| l | University of Operations included in this report and our previously filed Annual Reports on Form 10-K.Mumbai, Doctor of Medicine (M.D.) | | | | | |
| | (1) | On February 1, 2017, we completed the spin-off of our hemophilia business, Bioverativ, as an independent, publicly traded company. Our consolidated results of operations and financial position reflect the financial results of our hemophilia business for all periods through January 31, 2017. For additional information on the spin-off of our hemophilia business, please read Note 3, Hemophilia Spin-Off, to our consolidated financial statements included in this report.
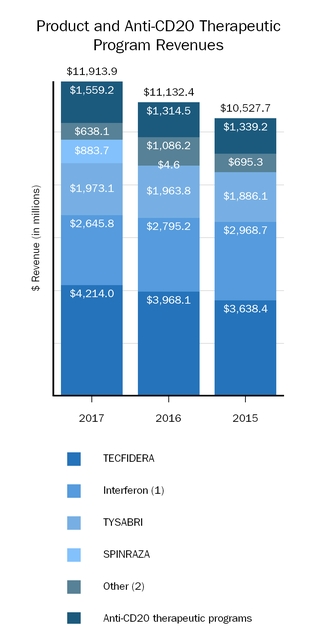
| | (2) | Product revenues, net reflect the impact of the following product launches: | | Experience |
Commercial salesDr. Grogan has served as our Executive Vice President and Head of SPINRAZADevelopment since September 2023. Dr. Grogan most recently served as the Chief Scientific Officer at Graphite Bio from 2021 to 2023 and ArsenalBio from 2019 to 2021, both cell and gene therapy companies. From 2004 to 2019 Dr. Grogan held several roles in the U.S. beganincreasing seniority at Genentech across Immunology and Immuno-oncology, covering research strategies and drug development across Rheumatoid Arthritis, Lupus, MS, Inflammatory Bowel Disease and Cancer. | | Education | | l | Leiden University, Ph.D. in the fourth quarterImmunology | | l | University of 2016Melbourne, B.Sc in Biochemistry and in rest of world markets in the first quarter of 2017.Under our collaboration agreement with AbbVie, we began to recognize revenues on sales of ZINBRYTA to third parties in the E.U. in the third quarter of 2016.
Under our commercial agreement with Samsung Bioepis, we began to recognize revenues on sales of BENEPALI and FLIXABI to third parties in the E.U. in the first quarter of 2016 and third quarter of 2016, respectively.
Commercial sales of ALPROLIX commenced in the second quarter of 2014 and commercial sales of ELOCTATE and PLEGRIDY commenced in the third quarter of 2014.
Commercial sales of TECFIDERA began in April 2013.
| | (3) | Notes payable and other financing arrangements reflects:Pharmacology |
Our 2017 repayment of our 6.875% notes that were issued in 2008 with an aggregate principal amount of $550.0 million, and
The issuance of our senior unsecured notes for an aggregate principal amount of $6.0 billion in September 2015.
| | | | | (4) | Total Biogen Inc. shareholders' equity reflects the repurchase of approximately 29.9 million shares of our common stock at a cost of approximately $8.7 billion between 2013 and 2017: |
During 2017 we repurchased and retired approximately 3.7 million shares of our common stock at a cost of $1.0 billion under our 2016 Share Repurchase Program.
During 2017 we repurchased approximately 1.2 million shares of our common stock at a cost of $365.4 million under our 2011 Share Repurchase Program.
During 2016 we repurchased and retired approximately 3.3 million shares of our common stock at a cost of $1.0 billion under our 2016 Share Repurchase Program.
During 2015 we repurchased and retired approximately 16.8 million shares of our common stock at a cost of $5.0 billion under a program authorized by our Board of Directors in May 2015 for the repurchase of up to $5.0 billion of our common stock (2015 Share Repurchase Program).
During 2014 and 2013 we repurchased approximately 2.9 million and 2.0 million shares, respectively, of our common stock at a cost of approximately $1.3 billion under our 2011 Share Repurchase Program.
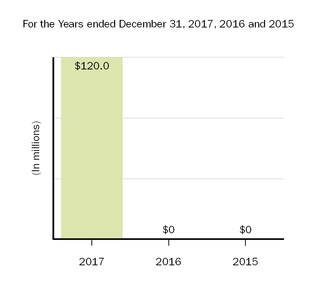
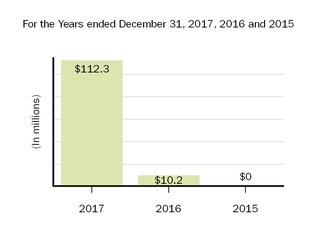
| | (a) | Total cost and expenses for the year ended December 31, 2017, includes a pre-tax charge to acquired in-process research and development of $120.0 million for an upfront payment made to Remedy upon closing of our asset purchase transaction for BIIB093.
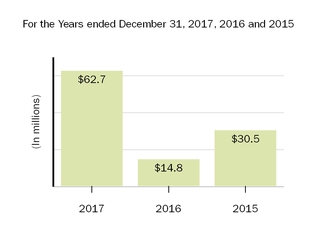
| | (b) | Net income (loss) attributable to noncontrolling interests, net of tax for the year ended December 31, 2017, includes a pre-tax charge of $150.0 million for a payment to Neurimmune in exchange for a 15% reduction in royalty rates payable on products developed under the agreement, including on potential commercial sales of aducanumab. | | Experience |
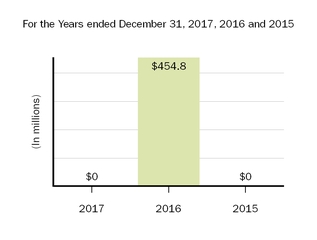
| | (c) | Total cost and expenses for the year ended December 31, 2016, includes a pre-tax charge of $454.8 million related to our January 2017 settlement and license agreement with Forward Pharma. |
Total costDr. Keeney has served as our Executive Vice President and expenses forHead of Corporate Development since April 2023. Dr. Keeney brings more than 20 years of experience leading R&D, business development and strategy organizations at industry-leading companies within biotech and large pharma, Dr. Keeney most recently served as the year ended December 31, 2017, includes $444.2 millionChief Executive Officer of amortization and impairment charges related to our U.S. and rest of world licenses to Forward Pharma’s intellectual property, including Forward Pharma's intellectual property related to TECFIDERA. For additional information on our
settlement and license agreement with Forward Pharma and related intangible assets, please read Note 7, Intangible Assets and Goodwill, to our consolidated financial statements included in this report.
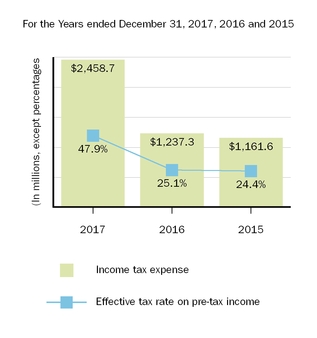
| | (d) | Income tax expense for the year ended December 31, 2017, includes $1,173.6 million related to our current estimate of the provisions of the 2017 Tax Act, including a $989.6 million expense under the Transition Toll Tax. For additional information on the 2017 Tax Act, please read Note 17, Income Taxes, to our consolidated financial statements included in this report.
|
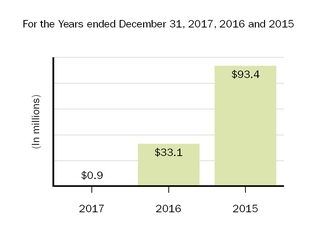
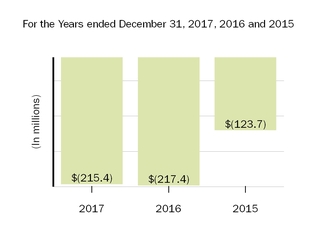
| | (e) | Total cost and expenses for the years ended December 31, 2017, 2016 and 2015, include restructuring charges of $0.9 million, $33.1 million and $93.4 million, respectively. In addition, total cost and expenses for the year ended December 31, 2016, also include charges to cost of sales totaling $52.4 million of expenses incurred as a result of our determination to cease manufacturing and vacate our small-scale biologics facility in Cambridge, MA as well as close and vacate our warehouse in Somerville, MA. Total cost and expenses for the years ended December 31, 2017 and 2016, also includes $19.2 million and $18.1 million, respectively, of costs incurred directly related to the spin-off of our hemophilia business into an independent, publicly traded company. |
| | (f) | Net income attributable to Biogen Inc. for the year ended December 31, 2015, includes a pre-tax charge to noncontrolling interest of $60.0 million for a milestone payment due to Neurimmune upon the enrollment of the first patient in a Phase 3 trial for aducanumab. |
| | (g) | Commencing in the second quarter of 2013 product and total revenues include 100% of net revenues related to sales of TYSABRI as a result of our acquisition of all remaining rights to TYSABRI from Elan Pharma International, Ltd (Elan), an affiliate of Elan Corporation, plc. Upon closing of this transaction, our collaboration agreement was terminated. |
Item 7. Management’s Discussion and Analysis of Financial Condition and Results of Operations
The following discussion should be read in conjunction with our consolidated financial statements and related notes beginning on page F-1 of this report. Certain totals may not sum due to rounding.
Executive Summary
Introduction
Biogen isNodThera, a global biopharmaceuticalclinical stage biotech company focused on discovering, developingchronic inflammation from 2018 to 2022. Prior to NodThera, Dr. Keeney was at Sanofi from 2014 to 2018 where he had responsibility for all of Sanofi Gezyme's business development activities, including early- and delivering worldwide innovative therapieslate-stage deals across therapeutic areas and modalities, successfully completing several significant transactions. From 2004 to 2013 Dr. Keeney worked at Johnson & Johnson where he held a number of business development roles with increasing responsibility and started his career at Lundbeck as a discovery scientist.
| | Education | | l | University of Nottingham, UK, Ph.D. in Neuropharmacology | | l | University of Leeds, UK, BSc (Hons) | | | | | |
| | | | | | | Robin C. Kramer | | Experience | Ms. Kramer has served as our Senior Vice President, Chief Accounting Officer since December 2020. Prior to that, Ms. Kramer served as our Vice President, Chief Accounting Officer from November 2018 to December 2020. Prior to joining Biogen, Ms. Kramer served as the Senior Vice President and Chief Accounting Officer of Hertz Global Holdings, Inc., a car rental company, from May 2014 to November 2018. Prior to that, Ms. Kramer was an audit partner at Deloitte & Touche LLP (Deloitte), a professional services firm, from 2007 to 2014, including serving in Deloitte's National Office Accounting Standards and Communications Group from 2007 to 2010. From 2005 to 2007 Ms. Kramer served as Chief Accounting Officer of Fisher Scientific International, Inc., a laboratory supply and biotechnology company, and from 2004 to 2005 Ms. Kramer served as Director, External Reporting, Accounting and Control for people living with serious neurological and neurodegenerative diseases, including in our core growth areas of MS and neuroimmunology, AD and dementia, movement disorders and neuromuscular disorders, including SMA and ALS. Wethe Gillette Company, a personal care company. Ms. Kramer also plan to invest in emerging growth areas such as pain, ophthalmology, neuropsychiatry and acute neurology. In addition, we are employing innovative technologies to discover potential treatments for rare and genetic disorders, including new ways of treating diseases through gene therapyheld partner positions in the public accounting firms of Ernst & Young LLP and Arthur Andersen LLP. Ms. Kramer is a licensed CPA in Massachusetts. She is a member of the Massachusetts Society of CPAs and the American Institute of CPAs. Ms. Kramer currently serves on the board of directors of the Center for Women and Enterprise. Ms. Kramer previously mentioned areas. We also manufacture and commercialize biosimilars of advanced biologics.Our marketed products include TECFIDERA, AVONEX, PLEGRIDY, TYSABRI, ZINBRYTA and FAMPYRAserved as a Board Member for the treatmentMassachusetts State Board of MS, SPINRAZA for the treatment of SMAAccountancy from September 2011 to December 2015 and FUMADERM for the treatment of severe plaque psoriasis. We also have certain business and financial rights with respectProbus Insurance Company Europe DAC from 2016 to RITUXAN for the treatment of non-Hodgkin's lymphoma, CLL and other conditions, GAZYVA for the treatment of CLL and follicular lymphoma, OCREVUS for the treatment of PPMS and RMS, and other potential anti-CD20 therapies under a collaboration agreement with Genentech.
Our current revenues depend upon continued sales of our principal products and, unless we develop, acquire rights to and/or commercialize new products and technologies, we may be substantially dependent on sales from our principal products for many years.
In the longer term, our revenue growth will be dependent upon the successful clinical development, regulatory approval and launch of new commercial products as well as additional indications for our existing products, our ability to obtain and maintain patents and other rights related to our marketed products, assets originating from our research and development efforts and/or successful execution of external business development opportunities.
Our innovative drug development and commercialization activities are complemented by our biosimilar therapies, which expand access to medicines and reduce the cost burden for healthcare systems. We are leveraging our manufacturing capabilities and know-how to develop, manufacture and market biosimilars through Samsung Bioepis, our joint venture with Samsung Biologics. Under our commercial agreement, we market and sell BENEPALI, an etanercept biosimilar referencing ENBREL, and FLIXABI, an infliximab biosimilar referencing REMICADE, in the E.U.
2017 Corporate Strategy
In July 2017 we announced an updated strategic framework to optimize the value of our MS business while investing for the future across our core growth areas of MS and neuroimmunology, AD and dementia, movement disorders, and neuromuscular diseases, including SMA and ALS. We also plan to invest in emerging growth areas such as pain, ophthalmology, neuropsychiatry, and acute neurology.
We expect the continued performance of our commercial assets and the expiration of the contingent payments related to TECFIDERA, discussed further in the “Contractual Obligations and Off-Balance Sheet Arrangements” section of this report, to enable us to invest in and build an industry leading neuroscience pipeline. We view investment in growth as our top priority, but also recognize the value of opportunistically returning excess capital to shareholders through share repurchases.
In order to deliver positive results in the near term while investing in the next stages of our growth, we will focus on the following strategic priorities:
maximizing the resilience of our MS core business;
accelerating efforts in SMA as a significant new growth opportunity;
developing and expanding our neuroscience portfolio;
focusing our capital allocation efforts to drive investment for future growth; and
creating a leaner and simpler operating model to streamline our operations and reallocate resources towards prioritized research and development and commercial value creation opportunities.
In October 2017, in connection with creating a leaner and simpler operating model, we approved a corporate restructuring program intended to streamline our operations and reallocate resources. We expect to make total non-recurring operating and
capital expenditures of up to $170.0 million, primarily in 2018, and our goal is to redirect resources of up to $400.0 million annually by 2020 to prioritized research and development and other value creation opportunities.
Tax Reform
The 2017 Tax Act has resulted in significant changes to the U.S. corporate income tax system. These changes include a federal statutory rate reduction from 35% to 21%, the elimination or reduction of certain domestic deductions and credits and limitations on the deductibility of interest expense and executive compensation. The 2017 Tax Act also transitions international taxation from a worldwide system to a modified territorial system and includes base erosion prevention measures on non-U.S. earnings, which has the effect of subjecting certain earnings of our foreign subsidiaries to U.S. taxation as GILTI. These changes are effective beginning in 2018.
The 2017 Tax Act also includes the Transition Toll Tax, which is a one-time mandatory deemed repatriation tax on accumulated foreign subsidiaries' previously untaxed foreign earnings.
Changes in tax rates and tax laws are accounted for in the period of enactment. Therefore, during the year ended December 31, 2017, we recorded a charge totaling $1,173.6 million related to our current estimate of the provisions of the 2017 Tax Act, including a $989.6 million expense under the Transition Toll Tax. The Transition Toll Tax will be paid over an eight-year period, starting in 2018, and will not accrue interest.
The 2017 Tax Act will provide us with flexibility in deploying our cash resources to advance our business interests. We expect that it will have a modest positive effect on our income tax rate in 2018 and a potential incremental benefit thereafter.
Hemophilia Spin-Off
On February 1, 2017, we completed the spin-off of our hemophilia business, Bioverativ, as an independent, publicly traded company trading under the symbol "BIVV" on the Nasdaq Global Select Market. The spin-off was accomplished through the distribution of all the then outstanding shares of common stock of Bioverativ to Biogen shareholders, who received one share of Bioverativ common stock for every two shares of Biogen common stock they owned. The separation and distribution was structured to be tax-free for shareholders for federal income tax purposes. Bioverativ assumed all of our rights and obligations under our collaboration agreement with Sobi and our collaboration and license agreement with Sangamo.
Our consolidated results of operations and financial position included in this report reflect the financial results of our hemophilia business for all periods through January 31, 2017.
For additional information on the spin-off of our hemophilia business, please read Note 3, Hemophilia Spin-Off, to our consolidated financial statements included in this report.
Financial Highlights
Diluted earnings per share attributable to Biogen
| | Public Company Boards | | l | Armata Pharmaceuticals, Inc. were $11.92 for 2017, representing a decrease of 29.6% versus the same period in 2016.As described below under “Results of Operations,” our income from operations for the year ended December 31, 2017 reflects the following:
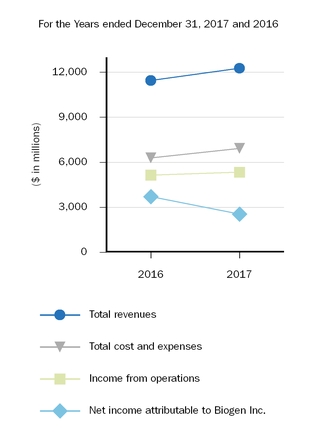
Total revenues were $12,273.9 million for 2017, representing an increase of 7.2% over the same period in 2016.
Product revenues, net totaled $10,354.7 million for 2017, representing an increase of 5.5% over the same period in 2016. This increase was primarily driven by revenues from SPINRAZA, TECFIDERA and BENEPALI, partially offset by the elimination of worldwide ALPROLIX and ELOCTATE revenues resulting from the spin-off of our hemophilia business on February 1, 2017 and a net decrease in total Interferon sales.
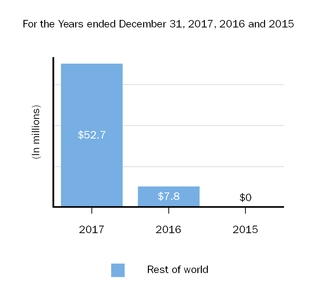
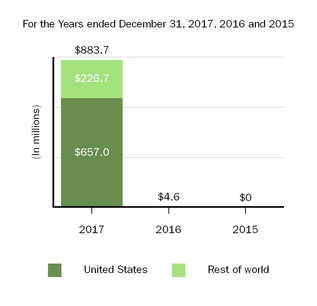
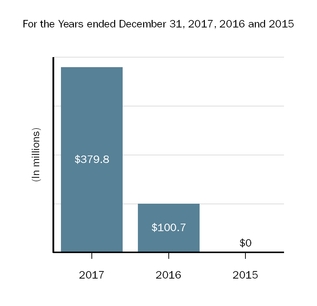
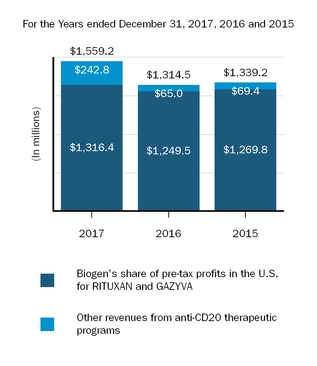
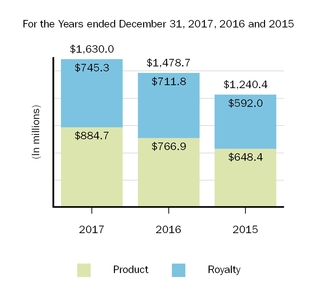
Revenues from anti-CD20 therapeutic programs totaled $1,559.2 million for 2017, representing an increase of 18.6% over the same period in 2016. This increase was primarily driven by royalty revenues on sales of OCREVUS and Biogen's share of pre-tax profits on RITUXAN.
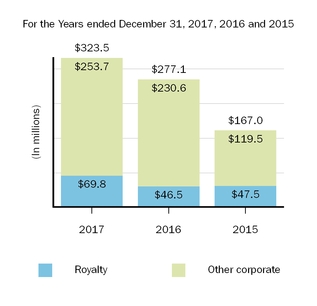
Other revenues totaled $360.0 million for 2017, representing an increase of 13.8% from the same period in 2016. This increase was primarily driven by an increase in other royalty and corporate revenues.
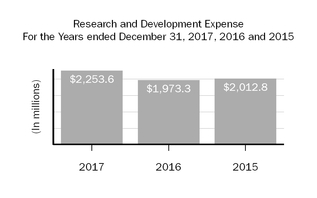
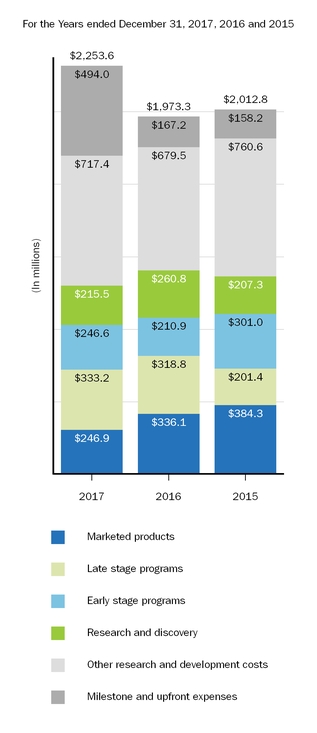
Total cost and expenses totaled $6,929.7 million for 2017, representing an increase of 10.0%, compared to the same period in 2016. This increase was primarily driven by $444.2 million of amortization and impairment charges related to our U.S. and rest of world licenses to Forward Pharma's intellectual property, including Forward Pharma's intellectual property related to TECFIDERA, a 14.2% increase in research and development primarily related to higher milestone and upfront expenses, a 10.2% increase in cost of goods sold, a $120.0 million pre-tax charge to acquired in-process research and development for an upfront payment made to Remedy upon the closing of the asset purchase transaction for BIIB093 and an increase in collaboration profit sharing. These increases were partially offset by a $454.8 million litigation settlement charge in the prior year.
As described below under "Financial Condition, Liquidity and Capital Resources":
We generated $4,551.0 million of net cash flows from operations for 2017, which were primarily driven by earnings.
Cash, cash equivalents and marketable securities totaled approximately $6,746.3 million as of December 31, 2017.
We repurchased approximately 4.9 million shares of common stock at a cost of $1.4 billion during 2017 under our share repurchase programs.
Acquisitions
BIIB093 Acquisition
In May 2017 we completed an asset purchase of the Phase 3-ready candidate BIIB093 (intravenous glibencamide) (formerly known as CIRARA) from Remedy. The target indication for BIIB093 is LHI, a severe form of ischemic stroke where cerebral edema often leads to a disproportionately large share of stroke-related morbidity and mortality. The FDA recently granted BIIB093 Orphan Drug Designation for
severe cerebral edema in patients with acute ischemic stroke. The FDA has also granted BIIB093 Fast Track designation.
Under this agreement, we are responsible for the future development and commercialization of BIIB093. Remedy will share in the cost of development for the target indication for BIIB093 in LHI stroke.
For additional information on our transaction with Remedy, please read Note 2, Acquisitions,to our consolidated financial statements included in this report.
Collaborative and Other Relationships
BIIB092 License Agreement
In June 2017 we completed an exclusive license agreement with BMS for BIIB092 (formerly known as BMS-986168), a Phase 2-ready experimental medicine with potential in AD and PSP. BIIB092 is an antibody targeting tau, the protein that forms the deposits, or tangles, in the brain associated with AD and other neurodegenerative tauopathies such as PSP.
Under this agreement, we received worldwide rights to BIIB092 and are responsible for the full development and global commercialization of BIIB092 in AD and PSP.
For additional information on our collaboration arrangement with BMS, please read Note 20, Collaborative and Other Relationships, to our consolidated financial statements included in this report.
Eisai Collaboration Agreement
In October 2017 we entered into a new collaboration agreement with Eisai for the joint development and commercialization of aducanumab (the Aducanumab Collaboration Agreement). Under the Aducanumab Collaboration Agreement, we will continue to lead the ongoing Phase 3 development of aducanumab and will remain responsible for 100% of development costs for aducanumab until April 2018. Eisai will then reimburse us for 15% of aducanumab development expenses for the period April 2018 through December 2018, and 45% thereafter. Upon commercialization, both companies will co-promote aducanumab with a region-based profit split.
In addition, we and Eisai will continue to jointly develop BAN2401 and E2609.
We and Eisai will co-promote AVONEX, TYSABRI and TECFIDERA in Japan in certain settings and Eisai will distribute AVONEX, TYSABRI, TECFIDERA and PLEGRIDY in India and other Asia-Pacific markets, excluding China.biotechnology company
| | Education | | l | Salem State University, B.B.A. Accounting |
AVAILABLE INFORMATION Our principal executive offices are located at 225 Binney Street, Cambridge, MA 02142 and our telephone number is (617) 679-2000. Our website address is www.biogen.com. We make available free of charge through the Investors section of our website our Annual Reports on Form 10-K, Quarterly Reports on Form 10-Q, Current Reports on Form 8-K and all amendments to those reports as soon as reasonably practicable after such material is electronically filed with or furnished to the SEC. We include our website address in this report only as an inactive textual reference and do not intend it to be an active link to our website. The contents of our website are not incorporated into this report. USE OF WEBSITE TO PROVIDE INFORMATION From time to time, we have used, and expect in the future to use, our website as a means of disclosing material information to the public in a broad, non-exclusionary manner, including for purposes of the SEC’s Regulation Fair Disclosure (Reg FD). Financial and other material information regarding the Company is routinely posted on our website and accessible at www.biogen.com. In order to receive notifications regarding new postings to our website, investors are encouraged to enroll on our website to receive automatic email alerts. None of the information on our website is incorporated into this report.
ITEM 1A. RISK FACTORS Risks Related to Our Business We are substantially dependent on revenue from our products. Our revenue depends upon continued sales of our products as well as the financial rights we have in our anti-CD20 therapeutic programs. A significant portion of our revenue is concentrated on sales of our products in increasingly competitive markets. Any of the following negative developments relating to any of our products or any of our anti-CD20 therapeutic programs may adversely affect our revenue and results of operations or could cause a decline in our stock price: •the introduction, greater acceptance or more favorable reimbursement of competing products, including new originator therapies, generics, prodrugs and biosimilars of existing products and products approved under abbreviated regulatory pathways; •safety or efficacy issues; •limitations and additional pressures on product pricing or price increases, including those relating to inflation and those resulting from governmental or regulatory requirements, including those relating to any future potential drug price negotiation under the IRA; increased competition, including from generic or biosimilar versions of our products; or changes in, or implementation of, reimbursement policies and practices of payors and other third-parties; •adverse legal, administrative, geopolitical events, regulatory or legislative developments; or •our ability to maintain a positive reputation among patients, healthcare providers and others, which may be impacted by our pricing and reimbursement decisions. LEQEMBI and SKYCLARYS are in the early stages of commercial launch in the U.S. In addition to risks associated with new product launches and the other factors described in these Risk Factors, Biogen’s and Eisai’s ability to successfully commercialize LEQEMBI and our ability to successfully commercialize SKYCLARYS may be adversely affected due to: •Eisai’s ability to obtain and maintain adequate reimbursement for LEQEMBI; •the effectiveness of Eisai's and Biogen’s commercial strategy for marketing LEQEMBI; •requirements such as participation in a registry and the use of imaging or other diagnostics for LEQEMBI; •our ability to obtain approval in other markets; •the approval of other new products for the same or similar indications; •Eisai’s and Biogen’s ability to maintain a positive reputation among patients, healthcare providers and others in the Alzheimer’s disease community, which may be impacted by pricing and reimbursement decisions relating to LEQEMBI, which are made by Eisai; •Biogen's ability to obtain and maintain adequate reimbursement for SKYCLARYS; and •the effectiveness of Biogen's commercial strategy for marketing SKYCLARYS. Our long-term success depends upon the successful development of new products and additional indications for our existing products. Our long-term success will depend upon the successful development of new products from our research and development activities or our licenses or acquisitions from third-parties, as well as additional indications for our existing products. Product development is very expensive and involves a high degree of uncertainty and risk and may not be successful. Only a small number of research and development programs result in the commercialization of a product. It is difficult to predict the success and the time and cost of product development of novel approaches for the treatment of diseases. The development of novel approaches for the treatment of diseases, including development efforts in new modalities such as those based on the antisense oligonucleotide platform and gene therapy, may present additional challenges and risks, including obtaining approval from regulatory authorities that have limited experience with the development of such therapies. For example, we are currently seeking approval of SKYCLARYS in Europe and any delays or challenges regarding its approval in Europe may adversely impact our ability to realize the anticipated benefits from the Reata acquisition.
Clinical trial data are subject to differing interpretations and even if we view data as sufficient to support the safety, effectiveness and/or approval of an investigational therapy, regulatory authorities may disagree and may require additional data, limit the scope of the approval or deny approval altogether. Furthermore, the approval of a product candidate by one regulatory agency does not mean that other regulatory agencies will also approve such product candidate. Success in preclinical work or early-stage clinical trials does not ensure that later stage or larger scale clinical trials will be successful. Clinical trials may indicate that our product candidates lack efficacy, have harmful side effects, result in unexpected adverse events or raise other concerns that may significantly reduce or delay the likelihood of regulatory approval. This may result in terminated programs, significant restrictions on use and safety warnings in an approved label, adverse placement within the treatment paradigm or significant reduction in the commercial potential of the product candidate. Even if we could successfully develop new products or indications, we may make a strategic decision to discontinue development of a product candidate or indication if, for example, we believe commercialization will be difficult relative to the standard of care or we prioritize other opportunities in our pipeline. Sales of new products or products with additional indications may not meet investor expectations. If we fail to compete effectively, our business and market position would suffer. The biopharmaceutical industry and the markets in which we operate are intensely competitive. We compete in the marketing and sale of our products, the development of new products and processes, the acquisition of rights to new products with commercial potential and the hiring and retention of personnel. We compete with biotechnology and pharmaceutical companies that have a greater number of products on the market and in the product pipeline, substantially greater financial, marketing, research and development and other resources and other technological or competitive advantages. Our products continue to face increasing competition from the introduction of new originator therapies, generics, prodrugs and biosimilars of existing products and products approved under abbreviated regulatory pathways. Some of these products are likely to be sold at substantially lower prices than our branded products. The introduction of such products as well as other lower-priced competing products has reduced, and may in the future, significantly reduce both the price that we are able to charge for our products and the volume of products we sell, which will negatively impact our revenue. For instance, demand and price for TECFIDERA declined significantly as a result of multiple TECFIDERA generic entrants entering the U.S. market in 2020. In addition, in some markets, when a generic or biosimilar version of one of our products is commercialized, it may be automatically substituted for our product and significantly reduce our revenue in a short period of time. Our ability to compete, maintain and grow our business may also be adversely affected due to a number of factors, including: •the introduction of other products, including products that may be more efficacious, safer, less expensive or more convenient alternatives to our products, including our own products and products of our collaborators; •the off-label use by physicians of therapies indicated for other conditions to treat patients; •patient dynamics, including the size of the patient population and our ability to identify, attract and maintain new and current patients to our therapies; •the reluctance of physicians to prescribe, and patients to use, our products without additional data on the efficacy and safety of such products; •damage to physician and patient confidence in any of our products, generic or biosimilars of our products or any other product from the same class as one of our products, or to our sales and reputation as a result of label changes, pricing and reimbursement decisions or adverse experiences or events that may occur with patients treated with our products or generic or biosimilars of our products; •inability to obtain and maintain appropriate pricing and adequate reimbursement for our products compared to our competitors in key markets; or •our ability to obtain and maintain patent, data or market exclusivity for our products. Our business may be adversely affected if we do not successfully execute or realize the anticipated benefits of our strategic and growth initiatives. The successful execution of our strategic and growth initiatives may depend upon internal development projects, commercial initiatives and external opportunities, which may include the acquisition and in-licensing of products,
technologies, companies, the entry into strategic alliances and collaborations or our Fit for Growth program, as well as our ability to execute on previously-announced initiatives such as the exploration of strategic options for our biosimilars business. While we believe we have a number of promising programs in our pipeline, failure or delay of internal development projects to advance or difficulties in executing on our commercial initiatives could impact our current and future growth, resulting in additional reliance on external development opportunities for growth. Supporting the further development of our existing products and potential new products in our pipeline will require significant capital expenditures and management resources, including investments in research and development, sales and marketing, manufacturing capabilities and other areas of our business. We have made, and may continue to make, significant operating and capital expenditures for potential new products prior to regulatory approval with no assurance that such investment will be recouped, which may adversely affect our financial condition, business and operations. The availability of high quality, fairly valued external product development is limited and the opportunity for their acquisition is highly competitive. As such, we are not certain that we will be able to identify suitable candidates for acquisition or if we will be able to reach agreement to make any such acquisition if suitable candidates are identified. We may fail to initiate or complete transactions for many reasons, including failure to obtain regulatory or other approvals as well as a result of disputes or litigation. Furthermore, we may not be able to achieve the full strategic and financial benefits expected to result from transactions, or the benefits may be delayed or not occur at all. We may also face additional costs or liabilities in completed transactions that were not contemplated prior to completion. Any failure in the execution of a transaction, in the integration of an acquired asset or business or in achieving expected synergies could result in slower growth, higher than expected costs, the recording of asset impairment charges and other actions which could adversely affect our business, financial condition and results of operations. For example, we recently acquired Reata and are in the process of integrating Reata into our Company. The ultimate success of our acquisition of Reata and our ability to realize the anticipated benefits from the acquisition, including the SKYCLARYS product and anticipated synergies, depends on, among other things, how effective we are in integrating the Biogen and Reata operations. We face risks associated with our Fit for Growth program that may impair our ability to achieve anticipated savings and operational efficiencies or that may otherwise harm our business. These risks include delays in implementation of cost optimization actions, loss of workforce capabilities, higher than anticipated separation expenses, litigation and the failure to meet financial and operational targets. In addition, the calculation of the anticipated cost savings and other benefits resulting from our Fit for Growth program are subject to many estimates and assumptions. These estimates and assumptions are subject to significant business, economic, competitive and other uncertainties and contingencies, many of which are beyond our control. if these estimates and assumptions are incorrect or if we experience delays or unforeseen events, our business and financial results could be adversely affected. Sales of our products depend, to a significant extent, on adequate coverage, pricing and reimbursement from third-party payors, which are subject to increasing and intense pressure from political, social, competitive and other sources. Our inability to obtain and maintain adequate coverage, or a reduction in pricing or reimbursement, could have an adverse effect on our business, reputation, revenue and results of operations. Sales of our products depend, to a significant extent, on adequate coverage, pricing and reimbursement from third-party payors. When a new pharmaceutical product is approved, the availability of government and private reimbursement for that product, diagnosis of the condition it treats and the cost to administer it may be uncertain, as is the pricing and amount for which that product will be reimbursed. Pricing and reimbursement for our products may be adversely affected by a number of factors, including: •changes in, and implementation of, federal, state or foreign government regulations or private third-party payors’ reimbursement policies; •pressure by employers on private health insurance plans to reduce costs; •consolidation and increasing assertiveness of payors seeking price discounts or rebates in connection with the placement of our products on their formularies and, in some cases, the imposition of restrictions on access or coverage of particular drugs or pricing determined based on perceived value; •our ability to receive reimbursement for our products or our ability to receive comparable reimbursement to that of competing products; and
•our value-based contracting program pursuant to which we aim to tie the pricing of our products to their clinical values by either aligning price to patient outcomes or adjusting price for patients who discontinue therapy for any reason, including efficacy or tolerability concerns. Our ability to set the price for our products varies significantly from country to country and, as a result, so can the price of our products. Governments may use a variety of cost-containment measures to control the cost of products, including price cuts, mandatory rebates, value-based pricing and reference pricing (i.e., referencing prices in other countries and using those reference prices to set a price). Drug prices are under significant scrutiny in the markets in which our products are prescribed; for example the IRA has certain provisions related to drug pricing. We expect drug pricing and other health care costs to continue to be subject to intense political and societal pressures on a global basis. Certain countries set prices by reference to the prices in other countries where our products are marketed. Our inability to obtain and maintain adequate prices in a particular country may not only limit the revenue from our products within that country but may also adversely affect our ability to secure acceptable prices in existing and potential new markets, which may limit market growth and result in reductions in revenue. This may create the opportunity for third-party cross-border trade or influence our decision to sell or not to sell a product, thus adversely affecting our geographic expansion plans and revenue. Additionally, in certain jurisdictions governmental health agencies may adjust, retroactively and/or prospectively, reimbursement rates for our products. Reimbursement for our products by governments, including the timing of any reimbursements, may also be affected by budgetary or political constraints, particularly in challenging economic environments. Government agencies often do not set their own budgets and therefore, have limited control over the amount of money they can spend. In addition, these agencies experience political pressure that may dictate the manner in which they spend money. There can be no assurance that the economic, budgeting or political issues will not worsen and adversely impact sales or reimbursements of our products. Competition from current and future competitors may negatively impact our ability to maintain pricing and our market share. New products marketed by our competitors could cause our revenue to decrease due to potential price reductions and lower sales volumes. Additionally, the introduction of generic or biosimilar versions of our products, follow-on products, prodrugs or products approved under abbreviated regulatory pathways may significantly reduce the price that we are able to charge for our products and the volume of products we sell. Many payors continue to adopt benefit plan changes that shift a greater portion of prescription costs to patients, including more limited benefit plan designs, higher patient co-pay or co-insurance obligations and limitations on patients' use of commercial manufacturer co-pay payment assistance programs (including through co-pay accumulator adjustment or maximization programs). Significant consolidation in the health insurance industry has resulted in a few large insurers and pharmacy benefit managers exerting greater pressure in pricing and usage negotiations with drug manufacturers, significantly increasing discounts and rebates required of manufacturers and limiting patient access and usage. Further consolidation among insurers, pharmacy benefit managers and other payors would increase the negotiating leverage such entities have over us and other drug manufacturers. Additional discounts, rebates, coverage or plan changes, restrictions or exclusions as described above could have a material adverse effect on sales of our affected products. Our failure to obtain or maintain adequate coverage, pricing or reimbursement for our products could have an adverse effect on our business, reputation, revenue and results of operations. We depend on relationships with collaborators and other third-parties for revenue, and for the development, regulatory approval, commercialization and marketing of certain of our products and product candidates, which are outside of our full control. We rely on a number of collaborative and other third-party relationships for revenue and the development, regulatory approval, commercialization and marketing of certain of our products and product candidates. We also outsource certain aspects of our regulatory affairs and clinical development relating to our products and product candidates to third-parties. Reliance on third-parties subjects us to a number of risks, including: •we may be unable to control the resources our collaborators or third-parties devote to our programs, products or product candidates, which may affect our ability to achieve development goals or milestones; •disputes may arise under an agreement, including with respect to the achievement and payment of milestones, payment of development or commercial costs, ownership of rights to technology developed, and the underlying agreement may fail to provide us with significant protection or may fail to be effectively enforced if the collaborators or third-parties fail to perform; •the interests of our collaborators or third-parties may not always be aligned with our interests, and such parties may not pursue regulatory approvals or market a product in the same manner or to the same extent
that we would, which could adversely affect our revenue, or may adopt tax strategies that could have an adverse effect on our business, results of operations or financial condition; •third-party relationships require the parties to cooperate, and failure to do so effectively could adversely affect product sales or the clinical development or regulatory approvals of product candidates under joint control, could result in termination of the research, development or commercialization of product candidates or could result in litigation or arbitration; •any failure on the part of our collaborators or third-parties to comply with applicable laws, including tax laws, regulatory requirements and/or applicable contractual obligations or to fulfill any responsibilities they may have to protect and enforce any intellectual property rights underlying our products could have an adverse effect on our revenue or reputation as well as involve us in possible legal proceedings; and •any improper conduct or actions on the part of our collaborators or third-parties could subject us to civil or criminal investigations and monetary and injunctive penalties, require management attention, impact the accuracy and timing of our financial reporting and/or adversely impact our ability to conduct business, our operating results and our reputation. Given these risks, there is considerable uncertainty regarding the success of our current and future collaborative efforts. If these efforts fail, our product development or commercialization of new products could be delayed, revenue from products could decline and/or we may not realize the anticipated benefits of these arrangements. Our results of operations may be adversely affected by current and potential future healthcare reforms. In the U.S., federal and state legislatures, health agencies and third-party payors continue to focus on containing the cost of health care. Legislative and regulatory proposals, enactments to reform health care insurance programs (including those contained in the IRA) and increasing pressure from social sources could significantly influence the manner in which our products are prescribed, purchased and reimbursed. For example, provisions of the PPACA have resulted in changes in the way health care is paid for by both governmental and private insurers, including increased rebates owed by manufacturers under the Medicaid Drug Rebate Program, annual fees and taxes on manufacturers of certain branded prescription drugs, the requirement that manufacturers participate in a discount program for certain outpatient drugs under Medicare Part D and the expansion of the number of hospitals eligible for discounts under Section 340B of the Public Health Service Act. These changes have had and are expected to continue to have a significant impact on our business. We may face uncertainties as a result of efforts to repeal, substantially modify or invalidate some or all of the provisions of the PPACA. There is no assurance that the PPACA, as currently enacted or as amended in the future, will not adversely affect our business and financial results, and we cannot predict how future federal or state legislative or administrative changes relating to healthcare reform will affect our business. There is substantial public attention on the costs of prescription drugs and we expect drug pricing and other health care costs to continue to be subject to intense political and societal pressures on a global basis. In addition, there have been (including elements of the IRA), and are expected to continue to be, legislative proposals to address prescription drug pricing. Some of these proposals could have significant effects on our business, including an executive order issued in September 2020 to test a “most favored nation” model for Part B and Part D drugs that tie reimbursement rates to international drug pricing metrics. These actions and the uncertainty about the future of the PPACA and healthcare laws may put downward pressure on pharmaceutical pricing and increase our regulatory burdens and operating costs. There is also significant economic pressure on state budgets, that may result in states increasingly seeking to achieve budget savings through mechanisms that limit coverage or payment for our drugs. In recent years, some states have considered legislation and ballot initiatives that would control the prices of drugs, including laws to allow importation of pharmaceutical products from lower cost jurisdictions outside the U.S. and laws intended to impose price controls on state drug purchases. State Medicaid programs are requesting manufacturers to pay supplemental rebates and requiring prior authorization by the state program for use of any drug for which supplemental rebates are not being paid. Government efforts to reduce Medicaid expense may lead to increased use of managed care organizations by Medicaid programs. This may result in managed care organizations influencing prescription decisions for a larger segment of the population and a corresponding limitation on prices and reimbursement for our products. In the E.U. and some other international markets, the government provides health care at low cost to consumers and regulates pharmaceutical prices, patient eligibility or reimbursement levels to control costs for the government-sponsored health care system. Many countries have announced or implemented measures, and may in the future implement new or additional measures, to reduce health care costs to limit the overall level of government
expenditures. These measures vary by country and may include, among other things, patient access restrictions, suspensions on price increases, prospective and possible retroactive price reductions and other recoupments and increased mandatory discounts or rebates, recoveries of past price increases and greater importation of drugs from lower-cost countries. These measures have negatively impacted our revenue and may continue to adversely affect our revenue and results of operations in the future. Our success in commercializing biosimilars is subject to risks and uncertainties inherent in the development, manufacture and commercialization of biosimilars. If we are unsuccessful in such activities, our business may be adversely affected. The development, manufacture and commercialization of biosimilar products require specialized expertise and are very costly and subject to complex regulation. Our success in commercializing biosimilars is subject to a number of risks, including: •Reliance on Third-Parties. We are dependent, in part, on the efforts of collaboration partners and other third-parties over whom we have limited or no control in the development and manufacturing of biosimilars products. For example, a recently announced potential acquisition of a contract development and manufacturing organization by a third party. If these third-parties fail to perform successfully, or reduce their third party manufacturing production, our biosimilar product development or commercialization of biosimilar products could be delayed, revenue from biosimilar products could decline and/or we may not realize the anticipated benefits of these arrangements; •Regulatory Compliance. Biosimilar products may face regulatory hurdles or delays due to the evolving and uncertain regulatory and commercial pathway of biosimilars products in certain jurisdictions; •Ability to Provide Adequate Supply. Manufacturing biosimilars is complex. If we encounter any manufacturing or supply chain difficulties we may be unable to meet demand. We are dependent on a third-party for the manufacture of our biosimilar products and such third-party may not perform its obligations in a timely and cost-effective manner or in compliance with applicable regulations and may be unable or unwilling to increase production capacity commensurate with demand for our existing or future biosimilar products; •Intellectual Property and Regulatory Challenges. Biosimilar products may face extensive intellectual property clearances and infringement litigation, injunctions or regulatory challenges, which could prevent the commercial launch of a product or delay it for many years or result in imposition of monetary damages, penalties or other civil sanctions and damage our reputation; •Failure to Gain Market and Patient Acceptance. Market success of biosimilar products will be adversely affected if patients, physicians and/or payors do not accept biosimilar products as safe and efficacious products offering a more competitive price or other benefit over existing therapies; and •Competitive Challenges. Biosimilar products face significant competition, including from innovator products and biosimilar products offered by other companies that may receive greater acceptance or more favorable reimbursement. Local tendering processes may restrict biosimilar products from being marketed and sold in some jurisdictions. The number of competitors in a jurisdiction, the timing of approval and the ability to market biosimilar products successfully in a timely and cost-effective manner are additional factors that may impact our success in this business area. The decision to explore strategic options related to our biosimilars business could adversely affect our operations related to our biosimilars business. Risks Related to Intellectual Property If we are unable to obtain and maintain adequate protection for our data, intellectual property and other proprietary rights, our business may be harmed. Our success, including our long-term viability and growth, depends, in part, on our ability to obtain and defend patent and other intellectual property rights, including certain regulatory forms of exclusivity, that are important to the commercialization of our products and product candidates. Patent protection and/or regulatory exclusivity in the U.S. and other important markets remains uncertain and depends, in part, upon decisions of the patent offices, courts, administrative bodies and lawmakers in these countries. We may fail to obtain, defend or preserve patent and other intellectual property rights, including certain regulatory forms of exclusivity, or the protection we obtain may not be of sufficient breadth and degree to protect our commercial interests in all countries where we conduct business, which could result in financial, business or reputational harm to us or could cause a decline or volatility in our stock price. In addition, settlements of such proceedings often result in reducing the period of exclusivity and other protections, resulting in a reduction in revenue from affected products.
In many markets, including the U.S., manufacturers may be allowed to rely on the safety and efficacy data of the innovator's product and do not need to conduct clinical trials before marketing a competing version of a product after there is no longer patent or regulatory exclusivity. In such cases, manufacturers often charge significantly lower prices and a major portion of the company's revenue may be reduced in a short period of time. In addition, manufacturers of generics and biosimilars may choose to launch or attempt to launch their products before the expiration of our patent or other intellectual property protections. Furthermore, our products may be determined to infringe patents or other intellectual property rights held by third-parties. Legal proceedings, administrative challenges or other types of proceedings are and may in the future be necessary to determine the validity, scope or non-infringement of certain patent rights claimed by third-parties to be pertinent to the manufacture, use or sale of our products. Legal proceedings may also be necessary to determine the rights, obligations and payments claimed during and after the expiration of intellectual property license agreements we have entered with third parties. Such proceedings are unpredictable and are often protracted and expensive. Negative outcomes of such proceedings could hinder or prevent us from manufacturing and marketing our products, require us to seek a license for the infringed product or technology or result in the assessment of significant monetary damages against us that may exceed amounts, if any, accrued in our financial statements. A failure to obtain necessary licenses for an infringed product or technology could prevent us from manufacturing or selling our products. Furthermore, payments under any licenses that we are able to obtain could reduce our profits from the covered products and services. Any of these circumstances could result in financial, business or reputational harm to us or could cause a decline or volatility in our stock price. Risks Related to Development, Clinical Testing and Regulation of Our Products and Product Candidates Successful preclinical work or early stage clinical trials does not ensure success in later stage trials, regulatory approval or commercial viability of a product. Positive results in a clinical trial may not be replicated in subsequent or confirmatory trials. Additionally, success in preclinical work or early stage clinical trials does not ensure that later stage or larger scale clinical trials will be successful or that regulatory approval will be obtained. Even if later stage clinical trials are successful, regulatory authorities may delay or decline approval of our product candidates. Regulatory authorities may disagree with our view of the data, require additional studies, disagree with our trial design or endpoints or not approve adequate reimbursement. Regulatory authorities may also fail to approve the facilities or processes used to manufacture a product candidate, our dosing or delivery methods or companion devices. Regulatory authorities may grant marketing approval that is more restricted than anticipated, including limiting indications to narrow patient populations and the imposition of safety monitoring, educational requirements, requiring confirmatory trials and risk evaluation and mitigation strategies. The occurrence of any of these events could result in significant costs and expense, have an adverse effect on our business, financial condition and results of operations and/or cause our stock price to decline or experience periods of volatility. Clinical trials and the development of biopharmaceutical products is a lengthy and complex process. If we fail to adequately manage our clinical activities, our clinical trials or potential regulatory approvals may be delayed or denied. Conducting clinical trials is a complex, time-consuming and expensive process. Our ability to complete clinical trials in a timely fashion depends on a number of key factors, including protocol design, regulatory and institutional review board approval, patient enrollment rates and compliance with current Good Clinical Practices. If we or our third-party clinical trial providers or third-party CROs do not successfully carry out these clinical activities, our clinical trials or the potential regulatory approval of a product candidate may be delayed or denied. We have opened clinical trial sites and are enrolling patients in a number of countries where our experience is limited. In most cases, we use the services of third-parties to carry out our clinical trial related activities and rely on such parties to accurately report their results. Our reliance on third-parties for these activities may impact our ability to control the timing, conduct, expense and quality of our clinical trials. One CRO has responsibility for a substantial portion of our activities and reporting related to our clinical trials and if such CRO does not adequately perform, many of our trials may be affected, including adversely affecting our expenses associated with such trials. We may need to replace our CROs, which may result in the delay of the affected trials or otherwise adversely affect our efforts to obtain regulatory approvals and commercialize our product candidates. Adverse safety events or restrictions on use and safety warnings for our products can negatively affect our business, product sales and stock price. Adverse safety events involving our marketed products, generic or biosimilar versions of our marketed products or products from the same class as one of our products may have a negative impact on our business. Discovery of safety issues with our products could create product liability and could cause additional regulatory scrutiny and
requirements for additional labeling or safety monitoring, withdrawal of products from the market and/or the imposition of fines or criminal penalties. Adverse safety events may also damage physician, patient and/or investor confidence in our products and our reputation. Any of these could result in adverse impacts on our results of operations. Regulatory authorities are making greater amounts of stand-alone safety information directly available to the public through periodic safety update reports, patient registries and other reporting requirements. The reporting of adverse safety events involving our products or products similar to ours and public rumors about such events may increase claims against us and may also cause our product sales to decline or our stock price to experience periods of volatility. Restrictions on use or safety warnings that may be required to be included in the label of our products may significantly reduce expected revenue for those products and require significant expense and management time. Risks Related to Our Operations A breakdown or breach of our information systems could subject us to liability or interrupt the operation of our business. We are increasingly dependent upon information systems and data to operate our business. Changes in how we operate have caused us to modify our business practices in ways that heighten this dependence, including changing the requirement that most of our office-based employees in the U.S. and our other key markets work from the office, with many of our employees now working in hybrid or full-remote positions. As a result, we are increasingly dependent upon our information systems to operate our business and our ability to effectively manage our business depends on the security, reliability and adequacy of our information systems and data, which includes use of cloud technologies, including Software as a Service (SaaS), Platform as a Service (PaaS) and Infrastructure as a Service (IaaS). Breakdowns, invasions, corruptions, destructions and/or breaches, which impact may include, but not limited to, comprising the capacity, reliability or security of our information systems or those of our business partners, including our cloud tech nologies, and/or unauthorized access to our data and information could subject us to significant liability, negatively impact our business operations, and/or require replacement of technology and/or sizeable ransom payments. Our information systems, including our cloud technologies, continue to increase in multitude and complexity, increasing our vulnerability when breakdowns, malicious intrusions and random attacks occur. Data privacy or security breaches also pose a risk that sensitive data, including intellectual property, trade secrets or personal information belonging to us, patients, customers or other business partners, may be exposed to unauthorized persons or to the public. Cybersecurity threats and incidents are increasing in their frequency, sophistication and intensity, and are becoming increasingly difficult to detect, particularly when they impact vendors, customers or suppliers, and other companies in our supply chain. Cybersecurity threats and incidents are often carried out by motivated, well-resourced, skilled and persistent actors, including nation states, organized crime groups, “hacktivists” and may include or target employees or contractors acting with careless or malicious intent. Recent developments in the threat landscape include use of AI and machine learning, as well as an increased number of cyber extortion attacks, with higher financial ransom demand amounts and increasing sophistication and variety of ransomware techniques and methodology. Geopolitical instability, including that related to Russia's invasion of Ukraine or the conflict in the Middle East, may increase the risk of cybersecurity threats. Cybersecurity threats or incidents may include deployment of harmful malware and key loggers, ransomware, a denial-of-service attack, a malicious website, the use of social engineering and other means to affect the confidentiality, integrity and availability of our information systems and data. Cybersecurity threats and incidents also include manufacturing, hardware or software supply chain attacks, which could cause a delay in the manufacturing of products or products produced for contract manufacturing or lead to a data privacy or security breach. Our key business partners face similar risks and any security breach of their systems could adversely affect our security posture. In addition, our increased use of cloud technologies heightens these and other operational risks, and any failure by cloud or other technology service providers to adequately safeguard their systems and prevent cyber-attacks could disrupt our operations and result in misappropriation, corruption or loss of confidential or propriety information. While we continue to build and improve our systems and infrastructure, including our business continuity plans, there can be no assurance that our efforts will prevent cybersecurity threats or incidents in our systems and any such incidents could materially adversely affect our business and operations and/or result in the loss of critical or sensitive information, which could result in material financial, legal, operational or reputational harm to us, loss of competitive advantage or loss of consumer confidence. Our liability insurance may not be sufficient in type or amount to cover us against claims related to security breaches, cyber-attacks and other related breaches.
Regulations continue to change as regulators worldwide consider new rules. For example, the SEC has adopted additional disclosure rules regarding cyber security risk management, strategy, governance and incident reporting by public companies. These new regulations or other regulations being considered in Europe and around the world may impact the manner in which we operate. Regulators are imposing new data privacy and security requirements, including new and greater monetary fines for privacy violations. For example, the E.U.’s General Data Protection Regulation established regulations regarding the handling of personal data, and provides an enforcement authority and imposes large penalties for noncompliance. New U.S. data privacy and security laws, such as the CCPA, and others that may be passed, similarly introduce requirements with respect to personal information, and non-compliance with the CCPA may result in liability through private actions (subject to statutorily defined damages in the event of certain data breaches) and enforcement. Failure to comply with these current and future laws, policies, industry standards or legal obligations or any security incident resulting in the unauthorized access to, or acquisition, release or transfer of personal information may result in governmental enforcement actions, litigation, fines and penalties or adverse publicity and could cause our customers to lose trust in us, which could have a material adverse effect on our business and results of operations. Manufacturing issues could substantially increase our costs, limit supply of our products and/or reduce our revenue. The process of manufacturing our products is complex, highly regulated and subject to numerous risks, including: •Risks of Reliance on Third-Parties and Single Source Providers. We rely on third-party suppliers and manufacturers for many aspects of our manufacturing process for our products and product candidates. In some cases, due to the unique manner in which our products are manufactured, we rely on single source providers of raw materials and manufacturing supplies. These third-parties are independent entities subject to their own unique operational and financial risks that are outside of our control. For example, a recently announced potential acquisition of a contract development and manufacturing organization by a third party. These third-parties may not perform their obligations in a timely and cost-effective manner or in compliance with applicable regulations, and they may be unable or unwilling to increase production capacity commensurate with demand for our existing or future products. Finding alternative providers could take a significant amount of time and involve significant expense due to the specialized nature of the services and the need to obtain regulatory approval of any significant changes to our suppliers or manufacturing methods. We cannot be certain that we could reach agreement with alternative providers or that the FDA or other regulatory authorities would approve our use of such alternatives. •Global Bulk Supply Risks. We rely on our manufacturing facilities for the production of drug substance for our large molecule products and product candidates. Our global bulk supply of these products and product candidates depends on the uninterrupted and efficient operation of these facilities, which could be adversely affected by equipment failures, labor or raw material shortages, geopolitical instability, public health epidemics, natural disasters, power failures, cyber-attacks and many other factors. •Risks Relating to Compliance with current GMP (cGMP). We and our third-party providers are generally required to maintain compliance with cGMP and other stringent requirements and are subject to inspections by the FDA and other regulatory authorities to confirm compliance. Any delay, interruption or other issues that arise in the manufacture, fill-finish, packaging or storage of our products as a result of a failure of our facilities or operations or those of third-parties to receive regulatory approval or pass any regulatory agency inspection could significantly impair our ability to develop and commercialize our products. Significant noncompliance could also result in the imposition of monetary penalties or other civil or criminal sanctions and damage our reputation. •Risk of Product Loss. The manufacturing process for our products is extremely susceptible to product loss due to contamination, oxidation, equipment failure or improper installation or operation of equipment or vendor or operator error. Even minor deviations from normal manufacturing processes could result in reduced production yields, product defects and other supply disruptions. If microbial, viral or other contaminations are discovered in our products or manufacturing facilities, we may need to close our manufacturing facilities for an extended period of time to investigate and remediate the contaminant. Any adverse developments affecting our manufacturing operations or the operations of our third-party suppliers and manufacturers may result in shipment delays, inventory shortages, lot failures, product withdrawals or recalls or other interruptions in the commercial supply of our products. Furthermore, factors such as geopolitical events, global health outbreaks, weather events, labor or raw material shortages and other supply chain disruptions could result in difficulties and delays in manufacturing our products, which could have an adverse impact on our results in operations or result in product shortages. We may also have to take inventory write-offs and incur other charges and expense for products that fail to meet specifications, undertake costly remediation efforts or seek more costly manufacturing alternatives. Such developments could increase our
manufacturing costs, cause us to lose revenue or market share as patients and physicians turn to competing therapeutics, diminish our profitability or damage our reputation. In addition, although we have business continuity plans to reduce the potential for manufacturing disruptions or delays and reduce the severity of a disruptive event, there is no guarantee that these plans will be adequate, which could adversely affect our business and operations. Management, personnel and other organizational changes may disrupt our operations, and we may have difficulty retaining personnel or attracting and retaining qualified replacements on a timely basis for the management and other personnel who may leave the Company. Changes in management, other personnel and our overall retention rate may disrupt our business, and any such disruption could adversely affect our operations, programs, growth, financial condition or results of operations. New members of management may have different perspectives on programs and opportunities for our business, which may cause us to focus on new opportunities or reduce or change emphasis on our existing programs. Our success is dependent upon our ability to attract and retain qualified management and other personnel in a highly competitive environment. Qualified individuals are in high demand, and we may incur significant costs to attract or retain them. We may face difficulty in attracting and retaining talent for a number of reasons, including management changes, integration related to the Reata acquisition, the underperformance or discontinuation of one or more marketed, pre-clinical or clinical programs, recruitment by competitors or changes in the overall labor market. In addition, changes in our organizational structure or in our flexible working arrangements could impact employees' productivity and morale as well as our ability to attract, retain and motivate employees. We cannot ensure that we will be able to hire or retain the personnel necessary for our operations or that the loss of any personnel will not have a material impact on our financial condition and results of operations. If we fail to comply with the extensive legal and regulatory requirements affecting the health care industry, we could face increased costs, penalties and a loss of business. Our activities, and the activities of our collaborators, distributors and other third-party providers, are subject to extensive government regulation and oversight in the U.S. and in foreign jurisdictions, and are subject to change and evolving interpretations, which could require us to incur substantial costs associated with compliance or to alter one or more of our business practices. The FDA and comparable foreign agencies directly regulate many of our most critical business activities, including the conduct of preclinical and clinical studies, product manufacturing, advertising and promotion, product distribution, adverse event reporting, product risk management and our compliance with good practice quality guidelines and regulations. Our interactions with physicians and other health care providers that prescribe or purchase our products are also subject to laws and government regulation designed to prevent fraud and abuse in the sale and use of products and place significant restrictions on the marketing practices of health care companies. Health care companies are facing heightened scrutiny of their relationships with health care providers and have been the target of lawsuits and investigations alleging violations of laws and government regulation, including claims asserting submission of incorrect pricing information, impermissible off-label promotion of pharmaceutical products, payments intended to influence the referral of health care business, submission of false claims for government reimbursement, antitrust violations or violations related to environmental matters. There is also enhanced scrutiny of company-sponsored patient assistance programs, including testing, insurance premium and co-pay assistance programs and donations to third-party charities that provide such assistance. The U.S. government has challenged some of our donations to third-party charities that provide patient assistance. If we, or our vendors or donation recipients, are found to fail to comply with relevant laws, regulations or government guidance in the operation of these or other patient assistance programs, we could be subject to significant fines or penalties. Risks relating to compliance with laws and regulations may be heightened as we continue to expand our global operations and enter new therapeutic areas with different patient populations, which may have different product distribution methods, marketing programs or patient assistance programs from those we currently utilize or support. Conditions and regulations governing the health care industry are subject to change, with possible retroactive effect, including: •new laws, regulations or judicial decisions, or new interpretations of existing laws, regulations or judicial decisions, related to health care availability, pricing or marketing practices, compliance with employment practices, method of delivery, payment for health care products and services, compliance with health information and data privacy and security laws and regulations, tracking and reporting payments and other transfers of value made to physicians and teaching hospitals, extensive anti-bribery and anti-corruption prohibitions, product serialization and labeling requirements and used product take-back requirements;
•changes in the FDA and foreign regulatory approval processes or perspectives that may delay or prevent the approval of new products and result in lost market opportunity; •government shutdowns or relocations may result in delays to the review and approval process, slowing the time necessary for new drug candidates to be reviewed and/or approved, which may adversely affect our business; •requirements that provide for increased transparency of clinical trial results and quality data, such as the EMA's clinical transparency policy, which could impact our ability to protect trade secrets and competitively-sensitive information contained in approval applications or could be misinterpreted leading to reputational damage, misperception or legal action, which could harm our business; and •changes in FDA and foreign regulations that may require additional safety monitoring, labeling changes, restrictions on product distribution or use or other measures after the introduction of our products to market, which could increase our costs of doing business, adversely affect the future permitted uses of approved products or otherwise adversely affect the market for our products. Violations of governmental regulation may be punishable by criminal and civil sanctions, including fines and civil monetary penalties and exclusion from participation in government programs, including Medicare and Medicaid, as well as against executives overseeing our business. We could also be required to repay amounts we received from government payors or pay additional rebates and interest if we are found to have miscalculated the pricing information we submitted to the government. In addition, legal proceedings and investigations are inherently unpredictable, and large judgments or settlements sometimes occur. While we believe that we have appropriate compliance controls, policies and procedures in place to comply with the laws or regulations of the jurisdictions in which we operate, there is a risk that acts committed by our employees, agents, distributors, collaborators or third-party providers might violate such laws or regulations. Whether or not we have complied with the law, an investigation or litigation related to alleged unlawful conduct could increase our expense, damage our reputation, divert management time and attention and adversely affect our business. Our sales and operations are subject to the risks of doing business internationally. We are increasing our presence in international markets, subjecting us to many risks that could adversely affect our business and revenue. There is no guarantee that our efforts and strategies to expand sales in international markets will succeed. Emerging market countries may be especially vulnerable to periods of global and local political, legal, regulatory and financial instability and may have a higher incidence of corruption and fraudulent business practices. Certain countries may require local clinical trial data as part of the drug registration process in addition to global clinical trials, which can add to overall drug development and registration timelines. We may also be required to increase our reliance on third-party agents or distributors and unfamiliar operations and arrangements previously utilized by companies we collaborate with or acquire in emerging markets. Our sales and operations are subject to the risks of doing business internationally, including: •the impact of public health epidemics on the global economy and the delivery of healthcare treatments; •less favorable intellectual property or other applicable laws; •the inability to obtain necessary foreign regulatory approvals of products in a timely manner; •limitations and additional pressures on our ability to obtain and maintain product pricing, reimbursement or receive price increases, including those resulting from governmental or regulatory requirements; •increased cost of goods due to factors such as inflation and supply chain disruptions; •additional complexity in manufacturing internationally, including materials manufactured in China; •delays in clinical trials relating to geopolitical instability related to Russia's invasion of Ukraine and the military conflict in the Middle East; •the inability to successfully complete subsequent or confirmatory clinical trials in countries where our experience is limited; •longer payment and reimbursement cycles and uncertainties regarding the collectability of accounts receivable; •fluctuations in foreign currency exchange rates that may adversely impact our revenue, net income and value of certain of our investments; •the imposition of governmental controls;
•diverse data privacy and protection requirements; •increasingly complex standards for complying with foreign laws and regulations that may differ substantially from country to country and may conflict with corresponding U.S. laws and regulations; •the far-reaching anti-bribery and anti-corruption legislation in the U.K., including the U.K. Bribery Act 2010, and elsewhere and escalation of investigations and prosecutions pursuant to such laws; •compliance with complex import and export control laws; •changes in tax laws; and •the imposition of tariffs or embargoes and other trade restrictions. In addition, our international operations are subject to regulation under U.S. law. For example, the U.S. FCPA prohibits U.S. companies and their representatives from paying, offering to pay, promising to pay or authorizing the payment of anything of value to any foreign government official, government staff member, political party or political candidate for the purpose of obtaining or retaining business or to otherwise obtain favorable treatment or influence a person working in an official capacity. In many countries, the health care professionals we regularly interact with may meet the FCPA's definition of a foreign government official. Failure to comply with domestic or foreign laws could result in various adverse consequences, including possible delay in approval or refusal to approve a product, recalls, seizures or withdrawal of an approved product from the market, disruption in the supply or availability of our products or suspension of export or import privileges, the imposition of civil or criminal sanctions, the prosecution of executives overseeing our international operations and damage to our reputation. Any significant impairment of our ability to sell products outside of the U.S. could adversely impact our business and financial results. In addition, while we believe that we have appropriate compliance controls, policies and procedures in place to comply with the FCPA, there is a risk that acts committed by our employees, agents, distributors, collaborators or third-party providers might violate the FCPA and we might be held responsible. If our employees, agents, distributors, collaborators or third-party providers are found to have engaged in such practices, we could suffer severe penalties and may be subject to other liabilities, which could negatively affect our business, operating results and financial condition. We built a large-scale biologics manufacturing facility and are building a gene therapy manufacturing facility, which will result in the incurrence of significant investment with no assurance that such investment will be recouped. In order to support our future growth and drug development pipeline, we have expanded our large molecule production capacity by building a large-scale biologics manufacturing facility in Solothurn, Switzerland with no assurance that the additional capacity will be required or this investment will be recouped. Although the Solothurn facility was approved by the FDA for ADUHELM and LEQEMBI, there can be no assurance that the regulatory authorities will approve the Solothurn facility for the manufacturing of other products. Additionally, we are building a new gene therapy manufacturing facility in RTP, North Carolina with no assurance that this investment will be fully utilized. If we are unable to fully utilize this gene therapy manufacturing facility, charges from excess capacity may occur and would have a negative effect on our financial condition and results of operations. If we are unable to fully utilize our manufacturing facilities, our business may be harmed. Charges resulting from excess capacity may continue to occur and would have a negative effect on our financial condition and results of operations. The illegal distribution and sale by third-parties of counterfeit or unfit versions of our products or stolen products could have a negative impact on our reputation and business. Third-parties might illegally distribute and sell counterfeit or unfit versions of our products, which do not meet our rigorous manufacturing, distribution and testing standards. A patient who receives a counterfeit or unfit drug may be at risk for a number of dangerous health consequences. Our reputation and business could suffer harm as a result of counterfeit or unfit drugs sold under our brand name. Inventory that is stolen from warehouses, plants or while in-transit, and that is subsequently improperly stored and sold through unauthorized channels, could adversely impact patient safety, our reputation and our business. The increasing use of social media platforms and artificial intelligence based software presents new risks and challenges. Social media is increasingly being used to communicate about our products and the diseases our therapies are designed to treat. Social media practices in the biopharmaceutical industry continue to evolve and regulations relating to such use are not always clear and create uncertainty and risk of noncompliance with regulations applicable to our business. For example, patients may use social media channels to comment on the effectiveness
of a product or to report an alleged adverse event. When such disclosures occur, there is a risk that we fail to monitor and comply with applicable adverse event reporting obligations or we may not be able to defend the company or the public's legitimate interests in the face of the political and market pressures generated by social media due to restrictions on what we may say about our products. There is also a risk of inappropriate disclosure of sensitive information or negative or inaccurate posts or comments about us on social media. We may also encounter criticism on social media regarding our company, management, product candidates or products. The immediacy of social media precludes us from having real-time control over postings made regarding us via social media, whether matters of fact or opinion. Our reputation could be damaged by negative publicity or if adverse information concerning us is posted on social media platforms or similar mediums, which we may not be able to reverse. If any of these events were to occur or we otherwise fail to comply with applicable regulations, we could incur liability, face restrictive regulatory actions or incur other harm to our business. Additionally, the use of AI based software is increasingly being used in the biopharmaceutical industry. Use of AI based software may lead to the release of confidential proprietary information which may impact our ability to realize the benefit of our intellectual property. Risks Related to Holding Our Common Stock Our operating results are subject to significant fluctuations. Our quarterly revenue, expense and net income (loss) have fluctuated in the past and are likely to fluctuate significantly in the future due to the risks described in these Risk Factors as well as the timing of charges and expense that we may take. We have recorded, or may be required to record, charges that include: •the cost of restructurings or other initiatives to streamline our operations and reallocate resources; •the costs associated with decisions to terminate research and development programs; •impairments with respect to investments, fixed assets and long-lived assets, including IPR&D and other intangible assets; •inventory write-downs for failed quality specifications, charges for excess capacity, charges for excess or obsolete inventory and charges for inventory write-downs relating to product suspensions, expirations or recalls; •changes in the fair value of contingent consideration or our equity investments; •bad debt expense and increased bad debt reserves; •outcomes of litigation and other legal or administrative proceedings, regulatory matters and tax matters; •payments in connection with acquisitions, divestitures and other business development activities and under license and collaboration agreements; •failure to meet certain contractual commitments; and •the impact of public health epidemics, on employees, the global economy and the delivery of healthcare treatments. Our revenue and certain assets and liabilities are also subject to foreign currency exchange rate fluctuations due to the global nature of our operations. Our efforts to mitigate the impact of fluctuating currency exchange rates may not be successful. As a result, currency fluctuations among our reporting currency, the U.S. dollar, and other currencies in which we do business will affect our operating results, often in unpredictable ways. Our net income may also fluctuate due to the impact of charges we may be required to take with respect to foreign currency hedge transactions. In particular, we may incur higher than expected charges from early termination of a hedge relationship. Our operating results during any one period do not necessarily suggest the anticipated results of future periods. Our investments in properties may not be fully realized. We own or lease real estate primarily consisting of buildings that contain research laboratories, office space and manufacturing operations. We may decide to consolidate or co-locate certain aspects of our business operations or dispose of one or more of our properties, some of which may be located in markets that are experiencing high vacancy rates and decreasing property values. If we determine that the fair value of any of our owned properties is lower than their book value, we may not realize the full investment in these properties and incur significant impairment charges or additional depreciation when the expected useful lives of certain assets have been shortened due to the anticipated closing of facilities. If we decide to fully or partially vacate a property, we may incur significant cost, including facility closing costs, employee separation and retention expense, lease termination fees, rent expense in excess of sublease income and impairment of leasehold improvements and accelerated depreciation of assets. Any of these events may have an adverse impact on our results of operations.
Our investment portfolio is subject to market, interest and credit risk that may reduce its value. We maintain a portfolio of marketable securities for investment of our cash as well as investments in equity securities of certain biotechnology companies. Changes in the value of our investment portfolio could adversely affect our earnings. The value of our investments may decline due to, among other things, increases in interest rates, downgrades of the bonds and other securities in our portfolio, negative company-specific news, biotechnology market sentiment, instability in the global financial markets that reduces the liquidity of securities in our portfolio, declines in the value of collateral underlying the securities in our portfolio and other factors. Each of these events may cause us to record charges to reduce the carrying value of our investment portfolio or sell investments for less than our acquisition cost. Although we attempt to mitigate these risks through diversification of our investments and continuous monitoring of our portfolio's overall risk profile, the value of our investments may nevertheless decline. There can be no assurance that we will continue to repurchase shares or that we will repurchase shares at favorable prices. From time to time our Board of Directors authorizes share repurchase programs. The amount and timing of share repurchases are subject to capital availability and our determination that share repurchases are in the best interest of our shareholders and are in compliance with all respective laws and our applicable agreements. Our ability to repurchase shares will depend upon, among other factors, our cash balances and potential future capital requirements for strategic transactions, our results of operations, our financial condition and other factors beyond our control that we may deem relevant. Additionally, the recently enacted IRA includes an excise tax on share repurchases, which will increase the cost of share repurchases. A reduction in repurchases under, or the completion of, our share repurchase programs could have a negative effect on our stock price. We can provide no assurance that we will repurchase shares at favorable prices, if at all. We may not be able to access the capital and credit markets on terms that are favorable to us. We may seek access to the capital and credit markets to supplement our existing funds and cash generated from operations for working capital, capital expenditure and debt service requirements and other business initiatives. The capital and credit markets are experiencing, and have in the past experienced, extreme volatility and disruption, which leads to uncertainty and liquidity issues for both borrowers and investors. In the event of adverse market conditions, we may be unable to obtain capital or credit market financing on favorable terms which could significantly increase our financing costs. Changes in credit ratings issued by nationally recognized credit rating agencies could also adversely affect our cost of financing and the market price of our securities. Our indebtedness could adversely affect our business and limit our ability to plan for or respond to changes in our business. Our indebtedness, together with our significant contingent liabilities, including milestone and royalty payment obligations, could have important consequences to our business; for example, such obligations could: •increase our vulnerability to general adverse economic and industry conditions; •limit our ability to access capital markets and incur additional debt in the future; •require us to dedicate a substantial portion of our cash flow from operations to payments on our indebtedness, thereby reducing the availability of our cash flow for other purposes, including business development, research and development and mergers and acquisitions; and •limit our flexibility in planning for, or reacting to, changes in our business and the industry in which we operate, thereby placing us at a disadvantage compared to our competitors that have less debt. Some of our collaboration agreements contain change in control provisions that may discourage a third-party from attempting to acquire us. Some of our collaboration agreements include change in control provisions that could reduce the potential acquisition price an acquirer is willing to pay or discourage a takeover attempt that could be viewed as beneficial to shareholders. Upon a change in control, some of these provisions could trigger reduced milestone, profit or royalty payments to us or give our collaboration partner rights to terminate our collaboration agreement, acquire operational control or force the purchase or sale of the programs that are the subject of the collaboration. General Risk Factors Our effective tax rate fluctuates, and we may incur obligations in tax jurisdictions in excess of accrued amounts. As a global biopharmaceutical company, we are subject to taxation in numerous countries, states and other jurisdictions. As a result, our effective tax rate is derived from a combination of applicable tax rates, including
withholding taxes, in the various places that we operate. In preparing our financial statements, we estimate the amount of tax that will become payable in each of such places. Our effective tax rate may be different than experienced in the past or our current expectations due to many factors, including changes in the mix of our profitability from country to country, the results of examinations and audits of our tax filings, adjustments to the value of our uncertain tax positions, interpretations by tax authorities or other bodies with jurisdiction, the result of tax cases, changes in accounting for income taxes and changes in tax laws and regulations either prospectively or retrospectively and the effects of the integration of Reata. Our inability to secure or sustain acceptable arrangements with tax authorities and future changes in the tax laws, among other things, may result in tax obligations in excess of amounts accrued in our financial statements. The enactment of some or all of the recommendations set forth or that may be forthcoming in the OECD’s project on “Base Erosion and Profit Shifting” by tax authorities and economic blocs in the countries in which we operate, could unfavorably impact our effective tax rate. These initiatives focus on common international principles for the entitlement to taxation of global corporate profits and minimum global tax rates. Many countries have or are in the process of enacting legislation intended to implement the OECD GloBE Model Rules effective on January 1, 2024. The impact on the Company will depend on the timing of implementation, the exact nature of each country's GloBE legislation, guidance and regulations thereon and their application by tax authorities either prospectively or retrospectively. Our business involves environmental risks, which include the cost of compliance and the risk of contamination or injury. Our business and the business of several of our strategic partners involve the controlled use of hazardous materials, chemicals, biologics and radioactive compounds. Although we believe that our safety procedures for handling and disposing of such materials comply with state, federal and foreign standards, there will always be the risk of accidental contamination or injury. If we were to become liable for an accident, or if we were to suffer an extended facility shutdown, we could incur significant costs, damages and penalties that could harm our business. Manufacturing of our products and product candidates also requires permits from government agencies for water supply and wastewater discharge. If we do not obtain appropriate permits, including permits for sufficient quantities of water and wastewater, we could incur significant costs and limits on our manufacturing volumes that could harm our business. Additionally, regulators are considering new environmental disclosure rules. For example, the SEC and other regulators are considering environmental disclosure rules and California enacted new environmental disclosure laws in October 2023 that will generally require additional disclosure and reporting by 2026. The new California laws, the Climate Corporate Data Accountability Act and the Climate-Related Financial Risk Act, each impose additional climate-related reporting requirements on large companies conducting business in the state of California. We expect to be subject to these new laws, which impose extensive reporting obligations about greenhouse gas emissions and climate-related financial risks. These recently enacted and proposed regulations may require us to incur compliance and disclosure costs and require management attention. ITEM 1B. UNRESOLVED STAFF COMMENTS None. ITEM 1C. CYBERSECURITY RISK MANAGEMENT AND STRATEGY We maintain a technology and cybersecurity program, which includes information security, as part of our overall risk management process with the aim that our information systems, including those of our vendors and other third-parties, will be resilient, effective and capable of safeguarding against emerging risks and cybersecurity threats. We endeavor to assure our program is appropriately resourced and to attract and retain expert talent to execute it. In designing, operating, evaluating and maintaining our program we use internal and external resources and frameworks, including cybersecurity expert consultants, industry working groups, the U.S. NIST Cybersecurity Framework and the U.S. Cybersecurity Agency's National Cyber Incident Scoring System model to benchmark, inform and evaluate the design of our program, our operational capabilities and our program maturity. Consistent with NIST 800-53, our technology and cybersecurity program and controls include a third party and vendor risk management component. As part of our vendor risk management program, we conduct security assessments prior to engagement of high-risk vendors and other third-party providers and have a monitoring program to evaluate ongoing compliance with our cybersecurity standards.
A key element of our technology and cybersecurity program strategy is fostering training and awareness. Our training and awareness program includes annual cybersecurity awareness training and role-based phishing tests for our employees and for third parties with access to our systems. Our technology and cybersecurity program focuses on the defense, rapid detection and rapid remediation of cybersecurity threats and incidents. Our program includes systems and processes designed based on defense-in-depth and zero-trust architectural principles and that are intended to provide the control capabilities set forth in NIST's 800-53 Rev 5, Security and Privacy Controls for Information Systems and Organizations. Our program also includes cybersecurity policies and a crisis response and management plan that is intended to allow rapid management and response and appropriate communication of cybersecurity threats and incidents. We staff a cybersecurity operations center to respond to threats and incidents. Our cybersecurity crisis management plan sets forth the items, procedures and actions we expect to address and follow in the event of a cybersecurity incident, including detection, response, mitigation and remediation. In addition to the cybersecurity operations center and our designated cybersecurity response team, we maintain a cross-functional cybersecurity crisis core team, which includes our CISO and senior representatives from our Legal, Finance, IT and Corporate Security teams. When a potential threat or incident is identified, our cyber security incident response team will assign a risk level classification and initiate the escalation and other steps called for by our plan. All incidents that are initially assessed by the cybersecurity incident response team as potentially high-risk are escalated promptly to our CISO. Our CISO, Chief Legal Officer and Chief Financial Officer, will determine whether and what elements of our cybersecurity crisis response and management plan should be activated, including escalation to other senior management or our Executive Committee. Our Executive Committee will inform our Board of Directors of cybersecurity incidents, as appropriate, considering a variety of factors, including financial, operational, legal or reputational impact. Our program's maturity and operational readiness are regularly evaluated by independent experts using the U.S. NIST's CyberSecurity Framework and penetration tests. Our program, and the results of these independent evaluations and testing, are regularly reviewed by our senior management and members of our Board of Directors. CYBERSECURITY RISK GOVERNANCE We are committed to appropriate cybersecurity governance and oversight. Our technology and cybersecurity program is the principal responsibility of our Chief Information Officer and CISO, each of whom have over 20 years of experience in information systems, including cybersecurity training and experience. Additionally, we have a Cybersecurity steering committee that includes senior representatives from our Legal, Finance and IT departments, which meets regularly to discuss cybersecurity matters. Our Board of Directors oversees management's processes for identifying and mitigating risks, including cybersecurity and information security risks. Our Audit Committee of our Board of Directors regularly reviews our technology and cybersecurity program and effectiveness, internal audits of our program, independent external expert evaluations of our program's maturity and operational readiness and the results of penetration testing. Our Audit Committee also receives regular cybersecurity updates and education on a broad range of topics, including: •Current cybersecurity landscape and emerging threats; •Status of ongoing cybersecurity initiatives and strategies; •Incident report and learnings from any cybersecurity events; and •Compliance with regulatory requirements and industry standards. For additional information on our cybersecurity risks, please read Item 1A. Risk Factors - A breakdown or breach of our technology systems could subject us to liability or interrupt the operation of our business, included in this report. ITEM 2. PROPERTIES Below is a summary of our owned and leased properties as of December 31, 2023. U.S. MASSACHUSETTS In Cambridge, Massachusetts we own approximately 263,000 square feet of real estate space, consisting of a building that houses a research laboratory and a cogeneration plant.
In addition, we lease a total of approximately 1,165,000 square feet in Massachusetts, which is summarized as follows: •808,000 square feet in Cambridge, Massachusetts, which is comprised of offices for our corporate headquarters and other administrative and development functions and laboratories, of which 209,000 square feet is subleased by multiple companies for general office space, laboratories and manufacturing facilities; and •357,000 square feet of office space in Weston, Massachusetts, of which 174,000 square feet is subleased through the remaining term of our lease agreement. Our lease expires in May 2025 and we do not intend on renewing the lease agreement. Our Massachusetts lease agreements expire at various dates through the year 2028. 125 BROADWAY BUILDING SALE AND LEASEBACK In September 2022 we completed the sale of our building and land parcel located at 125 Broadway. In connection with this sale, we simultaneously leased back the building for a term of approximately 5.5 years. The sale and immediate leaseback of this building qualified for sale and leaseback treatment and is classified as an operating lease. For additional information on our 125 Broadway sale and leaseback transaction, please read Note 11, Property, Plant and Equipment and Note 12, Leases, to our consolidated financial statements included in this report. 300 BINNEY STREET LEASE MODIFICATION In September 2022 we entered into an agreement to partially terminate a portion of our lease located at 300 Binney Street, as well as to reduce the lease term for the majority of the remaining space. The agreement was driven by our 2022 efforts to reduce costs by consolidating real estate locations. For additional information on our 300 Binney Street lease modification, please read Note 12, Leases, to our consolidated financial statements included in this report. NORTH CAROLINA In RTP, North Carolina we own approximately 1,040,000 square feet of real estate space, which is summarized as follows: •357,000 square feet of laboratory and office space; •206,000 square foot multi-purpose facility, including an ASO manufacturing suite and administrative space; •175,000 square feet related to a large-scale biologics manufacturing facility; •105,000 square feet related to a small-scale biologics manufacturing facility; •84,000 square feet of warehouse space and utilities; •70,000 square feet related to a parenteral fill-finish facility; and •43,000 square feet related to a large-scale purification facility. In addition, we lease approximately 65,000 square feet of warehouse space in Durham, North Carolina. Our North Carolina lease agreements expire at various dates through the year 2025. In the fourth quarter of 2021 we began construction of a new gene therapy manufacturing facility in RTP, North Carolina to support our gene therapy pipeline across multiple therapeutic areas. The new manufacturing facility will be approximately 197,000 square feet. As we continue to advance our research and development prioritization efforts, which includes refocusing our investment in gene therapy, we are evaluating several alternative uses for this facility.
TEXAS As part of our acquisition of Reata in September 2023 we acquired leases totaling approximately 404,000 square feet of real estate space, which is summarized as follows: •327,000 square feet in Plano, Texas, which is comprised of office and laboratory space, with an initial lease term through the year 2038. We do not intend to occupy this building and are evaluating opportunities to sublease this property; •35,000 square feet in Irving, Texas, which is comprised of office and laboratory space and expires in 2024; and •42,000 square feet in Plano, Texas, which is comprised of office and laboratory space and expires in 2024. For additional information on our acquisition of Reata, please read Note 2, Acquisitions, to our consolidated financial statements included in this report. INTERNATIONAL SWITZERLAND In order to support our future growth and drug development pipeline, we built a large-scale biologics manufacturing facility in Solothurn, Switzerland. This facility includes 393,000 square feet related to a large-scale biologics manufacturing facility, 290,000 square feet of warehouse, utilities and support space and 51,000 square feet of administrative space. In the second quarter of 2021 a portion of the facility (the first manufacturing suite) received a GMP multi-product license from the SWISSMEDIC and was placed into service. The second manufacturing suite became operational in January 2024. Solothurn has been approved for the manufacture of ADUHELM and LEQEMBI by the FDA. For additional information on our Solothurn manufacturing facility, please read Note 11, Property, Plant and Equipment, to our consolidated financial statements included in this report. OTHER INTERNATIONAL We lease office space in Baar, Switzerland, our international headquarters; the U.K.; Germany; France; Japan; Canada and numerous other countries. Our international lease agreements expire at various dates through the year 2034. ITEM 3. LEGAL PROCEEDINGS For a discussion of legal matters as of December 31, 2023, please read Note 21, Litigation, to our consolidated financial statements included in this report, which is incorporated into this item by reference. ITEM 4. MINE SAFETY DISCLOSURES Not applicable.
For additional information on our collaboration arrangement with Eisai, please read Note 20, Collaborative and Other Relationships, to our consolidated financial statements included in this report.
Neurimmune Collaboration Agreement
In October 2017 we amended the terms of our collaboration and license agreement with Neurimmune. Under the amended agreement, we made a $150.0 million payment to Neurimmune, which is reflected as a charge to noncontrolling interests, in exchange for a 15% reduction in royalty rates payable on products developed under the agreement, including on potential commercial sales of aducanumab. Our royalty rates payable on products developed under the agreement, including on potential commercial sales of aducanumab, will now range from the high single digits to low-teens.
Under the amended agreement, we also have an option that will expire in April 2018 to further reduce our royalty rates payable on products developed under the agreement, including on potential commercial sales of aducanumab, by an additional 5% in exchange for a $50.0 million payment to Neurimmune.
For additional information on our collaboration arrangement with Neurimmune, please read Note 19, Investments in Variable Interest Entities, to our consolidated financial statements included in this report.
BIIB098 License Agreement
In November 2017 we entered into an exclusive license and collaboration agreement with Alkermes for BIIB098 (formerly known as ALKS 8700), an oral MMF prodrug in Phase 3 development for the treatment of relapsing forms of MS.
Under this agreement, we received an exclusive, worldwide license to develop and commercialize BIIB098 and will pay Alkermes a royalty on potential worldwide net sales of BIIB098. Beginning in 2018 we are responsible for all development expenses related to BIIB098. Alkermes will maintain responsibility for regulatory interactions with the FDA through the potential approval of the NDA for BIIB098 for the treatment of MS.
For additional information on our collaboration arrangement with Alkermes, please read Note 20, Collaborative and Other Relationships, to our consolidated financial statements included in this report.
Ionis Collaboration Agreement
In December 2017 we entered into a new collaboration agreement with Ionis to identify new ASO drug candidates for the treatment of SMA. Under this agreement, we have the option to license therapies arising out of this collaboration and will be responsible for the development and commercialization of these therapies.
For additional information on our new collaboration arrangement with Ionis, please read Note 20, Collaborative and Other Relationships, to our consolidated financial statements included in this report.
Business Environment
The biopharmaceutical industry and the markets in which we operate are intensely competitive. Many of our competitors are working to develop or have commercialized products similar to those we market or are developing and have considerable experience in undertaking clinical trials and in obtaining regulatory approval to market pharmaceutical products. In addition, the commercialization of certain of our own approved MS products, products of our collaborators and pipeline product candidates may negatively impact future sales of our existing MS products. Our products may also face increased competitive pressures from the introduction of generic versions, prodrugs of existing therapies or biosimilars of existing products and other technologies.
Sales of our products are dependent, in large part, on the availability and extent of coverage, pricing and reimbursement from government health administration authorities, private health insurers and other organizations. Drug prices are under significant scrutiny in the markets in which our products are prescribed. Drug pricing and other health care costs continue to be subject to intense political and societal pressures on a global basis.
In addition, our sales and operations are subject to the risks of doing business internationally. For example, the effects of the implementation of the U.K.’s decision to voluntarily depart from the E.U., known as Brexit, remain unclear; compliance with any resulting regulatory mandates may prove challenging and the macroeconomic impact on our sales and consolidated results of operations from these developments remains unknown.
For additional information on our competition and pricing risks that could negatively impact our product sales, please read Item 1A. Risk Factors and Item 7A. Quantitative and Qualitative Disclosures About Market Risk included in this report.
Results of Operations
Revenues
Revenues are summarized as follows:
| | | | | | | | | | | | | | | | | | | | | For the Years Ended December 31, | | % Change | | | 2017 compared to 2016 | | 2016 compared to 2015 | | (In millions, except percentages) | 2017 | | 2016 | | 2015 | | | Product Revenues: | | | | | | | | | | | United States | $ | 7,017.1 |
| | $ | 7,050.4 |
| | $ | 6,545.8 |
| | (0.5 | )% | | 7.7 | % | | Rest of world | 3,337.6 |
| | 2,767.5 |
| | 2,642.7 |
| | 20.6 | % | | 4.7 | % | | Total product revenues | 10,354.7 |
| | 9,817.9 |
| | 9,188.5 |
| | 5.5 | % | | 6.8 | % | | Revenues from anti-CD20 therapeutic programs | 1,559.2 |
| | 1,314.5 |
| | 1,339.2 |
| | 18.6 | % | | (1.8 | )% | | Other revenues | 360.0 |
| | 316.4 |
| | 236.1 |
| | 13.8 | % | | 34.0 | % | | Total revenues | $ | 12,273.9 |
| | $ | 11,448.8 |
| | $ | 10,763.8 |
| | 7.2 | % | | 6.4 | % |
Product Revenues
Product revenues are summarized as follows:
| | | | | | | | | | | | | | | | | | | | | For the Years Ended December 31, | | % Change | | | 2017 compared to 2016 | | 2016 compared to 2015 | | (In millions, except percentages) | 2017 | | 2016 | | 2015 | | | Multiple Sclerosis: | | | | | | | | | | | TECFIDERA | $ | 4,214.0 |
| | $ | 3,968.1 |
| | $ | 3,638.4 |
| | 6.2 | % | | 9.1 | % | | Interferon* | 2,645.8 |
| | 2,795.2 |
| | 2,968.7 |
| | (5.3 | )% | | (5.8 | )% | | TYSABRI | 1,973.1 |
| | 1,963.8 |
| | 1,886.1 |
| | 0.5 | % | | 4.1 | % | | FAMPYRA | 91.6 |
| | 84.9 |
| | 89.7 |
| | 7.9 | % | | (5.4 | )% | | ZINBRYTA | 52.7 |
| | 7.8 |
| | — |
| | ** |
| | ** |
| | Spinal Muscular Atrophy: | | | | | | | | | | | SPINRAZA | 883.7 |
| | 4.6 |
| | — |
| | ** |
| | ** |
| | Hemophilia: | | | | | | | | | | | ELOCTATE | 48.4 |
| | 513.2 |
| | 319.7 |
| | (90.6 | )% | | 60.5 | % | | ALPROLIX | 26.0 |
| | 333.7 |
| | 234.5 |
| | (92.2 | )% | | 42.3 | % | | Other product revenues: | | | | | | | | | | | FUMADERM | 39.6 |
| | 45.9 |
| | 51.4 |
| | (13.7 | )% | | (10.7 | )% | | BENEPALI | 370.8 |
| | 100.6 |
| | — |
| | ** |
| | ** |
| | FLIXABI | 9.0 |
| | 0.1 |
| | — |
| | ** |
| | ** |
| | Total product revenues | $ | 10,354.7 |
| | $ | 9,817.9 |
| | $ | 9,188.5 |
| | 5.5 | % | | 6.8 | % |
* Interferon includes AVONEX and PLEGRIDY.
** Percentage not meaningful.
Multiple Sclerosis (MS)
TECFIDERA
For 2017 compared to 2016, the increase in U.S. TECFIDERA revenues was primarily due to price increases, partially offset by higher discounts and allowances and a decrease in unit sales volume of 3%.
For 2016 compared to 2015, the increase in U.S. TECFIDERA revenues was primarily due to price increases, partially offset by higher discounts and allowances and a decrease in unit sales volume of 1%.
For 2017 compared to 2016, the increase in rest of world TECFIDERA revenues was primarily due to increases in unit sales volume of 19% primarily in the E.U., partially offset by pricing reductions in certain European countries.
For 2016 compared to 2015, the increase in rest of world TECFIDERA revenues was primarily due to increases in unit sales volume of 32% in existing markets and new markets where we continue to launch the product and expand our presence around the world. These increases were partially offset by pricing reductions in certain European countries. Rest of world TECFIDERA revenues for 2016, compared to 2015, were also negatively impacted by a $50.2 million decrease in hedge gains recognized under our foreign currency hedging program in the comparative period.
We anticipate a modest increase in TECFIDERA demand on a global basis in 2018, compared to 2017, with expected volume growth in our international markets partially offset by declines in the U.S., due to increased competition from additional treatments for MS, including OCREVUS.
Interferon
AVONEX and PLEGRIDY
For 2017 compared to 2016, the decrease in U.S. Interferon revenues was primarily due to an overall decrease in Interferon unit sales volumes of 12%, which was primarily attributable to patients transitioning to other MS therapies, partially offset by price increases.
For 2016 compared to 2015, the decrease in U.S. Interferon revenues was primarily due to an overall decrease in Interferon unit sales volume of 10%, which was attributable to a decrease in AVONEX unit sales volume primarily due to patients transitioning to other oral MS therapies, as well as higher discounts and allowances. These decreases were partially offset by price increases.
For 2017 compared to 2016, the decrease in rest of world Interferon revenues was primarily due to an overall decrease in AVONEX unit sales volume of 14% primarily due to patients transitioning to other MS therapies in the E.U.
For 2016 compared to 2015, the decrease in rest of world Interferon revenues was primarily due to pricing reductions in certain European countries and an overall decrease in AVONEX unit sales volume of 10% due primarily to patients transitioning to other oral MS therapies, including TECFIDERA. Rest of world Interferon revenues for 2016, compared to 2015, were also negatively impacted by a $66.1 million decrease in hedge gains recognized under our hedging program in the comparative period.
We expect that overall Interferon revenues will continue to decline compared to prior year periods as a result of increasing competition from our other products as well as other treatments for MS, including biosimilars.
AVONEX For 2017, 2016 and 2015, U.S. AVONEX revenues totaled $1,593.6 million, $1,675.3 million and $1,790.2 million, respectively.
For 2017, 2016 and 2015 rest of world AVONEX revenues totaled $557.9 million, $638.2 million and $840.0 million, respectively.
PLEGRIDY For 2017, 2016TYSABRI
QALSODY Other* | | Solothurn, Switzerland | | LEQEMBI TYSABRI** | |
* Other includes products manufactured for contract manufacturing partners. ** We began manufacturing TYSABRI at the Solothurn manufacturing facility in 2024. In addition to our drug substance manufacturing facilities, we have a drug product manufacturing facility and supporting infrastructure in RTP, North Carolina, including a parenteral facility and an oral solid dose products manufacturing facility. The parenteral facility adds capabilities and capacity for filling biologics into vials and is used for filling product candidates. The oral solid dose products facility can supplement our outsourced small molecule manufacturing capabilities. We also have an oligonucleotide synthesis manufacturing facility in RTP, North Carolina. This facility gives us the capability to manufacture both commercial and clinical ASO's and beginning in 2024 this facility will manufacture SPINRAZA. In order to support our future growth and drug development pipeline, we built a large-scale biologics manufacturing facility in Solothurn, Switzerland. In the second quarter of 2021 a portion of the facility (the first manufacturing suite) received a GMP multi-product license from the SWISSMEDIC and was placed into service. The second manufacturing suite became operational in January 2024. Solothurn has been approved for the manufacture of ADUHELM and LEQEMBI by the FDA. Genentech is responsible for all worldwide manufacturing activities for bulk RITUXAN, RITUXAN HYCELA and GAZYVA and has sourced the manufacture of certain bulk RITUXAN, RITUXAN HYCELA and GAZYVA requirements to a third party. Alkermes currently supplies both VUMERITY and FAMPYRA to us pursuant to separate supply agreements. In October 2019 we entered into a new supply agreement and amended our license and collaboration agreement with Alkermes for VUMERITY. We have elected to initiate a technology transfer and, following a transition period, to manufacture VUMERITY or have VUMERITY manufactured by a third party we have engaged in exchange for paying an increased royalty rate to Alkermes on any portion of future worldwide net commercial sales of VUMERITY that is manufactured by us or our designee. In January 2023 we entered into a new supply agreement with Alkermes for FAMPYRA through January 2025. In December 2023 Alkermes entered into a definitive agreement to sell its development and manufacturing facility to Novo Nordisk, which is expected to close in mid-2024. Alkermes and Novo Nordisk plan to enter into subcontracting arrangements to continue work currently performed at the facility for a period of time after closing the transaction, which may continue through the end of 2025. THIRD-PARTY SUPPLIERS AND MANUFACTURERS We principally use third parties to manufacture the active pharmaceutical ingredient and the final product for our small molecule products and product candidates, including TECFIDERA and FUMADERM, and the final drug product for our large molecule products and, to a lesser extent, product candidates. We source the majority of our fill-finish and all of our final product assembly and storage operations for our products, along with a substantial part of our label and packaging operations, to a concentrated group of third-party contract manufacturing organizations. Raw materials, delivery devices, such as syringes and auto-injectors, and other supplies required for the production of our products and product candidates are procured from various third-party suppliers and manufacturers in quantities adequate to meet our needs. Continuity of supply of such raw materials, devices and supplies is assured through inventory management and dual sourcing as appropriate. Our third-party service providers, suppliers and manufacturers may be subject to routine cGMP inspections by the FDA or comparable agencies in other jurisdictions and undergo assessment and certification by our quality management
group. In addition, one of our contract manufacturers for IMRALDI and BENEPALI entered into a proposed acquisition by a third party, which is expected to close at the end of 2024. We are currently evaluating the impact this will have on our biosimilars business. ESG AND CLIMATE-RELATED MATTERS INTRODUCTION We continue to refine our ESG strategy and programs so they are designed to deliver meaningful results in the areas where we believe we can have the greatest impact. We have bolstered our efforts in access and health equity and refocused our Foundation efforts on the communities where we operate. Our environmental strategy is designed to balance impact in line with investment and to drive sustainability into our core operations. GOVERNANCE ESG oversight is formally embedded into our Board of Director's corporate governance principles and our Board of Directors annually review our ESG strategy and short-and long-term goals. We regularly review our environmental commitments within the context of our business performance, rising costs and supply chain challenges. We remain committed to engaging employees and suppliers. As part of our broader commitment to these priorities, we continue to tie a portion of our employees' and executive officers' compensation to advancing our ESG efforts. We strive to comply in all material respects with applicable laws and regulations concerning the environment. While it is impossible to predict accurately the future costs associated with environmental compliance and potential remediation activities, compliance with environmental laws is not currently expected to require significant capital expenditures and has not had, and is not expected to have, a material adverse effect on our operations or competitive position. Our Executive Committee has responsibility for evaluating the impact of climate change on the business and overseeing actions taken by the company to limit its adverse impact on the environment. Our ERM framework is designed to ensure climate-related risks and opportunities are integrated into our overall business strategy. Our ERM team monitors strategic climate-related risks across all aspects of our business and utilizes climate scenarios as part of its assessments. The ERM team evaluates identified risks, including any climate-related physical and transitional risks, by engaging leaders across the company. RISK MANAGEMENT Addressing ESG matters is part of our long-term global strategy and investment in our future and we have seen increased interest from stakeholders and investors on our ESG practices. While we continue to advance our ESG efforts, there is no certainty that we will manage ESG matters in ways that successfully meet rapidly changing expectations from investors, regulators, third party rankings firms, customers and society as a whole. Our inability to manage ESG matters in accordance with expectations can negatively impact our reputation and business. CLIMATE RISK MANAGEMENT We identify climate risk as the risk of loss arising from climate change which comprises both physical risk and transition risk. Physical risk considers how the physical impacts of climate change (e.g., increased frequency and intensity of storms, drought, fires, floods) can directly damage physical assets or otherwise impact their value or productivity. Transition risk considers how changes in policy, regulations, culture, technology, business practices and market preferences to address climate change (e.g., carbon pricing policies, power generation shifts from fossil fuels to renewable energy) can lead to changes in the value of assets and businesses. Disruption in supply chains, changing customer expectations in the biosimilars market and potential shifts in the regulatory environment that disadvantage the use of fossil fuels, PFAS or other materials may make it difficult for us to fulfill business obligations or cause us to incur substantial expense. Identified climate-related material risks and opportunities are reported to our ERM team, which reports to our Executive Committee and Board of Directors. We consider and address those risks and opportunities that are financially material and may impact our business model, as well as mitigation measures that are in place or need to be adopted. For additional information on our environment-related risks, please read Item 1A. Risk Factors included in this report.
CALIFORNIA CLIMATE LEGISLATION In October 2023 California signed into law the CCDAA and the CRFRA. These new environmental disclosure laws will each impose additional climate-related reporting requirements on large companies conducting business in the state of California. Beginning in 2026 the CCDAA will require companies meeting certain revenue thresholds to publicly disclose Scope 1 and Scope 2 GHG emissions for the prior fiscal year. Starting in 2027 companies meeting certain revenue thresholds will also need to publicly disclose Scope 3 GHG emissions for the prior fiscal year. Assurance requirements will also apply to these public disclosures and will be phased-in over time. The CRFRA will require companies meeting certain revenue thresholds to prepare biennial reports disclosing climate-related financial risk, as well as mitigation measures the company has adopted to reduce this risk. The first climate-related financial risk reports are due by January 1, 2026. We expect to be required to comply with both the CCDAA and CRFRA and are actively evaluating the requirements under these acts in order to prepare for compliance. At this time, we expect we may incur additional costs associated with these new laws, including costs associated with implementing or updating existing controls and procedures to collect and maintain required data, as well as costs associated with retaining third-party assurance providers. As of December 31, 2023, we had approximately 7,570 employees worldwide. Approximately 4,140 employees were employed in the U.S. and approximately 3,430 employees were employed in foreign countries. DIVERSITY, EQUITY AND INCLUSION At Biogen, prejudice, racism and intolerance are unacceptable. We are committed to DE&I across all aspects of our organization, including recruitment, hiring, promotion, retention and development practices. As of December 31, 2023, 31.2% of Biogen’s manager-level and above positions were held by ethnic or racial minorities in the U.S. Our policies and practices are global, but the laws in many countries outside the U.S. do not permit us to collect ethnic or racial data on our employees. Globally, 48.6% of Biogen’s positions at director-level and above were held by women as of December 31, 2023. Our DE&I strategy outlines what we believe to be actionable steps to deepen our commitment across the business, building upon a strong foundation. This plan includes the strategy to build our talent and strengthen our leadership, improve health outcomes for underserved communities in the disease areas we treat and contribute to the communities impacting our employees and patients. We plan to create greater awareness and capability in our organization through leadership accountability and transparency. We are honored to be recognized as an employer of choice. For the sixth consecutive year, we scored 100% on the Disability:IN's Disability Equality Index, which measures our policies and practices related to disability inclusion. Additionally, for the fourth consecutive year, we were awarded the DI-NC Employer Award by Disability:IN North Carolina for our commitment to champion and invest in disability inclusion at the affiliate and national levels. For the tenth consecutive year, we were recognized as a Best Place to Work for LGBTQ+ Equality by the Human Rights Campaign, scoring 100% on their Corporate Equality Index. STRENGTHENING OUR GLOBAL COMPETENCY We are committed to strengthening the DE&I awareness and capability of our employees. We have focused on giving our employees the resources and learning they need to contribute to our strategy. Our people managers are trained on inclusive recruiting and hiring and our global employees are trained on DE&I curriculum. In 2022 we introduced GlobeSmart®, a tool to enhance cross-cultural collaboration, increase cultural agility and further connect our global teams. Our people leaders have used GlobeSmart®, allowing them to explore different working styles, perspectives and approaches that exist around the globe, getting actionable, personalized advice for better collaboration and teamwork across cultures, and exploring new ways for teams to build trust, strengthen collaboration and leverage diversity. PHILOSOPHY ON PAY EQUITY We are committed to providing our employees with equal pay for equal work. We establish components and ranges of compensation based on market and benchmark data. Within this context, we strive to pay all employees equitably within a reasonable range, taking into consideration factors such as role; market data; internal equity; job location; relevant experience; and individual, business unit and company performance. In addition, we are committed to
providing flexible benefits designed to allow our diverse global workforce to have reward opportunities that meet their varied needs so that they are inspired to perform their best on behalf of patients and stockholders each day. We regularly review our compensation practices and analyze the equity of compensation decisions, for individual employees and our workforce as a whole. We institute measures, such as communications and trainings, to recognize, interrupt and prevent bias in hiring, performance management and compensation decisions and we provide resources to further develop managers and leaders to help them make equitable decisions about pay. RECRUITMENT AND RETENTION A business-wide priority is to strengthen our culture and the employee experience. To address a highly dynamic labor market, we have examined our global benefits and seek to provide competitive comprehensive total rewards to our employees. We have also conducted an affordability analysis to benchmark whether our benefits program costs are equitable. We examined employee total rewards across four pillars: physical, financial, emotional and social well-being. We continue to evolve our programs to meet our employees’ health and wellness needs, which we believe is essential to attract and retain employees of the highest caliber. We have refreshed our flexible working arrangement policies to allow for more flexibility around work hours to help employees balance the demands of their work and home lives, shifted many of our on-site wellness services to virtual, including virtual behavior health, nutrition, fitness and overall well-being classes and counseling, provided financial planning workshops, expanded our caregiver services and provided additional holidays and time off for recharging, voting and volunteering. SUCCESSION PLANNING Each year we conduct a talent review across our global enterprise that includes, among other important topics, a review of succession plans for many of our roles. To help ensure the long-term continuity of our business, we actively manage the development of talent to fill the roles that are most critical to the ongoing success of our Company. In addition, each year our Board of Directors reviews the succession plan for our executives. TALENT AND DEVELOPMENT Many factors influence employee success and well-being. We work to foster a workplace to allow employees to deliver on our shared mission while helping to mitigate their challenges. From career development to wellness to workplace environment, there are many opportunities to meet employee needs, and to build a workplace where people are empowered to learn, grow and build rewarding careers. Our employees are encouraged to take advantage of an array of professional development resources. Managers are trained to coach employees for performance, and also engage in employee development discussions to support growth and learning. Opportunities for ongoing learning can contribute to employee related engagement and success. At Biogen, development occurs through on-the-job learning, challenging new assignments, formal training, online learning, mentoring and more. With many employees continuing to work from home, virtual learning plays a key role. Virtual learnings are available through Biogen University as well as LinkedIn Learning. Through Biogen University we offer more than 1,000 instructor-based courses, of which approximately 200 are available virtually. Through LinkedIn Learning we provided employees with access to more than 22,000on-demand learning modules in 13 languages. To create and sustain a workplace as diverse and inclusive as the patients we serve, we offer programs that invest in our talent pipeline and in our current leaders, including: •Activate, Reflect and Co-Create: Preparing top talent for the rigors of executive roles. •Women’s Leadership Program:Addressing the unique challenges faced by female leaders to increase influence and impact. •Executive Leadership Retreat: Immersing leaders in topics designed to help them shape culture and build resilience. •The Partnership, Inc's BioDiversity Fellows Program:To continue to bolster our talent pipeline with a diverse mix of leaders, high potential, mid-career, underrepresented minorities participate in this program, which we helped create. •Women on the Rise: Addressing the unique challenges faced by mid-level female leaders to increase influence and impact. •Emerging Leaders: Preparing high-potential individual contributors for first-level leadership roles.
•BetterUp: Coaching program available to support individuals as they work toward enhancing their impact in the organization. Our ERNs provide invaluable opportunities for employees to share knowledge and build connections. Our current ERNs include: •Parenting Network Group: Biogen's newest ERN provides support, networking and development opportunities to working parents and caregivers, as well as helping employees navigate the challenges of work-life balance. •IGNITE: Brings together early-career professionals and their advocates. •AccessAbility: Supports employees with disabilities and employees who are caretakers of individuals with disabilities. •Biogen Veterans Network: Encourages veterans and allies of veterans to connect and support one another. •Mosaic: Fosters awareness and appreciation of different cultural backgrounds, in addition to promoting networking and development opportunities for members. •ReachOUT:Supports a best-in-class working environment for LGBTQ+ employees and embraces all LGBTQ+ employees and their allies. •Women’s Innovation Network: Creates networking, mentoring and learning opportunities for women and allies worldwide. •ourIMPACT:Advances climate, health and equity at work, in employees' personal lives and in the communities where we live and work. CULTURE AND ENGAGEMENT We utilize an employee survey program to pulse employees through email and mobile apps as well as provide an opportunity for commentary and facilitate feedback to questions. The survey is designed to empower managers and leaders with anonymous information on their practices related to building culture, performance and an engaged workforce, allowing them to create plans and measure efficacy for continuous improvement. We care deeply about employee feedback and are building an analytics community across Human Resources to bring more rigor and sophistication to the collection and analysis of employee opinions. We use their perspectives to guide us to take actions that improve engagement and support and help maintain our reputation as a great place to work for all our employees. WORKPLACE HEALTH AND SAFETY The well-being of our employees is the priority, and we believe every employee plays a role in creating a safe and healthy workplace. Our employees have varied roles and functions, which is why we empower them to promote a safe working environment, regardless of whether work happens in the lab, in an office or in a manufacturing plant. Our policies and practices are intended to protect not only our employees, but also the surrounding communities where we operate. In 2023 we continued to make significant progress integrating Human Performance into our Environment, Health and Safety programs. We believe that, when it comes to safety, workers are part of the solution. We encourage employees to collaboratively engage in proactive problem solving through practices such as Open Reporting and Work Observation and Risk Conversations. Additionally, our physical safety program focused on detailed evaluations of critical tasks that could expose employees to serious injury or fatality if controls are absent or not used. The actions we implement as a result of these evaluations reduce the risks associated with these essential activities and ensure our operational systems are safer and more resilient for employees. We also use “After Action Reviews” following the completion of a project. These reviews enable us to not only focus on areas for improvement, but also to learn and apply good practices from what goes well. By engaging and empowering our employees through such programs, we believe that we can help change how the entire industry approaches safety performance and risk management.
INFORMATION ABOUT OUR EXECUTIVE OFFICERS (as of February 13, 2024) | | | | | | | | | | | | | | | | | | | | | | Officer | | Current Position | | Age | | Year Joined Biogen | | Christopher A. Viehbacher | | President, Chief Executive Officer | | 63 | | 2022 | | Susan H. Alexander | | Executive Vice President, Chief Legal Officer | | 67 | | 2006 | | Michael R. McDonnell | | Executive Vice President and Chief Financial Officer | | 60 | | 2020 | | Nicole Murphy | | Executive Vice President, Pharmaceutical Operations and Technology | | 51 | | 2015 | | Ginger Gregory, Ph.D. | | Executive Vice President and Chief Human Resources Officer | | 56 | | 2017 | | Rachid Izzar | | Executive Vice President, Global Product Strategy and Commercialization | | 49 | | 2019 | | Priya Singhal, M.D., M.P.H. | | Executive Vice President, Head of Development | | 56 | | 2020 | | Jane Grogan, Ph.D. | | Executive Vice President, Head of Research | | 57 | | 2023 | | Adam Keeney, Ph.D. | | Executive Vice President, Head of Corporate Development | | 47 | | 2023 | | Robin C. Kramer | | Senior Vice President, Chief Accounting Officer | | 58 | | 2018 |
| | | | | | | Christopher A. Viehbacher | | Experience | Mr. Viehbacher has served as our President and Chief Executive Officer and member of our Board of Directors since November 2022. Prior to joining Biogen, Mr. Viehbacher served as Managing Partner of Gurnet Point Capital, a Boston based investment fund from 2015 to 2022. Prior to that, Mr. Viehbacher served as Global CEO of Sanofi, from 2008 to 2014. Prior to joining Sanofi, Mr. Viehbacher spent over 20 years with GlaxoSmithKline in Germany, Canada, France and, latterly, the U.S. PLEGRIDY revenues totaled $295.5 million, $305.0 millionas president of its North American pharmaceutical division. Mr. Viehbacher began his career with PricewaterhouseCoopers LLP and $227.1 million, respectively.For 2017, 2016qualified as a chartered accountant. Mr. Viehbacher previously served on the board of directors of Vedanta Biosciences, Inc. as chair, BEFORE Brands, Inc., and 2015, restCrossover Health. He is also a trustee of world PLEGRIDY revenues totaled $198.8 million, $176.7 million and $111.4 million, respectively.
TYSABRI
For 2017 compared to 2016, the decrease in U.S. TYSABRI revenues was primarily due to higher discounts and allowancesNortheastern University and a decreasemember of the board of fellows at Stanford Medical School.
| | | | | Education | | l | Queen's University in unit sales volumeKingston, Ontario, Canada, B.A. |
| | | | | | | Susan H. Alexander | | Experience | Ms. Alexander has served as our Executive Vice President, Chief Legal Officer since April 2018. Prior to that, Ms. Alexander served as our Executive Vice President, Chief Legal and Corporate Services from March 2017 to March 2018, as our Executive Vice President, Chief Legal Officer and Secretary from December 2011 to March 2017 and as our Executive Vice President, General Counsel and Corporate Secretary from 2006 to December 2011. Prior to joining Biogen, Ms. Alexander served as the Senior Vice President, General Counsel and Corporate Secretary of 4%, partially offset by price increases.For 2016 comparedPAREXEL International Corporation, a biopharmaceutical services company, from 2003 to 2015,January 2006. From 2001 to 2003 Ms. Alexander served as General Counsel of IONA Technologies, a software company. From 1995 to 2001 Ms. Alexander served as Counsel at Cabot Corporation, a specialty chemicals and performance materials company. Prior to that, Ms. Alexander was a partner at the increase in U.S. TYSABRI revenues was primarily due to an increase in unit sales volumelaw firms of 4%Hinckley, Allen & Snyder and increases in price, partially offset by higher discounts and allowances.Fine & Ambrogne.
| | | | | Education | | l | Wellesley College, B.A. | | l | Boston University School of Law, J.D. |
For 2017 compared | | | | | | | Michael R. McDonnell | | Experience | Mr. McDonnell has served as our Executive Vice President and Chief Financial Officer since August 2020. Prior to 2016, the increase in restjoining Biogen, Mr. McDonnell served as Executive Vice President and Chief Financial Officer of world TYSABRI revenues was primarily dueIQVIA Holdings Inc., a leading global provider of advanced analytics, technology solutions and contract research services to the recognitionlife sciences industry, from December 2015 until July 2020. Prior to that, Mr. McDonnell served as the Executive Vice President and Chief Financial Officer of approximately $45.0 millionIntelsat, a leading global provider of previously deferred revenue in Italy relatingsatellite services, from November 2008 to the pricing agreement with AIFADecember 2015, as Executive Vice President and Chief Financial Officer of MCG Capital Corporation, a 12% increase in unit sales volume primarily in our international partner markets, partially offset by publicly-held commercial finance company, from September 2004 until October 2008 and as MCG Capital Corporation’s Chief Operating Officer from August 2006 until October 2008. Before joining MCG Capital Corporation, Mr. McDonnell served as Executive Vice President and Chief Financial Officer for EchoStar Communications Corporation (f/k/a prior year favorable adjustment of approximately $20.0 millionDISH Network Corporation), a direct-to-home satellite television operator, from July 2004 until August 2004 and as its Senior Vice President and Chief Financial Officer from August 2000 to previous reserves estimates related to a government price reimbursement program included in our discounts and allowances. For information on our agreement with AIFA relating to sales of TYSABRI in Italy, please read Note 18, Other Consolidated Financial Statement Detail, to our consolidated financial statements included in this report.For 2016 compared to 2015, the decrease in rest of world TYSABRI revenues was primarily due to the impact of a $46.1 million decrease in hedge gains recognized under our hedging program in the comparative period. This decrease was partially offset by an increase in unit sales volume of 8%, primarily in Europe.
We anticipate a decline in TYSABRI demand on a global basis in 2018, compared to 2017, with expected volume declines in the U.S., due to increased competition from additional treatments for MS,July 2004. Mr. McDonnell spent 14 years at PricewaterhouseCoopers LLP, including OCREVUS, offsetting volume growth in our international markets.
ZINBRYTA
Under our collaboration agreement with AbbVie, we began to recognize revenues on sales of ZINBRYTA to third parties in the E.U. in the third quarter of 2016.
For 2017 compared to 2016, the increase in ZINBRYTA revenues was primarily due to an increase in unit sales volume.
We expect that the future sales growth of ZINBRYTA will be negatively impacted4 years as a resultpartner. Mr. McDonnell is a licensed certified public accountant (CPA).
| | Public Company Boards | | l | Merit Medical Systems, Inc. | | Education | | l | Georgetown University, B.S. Accounting |
| | | | | | | Nicole Murphy | | Experience | Ms. Murphy has served as our Executive Vice President, Pharmaceutical Operations and Technology since February 2022. Prior to that, Ms. Murphy has held senior executive positions at Biogen, including most recently as our Senior Vice President, Head of Global Manufacturing & Technical Operations, from June 2019 to January 2022. In 2017, Ms. Murphy played a critical role during the EC approved restrictions onsuccessful spin-off of Biogen's hemophilia franchise, as the useVice President and Head of ZINBRYTA.For additional information on our relationship with AbbVie, including information on the Article 20 ProcedureTechnical Operations of ZINBRYTA and resulting impairment of ZINBRYTA related assets, please read Note 20, Collaborative and Other Relationships, to our consolidated financial statements included in this report.
Spinal Muscular Atrophy (SMA)
SPINRAZA
We began to recognize revenues on sales of SPINRAZA in the U.S. in the fourth quarter of 2016 and the rest of world in the first quarter of 2017.
We expect that the rate at which SPINRAZA revenues will grow will moderate over time due to the loading dynamics as patients transition to dosing once every four months.
For additional information on our relationship with Ionis, please read Note 20, Collaborative and Other Relationships, to our consolidated financial statements included in this report.
Biosimilars
BENEPALI and FLIXABI
Under our commercial agreement with Samsung Bioepis, we began to recognize revenues on sales of BENEPALI and FLIXABI to third parties in the E.U. in the first and third quarters of 2016, respectively.
For 2017 compared to 2016, the increase in biosimilar revenues was primarily due to an increase in BENEPALI unit sales volume in new and existing markets.
For additional information on our relationship with Samsung Bioepis, please read Note 20, Collaborative and Other Relationships, to our consolidated financial statements included in this report.
Revenues from Anti-CD20 Therapeutic Programs
Genentech (Roche Group)
Our share of RITUXAN and GAZYVA collaboration operating profits in the U.S. and other revenues on anti-CD20 therapeutic programs are summarized as follows:
Biogen’s Share of Pre-tax Profits in the U.S. for RITUXAN and GAZYVA
The following table provides a summary of amounts comprising our share of pre-tax profits on RITUXAN and GAZYVA in the U.S.:
| | | | | | | | | | | | | | | For the Years Ended December 31, | | | | (In millions) | 2017 | | 2016 | | 2015 | | Product revenues, net | $ | 4,206.9 |
| | $ | 3,941.8 |
| | $ | 3,847.9 |
| | Cost and expenses | 755.2 |
| | 744.5 |
| | 673.7 |
| | Pre-tax profits in the U.S. | $ | 3,451.7 |
| | $ | 3,197.3 |
| | $ | 3,174.2 |
| | Biogen's share of pre-tax profits | $ | 1,316.4 |
| | $ | 1,249.5 |
| | $ | 1,269.8 |
|
Our share of RITUXAN annual pre-tax co-promotion profits in the U.S. in excess of $50.0 million decreased to 39% from 40% in February 2016 when GAZYVA was approved by the FDA as a new treatment for follicular lymphoma and further decreased to 37.5% in the third quarter of 2017 as gross sales of GAZYVA in the U.S. for the preceding 12-month period exceeded $150.0 million.
In November 2017 the FDA approved GAZYVA in combination with chemotherapy, followed by GAZYVA alone, for people with previously untreated advanced follicular lymphoma.
In June 2017 the FDA approved RITUXAN HYCELA for subcutaneous injection for the treatment of adults with previously untreated and relapsed or refractory follicular lymphoma, previously untreated diffuse large B-cell lymphoma and CLL. This new treatment includes the same monoclonal antibody as intravenous RITUXAN in combination with hyaluronidase human, an enzyme that helps to deliver rituximab under the skin.
For 2017 compared to 2016, the increase in U.S. product revenues was primarily due to selling price increases and an increase in RITUXAN and GAZYA unit sales volume of 2% and 6%, respectively, partially offset by higher discounts and allowances.
For 2016 compared to 2015, the increase in U.S. product revenues was primarily due to an increase in GAZYVA unit sales volume of 41%, an increase in RITUXAN unit sales of 1% and selling price increases, partially offset by higher RITUXAN discounts and allowances.
Collaboration costs and expenses for 2017, as depicted in the table above, excludes certain expenses charged to the collaboration by Genentech that we believe remain the responsibility of Genentech and that we are not obligated to pay under the terms of the collaboration agreement. Accordingly, we did not recognize the effect of those expenses in the determination of our share of pre-tax collaboration profits and Genentech has withheld approximately $120 million from amounts due to us in relation to collaboration activity for 2017, representing Genentech’s estimate of our share of these expenses. We remain in discussions with Genentech about a resolution relating to these amounts.
Excluding amounts under dispute, collaboration costs and expenses for 2017 compared to 2016 increased primarily due to higher branded pharmaceutical drug fees and an increase in RITUXAN selling and marketing costs, partially offset by a decrease in GAZYVA research and development costs.
Collaboration costs and expenses for 2016 compared to 2015 increased primarily due to an increase in RITUXAN product cost of sales.
Other Revenues from Anti-CD20 Therapeutic Programs
Other revenues from anti-CD20 therapeutic programs primarily consist of royalty revenues on sales of OCREVUS and our share of pre-tax co-promotion profits on RITUXAN in Canada.
For 2017 compared to 2016, other revenues from anti-CD20 therapeutic programs increased primarily due to the launch of OCREVUS in the second quarter of 2017.
For 2016 compared to 2015, other revenues from anti-CD20 therapeutic programs decreased as a result of lower pre-tax co-promotion profits on RITUXAN in Canada.
OCREVUS
In March 2017 the FDA approved OCREVUS, a humanized anti-CD20 monoclonal antibody, for the treatment of RMS and PPMS. Under our agreement with Genentech, we will receive a tiered royalty on U.S. net sales from 13.5% and increasing up to 24% if annual net sales exceed $900.0 million. There will be a 50% reduction to these royalties if a biosimilar to OCREVUS is approved in the U.S.
In addition, we will receive a 3% royalty on net sales of OCREVUS outside the U.S., with the royalty period lasting 11 years from the first commercial sale of OCREVUS on a country-by-country basis. OCREVUS was approved for treatment of RMS and PPMS in Australia, Switzerland and the E.U. in July 2017, September 2017 and January 2018, respectively. Marketing applications for OCREVUS are currently under review in numerous markets worldwide, including in Latin America and the Middle East.
The commercialization of OCREVUS does not impact the percentage of the co-promotion profits we receive for RITUXAN or GAZYVA. Genentech is solelyBioverativ responsible for clinical and commercial development, quality, regulatory, manufacturing and commercialization of OCREVUS and funding future costs. OCREVUS royalty revenues were based on our estimates from third party and market research data of OCREVUS sales occurring during the corresponding period. Differences between actual and estimated royalty revenues will be adjusted for in the period in which they become known, which is expected to be the following quarter.
For additional information on our collaboration with Genentech, including information regarding the pre-tax profit sharing formula and its impact on future revenues from anti-CD20 therapeutic programs, please read Note 20, Collaborative and Other Relationships, to our consolidated financial statements included in this report.
Other Revenues
Other revenues are summarized as follows:
| | | | | | | | | | | | | | | | | | | | | For The Years Ended December 31, | | % Change | | | | 2017 compared to 2016 | | 2016 compared to 2015 | | (In millions, except percentages) | 2017 | | 2016 | | 2015 | | | Revenues from collaborative and other relationships | $ | 36.5 |
| | $ | 39.3 |
| | $ | 69.1 |
| | (7.1 | )% | | (43.1 | )% | | Other royalty and corporate revenues | 323.5 |
| | 277.1 |
| | 167.0 |
| | 16.7 | % | | 65.9 | % | | Total other revenues | $ | 360.0 |
| | $ | 316.4 |
| | $ | 236.1 |
| | 13.8 | % | | 34.0 | % |
Revenues from Collaborative and Other Relationships
Other revenues from collaborative and other relationships include revenues earned under our 50% share of the co-promotion profits or losses of ZINBRYTA in the U.S. with AbbVie and revenues from our technical development and manufacturing services agreements with Samsung Bioepis.procurement. Prior to the spin-off Ms. Murphy was the General Manager and Head of Cambridge Site Operations at Biogen from May 2015 to December 2016. Prior to joining Biogen, Ms. Murphy was Executive Director, Head of Supply Chain at Amgen, a biopharmaceutical company, where her responsibilities included leadership of commercial manufacturing and technical operations. Ms. Murphy also held numerous technical and operational roles during her time at Amgen from 2001 to 2015 where she contributed significantly to various facility start-ups, business development integrations, strategic transformations and new product introductions. Prior to Amgen, Ms. Murphy held a variety of process development and engineering positions at Immunex Pharmaceuticals and the Monsanto Company.
| | Education | | l | University of Massachusetts Amherst, B.S. Engineering | | l | Rensselaer Polytechnic Institute, M.S. Engineering and a Masters of Business Administration |
| | | | | | | Ginger Gregory, Ph.D. | | Experience | Dr. Gregory has served as our hemophilia business, other revenuesExecutive Vice President and Chief Human Resources Officer since July 2017. Prior to joining Biogen, Dr. Gregory served as Executive Vice President and Chief Human Resources Officer at Shire PLC, a global specialty biopharmaceutical company, from collaborativeFebruary 2014 to April 2017. Prior to that, Dr. Gregory held executive-level human resources positions for several multinational companies across a variety of industries, including Dunkin’ Brands Group Inc., a restaurant holding company, where she served as Chief Human Resource Officer, Novartis AG, a pharmaceutical company, where she was the division head of Human Resources for Novartis Vaccines and other relationships also included revenues earned underDiagnostics, Novartis Consumer Health and Novartis Institutes of BioMedical Research and Novo Nordisk A/S, a pharmaceutical company, where she served as Senior Vice President, Corporate People & Organization at the company’s headquarters in Copenhagen, Denmark. Earlier in her career, Dr. Gregory held a variety of human resources generalist and specialist positions at BMS, a pharmaceutical company, and served as a consultant with Booz Allen & Hamilton, an information technology consulting company, in the area of organization change and effectiveness. | | Education | | l | University of Massachusetts, B.A. Psychology | | l | The George Washington University, Ph.D. Psychology |
| | | | | | | Rachid Izzar | | Experience | Mr. Izzar has served as our manufacturing services agreement with Sobi on shipmentsExecutive Vice President, Head of ELOCTAGlobal Product Strategy and ALPROLIXCommercialization since July 2021. Prior to Sobithat Mr. Izzar served as our President for the Intercontinental Region, which includes Latin America, Australia, Asia, Japan, the Middle East and royalties from Sobi on sales of ELOCTAAfrica, Turkey and ALPROLIX in their territory, which included substantially all of Europe, Russia, and certain marketsthe Global Biogen Biosimilars Unit. Prior to joining Biogen, Mr. Izzar was a Country President for AstraZeneca in Northern AfricaFrance, where his responsibilities included leadership for commercial and manufacturing operations. He held numerous roles at his time with AstraZeneca, including the Middle East. Bioverativ assumed allposition of our rights and obligations under our agreement with Sobi on February 1, 2017.For 2017 compared to 2016,Global Vice President of the decrease in other revenues from collaborative and other relationships was primarily dueCardiovascular Franchise where he contributed significantly to the impactdevelopment of the spin-off of our hemophilia business on February 1, 2017, partially offset by higher revenues earned under our manufacturing services agreement with Samsung Bioepis.
For 2016 compared to 2015, the decrease in other revenues from collaborative and other relationships was primarily due to a net overall loss in the collaboration with AbbVie of $21.9 millionfranchise within the U.S. and lower revenues earned under our manufacturing services agreement with Samsung Bioepis, partially offset by an increase in ELOCTA shipments made under our manufacturing services agreement with Sobi.
For additional information on our collaborative and other relationships, please read Note 20, Collaborative and Other Relationships, to our consolidated financial statements included in this report.
Other Royalty and Corporate Revenues
We receive royalties from net sales on products related to patents that we have out-licensed and we record other corporate revenues primarily from amounts earned under contract manufacturing agreements.
For 2017 compared to 2016, the increase in royalty and other corporate revenues was primarily due to an increase in sales of the underlying products from which we receive royalties and higher contract manufacturing revenues related to the volume of shipments of drug substance production provided to our strategic partners, including Bioverativ.
For 2016 compared to 2015, the increase in royalty and other corporate revenues was primarily due to higher contract manufacturing revenues related to drug substance manufacturing provided to a strategic partner.
Reserves for Discounts and Allowances
Revenues from product sales are recorded net of reserves established for applicable discounts and allowances, including those associated with the implementation of pricing actions in certain international markets where we operate.
These reserves are based on estimates of the amounts earned or to be claimed on the related sales and are classified as reductions of accounts receivable (if the amount is payable to our customer) or a liability (if the amount is payable to a party other than our customer). Our estimates take into consideration our historical experience, current contractual and statutory requirements, specific known market events and trends, industry data and forecasted customer buying and payment patterns. Actual amounts may ultimately differ from our estimates. If actual results vary, we adjust these estimates, which will have an effect on earnings in the period of adjustment.
Reserves for discounts, contractual adjustments and returns that reduced gross product revenues are summarized as follows:
For the years ended December 31, 2017, 2016 and 2015, reserves for discounts and allowances as a percentage of gross product revenues were 22.0%, 21.3% and 19.3%, respectively.
Discounts
Discounts include trade term discounts and wholesaler incentives.
For 2017 compared to 2016, the decrease in discounts was primarily driven by the impact from the spin-off of our hemophilia business on February 1, 2017, partially offset by an increase in rest of world product revenues, due in part to an increase in biosimilar revenues,North American subsidiary, as well as an increase in gross selling prices.Europe and China. Prior to that, Mr. Izzar was Vice President Strategic Transformation, also, China Portfolio for CEO based in Shanghai and Vice President Commercial International covering China, Australia, Brazil, Russia, America Latin, Asia, Turkey, the Middle East and Africa.
| | Education | | l | University of Sherbrooke, Masters of Business Administration | | l | Harvard Business School, Enterprise Executive Transformation Program | | | | |
For 2016 compared | | | | | | | Priya Singhal, M.D., M.P.H. | | Experience | Dr. Singhal has served as our Executive Vice President and Head of Development since January 2023. Prior to 2015, the increase in discounts was primarily driven by increases in gross selling price, contractual discount rates and volume related tothat Dr. Singhal served as our hemophilia products.Contractual Adjustments
Contractual adjustments primarily relate to Medicaid and managed care rebates, co-payment assistance (copay), VA and PHS discounts, specialty pharmacy program fees and other government rebates or applicable allowances.
For 2017 compared to 2016, the increase in contractual adjustments was primarily due to higher managed care rebates and Medicaid and other governmental rebates and allowances in the U.S., due in part to an increase in gross selling prices and the launchInterim Head of SPINRAZA in the U.S. in the fourth quarter of 2016, partially offset by the impact from the spin-off of our hemophilia business on February 1, 2017.
For 2016 compared to 2015, the increase in contractual adjustments was primarily due to higher Medicaid and other governmental rebates and allowances in the U.S. and managed care rebates, due in part to an increase in gross selling prices.
Returns
Product return reserves are established for returns made by wholesalers. In accordance with contractual terms, wholesalers are permitted to return product for reasons such as damaged or expired product. The majority of wholesaler returns are due to product expiration. Provisions for product returns are recorded in the period the related revenue is recognized, resulting in a reduction to product sales.
For 2017 compared to 2016, return provisions were relatively consistent.
For 2016 compared to 2015, return reserves decreased primarily due to a reduction in return rates based on recent experiences of returned products.
For additional information on our reserves, please read Note 5, Reserves for Discounts and Allowances, to our consolidated financial statements included in this report.
Cost and Expenses
A summary of total cost and expenses is as follows:
| | | | | | | | | | | | | | | | | | | | | For the Years Ended December 31, | | % Change | | | 2017 compared to 2016 | | 2016 compared to 2015 | | (In millions, except percentages) | 2017 | | 2016 | | 2015 | | | Cost of sales, excluding amortization of acquired intangible assets | $ | 1,630.0 |
| | $ | 1,478.7 |
| | $ | 1,240.4 |
| | 10.2 | % | | 19.2 | % | | Research and development | 2,253.6 |
| | 1,973.3 |
| | 2,012.8 |
| | 14.2 | % | | (2.0 | )% | | Selling, general and administrative | 1,935.5 |
| | 1,947.9 |
| | 2,113.1 |
| | (0.6 | )% | | (7.8 | )% | | Amortization of acquired intangible assets | 814.7 |
| | 385.6 |
| | 382.6 |
| | 111.3 | % | | 0.8 | % | | Acquired in-process research and development | 120.0 |
| | — |
| | — |
| | ** |
| | ** |
| | Collaboration profit sharing | 112.3 |
| | 10.2 |
| | — |
| | ** |
| | ** |
| | Loss (gain) on fair value remeasurement of contingent consideration | 62.7 |
| | 14.8 |
| | 30.5 |
| | 323.6 | % | | (51.5 | )% | | Restructuring charges | 0.9 |
| | 33.1 |
| | 93.4 |
| | (97.3 | )% | | (64.6 | )% | | TECFIDERA litigation settlement charge | — |
| | 454.8 |
| | — |
| | (100.0 | )% | | ** |
| | Total cost and expenses | $ | 6,929.7 |
| | $ | 6,298.4 |
| | $ | 5,872.8 |
| | 10.0 | % | | 7.2 | % |
** Percentage not meaningful.
Cost of Sales, Excluding Amortization of Acquired Intangible Assets (Cost of Sales)
Product Cost of Sales
For 2017 compared to 2016, the increase in product cost of sales was primarily driven by higher unit sales volume related to our biosimilar product shipments, higher contract manufacturing shipments of drug substance production provided to our strategic partners, including Bioverativ, and an increase in inventory amounts written down as a result of excess, obsolescence, unmarketability or other reasons. These increases were partially offset by the impact from the spin-off of our hemophilia business on February 1, 2017, and the accelerated depreciation recorded in the second, third and fourth quarters of 2016 as a result of our decision to cease manufacturing in Cambridge, MA.
For 2016 compared to 2015, the increase in product cost of sales was primarily driven by costs noted below as well as increased contract manufacturing shipments and higher unit sales volume related to our biosimilars and hemophilia products, partially offset by favorable production costs and mix of products.
Product cost of sales for 2016 reflects the recognition of $45.5 million of accelerated depreciation as a result of the determination to cease manufacturing in Cambridge, MA and vacate our small-scale biologics manufacturing facility in Cambridge, MA and warehouse space in Somerville, MA.
Inventory amounts written down as a result of excess, obsolescence, unmarketability or other reasons totaled $76.9 million, $48.2 million and $41.9 million for the years ended December 31, 2017, 2016 and 2015, respectively. Amounts written down during the year ended December 31, 2017, includes the impairment of $14.4 million related to the EC approved restrictions on the use of ZINBRYTA.
For additional information on the Article 20 Procedure of ZINBRYTA and resulting impairment of ZINBRYTA related assets, please read Note 20, Collaborative and Other Relationships, to our consolidated financial statements included in this report.
Royalty Cost of Sales
For 2017 compared to 2016, the increase in royalty cost of sales was primarily driven by the recognition of royalties payable to Ionis on sales of SPINRAZA and higher royalties on sales of AVONEX and PLEGRIDY in the U.S., as described below. These increases were partially offset by the elimination of royalties payable on sales of hemophilia product resulting from the spin-off of our hemophilia business on February 1, 2017 and lower royalties on sales of TYSABRI resulting from the expiration of certain third-party royalties.
For 2016 compared to 2015, the increase in royalty cost of sales was primarily driven by the increase in royalty rates payable to Sobi, increased sales of our hemophilia products and higher royalties on sales of AVONEX and PLEGRIDY in the U.S., partially offset by a decrease in TYSABRI royalties due to the expiration of certain third-party royalties.
On June 28, 2016, the U.S. Patent and Trademark Office issued to the Japanese Foundation for Cancer Research (JFCR) a patent related to recombinant interferon-beta protein. This patent, U.S. Patent No. 9,376,478, expires in June 2033. This patent was issued following an interference proceeding between JFCR and us. This patent is relevant to AVONEX and PLEGRIDY, and we will pay royalties in the mid-single digits in relation to this patent during the life of the patent.
We support our drug discovery and development efforts through the commitment of significant resources to discovery, research and development programs and business development opportunities, particularly within our core and emerging growth areas.
A significant amount of our research and development costs consist of indirect costs incurred in support of overall research and development activities and non-specific programs, including activities that benefit multiple programs, such as management costs, as well as depreciation, information technology and facility-based expenses. These costs are considered other research and development costs in the table above and are not allocated to a specific program or stage.
Research and development expense incurred in support of our marketed products includes costs associated with product lifecycle management activities including, if applicable, costs associated with the development of new indications for existing products. Late stage programs are programs in Phase 3 development or in registration stage. Early stage programs are programs in Phase 1 or Phase 2 development. Research and discovery represents costs incurred to support our discovery research and translational science efforts. Costs are reflected in the development stage based upon the program status when incurred. Therefore, the same program could be reflected in different development stages in the same year. For several of our programs, the research and development activities are part of our collaborative and other relationships. Our costs reflect our share of the total costs incurred.
For 2017 compared to 2016, the increase in research and development expense was primarily related to milestone and upfront expenses and costs incurred in connection with our early stage and late stage programs, partially offset by decreased costs incurred in connection with our marketed products.
For 2016 compared to 2015, the decrease in research and development expense was primarily related to a decrease in costs incurred in connection with our early stage programs, marketed products and other research and development costs. These decreases were partially offset by increased costs incurred in connection with our late stage and research and discovery programs.
We intend to continue committing significant resources to targeted research and development opportunities where there is a significant unmet need and where a drug candidate has the potential to be highly differentiated.
Milestone and Upfront Expenses included in Research and Development Expense
since 2021 in addition to serving as Head of Global Safety and Regulatory Sciences, including China and Japan Research and development expense for 2017 includes: $300.0 million upfront payment madeDevelopment, since rejoining Biogen in 2020. Dr. Singhal was initially at Biogen from 2012 to BMS upon entering into our agreement2018 and served in positions of increasing seniority as Vice President Clinical Trials Benefit-Risk Management, Global Head of Safety and Benefit Risk Management and as the Interim Co-lead and Senior Vice President of Global Development. Prior to exclusively license BIIB092;
$60.0 million developmental milestone payment dueher 2020 return to the former shareholdersBiogen, Dr. Singhal served as Head of iPierian, Inc. (iPierian), which became payable upon dosing of the first patient in the Phase 2 PSP study for BIIB092;
$28.0 million upfront payment made to Alkermes upon entering into our agreement to exclusively license BIIB098, representing our share of BIIB098 development costs already incurred in 2017;
$50.0 million accrual based upon the expected continuation of our agreement with Alkermes to develop and exclusively license BIIB098; and
$25.0 million upfront payment recognized upon entering into a new collaboration agreement with Ionis to identify new ASO drug candidates for the treatment of SMA.
Research and development expenseDevelopment and Manufacturing at Zafgen Inc. from 2019 to 2020. From 2008 to 2012 Dr. Singhal held roles at Vertex Pharmaceuticals, including Vice President, Medical Affairs. Dr. Singhal began her drug-development career at Millennium Pharmaceuticals, Inc. in 2005 and led benefit-risk management for 2016 includes:Velcade and other compounds. | | Education | | l | Harvard School of Public Health, M.P.H. in International Health | | l | University of Mumbai, Doctor of Medicine (M.D.) | | | | |
$75.0 million license fee paid to Ionis | | | | | | | Jane Grogan, Ph.D. | | Experience | Dr. Grogan has served as we exercised our option to developExecutive Vice President and commercialize SPINRAZA from Ionis;$50.0 million milestone payment to Eisai related to the initiationHead of a Phase 3 trial for E2609; and
$20.0 million upfront payment recognized upon entering into a collaboration and alliance agreement with UPenn.
Research and development expense for 2015 includes:
$60.0 million recognized upon entering into our collaboration with Mitsubishi Tanabe Pharma Corporation;
$48.1 million recognized upon entering into our collaboration with AGTC;
$30.0 million in milestones recognized in relation to our collaboration agreements with Ionis; and
$16.0 million paid to AbbVie related to milestones for the development of ZINBRYTA as a result of filing with the FDA and EMA during 2015.
These payments are classified as research and development expenseDevelopment since September 2023. Dr. Grogan most recently served as the programs they relateChief Scientific Officer at Graphite Bio from 2021 to had not achieved regulatory approval as2023 and ArsenalBio from 2019 to 2021, both cell and gene therapy companies. From 2004 to 2019 Dr. Grogan held several roles in increasing seniority at Genentech across Immunology and Immuno-oncology, covering research strategies and drug development across Rheumatoid Arthritis, Lupus, MS, Inflammatory Bowel Disease and Cancer.
| | Education | | l | Leiden University, Ph.D. in Immunology | | l | University of the payment date.For additional information about these collaborations, please read Note 20, CollaborativeMelbourne, B.Sc in Biochemistry and Other Relationships, to our consolidated financial statements included in this report.
Early Stage Programs
The increase in spending associated with our early stage programs for 2017 compared to 2016 was primarily related to spending associated with the development of BIIB092 in AD and PSP pursuant to our license agreement with BMS, BIIB074 in trigeminal neuralgia (TGN) and BIIB076 in AD. These increases were partially offset by a reduction in costs resulting from our discontinuance of development of amiselimod in the third quarter of 2016.
The decrease in spending associated with our early stage programs for 2016 compared to 2015 was primarily due to the advancement of our aducanumab program in AD to a late stage program in the third quarter of 2015, decreased costs incurred in connection with opicinumab in MS and the discontinuance of development of anti-TWEAK in lupus nephritis. These decreases were partially offset by increased costs of BIIB074 in TGN and increased costs associated with our discontinuance of development of amiselimod in the third quarter of 2016.
Late Stage Programs
The increase in spending associated with our late stage programs for 2017 compared to 2016 was primarily related the increased costs associated with the development of aducanumab in AD and costs incurred associated with the development of E2609, a BACE inhibitor that was advanced to a late stage program in the fourth quarter of 2016. These increases were partially offset by advancement of SPINRAZA to marketed products following its approval in the U.S. in the fourth quarter of 2016.
The increase in spending associated with our late stage programs for 2016 compared to 2015 was primarily driven by costs incurred to advance our aducanumab program in AD, the increased costs incurred to advance our SPINRAZA program and the advancement of E2609 to a late stage program in the fourth quarter of 2016, partially offset by the approval of ZINBRYTA in the third quarter of 2016.Pharmacology
| | | | |
Marketed Products
The decrease in spending associated with our marketed products for 2017 compared to 2016 was primarily due to a reduction in spending resulting from the spin-off of our hemophilia business on February 1, 2017 and a reduction in spending related to TECFIDERA. These decreases were partially offset by increased spending related to SPINRAZA following its approval in the U.S. in the fourth quarter of 2016.
The decrease in spending associated with our marketed products for 2016 compared to 2015 was primarily due to the discontinuance of development of TYSABRI and TECFIDERA in secondary primary MS in the third and fourth quarters of 2015, respectively, and decreased costs incurred in connection with our hemophilia products. These decreases were partially offset by the approvals of ZINBRYTA and SPINRAZA in the third and fourth quarters of 2016, respectively.
Selling, General and Administrative
For 2017 compared to 2016, the decrease in selling, general and administrative expenses was primarily due to a reduction in operational spending resulting from the spin-off of our hemophilia business on February 1, 2017, the execution of targeted cost reduction initiatives and a reduction in costs resulting from the discontinuance of our TECFIDERA television advertising campaign in the second quarter of 2016. These decreases were offset by an increase in SPINRAZA commercialization costs and an increase in corporate giving.
For 2016 compared to 2015, the decrease in selling, general and administrative expenses reflect cost savings in connection with our corporate restructuring, which are described below under the heading "Restructuring, Business Transformation and Other Cost Savings Initiatives," partially offset by an increase in costs associated with developing commercial capabilities for ZINBRYTA and SPINRAZA.
Amortization of Acquired Intangible Assets
Our amortization expense is based on the economic consumption and impairment of intangible assets. Our most significant intangible assets are related to our TECFIDERA, AVONEX and TYSABRI products. Annually, during our long-range planning cycle, we perform an analysis of anticipated lifetime revenues of TECFIDERA, AVONEX and TYSABRI. This analysis is also updated whenever events or changes in circumstances would significantly affect the anticipated lifetime revenues of any of these products.
Our most recent long-range planning cycle was completed in the third quarter of 2017. The results of our TECFIDERA, AVONEX and TYSABRI analyses were impacted by changes in the estimated timing of the impact of other alternative MS formulations, including OCREVUS, which may compete with TYSABRI, TECFIDERA and AVONEX. The outcome of this most recent analysis did not result in a significant net change in our expected rate of amortization for acquired intangible assets.
Based upon this most recent analysis, the estimated future amortization of acquired intangible assets for the next five years is expected to be as follows:
| | | | | | (In millions) | As of December 31, 2017 | | 2018 | $ | 423.5 |
| | 2019 | 401.8 |
| | 2020 | 381.6 |
| | 2021 | 254.3 |
| | 2022 | 242.3 |
|
We monitor events and expectations regarding product performance. If new information indicates that the assumptions underlying our most recent analysis are substantially different than those utilized in our current estimates, our analysis would be updated and may result in a significant change in the anticipated lifetime revenues of the relevant products. The occurrence of an adverse event could substantially increase the amount of amortization expense associated with our acquired intangible assets as compared to previous periods or our current expectations, which may result in a significant negative impact on our future results of operations.
For 2017 compared to 2016, the increase in amortization of acquired intangible assets was primarily due to $444.2 million of amortization and impairment charges associated with our U.S. and rest of world licenses to Forward Pharma's intellectual property, including Forward Pharma's intellectual property related to TECFIDERA, acquired in the first quarter of 2017, as discussed further below. Amortization of acquired intangible assets for 2017 also reflects the $31.2 million impairment of our acquired and in-licensed rights and patents intangible asset related to the Article 20 Procedure of ZINBRYTA.
For additional information on the Article 20 Procedure of ZINBRYTA and resulting impairment of ZINBRYTA related assets, please read Note 20, Collaborative and Other Relationships, to our consolidated financial statements included in this report.
For 2016 compared to 2015, amortization of acquired intangible assets was relatively consistent | | | | | | | Adam Keeney, Ph.D. | | Experience | Dr. Keeney has served as our Executive Vice President and Head of Corporate Development since April 2023. Dr. Keeney brings more than 20 years of experience leading R&D, business development and strategy organizations at industry-leading companies within biotech and large pharma, Dr. Keeney most recent analysis completed duringrecently served as the third quarterChief Executive Officer of 2016 resulted in noNodThera, a clinical stage biotech company focused on chronic inflammation from 2018 to 2022. Prior to NodThera, Dr. Keeney was at Sanofi from 2014 to 2018 where he had responsibility for all of Sanofi Gezyme's business development activities, including early- and late-stage deals across therapeutic areas and modalities, successfully completing several significant net change in our expected rate of amortization for acquired intangible assets. Amortization of acquired intangible assets for 2016 also reflects impairment charges recognized upon the termination of our collaboration agreements with Rodin Therapeutics, Inc. and Ataxion Inc., which resulted in impairment losses of $8.7 million and $3.5 million, respectively, relatedtransactions. From 2004 to the IPR&D assets recorded upon entering into the collaboration agreements.Impairment charges related to intangible assets during 2015 were insignificant.
TECFIDERA License Rights
In January 2017 we entered into a settlement and license agreement with Forward Pharma. Pursuant to this agreement, we obtained U.S. and rest of world licenses to Forward Pharma's intellectual property, including Forward Pharma's intellectual property related to TECFIDERA. In exchange, we paid Forward Pharma $1.25 billion in cash. During the fourth quarter of 2016, we recognized a pre-tax charge of $454.8 million and in the first quarter of 2017 we recognized an intangible asset of $795.2 million related to this agreement. The pre-tax charge recognized in the fourth quarter of 2016 represented the fair value of our licenses to Forward Pharma’s intellectual property for the period April 2014, when we started selling TECFIDERA, through December 31, 2016. The intangible asset represented the fair value of the U.S. and rest of world licenses to Forward Pharma’s intellectual property related to TECFIDERA revenues for the period January 2017, the month in which we entered into this agreement, through December 2020, the last month before royalty payments could first commence pursuant to this agreement.
We have two intellectual property disputes with Forward Pharma, one in the U.S. and one in the E.U., concerning intellectual property related to TECFIDERA. In March 2017 the U.S. intellectual property dispute was decided in our favor. Forward Pharma appealed to the U.S. Court of Appeals for the Federal Circuit and the appeal is pending. We evaluated the recoverability of the U.S. asset acquired from Forward Pharma and recorded an impairment charge in the first quarter of 2017 to adjust the carrying value of the acquired U.S. asset to fair value reflecting the impact of the developments in the U.S. legal dispute. In January 2018 the EPO announced its decision revoking Forward Pharma’s European Patent No. 2 801 355. Forward Pharma has stated that it expects to file an appeal to the Technical Board of Appeal of the EPO. Based upon our assessment of these rulings, we continue to amortize the remaining net book value of the U.S. and rest of world intangible assets in our consolidated statements of income utilizing an economic consumption model.
For additional information on our settlement and license agreement with Forward Pharma and related intangible assets, please read Note 7, Intangible Assets and Goodwill,to our consolidated financial statements included in this report. For additional information on these disputes, please read Note 21, Litigation, to our consolidated financial statements included in this report.
In Process Research2013 Dr. Keeney worked at Johnson & Development (IPR&D) related to Business Combinations
Overall, the value of our acquired IPR&D assets is dependent uponJohnson where he held a number of variables,business development roles with increasing responsibility and started his career at Lundbeck as a discovery scientist.
| | Education | | l | University of Nottingham, UK, Ph.D. in Neuropharmacology | | l | University of Leeds, UK, BSc (Hons) | | | | |
| | | | | | | Robin C. Kramer | | Experience | Ms. Kramer has served as our Senior Vice President, Chief Accounting Officer since December 2020. Prior to that, Ms. Kramer served as our Vice President, Chief Accounting Officer from November 2018 to December 2020. Prior to joining Biogen, Ms. Kramer served as the Senior Vice President and Chief Accounting Officer of Hertz Global Holdings, Inc., a car rental company, from May 2014 to November 2018. Prior to that, Ms. Kramer was an audit partner at Deloitte & Touche LLP (Deloitte), a professional services firm, from 2007 to 2014, including estimatesserving in Deloitte's National Office Accounting Standards and Communications Group from 2007 to 2010. From 2005 to 2007 Ms. Kramer served as Chief Accounting Officer of future revenuesFisher Scientific International, Inc., a laboratory supply and biotechnology company, and from 2004 to 2005 Ms. Kramer served as Director, External Reporting, Accounting and Control for the Gillette Company, a personal care company. Ms. Kramer also held partner positions in the public accounting firms of Ernst & Young LLP and Arthur Andersen LLP. Ms. Kramer is a licensed CPA in Massachusetts. She is a member of the Massachusetts Society of CPAs and the effectsAmerican Institute of competition,CPAs. Ms. Kramer currently serves on the levelboard of directors of the Center for Women and Enterprise. Ms. Kramer previously served as a Board Member for the Massachusetts State Board of Accountancy from September 2011 to December 2015 and Probus Insurance Company Europe DAC from 2016 to 2018. | | Public Company Boards | | l | Armata Pharmaceuticals, Inc., a biotechnology company | | Education | | l | Salem State University, B.B.A. Accounting |
AVAILABLE INFORMATION Our principal executive offices are located at 225 Binney Street, Cambridge, MA 02142 and our telephone number is (617) 679-2000. Our website address is www.biogen.com. We make available free of charge through the Investors section of our website our Annual Reports on Form 10-K, Quarterly Reports on Form 10-Q, Current Reports on Form 8-K and all amendments to those reports as soon as reasonably practicable after such material is electronically filed with or furnished to the SEC. We include our website address in this report only as an inactive textual reference and do not intend it to be an active link to our website. The contents of our website are not incorporated into this report. USE OF WEBSITE TO PROVIDE INFORMATION From time to time, we have used, and expect in the future to use, our website as a means of disclosing material information to the public in a broad, non-exclusionary manner, including for purposes of the SEC’s Regulation Fair Disclosure (Reg FD). Financial and other material information regarding the Company is routinely posted on our website and accessible at www.biogen.com. In order to receive notifications regarding new postings to our website, investors are encouraged to enroll on our website to receive automatic email alerts. None of the information on our website is incorporated into this report.
ITEM 1A. RISK FACTORS Risks Related to Our Business We are substantially dependent on revenue from our products. Our revenue depends upon continued sales of our products as well as the financial rights we have in our anti-CD20 therapeutic programs. A significant portion of our revenue is concentrated on sales of our products in increasingly competitive markets. Any of the following negative developments relating to any of our products or any of our anti-CD20 therapeutic programs may adversely affect our revenue and results of operations or could cause a decline in our stock price: •the introduction, greater acceptance or more favorable reimbursement of competing products, including new originator therapies, generics, prodrugs and biosimilars of existing products and products approved under abbreviated regulatory pathways; •safety or efficacy issues; •limitations and additional pressures on product pricing or price increases, including those relating to inflation and those resulting from governmental or regulatory requirements, including those relating to any future potential drug price negotiation under the IRA; increased competition, including from generic or biosimilar versions of our products; or changes in, or implementation of, reimbursement policies and practices of payors and other third-parties; •adverse legal, administrative, geopolitical events, regulatory or legislative developments; or •our ability to maintain a positive reputation among patients, healthcare providers and others, which may be impacted by our pricing and reimbursement decisions. LEQEMBI and SKYCLARYS are in the early stages of commercial launch in the U.S. In addition to risks associated with new product launches and the other factors described in these Risk Factors, Biogen’s and Eisai’s ability to successfully commercialize LEQEMBI and our ability to successfully commercialize SKYCLARYS may be adversely affected due to: •Eisai’s ability to obtain and maintain adequate reimbursement for LEQEMBI; •the effectiveness of Eisai's and Biogen’s commercial strategy for marketing LEQEMBI; •requirements such as participation in a registry and the use of imaging or other diagnostics for LEQEMBI; •our ability to obtain approval in other markets; •the approval of other new products for the same or similar indications; •Eisai’s and Biogen’s ability to maintain a positive reputation among patients, healthcare providers and others in the Alzheimer’s disease community, which may be impacted by pricing and reimbursement decisions relating to LEQEMBI, which are made by Eisai; •Biogen's ability to obtain and maintain adequate reimbursement for SKYCLARYS; and •the effectiveness of Biogen's commercial strategy for marketing SKYCLARYS. Our long-term success depends upon the successful development of new products and additional indications for our existing products. Our long-term success will depend upon the successful development of new products from our research and development activities or our licenses or acquisitions from third-parties, as well as additional indications for our existing products. Product development is very expensive and involves a high degree of uncertainty and risk and may not be successful. Only a small number of research and development programs result in the commercialization of a product. It is difficult to predict the success and the time and cost of product development of novel approaches for the treatment of diseases. The development of novel approaches for the treatment of diseases, including development efforts in new modalities such as those based on the antisense oligonucleotide platform and gene therapy, may present additional challenges and risks, including obtaining approval from regulatory authorities that have limited experience with the development of such therapies. For example, we are currently seeking approval of SKYCLARYS in Europe and any delays or challenges regarding its approval in Europe may adversely impact our ability to realize the anticipated benefits from the Reata acquisition.
Clinical trial data are subject to differing interpretations and even if we view data as sufficient to support the safety, effectiveness and/or approval of an investigational therapy, regulatory authorities may disagree and may require additional data, limit the scope of the approval or deny approval altogether. Furthermore, the approval of a product candidate by one regulatory agency does not mean that other regulatory agencies will also approve such product candidate. Success in preclinical work or early-stage clinical trials does not ensure that later stage or larger scale clinical trials will be successful. Clinical trials may indicate that our product candidates lack efficacy, have harmful side effects, result in unexpected adverse events or raise other concerns that may significantly reduce or delay the likelihood of regulatory approval. This may result in terminated programs, significant restrictions on use and safety warnings in an approved label, adverse placement within the treatment paradigm or significant reduction in the commercial potential of the product candidate. Even if we could successfully develop new products or indications, we may make a strategic decision to discontinue development of a product candidate or indication if, for example, we believe commercialization will be difficult relative to the standard of care or we prioritize other opportunities in our pipeline. Sales of new products or products with additional indications may not meet investor expectations. If we fail to compete effectively, our business and market position would suffer. The biopharmaceutical industry and the markets in which we operate are intensely competitive. We compete in the marketing and sale of our products, the development of new products and processes, the acquisition of rights to new products with commercial potential and the hiring and retention of personnel. We compete with biotechnology and pharmaceutical companies that have a greater number of products on the market and in the product pipeline, substantially greater financial, marketing, research and development and other resources and other technological or competitive advantages. Our products continue to face increasing competition from the introduction of new originator therapies, generics, prodrugs and biosimilars of existing products and products approved under abbreviated regulatory pathways. Some of these products are likely to be sold at substantially lower prices than our branded products. The introduction of such products as well as other lower-priced competing products has reduced, and may in the future, significantly reduce both the price that we are able to charge for our products and the volume of products we sell, which will negatively impact our revenue. For instance, demand and price for TECFIDERA declined significantly as a result of multiple TECFIDERA generic entrants entering the U.S. market in 2020. In addition, in some markets, when a generic or biosimilar version of one of our products is commercialized, it may be automatically substituted for our product and significantly reduce our revenue in a short period of time. Our ability to compete, maintain and grow our business may also be adversely affected due to a number of factors, including: •the introduction of other products, including products that may be more efficacious, safer, less expensive or more convenient alternatives to our products, including our own products and products of our collaborators; •the off-label use by physicians of therapies indicated for other conditions to treat patients; •patient dynamics, including the size of the patient population and our ability to identify, attract and maintain new and current patients to our therapies; •the reluctance of physicians to prescribe, and patients to use, our products without additional data on the efficacy and safety of such products; •damage to physician and patient confidence in any of our products, generic or biosimilars of our products or any other product from the same class as one of our products, or to our sales and reputation as a result of label changes, pricing and reimbursement decisions or adverse experiences or events that may occur with patients treated with our products or generic or biosimilars of our products; •inability to obtain and maintain appropriate pricing and adequate reimbursement for our products compared to our competitors in key markets; or •our ability to obtain and maintain patent, data or market exclusivity for our products. Our business may be adversely affected if we do not successfully execute or realize the anticipated benefits of our strategic and growth initiatives. The successful execution of our strategic and growth initiatives may depend upon internal development projects, commercial initiatives and external opportunities, which may include the acquisition and in-licensing of products,
technologies, companies, the entry into strategic alliances and collaborations or our Fit for Growth program, as well as our ability to execute on previously-announced initiatives such as the exploration of strategic options for our biosimilars business. While we believe we have a number of promising programs in our pipeline, failure or delay of internal development projects to advance or difficulties in executing on our commercial initiatives could impact our current and future growth, resulting in additional reliance on external development opportunities for growth. Supporting the further development of our existing products and potential new products in our pipeline will require significant capital expenditures and management resources, including investments in research and development, sales and marketing, manufacturing capabilities and other areas of our business. We have made, and may continue to make, significant operating and capital expenditures for potential new products prior to regulatory approval with no assurance that such investment will be recouped, which may adversely affect our financial condition, business and operations. The availability of high quality, fairly valued external product development is limited and the opportunity for their acquisition is highly competitive. As such, we are not certain that we will be able to identify suitable candidates for acquisition or if we will be able to reach agreement to make any such acquisition if suitable candidates are identified. We may fail to initiate or complete transactions for many reasons, including failure to obtain regulatory or other approvals as well as a result of disputes or litigation. Furthermore, we may not be able to achieve the full strategic and financial benefits expected to result from transactions, or the benefits may be delayed or not occur at all. We may also face additional costs or liabilities in completed transactions that were not contemplated prior to completion. Any failure in the execution of a transaction, in the integration of an acquired asset or business or in achieving expected synergies could result in slower growth, higher than expected costs, the recording of asset impairment charges and other actions which could adversely affect our business, financial condition and results of operations. For example, we recently acquired Reata and are in the process of integrating Reata into our Company. The ultimate success of our acquisition of Reata and our ability to realize the anticipated benefits from the acquisition, including the SKYCLARYS product and anticipated synergies, depends on, among other things, how effective we are in integrating the Biogen and Reata operations. We face risks associated with our Fit for Growth program that may impair our ability to achieve anticipated savings and operational efficiencies or that may otherwise harm our business. These risks include delays in implementation of cost optimization actions, loss of workforce capabilities, higher than anticipated separation expenses, litigation and the failure to meet financial and operational targets. In addition, the calculation of the anticipated cost savings and other benefits resulting from our Fit for Growth program are subject to many estimates and assumptions. These estimates and assumptions are subject to significant business, economic, competitive and other uncertainties and contingencies, many of which are beyond our control. if these estimates and assumptions are incorrect or if we experience delays or unforeseen events, our business and financial results could be adversely affected. Sales of our products depend, to a significant extent, on adequate coverage, pricing and reimbursement from third-party payors, which are subject to increasing and intense pressure from political, social, competitive and other sources. Our inability to obtain and maintain adequate coverage, or a reduction in pricing or reimbursement, could have an adverse effect on our business, reputation, revenue and results of operations. Sales of our products depend, to a significant extent, on adequate coverage, pricing and reimbursement from third-party payors. When a new pharmaceutical product is approved, the availability of government and private reimbursement for that product, diagnosis of the condition it treats and the cost to administer it may be uncertain, as is the pricing and amount for which that product will be reimbursed. Pricing and reimbursement for our products may be adversely affected by a number of factors, including: •changes in, and implementation of, federal, state or foreign government regulations or private third-party payors’ reimbursement policies; •pressure by employers on private health insurance plans to reduce costs; •consolidation and increasing assertiveness of payors seeking price discounts or rebates in connection with the placement of our products on their formularies and, in some cases, the imposition of restrictions on access or coverage of particular drugs or pricing determined based on perceived value; •our ability to receive reimbursement for our products or our ability to receive comparable reimbursement to that of competing products; and
•our value-based contracting program pursuant to which we aim to tie the pricing of our products to their clinical values by either aligning price to patient outcomes or adjusting price for patients who discontinue therapy for any reason, including efficacy or tolerability concerns. Our ability to set the price for our products varies significantly from country to country and, as a result, so can the price of our products. Governments may use a variety of cost-containment measures to control the cost of products, including price cuts, mandatory rebates, value-based pricing and reference pricing (i.e., referencing prices in other countries and using those reference prices to set a price). Drug prices are under significant scrutiny in the markets in which our products are prescribed; for example the IRA has certain provisions related to drug pricing. We expect drug pricing and other health care costs to continue to be subject to intense political and societal pressures on a global basis. Certain countries set prices by reference to the prices in other countries where our products are marketed. Our inability to obtain and maintain adequate prices in a particular country may not only limit the revenue from our products within that country but may also adversely affect our ability to secure acceptable prices in existing and potential new markets, which may limit market growth and result in reductions in revenue. This may create the opportunity for third-party cross-border trade or influence our decision to sell or not to sell a product, thus adversely affecting our geographic expansion plans and revenue. Additionally, in certain jurisdictions governmental health agencies may adjust, retroactively and/or prospectively, reimbursement rates for our products. Reimbursement for our products by governments, including the timing of any reimbursements, may also be affected by budgetary or political constraints, particularly in challenging economic environments. Government agencies often do not set their own budgets and therefore, have limited control over the amount of money they can spend. In addition, these agencies experience political pressure that may dictate the manner in which they spend money. There can be no assurance that the economic, budgeting or political issues will not worsen and adversely impact sales or reimbursements of our products. Competition from current and future competitors may negatively impact our ability to maintain pricing and our market share. New products marketed by our competitors could cause our revenue to decrease due to potential price reductions and lower sales volumes. Additionally, the introduction of generic or biosimilar versions of our products, follow-on products, prodrugs or products approved under abbreviated regulatory pathways may significantly reduce the price that we are able to charge for our products and the volume of products we sell. Many payors continue to adopt benefit plan changes that shift a greater portion of prescription costs to patients, including more limited benefit plan designs, higher patient co-pay or co-insurance obligations and limitations on patients' use of commercial manufacturer co-pay payment assistance programs (including through co-pay accumulator adjustment or maximization programs). Significant consolidation in the health insurance industry has resulted in a few large insurers and pharmacy benefit managers exerting greater pressure in pricing and usage negotiations with drug manufacturers, significantly increasing discounts and rebates required of manufacturers and limiting patient access and usage. Further consolidation among insurers, pharmacy benefit managers and other payors would increase the negotiating leverage such entities have over us and other drug manufacturers. Additional discounts, rebates, coverage or plan changes, restrictions or exclusions as described above could have a material adverse effect on sales of our affected products. Our failure to obtain or maintain adequate coverage, pricing or reimbursement for our products could have an adverse effect on our business, reputation, revenue and results of operations. We depend on relationships with collaborators and other third-parties for revenue, and for the development, regulatory approval, commercialization and marketing of certain of our products and product candidates, which are outside of our full control. We rely on a number of collaborative and other third-party relationships for revenue and the development, regulatory approval, commercialization and marketing of certain of our products and product candidates. We also outsource certain aspects of our regulatory affairs and clinical development relating to our products and product candidates to third-parties. Reliance on third-parties subjects us to a number of risks, including: •we may be unable to control the resources our collaborators or third-parties devote to our programs, products or product candidates, which may affect our ability to achieve development goals or milestones; •disputes may arise under an agreement, including with respect to the achievement and payment of milestones, payment of development or commercial costs, ownership of rights to technology developed, and the underlying agreement may fail to provide us with significant protection or may fail to be effectively enforced if the collaborators or third-parties fail to perform; •the interests of our collaborators or third-parties may not always be aligned with our interests, and such parties may not pursue regulatory approvals or market a product in the same manner or to the same extent
that we would, which could adversely affect our revenue, or may adopt tax strategies that could have an adverse effect on our business, results of operations or financial condition; •third-party relationships require the parties to cooperate, and failure to do so effectively could adversely affect product sales or the clinical development or regulatory approvals of product candidates under joint control, could result in termination of the research, development or commercialization of product candidates or could result in litigation or arbitration; •any failure on the part of our collaborators or third-parties to comply with applicable laws, including tax laws, regulatory requirements and/or applicable contractual obligations or to fulfill any responsibilities they may have to protect and enforce any intellectual property rights underlying our products could have an adverse effect on our revenue or reputation as well as involve us in possible legal proceedings; and •any improper conduct or actions on the part of our collaborators or third-parties could subject us to civil or criminal investigations and monetary and injunctive penalties, require management attention, impact the accuracy and timing of our financial reporting and/or adversely impact our ability to conduct business, our operating results and our reputation. Given these risks, there is considerable uncertainty regarding the success of our current and future collaborative efforts. If these efforts fail, our product development or commercialization of new products could be delayed, revenue from products could decline and/or we may not realize the anticipated benefits of these arrangements. Our results of operations may be adversely affected by current and potential future healthcare reforms. In the U.S., federal and state legislatures, health agencies and third-party payors continue to focus on containing the cost of health care. Legislative and regulatory proposals, enactments to reform health care insurance programs (including those contained in the IRA) and increasing pressure from social sources could significantly influence the manner in which our products are prescribed, purchased and reimbursed. For example, provisions of the PPACA have resulted in changes in the way health care is paid for by both governmental and private insurers, including increased rebates owed by manufacturers under the Medicaid Drug Rebate Program, annual fees and taxes on manufacturers of certain branded prescription drugs, the requirement that manufacturers participate in a discount program for certain outpatient drugs under Medicare Part D and the expansion of the number of hospitals eligible for discounts under Section 340B of the Public Health Service Act. These changes have had and are expected to continue to have a significant impact on our business. We may face uncertainties as a result of efforts to repeal, substantially modify or invalidate some or all of the provisions of the PPACA. There is no assurance that the PPACA, as currently enacted or as amended in the future, will not adversely affect our business and financial results, and we cannot predict how future federal or state legislative or administrative changes relating to healthcare reform will affect our business. There is substantial public attention on the costs of prescription drugs and we expect drug pricing and other health care costs to continue to be subject to intense political and societal pressures on a global basis. In addition, there have been (including elements of the IRA), and are expected to continue to be, legislative proposals to address prescription drug pricing. Some of these proposals could have significant effects on our business, including an executive order issued in September 2020 to test a “most favored nation” model for Part B and Part D drugs that tie reimbursement rates to international drug pricing metrics. These actions and the uncertainty about the future of the PPACA and healthcare laws may put downward pressure on pharmaceutical pricing and increase our regulatory burdens and operating costs. There is also significant economic pressure on state budgets, that may result in states increasingly seeking to achieve budget savings through mechanisms that limit coverage or payment for our drugs. In recent years, some states have considered legislation and ballot initiatives that would control the prices of drugs, including laws to allow importation of pharmaceutical products from lower cost jurisdictions outside the U.S. and laws intended to impose price controls on state drug purchases. State Medicaid programs are requesting manufacturers to pay supplemental rebates and requiring prior authorization by the state program for use of any drug for which supplemental rebates are not being paid. Government efforts to reduce Medicaid expense may lead to increased use of managed care organizations by Medicaid programs. This may result in managed care organizations influencing prescription decisions for a larger segment of the population and a corresponding limitation on prices and reimbursement for our products. In the E.U. and some other international markets, the government provides health care at low cost to consumers and regulates pharmaceutical prices, patient eligibility or reimbursement levels to control costs for the government-sponsored health care system. Many countries have announced or implemented measures, and may in the future implement new or additional measures, to reduce health care costs to limit the overall level of government
expenditures. These measures vary by country and may include, among other things, patient access restrictions, suspensions on price increases, prospective and possible retroactive price reductions and other recoupments and increased mandatory discounts or rebates, recoveries of past price increases and greater importation of drugs from lower-cost countries. These measures have negatively impacted our revenue and may continue to adversely affect our revenue and results of operations in the future. Our success in commercializing biosimilars is subject to risks and uncertainties inherent in the development, manufacture and commercialization of biosimilars. If we are unsuccessful in such activities, our business may be adversely affected. The development, manufacture and commercialization of biosimilar products require specialized expertise and are very costly and subject to complex regulation. Our success in commercializing biosimilars is subject to a number of risks, including: •Reliance on Third-Parties. We are dependent, in part, on the efforts of collaboration partners and other third-parties over whom we have limited or no control in the development and manufacturing of biosimilars products. For example, a recently announced potential acquisition of a contract development and manufacturing organization by a third party. If these third-parties fail to perform successfully, or reduce their third party manufacturing production, our biosimilar product development or commercialization of biosimilar products could be delayed, revenue from biosimilar products could decline and/or we may not realize the anticipated benefits of these arrangements; •Regulatory Compliance. Biosimilar products may face regulatory hurdles or delays due to the evolving and uncertain regulatory and commercial pathway of biosimilars products in certain jurisdictions; •Ability to Provide Adequate Supply. Manufacturing biosimilars is complex. If we encounter any manufacturing or supply chain difficulties we may be unable to meet demand. We are dependent on a third-party for the manufacture of our biosimilar products and such third-party may not perform its obligations in a timely and cost-effective manner or in compliance with applicable regulations and may be unable or unwilling to increase production capacity commensurate with demand for our existing or future biosimilar products; •Intellectual Property and Regulatory Challenges. Biosimilar products may face extensive intellectual property clearances and infringement litigation, injunctions or regulatory challenges, which could prevent the commercial launch of a product or delay it for many years or result in imposition of monetary damages, penalties or other civil sanctions and damage our reputation; •Failure to Gain Market and Patient Acceptance. Market success of biosimilar products will be adversely affected if patients, physicians and/or payors do not accept biosimilar products as safe and efficacious products offering a more competitive price or other benefit over existing therapies; and •Competitive Challenges. Biosimilar products face significant competition, including from innovator products and biosimilar products offered by other companies that may receive greater acceptance or more favorable reimbursement. Local tendering processes may restrict biosimilar products from being marketed and sold in some jurisdictions. The number of competitors in a jurisdiction, the timing of approval and the ability to market biosimilar products successfully in a timely and cost-effective manner are additional factors that may impact our success in this business area. The decision to explore strategic options related to our biosimilars business could adversely affect our operations related to our biosimilars business. Risks Related to Intellectual Property If we are unable to obtain and maintain adequate protection for our data, intellectual property and other proprietary rights, our business may be harmed. Our success, including our long-term viability and growth, depends, in part, on our ability to obtain and defend patent and other intellectual property rights, including certain regulatory forms of exclusivity, that are important to the commercialization of our products and product candidates. Patent protection and/or regulatory exclusivity in the U.S. and other important markets remains uncertain and depends, in part, upon decisions of the patent offices, courts, administrative bodies and lawmakers in these countries. We may fail to obtain, defend or preserve patent and other intellectual property rights, including certain regulatory forms of exclusivity, or the protection we obtain may not be of sufficient breadth and degree to protect our commercial interests in all countries where we conduct business, which could result in financial, business or reputational harm to us or could cause a decline or volatility in our stock price. In addition, settlements of such proceedings often result in reducing the period of exclusivity and other protections, resulting in a reduction in revenue from affected products.
In many markets, including the U.S., manufacturers may be allowed to rely on the safety and efficacy data of the innovator's product and do not need to conduct clinical trials before marketing a competing version of a product after there is no longer patent or regulatory exclusivity. In such cases, manufacturers often charge significantly lower prices and a major portion of the company's revenue may be reduced in a short period of time. In addition, manufacturers of generics and biosimilars may choose to launch or attempt to launch their products before the expiration of our patent or other intellectual property protections. Furthermore, our products may be determined to infringe patents or other intellectual property rights held by third-parties. Legal proceedings, administrative challenges or other types of proceedings are and may in the future be necessary to determine the validity, scope or non-infringement of certain patent rights claimed by third-parties to be pertinent to the manufacture, use or sale of our products. Legal proceedings may also be necessary to determine the rights, obligations and payments claimed during and after the expiration of intellectual property license agreements we have entered with third parties. Such proceedings are unpredictable and are often protracted and expensive. Negative outcomes of such proceedings could hinder or prevent us from manufacturing and marketing our products, require us to seek a license for the infringed product or technology or result in the assessment of significant monetary damages against us that may exceed amounts, if any, accrued in our financial statements. A failure to obtain necessary licenses for an infringed product or technology could prevent us from manufacturing or selling our products. Furthermore, payments under any licenses that we are able to obtain could reduce our profits from the covered products and services. Any of these circumstances could result in financial, business or reputational harm to us or could cause a decline or volatility in our stock price. Risks Related to Development, Clinical Testing and Regulation of Our Products and Product Candidates Successful preclinical work or early stage clinical trials does not ensure success in later stage trials, regulatory approval or commercial viability of a product. Positive results in a clinical trial may not be replicated in subsequent or confirmatory trials. Additionally, success in preclinical work or early stage clinical trials does not ensure that later stage or larger scale clinical trials will be successful or that regulatory approval will be obtained. Even if later stage clinical trials are successful, regulatory authorities may delay or decline approval of our product candidates. Regulatory authorities may disagree with our view of the data, require additional studies, disagree with our trial design or endpoints or not approve adequate reimbursement. Regulatory authorities may also fail to approve the facilities or processes used to manufacture a product candidate, our dosing or delivery methods or companion devices. Regulatory authorities may grant marketing approval that is more restricted than anticipated, including limiting indications to narrow patient populations and the imposition of safety monitoring, educational requirements, requiring confirmatory trials and risk evaluation and mitigation strategies. The occurrence of any of these events could result in significant costs and expense, have an adverse effect on our business, financial condition and results of operations and/or cause our stock price to decline or experience periods of volatility. Clinical trials and the development of biopharmaceutical products is a lengthy and complex process. If we fail to adequately manage our clinical activities, our clinical trials or potential regulatory approvals may be delayed or denied. Conducting clinical trials is a complex, time-consuming and expensive process. Our ability to complete clinical trials in a timely fashion depends on a number of key factors, including protocol design, regulatory and institutional review board approval, patient enrollment rates and compliance with current Good Clinical Practices. If we or our third-party clinical trial providers or third-party CROs do not successfully carry out these clinical activities, our clinical trials or the potential regulatory approval of a product candidate may be delayed or denied. We have opened clinical trial sites and are enrolling patients in a number of countries where our experience is limited. In most cases, we use the services of third-parties to carry out our clinical trial related activities and rely on such parties to accurately report their results. Our reliance on third-parties for these activities may impact our ability to control the timing, conduct, expense and quality of our clinical trials. One CRO has responsibility for a substantial portion of our activities and reporting related to our clinical trials and if such CRO does not adequately perform, many of our trials may be affected, including adversely affecting our expenses associated with such trials. We may need to replace our CROs, which may result in the delay of the affected trials or otherwise adversely affect our efforts to obtain regulatory approvals and commercialize our product candidates. Adverse safety events or restrictions on use and safety warnings for our products can negatively affect our business, product sales and stock price. Adverse safety events involving our marketed products, generic or biosimilar versions of our marketed products or products from the same class as one of our products may have a negative impact on our business. Discovery of safety issues with our products could create product liability and could cause additional regulatory scrutiny and
requirements for additional labeling or safety monitoring, withdrawal of products from the market and/or the imposition of fines or criminal penalties. Adverse safety events may also damage physician, patient and/or investor confidence in our products and our reputation. Any of these could result in adverse impacts on our results of operations. Regulatory authorities are making greater amounts of stand-alone safety information directly available to the public through periodic safety update reports, patient registries and other reporting requirements. The reporting of adverse safety events involving our products or products similar to ours and public rumors about such events may increase claims against us and may also cause our product sales to decline or our stock price to experience periods of volatility. Restrictions on use or safety warnings that may be required to be included in the label of our products may significantly reduce expected revenue for those products and require significant expense and management time. Risks Related to Our Operations A breakdown or breach of our information systems could subject us to liability or interrupt the operation of our business. We are increasingly dependent upon information systems and data to operate our business. Changes in how we operate have caused us to modify our business practices in ways that heighten this dependence, including changing the requirement that most of our office-based employees in the U.S. and our other key markets work from the office, with many of our employees now working in hybrid or full-remote positions. As a result, we are increasingly dependent upon our information systems to operate our business and our ability to effectively manage our business depends on the security, reliability and adequacy of our information systems and data, which includes use of cloud technologies, including Software as a Service (SaaS), Platform as a Service (PaaS) and Infrastructure as a Service (IaaS). Breakdowns, invasions, corruptions, destructions and/or breaches, which impact may include, but not limited to, comprising the capacity, reliability or security of our information systems or those of our business partners, including our cloud tech nologies, and/or unauthorized access to our data and information could subject us to significant liability, negatively impact our business operations, and/or require replacement of technology and/or sizeable ransom payments. Our information systems, including our cloud technologies, continue to increase in multitude and complexity, increasing our vulnerability when breakdowns, malicious intrusions and random attacks occur. Data privacy or security breaches also pose a risk that sensitive data, including intellectual property, trade secrets or personal information belonging to us, patients, customers or other business partners, may be exposed to unauthorized persons or to the public. Cybersecurity threats and incidents are increasing in their frequency, sophistication and intensity, and are becoming increasingly difficult to detect, particularly when they impact vendors, customers or suppliers, and other companies in our supply chain. Cybersecurity threats and incidents are often carried out by motivated, well-resourced, skilled and persistent actors, including nation states, organized crime groups, “hacktivists” and may include or target employees or contractors acting with careless or malicious intent. Recent developments in the threat landscape include use of AI and machine learning, as well as an increased number of cyber extortion attacks, with higher financial ransom demand amounts and increasing sophistication and variety of ransomware techniques and methodology. Geopolitical instability, including that related to Russia's invasion of Ukraine or the conflict in the Middle East, may increase the risk of cybersecurity threats. Cybersecurity threats or incidents may include deployment of harmful malware and key loggers, ransomware, a denial-of-service attack, a malicious website, the use of social engineering and other means to affect the confidentiality, integrity and availability of our information systems and data. Cybersecurity threats and incidents also include manufacturing, hardware or software supply chain attacks, which could cause a delay in the manufacturing of products or products produced for contract manufacturing or lead to a data privacy or security breach. Our key business partners face similar risks and any security breach of their systems could adversely affect our security posture. In addition, our increased use of cloud technologies heightens these and other operational risks, and any failure by cloud or other technology service providers to adequately safeguard their systems and prevent cyber-attacks could disrupt our operations and result in misappropriation, corruption or loss of confidential or propriety information. While we continue to build and improve our systems and infrastructure, including our business continuity plans, there can be no assurance that our efforts will prevent cybersecurity threats or incidents in our systems and any such incidents could materially adversely affect our business and operations and/or result in the loss of critical or sensitive information, which could result in material financial, legal, operational or reputational harm to us, loss of competitive advantage or loss of consumer confidence. Our liability insurance may not be sufficient in type or amount to cover us against claims related to security breaches, cyber-attacks and other related breaches.
Regulations continue to change as regulators worldwide consider new rules. For example, the SEC has adopted additional disclosure rules regarding cyber security risk management, strategy, governance and incident reporting by public companies. These new regulations or other regulations being considered in Europe and around the world may impact the manner in which we operate. Regulators are imposing new data privacy and security requirements, including new and greater monetary fines for privacy violations. For example, the E.U.’s General Data Protection Regulation established regulations regarding the handling of personal data, and provides an enforcement authority and imposes large penalties for noncompliance. New U.S. data privacy and security laws, such as the CCPA, and others that may be passed, similarly introduce requirements with respect to personal information, and non-compliance with the CCPA may result in liability through private actions (subject to statutorily defined damages in the event of certain data breaches) and enforcement. Failure to comply with these current and future laws, policies, industry standards or legal obligations or any security incident resulting in the unauthorized access to, or acquisition, release or transfer of personal information may result in governmental enforcement actions, litigation, fines and penalties or adverse publicity and could cause our customers to lose trust in us, which could have a material adverse effect on our business and results of operations. Manufacturing issues could substantially increase our costs, limit supply of our products and/or reduce our revenue. The process of manufacturing our products is complex, highly regulated and subject to numerous risks, including: •Risks of Reliance on Third-Parties and Single Source Providers. We rely on third-party suppliers and manufacturers for many aspects of our manufacturing process for our products and product candidates. In some cases, due to the unique manner in which our products are manufactured, we rely on single source providers of raw materials and manufacturing supplies. These third-parties are independent entities subject to their own unique operational and financial risks that are outside of our control. For example, a recently announced potential acquisition of a contract development and manufacturing organization by a third party. These third-parties may not perform their obligations in a timely and cost-effective manner or in compliance with applicable regulations, and they may be unable or unwilling to increase production capacity commensurate with demand for our existing or future products. Finding alternative providers could take a significant amount of time and involve significant expense due to the specialized nature of the services and the need to obtain regulatory approval of any significant changes to our suppliers or manufacturing methods. We cannot be certain that we could reach agreement with alternative providers or that the FDA or other regulatory authorities would approve our use of such alternatives. •Global Bulk Supply Risks. We rely on our manufacturing facilities for the production of drug substance for our large molecule products and product candidates. Our global bulk supply of these products and product candidates depends on the uninterrupted and efficient operation of these facilities, which could be adversely affected by equipment failures, labor or raw material shortages, geopolitical instability, public health epidemics, natural disasters, power failures, cyber-attacks and many other factors. •Risks Relating to Compliance with current GMP (cGMP). We and our third-party providers are generally required to maintain compliance with cGMP and other stringent requirements and are subject to inspections by the FDA and other regulatory authorities to confirm compliance. Any delay, interruption or other issues that arise in the manufacture, fill-finish, packaging or storage of our products as a result of a failure of our facilities or operations or those of third-parties to receive regulatory approval or pass any regulatory agency inspection could significantly impair our ability to develop and commercialize our products. Significant noncompliance could also result in the imposition of monetary penalties or other civil or criminal sanctions and damage our reputation. •Risk of Product Loss. The manufacturing process for our products is extremely susceptible to product loss due to contamination, oxidation, equipment failure or improper installation or operation of equipment or vendor or operator error. Even minor deviations from normal manufacturing processes could result in reduced production yields, product defects and other supply disruptions. If microbial, viral or other contaminations are discovered in our products or manufacturing facilities, we may need to close our manufacturing facilities for an extended period of time to investigate and remediate the contaminant. Any adverse developments affecting our manufacturing operations or the operations of our third-party suppliers and manufacturers may result in shipment delays, inventory shortages, lot failures, product withdrawals or recalls or other interruptions in the commercial supply of our products. Furthermore, factors such as geopolitical events, global health outbreaks, weather events, labor or raw material shortages and other supply chain disruptions could result in difficulties and delays in manufacturing our products, which could have an adverse impact on our results in operations or result in product shortages. We may also have to take inventory write-offs and incur other charges and expense for products that fail to meet specifications, undertake costly remediation efforts or seek more costly manufacturing alternatives. Such developments could increase our
manufacturing costs, cause us to lose revenue or market share as patients and physicians turn to competing therapeutics, diminish our profitability or damage our reputation. In addition, although we have business continuity plans to reduce the potential for manufacturing disruptions or delays and reduce the severity of a disruptive event, there is no guarantee that these plans will be adequate, which could adversely affect our business and operations. Management, personnel and other organizational changes may disrupt our operations, and we may have difficulty retaining personnel or attracting and retaining qualified replacements on a timely basis for the management and other personnel who may leave the Company. Changes in management, other personnel and our overall retention rate may disrupt our business, and any such disruption could adversely affect our operations, programs, growth, financial condition or results of operations. New members of management may have different perspectives on programs and opportunities for our business, which may cause us to focus on new opportunities or reduce or change emphasis on our existing programs. Our success is dependent upon our ability to attract and retain qualified management and other personnel in a highly competitive environment. Qualified individuals are in high demand, and we may incur significant costs to attract or retain them. We may face difficulty in attracting and retaining talent for a number of reasons, including management changes, integration related to the Reata acquisition, the underperformance or discontinuation of one or more marketed, pre-clinical or clinical programs, recruitment by competitors or changes in the overall labor market. In addition, changes in our organizational structure or in our flexible working arrangements could impact employees' productivity and morale as well as our ability to attract, retain and motivate employees. We cannot ensure that we will be able to hire or retain the personnel necessary for our operations or that the loss of any personnel will not have a material impact on our financial condition and results of operations. If we fail to comply with the extensive legal and regulatory requirements affecting the health care industry, we could face increased costs, penalties and a loss of business. Our activities, and the activities of our collaborators, distributors and other third-party providers, are subject to extensive government regulation and oversight in the U.S. and in foreign jurisdictions, and are subject to change and evolving interpretations, which could require us to incur substantial costs associated with compliance or to alter one or more of our business practices. The FDA and comparable foreign agencies directly regulate many of our most critical business activities, including the conduct of preclinical and clinical studies, product manufacturing, advertising and promotion, product distribution, adverse event reporting, product risk management and our compliance with good practice quality guidelines and regulations. Our interactions with physicians and other health care providers that prescribe or purchase our products are also subject to laws and government regulation designed to prevent fraud and abuse in the sale and use of products and place significant restrictions on the marketing practices of health care companies. Health care companies are facing heightened scrutiny of their relationships with health care providers and have been the target of lawsuits and investigations alleging violations of laws and government regulation, including claims asserting submission of incorrect pricing information, impermissible off-label promotion of pharmaceutical products, payments intended to influence the referral of health care business, submission of false claims for government reimbursement, antitrust violations or violations related to environmental matters. There is also enhanced scrutiny of company-sponsored patient assistance programs, including testing, insurance premium and co-pay assistance programs and donations to third-party charities that provide such assistance. The U.S. government has challenged some of our donations to third-party charities that provide patient assistance. If we, or our vendors or donation recipients, are found to fail to comply with relevant laws, regulations or government guidance in the operation of these or other patient assistance programs, we could be subject to significant fines or penalties. Risks relating to compliance with laws and regulations may be heightened as we continue to expand our global operations and enter new therapeutic areas with different patient populations, which may have different product distribution methods, marketing programs or patient assistance programs from those we currently utilize or support. Conditions and regulations governing the health care industry are subject to change, with possible retroactive effect, including: •new laws, regulations or judicial decisions, or new interpretations of existing laws, regulations or judicial decisions, related to health care availability, pricing or marketing practices, compliance with employment practices, method of delivery, payment for health care products and services, compliance with health information and data privacy and security laws and regulations, tracking and reporting payments and other transfers of value made to physicians and teaching hospitals, extensive anti-bribery and anti-corruption prohibitions, product serialization and labeling requirements and used product take-back requirements;
•changes in the FDA and foreign regulatory approval processes or perspectives that may delay or prevent the approval of new products and result in lost market opportunity; •government shutdowns or relocations may result in delays to the review and approval process, slowing the time necessary for new drug candidates to be reviewed and/or approved, which may adversely affect our business; •requirements that provide for increased transparency of clinical trial results and quality data, such as the EMA's clinical transparency policy, which could impact our ability to protect trade secrets and competitively-sensitive information contained in approval applications or could be misinterpreted leading to reputational damage, misperception or legal action, which could harm our business; and •changes in FDA and foreign regulations that may require additional safety monitoring, labeling changes, restrictions on product distribution or use or other measures after the introduction of our products to market, which could increase our costs of doing business, adversely affect the future permitted uses of approved products or otherwise adversely affect the market for our products. Violations of governmental regulation may be punishable by criminal and civil sanctions, including fines and civil monetary penalties and exclusion from participation in government programs, including Medicare and Medicaid, as well as against executives overseeing our business. We could also be required to repay amounts we received from government payors or pay additional rebates and interest if we are found to have miscalculated the pricing information we submitted to the government. In addition, legal proceedings and investigations are inherently unpredictable, and large judgments or settlements sometimes occur. While we believe that we have appropriate compliance controls, policies and procedures in place to comply with the laws or regulations of the jurisdictions in which we operate, there is a risk that acts committed by our employees, agents, distributors, collaborators or third-party providers might violate such laws or regulations. Whether or not we have complied with the law, an investigation or litigation related to alleged unlawful conduct could increase our expense, damage our reputation, divert management time and attention and adversely affect our business. Our sales and operations are subject to the risks of doing business internationally. We are increasing our presence in international markets, subjecting us to many risks that could adversely affect our business and revenue. There is no guarantee that our efforts and strategies to expand sales in international markets will succeed. Emerging market countries may be especially vulnerable to periods of global and local political, legal, regulatory and financial instability and may have a higher incidence of corruption and fraudulent business practices. Certain countries may require local clinical trial data as part of the drug registration process in addition to global clinical trials, which can add to overall drug development and registration timelines. We may also be required to increase our reliance on third-party agents or distributors and unfamiliar operations and arrangements previously utilized by companies we collaborate with or acquire in emerging markets. Our sales and operations are subject to the risks of doing business internationally, including: •the impact of public health epidemics on the global economy and the delivery of healthcare treatments; •less favorable intellectual property or other applicable laws; •the inability to obtain necessary foreign regulatory approvals of products in a timely manner; •limitations and additional pressures on our ability to obtain and maintain product pricing, reimbursement or receive price increases, including those resulting from governmental or regulatory requirements; •increased cost of goods due to factors such as inflation and supply chain disruptions; •additional complexity in manufacturing internationally, including materials manufactured in China; •delays in clinical trials relating to geopolitical instability related to Russia's invasion of Ukraine and the military conflict in the Middle East; •the inability to successfully complete subsequent or confirmatory clinical trials in countries where our experience is limited; •longer payment and reimbursement cycles and uncertainties regarding the collectability of accounts receivable; •fluctuations in foreign currency exchange rates that may adversely impact our revenue, net income and value of certain of our investments; •the imposition of governmental controls;
•diverse data privacy and protection requirements; •increasingly complex standards for complying with foreign laws and regulations that may differ substantially from country to country and may conflict with corresponding U.S. laws and regulations; •the far-reaching anti-bribery and anti-corruption legislation in the U.K., including the U.K. Bribery Act 2010, and elsewhere and escalation of investigations and prosecutions pursuant to such laws; •compliance with complex import and export control laws; •changes in tax laws; and •the imposition of tariffs or embargoes and other trade restrictions. In addition, our international operations are subject to regulation under U.S. law. For example, the U.S. FCPA prohibits U.S. companies and their representatives from paying, offering to pay, promising to pay or authorizing the payment of anything of value to any foreign government official, government staff member, political party or political candidate for the purpose of obtaining or retaining business or to otherwise obtain favorable treatment or influence a person working in an official capacity. In many countries, the health care professionals we regularly interact with may meet the FCPA's definition of a foreign government official. Failure to comply with domestic or foreign laws could result in various adverse consequences, including possible delay in approval or refusal to approve a product, recalls, seizures or withdrawal of an approved product from the market, disruption in the supply or availability of our products or suspension of export or import privileges, the imposition of civil or criminal sanctions, the prosecution of executives overseeing our international operations and damage to our reputation. Any significant impairment of our ability to sell products outside of the U.S. could adversely impact our business and financial results. In addition, while we believe that we have appropriate compliance controls, policies and procedures in place to comply with the FCPA, there is a risk that acts committed by our employees, agents, distributors, collaborators or third-party providers might violate the FCPA and we might be held responsible. If our employees, agents, distributors, collaborators or third-party providers are found to have engaged in such practices, we could suffer severe penalties and may be subject to other liabilities, which could negatively affect our business, operating results and financial condition. We built a large-scale biologics manufacturing facility and are building a gene therapy manufacturing facility, which will result in the incurrence of significant investment with no assurance that such investment will be recouped. In order to support our future growth and drug development pipeline, we have expanded our large molecule production capacity by building a large-scale biologics manufacturing facility in Solothurn, Switzerland with no assurance that the additional capacity will be required or this investment will be recouped. Although the Solothurn facility was approved by the FDA for ADUHELM and LEQEMBI, there can be no assurance that the regulatory authorities will approve the Solothurn facility for the manufacturing of other products. Additionally, we are building a new gene therapy manufacturing facility in RTP, North Carolina with no assurance that this investment will be fully utilized. If we are unable to fully utilize this gene therapy manufacturing facility, charges from excess capacity may occur and would have a negative effect on our financial condition and results of operations. If we are unable to fully utilize our manufacturing facilities, our business may be harmed. Charges resulting from excess capacity may continue to occur and would have a negative effect on our financial condition and results of operations. The illegal distribution and sale by third-parties of counterfeit or unfit versions of our products or stolen products could have a negative impact on our reputation and business. Third-parties might illegally distribute and sell counterfeit or unfit versions of our products, which do not meet our rigorous manufacturing, distribution and testing standards. A patient who receives a counterfeit or unfit drug may be at risk for a number of dangerous health consequences. Our reputation and business could suffer harm as a result of counterfeit or unfit drugs sold under our brand name. Inventory that is stolen from warehouses, plants or while in-transit, and that is subsequently improperly stored and sold through unauthorized channels, could adversely impact patient safety, our reputation and our business. The increasing use of social media platforms and artificial intelligence based software presents new risks and challenges. Social media is increasingly being used to communicate about our products and the diseases our therapies are designed to treat. Social media practices in the biopharmaceutical industry continue to evolve and regulations relating to such use are not always clear and create uncertainty and risk of noncompliance with regulations applicable to our business. For example, patients may use social media channels to comment on the effectiveness
of a product or to report an alleged adverse event. When such disclosures occur, there is a risk that we fail to monitor and comply with applicable adverse event reporting obligations or we may not be able to defend the company or the public's legitimate interests in the face of the political and market pressures generated by social media due to restrictions on what we may say about our products. There is also a risk of inappropriate disclosure of sensitive information or negative or inaccurate posts or comments about us on social media. We may also encounter criticism on social media regarding our company, management, product candidates or products. The immediacy of social media precludes us from having real-time control over postings made regarding us via social media, whether matters of fact or opinion. Our reputation could be damaged by negative publicity or if adverse information concerning us is posted on social media platforms or similar mediums, which we may not be able to reverse. If any of these events were to occur or we otherwise fail to comply with applicable regulations, we could incur liability, face restrictive regulatory actions or incur other harm to our business. Additionally, the use of AI based software is increasingly being used in the biopharmaceutical industry. Use of AI based software may lead to the release of confidential proprietary information which may impact our ability to realize the benefit of our intellectual property. Risks Related to Holding Our Common Stock Our operating results are subject to significant fluctuations. Our quarterly revenue, expense and net income (loss) have fluctuated in the past and are likely to fluctuate significantly in the future due to the risks described in these Risk Factors as well as the timing of charges and expense that we may take. We have recorded, or may be required to record, charges that include: •the cost of restructurings or other initiatives to streamline our operations and reallocate resources; •the costs associated with decisions to terminate research and development programs; •impairments with respect to investments, fixed assets and long-lived assets, including IPR&D and other intangible assets; •inventory write-downs for failed quality specifications, charges for excess capacity, charges for excess or obsolete inventory and charges for inventory write-downs relating to product suspensions, expirations or recalls; •changes in the fair value of contingent consideration or our equity investments; •bad debt expense and increased bad debt reserves; •outcomes of litigation and other legal or administrative proceedings, regulatory matters and tax matters; •payments in connection with acquisitions, divestitures and other business development activities and under license and collaboration agreements; •failure to meet certain contractual commitments; and •the impact of public health epidemics, on employees, the global economy and the delivery of healthcare treatments. Our revenue and certain assets and liabilities are also subject to foreign currency exchange rate fluctuations due to the global nature of our operations. Our efforts to mitigate the impact of fluctuating currency exchange rates may not be successful. As a result, currency fluctuations among our reporting currency, the U.S. dollar, and other currencies in which we do business will affect our operating results, often in unpredictable ways. Our net income may also fluctuate due to the impact of charges we may be required to take with respect to foreign currency hedge transactions. In particular, we may incur higher than expected charges from early termination of a hedge relationship. Our operating results during any one period do not necessarily suggest the anticipated results of future periods. Our investments in properties may not be fully realized. We own or lease real estate primarily consisting of buildings that contain research laboratories, office space and manufacturing operations. We may decide to consolidate or co-locate certain aspects of our business operations or dispose of one or more of our properties, some of which may be located in markets that are experiencing high vacancy rates and decreasing property values. If we determine that the fair value of any of our owned properties is lower than their book value, we may not realize the full investment in these properties and incur significant impairment charges or additional depreciation when the expected useful lives of certain assets have been shortened due to the anticipated closing of facilities. If we decide to fully or partially vacate a property, we may incur significant cost, including facility closing costs, employee separation and retention expense, lease termination fees, rent expense in excess of sublease income and impairment of leasehold improvements and accelerated depreciation of assets. Any of these events may have an adverse impact on our results of operations.
Our investment portfolio is subject to market, interest and credit risk that may reduce its value. We maintain a portfolio of marketable securities for investment of our cash as well as investments in equity securities of certain biotechnology companies. Changes in the value of our investment portfolio could adversely affect our earnings. The value of our investments may decline due to, among other things, increases in interest rates, downgrades of the bonds and other securities in our portfolio, negative company-specific news, biotechnology market sentiment, instability in the global financial markets that reduces the liquidity of securities in our portfolio, declines in the value of collateral underlying the securities in our portfolio and other factors. Each of these events may cause us to record charges to reduce the carrying value of our investment portfolio or sell investments for less than our acquisition cost. Although we attempt to mitigate these risks through diversification of our investments and continuous monitoring of our portfolio's overall risk profile, the value of our investments may nevertheless decline. There can be no assurance that we will continue to repurchase shares or that we will repurchase shares at favorable prices. From time to time our Board of Directors authorizes share repurchase programs. The amount and timing of share repurchases are subject to capital availability and our determination that share repurchases are in the best interest of our shareholders and are in compliance with all respective laws and our applicable agreements. Our ability to repurchase shares will depend upon, among other factors, our cash balances and potential future capital requirements for strategic transactions, our results of operations, our financial condition and other factors beyond our control that we may deem relevant. Additionally, the recently enacted IRA includes an excise tax on share repurchases, which will increase the cost of share repurchases. A reduction in repurchases under, or the completion of, our share repurchase programs could have a negative effect on our stock price. We can provide no assurance that we will repurchase shares at favorable prices, if at all. We may not be able to access the capital and credit markets on terms that are favorable to us. We may seek access to the capital and credit markets to supplement our existing funds and cash generated from operations for working capital, capital expenditure and debt service requirements and other business initiatives. The capital and credit markets are experiencing, and have in the past experienced, extreme volatility and disruption, which leads to uncertainty and liquidity issues for both borrowers and investors. In the event of adverse market conditions, we may be unable to obtain capital or credit market financing on favorable terms which could significantly increase our financing costs. Changes in credit ratings issued by nationally recognized credit rating agencies could also adversely affect our cost of financing and the market price of our securities. Our indebtedness could adversely affect our business and limit our ability to plan for or respond to changes in our business. Our indebtedness, together with our significant contingent liabilities, including milestone and royalty payment obligations, could have important consequences to our business; for example, such obligations could: •increase our vulnerability to general adverse economic and industry conditions; •limit our ability to access capital markets and incur additional debt in the future; •require us to dedicate a substantial portion of our cash flow from operations to payments on our indebtedness, thereby reducing the availability of our cash flow for other purposes, including business development, research and development and mergers and acquisitions; and •limit our flexibility in planning for, or reacting to, changes in our business and the industry in which we operate, thereby placing us at a disadvantage compared to our competitors that have less debt. Some of our collaboration agreements contain change in control provisions that may discourage a third-party from attempting to acquire us. Some of our collaboration agreements include change in control provisions that could reduce the potential acquisition price an acquirer is willing to pay or discourage a takeover attempt that could be viewed as beneficial to shareholders. Upon a change in control, some of these provisions could trigger reduced milestone, profit or royalty payments to us or give our collaboration partner rights to terminate our collaboration agreement, acquire operational control or force the purchase or sale of the programs that are the subject of the collaboration. General Risk Factors Our effective tax rate fluctuates, and we may incur obligations in tax jurisdictions in excess of accrued amounts. As a global biopharmaceutical company, we are subject to taxation in numerous countries, states and other jurisdictions. As a result, our effective tax rate is derived from a combination of applicable tax rates, including
withholding taxes, in the various places that we operate. In preparing our financial statements, we estimate the amount of tax that will become payable in each of such places. Our effective tax rate may be different than experienced in the past or our current expectations due to many factors, including changes in the mix of our profitability from country to country, the results of examinations and audits of our tax filings, adjustments to the value of our uncertain tax positions, interpretations by tax authorities or other bodies with jurisdiction, the result of tax cases, changes in accounting for income taxes and changes in tax laws and regulations either prospectively or retrospectively and the effects of the integration of Reata. Our inability to secure or sustain acceptable arrangements with tax authorities and future changes in the tax laws, among other things, may result in tax obligations in excess of amounts accrued in our financial statements. The enactment of some or all of the recommendations set forth or that may be forthcoming in the OECD’s project on “Base Erosion and Profit Shifting” by tax authorities and economic blocs in the countries in which we operate, could unfavorably impact our effective tax rate. These initiatives focus on common international principles for the entitlement to taxation of global corporate profits and minimum global tax rates. Many countries have or are in the process of enacting legislation intended to implement the OECD GloBE Model Rules effective on January 1, 2024. The impact on the Company will depend on the timing of implementation, the exact nature of each country's GloBE legislation, guidance and regulations thereon and their application by tax authorities either prospectively or retrospectively. Our business involves environmental risks, which include the cost of compliance and the risk of contamination or injury. Our business and the business of several of our strategic partners involve the controlled use of hazardous materials, chemicals, biologics and radioactive compounds. Although we believe that our safety procedures for handling and disposing of such materials comply with state, federal and foreign standards, there will always be the risk of accidental contamination or injury. If we were to become liable for an accident, or if we were to suffer an extended facility shutdown, we could incur significant costs, damages and penalties that could harm our business. Manufacturing of our products and product candidates also requires permits from government agencies for water supply and wastewater discharge. If we do not obtain appropriate permits, including permits for sufficient quantities of water and wastewater, we could incur significant costs and limits on our manufacturing volumes that could harm our business. Additionally, regulators are considering new environmental disclosure rules. For example, the SEC and other regulators are considering environmental disclosure rules and California enacted new environmental disclosure laws in October 2023 that will generally require additional disclosure and reporting by 2026. The new California laws, the Climate Corporate Data Accountability Act and the Climate-Related Financial Risk Act, each impose additional climate-related reporting requirements on large companies conducting business in the state of California. We expect to be subject to these new laws, which impose extensive reporting obligations about greenhouse gas emissions and climate-related financial risks. These recently enacted and proposed regulations may require us to incur compliance and disclosure costs and require management attention. ITEM 1B. UNRESOLVED STAFF COMMENTS None. ITEM 1C. CYBERSECURITY RISK MANAGEMENT AND STRATEGY We maintain a technology and cybersecurity program, which includes information security, as part of our overall risk management process with the aim that our information systems, including those of our vendors and other third-parties, will be resilient, effective and capable of safeguarding against emerging risks and cybersecurity threats. We endeavor to assure our program is appropriately resourced and to attract and retain expert talent to execute it. In designing, operating, evaluating and maintaining our program we use internal and external resources and frameworks, including cybersecurity expert consultants, industry working groups, the U.S. NIST Cybersecurity Framework and the U.S. Cybersecurity Agency's National Cyber Incident Scoring System model to benchmark, inform and evaluate the design of our program, our operational capabilities and our program maturity. Consistent with NIST 800-53, our technology and cybersecurity program and controls include a third party and vendor risk management component. As part of our vendor risk management program, we conduct security assessments prior to engagement of high-risk vendors and other third-party providers and have a monitoring program to evaluate ongoing compliance with our cybersecurity standards.
A key element of our technology and cybersecurity program strategy is fostering training and awareness. Our training and awareness program includes annual cybersecurity awareness training and role-based phishing tests for our employees and for third parties with access to our systems. Our technology and cybersecurity program focuses on the defense, rapid detection and rapid remediation of cybersecurity threats and incidents. Our program includes systems and processes designed based on defense-in-depth and zero-trust architectural principles and that are intended to provide the control capabilities set forth in NIST's 800-53 Rev 5, Security and Privacy Controls for Information Systems and Organizations. Our program also includes cybersecurity policies and a crisis response and management plan that is intended to allow rapid management and response and appropriate communication of cybersecurity threats and incidents. We staff a cybersecurity operations center to respond to threats and incidents. Our cybersecurity crisis management plan sets forth the items, procedures and actions we expect to address and follow in the event of a cybersecurity incident, including detection, response, mitigation and remediation. In addition to the cybersecurity operations center and our designated cybersecurity response team, we maintain a cross-functional cybersecurity crisis core team, which includes our CISO and senior representatives from our Legal, Finance, IT and Corporate Security teams. When a potential threat or incident is identified, our cyber security incident response team will assign a risk level classification and initiate the escalation and other steps called for by our plan. All incidents that are initially assessed by the cybersecurity incident response team as potentially high-risk are escalated promptly to our CISO. Our CISO, Chief Legal Officer and Chief Financial Officer, will determine whether and what elements of our cybersecurity crisis response and management plan should be activated, including escalation to other senior management or our Executive Committee. Our Executive Committee will inform our Board of Directors of cybersecurity incidents, as appropriate, considering a variety of factors, including financial, operational, legal or reputational impact. Our program's maturity and operational readiness are regularly evaluated by independent experts using the U.S. NIST's CyberSecurity Framework and penetration tests. Our program, and the results of these independent evaluations and testing, are regularly reviewed by our senior management and members of our Board of Directors. CYBERSECURITY RISK GOVERNANCE We are committed to appropriate cybersecurity governance and oversight. Our technology and cybersecurity program is the principal responsibility of our Chief Information Officer and CISO, each of whom have over 20 years of experience in information systems, including cybersecurity training and experience. Additionally, we have a Cybersecurity steering committee that includes senior representatives from our Legal, Finance and IT departments, which meets regularly to discuss cybersecurity matters. Our Board of Directors oversees management's processes for identifying and mitigating risks, including cybersecurity and information security risks. Our Audit Committee of our Board of Directors regularly reviews our technology and cybersecurity program and effectiveness, internal audits of our program, independent external expert evaluations of our program's maturity and operational readiness and the results of penetration testing. Our Audit Committee also receives regular cybersecurity updates and education on a broad range of topics, including: •Current cybersecurity landscape and emerging threats; •Status of ongoing cybersecurity initiatives and strategies; •Incident report and learnings from any cybersecurity events; and •Compliance with regulatory requirements and industry standards. For additional information on our cybersecurity risks, please read Item 1A. Risk Factors - A breakdown or breach of our technology systems could subject us to liability or interrupt the operation of our business, included in this report. ITEM 2. PROPERTIES Below is a summary of our owned and leased properties as of December 31, 2023. U.S. MASSACHUSETTS In Cambridge, Massachusetts we own approximately 263,000 square feet of real estate space, consisting of a building that houses a research laboratory and a cogeneration plant.
In addition, we lease a total of approximately 1,165,000 square feet in Massachusetts, which is summarized as follows: •808,000 square feet in Cambridge, Massachusetts, which is comprised of offices for our corporate headquarters and other administrative and development functions and laboratories, of which 209,000 square feet is subleased by multiple companies for general office space, laboratories and manufacturing facilities; and •357,000 square feet of office space in Weston, Massachusetts, of which 174,000 square feet is subleased through the remaining term of our lease agreement. Our lease expires in May 2025 and we do not intend on renewing the lease agreement. Our Massachusetts lease agreements expire at various dates through the year 2028. 125 BROADWAY BUILDING SALE AND LEASEBACK In September 2022 we completed the sale of our building and land parcel located at 125 Broadway. In connection with this sale, we simultaneously leased back the building for a term of approximately 5.5 years. The sale and immediate leaseback of this building qualified for sale and leaseback treatment and is classified as an operating lease. For additional information on our 125 Broadway sale and leaseback transaction, please read Note 11, Property, Plant and Equipment and Note 12, Leases, to our consolidated financial statements included in this report. 300 BINNEY STREET LEASE MODIFICATION In September 2022 we entered into an agreement to partially terminate a portion of our lease located at 300 Binney Street, as well as to reduce the lease term for the majority of the remaining space. The agreement was driven by our 2022 efforts to reduce costs by consolidating real estate locations. For additional information on our 300 Binney Street lease modification, please read Note 12, Leases, to our consolidated financial statements included in this report. NORTH CAROLINA In RTP, North Carolina we own approximately 1,040,000 square feet of real estate space, which is summarized as follows: •357,000 square feet of laboratory and office space; •206,000 square foot multi-purpose facility, including an ASO manufacturing suite and administrative space; •175,000 square feet related to a large-scale biologics manufacturing facility; •105,000 square feet related to a small-scale biologics manufacturing facility; •84,000 square feet of warehouse space and utilities; •70,000 square feet related to a parenteral fill-finish facility; and •43,000 square feet related to a large-scale purification facility. In addition, we lease approximately 65,000 square feet of warehouse space in Durham, North Carolina. Our North Carolina lease agreements expire at various dates through the year 2025. In the fourth quarter of 2021 we began construction of a new gene therapy manufacturing facility in RTP, North Carolina to support our gene therapy pipeline across multiple therapeutic areas. The new manufacturing facility will be approximately 197,000 square feet. As we continue to advance our research and development prioritization efforts, which includes refocusing our investment in gene therapy, we are evaluating several alternative uses for this facility.
TEXAS As part of our acquisition of Reata in September 2023 we acquired leases totaling approximately 404,000 square feet of real estate space, which is summarized as follows: •327,000 square feet in Plano, Texas, which is comprised of office and laboratory space, with an initial lease term through the year 2038. We do not intend to occupy this building and are evaluating opportunities to sublease this property; •35,000 square feet in Irving, Texas, which is comprised of office and laboratory space and expires in 2024; and •42,000 square feet in Plano, Texas, which is comprised of office and laboratory space and expires in 2024. For additional information on our acquisition of Reata, please read Note 2, Acquisitions, to our consolidated financial statements included in this report. INTERNATIONAL SWITZERLAND In order to support our future growth and drug development pipeline, we built a large-scale biologics manufacturing facility in Solothurn, Switzerland. This facility includes 393,000 square feet related to a large-scale biologics manufacturing facility, 290,000 square feet of warehouse, utilities and support space and 51,000 square feet of administrative space. In the second quarter of 2021 a portion of the facility (the first manufacturing suite) received a GMP multi-product license from the SWISSMEDIC and was placed into service. The second manufacturing suite became operational in January 2024. Solothurn has been approved for the manufacture of ADUHELM and LEQEMBI by the FDA. For additional information on our Solothurn manufacturing facility, please read Note 11, Property, Plant and Equipment, to our consolidated financial statements included in this report. OTHER INTERNATIONAL We lease office space in Baar, Switzerland, our international headquarters; the U.K.; Germany; France; Japan; Canada and numerous other countries. Our international lease agreements expire at various dates through the year 2034. ITEM 3. LEGAL PROCEEDINGS For a discussion of legal matters as of December 31, 2023, please read Note 21, Litigation, to our consolidated financial statements included in this report, which is incorporated into this item by reference. ITEM 4. MINE SAFETY DISCLOSURES Not applicable.
PART II ITEM 5. MARKET FOR REGISTRANT'S COMMON EQUITY, RELATED STOCKHOLDER MATTERS AND ISSUER PURCHASES OF EQUITY SECURITIES MARKET AND STOCKHOLDER INFORMATION Our common stock trades on The Nasdaq Global Select Market under the symbol “BIIB.” As of February 12, 2024, there were approximately 420 shareholders of record of our common stock. DIVIDENDS We have not paid cash dividends since our inception. While we historically have not paid cash dividends and do not have a current intention to pay cash dividends, we continually review our capital allocation strategies, including, among other things, payment of cash dividends, share repurchases and acquisitions. ISSUER PURCHASES OF EQUITY SECURITIES The following table summarizes our common stock repurchase activity during the fourth quarter of 2023: | | | | | | | | | | | | | | | | | | | | | | | | | Period | Total Number of
Shares Purchased
(#) | | Average Price
Paid per Share
($) | | Total Number of
Shares Purchased
as Part of Publicly
Announced Programs
(#) | | Approximate Dollar Value
of Shares That May Yet Be
Purchased Under
Our Programs
($ in millions) | | October 2023 | — | | | $ | — | | | — | | | $ | 2,050.0 | | | November 2023 | — | | | $ | — | | | — | | | $ | 2,050.0 | | | December 2023 | — | | | $ | — | | | — | | | $ | 2,050.0 | | Total(1) | — | | | $ | — | | | | | |
(1) There were no share repurchases during the fourth quarter of 2023. In October 2020 our Board of Directors authorized our 2020 Share Repurchase Program, which is a program to repurchase up to $5.0 billion of our common stock. Our 2020 Share Repurchase Program does not have an expiration date. All share repurchases under our 2020 Share Repurchase Program will be retired. Under our 2020 Share Repurchase Program, we repurchased and retired approximately 3.6 million and 6.0 million shares of our common stock at a cost of approximately $750.0 million and $1.8 billion during the years ended December 31, 2022 and 2021, respectively. There were no share repurchases of our common stock during the year ended December 31, 2023. Approximately $2.1 billion remained available under our 2020 Share Repurchase Program as of December 31, 2023. In August 2022 the IRA was signed into law. Among other things, the IRA levies a 1.0% excise tax on net stock repurchases after December 31, 2022. While we have historically made discretionary share repurchases, we had no share repurchases of our common stock during the year ended December 31, 2023.
PERFORMANCE GRAPH The performance graph below compares the five-year cumulative total stockholder return on our common stock, the Nasdaq Pharmaceutical Index, the S&P 500 Index and the Nasdaq Biotechnology Index. The performance graph below assumes the investment of $100.00 on December 31, 2018, in our common stock and each of the three indexes, with dividends being reinvested. The stock price performance in the graph below is not necessarily indicative of future price performance. | | | | | | | | | | | | | | | | | | | | | | | | | | | | | | | | | | | | | | | | | 2018 | | 2019 | | 2020 | | 2021 | | 2022 | | 2023 | | Biogen Inc. | | $100.00 | | $98.61 | | $81.37 | | $79.73 | | $92.01 | | $85.97 | | Nasdaq Pharmaceutical Index | | $100.00 | | $114.51 | | $126.56 | | $157.42 | | $175.29 | | $182.08 | | S&P 500 Index | | $100.00 | | $131.49 | | $155.68 | | $200.37 | | $164.08 | | $207.21 | | Nasdaq Biotechnology Index | | $100.00 | | $125.11 | | $158.17 | | $158.20 | | $142.19 | | $148.72 |
The information included under the heading Performance Graph is “furnished” and not “filed” for purposes of Section 18 of the Securities Exchange Act, or otherwise subject to the liabilities of that section, nor shall it be deemed to be “soliciting material” subject to Regulation 14A or incorporated by reference in any filing under the Securities Act of 1933 or the Securities Exchange Act of 1934. ITEM 6. RESERVED
ITEM 7. MANAGEMENT'S DISCUSSION AND ANALYSIS OF FINANCIAL CONDITION AND RESULTS OF OPERATIONS The following discussion should be read in conjunction with our consolidated financial statements and the accompanying notes beginning on page F-1 of this report. For our discussion of the year ended December 31, 2022, compared to the year ended December 31, 2021, please read Item 7.Management's Discussion and Analysis of Financial Condition and Results of Operations located in our Annual Report on Form 10-K for the year ended December 31, 2022. EXECUTIVE SUMMARY INTRODUCTION Biogen is a global biopharmaceutical company focused on discovering, developing and delivering innovative therapies for people living with serious and complex diseases worldwide. We have a broad portfolio of medicines to treat MS, have introduced the first approved treatment for SMA, co-developed treatments to address a defining pathology of Alzheimer’s disease and launched the first approved treatment to target a genetic cause of ALS. Through our 2023 acquisition of Reata we market the first and only drug approved in the U.S. and the E.U. for the treatment of Friedreich's Ataxia in adults and adolescents aged 16 years and older. We are focused on advancing our pipeline in neurology, specialized immunology and rare diseases. We support our drug discovery and development efforts through internal research and development programs and external collaborations. Our marketed products include TECFIDERA, VUMERITY, AVONEX, PLEGRIDY, TYSABRI and FAMPYRA for the treatment of MS; SPINRAZA for the treatment of SMA; SKYCLARYS for the treatment of Friedreich's Ataxia; QALSODY for the treatment of ALS; and FUMADERM for the treatment of severe plaque psoriasis. We also have collaborations with Eisai on the commercialization of LEQEMBI for the treatment of Alzheimer's disease and Sage on the commercialization of ZURZUVAE for the treatment of PPD and we have certain business and financial rights with respect to RITUXAN for the treatment of non-Hodgkin's lymphoma, CLL and other conditions; RITUXAN HYCELA for the treatment of non-Hodgkin's lymphoma and CLL; GAZYVA for the treatment of CLL and follicular lymphoma; OCREVUS for the treatment of PPMS and RMS; LUNSUMIO for the treatment of relapsed or refractory follicular lymphoma; COLUMVI, a bispecific antibody for the treatment of non-Hodgkin's lymphoma; and have the option to add other potential anti-CD20 therapies, pursuant to our collaboration arrangements with Genentech, a wholly-owned member of the Roche Group. We commercialize a portfolio of biosimilars of advanced biologics including BENEPALI, an etanercept biosimilar referencing ENBREL, IMRALDI, an adalimumab biosimilar referencing HUMIRA, and FLIXABI, an infliximab biosimilar referencing REMICADE, in certain countries in Europe, as well as BYOOVIZ, a ranibizumab biosimilar referencing LUCENTIS, in the U.S. and certain international markets. We also have exclusive rights to commercialize TOFIDENCE, a tocilizumab biosimilar referencing ACTEMRA. We continue to develop potential biosimilar product SB15, a proposed aflibercept biosimilar referencing EYLEA. In February 2023 we announced that we are exploring strategic options for our biosimilars business. For additional information on our collaboration arrangements, please read Note 19, Collaborative and Other Relationships, to our consolidated financial statements included in this report. We seek to ensure an uninterrupted supply of medicines to patients around the world. To that end, we continually review our manufacturing capacity, capabilities, processes and facilities. In order to support our future growth and drug development pipeline, we expanded our large molecule production capacity and built a large-scale biologics manufacturing facility in Solothurn, Switzerland. In the second quarter of 2021 a portion of the facility (the first manufacturing suite) received a GMP multi-product license from the SWISSMEDIC and was placed into service. The second manufacturing suite became operational in January 2024. Solothurn has been approved for the manufacture of ADUHELM and LEQEMBI by the FDA. We believe that the Solothurn facility will support our anticipated near to mid-term needs for the manufacturing of biologic assets, including the commercial launch of LEQEMBI. The plant represents a significant increase in our overall manufacturing capacity and is not yet being fully utilized, resulting in our recording of excess capacity charges. If we are unable to fully utilize our manufacturing facilities, we will incur additional excess capacity charges which would have a negative effect on our financial condition and results of operations. In the longer term, our revenue growth will depend upon the successful clinical development, regulatory approval and launch of new commercial products as well as additional indications for our existing products, our ability to obtain
and maintain patents and other rights related to our marketed products, assets originating from our research and development efforts and/or successful execution of external business development opportunities. BUSINESS ENVIRONMENT For a detailed discussion on our business environment, please read Item 1. Business, included in this report. For additional information on our competition and pricing risks that could negatively impact our product sales, please read Item 1A. Risk Factors, included in this report. TECFIDERA Multiple TECFIDERA generic entrants are now in North America, Brazil and certain E.U. countries and have deeply discounted prices compared to TECFIDERA. The generic competition for TECFIDERA has significantly reduced our TECFIDERA revenue and we expect that TECFIDERA revenue will continue to decline in the future. Following a favorable March 2023 decision of the CJEU affirming TECFIDERA's right to regulatory data and marketing protection and the EC determination in May 2023 that TECFIDERA is entitled to an additional year of market protection for its pediatric indication, we believe that TECFIDERA is entitled to regulatory marketing protection in the E.U. until at least February 2, 2025, and are seeking to enforce this protection. In December 2023, the EC revoked all centralized marketing authorizations for generic versions of TECFIDERA. As of December 31, 2023, some of the TECFIDERA generics have not yet fully exited some E.U. markets and we expect removal of all generics from the market will take additional time. We are closely monitoring this situation and working to enforce our legal right to market protection. In addition, we will continue to enforce our EP 2 653 873 patent related to TECFIDERA, which expires in 2028. For additional information, please read Note 21, Litigation, to our consolidated financial statements included in this report. BUSINESS UPDATE REGARDING MACROECONOMIC CONDITIONS AND OTHER DISRUPTIONS Significant portions of our business are conducted in Europe, Asia and other international geographies. Factors such as global health outbreaks, adverse weather events, geopolitical events, inflation, labor or raw material shortages and other supply chain disruptions could result in product shortages or other difficulties and delays or increased costs in manufacturing our products. Additionally, global disputes and interruptions in international relationships, including tariffs, trade protection measures, import or export licensing requirements and the imposition of trade sanctions or similar restrictions by the U.S. or other governments, affect our ability to do business. For example, tensions between the U.S. and China have led to a series of tariffs and sanctions being imposed by the U.S. on imports from China mainland, as well as other business restrictions. CURRENT ECONOMIC CONDITIONS Economic conditions remain vulnerable as markets continue to be impacted in part by elevated inflation, rising interest rates, global supply chain constraints and recent bank failures. During 2023 concerns arose with respect to the financial condition of certain banking institutions in the U.S., in particular those with exposure to certain types of depositors and large portfolios of investment securities. In March 2023 two such banks were closed and taken over by the FDIC, which created significant market disruption. While we did not have any direct exposure to these institutions, we do maintain our cash at financial institutions, often in balances that exceed the current FDIC insurance limits, and will continue to monitor our cash, cash equivalents and investments and take steps to identify any potential impact and minimize any disruptions on our business. If other banks and financial institutions enter receivership or become insolvent in the future due to financial conditions affecting the banking system and financial markets, our ability to access our cash, cash equivalents and investments, including transferring funds, making payments or receiving funds, may be threatened and could have a material adverse effect on our business and financial condition. GEOPOLITICAL TENSIONS The ongoing geopolitical tensions related to Russia's invasion of Ukraine and the recent military conflict in the Middle East have resulted in global business disruptions and economic volatility. For example, sanctions and other restrictions have been levied on the government and businesses in Russia. Although we do not have affiliates or employees, in either Russia or Ukraine, we do provide various therapies to patients in Russia through a distributor. In addition, new government sanctions on the export of certain
manufacturing materials to Russia may delay or limit our ability to get new products approved. The impact of the conflict on our operations and financial performance remains uncertain and will depend on future developments, including the severity and duration of the conflict between Russia and Ukraine, its impact on regional and global economic conditions and whether the conflict spreads or has effects on countries outside Ukraine and Russia. We will continue to monitor the ongoing conflict between Russia and Ukraine as well as the military conflict in the Middle East and assess any potential impacts on our business, supply chain, partners or customers, as well as any factors that could have an adverse effect on our results of operations. Revenue generated from sales in Russia and Ukraine represent less than 2.0% of total revenue for the years ended December 31, 2023, 2022 and 2021. Revenue generated from sales in the broader Middle East region represents less than 2.0% of total revenue for the years ended December 31, 2023, 2022 and 2021. INFLATION REDUCTION ACT OF 2022 In August 2022 the IRA was signed into law in the U.S. The IRA introduced new tax provisions, including a 15.0% corporate alternative minimum tax and a 1.0% excise tax on stock repurchases. The provisions of the IRA are effective for periods after December 31, 2022. The IRA did not result in any material adjustments to our income tax provision or other income tax balances as of December 31, 2023 and 2022. Preliminary guidance has been issued by the IRS and we expect additional guidance and regulations to be issued in future periods. We will continue to assess its potential impact on our business and results of operations as further information becomes available. The IRA also contains substantial drug pricing reforms that may have a significant impact on the pharmaceutical industry in the U.S. This includes allowing CMS to negotiate a maximum fair price for certain high-priced single source Medicare drugs, as well as redesigning Medicare Part D to reduce out-of-pocket prescription drug costs for beneficiaries, potentially resulting in higher contributions from plans and manufacturers. The IRA also establishes drug inflationary rebate requirements to penalize manufacturers from raising the prices of Medicare covered single-source drugs and biologics beyond the inflation-adjusted rate. Further, to incentivize biosimilar development, the IRA provides an 8.0% Medicare Part B add-on payment for qualifying biosimilar products for a five-year period. The IRA's drug pricing controls and Medicare redesign may have an adverse impact on our sales (particularly for our products that are more substantially reliant on Medicare reimbursement), our business and our results of operations. However, the degree of impact from this legislation on our business depends on a number of implementation decisions. We will continue to assess as further information becomes available.
FINANCIAL HIGHLIGHTS As described below under Results of Operations, our net income and diluted earnings per share attributable to Biogen Inc. for the year ended December 31, 2023, compared to the year ended December 31, 2022, reflects the following: Decreased $337.8 million or 3.3% | | | | | | | DILUTED EARNINGS PER SHARE |
Decreased $12.90 or 61.8% Decreased $741.1 million or 9.3% •MS revenue decreased $768.3 million, or 14.1% •Rare disease revenue increased $9.5 million, or 0.5% •Biosimilars revenue increased $18.9 million, or 2.5% •The decrease in MS product revenue was primarily due to a decrease in TECFIDERA demand as a result of multiple TECFIDERA generic entrants in North America, Brazil and certain E.U. countries, a decrease in Interferon demand due to competition as patients transition to higher efficacy therapies and a decrease in U.S. TYSABRI revenue primarily driven by increased competition and pricing pressure. •The increase in rare disease revenue was primarily due to revenue from SKYCLARYS, which we began recognizing in the fourth quarter of 2023 as a result of our acquisition of Reata in September 2023. The increase was partially offset by a decrease in rest of world SPINRAZA revenue primarily due to the unfavorable impact of foreign currency exchange, increased competition, a decrease in pricing and the timing of shipments. Increased $1,957.2 million or 29.7% •Cost of sales increased $255.1 million, or 11.2% •R&D expense increased $230.9 million, or 10.3% •SG&A expense increased $146.1 million, or 6.1% •Restructuring expense increased $87.7 million, or 66.9% •Other income decreased $423.7 million, net •The increase in cost of sales was primarily due to unfavorable product mix from increased contract manufacturing revenue, MS product mix and higher idle capacity charges, partially offset by a decrease in excess and obsolescence inventory charges in 2023. •The increase in research and development expense was primarily due to clinical trial close out costs incurred in 2023 of approximately $125.4 million and the recognition of $197.0 million in equity-based compensation expense related to our acquisition of Reata. •The increase in selling, general and administrative expense was primarily due to the recognition of $196.4 million in equity-based compensation expense related to our acquisition of Reata. •The increase in restructuring expense was primarily due to higher severance benefits associated with the 2023 cost savings initiatives as compared to 2022. •The decrease in other income, net was primarily due to the pre-tax gain of $1.5 billion recorded in 2022 related to the sale of our equity interest in Samsung Bioepis, partially offset by a pre-tax charge of $900.0 million, plus settlement fees and expenses, related to a litigation settlement agreement •Additionally, total cost and expense in 2022 was reduced by a pre-tax gain of approximately $503.7 million related to a sale of a building.
| | | | | | | FINANCIAL CONDITION, LIQUIDITY AND CAPITAL RESOURCES |
•We generated $1,547.2 million of net cash flow from operations for the years ended December 31, 2023. Net cash flow from operations includes $393.4 million of equity-based compensation expense related to our acquisition of Reata in September 2023. •Cash, cash equivalents and marketable securities totaled approximately $1.0 billion as of December 31, 2023, compared to approximately $5.6 billion as of December 31, 2022. The decrease was primarily due to consideration paid for our acquisition of Reata in September 2023. •There were no share repurchases of our common stock during 2023 under our 2020 Share Repurchase Program. Approximately $2.1 billion remained available under our 2020 Share Repurchase Program as of December 31, 2023. DEVELOPMENTS IN KEY COLLABORATIVE RELATIONSHIPS LEQEMBI (lecanemab) United States In July 2023 the FDA granted traditional approval of LEQEMBI, an anti-amyloid antibody for the treatment of Alzheimer's disease, which was previously granted accelerated approval by the FDA in January 2023. Following the FDA's traditional approval of LEQEMBI, CMS confirmed broader coverage of LEQEMBI. Additionally, in March 2023 Eisai announced that the U.S. Veteran's Health Administration will be providing coverage of LEQEMBI to veterans living with early stages of Alzheimer's disease. Rest of World Key developments related to LEQEMBI (lecanemab) in rest of world markets during 2023 consisted of the following: •In January 2024 we and Eisai announced that the SAG will convene at the request of the CHMP to discuss the MAA of lecanemab that is currently under review by the EMA. The meeting of the SAG is expected to take place during the first quarter of 2024 and the EC decision for the MAA of lecanemab is expected during the first half of 2024. •In January 2024 the NMPA approved LEQEMBI in China, with an expected launch date in 2024. •In December 2023 we and Eisai announced that LEQEMBI intravenous infusion was launched in Japan. •In September 2023 the Japanese Ministry of Health, Labor and Welfare approved LEQEMBI in Japan. •In January 2023 the EMA accepted for review the MAA for lecanemab. •In February 2023 the BLA for lecanemab was granted Priority Review by the NMPA of China. •In May 2023 we and Eisai announced the submission of a MAA for lecanemab to the U.K. MHRA in Great Britain, which has been designated by the MHRA for the Innovative Licensing and Access Pathway. Additionally, in May 2023 Health Canada accepted for review the NDS for lecanemab. •In June 2023 we and Eisai announced the submission of a MAA for lecanemab to the Ministry of Food and Drug Safety in South Korea. ZURZUVAE (zuranolone) In August 2023 the FDA approved ZURZUVAE for adults with PPD, pending DEA scheduling, which was completed in October 2023. Upon approval, ZURZUVAE for PPD became the first and only oral, once-daily, 14-day treatment that can provide rapid improvements in depressive symptoms by day 15 for women with PPD. ZURZUVAE for PPD became commercially available in the U.S. during the fourth quarter of 2023. Additionally, the FDA issued a CRL for the NDA for zuranolone in the treatment of adults with MDD. The CRL stated that the application did not provide substantial evidence of effectiveness to support the approval of zuranolone for the treatment of MDD and that an additional study or studies would be needed. We and Sage are continuing to seek feedback from the FDA and evaluating next steps.
BUSINESS COMBINATIONS REATA ACQUISITION On September 26, 2023, we completed the acquisition of all of the issued and outstanding shares of Reata, a biopharmaceutical company focused on developing therapeutics that regulate cellular metabolism and inflammation in serious neurologic diseases. As a result of this transaction we acquired SKYCLARYS (omaveloxolone), the first and only drug approved in the U.S. and the E.U. for the treatment of Friedreich's Ataxia in adults and adolescents aged 16 years and older, as well as other clinical and preclinical pipeline programs. Under the terms of this acquisition, we paid Reata shareholders $172.50 in cash for each issued and outstanding Reata share, which totaled approximately $6.6 billion. In addition, we agreed to pay approximately $983.9 million in cash for Reata's outstanding equity awards, inclusive of employer taxes, of which approximately $590.5 million was attributable to pre-acquisition services and is therefore reflected as a component of total purchase price paid. Of the $983.9 million paid to Reata's equity award holders, we recognized approximately $393.4 million as compensation attributable to the post-acquisition service period, of which $196.4 million was recognized as a charge to selling, general and administrative expense with the remaining $197.0 million as a charge to research and development expense within our consolidated statements of income for the year ended December 31, 2023. These amounts were associated with the accelerated vesting of stock options and RSUs previously granted to Reata employees that required no future services to vest. For additional information on our acquisition of Reata, please read Note 2, Acquisitions, to our consolidated financial statements included in this report. OTHER KEY DEVELOPMENTS SKYCLARYS (omaveloxolone) In February 2024 the EC approved SKYCLARYS in the E.U. for the treatment of FA in adults and adolescents aged 16 years and older. SKYCLARYS is the first treatment approved within the E.U. for this rare, genetic, progressive neurodegenerative disease. QALSODY (tofersen) In April 2023 the FDA approved QALSODY for the treatment of ALS in adults who have a mutation in the SOD1 gene. This indication is approved under accelerated approval based on reduction in plasma neurofilament light chain observed in patients treated with QALSODY. Continued approval for this indication may be contingent upon verification of clinical benefit in confirmatory trial(s). TECFIDERA Following a favorable March 2023 decision of the CJEU affirming TECFIDERA's right to regulatory data and marketing protection and the EC determination in May 2023 that TECFIDERA is entitled to an additional year of market protection for its pediatric indication, we believe that TECFIDERA is entitled to regulatory marketing protection in the E.U. until at least February 2, 2025, and are seeking to enforce this protection. In December 2023, the EC revoked all centralized marketing authorizations for generic versions of TECFIDERA. As of December 31, 2023, some of the TECFIDERA generics have not yet fully exited some E.U. markets and we expect removal of all generics from the market will take additional time. We are closely monitoring this situation and working to enforce our legal right to market protection. In addition, we will continue to enforce our EP 2 653 873 patent related to TECFIDERA, which expires in 2028. CORPORATE MATTERS FIT FOR GROWTH In 2023 we initiated additional cost saving measures as part of our Fit for Growth program to reduce operating costs, while improving operating efficiency and effectiveness. The Fit for Growth program is expected to generate approximately $1.0 billion in gross operating expense savings and $800.0 million in net operating expense savings by 2025, some of which will be reinvested in various initiatives. The Fit for Growth program is currently estimated to include net headcount reductions of approximately 1,000 employees and we expect to incur restructuring charges ranging from approximately $260.0 million to $280.0 million. For additional information on our Fit for Growth program, please read Note 4, Restructuring, to our consolidated financial statements included in this report.
DISCONTINUED PROGRAMS AND STUDIES ENVISION STUDY In November 2023 we notified Neurimmune of our decision to terminate our collaboration and license agreement with Neurimmune, to discontinue the development and commercialization of ADUHELM and to terminate the ENVISION clinical study. In connection with this termination, we recorded close-out costs of approximately $60.0 million in research and development expense within our consolidated statements of income for the year ended December 31, 2023. EMBARK STUDY In September 2023 we discontinued our EMBARK study for aducanumab. In connection with this discontinuation we recorded termination costs of approximately $43.0 million in research and development expense within our consolidated statements of income for the year ended December 31, 2023. ACORDA COLLABORATION In January 2024 we notified Acorda of our decision to terminate our collaboration and license agreement, effective January 1, 2025. As a result of this termination, Acorda will regain global commercialization rights to FAMPYRA. BIIB122 In June 2023 we and Denali announced plans to terminate the Phase 3 LIGHTHOUSE study for BIIB122, a small molecule inhibitor of LRRK2 in Parkinson's disease. The protocol for the Phase 2b LUMA study for BIIB122 in patients with early-stage Parkinson’s disease was amended to now include eligible patients with a LRRK2 genetic mutation in addition to continuing to enroll eligible patients with early-stage idiopathic Parkinson’s disease. BIIB093 In April 2023 we announced that we would terminate the development of BIIB093 (glibenclamide IV), currently in a Phase 3 study for LHI and a Phase 2 study for brain contusion, due to operational challenges and other strategic considerations. In connection with this termination, we recorded close-out costs of approximately $13.2 million in research and development expense within our consolidated statements of income for the year ended December 31, 2023. BIIB131 In April 2023 we announced that we will be pausing the initiation of a Phase 2b study for BIIB131 (TMS-007) for acute ischemic stroke and will continue to assess whether to initiate this study. We sold the rights to BIIB131 to a third-party biopharmaceutical company in exchange for an upfront with potential milestones and future royalties on global sales. BIIB132 In April 2023 we announced that we would discontinue further development of BIIB132 in spinocerebellar ataxia type 3, as part of our ongoing research and development prioritization initiative.
RESULTS OF OPERATIONS REVENUE The following revenue discussion should be read in conjunction with Note 5, Revenue, to our consolidated financial statements included in this report. Revenue is summarized as follows: | | | | | | | | | | | | | | | | | | | | | | | | | | | | | | | | | | | | | | | | | | | | | | | | For the Years Ended December 31, | | % Change | | $ Change | | | | 2023
vs.
2022 | | 2022
vs.
2021 | | 2023
vs.
2022 | | 2022
vs.
2021 | | (In millions, except percentages) | | 2023 | | 2022 | | 2021 | | | | | Product revenue, net: | | | | | | | | | | | | | | | | United States | | $ | 3,141.4 | | | $ | 3,469.3 | | | $ | 3,805.7 | | | (9.5) | % | | (8.8) | % | | $ | (327.9) | | | $ | (336.4) | | | Rest of world | | 4,105.3 | | | 4,518.5 | | | 5,041.2 | | | (9.1) | | | (10.4) | | | (413.2) | | | (522.7) | | | Total product revenue, net | | 7,246.7 | | | 7,987.8 | | | 8,846.9 | | | (9.3) | | | (9.7) | | | (741.1) | | | (859.1) | | | Revenue from anti-CD20 therapeutic programs | | 1,689.6 | | | 1,700.5 | | | 1,658.5 | | | (0.6) | | | 2.5 | | | (10.9) | | | 42.0 | | | Contract manufacturing, royalty and other revenue | | 899.3 | | | 485.1 | | | 476.3 | | | 85.4 | | | 1.8 | | | 414.2 | | | 8.8 | | | Total revenue | | $ | 9,835.6 | | | $ | 10,173.4 | | | $ | 10,981.7 | | | (3.3) | % | | (7.4) | % | | $ | (337.8) | | | $ | (808.3) | |
PRODUCT REVENUE Product revenue is summarized as follows: | | | | | | | | | | | | | | | | | | | | | | | | | | | | | | | | | | | | | | | | | | | | | | | | For the Years Ended December 31, | | % Change | | $ Change | | | | 2023
vs.
2022 | | 2022
vs.
2021 | | 2023
vs.
2022 | | 2022
vs.
2021 | | (In millions, except percentages) | | 2023 | | 2022 | | 2021 | | | | | Multiple Sclerosis | | $ | 4,661.9 | | | $ | 5,430.2 | | | $ | 6,096.7 | | | (14.1) | % | | (10.9) | % | | $ | (768.3) | | | $ | (666.5) | | | Rare disease | | 1,803.0 | | | 1,793.5 | | | 1,905.1 | | | 0.5 | | | (5.9) | | | 9.5 | | | (111.6) | | | Biosimilars | | 770.0 | | | 751.1 | | | 831.1 | | | 2.5 | | | (9.6) | | | 18.9 | | | (80.0) | | Other(1) | | 11.8 | | | 13.0 | | | 14.0 | | | (9.2) | | | (7.1) | | | (1.2) | | | (1.0) | | | Total product revenue, net | | $ | 7,246.7 | | | $ | 7,987.8 | | | $ | 8,846.9 | | | (9.3) | % | | (9.7) | % | | $ | (741.1) | | | $ | (859.1) | |
(1) Other includes FUMADERM, ADUHELM and ZURZUVAE, which became commercially available in the U.S. during the fourth quarter of 2023.
•Global TECFIDERA revenue decreased $431.4 million, from $1,443.9 million in 2022 to $1,012.5 million in 2023, or 29.9%, driven by a decrease in demand as a result of multiple TECFIDERA generic entrants in North America, Brazil and certain E.U. countries. •Global Interferon revenue decreased $199.7 million, from $1,305.4 million in 2022 to $1,105.7 million in 2023, or 15.3%, driven by a decrease in sales volumes as patients transition to higher efficacy therapies. •Global VUMERITY revenue increased $22.9 million, from $553.4 million in 2022 to $576.3 million in 2023, or 4.1%, primarily due to an increase in global demand, partially offset by higher discounts and allowances in the U.S. driven by a favorable Medicaid-related sales adjustment in the first quarter of 2022. •Global TYSABRI revenue decreased $154.0 million, from $2,030.9 million in 2022 to $1,876.9 million in 2023, or 7.6%, primarily due to a decrease in U.S. TYSABRI revenue driven by a decrease in demand, higher discounts and unfavorable channel dynamics. MS revenue includes sales from TECFIDERA, VUMERITY, AVONEX, PLEGRIDY, TYSABRI and FAMPYRA. In 2024 we expect total MS revenue will continue to decline as a result of increasing competition for many of our MS products in both the U.S. and rest of world markets. We are also aware of a biosimilar entrant of TYSABRI that was approved in the U.S. in August 2023 and the E.U. in September 2023. We believe that future sales of TYSABRI may be adversely affected by the entrance of this biosimilar. We believe that we have resolved previously reported manufacturing issues at our VUMERITY contract manufacturer. In addition, we are in the process of securing regulatory approval for a secondary source of supply. We do not anticipate a supply shortage in 2024 and are currently focused on rebuilding adequate inventory.
•U.S. SPINRAZA revenue increased $10.3 million, from $600.2 million in 2022 to $610.5 million in 2023, or 1.7%, primarily due to an increase in pricing, partially offset by higher discounts and allowances. •Rest of world SPINRAZA revenue decreased $62.6 million, from $1,193.3 million in 2022 to $1,130.7 million in 2023, or 5.2%, primarily due to the unfavorable impact of foreign currency exchange, a decrease in demand in certain European markets driven by increased competition, a decrease in pricing and the timing of shipments in certain Asian markets. •U.S. SKYCLARYS revenue was $55.9 million in 2023, which we began recognizing during the fourth quarter of 2023, subsequent to our acquisition of Reata. Rare disease revenue includes sales from SPINRAZA, QALSODY, which became commercially available in the U.S. during the second quarter of 2023, and SKYCLARYS (omaveloxolone), which was obtained as part of our acquisition of Reata in September 2023. SKYCLARYS became commercially available in the U.S. during the second quarter of 2023 and we began recognizing revenue from SKYCLARYS in the U.S. during the fourth quarter of 2023, subsequent to our acquisition of Reata. In February 2024 the EC approved SKYCLARYS in the E.U. for the treatment of FA in adults and adolescents aged 16 years and older. In 2024 we expect growth in rare disease revenue as we continue to launch SKYCLARYS in the U.S. Despite competition from a gene therapy product and an oral product, we anticipate SPINRAZA revenue to be relatively flat in 2024. We expect moderate growth in SPINRAZA in the U.S. as well as continued access expansion in emerging markets to offset increased competition and the impact of loading dose dynamics.
•For 2023 compared to 2022, the increase in biosimilar revenue was primarily due to an increase in sales volumes related to the continued launch of BYOOVIZ in the U.S. and rest of world, partially offset by unfavorable BYOOVIZ pricing and the unfavorable impact of foreign currency exchange.
Biosimilars revenue includes sales from BENEPALI, IMRALDI, FLIXABI and BYOOVIZ. BYOOVIZ launched in the U.S. in June 2022 and became commercially available in July 2022 through major distributors in the U.S. In 2023 BYOOVIZ became commercially available in certain international markets. During the third quarter of 2023 the FDA approved TOFIDENCE, a tocilizumab biosimilar referencing ACTEMRA, which we expect to become commercially available during 2024. In 2024 we anticipate modest growth in revenue from our biosimilars business driven by the continued launch of BYOOVIZ in the U.S. and rest of world, offset in part by lower pricing in certain markets. We continue to work with our third-party contract manufacturers for IMRALDI and BENEPALI to address supply constraints. If not resolved these supply constraints could have an adverse impact on 2024 sales. In addition, one of our contract manufacturers for IMRALDI and BENEPALI entered into a proposed acquisition by a third party, which is expected to close at the end of 2024. We are currently evaluating the impact this will have on our biosimilars business. In February 2023 we announced that we are exploring strategic options for our biosimilars business.
REVENUE FROM ANTI-CD20 THERAPEUTIC PROGRAMS Our share of RITUXAN, including RITUXAN HYCELA, GAZYVA and LUNSUMIO collaboration operating profits in the U.S., royalty revenue on sales of OCREVUS and other revenue from anti-CD20 therapeutic programs are summarized in the table below. For purposes of this discussion, we refer to RITUXAN and RITUXAN HYCELA collectively as RITUXAN. | | | | | | | | | | | | | | | | | | | | | | | | For the Years Ended December 31, | | (In millions) | | 2023 | | 2022 | | 2021 | | Royalty revenue on sales of OCREVUS | | $ | 1,266.2 | | | $ | 1,136.3 | | | $ | 991.7 | | Biogen’s share of pre-tax profits in the U.S. for RITUXAN, GAZYVA and LUNSUMIO(1) | | 409.4 | | | 547.0 | | | 647.7 | | | Other revenue from anti-CD20 therapeutic programs | | 14.0 | | | 17.2 | | | 19.1 | | | Total revenue from anti-CD20 therapeutic programs | | $ | 1,689.6 | | | $ | 1,700.5 | | | $ | 1,658.5 | |
(1) LUNSUMIO became commercially available in the U.S. during the first quarter of 2023. ROYALTY REVENUE ON SALES OF OCREVUS For 2023 compared to 2022, the increase in royalty revenue on sales of OCREVUS was primarily due to sales growth of OCREVUS in the U.S. OCREVUS royalty revenue is based on our estimates from third party and market research data of OCREVUS sales occurring during the corresponding period. Differences between actual and estimated royalty revenue will be adjusted for in the period in which they become known, which is generally expected to be the following quarter. BIOGEN'S SHARE OF PRE-TAX PROFITS IN THE US. FOR RITUXAN, GAZYVA AND LUNSUMIO The following table provides a summary of amounts comprising our share of pre-tax profits in the U.S. for RITUXAN, GAZYVA and LUNSUMIO: | | | | | | | | | | | | | | | | | | | | | | | | For the Years Ended December 31, | | (In millions) | | 2023 | | 2022 | | 2021 | | Product revenue, net | | $ | 1,581.3 | | | $ | 1,729.2 | | | $ | 2,032.0 | | | Cost and expense | | 419.9 | | | 253.6 | | | 291.8 | | | Pre-tax profits in the U.S. | | $ | 1,161.4 | | | $ | 1,475.6 | | | $ | 1,740.2 | | | Biogen's share of pre-tax profits | | $ | 409.4 | | | $ | 547.0 | | | $ | 647.7 | |
For 2023 compared to 2022, the decrease in U.S. product revenue, net was primarily due to a decrease in sales volumes of RITUXAN in the U.S. of 15.2%, resulting from competition from multiple biosimilar products, partially offset by an increase in sales volumes of GAZYVA of 17.9%. For 2023 compared to 2022, the increase in collaboration costs and expense was primarily due to higher expense related to LUNSUMIO, which became commercially available in the first quarter of 2023. In April 2023 our pre-tax profit share for RITUXAN, GAZYVA and LUNSUMIO decreased from 37.5% to 35.0%. Prior to regulatory approval, we record our share of the expense incurred by the collaboration for the development of anti-CD20 products in research and development expense and pre-commercialization costs within selling, general and administrative expense in our consolidated statements of income. After an anti-CD20 product is approved, we record our share of the development and sales and marketing expense related to that product as a reduction of our share of pre-tax profits in revenue from anti-CD20 therapeutic programs. We are aware of several other anti-CD20 molecules, including biosimilar products, that have been approved and are competing with RITUXAN and GAZYVA in the oncology and other markets. Biosimilar products referencing RITUXAN have launched in the U.S and are being offered at lower prices. This competition has had a significant adverse impact on the pre-tax profits of our collaboration arrangements with Genentech, as the sales of RITUXAN have decreased substantially compared to prior periods. We expect that biosimilar competition will continue to increase as these products capture additional market share and that this will have a significant adverse impact on our co-promotion profits in the U.S. in future years.
OTHER REVENUE FROM ANTI-CD20 THERAPEUTIC PROGRAMS Other revenue from anti-CD20 therapeutic programs consists of our share of pre-tax co-promotion profits from RITUXAN in Canada, royalty revenue on sales of LUNSUMIO outside the U.S. and royalty revenue on net sales of COLUMVI in the U.S, which became commercially available during the second quarter of 2023. For additional information on our collaboration arrangements with Genentech, including information regarding the pre-tax profit-sharing formula and its impact on future revenue from anti-CD20 therapeutic programs, please read Note 19, Collaborative and Other Relationships, to our consolidated financial statements included in this report. CONTRACT MANUFACTURING, ROYALTY AND OTHER REVENUE Contract manufacturing, royalty and other revenue is summarized as follows: | | | | | | | | | | | | | | | | | | | | | | | | For the Years Ended December 31, | | (In millions) | | 2023 | | 2022 | | 2021 | | Contract manufacturing revenue | | $ | 848.2 | | | $ | 417.7 | | | $ | 427.7 | | | Royalty and other revenue | | 51.1 | | | 67.4 | | | 48.6 | | | Total contract manufacturing, royalty and other revenue | | $ | 899.3 | | | $ | 485.1 | | | $ | 476.3 | |
CONTRACT MANUFACTURING REVENUE We record contract manufacturing revenue primarily from amounts earned under contract manufacturing agreements with our strategic customers. For 2023 compared to 2022, the increase in contract manufacturing revenue was primarily driven by higher volumes due to the timing of batch production, which includes batches related to LEQEMBI that we began recognizing in the first quarter of 2023 upon the accelerated approval of LEQEMBI in the U.S. As part of the 2020 sale of our Hillerød, Denmark manufacturing operations to FUJIFILM, we provided FUJIFILM with certain minimum batch production commitment guarantees, including batches related to our contract manufacturing arrangements. As of December 31, 2023, these batch commitments have been satisfied and we expect that our contract manufacturing revenue will be lower in 2024, compared to 2023, as we are no longer supplying contract manufacturing customers in this manner. For additional information on our collaboration arrangements with Eisai, please read Note 19, Collaborative and Other Relationships, to our consolidated financial statements included in this report. ROYALTY AND OTHER REVENUE Royalty and other revenue primarily reflects the royalties we receive from net sales on products related to patents that we have out-licensed, as well as royalty revenue on biosimilar products from our license arrangements with Samsung Bioepis and our 50.0% share of LEQEMBI product revenue, net and cost of sales, including royalties, as we are not the principal. For additional information on our collaborative arrangements with Samsung Bioepis, please read Note 19, Collaborative and Other Relationships, to our consolidated financial statements included in this report. RESERVES FOR DISCOUNTS AND ALLOWANCES Revenue from product sales is recorded net of reserves established for applicable discounts and allowances, including those associated with the implementation of pricing actions in certain international markets where we operate. These reserves are based on estimates of the amounts earned or to be claimed on the related sales and are classified as reductions of accounts receivable (if the amount is payable to our customer) or a liability (if the amount is payable to a party other than our customer). These estimates reflect our historical experience, current contractual and statutory requirements, specific known market events and trends, industry data and forecasted customer buying and payment patterns. Actual amounts may ultimately differ from our estimates. If actual results vary, we adjust these estimates, which could have an effect on earnings in the period of adjustment.
Reserves for discounts, contractual adjustments and returns that reduced gross product revenue are summarized as follows: | | | | | | | | | | | | | | | | | | | | | | | For the Years Ended December 31, | | (In millions) | | 2023 | | 2022 | | 2021 | | Contractual adjustments | | $ | 2,681.7 | | | $ | 2,716.9 | | | $ | 2,852.6 | | | Discounts | | 735.2 | | | 663.9 | | | 732.8 | | | Returns | | 38.2 | | | 5.1 | | | 11.9 | | | Total discounts and allowances | | $ | 3,455.1 | | | $ | 3,385.9 | | | $ | 3,597.3 | |
For the years ended December 31, 2023, 2022 and 2021, reserves for discounts and allowances as a percentage of gross product revenue were 32.0%, 30.1% and 28.6%, respectively. CONTRACTUAL ADJUSTMENTS Contractual adjustments primarily relate to Medicaid and managed care rebates in the U.S., pharmacy rebates, co-payment (copay) assistance, VA, 340B discounts, specialty pharmacy program fees and other government rebates or applicable allowances. For 2023 compared to 2022, the decrease in contractual adjustments was primarily due to lower government rebates in the U.S. as a result of a contract pharmacy change made during the first quarter of 2023 related to our Interferons, partially offset by higher managed care and Medicaid rebates in the U.S. and higher government rebates in rest of world. DISCOUNTS Discounts include trade term discounts and wholesaler incentives. For 2023 compared to 2022, the increase in discounts was primarily driven by higher purchase and volume discounts for biosimilars. RETURNS Product return reserves are established for returns made by wholesalers. In accordance with contractual terms, wholesalers are permitted to return product for reasons such as damaged or expired product. The majority of wholesaler returns are due to product expiration. Provisions for estimated product returns are recognized in the period the related revenue is recognized, resulting in a reduction to product sales. For 2023 compared to 2022, the increase in returns was primarily driven by higher return rates in the U.S. For additional information on our revenue reserves, please read Note 5, Revenue, to our consolidated financial statements included in this report.
COST AND EXPENSE A summary of total cost and expense is as follows: | | | | | | | | | | | | | | | | | | | | | | | | | | | | | | | | | | | | | | | | | | | | | | | | For the Years Ended December 31, | | % Change | | $ Change | | | | 2023
vs.
2022 | | 2022
vs.
2021 | | 2023
vs.
2022 | | 2022
vs.
2021 | | (In millions, except percentages) | | 2023 | | 2022 | | 2021 | | | | Cost of sales, excluding amortization and impairment of acquired intangible assets | | $ | 2,533.4 | | | $ | 2,278.3 | | | $ | 2,109.7 | | | 11.2 | % | | 8.0 | % | | $ | 255.1 | | | $ | 168.6 | | | Research and development | | 2,462.0 | | | 2,231.1 | | | 2,501.2 | | | 10.3 | | | (10.8) | | | 230.9 | | | (270.1) | | | Selling, general and administrative | | 2,549.7 | | | 2,403.6 | | | 2,674.3 | | | 6.1 | | | (10.1) | | | 146.1 | | | (270.7) | | | Amortization and impairment of acquired intangible assets | | 240.6 | | | 365.9 | | | 881.3 | | | (34.2) | | | (58.5) | | | (125.3) | | | (515.4) | | | Collaboration profit sharing/(loss reimbursement) | | 218.8 | | | (7.4) | | | 7.2 | | | nm | | (202.8) | | | 226.2 | | | (14.6) | | | (Gain) loss on fair value remeasurement of contingent consideration | | — | | | (209.1) | | | (50.7) | | | nm | | 312.4 | | | 209.1 | | | (158.4) | | | Acquired in-process research and development | | — | | | — | | | 18.0 | | | — | | | nm | | — | | | (18.0) | | | Restructuring charges | | 218.8 | | | 131.1 | | | — | | | 66.9 | | | nm | | 87.7 | | | 131.1 | | | Gain on sale of building | | — | | | (503.7) | | | — | | | nm | | nm | | 503.7 | | | (503.7) | | | Other (income) expense, net | | 315.5 | | | (108.2) | | | 1,095.5 | | | (391.6) | | | (109.9) | | | 423.7 | | | (1,203.7) | | | Total cost and expense | | $ | 8,538.8 | | | $ | 6,581.6 | | | $ | 9,236.5 | | | 29.7 | % | | (28.7) | % | | $ | 1,957.2 | | | $ | (2,654.9) | |
nm Not meaningful COST OF SALES, EXCLUDING AMORTIZATION AND IMPAIRMENT OF ACQUIRED INTANGIBLE ASSETS | | | | | | | | | | | | | | | | | | | | | | | For the Years Ended December 31, | | (In millions) | | 2023 | | 2022 | | 2021 | | Product | | $ | 1,787.2 | | | $ | 1,504.8 | | | $ | 1,281.2 | | | Royalty | | 746.2 | | | 773.5 | | | 828.5 | | | Total cost of sales | | $ | 2,533.4 | | | $ | 2,278.3 | | | $ | 2,109.7 | |
Cost of sales, as a percentage of total revenue, were 25.8%, 22.4% and 19.2% for the years ended December 31, 2023, 2022 and 2021, respectively. PRODUCT COST OF SALES For 2023 compared to 2022, the increase in product cost of sales was primarily due to unfavorable product mix from increased contract manufacturing revenue, MS product mix and higher idle capacity charges, partially offset by a decrease in excess and obsolescence inventory charges in 2023. Contract manufacturing revenue includes LEQEMBI inventory produced for Eisai, beginning in the first quarter of 2023 upon the accelerated approval of LEQEMBI in the U.S. Cost of sales as a percentage of revenue was adversely affected by LEQEMBI batches due to minimal margins. The increase was partially offset by a decrease in excess and obsolescence inventory charges as 2022 included a write-off of approximately $275.0 million during the first quarter of 2022 of excess inventory and contractual commitments related to ADUHELM. As a result of our acquisition of Reata in September 2023 we recorded a fair value step-up adjustment related to the acquired inventory of SKYCLARYS of approximately $1.3 billion. This fair value step-up adjustment will be amortized to cost of sales within our consolidated statements of income when the inventory is sold, which is expected to be within approximately 3 years from the acquisition date. For the year ended December 31, 2023, amortization from the fair value step-up adjustment as a result of inventory sold during the fourth quarter was approximately $31.5 million. For additional information on our acquisition of Reata, please read Note 2, Acquisitions, to our consolidated financial statements included in this report. Write Downs and Other Charges Inventory amounts written down as a result of excess, obsolescence or unmarketability totaled $124.4 million, $336.2 million and $167.6 million for the years ended December 31, 2023, 2022 and 2021, respectively.
For the year ended December 31, 2022, we recorded approximately $286.0 million of charges associated with the write-off of ADUHELM inventory and contractual commitments in excess of forecasted demand. We also recognized approximately $197.0 million related to Eisai's 45.0% share of inventory, idle capacity charges and contractual commitments in collaboration profit sharing/(loss reimbursement) within our consolidated statements of income for the year ended December 31, 2022. For the years ended December 31, 2023 and 2022, we recorded approximately $165.2 million and $119.0 million, respectively, of aggregate gross idle capacity charges. For additional information on our collaboration arrangements with Eisai, please read Note 19, Collaborative and Other Relationships, to our consolidated financial statements included in this report. ROYALTY COST OF SALES For 2023 compared to 2022, the decrease in royalty cost of sales was primarily due to lower royalties payable on lower sales of TYSABRI, partially offset by an increase in royalty cost of sales due to higher royalties payable on higher sales of VUMERITY and SKYCLARYS, which we began recognizing in the fourth quarter of 2023, subsequent to our acquisition of Reata.
RESEARCH AND DEVELOPMENT Research and development expense, as a percentage of total revenue, was 25.0%, 21.9% and 22.8% for the years ended December 31, 2023, 2022 and 2021, respectively. For 2023 compared to 2022, the increase in research and development was primarily due to approximately $197.0 million of equity-based compensation expense incurred as a result of our acquisition of Reata in 2023, an increase in spending for the development of LEQEMBI for the treatment of Alzheimer's disease, litifilimab for the treatment of CLE and SLE, and TOFIDENCE, a tocilizumab biosimilar referencing ACTEMRA, as well as clinical trial close out costs incurred in 2023 of approximately $125.4 million. EARLY STAGE PROGRAMS 2023 vs. 2022 The increase in early stage programs was driven by an increase in costs associated with: •development of BIIB121 for the treatment of Angelman syndrome; •development of litifilimab for the treatment of CLE; •development of BIIB115 for the treatment of SMA; •development of BIIB091 for the treatment of MS; and •development of BIIB080 for the treatment of Alzheimer's disease. The increase was partially offset by a decrease in costs associated with: •discontinuation of BIIB104 for the treatment of cognitive impairment associated with schizophrenia; and •discontinuation of BIIB078 for the treatment of Alzheimer's disease. LATE STAGE PROGRAMS 2023 vs. 2022 The decrease in late stage programs was driven by a decrease in costs associated with: •advancement of LEQEMBI from late stage to marketed upon the accelerated approval of LEQEMBI in the U.S.; •advancement of ZURZUVAE from late stage to marketed upon the approval of ZURZUVAE for PPD in the U.S.; •advancement of QALSODY from late stage to marketed upon the accelerated approval of QALSODY in the U.S.; and •advancement of LUNSUMIO from late stage to marketed upon the accelerated approval of LUNSUMIO in the U.S. The decrease was partially offset by an increase in costs associated with: •development of litifilimab for the treatment of SLE into late stage; and •development of TOFIDENCE, a tocilizumab biosimilar referencing ACTEMRA. MARKETED PROGRAMS 2023 vs. 2022 The increase in marketed programs was driven by an increase in costs associated with: •advancement of LEQEMBI from late stage to marketed upon the accelerated approval of LEQEMBI in the U.S.; •increased spend in ADUHELM primarily due to the change in our cost sharing arrangement with Eisai and clinical trial close out costs of approximately $103.0 million from the termination of our EMBARK and ENVISION studies; •advancement of ZURZUVAE from late stage to marketed upon the approval of ZURZUVAE for PPD in the U.S.; •increased spend in SKYCLARYS as a result of our acquisition of Reata in September 2023; and •advancement of QALSODY from late stage to marketed upon the accelerated approval of QALSODY in the U.S.
MILESTONE AND UPFRONT EXPENSE Research and development expense for 2023 includes: •$7.5 million charge to research and development expense in connection with a milestone payment to Ionis; and •$5.0 million charge to research and development expense in connection with exercising our option with Denali to license the ATV-enabled anti-amyloid beta program. Research and development expense for 2022 includes: •$37.0 million in charges to research and development expense in connection with milestone payments to Ionis; •$15.0 million charge to research and development expense in connection with the upfront payment associated with entering into our collaboration with Alectos Therapeutics Inc. in the second quarter of 2022; and •$10.0 million charge to research and development expense in connection with the upfront payment associated with entering into our collaboration with Alcyone Therapeutics in the fourth quarter of 2022. Research and development expense is reported above based on the following classifications. The development stage reported is based upon the program status when incurred. Therefore, the same program could be reflected in different development stages in the same year. •Research and discovery: represents costs incurred to support our discovery research and translational science efforts. •Early stage programs: are programs in Phase 1 or Phase 2 development. •Late stage programs: are programs in Phase 3 development or in registration stage. •Marketed products: includes costs associated with product lifecycle management activities including, if applicable, costs associated with the development of new indications for existing products. •Other research and development costs: A significant amount of our research and development costs consist of indirect costs incurred in support of overall research and development activities and non-specific programs, including activities that benefit multiple programs, such as management costs, as well as depreciation, information technology and facility-based expenses. These costs are considered other research and development costs in the table above and are not allocated to a specific program or stage. For several of our programs, the research and development activities are part of our collaborative and other relationships. Our costs reflect our share of the total costs incurred. For the year ended December 31, 2023, other research and development costs also includes approximately $197.0 million of equity-based compensation expense incurred as a result of our acquisition of Reata in September 2023. Excluding any milestone and upfront payments, we expect our core research and development expense to decrease in 2024, while continuing to invest in our pipeline. This is primarily due to the continued realization of our cost savings initiatives and the one-time costs incurred from our acquisition of Reata in September 2023 of approximately $197.0 million. We intend to continue committing significant resources to targeted research and development opportunities where there is a significant unmet need and where a drug candidate has the potential to be highly differentiated. For additional information on our acquisition of Reata, please read Note 2, Acquisitions, to our consolidated financial statements included in this report.
SELLING, GENERAL AND ADMINISTRATIVE For 2023 compared to 2022, selling, general and administrative expense increased by approximately 6.1% primarily due to the recognition of approximately $196.4 million in equity-based compensation expense related to our acquisition of Reata in September 2023. Additionally, we incurred transaction and integration-related expense of approximately $34.6 million related to this acquisition. The increase in selling, general and administrative expense was also due to a $31.0 million obligation to Eisai related to the termination of the co-promotion agreement for our MS products in Japan during 2023 and approximately $11.5 million of accelerated depreciation, associated with exiting a leased property, recognized during the second quarter of 2023. The increases were partially offset by the impact of cost-reduction measures realized during 2023. We expect selling, general and administrative costs to continue to decline in 2024 due to the continued realization of our cost savings initiatives and the one-time costs incurred from our acquisition of Reata in 2023 of approximately $196.4 million. For additional information on our acquisition of Reata, please read Note 2, Acquisitions, to our consolidated financial statements included in this report. For additional information on our collaboration arrangements with Eisai, please read Note 19, Collaborative and Other Relationships, to our consolidated financial statements included in this report. AMORTIZATION AND IMPAIRMENT OF ACQUIRED INTANGIBLE ASSETS Our amortization expense is based on the economic consumption and impairment of intangible assets. Our most significant amortizable intangible assets are related to TYSABRI, AVONEX, SPINRAZA, VUMERITY and SKYCLARYS, which was obtained as part of our acquisition of Reata in September 2023. For additional information on our acquisition of Reata, please read Note 2, Acquisitions, to our consolidated financial statements included in this report. For 2023 compared to 2022, the decrease in amortization and impairment of acquired intangible assets was primarily due to higher impairment charges in 2022 of approximately $119.6 million, compared to no impairment charges in 2023. For the year ended December 31, 2022, amortization and impairment of acquired intangible assets reflects the impact of a $119.6 million impairment charge related to vixotrigine (BIIB074) for the potential treatment of DPN. Amortization of acquired intangible assets, excluding impairment charges, totaled $240.6 million, $246.3 million and $252.0 million for the years ended December 31, 2023, 2022 and 2021, respectively. The decrease in amortization of acquired intangible assets, excluding impairment charges, over the three years was primarily due to a lower rate of amortization for acquired intangible assets. For additional information on the amortization and impairment of our acquired intangible assets, please read Note 7, Intangible Assets and Goodwill, to our consolidated financial statements included in this report. COLLABORATION PROFIT SHARING/(LOSS REIMBURSEMENT) Collaboration profit sharing/(loss reimbursement) primarily includes Samsung Bioepis' 50.0% share of the profit or loss related to our biosimilars 2013 commercial agreement with Samsung Bioepis. In the third quarter of 2023 we began recognizing collaboration profit sharing/(loss reimbursement) related to Sage's 50.0% share of income and expense in the U.S. related to ZURZUVAE for PPD. During 2022 we recognized Eisai's 45.0% share of income and expense in the U.S. related to the ADUHELM Collaboration Agreement. Beginning January 1, 2023, Eisai receives only a tiered royalty based on net sales of ADUHELM, and will no longer share global profits and losses. For the years ended December 31, 2023 and 2022, we recognized net profit-sharing expense of $223.5 million and $217.4 million, respectively, to reflect Samsung Bioepis' 50.0% sharing of the net collaboration profits. For the year ended December 31, 2023, we recognized net reductions to our operating expense of approximately $4.7 million to reflect Sage's 50.0% share of net collaboration losses in the U.S. For the year ended December 31, 2022, we recognized net reductions to our operating expense of approximately $224.7 million to reflect Eisai's 45.0% share of net collaboration losses in the U.S. for ADUHELM. For additional information on our collaboration and license arrangements with Samsung Bioepis, Sage and Eisai, please read Note 19, Collaborative and Other Relationships, to our consolidated financial statements included in this report.
(GAIN) LOSS ON FAIR VALUE REMEASUREMENT OF CONTINGENT CONSIDERATION For the year ended December 31, 2022, the changes in fair value of our contingent consideration obligations were primarily due to the discontinuation of further development efforts related to vixotrigine for the potential treatment of TGN and DPN, resulting in a reduction of our contingent consideration obligations of approximately$195.4 million, reducing the remaining fair value of vixotrigine to zero, as well as changes in the interest rates used to revalue our contingent consideration liabilities. For additional information on our IPR&D intangible assets, please read Note 7, Intangible Assets and Goodwill, to our consolidated financial statements included in this report. RESTRUCTURING CHARGES 2023 FIT FOR GROWTH RESTRUCTURING PROGRAM In 2023 we initiated additional cost saving measures as part of our Fit for Growth program to reduce operating costs, while improving operating efficiency and effectiveness. The Fit for Growth program is expected to generate approximately $1.0 billion in gross operating expense savings and $800.0 million in net operating expense savings by 2025, some of which will be reinvested in various initiatives. The Fit for Growth program is currently estimated to include net headcount reductions of approximately 1,000 employees and we expect to incur restructuring charges ranging from approximately $260.0 million to $280.0 million. Total charges incurred from our 2023 cost saving initiatives are summarized as follows: | | | | | | | | | | | | | | | | | | | | | | | | | | | | | | | | | For the Years Ended December 31, | | | 2023 | | | | (In millions) | | Severance
Costs | | Accelerated Depreciation and Other Costs | | | | Total | | | | | | | | | | Selling, general and administrative | | $ | — | | | $ | 23.3 | | | | | $ | 23.3 | | | | | | | | | | | Research and development | | — | | | 1.2 | | | | | 1.2 | | | | | | | | | | | Restructuring charges | | 153.4 | | | 34.6 | | | | | 188.0 | | | | | | | | | | | Total charges | | $ | 153.4 | | | $ | 59.1 | | | | | $ | 212.5 | | | | | | | | | | | | | | | | | | | | | | | | | | | | | | | | | | | | | | | | | | | | | | | | | | | | | | | | | | | | | | | | | | | | | | | | | | | | | | | | | | | | | | | | | | | | | | | | | | | | | | | | | | | | | | | | | | | | | | | |
Other Costs: includes costs associated with items such as asset abandonment and write-offs, facility closure costs, pretax gains and losses resulting from the termination of certain leases, employee non-severance expense, consulting fees and other costs. REATA INTEGRATION Following the close of our Reata acquisition, we implemented an integration plan designed to realize operating synergies through cost savings and avoidance. These amounts are primarily related to severance and are expected to be paid by the end of 2024. For the year ended December 31, 2023, we recognized approximately $30.4 million of net pre-tax restructuring charges related to employee severance costs. 2022 COST SAVING INITIATIVES In December 2021 and May 2022 we announced our plans to implement a series of cost-reduction measures during 2022. These savings are being achieved through a number of initiatives, including reductions to our workforce, the substantial elimination of our commercial ADUHELM infrastructure, deprioritization of certain research and development programs, the consolidation of certain real estate locations and operating efficiencies across our selling, general and administrative and research and development functions. Charges related to our 2022 cost saving initiatives were substantially incurred during 2022 with remaining payments expected to be made through 2026.
Total charges incurred from our 2022 cost saving initiatives are summarized as follows: | | | | | | | | | | | | | | | | | | | | | | | | | | | | | | | | | | | | | | | | | For the Years Ended December 31, | | | 2023 | | 2022 | | (In millions) | | Severance
Costs | | Accelerated Depreciation and Other Costs | | Total | | Severance Costs | | Accumulated Depreciation and Other Costs(1) | | Total | | Restructuring charges | | $ | (2.2) | | | $ | 2.6 | | | $ | 0.4 | | | $ | 112.6 | | | $ | 18.5 | | | $ | 131.1 | | | Total charges | | $ | (2.2) | | | $ | 2.6 | | | $ | 0.4 | | | $ | 112.6 | | | $ | 18.5 | | | $ | 131.1 | |
(1) Amounts reflect a gain recorded during the third quarter of 2022 of approximately $5.3 million related to the partial termination of a portion of our lease located at 300 Binney Street. For additional information on our 300 Binney Street lease modification, please read Note 12, Leases, to these consolidated financial statements. For additional information on our cost saving initiatives, please read Note 4, Restructuring, to our consolidated financial statements included in this report. In September 2022 we completed the sale of our building and land parcel located at 125 Broadway for an aggregate sales price of approximately $603.0 million, which is inclusive of a $10.8 million tenant allowance. This sale resulted in a pre-tax gain on sale of approximately $503.7 million, net of transaction costs, which is reflected within gain on sale of building in our consolidated statements of income for the year ended December 31, 2022. Simultaneously, with the close of this transaction we leased back the building for a term of approximately 5.5 years, which resulted in the recognition of approximately $168.2 million in a new lease liability and right-of-use asset recorded within our consolidated balance sheets as of December 31, 2022. The sale and immediate leaseback of this building qualified for sale and leaseback treatment and is classified as an operating lease. For additional information on our 125 Broadway sale and leaseback transaction, please read Note 11, Property, Plant and Equipment and Note 12, Leases, to our consolidated financial statements included in this report. OTHER (INCOME) EXPENSE, NET For 2023 compared to 2022, the change in other (income) expense, net primarily reflects a pre-tax gain recorded during 2022 of approximately $1.5 billion related to the sale of our 49.9% equity interest in Samsung Bioepis, partially offset by a pre-tax charge recorded during 2022 of approximately $900.0 million, plus settlement fees and expenses, related to a litigation settlement agreement to resolve a qui tam litigation relating to conduct prior to 2015. Additionally, other (income) expense, net for 2023 reflects higher interest income driven by higher interest rates in 2023. NET (GAINS) LOSSES IN EQUITY SECURITIES For the year ended December 31, 2023, net unrealized and realized losses on our holdings in equity securities were approximately $270.0 million and $5.2 million, respectively, compared to net unrealized losses and realized (gains) losses of approximately $264.7 million and zero, respectively, in 2022. •The net unrealized losses recognized during the year ended December 31, 2023, primarily reflect a decrease in the aggregate fair value of our investments in Sage, Denali, Sangamo and Ionis common stock of approximately $248.5 million. •The net unrealized losses recognized during the year ended December 31, 2022, primarily reflect a decrease in the aggregate fair value of our investments in Denali and Sangamo common stock of approximately $278.0 million, partially offset by an increase in the fair value of Ionis and Sage common stock of approximately $27.3 million. INTEREST INCOME AND EXPENSE For the year ended December 31, 2023, net interest income was $29.6 million, compared to net interest expense of $157.3 million in 2022. The increase was primarily due to higher interest rates leading to greater interest income earned on our investments in 2023, compared to 2022. For 2024 compared to 2023, we anticipate an increase in net interest expense as a result of lower cash balances leading to lower interest income due to the funding of our acquisition of Reata. For additional information on the sale of our equity interest in Samsung Bioepis, please read Note 3, Dispositions, to our consolidated financial statements included in this report.
For additional information on the litigation settlement agreement, please read Note 18, Other Consolidated Financial Statement Detail, to our consolidated financial statements included in this report. INCOME TAX PROVISION | | | | | | | | | | | | | | | | | | | | | | | For the Years Ended December 31, | | (In millions, except percentages) | | 2023 | | 2022 | | 2021 | | Income before income tax (benefit) expense | | $ | 1,296.8 | | | $ | 3,591.8 | | | $ | 1,745.2 | | | Income tax (benefit) expense | | 135.3 | | | 632.8 | | | 52.5 | | | Effective tax rate | | 10.4 | % | | 17.6 | % | | 3.0 | % |
Our effective tax rate fluctuates from year to year due to the global nature of our operations. The factors that most significantly impact our effective tax rate include changes in tax laws, variability in the allocation of our taxable earnings among multiple jurisdictions, the amount and characterization of our research and development expense, the levels of certain deductions and credits, acquisitions and licensing transactions. For 2023 compared to 2022, the decrease in our effective tax rate was driven by the impact of the non-cash changes in the value of our equity investments, the impact of Fit for Growth related expenses and Reata acquisition-related expenses, as well as the combined net unfavorable tax rate impacts in 2022 related to a litigation settlement agreement, the sale of our equity interest in Samsung Bioepis, the impact of a Neurimmune valuation allowance and an international reorganization to align with global tax developments. The change also benefits from the resolution of an uncertain tax matter during the first quarter of 2023 related to tax credits. For additional information on our acquisition of Reata, please read Note 2, Acquisitions, to our consolidated financial statements included in this report. For additional information on the litigation settlement agreement, please read Note 18, Other Consolidated Financial Statement Detail, to our consolidated financial statements included in this report. For additional information on our income taxes, uncertain tax positions and income tax rate reconciliation, please read Note 17, Income Taxes, to our consolidated financial statements included in this report. EQUITY IN (INCOME) LOSS OF INVESTEE, NET OF TAX In February 2012 we entered into a joint venture agreement with Samsung BioLogics establishing an entity, Samsung Bioepis, to develop, manufacture and market biosimilar products. In April 2022 we completed the sale of our 49.9% equity interest in Samsung Bioepis to Samsung BioLogics. Following the sale of Samsung Bioepis we no longer recognize gains or losses associated with Samsung Bioepis' results of operations and amortization related to basis differences. Prior to this sale, we recognized our share of the results of operations related to our investment in Samsung Bioepis under the equity method of accounting one quarter in arrears when the results of the entity became available, which was reflected as equity in (income) loss of investee, net of tax in our consolidated statements of income. We also recognized amortization on certain basis differences resulting from our November 2018 investment. For the year ended December 31, 2022, we recognized net income on our investment of $2.6 million, reflecting our share of Samsung Bioepis' operating profits, net of tax, totaling $17.0 million offset by amortization of basis differences totaling $14.4 million. This amount reflects our share of results prior to the sale of Samsung Bioepis as the results are recognized one quarter in arrears. For additional information on the sale of our equity interest in Samsung Bioepis, please read Note 3, Dispositions, to our consolidated financial statements included in this report. For additional information on our collaboration arrangements with Samsung Bioepis, please read Note 19, Collaborative and Other Relationships, to our consolidated financial statements included in this report. NONCONTROLLING INTERESTS, NET OF TAX Our consolidated financial statements include the financial results of a variable interest entity, Neurimmune, as we determined that we were the primary beneficiary. In November 2023 we notified Neurimmune of our decision to terminate the Neurimmune Agreement. Subsequent to the termination, we reconsidered our relationship with Neurimmune and determined that we were no longer the primary beneficiary of the variable interest entity. As a result, we recorded a net gain on the deconsolidation of
Neurimmune of approximately $3.0 million, which was recorded in other (income) expense, net within our consolidated statements of income for the year ended December 31, 2023. For 2023 compared to 2022, the change in net income (loss) attributable to noncontrolling interests, net of tax, was primarily due to an increase in a valuation allowance of approximately $85.0 million recorded in the first quarter of 2022. For additional information on the valuation allowance, deconsolidation and our collaboration agreement with Neurimmune, please read Note 20, Investments in Variable Interest Entities, to our consolidated financial statements included in this report. FINANCIAL CONDITION, LIQUIDITY AND CAPITAL RESOURCES Our financial condition is summarized as follows: | | | | | | | | | | | | | | | | | | | | | | | | | | | | | | As of December 31, | | | | | | (In millions, except percentages) | | 2023 | | 2022 | | % Change | | $ Change | | Financial assets: | | | | | | | | | | Cash and cash equivalents | | $ | 1,049.9 | | | $ | 3,419.3 | | | (69.3) | % | | $ | (2,369.4) | | | Marketable securities — current | | — | | | 1,473.5 | | | nm | | (1,473.5) | | | Marketable securities — non-current | | — | | | 705.7 | | | nm | | (705.7) | | | Total cash, cash equivalents and marketable securities | | $ | 1,049.9 | | | $ | 5,598.5 | | | (81.2) | % | | $ | (4,548.6) | | | Borrowings: | | | | | | | | | | Current portion of term loan | | $ | 150.0 | | | $ | — | | | nm | | $ | 150.0 | | | Notes payable and term loan | | 6,788.2 | | | 6,281.0 | | | 8.1 | | | 507.2 | | | Total borrowings | | $ | 6,938.2 | | | $ | 6,281.0 | | | 10.5 | % | | $ | 657.2 | | | Working Capital: | | | | | | | | | | Current assets | | $ | 6,859.3 | | | $ | 9,791.2 | | | (29.9) | % | | $ | (2,931.9) | | | Current liabilities | | (3,434.3) | | | (3,272.8) | | | 4.9 | | | (161.5) | | | Total working capital | | $ | 3,425.0 | | | $ | 6,518.4 | | | (47.5) | % | | $ | (3,093.4) | |
nm Not meaningful OVERVIEW We have historically financed and expect to continue to fund our operating and capital expenditures primarily through cash flow earned through our operations, as well as our existing cash resources. We believe that generic and biosimilar competition for many of our key products, the continued overall decline of our MS business and our investments in the launch of key new products and the development of our pipeline will have a significant adverse impact on our future cash flow from operations. We believe that our existing funds, when combined with cash generated from operations and our access to additional financing resources, if needed, are sufficient to satisfy our operating, working capital, strategic alliance, milestone payment, capital expenditure and debt service requirements for the foreseeable future. In addition, we may choose to opportunistically return cash to shareholders and pursue other business initiatives, including acquisition and licensing activities. We may also seek additional funding through a combination of new collaborative agreements, strategic alliances and additional equity and debt financings or from other sources should we identify a significant new opportunity. On September 26, 2023, we completed the acquisition of all of the issued and outstanding shares of Reata for $6.6 billion and $983.9 million for outstanding equity awards. This transaction was funded with cash on hand and the issuance of a $1.0 billion term loan. Additionally, we paid approximately $459.9 million to settle outstanding debt obligations acquired as part of our acquisition of Reata. For additional information on our acquisition of Reata, please read Note 2, Acquisitions, to our consolidated financial statements included in this report.
For additional information on certain risks that could negatively impact our financial position or future results of operations, please read Item 1A.Risk Factors and Item 7A. Quantitative and Qualitative Disclosures About Market Risk included in this report. LIQUIDITY WORKING CAPITAL Working capital is defined as current assets less current liabilities. Our working capital was $3.4 billion as of December 31, 2023, compared to $6.5 billion as of December 31, 2022. The change in working capital reflects a decrease in total current assets of approximately $2,931.9 million and an increase in total current liabilities of approximately $161.5 million. The changes in total current assets and total current liabilities were primarily driven by the following: CURRENT ASSETS •$3,842.9 million decrease in cash, cash equivalents and current marketable securities primarily due to consideration paid forour acquisition of Reata as well as the early repayment of $350.0 million in outstanding debt obligations associated with our Reata acquisition; •$235.6 million decrease in other current assets primarily due to the receipt of$812.5 million from Samsung BioLogics related to the sale of Samsung Bioepis, partially offset by the final deferred payment of $437.5 million now due within one year; and •$1,183.0 million increase in inventory primarily due to the fair value step-up adjustment for acquired inventory from our acquisition of Reata. CURRENT LIABILITIES •$88.2 million decrease in accounts payable primarily due to timing of payments; •$102.2 million increase in accrued expense and other primarily reflecting accrued costs related to our acquisition of Reata; and •$150.0 million increase in current portion of debt due to the short-term portion of our outstanding 2023 Term Loan related to our acquisition of Reata. For additional information on our acquisition of Reata, please read Note 2, Acquisitions, to our consolidated financial statements included in this report. For additional information on our 2023 Term Loan, please read Note 13, Indebtedness, to our consolidated financial statements included in this report. For additional information on the sale of our equity interest in Samsung Bioepis, please read Note 3, Dispositions, to our consolidated financial statements included in this report. CASH, CASH EQUIVALENTS AND MARKETABLE SECURITIES As of December 31, 2023, we had cash, cash equivalents and marketable securities totaling approximately $1.0 billion compared to approximately $5.6 billion as of December 31, 2022. The decrease in the balance was primarily due to the use of cash, cash equivalents and marketable securities to fund our acquisition of Reata. In connection with our acquisition of Reata we paid approximately $6.6 billion forthe issued and outstanding shares of Reata and $983.9 million related to Reata's outstanding equity awards, inclusive of employer taxes. Additionally, we assumed a payable to Blackstone of approximately $300.0 million related to a one-time contract termination fee to eliminate potential future royalty obligations related to SKYCLARYS, which was triggered as part of the change in control provision under Reata's funding agreement with Blackstone.For additional information on our acquisition of Reata, please read Note 2, Acquisitions, to these consolidated financial statements included in this report. Until required for another use in our business, we typically invest our cash reserves in bank deposits, certificates of deposit, commercial paper, corporate notes, U.S. and foreign government instruments, overnight reverse repurchase agreements and other interest-bearing marketable debt instruments in accordance with our investment policy. It is our policy to mitigate credit risk in our cash reserves and marketable securities by maintaining a well-diversified portfolio that limits the amount of exposure as to institution, maturity and investment type. We have experienced no significant limitations in our liquidity resulting from uncertainties in the banking sector.
The following table summarizes the fair value of our significant common stock investments in our strategic investment portfolio: | | | | | | | | | | | | | | | | | As of December 31, | | (In millions) | | 2023 | | 2022 | Denali(1) | | $ | 273.6 | | | $ | 370.2 | | | Sage | | 135.3 | | | 238.0 | | Sangamo(1) | | 7.9 | | | 74.3 | | Ionis(2) | | — | | | 108.6 | | | Total | | $ | 416.8 | | | $ | 791.1 | |
(1) During 2023 we sold a portion of our Sangamo and Denali common stock. (2) During 2023 we sold our remaining shares of Ionis common stock. Our ability to liquidate our investments in Denali, Sage and Sangamo may be limited by the size of our interest, the volume of market related activity, our concentrated level of ownership and potential restrictions resulting from our status as a collaborator. Therefore, we may realize significantly less than the current value of such investments. For additional information on our collaboration arrangements, please read Note 19, Collaborative and Other Relationships, to our consolidated financial statements included in this report. CASH FLOW The following table summarizes our cash flow activity: | | | | | | | | | | | | | | | | | | | | | | | | | | | | | | | | | | | | | | | | | % Change | | | | For the Years Ended December 31, | | 2023
vs.
2022 | | 2022
vs.
2021 | | (In millions, except percentages) | | 2023 | | 2022 | | 2021 | | | | Net cash flow provided by (used in) operating activities | | $ | 1,547.2 | | | $ | 1,384.3 | | | $ | 3,639.9 | | | 11.8 | % | | (62.0) | % | | Net cash flow provided by (used in) investing activities | | (4,101.0) | | | 1,576.6 | | | (563.7) | | | (360.1) | | | 379.7 | | | Net cash flow provided by (used in) financing activities | | 149.3 | | | (1,747.3) | | | (2,086.2) | | | 108.5 | | | (16.2) | |
OPERATING ACTIVITIES Operating cash flow is derived by adjusting our net income for: •non-cash operating items such as depreciation and amortization, impairment charges, unrealized (gain) loss on strategic investments and share-based compensation; •changes in operating assets and liabilities, which reflect timing differences between the receipt and payment of cash associated with transactions and when they are recognized in results of operations; and •(gains) losses on the disposal of assets, deferred income taxes, changes in the fair value of contingent payments associated with our acquisitions of businesses and acquired IPR&D. For 2023 compared to 2022, the change in net cash flow provided by operating activities was driven by changes in operating assets and liabilities primarily related to a lower inventory build in 2023 as compared to 2022, the favorable timing of customer payment receipts in 2023 and the unfavorable timing of U.S. federal tax payments in 2023. Operating cash flow in 2023 was also negatively impacted by the $393.4 million in equity-based compensation payments associated with the Reata acquisition. Operating cash flow in 2022 was also negatively impacted by the payment of of approximately $900.0 million, plus settlement fees and expenses, related to a litigation settlement agreement to resolve a qui tam litigation relating to conduct prior to 2015. INVESTING ACTIVITIES For 2023 compared to 2022, the change in net cash flow provided by (used in) investing activities was primarily due to a $6.9 billion payment made in 2023 for our acquisition of Reata, net of cash acquired, partially offset by higher net proceeds from the sales of marketable securities in the current period. Additionally, we received $582.6 million in 2022 related to the sale of one of our buildings.
FINANCING ACTIVITIES For 2023 compared to 2022, the change in net cash flow provided by (used in) financing activities was primarily due to the issuance of our 2023 Term Loans totaling $1.0 billion under our $1.5 billion term loan credit agreement which were used to partially fund our acquisition of Reata, partially offset by repayments of borrowings and debt premiums paid totaling $809.9 million. We had debt repayments of approximately $1.0 billion and share repurchases of $750.0 million during the same period in 2022. For additional information on our acquisition of Reata, please read Note 2, Acquisitions, to our consolidated financial statements included in this report. CAPITAL RESOURCES DEBT AND CREDIT FACILITIES LONG-TERM DEBT AND TERM LOAN CREDIT AGREEMENTS Our long-term obligations primarily consist of long-term debt related to our Senior Notes with final maturity dates ranging between 2025 and 2051. As of December 31, 2023, our outstanding balance related to long-term debt was $6,788.2 million. In connection with our acquisition of Reata in September 2023 we entered into a $1.5 billion term loan credit agreement. On the closing date of the Reata acquisition we drew $1.0 billion from the 2023 Term Loan, comprised of a $500.0 million floating rate 364-day tranche and a $500.0 million floating rate three-year tranche. The remaining unused commitment of $500.0 million was terminated. During the fourth quarter of 2023 we repaid $350.0 million of the 364-day tranche. As of December 31, 2023, we had $650.0 million outstanding under the 2023 Term Loan, of which $150.0 million was outstanding under the 364-day tranche and $500.0 million was outstanding under the three-year tranche. 2020 REVOLVING CREDIT FACILITY In January 2020 we entered into a $1.0 billion, five-year senior unsecured revolving credit facility under which we are permitted to draw funds for working capital and general corporate purposes. The terms of the revolving credit facility include a financial covenant that requires us not to exceed a maximum consolidated leverage ratio. As of December 31, 2023, we had no outstanding borrowings and were in compliance with all covenants under this facility. For a summary of the fair values of our outstanding borrowings as of December 31, 2023 and 2022, please read Note 8, Fair Value Measurements, to our consolidated financial statements included in this report. For additional information on our Senior Notes, 2023 Term Loan and credit facility please read, Note 13, Indebtedness, to our consolidated financial statements included in this report. SHARE REPURCHASE PROGRAMS In October 2020 our Board of Directors authorized our 2020 Share Repurchase Program, which is a program to repurchase up to $5.0 billion of our common stock. Our 2020 Share Repurchase Program does not have an expiration date. All share repurchases under our 2020 Share Repurchase Program will be retired. Under our 2020 Share Repurchase Program, we repurchased and retired approximately 3.6 million and 6.0 million shares of our common stock at a cost of approximately $750.0 million and $1.8 billion during the years ended December 31, 2022 and 2021, respectively. There were no share repurchases of our common stock during the year ended December 31, 2023. Approximately $2.1 billion remained available under our 2020 Share Repurchase Program as of December 31, 2023. CAPITAL EXPENDITURES In the fourth quarter of 2021 we began construction of a new gene therapy manufacturing facility in RTP, North Carolina to support our gene therapy pipeline across multiple therapeutic areas. The new manufacturing facility will be approximately 197,000 square feet with an estimated total investment of approximately $195.0 million. As we continue to advance our research and development prioritization efforts, which includes refocusing our investment in gene therapy, we are evaluating several alternative uses for this facility.
CONTRACTUAL OBLIGATIONS AND OFF-BALANCE SHEET ARRANGEMENTS CONTRACTUAL OBLIGATIONS The following table summarizes our contractual obligations as of December 31, 2023, excluding amounts related to uncertain tax positions, funding commitments, contingent development, regulatory and commercial milestone payments, contingent payments and contingent consideration related to our business combinations, as described below. | | | | | | | | | | | | | | | | | | | | | | | | | | | | | | | | | | | | Payments Due by Period | | (In millions) | | Total | | Less than
1 Year | | 1 to 3
Years | | 3 to 5
Years | | After
5 Years | Non-cancellable operating leases (1)(2)(3) | | $ | 524.6 | | | $ | 85.1 | | | $ | 152.3 | | | $ | 116.7 | | | $ | 170.5 | | Long-term debt obligations (4) | | 10,756.0 | | | 400.3 | | | 2,685.5 | | | 323.7 | | | 7,346.5 | | Purchase and other obligations (5) | | 807.7 | | | 524.9 | | | 277.5 | | | 0.8 | | | 4.5 | | | Defined benefit obligation | | 98.0 | | | — | | | — | | | — | | | 98.0 | | | Total contractual obligations | | $ | 12,186.3 | | | $ | 1,010.3 | | | $ | 3,115.3 | | | $ | 441.2 | | | $ | 7,619.5 | |
(1) We lease properties and equipment for use in our operations. Amounts reflected within the table above detail future minimum rental commitments under non-cancelable operating leases as of December 31 for each of the periods presented. In addition to the minimum rental commitments, these leases may require us to pay additional amounts for taxes, insurance, maintenance and other operating expenses. (2) Obligations are presented net of sublease income expected to be received for our vacated portions of our Weston, Massachusetts facility and other facilities throughout the world. (3) In connection with our acquisition of Reata in September 2023 we assumed operating lease commitments, including the responsibility for a single-tenant, built-to-suit building with a total net present value of rental expense of approximately $154.4 million over the next 15 years. For additional information on our acquisition of Reata, please read Note 2, Acquisitions, to our consolidated financial statements included in this report. (4) Long-term debt obligations are related to our 2015 Senior Notes, our 2020 Senior Notes and our 2021 Exchange Offer Senior Notes, including principal and interest payments, and our 2023 Term Loan. For additional information on our long-term debt obligations, please read Note 13, Indebtedness, to our consolidated financial statements included in this report. (5) Purchase and other obligations include $419.5 million related to the remaining payments on the Transition Toll Tax and $31.6 million related to the fair value of net liabilities on derivative contracts. ROYALTY PAYMENTS TYSABRI We are obligated to make contingent payments of 18.0% on annual worldwide net sales of TYSABRI up to $2.0 billion and 25.0% on annual worldwide net sales of TYSABRI that exceed $2.0 billion. Royalty payments are recognized as cost of sales in our consolidated statements of income. SPINRAZA We make royalty payments to Ionis on annual worldwide net sales of SPINRAZA using a tiered royalty rate between 11.0% and 15.0%, which are recognized as cost of sales in our consolidated statements of income. For additional information on our collaboration arrangements with Ionis, please read Note 19, Collaborative and Other Relationships, to our consolidated financial statements included in this report. QALSODY We make royalty payments to Ionis on annual worldwide net sales of QALSODY using a tiered royalty rate between 11.0% and 15.0%, which are recognized as cost of sales in our consolidated statements of income. For additional information on our collaboration arrangements with Ionis, please read Note 19, Collaborative and Other Relationships, to our consolidated financial statements included in this report. VUMERITY We make royalty payments to Alkermes on worldwide net sales of VUMERITY using a royalty rate of 15.0%, which are recognized as cost of sales in our consolidated statements of income. Royalties payable on net sales of VUMERITY are subject, under certain circumstances, to tiered minimum annual payment requirements for a period of five years following FDA approval.
In October 2019 we entered into a new supply agreement and amended our license and collaboration agreement with Alkermes for VUMERITY. We have elected to initiate a technology transfer and, following a transition period, to manufacture VUMERITY or have VUMERITY manufactured by a third party we have engaged in exchange for paying an increased royalty rate to Alkermes on any portion of future worldwide net commercial sales of VUMERITY that is manufactured by us or our designee. For additional information on our collaboration arrangement with Alkermes, please read Note 19, Collaborative and Other Relationships, to our consolidated financial statements included in this report. SKYCLARYS In connection with our acquisition of Reata in September 2023 we assumed additional contractual obligations related to royalty payments. Reata entered into agreements to pay royalties on future sales of SKYCLARYS, which will cumulatively range in the low- to mid-single digits. For additional information on our acquisition of Reata, please read Note 2, Acquisitions, to our consolidated financial statements included in this report. CONTINGENT DEVELOPMENT, REGULATORY AND COMMERCIAL MILESTONE PAYMENTS Based on our development plans as of December 31, 2023, we could trigger potential future milestone payments to third parties of up to approximately $5.1 billion, including approximately $0.9 billion in development milestones, approximately $0.4 billion in regulatory milestones and approximately $3.8 billion in commercial milestones, as part of our various collaborations, including licensing and development programs. Payments under these agreements generally become due and payable upon achievement of certain development, regulatory or commercial milestones. Because the achievement of these milestones was not considered probable as of December 31, 2023, such contingencies have not been recorded in our financial statements. Amounts related to contingent milestone payments are not considered contractual obligations as they are contingent on the successful achievement of certain development, regulatory or commercial milestones. During the fourth quarter of 2023 we accrued a milestone payment due to Sage of $75.0 million upon the first commercial sale of ZURZUVAE for PPD in the U.S., which was recorded within intangible assets, net in our consolidated balance sheets, and subsequently paid in January 2024. If certain clinical and commercial milestones are met, we may pay up to approximately $109.0 million in milestones in 2024 under our current agreements. OTHER FUNDING COMMITMENTS As of December 31, 2023, we have several ongoing clinical studies in various clinical trial stages. Our most significant clinical trial expenditures are to CROs. The contracts with CROs are generally cancellable, with notice, at our option. We recorded accrued expense of approximately $47.2 million in our consolidated balance sheets for expenditures incurred by CROs as of December 31, 2023. We have approximately $669.0 million in cancellable future commitments based on existing CRO contracts as of December 31, 2023. TAX RELATED OBLIGATIONS We exclude liabilities pertaining to uncertain tax positions from our summary of contractual obligations as we cannot make a reliable estimate of the period of cash settlement with the respective taxing authorities. As of December 31, 2023, we have approximately $172.0 million of liabilities associated with uncertain tax positions. As of December 31, 2023 and 2022, we have accrued income tax liabilities of approximately $419.5 million and $558.0 million, respectively, under the Transition Toll Tax. Of the amounts accrued as of December 31, 2023, approximately $185.4 million is expected to be paid within one year. The Transition Toll Tax is being paid in installments over an eight--year period, which started in 2018, and will not accrue interest. OTHER OFF-BALANCE SHEET ARRANGEMENTS We do not have any relationships with entities often referred to as structured finance or special purpose entities that were established for the purpose of facilitating off-balance sheet arrangements. As such, we are not exposed to any financing, liquidity, market or credit risk that could arise if we had engaged in such relationships. We consolidate variable interest entities if we are the primary beneficiary.
NEW ACCOUNTING STANDARDS For a discussion of new accounting standards please read Note 1, Summary of Significant Accounting Policies, to our consolidated financial statements included in this report. LEGAL MATTERS For a discussion of legal matters as of December 31, 2023, please read Note 21, Litigation, to our consolidated financial statements included in this report. CRITICAL ACCOUNTING POLICIES AND ESTIMATES The preparation of our consolidated financial statements, which have been prepared in accordance with U.S. GAAP, requires us to make estimates, judgments and assumptions that may affect the reported amounts of assets, liabilities, equity, revenue and expense and related disclosure of contingent assets and liabilities. On an ongoing basis we evaluate our estimates, judgments and assumptions. We base our estimates on historical experience and on various other assumptions that we believe are reasonable, the results of which form the basis for making judgments about the carrying values of assets, liabilities and equity and the amount of revenue and expense. Actual results may differ from these estimates. Other significant accounting policies are outlined in Note 1, Summary of Significant Accounting Policies, to our consolidated financial statements included in this report. REVENUE RECOGNITION We recognize revenue when our customer obtains control of promised goods or services, in an amount that reflects the consideration which we expect to receive in exchange for those goods or services. We recognize revenue following the five-step model prescribed under FASB ASC 606, Revenue from Contracts with Customers: (i) identify contract(s) with a customer; (ii) identify the performance obligations in the contract; (iii) determine the transaction price; (iv) allocate the transaction price to the performance obligations in the contract; and (v) recognize revenue when (or as) we satisfy the performance obligations. PRODUCT REVENUE In the U.S., we sell our products primarily to wholesale and specialty distributors and specialty pharmacies. In other countries, we sell our products primarily to wholesale distributors, hospitals, pharmacies and other third-party distribution partners. These customers subsequently resell our products to health care providers and patients. In addition, we enter into arrangements with health care providers and payors that provide for government-mandated or privately-negotiated discounts and allowances related to our products. Product revenue is recognized when the customer obtains control of our product, which occurs at a point in time, typically upon delivery to the customer. We expense incremental costs of obtaining a contract as and when incurred if the expected amortization period of the asset that we would have recognized is one year or less or the amount is immaterial. RESERVES FOR DISCOUNTS AND ALLOWANCES Product revenue is recorded net of reserves established for applicable discounts and allowances that are offered within contracts with our customers, health care providers or payors, including those associated with the implementation of pricing actions in certain of the international markets in which we operate. Our process for estimating reserves established for these variable consideration components do not differ materially from our historical practices. Product revenue reserves, which are classified as a reduction in product revenue, are generally characterized in the following categories: discounts, contractual adjustments and returns. These reserves are based on estimates of the amounts earned or to be claimed on the related sales and are classified as reductions of accounts receivable (if the amount is payable to our customer) or a liability (if the amount is payable to a party other than our customer). Our estimates of reserves established for variable consideration are calculated based upon a consistent application of our methodology utilizing the expected value method. These estimates reflect our historical experience, current contractual and statutory requirements, specific known market events and trends, industry data and forecasted customer buying and payment patterns. The transaction price, which includes variable consideration reflecting the impact of discounts and allowances, may be subject to constraint and is included in the net sales price only to the extent that it is probable that a significant reversal of the amount of the
cumulative revenue recognized will not occur in a future period. Actual amounts may ultimately differ from our estimates. If actual results vary, we adjust these estimates, which could have an effect on earnings in the period of adjustment. As of December 31, 2023 and 2022, a 10.0% change in our discounts, contractual adjustments and reserves would have resulted in a decrease of our pre-tax earnings by approximately $345.5 million and $338.6 million, respectively. In addition to discounts, rebates and product returns, we also maintain certain customer service contracts with distributors and other customers in the distribution channel that provide us with inventory management, data and distribution services, which are generally reflected as a reduction of revenue. To the extent we can demonstrate a separable benefit and fair value for these services we classify these payments in selling, general and administrative expense in our consolidated statements of income. For additional information on our revenue, please read Note 5, Revenue, to our consolidated financial statements included in this report. ACQUIRED INTANGIBLE ASSETS, INCLUDING IPR&D When we purchase a business, the acquired IPR&D is measured at fair value, capitalized as an intangible asset and tested for impairment at least annually, as of October 31, until commercialization, after which time the IPR&D is amortized over its estimated useful life. If we acquire an asset or group of assets that do not meet the definition of a business under applicable accounting standards, the acquired IPR&D is expensed on its acquisition date. Future costs to develop these assets are recorded to research and development expense as they are incurred. We have acquired, and expect to continue to acquire, intangible assets through the acquisition of biotechnology companies or through the consolidation of variable interest entities. These intangible assets primarily consist of technology associated with human therapeutic products, IPR&D product candidates and priority review vouchers. When significant identifiable intangible assets are acquired, we generally engage an independent third-party valuation firm to assist in determining the fair values of these assets as of the acquisition date. Management will determine the fair value of less significant identifiable intangible assets acquired. Discounted cash flow models are typically used in these valuations, and these models require the use of significant estimates and assumptions including but not limited to: •estimating the timing of and expected costs to complete the in-process projects; •projecting regulatory approvals; •estimating future cash flow from product sales resulting from completed products and in process projects; and •developing appropriate discount rates and probability rates by project. We believe the fair values assigned to the intangible assets acquired are based upon reasonable estimates and assumptions given available facts and circumstances as of the acquisition dates. If these projects are not successfully developed, the sales and profitability of the company may be adversely affected in future periods. Additionally, the value of the acquired intangible assets may become impaired. No assurance can be given that the underlying assumptions used to estimate expected project sales, development costs or profitability, or the events associated with such projects, will transpire as estimated. INVENTORY At each reporting period we review our inventories for excess or obsolescence and write-down obsolete or otherwise unmarketable inventory to its estimated net realizable value. The determination of obsolete or excess inventory requires management to make estimates based on assumptions about the future demand of our products, product expiration dates, estimated future sales and our general future plans. If customer demand subsequently differs from our forecasts, we may be required to record additional charges for excess inventory. Although we believe that the assumptions we use in estimating inventory write-downs are reasonable, no assurance can be given that significant future changes in these assumptions or changes in future events and market conditions could result in different estimates. During 2022 and 2021 we wrote-off excess inventory of $275.0 million and $120.0 million, respectively, related to ADUHELM.
IMPAIRMENT AND AMORTIZATION OF LONG-LIVED ASSETS Long-lived assets to be held and used include property, plant and equipment as well as intangible assets, including IPR&D and trademarks. Property, plant and equipment are reviewed for impairment whenever events or changes in circumstances indicate that the carrying amount of the assets may not be recoverable. We review our intangible assets with indefinite lives for impairment annually, as of October 31, and whenever events or changes in circumstances indicate that the carrying value of an asset may not be recoverable. When performing our impairment assessment, we calculate the fair value using the same methodology as described above under Acquired Intangible Assets, including IPR&D. If the carrying value of our acquired IPR&D exceeds its fair value, then the intangible asset is written down to its fair value. Changes in estimates and assumptions used in determining the fair value of our acquired IPR&D could result in an impairment. Impairments are recorded within amortization and impairment of acquired intangible assets in our consolidated statements of income. Based on our most recent impairment assessment we incurred impairment charges of approximately $119.6 million for the year ended December 31, 2022, mainly related to the discontinuation of IPR&D programs. For the year ended December 31, 2023, we had no impairment charges. For additional information on our impairments, please read Note 7, Intangible Assets and Goodwill, to our consolidated financial statements included in this report. Our most significant intangible assets are our acquired and in-licensed rights and patents. Acquired and in-licensed rights and patents primarily relate to our acquisition of all remaining rights to TYSABRI. We amortize the intangible assets related to our marketed products using the economic consumption method based on revenue generated from the products underlying the related intangible assets. An analysis of the anticipated lifetime revenue of our marketed products is performed annually during our long-range planning cycle and whenever events or changes in circumstances would significantly affect anticipated lifetime revenue of the relevant products. For additional information on the impairment charges related to our long-lived assets during 2023, 2022 and 2021, please read Note 7, Intangible Assets and Goodwill, to our consolidated financial statements included in this report. INCOME TAXES We prepare and file income tax returns based on our interpretation of each jurisdiction’s tax laws and regulations. In preparing our consolidated financial statements, we estimate our income tax liability in each of the jurisdictions in which we operate by estimating our actual current tax expense together with assessing temporary differences resulting from differing treatment of items for tax and financial reporting purposes. These differences result in deferred tax assets and liabilities, which are included in our consolidated balance sheets. Upon our election in the fourth quarter of 2018 to record deferred taxes for GILTI, we have included amounts related to GILTI taxes within temporary difference. Significant management judgment is required in assessing the realizability of our deferred tax assets. In performing this assessment, we consider whether it is more likely than not that some portion or all of the deferred tax assets will not be realized. The ultimate realization of deferred tax assets is dependent upon the generation of future taxable income during the periods in which those temporary differences become deductible. In making this determination, under the applicable financial accounting standards, we are allowed to consider the scheduled reversal of deferred tax liabilities, projected future taxable income and the effects of tax planning strategies. In the event that actual results differ from our estimates, we adjust our estimates in future periods and we may need to establish a valuation allowance, which could materially impact our consolidated financial position and results of operations. We account for uncertain tax positions using a “more likely than not” threshold for recognizing and resolving uncertain tax positions. We evaluate uncertain tax positions on a quarterly basis and consider various factors including, but not limited to, changes in tax law, the measurement of tax positions taken or expected to be taken in tax returns, the effective settlement of matters subject to audit, information obtained during in process audit activities and changes in facts or circumstances related to a tax position. We adjust the level of the liability to reflect any subsequent changes in the relevant facts surrounding the uncertain positions. Our liabilities for uncertain tax positions can be relieved only if the contingency becomes legally extinguished, through either payment to the taxing authority or the expiration of the statute of limitations, the recognition of the benefits associated with the position meet the “more likely than not” threshold or the liability becomes effectively settled through the examination process. We consider matters to be effectively settled once the taxing authority has completed all of its required or expected examination procedures, including all appeals and administrative reviews, we have no plans to appeal or litigate any aspect of the tax position and we believe that it is highly unlikely that the taxing authority would examine
or re-examine the related tax position. We also accrue for potential interest and penalties related to unrecognized tax benefits in income tax expense. BUSINESS COMBINATIONS Business combinations are recorded using the acquisition method of accounting. The results of operations of the acquired company are included in our results of operations beginning on the acquisition date, and assets acquired and liabilities assumed are recognized on the acquisition date at their respective fair values. Any excess of consideration transferred over the net carrying value of the assets acquired and liabilities assumed as of the acquisition date is recognized as goodwill. We use the multi-period excess earnings method, which is a form of the income approach, utilizing post-tax cash flow and discount rates in estimating the fair value of identifiable intangible assets acquired when allocating the purchase consideration paid for the acquisition. The estimates of the fair value of identifiable intangible assets involve significant judgment by management and include assumptions with measurement uncertainty, such as the amount and timing of projected cash flow, long-term sales forecasts, discount rates and additionally for IPR&D intangible assets, the timing and probability of regulatory and commercial success. We use the net realizable value method in estimating the fair value of acquired finished goods and work-in-process inventory. Raw materials acquired are valued using the replacement cost method. Transaction and restructuring costs related to business combinations are expensed as incurred. The fair value of assets acquired and liabilities assumed in certain cases may be subject to revision based on the final determination of fair value during a period of time not to exceed 12 months from the acquisition date. If we determine the assets acquired do not meet the definition of a business, the transaction will be accounted for as an asset acquisition rather than a business combination. ITEM 7A. QUANTITATIVE AND QUALITATIVE DISCLOSURES ABOUT MARKET RISK We are subject to certain risks that may affect our results of operations, cash flow and fair values of assets and liabilities, including volatility in foreign currency exchange rates, interest rate movements and equity price exposure as well as changes in economic conditions in the markets in which we operate as a result of the conflict between Russia and Ukraine and the military conflict in the Middle East. We manage the impact of foreign currency exchange rates and interest rates through various financial instruments, including derivative instruments such as foreign currency forward contracts, foreign currency options, interest rate lock contracts and interest rate swap contracts. We do not enter into financial instruments for trading or speculative purposes. The counterparties to these contracts are major financial institutions, and there is no significant concentration of exposure with any one counterparty. FOREIGN CURRENCY EXCHANGE RISK Our results of operations are subject to foreign currency exchange rate fluctuations due to the global nature of our operations. As a result, our consolidated financial position, results of operations and cash flow can be affected by market fluctuations in foreign currency exchange rates, primarily with respect to the Euro, British pound sterling, Canadian dollar and Swiss franc. While the financial results of our global activities are reported in U.S. dollars, the functional currency for most of our foreign subsidiaries is their respective local currency. Fluctuations in the foreign currency exchange rates of the countries in which we do business will affect our operating results, often in ways that are difficult to predict. In particular, as the U.S. dollar strengthens versus other currencies, the value of the non-U.S. revenue will decline when reported in U.S. dollars. The impact to net income as a result of a strengthening U.S. dollar will be partially mitigated by the value of non-U.S. expense, which will also decline when reported in U.S. dollars. As the U.S. dollar weakens versus other currencies, the value of the non-U.S. revenue and expense will increase when reported in U.S. dollars. We have established revenue and operating expense hedging and balance sheet risk management programs to protect against volatility of future foreign currency cash flow and changes in fair value caused by volatility in foreign currency exchange rates. During the second quarter of 2018 the International Practices Task Force of the Center for Audit Quality categorized Argentina as a country with a projected three-year cumulative inflation rate greater than 100.0%, which indicated that Argentina’s economy is highly inflationary. This categorization did not have a material impact on our results of operations or financial position as of December 31, 2023, and is not expected to have a material impact on our results of operations or financial position in the future. In December 2023 the Argentinian Peso experienced a substantial devaluation following a presidential election. The devaluation resulted in a $16.0 million charge recorded
during the fourth quarter of 2023 in other (income) expense, net within our consolidated statements of income for the year ended December 31, 2023. REVENUE AND OPERATING EXPENSE HEDGING PROGRAM Our foreign currency hedging program is designed to mitigate, over time, a portion of the impact resulting from volatility in exchange rate changes on revenue and operating expense. We use foreign currency forward contracts and foreign currency options to manage foreign currency risk, with the majority of our forward contracts and options used to hedge certain forecasted revenue and operating expense transactions denominated in foreign currencies in the next 12 months. We do not engage in currency speculation. For a more detailed disclosure of our revenue and operating expense hedging program, please read Note 10, Derivative Instruments, to our consolidated financial statements included in this report. Our ability to mitigate the impact of foreign currency exchange rate changes on revenue and net income diminishes as significant foreign currency exchange rate fluctuations are sustained over extended periods of time. In particular, devaluation or significant deterioration of foreign currency exchange rates are difficult to mitigate and likely to negatively impact earnings. The cash flow from these contracts are reported as operating activities in our consolidated statements of cash flow. BALANCE SHEET RISK MANAGEMENT HEDGING PROGRAM We also use forward contracts to mitigate the foreign currency exposure related to certain balance sheet items. The primary objective of our balance sheet risk management program is to mitigate the exposure of foreign currency denominated net monetary assets and liabilities of foreign affiliates. In these instances, we principally utilize currency forward contracts. We have not elected hedge accounting for the balance sheet related items. The cash flow from these contracts are reported as operating activities in our consolidated statements of cash flow. The following quantitative information includes the impact of currency movements on forward contracts used in our revenue, operating expense and balance sheet hedging programs. As of December 31, 2023 and 2022, a hypothetical adverse 10.0% movement in foreign currency exchange rates compared to the U.S. dollar across all maturities would result in a hypothetical decrease in the fair value of forward contracts of approximately $249.4 million and $293.7 million, respectively. The estimated fair value change was determined by measuring the impact of the hypothetical exchange rate movement on outstanding forward contracts. Our use of this methodology to quantify the market risk of such instruments is subject to assumptions and actual impact could be significantly different. The quantitative information about market risk is limited because it does not take into account all foreign currency operating transactions. INTEREST RATE RISK Our investment portfolio includes cash equivalents and short-term investments. The fair value of our marketable securities is subject to change as a result of potential changes in market interest rates. The potential change in fair value for interest rate sensitive instruments has been assessed on a hypothetical 100 basis point adverse movement across all maturities. As of December 31, 2022, we estimate that such hypothetical 100 basis point adverse movement would result in a hypothetical loss in fair value of approximately $11.7 million to our interest rate sensitive instruments. The fair values of our investments were determined using third-party pricing services or other market observable data. We partially funded our Reata acquisition through available cash, cash equivalents and marketable securities. As of December 31, 2023, we have sold all of our marketable debt securities. For additional information on our acquisition of Reata, please read Note 2, Acquisitions, to our consolidated financial statements included in this report.
CREDIT RISK Financial instruments that potentially subject us to concentrations of credit risk include cash and cash equivalents, investments, derivatives and accounts receivable. We attempt to minimize the risks related to cash and cash equivalents and investments by investing in a broad and diverse range of financial instruments. We have established guidelines related to credit ratings and maturities intended to safeguard principal balances and maintain liquidity. Our investment portfolio is maintained in accordance with our investment policy, which defines allowable investments, specifies credit quality standards and limits the credit exposure of any single issuer. We minimize credit risk resulting from derivative instruments by choosing only highly rated financial institutions as counterparties. We operate in certain countries where weakness in economic conditions, including the effects of the conflict between Russia and Ukraine and the military conflict in the Middle East, can result in extended collection periods. We continue to monitor these conditions, including the volatility associated with international economies and the relevant financial markets, and assess their possible impact on our business. To date, we have not experienced any significant losses with respect to the collection of our accounts receivable. We believe that our allowance for doubtful accounts was adequate as of December 31, 2023 and 2022. EQUITY PRICE RISK Our strategic investment portfolio includes investments in equity securities of certain biotechnology companies. While we are holding such securities, we are subject to equity price risk, and this may increase the volatility of our income in future periods due to changes in the fair value of equity investments. We may sell such equity securities based on our business considerations, which may include limiting our price risk. Changes in the fair value of these equity securities are impacted by the volatility of the stock market and changes in general economic conditions, among other factors. The potential change in fair value for equity price sensitive instruments has been assessed on a hypothetical 10.0% adverse movement. As of December 31, 2023 and 2022, a hypothetical adverse 10.0% movement would result in a hypothetical decrease in fair value of approximately $41.7 million and $79.1 million, respectively. ITEM 8. FINANCIAL STATEMENTS AND SUPPLEMENTARY DATA The information required by this Item 8 is contained on pages F-1 through F-85 of this report and is incorporated herein by reference. ITEM 9. CHANGES IN AND DISAGREEMENTS WITH ACCOUNTANTS ON ACCOUNTING AND FINANCIAL DISCLOSURE None. ITEM 9A. CONTROLS AND PROCEDURES DISCLOSURE CONTROLS AND PROCEDURES AND INTERNAL CONTROL OVER FINANCIAL REPORTING CONTROLS AND PROCEDURES We have carried out an evaluation, under the supervision and with the participation of our management, including our principal executive officer and principal financial officer, of the effectiveness of the design and operation of our disclosure controls and procedures (as defined in Rules 13a-15(e) or 15d-15(e) under the Securities Exchange Act of 1934, as amended), as of December 31, 2023. Based upon that evaluation, our principal executive officer and principal financial officer concluded that, as of the end of the period covered by this report, our disclosure controls and procedures are effective in ensuring that: (a) the information required to be disclosed by us in the reports that we file or submit under the Securities Exchange Act is recorded, processed, summarized and reported within the time periods specified in the U.S. Securities and Exchange Commission's rules and forms; and (b) such information is accumulated and communicated to our management, including our principal executive officer and principal financial officer, as appropriate to allow timely decisions regarding required disclosure.
In designing and evaluating our disclosure controls and procedures, our management recognized that any controls and procedures, no matter how well designed and operated, can provide only reasonable assurance of achieving the desired control objectives, and our management necessarily was required to apply its judgment in evaluating the cost-benefit relationship of possible controls and procedures. CHANGES IN INTERNAL CONTROL OVER FINANCIAL REPORTING There were no changes in our internal control over financial reporting during the quarter ended December 31, 2023, that have materially affected, or are reasonably likely to materially affect, our internal control over financial reporting. MANAGEMENT'S ANNUAL REPORT ON INTERNAL CONTROL OVER FINANCIAL REPORTING Our management is responsible for establishing and maintaining adequate internal control over our financial reporting. Internal control over financial reporting is defined in Rules 13a-15(f) and 15d-15(f) under the Securities Exchange Act as a process designed by, or under the supervision of, a company’s principal executive and principal financial officers and effected by a company’s board of directors, management and other personnel to provide reasonable assurance regarding the reliability of financial reporting and the preparation of financial statements for external purposes in accordance with U.S. GAAP. Our internal control over financial reporting includes those policies and procedures that: •pertain to the maintenance of records that, in reasonable detail, accurately and fairly reflect our transactions and dispositions of our assets; •provide reasonable assurance that transactions are recorded as necessary to permit preparation of financial statements in accordance with U.S. GAAP, and that our receipts and expenditures are being made only in accordance with authorizations of our management and directors; and •provide reasonable assurance regarding prevention or timely detection of unauthorized acquisition, use or disposition of our assets that could have a material effect on our financial statements. Because of its inherent limitations, internal control over financial reporting may not prevent or detect misstatements. Projections of any evaluation of effectiveness to future periods are subject to the risk that controls may become inadequate because of changes in conditions, or that the degree of compliance with the policies or procedures may deteriorate. Our management assessed the effectiveness of our internal control over financial reporting as of December 31, 2023. In making this assessment, management used the criteria set forth by the Committee of Sponsoring Organizations of the Treadway Commission (COSO) in its 2013 Internal Control — Integrated Framework. Based on our assessment, our management has concluded that, as of December 31, 2023, our internal control over financial reporting is effective based on those criteria. We excluded Reata from our assessment of internal control over financial reporting as of December 31, 2023, as Reata was acquired by our Company in a business combination during 2023. The total assets and total revenue of Reata represents 1.0% and 0.6%, respectively, of the related consolidated financial statement amounts as of and for the year ended December 31, 2023. The effectiveness of our internal control over financial reporting as of December 31, 2023, has been audited by PricewaterhouseCoopers LLP, an independent registered public accounting firm, as stated in their attestation report, which is included herein. ITEM 9B. OTHER INFORMATION RULE 10b5-1 TRADING ARRANGEMENTS From time to time, our officers (as defined in Rule 16a-1(f)) and directors may enter into Rule 10b5-1 or non-Rule 10b5-1 trading arrangements (as each such term is defined in Item 408 of Regulation S-K). During the fourth quarter of 2023 our officers and directors took the following actions with respect to 10b5-1 trading arrangements: | | | | | | | | | | | | | | | | | | | | | | | | | | | | | | | | | | | | | | | | | | | | | Trading Arrangement | | | | | | Name and Position | | Action | | Date | | Rule
10b5-1 | | Non-Rule 10b5-1 | | Total Shares to be Sold | | Expiration Date | | Robin Kramer (Senior Vice President, Chief Accounting Officer) | | Adopt | | 11/13/2023 | | X | | — | | 1,500 | | 11/10/2025 |
ITEM 9C. DISCLOSURE REGARDING FOREIGN JURISDICTIONS THAT PREVENT INSPECTIONS Not Applicable.
PART III ITEM 10. DIRECTORS, EXECUTIVE OFFICERS AND CORPORATE GOVERNANCE The information concerning our executive officers is set forth under the heading Information about our Executive Officers in Item 1 of this report. The text of our code of business conduct, which includes the code of ethics that applies to our principal executive officer, principal financial officer, principal accounting officer or controller, and persons performing similar functions, is posted on our website, www.biogen.com, under the “Corporate Governance” subsection of the “Investors” section of the site. We intend to make all required disclosures regarding any amendments to, or waivers from, provisions of our code of business conduct at the same location of our website. The response to the remainder of this item is incorporated by reference from the discussion responsive thereto in the sections entitled “Proposal 1 - Election of Directors,” “Corporate Governance” and “Miscellaneous - Stockholder Proposals” contained in the proxy statement for our 2024 annual meeting of stockholders. ITEM 11. EXECUTIVE COMPENSATION The response to this item is incorporated by reference from the discussion responsive thereto in the sections entitled “Executive Compensation Tables,” "Compensation Discussion and Analysis" and “Corporate Governance” contained in the proxy statement for our 2024 annual meeting of stockholders. ITEM 12. SECURITY OWNERSHIP OF CERTAIN BENEFICIAL OWNERS AND MANAGEMENT AND RELATED STOCKHOLDER MATTERS The response to this item is incorporated by reference from the discussion responsive thereto in the sections entitled “Stock Ownership” and “Equity Compensation Plan Information” contained in the proxy statement for our 2024 annual meeting of stockholders. ITEM 13. CERTAIN RELATIONSHIPS AND RELATED TRANSACTIONS, AND DIRECTOR INDEPENDENCE The response to this item is incorporated by reference from the discussion responsive thereto in the sections entitled “Certain Relationships and Related Person Transactions” and “Corporate Governance” contained in the proxy statement for our 2024 annual meeting of stockholders. ITEM 14. PRINCIPAL ACCOUNTANT FEES AND SERVICES The response to this item is incorporated by reference from the discussion responsive thereto in the section entitled “Proposal 2 - Ratification of the Selection of our Independent Registered Public Accounting Firm” contained in the proxy statement for our 2024 annual meeting of stockholders.
PART IV ITEM 15. EXHIBITS AND FINANCIAL STATEMENT SCHEDULES a. (1) Consolidated Financial Statements: The following financial statements are filed as part of this report: | | | | | | | | | | Financial Statements | | Page Number | | Consolidated Statements of Income | | F-2 | | Consolidated Statements of Comprehensive Income | | F-3 | | Consolidated Balance Sheets | | F-4 | | Consolidated Statements of Cash Flow | | F-5 | | Consolidated Statements of Equity | | F-6 | | Notes to Consolidated Financial Statements | | F-9 | | Report of Independent Registered Public Accounting Firm (PCAOB ID 238) | F-83 |
Certain totals may not sum due to rounding. (2) Exhibits The exhibits listed on the Exhibit Index beginning on page 98, which is incorporated herein by reference, are filed or furnished as part of this report or are incorporated into this report by reference. (3) Financial Statement Schedules Schedules are omitted because they are not applicable, or are not required, or because the information is included in the consolidated financial statements and notes thereto. ITEM 16. FORM 10-K SUMMARY Not applicable.
EXHIBIT INDEX | | | | | | | | | | Exhibit No. | | Description | | 2.1 | | | | 3.1 | | | | 3.2 | | | | 3.3 | | | | 3.4 | | | | 4.1 | | | | 4.2 | | | | 4.3 | | | | 4.4 | | | | 4.5 | | | | 4.6+ | | | | 10.1 | | | | 10.2 | | We review amounts capitalized as acquired IPR&D for impairment at least annually,Amendment to Credit Agreement, dated as of October 31,February 7, 2023, by and whenever events or changes in circumstances indicate to us that the carrying valueamong Biogen Inc., Bank of the assets might not be recoverable. Our most recent impairment assessmentAmerica, N.A., as of October 31, 2017, resulted in no impairments. Changes to clinical development plans, regulatory feedback received, life cycle management strategies and changes in program economics, including foreign currency exchange rates, are evaluated regularly. The field of developing treatments for forms of neuropathic pain, such as TGN, is highly competitive and can be affected by changes to expected market candidates and changes in timingadministrative agent, swing line lender and the clinical development of our product candidates. There can be no assurance that we will be able to successfully develop BIIB074 forL&C issuer, and the treatment of TGN or other indications, including our ability to confirm safety and efficacy based on data from clinical trials, or that a successfully developed therapy will be able to secure sufficient pricing in a competitive market. Changes in events and circumstances for these programs may have a material impact on the value of our related IPR&D.For additional information on the impairment and amortization of acquired intangible assets, including our TECFIDERA settlement and license agreement, please read Note 7, Intangible Assets and Goodwill,lenders party thereto. Filed as Exhibit 10.3 to our consolidated financial statements included in this report.
Acquired In-Process Research and Development
In May 2017 we completed an asset purchase of the Phase 3-ready candidate, BIIB093, from Remedy. In connection with the closing of this transaction, we made an upfront $120.0 million payment to Remedy, which was recorded as acquired in-process research and development in our consolidated statements of income as BIIB093 had not yet reached technological feasibility. For additional informationAnnual Report on our transaction with Remedy, please read Note 2, Acquisitions, to our consolidated financial statements included in this report.
Collaboration Profit (Loss) Sharing
Collaboration profit (loss) sharing includes our partner's 50% share of the profit or loss related to our biosimilars commercial agreement with Samsung Bioepis and our partner's 50% share of the co-promotion profits or losses in the E.U. and Canada related to our collaboration agreement with AbbVie on the commercialization of ZINBRYTA.
We began to recognize revenues on sales of biosimilars in the first quarter of 2016. For 2017 we shared collaboration profits and therefore recognized net expense of $111.0 million as compared to net expense of $15.1 million in the prior year comparative period. The increase in profit sharing expense for the comparative period was primarily due to increased collaboration profits resulting from increased biosimilar product sales.
We began to recognize revenues on sales of ZINBRYTA in the E.U. in the third quarter of 2016. For 2017 we recognized net expense of $1.3 million to reflect AbbVie's 50% sharing of the net collaboration profits in the E.U. and Canada as compared to net income recognized of $4.9 million in the prior year comparative period, to reflect AbbVie's 50% sharing of the net collaboration losses in the E.U. and Canada. The increase in profit sharing expense for the comparative period was primarily due to increased collaboration profits resulting from increased ZINBRYTA product sales.
We expect that the future sales growth of ZINBRYTA will be negatively impacted as a result of the EC approved restrictions on the use of ZINBRYTA. For additional information on our relationship with AbbVie, including information on the Article 20 Procedure of ZINBRYTA and resulting impairment of ZINBRYTA related assets, please read Note 20, Collaborative and Other Relationships, to our consolidated financial statements included in this report.
Loss (Gain) on Fair Value Remeasurement of Contingent Consideration
Consideration payable for certain of our business combinations includes future payments that are contingent upon the occurrence of a particular event or events. We record an obligation for such contingent consideration payments at fair value on the acquisition date. We then revalue our contingent consideration obligations each reporting period. Changes in the fair value of our contingent consideration obligations, other than changes due to payments, are recognized as a (gain) loss on fair value remeasurement of contingent consideration in our consolidated statements of income.
The loss on fair value remeasurement of contingent consideration for 2017 was primarily due to the increase in the probability of achieving certain developmental milestones based upon the progression of the underlying clinical programs.
The loss on fair value remeasurement of contingent consideration for 2016 was primarily due to changes in the probability of achieving certain developmental milestones based upon the progression of the underlying clinical programs and changes in the discount rate.
The loss on fair value remeasurement of contingent consideration for 2015 was primarily due to changes in the expected timing and probabilities of success related to the achievement of certain developmental milestones and in the discount rate.
Restructuring, Business Transformation and Other Cost Saving Initiatives
2017 Corporate Strategy
In July 2017 we announced an updated strategic framework to optimize the value of our MS business while investing for the future across our core growth areas of MS and neuroimmunology, AD and dementia, Parkinson’s disease and movement disorders and neuromuscular diseases including SMA and ALS. We also plan to invest in emerging growth areas such as pain, ophthalmology, neuropsychiatry and acute neurology.
We expect the continued performance of our commercial assets and the expiration of the contingent payments related to TECFIDERA, discussed further in the “Contractual Obligations and Off-Balance Sheet Arrangements” section of this report, to enable us to invest in and build an industry leading neuroscience pipeline. We view investment in growth as our top priority, but also recognize the value of opportunistically returning excess capital to shareholders through share repurchases.
In order to deliver positive results in the near term while investing in the next stages of our growth, we will focus on the following strategic priorities:
maximizing the resilience of our MS core business;
accelerating efforts in SMA as a significant new growth opportunity;
developing and expanding our neuroscience portfolio;
focusing our capital allocation efforts to drive investment for future growth; and
creating a leaner and simpler operating model to streamline our operations and reallocate resources towards prioritized research and development and commercial value creation opportunities.
In October 2017, in connection with creating a leaner and simpler operating model, we approved a corporate restructuring program intended to streamline our operations and reallocate resources. We expect to make total non-recurring operating and capital expenditures of up to $170.0 million, primarily in 2018, and our goal is to redirect resources of up to $400.0 million annually by 2020 to prioritized research and development and other value creation opportunities.
For the year ended December 31, 2017, we recognized charges in our consolidated statements of income totaling $19.4 million related to this effort, of which $18.5 million is included in selling, general and administrative expense and $0.9 million is reflected as restructuring charges. These restructuring charges, which were substantially incurred and paid in 2017, were primarily related to severance.
2016 Organizational Changes and Cost Saving Initiatives
2016 Restructuring Charges
During the third quarter of 2016 we initiated cost saving measures primarily intended to realign our organizational structure due to the changes in roles and workforce resulting from our decision to spin-off our hemophilia business, and to achieve further targeted cost reductions. For the year ended December 31, 2016, we recognized charges totaling $17.7 million related to this effort, which are in addition to, and separate from, the 2015 restructuring charges described below. These amounts, which were substantially incurred and paid by the end of 2016, were primarily related to severance and are reflected in restructuring charges in our consolidated statements of income.
Cambridge, MA Manufacturing Facility
In June 2016 following an evaluation of our current and future manufacturing capabilities and capacity needs, we determined that we intended to cease manufacturing and vacate our 67,000 square foot small-scale biologics manufacturing facility in Cambridge, MA and close and vacate our 46,000 square foot warehouse space in Somerville, MA.
In December 2016 we subleased our rights to the Cambridge, MA manufacturing facility to Brammer Bio MA, LLC (Brammer). Brammer also purchased from us certain manufacturing equipment, leasehold improvements and other assets in exchange for shares of Brammer common LLC interests and assumed manufacturing operations effective January 1, 2017. In December 2016 we closed and vacated our warehouse space in Somerville, MA.
Our departure from these facilities shortened the expected useful lives of certain leasehold improvements and other assets at these facilities. As a result, we recorded additional depreciation expense to reflect the assets' new shorter useful lives. For the year ended December 31, 2016, we recognized approximately $45.5 million of this additional depreciation, which was recorded as cost of sales in our consolidated statements of income.
In the fourth quarter of 2016 we also recognized charges totaling $7.4 million for severance costs related to certain employees separated from Biogen in connection with this transaction. These amounts were substantially incurred and paid by the end of first quarter of 2017 and are reflected in restructuring charges in our consolidated statements of income.
2015 Cost Saving Initiatives
2015 Restructuring Charges
In October 2015 we announced a corporate restructuring, which included the termination of certain pipeline programs and an 11% reduction in workforce. Under this restructuring, cash payments were estimated to total approximately $120.0 million, of which $15.9 million were related to previously accrued 2015 incentive compensation, resulting in net restructuring charges totaling approximately $102.0 million. These amounts were substantially paid by the end of 2016.
During the years ended December 31, 2016 and 2015, we recognized $8.0 million and $93.4 million, respectively, of restructuring charges related to our 2015 restructuring program in our consolidated statements of income. Our restructuring reserve is included in accrued expenses and other in our consolidated balance sheets.
The following table summarizes the charges and spending related to our 2015 restructuring program:
| | | | | | | | | | | | | | (In millions) | Workforce Reduction | | Pipeline Programs | | Total | | Restructuring reserve as of December 31, 2015 | $ | 33.7 |
| | $ | 3.6 |
| | $ | 37.3 |
| | Expense | 4.9 |
| | 5.4 |
| | 10.3 |
| | Payment | (31.2 | ) | | (9.0 | ) | | (40.2 | ) | | Adjustments to previous estimates, net | (5.2 | ) | | 2.9 |
| | (2.3 | ) | | Restructuring reserve as of December 31, 2016 | $ | 2.2 |
| | $ | 2.9 |
| | $ | 5.1 |
| | Payment | (1.7 | ) | | (2.9 | ) | | (4.6 | ) | | Restructuring reserve as of December 31, 2017 | $ | 0.5 |
| | $ | — |
| | $ | 0.5 |
|
TECFIDERA Litigation Settlement Charge
As described above under "Amortization of Acquired Intangible Assets - TECFIDERA License Rights,” in January 2017 we entered into a settlement and license agreement with Forward Pharma pursuant to which we obtained U.S. and rest of world licenses to Forward Pharma's intellectual property, including Forward Pharma's intellectual property related to TECFIDERA. In exchange, we paid Forward Pharma $1.25 billion in cash. During the fourth quarter of 2016, we recognized a pre-tax charge of $454.8 million and in the first quarter of 2017 we recognized an intangible asset of $795.2 million related to this agreement. The pre-tax charge recognized in the fourth quarter of 2016 represented the fair value of our licenses to Forward Pharma’s intellectual property for the period April 2014, when we started selling TECFIDERA, through December 31, 2016.
For additional information on our TECFIDERA settlement and license agreement, please read Note 7, Intangible Assets and Goodwill, to our consolidated financial statements included in this report.
Other Income (Expense), Net
For 2017 compared to 2016, the change in other income (expense), net was primarily due to an increase in foreign currency exchange gains, an increase in interest income and a decrease in interest expense, partially offset by other than temporary impairments recorded on strategic investments and marketable debt securities during the year.
Interest expenseForm 10-K for the year ended December 31, 2017, includes a net $5.2 million debt extinguishment charge recognized in November 2017 upon redemption2022.
| | 10.3 | | For additional information on this redemptionAugust 28, 2023, among Biogen Inc., JPMorgan Chase Bank N.S., as administrative agent and our outstanding indebtedness, please read Note 12, Indebtedness,the other lenders party thereto. Filed as Exhibit 10.1 to our consolidated financial statements included in this report.Current Report on Form 8-K filed on September 1, 2023.
| | 10.4† | | | | 10.5† | | Income Tax Provision
Our effective tax rate fluctuates from year to year due to the global nature of our operations. The factors that most significantly impact our effective tax rate include changes in tax laws, variability in the allocation of our taxable earnings among multiple jurisdictions, the amountLetter Agreement regarding GA101 financial terms between Biogen Idec Inc. and characterization of our research and development expenses, the levels of certain deductions and credits, acquisitions and licensing transactions.
Our effective tax rate for 2017 compared to 2016 increased primarily due to the effect of the 2017 Tax Act and the impairment of prepaid tax assets relatedGenentech, Inc., dated October 18, 2010. Filed as Exhibit 10.6 to our ZINBRYTA program.
On December 22, 2017, the 2017 Tax Act was signed into law and has resulted in significant changes to the U.S. corporate income tax system. The 2017 Tax Act includes a federal statutory rate reduction from 35% to 21%, the elimination or reduction of certain domestic deductions and credits, the Transition Toll Tax and other changes to taxation of foreign subsidiaries.
Changes in tax rates and tax laws are accountedAnnual Report on Form 10-K for in the period of enactment. Therefore, during the year ended December 31, 2010.
| | 10.6* | | | | 10.7* | |
TheBiogen Inc. 2017 Tax Act will provide us with flexibility in deploying our cash resources to advance our business interests. We expect that it will have a modest positive effect on our income tax rate in 2018 and a potential incremental benefit thereafter.
Article 20 Procedure of ZINBRYTA
As a result of the CHMP's recommendation of restrictions on the use of ZINBRYTA, we impaired prepaid tax balances totaling $142.6 million. Offsetting these amounts was an unrecorded tax benefit related to certain ZINBRYTA related assets totaling approximately $93.8 million. For additional information on the Article 20 Procedure of ZINBRYTA and resulting impairment of ZINBRYTA related assets, please read Note 20, Collaborative and Other Relationships,Omnibus Equity Plan. Filed as Exhibit 10.2 to our consolidated financial statements included in this report.
ExcludingQuarterly Report on Form 10-Q for the effectquarter ended June 30, 2017.
| | 10.8* | | Our effective tax rate for 2016 compared to 2015 increased primarily due to a net state tax benefit in 2015 of $27.0 million resulting from the remeasurement of one of our uncertain tax positions and a higher relative percentage of our earnings being attributed to the U.S., a higher tax jurisdiction.
Accounting for Uncertainty in Income Taxes
For additional information on our uncertain tax positions and income tax rate reconciliation for 2017, 2016 and 2015, please read Note 17, Income Taxes,Omnibus Equity Plan. Filed as Exhibit 10.3 to our consolidated financial statements included in this report.Quarterly Report on Form 10-Q for the quarter ended June 30, 2017.
| | 10.9* | | Equity in LossForm of Investee, Net of Tax
In February 2012 we entered into anperformance unit award agreement with Samsung Biologics, establishing an entity, Samsung Bioepis, to develop, manufacture and market biosimilar pharmaceuticals. We account for this investment under the equity method of accounting. We recognize our share of the results of operations relatedBiogen Inc. 2017 Omnibus Equity Plan. Filed as Exhibit 10.4 to our investment in Samsung Bioepis oneQuarterly Report on Form 10-Q for the quarter in arrears.ended June 30, 2017.
| | 10.10* | | For additional information on this transaction, please read Note 20, Collaborative and Other Relationships,Biogen Inc. 2017 Omnibus Equity Plan. Filed as Exhibit 10.5 to our consolidated financial statements included in this report.
Noncontrolling Interest
For 2017 compared to 2016,Quarterly Report on Form 10-Q for the change in net income (loss) attributable to noncontrolling interests, netquarter ended June 30, 2017.
| | 10.11* | | Under the amended agreement, we also have an option that will expire in April 2018 to further reduce our royalty rates payable on products developed under the agreement, including on potential commercial sales of aducanumab, by an additional 5% in exchange for a $50.0 million payment to Neurimmune.
For 2016 compared to 2015, the change in net income (loss) attributable to noncontrolling interests, net of tax, was primarily related to a $60.0 million pre-tax milestone payment made to Neurimmune in 2015.
For additional information on our collaboration arrangement with Neurimmune, please read Note 19, Investments in Variable Interest Entities,Biogen Inc. 2017 Omnibus Equity Plan. Filed as Exhibit 10.10 to our consolidated financial statements included in this report.
Financial Condition, Liquidity and Capital Resources
Our financial condition is summarized as follows:
| | | | | | | | | | | | | | As of December 31, | | % Change | | (In millions, except percentages) | 2017 | | 2016 | | 2017 compared to 2016 | | Financial assets: | | | | | | | Cash and cash equivalents | $ | 1,573.8 |
| | $ | 2,326.5 |
| | (32.4 | )% | | Marketable securities — current | 2,115.2 |
| | 2,568.6 |
| | (17.7 | )% | | Marketable securities — non-current | 3,057.3 |
| | 2,829.4 |
| | 8.1 | % | | Total cash, cash equivalents and marketable securities | $ | 6,746.3 |
| | $ | 7,724.5 |
| | (12.7 | )% | | Borrowings: | | | | | | | Current portion of notes payable and other financing arrangements | $ | 3.2 |
| | $ | 4.7 |
| | (31.9 | )% | | Notes payable and other financing arrangements | 5,935.0 |
| | 6,512.7 |
| | (8.9 | )% | | Total borrowings | $ | 5,938.2 |
| | $ | 6,517.4 |
| | (8.9 | )% | | Working Capital: | | | | | | | Current assets | $ | 7,873.3 |
| | $ | 8,732.2 |
| | (9.8 | )% | | Current liabilities | (3,368.2 | ) | | (3,419.9 | ) | | (1.5 | )% | | Total working capital | $ | 4,505.1 |
| | $ | 5,312.3 |
| | (15.2 | )% |
ForAnnual Report on Form 10-K for the year ended December 31, 2017, certain significant cash flows were as follows:
$4.6 billion in net cash flows provided by operating activities, net of:
| | ◦ | $1.1 billion in total net payments for income taxes;2017.
|
| 10.12* | | | | ◦ | $463.0 million in upfront and milestone payments to BMS, iPierian, Eisai, Alkermes and Ionis; and |
| | ◦ | $454.8 million payment made to Forward Pharma for the litigation settlement charge that was accrued as of December 31, 2016; |
$1.4 billion used for share repurchases;
$867.4 million used for purchases of property, plant and equipment;
$795.2 million payment made to Forward Pharma to license Forward Pharma's intellectual property, including Forward Pharma's intellectual property related to TECFIDERA;
$557.7 million payment made for the redemption of our 6.875% Senior Notes due March 1, 2018 prior to their maturity;
$302.7 million net cash contribution made in connection with the spin-off of our hemophilia business;
$295.0 million in upfront and milestone payments made to Remedy, Ionis and Samsung Bioepis; and
$132.4 million payment, net of tax, made to Neurimmune in exchange for a 15% reduction in royalty rates payable on products developedperformance stock units award agreement under the agreement, includingBiogen Inc. 2017 Omnibus Equity Plan. Filed as Exhibit 10.11 to our Annual Report on potential commercial sales of aducanumab.
ForForm 10-K for the year ended December 31, 2016, certain significant cash flows were2017.
| | 10.13* | | | | 10.14* | | | | 10.15* | | | | ◦ | $1.6 billion in total net payments for income taxes;
| | 10.16* | | |
| | ◦ | $75.0 million license fee payment made to Ionis; and |
| | ◦ | $20.0 million upfront payment to UPenn; |
$1.2 billion in contingent payments made to former shareholders of Fumapharm AG and holders of their rights;
$1.0 billion used for share repurchases;
| | | | | | | | | | Exhibit No. | | Description | | 10.17* | | $82.0 millionperformance stock units award agreement (cash settled) under the Biogen Inc. 2017 Omnibus Equity Plan (for grants commencing in milestone payments madeJuly 2019). Filed as Exhibit 10.3 to Samsung Bioepis and AbbVie.
Overview
We have historically financed our operating and capital expenditures primarily through cash flows earned through our operations. We expect to continue funding our current and planned operating requirements principally through our cash flows from operations, as well as our existing cash resources. We believe that our existing funds, when combined with cash generated from operations and our access to additional financing resources, if needed, are sufficient to satisfy our operating, working capital, strategic alliance, milestone payment, capital expenditure and debt service requirementsQuarterly Report on Form 10-Q for the foreseeable future. In addition, we may choosequarter ended June 30, 2019.
| | 10.18* | | Tax Reform
On December 22, 2017, the 2017 Tax Act was signed into law and has resulted in significant changes to the U.S. corporate income tax system.
The 2017 Tax Act eliminates the deferral of U.S. income taxour Annual Report on the historical unrepatriated earnings by imposing the Transition Toll Tax, which is a one-time mandatory deemed repatriation tax on undistributed foreign earnings. The Transition Toll Tax is assessed on the U.S. shareholder's share of the foreign corporation's accumulated foreign earnings that have not previously been taxed. Earnings in the form of cash and cash equivalents will be taxed at a rate of 15.5% and all other earnings will be taxed at a rate of 8.0%. As of December 31, 2017, we have accrued income tax liabilities of $989.6 million under the Transition Toll Tax, of which $78.3 million is expected to be paid within one year. The Transition Toll Tax will be paid over an eight-year period, starting in 2018, and will not accrue interest.
Of the total cash, cash equivalents and marketable securities at December 31, 2017, approximately $4.0 billion was generated in foreign
jurisdictions and may now be deployed with greater flexibility to advance our business interests.
For additional information on certain risks that could negatively impact our consolidated financial position or future results of operations, please read Item 1A. Risk Factors and Item 7A. Quantitative and Qualitative Disclosures About Market Risk included in this report.
Share Repurchase Programs
In July 2016 our Board of Directors authorized our 2016 Share Repurchase Program to repurchase up to $5.0 billion of our common stock. This authorization does not have an expiration date. All share repurchases under this authorization will be retired. Under this authorization, we repurchased and retired 3.7 million and 3.3 million shares of our common stock during the years ended December 31, 2017 and 2016, respectively, at a cost of $1.0 billionForm 10-K for each year. As of December 31, 2017, approximately $3.0 billion remains available for share repurchases under this authorization.
In May 2015 our Board of Directors authorized our 2015 Share Repurchase Program to repurchase up to $5.0 billion of our common stock. All share repurchases under this authorization were retired. Our 2015 Share Repurchase Program was completed as of December 31, 2015. Under this authorization, we repurchased and retired 16.8 million shares of our common stock at a cost of $5.0 billion during the year ended December 31, 2015.2022.
| | 10.19* | | | | 10.20* | | | | 10.21* | | | | 10.22* | | | | 10.23* | | | | 10.24* | | | | 10.25* | | Cash, Cash Equivalents and Marketable Securities
portfolio that limits the amount of exposure as to institution, maturity and investment type.
The net decrease in cash, cash equivalents and marketable securities atyear ended December 31, 2017, from2015.
| | 10.26* | | | | 10.27* | | | | 10.28* | | | | 10.29* | | | | 10.30* | | | | 10.31* | | | | 10.32*+ | | | | 10.33*+ | | | | 10.34* | | | | 10.35+ | | | | 10.36 | | | | 10.37 | | | | 21+ | | | | 23+ | | | | 31.1+ | | | | 31.2+ | | | | 32.1++ | | | | 97.1+ | | | | 101++ | | The following is a summary of our principal indebtedness as ofmaterials from Biogen Inc.’s Annual Report on Form 10-K for the year ended December 31, 2017:2023, formatted in iXBRL (Inline Extensible Business Reporting Language): (i) the Consolidated Statements of Income, (ii) the Consolidated Statements of Comprehensive Income, (iii) the Consolidated Balance Sheets, (iv) the Consolidated Statements of Cash Flow, (v) the Consolidated Statements of Equity and (vi) Notes to Consolidated Financial Statements. |
| | | | | | | * | Management contract or compensatory plan or arrangement. |
$1.5 billion aggregate principal amount | | | | | | | † | Confidential treatment has been granted or requested with respect to portions of 2.90% Senior Notes due September 15, 2020, valued at 99.792% of par;this exhibit. |
$1.0 billion aggregate principal amount of 3.625% Senior Notes due September 15, 2022, valued at 99.920% of par;
$1.75 billion aggregate principal amount of 4.05% Senior Notes due September 15, 2025, valued at 99.764% of par; and
$1.75 billion aggregate principal amount of 5.20% Senior Notes due September 15, 2045, valued at 99.294% of par.
These senior unsecured notes were issued at a discount and are amortized as additional interest expense over the period from issuance through maturity.
In November 2017 we redeemed our 6.875% Senior Notes due March 1, 2018, with an aggregate principal amount of $550.0 million. For additional information on this redemption please read Note 12, Indebtedness, to our consolidated financial statements included in this report.
During the third quarter of 2015, we entered into a $1.0 billion, five-year senior unsecured revolving credit facility under which we are permitted to draw funds for working capital and general corporate purposes. The terms of the revolving credit facility include a financial covenant that requires us not to exceed a maximum consolidated leverage ratio. As of December 31, 2017, we had no outstanding borrowings and were in compliance with all covenants under this facility.
In connection with our 2006 distribution agreement with Fumedica, we issued notes totaling 61.4 million Swiss Francs that are payable to Fumedica in varying amounts from June 2008 through June 2018. Our remaining note payable to Fumedica, payable in June 2018, had a carrying value of 3.1 million Swiss Francs ($3.2 million) and 6.2 million Swiss Francs ($6.0 million) as of December 31, 2017 and 2016, respectively.
For a summary of the fair values of our outstanding borrowings as of December 31, 2017 and 2016, please read Note 8, Fair Value Measurements, to our consolidated financial statements included in this report.
SIGNATURES Pursuant to the requirements of Section 13 or 15(d) of the Securities Exchange Act of 1934, the registrant has duly caused this report to be signed on its behalf by the undersigned, thereunto duly authorized. | | | | | | | BIOGEN INC. | | | | By: | Working Capital/S/ CHRISTOPHER A. VIEHBACHER
| | Christopher A. Viehbacher | | Chief Executive Officer |
Date: February 13, 2024
Pursuant to the requirements of the Securities Exchange Act of 1934, this report has been signed below by the following persons on behalf of the registrant and in the capacities and on the dates indicated. We define working capital as current assets less current liabilities. The change in working capital at December 31, 2017, from December 31, 2016, reflects a decrease in total current assets of $858.9 million, partially offset by a decrease in current liabilities of $51.7 million. | | | | | | | | | | | | | | | | Name | | Capacity | | Date | | | | | | /S/ CHRISTOPHER A. VIEHBACHER The decrease in total current assets was driven by a decrease in net cash, cash equivalents
| | Director and marketable securities, as described above, partially offset by an increase in accounts receivable due to an increase in revenuesChief Executive Officer (principal executive officer) | | February 13, 2024 | | Christopher A. Viehbacher | | | | | | | | /S/ MICHAEL R. MCDONNELL | | Executive Vice President and the timing of customer payments, including amounts due in connection with anti-CD20 therapeutic programs.Chief Financial Officer (principal financial officer) | | February 13, 2024 | | Michael R. McDonnell | | | | | | | | /S/ ROBIN C. KRAMER | | Senior Vice President, Chief Accounting Officer (principal accounting officer) | | February 13, 2024 | | Robin C. Kramer | | | | | | | | The decrease in total current liabilities primarily resulted from a reduction in taxes payable/S/ CAROLINE D. DORSA
| | Director and accrued expenses primarily due to the paymentChair of the $454.8 million charge that was accrued asBoard of December 31, 2016, in relationDirectors | | February 13, 2024 | | Caroline D. Dorsa | | | | | | | | /S/ MARIA C. FREIRE | | Director | | February 13, 2024 | | Maria C. Freire | | | | | | | | /S/ WILLIAM A. HAWKINS | | Director | | February 13, 2024 | | William A. Hawkins | | | | | | | | /S/ SUSAN LANGER | | Director | | February 13, 2024 | | Susan Langer | | | | | | | | /S/ JESUS B. MANTAS | | Director | | February 13, 2024 | | Jesus B. Mantas | | | | | | | | /S/ MONISH PATOLAWALA | | Director | | February 13, 2024 | | Monish Patolawala | | | | | | | | /S/ ERIC K. ROWINSKY | | Director | | February 13, 2024 | | Eric K. Rowinsky | | | | | | | | /S/ STEPHEN A. SHERWIN | | Director | | February 13, 2024 | | Stephen A. Sherwin | | |
BIOGEN INC. AND SUBSIDIARIES CONSOLIDATED FINANCIAL STATEMENTS | | | | | | | | | | | Page Number | | Consolidated Statements of Income | | F-2 | | Consolidated Statements of Comprehensive Income | | F-3 | | Consolidated Balance Sheets | | F-4 | | Consolidated Statements of Cash Flow | | F-5 | | Consolidated Statements of Equity | | F-6 | Notes to our settlement and license agreement with Forward Pharma, offset by an increase in the accrualConsolidated Financial Statements | | F-9 | Report of contingent payments related to FUMADERM and TECFIDERA (together, the Fumapharm Products) upon reaching $15.0 billion and $16.0 billion in total cumulative sales of Fumapharm Products in the fourth quarter of 2017.Cash Flows
The following table summarizes our cash flow activity:
| | | | | | | | | | | | | | | | | | | | | For the Years Ended December 31, | | % Change | | | 2017 compared to 2016 | | 2016 compared to 2015 | | (In millions, except percentages) | 2017 | | 2016 | | 2015 | | | Net cash flows provided by operating activities | $ | 4,551.0 |
| | $ | 4,587.2 |
| | $ | 3,919.4 |
| | (0.8 | )% | | 17.0 | % | | Net cash flows used in by investing activities | $ | (2,963.1 | ) | | $ | (2,484.8 | ) | | $ | (4,553.6 | ) | | 19.2 | % | | (45.4 | )% | | Net cash flows (used in) provided by financing activities | $ | (2,380.0 | ) | | $ | (1,052.6 | ) | | $ | 783.1 |
| | 126.1 | % | | (234.4 | )% |
Operating Activities
Cash flows from operating activities represent the cash receipts and disbursements related to all of our activities other than investing and financing activities. We expect cash provided from operating activities will continue to be our primary source of funds to finance operating needs and capital expenditures for the foreseeable future.
Operating cash flow is derived by adjusting our net income for:
Non-cash operating items such as depreciation and amortization, impairment charges, acquired in-process research and development and share-based compensation;
Changes in operating assets and liabilities which reflect timing differences between the receipt and payment of cash associated with transactions and when they are recognized in results of operations; and
Changes associated with the fair value of contingent payments associated with our acquisitions of businesses and payments related to collaborations.
For 2017 compared to 2016, net cash flows provided by operations were relatively consistent. Higher sales and lower income tax payments were offset by the $454.8 million payment related to our settlement and license agreement with Forward Pharma, which had been accrued as of December 31, 2016, and the timing of customer payments, including
amounts due in connection with anti-CD20 therapeutic programs.
Net income was lower in 2017, primarily due to the Transition Toll Tax under the 2017 Tax Act and higher depreciation and amortization.
For 2016 compared to 2015, the increase in cash provided by operating activities was primarily driven by higher net income, non-cash charges for depreciation and amortization, a comparative increase in accrued expenses and other liabilities, partially offset by a comparative increase in accounts receivable.
Investing Activities
For 2017 compared to 2016, the increase in net cash flows used in investing activities was primarily due to:
the $795.2 million payment made to Forward Pharma to license Forward Pharma's intellectual property, including Forward Pharma's intellectual property related to TECFIDERA;
an increase in purchases of property, plant and equipment primarily related to the construction of our Solothurn, Switzerland facility;
$175.0 million in milestone payments made to Ionis and Samsung Bioepis; and
the $120.0 million payment made to Remedy for the purchase of BIIB093.
These increases were partially offset by an increase in net proceeds of marketable securities.
For 2016 compared to 2015, the decrease in net cash flows used in investing activities was primarily due to a decrease in net purchases of marketable securities and cash paid for the acquisition of Convergence Pharmaceuticals (Convergence) in February 2015, partially offset by an increase in the contingent consideration related to the Fumapharm AG acquisition.
Financing Activities
For 2017 compared to 2016, the increase in net cash flows used in financing activities was primarily due to an increase in cash used for share repurchases, the payment made for the redemption of our 6.875% Senior Notes due March 1, 2018 prior to their maturity, the $302.7 million net cash contribution made in connection with the spin-off of our hemophilia business on February 1, 2017, and the net distributions to noncontrolling interest, including the payment made to Neurimmune in exchange for a 15% reduction in royalty rates payable on products developed under the agreement, including on potential commercial sales of aducanumab.
For 2016 compared to 2015, the decrease in net cash flows provided by financing activities was primarily due to the issuance of our senior unsecured notes issued in the third quarter of 2015, partially offset by a decrease in the purchases of common stock.
Contractual Obligations and Off-Balance Sheet Arrangements
Contractual Obligations
The following table summarizes our contractual obligations as of December 31, 2017, excluding amounts related to uncertain tax positions, funding commitments, contingent development, regulatory and commercial milestone payments, TYSABRI contingent payments and contingent consideration related to our business combinations, as described below.
| | | | | | | | | | | | | | | | | | | | | | | Payments Due by Period | | (In millions) | Total | | Less than 1 Year | | 1 to 3 Years | | 3 to 5 Years | | After 5 Years | | Non-cancellable operating leases (1), (2) | $ | 428.5 |
| | $ | 48.3 |
| | $ | 92.1 |
| | $ | 88.3 |
| | $ | 199.8 |
| | Long-term debt obligations (3) | 9,430.0 |
| | 244.8 |
| | 1,983.3 |
| | 1,396.3 |
| | 5,805.6 |
| | Purchase and other obligations (4) | 1,657.1 |
| | 637.3 |
| | 344.9 |
| | 234.6 |
| | 440.3 |
| | Defined benefit obligation | 91.8 |
| | — |
| | — |
| | — |
| | 91.8 |
| | Total contractual obligations | $ | 11,607.4 |
| | $ | 930.4 |
| | $ | 2,420.3 |
| | $ | 1,719.2 |
| | $ | 6,537.5 |
|
Independent Registered Public Accounting Firm (PCAOB ID 238)
| F-83 |
BIOGEN INC. AND SUBSIDIARIES CONSOLIDATED STATEMENTS OF INCOME (In millions, except per share amounts) | | | | | | | | | | | | | | | | | | | | | | | For the Years Ended December 31, | | | 2023 | | 2022 | | 2021 | | Revenue: | | | | | | | | Product revenue, net | | $ | 7,246.7 | | | $ | 7,987.8 | | | $ | 8,846.9 | | | Revenue from anti-CD20 therapeutic programs | | 1,689.6 | | | 1,700.5 | | | 1,658.5 | | | Contract manufacturing, royalty and other revenue | | 899.3 | | | 485.1 | | | 476.3 | | | Total revenue | | 9,835.6 | | | 10,173.4 | | | 10,981.7 | | | Cost and expense: | | | | | | | | Cost of sales, excluding amortization and impairment of acquired intangible assets | | 2,533.4 | | | 2,278.3 | | | 2,109.7 | | | Research and development | | 2,462.0 | | | 2,231.1 | | | 2,501.2 | | | Selling, general and administrative | | 2,549.7 | | | 2,403.6 | | | 2,674.3 | | | Amortization and impairment of acquired intangible assets | | 240.6 | | | 365.9 | | | 881.3 | | | Collaboration profit sharing/(loss reimbursement) | | 218.8 | | | (7.4) | | | 7.2 | | | | | | | | | | (Gain) loss on fair value remeasurement of contingent consideration | | — | | | (209.1) | | | (50.7) | | | Acquired in-process research and development | | — | | | — | | | 18.0 | | | Restructuring charges | | 218.8 | | | 131.1 | | | — | | | Gain on sale of building | | — | | | (503.7) | | | — | | | Other (income) expense, net | | 315.5 | | | (108.2) | | | 1,095.5 | | | Total cost and expense | | 8,538.8 | | | 6,581.6 | | | 9,236.5 | | | Income before income tax (benefit) expense and equity in loss of investee, net of tax | | 1,296.8 | | | 3,591.8 | | | 1,745.2 | | | Income tax (benefit) expense | | 135.3 | | | 632.8 | | | 52.5 | | | Equity in (income) loss of investee, net of tax | | — | | | (2.6) | | | (34.9) | | | Net income | | 1,161.5 | | | 2,961.6 | | | 1,727.6 | | | Net income (loss) attributable to noncontrolling interests, net of tax | | 0.4 | | | (85.3) | | | 171.5 | | | Net income attributable to Biogen Inc. | | $ | 1,161.1 | | | $ | 3,046.9 | | | $ | 1,556.1 | | | | | | | | | | Net income per share: | | | | | | | | Basic earnings per share attributable to Biogen Inc. | | $ | 8.02 | | | $ | 20.96 | | | $ | 10.44 | | | Diluted earnings per share attributable to Biogen Inc. | | $ | 7.97 | | | $ | 20.87 | | | $ | 10.40 | | | | | | | | | | Weighted-average shares used in calculating: | | | | | | | | Basic earnings per share attributable to Biogen Inc. | | 144.7 | | | 145.3 | | | 149.1 | | | Diluted earnings per share attributable to Biogen Inc. | | 145.6 | | | 146.0 | | | 149.6 | |
See accompanying notes to these consolidated financial statements.
BIOGEN INC. AND SUBSIDIARIES CONSOLIDATED STATEMENTS OF COMPREHENSIVE INCOME (In millions) | | | | | | | | | | | | | | | | | | | | | | | | For the Years Ended December 31, | | | | 2023 | | 2022 | | 2021 | | Net income attributable to Biogen Inc. | | $ | 1,161.1 | | | $ | 3,046.9 | | | $ | 1,556.1 | | | Other comprehensive income: | | | | | | | | Unrealized gains (losses) on securities available for sale, net of tax | | 15.7 | | | (13.5) | | | (3.6) | | | Unrealized gains (losses) on cash flow hedges, net of tax | | (40.1) | | | (38.7) | | | 232.8 | | | Gains (losses) on net investment hedges, net of tax | | — | | | (25.5) | | | 34.0 | | | Unrealized gains (losses) on pension benefit obligation, net of tax | | (1.5) | | | 43.7 | | | 21.5 | | | Currency translation adjustment | | 37.1 | | | (24.2) | | | (92.4) | | | Total other comprehensive income (loss), net of tax | | 11.2 | | | (58.2) | | | 192.3 | | | Comprehensive income (loss) attributable to Biogen Inc. | | 1,172.3 | | | 2,988.7 | | | 1,748.4 | | | Comprehensive income (loss) attributable to noncontrolling interests, net of tax | | 0.4 | | | (85.3) | | | 172.1 | | | Comprehensive income (loss) | | $ | 1,172.7 | | | $ | 2,903.4 | | | $ | 1,920.5 | |
See accompanying notes to these consolidated financial statements.
BIOGEN INC. AND SUBSIDIARIES CONSOLIDATED BALANCE SHEETS (In millions, except per share amounts) | | | | | | | | | | | | | As of December 31, | | 2023 | | 2022 | | ASSETS | | Current assets: | | | | | Cash and cash equivalents | $ | 1,049.9 | | | $ | 3,419.3 | | | Marketable securities | — | | | 1,473.5 | | | Accounts receivable, net of allowance for doubtful accounts of $2.4 and $2.3, respectively | 1,664.1 | | | 1,705.0 | | | Due from anti-CD20 therapeutic programs | 435.9 | | | 431.4 | | | Inventory | 2,527.4 | | | 1,344.4 | | | Other current assets | 1,182.0 | | | 1,417.6 | | | Total current assets | 6,859.3 | | | 9,791.2 | | | Marketable securities | — | | | 705.7 | | | Property, plant and equipment, net | 3,309.7 | | | 3,298.6 | | | Operating lease assets | 420.0 | | | 403.9 | | | Intangible assets, net | 8,363.0 | | | 1,850.1 | | | Goodwill | 6,219.2 | | | 5,749.0 | | | Deferred tax asset | 928.6 | | | 1,226.4 | | | Investments and other assets | 745.0 | | | 1,529.2 | | | Total assets | $ | 26,844.8 | | | $ | 24,554.1 | | | LIABILITIES AND EQUITY | | Current liabilities: | | | | | Current portion of term loan | $ | 150.0 | | | $ | — | | | Taxes payable | 257.4 | | | 259.9 | | | Accounts payable | 403.3 | | | 491.5 | | | Accrued expense and other | 2,623.6 | | | 2,521.4 | | | Total current liabilities | 3,434.3 | | | 3,272.8 | | | Notes payable and term loan | 6,788.2 | | | 6,281.0 | | | Deferred tax liability | 641.8 | | | 334.7 | | | Long-term operating lease liabilities | 400.0 | | | 333.0 | | | Other long-term liabilities | 781.1 | | | 944.2 | | | Total liabilities | 12,045.4 | | | 11,165.7 | | | Commitments, contingencies and guarantees (Notes 22 and 23) | | | | | Equity: | | | | | Biogen Inc. shareholders’ equity | | | | | Preferred stock, par value $0.001 per share | — | | | — | | | Common stock, par value $0.0005 per share | 0.1 | | | 0.1 | | | Additional paid-in capital | 302.5 | | | 73.3 | | | Accumulated other comprehensive income (loss) | (153.7) | | | (164.9) | | | Retained earnings | 17,627.6 | | | 16,466.5 | | | Treasury stock, at cost; 23.8 million and 23.8 million shares, respectively | (2,977.1) | | | (2,977.1) | | | Total Biogen Inc. shareholders’ equity | 14,799.4 | | | 13,397.9 | | | Noncontrolling interests | — | | | (9.5) | | | Total equity | 14,799.4 | | | 13,388.4 | | | Total liabilities and equity | $ | 26,844.8 | | | $ | 24,554.1 | |
See accompanying notes to these consolidated financial statements.
BIOGEN INC. AND SUBSIDIARIES CONSOLIDATED STATEMENTS OF CASH FLOW (In millions) | | | | | | | | | | | | | | | | | | | For the Years Ended December 31, | | | 2023 | | 2022 | | 2021 | | Cash flow from operating activities: | | | | | | | Net income | $ | 1,161.5 | | | $ | 2,961.6 | | | $ | 1,727.6 | | | Adjustments to reconcile net income to net cash flow from operating activities: | | | | | | | Depreciation and amortization | 494.8 | | | 518.4 | | | 487.7 | | | Impairment of intangible assets | — | | | 119.6 | | | 629.3 | | | Excess and obsolescence charges related to inventory | 124.4 | | | 336.2 | | | 167.6 | | | Amortization of inventory step-up | 31.5 | | | — | | | — | | | Acquired in-process research and development | — | | | — | | | 18.0 | | | Share-based compensation | 264.2 | | | 254.1 | | | 238.6 | | | Contingent consideration | — | | | (209.1) | | | (50.7) | | | Deferred income taxes | (305.8) | | | (168.6) | | | (426.8) | | | (Gain) loss on strategic investments | 277.1 | | | 265.9 | | | 826.8 | | | (Gain) loss on equity method investment | — | | | (2.6) | | | (34.9) | | | Gain on sale of equity interest in Samsung Bioepis | — | | | (1,505.4) | | | — | | | Gain on sale of building | — | | | (503.7) | | | — | | | Other | 148.2 | | | 208.2 | | | 202.2 | | | Changes in operating assets and liabilities, net of effects of business acquired: | | | | | | | Accounts receivable | 61.3 | | | (203.4) | | | 324.8 | | | Due from anti-CD20 therapeutic programs | (4.6) | | | (19.0) | | | 1.2 | | | Inventory | (130.9) | | | (320.2) | | | (462.4) | | | Accrued expense and other current liabilities | (201.6) | | | (113.4) | | | (95.4) | | | Income tax assets and liabilities | (299.0) | | | (142.3) | | | 230.8 | | | Other changes in operating assets and liabilities, net | (73.9) | | | (92.0) | | | (144.5) | | | Net cash flow provided by (used in) operating activities | 1,547.2 | | | 1,384.3 | | | 3,639.9 | | | Cash flow from investing activities: | | | | | | | Purchases of property, plant and equipment | (277.0) | | | (240.3) | | | (258.1) | | | Proceeds from sales and maturities of marketable securities | 7,380.8 | | | 3,671.0 | | | 3,405.4 | | | Purchases of marketable securities | (5,140.7) | | | (3,448.5) | | | (3,808.7) | | | Acquisition of Reata, net of cash acquired | (6,926.1) | | | — | | | — | | | Proceeds from sale of equity interest in Samsung Bioepis | 788.1 | | | 990.3 | | | — | | | Proceeds from sale of building | — | | | 582.6 | | | — | | | Proceeds from divestiture of Hillerød, Denmark manufacturing operations | — | | | — | | | 28.1 | | | Acquired in-process research and development | — | | | — | | | (18.0) | | | Acquisitions of intangible assets | (34.4) | | | (2.9) | | | (18.8) | | | Proceeds from sales of strategic investments | 119.6 | | | — | | | 93.5 | | | Other | (11.3) | | | 24.4 | | | 12.9 | | | Net cash flow provided by (used in) investing activities | (4,101.0) | | | 1,576.6 | | | (563.7) | | | Cash flow from financing activities: | | | | | | | Purchase of treasury stock | — | | | (750.0) | | | (1,800.0) | | | Payments related to issuance of stock for share-based compensation arrangements, net | (44.3) | | | (1.9) | | | (0.7) | | | Repayments of borrowings and premiums paid | (809.9) | | | (1,002.2) | | | (170.0) | | | Proceeds from borrowings | 997.2 | | | — | | | — | | | | | | | | | Net (distribution) contribution to noncontrolling interest | 12.3 | | | 12.4 | | | (94.4) | | | | | | | | | Other | (6.0) | | | (5.6) | | | (21.1) | | | Net cash flow provided by (used in) financing activities | 149.3 | | | (1,747.3) | | | (2,086.2) | | | Net increase (decrease) in cash and cash equivalents | (2,404.5) | | | 1,213.6 | | | 990.0 | | | Effect of exchange rate changes on cash and cash equivalents | 35.1 | | | (55.7) | | | (59.8) | | | Cash and cash equivalents, beginning of the year | 3,419.3 | | | 2,261.4 | | | 1,331.2 | | | Cash and cash equivalents, end of the year | $ | 1,049.9 | | | $ | 3,419.3 | | | $ | 2,261.4 | |
See accompanying notes to these consolidated financial statements.
BIOGEN INC. AND SUBSIDIARIES CONSOLIDATED STATEMENTS OF EQUITY (In millions) | | | | | | | | | | | | | | | | | | | | | | | | | | | | | | | | | | | | | | | | | | | | | | | | | | | | | | | | | | | | | | | | | | | | | | | | | | Preferred stock | | Common stock | | Additional
paid-in
capital | | Accumulated other comprehensive income (loss) | | Retained
earnings | | Treasury stock | | Total
Biogen Inc.
shareholders’
equity | | Noncontrolling
interests | | Total
equity | | | Shares | | Amount | | Shares | | Amount | | | | | Shares | | Amount | | | | | Balance, December 31, 2022 | — | | | $ | — | | | 167.9 | | | $ | 0.1 | | | $ | 73.3 | | | $ | (164.9) | | | $ | 16,466.5 | | | (23.8) | | | $ | (2,977.1) | | | $ | 13,397.9 | | | $ | (9.5) | | | $ | 13,388.4 | | | Net income | — | | | — | | | — | | | — | | | — | | | — | | | 1,161.1 | | | — | | | — | | | 1,161.1 | | | 0.4 | | | 1,161.5 | | | Other comprehensive income (loss), net of tax | — | | | — | | | — | | | — | | | — | | | 11.2 | | | — | | | — | | | — | | | 11.2 | | | — | | | 11.2 | | | Capital contribution from noncontrolling interest | — | | | — | | | — | | | — | | | — | | | — | | | — | | | — | | | — | | | — | | | 12.3 | | | 12.3 | | | Deconsolidation of noncontrolling interest | — | | | — | | | — | | | — | | | — | | | — | | | — | | | — | | | — | | | — | | | (3.2) | | | (3.2) | | | | | | | | | | | | | | | | | | | | | | | | | | | | | | | | | | | | | | | | | | | | | | | | | | | Issuance of common stock under stock option and stock purchase plans | — | | | — | | | 0.2 | | | — | | | 45.1 | | | — | | | — | | | — | | | — | | | 45.1 | | | — | | | 45.1 | | | Issuance of common stock under stock award plan | — | | | — | | | 0.6 | | | — | | | (89.5) | | | — | | | — | | | — | | | — | | | (89.5) | | | — | | | (89.5) | | | Compensation expense related to share-based payments | — | | | — | | | — | | | — | | | 274.4 | | | — | | | — | | | — | | | — | | | 274.4 | | | — | | | 274.4 | | | Other | — | | | — | | | — | | | — | | | (0.8) | | | — | | | — | | | — | | | — | | | (0.8) | | | — | | | (0.8) | | | Balance, December 31, 2023 | — | | | $ | — | | | 168.7 | | | $ | 0.1 | | | $ | 302.5 | | | $ | (153.7) | | | $ | 17,627.6 | | | (23.8) | | | $ | (2,977.1) | | | $ | 14,799.4 | | | $ | — | | | $ | 14,799.4 | |
See accompanying notes to these consolidated financial statements.
BIOGEN INC. AND SUBSIDIARIES CONSOLIDATED STATEMENTS OF EQUITY - (Continued) (In millions) | | | | | | | | | | | | | | | | | | | | | | | | | | | | | | | | | | | | | | | | | | | | | | | | | | | | | | | | | | | | | | | | | | | | | | | | | | Preferred stock | | Common stock | | Additional
paid-in
capital | | Accumulated other comprehensive income (loss) | | Retained
earnings | | Treasury stock | | Total
Biogen Inc.
shareholders’
equity | | Noncontrolling
interests | | Total
equity | | Shares | | Amount | | Shares | | Amount | | | | | Shares | | Amount | | | | | Balance, December 31, 2021 | — | | | $ | — | | | 170.8 | | | $ | 0.1 | | | $ | 68.2 | | | $ | (106.7) | | | $ | 13,911.7 | | | (23.8) | | | $ | (2,977.1) | | | $ | 10,896.2 | | | $ | 63.5 | | | $ | 10,959.7 | | | Net income | — | | | — | | | — | | | — | | | — | | | — | | | 3,046.9 | | | — | | | — | | | 3,046.9 | | | (85.3) | | | 2,961.6 | | | Other comprehensive income (loss), net of tax | — | | | — | | | — | | | — | | | — | | | (58.2) | | | — | | | — | | | — | | | (58.2) | | | — | | | (58.2) | | | | | | | | | | | | | | | | | | | | | | | | | | | Capital contribution from noncontrolling interest | — | | | — | | | — | | | — | | | — | | | — | | | — | | | — | | | — | | | — | | | 12.3 | | | 12.3 | | | Repurchase of common stock pursuant to the 2020 Share Repurchase Program, at cost | — | | | — | | | — | | | — | | | — | | | — | | | — | | | (3.6) | | | (750.0) | | | (750.0) | | | — | | | (750.0) | | | Retirement of common stock pursuant to the 2020 Share Repurchase Program, at cost | — | | | — | | | (3.6) | | | — | | | (257.9) | | | — | | | (492.1) | | | 3.6 | | | 750.0 | | | — | | | — | | | — | | | Issuance of common stock under stock option and stock purchase plans | — | | | — | | | 0.2 | | | — | | | 44.2 | | | — | | | — | | | — | | | — | | | 44.2 | | | — | | | 44.2 | | | Issuance of common stock under stock award plan | — | | | — | | | 0.5 | | | — | | | (46.0) | | | — | | | — | | | — | | | — | | | (46.0) | | | — | | | (46.0) | | | Compensation expense related to share-based payments | — | | | — | | | — | | | — | | | 263.5 | | | — | | | — | | | — | | | — | | | 263.5 | | | — | | | 263.5 | | | Other | — | | | — | | | — | | | — | | | 1.3 | | | — | | | — | | | — | | | — | | | 1.3 | | | — | | | 1.3 | | | Balance, December 31, 2022 | — | | | $ | — | | | 167.9 | | | $ | 0.1 | | | $ | 73.3 | | | $ | (164.9) | | | $ | 16,466.5 | | | (23.8) | | | $ | (2,977.1) | | | $ | 13,397.9 | | | $ | (9.5) | | | $ | 13,388.4 | |
See accompanying notes to these consolidated financial statements.
BIOGEN INC. AND SUBSIDIARIES CONSOLIDATED STATEMENTS OF EQUITY - (Continued) (In millions) | | | | | | | | | | | | | | | | | | | | | | | | | | | | | | | | | | | | | | | | | | | | | | | | | | | | | | | | | | | | | | | | | | | | | | | | | Preferred stock | | Common stock | | Additional
paid-in
capital | | Accumulated other comprehensive income (loss) | | Retained
earnings | | Treasury stock | | Total
Biogen Inc.
shareholders’
equity | | Noncontrolling
interests | | Total
equity | | Shares | | Amount | | Shares | | Amount | | | | | Shares | | Amount | | | | | Balance, December 31, 2020 | — | | | $ | — | | | 176.2 | | | $ | 0.1 | | | $ | — | | | $ | (299.0) | | | $ | 13,976.3 | | | (23.8) | | | $ | (2,977.1) | | | $ | 10,700.3 | | | $ | (14.2) | | | $ | 10,686.1 | | | Net income | — | | | — | | | — | | | — | | | — | | | — | | | 1,556.1 | | | — | | | — | | | 1,556.1 | | | 171.5 | | | 1,727.6 | | | Other comprehensive income (loss), net of tax | — | | | — | | | — | | | — | | | — | | | 192.3 | | | — | | | — | | | — | | | 192.3 | | | 0.6 | | | 192.9 | | | Distribution to noncontrolling interest | — | | | — | | | — | | | — | | | — | | | — | | | — | | | — | | | — | | | — | | | (100.0) | | | (100.0) | | | Capital contribution from noncontrolling interest | — | | | — | | | — | | | — | | | — | | | — | | | — | | | — | | | — | | | — | | | 5.6 | | | 5.6 | | | Repurchase of common stock pursuant to the 2020 Share Repurchase Program, at cost | — | | | — | | | — | | | — | | | — | | | — | | | — | | | (6.0) | | | (1,800.0) | | | (1,800.0) | | | — | | | (1,800.0) | | | Retirement of common stock pursuant to the 2020 Share Repurchase Program, at cost | — | | | — | | | (6.0) | | | — | | | (231.9) | | | — | | | (1,568.1) | | | 6.0 | | | 1,800.0 | | | — | | | — | | | — | | | Issuance of common stock under stock option and stock purchase plans | — | | | — | | | 0.2 | | | — | | | 54.4 | | | — | | | — | | | — | | | — | | | 54.4 | | | — | | | 54.4 | | | Issuance of common stock under stock award plan | — | | | — | | | 0.4 | | | — | | | (2.4) | | | — | | | (52.6) | | | — | | | — | | | (55.0) | | | — | | | (55.0) | | | Compensation expense related to share-based payments | — | | | — | | | — | | | — | | | 246.6 | | | — | | | — | | | — | | | — | | | 246.6 | | | — | | | 246.6 | | | Other | — | | | — | | | — | | | — | | | 1.5 | | | — | | | — | | | — | | | — | | | 1.5 | | | — | | | 1.5 | | | Balance, December 31, 2021 | — | | | $ | — | | | 170.8 | | | $ | 0.1 | | | $ | 68.2 | | | $ | (106.7) | | | $ | 13,911.7 | | | (23.8) | | | $ | (2,977.1) | | | $ | 10,896.2 | | | $ | 63.5 | | | $ | 10,959.7 | |
See accompanying notes to these consolidated financial statements.
BIOGEN INC. AND SUBSIDIARIES NOTES TO CONSOLIDATED FINANCIAL STATEMENTS
| | | | | | | Note 1: | | (1) | We lease properties and equipment for use in our operations. Amounts reflected within the table above detail future minimum rental commitments under non-cancelable operating leases as of December 31 for each of the periods presented. In addition to the minimum rental commitments, these leases may require us to pay additional amounts for taxes, insurance, maintenance and other operating expenses. |
| | (2) | Obligations are presented net of sublease income expected to be received for the vacated small-scale biologics manufacturing facility in Cambridge, MA, the vacated portion of our Weston, MA facility and other facilities throughout the world. |
| | (3) | Long-term debt obligations are primarily related to our Senior Notes, including principal and interest payments. |
| | (4) | Purchase and other obligations primarily includes our obligations to purchase direct materials, $989.6 million related to our current estimate of the impact of the 2017 Tax Act, $270.0 million in contractual commitments for the construction of our large-scale biologics manufacturing facility in Solothurn, Switzerland and $111.3 million related to the fair value of net liabilities on derivative contracts.
|
TYSABRI Contingent Payments
In 2013 we acquired from Elan full ownership of all remaining rights to TYSABRI that we did not already own or control. Under the acquisition agreement, we are obligated to make contingent payments to Elan of 18% on annual worldwide net sales up to $2.0 billion and 25% on annual worldwide net sales that exceed $2.0 billion. Royalty payments to Elan and other third parties are recognized as cost of sales in our consolidated statements of income. Elan was acquired by Perrigo Company plc (Perrigo) in December 2013, and Perrigo subsequently sold its rights to these payments to a third party effective January 2017.
Contingent Consideration related to Business Combinations
In connection with our acquisitions of Convergence, Stromedix, Inc. (Stromedix) and Biogen International Neuroscience GmbH (BIN), we agreed to make additional payments based upon the achievement of certain milestone events.
As the acquisitions of Convergence, Stromedix and BIN occurred after January 1, 2009, we recorded the contingent consideration liabilities associated with these transactions at their fair value on the
acquisition date and revalue these obligations each reporting period. We may pay up to approximately $1.1 billion in remaining milestones related to these acquisitions. For additional information on our acquisition of Convergence please read Note 2, Acquisitions, to our consolidated financial statements included in this report.
Fumapharm AG
In 2006 we acquired Fumapharm AG. As part of this acquisition we acquired FUMADERM and TECFIDERA (together, Fumapharm Products). We are required to make contingent payments to the former shareholders of Fumapharm AG or holders of their rights based on the attainment of certain cumulative sales levels of Fumapharm Products and the level of total net sales of Fumapharm Products in the prior 12-month period, as defined in the acquisition agreement.
During 2017 we paid $1.2 billion in contingent payments as we reached the $11.0 billion, $12.0 billion, $13.0 billion and $14.0 billion cumulative sales levels related to the Fumapharm Products in the fourth quarter of 2016 and the first, second and third quarters of 2017, respectively, and accrued $600.0 million upon reaching $15.0 billion and $16.0 billion in total cumulative sales of Fumapharm Products in the fourth quarter of 2017.
We will owe an additional $300.0 million contingent payment for every additional $1.0 billion in cumulative sales level of Fumapharm Products reached if the prior 12 months sales of the Fumapharm Products exceed $3.0 billion, until such time as the cumulative sales level reaches $20.0 billion, at which time no further contingent payments shall be due. If the prior 12 months sales of Fumapharm Products are less than $3.0 billion, contingent payments remain payable on a decreasing tiered basis. These payments will be accounted for as an increase to goodwill as incurred, in accordance with the accounting standard applicable to business combinations when we acquired Fumapharm. Any portion of the payment that is tax deductible will be recorded as a reduction to goodwill. Payments are due within 60 days following the end of the quarter in which the applicable cumulative sales level has been reached.
Contingent Development, Regulatory and Commercial Milestone Payments
Based on our development plans as of December 31, 2017, we could make potential future milestone payments to third parties of up to approximately $4.2 billion, including approximately $0.7 billion in development milestones, approximately $1.5 billion in regulatory milestones and approximately $2.0 billion in commercial milestones
as part of our various collaborations, including licensing and development programs. Payments under these agreements generally become due and payable upon achievement of certain development, regulatory or commercial milestones. Because the achievement of these milestones was not considered probable as of December 31, 2017, such contingencies have not been recorded in our financial statements. Amounts related to contingent milestone payments are not considered contractual obligations as they are contingent on the successful achievement of certain development, regulatory approval and commercial milestones.
Provided various development, regulatory or commercial milestones are achieved, we anticipate that we may pay approximately $110.0 million of milestone payments in 2018.
Other Funding Commitments
As of December 31, 2017, we have several on-going clinical studies in various clinical trial stages. Our most significant clinical trial expenditures are to CROs. The contracts with CROs are generally cancellable, with notice, at our option. We have recorded accrued expenses of approximately $40.0 million in our consolidated balance sheet for expenditures incurred by CROs as of December 31, 2017. We have approximately $460.0 million in cancellable future commitments based on existing CRO contracts as of December 31, 2017.
Tax Related Obligations
We exclude liabilities pertaining to uncertain tax positions from our summary of contractual obligations as we cannot make a reliable estimate of the period of cash settlement with the respective taxing authorities. As of December 31, 2017, we have approximately $77.3 million of net liabilities associated with uncertain tax positions.
As of December 31, 2017, we have accrued income tax liabilities of $989.6 million under the Transition Toll Tax, of which $78.3 million is expected to be paid within one year. The Transition Toll Tax will be paid over an eight-year period, starting in 2018, and will not accrue interest.
Other Off-Balance Sheet Arrangements
We do not have any relationships with entities often referred to as structured finance or special purpose entities that were established for the purpose of facilitating off-balance sheet arrangements. As such, we are not exposed to any financing, liquidity, market or credit risk that could arise if we had engaged in such relationships. We consolidate variable interest entities if we are the primary beneficiary.
Legal Matters
For a discussion of legal matters as of December 31, 2017, please read Note 21, Litigation, to our consolidated financial statements included in this report.
Critical Accounting Estimates
The preparation of our consolidated financial statements, which have been prepared in accordance with accounting principles generally accepted in the U.S. (U.S. GAAP), requires us to make estimates, judgments and assumptions that may affect the reported amounts of assets, liabilities, equity, revenues and expenses and related disclosure of contingent assets and liabilities. On an on-going basis we evaluate our estimates, judgments and methodologies. We base our estimates on historical experience and on various other assumptions that we believe are reasonable, the results of which form the basis for making judgments about the carrying values of assets, liabilities and equity and the amount of revenues and expenses. Actual results may differ from these estimates under different assumptions or conditions. Other significant accounting policies are outlined in Note 1, Summary of Significant Accounting Policies, to our consolidated financial statements included in this report.
|
References in these notes to "Biogen," the "company," "we," "us" and "our" refer to Biogen Inc. and its consolidated subsidiaries. Business Overview Biogen is a global biopharmaceutical company focused on discovering, developing and delivering innovative therapies for people living with serious and complex diseases worldwide. We have a broad portfolio of medicines to treat MS, have introduced the first approved treatment for SMA, co-developed treatments to address a defining pathology of Alzheimer’s disease and launched the first approved treatment to target a genetic cause of ALS. Through our 2023 acquisition of Reata we market the first and only drug approved in the U.S. and the E.U. for the treatment of Friedreich's Ataxia in adults and adolescents aged 16 years and older. We are focused on advancing our pipeline in neurology, specialized immunology and rare diseases. We support our drug discovery and development efforts through internal research and development programs and external collaborations. Our marketed products include TECFIDERA, VUMERITY, AVONEX, PLEGRIDY, TYSABRI and FAMPYRA for the treatment of MS; SPINRAZA for the treatment of SMA; SKYCLARYS for the treatment of Friedreich's Ataxia; QALSODY for the treatment of ALS; and FUMADERM for the treatment of severe plaque psoriasis. We also have collaborations with Eisai on the commercialization of LEQEMBI for the treatment of Alzheimer's disease and Sage on the commercialization of ZURZUVAE for the treatment of PPD and we have certain business and financial rights with respect to RITUXAN for the treatment of non-Hodgkin's lymphoma, CLL and other conditions; RITUXAN HYCELA for the treatment of non-Hodgkin's lymphoma and CLL; GAZYVA for the treatment of CLL and follicular lymphoma; OCREVUS for the treatment of PPMS and RMS; LUNSUMIO for the treatment of relapsed or refractory follicular lymphoma; COLUMVI, a bispecific antibody for the treatment of non-Hodgkin's lymphoma; and have the option to add other potential anti-CD20 therapies, pursuant to our collaboration arrangements with Genentech, a wholly-owned member of the Roche Group. We commercialize a portfolio of biosimilars of advanced biologics including BENEPALI, an etanercept biosimilar referencing ENBREL, IMRALDI, an adalimumab biosimilar referencing HUMIRA, and FLIXABI, an infliximab biosimilar referencing REMICADE, in certain countries in Europe, as well as BYOOVIZ, a ranibizumab biosimilar referencing LUCENTIS, in the U.S. and certain international markets. We also have exclusive rights to commercialize TOFIDENCE, a tocilizumab biosimilar referencing ACTEMRA. We continue to develop potential biosimilar product SB15, a proposed aflibercept biosimilar referencing EYLEA. For additional information on our collaboration arrangements, please read Note 19, Collaborative and Other Relationships, to our consolidated financial statements included in this report. Consolidation Our consolidated financial statements reflect our financial statements, those of our wholly-owned subsidiaries and variable interest entities where we are the primary beneficiary. For consolidated entities where we own or are exposed to less than 100.0% of the economics, we record net income (loss) attributable to noncontrolling interests, net of tax in our consolidated statements of income equal to the percentage of the economic or ownership interest retained in such entities by the respective noncontrolling parties. Intercompany balances and transactions are eliminated in consolidation. In determining whether we are the primary beneficiary of a variable interest entity, we apply a qualitative approach that determines whether we have both (1) the power to direct the economically significant activities of the entity and (2) the obligation to absorb losses of, or the right to receive benefits from, the entity that could potentially be significant to that entity. We continuously assess whether we are the primary beneficiary of a variable interest entity as changes to existing relationships or future transactions may result in us consolidating or deconsolidating one or more of our collaborators or partners. In November 2023 we terminated the Neurimmune Agreement, which resulted in the deconsolidation of our variable interest entity, Neurimmune. Use of Estimates The preparation of our consolidated financial statements requires us to make estimates, judgments and assumptions that may affect the reported amounts of assets, liabilities, equity, revenue and expense and related
BIOGEN INC. AND SUBSIDIARIES NOTES TO CONSOLIDATED FINANCIAL STATEMENTS — (Continued) disclosure of contingent assets and liabilities. On an ongoing basis we evaluate our estimates, judgments and assumptions. We base our estimates on historical experience and on various other assumptions that we believe are reasonable, the results of which form the basis for making judgments about the carrying values of assets, liabilities and equity and the amount of revenue and expense. Actual results may differ from these estimates. Revenue Recognition We recognize revenue when our customer obtains control of promised goods or services, in an amount that reflects the consideration which we expect to receive in exchange for those goods or services. We recognize revenue following the five-step model prescribed under FASB ASC 606, Revenue from Contracts with Customers: (i) identify contract(s) with a customer; (ii) identify the performance obligations in the contract; (iii) determine the transaction price; (iv) allocate the transaction price to the performance obligations in the contract; and (v) recognize revenue when (or as) we satisfy the performance obligations. Product Revenue In the U.S., we sell our products primarily to wholesale and specialty distributors and specialty pharmacies. In other countries, we sell our products primarily to wholesale distributors, hospitals, pharmacies and other third-party distribution partners. These customers subsequently resell our products to health care providers and patients. In addition, we enter into arrangements with health care providers and payors that provide for government-mandated or privately-negotiated discounts and allowances related to our products. Product revenue is recognized when the customer obtains control of our product, which occurs at a point in time, typically upon delivery to the customer. We expense incremental costs of obtaining a contract as and when incurred if the expected amortization period of the asset that we would have recognized is one year or less or the amount is immaterial. Reserves for Discounts and Allowances Product revenue is recorded net of reserves established for applicable discounts and allowances that are offered within contracts with our customers, health care providers or payors, including those associated with the implementation of pricing actions in certain of the international markets in which we operate. Product revenue reserves, which are classified as a reduction in product revenue, are generally characterized in the following categories: discounts, contractual adjustments and returns. These reserves are based on estimates of the amounts earned or to be claimed on the related sales and are classified as reductions of accounts receivable (if the amount is payable to our customer) or a liability (if the amount is payable to a party other than our customer). Our estimates of reserves established for variable consideration are calculated based upon a consistent application of our methodology utilizing the expected value method. These estimates reflect our historical experience, current contractual and statutory requirements, specific known market events and trends, industry data and forecasted customer buying and payment patterns. The transaction price, which includes variable consideration reflecting the impact of discounts and allowances, may be subject to constraint and is included in the net sales price only to the extent that it is probable that a significant reversal of the amount of the cumulative revenue recognized will not occur in a future period. Actual amounts may ultimately differ from our estimates. If actual results vary, we adjust these estimates, which could have an effect on earnings in the period of adjustment. Discounts include trade term discounts and wholesaler incentives. Trade term discounts and wholesaler incentives primarily relate to estimated obligations for credits to be granted to wholesalers for remitting payment on their purchases within established incentive periods and credits to be granted to wholesalers for compliance with various contractually-defined inventory management practices, respectively. We determine these reserves based on our historical experience, including the timing of customer payments. Contractual adjustments primarily relate to Medicaid and managed care rebates in the U.S., pharmacy rebates, co-payment (copay) assistance, VA and PHS discounts, specialty pharmacy program fees and other governmental rebates or applicable allowances. •Medicaid rebates: relate to our estimated obligations to states under established reimbursement arrangements. Rebate accruals are recorded in the same period the related revenue is recognized, resulting in a reduction of product revenue and the establishment of a liability which is included in accrued expense and other current liabilities in our consolidated balance sheets. Our liability for Medicaid rebates consists of estimates for claims
BIOGEN INC. AND SUBSIDIARIES NOTES TO CONSOLIDATED FINANCIAL STATEMENTS — (Continued) that a state will make for the current quarter, claims for prior quarters that have been estimated for which an invoice has not been received, invoices received for claims from the prior quarters that have not been paid and an estimate of potential claims that will be made for inventory that exists in the distribution channel at period end. •Governmental rebates: or chargebacks, including VA and PHS discounts, represent our estimated obligations resulting from contractual commitments to sell products to qualified healthcare providers at prices lower than the list prices we charge to wholesalers which provide those products. The wholesaler charges us for the difference between what the wholesaler pays for the products and the ultimate selling price to the qualified healthcare providers. Rebate and chargeback reserves are established in the same period as the related revenue is recognized, resulting in a reduction of product revenue and a reduction in the net accounts receivable. Chargeback amounts are generally determined at the time of resale to the qualified healthcare provider from the wholesaler, and we generally issue credits for such amounts within a few weeks of the wholesaler notifying us about the resale. Our reserves for VA, PHS and other chargebacks consist of amounts for inventory that exists at the wholesalers that we expect will be sold to qualified healthcare providers and chargebacks that wholesalers have claimed for which we have not issued a credit. •Managed care rebates: represent our estimated obligations to third-parties, primarily pharmacy benefit managers. Rebate accruals are recorded in the same period the related revenue is recognized, resulting in a reduction of product revenue and the establishment of a liability which is included in accrued expense and other current liabilities in our consolidated balance sheets. These rebates result from performance-based goals, formulary position and price increase limit allowances (price protection). The calculation of the accrual for these rebates is based on an estimate of the coverage patterns and the resulting applicable contractual rebate rate(s) to be earned over a contractual period. •Copay assistance: represents financial assistance to qualified patients, assisting them with prescription drug co-payments required by insurance. The calculation of the accrual for copay is based on an estimate of claims and the cost per claim that we expect to receive associated with inventory that exists in the distribution channel at period end. •Pharmacy rebates: represent our estimated obligations resulting from contractual commitments to sell products to specific pharmacies. Rebate accruals are recorded in the same period the related revenue is recognized, resulting in a reduction of product revenue and the establishment of a liability which is included in accrued expense and other current liabilities in our consolidated balance sheets. These rebates result from contracted discounts on product purchased or product dispensed. The calculation of the accrual for these rebates is based on an estimate of the pharmacy’s buying or dispensing patterns and the resulting applicable contractual rebate rate(s) to be earned over the contractual period. •Other governmental rebates: non-U.S. pharmaceutical taxes or applicable allowances primarily relate to mandatory rebates and discounts in international markets where government-sponsored healthcare systems are the primary payors for healthcare. Product return reserves are established for returns made by wholesalers and are recorded in the period the related revenue is recognized, resulting in a reduction to product revenue. In accordance with contractual terms, wholesalers are permitted to return product for reasons such as damaged or expired product. The majority of wholesaler returns are due to product expiration. Expired product return reserves are estimated through a comparison of historical return data to their related sales on a production lot basis. Historical rates of return are determined for each product and are adjusted for known or expected changes in the marketplace specific to each product. In addition to discounts, rebates and product returns, we also maintain certain customer service contracts with distributors and other customers in the distribution channel that provide us with inventory management, data and distribution services, which are generally reflected as a reduction of revenue. To the extent we can demonstrate a separable benefit and fair value for these services we classify these payments in selling, general and administrative expense in our consolidated statements of income. Revenue from Anti-CD20 Therapeutic Programs Our collaboration with Genentech is within the scope of ASC 808, Collaborative Agreements, which provides guidance on the presentation and disclosure of collaborative arrangements. For purposes of this footnote, we refer to RITUXAN and RITUXAN HYCELA collectively as RITUXAN.
BIOGEN INC. AND SUBSIDIARIES NOTES TO CONSOLIDATED FINANCIAL STATEMENTS — (Continued) Our share of the pre-tax co-promotion profits on RITUXAN, GAZYVA and LUNSUMIO and royalty revenue on sales of OCREVUS, resulted from an exchange of a license. As we do not have future performance obligations under the license or collaboration agreement, revenue is recognized as the underlying sales occur. Revenue from anti-CD20 therapeutic programs consist of: (i) our share of pre-tax profits and losses in the U.S. for RITUXAN, GAZYVA and LUNSUMIO; (ii) royalty revenue on sales of OCREVUS; and (ii) other revenue from anti-CD20 therapeutic programs, which consists of our share of pre-tax co-promotion profits on RITUXAN in Canada, royalties on net sales of COLUMVI in the U.S. and royalties on sales of LUNSUMIO outside the U.S. Pre-tax co-promotion profits on RITUXAN, GAZYVA and LUNSUMIO are calculated and paid to us by Genentech and the Roche Group. Pre-tax co-promotion profits consist of net sales to third-party customers less applicable costs to manufacture, third-party royalty expense, distribution, selling and marketing expense and joint development expense incurred by Genentech and the Roche Group. Our share of the pre-tax profits on RITUXAN, GAZYVA and LUNSUMIO include estimates that are based on information received from Genentech and the Roche Group. These estimates are subject to change and actual results may differ. We recognize royalty revenue on sales of OCREVUS based on our estimates from third party and market research data of OCREVUS sales occurring during the corresponding period. Differences between actual and estimated royalty revenue will be adjusted for in the period in which they become known, which is generally expected to be the following quarter. Prior to regulatory approval, we record our share of the expense incurred by the collaboration for the development of anti-CD20 products within research and development expense and pre-commercialization costs within selling, general and administrative expense in our consolidated statements of income. After an anti-CD20 product is approved, we record our share of the development and sales and marketing expense related to that product as a reduction of our share of pre-tax profits in revenue from anti-CD20 therapeutic programs. Accordingly, Biogen recorded its share of the expense incurred in connection with the development of LUNSUMIO within research and development expense and its share of pre-commercialization costs within selling, general and administrative expense through December 2022, when regulatory approval was granted by the FDA. Beginning in January 2023 our share of pre-tax profits and losses in the U.S. for LUNSUMIO was reflected as a component of revenue from anti-CD20 therapeutic programs within our consolidated statements of income. For additional information on our relationship with Genentech, please read Note 19, Collaborative and Other Relationships, to these consolidated financial statements. Contract Manufacturing, Royalty and Other Revenue Contract Manufacturing Revenue We record contract manufacturing revenue primarily from amounts earned under contract manufacturing agreements with our strategic customers. Revenue under contract manufacturing agreements is recognized when the customer obtains control of the product, which may occur at a point in time or over time depending on the terms and conditions of the agreement. During the first quarter of 2023 we began recognizing contract manufacturing revenue for LEQEMBI, upon accelerated approval of LEQEMBI in the U.S. Prior to accelerated approval, our share of contract manufacturing amounts related to LEQEMBI were recognized in research and development expense within our consolidated statements of income. Royalty and Other Revenue Royalty and other revenue primarily reflects the royalties we receive from net sales on products related to patents that we have out-licensed, as well as royalty revenue on biosimilar products from our collaboration arrangements with Samsung Bioepis and our 50.0% share of LEQEMBI product revenue, net and cost of sales, including royalties, as we are not the principal. These arrangements resulted from an exchange of a license and utilize the sales and usage based royalty exception. Therefore, royalties received are recognized as the underlying sales occur.
BIOGEN INC. AND SUBSIDIARIES NOTES TO CONSOLIDATED FINANCIAL STATEMENTS — (Continued) Collaborative and Other Relationships We also have a number of significant collaborative and other third-party relationships for revenue and for the development, regulatory approval, commercialization and marketing of certain of our products and product candidates. Where we are the principal on sales transactions with third parties, we recognize revenue, cost of sales and operating expense on a gross basis in their respective lines in our consolidated statements of income. Where we are not the principal on sales transactions with third parties, our share of the revenue, cost of sales and operating expense is recorded as a component of other revenue in our consolidated statements of income. Our development and commercialization arrangements with Genentech, Eisai, Sage and Samsung Bioepis represent collaborative arrangements as each party is an active participant in one or more joint operating activities and is exposed to significant risks and rewards of these arrangements. These arrangements resulted from an exchange of a license and utilize the sales and usage based royalty exception, as applicable. Therefore, revenue relating to royalties or profit-sharing amounts received is recognized as the underlying sales occur. For additional information on our collaboration arrangements with Genentech, Eisai, Sage and Samsung Bioepis, please read Note 19, Collaborative and Other Relationships, to these consolidated financial statements. Fair Value Measurements We have certain financial assets and liabilities recorded at fair value which have been classified as Level 1, 2 or 3 within the fair value hierarchy as described in the accounting standards for fair value measurements. •Level 1 — Fair values are determined utilizing quoted prices (unadjusted) in active markets for identical assets or liabilities that we have the ability to access; •Level 2 — Fair values are determined by utilizing quoted prices for identical or similar assets and liabilities in active markets or other market observable inputs such as interest rates, yield curves, foreign currency spot rates and option pricing valuation models; and •Level 3 — Prices or valuations that require inputs that are both significant to the fair value measurement and unobservable. The majority of our financial assets have been classified as Level 2. Our financial assets (which typically include our cash equivalents, marketable debt securities and certain of our marketable equity securities, derivative contracts and plan assets for deferred compensation) have been initially valued at the transaction price and subsequently valued, at the end of each reporting period, utilizing third-party pricing services or option pricing valuation models. The pricing services utilize industry standard valuation models, including both income and market-based approaches and observable market inputs to determine value. These observable market inputs include reportable trades, benchmark yields, credit spreads, broker/dealer quotes, bids, offers, current spot rates and other industry and economic events. We validate the prices provided by our third-party pricing services by understanding the models used, obtaining market values from other pricing sources and analyzing pricing data in certain instances. The option pricing valuation models use assumptions within the model, including the term, stock price volatility, constant maturity risk-free interest rate and dividend yield. After completing our validation procedures, we did not adjust or override any fair value measurements provided by our pricing services as of December 31, 2023 and 2022. Other Assets and Liabilities The carrying amounts reflected in our consolidated balance sheets for current accounts receivable, due from anti-CD20 therapeutic programs, other current assets, accounts payable and accrued expense and other, approximate fair value due to their short-term maturities. Cash and Cash Equivalents We consider only those investments that are highly liquid, readily convertible to cash and that mature within three months from date of purchase to be cash equivalents. As of December 31, 2023 and 2022, cash equivalents were comprised of money market funds, commercial paper, overnight reverse repurchase agreements and other debt securities with maturities less than three months from the date of purchase.
BIOGEN INC. AND SUBSIDIARIES NOTES TO CONSOLIDATED FINANCIAL STATEMENTS — (Continued) Accounts Receivable The majority of our accounts receivable arise from product sales and primarily represent amounts due from our wholesale and other third-party distributors, public hospitals, pharmacies and other government entities and have standard payment terms that generally require payment within 30 to 90 days. We do not adjust our receivables for the effects of a significant financing component at contract inception if we expect to collect the receivables in one year or less from the time of sale. We provide reserves against accounts receivable for estimated losses that may result from a customer's inability to pay. Amounts determined to be uncollectible are charged or written-off against the reserve. Receivables from Samsung BioLogics In April 2022 we completed the sale of our 49.9% equity interest in Samsung Bioepis to Samsung BioLogics, which resulted in a receivable of approximately $1.3 billion in cash to be deferred over two payments. The first deferred payment of $812.5 million was received in April 2023 and the second deferred payment of $437.5 million is due at the second anniversary of the closing of this transaction in April 2024. The payments due to us from Samsung BioLogics have been recorded at their estimated fair values through the use of risk-adjusted discount rates. For additional information on the accounting for the sale of our equity interest in Samsung Bioepis, please read Note 3, Dispositions, to these consolidated financial statements. Concentration of Credit Risk Financial instruments that potentially subject us to concentrations of credit risk include cash and cash equivalents, investments, derivatives and accounts receivable. We attempt to minimize the risks related to cash and cash equivalents and investments by investing in a broad and diverse range of financial instruments as previously defined by us. We have established guidelines related to credit ratings and maturities intended to safeguard principal balances and maintain liquidity. Our investment portfolio is maintained in accordance with our investment policy, which defines allowable investments, specifies credit quality standards and limits the credit exposure of any single issuer. We minimize credit risk resulting from derivative instruments by choosing only highly rated financial institutions as counterparties. Concentrations of credit risk with respect to receivables, which are typically unsecured, are somewhat mitigated due to the wide variety of customers and markets using our products, as well as their dispersion across many different geographic areas. We monitor the financial performance and creditworthiness of our customers so that we can properly assess and respond to changes in their credit profile. We continue to monitor these conditions and assess their possible impact on our business. Marketable Securities and Other Investments Marketable Debt Securities Available-for-sale marketable debt securities are recorded at fair market value and unrealized gains and losses are included in AOCI in equity, net of related tax effects, unless the security has experienced a credit loss, we have determined that we have the intent to sell the security or we have determined that it is more likely than not that we will have to sell the security before its expected recovery. Realized gains and losses are reported in other (income) expense, net on a specific identification basis. During the third quarter of 2023 we sold all of our marketable debt securities and used the proceeds to partially fund our acquisition of Reata. For additional information on our acquisition of Reata, please read Note 2, Acquisitions, to these consolidated financial statements. Marketable Equity Securities and Venture Capital Funds Our marketable equity securities are recorded at fair market value and unrealized gains and losses are included in other (income) expense, net in our consolidated statements of income. Our marketable equity securities represent investments in publicly traded equity securities and are included in investments and other assets in our consolidated balance sheets. Our investments in venture capital funds are recorded at net asset value, which approximates fair value, and unrealized gains and losses are included in other (income) expense, net in our consolidated statements of income.
BIOGEN INC. AND SUBSIDIARIES NOTES TO CONSOLIDATED FINANCIAL STATEMENTS — (Continued) The underlying investments of the venture capital funds in which we invest are in equity securities of certain biotechnology companies and are included in investments and other assets in our consolidated balance sheets. Non-Marketable Equity Securities We also invest in equity securities of companies whose securities are not publicly traded and where fair value is not readily available. These investments are recorded using either the equity method of accounting or the cost minus impairment adjusted for observable price changes, depending on our ownership percentage and other factors that suggest we have significant influence. We monitor these investments to evaluate whether any increase or decline in their value has occurred, based on the implied value of recent company financings, public market prices of comparable companies and general market conditions. These investments are included in investments and other assets in our consolidated balance sheets. Evaluating Marketable Debt Securities for Other-than-Temporary Impairments We conduct periodic reviews to identify and evaluate each investment that has an unrealized loss, in accordance with the meaning of other-than-temporary impairment. An unrealized loss exists when the current fair value of an individual security is less than its amortized cost basis. Unrealized losses on available-for-sale debt securities that are determined to be temporary, and not related to credit loss, are recorded, net of tax, in AOCI. For available-for-sale debt securities with unrealized losses, management performs an analysis to assess whether we intend to sell or whether we would more likely than not be required to sell the security before the expected recovery of the amortized cost basis. Where we intend to sell a security, or may be required to do so, the security’s decline in fair value is deemed to be other-than-temporary and the full amount of the unrealized loss is reflected in earnings as an impairment loss. Regardless of our intent to sell a security, we perform additional analysis on all securities with unrealized losses to evaluate losses associated with the creditworthiness of the security. Credit losses are identified where we do not expect to receive cash flows sufficient to recover the amortized cost basis of a security. Equity Method of Accounting In circumstances where we have the ability to exercise significant influence over the operating and financial policies of a company in which we have an investment, we utilize the equity method of accounting for recording investment activity. In assessing whether we exercise significant influence, we consider the nature and magnitude of our investment, the voting and protective rights we hold, any participation in the governance of the other company and other relevant factors such as the presence of a collaborative or other business relationship. Under the equity method of accounting, we record in our consolidated statements of income our share of income or loss of the other company. If our share of losses exceeds the carrying value of our investment, we will suspend recognizing additional losses and will continue to do so unless we commit to providing additional funding. Inventory Inventories are stated at the lower of cost or net realizable value with cost based on the first-in, first-out method. We classify our inventory costs as long-term when we expect to utilize the inventory beyond our normal operating cycle and include these costs in investments and other assets in our consolidated balance sheets. Inventory that can be used in either the production of clinical or commercial products is expensed as research and development costs when identified for use in a clinical manufacturing campaign. Revenue Recognition and Related Allowances
We recognize revenues when all of the following criteria are met: persuasive evidence of an arrangement exists; delivery has occurred or services have been rendered; our price to the customer is fixed or determinable; and collectability is reasonably assured. For additional information on the new accounting standard for revenues from contracts with customers please read Note 1, Summary of Significant Accounting Policies: New Accounting Pronouncements, to our consolidated financial statements included in this report.
Product Revenues
Revenues from product sales are recognized when title and risk of loss have passed to the customer, which is typically upon delivery. Product revenues are recorded net of applicable reserves for discounts and allowances. The timing of distributor orders and shipments can cause variability in earnings.
Reserves for Discounts and Allowances
Revenues from product sales are recorded net of reserves established for applicable discounts and allowances, including those associated with the implementation of pricing actions in certain of the international markets in which we operate. These reserves are based on estimates of the amounts
earned or to be claimed on the related sales and are classified as reductions of accounts receivable (if the amount is payable to our customer) or a liability (if the amount is payable to a party other than our customer). Our estimates take into consideration our historical experience, current contractual and statutory requirements, specific known market events and trends, industry data and forecasted customer buying and payment patterns. Actual amounts may ultimately differ from our estimates. If actual results vary, we adjust these estimates, which could have an effect on earnings in the period of adjustment.
In addition to the discounts and rebates described above and classified as a reduction of revenue, we also maintain certain customer service contracts with distributors and other customers in the distribution channel that provide us with inventory management, data and distribution services, which are generally reflected as a reduction of revenue. To the extent we can demonstrate a separable benefit and fair value for these services we classify these payments within selling, general and administrative expenses.
Concentrations of Credit Risk
The majority of our accounts receivable arise from product sales in the U.S. and Europe and are primarily due from wholesale distributors, public hospitals and other government entities. We monitor the financial performance and creditworthiness of our customers so that we can properly assess and respond to changes in their credit profile. We continue to monitor these conditions, including the volatility associated with international economies and the relevant financial markets, and assess their possible impact on our business. Credit and economic conditions in the E.U. continue to remain uncertain, which has, from time to time, led to longer collection periods for our accounts receivable and greater collection risk in certain countries.
Where our collections continue to be subject to significant payment delays due to government funding and reimbursement practices and a portion of these receivables are routinely being collected beyond our contractual payment terms and over periods in excess of one year, we have discounted our receivables and reduced related revenues based on the period of time that we estimate those amounts will be paid, to the extent such period exceeds one year, using the country’s market-based borrowing rate for such period. The related receivables are classified at the time of sale as non-current assets.
To date, we have not experienced any significant losses with respect to the collection of our accounts receivable. If economic conditions worsen and/or the financial condition of our customers were to further
deteriorate, our risk of collectability may increase, which may result in additional allowances and/or significant bad debts.
For additional information on our concentration of credit risk associated with our accounts receivable balances, please read the subsection entitled “Credit Risk” in Item 7A. Quantitative and Qualitative Disclosures About Market Risk included in this report.
CapitalizationPART III
ITEM 10. DIRECTORS, EXECUTIVE OFFICERS AND CORPORATE GOVERNANCE The information concerning our executive officers is set forth under the heading Information about our Executive Officers in Item 1 of Inventory Coststhis report. The text of our code of business conduct, which includes the code of ethics that applies to our principal executive officer, principal financial officer, principal accounting officer or controller, and persons performing similar functions, is posted on our website, www.biogen.com, under the “Corporate Governance” subsection of the “Investors” section of the site. We intend to make all required disclosures regarding any amendments to, or waivers from, provisions of our code of business conduct at the same location of our website. The response to the remainder of this item is incorporated by reference from the discussion responsive thereto in the sections entitled “Proposal 1 - Election of Directors,” “Corporate Governance” and “Miscellaneous - Stockholder Proposals” contained in the proxy statement for our 2024 annual meeting of stockholders. ITEM 11. EXECUTIVE COMPENSATION The response to this item is incorporated by reference from the discussion responsive thereto in the sections entitled “Executive Compensation Tables,” "Compensation Discussion and Analysis" and “Corporate Governance” contained in the proxy statement for our 2024 annual meeting of stockholders. ITEM 12. SECURITY OWNERSHIP OF CERTAIN BENEFICIAL OWNERS AND MANAGEMENT AND RELATED STOCKHOLDER MATTERS The response to this item is incorporated by reference from the discussion responsive thereto in the sections entitled “Stock Ownership” and “Equity Compensation Plan Information” contained in the proxy statement for our 2024 annual meeting of stockholders. ITEM 13. CERTAIN RELATIONSHIPS AND RELATED TRANSACTIONS, AND DIRECTOR INDEPENDENCE The response to this item is incorporated by reference from the discussion responsive thereto in the sections entitled “Certain Relationships and Related Person Transactions” and “Corporate Governance” contained in the proxy statement for our 2024 annual meeting of stockholders. ITEM 14. PRINCIPAL ACCOUNTANT FEES AND SERVICES The response to this item is incorporated by reference from the discussion responsive thereto in the section entitled “Proposal 2 - Ratification of the Selection of our Independent Registered Public Accounting Firm” contained in the proxy statement for our 2024 annual meeting of stockholders.
PART IV ITEM 15. EXHIBITS AND FINANCIAL STATEMENT SCHEDULES a. (1) Consolidated Financial Statements: The following financial statements are filed as part of this report: | | | | | | | | | | Financial Statements | | Page Number | | Consolidated Statements of Income | | F-2 | | Consolidated Statements of Comprehensive Income | | F-3 | | Consolidated Balance Sheets | | F-4 | | Consolidated Statements of Cash Flow | | F-5 | | Consolidated Statements of Equity | | F-6 | | Notes to Consolidated Financial Statements | | F-9 | | Report of Independent Registered Public Accounting Firm (PCAOB ID 238) | F-83 |
Certain totals may not sum due to rounding. (2) Exhibits The exhibits listed on the Exhibit Index beginning on page 98, which is incorporated herein by reference, are filed or furnished as part of this report or are incorporated into this report by reference. (3) Financial Statement Schedules Schedules are omitted because they are not applicable, or are not required, or because the information is included in the consolidated financial statements and notes thereto. ITEM 16. FORM 10-K SUMMARY Not applicable.
EXHIBIT INDEX | | | | | | | | | | Exhibit No. | | Description | | 2.1 | | | | 3.1 | | | | 3.2 | | | | 3.3 | | | | 3.4 | | | | 4.1 | | | | 4.2 | | | | 4.3 | | | | 4.4 | | | | 4.5 | | | | 4.6+ | | | | 10.1 | | | | 10.2 | | | | 10.3 | | | | 10.4† | | | | 10.5† | | | | 10.6* | | | | 10.7* | | | | 10.8* | | | | 10.9* | | | | 10.10* | | | | 10.11* | | | | 10.12* | | | | 10.13* | | | | 10.14* | | | | 10.15* | | | | 10.16* | | |
| | | | | | | | | | Exhibit No. | | Description | | 10.17* | | | | 10.18* | | | | 10.19* | | | | 10.20* | | | | 10.21* | | | | 10.22* | | | | 10.23* | | | | 10.24* | | | | 10.25* | | | | 10.26* | | | | 10.27* | | | | 10.28* | | | | 10.29* | | | | 10.30* | | | | 10.31* | | | | 10.32*+ | | | | 10.33*+ | | | | 10.34* | | | | 10.35+ | | | | 10.36 | | | | 10.37 | | | | 21+ | | | | 23+ | | | | 31.1+ | | | | 31.2+ | | | | 32.1++ | | | | 97.1+ | | | | 101++ | | The following materials from Biogen Inc.’s Annual Report on Form 10-K for the year ended December 31, 2023, formatted in iXBRL (Inline Extensible Business Reporting Language): (i) the Consolidated Statements of Income, (ii) the Consolidated Statements of Comprehensive Income, (iii) the Consolidated Balance Sheets, (iv) the Consolidated Statements of Cash Flow, (v) the Consolidated Statements of Equity and (vi) Notes to Consolidated Financial Statements. |
| | | | | | | * | Management contract or compensatory plan or arrangement. |
| | | | | | | † | Confidential treatment has been granted or requested with respect to portions of this exhibit. |
SIGNATURES Pursuant to the requirements of Section 13 or 15(d) of the Securities Exchange Act of 1934, the registrant has duly caused this report to be signed on its behalf by the undersigned, thereunto duly authorized. | | | | | | | BIOGEN INC. | | | | By: | /S/ CHRISTOPHER A. VIEHBACHER | | Christopher A. Viehbacher | | Chief Executive Officer |
Date: February 13, 2024
Pursuant to the requirements of the Securities Exchange Act of 1934, this report has been signed below by the following persons on behalf of the registrant and in the capacities and on the dates indicated. | | | | | | | | | | | | | | | | Name | | Capacity | | Date | | | | | | /S/ CHRISTOPHER A. VIEHBACHER | | Director and Chief Executive Officer (principal executive officer) | | February 13, 2024 | | Christopher A. Viehbacher | | | | | | | | /S/ MICHAEL R. MCDONNELL | | Executive Vice President and Chief Financial Officer (principal financial officer) | | February 13, 2024 | | Michael R. McDonnell | | | | | | | | /S/ ROBIN C. KRAMER | | Senior Vice President, Chief Accounting Officer (principal accounting officer) | | February 13, 2024 | | Robin C. Kramer | | | | | | | | /S/ CAROLINE D. DORSA | | Director and Chair of the Board of Directors | | February 13, 2024 | | Caroline D. Dorsa | | | | | | | | /S/ MARIA C. FREIRE | | Director | | February 13, 2024 | | Maria C. Freire | | | | | | | | /S/ WILLIAM A. HAWKINS | | Director | | February 13, 2024 | | William A. Hawkins | | | | | | | | /S/ SUSAN LANGER | | Director | | February 13, 2024 | | Susan Langer | | | | | | | | /S/ JESUS B. MANTAS | | Director | | February 13, 2024 | | Jesus B. Mantas | | | | | | | | /S/ MONISH PATOLAWALA | | Director | | February 13, 2024 | | Monish Patolawala | | | | | | | | /S/ ERIC K. ROWINSKY | | Director | | February 13, 2024 | | Eric K. Rowinsky | | | | | | | | /S/ STEPHEN A. SHERWIN | | Director | | February 13, 2024 | | Stephen A. Sherwin | | |
BIOGEN INC. AND SUBSIDIARIES CONSOLIDATED FINANCIAL STATEMENTS | | | | | | | | | | | Page Number | | Consolidated Statements of Income | | F-2 | | Consolidated Statements of Comprehensive Income | | F-3 | | Consolidated Balance Sheets | | F-4 | | Consolidated Statements of Cash Flow | | F-5 | | Consolidated Statements of Equity | | F-6 | | Notes to Consolidated Financial Statements | | F-9 | | Report of Independent Registered Public Accounting Firm (PCAOB ID 238) | F-83 |
BIOGEN INC. AND SUBSIDIARIES CONSOLIDATED STATEMENTS OF INCOME (In millions, except per share amounts) | | | | | | | | | | | | | | | | | | | | | | | For the Years Ended December 31, | | | 2023 | | 2022 | | 2021 | | Revenue: | | | | | | | | Product revenue, net | | $ | 7,246.7 | | | $ | 7,987.8 | | | $ | 8,846.9 | | | Revenue from anti-CD20 therapeutic programs | | 1,689.6 | | | 1,700.5 | | | 1,658.5 | | | Contract manufacturing, royalty and other revenue | | 899.3 | | | 485.1 | | | 476.3 | | | Total revenue | | 9,835.6 | | | 10,173.4 | | | 10,981.7 | | | Cost and expense: | | | | | | | | Cost of sales, excluding amortization and impairment of acquired intangible assets | | 2,533.4 | | | 2,278.3 | | | 2,109.7 | | | Research and development | | 2,462.0 | | | 2,231.1 | | | 2,501.2 | | | Selling, general and administrative | | 2,549.7 | | | 2,403.6 | | | 2,674.3 | | | Amortization and impairment of acquired intangible assets | | 240.6 | | | 365.9 | | | 881.3 | | | Collaboration profit sharing/(loss reimbursement) | | 218.8 | | | (7.4) | | | 7.2 | | | | | | | | | | (Gain) loss on fair value remeasurement of contingent consideration | | — | | | (209.1) | | | (50.7) | | | Acquired in-process research and development | | — | | | — | | | 18.0 | | | Restructuring charges | | 218.8 | | | 131.1 | | | — | | | Gain on sale of building | | — | | | (503.7) | | | — | | | Other (income) expense, net | | 315.5 | | | (108.2) | | | 1,095.5 | | | Total cost and expense | | 8,538.8 | | | 6,581.6 | | | 9,236.5 | | | Income before income tax (benefit) expense and equity in loss of investee, net of tax | | 1,296.8 | | | 3,591.8 | | | 1,745.2 | | | Income tax (benefit) expense | | 135.3 | | | 632.8 | | | 52.5 | | | Equity in (income) loss of investee, net of tax | | — | | | (2.6) | | | (34.9) | | | Net income | | 1,161.5 | | | 2,961.6 | | | 1,727.6 | | | Net income (loss) attributable to noncontrolling interests, net of tax | | 0.4 | | | (85.3) | | | 171.5 | | | Net income attributable to Biogen Inc. | | $ | 1,161.1 | | | $ | 3,046.9 | | | $ | 1,556.1 | | | | | | | | | | Net income per share: | | | | | | | | Basic earnings per share attributable to Biogen Inc. | | $ | 8.02 | | | $ | 20.96 | | | $ | 10.44 | | | Diluted earnings per share attributable to Biogen Inc. | | $ | 7.97 | | | $ | 20.87 | | | $ | 10.40 | | | | | | | | | | Weighted-average shares used in calculating: | | | | | | | | Basic earnings per share attributable to Biogen Inc. | | 144.7 | | | 145.3 | | | 149.1 | | | Diluted earnings per share attributable to Biogen Inc. | | 145.6 | | | 146.0 | | | 149.6 | |
See accompanying notes to these consolidated financial statements.
BIOGEN INC. AND SUBSIDIARIES CONSOLIDATED STATEMENTS OF COMPREHENSIVE INCOME (In millions) | | | | | | | | | | | | | | | | | | | | | | | | For the Years Ended December 31, | | | | 2023 | | 2022 | | 2021 | | Net income attributable to Biogen Inc. | | $ | 1,161.1 | | | $ | 3,046.9 | | | $ | 1,556.1 | | | Other comprehensive income: | | | | | | | | Unrealized gains (losses) on securities available for sale, net of tax | | 15.7 | | | (13.5) | | | (3.6) | | | Unrealized gains (losses) on cash flow hedges, net of tax | | (40.1) | | | (38.7) | | | 232.8 | | | Gains (losses) on net investment hedges, net of tax | | — | | | (25.5) | | | 34.0 | | | Unrealized gains (losses) on pension benefit obligation, net of tax | | (1.5) | | | 43.7 | | | 21.5 | | | Currency translation adjustment | | 37.1 | | | (24.2) | | | (92.4) | | | Total other comprehensive income (loss), net of tax | | 11.2 | | | (58.2) | | | 192.3 | | | Comprehensive income (loss) attributable to Biogen Inc. | | 1,172.3 | | | 2,988.7 | | | 1,748.4 | | | Comprehensive income (loss) attributable to noncontrolling interests, net of tax | | 0.4 | | | (85.3) | | | 172.1 | | | Comprehensive income (loss) | | $ | 1,172.7 | | | $ | 2,903.4 | | | $ | 1,920.5 | |
See accompanying notes to these consolidated financial statements.
BIOGEN INC. AND SUBSIDIARIES CONSOLIDATED BALANCE SHEETS (In millions, except per share amounts) | | | | | | | | | | | | | As of December 31, | | 2023 | | 2022 | | ASSETS | | Current assets: | | | | | Cash and cash equivalents | $ | 1,049.9 | | | $ | 3,419.3 | | | Marketable securities | — | | | 1,473.5 | | | Accounts receivable, net of allowance for doubtful accounts of $2.4 and $2.3, respectively | 1,664.1 | | | 1,705.0 | | | Due from anti-CD20 therapeutic programs | 435.9 | | | 431.4 | | | Inventory | 2,527.4 | | | 1,344.4 | | | Other current assets | 1,182.0 | | | 1,417.6 | | | Total current assets | 6,859.3 | | | 9,791.2 | | | Marketable securities | — | | | 705.7 | | | Property, plant and equipment, net | 3,309.7 | | | 3,298.6 | | | Operating lease assets | 420.0 | | | 403.9 | | | Intangible assets, net | 8,363.0 | | | 1,850.1 | | | Goodwill | 6,219.2 | | | 5,749.0 | | | Deferred tax asset | 928.6 | | | 1,226.4 | | | Investments and other assets | 745.0 | | | 1,529.2 | | | Total assets | $ | 26,844.8 | | | $ | 24,554.1 | | | LIABILITIES AND EQUITY | | Current liabilities: | | | | | Current portion of term loan | $ | 150.0 | | | $ | — | | | Taxes payable | 257.4 | | | 259.9 | | | Accounts payable | 403.3 | | | 491.5 | | | Accrued expense and other | 2,623.6 | | | 2,521.4 | | | Total current liabilities | 3,434.3 | | | 3,272.8 | | | Notes payable and term loan | 6,788.2 | | | 6,281.0 | | | Deferred tax liability | 641.8 | | | 334.7 | | | Long-term operating lease liabilities | 400.0 | | | 333.0 | | | Other long-term liabilities | 781.1 | | | 944.2 | | | Total liabilities | 12,045.4 | | | 11,165.7 | | | Commitments, contingencies and guarantees (Notes 22 and 23) | | | | | Equity: | | | | | Biogen Inc. shareholders’ equity | | | | | Preferred stock, par value $0.001 per share | — | | | — | | | Common stock, par value $0.0005 per share | 0.1 | | | 0.1 | | | Additional paid-in capital | 302.5 | | | 73.3 | | | Accumulated other comprehensive income (loss) | (153.7) | | | (164.9) | | | Retained earnings | 17,627.6 | | | 16,466.5 | | | Treasury stock, at cost; 23.8 million and 23.8 million shares, respectively | (2,977.1) | | | (2,977.1) | | | Total Biogen Inc. shareholders’ equity | 14,799.4 | | | 13,397.9 | | | Noncontrolling interests | — | | | (9.5) | | | Total equity | 14,799.4 | | | 13,388.4 | | | Total liabilities and equity | $ | 26,844.8 | | | $ | 24,554.1 | |
See accompanying notes to these consolidated financial statements.
BIOGEN INC. AND SUBSIDIARIES CONSOLIDATED STATEMENTS OF CASH FLOW (In millions) | | | | | | | | | | | | | | | | | | | For the Years Ended December 31, | | | 2023 | | 2022 | | 2021 | | Cash flow from operating activities: | | | | | | | Net income | $ | 1,161.5 | | | $ | 2,961.6 | | | $ | 1,727.6 | | | Adjustments to reconcile net income to net cash flow from operating activities: | | | | | | | Depreciation and amortization | 494.8 | | | 518.4 | | | 487.7 | | | Impairment of intangible assets | — | | | 119.6 | | | 629.3 | | | Excess and obsolescence charges related to inventory | 124.4 | | | 336.2 | | | 167.6 | | | Amortization of inventory step-up | 31.5 | | | — | | | — | | | Acquired in-process research and development | — | | | — | | | 18.0 | | | Share-based compensation | 264.2 | | | 254.1 | | | 238.6 | | | Contingent consideration | — | | | (209.1) | | | (50.7) | | | Deferred income taxes | (305.8) | | | (168.6) | | | (426.8) | | | (Gain) loss on strategic investments | 277.1 | | | 265.9 | | | 826.8 | | | (Gain) loss on equity method investment | — | | | (2.6) | | | (34.9) | | | Gain on sale of equity interest in Samsung Bioepis | — | | | (1,505.4) | | | — | | | Gain on sale of building | — | | | (503.7) | | | — | | | Other | 148.2 | | | 208.2 | | | 202.2 | | | Changes in operating assets and liabilities, net of effects of business acquired: | | | | | | | Accounts receivable | 61.3 | | | (203.4) | | | 324.8 | | | Due from anti-CD20 therapeutic programs | (4.6) | | | (19.0) | | | 1.2 | | | Inventory | (130.9) | | | (320.2) | | | (462.4) | | | Accrued expense and other current liabilities | (201.6) | | | (113.4) | | | (95.4) | | | Income tax assets and liabilities | (299.0) | | | (142.3) | | | 230.8 | | | Other changes in operating assets and liabilities, net | (73.9) | | | (92.0) | | | (144.5) | | | Net cash flow provided by (used in) operating activities | 1,547.2 | | | 1,384.3 | | | 3,639.9 | | | Cash flow from investing activities: | | | | | | | Purchases of property, plant and equipment | (277.0) | | | (240.3) | | | (258.1) | | | Proceeds from sales and maturities of marketable securities | 7,380.8 | | | 3,671.0 | | | 3,405.4 | | | Purchases of marketable securities | (5,140.7) | | | (3,448.5) | | | (3,808.7) | | | Acquisition of Reata, net of cash acquired | (6,926.1) | | | — | | | — | | | Proceeds from sale of equity interest in Samsung Bioepis | 788.1 | | | 990.3 | | | — | | | Proceeds from sale of building | — | | | 582.6 | | | — | | | Proceeds from divestiture of Hillerød, Denmark manufacturing operations | — | | | — | | | 28.1 | | | Acquired in-process research and development | — | | | — | | | (18.0) | | | Acquisitions of intangible assets | (34.4) | | | (2.9) | | | (18.8) | | | Proceeds from sales of strategic investments | 119.6 | | | — | | | 93.5 | | | Other | (11.3) | | | 24.4 | | | 12.9 | | | Net cash flow provided by (used in) investing activities | (4,101.0) | | | 1,576.6 | | | (563.7) | | | Cash flow from financing activities: | | | | | | | Purchase of treasury stock | — | | | (750.0) | | | (1,800.0) | | | Payments related to issuance of stock for share-based compensation arrangements, net | (44.3) | | | (1.9) | | | (0.7) | | | Repayments of borrowings and premiums paid | (809.9) | | | (1,002.2) | | | (170.0) | | | Proceeds from borrowings | 997.2 | | | — | | | — | | | | | | | | | Net (distribution) contribution to noncontrolling interest | 12.3 | | | 12.4 | | | (94.4) | | | | | | | | | Other | (6.0) | | | (5.6) | | | (21.1) | | | Net cash flow provided by (used in) financing activities | 149.3 | | | (1,747.3) | | | (2,086.2) | | | Net increase (decrease) in cash and cash equivalents | (2,404.5) | | | 1,213.6 | | | 990.0 | | | Effect of exchange rate changes on cash and cash equivalents | 35.1 | | | (55.7) | | | (59.8) | | | Cash and cash equivalents, beginning of the year | 3,419.3 | | | 2,261.4 | | | 1,331.2 | | | Cash and cash equivalents, end of the year | $ | 1,049.9 | | | $ | 3,419.3 | | | $ | 2,261.4 | |
See accompanying notes to these consolidated financial statements.
BIOGEN INC. AND SUBSIDIARIES CONSOLIDATED STATEMENTS OF EQUITY (In millions) | | | | | | | | | | | | | | | | | | | | | | | | | | | | | | | | | | | | | | | | | | | | | | | | | | | | | | | | | | | | | | | | | | | | | | | | | | Preferred stock | | Common stock | | Additional
paid-in
capital | | Accumulated other comprehensive income (loss) | | Retained
earnings | | Treasury stock | | Total
Biogen Inc.
shareholders’
equity | | Noncontrolling
interests | | Total
equity | | | Shares | | Amount | | Shares | | Amount | | | | | Shares | | Amount | | | | | Balance, December 31, 2022 | — | | | $ | — | | | 167.9 | | | $ | 0.1 | | | $ | 73.3 | | | $ | (164.9) | | | $ | 16,466.5 | | | (23.8) | | | $ | (2,977.1) | | | $ | 13,397.9 | | | $ | (9.5) | | | $ | 13,388.4 | | | Net income | — | | | — | | | — | | | — | | | — | | | — | | | 1,161.1 | | | — | | | — | | | 1,161.1 | | | 0.4 | | | 1,161.5 | | | Other comprehensive income (loss), net of tax | — | | | — | | | — | | | — | | | — | | | 11.2 | | | — | | | — | | | — | | | 11.2 | | | — | | | 11.2 | | | Capital contribution from noncontrolling interest | — | | | — | | | — | | | — | | | — | | | — | | | — | | | — | | | — | | | — | | | 12.3 | | | 12.3 | | | Deconsolidation of noncontrolling interest | — | | | — | | | — | | | — | | | — | | | — | | | — | | | — | | | — | | | — | | | (3.2) | | | (3.2) | | | | | | | | | | | | | | | | | | | | | | | | | | | | | | | | | | | | | | | | | | | | | | | | | | | Issuance of common stock under stock option and stock purchase plans | — | | | — | | | 0.2 | | | — | | | 45.1 | | | — | | | — | | | — | | | — | | | 45.1 | | | — | | | 45.1 | | | Issuance of common stock under stock award plan | — | | | — | | | 0.6 | | | — | | | (89.5) | | | — | | | — | | | — | | | — | | | (89.5) | | | — | | | (89.5) | | | Compensation expense related to share-based payments | — | | | — | | | — | | | — | | | 274.4 | | | — | | | — | | | — | | | — | | | 274.4 | | | — | | | 274.4 | | | Other | — | | | — | | | — | | | — | | | (0.8) | | | — | | | — | | | — | | | — | | | (0.8) | | | — | | | (0.8) | | | Balance, December 31, 2023 | — | | | $ | — | | | 168.7 | | | $ | 0.1 | | | $ | 302.5 | | | $ | (153.7) | | | $ | 17,627.6 | | | (23.8) | | | $ | (2,977.1) | | | $ | 14,799.4 | | | $ | — | | | $ | 14,799.4 | |
See accompanying notes to these consolidated financial statements.
BIOGEN INC. AND SUBSIDIARIES CONSOLIDATED STATEMENTS OF EQUITY - (Continued) (In millions) | | | | | | | | | | | | | | | | | | | | | | | | | | | | | | | | | | | | | | | | | | | | | | | | | | | | | | | | | | | | | | | | | | | | | | | | | | Preferred stock | | Common stock | | Additional
paid-in
capital | | Accumulated other comprehensive income (loss) | | Retained
earnings | | Treasury stock | | Total
Biogen Inc.
shareholders’
equity | | Noncontrolling
interests | | Total
equity | | Shares | | Amount | | Shares | | Amount | | | | | Shares | | Amount | | | | | Balance, December 31, 2021 | — | | | $ | — | | | 170.8 | | | $ | 0.1 | | | $ | 68.2 | | | $ | (106.7) | | | $ | 13,911.7 | | | (23.8) | | | $ | (2,977.1) | | | $ | 10,896.2 | | | $ | 63.5 | | | $ | 10,959.7 | | | Net income | — | | | — | | | — | | | — | | | — | | | — | | | 3,046.9 | | | — | | | — | | | 3,046.9 | | | (85.3) | | | 2,961.6 | | | Other comprehensive income (loss), net of tax | — | | | — | | | — | | | — | | | — | | | (58.2) | | | — | | | — | | | — | | | (58.2) | | | — | | | (58.2) | | | | | | | | | | | | | | | | | | | | | | | | | | | Capital contribution from noncontrolling interest | — | | | — | | | — | | | — | | | — | | | — | | | — | | | — | | | — | | | — | | | 12.3 | | | 12.3 | | | Repurchase of common stock pursuant to the 2020 Share Repurchase Program, at cost | — | | | — | | | — | | | — | | | — | | | — | | | — | | | (3.6) | | | (750.0) | | | (750.0) | | | — | | | (750.0) | | | Retirement of common stock pursuant to the 2020 Share Repurchase Program, at cost | — | | | — | | | (3.6) | | | — | | | (257.9) | | | — | | | (492.1) | | | 3.6 | | | 750.0 | | | — | | | — | | | — | | | Issuance of common stock under stock option and stock purchase plans | — | | | — | | | 0.2 | | | — | | | 44.2 | | | — | | | — | | | — | | | — | | | 44.2 | | | — | | | 44.2 | | | Issuance of common stock under stock award plan | — | | | — | | | 0.5 | | | — | | | (46.0) | | | — | | | — | | | — | | | — | | | (46.0) | | | — | | | (46.0) | | | Compensation expense related to share-based payments | — | | | — | | | — | | | — | | | 263.5 | | | — | | | — | | | — | | | — | | | 263.5 | | | — | | | 263.5 | | | Other | — | | | — | | | — | | | — | | | 1.3 | | | — | | | — | | | — | | | — | | | 1.3 | | | — | | | 1.3 | | | Balance, December 31, 2022 | — | | | $ | — | | | 167.9 | | | $ | 0.1 | | | $ | 73.3 | | | $ | (164.9) | | | $ | 16,466.5 | | | (23.8) | | | $ | (2,977.1) | | | $ | 13,397.9 | | | $ | (9.5) | | | $ | 13,388.4 | |
See accompanying notes to these consolidated financial statements.
BIOGEN INC. AND SUBSIDIARIES CONSOLIDATED STATEMENTS OF EQUITY - (Continued) (In millions) | | | | | | | | | | | | | | | | | | | | | | | | | | | | | | | | | | | | | | | | | | | | | | | | | | | | | | | | | | | | | | | | | | | | | | | | | Preferred stock | | Common stock | | Additional
paid-in
capital | | Accumulated other comprehensive income (loss) | | Retained
earnings | | Treasury stock | | Total
Biogen Inc.
shareholders’
equity | | Noncontrolling
interests | | Total
equity | | Shares | | Amount | | Shares | | Amount | | | | | Shares | | Amount | | | | | Balance, December 31, 2020 | — | | | $ | — | | | 176.2 | | | $ | 0.1 | | | $ | — | | | $ | (299.0) | | | $ | 13,976.3 | | | (23.8) | | | $ | (2,977.1) | | | $ | 10,700.3 | | | $ | (14.2) | | | $ | 10,686.1 | | | Net income | — | | | — | | | — | | | — | | | — | | | — | | | 1,556.1 | | | — | | | — | | | 1,556.1 | | | 171.5 | | | 1,727.6 | | | Other comprehensive income (loss), net of tax | — | | | — | | | — | | | — | | | — | | | 192.3 | | | — | | | — | | | — | | | 192.3 | | | 0.6 | | | 192.9 | | | Distribution to noncontrolling interest | — | | | — | | | — | | | — | | | — | | | — | | | — | | | — | | | — | | | — | | | (100.0) | | | (100.0) | | | Capital contribution from noncontrolling interest | — | | | — | | | — | | | — | | | — | | | — | | | — | | | — | | | — | | | — | | | 5.6 | | | 5.6 | | | Repurchase of common stock pursuant to the 2020 Share Repurchase Program, at cost | — | | | — | | | — | | | — | | | — | | | — | | | — | | | (6.0) | | | (1,800.0) | | | (1,800.0) | | | — | | | (1,800.0) | | | Retirement of common stock pursuant to the 2020 Share Repurchase Program, at cost | — | | | — | | | (6.0) | | | — | | | (231.9) | | | — | | | (1,568.1) | | | 6.0 | | | 1,800.0 | | | — | | | — | | | — | | | Issuance of common stock under stock option and stock purchase plans | — | | | — | | | 0.2 | | | — | | | 54.4 | | | — | | | — | | | — | | | — | | | 54.4 | | | — | | | 54.4 | | | Issuance of common stock under stock award plan | — | | | — | | | 0.4 | | | — | | | (2.4) | | | — | | | (52.6) | | | — | | | — | | | (55.0) | | | — | | | (55.0) | | | Compensation expense related to share-based payments | — | | | — | | | — | | | — | | | 246.6 | | | — | | | — | | | — | | | — | | | 246.6 | | | — | | | 246.6 | | | Other | — | | | — | | | — | | | — | | | 1.5 | | | — | | | — | | | — | | | — | | | 1.5 | | | — | | | 1.5 | | | Balance, December 31, 2021 | — | | | $ | — | | | 170.8 | | | $ | 0.1 | | | $ | 68.2 | | | $ | (106.7) | | | $ | 13,911.7 | | | (23.8) | | | $ | (2,977.1) | | | $ | 10,896.2 | | | $ | 63.5 | | | $ | 10,959.7 | |
See accompanying notes to these consolidated financial statements.
BIOGEN INC. AND SUBSIDIARIES NOTES TO CONSOLIDATED FINANCIAL STATEMENTS
| | | | | | | Note 1: | Summary of Significant Accounting Policies |
References in these notes to "Biogen," the "company," "we," "us" and "our" refer to Biogen Inc. and its consolidated subsidiaries. Business Overview Biogen is a global biopharmaceutical company focused on discovering, developing and delivering innovative therapies for people living with serious and complex diseases worldwide. We capitalize inventory costs associated withhave a broad portfolio of medicines to treat MS, have introduced the first approved treatment for SMA, co-developed treatments to address a defining pathology of Alzheimer’s disease and launched the first approved treatment to target a genetic cause of ALS. Through our products prior to regulatory approval, when, based on management’s judgment, future commercialization is considered probable2023 acquisition of Reata we market the first and only drug approved in the U.S. and the future economic benefit is expected to be realized. We consider numerous attributes in evaluating whether the costs to manufacture a particular product should be capitalized as an asset. We assess the regulatory approval process and where the particular product stands in relation to that approval process, including any known safety or efficacy concerns, potential labeling restrictions and other impediments to approval. We evaluate our anticipated research and development initiatives and constraints relating to the product and the indication in which it will be used. We consider our manufacturing environment including our supply chain in determining logistical constraints that could hamper approval or commercialization. We consider the shelf life of the product in relation to the expected timeline for approval and we consider patent related or contract issues that may prevent or delay commercialization. We also base our judgment on the viability of commercialization, trends in the marketplace and market acceptance criteria. Finally, we consider the reimbursement strategies that may prevail with respect to the product and assess the economic benefit that we are likely to realize. We expense previously capitalized costs related to pre-approval inventory upon a change in such judgment, due to, among other potential factors, a denial or significant delay of approval by necessary regulatory bodies. All changes in judgment in relation to pre-approval inventory have historically been insignificant. Acquired Intangible Assets, including In-process Research and Development (IPR&D)
When we purchase a business, the acquired IPR&D is measured at fair value, capitalized as an intangible asset and tested for impairment at least annually, as of October 31, until commercialization, after which time the IPR&D is amortized over its estimated useful life. If we acquire an asset or group of assets that do not meet the definition of a business under applicable accounting standards, the acquired IPR&D is expensed upon its acquisition date. Future costs to develop these assets are recorded to research and development expense as they are incurred.
We have acquired, and expect to continue to acquire, intangible assets through the acquisition of biotechnology companies or through the consolidation of variable interest entities. These intangible assets primarily consist of technology associated with human therapeutic products and IPR&D product candidates. When significant identifiable intangible assets are acquired, we generally engage an independent third-party valuation firm to assist in determining the fair values of these assets as of the acquisition date. Management will determine the fair value of less significant identifiable intangible assets acquired. Discounted cash flow models are typically used in these valuations, and these models require the use of significant estimates and assumptions including but not limited to:
estimating the timing of and expected costs to complete the in-process projects;
projecting regulatory approvals;
estimating future cash flows from product sales resulting from completed products and in process projects; and
developing appropriate discount rates and probability rates by project.
We believe the fair values assigned to the intangible assets acquired are based upon reasonable estimates and assumptions given available facts and circumstances as of the acquisition dates.
If these projects are not successfully developed, the sales and profitability of the company may be adversely affected in future periods. Additionally, the value of the acquired intangible assets may become impaired. We believe that the foregoing assumptions used in the IPR&D analysis were reasonable. No assurance can be given that the underlying assumptions used to estimate expected project sales, development costs or profitability, or the events associated with such projects, will transpire as estimated.
Certain IPR&D programs have a fair value that is not significantly in excess of carrying value, including our programE.U. for the treatment of TGN. SuchFriedreich's Ataxia in adults and adolescents aged 16 years and older. We are focused on advancing our pipeline in neurology, specialized immunology and rare diseases. We support our drug discovery and development efforts through internal research and development programs could become impaired if assumptions usedand external collaborations.
Our marketed products include TECFIDERA, VUMERITY, AVONEX, PLEGRIDY, TYSABRI and FAMPYRA for the treatment of MS; SPINRAZA for the treatment of SMA; SKYCLARYS for the treatment of Friedreich's Ataxia; QALSODY for the treatment of ALS; and FUMADERM for the treatment of severe plaque psoriasis. We also have collaborations with Eisai on the commercialization of LEQEMBI for the treatment of Alzheimer's disease and Sage on the commercialization of ZURZUVAE for the treatment of PPD and we have certain business and financial rights with respect to RITUXAN for the treatment of non-Hodgkin's lymphoma, CLL and other conditions; RITUXAN HYCELA for the treatment of non-Hodgkin's lymphoma and CLL; GAZYVA for the treatment of CLL and follicular lymphoma; OCREVUS for the treatment of PPMS and RMS; LUNSUMIO for the treatment of relapsed or refractory follicular lymphoma; COLUMVI, a bispecific antibody for the treatment of non-Hodgkin's lymphoma; and have the option to add other potential anti-CD20 therapies, pursuant to our collaboration arrangements with Genentech, a wholly-owned member of the Roche Group. We commercialize a portfolio of biosimilars of advanced biologics including BENEPALI, an etanercept biosimilar referencing ENBREL, IMRALDI, an adalimumab biosimilar referencing HUMIRA, and FLIXABI, an infliximab biosimilar referencing REMICADE, in determining the fair value change. Impairment and Amortization of Long-lived Assets and Accounting for Goodwill
Long-lived Assets Other than Goodwill
Long-lived assets to be held and used include property, plant and equipmentcertain countries in Europe, as well as intangible assets, including IPR&D and trademarks. Property, plant and equipment are reviewed for impairment whenever events or changesBYOOVIZ, a ranibizumab biosimilar referencing LUCENTIS, in circumstances indicate that the carrying amount of the assets may not be recoverable. We review our intangible assets with indefinite lives for impairment annually, as of October 31, and whenever events or changes in circumstances indicate that the carrying value of an asset may not be recoverable.
When performing our impairment assessment, we calculate the fair value using the same methodology as described above under "Acquired Intangible Assets, including In-process Research and Development (IPR&D)". If the carrying value of our acquired IPR&D exceeds its fair value, then the intangible asset is written-down to its fair value. Certain IPR&D programs have a fair value that is not significantly in excess of carrying value, including treatments for forms of neuropathic pain, such as TGN. Such programs could become impaired if assumptions used in determining the fair value change.
Our most significant intangible assets are our acquired and in-licensed rights and patents and developed technology. Acquired and in-licensed rights and patents primarily relate to obtaining the fair value of the U.S. and rest of world licenses to Forward Pharma's intellectual property, including Forward Pharma's intellectual property related to TECFIDERA, and our acquisition of all remainingcertain international markets. We also have exclusive rights to TYSABRI from Elan. Developed technology primarily relatescommercialize TOFIDENCE, a tocilizumab biosimilar referencing ACTEMRA. We continue to our AVONEXdevelop potential biosimilar product which was recorded in connection with the merger of Biogen, Inc. and IDEC Pharmaceuticals Corporation in 2003. We amortize the intangible assets related to TECFIDERA, TYSABRI and AVONEX using the economic consumption method based on revenues generated from the products underlying the related intangible assets. An analysis of the anticipated lifetime revenues of TECFIDERA, TYSABRI and AVONEX is performed annually during our long-range planning cycle, which is generally updated in the third quarter of each year, and whenever events or changes in circumstances would significantly affect the anticipated lifetime revenues of TECFIDERA, TYSABRI or AVONEX.SB15, a proposed aflibercept biosimilar referencing EYLEA.
For additional information on the impairment charges related to our long-lived assets during 2017 and 2016,collaboration arrangements, please read Note 7, Intangible Assets19, Collaborative and Goodwill,Other Relationships, to our consolidated financial statements included in this report. Impairment charges Consolidation Our consolidated financial statements reflect our financial statements, those of our wholly-owned subsidiaries and variable interest entities where we are the primary beneficiary. For consolidated entities where we own or are exposed to less than 100.0% of the economics, we record net income (loss) attributable to noncontrolling interests, net of tax in our consolidated statements of income equal to the percentage of the economic or ownership interest retained in such entities by the respective noncontrolling parties. Intercompany balances and transactions are eliminated in consolidation. In determining whether we are the primary beneficiary of a variable interest entity, we apply a qualitative approach that determines whether we have both (1) the power to direct the economically significant activities of the entity and (2) the obligation to absorb losses of, or the right to receive benefits from, the entity that could potentially be significant to that entity. We continuously assess whether we are the primary beneficiary of a variable interest entity as changes to existing relationships or future transactions may result in us consolidating or deconsolidating one or more of our collaborators or partners. In November 2023 we terminated the Neurimmune Agreement, which resulted in the deconsolidation of our variable interest entity, Neurimmune. Use of Estimates The preparation of our consolidated financial statements requires us to make estimates, judgments and assumptions that may affect the reported amounts of assets, liabilities, equity, revenue and expense and related
BIOGEN INC. AND SUBSIDIARIES NOTES TO CONSOLIDATED FINANCIAL STATEMENTS — (Continued) disclosure of contingent assets and liabilities. On an ongoing basis we evaluate our estimates, judgments and assumptions. We base our estimates on historical experience and on various other assumptions that we believe are reasonable, the results of which form the basis for making judgments about the carrying values of assets, liabilities and equity and the amount of revenue and expense. Actual results may differ from these estimates. Revenue Recognition We recognize revenue when our customer obtains control of promised goods or services, in an amount that reflects the consideration which we expect to receive in exchange for those goods or services. We recognize revenue following the five-step model prescribed under FASB ASC 606, Revenue from Contracts with Customers: (i) identify contract(s) with a customer; (ii) identify the performance obligations in the contract; (iii) determine the transaction price; (iv) allocate the transaction price to the performance obligations in the contract; and (v) recognize revenue when (or as) we satisfy the performance obligations. Product Revenue In the U.S., we sell our products primarily to wholesale and specialty distributors and specialty pharmacies. In other countries, we sell our products primarily to wholesale distributors, hospitals, pharmacies and other third-party distribution partners. These customers subsequently resell our products to health care providers and patients. In addition, we enter into arrangements with health care providers and payors that provide for government-mandated or privately-negotiated discounts and allowances related to our long-lived assets during 2015 were insignificant.
Product revenue is recognized when the customer obtains control of our product, which occurs at a point in time, typically upon delivery to the customer. We expense incremental costs of obtaining a contract as and when incurred if the expected amortization period of the asset that we would have recognized is one year or less or the amount is immaterial.
Reserves for Discounts and Allowances Product revenue is recorded net of reserves established for applicable discounts and allowances that are offered within contracts with our customers, health care providers or payors, including those associated with the implementation of pricing actions in certain of the international markets in which we operate. Product revenue reserves, which are classified as a reduction in product revenue, are generally characterized in the following categories: discounts, contractual adjustments and returns. These reserves are based on estimates of the amounts earned or to be claimed on the related sales and are classified as reductions of accounts receivable (if the amount is payable to our customer) or a liability (if the amount is payable to a party other than our customer). Our estimates of reserves established for variable consideration are calculated based upon a consistent application of our methodology utilizing the expected value method. These estimates reflect our historical experience, current contractual and statutory requirements, specific known market events and trends, industry data and forecasted customer buying and payment patterns. The transaction price, which includes variable consideration reflecting the impact of discounts and allowances, may be subject to constraint and is included in the net sales price only to the extent that it is probable that a significant reversal of the amount of the cumulative revenue recognized will not occur in a future period. Actual amounts may ultimately differ from our estimates. If actual results vary, we adjust these estimates, which could have an effect on earnings in the period of adjustment. Discounts include trade term discounts and wholesaler incentives. Trade term discounts and wholesaler incentives primarily relate to estimated obligations for credits to be granted to wholesalers for remitting payment on their purchases within established incentive periods and credits to be granted to wholesalers for compliance with various contractually-defined inventory management practices, respectively. We determine these reserves based on our historical experience, including the timing of customer payments. Contractual adjustments primarily relate to Medicaid and managed care rebates in the U.S., pharmacy rebates, co-payment (copay) assistance, VA and PHS discounts, specialty pharmacy program fees and other governmental rebates or applicable allowances. •Medicaid rebates: relate to our estimated obligations to states under established reimbursement arrangements. Rebate accruals are recorded in the same period the related revenue is recognized, resulting in a reduction of product revenue and the establishment of a liability which is included in accrued expense and other current liabilities in our consolidated balance sheets. Our liability for Medicaid rebates consists of estimates for claims
Goodwill relates largelyBIOGEN INC. AND SUBSIDIARIES
NOTES TO CONSOLIDATED FINANCIAL STATEMENTS — (Continued) that a state will make for the current quarter, claims for prior quarters that have been estimated for which an invoice has not been received, invoices received for claims from the prior quarters that have not been paid and an estimate of potential claims that will be made for inventory that exists in the distribution channel at period end. •Governmental rebates: or chargebacks, including VA and PHS discounts, represent our estimated obligations resulting from contractual commitments to sell products to qualified healthcare providers at prices lower than the list prices we charge to wholesalers which provide those products. The wholesaler charges us for the difference between what the wholesaler pays for the products and the ultimate selling price to the qualified healthcare providers. Rebate and chargeback reserves are established in the same period as the related revenue is recognized, resulting in a reduction of product revenue and a reduction in the net accounts receivable. Chargeback amounts are generally determined at the time of resale to the qualified healthcare provider from the wholesaler, and we generally issue credits for such amounts within a few weeks of the wholesaler notifying us about the resale. Our reserves for VA, PHS and other chargebacks consist of amounts for inventory that aroseexists at the wholesalers that we expect will be sold to qualified healthcare providers and chargebacks that wholesalers have claimed for which we have not issued a credit. •Managed care rebates: represent our estimated obligations to third-parties, primarily pharmacy benefit managers. Rebate accruals are recorded in the same period the related revenue is recognized, resulting in a reduction of product revenue and the establishment of a liability which is included in accrued expense and other current liabilities in our consolidated balance sheets. These rebates result from performance-based goals, formulary position and price increase limit allowances (price protection). The calculation of the accrual for these rebates is based on an estimate of the coverage patterns and the resulting applicable contractual rebate rate(s) to be earned over a contractual period. •Copay assistance: represents financial assistance to qualified patients, assisting them with prescription drug co-payments required by insurance. The calculation of the accrual for copay is based on an estimate of claims and the cost per claim that we expect to receive associated with inventory that exists in the distribution channel at period end. •Pharmacy rebates: represent our estimated obligations resulting from contractual commitments to sell products to specific pharmacies. Rebate accruals are recorded in the same period the related revenue is recognized, resulting in a reduction of product revenue and the establishment of a liability which is included in accrued expense and other current liabilities in our consolidated balance sheets. These rebates result from contracted discounts on product purchased or product dispensed. The calculation of the accrual for these rebates is based on an estimate of the pharmacy’s buying or dispensing patterns and the resulting applicable contractual rebate rate(s) to be earned over the contractual period. •Other governmental rebates: non-U.S. pharmaceutical taxes or applicable allowances primarily relate to mandatory rebates and discounts in international markets where government-sponsored healthcare systems are the primary payors for healthcare. Product return reserves are established for returns made by wholesalers and are recorded in the period the related revenue is recognized, resulting in a reduction to product revenue. In accordance with contractual terms, wholesalers are permitted to return product for reasons such as damaged or expired product. The majority of wholesaler returns are due to product expiration. Expired product return reserves are estimated through a comparison of historical return data to their related sales on a production lot basis. Historical rates of return are determined for each product and are adjusted for known or expected changes in the marketplace specific to each product. In addition to discounts, rebates and product returns, we also maintain certain customer service contracts with distributors and other customers in the distribution channel that provide us with inventory management, data and distribution services, which are generally reflected as a reduction of revenue. To the extent we can demonstrate a separable benefit and fair value for these services we classify these payments in selling, general and administrative expense in our consolidated statements of income. Revenue from Anti-CD20 Therapeutic Programs Our collaboration with Genentech is within the scope of ASC 808, Collaborative Agreements, which provides guidance on the presentation and disclosure of collaborative arrangements. For purposes of this footnote, we refer to RITUXAN and RITUXAN HYCELA collectively as RITUXAN.
BIOGEN INC. AND SUBSIDIARIES NOTES TO CONSOLIDATED FINANCIAL STATEMENTS — (Continued) Our share of the pre-tax co-promotion profits on RITUXAN, GAZYVA and LUNSUMIO and royalty revenue on sales of OCREVUS, resulted from an exchange of a license. As we do not have future performance obligations under the license or collaboration agreement, revenue is recognized as the underlying sales occur. Revenue from anti-CD20 therapeutic programs consist of: (i) our share of pre-tax profits and losses in the U.S. for RITUXAN, GAZYVA and LUNSUMIO; (ii) royalty revenue on sales of OCREVUS; and (ii) other revenue from anti-CD20 therapeutic programs, which consists of our share of pre-tax co-promotion profits on RITUXAN in Canada, royalties on net sales of COLUMVI in the U.S. and royalties on sales of LUNSUMIO outside the U.S. Pre-tax co-promotion profits on RITUXAN, GAZYVA and LUNSUMIO are calculated and paid to us by Genentech and the Roche Group. Pre-tax co-promotion profits consist of net sales to third-party customers less applicable costs to manufacture, third-party royalty expense, distribution, selling and marketing expense and joint development expense incurred by Genentech and the Roche Group. Our share of the pre-tax profits on RITUXAN, GAZYVA and LUNSUMIO include estimates that are based on information received from Genentech and the Roche Group. These estimates are subject to change and actual results may differ. We recognize royalty revenue on sales of OCREVUS based on our estimates from third party and market research data of OCREVUS sales occurring during the corresponding period. Differences between actual and estimated royalty revenue will be adjusted for in the period in which they become known, which is generally expected to be the following quarter. Prior to regulatory approval, we record our share of the expense incurred by the collaboration for the development of anti-CD20 products within research and development expense and pre-commercialization costs within selling, general and administrative expense in our consolidated statements of income. After an anti-CD20 product is approved, we record our share of the development and sales and marketing expense related to that product as a reduction of our share of pre-tax profits in revenue from anti-CD20 therapeutic programs. Accordingly, Biogen recorded its share of the expense incurred in connection with the mergerdevelopment of Biogen, Inc.LUNSUMIO within research and IDEC Pharmaceuticals Corporationdevelopment expense and its share of pre-commercialization costs within selling, general and administrative expense through December 2022, when regulatory approval was granted by the FDA. Beginning in 2003January 2023 our share of pre-tax profits and losses in the U.S. for LUNSUMIO was reflected as a component of revenue from anti-CD20 therapeutic programs within our consolidated statements of income. For additional information on our relationship with Genentech, please read Note 19, Collaborative and Other Relationships, to these consolidated financial statements. Contract Manufacturing, Royalty and Other Revenue Contract Manufacturing Revenue We record contract manufacturing revenue primarily from amounts earned under contract manufacturing agreements with our strategic customers. Revenue under contract manufacturing agreements is recognized when the customer obtains control of the product, which may occur at a point in time or over time depending on the terms and conditions of the agreement. During the first quarter of 2023 we began recognizing contract manufacturing revenue for LEQEMBI, upon accelerated approval of LEQEMBI in the U.S. Prior to accelerated approval, our share of contract manufacturing amounts related to LEQEMBI were recognized in research and development expense within our consolidated statements of income. Royalty and Other Revenue Royalty and other revenue primarily reflects the royalties we receive from net sales on products related to patents that we have out-licensed, as well as royalty revenue on biosimilar products from our collaboration arrangements with Samsung Bioepis and our 50.0% share of LEQEMBI product revenue, net and cost of sales, including royalties, as we are being paidnot the principal. These arrangements resulted from an exchange of a license and utilize the sales and usage based royalty exception. Therefore, royalties received are recognized as the underlying sales occur.
BIOGEN INC. AND SUBSIDIARIES NOTES TO CONSOLIDATED FINANCIAL STATEMENTS — (Continued) Collaborative and Other Relationships We also have a number of significant collaborative and other third-party relationships for revenue and for the development, regulatory approval, commercialization and marketing of certain of our products and product candidates. Where we are the principal on sales transactions with third parties, we recognize revenue, cost of sales and operating expense on a gross basis in connectiontheir respective lines in our consolidated statements of income. Where we are not the principal on sales transactions with third parties, our share of the acquisitionrevenue, cost of Fumapharm AG. sales and operating expense is recorded as a component of other revenue in our consolidated statements of income. Our goodwill balancesdevelopment and commercialization arrangements with Genentech, Eisai, Sage and Samsung Bioepis represent collaborative arrangements as each party is an active participant in one or more joint operating activities and is exposed to significant risks and rewards of these arrangements. These arrangements resulted from an exchange of a license and utilize the difference betweensales and usage based royalty exception, as applicable. Therefore, revenue relating to royalties or profit-sharing amounts received is recognized as the purchase priceunderlying sales occur. For additional information on our collaboration arrangements with Genentech, Eisai, Sage and theSamsung Bioepis, please read Note 19, Collaborative and Other Relationships, to these consolidated financial statements. Fair Value Measurements We have certain financial assets and liabilities recorded at fair value of the identifiable tangible and intangible net assets when accounted for using the purchase method of accounting. We assess our goodwill balance within our single reporting unit annually, as of October 31, and whenever events or changes in circumstances indicate the carrying value of goodwill may not be recoverable to determine whether any impairment in this asset may exist and, if so, the extent of such impairment. We compare the fair value of our reporting unit to its carrying value. If the carrying value of the net assets assigned to the reporting unit exceeds the fair value of our reporting unit, we would record an impairment loss equal to the difference.
We completed our required annual impairment test in the fourth quarters of 2017, 2016 and 2015, respectively, and determined in each of those periods that the carrying value of goodwill was not impaired. In each year, the fair value of our reporting unit, which includes goodwill, was significantly in excess of the carrying value of our reporting unit.
Investments, including Fair Value Measures and Impairments
We invest in various types of securities, including short-term and long-term marketable securities, principally corporate notes, government securities including government sponsored enterprise mortgage-backed securities and credit card and auto loan asset-backed securities, in which our excess cash balances are invested.
In accordance with the accounting standard for fair value measurements, we have been classified our financial assets as Level 1, 2 or 3 within the fair value hierarchy.hierarchy as described in the accounting standards for fair value measurements.
•Level 1 — Fair values are determined by Level 1 inputs utilizeutilizing quoted prices (unadjusted) in active markets for identical assets or liabilities that we have the ability to access.access; •Level 2 — Fair values are determined by Level 2utilizing quoted prices for identical or similar assets and liabilities in active markets or other market observable inputs utilize data points that are observable such as quoted prices, interest rates, yield curves, and foreign currency spot rates. Fair values determined by rates and option pricing valuation models; and •Level 3 — Prices or valuations that require inputs utilize unobservable data points forthat are both significant to the asset. fair value measurement and unobservable.As noted in Note 8, Fair Value Measurements, to our consolidated financial statements included in this report, aThe majority of our financial assets have been classified as Level 2. TheseOur financial assets (which typically include our cash equivalents, marketable debt securities and certain of our marketable equity securities, derivative contracts and plan assets for deferred compensation) have been initially valued at the transaction price and subsequently valued, at the end of each reporting period, utilizing third-party pricing services.services or option pricing valuation models. The pricing services use manyutilize industry standard valuation models, including both income and market-based approaches and observable market inputs to determine value, includingvalue. These observable market inputs include reportable trades, benchmark yields, credit spreads, broker/dealer quotes, bids, offers, current spot rates and other industry and economic events.
We validate the prices provided by our third-party pricing services by understanding the models used, obtaining market values from other pricing sources and analyzing pricing data in certain instances. The option pricing valuation models use assumptions within the model, including the term, stock price volatility, constant maturity risk-free interest rate and dividend yield. After completing our validation procedures, we did not adjust or override any fair value measurements provided by our pricing services as of December 31, 2023 and 2022. ImpairmentOther Assets and Liabilities
The carrying amounts reflected in our consolidated balance sheets for current accounts receivable, due from anti-CD20 therapeutic programs, other current assets, accounts payable and accrued expense and other, approximate fair value due to their short-term maturities. Cash and Cash Equivalents We consider only those investments that are highly liquid, readily convertible to cash and that mature within three months from date of purchase to be cash equivalents. As of December 31, 2023 and 2022, cash equivalents were comprised of money market funds, commercial paper, overnight reverse repurchase agreements and other debt securities with maturities less than three months from the date of purchase.
BIOGEN INC. AND SUBSIDIARIES NOTES TO CONSOLIDATED FINANCIAL STATEMENTS — (Continued) Accounts Receivable The majority of our accounts receivable arise from product sales and primarily represent amounts due from our wholesale and other third-party distributors, public hospitals, pharmacies and other government entities and have standard payment terms that generally require payment within 30 to 90 days. We do not adjust our receivables for the effects of a significant financing component at contract inception if we expect to collect the receivables in one year or less from the time of sale. We provide reserves against accounts receivable for estimated losses that may result from a customer's inability to pay. Amounts determined to be uncollectible are charged or written-off against the reserve. Receivables from Samsung BioLogics In April 2022 we completed the sale of our 49.9% equity interest in Samsung Bioepis to Samsung BioLogics, which resulted in a receivable of approximately $1.3 billion in cash to be deferred over two payments. The first deferred payment of $812.5 million was received in April 2023 and the second deferred payment of $437.5 million is due at the second anniversary of the closing of this transaction in April 2024. The payments due to us from Samsung BioLogics have been recorded at their estimated fair values through the use of risk-adjusted discount rates. For additional information on the accounting for the sale of our equity interest in Samsung Bioepis, please read Note 3, Dispositions, to these consolidated financial statements. Concentration of Credit Risk Financial instruments that potentially subject us to concentrations of credit risk include cash and cash equivalents, investments, derivatives and accounts receivable. We attempt to minimize the risks related to cash and cash equivalents and investments by investing in a broad and diverse range of financial instruments as previously defined by us. We have established guidelines related to credit ratings and maturities intended to safeguard principal balances and maintain liquidity. Our investment portfolio is maintained in accordance with our investment policy, which defines allowable investments, specifies credit quality standards and limits the credit exposure of any single issuer. We minimize credit risk resulting from derivative instruments by choosing only highly rated financial institutions as counterparties. Concentrations of credit risk with respect to receivables, which are typically unsecured, are somewhat mitigated due to the wide variety of customers and markets using our products, as well as their dispersion across many different geographic areas. We monitor the financial performance and creditworthiness of our customers so that we can properly assess and respond to changes in their credit profile. We continue to monitor these conditions and assess their possible impact on our business. Marketable Securities and Other Investments Marketable Debt Securities Available-for-sale marketable debt securities are recorded at fair market value and unrealized gains and losses are included in AOCI in equity, net of related tax effects, unless the security has experienced a credit loss, we have determined that we have the intent to sell the security or we have determined that it is more likely than not that we will have to sell the security before its expected recovery. Realized gains and losses are reported in other (income) expense, net on a specific identification basis. During the third quarter of 2023 we sold all of our marketable debt securities and used the proceeds to partially fund our acquisition of Reata. For additional information on our acquisition of Reata, please read Note 2, Acquisitions, to these consolidated financial statements. Marketable Equity Securities and Venture Capital Funds Our marketable equity securities are recorded at fair market value and unrealized gains and losses are included in other (income) expense, net in our consolidated statements of income. Our marketable equity securities represent investments in publicly traded equity securities and are included in investments and other assets in our consolidated balance sheets. Our investments in venture capital funds are recorded at net asset value, which approximates fair value, and unrealized gains and losses are included in other (income) expense, net in our consolidated statements of income.
BIOGEN INC. AND SUBSIDIARIES NOTES TO CONSOLIDATED FINANCIAL STATEMENTS — (Continued) The underlying investments of the venture capital funds in which we invest are in equity securities of certain biotechnology companies and are included in investments and other assets in our consolidated balance sheets. Non-Marketable Equity Securities We also invest in equity securities of companies whose securities are not publicly traded and where fair value is not readily available. These investments are recorded using either the equity method of accounting or the cost minus impairment adjusted for observable price changes, depending on our ownership percentage and other factors that suggest we have significant influence. We monitor these investments to evaluate whether any increase or decline in their value has occurred, based on the implied value of recent company financings, public market prices of comparable companies and general market conditions. These investments are included in investments and other assets in our consolidated balance sheets. Evaluating Marketable Debt Securities for Other-than-Temporary Impairments We conduct periodic reviews to identify and evaluate each investment that has an unrealized loss, in accordance with the meaning of other-than-temporary impairment and its application to certain investments.impairment. An unrealized loss exists when the current fair value of an individual security is less than its amortized cost basis. Unrealized losses on available-for-sale debt securities that are determined to be temporary, and not related to credit loss, are recorded, net of tax, in accumulated other comprehensive income.AOCI. For available-for-sale debt securities with unrealized losses, management performs an analysis to assess whether we intend to sell or whether we would more likely than not be required to sell the security before the expected recovery of the amortized cost basis. Where we intend to sell a security, or may be required to do so, the security’s decline in fair value is deemed to be other-than-temporary and the full amount of the unrealized loss is reflected withinin earnings as an impairment loss. Regardless of our intent to sell a security, we perform additional analysis on all securities with unrealized losses to evaluate losses associated with the creditworthiness of the security. Credit losses are identified where we do not expect to receive cash flows sufficient to recover the amortized cost basis of a securitysecurity. Equity Method of Accounting In circumstances where we have the ability to exercise significant influence over the operating and are reflected within earnings asfinancial policies of a company in which we have an impairment loss. Share-Based Compensation
We make certain assumptions in order to valueinvestment, we utilize the equity method of accounting for recording investment activity. In assessing whether we exercise significant influence, we consider the nature and record expense associated with awards made under our share-based compensation arrangements. Changes in these assumptions may lead to variability with respect to the amount of expense we recognize in connection with share-based payments.
Determining the appropriate valuation model and related assumptions requires judgment, and includes estimating the expected market pricemagnitude of our stock on vesting dateinvestment, the voting and stock price volatility as wellprotective rights we hold, any participation in the governance of the other company and other relevant factors such as the termpresence of a collaborative or other business relationship. Under the expected awards. Determining the appropriate amount to expense based on the anticipated achievementequity method of performance targets requires judgment, including forecasting the achievement of future financial targets. The estimate of expense is revised periodically based on the probability of achieving the required performance targets and adjustments are made throughout the term as appropriate. The cumulative impact of any revision is reflected in the period of change.
We also estimate forfeitures over the requisite service period when recognizing share-based compensation expense based on historical rates and forward-looking factors. These estimates are adjusted to the extent that actual forfeitures differ, or are expected to materially differ, from our estimates.
Contingent Consideration
For acquisitions completed before January 1, 2009,accounting, we record contingent consideration resulting from a business combination when the contingency is resolved. For acquisitions completed after January 1, 2009, we record contingent consideration resulting from a business combination at its fair value on the acquisition date. Each reporting period thereafter, we revalue these obligations and record increases or decreases in their fair value as an adjustment to contingent consideration expense in our consolidated statements of income. Changes in the fair value of the contingent consideration obligations can result from changes to one or multiple inputs including adjustments to the discount rates and achievement and timing of any cumulative sales-based and development milestones, or changes in the probability of certain clinical events and changes in the assumed probability associated with regulatory approval. These fair value measurements represent Level 3 measurements as they are based on significant inputs not observable in the market.
Significant judgment is employed in determining the appropriateness of these assumptions as of the acquisition date and for each subsequent period. Accordingly, changes in assumptions described above, could have a material impact on the amount of contingent consideration expense we record in any given period.
Restructuring Charges
We have made estimates and judgments regarding the amount and timing of our restructuring expense and liability, including current and future period termination benefits, pipeline program termination costs and other exit costs to be incurred when related actions take place. Severance and other related costs are reflected in our consolidated statements of income as a componentour share of total restructuring charges incurred. Actual results may differ from these estimates.income or loss of the other company. If our share of losses exceeds the carrying value of our investment, we will suspend recognizing additional losses and will continue to do so unless we commit to providing additional funding.
Income TaxesInventory
We prepare and file income tax returnsInventories are stated at the lower of cost or net realizable value with cost based on the first-in, first-out method. We classify our interpretation of each jurisdiction’s tax lawsinventory costs as long-term when we expect to utilize the inventory beyond our normal operating cycle and regulations. In preparing our consolidated financial statements, we estimate our income tax liabilityinclude these costs in each of the jurisdictions in which we operate by estimating our actual current tax expense together with assessing temporary differences resulting from differing treatment of items for taxinvestments and financial reporting purposes. These differences result in deferred taxother assets and liabilities, which are included in our consolidated balance sheets. Significant management judgment is required in assessing the realizability of our deferred tax assets. In performing this assessment, we consider whether it is more likely than notInventory that some portion or all of the deferred tax assets will not be realized. The ultimate realization of deferred tax assets is dependent upon the generation of future taxable income during the periods in which those temporary differences become deductible. In making this determination, under the applicable financial accounting standards, we are allowed to consider the scheduled reversal of deferred tax liabilities, projected future taxable income and the effects of tax planning strategies. Our estimates of future taxable income include, among other items, our estimates of future income tax deductions related to the exercise of stock options. In the event that actual results differ from our estimates, we adjust our estimates in future periods and we may need to establish a valuation allowance, which could materially impact our consolidated financial position and results of operations.
All tax effects associated with intercompany transfers of assets within our consolidated group, both current and deferred, are recorded as a prepaid tax or deferred charge and recognized through our consolidated statements of income when the asset transferred is sold to a third-party or otherwise recovered through amortization of the asset's remaining economic life. If the asset transferred becomes impaired, for example through the obsolescence of inventory or the discontinuation of a research program, we will expense any remaining deferred charge or prepaid tax. As of December 31,
2017, total deferred charges and prepaid taxes were $617.7 million. For additional information on the new accounting standard related to tax effects associated with intercompany transfers of assets within our consolidated group, please read Note 1, Summary of Significant Accounting Policies: New Accounting Pronouncements, to our consolidated financial statements included in this report.
We account for uncertain tax positions using a “more-likely-than-not” threshold for recognizing and resolving uncertain tax positions. We evaluate uncertain tax positions on a quarterly basis and consider various factors that include, but are not limited to, changes in tax law, the measurement of tax positions taken or expected to be taken in tax returns, the effective settlement of matters subject to audit, information obtained during in process audit activities and changes in facts or circumstances related to a tax position. We adjust the level of the liability to reflect any subsequent changes in the relevant facts surrounding the uncertain positions. Our liabilities for uncertain tax positions can be relieved only ifused in either the contingency becomes legally extinguished, through either payment to the taxing authorityproduction of clinical or the expiration of the statute of limitations, the recognition of the benefits associated with the position meet the “more-likely-than-not” threshold or the liability becomes effectively settled through the examination process. We consider matters to be effectively settled once the taxing authority has completed all of its required or expected examination procedures, including all appealscommercial products is expensed as research and administrative reviews, we have no plans to appeal or litigate any aspect of the tax position, and we believe that it is highly unlikely that the taxing authority would examine or re-examine the related tax position. We also accruedevelopment costs when identified for potential interest and penalties related to unrecognized tax benefits in income tax expense.
We earn a significant amount of our operating income outside the U.S. As a result, a portion of our cash, cash equivalents and marketable securities are held by foreign subsidiaries.
On December 22, 2017, the 2017 Tax Act was signed into law and has resulted in significant changes to the U.S. corporate income tax system.
The 2017 Tax Act eliminates the deferral of U.S. income tax on the historical unrepatriated earnings by imposing the Transition Toll Tax, which is a one-time mandatory deemed repatriation tax on undistributed foreign earnings. The Transition Toll Tax is assessed on the U.S. shareholder's share of the foreign corporation's accumulated foreign earnings that have not previously been taxed. Earnings in the form of cash and cash equivalents will be taxed at a rate of 15.5% and all other earnings will be taxed at a rate of 8.0%. As of December 31, 2017, we have accrued
income tax liabilities of $989.6 million under the Transition Toll Tax, of which $78.3 million is expected to be paid within one year. The Transition Toll Tax will be paid over an eight-year period, starting in 2018, and will not accrue interest.
New Accounting Standards
For a discussion of new accounting standards and their expected impact on our consolidated financial statements or disclosures, please read Note 1, Summary of Significant Accounting Policies, to our consolidated financial statements included in this report.
Item 7A. Quantitative and Qualitative Disclosures About Market Risk
Market Risk
We are subject to certain risks that may affect our results of operations, cash flows and fair values of assets and liabilities, including volatility in foreign currency exchange rates, interest rate movements, pricing pressures worldwide and weak economic conditions in the foreign markets in which we operate. We manage the impact of foreign currency exchange rates and interest rates through various financial instruments, including derivative instruments such as foreign currency forward contracts, interest rate lock contracts and interest rate swap contracts. We do not enter into financial instruments for trading or speculative purposes. The counterparties to these contracts are major financial institutions, and there is no significant concentration of exposure with any one counterparty.
Foreign Currency Exchange Risk
Our results of operations are subject to foreign currency exchange rate fluctuations due to the global nature of our operations. We have operations or maintain distribution relationships in the U.S., Europe, Canada, Asia, and Central and South America. In addition, we recognize our share of pre-tax co-promotion profits on RITUXAN in Canada. As a result, our consolidated financial position, results of operations and cash flows can be affected by market fluctuations in foreign currency exchange rates, primarily with respect to the Euro, British pound sterling, Canadian dollar, Swiss franc, Danish krone and Japanese yen.
While the financial results of our global activities are reported in U.S. dollars, the functional currency for most of our foreign subsidiaries is their respective local currency. Fluctuations in the foreign currency exchange rates of the countries in which we do business will affect our operating results, often in ways that are difficult to predict. In particular, as the U.S. dollar strengthens versus other currencies, the value of the non-U.S. revenues will decline when reported in U.S. dollars. The impact to net income as a result of a strengthening U.S. dollar will be partially mitigated by the value of non-U.S. expenses, which will also decline when reported in U.S. dollars. As the U.S. dollar weakens versus other currencies, the value of the non-U.S. revenues and expenses will increase when reported in U.S. dollars.
We have established revenue and operating expense hedging and balance sheet risk management programs to protect against volatility of future foreign currency cash flows and changes in fair value caused by volatility in foreign currency exchange rates.
In June 2016 the U.K. voteduse in a referendum to voluntarily depart from the E.U., known as Brexit, and in March 2017, the U.K. formally started the process for the U.K. to leave the E.U. The macroeconomic impact on our results of operations from these developments remains unknown. To date, the foreign currency exchange impact has been insignificant since we hedged the balance sheet foreign currency exchange risk.clinical manufacturing campaign.
Revenue and Operating Expense Hedging Program
Our foreign currency hedging program is designed to mitigate, over time, a portion of the impact resulting from volatility in exchange rate changes on revenues and operating expenses. We use foreign currency forward contracts to manage foreign currency risk, with the majority of our forward contracts used to hedge certain forecasted revenue and operating expense transactions denominated in foreign currencies in the next 21 months. We do not engage in currency speculation. For a more detailed disclosure of our revenue and operating expense hedging program, please read Note 10, Derivative Instruments, to our consolidated financial statements included in this report.
Our ability to mitigate the impact of exchange rate changes on revenues and net income diminishes as significant exchange rate fluctuations are sustained over extended periods of time. In particular, devaluation or significant deterioration of foreign currency exchange rates are difficult to mitigate and likely to negatively impact earnings. The cash flows from these contracts are reported as operating activities in our consolidated statements of cash flows.
Balance Sheet Risk Management Hedging Program
We also use forward contracts to mitigate the foreign currency exposure related to certain balance sheet items. The primary objective of our balance sheet risk management program is to mitigate the exposure of foreign currency denominated net monetary assets and liabilities of foreign affiliates. In these instances, we principally utilize currency forward contracts. We have not elected hedge accounting for the balance sheet related items. The cash flows from these contracts are reported as operating activities in our consolidated statements of cash flows.
The following quantitative information includes the impact of currency movements on forward contracts used in our revenue, operating expense and balance sheet hedging programs. As of December 31, 2017 and 2016, a hypothetical adverse 10% movement in foreign currency rates compared to the U.S. dollar across all maturities would result in a hypothetical decrease in the fair value of forward contracts of approximately $286.0 million and $172.0 million, respectively. The estimated fair value change was determined by measuring the impact of the hypothetical exchange rate movement on outstanding forward contracts. Our use of this methodology to quantify the market risk of such instruments is subject to assumptions and actual impact could be significantly different. The quantitative information about market risk is limited because it does not take into account all foreign currency operating transactions.
Interest Rate Risk
Our investment portfolio includes cash equivalents and short-term investments. The fair value of our marketable securities is subject to change as a result of potential changes in market interest rates. The potential change in fair value for interest rate sensitive instruments has been assessed on a hypothetical 100 basis point adverse movement across all maturities. As of December 31, 2017 and 2016, we estimate that such hypothetical 100 basis point adverse movement would result in a hypothetical loss in fair value of approximately $50.0 million to our interest rate sensitive instruments. The fair values of our investments were determined using third-party pricing services or other market observable data.
To achieve a desired mix of fixed and floating interest rate debt, we entered into interest rate swap contracts during 2015 for certain of our fixed-rate debt. These derivative contracts effectively converted a fixed-rate interest coupon to a floating-rate LIBOR-based coupon over the life of the respective note. As of December 31, 2017 and 2016, a 100 basis-point adverse movement (increase in LIBOR) would increase
annual interest expense by approximately $6.8 million.
Pricing Pressure
Governments in some international markets in which we operate have implemented measures aimed at reducing healthcare costs to limit the overall level of government expenditures. These measures vary by country and may include, among other things, patient access restrictions, suspensions on price increases, prospective and possibly retroactive price reductions and other recoupments and increased mandatory discounts or rebates, recoveries of past price increases and greater importation of drugs from lower-cost countries.
In addition, certain countries set prices by reference to the prices in other countries where our products are marketed. Thus, our inability to secure favorable prices in a particular country may impair our ability to obtain acceptable prices in existing and potential new markets, which may limit market growth. The continued implementation of pricing actions throughout Europe may also lead to higher levels of parallel trade.
In the U.S., federal and state legislatures, health agencies and third-party payors continue to focus on containing the cost of health care. Legislative and regulatory proposals, enactments to reform health care insurance programs and increasing pressure from social sources could significantly influence the manner in which our products are prescribed and purchased. It is possible that additional federal health care reform measures will be adopted in the future, which could result in increased pricing pressure and reduced reimbursement for our products and otherwise have an adverse impact on our consolidated financial position or results of operations.
Our products are also susceptible to increasing competition from generics and biosimilars in many markets. Generic versions of drugs and biosimilars are likely to be sold at substantially lower prices than branded products. Accordingly, the introduction of generic or biosimilar versions of our marketed products, as well as lower-priced competing products, likely would significantly reduce both the price that we receive for such marketed products and the volume of products that we sell, which may have an adverse impact on our consolidated results of operations.
There is also significant economic pressure on state budgets that results in states increasingly seeking to achieve budget savings through mechanisms that limit coverage or payment for our drugs. Managed care organizations are also continuing to seek price discounts and, in some cases, to impose restrictions on the coverage of
particular drugs.
Credit Risk
We are subject to credit risk from our accounts receivable related to our product sales. The majority of our accounts receivable arise from product sales in the U.S. and Europe with concentrations of credit risk limited due to the wide variety of customers and markets using our products, as well as their dispersion across many different geographic areas. Our accounts receivable are primarily due from wholesale distributors, public hospitals and other government entities. We monitor the financial performance and creditworthiness of our customers so that we can properly assess and respond to changes in their credit profile. We operate in certain countries where weakness in economic conditions can result in extended collection periods. We continue to monitor these conditions, including the volatility associated with international economies and the relevant financial markets, and assess their possible impact on our business. To date, we have not experienced any significant losses with respect to the collection of our accounts receivable.
Credit and economic conditions in the E.U. continue to remain uncertain, which has, from time to time, led to long collection periods for our accounts receivable and greater collection risk in certain countries.
We believe that our allowance for doubtful accounts was adequate as of December 31, 2017 and 2016. However, if significant changes occur in the availability of government funding or the reimbursement practices of these or other governments, we may not be able to collect on amounts due to us from customers in such countries and our results of operations could be adversely affected.
Item 8. Financial Statements and Supplementary Data
The information required by this Item 8 is contained on pages F-1 through F-78 of this report and is incorporated herein by reference.
Item 9. Changes in and Disagreements with Accountants on Accounting and Financial Disclosure
None.
Item 9A. Controls and Procedures
Disclosure Controls and Procedures and Internal Control over Financial Reporting
Controls and Procedures
We have carried out an evaluation, under the supervision and with the participation of our management, including our principal executive officer and principal financial officer, of the effectiveness of the design and operation of our disclosure controls and procedures (as defined in Rules 13a-15(e) and 15d-15(e) under the Securities Exchange Act of 1934, as amended), as of December 31, 2017. Based upon that evaluation, our principal executive officer and principal financial officer concluded that, as of the end of the period covered by this report, our disclosure controls and procedures are effective in ensuring that (a) the information required to be disclosed by us in the reports that we file or submit under the Securities Exchange Act is recorded, processed, summarized and reported within the time periods specified in the SEC’s rules and forms and (b) such information is accumulated and communicated to our management, including our principal executive officer and principal financial officer, as appropriate to allow timely decisions regarding required disclosure. In designing and evaluating our disclosure controls and procedures, our management recognized that any controls and procedures, no matter how well designed and operated, can provide only reasonable assurance of achieving the desired control objectives, and our management necessarily was required to apply its judgment in evaluating the cost-benefit relationship of possible controls and procedures.
Changes in Internal Control over Financial Reporting
There were no changes in our internal control over financial reporting during the quarter ended December 31, 2017, that have materially affected, or are reasonably likely to materially affect, our internal control over financial reporting.
Management’s Annual Report on Internal Control over Financial Reporting
Our management is responsible for establishing and maintaining adequate internal control over our financial reporting. Internal control over financial reporting is defined in Rules 13a-15(f) and 15d-15(f) under the Securities Exchange Act as a process designed by, or under the supervision of, a company’s principal executive and principal financial officers and effected by a company’s board of directors, management and other personnel to provide reasonable assurance regarding the reliability of financial reporting and the preparation of financial statements for external purposes in accordance with
U.S. GAAP. Our internal control over financial reporting includes those policies and procedures that:
pertain to the maintenance of records that, in reasonable detail, accurately and fairly reflect our transactions and dispositions of our assets;
provide reasonable assurance that transactions are recorded as necessary to permit preparation of financial statements in accordance with U.S. GAAP, and that our receipts and expenditures are being made only in accordance with authorizations of our management and directors; and
provide reasonable assurance regarding prevention or timely detection of unauthorized acquisition, use or disposition of our assets that could have a material effect on our financial statements.
Because of its inherent limitations, internal control over financial reporting may not prevent or detect misstatements. Projections of any evaluation of effectiveness to future periods are subject to the risk that controls may become inadequate because of changes in conditions, or that the degree of compliance with the policies or procedures may deteriorate.
Our management assessed the effectiveness of our internal control over financial reporting as of December 31, 2017. In making this assessment, management used the criteria set forth by the Committee of Sponsoring Organizations of the Treadway Commission (COSO) in its 2013 Internal Control — Integrated Framework.
Based on our assessment, our management has concluded that, as of December 31, 2017, our internal control over financial reporting is effective based on those criteria.
The effectiveness of our internal control over financial reporting as of December 31, 2017, has been audited by PricewaterhouseCoopers LLP, an independent registered public accounting firm, as stated in their attestation report, which is included herein.
Item 9B. Other Information
None.
PART III ItemITEM 10. Directors, Executive Officers and Corporate GovernanceDIRECTORS, EXECUTIVE OFFICERS AND CORPORATE GOVERNANCE
The information concerning our executive officers is set forth under the heading “OurInformation about our Executive Officers”Officers in Item 1 of this report. The text of our code of business conduct, which includes the code of ethics that applies to our principal executive officer, principal financial officer, principal accounting officer or controller, and persons performing similar functions, is posted on our website, www.biogen.com, under the “Corporate Governance” subsection of the “About UsInvestors” section of the site. We intend to make all required disclosures regarding any amendments to, or waivers from, provisions of our code of business conduct at the same location of our website. The response to the remainder of this item is incorporated by reference from the discussion responsive thereto in the sections entitled “Proposal 1 - Election of Directors,” “Corporate Governance at Biogen,” “Stock Ownership - Section 16(a) Beneficial Ownership Reporting Compliance” Governance” and “Miscellaneous - Stockholder Proposals” contained in the proxy statement for our 20182024 annual meeting of stockholders. ItemITEM 11. Executive CompensationEXECUTIVE COMPENSATION
The response to this item is incorporated by reference from the discussion responsive thereto in the sections entitled “Executive Compensation MattersTables,” "Compensation Discussion and Analysis" and “Corporate Governance at Biogen”Governance” contained in the proxy statement for our 20182024 annual meeting of stockholders. ITEM 12. Security Ownership of Certain Beneficial Owners and Management and Related Stockholder MattersSECURITY OWNERSHIP OF CERTAIN BENEFICIAL OWNERS AND MANAGEMENT AND RELATED STOCKHOLDER MATTERS The response to this item is incorporated by reference from the discussion responsive thereto in the sections entitled “Stock Ownership” and “Equity Compensation Plan Information” contained in the proxy statement for our 20182024 annual meeting of stockholders. ITEM 13. CERTAIN RELATIONSHIPS AND RELATED TRANSACTIONS, AND DIRECTOR INDEPENDENCE Item 13. Certain Relationships and Related Transactions, and Director Independence
The response to this item is incorporated by reference from the discussion responsive thereto in the sections entitled “Certain Relationships and Related Person Transactions” and “Corporate Governance at Biogen” contained in the proxy statement for our 20182024 annual meeting of stockholders. ItemITEM 14. Principal Accounting Fees and ServicesPRINCIPAL ACCOUNTANT FEES AND SERVICES
The response to this item is incorporated by reference from the discussion responsive thereto in the section entitled “Proposal 2 —- Ratification of the Selection of our Independent Registered Public Accounting Firm” contained in the proxy statement for our 20182024 annual meeting of stockholders.
PART IV ItemITEM 15. Exhibits and Financial Statement SchedulesEXHIBITS AND FINANCIAL STATEMENT SCHEDULES
a. (1) Consolidated Financial Statements: The following financial statements are filed as part of this report: | | | | | | | | | | Financial Statements | | Page Number | | | | Financial Statements | | Page Number | | Consolidated Statements of Income | | F-2 | | Consolidated Statements of Comprehensive Income | | F-3 | | Consolidated Balance Sheets | | F-4 | Consolidated Statements of Cash FlowsFlow | | F-5 | | Consolidated Statements of Equity | | F-6 | | Notes to Consolidated Financial Statements | | F-9 | | Report of Independent Registered Public Accounting Firm (PCAOB ID 238) | | F-77F-83 |
Certain totals may not sum due to rounding. (2) Exhibits The exhibits listed on the Exhibit Index beginning on page 94,98, which is incorporated herein by reference, are filed or furnished as part of this report or are incorporated into this report by reference. (3) Financial Statement Schedules Schedules are omitted because they are not applicable, or are not required, or because the information is included in the consolidated financial statements and notes thereto. ItemITEM 16. FormFORM 10-K SummarySUMMARY
Not applicable.
| | | | | | | | | | Exhibit No. | | Description | | 2.1 | | | Exhibit No. | | Description | 2.1† | | | 2.2 | | | | 3.1 | | | | 3.2 | | | | 3.3 | | | | 3.4 | | | | 4.1 | | | | 4.2 | | | 4.24.3 | | | 4.34.4 | | | | 4.5 | | | | 4.6+ | | | | 10.1 | | Credit Agreement, betweendated as of January 28, 2020, among Biogen Inc., Bank of America, N.A., Goldman Sachs Bank USAas administrative agent, swing line lender and the L/C issuer, and the other lenders party thereto,thereto. Filed as Exhibit 10.1 to our Current Report on Form 8-K filed on February 3, 2020. | | 10.2 | | | | 10.3 | | | 10.2†10.4† | | | 10.3†10.5† | | | 10.410.6* | | | 10.5* | | | 10.6*10.7* | | | 10.7*10.8* | | | 10.8*10.9* | | | 10.9*10.10* | | | 10.10*+10.11* | | | 10.11*+10.12* | | | 10.12*10.13* | | | 10.13*10.14* | | |
| | 10.15* | | | Exhibit No. | | Description | 10.14* | | | | 10.16* | | |
| | | | | | | | | | Exhibit No. | | Description | | 10.17* | | | 10.15*10.18* | |
| 10.16* | |
| 10.17*10.19* | | | 10.18*10.20* | | | 10.19* | | | 10.20*10.21* | | | 10.21*10.22* | | | | 10.23* | | | 10.22*10.24* | | | 10.23*10.25* | | | 10.24*10.26* | | | 10.25* | | | 10.26* | | | | 10.27* | | | 10.28*+ | | | 10.29*10.28* | | | 10.30*10.29* | | | 10.31*+10.30* | | | 10.32*+ | | | 10.33*+ | | | 10.34*10.31* | | | 10.35*10.32*+ | | | 10.36*10.33*+ | | | | 10.34* | | | | 10.35+ | | | | 10.36 | | | 10.37*10.37 | | |
| | | | Exhibit No. | | Description | 10.38* | | | | 21+ | | | | 23+ | | | | 31.1+ | | | | 31.2+ | | | | 32.1++ | | | | 97.1+ | | | | 101++ | | The following materials from Biogen Inc.’s Annual Report on Form 10-K for the year ended December 31, 2017,2023, formatted in XBRL (ExtensibleiXBRL (Inline Extensible Business Reporting Language): (i) the Consolidated Statements of Income, (ii) the Consolidated Statements of Comprehensive Income, (iii) the Consolidated Balance Sheets, (iv) the Consolidated Statements of Cash Flows,Flow, (v) the Consolidated Statements of Equity and (vi) Notes to Consolidated Financial Statements. |
| | | | | | | * | | ^ | References to “our” filings mean filings made by Biogen Inc. and filings made by IDEC Pharmaceuticals Corporation prior to the merger with Biogen, Inc. Unless otherwise indicated exhibits were previously filed with the Securities and Exchange Commission under Commission File Number 0-19311 and are incorporated herein by reference. |
| | | * | Management contract or compensatory plan or arrangement. |
| | | | | | | † | | † | Confidential treatment has been granted or requested with respect to portions of this exhibit. |
SIGNATURES Pursuant to the requirements of Section 13 or 15(d) of the Securities Exchange Act of 1934, the registrant has duly caused this report to be signed on its behalf by the undersigned, thereunto duly authorized. | | | | | | | BIOGEN INC. | | | BIOGEN INC. | | | | By: | /S/ MICHELCHRISTOPHER A. VOUNATSOSIEHBACHER | | Michel VounatsosChristopher A. Viehbacher | | Chief Executive Officer |
Date: February 1, 201813, 2024
Pursuant to the requirements of the Securities Exchange Act of 1934, this report has been signed below by the following persons on behalf of the registrant and in the capacities and on the dates indicated. | | | | | | | | | | | | | | | | Name | | Capacity | | Date | | | | | | Name | | Capacity | | Date | | | | | | /S/ MICHELCHRISTOPHER A. VOUNATSOSIEHBACHER | | Director and Chief Executive Officer (principal executive officer) | | February 1, 201813, 2024 | Michel VounatsosChristopher A. Viehbacher | | | | | | | | /S/ Jeffrey D. CapelloMICHAEL R. MCDONNELL | | Executive Vice President and Chief Financial Officer (principal financial officer) | | February 1, 201813, 2024 | Jeffrey D. CapelloMichael R. McDonnell | | | | | | | | /S/ GREGORY F. COVINOROBIN C. KRAMER | | Senior Vice President, Finance, Chief Accounting Officer (principal accounting officer) | | February 1, 201813, 2024 | Gregory F. CovinoRobin C. Kramer | | | | | | | | /S/ STELIOS PAPADOPOULOSCAROLINE D. DORSA | | Director and ChairmanChair of the Board of Directors | | February 1, 201813, 2024 | Stelios Papadopoulos | | | | | | | | /S/ ALEXANDER J. DENNER
| | Director | | February 1, 2018 | Alexander J. Denner | | | | | | | | /S/ CAROLINE D. DORSA
| | Director | | February 1, 2018 | | Caroline D. Dorsa | | | | | | | | /S/ MARIA C. FREIRE | | Director | | February 13, 2024 | | Maria C. Freire | | | | | | | | /S/ WILLIAM A. HAWKINS | | Director | | February 13, 2024 | | William A. Hawkins | | | | | | | | /S/ NANCY L.SUSAN LEAMINGANGER | | Director | | Director | February 1, 201813, 2024 | Nancy L. LeamingSusan Langer | | | | | | | | /S/ JESUS B. MANTAS | | Director | | February 13, 2024 | | Jesus B. Mantas | | | | | | | | /S/ MONISH PATOLAWALA | | Director | | February 13, 2024 | | Monish Patolawala | | | | | | | | /S/ ERIC K. RICHARD C. MULLIGANOWINSKY | | Director | | Director | February 1, 201813, 2024 | Richard C. Mulligan | | | | | | | | /S/ ROBERT W. PANGIA
| | Director | | February 1, 2018 | Robert W. Pangia | | | | | | | | /S/ BRIAN S. POSNER
| | Director | | February 1, 2018 | Brian S. Posner | | | | | | | | /S/ ERIC K. ROWINSKY
| | Director | | February 1, 2018 | | Eric K. Rowinsky | | | | | | | | /S/ STEPHEN A. SHERWIN | | Director | | February 13, 2024 | | | | | | /S/ LYNN SCHENK
| | Director | | February 1, 2018 | Lynn Schenk | | | | | | | | /S/ STEPHEN A. SHERWIN
| | Director | | February 1, 2018 | | Stephen A. Sherwin | | |
BIOGEN INC. AND SUBSIDIARIES CONSOLIDATED FINANCIAL STATEMENTS | | | | | | | | | | | Page Number | | | | | | Page Number | | Consolidated Statements of Income | | F-2 | | Consolidated Statements of Comprehensive Income | | F-3 | | Consolidated Balance Sheets | | F-4 | Consolidated Statements of Cash FlowsFlow | | F-5 | | Consolidated Statements of Equity | | F-6 | | Notes to Consolidated Financial Statements | | F-9 | | Report of Independent Registered Public Accounting Firm (PCAOB ID 238) | | F-77F-83 |
BIOGEN INC. AND SUBSIDIARIES CONSOLIDATED STATEMENTS OF INCOME (In millions, except per share amounts) | | | | | | | | | | | | | | | | | | | | | | | For the Years Ended December 31, | | | 2023 | | 2022 | | 2021 | | Revenue: | | | | | | | | Product revenue, net | | $ | 7,246.7 | | | $ | 7,987.8 | | | $ | 8,846.9 | | | Revenue from anti-CD20 therapeutic programs | | 1,689.6 | | | 1,700.5 | | | 1,658.5 | | | Contract manufacturing, royalty and other revenue | | 899.3 | | | 485.1 | | | 476.3 | | | Total revenue | | 9,835.6 | | | 10,173.4 | | | 10,981.7 | | | Cost and expense: | | | | | | | | Cost of sales, excluding amortization and impairment of acquired intangible assets | | 2,533.4 | | | 2,278.3 | | | 2,109.7 | | | Research and development | | 2,462.0 | | | 2,231.1 | | | 2,501.2 | | | Selling, general and administrative | | 2,549.7 | | | 2,403.6 | | | 2,674.3 | | | Amortization and impairment of acquired intangible assets | | 240.6 | | | 365.9 | | | 881.3 | | | Collaboration profit sharing/(loss reimbursement) | | 218.8 | | | (7.4) | | | 7.2 | | | | | | | | | | (Gain) loss on fair value remeasurement of contingent consideration | | — | | | (209.1) | | | (50.7) | | | Acquired in-process research and development | | — | | | — | | | 18.0 | | | Restructuring charges | | 218.8 | | | 131.1 | | | — | | | Gain on sale of building | | — | | | (503.7) | | | — | | | Other (income) expense, net | | 315.5 | | | (108.2) | | | 1,095.5 | | | Total cost and expense | | 8,538.8 | | | 6,581.6 | | | 9,236.5 | | | Income before income tax (benefit) expense and equity in loss of investee, net of tax | | 1,296.8 | | | 3,591.8 | | | 1,745.2 | | | Income tax (benefit) expense | | 135.3 | | | 632.8 | | | 52.5 | | | Equity in (income) loss of investee, net of tax | | — | | | (2.6) | | | (34.9) | | | Net income | | 1,161.5 | | | 2,961.6 | | | 1,727.6 | | | Net income (loss) attributable to noncontrolling interests, net of tax | | 0.4 | | | (85.3) | | | 171.5 | | | Net income attributable to Biogen Inc. | | $ | 1,161.1 | | | $ | 3,046.9 | | | $ | 1,556.1 | | | | | | | | | | Net income per share: | | | | | | | | Basic earnings per share attributable to Biogen Inc. | | $ | 8.02 | | | $ | 20.96 | | | $ | 10.44 | | | Diluted earnings per share attributable to Biogen Inc. | | $ | 7.97 | | | $ | 20.87 | | | $ | 10.40 | | | | | | | | | | Weighted-average shares used in calculating: | | | | | | | | Basic earnings per share attributable to Biogen Inc. | | 144.7 | | | 145.3 | | | 149.1 | | | Diluted earnings per share attributable to Biogen Inc. | | 145.6 | | | 146.0 | | | 149.6 | |
| | | | | | | | | | | | | | | For the Years Ended December 31, | | | 2017 | | 2016 | | 2015 | | Revenues: | | | | | | | Product, net | $ | 10,354.7 |
| | $ | 9,817.9 |
| | $ | 9,188.5 |
| | Revenues from anti-CD20 therapeutic programs | 1,559.2 |
| | 1,314.5 |
| | 1,339.2 |
| | Other | 360.0 |
| | 316.4 |
| | 236.1 |
| | Total revenues | 12,273.9 |
| | 11,448.8 |
| | 10,763.8 |
| | Cost and expenses: | | | | | | | Cost of sales, excluding amortization of acquired intangible assets | 1,630.0 |
| | 1,478.7 |
| | 1,240.4 |
| | Research and development | 2,253.6 |
| | 1,973.3 |
| | 2,012.8 |
| | Selling, general and administrative | 1,935.5 |
| | 1,947.9 |
| | 2,113.1 |
| | Amortization of acquired intangible assets | 814.7 |
| | 385.6 |
| | 382.6 |
| | Acquired in-process research and development | 120.0 |
| | — |
| | — |
| | Collaboration profit (loss) sharing | 112.3 |
| | 10.2 |
| | — |
| | Loss (gain) on fair value remeasurement of contingent consideration | 62.7 |
| | 14.8 |
| | 30.5 |
| | Restructuring charges | 0.9 |
| | 33.1 |
| | 93.4 |
| | TECFIDERA litigation settlement charge | — |
| | 454.8 |
| | — |
| | Total cost and expenses | 6,929.7 |
| | 6,298.4 |
| | 5,872.8 |
| | Income from operations | 5,344.2 |
| | 5,150.4 |
| | 4,891.0 |
| | Other income (expense), net | (215.4 | ) | | (217.4 | ) | | (123.7 | ) | | Income before income tax expense and equity in loss of investee, net of tax | 5,128.8 |
| | 4,933.0 |
| | 4,767.3 |
| | Income tax expense | 2,458.7 |
| | 1,237.3 |
| | 1,161.6 |
| | Equity in loss of investee, net of tax | — |
| | — |
| | 12.5 |
| | Net income | 2,670.1 |
| | 3,695.7 |
| | 3,593.2 |
| | Net income (loss) attributable to noncontrolling interests, net of tax | 131.0 |
| | (7.1 | ) | | 46.2 |
| | Net income attributable to Biogen Inc. | $ | 2,539.1 |
| | $ | 3,702.8 |
| | $ | 3,547.0 |
| | Net income per share: | | | | | | | Basic earnings per share attributable to Biogen Inc. | $ | 11.94 |
| | $ | 16.96 |
| | $ | 15.38 |
| | Diluted earnings per share attributable to Biogen Inc. | $ | 11.92 |
| | $ | 16.93 |
| | $ | 15.34 |
| | Weighted-average shares used in calculating: | | | | | | | Basic earnings per share attributable to Biogen Inc. | 212.6 |
| | 218.4 |
| | 230.7 |
| | Diluted earnings per share attributable to Biogen Inc. | 213.0 |
| | 218.8 |
| | 231.2 |
|
See accompanying notes to these consolidated financial statements.
BIOGEN INC. AND SUBSIDIARIES CONSOLIDATED STATEMENTS OF COMPREHENSIVE INCOME (In millions) | | | | | | | | | | | | | | | | | | | | | | | | For the Years Ended December 31, | | | | 2023 | | 2022 | | 2021 | | Net income attributable to Biogen Inc. | | $ | 1,161.1 | | | $ | 3,046.9 | | | $ | 1,556.1 | | | Other comprehensive income: | | | | | | | | Unrealized gains (losses) on securities available for sale, net of tax | | 15.7 | | | (13.5) | | | (3.6) | | | Unrealized gains (losses) on cash flow hedges, net of tax | | (40.1) | | | (38.7) | | | 232.8 | | | Gains (losses) on net investment hedges, net of tax | | — | | | (25.5) | | | 34.0 | | | Unrealized gains (losses) on pension benefit obligation, net of tax | | (1.5) | | | 43.7 | | | 21.5 | | | Currency translation adjustment | | 37.1 | | | (24.2) | | | (92.4) | | | Total other comprehensive income (loss), net of tax | | 11.2 | | | (58.2) | | | 192.3 | | | Comprehensive income (loss) attributable to Biogen Inc. | | 1,172.3 | | | 2,988.7 | | | 1,748.4 | | | Comprehensive income (loss) attributable to noncontrolling interests, net of tax | | 0.4 | | | (85.3) | | | 172.1 | | | Comprehensive income (loss) | | $ | 1,172.7 | | | $ | 2,903.4 | | | $ | 1,920.5 | |
| | | | | | | | | | | | | | | For the Years Ended December 31, | | | 2017 | | 2016 | | 2015 | | Net income attributable to Biogen Inc. | $ | 2,539.1 |
| | $ | 3,702.8 |
| | $ | 3,547.0 |
| | Other comprehensive income: | | | | | | | Unrealized gains (losses) on securities available for sale: | | | | | | | Unrealized gains (losses) recognized during the period, net of tax | (3.5 | ) | | (10.6 | ) | | (1.7 | ) | | Less: reclassification adjustment for (gains) losses included in net income, net of tax | 12.7 |
| | 0.6 |
| | 1.3 |
| | Unrealized gains (losses) on securities available for sale, net of tax | 9.2 |
| | (10.0 | ) | | (0.4 | ) | | Unrealized gains (losses) on cash flow hedges: | | | | | | | Unrealized gains (losses) recognized during the period, net of tax | (193.8 | ) | | 51.6 |
| | 110.8 |
| | Less: reclassification adjustment for (gains) losses included in net income, net of tax | 31.5 |
| | (4.0 | ) | | (172.3 | ) | | Unrealized gains (losses) on cash flow hedges, net of tax | (162.3 | ) | | 47.6 |
| | (61.5 | ) | | Unrealized gains (losses) on pension benefit obligation, net of tax | (4.1 | ) | | 5.1 |
| | (6.2 | ) | | Currency translation adjustment | 158.7 |
| | (138.6 | ) | | (96.4 | ) | | Total other comprehensive income (loss), net of tax | 1.5 |
| | (95.9 | ) | | (164.5 | ) | | Comprehensive income attributable to Biogen Inc. | 2,540.6 |
| | 3,606.9 |
| | 3,382.5 |
| | Comprehensive income (loss) attributable to noncontrolling interests, net of tax | 131.0 |
| | (7.1 | ) | | 46.2 |
| | Comprehensive income | $ | 2,671.6 |
| | $ | 3,599.8 |
| | $ | 3,428.7 |
|
See accompanying notes to these consolidated financial statements.
BIOGEN INC. AND SUBSIDIARIES CONSOLIDATED BALANCE SHEETS (In millions, except per share amounts) | | | | | | | | | | | | | As of December 31, | | 2023 | | 2022 | | ASSETS | | Current assets: | | | | | Cash and cash equivalents | $ | 1,049.9 | | | $ | 3,419.3 | | | Marketable securities | — | | | 1,473.5 | | | Accounts receivable, net of allowance for doubtful accounts of $2.4 and $2.3, respectively | 1,664.1 | | | 1,705.0 | | | Due from anti-CD20 therapeutic programs | 435.9 | | | 431.4 | | | Inventory | 2,527.4 | | | 1,344.4 | | | Other current assets | 1,182.0 | | | 1,417.6 | | | Total current assets | 6,859.3 | | | 9,791.2 | | | Marketable securities | — | | | 705.7 | | | Property, plant and equipment, net | 3,309.7 | | | 3,298.6 | | | Operating lease assets | 420.0 | | | 403.9 | | | Intangible assets, net | 8,363.0 | | | 1,850.1 | | | Goodwill | 6,219.2 | | | 5,749.0 | | | Deferred tax asset | 928.6 | | | 1,226.4 | | | Investments and other assets | 745.0 | | | 1,529.2 | | | Total assets | $ | 26,844.8 | | | $ | 24,554.1 | | | LIABILITIES AND EQUITY | | Current liabilities: | | | | | Current portion of term loan | $ | 150.0 | | | $ | — | | | Taxes payable | 257.4 | | | 259.9 | | | Accounts payable | 403.3 | | | 491.5 | | | Accrued expense and other | 2,623.6 | | | 2,521.4 | | | Total current liabilities | 3,434.3 | | | 3,272.8 | | | Notes payable and term loan | 6,788.2 | | | 6,281.0 | | | Deferred tax liability | 641.8 | | | 334.7 | | | Long-term operating lease liabilities | 400.0 | | | 333.0 | | | Other long-term liabilities | 781.1 | | | 944.2 | | | Total liabilities | 12,045.4 | | | 11,165.7 | | | Commitments, contingencies and guarantees (Notes 22 and 23) | | | | | Equity: | | | | | Biogen Inc. shareholders’ equity | | | | | Preferred stock, par value $0.001 per share | — | | | — | | | Common stock, par value $0.0005 per share | 0.1 | | | 0.1 | | | Additional paid-in capital | 302.5 | | | 73.3 | | | Accumulated other comprehensive income (loss) | (153.7) | | | (164.9) | | | Retained earnings | 17,627.6 | | | 16,466.5 | | | Treasury stock, at cost; 23.8 million and 23.8 million shares, respectively | (2,977.1) | | | (2,977.1) | | | Total Biogen Inc. shareholders’ equity | 14,799.4 | | | 13,397.9 | | | Noncontrolling interests | — | | | (9.5) | | | Total equity | 14,799.4 | | | 13,388.4 | | | Total liabilities and equity | $ | 26,844.8 | | | $ | 24,554.1 | |
| | | | | | | | | | | As of December 31, | | | 2017 | | 2016 | | ASSETS | | Current assets: | | | | | Cash and cash equivalents | $ | 1,573.8 |
| | $ | 2,326.5 |
| | Marketable securities | 2,115.2 |
| | 2,568.6 |
| | Accounts receivable, net | 1,787.0 |
| | 1,441.6 |
| | Due from anti-CD20 therapeutic programs | 532.6 |
| | 300.6 |
| | Inventory | 902.7 |
| | 1,001.6 |
| | Other current assets | 962.0 |
| | 1,093.3 |
| | Total current assets | 7,873.3 |
| | 8,732.2 |
| | Marketable securities | 3,057.3 |
| | 2,829.4 |
| | Property, plant and equipment, net | 3,182.4 |
| | 2,501.8 |
| | Intangible assets, net | 3,879.6 |
| | 3,808.3 |
| | Goodwill | 4,632.5 |
| | 3,669.3 |
| | Investments and other assets | 1,027.5 |
| | 1,335.8 |
| | Total assets | $ | 23,652.6 |
| | $ | 22,876.8 |
| | LIABILITIES AND EQUITY | | Current liabilities: | | | | | Current portion of notes payable and other financing arrangements | $ | 3.2 |
| | $ | 4.7 |
| | Taxes payable | 68.2 |
| | 231.9 |
| | Accounts payable | 395.5 |
| | 279.8 |
| | Accrued expenses and other | 2,901.3 |
| | 2,903.5 |
| | Total current liabilities | 3,368.2 |
| | 3,419.9 |
| | Notes payable and other financing arrangements | 5,935.0 |
| | 6,512.7 |
| | Deferred tax liability | 122.6 |
| | 93.1 |
| | Other long-term liabilities | 1,628.7 |
| | 722.5 |
| | Total liabilities | 11,054.5 |
| | 10,748.2 |
| | Commitments and contingencies |
|
| |
|
| | Equity: | | | | | Biogen Inc. shareholders’ equity | | | | | Preferred stock, par value $0.001 per share | — |
| | — |
| | Common stock, par value $0.0005 per share | 0.1 |
| | 0.1 |
| | Additional paid-in capital | 97.8 |
| | — |
| | Accumulated other comprehensive loss | (318.4 | ) | | (319.9 | ) | | Retained earnings | 15,810.4 |
| | 15,071.6 |
| | Treasury stock, at cost; 23.8 million and 22.6 million shares, respectively | (2,977.1 | ) | | (2,611.7 | ) | | Total Biogen Inc. shareholders’ equity | 12,612.8 |
| | 12,140.1 |
| | Noncontrolling interests | (14.7 | ) | | (11.5 | ) | | Total equity | 12,598.1 |
| | 12,128.6 |
| | Total liabilities and equity | $ | 23,652.6 |
| | $ | 22,876.8 |
|
See accompanying notes to these consolidated financial statements.
BIOGEN INC. AND SUBSIDIARIES CONSOLIDATED STATEMENTS OF CASH FLOWSFLOW (In millions) | | For the Years Ended December 31, | | | For the Years Ended December 31, | | | | | | | | | | 2023 | | 2022 | | 2021 | | | For the Years Ended December 31, | | | 2017 | | 2016 | | 2015 | | Cash flows from operating activities: | | | | | | | Cash flow from operating activities: | | | Net income | $ | 2,670.1 |
| | $ | 3,695.7 |
| | $ | 3,593.2 |
| | Adjustments to reconcile net income to net cash flows from operating activities: | | | | | | | Net income | | | Net income | | | Adjustments to reconcile net income to net cash flow from operating activities: | | | Depreciation and amortization | 1,081.0 |
| | 682.7 |
| | 600.4 |
| | Depreciation and amortization | | | Depreciation and amortization | | | Impairment of intangible assets | | | Excess and obsolescence charges related to inventory | | | Amortization of inventory step-up | | | Acquired in-process research and development | 120.0 |
| | — |
| | — |
| | Share-based compensation | 128.0 |
| | 154.8 |
| | 161.4 |
| | Contingent consideration | | | Deferred income taxes | 91.7 |
| | (175.0 | ) | | (145.6 | ) | | Contingent consideration | 62.7 |
| | 14.8 |
| | 30.5 |
| | (Gain) loss on strategic investments | | | (Gain) loss on equity method investment | | | Gain on sale of equity interest in Samsung Bioepis | | | Gain on sale of building | | | Other | 162.1 |
| | 89.0 |
| | 129.9 |
| | Changes in operating assets and liabilities, net: | | | | | | | Changes in operating assets and liabilities, net of effects of business acquired: | | | Accounts receivable | | | Accounts receivable | | | Accounts receivable | (435.6 | ) | | (241.4 | ) | | 29.0 |
| | Due from anti-CD20 therapeutic programs | (232.0 | ) | | 13.9 |
| | (31.1 | ) | | Inventory | (94.5 | ) | | (165.6 | ) | | (174.4 | ) | | Other assets | (76.6 | ) | | 59.1 |
| | (127.0 | ) | | Accrued expenses and other current liabilities | (227.4 | ) | | 622.3 |
| | 199.3 |
| | Accrued expense and other current liabilities | | | Income tax assets and liabilities | 1,303.9 |
| | (232.6 | ) | | (429.4 | ) | | Other liabilities | (2.4 | ) | | 69.5 |
| | 83.2 |
| | Net cash flows provided by operating activities | 4,551.0 |
| | 4,587.2 |
| | 3,919.4 |
| | Cash flows from investing activities: | | | | | | | Other changes in operating assets and liabilities, net | | | Net cash flow provided by (used in) operating activities | | | Cash flow from investing activities: | | | Purchases of property, plant and equipment | | | Purchases of property, plant and equipment | | | Purchases of property, plant and equipment | | | Proceeds from sales and maturities of marketable securities | 5,565.9 |
| | 7,378.9 |
| | 4,063.0 |
| | Purchases of marketable securities | (5,355.2 | ) | | (7,913.2 | ) | | (6,864.9 | ) | | Contingent consideration related to Fumapharm AG acquisition | (1,200.0 | ) | | (1,200.0 | ) | | (850.0 | ) | | Acquisition of Reata, net of cash acquired | | | Proceeds from sale of equity interest in Samsung Bioepis | | | Proceeds from sale of building | | | Proceeds from divestiture of Hillerød, Denmark manufacturing operations | | | Acquired in-process research and development | (120.0 | ) | | — |
| | — |
| | Acquisitions of businesses, net of cash acquired | — |
| | — |
| | (198.8 | ) | | Purchases of property, plant and equipment | (867.4 | ) | | (616.1 | ) | | (643.0 | ) | | Acquisitions of intangible assets | (975.4 | ) | | (111.6 | ) | | (15.4 | ) | | Proceeds from sales of strategic investments | | | Other | (11.0 | ) | | (22.8 | ) | | (44.5 | ) | | Net cash flows used in investing activities | (2,963.1 | ) | | (2,484.8 | ) | | (4,553.6 | ) | | Cash flows from financing activities: | | | | | | | Purchases of treasury stock | (1,365.4 | ) | | (1,000.0 | ) | | (5,000.0 | ) | | Net cash flow provided by (used in) investing activities | | | Cash flow from financing activities: | | | Purchase of treasury stock | | | Purchase of treasury stock | | | Purchase of treasury stock | | | Payments related to issuance of stock for share-based compensation arrangements, net | (5.3 | ) | | (8.5 | ) | | (70.9 | ) | | Net distribution to noncontrolling interest | (134.1 | ) | | — |
| | (56.1 | ) | | Repayments of borrowings and premiums paid | | | Proceeds from borrowings | — |
| | — |
| | 5,930.5 |
| | Repayments of borrowings | (560.9 | ) | | (2.7 | ) | | (2.1 | ) | | Net cash contribution to Bioverativ, Inc. | (302.7 | ) | | — |
| | — |
| | Contingent consideration payments | (3.0 | ) | | (38.6 | ) | | (13.1 | ) | | | Net (distribution) contribution to noncontrolling interest | | | Net (distribution) contribution to noncontrolling interest | | | Net (distribution) contribution to noncontrolling interest | | | | Other | (8.6 | ) | | (2.8 | ) | | (5.2 | ) | | Net cash flows provided by (used in) financing activities | (2,380.0 | ) | | (1,052.6 | ) | | 783.1 |
| | Net increase in cash and cash equivalents | (792.1 | ) | | 1,049.8 |
| | 148.9 |
| | Other | | | Other | | | Net cash flow provided by (used in) financing activities | | | Net increase (decrease) in cash and cash equivalents | | | Effect of exchange rate changes on cash and cash equivalents | 39.4 |
| | (31.3 | ) | | (45.8 | ) | | Cash and cash equivalents, beginning of the year | 2,326.5 |
| | 1,308.0 |
| | 1,204.9 |
| | Cash and cash equivalents, end of the year | $ | 1,573.8 |
| | $ | 2,326.5 |
| | $ | 1,308.0 |
|
See accompanying notes to these consolidated financial statements.
BIOGEN INC. AND SUBSIDIARIES CONSOLIDATED STATEMENTS OF EQUITY (In millions) | | | | | | | | | | | | | | | | | | | | | | | | | | | | | | | | | | | | | | | | | | | | | | | | | | | | | | | | | | | | | | | | | | | | | | | | | | Preferred stock | | Common stock | | Additional
paid-in
capital | | Accumulated other comprehensive income (loss) | | Retained
earnings | | Treasury stock | | Total
Biogen Inc.
shareholders’
equity | | Noncontrolling
interests | | Total
equity | | | Shares | | Amount | | Shares | | Amount | | | | | Shares | | Amount | | | | | Balance, December 31, 2022 | — | | | $ | — | | | 167.9 | | | $ | 0.1 | | | $ | 73.3 | | | $ | (164.9) | | | $ | 16,466.5 | | | (23.8) | | | $ | (2,977.1) | | | $ | 13,397.9 | | | $ | (9.5) | | | $ | 13,388.4 | | | Net income | — | | | — | | | — | | | — | | | — | | | — | | | 1,161.1 | | | — | | | — | | | 1,161.1 | | | 0.4 | | | 1,161.5 | | | Other comprehensive income (loss), net of tax | — | | | — | | | — | | | — | | | — | | | 11.2 | | | — | | | — | | | — | | | 11.2 | | | — | | | 11.2 | | | Capital contribution from noncontrolling interest | — | | | — | | | — | | | — | | | — | | | — | | | — | | | — | | | — | | | — | | | 12.3 | | | 12.3 | | | Deconsolidation of noncontrolling interest | — | | | — | | | — | | | — | | | — | | | — | | | — | | | — | | | — | | | — | | | (3.2) | | | (3.2) | | | | | | | | | | | | | | | | | | | | | | | | | | | | | | | | | | | | | | | | | | | | | | | | | | | Issuance of common stock under stock option and stock purchase plans | — | | | — | | | 0.2 | | | — | | | 45.1 | | | — | | | — | | | — | | | — | | | 45.1 | | | — | | | 45.1 | | | Issuance of common stock under stock award plan | — | | | — | | | 0.6 | | | — | | | (89.5) | | | — | | | — | | | — | | | — | | | (89.5) | | | — | | | (89.5) | | | Compensation expense related to share-based payments | — | | | — | | | — | | | — | | | 274.4 | | | — | | | — | | | — | | | — | | | 274.4 | | | — | | | 274.4 | | | Other | — | | | — | | | — | | | — | | | (0.8) | | | — | | | — | | | — | | | — | | | (0.8) | | | — | | | (0.8) | | | Balance, December 31, 2023 | — | | | $ | — | | | 168.7 | | | $ | 0.1 | | | $ | 302.5 | | | $ | (153.7) | | | $ | 17,627.6 | | | (23.8) | | | $ | (2,977.1) | | | $ | 14,799.4 | | | $ | — | | | $ | 14,799.4 | |
| | | | | | | | | | | | | | | | | | | | | | | | | | | | | | | | | | | | | | | | | | | | | | | | Preferred stock | | Common stock | | Additional paid-in capital | | Accumulated other comprehensive loss | | Retained earnings | | Treasury stock | | Total Biogen Inc. shareholders’ equity | | Noncontrolling interests | | Total equity | | | Shares | | Amount | | Shares | | Amount | | | | | Shares | | Amount | | | | | Balance, December 31, 2016 | — |
| | $ | — |
| | 238.5 |
| | $ | 0.1 |
| | $ | — |
| | $ | (319.9 | ) | | $ | 15,071.6 |
| | (22.6 | ) | | $ | (2,611.7 | ) | | $ | 12,140.1 |
| | $ | (11.5 | ) | | $ | 12,128.6 |
| | Net income | | | | | | | | | | | | | 2,539.1 |
| | | | | | 2,539.1 |
| | 131.0 |
| | 2,670.1 |
| | Other comprehensive income (loss), net of tax | | | | | | | | | | | 1.5 |
| | | | | | | | 1.5 |
| | — |
| | 1.5 |
| | Capital contribution by noncontrolling interest | | | | | | | | | | | | | | | | | | | — |
| | 15.8 |
| | 15.8 |
| | Distribution to noncontrolling interest | | | | | | | | | | | | | | | | | | | — |
| | (150.0 | ) | | (150.0 | ) | | Repurchase of common stock pursuant to the 2016 Share Repurchase Program, at cost | | | | | | | | | | | | | | | (3.7 | ) | | (1,000.0 | ) | | (1,000.0 | ) | | | | (1,000.0 | ) | | Retirement of common stock pursuant to the 2016 Share Repurchase Program, at cost | | | | | (3.7 | ) | | — |
| | (36.0 | ) | | | | (964.0 | ) | | 3.7 |
| | 1,000.0 |
| | — |
| | | | — |
| | Repurchase of common stock pursuant to the 2011 Share Repurchase Program, at cost | | | | | | | | | | | | | | | (1.2 | ) | | (365.4 | ) | | (365.4 | ) | | | | (365.4 | ) | | Issuance of common stock under stock option and stock purchase plans | | | | | 0.2 |
| | — |
| | 40.5 |
| | | | — |
| | | | | | 40.5 |
| | | | 40.5 |
| | Issuance of common stock under stock award plan | | | | | 0.3 |
| | — |
| | (44.8 | ) | | | | (1.0 | ) | | | | | | (45.8 | ) | | | | (45.8 | ) | | Compensation related to share-based payments | | | | | | | | | 138.1 |
| | | | | | | | | | 138.1 |
| | | | 138.1 |
| | Hemophilia spin-off adjustment | | | | | | | | | | | | | (852.8 | ) | | | | | | (852.8 | ) | | | | (852.8 | ) | | Tax benefit | | | | | | | | | | | | | 17.5 |
| | | | | | 17.5 |
| | | | 17.5 |
| | Balance, December 31, 2017 | — |
| | $ | — |
| | 235.3 |
| | $ | 0.1 |
| | $ | 97.8 |
| | $ | (318.4 | ) | | $ | 15,810.4 |
| | (23.8 | ) | | $ | (2,977.1 | ) | | $ | 12,612.8 |
| | $ | (14.7 | ) | | $ | 12,598.1 |
|
See accompanying notes to these consolidated financial statements.
BIOGEN INC. AND SUBSIDIARIES CONSOLIDATED STATEMENTS OF EQUITY - (Continued) (In millions) | | | | | | | | | | | | | | | | | | | | | | | | | | | | | | | | | | | | | | | | | | | | | | | | | | | | | | | | | | | | | | | | | | | | | | | | | | Preferred stock | | Common stock | | Additional
paid-in
capital | | Accumulated other comprehensive income (loss) | | Retained
earnings | | Treasury stock | | Total
Biogen Inc.
shareholders’
equity | | Noncontrolling
interests | | Total
equity | | Shares | | Amount | | Shares | | Amount | | | | | Shares | | Amount | | | | | Balance, December 31, 2021 | — | | | $ | — | | | 170.8 | | | $ | 0.1 | | | $ | 68.2 | | | $ | (106.7) | | | $ | 13,911.7 | | | (23.8) | | | $ | (2,977.1) | | | $ | 10,896.2 | | | $ | 63.5 | | | $ | 10,959.7 | | | Net income | — | | | — | | | — | | | — | | | — | | | — | | | 3,046.9 | | | — | | | — | | | 3,046.9 | | | (85.3) | | | 2,961.6 | | | Other comprehensive income (loss), net of tax | — | | | — | | | — | | | — | | | — | | | (58.2) | | | — | | | — | | | — | | | (58.2) | | | — | | | (58.2) | | | | | | | | | | | | | | | | | | | | | | | | | | | Capital contribution from noncontrolling interest | — | | | — | | | — | | | — | | | — | | | — | | | — | | | — | | | — | | | — | | | 12.3 | | | 12.3 | | | Repurchase of common stock pursuant to the 2020 Share Repurchase Program, at cost | — | | | — | | | — | | | — | | | — | | | — | | | — | | | (3.6) | | | (750.0) | | | (750.0) | | | — | | | (750.0) | | | Retirement of common stock pursuant to the 2020 Share Repurchase Program, at cost | — | | | — | | | (3.6) | | | — | | | (257.9) | | | — | | | (492.1) | | | 3.6 | | | 750.0 | | | — | | | — | | | — | | | Issuance of common stock under stock option and stock purchase plans | — | | | — | | | 0.2 | | | — | | | 44.2 | | | — | | | — | | | — | | | — | | | 44.2 | | | — | | | 44.2 | | | Issuance of common stock under stock award plan | — | | | — | | | 0.5 | | | — | | | (46.0) | | | — | | | — | | | — | | | — | | | (46.0) | | | — | | | (46.0) | | | Compensation expense related to share-based payments | — | | | — | | | — | | | — | | | 263.5 | | | — | | | — | | | — | | | — | | | 263.5 | | | — | | | 263.5 | | | Other | — | | | — | | | — | | | — | | | 1.3 | | | — | | | — | | | — | | | — | | | 1.3 | | | — | | | 1.3 | | | Balance, December 31, 2022 | — | | | $ | — | | | 167.9 | | | $ | 0.1 | | | $ | 73.3 | | | $ | (164.9) | | | $ | 16,466.5 | | | (23.8) | | | $ | (2,977.1) | | | $ | 13,397.9 | | | $ | (9.5) | | | $ | 13,388.4 | |
| | | | | | | | | | | | | | | | | | | | | | | | | | | | | | | | | | | | | | | | | | | | | | | | Preferred stock | | Common stock | | Additional paid-in capital | | Accumulated other comprehensive loss | | Retained earnings | | Treasury stock | | Total Biogen Inc. shareholders’ equity | | Noncontrolling interests | | Total equity | | | Shares | | Amount | | Shares | | Amount | | | | | Shares | | Amount | | | | | Balance, December 31, 2015 | — |
| | $ | — |
| | 241.2 |
| | $ | 0.1 |
| | $ | — |
| | $ | (224.0 | ) | | $ | 12,208.4 |
| | (22.6 | ) | | $ | (2,611.7 | ) | | $ | 9,372.8 |
| | $ | 2.1 |
| | $ | 9,374.9 |
| | Net income | | | | | | | | | | | | | 3,702.8 |
| | | | | | 3,702.8 |
| | (7.1 | ) | | 3,695.7 |
| | Other comprehensive income (loss), net of tax | | | | | | | | | | | (95.9 | ) | | | | | | | | (95.9 | ) | | 0.1 |
| | (95.8 | ) | | Acquisition of noncontrolling interest | | | | | | | | | | | | | | | | | | | — |
| | (0.6 | ) | | (0.6 | ) | | Capital contribution by noncontrolling interest | | | | | | | | | | | | | | | | | | | — |
| | 1.5 |
| | 1.5 |
| | Deconsolidation of noncontrolling interest | | | | | | | | | | | | | | | | | | | — |
| | (7.5 | ) | | (7.5 | ) | | Repurchase of common stock pursuant to the 2016 Share Repurchase Program, at cost | | | | | | | | | | | | | | | (3.3 | ) | | (1,000.0 | ) | | (1,000.0 | ) | | | | (1,000.0 | ) | | Retirement of common stock pursuant to the 2016 Share Repurchase Program, at cost | | | | | (3.3 | ) | | — |
| | (164.9 | ) | | | | (835.1 | ) | | 3.3 |
| | 1,000.0 |
| | — |
| | | | — |
| | Issuance of common stock under stock option and stock purchase plans | | | | | 0.2 |
| | — |
| | 43.7 |
| | | | | | | | | | 43.7 |
| | | | 43.7 |
| | Issuance of common stock under stock award plan | | | | | 0.4 |
| | — |
| | (47.6 | ) | | | | (4.5 | ) | | | | | | (52.1 | ) | | | | (52.1 | ) | | Compensation related to share-based payments | | | | | | | | | 169.4 |
| | | | | | | | | | 169.4 |
| | | | 169.4 |
| | Tax benefit from share-based payments | | | | | | | | | (0.6 | ) | | | | | | | | | | (0.6 | ) | | | | (0.6 | ) | | Balance, December 31, 2016 | — |
| | $ | — |
| | 238.5 |
| | $ | 0.1 |
| | $ | — |
| | $ | (319.9 | ) | | $ | 15,071.6 |
| | (22.6 | ) | | $ | (2,611.7 | ) | | $ | 12,140.1 |
| | $ | (11.5 | ) | | $ | 12,128.6 |
|
See accompanying notes to these consolidated financial statements.
BIOGEN INC. AND SUBSIDIARIES CONSOLIDATED STATEMENTS OF EQUITY - (Continued) (In millions) | | | | | | | | | | | | | | | | | | | | | | | | | | | | | | | | | | | | | | | | | | | | | | | | | | | | | | | | | | | | | | | | | | | | | | | | | Preferred stock | | Common stock | | Additional
paid-in
capital | | Accumulated other comprehensive income (loss) | | Retained
earnings | | Treasury stock | | Total
Biogen Inc.
shareholders’
equity | | Noncontrolling
interests | | Total
equity | | Shares | | Amount | | Shares | | Amount | | | | | Shares | | Amount | | | | | Balance, December 31, 2020 | — | | | $ | — | | | 176.2 | | | $ | 0.1 | | | $ | — | | | $ | (299.0) | | | $ | 13,976.3 | | | (23.8) | | | $ | (2,977.1) | | | $ | 10,700.3 | | | $ | (14.2) | | | $ | 10,686.1 | | | Net income | — | | | — | | | — | | | — | | | — | | | — | | | 1,556.1 | | | — | | | — | | | 1,556.1 | | | 171.5 | | | 1,727.6 | | | Other comprehensive income (loss), net of tax | — | | | — | | | — | | | — | | | — | | | 192.3 | | | — | | | — | | | — | | | 192.3 | | | 0.6 | | | 192.9 | | | Distribution to noncontrolling interest | — | | | — | | | — | | | — | | | — | | | — | | | — | | | — | | | — | | | — | | | (100.0) | | | (100.0) | | | Capital contribution from noncontrolling interest | — | | | — | | | — | | | — | | | — | | | — | | | — | | | — | | | — | | | — | | | 5.6 | | | 5.6 | | | Repurchase of common stock pursuant to the 2020 Share Repurchase Program, at cost | — | | | — | | | — | | | — | | | — | | | — | | | — | | | (6.0) | | | (1,800.0) | | | (1,800.0) | | | — | | | (1,800.0) | | | Retirement of common stock pursuant to the 2020 Share Repurchase Program, at cost | — | | | — | | | (6.0) | | | — | | | (231.9) | | | — | | | (1,568.1) | | | 6.0 | | | 1,800.0 | | | — | | | — | | | — | | | Issuance of common stock under stock option and stock purchase plans | — | | | — | | | 0.2 | | | — | | | 54.4 | | | — | | | — | | | — | | | — | | | 54.4 | | | — | | | 54.4 | | | Issuance of common stock under stock award plan | — | | | — | | | 0.4 | | | — | | | (2.4) | | | — | | | (52.6) | | | — | | | — | | | (55.0) | | | — | | | (55.0) | | | Compensation expense related to share-based payments | — | | | — | | | — | | | — | | | 246.6 | | | — | | | — | | | — | | | — | | | 246.6 | | | — | | | 246.6 | | | Other | — | | | — | | | — | | | — | | | 1.5 | | | — | | | — | | | — | | | — | | | 1.5 | | | — | | | 1.5 | | | Balance, December 31, 2021 | — | | | $ | — | | | 170.8 | | | $ | 0.1 | | | $ | 68.2 | | | $ | (106.7) | | | $ | 13,911.7 | | | (23.8) | | | $ | (2,977.1) | | | $ | 10,896.2 | | | $ | 63.5 | | | $ | 10,959.7 | |
| | | | | | | | | | | | | | | | | | | | | | | | | | | | | | | | | | | | | | | | | | | | | | | | Preferred stock | | Common stock | | Additional paid-in capital | | Accumulated other comprehensive loss | | Retained earnings | | Treasury stock | | Total Biogen Inc. shareholders’ equity | | Noncontrolling interests | | Total equity | | | Shares | | Amount | | Shares | | Amount | | | | | Shares | | Amount | | | | | Balance, December 31, 2014 | — |
| | $ | — |
| | 257.1 |
| | $ | 0.1 |
| | $ | 4,196.2 |
| | $ | (59.5 | ) | | $ | 9,283.9 |
| | (22.6 | ) | | $ | (2,611.7 | ) | | $ | 10,809.0 |
| | $ | 5.0 |
| | $ | 10,814.0 |
| | Net income | | | | | | | | | | | | | 3,547.0 |
| | | | | | 3,547.0 |
| | 46.2 |
| | 3,593.2 |
| | Other comprehensive income (loss), net of tax | | | | | | | | | | | (164.5 | ) | | | | | | | | (164.5 | ) | | — |
| | (164.5 | ) | | Distribution to noncontrolling interests | | | | | | | | | | | | | | | | | | | — |
| | (60.0 | ) | | (60.0 | ) | | Acquisition of noncontrolling interests | | | | | | | | | | | | | | | | | | | — |
| | 10.9 |
| | 10.9 |
| | Repurchase of common stock pursuant to the 2015 Share Repurchase Program, at cost | | | | | | | | | | | | | | | (16.8 | ) | | (5,000.0 | ) | | (5,000.0 | ) | | | | (5,000.0 | ) | | Retirement of common stock pursuant to the 2015 Share Repurchase Program, at cost | | | | | (16.8 | ) | | — |
| | (4,377.5 | ) | | | | (622.5 | ) | | 16.8 |
| | 5,000.0 |
| | — |
| | | | — |
| | Issuance of common stock under stock option and stock purchase plans | | | | | 0.3 |
| | — |
| | 54.2 |
| | | | | | | | | | 54.2 |
| | | | 54.2 |
| | Issuance of common stock under stock award plan | | | | | 0.6 |
| | — |
| | (125.1 | ) | | | | | | | | | | (125.1 | ) | | | | (125.1 | ) | | Compensation related to share-based payments | | | | | | | | | 183.2 |
| | | | | | | | | | 183.2 |
| | | | 183.2 |
| | Tax benefit from share-based payments | | | | | | | | | 69.0 |
| | | | | | | | | | 69.0 |
| | | | 69.0 |
| | Balance, December 31, 2015 | — |
| | $ | — |
| | 241.2 |
| | $ | 0.1 |
| | $ | — |
| | $ | (224.0 | ) | | $ | 12,208.4 |
| | (22.6 | ) | | $ | (2,611.7 | ) | | $ | 9,372.8 |
| | $ | 2.1 |
| | $ | 9,374.9 |
|
See accompanying notes to these consolidated financial statements.
BIOGEN INC. AND SUBSIDIARIES NOTES TO CONSOLIDATED FINANCIAL STATEMENTS
1. | | | | | | | Note 1: | Summary of Significant Accounting Policies |
References in these notes to "Biogen," the "company," "we," "us" and "our" refer to Biogen Inc. and its consolidated subsidiaries. Business Overview Biogen is a global biopharmaceutical company focused on discovering, developing and delivering worldwide innovative therapies for people living with serious neurological and neurodegenerativecomplex diseases including in our core growth areasworldwide. We have a broad portfolio of multiple sclerosis (MS) and neuroimmunology,medicines to treat MS, have introduced the first approved treatment for SMA, co-developed treatments to address a defining pathology of Alzheimer’s disease (AD) and dementia, movement disorderslaunched the first approved treatment to target a genetic cause of ALS. Through our 2023 acquisition of Reata we market the first and neuromuscular disorders, including spinal muscular atrophy (SMA) and amyotrophic lateral sclerosis (ALS). We also plan to invest in emerging growth areas such as pain, ophthalmology, neuropsychiatry and acute neurology. In addition, we are employing innovative technologies to discover potential treatments for rare and genetic disorders, including new ways of treating diseases through gene therapyonly drug approved in the previously mentioned areas.U.S. and the E.U. for the treatment of Friedreich's Ataxia in adults and adolescents aged 16 years and older. We also manufactureare focused on advancing our pipeline in neurology, specialized immunology and commercialize biosimilars of advanced biologics.rare diseases. We support our drug discovery and development efforts through internal research and development programs and external collaborations. Our marketed products include TECFIDERA, VUMERITY, AVONEX, PLEGRIDY, TYSABRI ZINBRYTA and FAMPYRA for the treatment of MS,MS; SPINRAZA for the treatment of SMASMA; SKYCLARYS for the treatment of Friedreich's Ataxia; QALSODY for the treatment of ALS; and FUMADERM for the treatment of severe plaque psoriasis. We also have collaborations with Eisai on the commercialization of LEQEMBI for the treatment of Alzheimer's disease and Sage on the commercialization of ZURZUVAE for the treatment of PPD and we have certain business and financial rights with respect to RITUXAN for the treatment of non-Hodgkin's lymphoma, chronic lymphocytic leukemia (CLL)CLL and other conditions,conditions; RITUXAN HYCELA for the treatment of non-Hodgkin's lymphoma and CLL; GAZYVA for the treatment of CLL and follicular lymphoma,lymphoma; OCREVUS for the treatment of primary progressive MSPPMS and relapsing MSRMS; LUNSUMIO for the treatment of relapsed or refractory follicular lymphoma; COLUMVI, a bispecific antibody for the treatment of non-Hodgkin's lymphoma; and have the option to add other potential anti-CD20 therapies, under apursuant to our collaboration agreementarrangements with Genentech, Inc. (Genentech), a wholly-owned member of the Roche Group. We support our drug discovery and development efforts through the commitment of significant resources to discovery, research and development programs and business development opportunities, particularly within our core and emerging growth areas. For nearly two decades we have led in the research and development of new therapies to treat MS, resulting in our leadingcommercialize a portfolio of MS treatments. Now our research is focused on additional improvements in the treatmentbiosimilars of MS, such as the development of next generation therapies for MS, with a goal to reverse or possibly repair damage caused by the disease. We are also applying our scientific expertise to solve some of the most challenging and complex diseases,advanced biologics including AD, progressive supranuclear palsy (PSP), a rare condition that affects movement, speech, vision and cognitive function, Parkinson's disease and ALS. Our innovative drug development and commercialization activities are complemented by our biosimilar therapies that expand access to medicines and reduce the cost burden for healthcare systems. We are leveraging our manufacturing capabilities and know-how to develop, manufacture and market biosimilars through Samsung Bioepis, our joint venture with Samsung BioLogics Co. Ltd. (Samsung Biologics). Under our commercial agreement, we market and sell BENEPALI, an etanercept biosimilar referencing ENBREL, IMRALDI, an adalimumab biosimilar referencing HUMIRA, and FLIXABI, an infliximab biosimilar referencing REMICADE, in certain countries in Europe, as well as BYOOVIZ, a ranibizumab biosimilar referencing LUCENTIS, in the European Union (E.U.).U.S. and certain international markets. We also have exclusive rights to commercialize TOFIDENCE, a tocilizumab biosimilar referencing ACTEMRA. We continue to develop potential biosimilar product SB15, a proposed aflibercept biosimilar referencing EYLEA.
Hemophilia Spin-Off
On February 1, 2017, we completed the spin-off of our hemophilia business, Bioverativ Inc. (Bioverativ), as an independent, publicly traded company. Our consolidated results of operations and financial position included in these audited consolidated financial statements reflect the financial results of our hemophilia business for all periods through January 31, 2017.
For additional information on the spin-off of our hemophilia business,collaboration arrangements, please read Note 3, Hemophilia Spin-Off,19, Collaborative and Other Relationships, to theseour consolidated financial statements.statements included in this report. Consolidation Our consolidated financial statements reflect our financial statements, those of our wholly-owned subsidiaries and those of certain variable interest entities where we are the primary beneficiary. For consolidated entities where we own or are exposed to less than 100%100.0% of the economics, we record net income (loss) attributable to noncontrolling interests, net of tax in our consolidated statements of income equal to the percentage of the economic or ownership interest retained in such entities by the respective noncontrolling parties. Intercompany balances and transactions are eliminated in consolidation. In determining whether we are the primary beneficiary of ana variable interest entity, we apply a qualitative approach that determines whether we have both (1) the power to direct the economically significant activities of the entity and (2)
BIOGEN INC. AND SUBSIDIARIES
NOTES TO CONSOLIDATED FINANCIAL STATEMENTS — (Continued)
the obligation to absorb losses of, or the right to receive benefits from, the entity that could potentially be significant to that entity. These considerations impact the way we account for our existing collaborative relationships and other arrangements. We continuously assess whether we are the primary beneficiary of a variable interest entity as changes to existing relationships or future transactions may result in us consolidating or deconsolidating one or more of our collaborators or partners. In November 2023 we terminated the Neurimmune Agreement, which resulted in the deconsolidation of our variable interest entity, Neurimmune. Use of Estimates The preparation of our consolidated financial statements requires us to make estimates, judgments and assumptions that may affect the reported amounts of assets, liabilities, equity, revenuesrevenue and expensesexpense and related
BIOGEN INC. AND SUBSIDIARIES NOTES TO CONSOLIDATED FINANCIAL STATEMENTS — (Continued) disclosure of contingent assets and liabilities. On an on-goingongoing basis we evaluate our estimates, judgments and methodologies.assumptions. We base our estimates on historical experience and on various other assumptions that we believe are reasonable, the results of which form the basis for making judgments about the carrying values of assets, liabilities and equity and the amount of revenuesrevenue and expenses.expense. Actual results may differ from these estimates under different assumptions or conditions.estimates. Revenue Recognition We recognize revenuesrevenue when allour customer obtains control of the following criteria are met: persuasive evidence of an arrangement exists; delivery has occurredpromised goods or services, have been rendered; ourin an amount that reflects the consideration which we expect to receive in exchange for those goods or services. We recognize revenue following the five-step model prescribed under FASB ASC 606, Revenue from Contracts with Customers: (i) identify contract(s) with a customer; (ii) identify the performance obligations in the contract; (iii) determine the transaction price; (iv) allocate the transaction price to the customer is fixed or determinable;performance obligations in the contract; and collectability is reasonably assured.(v) recognize revenue when (or as) we satisfy the performance obligations. Product RevenuesRevenue Revenues from product sales areIn the U.S., we sell our products primarily to wholesale and specialty distributors and specialty pharmacies. In other countries, we sell our products primarily to wholesale distributors, hospitals, pharmacies and other third-party distribution partners. These customers subsequently resell our products to health care providers and patients. In addition, we enter into arrangements with health care providers and payors that provide for government-mandated or privately-negotiated discounts and allowances related to our products.
Product revenue is recognized when title and riskthe customer obtains control of loss have passedour product, which occurs at a point in time, typically upon delivery to the customer, whichcustomer. We expense incremental costs of obtaining a contract as and when incurred if the expected amortization period of the asset that we would have recognized is typically upon delivery.one year or less or the amount is immaterial. Reserves for Discounts and Allowances Revenues from product sales areProduct revenue is recorded net of reserves established for applicable discounts and allowances that are offered within contracts with our customers, health care providers or payors, including those associated with the implementation of pricing actions in certain of the international markets in which we operate.
Product revenue reserves, which are classified as a reduction in product revenue, are generally characterized in the following categories: discounts, contractual adjustments and returns. These reserves are based on estimates of the amounts earned or to be claimed on the related sales and are classified as reductions of accounts receivable (if the amount is payable to our customer) or a liability (if the amount is payable to a party other than our customer). Our estimates take intoof reserves established for variable consideration are calculated based upon a consistent application of our methodology utilizing the expected value method. These estimates reflect our historical experience, current contractual and statutory requirements, specific known market events and trends, industry data and forecasted customer buying and payment patterns. The transaction price, which includes variable consideration reflecting the impact of discounts and allowances, may be subject to constraint and is included in the net sales price only to the extent that it is probable that a significant reversal of the amount of the cumulative revenue recognized will not occur in a future period. Actual amounts may ultimately differ from our estimates. If actual results vary, we adjust these estimates, which could have an effect on earnings in the period of adjustment. Product revenue reserves are categorized as follows: discounts, contractual adjustments and returns.
Discounts include trade term discounts and wholesaler incentives. Trade term discounts and wholesaler incentives primarily relate to estimated obligations for credits to be granted to wholesalers for remitting payment on their purchases within established incentive periods and credits to be granted to wholesalers for compliance with various contractually-defined inventory management practices, respectively. We determine these reserves based on our historical experience, including the timing of customer payments. Contractual adjustments primarily relate to Medicaid and managed care rebates in the U.S., pharmacy rebates, co-payment (copay) assistance, Veterans Administration (VA)VA and Public Health Service (PHS)PHS discounts, specialty pharmacy program fees and other governmental rebates or applicable allowances. •Medicaid rebatesrebates: relate to our estimated obligations to states under established reimbursement arrangements. Rebate accruals are recorded in the same period the related revenue is recognized, resulting in a reduction of product revenue and the establishment of a liability which is included in accrued expense and other current liabilities.liabilities in our consolidated balance sheets. Our liability for Medicaid rebates consists of estimates for claims
BIOGEN INC. AND SUBSIDIARIES NOTES TO CONSOLIDATED FINANCIAL STATEMENTS — (Continued) that a state will make for the current quarter, claims for prior quarters that have been estimated for which an invoice has not been received, invoices received for claims from the prior quarters that have not been paid and an estimate of potential claims that will be made for inventory that exists in the distribution channel at period end. •Governmental rebatesrebates: or chargebacks, including VA and PHS discounts, represent our estimated obligations resulting from contractual commitments to sell products to qualified healthcare providers at prices lower than the list prices we charge to wholesalers which provide those products. The wholesaler charges us for the
BIOGEN INC. AND SUBSIDIARIES
NOTES TO CONSOLIDATED FINANCIAL STATEMENTS — (Continued)
difference between what the wholesaler pays for the products and the ultimate selling price to the qualified healthcare providers. Rebate and chargeback reserves are established in the same period as the related revenue is recognized, resulting in a reduction inof product revenue and a reduction in the net accounts receivable. Chargeback amounts are generally determined at the time of resale to the qualified healthcare provider from the wholesaler, and we generally issue credits for such amounts within a few weeks of the wholesaler notifying us about the resale. Our reserves for VA, PHS and other chargebacks consist of amounts that we expect to issue for inventory that exists at the wholesalers that we expect will be sold to qualified healthcare providers and chargebacks that wholesalers have claimed for which we have not issued a credit. •Managed care rebatesrebates: represent our estimated obligations to third parties,third-parties, primarily pharmacy benefit managers. Rebate accruals are recorded in the same period the related revenue is recognized, resulting in a reduction of product revenue and the establishment of a liability which is included in accrued expensesexpense and other current liabilities.liabilities in our consolidated balance sheets. These rebates result from performance-based goals, formulary position and price increase limit allowances (price protection). The calculation of the accrual for these rebates is based on an estimate of the customer’s buyingcoverage patterns and the resulting applicable contractual rebate rate(s) to be earned over a contractual period. •Copay assistanceassistance: represents financial assistance to qualified patients, assisting them with prescription drug co-payments required by insurance. The calculation of the accrual for copay is based on an estimate of claims and the cost per claim that we expect to receive associated with inventory that exists in the distribution channel at period end. •Pharmacy rebates: represent our estimated obligations resulting from contractual commitments to sell products to specific pharmacies. Rebate accruals are recorded in the same period the related revenue is recognized, resulting in a reduction of product revenue and the establishment of a liability which is included in accrued expense and other current liabilities in our consolidated balance sheets. These rebates result from contracted discounts on product purchased or product dispensed. The calculation of the accrual for these rebates is based on an estimate of the pharmacy’s buying or dispensing patterns and the resulting applicable contractual rebate rate(s) to be earned over the contractual period. •Other governmental rebates, non-USrebates: non-U.S. pharmaceutical taxes or applicable allowances primarily relate to mandatory rebates and discounts in international markets where government-sponsored healthcare systems are the primary payors for healthcare. Product returnsreturn reserves are established for returns expected to be made by wholesalers and are recorded in the period the related revenue is recognized, resulting in a reduction to product sales.revenue. In accordance with contractual terms, wholesalers are permitted to return product for reasons such as damaged or expired product. The majority of wholesaler returns are due to product expiration. Expired product return reserves are estimated through a comparison of historical return data to their related sales on a production lot basis. Historical rates of return are determined for each product and are adjusted for known or expected changes in the marketplace specific to each product. In addition to the discounts, rebates and product returns, described above and classified as a reduction of revenue, we also maintain certain customer service contracts with distributors and other customers in the distribution channel that provide us with inventory management, data and distribution services, which are generally reflected as a reduction of revenue. To the extent we can demonstrate a separable benefit and fair value for these services we classify these payments in selling, general and administrative expenses.expense in our consolidated statements of income. RevenuesRevenue from Anti-CD20 Therapeutic Programs
Revenues from anti-CD20 therapeutic programs consist of:
| | (i) | our share of pre-tax profits and losses in the United States (U.S.) for RITUXAN and GAZYVA; |
| | (ii) | reimbursement of our selling and development expenses in the U.S. for RITUXAN; and |
| | (iii) | other revenues from anti-CD20 therapeutic programs, which primarily consist of our share of pre-tax co-promotion profits on RITUXAN in Canada and royalty revenues on sales of OCREVUS. |
Pre-tax co-promotion profits on RITUXAN and GAZYVA are calculated and paid to us by Genentech in the U.S. Pre-tax co-promotion profits on RITUXAN are calculated and paid to us by the Roche Group in Canada. Pre-tax co-promotion profits consist of U.S. and Canadian net sales to third-party customers less applicable costs to manufacture, third-party royalty expenses, distribution, selling and marketing expenses and joint development expenses incurred by Genentech, the Roche Group and us. Our share of the pre-tax profits on RITUXAN and GAZYVA in the U.S. and pre-tax co-promotion profits on RITUXAN in Canada include estimates made by Genentech and those estimates are subject to change. Actual results may differ from our estimates. For additional information on our collaboration with Genentech please read Note 20, is within the scope of ASC 808, Collaborative Agreements, which provides guidance on the presentation and Other Relationships,disclosure of collaborative arrangements. For purposes of this footnote, we refer to these consolidated financial statements.
RITUXAN and RITUXAN HYCELA collectively as RITUXAN.
BIOGEN INC. AND SUBSIDIARIES NOTES TO CONSOLIDATED FINANCIAL STATEMENTS — (Continued)
Royalty Revenues
We receiveOur share of the pre-tax co-promotion profits on RITUXAN, GAZYVA and LUNSUMIO and royalty revenuesrevenue on sales by our licensees of other products covered under patents thatOCREVUS, resulted from an exchange of a license. As we own. We do not have future performance obligations under thesethe license arrangements. We record these revenues basedor collaboration agreement, revenue is recognized as the underlying sales occur.
Revenue from anti-CD20 therapeutic programs consist of: (i) our share of pre-tax profits and losses in the U.S. for RITUXAN, GAZYVA and LUNSUMIO; (ii) royalty revenue on estimatessales of OCREVUS; and (ii) other revenue from anti-CD20 therapeutic programs, which consists of our share of pre-tax co-promotion profits on RITUXAN in Canada, royalties on net sales of COLUMVI in the U.S. and royalties on sales of LUNSUMIO outside the U.S. Pre-tax co-promotion profits on RITUXAN, GAZYVA and LUNSUMIO are calculated and paid to us by Genentech and the Roche Group. Pre-tax co-promotion profits consist of net sales to third-party customers less applicable costs to manufacture, third-party royalty expense, distribution, selling and marketing expense and joint development expense incurred by Genentech and the Roche Group. Our share of the salespre-tax profits on RITUXAN, GAZYVA and LUNSUMIO include estimates that occurred during the relevant period as a component of other revenues. The relevant period estimates of sales are based on interiminformation received from Genentech and the Roche Group. These estimates are subject to change and actual results may differ. We recognize royalty revenue on sales of OCREVUS based on our estimates from third party and market research data provided by licensees and analysis of historical royalties that have been paid to us, adjusted for any changes in facts and circumstances, as appropriate.OCREVUS sales occurring during the corresponding period. Differences between actual and estimated royalty revenues arerevenue will be adjusted for in the period in which they become known, typicallywhich is generally expected to be the following quarter. Historically, adjustments have not been material when compared Prior to actual amounts paid by licensees. Multiple-Element Revenue Arrangements
We may enter into transactions that involve the sale of products and related services under multiple element arrangements. In accounting for these transactions,regulatory approval, we assess the elementsrecord our share of the contractexpense incurred by the collaboration for the development of anti-CD20 products within research and whether each element has standalone valuedevelopment expense and allocate revenuespre-commercialization costs within selling, general and administrative expense in our consolidated statements of income. After an anti-CD20 product is approved, we record our share of the development and sales and marketing expense related to that product as a reduction of our share of pre-tax profits in revenue from anti-CD20 therapeutic programs.
Accordingly, Biogen recorded its share of the various elements based on their estimatedexpense incurred in connection with the development of LUNSUMIO within research and development expense and its share of pre-commercialization costs within selling, pricegeneral and administrative expense through December 2022, when regulatory approval was granted by the FDA. Beginning in January 2023 our share of pre-tax profits and losses in the U.S. for LUNSUMIO was reflected as a component of total revenues. The selling pricerevenue from anti-CD20 therapeutic programs within our consolidated statements of income. For additional information on our relationship with Genentech, please read Note 19, Collaborative and Other Relationships, to these consolidated financial statements. Contract Manufacturing, Royalty and Other Revenue Contract Manufacturing Revenue We record contract manufacturing revenue primarily from amounts earned under contract manufacturing agreements with our strategic customers. Revenue under contract manufacturing agreements is recognized when the customer obtains control of the product, which may occur at a point in time or over time depending on the terms and conditions of the agreement. During the first quarter of 2023 we began recognizing contract manufacturing revenue for LEQEMBI, upon accelerated approval of LEQEMBI in the U.S. Prior to accelerated approval, our share of contract manufacturing amounts related to LEQEMBI were recognized in research and development expense within our consolidated statements of income. Royalty and Other Revenue Royalty and other revenue primarily reflects the royalties we receive from net sales on products related to patents that we have out-licensed, as well as royalty revenue on biosimilar products from our collaboration arrangements with Samsung Bioepis and our 50.0% share of LEQEMBI product revenue, net and cost of sales, including royalties, as we are not the principal. These arrangements resulted from an exchange of a revenue generating element can belicense and utilize the sales and usage based on current selling prices offered by us or another party for current products or management’s best estimate of a selling price. Revenues allocated to an individual elementroyalty exception. Therefore, royalties received are recognized when all other revenue recognition criteria are met for that element.as the underlying sales occur.
BIOGEN INC. AND SUBSIDIARIES NOTES TO CONSOLIDATED FINANCIAL STATEMENTS — (Continued) Collaborative and Other Relationships OurWe also have a number of significant collaborative and other third-party relationships for revenue and for the development, regulatory approval, commercialization and commercialization arrangement with AbbVie Inc. (AbbVie) represents a collaborative arrangement as each party is an active participantmarketing of certain of our products and exposed to significant risks and rewards of the arrangement.product candidates. Where we are the principal on sales transactions with third parties, we recognize revenues,revenue, cost of sales and operating expensesexpense on a gross basis in their respective lines in our consolidated statements of income. Where we are not the principal on sales transactions with third parties, we record our share of the revenues,revenue, cost of sales and operating expenses onexpense is recorded as a net basis in collaborative and other relationships included incomponent of other revenue in our consolidated statements of income.
Our development and commercialization arrangements with Genentech, Eisai, Sage and Samsung Bioepis represent collaborative arrangements as each party is an active participant in one or more joint operating activities and is exposed to significant risks and rewards of these arrangements. These arrangements resulted from an exchange of a license and utilize the sales and usage based royalty exception, as applicable. Therefore, revenue relating to royalties or profit-sharing amounts received is recognized as the underlying sales occur. For additional information on our collaboration arrangements with AbbVie,Genentech, Eisai, Sage and Samsung Bioepis, please read Note 20, 19, Collaborative and Other Relationships, to these consolidated financial statements. Fair Value Measurements We have certain financial assets and liabilities recorded at fair value which have been classified as Level 1, 2 or 3 within the fair value hierarchy as described in the accounting standards for fair value measurements. •Level 1 — Fair values are determined utilizing quoted prices (unadjusted) in active markets for identical assets or liabilities that we have the ability to access; •Level 2 — Fair values are determined by utilizing quoted prices for identical or similar assets and liabilities in active markets or other market observable inputs such as interest rates, yield curves, and foreign currency spot rates;rates and option pricing valuation models; and•Level 3 — Prices or valuations that require inputs that are both significant to the fair value measurement and unobservable. The majority of our financial assets have been classified as Level 2. Our financial assets (which typically include our cash equivalents, derivative contracts, marketable debt securities and certain of our marketable equity securities, derivative contracts and plan assets for deferred compensation) have been initially valued at the transaction price and subsequently valued, at the end of each reporting period, utilizing third-party pricing services or other market observable data.option pricing valuation models. The pricing services utilize industry standard valuation models, including both income and market-based approaches and observable market inputs to determine value. These observable market inputs include reportable trades, benchmark yields, credit spreads, broker/dealer quotes, bids, offers, current spot rates and other industry and economic events. We validate the prices provided by our third-party pricing services by reviewing their pricing methods and matrices,understanding the models used, obtaining market values from other pricing sources and analyzing pricing data in certain instances. The option pricing valuation models use assumptions within the model, including the term, stock price volatility, constant maturity risk-free interest rate and dividend yield. After completing our validation procedures, we did not adjust or override any fair value measurements provided by our pricing services as of December 31, 20172023 and 2016.
BIOGEN INC. AND SUBSIDIARIES
NOTES TO CONSOLIDATED FINANCIAL STATEMENTS — (Continued)
2022.
Other Assets and Liabilities The carrying amounts reflected in our consolidated balance sheets for current accounts receivable, due from anti-CD20 therapeutic programs, other current assets, accounts payable and accrued expensesexpense and other, approximate fair value due to their short-term maturities. Cash and Cash Equivalents We consider only those investments whichthat are highly liquid, readily convertible to cash and that mature within three months from date of purchase to be cash equivalents. As of December 31, 20172023 and 2016,2022, cash equivalents were comprised of money market funds, and commercial paper, overnight reverse repurchase agreements and other debt securities with maturities less than 90 daysthree months from the date of purchase.
BIOGEN INC. AND SUBSIDIARIES NOTES TO CONSOLIDATED FINANCIAL STATEMENTS — (Continued) Accounts Receivable The majority of our accounts receivable arise from product sales and primarily represent amounts due from our wholesale and other third-party distributors, public hospitals, pharmacies and other government entities. entities and have standard payment terms that generally require payment within 30 to 90 days. We monitordo not adjust our receivables for the financial performance and creditworthinesseffects of our customers so thata significant financing component at contract inception if we can properly assess and respondexpect to changescollect the receivables in their credit profile. one year or less from the time of sale. We provide reserves against trade receivablesaccounts receivable for estimated losses that may result from a customer’scustomer's inability to pay. Amounts determined to be uncollectible are charged or written-off against the reserve. To date, Receivables from Samsung BioLogics In April 2022 we completed the sale of our historical reserves49.9% equity interest in Samsung Bioepis to Samsung BioLogics, which resulted in a receivable of approximately $1.3 billion in cash to be deferred over two payments. The first deferred payment of $812.5 million was received in April 2023 and write-offsthe second deferred payment of accounts receivable have not been significant. In countries where we have experienced a pattern of payments extending beyond our contractual payment term and we expect to collect receivables greater than one year from the time of sale, we have discounted our receivables and reduced related revenues over the period of time that we estimate those amounts will be paid using the country’s market-based borrowing rate for such period. The related receivables are classified$437.5 million is due at the timesecond anniversary of the closing of this transaction in April 2024. The payments due to us from Samsung BioLogics have been recorded at their estimated fair values through the use of risk-adjusted discount rates. For additional information on the accounting for the sale as non-current assets. We accreteof our equity interest income onin Samsung Bioepis, please read Note 3, Dispositions, to these receivables, which is recognized as a component of other income (expense), net in our consolidated statements of income.financial statements.
Concentration of Credit Risk Financial instruments that potentially subject us to concentrations of credit risk include cash and cash equivalents, investments, derivatives and accounts receivable. We attempt to minimize the risks related to cash and cash equivalents and investments by investing in a broad and diverse range of financial instruments as previously defined by us. We have established guidelines related to credit ratings and maturities intended to safeguard principal balances and maintain liquidity. Our investment portfolio is maintained in accordance with our investment policy, which defines allowable investments, specifies credit quality standards and limits the credit exposure of any single issuer. We minimize credit risk resulting from derivative instruments by choosing only highly rated financial institutions as counterparties. Concentrations of credit risk with respect to receivables, which are typically unsecured, are somewhat mitigated due to the wide variety of customers and markets using our products, as well as their dispersion across many different geographic areas. The majority of our accounts receivable arise from product sales in the U.S. and Europe and have standard payment terms that generally require payment within 30 to 90 days. We monitor the financial performance and creditworthiness of our customers so that we can properly assess and respond to changes in their credit profile. We continue to monitor these conditions and assess their possible impact on our business. As of December 31, 2017 and 2016, two wholesale distributors individually accounted for approximately 26.5% and 19.0%, and 37.2% and 19.2%, of accounts receivable, net, respectively.
Marketable Securities and Other Investments Marketable Debt Securities Available-for-sale marketable debt securities are recorded at fair market value and unrealized gains and losses are included in accumulated other comprehensive income (loss)AOCI in equity, net of related tax effects, unless the security has experienced a credit loss, we have determined that we have the intent to sell the security or we have determined that it is more likely than not that we will have to sell the security before its expected recovery. Realized gains and losses are reported in other income (expense),(income) expense, net on a specific identification basis.
BIOGEN INC. AND SUBSIDIARIES
NOTES TO CONSOLIDATED FINANCIAL STATEMENTS — (Continued)
2023 we sold all of our marketable debt securities and used the proceeds to partially fund our acquisition of Reata. For additional information on our acquisition of Reata, please read Note 2, Acquisitions, to these consolidated financial statements.
Marketable Equity Securities and Venture Capital Funds Our marketable equity securities are recorded at fair market value and unrealized gains and losses are included in other (income) expense, net in our consolidated statements of income. Our marketable equity securities represent investments in publicly traded equity securities and are included in investments and other assets in our consolidated balance sheets. When assessing whether a decline Our investments in theventure capital funds are recorded at net asset value, which approximates fair value, and unrealized gains and losses are included in other (income) expense, net in our consolidated statements of a marketable equity security is other-than-temporary, we consider the fair market valueincome.
BIOGEN INC. AND SUBSIDIARIES NOTES TO CONSOLIDATED FINANCIAL STATEMENTS — (Continued) The underlying investments of the security, the duration of the security’s decline and prospects for the underlying business, including favorable or adverse clinical trial results, new product initiatives and new collaborative agreements with the companiesventure capital funds in which we have invested.invest are in equity securities of certain biotechnology companies and are included in investments and other assets in our consolidated balance sheets. Non-Marketable Equity Securities We also invest in equity securities of companies whose securities are not publicly traded and where fair value is not readily available. These investments are recorded using either the cost method or the equity method of accounting or the cost minus impairment adjusted for observable price changes, depending on our ownership percentage and other factors that suggest we have significant influence. We monitor these investments to evaluate whether any increase or decline in their value has occurred, that would be other-than-temporary, based on the implied value of recent company financings, public market prices of comparable companies and general market conditions andconditions. These investments are included in investments and other assets in our consolidated balance sheets. Evaluating InvestmentsMarketable Debt Securities for Other-than-Temporary Impairments We conduct periodic reviews to identify and evaluate each investment that has an unrealized loss, in accordance with the meaning of other-than-temporary impairment and its application to certain investments.impairment. An unrealized loss exists when the current fair value of an individual security is less than its amortized cost basis. Unrealized losses on available-for-sale debt securities that are determined to be temporary, and not related to credit loss, are recorded, net of tax, in accumulated other comprehensive income.AOCI. For available-for-sale debt securities with unrealized losses, management performs an analysis to assess whether we intend to sell or whether we would more likely than not be required to sell the security before the expected recovery of the amortized cost basis. Where we intend to sell a security, or may be required to do so, the security’s decline in fair value is deemed to be other-than-temporary and the full amount of the unrealized loss is reflected in earnings as an impairment loss. Regardless of our intent to sell a security, we perform additional analysis on all securities with unrealized losses to evaluate losses associated with the creditworthiness of the security. Credit losses are identified where we do not expect to receive cash flows sufficient to recover the amortized cost basis of a security. For equity securities, when assessing whether a decline in value is other-than-temporary, we consider the fair market value of the security, the duration of the security’s decline and the financial condition of the issuer. We then consider our intent and ability to hold the equity security for a period of time sufficient to recover our carrying value. Where we have determined that we lack the intent and ability to hold an equity security to its expected recovery, the security’s decline in fair value is deemed to be other-than-temporary and is reflected in earnings as an impairment loss.
Equity Method of Accounting In circumstances where we have the ability to exercise significant influence over the operating and financial policies of a company in which we have an investment, we utilize the equity method of accounting for recording investment activity. In assessing whether we exercise significant influence, we consider the nature and magnitude of our investment, the voting and protective rights we hold, any participation in the governance of the other company and other relevant factors such as the presence of a collaborative or other business relationship. Under the equity method of accounting, we record in our resultsconsolidated statements of operationsincome our share of income or loss of the other company. If our share of losses exceeds the carrying value of our investment, we will suspend recognizing additional losses and will continue to do so unless we commit to providing additional funding. Inventory Inventories are stated at the lower of cost or marketnet realizable value with cost based on the first-in, first-out method. We classify our inventory costs as long-term when we expect to utilize the inventory beyond our normal operating cycle and include these costs in investments and other assets in our consolidated balance sheets. Inventory that can be used in either the production of clinical or commercial products is expensed as research and development costs when identified for use in a clinical manufacturing campaign.
BIOGEN INC. AND SUBSIDIARIES
NOTES TO CONSOLIDATED FINANCIAL STATEMENTS — (Continued)
Capitalization of Inventory Costs We capitalize inventory costs associated with our products prior to regulatory approval, when, based on management’s judgment, future commercialization is considered probable and the future economic benefit is expected to be realized. We consider numerous attributes in evaluating whether the costs to manufacture a particular product should be capitalized as an asset. We assess the regulatory approval process and where the particular product stands in relation to that approval process, including any known safety or efficacy concerns, potential labeling restrictions and other impediments to approval. We evaluate our anticipated research and development initiatives and constraints relating to the product and the indication in which it will be used. We consider our manufacturing environment including our supply chain in determining logistical constraints that could hamper approval or commercialization. We consider the shelf life of the product in relation to the expected timeline for approval and we consider patent related or contract issues that may prevent or delay commercialization. We also
BIOGEN INC. AND SUBSIDIARIES NOTES TO CONSOLIDATED FINANCIAL STATEMENTS — (Continued) base our judgment on the viability of commercialization, trends in the marketplace and market acceptance criteria. Finally, we consider the reimbursement strategies that may prevail with respect to the product and assess the economic benefit that we are likely to realize. We expense previously capitalized costs related to pre-approval inventory upon a changechanges in such judgment,judgments, due to, among other potential factors, a denial or significant delay of approval by necessary regulatory bodies. Obsolescence and Unmarketable Inventory We periodicallyAt each reporting period we review our inventories for excess or obsolescence and write-down obsolete or otherwise unmarketable inventory to its estimated net realizable value. If the actual net realizable value is less than that estimated by us, or if it is determined that inventory utilization will further diminish based on estimates of demand, additional inventory write-downs may be required. Additionally, our products are subject to strict quality control and monitoring that we perform throughout the manufacturing process. In the event that certain batches or units of product no longer meet quality specifications, we will record a charge to cost of sales to write-down any unmarketable inventory to its estimated net realizable value. In all cases, product inventory is carried at the lower of cost or its estimated net realizable value. Amounts written-down due to unmarketable inventory are charged to cost of sales.sales in our consolidated statements of income.
Property, Plant and Equipment Property, plant and equipment are carried at cost, subject to reviewreviews for impairment whenever events or changes in circumstances indicate that the carrying amount of the asset may not be recoverable. The cost of normal, recurring or periodic repairs and maintenance activities related to property, plant and equipment are expensed as incurred. The cost for planned major maintenance activities, including the related acquisition or construction of assets, is capitalized if the repair will result in future economic benefits. Interest costs incurred during the construction of major capital projects are capitalized until the underlying asset is ready for its intended use, at which point the interest costs are amortized as depreciation expense over the life of the underlying asset. We also capitalize certain direct and incremental costs associated with the validation effort required for licensing by regulatory agencies of new manufacturing equipment for the production of a commercially approved drug. These costs primarily include direct labor and material and are incurred in preparing the equipment for its intended use. The validation costs are either amortized over the life of the related equipment or expensed as cost of sales when the product produced in the validation process is sold. In addition, we capitalize certain internal use computer software development costs. If the software is an integral part of production assets, these costs are included in machinery and equipment and are amortized on a straight-line basis over the estimated useful lives of the related software, which generally range from three to five years.
BIOGEN INC. AND SUBSIDIARIES
NOTES TO CONSOLIDATED FINANCIAL STATEMENTS — (Continued)
We generally depreciate or amortize the cost of our property, plant and equipment using the straight-line method over the estimated useful lives of the respective assets, which are summarized as follows: | | | | | | | Asset Category | Useful Lives | | Land | Not depreciated | Asset Category | Useful Lives | Land | Not depreciated | | Buildings | 15 to 40 years | | Leasehold Improvements | Lesser of the useful life or the term of the respective lease | | Furniture and Fixtures | 5 to 7 years | | Machinery and Equipment | 5 to 20 years | | Computer Software and Hardware | 3 to 5 years |
When we dispose of property, plant and equipment, we remove the associated cost and accumulated depreciation from the related accounts in our consolidated balance sheets and include any resulting gain or loss in our consolidated statements of income. Leases We determine if an arrangement is a lease at contract inception. Operating lease assets represent our right to use an underlying asset for the lease term and operating lease liabilities represent our obligation to make lease payments arising from the lease. Operating lease assets and liabilities are recognized at the commencement date of the lease based upon the present value of lease payments over the lease term. When determining the lease term, we include options to extend or terminate the lease when it is reasonably certain that they will be exercised.
BIOGEN INC. AND SUBSIDIARIES NOTES TO CONSOLIDATED FINANCIAL STATEMENTS — (Continued) We use the implicit rate when readily determinable and use our incremental borrowing rate when the implicit rate is not readily determinable based upon the information available at the commencement date in determining the present value of the lease payments. Our incremental borrowing rate is determined using a secured borrowing rate for the same currency and term as the associated lease. The lease payments used to determine our operating lease assets may include lease incentives, stated rent increases and escalation clauses linked to rates of inflation when determinable and are recognized in our operating lease assets in our consolidated balance sheets. Our lease agreements may include both lease and non-lease components, which we account for as a single lease component when the payments are fixed. Variable payments included in the lease agreement are expensed as incurred. For certain equipment leases, such as vehicles, we apply a portfolio approach to effectively account for the operating lease assets and liabilities. Our operating leases are reflected in operating lease assets, accrued expense and other and long-term operating lease liabilities in our consolidated balance sheets. Lease expense for minimum lease payments is recognized on a straight-line basis over the lease term. We also have real estate lease agreements which are subleased to third-parties. Operating leases for which we are the sublessor are included in accrued expense and other and other long-term liabilities in our consolidated balance sheets. We recognize sublease income on a straight-line basis over the lease term in our consolidated statements of income. For additional information on our leases, please read Note 12, Leases, to these consolidated financial statements. Intangible Assets Our intangible assets consist of completed technology (comprised of acquired and in-licensed rights and patents, developed technology out-licensed patents, in-process research and developmentother), IPR&D acquired after January 1, 2009, priority review vouchers and trademarks and trade names. Our intangible assets are recorded at fair value at the time of their acquisition and are stated in our consolidated balance sheets net of accumulated amortization and impairments, if applicable. Intangible assets related to acquired and in-licensed rights and patents, developed technology and out-licensed patentsother are amortized over their estimated useful lives using the economic consumption method if anticipated future revenuesrevenue can be reasonably estimated. The straight-line method is used when revenuesrevenue cannot be reasonably estimated. Amortization is recorded aswithin amortization and impairment of acquired intangible assets in our consolidated statements of income. Acquired and in-licensed rights and patents primarily relate to obtaining the fair value of the U.S. and rest of world licenses to Forward Pharma A/S' (Forward Pharma) intellectual property, including Forward Pharma's intellectual property related to TECFIDERA, and our acquisition of all remaining rights to TYSABRI from Elan Pharma International, Ltd. (Elan), an affiliate of Elan Corporation, plc. Developed technology primarily relates to our AVONEX product, which was recorded in connection with the merger of Biogen, Inc. and IDEC Pharmaceuticals Corporation in 2003. We amortize the intangible assets related to TECFIDERA, TYSABRI and AVONEXour marketed products using the economic consumption method based on revenuesrevenue generated from the products underlying the related intangible assets. An analysis of the anticipated lifetime revenuesrevenue of TECFIDERA, TYSABRI and AVONEXour marketed products is performed annually during our long-range planning cycle which is generally updated in the third quarter of each year, and whenever events or changes in circumstances would significantly affect the anticipated lifetime revenuesrevenue of TECFIDERA, TYSABRI or AVONEX.the relevant products.
Intangible assets related to trademarks, trade names, and in-process research and developmentIPR&D prior to commercialization and priority review vouchers are not amortized because they have indefinite lives; however, they are subject to review for impairment. We review our intangible assets with indefinite lives for impairment annually, as of October 31, and whenever events or changes in circumstances indicate that the carrying value of an asset may not be recoverable.
BIOGEN INC. AND SUBSIDIARIES
NOTES TO CONSOLIDATED FINANCIAL STATEMENTS — (Continued)
Acquired In-process Research and Development (IPR&D) Acquired IPR&D represents the fair value assigned to research and development assets that have not reached technological feasibility. The value assigned to acquired IPR&D is determined by estimating the costs to develop the acquired technology into commercially viable products, estimating the resulting revenuesrevenue from the projects and discounting the net cash flowsflow to present value. The revenuesrevenue and costscost projections used to value acquired IPR&D are, as applicable, reduced based on the probability of success of developing a new drug. Additionally, the projections consider the relevant market sizes and growth factors, expected trends in technology and the nature and expected timing of new product introductions by us and our competitors. The rates utilized to discount the net cash flowsflow to their present value are commensurate with the stage of development of the projects and uncertainties in the economic estimates used in the projections. Upon the acquisition of IPR&D, we complete an assessment of whether our acquisition constitutes the purchase of a single asset or a group of assets. We consider multiple factors in this assessment, including the nature of the technology acquired, the presence or absence of separate cash flows,flow, the development process and stage of completion, quantitative significance and our rationale for entering into the transaction.
BIOGEN INC. AND SUBSIDIARIES NOTES TO CONSOLIDATED FINANCIAL STATEMENTS — (Continued) If we acquire a business as defined under applicable accounting standards, then the acquired IPR&D is capitalized as an intangible asset. If we acquire an asset or group of assets that do not meet the definition of a business under applicable accounting standards, then the acquired IPR&D is expensed on its acquisition date. Future costs to develop these assets are recorded to research and development expense in our consolidated statements of income as they are incurred. When performing our impairment assessment, we calculate the fair value using the same methodology as described above. If the carrying value of our acquired IPR&D exceeds its fair value, then the intangible asset is written-downwritten down to its fair value. Certain IPR&D programs have a fair value that is not significantlyChanges in excess of carrying value, including treatments for forms of neuropathic pain, such as trigeminal neuralgia (TGN). Such programs could become impaired ifestimates and assumptions used in determining the fair value change.of our acquired IPR&D could result in an impairment. Impairments are recorded aswithin amortization and impairment of acquired intangible assets in our consolidated statements of income. Goodwill Goodwill represents the difference between the purchase price and the fair value of the identifiable tangible and intangible net assets when accounted for using the purchase method of accounting. Goodwill is not amortized, but is reviewed for impairment. Goodwill is reviewedimpairment annually, as of October 31, and whenever events or changes in circumstances indicate that the carrying value of the goodwill mightmay not be recoverable. We compare the fair value of our reporting unit to its carrying value. If the carrying value of the net assets assigned to the reporting unit exceeds the fair value of our reporting unit, we would record an impairment loss equal to the difference. As described in Note 25, Segment Information, to these consolidated financial statements, we operate inas one operating segment, which we consideris our only reporting unit. Impairment of Long-Lived Assets Long-lived assets to be held and used, including property, plant and equipment, and definite-lived intangible assets are reviewed for impairment whenever events or changes in circumstances indicate that the carrying amount of the assets or asset group may not be recoverable. Determination of recoverability is based on an estimate of undiscounted future cash flowsflow resulting from the use of the asset and its eventual disposition. In the event that such cash flows areflow is not expected to be sufficient to recover the carrying amount of the assets, the assets are written-down to their fair values. Long-lived assets to be disposed of are carried at fair value less costs to sell.
BIOGEN INC. AND SUBSIDIARIES
NOTES TO CONSOLIDATED FINANCIAL STATEMENTS — (Continued)
Contingent Consideration The consideration for our acquisitions often includes future payments that are contingent upon the occurrence of a particular event or events. For acquisitions completed before January 1, 2009, we record contingent consideration resulting from a business combination when the contingency is resolved. For acquisitions that qualify as business combinations completed after January 1, 2009, weWe record an obligation for such contingent payments at fair value on the acquisition date. We estimate the fair value of contingent consideration obligations through valuation models that incorporate probability-adjusted assumptions related to the achievement of the milestones and thus likelihood of making related payments. We revalue our contingent consideration obligations each reporting period. Changes in the fair value of our contingent consideration obligations are recognized in our consolidated statements of income. Changes in the fair value of the contingent consideration obligations can result from changes to one or multiple inputs, including adjustments to the discount rates, changes in the amount or timing of expected expenditures associated with product development, changes in the amount or timing of cash flowsflow and reserves associated with products upon commercialization, changes in the assumed achievement or timing of any cumulative sales-based and development milestones, changes in the probability of certain clinical events and changes in the assumed probability associated with regulatory approval. Discount rates in our valuation models represent a measure of the credit risk associated with settling the liability. The period over which we discount our contingent obligations is based on the current development stage of the product candidates, our specific development plan for that product candidate adjusted for the probability of completing the development step and when the contingent payments would be triggered. In estimating the probability of success, we utilize data regarding similar milestone events from several sources, including industry studies and our own experience. These fair value measurements are based on significant inputs not observable in the market. Significant judgment is employed in determining the appropriateness of these assumptions as of the acquisition date and for each subsequent period. Accordingly, changes in assumptions could have a material impact on the amount
BIOGEN INC. AND SUBSIDIARIES NOTES TO CONSOLIDATED FINANCIAL STATEMENTS — (Continued) Derivative Instruments and Hedging Activities Cash Flow and Fair Value Derivative Instruments We recognize all derivative instruments as either assets or liabilities at fair value in our consolidated balance sheets. Changes in the fair value of derivativesour derivative instruments are recordedrecognized each period in current earnings or accumulated other comprehensive income (loss),AOCI, depending on whether athe derivative instrument is designated as part of a hedge transaction and, if so, the type of hedge transaction. We classify the cash flowsflow from these instruments in the same category as the cash flowsflow from the hedged items. We do not hold or issue derivative instruments for trading or speculative purposes. We assess both at inception and on an ongoing basis, whether the derivativesderivative instruments that are used in hedging transactions are highly effective in offsetting the changes in cash flowsflow or fair values of the hedged items. We also assess hedge ineffectiveness onexclude the forward points portion of the derivative instruments used in a quarterly basishedging transaction from the effectiveness test and record the fair value gain or loss related to this portion each period in our consolidated statements of income in the ineffective portion to current earnings.same line as the underlying hedged item. If we determine that a forecasted transaction is no longer probable of occurring, we discontinue hedge accounting for the affected portion of the hedge instrument, and any related unrealized gain or loss on the contract is recognized in current earnings. Net Investment Derivative Instruments Designated net investment hedges are recognized as either assets or liabilities, at fair value, in our consolidated balance sheets. We hedge the changes in the spot exchange rate in AOCI and exclude changes to the forward rate and amortize the forward points in other (income) expense, net in our consolidated statements of income over the term of the contract. We classify the cash flow from these instruments in the same category as the cash flow from the hedged items. Beginning in the second quarter of 2022 we no longer held net investment hedges as they were closed with the sale of our 49.9% equity interest in Samsung Bioepis in April 2022. For additional information on the sale of our equity interest in Samsung Bioepis, please read Note 3, Dispositions, to these consolidated financial statements. For additional information on our derivative instruments and hedging activities, please read Note 10, Derivative Instruments, to these consolidated financial statements. Translation of Foreign Currencies The functional currency for most of our foreign subsidiaries is their local currency. For our non-U.S. subsidiaries that transact in a functional currency other than the U.S. dollar, assets and liabilities are translated at current rates of exchange at the balance sheet date. Income and expense items are translated at the average foreign currency exchange rates for the period. Adjustments resulting from the translation of the financial statements of our foreign operations into U.S. dollars are excluded from the determination of net income and are recorded in accumulated other comprehensive income,AOCI, as a separate component of equity. For subsidiaries where the functional currency of the assets and liabilities differ from the local currency, non-monetary assets and liabilities are translated at the rate of exchange in effect on the date assets were acquired while monetary assets and liabilities are translated at current rates of exchange as of the balance sheet date. Income and expense items are translated at the average foreign currency rates for the period. Translation adjustments of these subsidiaries are included in other income (expense),(income) expense, net in our consolidated statements of income.
BIOGEN INC. AND SUBSIDIARIES
NOTES TO CONSOLIDATED FINANCIAL STATEMENTS — (Continued)
Royalty Cost of Sales We make royalty payments to a number of third partiesthird-parties under license or purchase agreements associated with our acquisition of intellectual property. These royalty payments are typically calculated as a percentage (royalty rate) of the sales of our products in a particular year. That royalty rate may remain constant, increase or decrease within each year based on the total amount of sales during the annual period. Each quarterly period, we estimate our total royalty obligation for the full year and recognize the proportional amount as cost of sales based on actual quarterly sales as a percentage of full year estimated sales. For example, if the level of net sales in any calendar year increases the royalty rate within the year, we will record our cost of sales at an even rate over the year, based on the estimated blended royalty rate.
BIOGEN INC. AND SUBSIDIARIES NOTES TO CONSOLIDATED FINANCIAL STATEMENTS — (Continued) Accounting for Share-Based Compensation Our share-based compensation programs grant awards that have included stock options, restricted stock units that vest based on stock performance known as market stock units (MSUs),MSUs, time-vested RSUs, performance-vested restricted stock units that settle in stock or cash (CSPUs), time-vested restricted stock units (RSUs), performance-vested restricted stock units that can be settled in cash or shares of our common stock (PUs) at the sole discretion of the Compensation and Management Development Committee of the Board of Directors(PSUs) and shares issued under our employee stock purchase plan (ESPP). We chargeESPP. Compensation expense is recognized based on the estimated fair value of the awards against incomeat grant date. We recognize compensation expense for the number of awards expected to vest after taking into consideration an estimate of award forfeitures over the requisite service period, which is generally the vesting period. Where awards are made with non-substantive vesting periods (for instance, where a portion of the award vests upon retirement eligibility), we estimate and recognize expense based on the period from the grant date to the date the employee becomes retirement eligible. The fair values of our stock option grants are estimated as of the date of grant using a Black-Scholes option valuation model. The estimated fair values of the stock options are then expensed over the options’options' vesting periods. The fair values of our MSUs and PSUs that settle in stock and have market-based metrics are estimated using a lattice model with a Monte Carlo simulation. We apply an accelerated attribution method to recognize share-based compensation expense over the applicable service period net of estimated forfeitures when accounting for our MSUs.these awards. The probability of actual shares expected to be earned is considered in the grant date valuation, therefore the expense is not adjusted to reflect the actual units earned. The fair values of our RSUs are based on the market value of our stock on the date of grant. Compensation expense net of forfeitures, for RSUs is recognized straight-line over the applicable service period. We apply an accelerated attribution method to recognize share-based compensation expense when accounting for our CSPUs and PUsPSUs that settle in cash, and the fair value of the liability is remeasured at the end of each reporting period through expected settlement. Compensation expense associated with CSPUs and PUsPSUs that settle in cash are based upon the stock price and the number of units expected to be earned after assessing the probability that certain performance criteria will be met and the associated targeted payout level that is forecasted willassociated with the performance criteria expected to be achieved, net of estimated forfeitures.achieved. Cumulative adjustments are recorded each quarter to reflect changes in the stock price and estimated outcome of the performance-related conditions until the date results are determined and settled. If performance criteria are not met or not expected to be met, any compensation expense previously recognized to date associated with the awards will be reversed. The purchasefair values of PSUs that settle in stock and do not have market-based metrics are based upon the stock price on the date of common stock under our ESPPgrant. Compensation expense is equalrecognized for the number of units expected to 85%be earned after assessing the probability that certain performance criteria will be met and the targeted payout level associated with the performance criteria expected to be achieved. Cumulative adjustments are recorded each quarter to reflect the estimated outcome of the lesser of (i)performance-related conditions until the fair market value per share of the common stock on the first business day of an offering perioddate results are determined and (ii) the fair market value per share of the common stock on the purchase date. The fair value of the discounted purchases made under our ESPP is calculated using the Black-Scholes model. The fair value of the look-back provision plus the 15% discount is recognized assettled. If performance criteria are not met or not expected to be met, any compensation expense overpreviously recognized to date associated with the 90-day purchase period.awards will be reversed. Research and Development ExpensesExpense Research and development expenses consistexpense consists of upfront fees and milestones paid to collaborators and expenses incurred in performing research and development activities, which include compensation and benefits, facilities and overhead expenses,expense, clinical trial expensesexpense and fees paid to contract research organizations (CROs),CROs, clinical supply and manufacturing expenses,expense, write-offs of inventory that was previously capitalized in anticipation of product launch and determined to no longer be realizable and other outside expenses.expense and upfront fees and milestones paid to third-party collaborators. Research and development expensesexpense is expensed as incurred. Upfront and milestone payments made to third-party collaborators are expensed as incurred.incurred up to the point of regulatory approval. Milestone payments made upon regulatory approval are capitalized and amortized over the remaining useful life of the related product. Payments we make for research and development services prior to the services being rendered are recorded as prepaid assets in our consolidated balance sheets and are expensed as the services are provided. We also accrue the costs of ongoing clinical trials associated with programs that have been terminated or discontinued for which there is no future economic benefit at the time the decision is made to terminate or discontinue the program.
BIOGEN INC. AND SUBSIDIARIES
NOTES TO CONSOLIDATED FINANCIAL STATEMENTS — (Continued)
From time to time, we enter into development agreements in which we share expenses with a collaborative partner. We record payments received from our collaborative partners for their share of the development costs as a reduction of research and development expense, except as discussed in Note 20, 19, Collaborative and Other Relationships, to these consolidated financial statements. Because an initial indication has been approved for both RITUXAN and GAZYVA, expensesExpenses incurred by Genentech in the ongoing development of RITUXAN,
BIOGEN INC. AND SUBSIDIARIES NOTES TO CONSOLIDATED FINANCIAL STATEMENTS — (Continued) GAZYVA, LUNSUMIO and GAZYVAother products for which an initial indication has been approved are not recorded as research and development expense, but rather reduce our share of profits recorded as a component of revenuesrevenue from anti-CD20 therapeutic programs. For collaborations with commercialized products, if we are the principal, we record revenues and the corresponding operating costs in their respective line items in our consolidated statements of income. If we are not the principal, we record operating costs as a reduction of revenue.
Selling, General and Administrative ExpensesExpense Selling, general and administrative expenses areexpense is primarily comprised of compensation and benefits associated with sales and marketing, finance, human resources, legal, information technology and other administrative personnel, outside marketing, advertising and legal expensesexpense and other general and administrative costs. Advertising costs are expensed as incurred. For the years ended December 31, 2017, 20162023, 2022 and 2015,2021, advertising costs totaled $75.2totaled $71.4 million $106.3, $54.1 million and $108.6$98.7 million, respectively. Income Taxes The provision for income taxes includes federal, state, local and foreign taxes. Income taxes are accounted for under the asset and liability method. Deferred tax assets and liabilities are recognized for the estimated future tax consequences of temporary differences between the financial statement carrying amounts and their respective tax bases. Deferred tax assets and liabilities are measured using enacted tax rates expected to apply to taxable income in the year in which the temporary differences are expected to be recovered or settled. We evaluate the realizability of our deferred tax assets and establish a valuation allowance when it is more likely than not that all or a portion of deferred tax assets will not be realized. All tax effects We recognize deferred taxes associated with intercompanyour GILTI tax calculations.
The income tax consequences from the intra-entity transfers of assetsinventory within our consolidated group, both current and deferred, are recorded as a prepaid tax or deferred charge and recognized through our consolidated statements of income when the asset transferredinventory is sold to a third party or otherwise recovered through amortizationthird-party. The income tax consequences from the intra-entity transfer of assets other than inventory and associated changes to deferred taxes are recognized when the asset's remaining economic life. If the asset transferred becomes impaired, for example through the obsolescence of inventory or discontinuation of a research program, we will expense any remaining deferred charge or prepaid tax.transfer occurs. We account for uncertain tax positions using a “more-likely-than-not”“more likely than not” threshold for recognizing and resolving uncertain tax positions. We evaluate uncertain tax positions on a quarterly basis and consider various factors including, but not limited to, changes in tax law, the measurement of tax positions taken or expected to be taken in tax returns, the effective settlement of matters subject to audit, information obtained during in process audit activities and changes in facts or circumstances related to a tax position. We also accrue for potential interest and penalties related to unrecognized tax benefits in income tax expense.(benefit) expense in our consolidated statements of income. Contingencies We are currently involved in various claims and legal proceedings. Loss contingency provisions are recorded if the potential loss from any claim, asserted or unasserted, or legal proceeding is considered probable and the amount can be reasonably estimated or a range of loss can be determined. These accruals represent management’s best estimate of probable loss. Disclosure also is provided when it is reasonably possible that a loss will be incurred or when it is reasonably possible that the amount of a loss will exceed the recorded provision. On a quarterly basis, we review the status of each significant matter and assess its potential financial exposure. Significant judgment is required in both the determination of probability and the determination as to whether an exposure is reasonably estimable. Because of uncertainties related to these matters, accruals are based only on the best information available at the time. As additional information becomes available, we reassess the potential liability related to pending claims and litigation and may change our estimates. These changes in the estimates of the potential liabilities could have a material impact on our consolidated results of operations and financial position.Legal costs associated with legal proceedings are expensed when incurred. Earnings per Share Basic earnings per share is computed by dividing undistributed net income attributable to Biogen Inc. by the weighted-average number of common shares outstanding during the period.
Diluted earnings per share is computed based on the treasury method by dividing net income by the weighted-average number of common shares outstanding during the period plus potentially dilutive common equivalent shares outstanding.
BIOGEN INC. AND SUBSIDIARIES NOTES TO CONSOLIDATED FINANCIAL STATEMENTS — (Continued)
Business Combinations
Business combinations are recorded using the acquisition method of accounting. The results of operations of the acquired company are included in our results of operations beginning on the acquisition date, and assets acquired and liabilities assumed are recognized on the acquisition date at their respective fair values. Any excess of consideration transferred over the net carrying value of the assets acquired and liabilities assumed as of the acquisition date is recognized as goodwill. We use the multi-period excess earnings method, which is a form of the income approach, utilizing post-tax cash flow and discount rates in estimating the fair value of identifiable intangible assets acquired when allocating the purchase consideration paid for the acquisition. The estimates of the fair value of identifiable intangible assets involve significant judgment by management and include assumptions with measurement uncertainty, such as the amount and timing of projected cash flow, long-term sales forecasts, discount rates and additionally for IPR&D intangible assets, the timing and probability of regulatory and commercial success. We use the net realizable value method in estimating the fair value of acquired finished goods and work-in-process inventory. Raw materials acquired are valued using the replacement cost method. Transaction and restructuring costs related to business combinations are expensed as incurred. The fair value of assets acquired and liabilities assumed in certain cases may be subject to revision based on the final determination of fair value during a period of time not to exceed 12 months from the acquisition date. If we determine the assets acquired do not meet the definition of a business, the transaction will be accounted for as an asset acquisition rather than a business combination. New Accounting Pronouncements From time to time, new accounting pronouncements are issued by the Financial Accounting Standards Board (FASB)FASB or other standard setting bodies that we adopt as of the specified effective date. Unless otherwise discussed below, we do not believe that the adoption of recently issued standards have or may have a material impact on our consolidated financial statements or disclosures. Segment Reporting In May 2014November 2023 the FASB issued Accounting Standards Update (ASU)ASU No. 2014-09, Revenue from Contracts with Customers2023-07, Segment Reporting (Topic 606), which supersedes all existing revenue recognition requirements, including most industry-specific guidance.280): Improvements to Reportable Segment Disclosure. This new standard requires a companydisclosure of significant segment expenses that are regularly provided to recognize revenue when it transfers goodsthe CODM and included within each reported measure of segment profit or services to customers inloss, an amount that reflectsand description of its composition for other segment items to reconcile to segment profit or loss and the consideration thattitle and position of the company expects to receiveentity's CODM. The amendments in this update also expand the interim segment disclosure requirements. All disclosure requirements under this standard are also required for those goods or services. The FASB subsequently issued amendments to ASU No. 2014-09 that have the same effective date and transition date. These new standards becamepublic entities with a single reportable segment. This standard is effective for usfiscal years beginning after December 15, 2023, and interim periods within fiscal years beginning after December 15, 2024. Early adoption is permitted and the amendments in this update are required to be applied on January 1, 2018, and will be adopted usinga retrospective basis. We are currently evaluating the modified retrospective method through a cumulative-effect adjustment directly to retained earnings as of that date. We have performed a review of these new standards as compared to our current accounting policies for customer contracts and collaborative relationships. During the fourth quarter of 2017 we finalized our assessments over thepotential impact that thesethis new standardsstandard will have on our consolidated results of operations, financial positionstatements and disclosures. As of December 31, 2017, we have not identified any accounting changes that would materially impact the amount of reported revenues with respect to our product revenues, revenues from anti-CD20 therapeutic programs or other revenues; however, the adoption of these new standards may result in a change in the timing of revenue recognition related to certain of our contract manufacturing activities. As of December 31, 2017, we expect to recognize an immaterial adjustment to retained earnings reflecting the cumulative impact for the accounting changes related to certain contract manufacturing arrangements made upon adoption of these new standards.disclosures. Fair Value Measurements In January 2016June 2022 the FASB issued ASU No. 2016-01, Financial Instruments - Overall (Subtopic 825-10)2022-03, Fair Value Measurement (Topic 820): Recognition andFair Value Measurement of Financial Assets and Financial LiabilitiesEquity Securities Subject to Contractual Sale Restrictions. This new standard amends certain aspectsclarifies that a contractual restriction on the sale of accounting and disclosure requirements for financial instruments, includingan equity security is not considered part of the requirement that equity investments with readily determinable fair values are to be measured at fair value with any changes in fair value recognized in a company's resultsunit of operations. This new standard does not apply to investments accounted for underaccount of the equity method of accounting or those investments that resultsecurity and, therefore, is not considered in consolidation of the investee. Equity investments that do not have readily determinablemeasuring fair values may be measured at fair value or at cost minus impairment adjusted for changes in observable prices. A financial liability that is measured at fair value in accordance with the fair value option is required to be presented separately in other comprehensive income for the portion of the total change in the fair value resulting from change in the instrument-specific credit risk. In addition, a valuation allowance should be evaluated on deferred tax assets related to available-for-sale debt securities in combination with other deferred tax assets.value. This new standard became effective for us on January 1, 2018. Based2024. We elected to early adopt this standard on our current investment holdings,a prospective basis during the third quarter of 2022. Upon adoption, of this new standard is not expected to have a material impact onwe recorded an immaterial amount in other (income) expense, net in our consolidated financial position or resultsstatements of operations; however, it will result in the reclassification of where we recognize changes in fair value related to certain investments prospectively. In February 2016 the FASB issued ASU No. 2016-02, Leases (Topic 842). This new standard establishes a right-of-use (ROU) model that requires all lessees recognize right-of-use assets and liabilities on their balance sheet that arise from leases with terms longer than 12 months as well as provide disclosures with respect to certain qualitative and quantitative information related to their leasing arrangements. This new standard will become effective for us on January 1, 2019. A modified retrospective transition approach is required for leases existing at, or entered into after, the beginning of the earliest comparative period presented in the financial statements, with certain practical expedients available. While we are currently evaluating the impact that this new standard may have on our consolidated results of operations, financial position and disclosures, we expect that the adoption of this new standard may materially affect the reported amount of total assets and total liabilities within our consolidated balance sheet with no material impact to our consolidated statement of income. We are unable to quantify the impact at this time as the ultimate impact of adopting this new standard will depend on the total amount of our lease commitments as of the adoption date.
In March 2016 the FASB issued ASU No. 2016-09, Compensation - Stock Compensation (Topic 718): Improvements to Employee Share-Based Payment Accounting. This new standard requires recognition of the income tax effects of vested or settled awards in the income statement and involves several other aspects of the accounting for share-based payment transactions, including the income tax consequences and classification of awards as either equity or liabilities in the statement of cash flows. This new standard became effective for us on January 1, 2017. The adoption of this new standard did not have a material impact on our consolidated financial position, results of
BIOGEN INC. AND SUBSIDIARIES NOTES TO CONSOLIDATED FINANCIAL STATEMENTS — (Continued) operations or statementReata Pharmaceuticals, Inc.
On September 26, 2023, we completed the acquisition of cash flows; however, it has resultedall of the issued and outstanding shares of Reata, a biopharmaceutical company focused on developing therapeutics that regulate cellular metabolism and inflammation in serious neurologic diseases. As a result of this transaction we acquired SKYCLARYS (omaveloxolone), the first and only drug approved in the reclassificationU.S. and the E.U. for the treatment of certain prior year amountsFriedreich's Ataxia in adults and adolescents aged 16 years and older, as well as other clinical and preclinical pipeline programs. The acquisition of Reata is expected to complement our global portfolio of neuromuscular and rare disease therapies. The addition of SKYCLARYS is anticipated to provide potential operating synergies with SPINRAZA and QALSODY. Under the terms of this acquisition, we paid Reata shareholders $172.50 in cash for each issued and outstanding Reata share, which totaled approximately $6.6 billion. In addition, we agreed to pay approximately $983.9 million in cash for Reata's outstanding equity awards, inclusive of employer taxes, of which approximately $590.5 million was attributable to pre-acquisition services and is therefore reflected as a component of total purchase price paid. Of the $983.9 million paid to Reata's equity award holders, we recognized approximately $393.4 million as compensation attributable to the post-acquisition service period, of which $196.4 million was recognized as a charge to selling, general and administrative expense with the remaining $197.0 million as a charge to research and development expense within our consolidated statements of income for the year ended December 31, 2023. These amounts were associated with the accelerated vesting of stock options and RSUs previously granted to Reata employees that required no future services to vest. We funded this acquisition through available cash, flows cash equivalents and marketable securities, supplemented by the issuance of a $1.0 billion term loan under our term loan credit agreement. For additional information on our term loan credit agreement, please read Note 13, Indebtedness, to conform to our current year presentation. Specifically, amounts previously disclosed in net cash flows used in financing activities related to our excess tax benefit from share-based compensation have been reclassified to net cash flows provided by operating activities and amounts related to cash paid when withholding sharesthese consolidated financial statements. We accounted for tax withholding purposes, previously disclosed in net cash flows provided by operating activities, have been reclassified to net cash flows used in financing activities. In October 2016 the FASB issued ASU No. 2016-16, Income Taxes (Topic 740): Intra-Entity Transfer of Assets Other Than Inventory. This new standard eliminates the deferral of the tax effects of intra-entity asset transfers other than inventory. Asthis acquisition as a result, the income tax consequences from the intra-entity transfer of an asset other than inventory and associated changes to deferred taxes will be recognized when the transfer occurs. This new standard became effective for us on January 1, 2018. We will adopt this new standardbusiness combination using the modified retrospectiveacquisition method through a cumulative-effect adjustment directly to retained earningsof accounting in accordance with ASC Topic 805, Business Combinations, and recorded assets acquired and liabilities assumed at their respective fair values as of the beginningacquisition date.
Purchase Price Consideration Total consideration transferred for the acquisition of that date. BasedReata is summarized as follows: | | | | | | | | | | (In millions) | | As of September 26, 2023 | Cash consideration paid to Reata shareholders(1) | | $ | 6,602.9 | | Fair value of Reata equity compensation pre-acquisition services and related taxes(2) | | 590.5 | | | Total consideration | | $ | 7,193.4 | |
(1) Represents cash consideration transferred of $172.50 per outstanding Reata ordinary share based on currently enacted tax rates, upon adoption, we will record additional deferred tax assets of approximately $0.5 billion and an increase to retained earnings of approximately $0.5 billion. We will recognize incremental deferred income tax expense thereafter as these net deferred tax assets are utilized.38.3 million Reata shares outstanding at closing. In January 2017 the FASB issued ASU No. 2017-01, Business Combinations (Topic 805): Clarifying the Definition of a Business. This new standard clarifies the definition of a business and provides a screen to determine when an integrated set of assets and activities is not a business. The screen requires that when substantially all of(2) Represents the fair value of the gross assets acquired (or disposed of) is concentrated in a single identifiable asset or a group of similar identifiable assets, the set is not a business. We electedReata stock options and stock units issued to early adopt this new standard as of January 1, 2017, with prospective application to any business development transactions, including our recent asset acquisition of BIIB093 from Remedy Pharmaceuticals Inc. (Remedy) in May 2017. For additional information on this transaction, please read Note 2, Acquisitions, to these consolidated financial statements.
In January 2017 the FASB issued ASU No. 2017-04, Intangibles - Goodwill and Other (Topic 350): Simplifying the Test of Goodwill Impairment. This new standard eliminates Step 2 from the goodwill impairment test. Under the amendments in ASU No. 2017-04, an entity should recognize an impairment charge for the amount by which the carrying amount of a reporting unit exceeds that reporting unit’s fair value; however, the loss recognized should not exceed the total amount of goodwill allocated to that reporting unit. We elected to early adopt this new standard as of October 31, 2017, during our annual review of goodwill. The adoption of this new standard resulted in a change to our accounting policy; however, did not have an impact on our consolidated financial position or results of operations.
In March 2017 the FASB issued ASU No. 2017-08, Receivables - Nonrefundable Fees and Other Costs (Subtopic 310-20): Premium Amortization on Purchased Callable Debt Securities. This new standard amends the amortization period for certain purchased callable debt securities held at a premium by shortening the amortization period for the premium to the earliest call date. This new standard will become effective for us on January 1, 2019. We are currently evaluating the potential impact that this new standard may have on our consolidated financial position and results of operations.
In August 2017 the FASB issued ASU No. 2017-12, Derivatives and Hedging (Topic 815): Targeted Improvements to Accounting for Hedging Activities. This new standard is intended to simplify hedge accounting by better aligning how an entity’s risk management activities and hedging relationships are presented in its financial statements and simplifies the application of hedge accounting guidance in certain situations. This new standard expands and refines hedge accounting for both non-financial and financial risk components and aligns the recognition and presentation of the effects of the hedging instrumentReata equity award holders and the hedged item in the financial statements. This new standard will become effective for us on January 1, 2019; however, early adoption is permitted. For cash flow hedges existing at the adoption date, this new standard requires adoption on a modified retrospective basis with a cumulative-effect adjustmentrelated taxes attributable to retained earnings as of the effective date. The amendments to presentation guidance and disclosure requirements are required to be adopted prospectively. We are currently evaluating the date upon which we will adopt this new standard and the impact this new standard may have on our consolidated financial statements.
pre-acquisition vesting services.
BIOGEN INC. AND SUBSIDIARIES NOTES TO CONSOLIDATED FINANCIAL STATEMENTS — (Continued)
Preliminary Purchase Price Allocation
2. Acquisitions
Remedy Pharmaceuticals Inc.
In May 2017 we completed an asset purchaseThe following table summarizes the provisional amounts recognized for assets acquired and liabilities assumed as of the Phase 3-ready candidate, BIIB093 (intravenous glibencamide) (formerly knownacquisition date, as CIRARA), from Remedy. The target indication for BIIB093 is large hemispheric infarction (LHI), a severe form of ischemic stroke where brain swelling (cerebral edema) often leadswell as measurement period adjustments made year-to-date to a disproportionately large share of stroke-related morbidity and mortality. The U.S. Food and Drug Administration (FDA) recently granted BIIB093 Orphan Drug designation for severe cerebral edema in patients with acute ischemic stroke. The FDA has also granted BIIB093 Fast Track designation.
Under this agreement, we are responsible for the future development and commercialization of BIIB093 and Remedy will share in the cost of development for the target indication for BIIB093 in LHI stroke.
We accounted for this transaction as an asset acquisition as we did not acquire any employees from Remedy nor did we acquire any significant processes required in the development of BIIB093. In connection with the closing of this transaction, we made an upfront payment of $120.0 million to Remedy, which wasamounts initially recorded as of the acquisition date on September 26, 2023. The measurement period adjustments summarized below resulted from updates to our valuation assumptions related to the estimated amounts and timing of future cash flows associated with certain intangible assets, updates of our assumptions related to the quantities, selling location and remaining manufacturing and selling costs of acquired in-process researchinventory, and development inother assets and liabilities. The related impact to our consolidated statements of income as BIIB093 has not yet reached technological feasibility. We alsothat would have agreed to pay Remedy certain development and sales based milestone payments that are substantially payable upon or after regulatory approval,been recognized in previous periods if the adjustments were recognized as well as royalties on future commercial sales.
Convergence Pharmaceuticals
In February 2015, we completed our acquisition of all of the outstanding stock of Convergence Pharmaceuticals (Convergence)acquisition date is immaterial.
| | | | | | | | | | | | | | | | | | | | | | (In millions) | | Amounts Recognized as of Acquisition Date (as previously reported) | | Measurement Period Adjustments | | Amounts Recognized as of Acquisition Date
(as adjusted) | | Cash and cash equivalents | | $ | 267.3 | | | $ | — | | | $ | 267.3 | | | Accounts receivable | | 15.9 | | | — | | | 15.9 | | | Inventory | | 1,692.0 | | | (433.0) | | | 1,259.0 | | | Other current assets | | 53.6 | | | — | | | 53.6 | | | Intangible assets: | | | | | | | | Completed technology for SKYCLARYS (U.S.) | | 3,600.0 | | | 600.0 | | | 4,200.0 | | | In-process research and development (omaveloxolone) | | 1,900.0 | | | 400.0 | | | 2,300.0 | | | Priority review voucher | | 100.0 | | | — | | | 100.0 | | | Other clinical programs | | 20.0 | | | 20.0 | | | 40.0 | | | Operating lease assets | | 122.4 | | | (1.2) | | | 121.2 | | | Accrued expense and other | | (98.9) | | | (2.6) | | | (101.5) | | | Debt payable | | (159.9) | | | — | | | (159.9) | | Contingent payable to Blackstone(1) | | (300.0) | | | — | | | (300.0) | | | Deferred tax liability | | (922.5) | | | 10.1 | | | (912.4) | | | Operating lease liabilities | | (151.8) | | | — | | | (151.8) | | | Other assets and liabilities, net | | (2.0) | | | (0.5) | | | (2.5) | | | Total identifiable net assets | | 6,136.1 | | | 592.8 | | | 6,728.9 | | | Goodwill | | 1,057.3 | | | (592.8) | | | 464.5 | | | Total assets acquired and liabilities assumed | | $ | 7,193.4 | | | $ | — | | | $ | 7,193.4 | |
(1) For additional information on the contingent payable to Blackstone, please read Note 18, Other Consolidated Financial Statement Detail, to these consolidated financial statements. Inventory: Total inventory acquired wasapproximately $1.3 billion, which reflects a clinical-stage biopharmaceutical company with a focus on developing product candidates for neuropathic pain. Convergence’s lead candidate was a Phase 2 clinical candidate BIIB074 (formerly known as CNV1014802), which had demonstrated clinical activitystep-up in proof-of-concept studies for TGN. Additionally, BIIB074 had potential applicability in several other neuropathic pain states, including lumbosacral radiculopathy and erythromelalgia. The purchase price consisted of a $200.1 million cash payment at closing, plus contingent consideration in the form of development and approval milestones up to a maximum of $450.0 million, of which $350.0 million is associated with the development and approval of BIIB074 for the treatment of TGN. In connection with the closing of this transaction, we recorded a liability of $274.5 million representing the fair value of finished goods and work-in-process inventory for SKYCLARYS. The fair value was determined based on the contingent consideration resulting in an adjusted purchaseestimated selling price of $474.6the inventory, less the remaining manufacturing and selling costs and a normal profit margin on those manufacturing and selling efforts. This fair value step-up adjustment will be amortized to cost of sales within our consolidated statements of income when the inventory is sold, which is expected to be within approximately 3 years from the acquisition date. For the year ended December 31, 2023, amortization from the fair value step-up adjustment as a result of inventory sold during the fourth quarter was approximately $31.5 million. The separately identifiable
Intangible assets: Intangible assets and liabilities acquired were primarilyare comprised of $424.6$4.2 billion related to SKYCLARYS commercialization rights in the U.S., $2.3 billion of IPR&D related to the omaveloxolone program outside the U.S., which had not yet received regulatory approval in the E.U. as of the acquisition date, $100.0 million and $128.3 million attributedrelated to in-process research and development and goodwill, respectively. These amounts were partially offseta rare pediatric disease priority voucher which may be used to obtain priority review by the establishmentFDA for a future regulatory submission or sold to a third party and $40.0 million related to other clinical programs. The estimated fair values of a deferred tax liability for the acquired IPR&Dprogram related intangible assets which had no tax basis. We attributedwere determined using a multi-period excess earnings method, a form of the goodwill recognized to the Convergence workforce's expertise in chronic pain research and clinical development and to establishingincome approach, utilizing a deferred tax liability for the acquired IPR&D intangible assets. The goodwill was not tax deductible.
3. Hemophilia Spin-Off
On February 1, 2017, we completed the spin-offdiscount rate of our hemophilia business, Bioverativ, as an independent, publicly traded company trading under the symbol "BIVV" on the Nasdaq Global Select Market. The spin-off was accomplished through the distribution of all the then outstanding shares of common stock of Bioverativ to Biogen shareholders, who received one share of Bioverativ common stock for every two shares of Biogen common stock they owned. The separation and distribution was structured to be tax-free for shareholders for federal income tax purposes. Bioverativ assumed all of our rights and obligations under our collaboration agreement with Swedish Orphan Biovitrum AB (Sobi) and our collaboration and license agreement with Sangamo Biosciences Inc. (Sangamo).
In connection with the distribution, Biogen and Bioverativ entered into a separation agreement and various other agreements (including a transition services agreement, a tax matters agreement, a manufacturing and supply agreement, an employee matters agreement, an intellectual property matters agreement and certain other commercial agreements). These agreements govern the separation and distribution14.3% and the relationship between the two companies going forward. They also provide for the performance of services by each company for the benefitestimated fair value of the other for a periodpriority review voucher was based on recent external purchase and sale transactions of time. In addition, under the separation agreement, Bioverativ is obligated to indemnify us for
similar vouchers.
BIOGEN INC. AND SUBSIDIARIES NOTES TO CONSOLIDATED FINANCIAL STATEMENTS — (Continued)
liabilities that may exist relating to its business activities, whether incurred prior to or after the distribution, including any pending or future litigation.
The services under these agreements generally commenced on February 1, 2017 (the distribution date), and terminate within 12 monthsOur valuation of the distribution date, withSKYCLARYS commercialization rights reflects the exceptionassumption that, using an economic consumption model, the related $4.2 billion intangible asset will be amortized over its expected economic life. Our valuation of the manufacturing$2.3 billion IPR&D asset relates to omaveloxolone, which was submitted to the EMA in 2023 and supply agreement,subsequently approved in the E.U. in February 2024. We expect sales to commence in certain countries in Europe during 2024, at which hastime we will begin amortizing the intangible asset over its expected economic life.
These fair value measurements were based on significant inputs not observable in the market and thus represent Level 3 fair value measurements. Leases: We assumed responsibility for a single-tenant, build-to-suit building of approximately 327,400 square feet of office and laboratory space located in Plano, Texas, with an initial lease term of 516 years. We recorded a lease liability of approximately $151.8 million, which represents the net present value of rental expense over the remaining lease term of approximately 15 years, with a 5 year extension at Bioverativ's sole discretioncorresponding right-of-use asset of approximately $121.2 million, which represents our estimate of the fair value for a market participant of the current rental market in the Dallas, Texas area. Included in our estimate of the market rental rate is the value of any leasehold improvements or tenant allowances related to the building. We do not intend to occupy this building and a further 5 year extension with Bioverativ'sare evaluating opportunities to sublease the property. Goodwill: Goodwill was calculated as the excess of the consideration transferred over the net assets recognized and represents the future economic benefits arising from the other assets acquired that could not be individually identified and separately recognized. We recognized goodwill of approximately $464.5 million, which is not deductible for tax purposes. The goodwill recognized from our consent. In connection withacquisition of Reata is primarily the distribution we made a net cash contribution to Bioverativ, during the first quarter of 2017, totaling $302.7 million. The following table summarizes the assets and liabilities that were charged against equity as a result of the spin-off of our hemophilia business:deferred tax consequences from the transaction recorded for financial statement purposes.
| | | | | | (In millions) | | | Assets | | | Cash | $ | 302.7 |
| | Accounts receivable | 144.7 |
| | Inventory | 116.1 |
| | Property, plant and equipment, net | 20.2 |
| | Intangible assets, net | 56.8 |
| | Goodwill | 314.1 |
| | Other, net | 53.7 |
| | Assets transferred, net | $ | 1,008.3 |
| | | | | Liabilities | | | Accrued expenses and other current liabilities | $ | 87.8 |
| | Other long-term liabilities | 67.7 |
| | Liabilities transferred, net | $ | 155.5 |
|
Pursuant to the terms of our agreements with Bioverativ, upon completion of the spin-off, we distributed ALPROLIX and ELOCTATE on behalf of Bioverativ until Bioverativ obtained appropriate regulatory authorizations in certain countries, including a Biologics License Application transfer in the U.S., which was received in September 2017. Accordingly, commencing October 2017, we ceased distribution of ALPROLIX and ELOCTATE on behalf of Bioverativ under this arrangement.
Under the manufacturing and supply agreement, we manufacture and supply certain products and materials to Bioverativ. For the year ended December 31, 2017, we recognized $64.8 million in revenues in relation to these contract manufacturing services, which is reflected as a component of other royalty and corporate revenues in our consolidated statements of income. We also recorded $15.1 million as cost of sales in relation to these services during the year ended December 31, 2017.
Amounts earned under the non-manufacturing and supply related transaction service agreements are recorded as a reduction of costs andAcquisition-related expenses: Acquisition-related expenses, in their respective expense line items. These amounts, which were comprised primarily reflected as a reduction toof regulatory, advisory and legal fees, and other transaction costs, totaled approximately $28.4 million and are included within selling, general and administrative expenses in our consolidated statements of income, were not significant for the year ended December 31, 2017.
Hemophilia related product revenues reflected inexpense within our consolidated statements of income for the years ended December 31, 2017, 2016 and 2015 totaled $74.4 million, $846.9 million and $554.2 million, respectively. Results for the year ended December 31, 2017 only reflect hemophilia-related product revenues through January 31, 2017.2023.
PatentsAssumptions in the Allocations of Purchase Price
The results of operations of Reata, along with the estimated fair values of the assets acquired and liabilities assumed in the Reata acquisition, have been included in our consolidated financial statements since the closing of the Reata acquisition on September 26, 2023. Our preliminary estimate of the fair value of the specifically identifiable assets acquired and liabilities assumed as of the date of acquisition is subject to the finalization of management's analysis related to certain matters, such as finalizing our assessment of income taxes. The final determination of these fair values will be completed as additional information becomes available but no later than one year from the acquisition date. The final determination may result in asset and liability fair values that are different than the preliminary estimates. Subsequent to the acquisition date, our results of operations include the results of operations of Reata. Due to the immateriality of Reata's revenue and expense, additional pro forma information combining the results of operations of Biogen and Reata have not been included. Sale of Joint Venture Equity Interest in Samsung Bioepis In April 2022 we completed the sale of our 49.9% equity interest in Samsung Bioepis to Samsung BioLogics in exchange for total consideration of approximately $2.3 billion. Under the terms of this transaction, we received approximately $1.0 billion in cash at closing, with approximately $1.3 billion in cash to be deferred over two payments. The first deferred payment of $812.5 million was received in April 2023 and the second deferred payment of $437.5 million is due at the second anniversary of the closing of this transaction in April 2024. Prior to the spin-offsale, the carrying value of our hemophilia business,investment in Samsung Bioepis totaled $581.6 million. For the year ended December 31, 2022, we were awarded various methodsrecognized a pre-tax gain of treatment and composition of matter patentsapproximately $1.5 billion related to ELOCTATE and ALPROLIX. Upon completionthis transaction, which was recorded in other (income) expense, net in our consolidated statements of income. This pre-tax gain included reclassifications from AOCI to net income of approximately $58.9 million in cumulative translation losses, partially offset by approximately $57.0 million in gains resulting from the spin-off, these patents were transferred to the patent portfoliotermination of Bioverativ.
our net investment hedge.
BIOGEN INC. AND SUBSIDIARIES NOTES TO CONSOLIDATED FINANCIAL STATEMENTS — (Continued)
4. Restructuring, Business Transformation and Other Cost Saving Initiatives
2017 Corporate Strategy
In July 2017 we announced an updatedWe concluded that the divestment of Samsung Bioepis did not meet the criteria to be reported as discontinued operations in our consolidated financial statements, as our decision to divest this business did not represent a strategic framework to optimize the value of our MS business while investing for the future across our core growth areas of MS and neuroimmunology, AD and dementia, movement disorders and neuromuscular diseases including SMA and ALS. We also plan to invest in emerging growth areas such as pain, ophthalmology, neuropsychiatry and acute neurology. In addition, we are employing innovative technologies to discover potential treatments for rare and genetic disorders, including new ways of treating diseases through gene therapy in the previously mentioned areas.
In order to deliver positive results in the near term while investing in the next stages of our growth, we will focusshift that would have a major effect on the following strategic priorities:
maximizing the resilience of our MS core business;
accelerating efforts in SMA as a significant new growth opportunity;
developing and expanding our neuroscience portfolio;
focusing our capital allocation efforts to drive investment for future growth; and
creating a leaner and simpler operating model to streamline our operations and reallocate resources towards prioritized researchfinancial results.
We elected the fair value option and developmentmeasured the payments due to us from Samsung BioLogics at fair value. As of December 31, 2023, the estimated fair value of the remaining second deferred payment using a risk-adjusted discount rate of 5.8% was approximately $430.0 million. This payment has been classified as a Level 3 measurement and commercial value creation opportunities.is reflected in other current assets within our consolidated balance sheets as of December 31, 2023. In October 2017, in connection with creating a leaner and simpler operating model, we approved a corporate restructuring program intended to streamline our operations and reallocate resources. We expect to make total non-recurring operating and capital expenditures of up to $170.0 million, primarily in 2018, and our goal is to redirect resources of up to $400.0 million annually by 2020 to prioritized research and development and other value creation opportunities.
For the year ended December 31, 2017,2023, we recognized chargesa gain of approximately $13.7 million to reflect the change in our consolidated statements of income totaling $19.4 millionfair value related to this effort,the first deferred payment due to us, which was received in April 2023. Additionally, for the year ended December 31, 2023, we recognized a gain of which $18.5approximately $24.6 million is included to reflect the change in selling, general and administrative expense and $0.9 million is reflected as restructuring charges. These restructuring charges, which were substantially incurred and paid in 2017, were primarilyfair value related to severance. 2016 Organizational Changes and Cost Saving Initiatives
2016 Restructuring Charges
During the third quarter of 2016 we initiated cost saving measures primarily intended to realign our organizational structuresecond deferred payment due to the changes in roles and workforce resulting from our decision to spin-off our hemophilia business, and to achieve further targeted cost reductions.us. For the year ended December 31, 2016,2022, we recognized charges totaling $17.7a gain of approximately $10.7 million and a loss of approximately $1.4 million to reflect the changes in fair value related to the first and second deferred payments due to us, respectively. These changes were recorded in other (income) expense, net within our consolidated statements of income.
As part of this transaction, we are also eligible to receive up to an additional $50.0 million upon the achievement of certain commercial milestones. Our policy for contingent payments of this nature is to recognize the payments in the period the payments become realizable, which is generally the same period in which the payments are earned. If any payments due to us remain outstanding after the second anniversary of the closing of this transaction, we may elect to receive shares of Samsung BioLogics common stock at a 5.0% discount in lieu of a cash payment for the remaining amount due. Currently, we believe that the likelihood of Samsung BioLogics failing to make the second deferred payment due to us is remote. Additionally, for the year ended December 31, 2022, we recorded a discrete tax expense of approximately $257.9 million related to this effort,transaction, which are in addition to, and separate from, the 2015 restructuring charges described below. These amounts, which were substantially incurred and paid by the end of 2016, were primarily related to severance and areis reflected in restructuring chargesincome tax (benefit) expense in our consolidated statements of income. Cambridge, MA Manufacturing FacilityIn June 2016 following an evaluation of our current and future manufacturing capabilities and capacity needs, we determined that we intended to cease manufacturing and vacate our 67,000 square foot small-scale biologics manufacturing facility in Cambridge, MA and close and vacate our 46,000 square foot warehouse space in Somerville, MA.
In December 2016 we subleased our rights to the Cambridge, MA manufacturing facility to Brammer Bio MA, LLC (Brammer). Brammer also purchased from us certain manufacturing equipment, leasehold improvements and other assets in exchange for shares of Brammer common LLC interests and assumed manufacturing operations effective January 1, 2017. In December 2016 we closed and vacated our warehouse space in Somerville, MA.
Our departure from these facilities shortened the expected useful lives of certain leasehold improvements and other assets at these facilities. As a result, we recorded additional depreciation expense to reflect the assets' new
BIOGEN INC. AND SUBSIDIARIES NOTES TO CONSOLIDATED FINANCIAL STATEMENTS — (Continued) shorter useful lives.2023 Fit for Growth Restructuring Program
In 2023 we initiated additional cost saving measures as part of our Fit for Growth program to reduce operating costs, while improving operating efficiency and effectiveness. The Fit for Growth program is expected to generate approximately $1.0 billion in gross operating expense savings by 2025, some of which will be reinvested in various initiatives. The Fit for Growth program is currently estimated to include net headcount reductions of approximately 1,000 employees and we expect to incur restructuring charges ranging from approximately $260.0 million to $280.0 million. Total charges incurred from our 2023 cost saving initiatives are summarized as follows: | | | | | | | | | | | | | | | | | | | | | | | For the Year Ended December 31, | | | 2023 | | (In millions) | | Severance
Costs | | Accelerated Depreciation and Other Costs | | Total | | Selling, general and administrative | | $ | — | | | $ | 23.3 | | | $ | 23.3 | | | Research and development | | — | | | 1.2 | | | 1.2 | | | Restructuring charges | | 153.4 | | | 34.6 | | | 188.0 | | | Total charges | | $ | 153.4 | | | $ | 59.1 | | | $ | 212.5 | | | | | | | | | | | | | | | | | | | | | | | | | | | | | | | | | | | | | | | | | | | | | | | | | |
Other Costs: includes costs associated with items such as asset abandonment and write-offs, facility closure costs, pretax gains and losses resulting from the termination of certain leases, employee non-severance expense, consulting fees and other costs. Reata Integration Following the close of our Reata acquisition, we implemented an integration plan designed to realize operating synergies through cost savings and avoidance. These amounts are primarily related to severance and are expected to be paid by the end of 2024. For the year ended December 31, 2016,2023, we recognized approximately $45.5$30.4 million of this additional depreciation, which was recorded as cost of sales in our consolidated statements of income. In the fourth quarter of 2016 we also recognized charges totaling $7.4 million for severance costs related to certain employees separated from Biogen in connection with our departure from these facilities. These amounts were substantially incurred and paid by the end of first quarter of 2017 and are reflected in restructuring charges in our consolidated statements of income for the year ended December 31, 2016.
2015 Cost Saving Initiatives
2015 Restructuring Charges
In October 2015, we announced a corporate restructuring, which included the termination of certain pipeline programs and an 11% reduction in workforce. Under this restructuring, cash payments were estimated to total approximately $120.0 million, of which $15.9 million were related to previously accrued 2015 incentive compensation, resulting in net restructuring charges totaling approximately $102.0 million. These amounts were substantially paid by the end of 2016.
During the years ended December 31, 2016 and 2015, we recognized $8.0 million and $93.4 million, respectively, ofpre-tax restructuring charges related to employee severance costs.
2022 Cost Saving Initiatives In December 2021 and May 2022 we announced our 2015 restructuring program inplans to implement a series of cost-reduction measures during 2022. These savings are being achieved through a number of initiatives, including reductions to our workforce, the substantial elimination of our commercial ADUHELM infrastructure, deprioritization of certain research and development programs, the consolidation of certain real estate locations and operating efficiencies across our selling, general and administrative and research and development functions. Charges related to our 2022 cost saving initiatives were substantially incurred during 2022 with remaining payments expected to be made through 2026. Total charges incurred from our 2022 cost saving initiatives are summarized as follows: | | | | | | | | | | | | | | | | | | | | | | | | | | | | | | | | | | | | | | | | | For the Years Ended December 31, | | | 2023 | | 2022 | | (In millions) | | Severance
Costs | | Accelerated Depreciation and Other Costs | | Total | | Severance Costs | | Accumulated Depreciation and Other Costs(1) | | Total | | Restructuring charges | | $ | (2.2) | | | $ | 2.6 | | | $ | 0.4 | | | $ | 112.6 | | | $ | 18.5 | | | $ | 131.1 | | | Total charges | | $ | (2.2) | | | $ | 2.6 | | | $ | 0.4 | | | $ | 112.6 | | | $ | 18.5 | | | $ | 131.1 | |
(1) Amounts reflect a gain recorded during the third quarter of 2022 of approximately $5.3 million related to the partial termination of a portion of our lease located at 300 Binney Street. For additional information on our 300 Binney Street lease modification, please read Note 12, Leases, to these consolidated statementsfinancial statements.
The following table summarizes the chargesBIOGEN INC. AND SUBSIDIARIES
NOTES TO CONSOLIDATED FINANCIAL STATEMENTS — (Continued) Charges and spending related to our 2015 restructuring program2023 and 2022 workforce reductions and Reata integration are summarized as follows: | | | | | | | | | | | | | | (In millions) | | Total | | | | | | Restructuring reserve, December 31, 2021 | | $ | — | | | | | | | Expense | | 112.6 | | | | | | | Payment | | (78.0) | | | | | | | Foreign currency and other adjustments | | 1.3 | | | | | | | Restructuring reserve, December 31, 2022 | | 35.9 | | | | | | | Expense | | 181.6 | | | | | | | Payment | | (140.5) | | | | | | | Foreign currency and other adjustments | | (1.6) | | | | | | | Restructuring reserve, December 31, 2023 | | $ | 75.4 | | | | | |
BIOGEN INC. AND SUBSIDIARIES NOTES TO CONSOLIDATED FINANCIAL STATEMENTS — (Continued) Product Revenue Revenue by product are summarized as follows: | | | | | | | | | | | | | | | | | | | | | | | | | | | | | | | | | | | | | | | | | | | | | | | | | | | | | | | | | | | | For the Years Ended December 31, | | | | 2023 | | 2022 | | 2021 | | (In millions) | | United
States | | Rest of
World | | Total | | United
States | | Rest of
World | | Total | | United
States | | Rest of
World | | Total | | Multiple Sclerosis: | | | | | | | | | | | | | | | | | | | | TECFIDERA | | $ | 263.1 | | | $ | 749.4 | | | $ | 1,012.5 | | | $ | 417.7 | | | $ | 1,026.2 | | | $ | 1,443.9 | | | $ | 680.6 | | | $ | 1,271.3 | | | $ | 1,951.9 | | | VUMERITY | | 512.1 | | | 64.2 | | | 576.3 | | | 521.3 | | | 32.1 | | | 553.4 | | | 408.9 | | | 1.5 | | | 410.4 | | | Total Fumarate | | 775.2 | | | 813.6 | | | 1,588.8 | | | 939.0 | | | 1,058.3 | | | 1,997.3 | | | 1,089.5 | | | 1,272.8 | | | 2,362.3 | | | AVONEX | | 536.7 | | | 274.3 | | | 811.0 | | | 649.2 | | | 324.3 | | | 973.5 | | | 830.2 | | | 378.5 | | | 1,208.7 | | | PLEGRIDY | | 126.2 | | | 168.5 | | | 294.7 | | | 148.4 | | | 183.5 | | | 331.9 | | | 152.9 | | | 204.5 | | | 357.4 | | | Total Interferon | | 662.9 | | | 442.8 | | | 1,105.7 | | | 797.6 | | | 507.8 | | | 1,305.4 | | | 983.1 | | | 583.0 | | | 1,566.1 | | | TYSABRI | | 997.9 | | | 879.0 | | | 1,876.9 | | | 1,123.4 | | | 907.5 | | | 2,030.9 | | | 1,142.2 | | | 920.9 | | | 2,063.1 | | | FAMPYRA | | — | | | 90.5 | | | 90.5 | | | — | | | 96.6 | | | 96.6 | | | — | | | 105.2 | | | 105.2 | | | Subtotal: Multiple Sclerosis | | 2,436.0 | | | 2,225.9 | | | 4,661.9 | | | 2,860.0 | | | 2,570.2 | | | 5,430.2 | | | 3,214.8 | | | 2,881.9 | | | 6,096.7 | | | | | | | | | | | | | | | | | | | | | | Rare Disease: | | | | | | | | | | | | | | | | | | | | SPINRAZA | | 610.5 | | | 1,130.7 | | | 1,741.2 | | | 600.2 | | | 1,193.3 | | | 1,793.5 | | | 587.9 | | | 1,317.2 | | | 1,905.1 | | QALSODY(1) | | 5.8 | | | 0.1 | | | 5.9 | | | — | | | — | | | — | | | — | | | — | | | — | | SKYCLARYS(2) | | 55.9 | | | — | | | 55.9 | | | — | | | — | | | — | | | — | | | — | | | — | | | Subtotal: Rare Disease | | 672.2 | | | 1,130.8 | | | 1,803.0 | | | 600.2 | | | 1,193.3 | | | 1,793.5 | | | 587.9 | | | 1,317.2 | | | 1,905.1 | | | | | | | | | | | | | | | | | | | | | | Biosimilars: | | | | | | | | | | | | | | | | | | | | BENEPALI | | — | | | 438.8 | | | 438.8 | | | — | | | 441.0 | | | 441.0 | | | — | | | 498.3 | | | 498.3 | | | IMRALDI | | — | | | 222.1 | | | 222.1 | | | — | | | 224.5 | | | 224.5 | | | — | | | 233.4 | | | 233.4 | | | FLIXABI | | — | | | 77.4 | | | 77.4 | | | — | | | 81.3 | | | 81.3 | | | — | | | 99.4 | | | 99.4 | | BYOOVIZ(3) | | 29.2 | | | 2.5 | | | 31.7 | | | 4.3 | | | — | | | 4.3 | | | — | | | — | | | — | | | Subtotal: Biosimilars | | 29.2 | | | 740.8 | | | 770.0 | | | 4.3 | | | 746.8 | | | 751.1 | | | — | | | 831.1 | | | 831.1 | | | | | | | | | | | | | | | | | | | | | Other(4) | | 4.0 | | | 7.8 | | | 11.8 | | | 4.8 | | | 8.2 | | | 13.0 | | | 3.0 | | | 11.0 | | | 14.0 | | | Total product revenue | | $ | 3,141.4 | | | $ | 4,105.3 | | | $ | 7,246.7 | | | $ | 3,469.3 | | | $ | 4,518.5 | | | $ | 7,987.8 | | | $ | 3,805.7 | | | $ | 5,041.2 | | | $ | 8,846.9 | |
(1) QALSODY became commercially available in the U.S. during 2017:the second quarter of 2023. (2) SKYCLARYS was obtained as part of our acquisition of Reata in September 2023. SKYCLARYS became commercially available in the U.S. during the second quarter of 2023 and we began recognizing revenue from SKYCLARYS in the U.S. during the fourth quarter of 2023, subsequent to our acquisition. (3) BYOOVIZ became commercially available in the U.S. during the third quarter of 2022 and commercially available in certain international markets in 2023. (4) Other includes FUMADERM, ADUHELM and ZURZUVAE, which became commercially available in the U.S. during the fourth quarter of 2023. We recognized revenue from two wholesalers accounting for 27.0% and 9.9% of gross product revenue in 2023, 26.8% and 11.1% of gross product revenue in 2022 and 28.8% and 10.1% of gross product revenue in 2021, respectively. As of December 31, 2023, two wholesale distributors individually accounted for approximately 24.6% and 11.6% of net accounts receivable associated with our product sales, as compared to 22.7% and 10.9% as of December 31, 2022, respectively.
| | | | | | | | | | | | | | (In millions) | Workforce Reduction | | Pipeline Programs | | Total | | Restructuring reserve as of December 31, 2015 | $ | 33.7 |
| | $ | 3.6 |
| | $ | 37.3 |
| | Expense | 4.9 |
| | 5.4 |
| | 10.3 |
| | Payments | (31.2 | ) | | (9.0 | ) | | (40.2 | ) | | Adjustments to previous estimates, net | (5.2 | ) | | 2.9 |
| | (2.3 | ) | | Restructuring reserve as of December 31, 2016 | $ | 2.2 |
| | $ | 2.9 |
| | $ | 5.1 |
| | Payments | (1.7 | ) | | (2.9 | ) | | (4.6 | ) | | Restructuring reserve as of December 31, 2017 | $ | 0.5 |
| | $ | — |
| | $ | 0.5 |
|
BIOGEN INC. AND SUBSIDIARIES 5. Reserves for Discounts and AllowancesNOTES TO CONSOLIDATED FINANCIAL STATEMENTS — (Continued)
An analysis of the change in reserves for discounts and allowances is summarized as follows: | | | | | | | | | | | | | | | | | | | | | | | | | | | | | December 31, 2023 | | (In millions) | | Discounts | | Contractual
Adjustments | | Returns | | Total | | Beginning balance | | $ | 153.8 | | | $ | 857.7 | | | $ | 23.5 | | | $ | 1,035.0 | | | Current provisions relating to sales in current year | | 735.6 | | | 2,720.1 | | | 19.0 | | | 3,474.7 | | | Adjustments relating to prior years | | (0.4) | | | (38.4) | | | 19.2 | | | (19.6) | | | Payments/credits relating to sales in current year | | (572.9) | | | (1,944.8) | | | (2.1) | | | (2,519.8) | | | Payments/credits relating to sales in prior years | | (142.8) | | | (737.5) | | | (28.0) | | | (908.3) | | | Ending balance | | $ | 173.3 | | | $ | 857.1 | | | $ | 31.6 | | | $ | 1,062.0 | |
| | | | December 31, 2022 | | | | December 31, 2022 | | (In millions) | Discounts | | Contractual Adjustments | | Returns | | Total | (In millions) | | Discounts | | Contractual
Adjustments | | Returns | | Total | | 2017 | | | | | | | | | Beginning balance | $ | 71.6 |
| | $ | 482.7 |
| | $ | 51.2 |
| | $ | 605.5 |
| | Current provisions relating to sales in current year | 583.0 |
| | 2,307.4 |
| | 26.9 |
| | 2,917.3 |
| | Adjustments relating to prior years | (0.1 | ) | | 15.0 |
| | (8.9 | ) | | 6.0 |
| | Payments/returns relating to sales in current year | (475.8 | ) | | (1,756.9 | ) | | (0.1 | ) | | (2,232.8 | ) | | Payments/returns relating to sales in prior years | (69.1 | ) | | (442.2 | ) | | (23.1 | ) | | (534.4 | ) | | Payments/credits relating to sales in current year | | | Payments/credits relating to sales in prior years | | | Ending balance | $ | 109.6 |
| | $ | 606.0 |
| | $ | 46.0 |
| | $ | 761.6 |
|
| | | | | | | | | | | | | | | | | | | | | | | | | | | | | December 31, 2021 | | (In millions) | | Discounts | | Contractual
Adjustments | | Returns | | Total | | Beginning balance | | $ | 141.4 | | | $ | 1,093.0 | | | $ | 41.6 | | | $ | 1,276.0 | | | Current provisions relating to sales in current year | | 736.7 | | | 2,948.7 | | | 15.2 | | | 3,700.6 | | | Adjustments relating to prior years | | (4.0) | | | (96.1) | | | (3.3) | | | (103.4) | | | Payments/credits relating to sales in current year | | (599.3) | | | (2,283.1) | | | (0.4) | | | (2,882.8) | | | Payments/credits relating to sales in prior years | | (137.1) | | | (902.9) | | | (15.1) | | | (1,055.1) | | | Ending balance | | $ | 137.7 | | | $ | 759.6 | | | $ | 38.0 | | | $ | 935.3 | |
The total reserves above, which are included in our consolidated balance sheets, are summarized as follows: | | | | | | | | | | | | | | | | | | As of December 31, | | (In millions) | | 2023 | | 2022 | | Reduction of accounts receivable | | $ | 135.5 | | | $ | 143.4 | | | Component of accrued expense and other | | 926.5 | | | 891.6 | | | Total revenue-related reserves | | $ | 1,062.0 | | | $ | 1,035.0 | |
BIOGEN INC. AND SUBSIDIARIES NOTES TO CONSOLIDATED FINANCIAL STATEMENTS — (Continued)
Revenue from Anti-CD20 Therapeutic Programs
| | | | | | | | | | | | | | | | | | (In millions) | Discounts | | Contractual Adjustments | | Returns | | Total | | 2016 | | | | | | | | | Beginning balance | $ | 56.1 |
| | $ | 548.7 |
| | $ | 57.9 |
| | $ | 662.7 |
| | Current provisions relating to sales in current year | 592.6 |
| | 2,044.5 |
| | 30.9 |
| | 2,668.0 |
| | Adjustments relating to prior years | (1.4 | ) | | 1.5 |
| | (16.8 | ) | | (16.7 | ) | | Payments/returns relating to sales in current year | (522.5 | ) | | (1,576.0 | ) | | (1.0 | ) | | (2,099.5 | ) | | Payments/returns relating to sales in prior years | (53.2 | ) | | (536.0 | ) | | (19.8 | ) | | (609.0 | ) | | Ending balance | $ | 71.6 |
| | $ | 482.7 |
| | $ | 51.2 |
| | $ | 605.5 |
|
| | | | | | | | | | | | | | | | | | (In millions) | Discounts | | Contractual Adjustments | | Returns | | Total | | 2015 | | | | | | | | | Beginning balance | $ | 47.6 |
| | $ | 387.1 |
| | $ | 49.1 |
| | $ | 483.8 |
| | Current provisions relating to sales in current year | 459.7 |
| | 1,732.1 |
| | 37.6 |
| | 2,229.4 |
| | Adjustments relating to prior years | (1.3 | ) | | (16.3 | ) | | (14.7 | ) | | (32.3 | ) | | Payments/returns relating to sales in current year | (405.9 | ) | | (1,258.1 | ) | | (2.6 | ) | | (1,666.6 | ) | | Payments/returns relating to sales in prior years | (44.0 | ) | | (296.1 | ) | | (11.5 | ) | | (351.6 | ) | | Ending balance | $ | 56.1 |
| | $ | 548.7 |
| | $ | 57.9 |
| | $ | 662.7 |
|
The total revenue-related reserves above, included in our consolidated balance sheets, areRevenue from anti-CD20 therapeutic programs is summarized as follows:
| | | | | | | | | | | As of December 31, | | (In millions) | 2017 | | 2016 | | Reduction of accounts receivable | $ | 189.6 |
| | $ | 166.9 |
| | Component of accrued expenses and other | 572.0 |
| | 438.6 |
| | Total revenue-related reserves | $ | 761.6 |
| | $ | 605.5 |
|
6. Inventory
The components of inventory are summarized as follows:
| | | | | | | | | | | As of December 31, | | (In millions) | 2017 | | 2016 | | Raw materials | $ | 162.4 |
| | $ | 170.4 |
| | Work in process | 605.7 |
| | 698.7 |
| | Finished goods | 157.4 |
| | 170.3 |
| | Total inventory | $ | 925.5 |
| | $ | 1,039.4 |
| | | | | | | Balance Sheet Classification: | | | | | Inventory | $ | 902.7 |
| | $ | 1,001.6 |
| | Investments and other assets | 22.8 |
| | 37.8 |
| | Total inventory | $ | 925.5 |
| | $ | 1,039.4 |
|
Balances in the table abovebelow. For purposes of this footnote, we refer to RITUXAN and RITUXAN HYCELA collectively as RITUXAN.
| | | | | | | | | | | | | | | | | | | | | | | | For the Years Ended December 31, | | (In millions) | | 2023 | | 2022 | | 2021 | | Royalty revenue on sales of OCREVUS | | $ | 1,266.2 | | | $ | 1,136.3 | | | $ | 991.7 | | Biogen's share of pre-tax profits in the U.S. for RITUXAN, GAZYVA and LUNSUMIO(1) | | 409.4 | | | 547.0 | | | 647.7 | | | Other revenue from anti-CD20 therapeutic programs | | 14.0 | | | 17.2 | | | 19.1 | | | Total revenue from anti-CD20 therapeutic programs | | $ | 1,689.6 | | | $ | 1,700.5 | | | $ | 1,658.5 | |
(1) LUNSUMIO became commercially available in the U.S. during the first quarter of December 31, 2017 reflect the elimination of certain amounts transferred to Bioverativ in connection with the completion of the spin-off2023. Approximately 17.2%, 16.7% and 15.1% of our hemophilia business. Balances transferred to Bioverativ related to worktotal revenue in process2023, 2022 and finished goods inventory totaled $84.5 million and $31.6 million, respectively.2021, respectively, was derived from our collaboration arrangements with Genentech. For additional information on the spin-off of our hemophilia business,collaboration arrangements with Genentech, please read Note 3, Hemophilia Spin-Off,19, Collaborative and Other Relationships, to these consolidated financial statements.
Contract Manufacturing, Royalty and Other Revenue
Contract manufacturing, royalty and other revenue is summarized as follows: | | | | | | | | | | | | | | | | | | | | | | | | For the Years Ended December 31, | | (In millions) | | 2023 | | 2022 | | 2021 | | | | | | | | | | | | | | | | | | | | | | | | | | | | | | Contract manufacturing revenue | | $ | 848.2 | | | $ | 417.7 | | | $ | 427.7 | | | Royalty and other revenue | | 51.1 | | | 67.4 | | | 48.6 | | | Total contract manufacturing, royalty and other revenue | | $ | 899.3 | | | $ | 485.1 | | | $ | 476.3 | |
Contract Manufacturing Revenue Contract manufacturing revenue primarily reflects amounts earned under contract manufacturing agreements with our strategic customers. During the first quarter of 2023 we began recognizing contract manufacturing revenue for LEQEMBI, upon accelerated approval of LEQEMBI in the U.S. Prior to accelerated approval, our share of contract manufacturing amounts related to LEQEMBI were recognized in research and development expense within our consolidated statements of income. During the third quarter of 2019, we amended our agreement with a contract manufacturing customer pursuant to which we licensed certain of our manufacturing-related intellectual property to the customer. In the second quarter of 2020, the customer received regulatory approval for its product that is being manufactured using certain of our manufacturing-related intellectual property. As a result we were entitled to $500.0 million in a series of three payments. The first payment became due upon a regulatory approval of such product and was received during the second quarter of 2020. The second payment became due upon the first anniversary of the regulatory approval and was received during the second quarter of 2021. The third payment became due upon the second anniversary of the regulatory approval and was received during the second quarter of 2022. Royalty and Other Revenue Royalty and other revenue primarily reflects the royalties we receive from net sales on products related to patents that we have out-licensed, as well as royalty revenue on biosimilar products from our license arrangements with Samsung Bioepis and our 50.0% share of LEQEMBI product revenue, net and cost of sales, including royalties, as we are not the principal. For additional information on our collaboration arrangements with Eisai and our license arrangements with Samsung Bioepis, please read Note 19, Collaborative and Other Relationships, to these consolidated financial statements.
BIOGEN INC. AND SUBSIDIARIES NOTES TO CONSOLIDATED FINANCIAL STATEMENTS — (Continued) The components of inventory are summarized as follows: | | | | | | | | | | | | | | | | | | As of December 31, | | (In millions) | | 2023 | | 2022 | | Raw materials | | $ | 426.9 | | | $ | 413.2 | | | Work in process | | 1,926.8 | | | 751.9 | | | Finished goods | | 255.4 | | | 200.4 | | | Total inventory | | $ | 2,609.1 | | | $ | 1,365.5 | | | | | | | | Balance Sheet Classification: | | | | | | Inventory | | $ | 2,527.4 | | | $ | 1,344.4 | | | Investments and other assets | | 81.7 | | | 21.1 | | | Total inventory | | $ | 2,609.1 | | | $ | 1,365.5 | |
We recorded approximately $1.3 billion of acquired inventory, which includes measurement period adjustments, related to SKYCLARYS as a result of our acquisition of Reata in September 2023. For additional information on our acquisition of Reata, please read Note 2, Acquisitions, to these consolidated financial statements. Long-term inventory which primarily consists of work in process, is included in investments and other assets in our consolidated balance sheets. Write Downs and Other Charges Inventory amounts written down as a result of excess, obsolescence unmarketability or other reasonsunmarketability are charged to cost of sales, and totaled $76.9$124.4 million, $48.2$336.2 million and $41.9$167.6 million for the years ended December 31, 2017, 20162023, 2022 and 2015,2021, respectively. During the first quarter of 2022 we wrote-off approximately $275.0 million of inventory related to ADUHELM, as a result of the final NCD, which was recognized in cost of sales within our consolidated statements of income for the year ended December 31, 2022. We recognized approximately $136.0 million related to Eisai's 45.0% share of these charges in collaboration profit sharing/(loss reimbursement) within our consolidated statements of income for the year ended December 31, 2022. 7. During the fourth quarter of 2021 we wrote-off approximately $120.0 million of inventory in excess of forecasted demand related to ADUHELM, which was recognized in cost of sales within our consolidated statements of income for the year ended December 31, 2021. We have recognized approximately $59.0 million related to Eisai's 45.0% share of these charges in collaboration profit sharing/(loss reimbursement) within our consolidated statements of income for the year ended December 31, 2021.
As of December 31, 2023 and 2022, the carrying value of ADUHELM inventory was zero. In November 2023 we notified Neurimmune of our decision to terminate our collaboration and license agreement with Neurimmune and to discontinue the development and commercialization of ADUHELM. For additional information on our collaboration with Eisai, please read Note 19, Collaborative and Other Relationships, to these consolidated financial statements. For additional information on the discontinuation of ADUHELM, please read Note 20, Investments in Variable Interest Entities, to these consolidated financial statements.
BIOGEN INC. AND SUBSIDIARIES NOTES TO CONSOLIDATED FINANCIAL STATEMENTS — (Continued) | | | | | | | Note 7: | Intangible Assets and Goodwill |
Intangible Assets Intangible assets, net of accumulated amortization, impairment charges and adjustments are summarized as follows: | | | | | | As of December 31, 2017 | | As of December 31, 2016 | | | | | As of December 31, 2023 | | As of December 31, 2022 | | (In millions) | Estimated Life | | Cost | | Accumulated Amortization | | Net | | Cost | | Accumulated Amortization | | Net | (In millions) | | Estimated Life | | Cost | | Accumulated
Amortization | | Net | | Cost | | Accumulated
Amortization | | Net | | Out-licensed patents | 13-23 years | | $ | 543.3 |
| | $ | (535.6 | ) | | $ | 7.7 |
| | $ | 543.3 |
| | $ | (523.6 | ) | | $ | 19.7 |
| | Developed technology | 15-23 years | | 3,005.3 |
| | (2,689.0 | ) | | 316.3 |
| | 3,005.3 |
| | (2,634.3 | ) | | 371.0 |
| | Completed technology | | | Acquired and in-licensed rights and patents | | | Acquired and in-licensed rights and patents | | | Acquired and in-licensed rights and patents | | | Developed technology and other | | | | Total completed technology | | | Total completed technology | | | Total completed technology | | | In-process research and development | Indefinite until commercialization | | 680.6 |
| | — |
| | 680.6 |
| | 648.0 |
| | — |
| | 648.0 |
| | Priority review voucher | | | Trademarks and trade names | Indefinite | | 64.0 |
| | — |
| | 64.0 |
| | 64.0 |
| | — |
| | 64.0 |
| | Acquired and in-licensed rights and patents | 4-18 years | | 3,971.4 |
| | (1,160.4 | ) | | 2,811.0 |
| | 3,481.7 |
| | (776.1 | ) | | 2,705.6 |
| | Total intangible assets | | $ | 8,264.6 |
| | $ | (4,385.0 | ) | | $ | 3,879.6 |
| | $ | 7,742.3 |
| | $ | (3,934.0 | ) | | $ | 3,808.3 |
|
Amortization and Impairments Amortization and impairment of acquired intangible assets totaled $814.7$240.6 million, $385.6$365.9 million and $382.6$881.3 million for the years ended December 31, 2017, 20162023, 2022 and 2015,2021, respectively. For the year ended December 31, 2023, we had no impairment charges. Amortization of acquired intangible assets, excluding impairment charges, totaled $240.6 million, $246.3 million and $252.0 million for the years ended December 31, 2023, 2022 and 2021, respectively. The decrease in amortization of acquired intangible assets, excluding impairment charges, over the three years was primarily due to a lower rate of amortization for acquired intangible assets. For the year ended December 31, 2022, amortization and impairment of acquired intangible assets reflects the impact of a $119.6 million impairment charge related to vixotrigine (BIIB074) for the potential treatment of DPN. For the year ended December 31, 2017, includes $444.2 million of2021, amortization and impairment charges related to our U.S. and rest of world licenses to Forward Pharma's intellectual property, including Forward Pharma's intellectual property related to TECFIDERA, as discussed below. Amortization of acquired intangible assets for 2017 also reflects the impact of a $31.2$365.0 million impairment charge related to BIIB111 (timrepigene emparvovec), a $220.0 million impairment charge related to BIIB112 (cotoretigene toliparvovec) and a $44.3 million impairment charge related to vixotrigine for the Article 20 Procedurepotential treatment of ZINBRYTATGN. We monitor events and expectations regarding product performance. If new information indicates that the assumptions underlying our most recent analysis are substantially different than those utilized in our current estimates, our analysis would be updated and may result in a significant change in the E.U. For additional information on the Article 20 Procedure of ZINBRYTA and resulting impairment of ZINBRYTA related assets, please read Note 20, Collaborative and Other Relationships, to these consolidated financial statements. Balances in the table above as of December 31, 2017 also reflect the elimination of certain amounts transferred to Bioverativ in connection with the completionanticipated lifetime revenue of the spin-offrelevant products. The occurrence of our hemophilia business. For additional information onan adverse event could substantially increase the spin-offamount of our hemophilia business, please read Note 3, Hemophilia Spin-Off, to these consolidated financial statements. In-process research and development balances include adjustmentsamortization expense related to foreign currency exchange rate fluctuations.our acquired intangible assets as compared to previous periods or our current expectations, which may result in a significant negative impact on our future results of operations.
Out-licensed Patents
Out-licensed patents to third-parties primarily relate to patents acquired in connection with the merger of Biogen, Inc. and IDEC Pharmaceuticals Corporation in 2003.
DevelopedCompleted Technology
DevelopedCompleted technology primarily relates to our AVONEX product,other marketed products and programs acquired through asset acquisitions, licenses and business combinations. Completed technology intangible assets are amortized over their estimated useful lives, which was recorded inrange between 2 to 31 years, with a remaining weighted average useful life of 12 years for acquired and in-licensed rights and patents and 10 years for developed technology and other. In connection with our acquisition of Reata in September 2023 we acquired SKYCLARYS, a commercially-approved product in the merger of Biogen, Inc. and IDEC Pharmaceuticals Corporation in 2003. The net bookU.S., with an estimated fair value of this asset as of December 31, 2017 was $309.5 million.
BIOGEN INC. AND SUBSIDIARIES
NOTES TO CONSOLIDATED FINANCIAL STATEMENTS — (Continued)
approximately $4.2 billion, which includes measurement period adjustments.
IPR&D Related to Business Combinations IPR&D represents the fair value assigned to research and development assets that we acquired as part of a business combination and had not yet reached technological feasibility at the date of acquisition. Upon commercialization, we will determine the estimated useful life and amortize these amounts based upon an economic consumption method. The carrying value associated with ourIncluded in IPR&D assets as of December 31, 2017 and 2016 relatesbalances are adjustments related to the various IPR&D programs we acquired in connection with our acquisitions of Convergence, Stromedix Inc. (Stromedix) and Biogen International Neuroscience GmbH (BIN) in 2015, 2012 and 2010, respectively. These amounts have and will be adjusted for foreign currency exchange rate fluctuations. An analysis of anticipated lifetime revenues and anticipated development costs is performed annually during our long-range planning cycle, which was updated in the third quarter of 2017. This analysis is based upon certain assumptions that we evaluate on a periodic basis, including anticipated future product sales, the expected impact of changes in the amount of development costs and the probabilities of our programs succeeding, the introduction of new products by our competitors and changes in our commercial and pipeline product candidates.
Acquired and In-licensed Rights and Patents
Acquired and in-licensed rights and patents primarily relate to our acquisition of all remaining rights to TYSABRI from Elan. The net book value of this asset We review amounts capitalized as of December 31, 2017 was $2,236.2 million.
The net change in acquired and in-licensed rights and patents during 2017 reflects $90.0 million in total milestone payments paid to Ionis Pharmaceuticals, Inc. (Ionis) for the approvals of SPINRAZA in the E.U. and Japan in June 2017 and July 2017, respectively, the $25.0 million milestone payment paid to Samsung Bioepis, for the approval of IMRALDI, an adalimumab biosimilar referencing HUMIRA, in the E.U. in August 2017, and the net carrying value recognized in relation to our acquisition of TECFIDERA license rights, as described below. These net increases were in part offset by amortization and the $31.2 million impairment charge related to the Article 20 Procedure of ZINBRYTA.
For additional information on our relationships with Ionis and Samsung Bioepis and the European Commission (EC) approved restrictions on the use of ZINBRYTA, please read Note 20, Collaborative and Other Relationships, to these consolidated financial statements.
TECFIDERA License Rights
In January 2017 we entered into a settlement and license agreement among Biogen Swiss Manufacturing GmbH, Biogen International Holding Ltd., Forward Pharma and certain related parties, which was effective as of February 1, 2017. Pursuant to this agreement, we obtained U.S. and rest of world licenses to Forward Pharma's intellectual property, including Forward Pharma's intellectual property related to TECFIDERA. In exchange, we paid Forward Pharma $1.25 billion in cash. During the fourth quarter of 2016, we recognized a pre-tax charge of $454.8 million related to this agreement and in the first quarter of 2017 we recognized an intangible asset of $795.2 million related to this agreement. The pre-tax charge recognized in the fourth quarter of 2016 represented the fair value of our license to Forward Pharma’s intellectual property for the period April 2014, when we started selling TECFIDERA, through December 31, 2016. The intangible asset represented the fair value of the U.S. and rest of world licenses to Forward Pharma’s intellectual property related to TECFIDERA revenues for the period January 2017, the month in which we entered into this agreement, through December 2020, the last month before royalty payments could first commence pursuant to this agreement.
We have two intellectual property disputes with Forward Pharma, one in the U.S. and one in the E.U., concerning intellectual property related to TECFIDERA. In March 2017 the U.S. intellectual property dispute was decided in our favor. Forward Pharma appealed to the U.S. Court of Appeals for the Federal Circuit and the appeal is pending. We evaluated the recoverability of the U.S. asset acquired from Forward Pharma and recorded an impairment charge in the first quarter of 2017 to adjust the carrying value of the acquired U.S. asset to fair value reflecting the impact of the developments in the U.S. legal dispute. In January 2018 the European Patent Office (EPO) announced its decision revoking Forward Pharma’s European Patent No. 2 801 355. Forward Pharma has stated that it expects to file an appeal to the Technical Board of Appeal of the EPO. Based upon our assessment of these rulings, we continue to amortize the remaining net book value of the U.S. and rest of world intangible assets in our consolidated statements of income utilizing an economic consumption model.
For additional information on these disputes, please read Note 21, Litigation, to these consolidated financial statements.
BIOGEN INC. AND SUBSIDIARIES NOTES TO CONSOLIDATED FINANCIAL STATEMENTS — (Continued)
Estimated Future Amortizationacquired IPR&D for impairment annually, as of Intangible Assets
Our amortization expense is based on the economic consumptionOctober 31, and impairment of intangible assets. Our most significant intangible assets are related to our TECFIDERA, AVONEX and TYSABRI products. Annually, during our long-range planning cycle, we perform an analysis of anticipated lifetime revenues of TECFIDERA, AVONEX and TYSABRI. This analysis is also updated whenever events or changes in circumstances would significantly affectindicate to us that the anticipated lifetime revenuescarrying value of anythe assets might not be recoverable. The carrying value associated with our IPR&D assets as of December 31, 2023, relates to the IPR&D programs we acquired in connection with our acquisition of Reata in September 2023 with an estimated fair value of approximately $2.3 billion, which includes measurement period adjustments.
Priority Review Voucher In connection with our acquisition of Reata in September 2023 we acquired a rare pediatric disease priority review voucher that may be used to obtain priority review by the FDA for a future regulatory submission or sold to a third party. We recorded the priority review voucher based on its estimated fair value of $100.0 million as an intangible asset. The estimated fair value was based on recent external purchase and sale transactions of similar vouchers. For additional information on our acquisition of Reata, please read Note 2, Acquisitions, to these products.consolidated financial statements. Our most recent long-range planning cycleVixotrigine
In connection with our acquisition of Convergence, we recognized $424.6 million of acquired IPR&D intangible assets for vixotrigine. In the periods following our acquisition of vixotrigine, there were numerous delays in the initiation of Phase 3 studies for the potential treatment of TGN and for the potential treatment of DPN, another form of neuropathic pain. We engaged with the FDA regarding the design of the potential Phase 3 studies of vixotrigine for the potential treatment of TGN and DPN and performed an additional clinical trial of vixotrigine, which was completed during 2022. The performance of this additional clinical trial delayed the initiation of the Phase 3 studies of vixotrigine for the potential treatment of TGN, and, as a result, we recognized an impairment charge of $44.3 million related to vixotrigine for the potential treatment of TGN during the first quarter of 2021. During the fourth quarter of 2022 we discontinued further development of vixotrigine based on regulatory, development and commercialization challenges. For the year ended December 31, 2022, we recognized an impairment charge of approximately $119.6 million related to vixotrigine for the potential treatment of DPN, reducing the remaining book value of this IPR&D intangible asset to zero. We also adjusted the value of our contingent consideration obligations related to this asset resulting in a pre-tax gain of approximately $209.1 million, which was recognized in (gain) loss on fair value remeasurement of contingent consideration within our consolidated statements of income for the year ended December 31, 2022. BIIB111 and BIIB112 In connection with our acquisition of Nightstar Therapeutics plc, we recognized $480.0 million and $220.0 million of acquired IPR&D intangible assets for BIIB111 and BIIB112, respectively. During the second quarter of 2021 we announced that our Phase 3 STAR study of BIIB111 and our Phase 2/3 XIRIUS study of BIIB112 did not meet their primary endpoints. In the third quarter of 2017. Based upon this analysis,2021 we suspended further development on these programs based on the decision by management as part of its strategic review process. For the year ended December 31, 2021, we recognized an impairment charge of $365.0 million related to BIIB111 and an impairment charge of $220.0 million related to BIIB112, reducing the remaining book values of these IPR&D intangible assets to zero. In addition, as a result of our decision to suspend further development of BIIB111 and BIIB112, we recorded charges of approximately $39.1 million during the third quarter of 2021 related to our manufacturing arrangements and other costs that we expect to incur as a result of suspending these programs. These charges were recognized in research and development expense in our consolidated statements of income for the year ended December 31, 2021.
BIOGEN INC. AND SUBSIDIARIES NOTES TO CONSOLIDATED FINANCIAL STATEMENTS — (Continued) Estimated Future Amortization of Intangible Assets The estimated future amortization of acquiredfinite-lived intangible assets for the next five years is expected to be as follows: | | | | | | (In millions) | As of December 31, 2017 | | 2018 | $ | 423.5 |
| | 2019 | 401.8 |
| | 2020 | 381.6 |
| | 2021 | 254.3 |
| | 2022 | 242.3 |
|
| | | | | | | | | | (In millions) | | As of December 31, 2023 | | 2024 | | $ | 345.0 | | | 2025 | | 470.0 | | | 2026 | | 485.0 | | | 2027 | | 480.0 | | | 2028 | | 495.0 | |
Goodwill The following table provides a roll forward of the changes in our goodwill balance: | | | | | | | | | | | | | | | | | | As of December 31, | | (In millions) | | 2023 | | 2022 | | Goodwill, beginning of year | | $ | 5,749.0 | | | $ | 5,761.1 | | | Goodwill resulting from Reata acquisition | | 464.5 | | | — | | | | | | | | Other | | 5.7 | | | (12.1) | | | Goodwill, end of year | | $ | 6,219.2 | | | $ | 5,749.0 | |
| | | | | | | | | | | As of December 31, | | (In millions) | 2017 | | 2016 | | Goodwill, beginning of year | $ | 3,669.3 |
| | $ | 2,663.8 |
| | Elimination of goodwill allocated to our hemophilia business | (314.1 | ) | | — |
| | Increase to goodwill | 1,267.3 |
| | 1,026.9 |
| | Other | 10.0 |
| | (21.4 | ) | | Goodwill, end of year | $ | 4,632.5 |
| | $ | 3,669.3 |
|
The elimination of goodwill represents an allocation based upon the relative enterprise fair value of the hemophilia business as of the distribution date. For additional information on the spin-offour acquisition of our hemophilia business,Reata, please read Note 3, Hemophilia Spin-Off,2, Acquisitions, to these consolidated financial statements.
The increase in goodwill during 2017 and 2016 was related to $1.5 billion and $1.2 billion in contingent milestones achieved (exclusive of $232.7 million and $173.1 million in tax benefits), respectively, and payable to the former shareholders of Fumapharm AG or holders of their rights.
Other includes changes related to foreign currency exchange rate fluctuations. As of December 31, 2017,2023 and 2022, we had no accumulated impairment losses related to goodwill.
For additional information on future contingent payments Other includes adjustments related to the former shareholders of Fumapharm AG or holders of their rights, please read Note 22, Commitments and Contingencies, to these consolidated financial statements.
foreign currency exchange rate fluctuations.
BIOGEN INC. AND SUBSIDIARIES NOTES TO CONSOLIDATED FINANCIAL STATEMENTS — (Continued)
8. | | | | | | | Note 8: | Fair Value Measurements |
The tables below present information about our assets and liabilities that are regularly measured and carried at fair value and indicate the level within the fair value hierarchy of the valuation techniques we utilized to determine such fair value: | | | | | | | | | | | | | | | | | | | | | | | | | | | | | As of December 31, 2023 | | (In millions) | | Total | | Quoted Prices in
Active Markets
(Level 1) | | Significant Other
Observable Inputs
(Level 2) | | Significant
Unobservable
Inputs
(Level 3) | | Assets: | | | | | | | | | | Cash equivalents | | $ | 610.7 | | | $ | — | | | $ | 610.7 | | | $ | — | | | | | | | | | | | | | | | | | | | | | | | | | | | | | | | | | | | | | | | Marketable equity securities | | 416.8 | | | 416.8 | | | — | | | — | | | Other current assets: | | | | | | | | | Receivable from Samsung BioLogics(1) | | 430.0 | | | — | | | — | | | 430.0 | | | Derivative contracts | | 11.9 | | | — | | | 11.9 | | | — | | | Other non-current assets: | | | | | | | | | | Plan assets for deferred compensation | | 37.5 | | | — | | | 37.5 | | | — | | | | | | | | | | | | Total | | $ | 1,506.9 | | | $ | 416.8 | | | $ | 660.1 | | | $ | 430.0 | | | Liabilities: | | | | | | | | | | Derivative contracts | | $ | 31.6 | | | $ | — | | | $ | 31.6 | | | $ | — | | | | | | | | | | | | Total | | $ | 31.6 | | | $ | — | | | $ | 31.6 | | | $ | — | |
| | | | | | | | | | | | | | | | | | (In millions) | As of
December 31,
2017 | | Quoted Prices in Active Markets (Level 1) | | Significant Other Observable Inputs (Level 2) | | Significant Unobservable Inputs (Level 3) | | Assets: | | | | | | | | | Cash equivalents | $ | 1,229.4 |
| | $ | — |
| | $ | 1,229.4 |
| | $ | — |
| | Marketable debt securities: | | | | | | | | | Corporate debt securities | 2,609.8 |
| | — |
| | 2,609.8 |
| | — |
| | Government securities | 1,919.3 |
| | — |
| | 1,919.3 |
| | — |
| | Mortgage and other asset backed securities | 643.4 |
| | — |
| | 643.4 |
| | — |
| | Marketable equity securities | 11.8 |
| | 11.8 |
| | — |
| | — |
| | Derivative contracts | 2.7 |
| | — |
| | 2.7 |
| | — |
| | Plan assets for deferred compensation | 28.5 |
| | — |
| | 28.5 |
| | — |
| | Total | $ | 6,444.9 |
| | $ | 11.8 |
| | $ | 6,433.1 |
| | $ | — |
| | Liabilities: | | | | | | | | | Derivative contracts | $ | 111.3 |
| | $ | — |
| | $ | 111.3 |
| | $ | — |
| | Contingent consideration obligations | 523.6 |
| | — |
| | — |
| | 523.6 |
| | Total | $ | 634.9 |
| | $ | — |
| | $ | 111.3 |
| | $ | 523.6 |
|
| | | | | | | | | | | | | | | | | | (In millions) | As of
December 31,
2016 | | Quoted Prices in Active Markets (Level 1) | | Significant Other Observable Inputs (Level 2) | | Significant Unobservable Inputs (Level 3) | | Assets: | | | | | | | | | Cash equivalents | $ | 2,039.6 |
| | $ | — |
| | $ | 2,039.6 |
| | $ | — |
| | Marketable debt securities: | | | | | | | | | Corporate debt securities | 2,663.8 |
| | — |
| | 2,663.8 |
| | — |
| | Government securities | 2,172.5 |
| | — |
| | 2,172.5 |
| | — |
| | Mortgage and other asset backed securities | 561.7 |
| | — |
| | 561.7 |
| | — |
| | Marketable equity securities | 24.9 |
| | 24.9 |
| | — |
| | — |
| | Derivative contracts | 61.0 |
| | — |
| | 61.0 |
| | — |
| | Plan assets for deferred compensation | 34.5 |
| | — |
| | 34.5 |
| | — |
| | Total | $ | 7,558.0 |
| | $ | 24.9 |
| | $ | 7,533.1 |
| | $ | — |
| | Liabilities: | | | | | | | | | Derivative contracts | $ | 13.6 |
| | $ | — |
| | $ | 13.6 |
| | $ | — |
| | Contingent consideration obligations | 467.6 |
| | — |
| | — |
| | 467.6 |
| | Total | $ | 481.2 |
| | $ | — |
| | $ | 13.6 |
| | $ | 467.6 |
|
The(1) Represents the fair value of Level 2 instruments classifiedthe current payment due from Samsung BioLogics as cash equivalents anda result of the sale of our 49.9% equity interest in Samsung Bioepis to Samsung BioLogics during the second quarter of 2022, for which we elected the fair value option. For additional information on the sale of our equity interest in Samsung Bioepis, please read Note 3, Dispositions, to these consolidated financial statements.
During the third quarter of 2023 we sold all of our marketable debt securities were determined through third-party pricing services. and used the proceeds to partially fund our acquisition of Reata. For additional information on our acquisition of Reata, please read Note 2, Acquisitions, to these consolidated financial statements.
BIOGEN INC. AND SUBSIDIARIES NOTES TO CONSOLIDATED FINANCIAL STATEMENTS — (Continued) | | | | | | | | | | | | | | | | | | | | | | | | | | | | | As of December 31, 2022 | | (In millions) | | Total | | Quoted Prices
in Active Markets
(Level 1) | | Significant
Other Observable
Inputs
(Level 2) | | Significant
Unobservable
Inputs
(Level 3) | | Assets: | | | | | | | | | | Cash equivalents | | $ | 2,847.6 | | | $ | — | | | $ | 2,847.6 | | | $ | — | | | Marketable debt securities: | | | | | | | | | | Corporate debt securities | | 1,231.6 | | | — | | | 1,231.6 | | | — | | | Government securities | | 810.3 | | | — | | | 810.3 | | | — | | | Mortgage and other asset backed securities | | 137.3 | | | — | | | 137.3 | | | — | | | Marketable equity securities | | 791.1 | | | 791.1 | | | — | | | — | | | Other current assets: | | | | | | | | | Receivable from Samsung BioLogics(1) | | 798.8 | | | — | | | — | | | 798.8 | | | Other non-current assets: | | | | | | | | | | Derivative contracts | | 63.0 | | | — | | | 63.0 | | | — | | | Plan assets for deferred compensation | | 32.8 | | | — | | | 32.8 | | | — | | Receivable from Samsung BioLogics(1) | | 405.4 | | | — | | | — | | | 405.4 | | | Total | | $ | 7,117.9 | | | $ | 791.1 | | | $ | 5,122.6 | | | $ | 1,204.2 | | | Liabilities: | | | | | | | | | | Derivative contracts | | $ | 26.0 | | | $ | — | | | $ | 26.0 | | | $ | — | | | | | | | | | | | | Total | | $ | 26.0 | | | $ | — | | | $ | 26.0 | | | $ | — | |
(1) Represents the fair value of the current and non-current payments due from Samsung BioLogics as a result of the sale of our 49.9% equity interest in Samsung Bioepis to Samsung BioLogics during the second quarter of 2022, for which we elected the fair value option. For additional information on the sale of our equity interest in Samsung Bioepis, please read Note 3, Dispositions, to these consolidated financial statements. Our marketable equity securities represent investments in publicly traded equity securities. Our ability to liquidate our investments in Denali, Sage and Sangamo may be limited by the size of our interest, the volume of market related activity, our concentrated level of ownership and potential restrictions resulting from our status as a collaborator. Therefore, we may realize significantly less than the current value of such investments. For additional information on our investments in Denali, Sangamo and Sage common stock, please read Note 19, Collaborative and Other Relationships, to these consolidated financial statements. There have been no material impairments of our assets measured and carried at fair value as of December 31, 2023 and 2022. In addition, there have been no changes in valuation techniques as of December 31, 2023 and 2022. For a description of our validation procedures related to prices provided by third-party pricing services and our option pricing valuation model, please read the Fair Value Measurements section within Note 1, Summary of Significant Accounting Policies: Fair Value Measurements,Policies, to these consolidated financial statements.
Level 3 Assets and Liabilities Held at Fair Value
There were no transfers of assets or liabilities into or out of Level 3 as of December 31, 2023 and 2022.
BIOGEN INC. AND SUBSIDIARIES NOTES TO CONSOLIDATED FINANCIAL STATEMENTS — (Continued)
Contingent Consideration Obligations
In connection with our acquisition of Convergence, we agreed to make additional payments based upon the achievement of certain milestone events. The following table provides a roll forward of the fair value of our contingent consideration obligations, which were classified as Level 3 measurements: | | | | | | | | | | | | | | | As of December 31, | | (In millions) | | | | 2022 | | Fair value, beginning of year | | | | $ | 209.1 | | | Changes in fair value | | | | (209.1) | | | | | | | | Fair value, end of year | | | | $ | — | |
For the year ended December 31, 2022, the changes in fair value of our contingent consideration obligations were primarily due to the discontinuation of further development efforts related to vixotrigine for the potential treatment of TGN and DPN, resulting in a reduction of our contingent consideration obligations of approximately $195.4 million, reducing the remaining fair value of vixotrigine to zero, as well as changes in the interest rates used to revalue our contingent consideration liabilities. Changes in the fair values of our contingent consideration obligations are recorded in (gain) loss on fair value remeasurement of contingent consideration in our consolidated statements of income. The fair values of the contingent consideration liabilities were based on a probability-adjusted discounted cash flow calculation using Level 3 fair value measurements and inputs. For additional information on the valuation techniques and inputs utilized in the valuation of our financial assets and liabilities, please read Note 1, Summary of Significant Accounting Policies, to these consolidated financial statements. Convergence Pharmaceuticals Holdings Limited In connection with our acquisition of Convergence in February 2015 we recorded a contingent consideration obligation of $274.5 million. As of December 31, 2021, the fair value of this contingent consideration obligation was $209.1 million. During the fourth quarter of 2022 we discontinued further development of vixotrigine based on regulatory, development and commercialization challenges. As a result, the fair value of the contingent consideration obligations related to Convergence has been adjusted to zero, resulting in a pre-tax gain of approximately $209.1 million for the year ended December 31, 2022. This pre-tax gain was recorded in (gain) loss on fair value remeasurement of contingent consideration within our consolidated statements of income. Nonrecurring Fair Value Measurements For the year ended December 31, 2022, we recorded impairment charges of $119.6 million related to vixotrigine. As a result, the remaining book values associated with these programs were reduced to zero. For the year ended December 31, 2021, we recorded impairment charges of $365.0 million related to BIIB111 and $220.0 million related to BIIB112. As a result, the remaining book values associated with these programs were reduced to zero. For additional information on our impairments for intangible assets, please read Note 7, Intangible Assets and Goodwill, to these consolidated financial statements. Financial Instruments Not Carried at Fair Value Other Financial Instruments Due to the short-term nature of certain financial instruments, the carrying value reflected in our consolidated balance sheets for current accounts receivable, due from anti-CD20 therapeutic programs, other current assets, accounts payable and accrued expense and other, approximates fair value.
BIOGEN INC. AND SUBSIDIARIES NOTES TO CONSOLIDATED FINANCIAL STATEMENTS — (Continued) Debt Instruments The fair values of our debt instruments, which are Level 2 liabilities, are summarized as follows: | | | | | | | | | | | | | | | | | | Fair Value
As of December 31, | | (In millions) | | 2023 | | 2022 | | Current portion: | | | | | 2023 Term Loan 364-day tranche(1) | | $ | 150.0 | | | $ | — | | | Current portion of notes payable and term loan | | 150.0 | | | — | | | | | | | | Non-current portion: | | | | | 2023 Term Loan three-year tranche(1) | | 500.0 | | | — | | | 4.050% Senior Notes due September 15, 2025 | | 1,721.5 | | | 1,699.9 | | | 2.250% Senior Notes due May 1, 2030 | | 1,279.3 | | | 1,219.0 | | | 5.200% Senior Notes due September 15, 2045 | | 1,089.7 | | | 1,033.2 | | | 3.150% Senior Notes due May 1, 2050 | | 1,049.0 | | | 989.0 | | | 3.250% Senior Notes due February 15, 2051 | | 498.2 | | | 469.1 | | | Non-current portion of notes payable and term loan | | 6,137.7 | | | 5,410.2 | | | Total notes payable and term loan | | $ | 6,287.7 | | | $ | 5,410.2 | |
| | | | | | | | | | | As of December 31, | | (In millions) | 2017 | | 2016 | | Notes payable to Fumedica | $ | 3.2 |
| | $ | 6.1 |
| | 6.875% Senior Notes due March 1, 2018 | — |
| | 583.7 |
| | 2.900% Senior Notes due September 15, 2020 | 1,517.7 |
| | 1,521.5 |
| | 3.625% Senior Notes due September 15, 2022 | 1,032.9 |
| | 1,026.6 |
| | 4.050% Senior Notes due September 15, 2025 | 1,851.9 |
| | 1,796.0 |
| | 5.200% Senior Notes due September 15, 2045 | 2,077.6 |
| | 1,874.5 |
| | Total | $ | 6,483.3 |
| | $ | 6,808.4 |
|
(1)In November 2017connection with our acquisition of Reata we redeemeddrew $1.0 billion from our 6.875% Senior Notes due March 1, 2018 with an aggregate principal amount2023 Term Loan, comprised of $550.0 million.a $500.0 million floating rate 364-day tranche and a $500.0 million floating rate three-year tranche. For additional information on this redemptionour 2023 Term Loan, please read Note 12, 13, Indebtedness, to these consolidated financial statements. The fair valuevalues of each of our notes payable to Fumedica was estimated using market observable inputs, including current interest and foreign currency exchange rates. The fair value of each series of our Senior Notes waswere determined through market, observable and corroborated sources. The changes in the fair values of our Senior Notes as of December 31, 2023, compared to 2022, are primarily related to increases in U.S. treasury yields partially offset by a decrease in credit spreads used to value our Senior Notes since December 31, 2022. For additional information onrelated to our debt instruments,Senior Notes, please read Note 12, 13, Indebtedness, to these consolidated financial statements. Contingent Consideration Obligations
In connection with our acquisitions of Convergence, Stromedix and BIN in 2015, 2012 and 2010, respectively, we agreed to make additional payments based upon the achievement of certain milestone events. The following table provides a roll forward of the fair values of our contingent consideration obligations, which includes Level 3 measurements:
| | | | | | | | | | | As of December 31, | | (In millions) | 2017 | | 2016 | | Fair value, beginning of year | $ | 467.6 |
| | $ | 506.0 |
| | Changes in fair value | 62.7 |
| | 14.8 |
| | Payments and other | (6.7 | ) | | (53.2 | ) | | Fair value, end of year | $ | 523.6 |
| | $ | 467.6 |
|
As of December 31, 2017 and 2016, approximately $279.0 million and $246.8 million, respectively, of the fair value of our total contingent consideration obligations was reflected as a component of other long-term liabilities in our consolidated balance sheets with the remaining balance reflected as a component of accrued expenses and other. Changes in the fair value of our contingent consideration obligations are primarily due to changes in the expected timing and probabilities of success related to the achievement of certain developmental milestones and changes in the discount rate. Payments and other for 2016 includes $7.9 million of a Convergence milestone converted to a short-term obligation under the acquisition agreement.
There were no changes in valuation techniques or transfers between fair value measurement levels during the years ended December 31, 2017 and 2016. The fair values of the intangible assets and contingent consideration liabilities were based on a probability-adjusted discounted cash flow calculation using Level 3 fair value measurements and inputs including estimated revenues and probabilities of success. For additional information on the valuation techniques and inputs utilized in the valuation of our financial assets and liabilities, please read Note 1, Summary of Significant Accounting Policies, to these consolidated financial statements.
BIOGEN INC. AND SUBSIDIARIES
NOTES TO CONSOLIDATED FINANCIAL STATEMENTS — (Continued)
Convergence
In connection with our acquisition of Convergence in February 2015 we recorded a contingent consideration obligation of $274.5 million. This valuation was based on probability weighted net cash outflow projections of $450.0 million, discounted using a rate of 2.0%, which was the estimated cost of debt financing for market participants. This liability reflected the revised estimate from the date of acquisition for our initial clinical development plans, resulting probabilities of success and the timing of certain milestone payments. For additional information on this transaction, please read Note 2, Acquisitions, to these consolidated financial statements.
As of December 31, 2017 and 2016, the fair value of this contingent consideration obligation was $259.0 million and $258.9 million, respectively. Our most recent valuation was determined based upon net cash flow projections of $400.0 million, probability weighted and discounted using a rate of 2.4%, which is a measure of the credit risk associated with settling the liability.
For 2017 compared to 2016, the net increase in the fair value of this obligation was primarily due to changes in the discount rate, partially offset by changes in the expected timing related to the achievement of certain remaining developmental milestones. Approximately $147.9 million is reflected as a component of accrued expenses and other in our consolidated balance sheets as we expect to make the payment within one year.
Stromedix Inc.
In connection with our acquisition of Stromedix in March 2012 we recorded a contingent consideration obligation of $122.2 million. As of December 31, 2017 and 2016, the fair value of this contingent consideration obligation was $162.4 million and $133.2 million, respectively. Our most recent valuation was determined based upon net cash outflow projections of $344.0 million, probability weighted and discounted using a rate of 2.4%, which is a measure of the credit risk associated with settling the liability.
For 2017 compared to 2016, the net increase in the fair value of this obligation was primarily due to an increase in the probability of success related to the achievement of certain remaining developmental milestones, partially offset by changes in the discount rate. Approximately $76.7 million is reflected as a component of accrued expenses and other in our consolidated balance sheets as we expect to make the payment within one year.
Biogen Idec International Neuroscience GmbH
In connection with our acquisition of BIN in December 2010 we recorded a contingent consideration obligation of $81.2 million. As of December 31, 2017 and 2016, the fair value of this contingent consideration obligation was $102.2 million and $75.5 million, respectively. Our most recent valuation was determined based upon net cash outflow projections of $355.0 million, probability weighted and discounted using a rate of 2.8%, which is a measure of the credit risk associated with settling the liability.
For 2017 compared to 2016, the net increase in the fair value of this obligation was primarily due to an increase in the probability of success related to the achievement of certain remaining developmental milestones, partially offset by a $6.7 million developmental milestone payment. Approximately $20.0 million is reflected as a component of accrued expenses and other in our consolidated balance sheets as we achieved the developmental milestone of dosing our first patient in our Phase 2 SPARK study of BIIB054 in Parkinson's disease in January 2018.
Acquired IPR&D
In connection with our acquisition of Convergence, we also allocated $424.6 million of the total purchase price to acquired IPR&D, which was capitalized as an intangible asset. The amount allocated to acquired IPR&D was based on significant inputs not observable in the market and thus represented a Level 3 fair value measurement. These assets will be tested for impairment annually until commercialization, after which time the IPR&D will be amortized over its estimated useful life using the economic consumption method. For additional information on this transaction, please read Note 2, Acquisitions, to these consolidated financial statements.
BIOGEN INC. AND SUBSIDIARIES
NOTES TO CONSOLIDATED FINANCIAL STATEMENTS — (Continued)
9. | | | | | | | Note 9: | Financial Instruments |
The following table summarizes our financial assets with maturities of less than 90 days from the date of purchase included in cash and cash equivalents in our consolidated balance sheets: | | | | As of December 31, | | | As of December 31, | | (In millions) | 2017 | | 2016 | (In millions) | | 2023 | | 2022 | | Commercial paper | $ | 30.5 |
| | $ | 31.0 |
| | Overnight reverse repurchase agreements | 3.6 |
| | — |
| | Money market funds | 948.0 |
| | 741.7 |
| | Short-term debt securities | 247.3 |
| | 1,266.9 |
| | Total | $ | 1,229.4 |
| | $ | 2,039.6 |
|
The carrying values of our commercial paper, including accrued interest, overnight reverse repurchase agreements, money market funds and our short-term debt securities approximate fair value due to their short-term maturities. We partially funded our Reata acquisition through available cash, cash equivalents and marketable securities. As of December 31, 2023, we have sold all of our marketable debt securities. For additional information on our acquisition of Reata, please read Note 2, Acquisitions, to these consolidated financial statements.
BIOGEN INC. AND SUBSIDIARIES NOTES TO CONSOLIDATED FINANCIAL STATEMENTS — (Continued) Our marketable equity securities gains (losses) are recorded in other (income) expense, net in our consolidated statements of income. The following tables summarize our marketable debt and equity securities, classified as available for sale: | | | | | | | | | | | | | | | | | | | | | | | | | | | | | As of December 31, 2023 | | (In millions) | | Amortized
Cost | | Gross
Unrealized
Gains | | Gross
Unrealized
Losses | | Fair
Value | | | | | | | | | | | | | | | | | | | | | | | | | | | | | | | | | | | | | | | | | | | | | | | | | | | | | | | | | | | | | | | | | | | | | | | | | | | | | | | | | | | | | | | | | | | | | | | | | | | | | | | | | | | | | | Marketable equity securities: | | | | | | | | | | Marketable equity securities, current | | $ | 31.6 | | | $ | — | | | $ | (21.0) | | | $ | 10.6 | | | Marketable equity securities, non-current | | 948.3 | | | — | | | (542.1) | | | 406.2 | | | Total marketable equity securities | | $ | 979.9 | | | $ | — | | | $ | (563.1) | | | $ | 416.8 | |
| | | | | | | | | | | | | | | | | | As of December 31, 2017 (In millions) | Fair Value | | Gross Unrealized Gains | | Gross Unrealized Losses | | Amortized Cost | | Corporate debt securities | | | | | | | | | Current | $ | 1,039.3 |
| | $ | — |
| | $ | (0.2 | ) | | $ | 1,039.5 |
| | Non-current | 1,570.5 |
| | 0.9 |
| | — |
| | 1,569.6 |
| | Government securities | | | | | | | | | Current | 1,075.1 |
| | 0.1 |
| | (0.7 | ) | | 1,075.7 |
| | Non-current | 844.2 |
| | 0.2 |
| | (1.1 | ) | | 845.1 |
| | Mortgage and other asset backed securities | | | | | | | | | Current | 0.8 |
| | — |
| | — |
| | 0.8 |
| | Non-current | 642.6 |
| | 1.1 |
| | (0.8 | ) | | 642.3 |
| | Total marketable debt securities | $ | 5,172.5 |
| | $ | 2.3 |
| | $ | (2.8 | ) | | $ | 5,173.0 |
| | Marketable equity securities, non-current | $ | 11.8 |
| | $ | 1.8 |
| | $ | (4.4 | ) | | $ | 14.4 |
|
| | | | | | | | | | | | | | | | | | As of December 31, 2016 (In millions) | Fair Value | | Gross Unrealized Gains | | Gross Unrealized Losses | | Amortized Cost | | Corporate debt securities | | | | | | | | | Current | $ | 1,408.6 |
| | $ | 0.2 |
| | $ | (0.6 | ) | | $ | 1,409.0 |
| | Non-current | 1,255.2 |
| | 1.2 |
| | (4.7 | ) | | 1,258.7 |
| | Government securities | | | | | | | | | Current | 1,156.0 |
| | 0.2 |
| | (0.3 | ) | | 1,156.1 |
| | Non-current | 1,016.5 |
| | 0.5 |
| | (3.4 | ) | | 1,019.4 |
| | Mortgage and other asset backed securities | | | | | | | | | Current | 4.0 |
| | — |
| | — |
| | 4.0 |
| | Non-current | 557.7 |
| | 0.8 |
| | (2.2 | ) | | 559.1 |
| | Total marketable debt securities | $ | 5,398.0 |
| | $ | 2.9 |
| | $ | (11.2 | ) | | $ | 5,406.3 |
| | Marketable equity securities, non-current | $ | 24.9 |
| | $ | 0.7 |
| | $ | (9.3 | ) | | $ | 33.5 |
|
BIOGEN INC. AND SUBSIDIARIES
NOTES TO CONSOLIDATED FINANCIAL STATEMENTS — (Continued)
| | | | | | | | | | | | | | | | | | | | | | | | | | | | | As of December 31, 2022 | | (In millions) | | Amortized
Cost | | Gross
Unrealized
Gains | | Gross
Unrealized
Losses | | Fair
Value | | Marketable debt securities: | | | | | | | | | | Corporate debt securities: | | | | | | | | | | Current | | $ | 936.2 | | | $ | — | | | $ | (4.9) | | | $ | 931.3 | | | Non-current | | 305.3 | | | 0.1 | | | (5.1) | | | 300.3 | | | Government securities: | | | | | | | | | | Current | | 547.1 | | | 0.1 | | | (5.0) | | | 542.2 | | | Non-current | | 271.4 | | | — | | | (3.3) | | | 268.1 | | | Mortgage and other asset backed securities: | | | | | | | | | | Current | | — | | | — | | | — | | | — | | | Non-current | | 139.1 | | | 0.1 | | | (1.9) | | | 137.3 | | | Total marketable debt securities | | $ | 2,199.1 | | | $ | 0.3 | | | $ | (20.2) | | | $ | 2,179.2 | | | | | | | | | | | | Marketable equity securities: | | | | | | | | | | | | | | | | | | | Marketable equity securities, non-current | | $ | 1,133.8 | | | $ | — | | | $ | (342.7) | | | $ | 791.1 | | | Total marketable equity securities | | $ | 1,133.8 | | | $ | — | | | $ | (342.7) | | | $ | 791.1 | |
Summary of Contractual Maturities: Available-for-Sale Debt Securities The estimated fair value and amortized cost of our marketable debt securities classified as available-for-sale by contractual maturity are summarized as follows: | | | | | | | | | As of December 31, 2017 | | As of December 31, 2016 | | | | As of December 31, 2022 | | (In millions) | Estimated Fair Value | | Amortized Cost | | Estimated Fair Value | | Amortized Cost | (In millions) | | | | | | Estimated
Fair Value | | Amortized
Cost | | Due in one year or less | $ | 2,115.2 |
| | $ | 2,116.0 |
| | $ | 2,568.6 |
| | $ | 2,569.1 |
| | Due after one year through five years | 2,730.0 |
| | 2,730.0 |
| | 2,552.6 |
| | 2,559.7 |
| | Due after five years | 327.3 |
| | 327.0 |
| | 276.8 |
| | 277.5 |
| | Total available-for-sale securities | $ | 5,172.5 |
| | $ | 5,173.0 |
| | $ | 5,398.0 |
| | $ | 5,406.3 |
| | Total marketable debt securities | |
The average maturity of our marketable debt securities classified as available-for-sale as of December 31, 2017 and 20162022, was 17 months and 12 months, respectively.approximately 8 months.
BIOGEN INC. AND SUBSIDIARIES NOTES TO CONSOLIDATED FINANCIAL STATEMENTS — (Continued) Proceeds from Marketable Debt Securities The proceeds from maturities and sales of marketable debt securities and resulting realized gains and losses are summarized as follows: | | | | For the Years Ended December 31, | | | For the Years Ended December 31, | | (In millions) | 2017 | | 2016 | | 2015 | (In millions) | | 2023 | | 2022 | | 2021 | | Proceeds from maturities and sales | $ | 5,565.9 |
| | $ | 7,378.9 |
| | $ | 4,063.0 |
| | Realized gains | $ | 3.0 |
| | $ | 3.3 |
| | $ | 1.5 |
| | Realized losses | $ | 22.4 |
| | $ | 4.3 |
| | $ | 3.5 |
|
Realized losses for the year ended December 31, 20172023, primarily relate to impairments recognized on certain of our available-for-sale marketable debt securities as we intend to sell these securities as a result of the Tax Cuts and Jobs Act of 2017 (the 2017 Tax Act), sales of agency mortgage-backed securities,U.S. treasuries and corporate bonds and government securities.bonds. Realized losses for the yearyears ended December 31, 20162022 and 2021, primarily relate to sales of corporate bonds, agency mortgage-backed securities and other asset-backed securities. Realized losses for During the year ended December 31, 2015 primarily relate to salesthird quarter of corporate bonds, agency mortgage-backed2023 we sold all of our marketable debt securities and other asset-backed securities.used the proceeds to partially fund our acquisition of Reata. For additional information on our acquisition of Reata, please read Note 2, Acquisitions, to these consolidated financial statements. Strategic Investments Our strategic investment portfolio includes investments in equity securities of certain biotechnology companies, which are reflected within our disclosures included in Note 8, Fair Value Measurements, to these consolidated financial statements, as well as venture capital funds where the underlying investments are in equity securities of certain biotechnology companies and non-marketable equity securities. As of December 31, 2017 and 2016,2023, our strategic investment portfolio was comprised of investments totaling $85.8$460.7 million which are included in other current assets and $99.9investments and other assets in our consolidated balance sheets. As of December 31, 2022, our strategic investment portfolio comprised of investments totaling $846.0 million respectively, which are included in investments and other assets in our consolidated balance sheets. Our The decrease in our strategic investment portfolio includesfor the year ended December 31, 2023, was primarily due to the decrease in the fair value of our investments in equity securitiesDenali, Sangamo and Sage common stock. Additionally, during 2023 we sold a portion of certain biotechnology companiesour Sangamo and Denali common stock and the remainder of our Ionis common stock. For additional information on our investments in venture capital funds where the underlying investments are in equity securities of biotechnology companies.Denali, Sangamo, Sage and Ionis common stock, please read Note 19, Collaborative and Other Relationships, to these consolidated financial statements. 10. | | | | | | | Note 10: | Derivative Instruments |
Foreign Currency Forward Contracts - Hedging Instruments Due to the global nature of our operations, portions of our revenuesrevenue and operating expensesexpense are recorded in currencies other than the U.S. dollar. The value of revenuesrevenue and operating expensesexpense measured in U.S. dollars is therefore subject to changes in foreign currency exchange rates. In order to mitigate these changes we useWe enter into foreign currency forward contracts and foreign currency options with financial institutions with the primary objective to lock inmitigate the impact of foreign currency exchange rates associated with a portion ofrate fluctuations on our forecasted international revenuesrevenue and operating expenses.expense. Foreign currency forward contracts and foreign currency options in effect as of December 31, 20172023 and 20162022, had durations of 1 to 21 months and 1 to 18 months, respectively.12 months. These contracts have been designated as cash flow hedges and accordingly, to the extent effective, any unrealized gains orand losses on the portion of these foreign currency forward contracts and foreign currency options that are included in the effectiveness test are reported in accumulated other comprehensive income (loss) (referred to as AOCI in the tables below).AOCI. Realized gains and losses for the effective portion of such contracts and options are recognized in revenuesrevenue when the sale of product in the currency being hedged is recognized and in operating expensesexpense when the expense in the currency being hedged is recorded. ToWe recognize all cash flow hedge reclassifications from AOCI and fair value changes of excluded portions in the extent ineffective, hedge transaction gains and losses are reportedsame line item in otherour consolidated statements of income (expense), net.
that have been impacted by the hedged item.
BIOGEN INC. AND SUBSIDIARIES NOTES TO CONSOLIDATED FINANCIAL STATEMENTS — (Continued)
The notional valueamount of foreign currency forward contracts and foreign currency options that were entered into to hedge forecasted revenuesrevenue and operating expensesexpense is summarized as follows: | | | | | | | | | | | Notional Amount As of December 31, | | Foreign Currency: (In millions) | 2017 | | 2016 | | Euro | $ | 1,875.6 |
| | $ | 871.7 |
| | British pound sterling | 150.9 |
| | — |
| | Swiss francs | 88.7 |
| | — |
| | Canadian dollar | 83.5 |
| | — |
| | Total foreign currency forward contracts | $ | 2,198.7 |
| | $ | 871.7 |
|
| | | | | | | | | | | | | | | | | | Notional Amount
As of December 31, | | (In millions) | | 2023 | | 2022 | | Euro | | $ | 1,169.0 | | | $ | 1,495.5 | | | British pound | | — | | | 162.8 | | | Swiss franc | | — | | | — | | | Canadian dollar | | — | | | 57.2 | | | Total foreign currency forward contracts and options | | $ | 1,169.0 | | | $ | 1,715.5 | |
The pre-tax portion of the fair value of these foreign currency forward contracts and foreign currency options that waswere included in accumulated other comprehensive income (loss)AOCI in total equity reflected net losses of $113.0 million for the year ended December 31, 2017, and net gains of $49.8 million and $1.8 million for the years ended December 31, 2016 and 2015, respectively. is summarized as follows: | | | | | | | | | | | | | | | | | | | | | | | For the Years Ended December 31, | | (In millions) | | 2023 | | 2022 | | 2021 | | Unrealized gains | | $ | — | | | $ | 29.9 | | | $ | 60.8 | | | Unrealized (losses) | | (34.8) | | | (21.3) | | | (7.0) | | | Net unrealized gains (losses) | | $ | (34.8) | | | $ | 8.6 | | | $ | 53.8 | |
We expect the net unrealized losses of $113.0approximately $34.8 million to be settled over the next 21 months, of which $98.5 million is expected to be settled over the next 12 months, with any amounts in accumulated other comprehensive income (loss)AOCI to be reported as an adjustment to revenue or operating expense. We consider the impact of our and our counterparties’ credit risk on the fair value of the contracts as well as the ability of each party to execute its contractual obligations. As of December 31, 20172023 and 2016,2022, credit risk did not materially change the fair value of our foreign currency forward contracts.contracts and forward currency options. The following table summarizes the effect of foreign currency forward contracts and forward currency options designated as hedging instruments in our consolidated statements of income: | | | | | | | | | | | | | | | | | | | | | | | | | | | | | | | | | | | | | | | | | | | | | | For the Years Ended December 31, | Net Gains/(Losses) Reclassified from AOCI into Operating Income (in millions) | | Net Gains/(Losses)
Recognized in Operating Income (in millions) | | Location | | 2023 | | 2022 | | 2021 | | Location | | 2023 | | 2022 | | 2021 | | Revenue | | $ | 11.6 | | | $ | 201.6 | | | $ | (60.0) | | | Revenue | | $ | (2.4) | | | $ | (8.6) | | | $ | (8.4) | | | Operating expense | | 3.7 | | | (5.5) | | | (0.8) | | | Operating expense | | — | | | — | | | — | |
| | | | | | | | | | | | | | | | | | | | | | | | | | | | | For the Years Ended December 31, | Net Gains/(Losses) Reclassified from AOCI into Operating Income (Effective Portion) (in millions) | | Net Gains/(Losses) Recognized into Net Income (Ineffective Portion) (in millions) | | Location | | 2017 | | 2016 | | 2015 | | Location | | 2017 | | 2016 | | 2015 | | Revenues | | $ | (32.5 | ) | | $ | 5.3 |
| | $ | 173.2 |
| | Other income (expense) | | $ | 8.9 |
| | $ | 2.9 |
| | $ | 4.9 |
| | Operating expenses | | $ | 0.6 |
| | $ | (1.5 | ) | | $ | — |
| | Other income (expense) | | $ | (0.2 | ) | | $ | 0.1 |
| | $ | — |
|
Interest Rate ContractsNet Investment Hedges - Hedging Instruments
We have entered into interest rate lock contracts or interest rate swap contracts on certain borrowing transactions to manage our exposure to interest rate changes and to reduce our overall cost of borrowing.
Interest Rate Lock Contracts
During 2015In February 2012 we entered into treasury rate locks,a joint venture agreement with Samsung BioLogics establishing an aggregated notional amountentity, Samsung Bioepis, to develop, manufacture and market biosimilar products. In June 2018 we exercised our option under our joint venture agreement to increase our ownership percentage in Samsung Bioepis from approximately 5.0% to approximately 49.9%. Our investment in the equity of $1.1 billion, whichSamsung Bioepis related to this transaction was exposed to the currency fluctuations in the South Korean won.
In order to mitigate the currency fluctuations between the U.S. dollar and South Korean won, we entered into foreign currency forward contracts. These contracts were designated as cash flow hedges to hedge against changes innet investment hedges. In April 2022 we completed the 10-year and 30-year U.S. treasury interest rates that could have impacted our anticipated debt offering. In connection with the issuancesale of our 4.05%49.9% equity interest in Samsung Bioepis to Samsung BioLogics and 5.20% Senior Notes, as describedclosed these foreign currency forward contracts. Upon completing this sale, the cumulative gains on our net investment hedges of $57.0 million were reclassified from AOCI and reflected within the total pre-tax gain recognized from the sale, which was recorded in other (income) expense, net in our consolidated statements of income for the year ended December 31, 2022. For additional information on the sale of our equity interest in Samsung Bioepis, please read Note 12, Indebtedness3, Dispositions, to these consolidated financial statements,statements. Prior to the sale of our 49.9% equity interest in Samsung Bioepis, we settledrecognized changes in the treasuryspot exchange rate locks and realized an $8.5of these foreign currency forward contracts in AOCI. The pre-tax portion of the fair value of these foreign currency forward contracts that were included in AOCI in total equity reflected net gains of $10.6 million gain. Asas of December 31, 2021. We excluded fair value changes related to the forward rate from our hedging relationship was effective,and amortized the gain was recorded in AOCI and will be recognized in other income (expense), net over the life of the 4.05% and 5.20% Senior Notes.
BIOGEN INC. AND SUBSIDIARIES NOTES TO CONSOLIDATED FINANCIAL STATEMENTS — (Continued)
forward points in other (income) expense, net in our consolidated statements of income over the term of the contract. The pre-tax portion of the fair value of the forward points that were included in AOCI in total equity reflected net losses of $3.6 million as of December 31, 2021.
Interest Rate Swap ContractsThe following table summarizes the effect of our net investment hedges in our consolidated financial statements:
In connection | | | | | | | | | | | | | | | | | | | | | | | | | | | | | | | | | | | | | | | | | | | | | | | | | | | | | | | | | | For the Years Ended December 31, | Net Gains/(Losses)
Recognized in Other Comprehensive Income (Effective Portion) (in millions) | | Net Gains/(Losses)
Recognized in Other Comprehensive Income (Amounts Excluded from Effectiveness Testing) (in millions) | | Net Gains/(Losses)
Recognized in Net Income
(Amounts Excluded from Effectiveness Testing) (in millions) | | Location | | | | 2022 | | 2021 | | Location | | | | 2022 | | 2021 | | Location | | | | 2022 | | 2021 | Gains (losses) on net investment hedge(1) | | | | $ | 20.4 | | | $ | 46.0 | | | Gains (losses) on net investment hedge(1) | | | | $ | (3.2) | | | $ | (3.2) | | | Other (income) expense(1) | | | | $ | (4.6) | | | $ | (0.6) | |
(1) Beginning in the second quarter of 2022 we no longer held net investment hedges as they were closed with the issuancesale of our 2.90% Senior Notes, as described49.9% equity interest in Samsung Bioepis in April 2022. For additional information on the sale of our equity interest in Samsung Bioepis, please read Note 12, Indebtedness3, Dispositions, to these consolidated financial statements, we entered into interest rate swapsstatements. For additional information on our collaboration arrangements with an aggregate notional amount of $675.0 million, which expire on September 15, 2020. The interest rate swap contracts are designated as hedges of the fair value changes in the 2.90% Senior Notes attributableSamsung Bioepis, please read Note 19, Collaborative and Other Relationships, to changes in interest rates. Since the specific terms and notional amount of the swaps match the debt being hedged, it is assumed to be a highly effective hedge and all changes in the fair value of the swaps are recorded as a component of the 2.90% Senior Notes with no net impact recorded in income. Any net interest payments made or received on the interest rate swap contracts are recognized as a component of interest expense in ourthese consolidated statements of income.financial statements. Foreign Currency Forward Contracts - Other DerivativesDerivative Instruments We also enter into other foreign currency forward contracts, usually with durations of one month or less, to mitigate the foreign currency risk related to certain balance sheet positions. We have not elected hedge accounting for these transactions. The aggregate notional amount of these outstanding foreign currency forward contracts was $564.9$1,301.5 million and $902.1$1,238.8 million as of December 31, 20172023 and 2016,2022, respectively. Net gains of $4.5$3.8 million, net losses of $34.7 million and net losses of $29.2 million and $23.8$43.3 million related to these contracts were recognizedrecorded as a component of other income (expense),(income) expense, net for the years ended December 31, 2017, 20162023, 2022 and 2015,2021, respectively. Summary of DerivativesDerivative Instruments While certain of our derivativesderivative instruments are subject to netting arrangements with our counterparties, we do not offset derivative assets and liabilities in our consolidated balance sheets. The amounts in the table below would not be substantially different if the derivative assets and liabilities were offset. The following table summarizes the fair value and presentation in our consolidated balance sheets of our outstanding derivativesderivative instruments, including those designated as hedging instruments: | | | | | | | (In millions) | Balance Sheet Location | Fair Value
As of December 31, 2017 | | Hedging Instruments: | | | | Asset derivatives | Other current assets | $ | 0.7 |
| | | Investments and other assets | $ | 0.2 |
| | Liability derivatives | Accrued expenses and other | $ | 84.7 |
| | | Other long-term liabilities | 23.6 |
| | Other Derivatives: | | | | Asset derivatives | Other current assets | $ | 1.8 |
| | Liability derivatives | Accrued expenses and other | $ | 3.0 |
|
| | | | | | | | | | | | | | | | | | | | | | | | | As of December 31, | | (In millions) | | Balance Sheet Location | | 2023 | | 2022 | | Cash Flow Hedging Instruments: | | | | | | | | Asset derivative instruments | | Other current assets | | $ | 0.3 | | | $ | 37.9 | | | | | | | | | | Liability derivative instruments | | Accrued expense and other | | 26.5 | | | 18.4 | | | | | | | | | | | | | | | | | Other Derivative Instruments: | | | | | | | | Asset derivative instruments | | Other current assets | | 11.6 | | | 25.1 | | | Liability derivative instruments | | Accrued expense and other | | 5.1 | | | 7.6 | |
| | | | | | | (In millions) | Balance Sheet Location | Fair Value
As of December 31, 2016 | | Hedging Instruments: | | | | Asset derivatives | Other current assets | $ | 50.4 |
| | | Investments and other assets | $ | 6.6 |
| | Liability derivatives | Other long-term liabilities | $ | 4.6 |
| | Other Derivatives: | | | | Asset derivatives | Other current assets | $ | 4.0 |
| | Liability derivatives | Accrued expenses and other | $ | 9.0 |
|
BIOGEN INC. AND SUBSIDIARIES NOTES TO CONSOLIDATED FINANCIAL STATEMENTS — (Continued)
11. | | | | | | | Note 11: | Property, Plant and Equipment |
Property, plant and equipment are recorded at historical cost, net of accumulated depreciation. Components of property, plant and equipment, net are summarized as follows: | | | | As of December 31, | | | As of December 31, | | (In millions) | 2017 | | 2016 | (In millions) | | 2023 | | 2022 | | Land | $ | 141.2 |
| | $ | 137.8 |
| | Buildings | 1,213.6 |
| | 1,107.8 |
| | Leasehold improvements | 80.6 |
| | 123.7 |
| | Machinery and equipment | 1,207.7 |
| | 1,105.8 |
| | Computer software and hardware | 767.1 |
| | 746.8 |
| | Furniture and fixtures | 55.3 |
| | 60.6 |
| | Construction in progress | 1,276.0 |
| | 658.6 |
| | Total cost | 4,741.5 |
| | 3,941.1 |
| | Less: accumulated depreciation | (1,559.1 | ) | | (1,439.3 | ) | | Total property, plant and equipment, net | $ | 3,182.4 |
| | $ | 2,501.8 |
|
Depreciation expense totaled $266.3$254.2 million, $309.3$272.4 million and $217.9$235.3 million for 2017, 2016the years ended December 31, 2023, 2022 and 2015,2021, respectively. For 2017, 2016the years ended December 31, 2023, 2022 and 2015,2021, we capitalized interest costs related to construction in progress totaling approximately $30.7$21.7 million, $12.9$17.1 million and $10.4$36.3 million, respectively. The increase in capitalized interest costs is primarily due to the construction of our Solothurn, Switzerland facility, as discussed below. Solothurn, Switzerland Manufacturing Facility During the first quarter of 2016In order to support our future growth and drug development pipeline, we purchased land in Solothurn, Switzerland for 64.4 million Swiss Francs (approximately $62.5 million) and are buildingbuilt a large-scale biologics manufacturing facility at this site. We expect thisin Solothurn, Switzerland. This facility to be operational by the end of the decade. Upon completion, the facility will includeincludes 393,000 square feet related to a large-scale biologics manufacturing facility, 290,000 square feet of warehouse, utilities and support space and 51,000 square feet of administrative space. As of December 31, 20172023 and 2016,2022, we had approximately $1.2 billion$728.8 million and $481.5$711.1 million, respectively, capitalized as construction in progress related to this facility. In the second quarter of 2021 a portion of this facility (the first manufacturing suite) received a GMP multi-product license from the SWISSMEDIC, resulting in approximately $1.2 billion of fixed assets being placed into service during the second quarter of 2021. The second manufacturing suite became operational in January 2024, resulting in approximately $710.7 million of fixed assets being placed into service during the first quarter of 2024. Solothurn has been approved for the manufacture of ADUHELM and LEQEMBI by the FDA.
Research Triangle Park Facility Purchase125 Broadway Building Sale
In August 2015September 2022 we completed the purchasesale of our building and land parcel located at 125 Broadway for an aggregate sales price of approximately $603.0 million, which is inclusive of a drug product manufacturing facility$10.8 million tenant allowance. This sale resulted in a pre-tax gain on sale of approximately $503.7 million, net of transaction costs, which is reflected within gain on sale of building in our consolidated statements of income for the year ended December 31, 2022. This transaction included approximately $79.2 million of property, plant and supporting infrastructure in Research Triangle Park (RTP), NC from Eisai Inc. (Eisai). The $104.8 million purchase price wasequipment, net, which comprised of $58.6approximately $72.6 million for buildings, $25.9approximately $1.6 million for land and approximately $5.0 million for machinery and equipmentequipment. We lease real estate, including laboratory and $20.3 million for land.office space, and certain equipment. In August 2015 we also amendedOur leases have remaining lease terms ranging from less than one year to fifteen years. Certain leases include one or more options to renew, exercised at our existing 10-year lease related to Eisai's oral solid dose products manufacturing facility in RTP, NC. The amended lease provided for a three-year term and our agreement to purchase the facility upon expiration ofsole discretion, with renewal terms that can extend the lease term or at Eisai's option, their completionfrom one year to ten years.
In addition, we sublease certain real estate to third parties. Our sublease portfolio consists of certain activities at the facility. Upon signing, we recognized assets alongoperating leases, with a corresponding financing obligation in our consolidated balance sheet of $20.3 million, the net present value of the future minimumremaining lease payments. These assets were recorded as a component of buildings and machinery and equipment. In December 2017, upon the earlier than expected completion of Eisai's activities, we completed our purchase of this facility for $17.2 million.
terms ranging from one year to six years.
BIOGEN INC. AND SUBSIDIARIES NOTES TO CONSOLIDATED FINANCIAL STATEMENTS — (Continued)
All of our leases qualify as operating leases. The following table summarizes the presentation in our consolidated balance sheets of our operating leases:
12. | | | | | | | | | | | | | | | | | | | | | As of December 31, | | (In millions) | Balance sheet location | | 2023 | | 2022 | | Assets: | | | | | | | Operating lease assets | Operating lease assets | | $ | 420.0 | | | $ | 403.9 | | | | | | | | | Liabilities | | | | | | | Current operating lease liabilities | Accrued expense and other | | $ | 90.3 | | | $ | 97.2 | | | Non-current operating lease liabilities | Long-term operating lease liabilities | | 400.0 | | | 333.0 | | | Total operating lease liabilities | | | $ | 490.3 | | | $ | 430.2 | |
The following table summarizes the effect of lease costs in our consolidated statements of income: | | | | | | | | | | | | | | | | | | | | | | | | | | | | | | | For the Years Ended December 31, | | (In millions) | | Income Statement Location | | 2023 | | 2022 | | 2021 | | Operating lease cost | | Research and development | | $ | 2.0 | | | $ | 2.0 | | | $ | 3.4 | | | | Selling, general and administrative | | 128.1 | | | 95.9 | | | 95.9 | | | Variable lease cost | | Research and development | | 0.5 | | | 0.4 | | | 0.8 | | | | Selling, general and administrative | | 37.3 | | | 25.4 | | | 25.7 | | | Sublease income | | Selling, general and administrative | | (23.5) | | | (24.0) | | | (23.9) | | | | Other (income) expense, net | | (4.1) | | | (4.1) | | | (4.0) | | | Net lease cost | | | | $ | 140.3 | | | $ | 95.6 | | | $ | 97.9 | |
Variable lease cost primarily related to operating expense, taxes and insurance associated with our operating leases. As these costs are generally variable in nature, they are not included in the measurement of the operating lease asset and related lease liability. The minimum lease payments for the next five years and thereafter are expected to be as follows: | | | | | | | | |
(In millions) | | As of December 31, 2023 | | 2024 | | $ | 106.2 | | | 2025 | | 96.1 | | | 2026 | | 83.5 | | | 2027 | | 86.1 | | | 2028 | | 49.4 | | | Thereafter | | 170.4 | | | Total lease payments | | $ | 591.7 | | | Less: interest | | 101.4 | | | Present value of operating lease liabilities | | $ | 490.3 | |
The weighted average remaining lease term and weighted average discount rate of our operating leases are as follows: | | | | | | | | | | | | | | | | | | | As of December 31, | | | 2023 | | 2022 | | | | Weighted average remaining lease term in years | | 7.37 | | 4.64 | | | | Weighted average discount rate | | 4.5 | % | | 3.7 | % | | |
BIOGEN INC. AND SUBSIDIARIES NOTES TO CONSOLIDATED FINANCIAL STATEMENTS — (Continued) Supplemental disclosure of cash flow information related to our operating leases included in cash flow provided by operating activities in our consolidated statements of cash flow is as follows: | | | | | | | | | | | | | | | | | | | | | | | As of December 31, | | (In millions) | | 2023 | | 2022 | | 2021 | | Cash paid for amounts included in the measurement of lease liabilities | | $ | 116.4 | | | $ | 107.4 | | | $ | 105.8 | | | Operating lease assets obtained in exchange for lease obligations | | 146.0 | | | 108.3 | | | 18.1 | |
6100 Legacy Drive Lease In connection with our acquisition of Reata we assumed responsibility for a single-tenant, build-to-suit building of approximately 327,400 square feet of office and laboratory space located in Plano, Texas, with an initial lease term of 16 years. We recorded a lease liability of approximately $151.8 million, which represents the net present value of rental expense over the remaining lease term of approximately 15 years, with a corresponding right-of-use asset of approximately $121.2 million, which represents our estimate of the fair value for a market participant of the current rental market in the Dallas, Texas area. Included in our estimate of the market rental rate is the value of any leasehold improvements or tenant allowances related to the building. We do not intend to occupy this building and are evaluating opportunities to sublease the property. For additional information on our acquisition of Reata, please read Note 2, Acquisitions, to these consolidated financial statements. 125 Broadway Building Sale and Leaseback Transaction In connection with the sale of our 125 Broadway building during the third quarter of 2022, we simultaneously leased back the building for a term of approximately 5.5 years, which resulted in the recognition of approximately $168.2 million in a new lease liability and right-of-use asset recorded within our consolidated balance sheets as of December 31, 2022. The sale and immediate leaseback of this building qualified for sale and leaseback treatment and is classified as an operating lease. For additional information on the sale of our 125 Broadway building, please read Note 11, Property, Plant and Equipment, to these consolidated financial statements. 300 Binney Street Lease Modification In September 2022 we entered into an agreement to partially terminate a portion of our lease located at 300 Binney Street, as well as to reduce the lease term for the majority of the remaining space. The agreement was driven by our 2022 efforts to reduce costs by consolidating real estate locations. The transaction was treated as a lease modification as of the effective date and resulted in the derecognition of a right-of-use asset of approximately $47.4 million and a lease liability of approximately $52.7 million, which resulted in a gain of approximately $5.3 million, which was recorded within restructuring charges in our consolidated statements of income for the year ended December 31, 2022.
BIOGEN INC. AND SUBSIDIARIES NOTES TO CONSOLIDATED FINANCIAL STATEMENTS — (Continued) Our indebtedness is summarized as follows: | | | | | | | | | | | | | | | | | | As of December 31, | | (In millions) | | 2023 | | 2022 | | Current portion: | | | | | 2023 Term Loan 364-day tranche(1) | | $ | 150.0 | | | $ | — | | | Current portion of notes payable and term loan | | $ | 150.0 | | | $ | — | | | Non-current portion: | | | | | 2023 Term Loan three-year tranche(1) | | $ | 500.0 | | | $ | — | | | 4.050% Senior Notes due September 15, 2025 | | 1,746.6 | | | 1,744.7 | | | 2.250% Senior Notes due May 1, 2030 | | 1,493.8 | | | 1,492.9 | | | 5.200% Senior Notes due September 15, 2045 | | 1,100.7 | | | 1,100.3 | | | 3.150% Senior Notes due May 1, 2050 | | 1,474.3 | | | 1,473.8 | | | 3.250% Senior Notes due February 15, 2051 | | 472.8 | | | 469.3 | | | Non-current portion of notes payable and term loan | | $ | 6,788.2 | | | $ | 6,281.0 | |
| | | | | | | | | | | As of December 31, | | (In millions) | 2017 | | 2016 | | Current portion: | | | | | Notes payable to Fumedica | $ | 3.2 |
| | $ | 3.0 |
| | Financing arrangement for the purchase of the RTP facility | — |
| | 1.7 |
| | Current portion of notes payable and other financing arrangements | $ | 3.2 |
| | $ | 4.7 |
| | Non-current portion: | | | | | 6.875% Senior Notes due March 1, 2018 | $ | — |
| | $ | 558.5 |
| | 2.900% Senior Notes due September 15, 2020 | 1,482.4 |
| | 1,485.3 |
| | 3.625% Senior Notes due September 15, 2022 | 994.3 |
| | 993.2 |
| | 4.050% Senior Notes due September 15, 2025 | 1,736.3 |
| | 1,734.8 |
| | 5.200% Senior Notes due September 15, 2045 | 1,722.0 |
| | 1,721.5 |
| | Notes payable to Fumedica | — |
| | 3.0 |
| | Financing arrangement for the purchase of the RTP facility | — |
| | 16.4 |
| | Non-current portion of notes payable and other financing arrangements | $ | 5,935.0 |
| | $ | 6,512.7 |
|
6.875%(1) In connection with our acquisition of Reata we drew $1.0 billion from our 2023 Term Loan, comprised of a $500.0 million floating rate 364-day tranche and a $500.0 million floating rate three-year tranche.
As of December 31, 2023, we were in compliance with our senior note covenants and term loan covenants. 2023 Term Loan Credit Agreement In connection with our acquisition of Reata in September 2023 we entered into a $1.5 billion term loan credit agreement (2023 Term Loan). On the closing date of the Reata acquisition we drew $1.0 billion from the 2023 Term Loan, comprised of a $500.0 million floating rate 364-day tranche and a $500.0 million floating rate three-year tranche. The remaining unused commitment of $500.0 million was terminated. During the fourth quarter of 2023 we repaid $350.0 million of the 364-day tranche. As of December 31, 2023, we had $650.0 million outstanding under the 2023 Term Loan, of which $150.0 million was outstanding under the 364-day tranche and $500.0 million was outstanding under the three-year tranche. 2021 Exchange Offer In February 2021 we completed our private offer to exchange (Exchange Offer) our tendered 5.200% Senior Notes due March 1, 2018September 15, 2045 (2045 Senior Notes) for a new series of 3.250% Senior Notes due February 15, 2051 (2051 Senior Notes) and cash, and an offer to purchase our tendered 2045 Senior Notes for cash. On March 4, 2008, we issued $550.0 millionAn aggregate principal amount of 6.875%approximately $624.6 million of our 2045 Senior Notes due March 1, 2018 at 99.184% of par. These notes were senior unsecured obligations. We also entered into interest rate swap contracts where we received a fixed rate and paid a variable rate. These contracts were terminated in December 2008. Upon termination of these contracts, the carryingwas exchanged for an aggregate principal amount of these notes were increased by $62.8approximately $700.7 million with this amount being amortized using the effective interest rate method over the remaining life of theour 2051 Senior Notes and recognizedaggregate cash payments of approximately $151.8 million. Our Exchange Offer has been accounted for as a reductiondebt modification; as such, the cash component has been reflected as additional debt discount and is amortized as an adjustment to interest expense over the term of interest expense.our 2051 Senior Notes.
In November 2017addition, we redeemed these notes prior to their maturityan aggregate principal amount of approximately $8.9 million of our 2045 Senior Notes for aggregate cash payments of approximately $12.1 million, excluding accrued and unpaid interest. The redemption has been accounted for as a debt extinguishment; as such, we recognized a netpre-tax charge of $5.2$3.2 million upon the extinguishment of these notes.such 2045 Senior Notes. This charge, which was recognized in interest expense in other income (expense)(income) expense, net in our consolidated statements of income for the year ended December 31, 2017,2021, reflects the payment of a $7.7 millionan early call premium and the write offwrite-off of the remaining unamortized original debt issuance costs and discount balances partially offset byassociated with such 2045 Senior Notes.
BIOGEN INC. AND SUBSIDIARIES NOTES TO CONSOLIDATED FINANCIAL STATEMENTS — (Continued) Upon settlement, we also made aggregate cash payments of approximately $13.8 million to settle all accrued and unpaid interest from the last interest payment date on our 2045 Senior Notes that were exchanged or redeemed. We incurred approximately $6.1 million of costs associated with our Exchange Offer, which was recognized in interest expense in other (income) expense, net in our consolidated statements of income for the year ended December 31, 2021. 2020 Senior Notes On April 30, 2020, we issued senior unsecured notes for an aggregate principal amount of $3.0 billion (2020 Senior Notes), consisting of the following: •$1.5 billion aggregate principal amount of 2.25% Senior Notes due May 1, 2030, valued at 99.973% of par; and •$1.5 billion aggregate principal amount of 3.15% Senior Notes due May 1, 2050, valued at 99.174% of par. Our 2020 Senior Notes are senior unsecured obligations and may be redeemed at our option at any time at 100.0% of the principal amount plus accrued interest and, until a $2.9 million gain relatedspecified period before maturity, a specified make-whole amount. Our 2020 Senior Notes contain a change-of-control provision that, under certain circumstances, may require us to purchase our 2020 Senior Notes at a price equal to 101.0% of the principal amount plus accrued and unpaid interest to the remaining unamortized balancedate of repurchase. The original costs associated with this offering of approximately $24.4 million have been recorded as a reduction to the carrying amount of the debt in our consolidated balance sheets. These costs along with the discounts will be amortized as additional interest expense using the effective interest rate swap liability discussed above.method over the period from issuance through maturity. Interest on our 2020 Senior Notes is payable May 1 and November 1 of each year, commencing November 1, 2020. 2015 Senior Notes The following is a summary of our principal indebtedness ascurrently outstanding senior unsecured notes issued in 2015 (the 2015 Senior Notes), consisting of December 31, 2017:the following: •$1.51.75 billion aggregate principal amount of 2.90% Senior Notes due September 15, 2020, valued at 99.792% of par; $1.0 billion aggregate principal amount of 3.625% Senior Notes due September 15, 2022, valued at 99.920% of par;
$1.75 billion aggregate principal amount of 4.05% Senior Notes due September 15, 2025, valued at 99.764% of par; and
•$1.751.12 billion aggregate principal amount of 5.20% Senior Notes due September 15, 2045, valued at 99.294% of par. Our 2015 Senior Notes are senior unsecured obligations and may be redeemed at our option at any time at 100.0% of the principal amount plus accrued interest and a specified make-whole amount. Our 2015 Senior Notes contain a change of control provision that may require us to purchase the notes at a price equal to 101.0% of the principal amount plus accrued and unpaid interest to the date of purchase under certain circumstances. The original costs associated with these offeringsthis offering of approximately $47.5 million have been recorded as a reduction to the carrying amount of the debt in our consolidated balance sheet.sheets. These costs along with the discounts will be amortized as additional interest expense using the effective interest rate method over the period from issuance through maturity. These notes are3.625% Senior Notes due September 15, 2022
On September 15, 2015, we issued $1.0 billion aggregate principal amount of our 3.625% Senior Notes due September 15, 2022, at 99.920% of par. Our 3.625% Senior Notes were senior unsecured obligations. TheseIn July 2022 we redeemed our 3.625% Senior Notes may be redeemed at our option at any time at 100%prior to their maturity and recognized a net pre-tax charge of approximately $2.4 million upon the principal amount plus accrued interest and a specified make-whole amount. These Senior Notes
BIOGEN INC. AND SUBSIDIARIES
NOTES TO CONSOLIDATED FINANCIAL STATEMENTS — (Continued)
contain a change of control provision that may require us to purchase the notes at a price equal to 101% of the principal amount plus accrued and unpaid interest to the date of purchase under certain circumstances.
In connection with the 2.90%these Senior Notes, offering duewhich primarily reflects the payment of an early call premium as well as the write-off of remaining unamortized original debt issuance costs and discount balances. These charges were recognized as interest expense in 2020, we entered into interest rate swap contracts. The carrying valueother (income) expense, net in our consolidated statements of income for the 2.90% Senior Notes includes approximately $10.1 million related to changes in the fair value of these contracts. For additional information on our interest rate contracts, please read Note 10, Derivative Instruments, to these consolidated financial statements.
Notes Payable to Fumedica
In connection with our 2006 distribution agreement with Fumedica, we issued notes totaling 61.4 million Swiss Francs that are payable to Fumedica in varying amounts from June 2008 through June 2018. Our remaining note payable to Fumedica, payable in June 2018, had a carrying value of 3.1 million Swiss Francs ($3.2 million) and 6.2 million Swiss Francs ($6.0 million) as ofyear ended December 31, 2017 and 2016, respectively.2022.
2020 Revolving Credit Facility In August 2015January 2020 we entered into a $1.0 billion, five-year senior unsecured revolving credit facility under which we are permitted to draw funds for working capital and general corporate purposes. The terms of the revolving credit facility
BIOGEN INC. AND SUBSIDIARIES NOTES TO CONSOLIDATED FINANCIAL STATEMENTS — (Continued) include a financial covenant that requires us not to exceed a maximum consolidated leverage ratio. As of December 31, 2017,2023, we had no outstanding borrowings and were in compliance with all covenants under this facility. Financing Arrangement
During 2015 we recorded a financing obligation in relation to the amendment of our lease agreement for Eisai's oral solid dose products manufacturing facility in RTP, NC. In December 2017 we completed the purchase of this facility for $17.2 million and derecognized the remaining unamortized portion of the financing obligation from our consolidated balance sheet as of that date. For additional information on this transaction, please read Note 11, Property, Plant and Equipment, to these consolidated financial statements.
Debt Maturity The total gross payments excluding our financing arrangement, due under our debt arrangements are as follows: | | | | | | | | | | (In millions) | | As of December 31, 2023 | | 2024 | | $ | 150.0 | | | 2025 | | 1,750.0 | | | 2026 | | 500.0 | | | 2027 | | — | | | 2028 | | — | | | 2029 and thereafter | | 4,817.3 | | | Total current and non-current debt | | $ | 7,217.3 | | | Less: debt discount and issuance fees | | (279.1) | | | Total current and non-current debt, net | | $ | 6,938.2 | |
| | | | | | (In millions) | As of December 31, 2017 | | 2018 | $ | 3.2 |
| | 2019 | — |
| | 2020 | 1,500.0 |
| | 2021 | — |
| | 2022 | 1,000.0 |
| | 2023 and thereafter | 3,500.0 |
| | Total | $ | 6,003.2 |
|
The fair value of our debt is disclosed in Note 8, Fair Value Measurements, to these consolidated financial statements. Preferred Stock We have 8.0 million shares of Preferred Stock authorized, of which 1.75 million shares are authorized as Series A, 1.0 million shares are authorized as Series X junior participating and 5.25 million shares are undesignated. Shares may be issued without a vote or action of shareholders from time to time in classes or series with the designations, powers, preferences and the relative, participating, optional or other special rights of the shares of each such class or series and any qualifications, limitations or restrictions thereon as set forth in the instruments governing such shares. Any such Preferred Stock may rank prior to common stock as to dividend rights, liquidation preference or both, and may have full or limited voting rights and may be convertible into shares of common stock. No shares of Preferred Stock were issued and outstanding during 2017, 20162023, 2022 and 2015.
BIOGEN INC. AND SUBSIDIARIES
NOTES TO CONSOLIDATED FINANCIAL STATEMENTS — (Continued)
2021.
Common Stock The following table describes the number of shares authorized, issued and outstanding of our common stock as of December 31, 20172023, 2022 and 2016:2021: | | | | As of December 31, 2017 | | As of December 31, 2016 | | | As of December 31, 2023 | | As of December 31, 2022 | | As of December 31, 2021 | | (In millions) | Authorized | | Issued | | Outstanding | | Authorized | | Issued | | Outstanding | (In millions) | | Authorized | | Issued | | Outstanding | | Authorized | | Issued | | Outstanding | | Authorized | | Issued | | Outstanding | | Common stock | 1,000.0 |
| | 235.3 |
| | 211.5 |
| | 1,000.0 |
| | 238.5 |
| | 215.9 |
|
Share Repurchases In July 2016October 2020 our Board of Directors authorized our 2020 Share Repurchase Program, which is a program to repurchase up to $5.0 billion of our common stock (2016stock. Our 2020 Share Repurchase Program). This authorizationProgram does not have an expiration date. All share repurchases under this authorizationour 2020 Share Repurchase Program will be retired. Under this authorization,our 2020 Share Repurchase Program, we repurchased and retired 3.7approximately 3.6 million and 3.36.0 million shares of our common stock at a cost of approximately $750.0 million and $1.8 billion during the years ended December 31, 20172022 and 2016, respectively, at a cost of $1.0 billion for each year. As of December 31, 2017, approximately $3.0 billion remains available for2021, respectively. There were no share repurchases under this authorization. In May 2015 our Board of Directors authorized a program to repurchase up to $5.0 billion of our common stock (2015 Share Repurchase Program). All shares repurchased under this authorization were retired. Our 2015 Share Repurchase Program was completed as of December 31, 2015. Under this authorization, we repurchased and retired approximately 16.8 million shares of common stock at a cost of $5.0 billion during the year ended December 31, 2015.
In February 2011 our Board of Directors authorized a program to repurchase up to 20.0 million shares of our common stock (2011 Share Repurchase Program). Shares repurchased under this authorization were principally used to offset common stock issuances2023. Approximately $2.1 billion remained available under our share-based compensation programs. Our 20112020 Share Repurchase Program was completed as of March 31, 2017. Under this authorization, we repurchased 1.2 million shares of common stock at a cost of $365.4 million during the year ended December 31, 2017. We did not2023.
Amounts paid to repurchase any shares in excess of common stock under this authorization during the years ended December 31, 2016their par value are allocated between additional paid-in capital and 2015. 14. Accumulated Other Comprehensive Income (Loss)
The following table summarizes the changesretained earnings, with payments in accumulated other comprehensive income (loss), netexcess of tax by component:our additional paid-in-capital balance recorded as a reduction to retained earnings.
| | | | | | | | | | | | | | | | | | | | | | (In millions) | Unrealized Gains (Losses) on Securities Available for Sale, net of tax | | Unrealized Gains (Losses) on Cash Flow Hedges, net of tax | | Unfunded Status of Postretirement Benefit Plans, net of tax | | Translation Adjustments | | Total | | Balance, December 31, 2016 | $ | (10.8 | ) | | $ | 57.8 |
| | $ | (32.7 | ) | | $ | (334.2 | ) | | $ | (319.9 | ) | | Other comprehensive income (loss) before reclassifications | (3.5 | ) | | (193.8 | ) | | (4.1 | ) | | 158.7 |
| | (42.7 | ) | | Amounts reclassified from accumulated other comprehensive income (loss) | 12.7 |
| | 31.5 |
| | — |
| | — |
| | 44.2 |
| | Net current period other comprehensive income (loss) | 9.2 |
| | (162.3 | ) | | (4.1 | ) | | 158.7 |
| | 1.5 |
| | Balance, December 31, 2017 | $ | (1.6 | ) | | $ | (104.5 | ) | | $ | (36.8 | ) | | $ | (175.5 | ) | | $ | (318.4 | ) |
BIOGEN INC. AND SUBSIDIARIES NOTES TO CONSOLIDATED FINANCIAL STATEMENTS — (Continued)
In August 2022 the IRA was signed into law. Among other things, the IRA levies a 1.0% excise tax on net stock repurchases after December 31, 2022. While we have historically made discretionary share repurchases, we had no share repurchases of our common stock during the year ended December 31, 2023.
| | | | | | | | | | | | | | | | | | | | | | (In millions) | Unrealized Gains (Losses) on Securities Available for Sale, net of tax | | Unrealized Gains (Losses) on Cash Flow Hedges, net of tax | | Unfunded Status of Postretirement Benefit Plans, net of tax | | Translation Adjustments | | Total | | Balance, December 31, 2015 | $ | (0.8 | ) | | $ | 10.2 |
| | $ | (37.8 | ) | | $ | (195.6 | ) | | $ | (224.0 | ) | | Other comprehensive income (loss) before reclassifications | (10.6 | ) | | 51.6 |
| | 5.1 |
| | (138.6 | ) | | (92.5 | ) | | Amounts reclassified from accumulated other comprehensive income (loss) | 0.6 |
| | (4.0 | ) | | — |
| | — |
| | (3.4 | ) | | Net current period other comprehensive income (loss) | (10.0 | ) | | 47.6 |
| | 5.1 |
| | (138.6 | ) | | (95.9 | ) | | Balance, December 31, 2016 | $ | (10.8 | ) | | $ | 57.8 |
| | $ | (32.7 | ) | | $ | (334.2 | ) | | $ | (319.9 | ) |
| | | | | | | | | | | | | | | | | | | | | | (In millions) | Unrealized Gains (Losses) on Securities Available for Sale, net of tax | | Unrealized Gains (Losses) on Cash Flow Hedges, net of tax | | Unfunded Status of Postretirement Benefit Plans, net of tax | | Translation Adjustments | | Total | | Balance, December 31, 2014 | $ | (0.4 | ) | | $ | 71.7 |
| | $ | (31.6 | ) | | $ | (99.2 | ) | | $ | (59.5 | ) | | Other comprehensive income (loss) before reclassifications | (1.7 | ) | | 110.8 |
| | (6.2 | ) | | (96.4 | ) | | 6.5 |
| | Amounts reclassified from accumulated other comprehensive income (loss) | 1.3 |
| | (172.3 | ) | | — |
| | — |
| | (171.0 | ) | | Net current period other comprehensive income (loss) | (0.4 | ) | | (61.5 | ) | | (6.2 | ) | | (96.4 | ) | | (164.5 | ) | | Balance, December 31, 2015 | $ | (0.8 | ) | | $ | 10.2 |
| | $ | (37.8 | ) | | $ | (195.6 | ) | | $ | (224.0 | ) |
The following table summarizestables summarize the amounts reclassified from accumulated other comprehensive income:changes in AOCI, net of tax by component: | | | | | | | | | | | | | | | | | | | | | | | | | | | | | | | | | | | December 31, 2023 | | (In millions) | | Unrealized Gains (Losses) on Securities Available for Sale, Net of Tax | | Unrealized Gains (Losses) on Cash Flow Hedges, Net of Tax | | Unrealized Gains (Losses) on Pension Benefit Obligation, Net of Tax | | Currency Translation Adjustments | | Total | | Balance, December 31, 2022 | | $ | (15.7) | | | $ | 15.1 | | | $ | (1.1) | | | $ | (163.2) | | | $ | (164.9) | | | Other comprehensive income (loss) before reclassifications | | 2.3 | | | (26.8) | | | (1.5) | | | 37.1 | | | 11.1 | | | Amounts reclassified from AOCI | | 13.4 | | | (13.3) | | | — | | | — | | | 0.1 | | | Net current period other comprehensive income (loss) | | 15.7 | | | (40.1) | | | (1.5) | | | 37.1 | | | 11.2 | | | Balance, December 31, 2023 | | $ | — | | | $ | (25.0) | | | $ | (2.6) | | | $ | (126.1) | | | $ | (153.7) | |
| | | | | | | | | | | | | | | | | | | | | | | | | | | | | | | | | | | | | | | | | December 31, 2022 | | (In millions) | | Unrealized Gains (Losses) on Securities Available for Sale, Net of Tax | | Unrealized Gains (Losses) on Cash Flow Hedges, Net of Tax | | Gains (Losses) on Net Investment Hedges, Net of Tax(1) | | Unrealized Gains (Losses) on Pension Benefit Obligation, Net of Tax | | Currency Translation Adjustments | | Total | | Balance, December 31, 2021 | | $ | (2.2) | | | $ | 53.8 | | | $ | 25.5 | | | $ | (44.8) | | | $ | (139.0) | | | $ | (106.7) | | | Other comprehensive income (loss) before reclassifications | | (23.5) | | | 137.3 | | | 12.6 | | | 43.7 | | | (83.1) | | | 87.0 | | | Amounts reclassified from AOCI | | 10.0 | | | (176.0) | | | (38.1) | | | — | | | 58.9 | | | (145.2) | | | Net current period other comprehensive income (loss) | | (13.5) | | | (38.7) | | | (25.5) | | | 43.7 | | | (24.2) | | | (58.2) | | | Balance, December 31, 2022 | | $ | (15.7) | | | $ | 15.1 | | | $ | — | | | $ | (1.1) | | | $ | (163.2) | | | $ | (164.9) | |
(1) Beginning in the second quarter of 2022 we no longer held net investment hedges as they were closed with the sale of our 49.9% equity interest in Samsung Bioepis in April 2022. For additional information on the sale of our equity interest in Samsung Bioepis, please read Note 3, Dispositions, to these consolidated financial statements.
| | | | | | | | | | | | | | | | | | | | | | | | | | | | | | | | | | | | | | | | | December 31, 2021 | | (In millions) | | Unrealized Gains (Losses) on Securities Available for Sale, Net of Tax | | Unrealized Gains (Losses) on Cash Flow Hedges, Net of Tax | | Gains (Losses) on Net Investment Hedges, Net of Tax | | Unrealized Gains (Losses) on Pension Benefit Obligation, Net of Tax | | Currency Translation Adjustments | | Total | | Balance, December 31, 2020 | | $ | 1.4 | | | $ | (179.0) | | | $ | (8.5) | | | $ | (66.3) | | | $ | (46.6) | | | $ | (299.0) | | | Other comprehensive income (loss) before reclassifications | | (6.6) | | | 178.2 | | | 33.4 | | | 21.5 | | | (92.4) | | | 134.1 | | | Amounts reclassified from AOCI | | 3.0 | | | 54.6 | | | 0.6 | | | — | | | — | | | 58.2 | | | Net current period other comprehensive income (loss) | | (3.6) | | | 232.8 | | | 34.0 | | | 21.5 | | | (92.4) | | | 192.3 | | | Balance, December 31, 2021 | | $ | (2.2) | | | $ | 53.8 | | | $ | 25.5 | | | $ | (44.8) | | | $ | (139.0) | | | $ | (106.7) | |
| | | | | | | | | | | | | | | (In millions) | Income Statement Location | Amounts Reclassified from Accumulated Other Comprehensive Income | | For the Years Ended December 31, | | 2017 | | 2016 | | 2015 | | Gains (losses) on securities available for sale | Other income (expense) | $ | (19.5 | ) | | $ | (0.9 | ) | | $ | (2.0 | ) | | | Income tax benefit (expense) | 6.8 |
| | 0.3 |
| | 0.7 |
| | | | | | | | | | Gains (losses) on cash flow hedges | Revenues | (32.5 | ) | | 5.3 |
| | 173.2 |
| | | Operating expenses | 0.6 |
| | (1.5 | ) | | — |
| | | Other income (expense) | 0.3 |
| | 0.2 |
| | (0.1 | ) | | | Income tax benefit (expense) | 0.1 |
| | — |
| | (0.8 | ) | | | | | | | | | | Total reclassifications, net of tax | | $ | (44.2 | ) | | $ | 3.4 |
| | $ | 171.0 |
|
BIOGEN INC. AND SUBSIDIARIES NOTES TO CONSOLIDATED FINANCIAL STATEMENTS — (Continued)
The following table summarizes the amounts reclassified from AOCI:
15. | | | | | | | | | | | | | | | | | | | | | | | | | | | | (In millions) | | Amounts Reclassified from AOCI | | Income Statement Location | | For the Years Ended December 31, | | | 2023 | | 2022 | | 2021 | | | Gains (losses) on securities available for sale | | $ | (17.0) | | | $ | (12.6) | | | $ | (3.8) | | | Other (income) expense | | | 3.6 | | | 2.6 | | | 0.8 | | | Income tax (benefit) expense | | | | | | | | | | | Gains (losses) on cash flow hedges | | 11.6 | | | 201.6 | | | (60.0) | | | Revenue | | | 3.7 | | | (5.5) | | | (0.8) | | | Operating expense | | | (0.3) | | | (0.3) | | | 0.2 | | | Other (income) expense | | | (1.7) | | | (19.8) | | | 6.0 | | | Income tax (benefit) expense | | | | | | | | | | Gains (losses) on net investment hedges(1) | | — | | | 38.1 | | | (0.6) | | | Other (income) expense | | | | | | | | | | | Currency translation adjustments | | — | | | (58.9) | | | — | | | Other (income) expense | | | | | | | | | | | Total reclassifications, net of tax | | $ | (0.1) | | | $ | 145.2 | | | $ | (58.2) | | | |
(1) Beginning in the second quarter of 2022 we no longer held net investment hedges as they were closed with the sale of our 49.9% equity interest in Samsung Bioepis in April 2022. For additional information on the sale of our equity interest in Samsung Bioepis, please read Note 3, Dispositions, to these consolidated financial statements. | | | | | | | Note 15: | Earnings per Share |
Basic and diluted shares outstanding used in our earnings per share calculation are calculated as follows: | | | | For the Years Ended December 31, | | | For the Years Ended December 31, | | (In millions) | 2017 | | 2016 | | 2015 | (In millions) | | 2023 | | 2022 | | 2021 | | Numerator: | | | | | | | Net income attributable to Biogen Inc. | $ | 2,539.1 |
| | $ | 3,702.8 |
| | $ | 3,547.0 |
| | Net income attributable to Biogen Inc. | | | Net income attributable to Biogen Inc. | | | Denominator: | | | | | | | Weighted average number of common shares outstanding | 212.6 |
| | 218.4 |
| | 230.7 |
| | Weighted average number of common shares outstanding | | | Weighted average number of common shares outstanding | | | Effect of dilutive securities: | | | | | | | Stock options and employee stock purchase plan | 0.1 |
| | 0.1 |
| | 0.1 |
| | | Time-vested restricted stock units | | | | Time-vested restricted stock units | | | | Time-vested restricted stock units | 0.2 |
| | 0.2 |
| | 0.3 |
| | Market stock units | 0.1 |
| | 0.1 |
| | 0.1 |
| | Performance stock units settled in stock | | | Dilutive potential common shares | 0.4 |
| | 0.4 |
| | 0.5 |
| | Shares used in calculating diluted earnings per share | 213.0 |
| | 218.8 |
| | 231.2 |
|
Amounts excluded from the calculation of net income per diluted share because their effects were anti-dilutive were insignificant. Earnings per share for the years ended December 31, 2017, 20162022 and 20152021, reflects on a weighted average basis, the repurchase of 3.7approximately 3.6 million shares and 6.0 million shares 0.7 million shares and 4.6 million shares, respectively, of our common stock, respectively, under our share repurchase authorizations. The adjustments related to the spin-offprograms. There were no share repurchases of our hemophilia business did not have a material impactcommon stock during the year ended December 31, 2023.For additional information on the potentially dilutive securitiesour share repurchase programs, please read Note 14, Equity, to be considered in the calculationthese consolidated financial statements.
BIOGEN INC. AND SUBSIDIARIES 16. Share-based PaymentsNOTES TO CONSOLIDATED FINANCIAL STATEMENTS — (Continued)
Share-based | | | | | | | Note 16: | Share-Based Payments |
Share-Based Compensation Expense The following table summarizes share-based compensation expense included in our consolidated statements of income: | | | | | | | | | | | | | | | | | | | | | | | | For the Years Ended December 31, | | (In millions) | | 2023 | | 2022 | | 2021 | | Research and development | | $ | 296.7 | | | $ | 98.5 | | | $ | 89.3 | | | Selling, general and administrative | | 371.7 | | | 175.1 | | | 169.5 | | | Subtotal | | 668.4 | | | 273.6 | | | 258.8 | | | Capitalized share-based compensation costs | | (10.2) | | | (9.3) | | | (8.0) | | | Share-based compensation expense included in total cost and expense | | 658.2 | | | 264.3 | | | 250.8 | | | Income tax effect | | (132.6) | | | (49.2) | | | (46.7) | | | Share-based compensation expense included in net income attributable to Biogen Inc. | | $ | 525.6 | | | $ | 215.1 | | | $ | 204.1 | |
| | | | | | | | | | | | | | | For the Years Ended December 31, | | (In millions) | 2017 | | 2016 | | 2015 | | Research and development | $ | 74.0 |
| | $ | 84.5 |
| | $ | 88.6 |
| | Selling, general and administrative | 95.7 |
| | 121.7 |
| | 127.3 |
| | Restructuring charges | — |
| | (1.8 | ) | | (8.6 | ) | | Subtotal | 169.7 |
| | 204.4 |
| | 207.3 |
| | Capitalized share-based compensation costs | (9.6 | ) | | (14.6 | ) | | (11.0 | ) | | Share-based compensation expense included in total cost and expenses | 160.1 |
| | 189.8 |
| | 196.3 |
| | Income tax effect | (42.8 | ) | | (54.0 | ) | | (55.8 | ) | | Share-based compensation expense included in net income attributable to Biogen Inc. | $ | 117.3 |
| | $ | 135.8 |
| | $ | 140.5 |
|
BIOGEN INC. AND SUBSIDIARIES
NOTES TO CONSOLIDATED FINANCIAL STATEMENTS — (Continued)
Reata in September 2023 we recognized Reata equity-based compensation expense, inclusive of employer taxes, of approximately $393.4 million attributable to the post-acquisition service period, of which $196.4 million was recognized as a charge to selling, general and administrative expense with the remaining $197.0 million as a charge to research and development expense within our consolidated statements of income for the year ended December 31, 2023. These amounts were associated with the accelerated vesting of stock options and RSUs previously granted to Reata employees that required no future services to vest. For additional information on our acquisition of Reata, please read Note 2, Acquisitions, to these consolidated financial statements.
The following table summarizes share-based compensation expense associated with each of our share-based compensation programs: | | | | | | | | | | | | | | | | | | | | | | | | For the Years Ended December 31, | | (In millions) | | 2023 | | 2022 | | 2021 | | Market stock units | | $ | 4.9 | | | $ | 13.2 | | | $ | 45.6 | | | Time-vested restricted stock units | | 220.0 | | | 202.3 | | | 159.8 | | | Performance stock units settled in stock | | 35.5 | | | 35.0 | | | 23.9 | | | Performance stock units settled in cash | | 6.8 | | | 10.1 | | | 12.2 | | | Employee stock purchase plan | | 10.5 | | | 12.7 | | | 17.3 | | | Stock options | | 3.7 | | | 0.3 | | | — | | Reata equity awards(1) | | 387.0 | | | — | | | — | | | Subtotal | | 668.4 | | | 273.6 | | | 258.8 | | | Capitalized share-based compensation costs | | (10.2) | | | (9.3) | | | (8.0) | | | Share-based compensation expense included in total cost and expense | | $ | 658.2 | | | $ | 264.3 | | | $ | 250.8 | |
| | | | | | | | | | | | | | | For the Years Ended December 31, | | (In millions) | 2017 | | 2016 | | 2015 | | Market stock units | $ | 22.4 |
| | $ | 38.4 |
| | $ | 38.1 |
| | Time-vested restricted stock units | 107.3 |
| | 120.0 |
| | 119.0 |
| | Cash settled performance units | 18.4 |
| | 16.3 |
| | 22.4 |
| | Performance units | 12.3 |
| | 18.6 |
| | 13.9 |
| | Employee stock purchase plan | 9.3 |
| | 11.1 |
| | 13.9 |
| | Subtotal | 169.7 |
| | 204.4 |
| | 207.3 |
| | Capitalized share-based compensation costs | (9.6 | ) | | (14.6 | ) | | (11.0 | ) | | Share-based compensation expense included in total cost and expenses | $ | 160.1 |
| | $ | 189.8 |
| | $ | 196.3 |
|
(1) Relates to the Reata equity-based compensation expense attributable to the post-acquisition service period, associated with the accelerated vesting of stock options and RSUs previously granted to Reata employees that required no future services to vest. For additional information on our acquisition of Reata, please read Note 2, Acquisitions, to these consolidated financial statements. As of December 31, 2017,2023, unrecognized compensation cost related to unvested share-based compensation was approximately $168.0$287.4 million, net of estimated forfeitures. We expect to recognize the cost of these unvested awards over a weighted-average period of 1.91.8 years. Spin-off Related Equity Adjustments
Pursuant to an employee matters agreement entered into in connection with the spin-off of our hemophilia business and the provisions of our existing share-based compensation arrangements, we made certain adjustments to the number and terms of our outstanding stock options, RSUs, CSPUs and other share-based awards to preserve the intrinsic value of the awards immediately before and after the spin-off. For purposes of the vesting of these equity awards, continued employment or service with Biogen or with Bioverativ was treated as continued employment for purposes of both Biogen’s and Bioverativ’s equity awards with the outstanding awards continuing to vest over their respective original vesting periods. Outstanding unvested awards for employees transferring to Bioverativ were converted to unvested Bioverativ awards.BIOGEN INC. AND SUBSIDIARIES
Adjustments to the number of our share-based compensation awards were made using an adjustment ratio based upon the weighted-average closing price of our common stock for the 10 calendar days prior to the effective date of the spin-off and the volume-weighted average prices for the 10 calendar days of our common stock following the effective date of the spin-off. For stock options, the exercise prices of the awards were modified to maintain the pre-spin intrinsic value of the awards in relation to the post-spin stock price of Biogen. The difference between the fair value of the awards based upon the adjustment ratio and the opening price on the distribution date was not material.NOTES TO CONSOLIDATED FINANCIAL STATEMENTS — (Continued)
Share-Based Compensation Plans We have three share-based compensation plans pursuant to which awards are currently being made: (i) the Biogen Inc. 2006 Non-Employee Directors Equity Plan (2006 Directors Plan); (ii) the Biogen Inc. 2017 Omnibus Equity Plan (2017 Omnibus Equity Plan); and (iii) the Biogen Inc. 2015 Employee Stock Purchase Plan (2015 ESPP). Directors Plan In May 2006 our shareholders approved the 2006 Directors Plan for share-based awards to our directors. Awards granted from the 2006 Directors Plan may include stock options, shares of restricted stock, RSUs, stock appreciation rights and other awards in such amounts and with such terms and conditions as may be determined by a committee of our Board of Directors, subject to the provisions of the plan.2006 Directors Plan. We have reserved a total of 1.6 million shares of common stock for issuance under the 2006 Directors Plan. The 2006 Directors Plan provides that awards other than stock options and stock appreciation rights will be counted against the total number of shares reserved under the plan in a 1.5-to-1 ratio. In June 2015 our shareholders approved an amendment to extend the term of the 2006 Directors Plan until June 2025.
BIOGEN INC. AND SUBSIDIARIES
NOTES TO CONSOLIDATED FINANCIAL STATEMENTS — (Continued)
Omnibus Plan In June 2017 our shareholders approved the 2017 Omnibus Equity Plan for share-based awards to our employees. Awards granted from the 2017 Omnibus Equity Plan may include stock options, shares of restricted stock, RSUs, performance shares, stock appreciation rights and other awards in such amounts and with such terms and conditions as may be determined by a committee of our Board of Directors, subject to the provisions of the plan.2017 Omnibus Equity Plan. Shares of common stock available for grant under the 2017 Omnibus Equity Plan consist of 8.0 million shares reserved for this purpose, plus shares of common stock that remained available for grant under ourthe Biogen Idec Inc. 2008 Omnibus Equity Plan (2008 Omnibus Equity Plan) as of June 7, 2017, or that could again become available for grant if outstanding awards under the 2008 Omnibus Equity Plan as of June 7, 2017, are cancelled, surrendered or terminated in whole or in part. The 2017 Omnibus Equity Plan provides that awards other than stock options and stock appreciation rights will be counted against the total number of shares available under the plan in a 1.5-to-1 ratio. We have not made any awards pursuant to the 2008 Omnibus Equity Plan since our shareholders approved the 2017 Omnibus Equity Plan, and do not intend to make any awards pursuant to the 2008 Omnibus Equity Plan in the future, except that unused shares under the 2008 Omnibus Equity Plan have been carried over for use under the 2017 Omnibus Equity Plan. Stock Options We currently do not grantIn 2022 we granted approximately 81,000 stock options to our employees or directors. OutstandingCEO (2022 CEO Grant) under the 2017 Omnibus Plan with a grant date fair value of $139.10 per option for a total of approximately $11.2 million. The fair value of the stock options previously grantedoption grant is estimated as of the date of grant using a Black-Scholes option valuation model. The estimated fair value of the stock option is then expensed over the options' vesting periods. The 2022 CEO Grant is eligible to our employees and directors generally havevest in equal annual installments over a ten-yearthree-year period from the grant date, subject to the CEO’s continued employment. The outstanding stock option has a 10-year term and vest over a period of between one and four years, provided the individual continues to serve at Biogen through the vesting dates. Options granted under all plans areis exercisable at a price per share not less than the fair market value of the underlying common stock on the date of grant. The estimated fair value of options, including the effect of estimated forfeitures, is recognized over the options’ vesting periods. The fair value of the stock options granted in 2010 was estimated as of the date of grant using a Black-Scholes option valuation model. There were no grants of stock options made in 2017, 2016 and 2015. As of December 31, 2017, all outstanding options were exercisable.
The expected life of options granted is derived using assumed exercise rates based on historical exercise patterns and represents the period of time that options granted are expected to be outstanding. Expected stock price volatility is based upon implied volatility for our exchange-traded options and other factors, including historical volatility. After assessing all available information on either historical volatility, implied volatility or both, we have concluded that a combination of both historical and implied volatility provides the best estimate of expected volatility. The risk-free interest rate used is determined by the market yield curve based upon risk-free interest rates established by the Federal Reserve, or non-coupon bonds that have maturities equal to the expected term. The dividend yield of zero is based upon the fact that we have not historically granted cash dividends, and do not expect to issue dividends in the foreseeable future. Stock options granted prior to January 1, 2006 were valued based on the grant date fair value of those awards, using the Black-Scholes option pricing model, as previously calculated for pro-forma disclosures.
The following table summarizes our stock option activity: | | | | | | | | | | | | | | | | | | | | | | | | | December 31, 2023 | | | Shares | | Weighted Average Exercise Price | | Weighted Average Remaining Contractual Term | | | | Outstanding at December 31, 2022 | | 81,000 | | | $ | 301.85 | | | 9.9 years | | | | Granted | | — | | | — | | | | | | | Exercised | | — | | | — | | | | | | | Forfeited | | — | | | — | | | | | | | Outstanding at December 31, 2023 | | 81,000 | | | $ | 301.85 | | | 8.9 years | | | | Exercisable at December 31, 2023 | | 27,000 | | | $ | 301.85 | | | 8.9 years | | | | | | | | | | | |
| | | | | | | | | | Shares | | Weighted Average Exercise Price | | Outstanding at December 31, 2016 | 66,000 |
| | $ | 54.06 |
| | Hemophilia spin-off adjustment | — |
| | $ | — |
| | Granted | — |
| | $ | — |
| | Exercised | (14,000 | ) | | $ | 50.89 |
| | Cancelled | (10,000 | ) | | $ | 55.11 |
| | Outstanding at December 31, 2017 | 42,000 |
| | $ | 53.83 |
|
The total intrinsic values of options exercised in 2017, 2016 and 2015 totaled $3.4 million, $10.4 million and $38.0 million, respectively. The aggregate intrinsic values of options outstanding as of December 31, 2017 totaled $11.1 million. The weighted average remaining contractual term for options outstanding as of December 31, 2017 was 1.3 years.
BIOGEN INC. AND SUBSIDIARIES NOTES TO CONSOLIDATED FINANCIAL STATEMENTS — (Continued)
The following table summarizes the amount of tax benefit realized for stock options and cash received from the exercise of stock options:
| | | | | | | | | | | | | | | For the Years Ended December 31, | | (In millions) | 2017 | | 2016 | | 2015 | | Tax benefit realized for stock options | $ | 3.4 |
| | $ | 4.0 |
| | $ | 11.9 |
| | Cash received from the exercise of stock options | $ | 0.7 |
| | $ | 2.2 |
| | $ | 6.3 |
|
Market Stock Units (MSUs) MSUs awarded to employees prior to 2014 vested in four equal annual increments beginning on the first anniversary of the grant date. Participants may ultimately earn between 0%zero and 150%150.0% of the target number of units granted based on actual stock performance. MSUs awarded to employees in 2014 and thereafter vest in three equal annual increments beginning on the first anniversary of the grant date, and participants may ultimately earn between 0%zero and 200%200.0% of the target number of units granted based on actual stock performance. The vesting of these awards is subject to the respective employee’s continued employment. The number of MSUs granted represents the target number of units that are eligible to be earned based on the attainment of certain market-based criteria involving our stock price. The number of MSUs earned is calculated at each annual anniversary from the date of grant over the respective vesting periods, resulting in multiple performance periods. Accordingly, additional MSUs may be issued or currently outstanding MSUs may be cancelled upon final determination of the number of awards earned. Compensation expense, including the effect Beginning in 2022 we no longer grant MSUs as part of forfeitures, is recognized over the applicable service period.our long term incentive program and have replaced with granting performance-vested RSUs. MSUs granted in 2021 had a weighted average grant date fair value of $358.77. The following table summarizes our MSU activity: | | | | | | | | | | | | | December 31, 2023 | | Shares | | Weighted Average
Grant Date Fair Value | | Unvested at December 31, 2022 | 113,000 | | | $ | 366.52 | | | Granted | — | | | — | | | Vested | (74,000) | | | 368.87 | | | Forfeited | (5,000) | | | 372.87 | | | Unvested at December 31, 2023 | 34,000 | | | $ | 359.77 | |
| | | | | | | | | | Shares | | Weighted Average Grant Date Fair Value | | Unvested at December 31, 2016 | 230,000 |
| | $ | 355.60 |
| | Hemophilia spin-off adjustment | 4,000 |
| | $ | — |
| | Granted (a) | 94,000 |
| | $ | 382.59 |
| | Vested | (112,000 | ) | | $ | 311.17 |
| | Forfeited | (45,000 | ) | | $ | 372.35 |
| | Unvested at December 31, 2017 | 171,000 |
| | $ | 370.83 |
|
| | (a) | MSUs granted in 2017 include approximately 9,000 MSUs issued in 2017 based upon the attainment of performance criteria set for 2013, in relation to awards granted in that year. MSUs granted during 2017 also include awards granted in conjunction with our annual awards made in February 2017 and MSUs granted in conjunction with the hiring of employees. These grants reflect the target number of shares eligible to be earned at the time of grant. MSUs granted in 2017 reflect an adjustment based upon the final performance multiplier in relation to shares granted in 2016, 2015 and 2014.
|
We value grants of MSUs using a lattice model with a Monte Carlo simulation. This valuation methodology utilizes several key assumptions, including the 60 calendar day average closing stock price on grant date for MSUs awarded prior to 2014, the 30 calendar day average closing stock price on the date of grant for MSUs, awarded in 2014 and thereafter, expected volatility of our stock price, risk-free rates of return and expected dividend yield. The assumptions used in our valuation are summarized as follows: | | | | | | | | | For the Years Ended December 31, | | | 2017 | | 2016 | | 2015 | | Expected dividend yield | —% | | —% | | —% | | Range of expected stock price volatility | 33.0% - 35.6% | | 38.2% - 40.7% | | 31.0% - 33.2% | | Range of risk-free interest rates | 0.9% - 1.6% | | 0.6% - 0.9% | | 0.2% - 1.0% | | 30 calendar day average stock price on grant date | $263.18 - $267.88 | | $260.67 - $304.86 | | $277.35 - $426.27 | | Weighted-average per share grant date fair value | $382.59 | | $328.03 | | $493.43 |
BIOGEN INC. AND SUBSIDIARIES
NOTES TO CONSOLIDATED FINANCIAL STATEMENTS — (Continued)
| | | | | | | | | | | | | | | December 31, 2021 | | Expected dividend yield | | | | —% | | Range of expected stock price volatility | | | | 54.8% - 61.6% | | Range of risk-free interest rates | | | | 0.06% - 0.21% | | 30 calendar day average stock price on grant date | | | | $262.23 - $360.31 | | Weighted-average per share grant date fair value | | | | $358.77 |
The fair values of MSUs vested in 2017, 20162023, 2022 and 20152021 totaled $31.4$20.7 million, $39.3$18.8 million and $109.0$22.5 million, respectively. CashPerformance Stock Units
PSUs Settled Performance Units (CSPUs)in Stock CSPUsDuring the first quarter of 2018 we began granting awards for performance-vested RSUs that will settle in stock. PSUs awarded to employees have a three-year performance period and vest in three equal annual increments beginning on the firstthird anniversary of the grant date. The vesting of these awards is subject to the respective employee’s continued employment with such awards settled in cash.employment. The number of CSPUsPSUs granted represents the target number of units that are eligible to be earned based on the attainmentachievement of certaincumulative three-year performance measures established at the beginning of the performance period, which ends on December 31 of each year. the third year of the performance period.
Participants may ultimately earn between 0%zero and 200%200.0% of the target number of unitsPSUs granted based on the degree of actualachievement of the applicable performance metric achievement.metric. Accordingly, additional CSPUsPSUs may be issued or currently outstanding CSPUsPSUs may be cancelled upon final determination of the number of units earned. CSPUs awarded prior to 2014 are
BIOGEN INC. AND SUBSIDIARIES NOTES TO CONSOLIDATED FINANCIAL STATEMENTS — (Continued) Beginning in 2022 we no longer grant MSUs as part of long term incentive program and have replaced with granting PSUs with a performance metric based on a three-year cumulative relative total shareholder return (rTSR) metric. The PSUs will vest on the third anniversary of the date of grant, with the number of PSUs earned based on this cumulative rTSR metric. The following table summarizes our PSUs that settle in stock activity: | | | | | | | | | | | | | December 31, 2023 | | Shares | | Weighted Average
Grant Date Fair Value | | Unvested at December 31, 2022 | 336,000 | | | $ | 292.95 | | Granted (1) | 206,000 | | | 383.61 | | | Vested | (100,000) | | | 290.72 | | | Forfeited | (53,000) | | | 323.52 | | | Unvested at December 31, 2023 | 389,000 | | | $ | 325.73 | |
(1) PSUs settled in cash based onstock granted in 2023 include awards granted in conjunction with our annual awards made in February 2023 and PSUs granted in conjunction with the 60hiring of employees. These grants reflect the target number of shares eligible to be earned at the time of grant. PSUs settled in stock granted in 2022 and 2021 had weighted average grant date fair values of $294.43 and $276.61, respectively. We value grants of PSUs using a lattice model with a Monte Carlo simulation. This valuation methodology utilizes several key assumptions, the 30 calendar day average closing stock price through eachon the date of grant for PSUs, expected volatility of our stock price, risk-free rates of return and expected dividend yield. The assumptions used in our valuation are summarized as follows: | | | | | | | | | | | | | | | | | | | | For the Years Ended December 31, | | | | 2023 | | 2022 | | | | Expected dividend yield | | —% | | —% | | | | Range of expected stock price volatility | | 44.7% | | 44.0% - 45.9% | | | | Range of risk-free interest rates | | 4.1% | | 1.8% - 3.9% | | | | 30 calendar day average stock price on grant date | | $283.93 | | $231.31 - $294.86 | | | | Weighted-average per share grant date fair value | | $383.61 | | $294.43 | | |
The fair values of PSUs settled in stock that vested in 2023, 2022 and 2021 totaled $28.6 million, $9.5 million and $15.5 million, respectively. PSUs Settled in Cash During the first quarter of 2018 we began granting awards for performance-vested restricted stock units that will settle in cash. PSUs awarded to employees have three performance periods and vest on the third anniversary of the grant date. The vesting date onceof these awards is subject to the actual vested and earnedrespective employee’s continued employment. The number of PSUs granted represents the target number of units is known. CSPUs awarded in 2014that are eligible to be earned based on the achievement of three annual performance measures established when the performance objectives are defined, which will be at the beginning of each year and thereafterwill end on December 31 of such year. Participants may ultimately earn between zero and 200.0% of the target number of PSUs granted based on the degree of achievement of the applicable performance metric. Accordingly, additional PSUs may be issued or currently outstanding PSUs may be cancelled upon final determination of the number of units earned. PSUs are classified as liability awards and will be settled in cash based on the 30 calendar day average closing stock price through eachthe vesting date, once the actual vested and earned number of unitsPSUs is known.determined. Since no shares are issued, these awards do not dilute equity. Compensation expense, including the effect Beginning in 2022 we no longer grant this type of forfeitures, is recognized over the applicable service period. The following table summarizes our CSPU activity:
| | | | | Shares | Unvested at December 31, 2016 | 122,000 |
| Hemophilia spin-off adjustment | 3,000 |
| Granted (a) | 83,000 |
| Vested | (69,000 | ) | Forfeited | (34,000 | ) | Unvested at December 31, 2017 | 105,000 |
|
| | (a) | CSPUs granted in 2017 include awards granted in conjunction with our annual awards made in February 2017 and CSPUs granted in conjunction with the hiring of employees. These grants reflect the target number of shares eligible to be earned at the time of grant. CSPUs granted in 2017 also include CSPUs issued in 2017 based upon the attainment of performance criteria set for 2016 in relation to shares granted in 2016. |
The cash paid in settlement of CSPUs vested in 2017, 2016 and 2015 totaled $16.6 million, $31.9 million and $79.8 million, respectively.
Performance-vested Restricted Stock Units (PUs)
PUs are granted to certain employees in the form of RSUs that may be settled in cash or sharesPSUs as part of our common stock at the sole discretion of the Compensationlong term incentive program and Management Development Committee of our Board of Directors. These awards are structured and accounted for the same way as the CSPUs, and vest in three equal annual increments beginning on the first anniversary of the grant date. The number of PUs granted represents the target number of units that are eligible to be earned based on the attainment of certain performance measures established at the beginning of the performance period, which ends on December 31 of each year. Participants may ultimately earn between 0% and 200% of the target number of units granted based on the degree of actual performance metric achievement. Accordingly, additional PUs may be issued or currently outstanding PUs may be cancelled upon final determination of the number of units earned. PUs settling in cash are based on the 30 calendar day average closing stock price through each vesting date once the actual vested and earned number of units is known. Compensation expense, including the effect of forfeitures, is recognized over the applicable service period.
have replaced with granting time-vested RSUs.
BIOGEN INC. AND SUBSIDIARIES NOTES TO CONSOLIDATED FINANCIAL STATEMENTS — (Continued)
The following table summarizes our PUPSUs that settle in cash activity: | | | | | | | December 31, 2023 | | | Shares | | Shares | Unvested at December 31, 20162022 | 110,00083,000 | |
Hemophilia spin-off adjustmentGranted(1) | 3,0005,000 | |
Granted (a)Vested | 40,000(41,000) | |
VestedForfeited | (43,000(6,000) | | ) Forfeited | (19,000 | ) | Unvested at December 31, 20172023 | 91,00041,000 | |
| | | | | | | | | | (a) | PUs granted in 2017 include awards granted in conjunction with our annual awards made in February 2017 and PUs granted in conjunction with the hiring of employees. These grants reflect the target number of shares eligible to be earned at the time of grant. |
During 2015 32,000 PUs were converted(1) PSUs settled in cash granted in 2023 represent the adjustment recorded to share settlements,reflect the total number of which approximately 11,000 shares were vested and issued. All other PUsunits earned based on the finalization of the related performance multiplier for awards previously granted in 2020.
The fair values of PSUs settled in cash that vested in 2015 were settled in cash totaling $12.4 million. All PUs that vested in 20172023, 2022 and 2016 were settled in cash totaling $11.52021 totaled $11.7 million, $11.0 million and $8.1$9.9 million, respectively.
Time-Vested Restricted Stock Units (RSUs) RSUs awarded to employees generally vest no sooner than one-third per year over three years on the anniversary of the date of grant, or upon the third anniversary of the date of the grant, provided the employee remains continuously employed with us, except as otherwise provided in the plan. Shares of our common stock will be delivered to the employee upon vesting, subject to payment of applicable withholding taxes. RSUs awarded to directors for service on our Board of Directors vest on the first anniversary of the date of grant, provided in each case that the director continues to serve on our Board of Directors through the vesting date. Shares of our common stock will be delivered to the director upon vesting and are not subject to any withholding taxes. The fair value of all RSUs is based on the market value of our stock on the date of grant. Compensation expense, including the effect of forfeitures, is recognized over the applicable service period. The following table summarizes our RSU activity: | | | | | | | | | | | | | Shares | | Weighted Average
Grant Date Fair Value | | Unvested at December 31, 2022 | 1,946,000 | | | $ | 237.90 | | Granted (1) | 1,171,000 | | | 282.92 | | | Vested | (822,000) | | | 249.12 | | | Forfeited | (439,000) | | | 257.66 | | | Unvested at December 31, 2023 | 1,856,000 | | | $ | 256.74 | |
| | | | | | | | | | Shares | | Weighted Average Grant Date Fair Value | | Unvested at December 31, 2016 | 888,000 |
| | $ | 303.49 |
| | Hemophilia spin-off adjustment | 12,000 |
| | $ | — |
| | Granted (a) | 464,000 |
| | $ | 293.41 |
| | Vested | (350,000 | ) | | $ | 308.04 |
| | Forfeited | (182,000 | ) | | $ | 292.57 |
| | Unvested at December 31, 2017 | 832,000 |
| | $ | 291.85 |
|
| | | | | | | | | | (a) | RSUs granted in 2017 primarily represent RSUs granted in conjunction with our annual awards made in February 2017 and awards made in conjunction with the hiring of new employees. RSUs granted in 2017 also include approximately 11,000 RSUs granted to our Board of Directors.
|
(1) RSUs granted in 2023 primarily represent RSUs granted in conjunction with our annual awards made in February 2023 and awards made in conjunction with the hiring of new employees. RSUs granted in 2023 also include approximately 7,300 RSUs granted to our Board of Directors. RSUs granted in 20162022 and 20152021 had weighted average grant date fair values of $268.52$221.28 and $388.88,$276.90, respectively. The fair values of RSUs vested in 2017, 20162023, 2022 and 20152021 totaled $100.0$232.1 million, $104.6$116.3 million and $239.7$132.2 million, respectively.
BIOGEN INC. AND SUBSIDIARIES
NOTES TO CONSOLIDATED FINANCIAL STATEMENTS — (Continued)
Employee Stock Purchase Plan (ESPP) In June 2015 our shareholders approved the 2015 ESPP. The 2015 ESPP, which became effective on July 1, 2015, replaced the Biogen Idec Inc. 1995 ESPP (1995 ESPP), which expired on June 30, 2015. The maximum aggregate number of shares of our common stock that may be purchased under the 2015 ESPP is 6.2 million. The following table summarizes our ESPP activity: | | | | | | | | | | | | | | | | | | | | | | | | For the Years Ended December 31, | | (In millions, except share amounts) | | 2023 | | 2022 | | 2021 | | Shares issued under the 2015 ESPP | | 199,000 | | | 241,000 | | | 248,000 | | | Cash received under the 2015 ESPP | | $ | 45.1 | | | $ | 44.2 | | | $ | 54.4 | |
| | | | | | | | | | | | | | | For the Years Ended December 31, | | (In millions, except share amounts) | 2017 | | 2016 | | 2015 | | Shares issued under the 2015 ESPP | 167,000 |
| | 190,000 |
| | 78,000 |
| | Shares issued under the 1995 ESPP | — |
| | — |
| | 98,000 |
| | Cash received under the 2015 ESPP | $ | 39.8 |
| | $ | 41.5 |
| | $ | 19.3 |
| | Cash received under the 1995 ESPP | $ | — |
| | $ | — |
| | $ | 30.0 |
|
17. Income Taxes
Income Tax Expense
Income before income tax provision and the income tax expense consist of the following:
| | | | | | | | | | | | | | | For the Years Ended December 31, | | (In millions) | 2017 | | 2016 | | 2015 | | Income before income taxes (benefit): | | | | | | | Domestic | $ | 3,540.4 |
| | $ | 3,655.4 |
| | $ | 3,386.7 |
| | Foreign | 1,588.4 |
| | 1,277.6 |
| | 1,380.6 |
| | Total | $ | 5,128.8 |
| | $ | 4,933.0 |
| | $ | 4,767.3 |
| | Income tax expense (benefit): | | | | | | | Current: | | | | | | | Federal | $ | 2,201.4 |
| | $ | 1,304.3 |
| | $ | 1,214.1 |
| | State | 57.0 |
| | 55.1 |
| | 38.6 |
| | Foreign | 108.6 |
| | 52.9 |
| | 54.5 |
| | Total | 2,367.0 |
| | 1,412.3 |
| | 1,307.2 |
| | Deferred: | | | | | | | Federal | $ | 241.0 |
| | $ | (125.6 | ) | | $ | (129.6 | ) | | State | 9.9 |
| | (3.8 | ) | | (1.9 | ) | | Foreign | (159.2 | ) | | (45.6 | ) | | (14.1 | ) | | Total | 91.7 |
| | (175.0 | ) | | (145.6 | ) | | Total income tax expense | $ | 2,458.7 |
| | $ | 1,237.3 |
| | $ | 1,161.6 |
|
Tax Reform
The 2017 Tax Act, which was signed into law on December 22, 2017, has resulted in significant changes to the U.S. corporate income tax system. These changes include a federal statutory rate reduction from 35% to 21%, the elimination or reduction of certain domestic deductions and credits and limitations on the deductibility of interest expense and executive compensation. The 2017 Tax Act also transitions international taxation from a worldwide system to a modified territorial system and includes base erosion prevention measures on non-U.S. earnings, which has the effect of subjecting certain earnings of our foreign subsidiaries to U.S. taxation as global intangible low-taxed income (GILTI). These changes are effective beginning in 2018.
The 2017 Tax Act also includes a one-time mandatory deemed repatriation tax on accumulated foreign subsidiaries' previously untaxed foreign earnings (the Transition Toll Tax).
Changes in tax rates and tax laws are accounted for in the period of enactment. Therefore, during the year ended December 31, 2017, we recorded a charge totaling $1,173.6 million related to our current estimate of the provisions of the 2017 Tax Act.
BIOGEN INC. AND SUBSIDIARIES NOTES TO CONSOLIDATED FINANCIAL STATEMENTS — (Continued) Income Tax Expense Income before income tax (benefit) expense and the income tax (benefit) expense consist of the following: | | | | | | | | | | | | | | | | | | | | | | | | For the Years Ended December 31, | | (In millions) | | 2023 | | 2022 | | 2021 | | Income before income tax (benefit) expense: | | | | | | | | Domestic | | $ | 192.4 | | | $ | 1,842.0 | | | $ | 448.3 | | | Foreign | | 1,104.4 | | | 1,749.8 | | | 1,296.9 | | | Total income before income tax (benefit) expense | | $ | 1,296.8 | | | $ | 3,591.8 | | | $ | 1,745.2 | | | Income tax (benefit) expense: | | | | | | | | Current: | | | | | | | | Federal | | $ | 377.6 | | | $ | 694.5 | | | $ | 319.1 | | | State | | 15.1 | | | 39.0 | | | 23.1 | | | Foreign | | 48.4 | | | 67.9 | | | 137.1 | | | Total current | | 441.1 | | | 801.4 | | | 479.3 | | | Deferred: | | | | | | | | Federal | | (587.4) | | | (328.3) | | | (242.5) | | | State | | (12.7) | | | 2.5 | | | (11.9) | | | Foreign | | 294.3 | | | 157.2 | | | (172.4) | | | Total deferred | | (305.8) | | | (168.6) | | | (426.8) | | | Total income tax (benefit) expense | | $ | 135.3 | | | $ | 632.8 | | | $ | 52.5 | |
Transition Toll Tax The Tax Cuts and Jobs Act of 2017 Tax Act eliminateseliminated the deferral of U.S. income tax on the historical unrepatriated earnings by imposing the Transition Toll Tax, which is a one-time mandatory deemed repatriation tax on undistributedaccumulated foreign subsidiaries' previously untaxed foreign earnings. The Transition Toll Tax iswas assessed on the U.S. shareholder'sour share of theour foreign corporation'scorporations' accumulated foreign earnings that havewere not previously been taxed. Earnings in the form of cash and cash equivalents will bewere taxed at a rate of 15.5% and all other earnings will bewere taxed at a rate of 8.0%. As of December 31, 2017,2023 and 2022, we have accrued income tax liabilities of $989.6$419.5 million and $558.0 million, respectively, under the Transition Toll Tax,Tax. Of the amounts accrued as of which $78.3December 31, 2023, approximately $185.4 million is expected to be paid within one year. The Transition Toll Tax will beis being paid in installments over an eight-yeareight--year period, startingwhich started in 2018, and will not accrue interest. Unremitted Earnings At December 31, 2017,2023, we considered none of our earnings not to be permanently reinvested outside the U.S. and have therefore recorded deferred tax liabilities associated with an estimate of the total withholding taxes that may beexpected as a result of our repatriation of earnings. Effect on Deferred Tax Assets and Liabilities and Other than for earnings, we are permanently reinvested for book/tax basis differences of approximately $1.5 billion as of December 31, 2023, primarily arising through the impacts of purchase accounting. These permanently reinvested basis differences could reverse through sales of the foreign subsidiaries, as well as various other Adjustments
Our deferred tax assets and liabilities are measured at the enacted tax rate expected to apply when these temporary differences are expected to be realized or settled.
As our deferred tax assets exceed the balanceevents, none of our deferred tax liabilities at the datewhich were considered probable as of enactment, we have recorded a tax expense of $184.0 million, reflecting the decrease in the U.S. corporate income tax rate and other changes toDecember 31, 2023. The residual U.S. tax law. It is our current policy to not recognize deferred taxes for basisliability, if these differences expected to reverse, would be between $300.0 million and $400.0 million as GILTI is incurred and instead to account for any taxes assessed as period costs.
Status of our Assessment
Our preliminary estimate of the Transition Toll Tax and the remeasurement of our deferred tax assets and liabilities is subject to the finalization of management’s analysis related to certain matters, such as developing interpretations of the provisions of the 2017 Tax Act, changes to certain estimates and amounts related to the earnings and profits of certain subsidiaries and the filing of our tax returns. U.S. Treasury regulations, administrative interpretations or court decisions interpreting the 2017 Tax Act may require further adjustments and changes in our estimates.
The final determination of the Transition Toll Tax and the remeasurement of our deferred assets and liabilities will be completed as additional information becomes available, but no later than one year from the enactment of the 2017 Tax Act.
Article 20 Procedure of ZINBRYTA
As a result of the Article 20 Procedure of ZINBRYTA, we have recognized a net impairment charge on certain tax assets reflected within income tax expense of $48.8 million. This charge reflects the write off of $142.6 million related to prepaid taxes, which was partially offset by the recognition of an unrecorded deferred tax benefit of $93.8 million. For additional information on the Article 20 Procedure of ZINBRYTA and resulting impairment of ZINBRYTA related assets, please read Note 20, Collaborative and Other Relationships, to these consolidated financial statements.
December 31, 2023.
BIOGEN INC. AND SUBSIDIARIES NOTES TO CONSOLIDATED FINANCIAL STATEMENTS — (Continued)
Deferred Tax Assets and Liabilities Significant components of our deferred tax assets and liabilities are summarized as follows: | | | | | | | | | | | | | | | | | | As of December 31, | | (In millions) | | 2023 | | 2022 | | Deferred tax assets: | | | | | | Tax credits | | $ | 252.8 | | | $ | 112.6 | | | Inventory, other reserves and accruals | | 203.7 | | | 202.8 | | | Intangibles, net | | 1,153.9 | | | 1,370.3 | | | Neurimmune's tax basis in ADUHELM | | — | | | 470.3 | | | IRC Section 174 capitalized research and development | | 570.8 | | | 271.8 | | | Net operating loss | | 1,700.4 | | | 1,845.9 | | | Share-based compensation | | 36.1 | | | 37.2 | | | Other | | 293.3 | | | 280.7 | | | Valuation allowance | | (1,278.7) | | | (2,003.3) | | | Total deferred tax assets | | $ | 2,932.3 | | | $ | 2,588.3 | | | Deferred tax liabilities: | | | | | | Purchased inventory valuation step-up and intangible assets | | $ | (1,257.4) | | | $ | (76.1) | | | Samsung Bioepis investment installments | | (35.5) | | | (138.0) | | | GILTI | | (1,136.9) | | | (1,002.0) | | | Tax credits | | — | | | (228.7) | | | Depreciation, amortization and other | | (215.7) | | | (251.8) | | | Total deferred tax liabilities | | $ | (2,645.5) | | | $ | (1,696.6) | |
| | | | | | | | | | | As of December 31, | | (In millions) | 2017 | | 2016 | | Deferred tax assets: | | | | | Tax credits | $ | 60.0 |
| | $ | 201.1 |
| | Inventory, other reserves and accruals | 147.8 |
| | 250.6 |
| | Intangibles, net | 378.8 |
| | 459.8 |
| | Net operating loss | 209.8 |
| | 65.9 |
| | Share-based compensation | 26.9 |
| | 61.5 |
| | Other | 25.1 |
| | 49.0 |
| | Valuation allowance | (16.6 | ) | | (16.1 | ) | | Total deferred tax assets | $ | 831.8 |
| | $ | 1,071.8 |
| | Deferred tax liabilities: | | | | | Purchased intangible assets | $ | (250.7 | ) | | $ | (376.6 | ) | | Depreciation, amortization and other | (107.9 | ) | | (113.5 | ) | | Total deferred tax liabilities | $ | (358.6 | ) | | $ | (490.1 | ) |
In addition to deferred tax assets and liabilities, we have recorded prepaid tax and deferred charges related to intercompany transactions.intra-entity sales of inventory. As of December 31, 20172023 and 2016,2022, the total deferred charges and prepaid taxes were $617.7$69.3 million and $989.8$56.6 million, respectively. Inflation Reduction Act In October 2016August 2022 the FASB issued ASU No. 2016-16, Income Taxes (Topic 740): Intra-Entity Transfer of Assets Other Than Inventory. ThisIRA was signed into law in the U.S. The IRA introduced new standard eliminates the deferraltax provisions, including a 15.0% corporate alternative minimum tax and a 1.0% excise tax on stock repurchases. The provisions of the tax effects of intra-entity asset transfers other than inventory. As aIRA are effective for periods after December 31, 2022. The IRA did not result thein any material adjustments to our income tax consequences fromprovision or income tax balances as of December 31, 2023 and 2022. Preliminary guidance has been issued by the intra-entity transfer of an asset other than inventoryIRS and associated changeswe expect additional guidance and regulations to deferred taxes will be recognized when the transfer occurs. This new standard becomes effective for us on January 1, 2018.issued in future periods. We will adopt this standard using the modified retrospective method, through a cumulative-effect adjustment directlycontinue to retained earningsassess its potential impact on our business and results of operations as further information becomes available.
BIOGEN INC. AND SUBSIDIARIES NOTES TO CONSOLIDATED FINANCIAL STATEMENTS — (Continued) Tax Rate A reconciliation between the U.S. federal statutory tax rate and our effective tax rate is summarized as follows: | | | | | | | | | | | | | | | | | | | | | | | | For the Years Ended December 31, | | | | 2023 | | 2022 | | 2021 | | Statutory rate | | 21.0 | % | | 21.0 | % | | 21.0 | % | | State taxes | | 1.1 | | | 1.1 | | | 0.8 | | | Taxes on foreign earnings | | (5.9) | | | (4.9) | | | (10.5) | | | Tax credits | | (7.3) | | | (1.7) | | | (3.8) | | | Purchased inventory valuation step-up and intangible assets | | 0.7 | | | 0.3 | | | (1.6) | | | | | | | | | | GILTI | | (0.6) | | | 0.7 | | | 1.3 | | | Sale of Samsung Bioepis | | — | | | (1.6) | | | — | | | Litigation settlement agreement | | — | | | 2.6 | | | — | | | | | | | | | | Neurimmune tax impacts | | — | | | 2.3 | | | (5.3) | | | Internal reorganization | | (0.1) | | | (1.4) | | | — | | | Other, including permanent items | | 1.5 | | | (0.8) | | | 1.1 | | | Effective tax rate | | 10.4 | % | | 17.6 | % | | 3.0 | % |
| | | | | | | | | | | | For the Years Ended December 31, | | | 2017 | | 2016 | | 2015 | | Statutory rate | 35.0 | % | | 35.0 | % | | 35.0 | % | | State taxes | 0.8 |
| | 0.9 |
| | 0.5 |
| | Taxes on foreign earnings | (11.1 | ) | | (9.6 | ) | | (10.0 | ) | | Credits and net operating loss utilization | (0.8 | ) | | (1.4 | ) | | (1.3 | ) | | Purchased intangible assets | 1.4 |
| | 1.2 |
| | 1.0 |
| | Manufacturing deduction | (1.9 | ) | | (1.9 | ) | | (1.8 | ) | | 2017 Tax Act | 22.9 |
| | — |
| | — |
| | Impairment of ZINBRYTA related tax assets | 0.9 |
| | — |
| | — |
| | Other permanent items | 0.7 |
| | 0.5 |
| | 0.7 |
| | Other | — |
| | 0.4 |
| | 0.3 |
| | Effective tax rate | 47.9 | % | | 25.1 | % | | 24.4 | % |
For the year ended December 31, 2023, compared to 2022, the decrease in our effective tax rate was driven by the impact of the non-cash changes in the value of our equity investments, the impact of Fit for Growth related expenses and Reata acquisition-related expenses, as well as the combined net unfavorable tax rate impacts in 2022 related to a litigation settlement agreement, the sale of our equity interest in Samsung Bioepis, the impact of a Neurimmune valuation allowance, as discussed below, and an international reorganization to align with global tax developments. The change also benefits from the resolution of an uncertain tax matter during the first quarter of 2023 related to tax credits.
For the year ended December 31, 2022, compared to 2021, the increase in our effective tax rate, excluding the impact of the net Neurimmune deferred tax asset, as discussed below, includes the tax impacts of the litigation settlement agreement and the sale of our building at 125 Broadway. These increases were partially offset by the impact of the current year tax benefits related to an international reorganization to align with global tax developments, the impacts of the sale of our equity interest in Samsung Bioepis and the tax impacts of the decision to discontinue development of vixotrigine. Further in 2021, our effective tax rate benefited from the tax effects of the BIIB111 and BIIB112 impairment charges and the non-cash tax effects of changes in the value of our equity instruments. For additional information on our acquisition of Reata, please read Note 2, Acquisitions, to these consolidated financial statements. For additional information on the litigation settlement agreement, please read Note 18, Other Consolidated Financial Statement Detail, to these consolidated financial statements. Neurimmune Deferred Tax Asset During 2021 we recorded a net deferred tax asset in Switzerland of approximately $100.0 million on Neurimmune's tax basis in ADUHELM, the realization of which was dependent on future sales of ADUHELM. During the first quarter of 2022, upon issuance of the final NCD related to ADUHELM, we recorded an increase in a valuation allowance of approximately $85.0 million to reduce the net value of this deferred tax asset to zero. These adjustments to our net deferred tax asset were each recorded with an equal and offsetting amount assigned to net income (loss) attributable to noncontrolling interests, net of tax in our consolidated statements of income, resulting in a zero net impact to net income attributable to Biogen Inc.
BIOGEN INC. AND SUBSIDIARIES NOTES TO CONSOLIDATED FINANCIAL STATEMENTS — (Continued)
ChangesDuring the fourth quarter of 2023 Neurimmune was deconsolidated from our consolidated financial statements. For additional information on the deconsolidation and our collaboration arrangement with Neurimmune, please read Note 20, Investments in Tax Rate
The most significant factors contributingVariable Interest Entities, to the increase in our effective tax rate for the year ended December 31, 2017, as compared to 2016 is the effect of the enactment of the 2017 Tax Act and the impairment of certain ZINBRYTA related tax assets, both of which are discussed above. Excluding the effect of these items, our income tax rate would have decreased due to a lower percentage of our earnings being recognized in the U.S., a higher tax jurisdiction. The geographic split of our earnings was affected by milestone and upfront payments in the current year and the spin-off of our hemophilia business, partially offset by growth from the U.S. launch of SPINRAZA and increases in our revenues from anti-CD20 therapeutic programs in the U.S. In addition, in 2017 we earned a lower benefit from the orphan drug credit due to the FDA's approval of SPINRAZA.consolidated financial statements.
Our effective tax rate for 2016 compared to 2015 increased primarily due to a net state tax benefit in 2015 resulting from the remeasurement of one of our uncertain tax positions, described below, and a higher relative percentage of our earnings being attributed to the U.S., a higher tax jurisdiction.
Tax Attributes As of December 31, 2017,2023, we had net operating losses and general business credit carry forwards for U.S. federal income tax purposes of approximately $1.4 million and $1.3 million, respectively, which begin to expire in 2020. Additionally, for state income tax purposes, we had net operating loss carry forwards of approximately $19.3$141.8 million that begin to expire in 2018.2030 and net operating losses of approximately $913.1 million that do not expire. For U.S. state income tax purposes, we also had research and investment credit carry forwards of approximately $129.7$140.5 million that begin to expire in 2018.2027 and net operating losses of approximately $21.0 million that begin to expire in 2036. For foreign income tax purposes, we had $2.1$13.0 billion of federal net operating loss carryforwards that begin to expire in 2021.2027 and $12.2 billion of Swiss cantonal net operating loss carryforwards that begin to expire in 2027. In assessing the realizability of our deferred tax assets, we have considered whether it is more likely than not that some portion or all of the deferred tax assets will not be realized. The ultimate realization of deferred tax assets is dependent upon the generation of future taxable income during the periods in which those temporary differences become deductible. In making this determination, under the applicable financial reporting standards, we are allowed to consider the scheduled reversal of deferred tax liabilities, projected future taxable income and tax planning strategies. Our estimates of future taxable income take into consideration, among other items, our estimates of future income tax deductions related to the exercise of stock options. Based upon the level of historical taxable income and income tax liability and projections for future taxable income over the periods in which the deferred tax assets are utilizable, we believe it is more likely than not that we will realize the net benefits of the deferred tax assets of our wholly owned subsidiaries.subsidiaries, net of the recorded valuation allowance. In the event that actual results differ from our estimates or we adjust our estimates in future periods, we may need to adjust or establish a valuation allowance, which could materially impact our consolidated financial position and results of operations. Accounting for Uncertainty in Income Taxes A reconciliation of the beginning and ending amount of our unrecognized tax benefits is summarized as follows: | | | | | | | | | | | | | | | | | | | | | | | | | (In millions) | | 2023 | | 2022 | | 2021 | | Beginning balance | | $ | 606.4 | | | $ | 563.4 | | | $ | 75.7 | | | Additions based on tax positions related to the current period | | 5.2 | | | 36.3 | | | 4.2 | | | Additions for tax positions of prior periods | | 60.2 | | | 23.4 | | | 509.9 | | | Reductions for tax positions of prior periods | | (485.0) | | | (14.9) | | | (18.8) | | | Statute expirations | | (2.1) | | | (1.6) | | | (3.2) | | | Settlement refund (payment) | | (11.3) | | | (0.2) | | | (4.4) | | | Ending balance | | $ | 173.4 | | | $ | 606.4 | | | $ | 563.4 | |
| | | | | | | | | | | | | | (In millions) | 2017 | | 2016 | | 2015 | | Balance at January 1, | $ | 32.4 |
| | $ | 67.9 |
| | $ | 131.5 |
| | Additions based on tax positions related to the current period | 5.7 |
| | 7.2 |
| | 10.5 |
| | Additions for tax positions of prior periods | 7.3 |
| | 36.3 |
| | 19.5 |
| | Reductions for tax positions of prior periods | (21.8 | ) | | (13.3 | ) | | (49.9 | ) | | Statute expirations | (1.4 | ) | | (1.4 | ) | | (1.2 | ) | | Settlement refund (payment) | 44.6 |
| | (64.3 | ) | | (42.5 | ) | | Balance at December 31, | $ | 66.8 |
| | $ | 32.4 |
| | $ | 67.9 |
|
Our 2017 activity above reflects a refund received from a state,During the year ended December 31, 2021, we increased our gross unrecognized tax benefits by approximately $455.0 million, related to a deferred tax asset for Swiss tax purposes for Neurimmune's tax basis in ADUHELM. This unrecognized tax benefit was recorded as a reduction to the settlementgross deferred tax asset, resulting in the net deferred tax asset, as discussed above, and not as a separate liability on our consolidated balance sheets. As of an uncertainDecember 31, 2022, the unrecognized tax position.benefits related to Neurimmune was approximately $450.0 million. During the year ended December 31, 2023, we decreased our gross unrecognized tax benefits by approximately $450.0 million related to this item as a result of the deconsolidation of Neurimmune.
We and our subsidiaries are routinely examined by various taxing authorities. We file income tax returns in various U.S. states and in U.S. federal and other foreign jurisdictions. With few exceptions, we are no longer subject to U.S. federal tax examination for years before 20132019 or state, local or non-U.S. income tax examinations for years before 2010.2013.
BIOGEN INC. AND SUBSIDIARIES
NOTES TO CONSOLIDATED FINANCIAL STATEMENTS — (Continued)
Included in the balance of unrecognized tax benefits as of December 31, 2017, 2016 and 2015 are $64.3 million, $26.9 million and $15.7 million (net of the federal benefit on state issues), respectively, of unrecognized tax benefits that, if recognized, would affect the effective income tax rate in future periods.
We recognize potential interest and penalties accrued related to unrecognized tax benefits in income tax expense. In 2017 we recognized a net interest expense of $4.8 million. In 2016 we recognized net interest expense of $9.1 million. In 2015 we recognized a net interest expense of approximately $3.1 million. We have accrued approximately $16.1 million and $25.2 million for the payment of interest and penalties as of December 31, 2017 and 2016, respectively.
International Uncertain Tax Positions
We have made payments totaling approximately $60.0 million to the Danish Tax Authority (SKAT) for assessments received for fiscal 2009, 2011 and 2013 regarding withholding taxes and the treatment of certain intercompany transactions involving a Danish affiliate and another of our affiliates. We continue to dispute the assessments for all of these periods and believe that the positions taken in our historical filings are valid.
It is reasonably possible that we will adjust the value of our uncertain tax positions related to Danish withholding taxes based on potential European court decisions expected in 2018 on similar matters.
Federal and State Uncertain Tax Positions
It is reasonably possible that we will adjust the value of our uncertain tax positions related to our revenues from anti-CD20 therapeutic programs and certain transfer pricing issues as we receive additional information from various taxing authorities, including reaching settlements with the authorities. In addition, theThe U.S. Internal Revenue Service and other national tax authorities routinely examine our intercompany transfer pricing with respect to intellectual property related transactions and it is possible that they may disagree with one or more positions we have taken with respect to such valuations.
Included in the balance of unrecognized tax benefits as of December 31, 2023, 2022 and 2021, are $147.6 million, $134.0 million and $87.5 million (net of the federal benefit on state issues), respectively, of unrecognized tax benefits that, if recognized, would affect the effective income tax rate in future periods.
BIOGEN INC. AND SUBSIDIARIES NOTES TO CONSOLIDATED FINANCIAL STATEMENTS — (Continued) We recognize potential interest and penalties related to unrecognized tax benefits in income tax expense. During the years ended December 31, 2023, 2022 and 2021, we recognized total interest and penalty expense of $5.1 million, $0.7 million and $2.7 million, respectively. We have accrued $30.2 million and $25.2 million for the payment of interest and penalties as of December 31, 2023 and 2022, respectively. It is reasonably possible that we will adjust the value of our uncertain tax positions related to certain transfer pricing, collaboration matters, withholding taxes and other issues as we receive additional information from various taxing authorities, including reaching settlements with such authorities. We estimate that it is reasonably possible that our gross unrecognized tax benefits, exclusive of interest, could decrease by up to approximately $20.0 million in the next 12 months as a result of various audit closures, settlements and expiration of the statute of limitations. | | | | | | | Note 18: | Other Consolidated Financial Statement Detail |
Supplemental Cash Flow Information Supplemental disclosure of cash flow information for the years ended December 31, 2017, 20162023, 2022 and 2015,2021, is as follows: | | | | | | | | | | | | | | | | | | | | | | | | For the Years Ended December 31, | | (In millions) | | 2023 | | 2022 | | 2021 | | Cash paid during the year for: | | | | | | | | Interest | | $ | 252.2 | | | $ | 262.5 | | | $ | 280.8 | | | Income taxes | | 740.7 | | | 932.9 | | | 247.9 | |
| | | | | | | | | | | | | | | For the Years Ended December 31, | | (In millions) | 2017 | | 2016 | | 2015 | | Cash paid during the year for: | | | | | | | Interest | $ | 281.7 |
| | $ | 281.2 |
| | $ | 39.1 |
| | Income taxes | $ | 1,066.4 |
| | $ | 1,642.2 |
| | $ | 1,674.8 |
|
Non-cash Operating, Investing and Financing ActivityComponents of other (income) expense, net, are summarized as follows:
In | | | | | | | | | | | | | | | | | | | | | | | | For the Years Ended December 31, | | (In millions) | | 2023 | | 2022 | | 2021 | Gain on sale of equity interest in Samsung Bioepis(1) | | $ | — | | | $ | (1,505.4) | | | $ | — | | | Litigation settlement agreement and settlement fees | | — | | | 917.0 | | | — | | | Interest income | | (276.5) | | | (89.3) | | | (11.0) | | | Interest expense | | 246.9 | | | 246.6 | | | 253.6 | | | (Gains) losses on investments, net | | 291.2 | | | 277.3 | | | 824.9 | | | Foreign exchange (gains) losses, net | | 50.4 | | | 35.5 | | | 22.4 | | | Other, net | | 3.5 | | | 10.1 | | | 5.6 | | | Total other (income) expense, net | | $ | 315.5 | | | $ | (108.2) | | | $ | 1,095.5 | |
(1) Reflects the fourth quarter of 2017 we accrued $600.0 million upon reaching $15.0 billion and $16.0 billion in total cumulative sales of FUMADERM and TECFIDERA (together, the Fumapharm Products). The amount,pre-tax gain, net of tax benefit, was accounted for as an increasetransaction costs, recognized from the sale of our 49.9% equity interest in Samsung Bioepis to goodwillSamsung BioLogics in accordance with the accounting standard applicable to business combinations when we acquired Fumapharm, and is expected to be paid in the first quarter of 2018.April 2022. For additional information on this transaction,the sale of our equity interest in Samsung Bioepis, please read Note 22, Commitments and Contingencies,3, Dispositions, to these consolidated financial statements. In connection withThe (gains) losses on investments, net, as reflected in the constructiontable above, relate to debt securities, equity securities of our large-scale biologics manufacturing facilitycertain biotechnology companies, venture capital funds where the underlying investments are in Solothurn, Switzerland,equity securities of certain biotechnology companies and non-marketable equity securities.
During the second quarter of 2022 we accrued chargesrecorded a pre-tax charge of $900.0 million, plus settlement fees and expenses, related to processing equipment and engineering services of approximately $150.0 million and $100.0 milliona litigation settlement agreement to resolve a qui tam litigation relating to conduct prior to 2015. This charge is included within other (income) expense, net in our consolidated balance sheets asstatements of income for the year ended December 31, 2017 and 2016, respectively. For additional information on this matter, please read Note 11, Property, Plant and Equipment, to these consolidated financial statements. In December 2016 we accrued $454.8 million related to the settlement and license agreement with Forward Pharma. For additional information on this transaction, please read Note 7, Intangible Assets and Goodwill, to these consolidated financial statements.
2022.
BIOGEN INC. AND SUBSIDIARIES NOTES TO CONSOLIDATED FINANCIAL STATEMENTS — (Continued)
The following table summarizes our (gains) losses on investments, net that relates to our equity securities held as of December 31, 2023, 2022 and 2021:
In February 2015 upon completion of our acquisition of Convergence, we recorded a contingent consideration obligation of $274.5 million as part of the purchase price. For additional information on this transaction, please read Note 2, Acquisitions, to these consolidated financial statements. | | | | | | | | | | | | | | | | | | | | | | | | For the Years Ended December 31, | | (In millions) | | 2023 | | 2022 | | 2021 | | Net (gains) losses recognized on equity securities | | $ | 275.2 | | | $ | 264.7 | | | $ | 821.1 | | | Less: Net (gains) losses realized on equity securities | | 5.2 | | | — | | | (10.3) | | | Net unrealized (gains) losses recognized on equity securities | | $ | 270.0 | | | $ | 264.7 | | | $ | 831.4 | |
Other Income (Expense), Net
Components of other income (expense),The net are summarized as follows:
| | | | | | | | | | | | | | | For the Years Ended December 31, | | (In millions) | 2017 | | 2016 | | 2015 | | Interest income | $ | 78.5 |
| | $ | 63.4 |
| | $ | 22.1 |
| | Interest expense | (250.8 | ) | | (260.0 | ) | | (95.5 | ) | | Gain (loss) on investments, net | (36.3 | ) | | 6.0 |
| | (3.8 | ) | | Foreign exchange gains (losses), net | 6.3 |
| | (9.8 | ) | | (32.7 | ) | | Other, net | (13.1 | ) | | (17.0 | ) | | (13.8 | ) | | Total other income (expense), net | $ | (215.4 | ) | | $ | (217.4 | ) | | $ | (123.7 | ) |
Interest expense forunrealized losses recognized during the year ended December 31, 2017, includes2023, primarily reflect a $5.2 million charge recognizeddecrease in November 2017 upon the redemptionaggregate fair value of our 6.875% Senior Notes due March 1, 2018. For additional information on the redemptioninvestments in Sage, Denali, Sangamo and Ionis common stock of these notes, please read Note 12, Indebtedness, to these consolidated financial statements.approximately $248.5 million.
Gain (loss) on investments,The net forunrealized losses recognized during the year ended December 31, 2017, includes other than temporary impairments recorded on strategic2022, primarily reflect a decrease in the aggregate fair value of our investments in Denali and marketable debt securities duringSangamo common stock of approximately $278.0 million, partially offset by an increase in the year.
Other Current Assets
Other current assets include prepaid taxes totalingfair value of Ionis and Sage common stock of approximately $657.6 million and $817.0 million as of December 31, 2017 and 2016, respectively.
As a result of the Article 20 Procedure of ZINBRYTA, we impaired prepaid tax balances totaling $142.6$27.3 million. For additional information on the Article 20 Procedure of ZINBRYTA and resulting impairment of ZINBRYTA related assets, please read Note 20, Collaborative and Other Relationships, to these consolidated financial statements.
Accrued ExpensesExpense and Other Accrued expensesexpense and other consists of the following: | | | | | | | | | | | | | | | | | | As of December 31, | | (In millions) | | 2023 | | 2022 | | | | | | | Revenue-related reserves for discounts and allowances | | $ | 926.5 | | | $ | 891.6 | | | Employee compensation and benefits | | 335.1 | | | 395.6 | | | Collaboration expense | | 214.6 | | | 277.9 | | | Royalties and licensing fees | | 191.5 | | | 209.4 | | | | | | | | | | | | | | | | | | Reata acquisition-related accrued expense | | 117.5 | | | — | | | Other | | 838.4 | | | 746.9 | | | Total accrued expense and other | | $ | 2,623.6 | | | $ | 2,521.4 | |
Other long-term liabilities were $781.1 million and $944.2 million as of December 31, 2023 and 2022, respectively, and included accrued income taxes totaling $403.2 million and $541.7 million, respectively. | | | | | | | | | | | As of December 31, | | (In millions) | 2017 | | 2016 | | Current portion of contingent consideration obligations | $ | 844.6 |
| | $ | 580.8 |
| | Revenue-related reserves for discounts and allowances | 572.0 |
| | 438.6 |
| | Employee compensation and benefits | 297.7 |
| | 282.9 |
| | Royalties and licensing fees | 206.7 |
| | 195.8 |
| | Collaboration expenses | 183.7 |
| | 130.9 |
| | Construction in progress | 159.7 |
| | 134.0 |
| | Accrued TECFIDERA litigation settlement charge | — |
| | 454.8 |
| | Other | 636.9 |
| | 685.7 |
| | Total accrued expenses and other | $ | 2,901.3 |
| | $ | 2,903.5 |
|
Pricing of TYSABRI in Italy - AIFA | | | | | | | Note 19: | Collaborative and Other Relationships |
In connection with our business strategy, we have entered into various collaboration agreements that provide us with rights to develop, produce and market products using certain know-how, technology and patent rights maintained by our collaborative partners. Terms of the fourthvarious collaboration agreements may require us to make milestone payments upon the achievement of certain product research and development objectives and pay royalties on future sales, if any, of commercial products resulting from the collaboration. Depending on the collaborative arrangement, we may record funding receivable or payable balances with our collaboration partners, based on the nature of the cost-sharing mechanism and activity within the collaboration. Our significant collaborative arrangements are discussed below. Genentech, Inc. (Roche Group) We have certain business and financial rights with respect to RITUXAN for the treatment of non-Hodgkin's lymphoma, CLL and other conditions; RITUXAN HYCELA for the treatment of non-Hodgkin's lymphoma and CLL; GAZYVA for the treatment of CLL and follicular lymphoma; OCREVUS for the treatment of PPMS and RMS; LUNSUMIO for the treatment of relapsed or refractory follicular lymphoma; COLUMVI, a bispecific antibody for the treatment of non-Hodgkin's lymphoma, which was granted accelerated approval by the FDA during the second quarter of 2011 Biogen Italia SRL, our Italian subsidiary, received a notice from2023; and have the Italian National Medicines Agency (Agenzia Italiana del Farmaco or AIFA) that sales of TYSABRI after mid-February 2009 through mid-February 2011 exceeded by EUR30.7 million a reimbursement limit establishedoption to add other potential anti-CD20 therapies, pursuant to our collaboration arrangements with Genentech, a Price Determination Resolution granted by AIFA in December 2006. In January 2012wholly-owned member of the Roche Group. For purposes of this footnote, we filed an appeal against AIFA in administrative court in Rome, Italy seeking a ruling that the reimbursement limit in the Price Determination Resolution should applyrefer to RITUXAN and RITUXAN HYCELA collectively as written to only “the first 24 months” of TYSABRI sales, which ended in mid-February 2009. Since being notified in the fourth quarter of 2011 that AIFA believed a reimbursement limit was still in effect, we deferred revenue on sales of TYSABRI as if the reimbursement limit were in effect for each biannual period
RITUXAN.
BIOGEN INC. AND SUBSIDIARIES NOTES TO CONSOLIDATED FINANCIAL STATEMENTS — (Continued)
If we undergo a change in control, as defined in our collaboration agreement, Genentech has the right to present an offer to buy the rights to RITUXAN and we must either accept Genentech’s offer or purchase Genentech’s rights on the same terms as its offer. Genentech will also be deemed concurrently to have purchased our rights to the remaining products in the collaboration on the terms set forth below.
Our collaboration with Genentech was created through a contractual arrangement and not through a joint venture or other legal entity. RITUXAN Genentech and its affiliates are responsible for the worldwide manufacture of RITUXAN as well as all development and commercialization activities as follows: •U.S.:We have co-exclusively licensed our rights to develop, commercialize and market RITUXAN in the U.S. •Canada:We have co-exclusively licensed our rights to develop, commercialize and market RITUXAN in Canada. GAZYVA The Roche Group and its sub-licensees maintain sole responsibility for the development, manufacture and commercialization of GAZYVA in the U.S. The level of gross sales of GAZYVA in the U.S. has impacted our percentage of the co-promotion profits for RITUXAN and LUNSUMIO, as summarized in the table below. If we undergo a change in control, as defined in our collaboration agreement, Genentech will be deemed to have purchased our rights to GAZYVA in exchange for the continued payment of the current compensation payable for GAZYVA under the collaboration arrangement until the 11 year anniversary of the first commercial sale of GAZYVA in the U.S. OCREVUS Pursuant to the terms of our collaboration arrangements with Genentech, we receive a tiered royalty on U.S. net sales from 13.5% and increasing up to 24.0% if annual net sales exceed $900.0 million. There will be a 50.0% reduction to these royalties if a biosimilar to OCREVUS is approved in the U.S. In addition, we receive a gross 3.0% royalty on net sales of OCREVUS outside the U.S., with the royalty period lasting 11 years from the first commercial sale of OCREVUS on a country-by-country basis. The commercialization of OCREVUS does not impact the percentage of the co-promotion profits we receive for RITUXAN, LUNSUMIO or GAZYVA. Genentech is solely responsible for development and commercialization of OCREVUS and funding future costs. Genentech cannot develop OCREVUS in CLL, non-Hodgkin's lymphoma or rheumatoid arthritis. OCREVUS royalty revenue is based on our estimates from third party and market research data of OCREVUS sales occurring during the corresponding period. Differences between actual and estimated royalty revenue will be adjusted for in the period in which they become known, which is generally expected to be the following quarter. If we undergo a change in control, as defined in our collaboration agreement, Genentech will be deemed to have purchased our rights to OCREVUS in exchange for the continued payment of the current royalties on net sales (as defined in our collaboration agreement and summarized above) in the U.S. only, until the 11 year anniversary of the first commercial sale of OCREVUS in the U.S.
BIOGEN INC. AND SUBSIDIARIES NOTES TO CONSOLIDATED FINANCIAL STATEMENTS — (Continued) LUNSUMIO (mosunetuzumab) In January 2022 we exercised our option with Genentech to participate in the joint development and commercialization of LUNSUMIO. In connection with this exercise, we recorded a $30.0 million option exercise fee payable to Genentech in December 2021, which was recognized in research and development expense in our consolidated statements of income for the year ended December 31, 2021. We also recorded a charge of approximately $20.0 million to reimburse Genentech for our 30.0% share of the costs incurred in developing this product candidate during 2021, which was recognized in research and development expense in our consolidated statements of income for the year ended December 31, 2021. For the year ended December 31, 2022, we recorded approximately $28.4 million in research and development expense and approximately $13.0 million in sales and marketing expense in our consolidated statements of income related to this collaboration. For the year ended December 31, 2023, we began to record our share of LUNSUMIO development and sales and marketing expense as a reduction of our share of pre-tax profits in revenue from anti-CD20 therapeutic programs within our consolidated statements of income. Under our collaboration with Genentech, we were responsible for 30.0% of development costs for LUNSUMIO prior to FDA approval and will be entitled to a tiered share of co-promotion operating profits and losses in the U.S., as summarized in the table below. In addition, we receive low single-digit royalties on sales of LUNSUMIO outside the U.S. In December 2022 LUNSUMIO was granted accelerated approval by the FDA for the treatment of relapsed or refractory follicular lymphoma. If we undergo a change in control, as defined in our collaboration agreement, Genentech will be deemed to have purchased our rights to LUNSUMIO in exchange for 30.0% of the U.S. co-promotion operating profits or losses until the 11 year anniversary of the first commercial sale of LUNSUMIO in the U.S. COLUMVI (glofitamab) In December 2022 we entered into an agreement with Genentech related to the commercialization and sharing of economics for COLUMVI, a bispecific antibody for the treatment of B-cell non-Hodgkin's lymphoma, which was subsequently granted accelerated approval by the FDA in June 2023. Under the terms of this agreement, we will have no payment obligations. Genentech will have sole decision-making rights on the commercialization of COLUMVI within the U.S. and we will receive tiered royalties in the mid-single digit range on net sales of COLUMVI in the U.S. The commercialization of COLUMVI does not impact the percentage of the co-promotion profits we receive for RITUXAN, LUNSUMIO or GAZYVA. If we undergo a change in control, as defined in our collaboration agreement, Genentech will be deemed to have purchased our rights to COLUMVI in exchange for a mid-single digit royalty on net sales (as defined in our collaboration agreement) in the U.S. only, until the 11 year anniversary of the first commercial sale of the product in the U.S. Profit-sharing Formulas RITUXAN and LUNSUMIO Profit Share Our current pretax co-promotion profit-sharing formula for RITUXAN and LUNSUMIO in the U.S. provides for a 30.0% share on the first $50.0 million of combined co-promotion operating profits earned each calendar year. As a result of the FDA approval of LUNSUMIO our share of the combined annual co-promotion profits for RITUXAN and LUNSUMIO in excess of $50.0 million varies upon the following events, as summarized in the table below: | | | | | | | | | | | After LUNSUMIO Approval until the First Threshold Date | 37.5 | % | | After First Threshold Date until the Second Threshold Date | 35.0 | % | | After Second Threshold Date | 30.0 | % |
First Threshold Date means the earlier of (i) the first day of the calendar quarter following the date U.S. gross sales of GAZYVA within any consecutive 12-month period have reached $500.0 million or (ii) the first date in any calendar year in which U.S. gross sales of LUNSUMIO have reached $150.0 million. Second Threshold Date means the later of (i) the first date the gross sales in any calendar year in which U.S. gross sales of LUNSUMIO reach $350.0 million or (ii) January 1 of the calendar year following the calendar year in which the First Threshold Date occurs.
BIOGEN INC. AND SUBSIDIARIES NOTES TO CONSOLIDATED FINANCIAL STATEMENTS — (Continued) In March 2023 the First Threshold Date was achieved. As a result, beginning in mid-February 2009.April 2023 the pre-tax profit share for RITUXAN and LUNSUMIO was 35.0%. Our share of RITUXAN pre-tax profits in the U.S. in excess of $50.0 million for the years ended December 31, 2022 and 2021, was 37.5%. GAZYVA Profit Share Our current pretax profit-sharing formula for GAZYVA provides for a 35.0% share on the first $50.0 million of operating profits earned each calendar year. Our share of annual co-promotion profits in excess of $50.0 million varies upon the following events, as summarized in the table below: | | | | | | | | | Until Second GAZYVA Threshold Date | 37.5 | % | | After Second GAZYVA Threshold Date | 35.0 | % | | |
Second GAZYVA Threshold Date means the first day of the calendar quarter following the date U.S. gross sales of GAZYVA within any consecutive 12-month period have reached $500.0 million. The Second GAZYVA Threshold Date can be achieved regardless of whether GAZYVA has been approved in a non-CLL indication. In March 2023 the Second GAZYVA Threshold Date was achieved. As a result, beginning in April 2023 the pre-tax profit share for GAZYVA was 35.0%. Our share of GAZYVA pre-tax profits in excess of $50.0 million for the years ended December 31, 2022 and 2021, was 37.5%. Revenue from Anti-CD20 Therapeutic Programs Revenue from anti-CD20 therapeutic programs is summarized as follows: | | | | | | | | | | | | | | | | | | | | | | | | For the Years Ended December 31, | | (In millions) | | 2023 | | 2022 | | 2021 | | Royalty revenue on sales of OCREVUS | | $ | 1,266.2 | | | $ | 1,136.3 | | | $ | 991.7 | | Biogen's share of pre-tax profits in the U.S. for RITUXAN, GAZYVA and LUNSUMIO(1) | | 409.4 | | | 547.0 | | | 647.7 | | | Other revenue from anti-CD20 therapeutic programs | | 14.0 | | | 17.2 | | | 19.1 | | | Total revenue from anti-CD20 therapeutic programs | | $ | 1,689.6 | | | $ | 1,700.5 | | | $ | 1,658.5 | |
(1) LUNSUMIO became commercially available in the U.S. during the first quarter of 2023. Prior to regulatory approval, we record our share of the expense incurred by the collaboration for the development of anti-CD20 products in research and development expense and pre-commercialization costs within selling, general and administrative expense in our consolidated statements of income. After an anti-CD20 product is approved, we record our share of the development and sales and marketing expense related to that product as a reduction of our share of pre-tax profits in revenue from anti-CD20 therapeutic programs. Ionis Pharmaceuticals, Inc. SPINRAZA In January 2012 we entered into a collaboration and license agreement with Ionis pursuant to which we have an exclusive, worldwide license to develop and commercialize SPINRAZA for the treatment of SMA. Under our agreement with Ionis, we make royalty payments to Ionis on annual worldwide net sales of SPINRAZA using a tiered royalty rate between 11.0% and 15.0%, which are recognized in cost of sales within our consolidated statements of income. Royalty cost of sales related to sales of SPINRAZA for the years ended December 31, 2023, 2022 and 2021, totaled approximately $240.2 million, $243.1 million and $267.1 million, respectively. 2018 Ionis Agreement In June 2018 we entered into a 10-year exclusive collaboration agreement with Ionis to develop novel ASO drug candidates for a broad range of neurological diseases for a total payment of $1.0 billion, consisting of an upfront payment of $375.0 million and the purchase of approximately 11.5 million shares of Ionis common stock at a cost of $625.0 million. Upon closing, we recorded $50.9 million of the $375.0 million upfront payment as prepaid services in our consolidated balance sheets and recognized the remaining $324.1 million as research and development expense in
BIOGEN INC. AND SUBSIDIARIES NOTES TO CONSOLIDATED FINANCIAL STATEMENTS — (Continued) our consolidated statements of income. The amount recorded as prepaid services represented the value of the employee resources committed to the arrangement to provide research and discovery services over the term of the agreement. We have the option to license therapies arising out of this agreement and will be responsible for the development and commercialization of such therapies. We may pay development milestones to Ionis of up to $125.0 million or $270.0 million for each program, depending on the indication plus an annual license fee, as well as royalties on potential net commercial sales. During the years ended December 31, 2023, 2022 and 2021, we incurred milestones of $7.5 million, $10.0 million and $22.5 million, respectively, related to the advancement of neurological targets identified under this agreement, which were recorded as research and development expense in our consolidated statements of income. 2017 SMA Collaboration Agreement In December 2017 we entered into a collaboration agreement with Ionis to identify new ASO drug candidates for the potential treatment of SMA. Under this agreement, we have the option to license therapies arising out of this collaboration and will be responsible for their development and commercialization of such therapies. Upon entering into this agreement, we made a $25.0 million upfront payment to Ionis and we may pay Ionis up to $260.0 million in additional development and regulatory milestone payments if new drug candidates advance to marketing approval. Upon commercialization, we may also pay Ionis up to $800.0 million in additional performance-based milestone payments and tiered royalties on potential net sales of such therapies. In December 2021 we exercised our option with Ionis and obtained a worldwide, exclusive, royalty-bearing license to develop and commercialize BIIB115, an investigational ASO in development for SMA. In connection with this option exercise, we made an opt-in payment of $60.0 million to Ionis, which was recorded as research and development expense in our consolidated statements of income for the year ended December 31, 2021. 2013 Long-term Strategic Research Agreement In September 2013 we entered into a six-year research collaboration agreement with Ionis under which both companies collaborate to perform discovery level research and subsequent development and commercialization activities of antisense or other therapeutics for the potential treatment of neurological diseases. Under this agreement, Ionis performs research on a set of neurological targets identified within the agreement. Ionis is eligible to receive milestone payments, license fees and royalty payments for all product candidates developed through this collaboration, with the specific amount dependent upon the modality of the product candidate advanced by us under the terms of the agreement. For non-ALS antisense product candidates, Ionis is responsible for global development through the completion of a Phase 2 trial and we provide advice on the clinical trial design and regulatory strategy. For ALS antisense product candidates, we are responsible for global development, clinical trial design and regulatory strategy. We have an option to license a product candidate until completion of the Phase 2 trial. If we exercise our option, we will pay Ionis up to a $70.0 million license fee and assume global development, regulatory and commercialization responsibilities. Ionis could receive additional milestone payments upon the achievement of certain regulatory milestones of up to $130.0 million, plus additional amounts related to the cost of clinical trials conducted by Ionis under the collaboration, and royalties on future sales if we successfully develop the product candidate after option exercise. In December 2018 we exercised our option with Ionis and obtained a worldwide, exclusive, royalty-bearing license to develop and commercialize QALSODY (tofersen), for the treatment of ALS with SOD1 mutations. Following the option exercise, we are solely responsible for the costs and expense related to the development, manufacturing and commercialization of QALSODY. We may pay post-licensing milestone payments to Ionis of up to $55.0 million based on the successful achievement of certain regulatory and commercial milestones. In April 2023 the FDA approved QALSODY for the treatment of ALS in adults who have a mutation in the SOD1 gene. This indication is approved under accelerated approval based on reduction in plasma neurofilament light chain observed in patients treated with QALSODY. Continued approval for this indication may be contingent upon verification of clinical benefit in confirmatory trial(s). Under this agreement, we make royalty payments to Ionis on annual worldwide net sales of QALSODY using a tiered royalty rate between 11.0% and 15.0%, which are recognized in cost of sales within our consolidated statements of income.
BIOGEN INC. AND SUBSIDIARIES NOTES TO CONSOLIDATED FINANCIAL STATEMENTS — (Continued) During the year ended December 31, 2023, we incurred a milestone payment of $16.0 million to Ionis following the FDA's approval of QALSODY, which was recorded within intangible assets, net in our consolidated balance sheets. We may pay Ionis an additional milestone of $20.0 million if QALSODY receives regulatory approval in the E.U. During the years ending December 31, 2022 and 2021, we incurred milestones of $17.0 million and $10.0 million, respectively, related to the advancement of programs under this agreement, which were recorded as research and development expense in our consolidated statements of income. 2012 Ionis Agreement In December 2012 we entered into an agreement with Ionis for the development and commercialization of up to three gene targets. Under this agreement, Ionis is responsible for global development of any product candidatethrough the completion of a Phase 2 trial and we will provide advice on the clinical trial design and regulatory strategy. We have an option to license the product candidateuntil completion of the Phase 2 trial. If we exercise our option, we will pay a license fee of up to $70.0 million to Ionis and assume global development, regulatory and commercialization responsibilities. Ionis is eligible to receive up to $130.0 million in additional milestone payments upon the achievement of certain regulatory milestones as well as royalties on future salesif we successfully develop the product candidate after option exercise. In December 2019 we exercised our option with Ionis and obtained a worldwide, exclusive, royalty-bearing license to develop and commercialize BIIB080 (tau ASO), which is currently in Phase 2 development for the potential treatment of Alzheimer's disease. In connection with the option exercise, we made a payment of $45.0 million to Ionis, which was recorded as research and development expense in our consolidated statements of income. Future payments may include additional milestone payments of up to $155.0 million and royalties on future sales in the low- to mid-teens if we successfully develop the product candidate after option exercise. During the year ended December 31, 2022, we incurred a milestone payment of $10.0 million, related to the advancement of BIIB080 under this agreement, which was recorded within research and development expense in our consolidated statements of income. Eisai Co., Ltd. During the first quarter of 2023 we accrued a $31.0 million payable to Eisai related to the termination of an agreement whereby Eisai co-promoted or distributed our MS products in certain Asia-Pacific markets and settings. As of December 31, 2023, we paid approximately $16.0 million of the $31.0 million payable. The remaining portion was subsequently paid in January 2024. This termination fee is included in selling, general and administrative expense in our consolidated statements of income for the year ended December 31, 2023. LEQEMBI (lecanemab) Collaboration We have a collaboration agreement with Eisai to jointly develop and commercialize LEQEMBI (lecanemab), an anti-amyloid antibody for the treatment of Alzheimer's disease (the LEQEMBI Collaboration). Eisai serves as the lead of LEQEMBI development and regulatory submissions globally with both companies co-commercializing and co-promoting the product, and Eisai having final decision-making authority. All costs, including research, development, sales and marketing expense, are shared equally between us and Eisai. We and Eisai co-promote LEQEMBI and share profits and losses equally. We currently manufacture LEQEMBI drug substance and drug product and in March 2022 we extended our supply agreement with Eisai related to LEQEMBI from five years to ten years for the manufacture of LEQEMBI drug substance. The LEQEMBI Collaboration also provided Eisai with an option to jointly develop and commercialize ADUHELM (aducanumab) (ADUHELM Option), and an option to jointly develop and commercialize one of our anti-tau monoclonal antibodies (Anti-Tau Option). In October 2017 Eisai exercised its ADUHELM Option and we entered into a new collaboration agreement for the joint development and commercialization of ADUHELM (aducanumab) (the ADUHELM Collaboration Agreement).
BIOGEN INC. AND SUBSIDIARIES NOTES TO CONSOLIDATED FINANCIAL STATEMENTS — (Continued) On March 14, 2022, we amended our ADUHELM Collaboration Agreement with Eisai. As of the amendment date, we have sole decision making and commercialization rights worldwide on ADUHELM, and beginning January 1, 2023, Eisai receives only a tiered royalty based on net sales of ADUHELM, and no longer participates in sharing ADUHELM's global profits and losses. In March 2022 we also amended the LEQEMBI Collaboration Agreement with Eisai to eliminate the Anti-Tau Option. If either company undergoes a change of control, as defined in our LEQEMBI Collaboration Agreement, the non-acquired party may elect to initiate an operational separation, as defined in the LEQEMBI Collaboration Agreement. In the event of an operational separation, we would work with Eisai to effect a timely transition of any development, manufacturing or commercial responsibilities regarding LEQEMBI from us to Eisai. In this scenario, as of six months following the change of control, our ongoing responsibility for LEQEMBI related cost-sharing would be reduced to an amount equal to 80.0% of what we would have owed prior to the operational separation, and all other economic rights would remain unchanged. In addition, in the event either company undergoes a change of control in which the acquirer is engaged in commercialization of a competing product, as defined in the LEQEMBI Collaboration Agreement, the non-acquired party may also request that the acquired party cease commercializing the competing product. Should the acquired party elect to continue commercializing the competing product, the non-acquired party may terminate the LEQEMBI Collaboration Agreement. Furthermore, in the event we are the non-acquired party, we may choose either to sell our interest in LEQEMBI to Eisai or purchase Eisai's interest in LEQEMBI, subject to the parameters set forth in the LEQEMBI Collaboration Agreement. In July 20132023 the FDA granted traditional approval of LEQEMBI. Prior to receiving traditional approval, LEQEMBI had been granted accelerated approval by the FDA in January 2023, at which time it became commercially available in the U.S. Additionally, in September 2023 the Japanese Ministry of Health, Labor and Welfare approved LEQEMBI in Japan, which was subsequently launched in Japan in December 2023. Upon commercialization of LEQEMBI, we negotiatedbegan recognizing our 50.0% share of LEQEMBI product revenue, net and cost of sales, including royalties, within other revenue in our consolidated statements of income, as we are not the principal. Our share of LEQEMBI sales and marketing expense and development expense are recorded within selling, general and administrative expense and research and development expense, respectively, within our consolidated statements of income. A summary of development and sales and marketing expense related to the LEQEMBI Collaboration is as follows: | | | | | | | | | | | | | | | | | | | | | | | | For the Years Ended December 31, | | (In millions) | | 2023 | | 2022 | | 2021 | | Total development expense incurred by the collaboration related to the advancement of LEQEMBI | | $ | 371.9 | | | $ | 347.2 | | | $ | 323.0 | | | Biogen's share of the LEQEMBI Collaboration development expense reflected in research and development expense in our consolidated statements of income | | 186.0 | | | 173.6 | | | 161.5 | | | Total sales and marketing expense incurred by the LEQEMBI Collaboration | | 304.4 | | | 104.6 | | | 27.2 | | | Biogen's share of the LEQEMBI Collaboration sales and marketing expense reflected in selling, general and administrative expense in our consolidated statements of income | | 152.2 | | | 52.3 | | | 13.6 | |
ADUHELM Collaboration Agreement The LEQEMBI Collaboration also provided Eisai with an option to jointly develop and commercialize ADUHELM (aducanumab) (ADUHELM Option). In October 2017 Eisai exercised its ADUHELM Option and we entered into a new collaboration agreement for the joint development and commercialization of ADUHELM (the ADUHELM Collaboration Agreement). Under our initial ADUHELM Collaboration Agreement, we would lead the ongoing development of ADUHELM, and we and Eisai would co-promote ADUHELM with a region-based profit split. Beginning in principle2019, Eisai was reimbursing us for 45.0% of development and sales and marketing expense incurred by the collaboration for the advancement of ADUHELM.
BIOGEN INC. AND SUBSIDIARIES NOTES TO CONSOLIDATED FINANCIAL STATEMENTS — (Continued) In March 2022 we amended our ADUHELM Collaboration Agreement with AIFA's PriceEisai. As of the amendment date, we have sole decision making and Reimbursement Committee that wouldcommercialization rights worldwide on ADUHELM, and beginning January 1, 2023, Eisai receives only a tiered royalty based on net sales of ADUHELM, and no longer participates in sharing ADUHELM's global profits and losses. Eisai's share of development, commercialization and manufacturing expense was limited to $335.0 million for the period from January 1, 2022 to December 31, 2022, which was achieved as of December 31, 2022. Once this limit was achieved, we became responsible for all ADUHELM related costs. A summary of development expense, sales and marketing expense and milestone payments related to our initial ADUHELM Collaboration Agreement is as follows: | | | | | | | | | | | | | | | | | | | | | For the Year Ended December 31, | | (In millions) | | | | 2022 | | 2021 | | Total ADUHELM Collaboration development expense | | | | $ | 149.4 | | | $ | 183.7 | | | Biogen's share of the ADUHELM Collaboration development expense reflected in research and development expense in our consolidated statements of income | | | | 82.2 | | | 101.1 | | | Total sales and marketing expense incurred by the ADUHELM Collaboration | | | | 134.2 | | | 562.3 | | | Biogen's share of the ADUHELM Collaboration sales and marketing expense reflected in selling, general and administrative expense and collaboration profit sharing/(loss reimbursement) in our consolidated statements of income | | | | 71.5 | | | 301.4 | | | Total ADUHELM Collaboration third party milestones | | | | — | | | 100.0 | | | Biogen's share of reimbursement from Eisai of ADUHELM milestone payments reflected in collaboration profit sharing/(loss reimbursement) in our consolidated statements of income | | | | — | | | 45 | |
ADUHELM Co-promotion Profits and Losses Under our initial ADUHELM Collaboration Agreement, we recognized revenue on sales of ADUHELM in the U.S. to third parties as a component of product revenue, net in our consolidated statements of income. We also recorded the related cost of revenue and sales and marketing expense in our consolidated statements of income as these costs were incurred. Payments made to and received from Eisai for its 45.0% share of the co-promotion profits or losses in the U.S. were recognized in collaboration profit sharing/(loss reimbursement) in our consolidated statements of income. For the years ended December 31, 2022 and 2021, we recognized net reductions to our operating expense of approximately $224.7 million and $233.2 million, respectively, to reflect Eisai's 45.0% share of net collaboration losses in the U.S. for ADUHELM. For the year ended December 31, 2021, we recognized a net reduction to our operating expense of $45.0 million to reflect Eisai's 45.0% share of the $100.0 million milestone payment made to Neurimmune related to the launch of ADUHELM in the U.S., which was recorded in collaboration profit sharing/(loss reimbursement) in our consolidated statements of income. During the fourth quarter of 2021 we recorded approximately $164.0 million of charges associated with the write-off of inventory and purchase commitments in excess of forecasted demand related to ADUHELM. During the first quarter of 2022, as a result of the final NCD, we recorded approximately $275.0 million of charges associated with the write-off of inventory and purchase commitments in excess of forecasted demand related to ADUHELM. Additionally, for the years ended December 31, 2022 and 2021, we recorded approximately $111.0 million and $30.0 million, respectively, of aggregate gross idle capacity charges related to ADUHELM. These charges were recorded in cost of sales within our consolidated statements of income for the years ended December 31, 2022 and 2021. We recognized approximately $197.0 million and $99.0 million related to Eisai's 45.0% share of inventory, idle capacity charges and contractual commitments in collaboration profit sharing/(loss reimbursement) within our consolidated statements of income for the years ended December 31, 2022 and 2021, respectively. Amounts receivable from Eisai related to the agreements discussed above were approximately $1.4 million and $88.0 million as of December 31, 2023 and 2022, respectively. Amounts payable to Eisai related to the agreements discussed above were approximately $118.4 million and $81.2 million as of December 31, 2023 and 2022, respectively. UCB We have resolved alla collaboration agreement with UCB, effective November 2003, to jointly develop and commercialize dapirolizumab pegol, an anti-CD40L pegylated Fab, for the potential treatment of AIFA's claims relatingSLE and other future agreed
BIOGEN INC. AND SUBSIDIARIES NOTES TO CONSOLIDATED FINANCIAL STATEMENTS — (Continued) indications. Either we or UCB may propose development of dapirolizumab pegol in additional indications. If the parties do not agree to add an indication as an agreed indication to the collaboration, we or UCB may, at the sole expense of the applicable party, pursue development in such excluded indication(s), subject to an opt-in right of the non-pursuing party after proof of clinical activity. All costs incurred for agreed indications, including research, development, sales and marketing expense, are shared equally between us and UCB. If marketing approval is obtained, both companies will co-promote dapirolizumab pegol and share profits and losses equally. A summary of development expense related to the UCB collaboration agreement is as follows: | | | | | | | | | | | | | | | | | | | | | | | For the Years Ended December 31, | | (In millions) | | 2023 | | 2022 | | 2021 | | Total UCB collaboration development expense | | $ | 60.7 | | | $ | 68.0 | | | $ | 84.2 | | | Biogen's share of the UCB collaboration development expense reflected in research and development expense in our consolidated statements of income | | 30.3 | | | 34.0 | | | 42.1 | |
Alkermes In November 2017 we entered into an exclusive license and collaboration agreement with Alkermes Pharma Ireland Limited, a subsidiary of Alkermes, for VUMERITY, a novel fumarate for the treatment of RMS. In October 2019 the FDA approved VUMERITY in the U.S. for the treatment of RMS. During the fourth quarter of 2021 VUMERITY was approved for the treatment of RRMS in certain international markets. Under this agreement, we received an exclusive, worldwide license to develop and commercialize VUMERITY and we pay Alkermes royalties of 15.0% on worldwide net commercial sales of VUMERITY, which are recognized in cost of sales within our consolidated statements of income. Royalties payable on net commercial sales of VUMERITY are subject, under certain circumstances, to tiered minimum annual payment requirements for a period of five years following FDA approval. Royalty cost of sales related to sales of TYSABRI in excess of the reimbursement limitVUMERITY for the periodsyears ended December 31, 2023, 2022 and 2021, totaled approximately $87.4 million, $83.0 million and $61.6 million, respectively. Alkermes is eligible to receive royalties in the high-single digits to sub-teen double digits of annual net commercial sales upon successful development and commercialization of new product candidates, other than VUMERITY, developed under the exclusive license from February 2009Alkermes. Alkermes currently supplies both VUMERITY and FAMPYRA to us pursuant to separate supply agreements. In October 2019 we entered into a new supply agreement and amended our license and collaboration agreement with Alkermes for VUMERITY. We have elected to initiate a technology transfer and, following a transition period, to manufacture VUMERITY or have VUMERITY manufactured by a third party we have engaged in exchange for paying an increased royalty rate to Alkermes on any portion of future worldwide net commercial sales of VUMERITY that is manufactured by us or our designee. In January 2023 we entered into a new supply agreement with Alkermes for FAMPYRA through January 20132025. In December 2023 Alkermes entered into a definitive agreement to sell its development and manufacturing facility to Novo Nordisk, which is expected to close in mid-2024. Alkermes and Novo Nordisk plan to enter into subcontracting arrangements to continue work currently performed at the facility for an aggregate repaymenta period of EUR33.3 million.time after closing the transaction, which may continue through the end of 2025. Acorda Therapeutics, Inc. In June 2009 we entered into a collaboration and license agreement with Acorda to develop and commercialize products containing fampridine, such as FAMPYRA, in markets outside the U.S. Under this agreement, we pay tiered royalties based on the level of ex-U.S. net sales and we may pay potential milestone payments based on the successful achievement of certain regulatory and commercial milestones. In January 2024 we notified Acorda of our decision to terminate our collaboration and license agreement, effective January 1, 2025. As a result of this termination, Acorda will regain global commercialization rights to FAMPYRA. For the years ended December 31, 2023, 2022 and 2021, total cost of sales related to royalties and commercial supply of FAMPYRA reflected in our consolidated statements of income were approximately $55.2 million, $46.1 million and $46.6 million, respectively.
BIOGEN INC. AND SUBSIDIARIES NOTES TO CONSOLIDATED FINANCIAL STATEMENTS — (Continued) Sage Therapeutics, Inc. In November 2020 we entered into a global collaboration and license agreement with Sage to jointly develop and commercialize ZURZUVAE (zuranolone) for the treatment of PPD and potential treatment of MDD and BIIB124 (SAGE-324) for the potential treatment of essential tremor with potential in principle,other neurological conditions such as epilepsy. In connection with the closing of this transaction in December 2020 we recordedpurchased $650.0 million of Sage common stock, or approximately 6.2 million shares at approximately $104.14 per share, which were initially subject to transfer restrictions. We may pay Sage development and commercial milestone payments that could total up to approximately $1.6 billion if all the specified milestones set forth in this collaboration are achieved. In August 2023 the FDA approved ZURZUVAE for adults with PPD, pending DEA scheduling, which was completed in October 2023. Upon approval, ZURZUVAE became the first and only oral, once-daily, 14-day treatment that can provide rapid improvements in depressive symptoms by day 15 for women with PPD. ZURZUVAE for PPD became commercially available in the U.S. during the fourth quarter of 2023. Additionally, the FDA issued a liabilityCRL for the NDA for zuranolone in the treatment of adults with MDD. The CRL stated that the application did not provide substantial evidence of effectiveness to support the approval of zuranolone for the treatment of MDD and reductionthat an additional study or studies would be needed. We and Sage are continuing to revenue of EUR15.4 million at June 30, 2013, which approximated 50%seek feedback from the FDA and evaluating next steps. Under this collaboration, both companies will share equal responsibility and costs for development as well as profits and losses for commercialization in the U.S. Outside of the claimU.S., we are responsible for development and commercialization, excluding Japan, Taiwan and South Korea, with respect to zuranolone and may pay Sage potential tiered royalties in the high teens to low twenties. During the fourth quarter of 2023 we accrued a milestone payment due to Sage of $75.0 million upon the first commercial sale of ZURZUVAE for PPD in the U.S., which was recorded within intangible assets, net in our consolidated balance sheets, and subsequently paid in January 2024. For the year ended December 31, 2023, we recognized net reductions to our operating expense of approximately $4.7 million to reflect Sage's 50.0% share of net collaboration losses in the U.S., which is recognized in collaboration profit sharing/(loss reimbursement) in our consolidated statements of income. A summary of development and sales and marketing expense related to the period from mid-February 2009 through mid-February 2011.Sage collaboration is as follows: | | | | | | | | | | | | | | | | | | | | | | | For the Years Ended December 31, | | (In millions) | | 2023 | | 2022 | | 2021 | | Total Sage collaboration development expense | | $ | 176.7 | | | $ | 173.3 | | | $ | 167.7 | | | Biogen's share of the Sage collaboration development expense reflected in research and development expense in our consolidated statements of income | | 88.3 | | | 86.7 | | | 83.8 | | | Total sales and marketing expense incurred by the Sage collaboration | | 187.0 | | | 109.9 | | | 36.4 | | | Biogen's share of the Sage collaboration sales and marketing expense reflected in selling, general and administrative expense and collaboration profit sharing/(loss reimbursement) in our consolidated statements of income | | 93.5 | | | 55.0 | | | 18.2 | |
BIOGEN INC. AND SUBSIDIARIES NOTES TO CONSOLIDATED FINANCIAL STATEMENTS — (Continued) Denali Therapeutics Inc. In June 2014 AIFA approvedAugust 2020 we entered into a resolution affirmingcollaboration and license agreement with Denali to co-develop and co-commercialize Denali's small molecule inhibitors of LRRK2 for Parkinson's disease (LRRK2 Collaboration) and also entered into a separate agreement to obtain an exclusive option to license two preclinical programs from Denali's Transport Vehicle platform, including its ATV-enabled anti-amyloid beta program and a second program utilizing its Transport Vehicle technology. As part of this collaboration we purchased $465.0 million of Denali common stock in September 2020, or approximately 13 million shares at approximately $34.94 per share, which were initially subject to transfer restrictions. We may pay Denali development and commercial milestone payments that there is no reimbursement limit from and after February 2013. As a result, we recognized $53.5 million of TYSABRI revenuescould total up to approximately $1.1 billion if the milestones related to the periodsLRRK2 Collaboration are achieved. In April 2023 we exercised our option with Denali to license the ATV-enabled anti-amyloid beta program. In connection with this exercise, we assumed responsibility for all development and commercial activities and associated expenses related to this program. In addition, we made a one-time option exercise payment to Denali and, should certain milestones be achieved, may pay Denali additional development and commercial milestone payments and royalties based on future net sales. Our agreement with Denali was amended in August 2023, whereby certain milestone criteria were changed, while the total amount of development, regulatory and commercial milestones remains the same. In addition, we agreed to waive our option right to the second option program. Under the LRRK2 Collaboration, both companies share responsibility and costs for global development based on specified percentages as well as profits and losses for commercialization in the U.S. and China. Outside the U.S. and China we are responsible for commercialization and may pay Denali potential tiered royalties. A summary of development expense related to the Denali collaboration is as follows: | | | | | | | | | | | | | | | | | | | | | | | For the Years Ended December 31, | | (In millions) | | 2023 | | 2022 | | 2021 | | Total Denali collaboration development expense | | $ | 65.0 | | | $ | 75.1 | | | $ | 42.5 | | | Biogen's share of the Denali collaboration development expense reflected in research and development expense in our consolidated statements of income | | 39.0 | | | 43.8 | | | 25.5 | |
Sangamo Therapeutics, Inc. In February 2013 through2020 we entered into a collaboration and license agreement with Sangamo to pursue certain neurological targets leveraging Sangamo’s proprietary zinc finger protein technology delivered via adeno-associated virus to modulate the expression of key genes involved in neurological diseases. In connection with the closing of this transaction in April 2020 we purchased $225.0 million of Sangamo common stock, or approximately 24 million shares at approximately $9.21 per share, which were initially subject to transfer restrictions. These restrictions have now lapsed. In March 2023 we terminated our collaboration and license agreement with Sangamo. A summary of development expense related to the Sangamo collaboration is as follows: | | | | | | | | | | | | | | | | | | | | | | | For the Years Ended December 31, | | (In millions) | | 2023 | | 2022 | | 2021 | | Total Sangamo collaboration development expense | | $ | 4.1 | | | $ | 19.1 | | | $ | 22.7 | | | Biogen's share of the Sangamo collaboration development expense reflected in research and development expense in our consolidated statements of income | | 2.4 | | | 12.1 | | | 14.6 | |
InnoCare Pharma Limited In July 2021 we entered into a collaboration and license agreement with InnoCare Pharma Limited (InnoCare) for orelabrutinib, an oral small molecule Bruton's tyrosine kinase inhibitor for the potential treatment of MS. In connection with the closing of this transaction in August 2021 we made an upfront payment of $125.0 million that was recorded as research and development expense within our consolidated statements of income for the year ended December 31, 2021.
BIOGEN INC. AND SUBSIDIARIES NOTES TO CONSOLIDATED FINANCIAL STATEMENTS — (Continued) In February 2023 we terminated our collaboration and license agreement with InnoCare for orelabrutinib, for the potential treatment of MS. Other Research and Discovery Arrangements These arrangements may include the potential for future milestone payments based on the achievement of certain clinical and commercial development payable over a period of several years. Other For the years ended December 31, 2023, 2022 and 2021, we recorded approximately$4.1 million, $39.2 million and $89.1 million, respectively, as research and development expense in our consolidated statements of income related to other research and discovery related arrangements. Samsung Bioepis Co., Ltd. Joint Venture Agreement In February 2012 we entered into a joint venture agreement with Samsung BioLogics establishing an entity, Samsung Bioepis, to develop, manufacture and market biosimilar products. Samsung BioLogics contributed 280.5 billion South Korean won (approximately $250.0 million) for an 85.0% ownership interest in Samsung Bioepis and we contributed 49.5 billion South Korean won (approximately $45.0 million) for the remaining 15.0% ownership interest. In June 20142018 we exercised our option under our joint venture agreement to increase our ownership percentage in Samsung Bioepis from approximately 5.0%, which reflected the effect of previous equity financings in which we did not participate, to approximately 49.9%. The share purchase transaction was completed in November 2018 and, upon closing, we paid 759.5 billion South Korean won ($676.6 million) to Samsung BioLogics. In April 2022 we completed the sale of our 49.9% equity interest in Samsung Bioepis to Samsung BioLogics in exchange for total consideration of approximately $2.3 billion. Under the terms of this transaction, we received approximately $1.0 billion in cash at closing, with approximately $1.3 billion in cash to be deferred over two payments. The first deferred payment of $812.5 million was received in April 2023 and the second deferred payment of $437.5 million is due at the second anniversary of the closing of this transaction in April 2024. As part of this transaction, we are also eligible to receive up to an additional $50.0 million upon the achievement of certain commercial milestones. Our policy for contingent payments of this nature is to recognize the payments in the period that they become realizable, which is generally the same period in which the payments are earned. Prior to this sale, we recognized our share of the results of operations related to our investment in Samsung Bioepis under the equity method of accounting one quarter in arrears when the results of the entity became available, which was reflected as equity in (income) loss of investee, net of tax in our consolidated statements of income. Upon our November 2018 investment, the equity method of accounting required us to identify and allocate differences between the fair value of our investment and the carrying value of our interest in the underlying net assets of the investee. These basis differences were being amortized over their economic life, until the completion of the sale in April 2022, as discussed above. The total basis difference was approximately $675.0 million and related to inventory, developed technology, IPR&D and deferred tax balances. The basis differences related to inventory were amortized, net of tax, over their estimated useful lives of 1.5 years, and the basis differences related to developed technology and IPR&D for marketed products were being amortized, net of tax, over their estimated useful lives of 15 years. For the year ended December 31, 2022, we recognized net income on our investment of $2.6 million, reflecting our share of Samsung Bioepis' operating profits, net of tax, totaling $17.0 million offset by amortization of basis differences totaling $14.4 million. Following the sale of Samsung Bioepis we no longer recognize gains or losses associated with Samsung Bioepis' results of operations and amortization related to basis differences. For the year ended December 31, 2021, we recognized net income on our investment of $34.9 million, reflecting our share of Samsung Bioepis' operating profits, net of tax, totaling $64.6 million offset by amortization of basis differences totaling $29.7 million. Net income on our investment for the year ended December 31, 2021, reflects a $31.2 million benefit related to the release of a valuation allowance on deferred tax assets associated with Samsung Bioepis. The valuation allowance was released in the second quarter of 2021 based on a consideration of the positive and negative evidence, including the historic earnings of Samsung Bioepis.
BIOGEN INC. AND SUBSIDIARIES NOTES TO CONSOLIDATED FINANCIAL STATEMENTS — (Continued) For additional information on the sale of our equity interest in Samsung Bioepis, please read Note 3, Dispositions, to these consolidated financial statements. 2019 Development and Commercialization Agreement In December 2019 we completed a transaction with Samsung Bioepis and secured the exclusive rights to commercialize two potential ophthalmology biosimilar products, BYOOVIZ (ranibizumab-nuna), a ranibizumab biosimilar referencing LUCENTIS, and SB15, a proposed aflibercept biosimilar referencing EYLEA, in major markets worldwide, including the U.S., Canada, Europe, Japan and Australia. Samsung Bioepis will be responsible for development and will supply both products to us at a pre-specified gross margin of approximately 45.0%. During the third quarter of 2021 we accrued $15.0 million in milestone payments related to the approval of BYOOVIZ in the U.S., the E.U. and the U.K., that were previously deferred.capitalized within intangible assets, net in our consolidated balance sheets. We may also pay Samsung Bioepis up to approximately $180.0 million in additional development, regulatory and sales-based milestones. 2013 Commercial Agreement In the first quarter of 2017December 2013 we reachedentered into an agreement with AIFA's PriceSamsung Bioepis to commercialize, over a 10-year term, 3 anti-TNF biosimilar product candidates which includes IMRALDI, an adalimumab biosimilar referencing HUMIRA, FLIXABI, an infliximab biosimilar referencing REMICADE, and Reimbursement Committee resolving allBENEPALI, an etanercept biosimilar referencing ENBREL, in Europe, and in the case of AIFA's claims relatingBENEPALI, Japan. We have an option to extend this agreement by an additional five years, subject to payment of an option exercise fee of $60.0 million by August 2024. We also have an option to acquire exclusive rights to commercialize these products in China. We reflect revenue on sales of TYSABRIBENEPALI, IMRALDI and FLIXABI to third parties in excessproduct revenue, net in our consolidated statements of income and record the related cost of revenue and sales and marketing expense in our consolidated statements of income to their respective line items when these costs are incurred. Royalty payments to AbbVie on sales of IMRALDI are recognized in cost of sales within our consolidated statements of income. We share 50.0% of the reimbursement limit for prior periods. As a result,profit or loss related to our commercial agreement with Samsung Bioepis, which is recognized in collaboration profit sharing/(loss reimbursement) in our consolidated statements of income. For the first quarter of 2017,years ended December 31, 2023, 2022 and 2021, we recognized EUR41.8net profit-sharing expense of $223.5 million (approximately $45.0 million), $217.4 million and $285.4 million, respectively, to reflect Samsung Bioepis' 50.0% sharing of the net collaboration profits. Other Services Simultaneous with the formation of Samsung Bioepis, we also entered into a license agreement with Samsung Bioepis. Under this license agreement, we granted Samsung Bioepis an exclusive license to use, develop, manufacture and commercialize biosimilar products created by Samsung Bioepis using Biogen product-specific technology. In exchange, we receive single digit royalties on biosimilar products developed and commercialized by Samsung Bioepis. Royalty revenue under the license agreement is recognized as a component of contract manufacturing, royalty and other revenue in revenues for sales thatour consolidated statements of income. For the years ended December 31, 2023, 2022 and 2021, we recognized $13.6 million, $20.6 million and $20.7 million, respectively, as a component of contract manufacturing, royalty and other revenue in our consolidated statements of income related to the license agreement and other services performed under our collaboration with Samsung Bioepis. Amounts receivable from Samsung Bioepis related to the agreements discussed above were previously deferred. These amounts were previously accrued for$9.9 million and included in the table above in Other$2.0 million as of December 31, 2016.2023 and 2022, respectively. Amounts payable to Samsung Bioepis related to the agreements discussed above were $73.7 million and $40.5 million as of December 31, 2023 and 2022, respectively. 19. Investments in Variable Interest Entities
BIOGEN INC. AND SUBSIDIARIES NOTES TO CONSOLIDATED FINANCIAL STATEMENTS — (Continued) | | | | | | | Note 20: | Investments in Variable Interest Entities |
Consolidated Variable Interest Entities
Our consolidated financial statements include the financial results of variable interest entities in which we are the primary beneficiary. The following are our significant variable interest entities.
Neurimmune
In November 2007 we entered into a collaboration and license agreement with Neurimmune Subone AG (Neurimmune) for the development and commercialization of antibodies for the treatment of AD. We are responsible for the development, manufacturing and commercialization of all collaboration products. This agreement is effective for the longer of the duration of certain patents relating to a licensed product, or 12 years from the first commercial sale of any product using such a licensed compound. Our anti-amyloid beta antibody, aducanumab, for the treatment of AD resulted from this collaboration.
We consolidate the results of Neurimmune as we determined that we are the primary beneficiary of Neurimmune because we have the power through the collaboration to direct the activities that most significantly impact the entity’s economic performance and we are required to fund 100% of the research and development costs incurred in support of the collaboration. Under this agreement, we are also required to pay royalties on sales of any resulting commercial products and make payments upon the achievement of certain milestone events.
In October 2017 we amended the terms of our collaboration and license agreement with Neurimmune. Under the amended agreement, we made a $150.0 million payment to Neurimmune in exchange for a 15% reduction in royalty rates payable on products developed under the agreement, including on potential commercial sales of aducanumab. Our royalty rates payable on products developed under the agreement, including on potential commercial sales of aducanumab, will now range from the high single digits to low teens. As we consolidate the results of Neurimmune, we recognized this payment as a charge to noncontrolling interest in the fourth quarter of 2017 and treated it as a distribution. Under the amended agreement, we also have an option that will expire in April 2018 to further reduce our royalty rates payable on products developed under the agreement, including on potential commercial sales of aducanumab, by an additional 5% in exchange for a $50.0 million payment to Neurimmune.
Research and development costs for which we reimburse Neurimmune are reflected in research and development expense in our consolidated statements of income. During the years ending December 31, 2017, 2016 and 2015 amounts reimbursed were immaterial.
In September 2015 we recognized a $60.0 million milestone payable to Neurimmune upon enrollment of the first patient in a Phase 3 trial for aducanumab. We recognized this payment as a charge to noncontrolling interest. Based upon our current development plans for aducanumab, we may pay Neurimmune up to $275.0 million in remaining milestone payments. Future milestone payments and royalties, if any, will be reflected in our consolidated statements of income as a charge to noncontrolling interest, net of tax when such milestones are achieved.
BIOGEN INC. AND SUBSIDIARIES
NOTES TO CONSOLIDATED FINANCIAL STATEMENTS — (Continued)
The assets and liabilities of Neurimmune are not significant to our consolidated financial position or results of operations as it is a research and development organization. We have provided no financing to Neurimmune other than previously contractually required amounts.
Under the terms of our October 2017 collaboration agreement with Eisai for the joint development and commercialization of aducanumab, Eisai may elect to share in the benefit and cost associated with the royalty reductions discussed above. Eisai has elected to not share in the benefit and cost of the October 2017 royalty reduction. For additional information on our collaboration arrangement with Eisai, please read Note 20, Collaborative and Other Relationships, to these consolidated financial statements.
Unconsolidated Variable Interest Entities
We have relationships with other variable interest entities that we do not consolidate as we lack the power to direct the activities that significantly impact the economic success of these entities. These relationships include investments in certain biotechnology companies and research collaboration agreements.
As of December 31, 2017 and 2016, the carrying value of our investments in biotechnology companies totaled $48.3 million and $47.4 million, respectively. Our maximum exposure to loss related to these variable interest entities is limited to the carrying value of our investments.
We have also entered into research collaboration agreements with certain variable interest entities where we are required to fund certain development activities. These development activities are included in research and development expense in our consolidated statements of income, as they are incurred. We have provided no financing to these variable interest entities other than previously contractually required amounts.
20. Collaborative and Other Relationships
In connection with our business strategy, we have entered into various collaboration agreements that provide us with rights to develop, produce and market products using certain know-how, technology and patent rights maintained by our collaborative partners. Terms of the various collaboration agreements may require us to make milestone payments upon the achievement of certain product research and development objectives and pay royalties on future sales, if any, of commercial products resulting from the collaboration.
Depending on the collaborative arrangement, we may record funding receivable or payable balances with our partners, based on the nature of the cost-sharing mechanism and activity within the collaboration. Our significant collaboration arrangements are discussed below.
Genentech (Roche Group)
We have certain business and financial rights with respect to RITUXAN for the treatment of non-Hodgkin's lymphoma, CLL and other conditions, GAZYVA for the treatment of CLL and follicular lymphoma, OCREVUS for the treatment of primary progressive MS (PPMS) and relapsing MS (RMS) and other potential anti-CD20 therapies under a collaboration agreement with Genentech, a wholly-owned member of the Roche Group. The Roche Group and its sub-licensees maintain sole responsibility for the development, manufacturing and commercialization of GAZYVA in the U.S.
Our collaboration agreement will continue in effect until we mutually agree to terminate the collaboration, except that if we undergo a change in control, as defined in our collaboration agreement, Genentech has the right to present an offer to buy the rights to RITUXAN and we must either accept Genentech’s offer or purchase Genentech’s rights on the same terms as its offer. Genentech will also be deemed concurrently to have purchased our rights to any other anti-CD20 products in development in exchange for a royalty and our rights to GAZYVA in exchange for the compensation described in the table below. Our collaboration with Genentech was created through a contractual arrangement and not through a joint venture or other legal entity.
RITUXAN
Genentech is responsible for the worldwide manufacturing of RITUXAN. Development and commercialization rights and responsibilities under this collaboration are divided as follows:
U.S.
We share with Genentech co-exclusive rights to develop, commercialize and market RITUXAN in the U.S.
BIOGEN INC. AND SUBSIDIARIES
NOTES TO CONSOLIDATED FINANCIAL STATEMENTS — (Continued)
Canada
We and Genentech have assigned our rights under our collaboration agreement with respect to Canada to the Roche Group.
GAZYVA We recognize our share of the development and commercialization expenses of GAZYVA as a reduction of our share of pre-tax profits in revenues from anti-CD20 therapeutic programs.
Commercialization of GAZYVA impacts our percentage of the co-promotion profits for RITUXAN, as summarized in the table below.
OCREVUS
In March 2017 the FDA approved OCREVUS, a humanized anti-CD20 monoclonal antibody, for the treatment of RMS and PPMS. Under our agreement with Genentech, we will receive a tiered royalty on U.S. net sales from 13.5% and increasing up to 24% if annual net sales exceed $900.0 million. There will be a 50% reduction to these royalties if a biosimilar to OCREVUS is approved in the U.S.
In addition, we will receive a 3% royalty on net sales of OCREVUS outside the U.S., with the royalty period lasting 11 years from the first commercial sale of OCREVUS on a country-by-country basis. OCREVUS was approved for the treatment of RMS and PPMS in Australia, Switzerland and the E.U. in July 2017, September 2017 and January 2018, respectively.
The commercialization of OCREVUS does not impact the percentage of the co-promotion profits we receive for RITUXAN or GAZYVA. Genentech is solely responsible for development and commercialization of OCREVUS and funding future costs. Genentech cannot develop OCREVUS in CLL, non-Hodgkin's lymphoma or rheumatoid arthritis. OCREVUS royalty revenues were based on our estimates from third party and market research data of OCREVUS sales occurring during the corresponding period. Differences between actual and estimated royalty revenues will be adjusted for in the period in which they become known, which is expected to be the following quarter.
Profit-sharing Formulas
RITUXAN Profit Share
Our current pretax co-promotion profit-sharing formula for RITUXANGAZYVA provides for a 30%35.0% share on the first $50.0 million of co-promotion operating profits earned each calendar year. Our share of annual co-promotion profits in excess of $50.0 million varies upon the following events, as summarized in the table below, upon the following events: | | | | | | | | | Until GAZYVA First Non-CLL FDA Approval | 40.0 | % | After GAZYVA First Non-CLL FDA Approval until First GAZYVA Threshold Date | 39.0 | % | After First GAZYVA Threshold Date until Second GAZYVA Threshold Date | 37.5 | % | | After Second GAZYVA Threshold Date | 35.0 | % | | |
First Non-CLL GAZYVA FDA Approval means the FDA’s first approval of GAZYVA in an indication other than CLL.
First GAZYVA Threshold Date means the earlier of (i) the date of the First Non-CLL GAZYVA FDA approval if U.S. gross sales of GAZYVA for the preceding consecutive 12-month period were at least $150.0 million or (ii) the first day of the calendar quarter after the date of the First Non-CLL GAZYVA FDA Approval that U.S. gross sales of GAZYVA within any consecutive 12-month period have reached $150.0 million.
Second GAZYVA Threshold Date means the first day of the calendar quarter afterfollowing the date U.S. gross sales of GAZYVA within any consecutive 12-month period have reached $500.0 million. The Second GAZYVA Threshold Date can be achieved regardless of whether GAZYVA has been approved in a non-CLL indication. In March 2023 the Second GAZYVA Threshold Date was achieved. As a result, beginning in April 2023 the pre-tax profit share for GAZYVA was 35.0%. Our share of RITUXANGAZYVA pre-tax profits in excess of $50.0 million for the U.S. decreased to 39%years ended December 31, 2022 and 2021, was 37.5%. Revenue from 40% in February 2016 when GAZYVA was approved by the FDAAnti-CD20 Therapeutic Programs Revenue from anti-CD20 therapeutic programs is summarized as a new treatment for follicular lymphoma and was further decreased to 37.5% in the third quarter of 2017 as gross sales of GAZYVAfollows: | | | | | | | | | | | | | | | | | | | | | | | | For the Years Ended December 31, | | (In millions) | | 2023 | | 2022 | | 2021 | | Royalty revenue on sales of OCREVUS | | $ | 1,266.2 | | | $ | 1,136.3 | | | $ | 991.7 | | Biogen's share of pre-tax profits in the U.S. for RITUXAN, GAZYVA and LUNSUMIO(1) | | 409.4 | | | 547.0 | | | 647.7 | | | Other revenue from anti-CD20 therapeutic programs | | 14.0 | | | 17.2 | | | 19.1 | | | Total revenue from anti-CD20 therapeutic programs | | $ | 1,689.6 | | | $ | 1,700.5 | | | $ | 1,658.5 | |
(1) LUNSUMIO became commercially available in the U.S. during the first quarter of 2023. Prior to regulatory approval, we record our share of the expense incurred by the collaboration for the preceding 12 month period exceeded $150.0development of anti-CD20 products in research and development expense and pre-commercialization costs within selling, general and administrative expense in our consolidated statements of income. After an anti-CD20 product is approved, we record our share of the development and sales and marketing expense related to that product as a reduction of our share of pre-tax profits in revenue from anti-CD20 therapeutic programs. Ionis Pharmaceuticals, Inc. SPINRAZA In January 2012 we entered into a collaboration and license agreement with Ionis pursuant to which we have an exclusive, worldwide license to develop and commercialize SPINRAZA for the treatment of SMA. Under our agreement with Ionis, we make royalty payments to Ionis on annual worldwide net sales of SPINRAZA using a tiered royalty rate between 11.0% and 15.0%, which are recognized in cost of sales within our consolidated statements of income. Royalty cost of sales related to sales of SPINRAZA for the years ended December 31, 2023, 2022 and 2021, totaled approximately $240.2 million, $243.1 million and $267.1 million, respectively. 2018 Ionis Agreement In June 2018 we entered into a 10-year exclusive collaboration agreement with Ionis to develop novel ASO drug candidates for a broad range of neurological diseases for a total payment of $1.0 billion, consisting of an upfront payment of $375.0 million and the purchase of approximately 11.5 million shares of Ionis common stock at a cost of $625.0 million.
Upon closing, we recorded $50.9 million of the $375.0 million upfront payment as prepaid services in our consolidated balance sheets and recognized the remaining $324.1 million as research and development expense in
BIOGEN INC. AND SUBSIDIARIES NOTES TO CONSOLIDATED FINANCIAL STATEMENTS — (Continued)
our consolidated statements of income. The amount recorded as prepaid services represented the value of the employee resources committed to the arrangement to provide research and discovery services over the term of the agreement.
We have the option to license therapies arising out of this agreement and will be responsible for the development and commercialization of such therapies. We may pay development milestones to Ionis of up to $125.0 million or $270.0 million for each program, depending on the indication plus an annual license fee, as well as royalties on potential net commercial sales. During the years ended December 31, 2023, 2022 and 2021, we incurred milestones of $7.5 million, $10.0 million and $22.5 million, respectively, related to the advancement of neurological targets identified under this agreement, which were recorded as research and development expense in our consolidated statements of income. 2017 SMA Collaboration Agreement In December 2017 we entered into a collaboration agreement with Ionis to identify new ASO drug candidates for the potential treatment of SMA. Under this agreement, we have the option to license therapies arising out of this collaboration and will be responsible for their development and commercialization of such therapies. Upon entering into this agreement, we made a $25.0 million upfront payment to Ionis and we may pay Ionis up to $260.0 million in additional development and regulatory milestone payments if new drug candidates advance to marketing approval. Upon commercialization, we may also pay Ionis up to $800.0 million in additional performance-based milestone payments and tiered royalties on potential net sales of such therapies. In December 2021 we exercised our option with Ionis and obtained a worldwide, exclusive, royalty-bearing license to develop and commercialize BIIB115, an investigational ASO in development for SMA. In connection with this option exercise, we made an opt-in payment of $60.0 million to Ionis, which was recorded as research and development expense in our consolidated statements of income for the year ended December 31, 2021. 2013 Long-term Strategic Research Agreement In September 2013 we entered into a six-year research collaboration agreement with Ionis under which both companies collaborate to perform discovery level research and subsequent development and commercialization activities of antisense or other therapeutics for the potential treatment of neurological diseases. Under this agreement, Ionis performs research on a set of neurological targets identified within the agreement. Ionis is eligible to receive milestone payments, license fees and royalty payments for all product candidates developed through this collaboration, with the specific amount dependent upon the modality of the product candidate advanced by us under the terms of the agreement. For non-ALS antisense product candidates, Ionis is responsible for global development through the completion of a Phase 2 trial and we provide advice on the clinical trial design and regulatory strategy. For ALS antisense product candidates, we are responsible for global development, clinical trial design and regulatory strategy. We have an option to license a product candidate until completion of the Phase 2 trial. If we exercise our option, we will pay Ionis up to a $70.0 million license fee and assume global development, regulatory and commercialization responsibilities. Ionis could receive additional milestone payments upon the achievement of certain regulatory milestones of up to $130.0 million, plus additional amounts related to the cost of clinical trials conducted by Ionis under the collaboration, and royalties on future sales if we successfully develop the product candidate after option exercise. In December 2018 we exercised our option with Ionis and obtained a worldwide, exclusive, royalty-bearing license to develop and commercialize QALSODY (tofersen), for the treatment of ALS with SOD1 mutations. Following the option exercise, we are solely responsible for the costs and expense related to the development, manufacturing and commercialization of QALSODY. We may pay post-licensing milestone payments to Ionis of up to $55.0 million based on the successful achievement of certain regulatory and commercial milestones. In April 2023 the FDA approved QALSODY for the treatment of ALS in adults who have a mutation in the SOD1 gene. This indication is approved under accelerated approval based on reduction in plasma neurofilament light chain observed in patients treated with QALSODY. Continued approval for this indication may be contingent upon verification of clinical benefit in confirmatory trial(s). Under this agreement, we make royalty payments to Ionis on annual worldwide net sales of QALSODY using a tiered royalty rate between 11.0% and 15.0%, which are recognized in cost of sales within our consolidated statements of income.
BIOGEN INC. AND SUBSIDIARIES NOTES TO CONSOLIDATED FINANCIAL STATEMENTS — (Continued) During the year ended December 31, 2023, we incurred a milestone payment of $16.0 million to Ionis following the FDA's approval of QALSODY, which was recorded within intangible assets, net in our consolidated balance sheets. We may pay Ionis an additional milestone of $20.0 million if QALSODY receives regulatory approval in the E.U. During the years ending December 31, 2022 and 2021, we incurred milestones of $17.0 million and $10.0 million, respectively, related to the advancement of programs under this agreement, which were recorded as research and development expense in our consolidated statements of income. 2012 Ionis Agreement In December 2012 we entered into an agreement with Ionis for the development and commercialization of up to three gene targets. Under this agreement, Ionis is responsible for global development of any product candidatethrough the completion of a Phase 2 trial and we will provide advice on the clinical trial design and regulatory strategy. We have an option to license the product candidateuntil completion of the Phase 2 trial. If we exercise our option, we will pay a license fee of up to $70.0 million to Ionis and assume global development, regulatory and commercialization responsibilities. Ionis is eligible to receive up to $130.0 million in additional milestone payments upon the achievement of certain regulatory milestones as well as royalties on future salesif we successfully develop the product candidate after option exercise. In December 2019 we exercised our option with Ionis and obtained a worldwide, exclusive, royalty-bearing license to develop and commercialize BIIB080 (tau ASO), which is currently in Phase 2 development for the potential treatment of Alzheimer's disease. In connection with the option exercise, we made a payment of $45.0 million to Ionis, which was recorded as research and development expense in our consolidated statements of income. Future payments may include additional milestone payments of up to $155.0 million and royalties on future sales in the low- to mid-teens if we successfully develop the product candidate after option exercise. During the year ended December 31, 2022, we incurred a milestone payment of $10.0 million, related to the advancement of BIIB080 under this agreement, which was recorded within research and development expense in our consolidated statements of income. Eisai Co., Ltd. During the first quarter of 2023 we accrued a $31.0 million payable to Eisai related to the termination of an agreement whereby Eisai co-promoted or distributed our MS products in certain Asia-Pacific markets and settings. As of December 31, 2023, we paid approximately $16.0 million of the $31.0 million payable. The remaining portion was subsequently paid in January 2024. This termination fee is included in selling, general and administrative expense in our consolidated statements of income for the year ended December 31, 2023. LEQEMBI (lecanemab) Collaboration We have a collaboration agreement with Eisai to jointly develop and commercialize LEQEMBI (lecanemab), an anti-amyloid antibody for the treatment of Alzheimer's disease (the LEQEMBI Collaboration). Eisai serves as the lead of LEQEMBI development and regulatory submissions globally with both companies co-commercializing and co-promoting the product, and Eisai having final decision-making authority. All costs, including research, development, sales and marketing expense, are shared equally between us and Eisai. We and Eisai co-promote LEQEMBI and share profits and losses equally. We currently manufacture LEQEMBI drug substance and drug product and in March 2022 we extended our supply agreement with Eisai related to LEQEMBI from five years to ten years for the manufacture of LEQEMBI drug substance. The LEQEMBI Collaboration also provided Eisai with an option to jointly develop and commercialize ADUHELM (aducanumab) (ADUHELM Option), and an option to jointly develop and commercialize one of our anti-tau monoclonal antibodies (Anti-Tau Option). In October 2017 Eisai exercised its ADUHELM Option and we entered into a new collaboration agreement for the joint development and commercialization of ADUHELM (aducanumab) (the ADUHELM Collaboration Agreement).
BIOGEN INC. AND SUBSIDIARIES NOTES TO CONSOLIDATED FINANCIAL STATEMENTS — (Continued) On March 14, 2022, we amended our ADUHELM Collaboration Agreement with Eisai. As of the amendment date, we have sole decision making and commercialization rights worldwide on ADUHELM, and beginning January 1, 2023, Eisai receives only a tiered royalty based on net sales of ADUHELM, and no longer participates in sharing ADUHELM's global profits and losses. In March 2022 we also amended the LEQEMBI Collaboration Agreement with Eisai to eliminate the Anti-Tau Option. If either company undergoes a change of control, as defined in our LEQEMBI Collaboration Agreement, the non-acquired party may elect to initiate an operational separation, as defined in the LEQEMBI Collaboration Agreement. In the event of an operational separation, we would work with Eisai to effect a timely transition of any development, manufacturing or commercial responsibilities regarding LEQEMBI from us to Eisai. In this scenario, as of six months following the change of control, our ongoing responsibility for LEQEMBI related cost-sharing would be reduced to an amount equal to 80.0% of what we would have owed prior to the operational separation, and all other economic rights would remain unchanged. In addition, shouldin the FDA approve an anti-CD20event either company undergoes a change of control in which the acquirer is engaged in commercialization of a competing product, other than OCREVUSas defined in the LEQEMBI Collaboration Agreement, the non-acquired party may also request that the acquired party cease commercializing the competing product. Should the acquired party elect to continue commercializing the competing product, the non-acquired party may terminate the LEQEMBI Collaboration Agreement. Furthermore, in the event we are the non-acquired party, we may choose either to sell our interest in LEQEMBI to Eisai or GAZYVA that is acquired or developed by Genentech andpurchase Eisai's interest in LEQEMBI, subject to the parameters set forth in the LEQEMBI Collaboration Agreement. In July 2023 the FDA granted traditional approval of LEQEMBI. Prior to receiving traditional approval, LEQEMBI had been granted accelerated approval by the FDA in January 2023, at which time it became commercially available in the U.S. Additionally, in September 2023 the Japanese Ministry of Health, Labor and Welfare approved LEQEMBI in Japan, which was subsequently launched in Japan in December 2023. Upon commercialization of LEQEMBI, we began recognizing our 50.0% share of LEQEMBI product revenue, net and cost of sales, including royalties, within other revenue in our consolidated statements of income, as we are not the principal. Our share of LEQEMBI sales and marketing expense and development expense are recorded within selling, general and administrative expense and research and development expense, respectively, within our consolidated statements of income. A summary of development and sales and marketing expense related to the LEQEMBI Collaboration is as follows: | | | | | | | | | | | | | | | | | | | | | | | | For the Years Ended December 31, | | (In millions) | | 2023 | | 2022 | | 2021 | | Total development expense incurred by the collaboration related to the advancement of LEQEMBI | | $ | 371.9 | | | $ | 347.2 | | | $ | 323.0 | | | Biogen's share of the LEQEMBI Collaboration development expense reflected in research and development expense in our consolidated statements of income | | 186.0 | | | 173.6 | | | 161.5 | | | Total sales and marketing expense incurred by the LEQEMBI Collaboration | | 304.4 | | | 104.6 | | | 27.2 | | | Biogen's share of the LEQEMBI Collaboration sales and marketing expense reflected in selling, general and administrative expense in our consolidated statements of income | | 152.2 | | | 52.3 | | | 13.6 | |
ADUHELM Collaboration Agreement The LEQEMBI Collaboration also provided Eisai with an option to jointly develop and commercialize ADUHELM (aducanumab) (ADUHELM Option). In October 2017 Eisai exercised its ADUHELM Option and we entered into a new collaboration agreement for the joint development and commercialization of ADUHELM (the ADUHELM Collaboration Agreement). Under our initial ADUHELM Collaboration Agreement, we would lead the ongoing development of ADUHELM, and we and Eisai would co-promote ADUHELM with a region-based profit split. Beginning in 2019, Eisai was reimbursing us for 45.0% of development and sales and marketing expense incurred by the collaboration for the advancement of ADUHELM.
BIOGEN INC. AND SUBSIDIARIES NOTES TO CONSOLIDATED FINANCIAL STATEMENTS — (Continued) In March 2022 we amended our ADUHELM Collaboration Agreement with Eisai. As of the amendment date, we have sole decision making and commercialization rights worldwide on ADUHELM, and beginning January 1, 2023, Eisai receives only a tiered royalty based on net sales of ADUHELM, and no longer participates in sharing ADUHELM's global profits and losses. Eisai's share of development, commercialization and manufacturing expense was limited to $335.0 million for the period from January 1, 2022 to December 31, 2022, which was achieved as of December 31, 2022. Once this limit was achieved, we became responsible for all ADUHELM related costs. A summary of development expense, sales and marketing expense and milestone payments related to our initial ADUHELM Collaboration Agreement is as follows: | | | | | | | | | | | | | | | | | | | | | For the Year Ended December 31, | | (In millions) | | | | 2022 | | 2021 | | Total ADUHELM Collaboration development expense | | | | $ | 149.4 | | | $ | 183.7 | | | Biogen's share of the ADUHELM Collaboration development expense reflected in research and development expense in our consolidated statements of income | | | | 82.2 | | | 101.1 | | | Total sales and marketing expense incurred by the ADUHELM Collaboration | | | | 134.2 | | | 562.3 | | | Biogen's share of the ADUHELM Collaboration sales and marketing expense reflected in selling, general and administrative expense and collaboration profit sharing/(loss reimbursement) in our consolidated statements of income | | | | 71.5 | | | 301.4 | | | Total ADUHELM Collaboration third party milestones | | | | — | | | 100.0 | | | Biogen's share of reimbursement from Eisai of ADUHELM milestone payments reflected in collaboration profit sharing/(loss reimbursement) in our consolidated statements of income | | | | — | | | 45 | |
ADUHELM Co-promotion Profits and Losses Under our initial ADUHELM Collaboration Agreement, we recognized revenue on sales of ADUHELM in the U.S. to third parties as a component of product revenue, net in our consolidated statements of income. We also recorded the related cost of revenue and sales and marketing expense in our consolidated statements of income as these costs were incurred. Payments made to and received from Eisai for its 45.0% share of the co-promotion profits or losses in the U.S. were recognized in collaboration profit sharing/(loss reimbursement) in our consolidated statements of income. For the years ended December 31, 2022 and 2021, we recognized net reductions to our operating expense of approximately $224.7 million and $233.2 million, respectively, to reflect Eisai's 45.0% share of net collaboration losses in the U.S. for ADUHELM. For the year ended December 31, 2021, we recognized a net reduction to our operating expense of $45.0 million to reflect Eisai's 45.0% share of the $100.0 million milestone payment made to Neurimmune related to the launch of ADUHELM in the U.S., which was recorded in collaboration profit sharing/(loss reimbursement) in our consolidated statements of income. During the fourth quarter of 2021 we recorded approximately $164.0 million of charges associated with the write-off of inventory and purchase commitments in excess of forecasted demand related to ADUHELM. During the first quarter of 2022, as a result of the final NCD, we recorded approximately $275.0 million of charges associated with the write-off of inventory and purchase commitments in excess of forecasted demand related to ADUHELM. Additionally, for the years ended December 31, 2022 and 2021, we recorded approximately $111.0 million and $30.0 million, respectively, of aggregate gross idle capacity charges related to ADUHELM. These charges were recorded in cost of sales within our consolidated statements of income for the years ended December 31, 2022 and 2021. We recognized approximately $197.0 million and $99.0 million related to Eisai's 45.0% share of inventory, idle capacity charges and contractual commitments in collaboration profit sharing/(loss reimbursement) within our consolidated statements of income for the years ended December 31, 2022 and 2021, respectively. Amounts receivable from Eisai related to the agreements discussed above were approximately $1.4 million and $88.0 million as of December 31, 2023 and 2022, respectively. Amounts payable to Eisai related to the agreements discussed above were approximately $118.4 million and $81.2 million as of December 31, 2023 and 2022, respectively. UCB We have a collaboration agreement with UCB, effective November 2003, to jointly develop and commercialize dapirolizumab pegol, an anti-CD40L pegylated Fab, for the potential treatment of SLE and other future agreed
BIOGEN INC. AND SUBSIDIARIES NOTES TO CONSOLIDATED FINANCIAL STATEMENTS — (Continued) indications. Either we or UCB may propose development of dapirolizumab pegol in additional indications. If the parties do not agree to add an indication as an agreed indication to the collaboration, we or UCB may, at the sole expense of the applicable party, pursue development in such excluded indication(s), subject to an opt-in right of the non-pursuing party after proof of clinical activity. All costs incurred for agreed indications, including research, development, sales and marketing expense, are shared equally between us and UCB. If marketing approval is obtained, both companies will co-promote dapirolizumab pegol and share profits would be between 30% and 37.5% basedlosses equally. A summary of development expense related to the UCB collaboration agreement is as follows: | | | | | | | | | | | | | | | | | | | | | | | For the Years Ended December 31, | | (In millions) | | 2023 | | 2022 | | 2021 | | Total UCB collaboration development expense | | $ | 60.7 | | | $ | 68.0 | | | $ | 84.2 | | | Biogen's share of the UCB collaboration development expense reflected in research and development expense in our consolidated statements of income | | 30.3 | | | 34.0 | | | 42.1 | |
Alkermes In November 2017 we entered into an exclusive license and collaboration agreement with Alkermes Pharma Ireland Limited, a subsidiary of Alkermes, for VUMERITY, a novel fumarate for the treatment of RMS. In October 2019 the FDA approved VUMERITY in the U.S. for the treatment of RMS. During the fourth quarter of 2021 VUMERITY was approved for the treatment of RRMS in certain international markets. Under this agreement, we received an exclusive, worldwide license to develop and commercialize VUMERITY and we pay Alkermes royalties of 15.0% on worldwide net commercial sales of VUMERITY, which are recognized in cost of sales within our consolidated statements of income. Royalties payable on net commercial sales of VUMERITY are subject, under certain events.circumstances, to tiered minimum annual payment requirements for a period of five years following FDA approval. Royalty cost of sales related to sales of VUMERITY for the years ended December 31, 2023, 2022 and 2021, totaled approximately $87.4 million, $83.0 million and $61.6 million, respectively. Alkermes is eligible to receive royalties in the high-single digits to sub-teen double digits of annual net commercial sales upon successful development and commercialization of new product candidates, other than VUMERITY, developed under the exclusive license from Alkermes. Alkermes currently supplies both VUMERITY and FAMPYRA to us pursuant to separate supply agreements. In October 2019 we entered into a new supply agreement and amended our license and collaboration agreement with Alkermes for VUMERITY. We have elected to initiate a technology transfer and, following a transition period, to manufacture VUMERITY or have VUMERITY manufactured by a third party we have engaged in exchange for paying an increased royalty rate to Alkermes on any portion of future worldwide net commercial sales of VUMERITY that is manufactured by us or our designee. In January 2023 we entered into a new supply agreement with Alkermes for FAMPYRA through January 2025. In December 2023 Alkermes entered into a definitive agreement to sell its development and manufacturing facility to Novo Nordisk, which is expected to close in mid-2024. Alkermes and Novo Nordisk plan to enter into subcontracting arrangements to continue work currently performed at the facility for a period of time after closing the transaction, which may continue through the end of 2025. Acorda Therapeutics, Inc. In June 20172009 we entered into a collaboration and license agreement with Acorda to develop and commercialize products containing fampridine, such as FAMPYRA, in markets outside the U.S. Under this agreement, we pay tiered royalties based on the level of ex-U.S. net sales and we may pay potential milestone payments based on the successful achievement of certain regulatory and commercial milestones. In January 2024 we notified Acorda of our decision to terminate our collaboration and license agreement, effective January 1, 2025. As a result of this termination, Acorda will regain global commercialization rights to FAMPYRA. For the years ended December 31, 2023, 2022 and 2021, total cost of sales related to royalties and commercial supply of FAMPYRA reflected in our consolidated statements of income were approximately $55.2 million, $46.1 million and $46.6 million, respectively.
BIOGEN INC. AND SUBSIDIARIES NOTES TO CONSOLIDATED FINANCIAL STATEMENTS — (Continued) Sage Therapeutics, Inc. In November 2020 we entered into a global collaboration and license agreement with Sage to jointly develop and commercialize ZURZUVAE (zuranolone) for the treatment of PPD and potential treatment of MDD and BIIB124 (SAGE-324) for the potential treatment of essential tremor with potential in other neurological conditions such as epilepsy. In connection with the closing of this transaction in December 2020 we purchased $650.0 million of Sage common stock, or approximately 6.2 million shares at approximately $104.14 per share, which were initially subject to transfer restrictions. We may pay Sage development and commercial milestone payments that could total up to approximately $1.6 billion if all the specified milestones set forth in this collaboration are achieved. In August 2023 the FDA approved RITUXAN HYCELAZURZUVAE for subcutaneous injectionadults with PPD, pending DEA scheduling, which was completed in October 2023. Upon approval, ZURZUVAE became the first and only oral, once-daily, 14-day treatment that can provide rapid improvements in depressive symptoms by day 15 for women with PPD. ZURZUVAE for PPD became commercially available in the U.S. during the fourth quarter of 2023. Additionally, the FDA issued a CRL for the NDA for zuranolone in the treatment of adults with previously untreatedMDD. The CRL stated that the application did not provide substantial evidence of effectiveness to support the approval of zuranolone for the treatment of MDD and relapsedthat an additional study or refractory follicular lymphoma, previously untreated diffuse large B-cell lymphomastudies would be needed. We and CLL. This newSage are continuing to seek feedback from the FDA and evaluating next steps. Under this collaboration, both companies will share equal responsibility and costs for development as well as profits and losses for commercialization in the U.S. Outside of the U.S., we are responsible for development and commercialization, excluding Japan, Taiwan and South Korea, with respect to zuranolone and may pay Sage potential tiered royalties in the high teens to low twenties. During the fourth quarter of 2023 we accrued a milestone payment due to Sage of $75.0 million upon the first commercial sale of ZURZUVAE for PPD in the U.S., which was recorded within intangible assets, net in our consolidated balance sheets, and subsequently paid in January 2024. For the year ended December 31, 2023, we recognized net reductions to our operating expense of approximately $4.7 million to reflect Sage's 50.0% share of net collaboration losses in the U.S., which is recognized in collaboration profit sharing/(loss reimbursement) in our consolidated statements of income. A summary of development and sales and marketing expense related to the Sage collaboration is as follows: | | | | | | | | | | | | | | | | | | | | | | | For the Years Ended December 31, | | (In millions) | | 2023 | | 2022 | | 2021 | | Total Sage collaboration development expense | | $ | 176.7 | | | $ | 173.3 | | | $ | 167.7 | | | Biogen's share of the Sage collaboration development expense reflected in research and development expense in our consolidated statements of income | | 88.3 | | | 86.7 | | | 83.8 | | | Total sales and marketing expense incurred by the Sage collaboration | | 187.0 | | | 109.9 | | | 36.4 | | | Biogen's share of the Sage collaboration sales and marketing expense reflected in selling, general and administrative expense and collaboration profit sharing/(loss reimbursement) in our consolidated statements of income | | 93.5 | | | 55.0 | | | 18.2 | |
BIOGEN INC. AND SUBSIDIARIES NOTES TO CONSOLIDATED FINANCIAL STATEMENTS — (Continued) Denali Therapeutics Inc. In August 2020 we entered into a collaboration and license agreement with Denali to co-develop and co-commercialize Denali's small molecule inhibitors of LRRK2 for Parkinson's disease (LRRK2 Collaboration) and also entered into a separate agreement to obtain an exclusive option to license two preclinical programs from Denali's Transport Vehicle platform, including its ATV-enabled anti-amyloid beta program and a second program utilizing its Transport Vehicle technology. As part of this collaboration we purchased $465.0 million of Denali common stock in September 2020, or approximately 13 million shares at approximately $34.94 per share, which were initially subject to transfer restrictions. We may pay Denali development and commercial milestone payments that could total up to approximately $1.1 billion if the milestones related to the LRRK2 Collaboration are achieved. In April 2023 we exercised our option with Denali to license the ATV-enabled anti-amyloid beta program. In connection with this exercise, we assumed responsibility for all development and commercial activities and associated expenses related to this program. In addition, we made a one-time option exercise payment to Denali and, should certain milestones be achieved, may pay Denali additional development and commercial milestone payments and royalties based on future net sales. Our agreement with Denali was amended in August 2023, whereby certain milestone criteria were changed, while the total amount of development, regulatory and commercial milestones remains the same. In addition, we agreed to waive our option right to the second option program. Under the LRRK2 Collaboration, both companies share responsibility and costs for global development based on specified percentages as well as profits and losses for commercialization in the U.S. and China. Outside the U.S. and China we are responsible for commercialization and may pay Denali potential tiered royalties. A summary of development expense related to the Denali collaboration is as follows: | | | | | | | | | | | | | | | | | | | | | | | For the Years Ended December 31, | | (In millions) | | 2023 | | 2022 | | 2021 | | Total Denali collaboration development expense | | $ | 65.0 | | | $ | 75.1 | | | $ | 42.5 | | | Biogen's share of the Denali collaboration development expense reflected in research and development expense in our consolidated statements of income | | 39.0 | | | 43.8 | | | 25.5 | |
Sangamo Therapeutics, Inc. In February 2020 we entered into a collaboration and license agreement with Sangamo to pursue certain neurological targets leveraging Sangamo’s proprietary zinc finger protein technology delivered via adeno-associated virus to modulate the expression of key genes involved in neurological diseases. In connection with the closing of this transaction in April 2020 we purchased $225.0 million of Sangamo common stock, or approximately 24 million shares at approximately $9.21 per share, which were initially subject to transfer restrictions. These restrictions have now lapsed. In March 2023 we terminated our collaboration and license agreement with Sangamo. A summary of development expense related to the Sangamo collaboration is as follows: | | | | | | | | | | | | | | | | | | | | | | | For the Years Ended December 31, | | (In millions) | | 2023 | | 2022 | | 2021 | | Total Sangamo collaboration development expense | | $ | 4.1 | | | $ | 19.1 | | | $ | 22.7 | | | Biogen's share of the Sangamo collaboration development expense reflected in research and development expense in our consolidated statements of income | | 2.4 | | | 12.1 | | | 14.6 | |
InnoCare Pharma Limited In July 2021 we entered into a collaboration and license agreement with InnoCare Pharma Limited (InnoCare) for orelabrutinib, an oral small molecule Bruton's tyrosine kinase inhibitor for the potential treatment includesof MS. In connection with the closing of this transaction in August 2021 we made an upfront payment of $125.0 million that was recorded as research and development expense within our consolidated statements of income for the year ended December 31, 2021.
BIOGEN INC. AND SUBSIDIARIES NOTES TO CONSOLIDATED FINANCIAL STATEMENTS — (Continued) In February 2023 we terminated our collaboration and license agreement with InnoCare for orelabrutinib, for the potential treatment of MS. Other Research and Discovery Arrangements These arrangements may include the potential for future milestone payments based on the achievement of certain clinical and commercial development payable over a period of several years. Other For the years ended December 31, 2023, 2022 and 2021, we recorded approximately$4.1 million, $39.2 million and $89.1 million, respectively, as research and development expense in our consolidated statements of income related to other research and discovery related arrangements. Samsung Bioepis Co., Ltd. Joint Venture Agreement In February 2012 we entered into a joint venture agreement with Samsung BioLogics establishing an entity, Samsung Bioepis, to develop, manufacture and market biosimilar products. Samsung BioLogics contributed 280.5 billion South Korean won (approximately $250.0 million) for an 85.0% ownership interest in Samsung Bioepis and we contributed 49.5 billion South Korean won (approximately $45.0 million) for the remaining 15.0% ownership interest. In June 2018 we exercised our option under our joint venture agreement to increase our ownership percentage in Samsung Bioepis from approximately 5.0%, which reflected the effect of previous equity financings in which we did not participate, to approximately 49.9%. The share purchase transaction was completed in November 2018 and, upon closing, we paid 759.5 billion South Korean won ($676.6 million) to Samsung BioLogics. In April 2022 we completed the sale of our 49.9% equity interest in Samsung Bioepis to Samsung BioLogics in exchange for total consideration of approximately $2.3 billion. Under the terms of this transaction, we received approximately $1.0 billion in cash at closing, with approximately $1.3 billion in cash to be deferred over two payments. The first deferred payment of $812.5 million was received in April 2023 and the second deferred payment of $437.5 million is due at the second anniversary of the closing of this transaction in April 2024. As part of this transaction, we are also eligible to receive up to an additional $50.0 million upon the achievement of certain commercial milestones. Our policy for contingent payments of this nature is to recognize the payments in the period that they become realizable, which is generally the same monoclonal antibody as intravenous RITUXANperiod in combination with hyaluronidase human, an enzyme that helpswhich the payments are earned. Prior to deliver rituximabthis sale, we recognized our share of the results of operations related to our investment in Samsung Bioepis under the skin.equity method of accounting one quarter in arrears when the results of the entity became available, which was reflected as equity in (income) loss of investee, net of tax in our consolidated statements of income. Upon our November 2018 investment, the equity method of accounting required us to identify and allocate differences between the fair value of our investment and the carrying value of our interest in the underlying net assets of the investee. These basis differences were being amortized over their economic life, until the completion of the sale in April 2022, as discussed above. The total basis difference was approximately $675.0 million and related to inventory, developed technology, IPR&D and deferred tax balances. The basis differences related to inventory were amortized, net of tax, over their estimated useful lives of 1.5 years, and the basis differences related to developed technology and IPR&D for marketed products were being amortized, net of tax, over their estimated useful lives of 15 years. For the year ended December 31, 2022, we recognized net income on our investment of $2.6 million, reflecting our share of Samsung Bioepis' operating profits, net of tax, totaling $17.0 million offset by amortization of basis differences totaling $14.4 million. Following the sale of Samsung Bioepis we no longer recognize gains or losses associated with Samsung Bioepis' results of operations and amortization related to basis differences. For the year ended December 31, 2021, we recognized net income on our investment of $34.9 million, reflecting our share of Samsung Bioepis' operating profits, net of tax, totaling $64.6 million offset by amortization of basis differences totaling $29.7 million. Net income on our investment for the year ended December 31, 2021, reflects a $31.2 million benefit related to the release of a valuation allowance on deferred tax assets associated with Samsung Bioepis. The valuation allowance was released in the second quarter of 2021 based on a consideration of the positive and negative evidence, including the historic earnings of Samsung Bioepis.
BIOGEN INC. AND SUBSIDIARIES NOTES TO CONSOLIDATED FINANCIAL STATEMENTS — (Continued) For additional information on the sale of our equity interest in Samsung Bioepis, please read Note 3, Dispositions, to these consolidated financial statements. 2019 Development and Commercialization Agreement In December 2019 we completed a transaction with Samsung Bioepis and secured the exclusive rights to commercialize two potential ophthalmology biosimilar products, BYOOVIZ (ranibizumab-nuna), a ranibizumab biosimilar referencing LUCENTIS, and SB15, a proposed aflibercept biosimilar referencing EYLEA, in major markets worldwide, including the U.S., Canada, Europe, Japan and Australia. Samsung Bioepis will be responsible for development and will supply both products to us at a pre-specified gross margin of approximately 45.0%. During the third quarter of 2021 we accrued $15.0 million in milestone payments related to the approval of BYOOVIZ in the U.S., the E.U. and the U.K., that were capitalized within intangible assets, net in our consolidated balance sheets. We may also pay Samsung Bioepis up to approximately $180.0 million in additional development, regulatory and sales-based milestones. 2013 Commercial Agreement In December 2013 we entered into an agreement with Samsung Bioepis to commercialize, over a 10-year term, 3 anti-TNF biosimilar product candidates which includes IMRALDI, an adalimumab biosimilar referencing HUMIRA, FLIXABI, an infliximab biosimilar referencing REMICADE, and BENEPALI, an etanercept biosimilar referencing ENBREL, in Europe, and in the case of BENEPALI, Japan. We have an option to extend this agreement by an additional five years, subject to payment of an option exercise fee of $60.0 million by August 2024. We also have an option to acquire exclusive rights to commercialize these products in China. We reflect revenue on sales of BENEPALI, IMRALDI and FLIXABI to third parties in product revenue, net in our consolidated statements of income and record the related cost of revenue and sales and marketing expense in our consolidated statements of income to their respective line items when these costs are incurred. Royalty payments to AbbVie on sales of IMRALDI are recognized in cost of sales within our consolidated statements of income. We share 50.0% of the profit or loss related to our commercial agreement with Samsung Bioepis, which is recognized in collaboration profit sharing/(loss reimbursement) in our consolidated statements of income. For the years ended December 31, 2023, 2022 and 2021, we recognized net profit-sharing expense of $223.5 million, $217.4 million and $285.4 million, respectively, to reflect Samsung Bioepis' 50.0% sharing of the net collaboration profits. Other Services Simultaneous with the formation of Samsung Bioepis, we also entered into a license agreement with Samsung Bioepis. Under this license agreement, we granted Samsung Bioepis an exclusive license to use, develop, manufacture and commercialize biosimilar products created by Samsung Bioepis using Biogen product-specific technology. In exchange, we receive single digit royalties on biosimilar products developed and commercialized by Samsung Bioepis. Royalty revenue under the license agreement is recognized as a component of contract manufacturing, royalty and other revenue in our consolidated statements of income. For the years ended December 31, 2023, 2022 and 2021, we recognized $13.6 million, $20.6 million and $20.7 million, respectively, as a component of contract manufacturing, royalty and other revenue in our consolidated statements of income related to the license agreement and other services performed under our collaboration with Samsung Bioepis. Amounts receivable from Samsung Bioepis related to the agreements discussed above were $9.9 million and $2.0 million as of December 31, 2023 and 2022, respectively. Amounts payable to Samsung Bioepis related to the agreements discussed above were $73.7 million and $40.5 million as of December 31, 2023 and 2022, respectively.
BIOGEN INC. AND SUBSIDIARIES NOTES TO CONSOLIDATED FINANCIAL STATEMENTS — (Continued) | | | | | | | Note 20: | Investments in Variable Interest Entities |
GAZYVA Profit Share Our current pretax profit-sharing formula for GAZYVA provides for a 35%35.0% share on the first $50.0 million of operating profits earned each calendar year. Our share of annual co-promotion profits in excess of $50.0 million varies upon the following events, as summarized in the table below, upon the following events: | | | | | | | | | Until First GAZYVA Threshold Date | 39.0 | % | After First GAZYVA Threshold Date until Second GAZYVA Threshold Date | 37.5 | % | | After Second GAZYVA Threshold Date | 35.0 | % | | |
Second GAZYVA Threshold Date means the first day of the calendar quarter following the date U.S. gross sales of GAZYVA within any consecutive 12-month period have reached $500.0 million. The Second GAZYVA Threshold Date can be achieved regardless of whether GAZYVA has been approved in a non-CLL indication. In 2017, 2016 and 2015 ourMarch 2023 the Second GAZYVA Threshold Date was achieved. As a result, beginning in April 2023 the pre-tax profit share for GAZYVA was 35.0%. Our share of operatingGAZYVA pre-tax profits on GAZYVAin excess of $50.0 million for the years ended December 31, 2022 and 2021, was 35%37.5%. In November 2017 the FDA approved GAZYVA in combination with chemotherapy, followed by GAZYVA alone, for people with previously untreated advanced follicular lymphoma.
RevenuesRevenue from Anti-CD20 Therapeutic Programs
RevenuesRevenue from anti-CD20 therapeutic programs areis summarized as follows:
| | | | | | | | | | | | | | | | | | | | | | | | For the Years Ended December 31, | | (In millions) | | 2023 | | 2022 | | 2021 | | Royalty revenue on sales of OCREVUS | | $ | 1,266.2 | | | $ | 1,136.3 | | | $ | 991.7 | | Biogen's share of pre-tax profits in the U.S. for RITUXAN, GAZYVA and LUNSUMIO(1) | | 409.4 | | | 547.0 | | | 647.7 | | | Other revenue from anti-CD20 therapeutic programs | | 14.0 | | | 17.2 | | | 19.1 | | | Total revenue from anti-CD20 therapeutic programs | | $ | 1,689.6 | | | $ | 1,700.5 | | | $ | 1,658.5 | |
| | | | | | | | | | | | | | | For the Years Ended December 31, | | (In millions) | 2017 | | 2016 | | 2015 | | Biogen's share of pre-tax profits in the U.S. for RITUXAN and GAZYVA, including the reimbursement of selling and development expenses | $ | 1,316.4 |
| | $ | 1,249.5 |
| | $ | 1,269.8 |
| | Other revenues from anti-CD20 therapeutic programs | 242.8 |
| | 65.0 |
| | 69.4 |
| | Total revenues from anti-CD20 therapeutic programs | $ | 1,559.2 |
| | $ | 1,314.5 |
| | $ | 1,339.2 |
|
In 2017(1) LUNSUMIO became commercially available in the 37.5% profit-sharing threshold was met during the third quarter and the 39% profit-sharing threshold was metU.S. during the first quarter. In 2016 the 39% profit-sharing threshold was met during the first quarter. In 2015, the 40% profit-sharing threshold was met during the first quarter.
Biogen's sharequarter of pre-tax profits in the U.S. for RITUXAN and GAZYVA, including the reimbursement of selling and development expenses for 2017, as depicted in the table above, excludes certain expenses charged to the collaboration by Genentech that we believe remain the responsibility of Genentech and that we are not obligated to pay under the terms of the collaboration agreement. Accordingly, we did not recognize the effect of those expenses in the determination of our share of pre-tax collaboration profits and Genentech has withheld approximately $120 million from amounts due to us in relation to collaboration activity for 2017, representing Genentech’s estimate of our share of these expenses. We remain in discussions with Genentech about a resolution relating to these amounts.2023.
Prior to regulatory approval, we record our share of the expensesexpense incurred by the collaboration for the development of anti-CD20 products in research and development expense and pre-commercialization costs within selling, general and administrative expense in our consolidated statements of income. After an anti-CD20 product is approved, we record our share of the development expensesand sales and marketing expense related to that product as a reduction of our share of pre-tax profits in revenuesrevenue from anti-CD20 therapeutic programs.
Ionis Pharmaceuticals, Inc.
BIOGEN INC. AND SUBSIDIARIES
NOTES TO CONSOLIDATED FINANCIAL STATEMENTS — (Continued)
AbbVie
We have a collaboration agreement with AbbVie for the development and commercialization of ZINBRYTA, which was approved for the treatment of relapsing forms of MS in the U.S. in May 2016 and in the E.U. in July 2016. Under this agreement, we and AbbVie conduct ZINBRYTA co-promotion activities in the U.S., E.U. and Canadian territories (Collaboration Territory) where development and commercialization costs and profits are shared equally. Outside of the Collaboration Territory, we are solely responsible for development and commercialization of ZINBRYTA and will pay a tiered royalty to AbbVie as a percentage of net sales in the low to high teens.
We are responsible for manufacturing and research and development activities in both the Collaboration Territory and outside the Collaboration Territory and record these activities within their respective lines in our consolidated statements of income, net of any reimbursement of research and development expenditures received from AbbVie. For the years ended December 31, 2017, 2016 and 2015, the collaboration incurred $39.9 million, $48.6 million and $113.8 million for research and development activities, respectively, for which we recognized $19.9 million, $24.3 million and $60.8 million, respectively, in our consolidated statements of income.
Prior to regulatory approval, we also recognized $22.0 million of pre-commercialization expenses within our selling, general and administrative expense, which represented 50% of the collaboration's pre-commercialization costs for 2016. After ZINBRYTA was approved by the FDA and European Medicines Agency (EMA) in 2016, we began to recognize our share of the collaboration activities within the U.S., E.U. and Canadian territories as described below under "Co-promotion Profits and Losses."
Article 20 Procedure of ZINBRYTASPINRAZA
In July 2017 the EMA announced that it had provisionally restricted the use of ZINBRYTA to adult patients with highly active relapsing disease despite a full and adequate course of treatment with at least one disease modifying therapy (DMT) or with rapidly evolving severe relapsing MS who are unsuitable for treatment with other DMTs. These restrictions followed the initiation of an EMA review (referred to as an Article 20 Procedure) of ZINBRYTA following the report of a case of fatal fulminant liver failure, as well as four cases of serious liver injury. In October 2017, as part of this Article 20 Procedure of ZINBRYTA, the EMA Pharmacovigilance Risk Assessment Committee (PRAC) completed its assessment and recommended a further set of restrictions on the use of ZINBRYTA by MS patients.
In November 2017 the Committee for Medicinal Products for Human Use (CHMP) adopted an opinion, confirming the PRAC's recommendations, for further restrictions to minimize the risk of serious liver injury with ZINBRYTA, including restriction of its use to adult patients with relapsing forms of MS who have had an inadequate response to at least two DMTs and for whom treatment with any other DMT is contraindicated or otherwise unsuitable. In January 2018 the EC adopted a final and legally-binding decision, which concluded the Article 20 Procedure, confirming the CHMP opinion.
The recommendation of these restrictions by the CHMP resulted in the impairment of substantially all of our assets related to ZINBRYTA as we have determined that these amounts may not be recoverable. As a result, we recorded net impairment charges related to intangible assets, inventory, property, plant and equipment and prepaid tax assets, totaling approximately $190.8 million. Inventory related losses are subject to our profit share with AbbVie and are included above net of expected reimbursement. Offsetting these amounts was an unrecorded tax benefit related to certain ZINBRYTA related assets totaling approximately $93.8 million.
Co-promotion Profits and Losses
In the U.S., AbbVie recognizes revenues on sales to third parties and we recognize our 50% share of the co-promotion profits or losses as a component of total revenues in our consolidated statements of income. The collaboration began selling ZINBRYTA in the U.S. in the third quarter of 2016. For the years ended December 31, 2017 and 2016, we recognized a net reduction in revenue of $16.9 million and $21.9 million, respectively, to reflect our share of an overall net loss within the collaboration.
BIOGEN INC. AND SUBSIDIARIES
NOTES TO CONSOLIDATED FINANCIAL STATEMENTS — (Continued)
The following table provides a summary of the U.S. collaboration and our share of the co-promotion losses on ZINBRYTA in the U.S.:
| | | | | | | | | | | For the Year Ended December 31, | | (In millions) | 2017 | | 2016 | | Product revenues, net | $ | 53.1 |
| | $ | 6.1 |
| | Costs and expenses | 92.6 |
| | 50.0 |
| | Co-promotion losses in the U.S. | $ | 39.5 |
| | $ | 43.9 |
| | Biogen's share of co-promotion losses in the U.S. | $ | 16.9 |
| | $ | 21.9 |
|
In the E.U. and Canada, we recognize revenues on sales to third parties in product revenues, net in our consolidated statements of income. We also record the related cost of revenues and sales and marketing expenses to their respective line items in our consolidated statements of income as these costs are incurred. We reimburse AbbVie for their 50% share of the co-promotion profits or losses in the E.U. and Canada. This reimbursement is recognized in collaboration profit (loss) sharing in our consolidated statements of income. We began to recognize product revenues on sales of ZINBRYTA in the E.U. in the third quarter of 2016. For the year ended December 31, 2017, we recognized net expense of $1.3 million to reflect AbbVie's 50% sharing of the net collaboration profits in the E.U. and Canada, as compared to net income recognized of $4.9 million to reflect AbbVie's 50% sharing of the net collaboration losses in the E.U. and Canada in the prior year.
Acorda
In June 20092012 we entered into a collaboration and license agreement with Acorda Therapeutics, Inc. (Acorda)Ionis pursuant to develop and commercialize products containing fampridine, such as FAMPYRA, in markets outside the U.S. We are responsible for all regulatory activities and the future clinical development of related products in those markets.
Under this agreement,which we pay tiered royalties based on the level of ex-U.S. net sales and potential milestone payments based on the successful achievement of certain regulatory and commercial milestones, which would be capitalized as intangible assets upon achievement of the milestones and amortized utilizing an economic consumption model. The next expected milestone would be $15.0 million, due if ex-U.S. net sales reach $100.0 million over a period of four consecutive quarters. Royalty payments are recognized in cost of sales within our consolidated statements of income.
In connection with the collaboration and license agreement, we also entered into a supply agreement with Acorda for the commercial supply of FAMPYRA. This agreement is a sublicense arrangement of an existing agreement between Acorda and Alkermes, who acquired Elan Drug Technologies, the original party to the license with Acorda.
For the years ending December 31, 2017, 2016 and 2015, total cost of sales related to royalties and commercial supply of FAMPYRA reflected in our consolidated statements of income were $34.0 million, $31.5 million and $30.6 million, respectively.
Ionis Pharmaceuticals, Inc.
Product Collaborations
SPINRAZA
In January 2012 we entered intohave an exclusive, worldwide option and collaboration agreement with Ionislicense to develop and commercialize SPINRAZA for the treatment of SMA. During 2014 we amended this agreement to adjust the amount of potential additional payments and terms of the exercise of our opt-in right to license SPINRAZA, which included providing for additional opt-in scenarios, based on the filing or acceptance of a New Drug Application (NDA) with the FDA or marketing authorization application with the EMA. Consistent with the initial agreement, Ionis remained responsible for conducting the pivotal/Phase 3 trials and we provided input on the clinical trial design and regulatory strategy for the development of SPINRAZA.
SPINRAZA was approved for the treatment of SMA in the U.S., E.U. and Japan in December 2016, June 2017 and July 2017, respectively.
BIOGEN INC. AND SUBSIDIARIES
NOTES TO CONSOLIDATED FINANCIAL STATEMENTS — (Continued)
For the years ended December 31, 2017 and 2016, we recognized product revenues totaling $883.7 million and $4.6 million, respectively, on our sales of SPINRAZA. Under our agreement with Ionis, we make royalty payments to Ionis on annual worldwide net sales of SPINRAZA using a tiered royalty rate between 11%11.0% and 15%15.0%, which are recognized in cost of sales within our consolidated statements of income. Royalty cost of sales related to sales of SPINRAZA for the years ended December 31, 20172023, 2022 and 20162021, totaled $112.4approximately $240.2 million, $243.1 million and $0.5$267.1 million, respectively.
Upon entering2018 Ionis Agreement
In June 2018 we entered into thisa 10-year exclusive collaboration agreement we madewith Ionis to develop novel ASO drug candidates for a broad range of neurological diseases for a total payment of $1.0 billion, consisting of an upfront payment of $29.0$375.0 million to Ionis. In addition, during 2017and the purchase of approximately 11.5 million shares of Ionis common stock at a cost of $625.0 million. Upon closing, we made milestone payments to Ionis totaling $150.0recorded $50.9 million related toof the marketing approvals discussed above, which were capitalized in intangible assets, net$375.0 million upfront payment as prepaid services in our consolidated balance sheets. sheets and recognized the remaining $324.1 million as research and development expense in
BIOGEN INC. AND SUBSIDIARIES NOTES TO CONSOLIDATED FINANCIAL STATEMENTS — (Continued) our consolidated statements of income. The amount recorded as prepaid services represented the value of the employee resources committed to the arrangement to provide research and discovery services over the term of the agreement. We have the option to license therapies arising out of this agreement and will be responsible for the development and commercialization of such therapies. We may pay development milestones to Ionis of up to $125.0 million or $270.0 million for each program, depending on the indication plus an annual license fee, as well as royalties on potential net commercial sales. During the third quarteryears ended December 31, 2023, 2022 and 2021, we incurred milestones of 2016, upon$7.5 million, $10.0 million and $22.5 million, respectively, related to the exerciseadvancement of our option to develop and commercialize SPINRAZA, we also paid a $75.0 million license fee to Ionis,neurological targets identified under this agreement, which was recognizedwere recorded as research and development expense in our consolidated statements of income. During 2017 no clinical trial payments were made to Ionis due to the completion of study activities. During 2016 and 2015, we made clinical trial payments of $35.3 million and $42.8 million, respectively, related to the advancement of the program, which were recorded in investments and other assets in our consolidated balance sheets as they represented prepaid research and development expenditures. As of December 31, 2017, these prepaid research and development amounts were fully expensed as the services were provided.
For the years ending December 31, 2017, 2016 and 2015, $234.5 million, $257.8 million and $74.9 million, respectively, were reflected in total costs and expenses in our consolidated statements of income related to the advancement and commercialization of the program.
Antisense TherapeuticsSMA Collaboration Agreement
In December 20122017 we entered into ana collaboration agreement with Ionis to identify new ASO drug candidates for the potential treatment of SMA. Under this agreement, we have the option to license therapies arising out of this collaboration and will be responsible for their development and commercialization of up to three therapeutic targets.such therapies. Under this agreement, Ionis is responsible for global development of any product candidatethrough the completion of a Phase 2 trial and we will provide advice on the clinical trial design and regulatory strategy. We have an option to license the product candidateuntil completion of the Phase 2 trial. If we exercise our option, we will pay a license fee of up to $70.0 million to Ionis and assume global development, regulatory and commercialization responsibilities. Ionis is eligible to receive up to another $130.0 million in milestone payments upon the achievement of certain regulatory milestones as well as royalties on future salesif we successfully develop the product candidate after option exercise.
Upon entering into this agreement, we made ana $25.0 million upfront payment to Ionis and we may pay Ionis up to $260.0 million in additional development and regulatory milestone payments if new drug candidates advance to marketing approval. Upon commercialization, we may also pay Ionis up to $800.0 million in additional performance-based milestone payments and tiered royalties on potential net sales of $30.0such therapies. In December 2021 we exercised our option with Ionis and obtained a worldwide, exclusive, royalty-bearing license to develop and commercialize BIIB115, an investigational ASO in development for SMA. In connection with this option exercise, we made an opt-in payment of $60.0 million to Ionis, which was recorded as research and agreed to make potential additional payments, prior to licensing,development expense in our consolidated statements of up to $10.0 million based onincome for the development of the selected product candidate as well as a mark-up of the cost estimate of the Phase 1 and Phase 2 trials. During 2015 we recognized this $10.0 million developmental milestone upon the selection of BIIB080 (also known as IONIS-MAPTRx), which is currently in Phase 1 development. Research Collaborationsyear ended December 31, 2021.
2013 Long-term Strategic Research Agreement In September 2013 we entered into a six-year research collaboration agreement with Ionis under which both companies collaborate to perform discovery level research and subsequent development and commercialization activities of antisense or other therapeutics for the potential treatment of neurological disorders.diseases. Under the collaboration,this agreement, Ionis will performperforms research on a set of neurological targets identified within thisthe agreement. Once the research has reached a specific stage of development, we will make a determination whether antisense therapy is the preferred approach to developing a therapeutic candidate or whether another modality is preferred. If an antisense approach is selected, Ionis will continue development and identify a potential product candidate. If another modality is selected, we will assume responsibility for identifying a potential product candidate and assume development responsibility for development in that modality. Under this agreement, we made an upfront payment of $100.0 million to Ionis, of which $75.0 million was recorded as research and development expense representing the value of intellectual property purchased that had not reached technological feasibility. We recognized the remaining $25.0 million as prepaid research and discovery services, representing the value of the Ionis full time equivalent employee resources required by the collaboration to provide research and discovery services over the term of the collaboration.
BIOGEN INC. AND SUBSIDIARIES
NOTES TO CONSOLIDATED FINANCIAL STATEMENTS — (Continued)
Ionis is also eligible to receive milestone payments, license fees and royalty payments for all product candidates developed through this collaboration, with the specific amount dependent upon the modality of the product candidate advanced by us. Duringus under the years ending December 31, 2017, 2016 and 2015, we triggered milestonesterms of $12.0 million, $5.5 million and $20.0 million, respectively, related to the advancement of IONIS-SOD1Rx for the treatment of ALS and other neurological targets identified.agreement. For non-ALS antisense product candidates, Ionis will beis responsible for global development through the completion of a Phase 2 trial and we will provide advice on the clinical trial design and regulatory strategy. For ALS antisense product candidates, we are responsible for global development, clinical trial design and regulatory strategy. We have an option to license a product candidate until completion of the Phase 2 trial. If we exercise our option, we will pay Ionis up to a $70.0 million license fee and assume global development, regulatory and commercialization responsibilities. Ionis could receive additional milestone payments upon the achievement of certain regulatory milestones of up to $130.0 million, plus additional amounts related to the cost of clinical trials conducted by Ionis under the collaboration, and royalties on future sales if we successfully develop the product candidate after option exercise. For product candidatesIn December 2018 we exercised our option with Ionis and obtained a worldwide, exclusive, royalty-bearing license to develop and commercialize QALSODY (tofersen), for the treatment of ALS with SOD1 mutations. Following the option exercise, we are solely responsible for the costs and expense related to the development, manufacturing and commercialization of QALSODY. We may pay post-licensing milestone payments to Ionis of up to $55.0 million based on the successful achievement of certain regulatory and commercial milestones.
In April 2023 the FDA approved QALSODY for the treatment of ALS in adults who have a mutation in the SOD1 gene. This indication is approved under accelerated approval based on reduction in plasma neurofilament light chain observed in patients treated with QALSODY. Continued approval for this indication may be contingent upon verification of clinical benefit in confirmatory trial(s). Under this agreement, we make royalty payments to Ionis on annual worldwide net sales of QALSODY using a different modality,tiered royalty rate between 11.0% and 15.0%, which are recognized in cost of sales within our consolidated statements of income.
BIOGEN INC. AND SUBSIDIARIES NOTES TO CONSOLIDATED FINANCIAL STATEMENTS — (Continued) During the year ended December 31, 2023, we will beincurred a milestone payment of $16.0 million to Ionis following the FDA's approval of QALSODY, which was recorded within intangible assets, net in our consolidated balance sheets. We may pay Ionis an additional milestone of $20.0 million if QALSODY receives regulatory approval in the E.U. During the years ending December 31, 2022 and 2021, we incurred milestones of $17.0 million and $10.0 million, respectively, related to the advancement of programs under this agreement, which were recorded as research and development expense in our consolidated statements of income. 2012 Ionis Agreement In December 2012 we entered into an agreement with Ionis for the development and commercialization of up to three gene targets. Under this agreement, Ionis is responsible for global development of any product candidatethrough all stagesthe completion of a Phase 2 trial and we will provide advice on the clinical trial design and regulatory strategy. We have an option to license the product candidateuntil completion of the Phase 2 trial. If we exercise our option, we will pay Ionisa license fee of up to $90.0$70.0 million to Ionis and assume global development, regulatory and commercialization responsibilities. Ionis is eligible to receive up to $130.0 million in additional milestone payments upon the achievement of certain regulatory milestones andas well as royalties on future salesif we successfully develop the product candidate. 2017 SMA Collaboration Agreementcandidate after option exercise.
In December 20172019 we entered into a new collaboration agreementexercised our option with Ionis and obtained a worldwide, exclusive, royalty-bearing license to identify new antisense oligonucleotide drug candidatesdevelop and commercialize BIIB080 (tau ASO), which is currently in Phase 2 development for the potential treatment of SMA. Under this agreement, we will haveAlzheimer's disease. In connection with the option to license therapies arising out of this collaboration and will be responsible for their development and commercialization of these therapies. Upon entering into this agreement,exercise, we made a $25.0payment of $45.0 million upfront payment to Ionis, which was recorded as research and wedevelopment expense in our consolidated statements of income. Future payments may pay Ionisinclude additional milestone payments of up to $260.0$155.0 million in additional development and regulatory milestone payments if new drugs advance to marketing approval. Upon commercialization, we may also pay Ionis up to $800.0 million in additional performance-based milestone payments and tiered royalties on potential netfuture sales in the low- to mid-teens if we successfully develop the product candidate after option exercise.
During the year ended December 31, 2022, we incurred a milestone payment of such therapies.$10.0 million, related to the advancement of BIIB080 under this agreement, which was recorded within research and development expense in our consolidated statements of income. Eisai Co., Ltd. BAN2401During the first quarter of 2023 we accrued a $31.0 million payable to Eisai related to the termination of an agreement whereby Eisai co-promoted or distributed our MS products in certain Asia-Pacific markets and E2609settings. As of December 31, 2023, we paid approximately $16.0 million of the $31.0 million payable. The remaining portion was subsequently paid in January 2024. This termination fee is included in selling, general and administrative expense in our consolidated statements of income for the year ended December 31, 2023.
LEQEMBI (lecanemab) Collaboration In March 2014 we entered intoWe have a collaboration agreement with Eisai (Eisai Collaboration Agreement) to jointly develop and commercialize two Eisai product candidatesLEQEMBI (lecanemab), an anti-amyloid antibody for the treatment of AD, BAN2401, a monoclonal antibody that targets amyloid-beta aggregates, and E2609, a BACE inhibitor. Under the Eisai Collaboration Agreement, Alzheimer's disease (the LEQEMBI Collaboration).
Eisai serves as the global operationallead of LEQEMBI development and regulatory lead forsubmissions globally with both compounds with allcompanies co-commercializing and co-promoting the product, and Eisai having final decision-making authority. All costs, including research, development, sales and marketing expensesexpense, are shared equally bybetween us and Eisai; and following marketing approval in major markets, such as the U.S., the E.U. and Japan, weEisai. We and Eisai would co-promote BAN2401 and E2609LEQEMBI and share profits and losses equally. In smaller markets,We currently manufacture LEQEMBI drug substance and drug product and in March 2022 we extended our supply agreement with Eisai will distribute these products and pay us a royalty. In addition,related to LEQEMBI from five years to ten years for the Eisai Collaboration Agreement provides both parties with certain rights and obligations in the eventmanufacture of a change in control of either party.LEQEMBI drug substance. The EisaiLEQEMBI Collaboration Agreement also provided Eisai with an option to jointly develop and commercialize aducanumab (AducanumabADUHELM (aducanumab) (ADUHELM Option), and an option to jointly develop and commercialize one of our anti-tau monoclonal antibodies (Anti-Tau Option). Upon exercise of each of the Aducanumab Option and the Anti-Tau Option, a separate collaboration agreement would be entered into with Eisai on terms and conditions that mirror the Eisai Collaboration Agreement. In October 2017 Eisai exercised its AducanumabADUHELM Option and we entered into a new collaboration agreement for the joint development and commercialization of aducanumab (AducanumabADUHELM (aducanumab) (the ADUHELM Collaboration Agreement). Eisai has not yet exercised its Anti-Tau Option. Under the Aducanumab Collaboration Agreement, both companies will continue to jointly develop BAN2401 and E2609 in accordance with the Eisai Collaboration Agreement; however, we are no longer required to pay Eisai any milestone payments for products containing BAN2401 and we are no longer entitled to any potential development and commercial milestone payments from Eisai in relation to aducanumab.
BIOGEN INC. AND SUBSIDIARIES NOTES TO CONSOLIDATED FINANCIAL STATEMENTS — (Continued)
On March 14, 2022, we amended our ADUHELM Collaboration Agreement with Eisai. As of the amendment date, we have sole decision making and commercialization rights worldwide on ADUHELM, and beginning January 1, 2023, Eisai receives only a tiered royalty based on net sales of ADUHELM, and no longer participates in sharing ADUHELM's global profits and losses. In March 2022 we also amended the LEQEMBI Collaboration Agreement with Eisai to eliminate the Anti-Tau Option.
A summaryIf either company undergoes a change of activitycontrol, as defined in our LEQEMBI Collaboration Agreement, the non-acquired party may elect to initiate an operational separation, as defined in the LEQEMBI Collaboration Agreement. In the event of an operational separation, we would work with Eisai to effect a timely transition of any development, manufacturing or commercial responsibilities regarding LEQEMBI from us to Eisai. In this scenario, as of six months following the change of control, our ongoing responsibility for LEQEMBI related cost-sharing would be reduced to an amount equal to 80.0% of what we would have owed prior to the Eisaioperational separation, and all other economic rights would remain unchanged.
In addition, in the event either company undergoes a change of control in which the acquirer is engaged in commercialization of a competing product, as defined in the LEQEMBI Collaboration Agreement, is as follows: | | | | | | | | | | | | | | | For the Years Ended December 31, | | (In millions) | 2017 | | 2016 | | 2015 | | Total development expense incurred by the collaboration in development of BAN2401 and E2609 | $ | 146.2 |
| | $ | 95.1 |
| | $ | 84.1 |
| | Biogen's share of BAN2401 and E2609 development expense reflected in our consolidated statements of income, excluding upfront and milestone payments | $ | 74.3 |
| | $ | 50.5 |
| | $ | 40.4 |
|
During the fourth quarter of 2016non-acquired party may also request that the acquired party cease commercializing the competing product. Should the acquired party elect to continue commercializing the competing product, the non-acquired party may terminate the LEQEMBI Collaboration Agreement. Furthermore, in the event we recognized a $50.0 million milestone payment relatedare the non-acquired party, we may choose either to sell our interest in LEQEMBI to Eisai or purchase Eisai's interest in LEQEMBI, subject to the initiation of a Phase 3 trial for E2609, which is included in research and development expense in our consolidated statements of income. We could pay Eisai up to an additional $625.0 million under the Eisai Collaboration Agreement based on the future achievement of certain development, regulatory and commercial milestones.
Aducanumab Collaboration Agreement
Under the Aducanumab Collaboration Agreement, we will continue to lead the ongoing Phase 3 development of aducanumab and will remain responsible for 100% of development costs for aducanumab incurred in support of this agreement until April 2018. Eisai will then reimburse us for 15% of aducanumab development expenses for the period April 2018 through December 2018, and 45% thereafter. Upon commercialization, both companies will co-promote aducanumab with a region-based profit split. We will receive a 55% share of the potential profits (losses)parameters set forth in the U.S., a 68.5% shareLEQEMBI Collaboration Agreement.
In July 2023 the FDA granted traditional approval of LEQEMBI. Prior to receiving traditional approval, LEQEMBI had been granted accelerated approval by the potential profits (losses)FDA in January 2023, at which time it became commercially available in the E.U.U.S. Additionally, in September 2023 the Japanese Ministry of Health, Labor and a 20% share of the potential profits (losses)Welfare approved LEQEMBI in Japan, and Asia, excluding China and South Korea. The companies will continue to share equally in the potential profits (losses) in rest of world markets. We and Eisai also agreed to co-promote AVONEX, TYSABRI and TECFIDERAwhich was subsequently launched in Japan in certain settingsDecember 2023.
Upon commercialization of LEQEMBI, we began recognizing our 50.0% share of LEQEMBI product revenue, net and Eisai will distribute AVONEX, TYSABRI, TECFIDERA and PLEGRIDY in India andcost of sales, including royalties, within other Asia-Pacific markets, excluding China. During the year ended December 31, 2017, $263.4 million was reflected in research and development expenserevenue in our consolidated statements of income, related toas we are not the advancementprincipal.
Our share of our aducanumab program. Anti-Tau Option
Eisai may exercise the Anti-Tau Option after completion of the Phase 1 clinical trial of such anti-tau monoclonal antibody. If Eisai exercises its Anti-Tau Option, we will receive an upfront payment from EisaiLEQEMBI sales and will be entitled to additionalmarketing expense and development expense are recorded within selling, general and commercial milestone payments.
Bristol-Myers Squibb Company
In June 2017 we completed an exclusive license agreement with Bristol-Myers Squibb Company (BMS) for BIIB092 (formerly known as BMS-986168), a Phase 2-ready experimental medicine with potential in ADadministrative expense and PSP. BIIB092 is an antibody targeting tau, the protein that forms the deposits, or tangles, in the brain associated with AD and other neurodegenerative tauopathies such as PSP.
Under this agreement, we received worldwide rights to BIIB092 and are responsible for the full development and global commercialization of BIIB092 in AD and PSP.
Upon entering into this agreement, we made an upfront payment of $300.0 million to BMS and we may pay BMS up to $410.0 million in additional milestone payments, and potential royalties. We also assumed all remaining obligations to the former shareholders of iPierian, Inc. (iPierian) related to BMS’s acquisition of iPierian in 2014. In June 2017 we recognized a $60.0 million developmental milestone payable to the former shareholders of iPierian upon dosing of the first patient in the Phase 2 PSP study for BIIB092 and we may pay the former shareholders of iPierian up to $490.0 million in remaining milestone payments, and potential royalties.
Both the $300.0 million upfront payment and the $60.0 million developmental milestone payment were recognized as research and development expense, inrespectively, within our consolidated statements of incomeincome.
A summary of development and sales and marketing expense related to the LEQEMBI Collaboration is as follows: | | | | | | | | | | | | | | | | | | | | | | | | For the Years Ended December 31, | | (In millions) | | 2023 | | 2022 | | 2021 | | Total development expense incurred by the collaboration related to the advancement of LEQEMBI | | $ | 371.9 | | | $ | 347.2 | | | $ | 323.0 | | | Biogen's share of the LEQEMBI Collaboration development expense reflected in research and development expense in our consolidated statements of income | | 186.0 | | | 173.6 | | | 161.5 | | | Total sales and marketing expense incurred by the LEQEMBI Collaboration | | 304.4 | | | 104.6 | | | 27.2 | | | Biogen's share of the LEQEMBI Collaboration sales and marketing expense reflected in selling, general and administrative expense in our consolidated statements of income | | 152.2 | | | 52.3 | | | 13.6 | |
ADUHELM Collaboration Agreement The LEQEMBI Collaboration also provided Eisai with an option to jointly develop and commercialize ADUHELM (aducanumab) (ADUHELM Option). In October 2017 Eisai exercised its ADUHELM Option and we entered into a new collaboration agreement for the year ended December 31, 2017.joint development and commercialization of ADUHELM (the ADUHELM Collaboration Agreement).
Under our initial ADUHELM Collaboration Agreement, we would lead the ongoing development of ADUHELM, and we and Eisai would co-promote ADUHELM with a region-based profit split. Beginning in 2019, Eisai was reimbursing us for 45.0% of development and sales and marketing expense incurred by the collaboration for the advancement of ADUHELM.
BIOGEN INC. AND SUBSIDIARIES NOTES TO CONSOLIDATED FINANCIAL STATEMENTS — (Continued)
In March 2022 we amended our ADUHELM Collaboration Agreement with Eisai. As of the amendment date, we have sole decision making and commercialization rights worldwide on ADUHELM, and beginning January 1, 2023, Eisai receives only a tiered royalty based on net sales of ADUHELM, and no longer participates in sharing ADUHELM's global profits and losses. Eisai's share of development, commercialization and manufacturing expense was limited to $335.0 million for the period from January 1, 2022 to December 31, 2022, which was achieved as of December 31, 2022. Once this limit was achieved, we became responsible for all ADUHELM related costs.
A summary of development expense, sales and marketing expense and milestone payments related to our initial ADUHELM Collaboration Agreement is as follows: | | | | | | | | | | | | | | | | | | | | | For the Year Ended December 31, | | (In millions) | | | | 2022 | | 2021 | | Total ADUHELM Collaboration development expense | | | | $ | 149.4 | | | $ | 183.7 | | | Biogen's share of the ADUHELM Collaboration development expense reflected in research and development expense in our consolidated statements of income | | | | 82.2 | | | 101.1 | | | Total sales and marketing expense incurred by the ADUHELM Collaboration | | | | 134.2 | | | 562.3 | | | Biogen's share of the ADUHELM Collaboration sales and marketing expense reflected in selling, general and administrative expense and collaboration profit sharing/(loss reimbursement) in our consolidated statements of income | | | | 71.5 | | | 301.4 | | | Total ADUHELM Collaboration third party milestones | | | | — | | | 100.0 | | | Biogen's share of reimbursement from Eisai of ADUHELM milestone payments reflected in collaboration profit sharing/(loss reimbursement) in our consolidated statements of income | | | | — | | | 45 | |
ADUHELM Co-promotion Profits and Losses Under our initial ADUHELM Collaboration Agreement, we recognized revenue on sales of ADUHELM in the U.S. to third parties as a component of product revenue, net in our consolidated statements of income. We also recorded the related cost of revenue and sales and marketing expense in our consolidated statements of income as these costs were incurred. Payments made to and received from Eisai for its 45.0% share of the co-promotion profits or losses in the U.S. were recognized in collaboration profit sharing/(loss reimbursement) in our consolidated statements of income. For the years ended December 31, 2022 and 2021, we recognized net reductions to our operating expense of approximately $224.7 million and $233.2 million, respectively, to reflect Eisai's 45.0% share of net collaboration losses in the U.S. for ADUHELM. For the year ended December 31, 2021, we recognized a net reduction to our operating expense of $45.0 million to reflect Eisai's 45.0% share of the $100.0 million milestone payment made to Neurimmune related to the launch of ADUHELM in the U.S., which was recorded in collaboration profit sharing/(loss reimbursement) in our consolidated statements of income. During the fourth quarter of 2021 we recorded approximately $164.0 million of charges associated with the write-off of inventory and purchase commitments in excess of forecasted demand related to ADUHELM. During the first quarter of 2022, as a result of the final NCD, we recorded approximately $275.0 million of charges associated with the write-off of inventory and purchase commitments in excess of forecasted demand related to ADUHELM. Additionally, for the years ended December 31, 2022 and 2021, we recorded approximately $111.0 million and $30.0 million, respectively, of aggregate gross idle capacity charges related to ADUHELM. These charges were recorded in cost of sales within our consolidated statements of income for the years ended December 31, 2022 and 2021. We recognized approximately $197.0 million and $99.0 million related to Eisai's 45.0% share of inventory, idle capacity charges and contractual commitments in collaboration profit sharing/(loss reimbursement) within our consolidated statements of income for the years ended December 31, 2022 and 2021, respectively. Amounts receivable from Eisai related to the agreements discussed above were approximately $1.4 million and $88.0 million as of December 31, 2023 and 2022, respectively. Amounts payable to Eisai related to the agreements discussed above were approximately $118.4 million and $81.2 million as of December 31, 2023 and 2022, respectively. UCB We have a collaboration agreement with UCB, effective November 2003, to jointly develop and commercialize dapirolizumab pegol, an anti-CD40L pegylated Fab, for the potential treatment of SLE and other future agreed
BIOGEN INC. AND SUBSIDIARIES NOTES TO CONSOLIDATED FINANCIAL STATEMENTS — (Continued) indications. Either we or UCB may propose development of dapirolizumab pegol in additional indications. If the parties do not agree to add an indication as an agreed indication to the collaboration, we or UCB may, at the sole expense of the applicable party, pursue development in such excluded indication(s), subject to an opt-in right of the non-pursuing party after proof of clinical activity. All costs incurred for agreed indications, including research, development, sales and marketing expense, are shared equally between us and UCB. If marketing approval is obtained, both companies will co-promote dapirolizumab pegol and share profits and losses equally. A summary of development expense related to the UCB collaboration agreement is as follows: | | | | | | | | | | | | | | | | | | | | | | | For the Years Ended December 31, | | (In millions) | | 2023 | | 2022 | | 2021 | | Total UCB collaboration development expense | | $ | 60.7 | | | $ | 68.0 | | | $ | 84.2 | | | Biogen's share of the UCB collaboration development expense reflected in research and development expense in our consolidated statements of income | | 30.3 | | | 34.0 | | | 42.1 | |
Alkermes In November 2017 we entered into an exclusive license and collaboration agreement with Alkermes Pharma Ireland Limited, a subsidiary of Alkermes, plc (Alkermes), for BIIB098 (formerly known as ALKS 8700), an oral monomethylVUMERITY, a novel fumarate prodrug in Phase 3 development for the treatment of relapsing formsRMS. In October 2019 the FDA approved VUMERITY in the U.S. for the treatment of MS.RMS. During the fourth quarter of 2021 VUMERITY was approved for the treatment of RRMS in certain international markets. Under this agreement, we received an exclusive, worldwide license to develop and commercialize BIIB098VUMERITY and willwe pay Alkermes a mid-teens percentage royaltyroyalties of 15.0% on potential worldwide net commercial sales of BIIB098.VUMERITY, which are recognized in cost of sales within our consolidated statements of income. Royalties payable on net commercial sales of BIIB098VUMERITY are subject, under certain circumstances, to tiered minimum annual payment requirements for a period of five years following FDA approval. Royalty cost of sales related to sales of VUMERITY for the years ended December 31, 2023, 2022 and 2021, totaled approximately $87.4 million, $83.0 million and $61.6 million, respectively. Alkermes is eligible to receive royalties in the mid-singlehigh-single digits to low-teen percentagessub-teen double digits of annual net commercial sales upon successful development and commercialization of new product candidates, other than BIIB098. VUMERITY, developed under the exclusive license from Alkermes. Alkermes will maintain responsibility for regulatory interactions with the FDA through the potential approval of the NDA for BIIB098 for the treatment of MS. Upon enteringcurrently supplies both VUMERITY and FAMPYRA to us pursuant to separate supply agreements. In October 2019 we entered into thisa new supply agreement we made a $28.0 million upfront payment to Alkermes representingand amended our share of BIIB098 development costs already incurred in 2017. Beginning in 2018 we are responsible for all development expenses related to BIIB098. In December 2017 we also recognized a $50.0 million expense, which is expected to be paid to Alkermes in early 2018, enabling the continuation of the agreement to develop BIIB098. Both the $28.0 million upfront payment and $50.0 million continuation payment were recognized as research and development expense in our consolidated financial statements for the year ended December 31, 2017.
We may also pay Alkermes up to approximately $150.0 million in additional future milestone payments upon certain regulatory achievements related to BIIB098 under this collaboration. For the year ended December 31, 2017, we recorded $80.3 million in research and development expense in our consolidated statements of income related to this collaboration.
In connection with the license and collaboration agreement with Alkermes for VUMERITY. We have elected to initiate a technology transfer and, following a transition period, to manufacture VUMERITY or have VUMERITY manufactured by a third party we may also enterhave engaged in exchange for paying an increased royalty rate to Alkermes on any portion of future worldwide net commercial sales of VUMERITY that is manufactured by us or our designee. In January 2023 we entered into a new supply agreement with Alkermes for FAMPYRA through January 2025. In December 2023 Alkermes entered into a definitive agreement to sell its development and manufacturing facility to Novo Nordisk, which is expected to close in mid-2024. Alkermes and Novo Nordisk plan to enter into subcontracting arrangements to continue work currently performed at the commercial supplyfacility for a period of BIIB098 and other products developed undertime after closing the license and collaboration agreement.transaction, which may continue through the end of 2025.
Applied Genetic Technologies CorporationAcorda Therapeutics, Inc.
In July 2015June 2009 we entered into a collaboration and license agreement with Acorda to develop gene-based therapies for multiple ophthalmic diseases with Applied Genetic Technologies Corporation (AGTC). This collaboration is focused onand commercialize products containing fampridine, such as FAMPYRA, in markets outside the development of a portfolio of AGTC’s therapeutic programs, including both a clinical-stage candidate for X-linked Retinoschisis (XLRS) and a pre-clinical candidate for the treatment of X-Linked Retinitis Pigmentosa (XLRP). This agreement also provides us with options for early stage discovery programs in two ophthalmic diseases and one non-ophthalmic condition, as well as an equity investment in AGTC.U.S. Under this agreement, we received worldwide commercialization rights forpay tiered royalties based on the XLRS and XLRP programs. AGTC will lead the clinical development programslevel of XLRS through product approval and of XLRP through the completion of first-in-human trialsex-U.S. net sales and we will supportmay pay potential milestone payments based on the related clinical development costs, subject tosuccessful achievement of certain conditions, following the first-in-human study for XLRS and IND-enabling studies for XLRP. AGTC has an option to share development costs and profits after the initial clinical trial data becomes available, and an option to co-promote the second of these products approved in the U.S. Upon entering into this agreement we made an upfront payment of $124.0 million to AGTC. AGTC is also eligible to receive development, regulatory and commercial milestone payments aggregating in excessmilestones.
In January 2024 we notified Acorda of $1.1 billion, which includes upour decision to $467.5 million collectively forterminate our collaboration and license agreement, effective January 1, 2025. As a result of this termination, Acorda will regain global commercialization rights to FAMPYRA. For the two lead programsyears ended December 31, 2023, 2022 and up2021, total cost of sales related to $592.5 million across the discovery programs. AGTC is also eligible to receive royalties in the mid-single digit to mid-teen percentagesand commercial supply of annual net sales upon successful development and commercialization of new product candidates. The $124.0 million upfront paymentFAMPYRA reflected a $30.0 million equity investment in AGTC, prepaid research and development expenditures of $58.4 million and total licensing and other fees of $35.6 million. The $35.6 million in total licensing and other fees were recognized as a charge to research and development expense in our consolidated statements of income for the year ended December 31, 2015. The $30.0were approximately $55.2 million, equity investment$46.1 million and the $58.4$46.6 million, of prepaid research and development expenditures were recorded in investments and other assets in our consolidated balance sheets. These prepaid research and development amounts are being expensed as the services are provided, of which $11.1 million remains as a prepaid asset as of December 31, 2017.
respectively.
BIOGEN INC. AND SUBSIDIARIES NOTES TO CONSOLIDATED FINANCIAL STATEMENTS — (Continued)
Sage Therapeutics, Inc.
In November 2020 we entered into a global collaboration and license agreement with Sage to jointly develop and commercialize ZURZUVAE (zuranolone) for the treatment of PPD and potential treatment of MDD and BIIB124 (SAGE-324) for the potential treatment of essential tremor with potential in other neurological conditions such as epilepsy. In connection with the closing of this transaction in December 2020 we purchased $650.0 million of Sage common stock, or approximately 6.2 million shares at approximately $104.14 per share, which were initially subject to transfer restrictions. We may pay Sage development and commercial milestone payments that could total up to approximately $1.6 billion if all the specified milestones set forth in this collaboration are achieved. In August 2023 the FDA approved ZURZUVAE for adults with PPD, pending DEA scheduling, which was completed in October 2023. Upon approval, ZURZUVAE became the first and only oral, once-daily, 14-day treatment that can provide rapid improvements in depressive symptoms by day 15 for women with PPD. ZURZUVAE for PPD became commercially available in the U.S. during the fourth quarter of 2023. Additionally, the FDA issued a CRL for the NDA for zuranolone in the treatment of adults with MDD. The CRL stated that the application did not provide substantial evidence of effectiveness to support the approval of zuranolone for the treatment of MDD and that an additional study or studies would be needed. We and Sage are continuing to seek feedback from the FDA and evaluating next steps. Under this collaboration, both companies will share equal responsibility and costs for development as well as profits and losses for commercialization in the U.S. Outside of the U.S., we are responsible for development and commercialization, excluding Japan, Taiwan and South Korea, with respect to zuranolone and may pay Sage potential tiered royalties in the high teens to low twenties. During the fourth quarter of 2023 we accrued a milestone payment due to Sage of $75.0 million upon the first commercial sale of ZURZUVAE for PPD in the U.S., which was recorded within intangible assets, net in our consolidated balance sheets, and subsequently paid in January 2024. For the yearsyear ended December 31, 2017, 2016 and 20152023, we recorded $27.5recognized net reductions to our operating expense of approximately $4.7 million $26.5 million and $54.5 million, respectively,to reflect Sage's 50.0% share of net collaboration losses in the U.S., which were reflectedis recognized in research and development expensecollaboration profit sharing/(loss reimbursement) in our consolidated statements of incomeincome. A summary of development and sales and marketing expense related to this collaboration.the Sage collaboration is as follows: | | | | | | | | | | | | | | | | | | | | | | | For the Years Ended December 31, | | (In millions) | | 2023 | | 2022 | | 2021 | | Total Sage collaboration development expense | | $ | 176.7 | | | $ | 173.3 | | | $ | 167.7 | | | Biogen's share of the Sage collaboration development expense reflected in research and development expense in our consolidated statements of income | | 88.3 | | | 86.7 | | | 83.8 | | | Total sales and marketing expense incurred by the Sage collaboration | | 187.0 | | | 109.9 | | | 36.4 | | | Biogen's share of the Sage collaboration sales and marketing expense reflected in selling, general and administrative expense and collaboration profit sharing/(loss reimbursement) in our consolidated statements of income | | 93.5 | | | 55.0 | | | 18.2 | |
BIOGEN INC. AND SUBSIDIARIES NOTES TO CONSOLIDATED FINANCIAL STATEMENTS — (Continued) Denali Therapeutics Inc. In connection with the collaboration and license agreement, we also received a manufacturing license under which we received an exclusive license to use AGTC’s proprietary technology platform to make AAV vectors for up to six genes, three of which are in AGTC’s discretion, in exchange for payment of milestones and royalties. University of Pennsylvania
In May 2016August 2020 we entered into a collaboration and alliancelicense agreement with Denali to co-develop and co-commercialize Denali's small molecule inhibitors of LRRK2 for Parkinson's disease (LRRK2 Collaboration) and also entered into a separate agreement to obtain an exclusive option to license two preclinical programs from Denali's Transport Vehicle platform, including its ATV-enabled anti-amyloid beta program and a second program utilizing its Transport Vehicle technology.
As part of this collaboration we purchased $465.0 million of Denali common stock in September 2020, or approximately 13 million shares at approximately $34.94 per share, which were initially subject to transfer restrictions. We may pay Denali development and commercial milestone payments that could total up to approximately $1.1 billion if the milestones related to the LRRK2 Collaboration are achieved. In April 2023 we exercised our option with Denali to license the ATV-enabled anti-amyloid beta program. In connection with this exercise, we assumed responsibility for all development and commercial activities and associated expenses related to this program. In addition, we made a one-time option exercise payment to Denali and, should certain milestones be achieved, may pay Denali additional development and commercial milestone payments and royalties based on future net sales. Our agreement with Denali was amended in August 2023, whereby certain milestone criteria were changed, while the total amount of development, regulatory and commercial milestones remains the same. In addition, we agreed to waive our option right to the second option program. Under the LRRK2 Collaboration, both companies share responsibility and costs for global development based on specified percentages as well as profits and losses for commercialization in the U.S. and China. Outside the U.S. and China we are responsible for commercialization and may pay Denali potential tiered royalties. A summary of development expense related to the Denali collaboration is as follows: | | | | | | | | | | | | | | | | | | | | | | | For the Years Ended December 31, | | (In millions) | | 2023 | | 2022 | | 2021 | | Total Denali collaboration development expense | | $ | 65.0 | | | $ | 75.1 | | | $ | 42.5 | | | Biogen's share of the Denali collaboration development expense reflected in research and development expense in our consolidated statements of income | | 39.0 | | | 43.8 | | | 25.5 | |
Sangamo Therapeutics, Inc. In February 2020 we entered into a collaboration and license agreement with Sangamo to pursue certain neurological targets leveraging Sangamo’s proprietary zinc finger protein technology delivered via adeno-associated virus to modulate the expression of key genes involved in neurological diseases. In connection with the Universityclosing of Pennsylvania (UPenn)this transaction in April 2020 we purchased $225.0 million of Sangamo common stock, or approximately 24 million shares at approximately $9.21 per share, which were initially subject to advance gene therapytransfer restrictions. These restrictions have now lapsed. In March 2023 we terminated our collaboration and gene editing technologies. Thelicense agreement with Sangamo. A summary of development expense related to the Sangamo collaboration is primarily focused onas follows: | | | | | | | | | | | | | | | | | | | | | | | For the Years Ended December 31, | | (In millions) | | 2023 | | 2022 | | 2021 | | Total Sangamo collaboration development expense | | $ | 4.1 | | | $ | 19.1 | | | $ | 22.7 | | | Biogen's share of the Sangamo collaboration development expense reflected in research and development expense in our consolidated statements of income | | 2.4 | | | 12.1 | | | 14.6 | |
InnoCare Pharma Limited In July 2021 we entered into a collaboration and license agreement with InnoCare Pharma Limited (InnoCare) for orelabrutinib, an oral small molecule Bruton's tyrosine kinase inhibitor for the developmentpotential treatment of therapeutic approaches that targetMS. In connection with the eye, skeletal muscle and the central nervous system. The alliance is also focused on the research and validationclosing of next-generation gene transfer technology using adeno-associated virus gene delivery vectors and exploring the expanded use of genome editing technology as a potential therapeutic platform. Upon entering into this agreementtransaction in August 2021 we made an upfront payment of $20.0$125.0 million to UPenn, whichthat was recorded as research and development expense inwithin our consolidated statements of income and made prepaid research and development expenditures of $15.0 million, which was recorded in investments and other assets in our consolidated balance sheets. During 2017, we made additional prepaid research and development expenditures to UPenn of $29.1 million related tofor the advancement of these programs. These prepaid research and development amounts are being expensed as the services are provided, of which $12.7 million remains as a prepaid asset as of December 31, 2017. We also expect to fund an additional $18.4 million in additional research and development costs in seven preclinical research and development programs, as well as the exploration of genome-editing technology.
If all of the collaborations programs are successful and we exercise all of our options under the UPenn collaboration and alliance, we may be required to make future payments of over $2.0 billion in research funding, options and milestone payments. UPenn is also eligible to receive royalties in the mid-single digit to mid-teens percentages of annual net sales upon successful development and commercialization of new product candidates.
For the yearsyear ended December 31, 20172021.
BIOGEN INC. AND SUBSIDIARIES NOTES TO CONSOLIDATED FINANCIAL STATEMENTS — (Continued) In February 2023 we terminated our collaboration and 2016, we recorded $33.0 million and $27.8 million, respectively, in research and development expense in our consolidated statementslicense agreement with InnoCare for orelabrutinib, for the potential treatment of income related to this collaboration.MS. Other Research and Discovery Arrangements For the years ended December 31, 2017, 2016 and 2015, we entered into several research, discovery and other related arrangements that resulted in $10.0 million, $10.3 million and $9.7 million, respectively, recorded as research and development expense in our consolidated statements of income.
These arrangements may include the potential for future milestone payments based on the achievement of certain clinical and commercial development payable over a period of several years. Other For the years ended December 31, 2023, 2022 and 2021, we recorded approximately$4.1 million, $39.2 million and $89.1 million, respectively, as research and development expense in our consolidated statements of income related to other research and discovery related arrangements. Samsung Bioepis Co., Ltd. Joint Venture Agreement In February 2012 we entered into a joint venture agreement with Samsung Biologics,BioLogics establishing an entity, Samsung Bioepis, to develop, manufacture and market biosimilar pharmaceuticals.products. Samsung BiologicsBioLogics contributed 280.5 billion South Korean won (approximately $250.0 million) for an 85% stake85.0% ownership interest in Samsung Bioepis and we contributed approximately 49.5 billion South Korean won (approximately $45.0 million) for the remaining 15%15.0% ownership interest. Under theIn June 2018 we exercised our option under our joint venture agreement we have no obligation to provide any additional funding andincrease our ownership interest may be diluted due to financingspercentage in which we do not participate. As of December 31, 2017, our ownership interest isSamsung Bioepis from approximately 5%5.0%, which reflectsreflected the effect of additionalprevious equity financings in which we did not participate. We maintain an optionparticipate, to approximately 49.9%. The share purchase additional stocktransaction was completed in November 2018 and, upon closing, we paid 759.5 billion South Korean won ($676.6 million) to Samsung BioLogics. In April 2022 we completed the sale of our 49.9% equity interest in Samsung Bioepis that would allow us to increase our ownership percentageSamsung BioLogics in exchange for total consideration of approximately $2.3 billion. Under the terms of this transaction, we received approximately $1.0 billion in cash at closing, with approximately $1.3 billion in cash to be deferred over two payments. The first deferred payment of $812.5 million was received in April 2023 and the second deferred payment of $437.5 million is due at the second anniversary of the closing of this transaction in April 2024. As part of this transaction, we are also eligible to receive up to 49.9%. The exercisean additional $50.0 million upon the achievement of certain commercial milestones. Our policy for contingent payments of this optionnature is within our control and is based on paying for 49.9% ofto recognize the total investment made by Samsung Biologics into Samsung Bioepis in excess of what we have already contributed under the joint venture agreement plus a rate that will represent their return on capital. If we do not exercise this option by mid-2018, this option will expire and Samsung Biologics will have the right to purchase all of Samsung Bioepis’ shares then held by us.
BIOGEN INC. AND SUBSIDIARIES
NOTES TO CONSOLIDATED FINANCIAL STATEMENTS — (Continued)
We account for this investment under the equity method of accounting as we maintain the ability to exercise significant influence over Samsung Bioepis through a presence on the entity’s Board of Directors and our contractual relationship. Under the equity method, we recorded our original investment at cost and subsequently adjust the carrying value of our investment for our share of equitypayments in the entity’s income or losses accordingperiod that they become realizable, which is generally the same period in which the payments are earned.
Prior to our percentage of ownership. We recognizethis sale, we recognized our share of the results of operations related to our investment in Samsung Bioepis under the equity method of accounting one quarter in arrears when the results of the entity becomebecame available, which iswas reflected as equity in (income) loss of investee, net of tax in our consolidated statements of income. During Upon our November 2018 investment, the equity method of accounting required us to identify and allocate differences between the fair value of our investment and the carrying value of our interest in the underlying net assets of the investee. These basis differences were being amortized over their economic life, until the completion of the sale in April 2022, as discussed above. The total basis difference was approximately $675.0 million and related to inventory, developed technology, IPR&D and deferred tax balances. The basis differences related to inventory were amortized, net of tax, over their estimated useful lives of 1.5 years, and the basis differences related to developed technology and IPR&D for marketed products were being amortized, net of tax, over their estimated useful lives of 15 years. For the year ended December 31, 2015,2022, we recognized a lossnet income on our investment of $12.5 million. During 2015, as$2.6 million, reflecting our share of Samsung Bioepis' operating profits, net of tax, totaling $17.0 million offset by amortization of basis differences totaling $14.4 million. Following the sale of Samsung Bioepis we no longer recognize gains or losses exceededassociated with Samsung Bioepis' results of operations and amortization related to basis differences. For the carrying valueyear ended December 31, 2021, we recognized net income on our investment of $34.9 million, reflecting our share of Samsung Bioepis' operating profits, net of tax, totaling $64.6 million offset by amortization of basis differences totaling $29.7 million. Net income on our investment for the year ended December 31, 2021, reflects a $31.2 million benefit related to the release of a valuation allowance on deferred tax assets associated with Samsung Bioepis. The valuation allowance was released in the second quarter of 2021 based on a consideration of the positive and negative evidence, including the historic earnings of Samsung Bioepis.
BIOGEN INC. AND SUBSIDIARIES NOTES TO CONSOLIDATED FINANCIAL STATEMENTS — (Continued) For additional information on the sale of our investment,equity interest in Samsung Bioepis, please read Note 3, Dispositions, to these consolidated financial statements. 2019 Development and Commercialization Agreement In December 2019 we suspended recognizing additional lossescompleted a transaction with Samsung Bioepis and secured the exclusive rights to commercialize two potential ophthalmology biosimilar products, BYOOVIZ (ranibizumab-nuna), a ranibizumab biosimilar referencing LUCENTIS, and SB15, a proposed aflibercept biosimilar referencing EYLEA, in major markets worldwide, including the U.S., Canada, Europe, Japan and Australia. Samsung Bioepis will be responsible for development and will continuesupply both products to do so unlessus at a pre-specified gross margin of approximately 45.0%. During the third quarter of 2021 we commitaccrued $15.0 million in milestone payments related to providingthe approval of BYOOVIZ in the U.S., the E.U. and the U.K., that were capitalized within intangible assets, net in our consolidated balance sheets. We may also pay Samsung Bioepis up to approximately $180.0 million in additional funding.development, regulatory and sales-based milestones. 2013 Commercial Agreement In December 2013 pursuant to our rights under the joint venture agreement with Samsung Biologics, we entered into an agreement with Samsung Bioepis to commercialize, over a 10-year term, three anti-tumor necrosis factor (TNF)3 anti-TNF biosimilar product candidates which includes IMRALDI, an adalimumab biosimilar referencing HUMIRA, FLIXABI, an infliximab biosimilar referencing REMICADE, and BENEPALI, an etanercept biosimilar referencing ENBREL, in Europe, and in the case of one anti-TNF biosimilar,BENEPALI, Japan. UnderWe have an option to extend this agreement we have made total upfront and clinical development milestone paymentsby an additional five years, subject to payment of $46.0an option exercise fee of $60.0 million all of which have been recorded as research and development expense in our consolidated statements of income as the programs they relate to had not achieved regulatory approval.by August 2024. We also agreedhave an option to make additional milestone payments of $25.0 million upon regulatory approvalacquire exclusive rights to commercialize these products in the E.U. for each of the three anti-TNF biosimilar product candidates. During the years ended December 31, 2017 and 2016, we paid $25.0 million and $50.0 million, respectively, in milestone payments, which have been capitalized in intangible assets, net in our consolidated balance sheets as IMRALDI received regulatory approval in the E.U. in August 2017, BENEPALI received regulatory approval in the E.U. in January 2016 and FLIXABI received regulatory approval in the E.U. in May 2016.China. We began to recognize revenuesreflect revenue on sales of BENEPALI, in the E.U. in the first quarter of 2016 and FLIXABI in the E.U. in the third quarter of 2016. We reflect revenues on sales of BENEPALIIMRALDI and FLIXABI to third parties in product revenues,revenue, net in our consolidated statements of income and record the related cost of revenuesrevenue and sales and marketing expensesexpense in our consolidated statements of income to their respective line items when these costs are incurred. Royalty payments to AbbVie on sales of IMRALDI are recognized in cost of sales within our consolidated statements of income. We share 50%50.0% of the profit or loss related to our commercial agreement with Samsung Bioepis. This profit sharing with Samsung Bioepis, which is recognized in collaboration profit (loss) sharingsharing/(loss reimbursement) in our consolidated statements of income. For the years ended December 31, 20172023, 2022 and 2016,2021, we recognized a net profit-sharing expense of $111.0of $223.5 million, $217.4 million and $15.1$285.4 million, respectively, to reflect Samsung Bioepis's 50%Bioepis' 50.0% sharing of the net collaboration profits. Other Services Simultaneous with the formation of Samsung Bioepis, we also entered into a license agreement a technical development services agreement and a manufacturing agreement with Samsung Bioepis. Under thethis license agreement, we granted Samsung Bioepis an exclusive license to use, develop, manufacture and commercialize biosimilar products created by Samsung Bioepis using Biogen product-specific technology. In exchange, we will receive single digit royalties on all biosimilar products developed and commercialized by Samsung Bioepis. UnderRoyalty revenue under the technical development serviceslicense agreement we provide Samsung Bioepis technical developmentis recognized as a component of contract manufacturing, royalty and technology transfer services, which include, but are not limited to, cell culture development, purification process development, formulation development and analytical development. Underother revenue in our manufacturing agreement, we manufacture clinical and commercial quantitiesconsolidated statements of bulk drug substance of biosimilar products for Samsung Bioepis pursuant to contractual terms. Under limited circumstances, we may also supply Samsung Bioepis with quantities of drug product of biosimilar products for use in clinical trials through arrangements with third-party contract manufacturers.income. For the years ended December 31, 2017, 20162023, 2022 and 2015,2021, we recognized $42.7$13.6 million, $20.2$20.6 million and $62.9$20.7 million, respectively, in revenues in relation to these services, which is reflected as a component of contract manufacturing, royalty and other revenuesrevenue in our consolidated statements of income related to the license agreement and other services performed under our collaboration with Samsung Bioepis. Amounts receivable from Samsung Bioepis related to the agreements discussed above were $9.9 million and $2.0 million as of December 31, 2023 and 2022, respectively. Amounts payable to Samsung Bioepis related to the agreements discussed above were $73.7 million and $40.5 million as of December 31, 2023 and 2022, respectively.
BIOGEN INC. AND SUBSIDIARIES NOTES TO CONSOLIDATED FINANCIAL STATEMENTS — (Continued) | | | | | | | Note 20: | Investments in Variable Interest Entities |
Consolidated Variable Interest Entities Our consolidated financial statements include the financial results of variable interest entities in which we are the primary beneficiary. The following are our significant variable interest entities. Neurimmune SubOne AG Beginning in 2007 we consolidated the results of Neurimmune as we determined we were the primary beneficiary because we had the power through the collaboration to direct the activities that most significantly impacted the entity's economic performance and we were required to fund 100.0% of the research and development costs incurred in support of the collaboration. The collaboration and license agreement with Neurimmune was for the development and commercialization of antibodies for the potential treatment of Alzheimer's disease, including ADUHELM (as amended, the Neurimmune Agreement). In November 2023 we notified Neurimmune of our decision to terminate the Neurimmune Agreement. Subsequent to the termination, we reconsidered our relationship with Neurimmune and determined that we were no longer the primary beneficiary of the variable interest entity. As a result, we recorded a net gain on the deconsolidation of Neurimmune of approximately $3.0 million, which was recorded in other (income) expense, net within our consolidated statements of income for the year ended December 31, 2023. In June 2021 ADUHELM was granted accelerated approval by the FDA. Under the terms of the Neurimmune Agreement, we were required to pay Neurimmune a milestone payment of $100.0 million related to the launch of ADUHELM in the U.S. During the second quarter of 2021 we made this $100.0 million payment, which was recognized as a charge to net income (loss) attributable to noncontrolling interests, net of tax in our consolidated statements of income. In addition, during the second quarter of 2021 we recognized net profit-sharing income of $45.0 million to reflect Eisai's 45.0% share of the $100.0 million milestone payment, which was recognized in collaboration profit sharing/(loss reimbursement) in our consolidated statements of income. During 2021 we recorded a net deferred tax asset in Switzerland of approximately $100.0 million on Neurimmune's tax basis in ADUHELM, the realization of which was dependent on future sales of ADUHELM. During the first quarter of 2022, upon issuance of the final NCD related to ADUHELM, we recorded an increase in a valuation allowance of approximately $85.0 million to reduce the net value of this deferred tax asset to zero. These adjustments to our net deferred tax asset were each recorded with an equal and offsetting amount assigned to net income (loss) attributable to noncontrolling interests, net of tax in our consolidated statements of income, resulting in a zero net impact to net income attributable to Biogen Inc. 21. LitigationExcluding the impact of the Neurimmune deferred tax asset, the assets and liabilities of Neurimmune are not significant to our consolidated financial position or results of operations as it is a research and development organization. We have provided no financing to Neurimmune other than contractually required amounts.
Research and development costs for which we reimbursed Neurimmune are reflected in research and development expense in our consolidated statements of income. For the years ended December 31, 2023, 2022 and 2021, amounts reimbursed were immaterial. For additional information on our collaboration arrangements with Eisai, please read Note 19, Collaborative and Other Relationships, to these consolidated financial statements. Unconsolidated Variable Interest Entities We have relationships with various variable interest entities that we do not consolidate as we lack the power to direct the activities that significantly impact the economic success of these entities. These relationships include investments in certain biotechnology companies and research collaboration agreements. As of December 31, 2023 and 2022, the carrying value of our investments in certain biotechnology companies representing potential unconsolidated variable interest entities totaled $16.4 million and $27.8 million, respectively. Our maximum exposure to loss related to these variable interest entities is limited to the carrying value of our investments. We have also entered into research collaboration agreements with certain variable interest entities where we are required to fund certain development activities. These development activities are included in research and
BIOGEN INC. AND SUBSIDIARIES NOTES TO CONSOLIDATED FINANCIAL STATEMENTS — (Continued) development expense in our consolidated statements of income as they are incurred. We have provided no financing to these variable interest entities other than previous contractually required amounts. We are currently involved in various claims, investigations and legal proceedings, including the matters described below. For information as to our accounting policies relating to claims and legal proceedings, including use of estimates and contingencies, please read Note 1, Summary of Significant Accounting Policies, to these consolidated financial statements.
BIOGEN INC. AND SUBSIDIARIES
NOTES TO CONSOLIDATED FINANCIAL STATEMENTS — (Continued)
With respect to some loss contingencies, an estimate of the possible loss or range of loss cannot be made until management has further information, including, for example, (i) which claims, if any, will survive dispositive motion practice; (ii) information to be obtained through discovery; (iii) information as to the parties' damages claims and supporting evidence; (iv) the parties’ legal theories; and (v) the parties' settlement positions. If an estimate of the possible loss or range of loss can be made at this time, it is included in the potential loss contingency description below. The claims and legal proceedings in which we are involved also include challenges to the scope, validity or enforceability of the patents relating to our products, pipeline or processes and challenges to the scope, validity or enforceability of the patents held by others. These include claims by third partiesthird-parties that we infringe their patents. An adverse outcome in any of these proceedings could result in one or more of the following and have a material impact on our business or consolidated results of operations and financial position: (i) loss of patent protection; (ii) inability to continue to engage in certain activities; and (iii) payment of significant damages, royalties, penalties and/or license fees to third parties. Loss Contingencies Qui Tam Litigation
On July 6, 2015, a qui tam action filed on behalf of the United States and certain states was unsealed by the U.S. District Court for the District of Massachusetts. The action alleges sales and promotional activities in violation of the federal False Claims Act and state law counterparts, and seeks single and treble damages, civil penalties, interest, attorneys’ fees and costs. Our motion to dismiss is pending. The United States has not made an intervention decision. An estimate of the possible loss or range of loss cannot be made at this time.
ADUHELM Securities Litigation We and certain current and former officers are defendants in antwo actions related to ADUHELM filed in the United States District Court for the District of Massachusetts (the District Court). Both actions allege violations of federal securities laws under 15 U.S.C. §78j(b) and §78t(a) and 17 C.F.R. §240.10b-5 and seek declarations of the actions as class actions and monetary relief. In October 2023 the United States Court of Appeals for the First Circuit reversed in part and affirmed in part the dismissal of the shareholder action related to ADUHELM that was filed in November 2020. In March 2023 the District Court dismissed the shareholder action that was filed in February 2022. In May 2023 the plaintiff filed a motion to alter the judgment and amend the complaint, which is pending. Derivative Actions We and members of the Board of Directors are named as defendants in derivative actions filed by shareholders in February and July 2022, in the U.S. District Court for the District of Massachusetts. The actions allege violations of federal securities laws under 15 U.S.C. §78n(a) and 17 C.F.R. §240 14.a-9, and breaches of fiduciary duties and waste of corporate assets, and seek declaratory and injunctive relief, monetary relief payable to Biogen, and attorneys’ fees and costs payable to the plaintiffs. The Court has stayed both cases. IMRALDI Patent Litigation In June 2022 Fresenius Kabi Deutschland GmbH (Fresenius Kabi) filed a shareholderclaim for damages and injunctive relief against Biogen France SAS in the Tribunal de Grande Instance de Paris, alleging that IMRALDI, the adalimumab biosimilar product of Samsung Bioepis that Biogen commercializes in Europe, infringes the French counterpart of European Patent 3 145 488 (the EP ‘488 Patent), which expires in May 2035. In August 2022 Fresenius Kabi filed a claim for damages and injunctive relief against Biogen GmbH in the Düsseldorf Regional Court, alleging infringement of the German counterpart of the EP '488 Patent. A hearing in the Düsseldorf Regional Court was held in December 2023 and a decision is pending. The EP '488 Patent is the subject of opposition proceedings in the EPO Technical Boards of Appeal.
BIOGEN INC. AND SUBSIDIARIES NOTES TO CONSOLIDATED FINANCIAL STATEMENTS — (Continued) Litigation with Former Convergence Shareholders In 2015 Biogen acquired Convergence, a U.K. company. In 2019 Shareholder Representative Services LLC, on October 20, 2016behalf of the former shareholders of Convergence, asserted claims of $200.0 million for alleged breaches of the contract pursuant to which we acquired Convergence. In June 2023 Shareholder Representative Services LLC and 24 former shareholders filed suit against us in the High Court of Justice of England and Wales on one of the previously asserted claims, seeking payment of $49.9 million, interest and costs. ERISA Class Action Litigation In 2020 participants in the Biogen 401(k) Savings Plan filed actions against us in the U.S. District Court for the District of Massachusetts alleging violationsbreach of federal securities lawsfiduciary duty under 15 U.S.C §78j(b) and §78t(a) and 17 C.F.R. §240.10b-5ERISA and seeking a declaration of the actions as class actions and monetary and other relief. In January 2024 the Court granted final approval of a settlement under which we agreed to pay $9.75 million without any admission of liability and dismissed the actions with prejudice. Humana Patient Assistance Litigation In March 2023 the U.S. District Court for the District of Massachusetts dismissed the previously disclosed action filed against us by Humana in September 2020. Humana had alleged damages related to our providing MS patients with free medications and making charitable contributions to non-profit organizations that assist MS patients and had alleged violations of the federal RICO Act and state laws. In December 2023 Humana appealed to the United States Court of Appeals for the First Circuit and the appeal is pending. Genentech Litigation In February 2023 Genentech, Inc. filed suit against us in the U.S. District Court for the Northern District of California, alleging that it is owed royalties on sales of TYSABRI that occurred after the expiration of a patent licensed by Genentech to Biogen, together with interest and costs. The Company estimates that the royalties claimed total approximately $88.3 million. Bardoxolone Securities Litigation In 2021 and 2022 putative stockholders of Reata (later acquired by Biogen) filed litigation in the United States District Court for the Eastern District of Texas alleging violations of the federal securities laws by Reata, certain former officers and directors and certain underwriters under 15 U.S.C. §78j(b) and §78t(a), 17 C.F.R. §240.10b-5, and 15 U.S.C. §§77k, 77l(a)(2) and 77o in connection with Reata's asset bardoxolone. Plaintiffs seek declaration of the actions as a class actionactions and an awardmonetary relief. In October 2023 the parties reached a settlement providing for payment by Reata of damages, interest$45.0 million without any admission of liability. The Court preliminarily approved the settlement in November 2023 and attorneys' fees. An estimatehas set a final fairness hearing for March 2024. We expect a portion of the possible loss or rangepayment to be reimbursed under Reata's insurance coverage. Lender Dispute One of loss cannot be made at this time.Reata's lenders claims that approximately $23.3 million is owing under a loan agreement with Reata. Other Matters Abbreviated New Drug Application (ANDA) LitigationGovernment Investigations
The Company has received subpoenas from the SEC seeking information relating to TECFIDERAADUHELM and its launch. The Company has received a subpoena from the DOJ seeking information relating to our business operations in several foreign countries. The Company is also providing information relating to our business operations in several foreign countries to the SEC. TYSABRI Biosimilar Patent Matter In June, July, and September 2017 and January 2018,2022 we initiated patent infringement proceedings pursuant to the Hatch-Waxman actfiled an action in the U.S. District Court for the District of Delaware against Amneal Pharmaceuticals LLC, Aurobindo Pharma U.S.A., Inc., Caribe Holdings (Cayman) Co. Ltd. DBA Puracap Caribe, Puracap International LLC, Graviti Pharmaceuticals Pvt. Ltd., Hetero USA, Inc., Impax Laboratories, Inc., Prinston Pharmaceutical Inc., Slayback Pharma LLC, Teva Pharmaceuticals USA, Inc., Alkem Laboratories Ltd., Cipla Limited, Glenmark Pharmaceuticals Ltd., Lupin Atlantis Holdings SA, Macleods Pharmaceuticals, Ltd., MSN Laboratories Pvt. Ltd., Pharmathen S.A., Shipla Medicare Limited, Sun Pharma Global FZE, Torrent Pharmaceuticals Ltd., TWi Pharmaceuticals, Inc., Windlas Healthcare Pvt. Ltd., Accord Healthcare Inc., Par Pharmaceutical Inc., Sandoz Inc., Sawai USA, Inc.other Sandoz entities and Zydus Pharmaceuticals (USA) Inc. In addition, we initiatedPolpharma Biologics S.A. under the Biologics Price Competition and Innovation Act, 42 U.S.C. §262, seeking a declaratory judgment of patent infringement proceedings pursuant to the Hatch-Waxman act against Stason Pharmaceuticals, Inc.infringement. Annulment Proceedings in the U.S. DistrictGeneral Court forof the Central District of California, Zydus Pharmaceuticals (USA) Inc.European Union relating to TECFIDERA In November 2020 Mylan Ireland filed an action in the U.S. DistrictGeneral Court forof the DistrictEuropean Union to annul the EMA's decision not to validate its applications to market generic versions of New Jersey, Accord Healthcare Inc. inTECFIDERA on the U.S. District Court for the Middle District of North Carolina, Par Pharmaceutical Inc. in the U.S. District Court for the Southern District of New York, Sandoz Inc. in the U.S. District Court for the District of Colorado and Mylan Pharmaceuticals Inc. in the U.S. District Court for the Northern District of West Virginia. The cases against Accord Healthcare Inc., Zydus Pharmaceuticals (USA) Inc. and Sandoz Inc. have been dismissed in the North Carolina, New Jersey and Colorado courts but will continue against those parties in Delaware. The cases against Par Pharmaceutical Inc. in both New York and Delaware have been dismissed because Par Pharmaceutical Inc.’s ANDA application has been withdrawn. The case against Stason Pharmaceuticals, Inc. in California has been dismissed, but the case against its partner Sawai USA, Inc. will proceed in Delaware.
We expect a trial in the Delaware actions in December 2019, and a trial has been set in the West Virginia action in February 2020.
grounds that TECFIDERA benefits from regulatory data protection.
BIOGEN INC. AND SUBSIDIARIES NOTES TO CONSOLIDATED FINANCIAL STATEMENTS — (Continued)
Hatch-Waxman Act Litigation relating to VUMERITY Orange-Book Listed Patents
Interference Proceeding with ForwardIn July 2023 Biogen and Alkermes Pharma
In April 2015 the U.S. Ireland Limited filed patent infringement proceedings relating to VUMERITY Orange-Book listed patents (U.S. Patent Nos. 8,669,281, 9,090,558 and Trademark Office (USPTO) declared an interference between Forward Pharma’s pending U.S. Patent Application No. 11/576,871 and our U.S. Patent No. 8,399,514 (the '514 patent). The '514 patent includes claims covering the treatment of MS with 480 mg of dimethyl fumarate as provided for in our TECFIDERA label. In March 2017 the USPTO ruled against Forward Pharma. Forward Pharma has appealed10,080,733) pursuant to the U.S. CourtDrug Price Competition and Patent Term Restoration Act of Appeals for the Federal Circuit and the appeal is pending. For additional information regarding this matter, please read Note 7, Intangibles Assets and Goodwill, to these consolidated financial statements.
European Patent Office Oppositions
In 2016 the EPO decided to revoke our European patent number 2 137 5371984 (the '537 patent), which we have appealed. The '537 patent includes claims covering the treatment of MS with 480 mg of dimethyl fumarate as provided for in our TECFIDERA label.
In January 2018 the EPO announced its decision revoking Forward Pharma’s European Patent No. 2 801 355, which was issued in May 2015 and expires in October 2025. Forward Pharma has stated that it expects to file an appeal to the Technical Board of Appeal of the EPO. The settlement and license agreement that we entered with Forward Pharma in January 2017 did not resolve the issues pending in this proceeding and we and Forward Pharma intend to permit the Technical Board of Appeal and the Enlarged Board of Appeal, as applicable, to make a final determination. For additional information regarding this matter, please read Note 7, Intangibles Assets and Goodwill, to these consolidated financial statements.
Patent Revocation Matter
Swiss Pharma International AG filed actions in the District Court of The Hague (on January 11, 2016), the German Patents Court (on March 3, 2016) and the Commercial Court of Rome (November 2017) to invalidate the Dutch, German and Italian counterparts of our European Patent Number 1 485 127 (“Administration of agents to treat inflammation”) ('127 patent), which was issued in June 2011 and concerns administration of natalizumab (TYSABRI) to treat MS. The patent expires in February 2023. The Dutch counterpart was ruled invalid and we have appealed. In November 2018 Bioeq gmbh (an entity associated with Swiss Pharma and Polpharma) brought an action in the Polish Patent Office seeking to revoke the Polish counterpart of the ‘127 patent. In January 2018 the German court announced that the German counterpart was invalid. No date for a hearing on the merits has yet been set in the Italian action.
'755 Patent Litigation
On May 28, 2010, Biogen MA Inc. (formerly Biogen Idec MA Inc.) filed a complaintHatch-Waxman Act) in the U.S. District Court for the District of New Jersey alleging infringement by Bayer Healthcare Pharmaceuticals Inc. (Bayer) (manufacturer, marketer and seller of BETASERON and manufacturer of EXTAVIA), EMD Serono, Inc. (EMD Serono) (manufacturer, marketer and seller of REBIF), Pfizer Inc. (Pfizer) (co-marketer of REBIF) and Novartis Pharmaceuticals Corp. (Novartis) (marketer and seller of EXTAVIA) of our U.S. Patent No. 7,588,755 ('755 Patent), which claims the use of interferon beta for immunomodulation or treating a viral condition, viral disease, cancers or tumors. The complaint seeks monetary damages, including lost profits and royalties. Bayer had previously filed a complaintDelaware against us in the same court, on May 27, 2010, seeking a declaratory judgment that it does not infringe the '755 Patent and that the patent is invalid, and seeking monetary relief in the form of attorneys' fees, costs and expenses.
Bayer, Pfizer, Novartis and EMD Serono have all filed counterclaims seeking declaratory judgments of patent invalidity and non-infringement, and seeking monetary relief in the form of costs and attorneys' fees. The trial against EMD Serono and Pfizer commenced in mid-January 2018 and is ongoing. A trial date against Bayer and Novartis has not yet been set.
BIOGEN INC. AND SUBSIDIARIES
NOTES TO CONSOLIDATED FINANCIAL STATEMENTS — (Continued)
Government Matters
We have learned that state and federal governmental authorities are investigating our sales and promotional practices and have received related subpoenas. We are cooperating with the government.
We have received subpoenas and other requests from the federal government for documents and information relating to our relationship with non-profit organizations that provide assistance to patients taking drugs sold by Biogen and Biogen's co-pay assistance programs. We are cooperating with the government.
On July 1, 2016, we received civil investigative demands from the federal government for documents and information relating to our treatment of certain service agreements with wholesalers when calculating and reporting Average Manufacturer Prices in connection with the Medicaid Drug Rebate Program. We are cooperating with the government.
In July 2017 we learned that the Prosecution Office of Milan is investigating our interactions with certain healthcare providers in Italy. We are cooperating with the government.Zydus Worldwide DMCC.
Product Liability and Other Legal Proceedings We are also involved in product liability claims and other legal proceedings generally incidental to our normal business activities. While the outcome of any of these proceedings cannot be accurately predicted, we do not believe the ultimate resolution of any of these existing matters would have a material adverse effect on our business or financial condition. 22. Commitments and Contingencies
TYSABRI Contingent Payments
In 2013 we acquired from Elan full ownership of all remaining rights to TYSABRI that we did not already own or control. Under the acquisition agreement, we are obligated to make contingent payments to Elan of 18% on annual worldwide net sales up to $2.0 billion and 25% on annual worldwide net sales that exceed $2.0 billion. Royalty payments to Elan and other third parties are recognized as cost of sales in our consolidated statements of income. Elan was acquired by Perrigo Company plc (Perrigo) in December 2013, and Perrigo subsequently sold its rights to these payments to a third party effective January 2017.
Contingent Consideration related to Business Combinations
In connection with our acquisitions of Convergence, Stromedix and BIN, we agreed to make additional payments based upon the achievement of certain milestone events.
As the acquisitions of Convergence, Stromedix and BIN, occurred after January 1, 2009, we recorded the contingent consideration liabilities associated with these transactions at their fair value on the acquisition date and revalue these obligations each reporting period. We may pay up to approximately $1.1 billion in remaining milestones related to these acquisitions. For additional information on our acquisition of Convergence please read Note 2, Acquisitions, to these consolidated financial statements.
Fumapharm AG
In 2006 we acquired Fumapharm AG. As part of this acquisition we acquired FUMADERM and TECFIDERA (together, Fumapharm Products). We paid $220.0 million upon closing of the transaction and agreed to pay an additional $15.0 million if a Fumapharm Product was approved for MS in the U.S. or E.U. In the second quarter of 2013 we paid this $15.0 million contingent payment as TECFIDERA was approved in the U.S. for MS by the FDA. We are also required to make additional contingent payments to former shareholders of Fumapharm AG or holders of their rights based on the attainment of certain cumulative sales levels of Fumapharm Products and the level of total net sales of Fumapharm Products in the prior 12-month period, as defined in the acquisition agreement.
During 2017 we paid $1.2 billion in contingent payments as we reached the $11.0 billion, $12.0 billion, $13.0 billion and $14.0 billion cumulative sales levels related to the Fumapharm Products in the fourth quarter of 2016 and the first, second and third quarters of 2017, respectively, and accrued $600.0 million upon reaching $15.0 billion and $16.0 billion in total cumulative sales of Fumapharm Products in the fourth quarter of 2017.
BIOGEN INC. AND SUBSIDIARIES NOTES TO CONSOLIDATED FINANCIAL STATEMENTS — (Continued) | | | | | | | Note 22: | Commitments and Contingencies |
Royalty Payments TYSABRI We will owe an additional $300.0 millionare obligated to make contingent payment for every additional $1.0 billion in cumulative sales levelpayments of Fumapharm Products reached if the prior 12 months18.0% on annual worldwide net sales of the Fumapharm Products exceed $3.0TYSABRI up to $2.0 billion until such time as the cumulative sales level reaches $20.0 billion, at which time no further contingent payments shall be due. If the prior 12 monthsand 25.0% on annual worldwide net sales of Fumapharm ProductsTYSABRI that exceed $2.0 billion. Royalty payments are less than $3.0 billion, contingentrecognized as cost of sales in our consolidated statements of income. SPINRAZA We make royalty payments remainto Ionis on annual worldwide net sales of SPINRAZA using a tiered royalty rate between 11.0% and 15.0%, which are recognized as cost of sales in our consolidated statements of income. For additional information on our collaboration arrangements with Ionis, please read Note 19, Collaborative and Other Relationships, to these consolidated financial statements. QALSODY We make royalty payments to Ionis on annual worldwide net sales of QALSODY using a tiered royalty rate between 11.0% and 15.0%, which are recognized as cost of sales in our consolidated statements of income. For additional information on our collaboration arrangements with Ionis, please read Note 19, Collaborative and Other Relationships, to these consolidated financial statements. VUMERITY We make royalty payments to Alkermes on worldwide net sales of VUMERITY using a royalty rate of 15.0%, which are recognized as cost of sales in our consolidated statements of income. Royalties payable on net sales of VUMERITY are subject, under certain circumstances, to tiered minimum annual payment requirements for a decreasing tiered basis. These payments will be accountedperiod of five years following FDA approval. In October 2019 we entered into a new supply agreement and amended our license and collaboration agreement with Alkermes for asVUMERITY. We have elected to initiate a technology transfer and, following a transition period, to manufacture VUMERITY or have VUMERITY manufactured by a third party we have engaged in exchange for paying an increaseincreased royalty rate to goodwill as incurred, in accordance with the accounting standard applicable to business combinations when we acquired Fumapharm. AnyAlkermes on any portion of future worldwide net commercial sales of VUMERITY that is manufactured by us or our designee. For additional information on our collaboration arrangement with Alkermes, please read Note 19, Collaborative and Other Relationships, to these consolidated financial statements. SKYCLARYS In connection with our acquisition of Reata in September 2023 we assumed additional contractual obligations related to royalty payments. Reata entered into agreements to pay royalties on future sales of SKYCLARYS, which will cumulatively range in the payment which is tax deductible will be recorded as a reductionlow- to goodwill. Payments are due within 60 days following the endmid-single digits. For additional information on our acquisition of the quarter in which the applicable cumulative sales level has been reached.Reata, please read Note 2, Acquisitions, to these consolidated financial statements. Contingent Development, Regulatory and Commercial Milestone Payments
Based on our development plans as of December 31, 2017,2023, we could maketrigger potential future milestone payments to third parties of up to approximately $4.2$5.1 billion, including approximately $0.7$0.9 billion in development milestones, approximately $1.5$0.4 billion in regulatory milestones and approximately $2.0$3.8 billion in commercial milestones, as part of our various collaborations, including licensing and development programs. Payments under these agreements generally become due and payable upon achievement of certain development, regulatory or commercial milestones. Because the achievement of these milestones was not considered probable as of December 31, 2017,2023, such contingencies have not been recorded in our financial statements. Amounts related to contingent milestone payments are not considered contractual obligations as they are contingent on the successful achievement of certain development, regulatory approvalor commercial milestones. During the fourth quarter of 2023 we accrued a milestone payment due to Sage of $75.0 million upon the first commercial sale of ZURZUVAE for PPD in the U.S., which was recorded within intangible assets, net in our
BIOGEN INC. AND SUBSIDIARIES NOTES TO CONSOLIDATED FINANCIAL STATEMENTS — (Continued) consolidated balance sheets, and subsequently paid in January 2024. If certain clinical and commercial milestones.milestones are met, we may pay up to approximately $109.0 million in milestones in 2024 under our current agreements. In June 2021 ADUHELM was granted accelerated approval by the FDA. Under the terms of the Neurimmune Agreement, we were required to pay Neurimmune a milestone payment of $100.0 million related to the launch of ADUHELM in the U.S. During the second quarter of 2021 we made this $100.0 million payment, which was recognized as a charge to net income (loss) attributable to noncontrolling interests, net of tax in our consolidated statements of income. Other Funding Commitments As of December 31, 2017,2023, we have several on-goingongoing clinical studies in various clinical trial stages. Our most significant clinical trial expenditures are to CROs. The contracts with CROs are generally cancellable, with notice, at our option. We have recorded accrued expensesexpense of approximately $40.0$47.2 million in our consolidated balance sheetsheets for expenditures incurred by CROs as of December 31, 2017.2023. We have approximately $460.0$669.0 million in cancellable future commitments based on existing CRO contracts as of December 31, 2017.2023. Tax Related Obligations We exclude liabilities pertaining to uncertain tax positions from our summary of contractual obligations as we cannot make a reliable estimate of the period of cash settlement with the respective taxing authorities. As of December 31, 2017,2023, we have approximately $77.3$172.0 million of net liabilities associated with uncertain tax positions. As of December 31, 2017,2023 and 2022, we have accrued income tax liabilities of $989.6approximately $419.5 million and $558.0 million, respectively, under the Transition Toll Tax,Tax. Of the amounts accrued as of which $78.3December 31, 2023, approximately $185.4 million is expected to be paid within one year. The Transition Toll Tax will beis being paid in installments over an eight-yeareight--year period, startingwhich started in 2018, and will not accrue interest. For additional information on the Transition Toll Tax, please read Note 17, Income Taxes, to these consolidated financial statements. Solothurn, Switzerland Facility
In December 2015, we purchased land in Solothurn, Switzerland and are building a large-scale biologics manufacturing facility at this site. We expect this facility to be operational by the end of the decade. As of December 31, 2017, we had contractual commitments of $270.0 million for the construction of this facility.
Leases
We rent laboratory and office space and certain equipment under non-cancelable operating leases. These lease agreements contain various clauses for renewal at our option and, in certain cases, escalation clauses typically linked to rates of inflation. Rental expense, net of sublease income under these leases, which terminate at various dates through 2028, amounted to $65.3 million, $68.7 million and $68.6 million in 2017, 2016 and 2015, respectively. In addition to rent, the leases may require us to pay additional amounts for taxes, insurance, maintenance and other operating expenses.
BIOGEN INC. AND SUBSIDIARIES
NOTES TO CONSOLIDATED FINANCIAL STATEMENTS — (Continued)
As of December 31, 2017, minimum rental commitments under non-cancelable leases, net of income from subleases, for each of the next five years2023 and total thereafter were as follows: | | | | | | | | | | | | | | | | | | | | | | | | | | | | | | (In millions) | 2018 | | 2019 | | 2020 | | 2021 | | 2022 | | Thereafter | | Total | | Minimum lease payments | $ | 72.6 |
| | $ | 72.3 |
| | $ | 68.4 |
| | $ | 66.9 |
| | $ | 65.7 |
| | $ | 271.1 |
| | $ | 617.0 |
| | Less: income from subleases (1) | (24.3 | ) | | (24.7 | ) | | (23.9 | ) | | (22.3 | ) | | (22.0 | ) | | (71.3 | ) | | (188.5 | ) | | Net minimum lease payments | $ | 48.3 |
| | $ | 47.6 |
| | $ | 44.5 |
| | $ | 44.6 |
| | $ | 43.7 |
| | $ | 199.8 |
| | $ | 428.5 |
|
| | (1) | Represents sublease income expected to be received for the vacated manufacturing facility in Cambridge, MA, the vacated portion of our Weston, MA facility and other facilities throughout the world. |
Under certain of our lease agreements, we are contractually obligated to return leased space to its original condition upon termination of the lease agreement. At the inception of a lease with such conditions, we record an asset retirement obligation liability and a corresponding capital asset in an amount equal to the estimated fair value of the obligation. In subsequent periods, for each such lease, we record interest expense to accrete the asset retirement obligation liability to full value and depreciate each capitalized asset retirement obligation asset, both over the term of the associated lease agreement. Our asset retirement obligations were not significant as of December 31, 2017 or 2016.
23. Guarantees
As of December 31, 2017 and 2016,2022, we did not have significant liabilities recorded for guarantees.
We enter into indemnification provisions under our agreements with other companies in the ordinary course of business, typically with business partners, contractors, clinical sites and customers. Under these provisions, we generally indemnify and hold harmless the indemnified party for losses suffered or incurred by the indemnified party as a result of our activities. These indemnification provisions generally survive termination of the underlying agreement. The maximum potential amount of future payments we could be required to make under these indemnification provisions is unlimited. However, to date we have not incurred material costs to defend lawsuits or settle claims related to these indemnification provisions. As a result, the estimated fair value of these agreements is minimal. Accordingly, we have no liabilities recorded for these agreements as of December 31, 20172023 and 2016.2022. 24. | | | | | | | Note 24: | Employee Benefit Plans |
We sponsor various retirement and pension plans. Our estimates of liabilities and expensesexpense for these plans incorporate a number of assumptions, including expected rates of return on plan assets and interest rates used to discount future benefits. 401(k) Savings Plan We maintain a 401(k) Savings Plan, which is available to substantially all regular employees in the U.S. over the age of 21. Participants may make voluntary contributions. We make matching contributions according to the 401(k) Savings Plan’s matching formula. All matching contributions and participant contributions vest immediately. The 401(k) Savings Plan also holds certain transition contributions on behalf of participants who previously participated in the Biogen, Inc. Retirement Plan. The expense related to our 401(k) Savings Plan primarily consists of our matching contributions. Expense related to our 401(k) Savings Plan totaled $42.6approximately $55.9 million, $45.2$56.0 million and $51.8$58.4 million for the years ended December 31, 2017, 20162023, 2022 and 2015,2021, respectively.
BIOGEN INC. AND SUBSIDIARIES NOTES TO CONSOLIDATED FINANCIAL STATEMENTS — (Continued)
Deferred Compensation Plan We maintain a non-qualified deferred compensation plan, known as the Supplemental Savings Plan (SSP),SSP, which allows a select group of management employees in the U.S. to defer a portion of their compensation. The SSP also provides certain credits to highly compensated U.S. employees that are paid by the company. These credits are known as the Restoration Match. The deferred compensation amounts are accrued when earned. Such deferred compensation is distributable in cash in accordance with the rules of the SSP. Deferred compensation amounts under such plan as of December 31, 20172023 and 20162022, totaled approximately $109.8$134.6 million and $128.5$131.9 million, respectively, and are included in other long-term liabilities in our consolidated balance sheets. The SSP also holds certain transition contributions on behalf of participants who previously participated in the Biogen, Inc. Retirement Plan. The Restoration Match and participant contributions vest immediately. Distributions to participants can be either in one lump sum payment or annual installments as elected by the participants. Pension Plans Our retiree benefit plans include defined benefit plans for employees in our affiliates in Switzerland and Germany as well as other insignificant defined benefit plans in certain other countries where we maintain an operating presence. Our Swiss plan is a government-mandated retirement fund that provides employees with a minimum investment return. The minimum investment return is determined annually by the Swiss government and was 1.75% in 2023, 2.00% in 2022 and 1.00% in 2017 and 1.25% in 2016 and 1.75% in 2015, respectively.2021. Under the Swiss plan, both we and certain of our employees with annual earnings in excess of government determined amounts are required to make contributions into a fund managed by an independent investment fiduciary. Employer contributions must be in an amount at least equal to the employee’s contribution. Minimum employee contributions are based on the respective employee’s age, salary and gender. As of December 31, 20172023 and 2016,2022, the Swiss plan had an unfunded net pension obligation of approximately $48.3$51.5 million and $39.1$49.9 million, respectively, and plan assets that totaled approximately $83.7$239.6 million and $68.6$193.7 million, respectively. In 2017, 20162023, 2022 and 2015,2021 we recognized net expense totaling $12.3$17.6 million, $15.3$20.0 million and $12.9$21.5 million, respectively, related to our Swiss plan.plan, of which $5.1 million, $5.3 million and $3.5 million, respectively, was included in other (income) expense, net in our consolidated statements of income. The obligations under the German plans are unfunded and totaled $43.5$46.5 million and $35.4$40.9 million as of December 31, 20172023 and 2016,2022, respectively. Net periodic pension cost related to the German plans totaled $5.2$3.6 million, $4.2$5.9 million and $4.0$7.6 million for the years ended December 31, 2017, 20162023, 2022 and 2015, respectively.2021, respectively, of which $0.8 million, $1.8 million and $2.1 million, respectively, was included in other (income) expense, net in our consolidated statements of income. 25.
BIOGEN INC. AND SUBSIDIARIES NOTES TO CONSOLIDATED FINANCIAL STATEMENTS — (Continued) | | | | | | | Note 25: | Segment Information |
We operate as one operating segment, focused on discovering, developing and delivering worldwide innovative therapies for people living with serious neurological and neurodegenerative diseases.diseases as well as related therapeutic adjacencies. Our Chief Executive Officer (CEO),CEO, as the chief operating decision-maker,CODM, manages and allocates resources to the operations of our company on a total company basis. Our research and development organization is responsible for the research and discovery of new product candidates and supports development and registration efforts for potential future products. Our pharmaceutical, operations and technology organization manages the development of the manufacturing processes, clinical trial supply, commercial product supply, distribution, buildings and facilities. Our commercial organization is responsible for U.S. and international development of our commercial products. The company is also supported by corporate staff functions. Managing and allocating resources on a total company basis enables our CEO to assess the overall level of resources available and how to best deploy these resources across functions, therapeutic areas and research and development projects that are in line with our long-term company-wide strategic goals. Consistent with this decision-making process, our CEO uses consolidated, single-segment financial information for purposes of evaluating performance, forecasting future period financial results, allocating resources and setting incentive targets. Enterprise-wide disclosures about product revenues,revenue, other revenuesrevenue and long-lived assets by geographic area and information relating to major customers are presented below. Revenues areRevenue is primarily attributed to individual countries based on location of the customer or licensee.
BIOGEN INC. AND SUBSIDIARIES
NOTES TO CONSOLIDATED FINANCIAL STATEMENTS — (Continued)
Revenues by product are summarized as follows:
| | | | | | | | | | | | | | | | | | | | | | | | | | | | | | | | | | | | | | | For the Years Ended December 31, | | | 2017 | | 2016 | | 2015 | | (In millions) | United States | | Rest of World | | Total | | United States | | Rest of World | | Total | | United States | | Rest of World | | Total | | Multiple Sclerosis (MS): | | | | | | | | | | | | | | | | | | | TECFIDERA | $ | 3,294.0 |
| | $ | 920.0 |
| | $ | 4,214.0 |
| | $ | 3,169.4 |
| | $ | 798.7 |
| | $ | 3,968.1 |
| | $ | 2,908.2 |
| | $ | 730.2 |
| | $ | 3,638.4 |
| | AVONEX | 1,593.6 |
| | 557.9 |
| | 2,151.5 |
| | 1,675.3 |
| | 638.2 |
| | 2,313.5 |
| | 1,790.2 |
| | 840.0 |
| | 2,630.2 |
| | PLEGRIDY | 295.5 |
| | 198.8 |
| | 494.3 |
| | 305.0 |
| | 176.7 |
| | 481.7 |
| | 227.1 |
| | 111.4 |
| | 338.5 |
| | TYSABRI | 1,113.8 |
| | 859.3 |
| | 1,973.1 |
| | 1,182.9 |
| | 780.9 |
| | 1,963.8 |
| | 1,103.1 |
| | 783.0 |
| | 1,886.1 |
| | FAMPYRA | — |
| | 91.6 |
| | 91.6 |
| | — |
| | 84.9 |
| | 84.9 |
| | — |
| | 89.7 |
| | 89.7 |
| | ZINBRYTA | — |
| | 52.7 |
| | 52.7 |
| | — |
| | 7.8 |
| | 7.8 |
| | — |
| | — |
| | — |
| | Spinal Muscular Atrophy: | | | | | | | | | | | | | | | | | | | SPINRAZA | 657.0 |
| | 226.7 |
| | 883.7 |
| | 4.6 |
| | — |
| | 4.6 |
| | — |
| | — |
| | — |
| | Hemophilia: | | | | | | | | | | | | | | | | | | | ELOCTATE | 42.2 |
| | 6.2 |
| | 48.4 |
| | 445.2 |
| | 68.0 |
| | 513.2 |
| | 308.3 |
| | 11.4 |
| | 319.7 |
| | ALPROLIX | 21.0 |
| | 5.0 |
| | 26.0 |
| | 268.0 |
| | 65.7 |
| | 333.7 |
| | 208.9 |
| | 25.6 |
| | 234.5 |
| | Other product revenues: | | | | | | | | | | | | | | | | | | | FUMADERM | — |
| | 39.6 |
| | 39.6 |
| | — |
| | 45.9 |
| | 45.9 |
| | — |
| | 51.4 |
| | 51.4 |
| | BENEPALI | — |
| | 370.8 |
| | 370.8 |
| | — |
| | 100.6 |
| | 100.6 |
| | — |
| | — |
| | — |
| | FLIXABI | — |
| | 9.0 |
| | 9.0 |
| | — |
| | 0.1 |
| | 0.1 |
| | — |
| | — |
| | — |
| | Total product revenues | $ | 7,017.1 |
| | $ | 3,337.6 |
| | $ | 10,354.7 |
| | $ | 7,050.4 |
| | $ | 2,767.5 |
| | $ | 9,817.9 |
| | $ | 6,545.8 |
| | $ | 2,642.7 |
| | $ | 9,188.5 |
|
Geographic Information The following tables contain certain financial information by geographic area: | | | | | | | | | | | | | | | | | | | | | | | | | | | | | | | | | | | | | | | | | December 31, 2023 | | (In millions) | | U.S. | | Europe(1) | | Germany | | Asia | | Other | | Total | | Product revenue from external customers | | $ | 3,141.4 | | | $ | 2,127.4 | | | $ | 868.0 | | | $ | 649.4 | | | $ | 460.5 | | | $ | 7,246.7 | | | Revenue from anti-CD20 therapeutic programs | | 1,618.5 | | | 0.4 | | | — | | | — | | | 70.7 | | | 1,689.6 | | | Contract manufacturing, royalty and other revenue | | 673.6 | | | 11.7 | | | — | | | 214.0 | | | — | | | 899.3 | | | Long-lived assets | | 1,443.0 | | | 2,248.0 | | | 17.5 | | | 8.3 | | | 12.9 | | | 3,729.7 | | | | | | | | | | | | | | | | | December 31, 2022 | | (In millions) | | U.S. | | Europe(1) | | Germany | | Asia | | Other | | Total | | Product revenue from external customers | | $ | 3,469.3 | | | $ | 2,401.3 | | | $ | 926.2 | | | $ | 672.1 | | | $ | 518.9 | | | $ | 7,987.8 | | | Revenue from anti-CD20 therapeutic programs | | 1,636.4 | | | 0.1 | | | — | | | — | | | 64.0 | | | 1,700.5 | | | Contract manufacturing, royalty and other revenue | | 425.8 | | | 11.7 | | | — | | | 47.6 | | | — | | | 485.1 | | | Long-lived assets | | 1,369.4 | | | 2,275.8 | | | 21.0 | | | 13.7 | | | 22.6 | | | 3,702.5 | | | | | | | | | | | | | | | | | December 31, 2021 | | (In millions) | | U.S. | | Europe(1) | | Germany | | Asia | | Other | | Total | | Product revenue from external customers | | $ | 3,805.7 | | | $ | 2,626.0 | | | $ | 1,162.4 | | | $ | 688.0 | | | $ | 564.8 | | | $ | 8,846.9 | | | Revenue from anti-CD20 therapeutic programs | | 1,596.7 | | | — | | | — | | | — | | | 61.8 | | | 1,658.5 | | | Contract manufacturing, royalty and other revenue | | 429.9 | | | 9.7 | | | — | | | 36.7 | | | — | | | 476.3 | | | Long-lived assets | | 1,390.5 | | | 2,337.8 | | | 25.4 | | | 16.4 | | | 21.7 | | | 3,791.8 | |
| | | | | | | | | | | | | | | | | | | | | | December 31, 2017 (In millions) | U.S. | | Europe | | Asia | | Other | | Total | | Product revenues from external customers | $ | 7,017.1 |
| | $ | 2,844.8 |
| | $ | 160.1 |
| | $ | 332.7 |
| | $ | 10,354.7 |
| | Revenues from anti-CD20 therapeutic programs | $ | 1,475.6 |
| | $ | 0.6 |
| | $ | — |
| | $ | 83.0 |
| | $ | 1,559.2 |
| | Other revenues from external customers | $ | 249.5 |
| | $ | 67.8 |
| | $ | 42.7 |
| | $ | — |
| | $ | 360.0 |
| | Long-lived assets | $ | 1,226.9 |
| | $ | 1,948.2 |
| | $ | 5.2 |
| | $ | 2.1 |
| | $ | 3,182.4 |
| | | | | | | | | | | | | December 31, 2016 (In millions) | U.S. | | Europe | | Asia | | Other | | Total | | Product revenues from external customers | $ | 7,050.4 |
| | $ | 2,237.2 |
| | $ | 217.3 |
| | $ | 313.0 |
| | $ | 9,817.9 |
| | Revenues from anti-CD20 therapeutic programs | $ | 1,249.5 |
| | $ | 1.9 |
| | $ | — |
| | $ | 63.1 |
| | $ | 1,314.5 |
| | Other revenues from external customers | $ | 224.7 |
| | $ | 71.5 |
| | $ | 20.2 |
| | $ | — |
| | $ | 316.4 |
| | Long-lived assets | $ | 1,272.3 |
| | $ | 1,221.1 |
| | $ | 7.0 |
| | $ | 1.4 |
| | $ | 2,501.8 |
| | | | | | | | | | | | | December 31, 2015 (In millions) | U.S. | | Europe | | Asia | | Other | | Total | | Product revenues from external customers | $ | 6,545.8 |
| | $ | 2,165.7 |
| | $ | 143.7 |
| | $ | 333.3 |
| | $ | 9,188.5 |
| | Revenues from anti-CD20 therapeutic programs | $ | 1,269.8 |
| | $ | 3.5 |
| | $ | — |
| | $ | 65.9 |
| | $ | 1,339.2 |
| | Other revenues from external customers | $ | 142.0 |
| | $ | 31.2 |
| | $ | 62.9 |
| | $ | — |
| | $ | 236.1 |
| | Long-lived assets | $ | 1,296.5 |
| | $ | 881.7 |
| | $ | 7.7 |
| | $ | 1.7 |
| | $ | 2,187.6 |
|
Revenues from Anti-CD20 Therapeutic Programs(1) Represents amounts related to Europe less those attributable to Germany.
Approximately 13%, 11% and 12% of our total revenues in 2017, 2016 and 2015, respectively, are derived from our collaboration agreement with Genentech. For additional information on our collaboration with Genentech, please read Note 20, Collaborative and Other Relationships, to these consolidated financial statements.
BIOGEN INC. AND SUBSIDIARIES
NOTES TO CONSOLIDATED FINANCIAL STATEMENTS — (Continued)
Significant Customers
We recorded revenues from two wholesalers accounting for 34% and 21% of gross product revenues in 2017, 35% and 22% of gross product revenues in 2016, and 34% and 26% of gross product revenues in 2015, respectively.
OtherLong-Lived Assets
As of December 31, 2017, 20162023, 2022 and 2015,2021, approximately $1,215.7$2,156.4 million, $545.5$2,198.5 million and $161.5$2,237.0 million, respectively, of our long-lived assets were related to the construction of our large-scale biologics manufacturing facility in Solothurn, Switzerland. As of December 31, 2017, 2016 and 2015, approximately $707.1 million, $643.6 million and $684.9 million, respectively, of our long-lived assets were related to our manufacturing facilities in Denmark.
For additional information on our large-scale biologicsSolothurn manufacturing facility, in Solothurn, Switzerland, please read Note 11, Property, Plant and Equipment, to these consolidated financial statements. 26. Quarterly Financial Data (Unaudited)
| | | | | | | | | | | | | | | | | | | | | | (In millions, except per share amounts) | First Quarter | | Second Quarter | | Third Quarter | | Fourth Quarter | | Total Year | | 2017 | (a) | | (a) (b) (c) (d) | | (a) | | (a) (e) (f) (g) (h) | | | | Product revenues, net | $ | 2,380.1 |
| | $ | 2,639.7 |
| | $ | 2,622.5 |
| | $ | 2,712.4 |
| | $ | 10,354.7 |
| | Revenues from anti-CD20 therapeutic programs | $ | 340.6 |
| | $ | 397.1 |
| | $ | 406.5 |
| | $ | 415.0 |
| | $ | 1,559.2 |
| | Other revenues | $ | 90.0 |
| | $ | 41.6 |
| | $ | 48.8 |
| | $ | 179.6 |
| | $ | 360.0 |
| | Total revenues | $ | 2,810.7 |
| | $ | 3,078.4 |
| | $ | 3,077.8 |
| | $ | 3,307.0 |
| | $ | 12,273.9 |
| | Gross profit (1) | $ | 2,426.1 |
| | $ | 2,712.2 |
| | $ | 2,707.8 |
| | $ | 2,797.8 |
| | $ | 10,643.9 |
| | Net income | $ | 747.5 |
| | $ | 862.8 |
| | $ | 1,226.1 |
| | $ | (166.3 | ) | | $ | 2,670.1 |
| | Net income attributable to Biogen Inc. | $ | 747.6 |
| | $ | 862.8 |
| | $ | 1,226.1 |
| | $ | (297.4 | ) | | $ | 2,539.1 |
| | Net income per share: | | | | | | | | | | | Basic earnings per share attributable to Biogen Inc. | $ | 3.47 |
| | $ | 4.07 |
| | $ | 5.80 |
| | $ | (1.41 | ) | | $ | 11.94 |
| | Diluted earnings per share attributable to Biogen Inc. | $ | 3.46 |
| | $ | 4.07 |
| | $ | 5.79 |
| | $ | (1.40 | ) | | $ | 11.92 |
| | Weighted-average shares used in calculating: | | | | | | | | | | | Basic earnings per share attributable to Biogen Inc. | 215.6 |
| | 211.9 |
| | 211.4 |
| | 211.5 |
| | 212.6 |
| | Diluted earnings per share attributable to Biogen Inc. | 215.9 |
| | 212.2 |
| | 211.8 |
| | 212.0 |
| | 213.0 |
|
BIOGEN INC. AND SUBSIDIARIES
NOTES TO CONSOLIDATED FINANCIAL STATEMENTS — (Continued)
| | | | | | | | | | | | | | | | | | | | | | (In millions, except per share amounts) | First Quarter | | Second Quarter | | Third Quarter | | Fourth Quarter | | Total Year | | 2016 | | | (i) | | (i) (j) | | (i) (k) (l) | | | | Product revenues, net | $ | 2,309.4 |
| | $ | 2,466.0 |
| | $ | 2,539.6 |
| | $ | 2,502.9 |
| | $ | 9,817.9 |
| | Revenues from anti-CD20 therapeutic programs | $ | 329.5 |
| | $ | 349.2 |
| | $ | 317.6 |
| | $ | 318.2 |
| | $ | 1,314.5 |
| | Other revenues | $ | 87.9 |
| | $ | 79.0 |
| | $ | 98.6 |
| | $ | 50.9 |
| | $ | 316.4 |
| | Total revenues | $ | 2,726.8 |
| | $ | 2,894.2 |
| | $ | 2,955.8 |
| | $ | 2,872.0 |
| | $ | 11,448.8 |
| | Gross profit (1) | $ | 2,413.8 |
| | $ | 2,523.9 |
| | $ | 2,538.9 |
| | $ | 2,493.5 |
| | $ | 9,970.1 |
| | Net income | $ | 969.2 |
| | $ | 1,048.4 |
| | $ | 1,030.2 |
| | $ | 647.9 |
| | $ | 3,695.7 |
| | Net income attributable to Biogen Inc. | $ | 970.9 |
| | $ | 1,049.8 |
| | $ | 1,032.9 |
| | $ | 649.2 |
| | $ | 3,702.8 |
| | Net income per share: | | | | | | | | | | | Basic earnings per share attributable to Biogen Inc. | $ | 4.44 |
| | $ | 4.79 |
| | $ | 4.72 |
| | $ | 3.00 |
| | $ | 16.96 |
| | Diluted earnings per share attributable to Biogen Inc. | $ | 4.43 |
| | $ | 4.79 |
| | $ | 4.71 |
| | $ | 2.99 |
| | $ | 16.93 |
| | Weighted-average shares used in calculating: | | | | | | | | | | | Basic earnings per share attributable to Biogen Inc. | 218.9 |
| | 219.1 |
| | 218.9 |
| | 216.6 |
| | 218.4 |
| | Diluted earnings per share attributable to Biogen Inc. | 219.3 |
| | 219.4 |
| | 219.4 |
| | 217.0 |
| | 218.8 |
|
(1) Gross profit is calculated as total revenues less costReport of sales, excluding amortization of acquired intangible assets.
| | (a) | Net income and net income attributable to Biogen Inc. for the first, second, third and fourth quarters of 2017 include a pre-tax charge of $353.6 million, $29.4 million, $30.4 million and $30.8 million, respectively, related to our U.S. and rest of world licenses to Forward Pharma's intellectual property, including Forward Pharma's intellectual property related to TECFIDERA.
|
| | (b) | Net income and net income attributable to Biogen Inc. for the second quarter of 2017 includes a pre-tax charge to research and development expense of $300.0 million for an upfront payment to BMS upon the closing of our agreement to exclusively license BIIB092.
|
| | (c) | Net income and net income attributable to Biogen Inc. for the second quarter of 2017 includes a pre-tax charge to acquired in-process research and development of $120.0 million for an upfront payment to Remedy upon closing of the asset purchase transaction.
|
| | (d) | Net income and net income attributable to Biogen Inc. for the second quarter of 2017 includes a pre-tax charge to research and development expense of $60.0 million for a developmental milestone that became payable to the former shareholders of iPierian upon dosing of the first patient in the Phase 2 PSP study for BIIB092.
|
| | (e) | Net income attributable to Biogen Inc., for the fourth quarter of 2017, includes a pre-tax charge to noncontrolling interest of $150.0 million for a payment to Neurimmune in exchange for a 15% reduction in royalty rates payable on potential commercial sales of aducanumab.
|
| | (f) | Net income and net income attributable to Biogen Inc. for the fourth quarter of 2017 includes pre-tax charges to research and development expense of $28.0 million and $50.0 million for an upfront payment and a continuation payment, respectively, to Alkermes.
|
| | (g) | Net income and net income attributable to Biogen Inc. for the fourth quarter of 2017 includes a pre-tax charge to research and development expense of $25.0 million for an upfront payment to Ionis upon entering into a new collaboration agreement to identify new antisense-oligonucleotide drug candidates for the treatment of SMA.
|
| | (h) | Net income and net income attributable to Biogen Inc. for the fourth quarter of 2017 includes $1,173.6 million related to the provisions of the 2017 Tax Act, including a $989.6 million expense under the Transition Toll Tax.
|
BIOGEN INC. AND SUBSIDIARIES
NOTES TO CONSOLIDATED FINANCIAL STATEMENTS — (Continued)
| | (i) | Net income and net income attributable to Biogen Inc. for the second, third and fourth quarters of 2016 includes additional pre-tax depreciation expense totaling $15.8 million, $15.7 million and $14.0 million, respectively, as part of our decision to cease manufacturing and vacate our small-scale biologics manufacturing facility in Cambridge, MA as well as close and vacate our warehouse space in Somerville, MA.
|
| | (j) | Net income and net income attributable to Biogen Inc. for the third quarter of 2016 includes a pre-tax charge to research and development expense of $75.0 million for a license fee paid to Ionis as we exercised our option to develop and commercialize SPINRAZA.
|
| | (k) | Net income and net income attributable to Biogen Inc. for the fourth quarter of 2016 includes a pre-tax charge to research and development expense of $50.0 million for a milestone payment due to Eisai related to the initiation of a Phase 3 trial for E2609.
|
| | (l) | Net income and net income attributable to Biogen Inc. for the fourth quarter of 2016 includes a pre-tax charge of $454.8 million related to our January 2017 settlement and license agreement with Forward Pharma.
|
27. Subsequent Events
Karyopharm Therapeutics Inc.
In January 2018 we acquired the exclusive worldwide rights to develop and commercialize Karyopharm Therapeutics Inc.'s (Karyopharm) investigational oral compound BIIB100 (formerly known as KPT-350) for the treatment of certain neurological and neurodegenerative conditions, primarily in ALS. We will pay Karyopharm an upfront payment of $10.0 million and we may pay Karyopharm up to $207.0 million in additional milestone payments, and potential royalties.
REPORT OF INDEPENDENT REGISTERED PUBLIC ACCOUNTING FIRMIndependent Registered Public Accounting Firm
To the Board of Directors and Shareholders of Biogen Inc.
Opinions on the Financial Statements and Internal Control over Financial Reporting
We have audited the accompanying consolidated balance sheets of Biogen Inc. and its subsidiaries (the "Company"“Company”) as of December 31, 20172023 and 2016,2022, and the related consolidated statements of income, of comprehensive income, of equity and of cash flowsflow for each of the three years in the period ended December 31, 2017,2023, including the related notes (collectively referred to as the “consolidated financial statements”).We also have audited the Company's internal control over financial reporting as of December 31, 2017,2023, based on criteria established in Internal Control - Integrated Framework (2013) issued by the Committee of Sponsoring Organizations of the Treadway Commission (COSO).
In our opinion, the consolidated financial statements referred to above present fairly, in all material respects, the financial position of the Company as of December 31, 20172023 and 2016, 2022, and the results of its operations and its cash flows for each of the three years in the period ended December 31, 20172023 in conformity with accounting principles generally accepted in the United States of America. Also in our opinion, the Company maintained, in all material respects, effective internal control over financial reporting as of December 31, 2017,2023, based on criteria established in Internal Control - Integrated Framework (2013) issued by the COSO.
Basis for Opinions
The Company's management is responsible for these consolidated financial statements, for maintaining effective internal control over financial reporting, and for its assessment of the effectiveness of internal control over financial reporting, included in Management’s Annual Report on Internal Control over Financial Reporting appearing under Item 9A. Our responsibility is to express opinions on the Company’s consolidated financial statements and on the Company's internal control over financial reporting based on our audits. We are a public accounting firm registered with the Public Company Accounting Oversight Board (United States) ("PCAOB")(PCAOB) and are required to be independent with respect to the Company in accordance with the U.S. federal securities laws and the applicable rules and regulations of the Securities and Exchange Commission and the PCAOB.
We conducted our audits in accordance with the standards of the PCAOB. Those standards require that we plan and perform the audits to obtain reasonable assurance about whether the consolidated financial statements are free of material misstatement, whether due to error or fraud, and whether effective internal control over financial reporting was maintained in all material respects.
Our audits of the consolidated financial statements included performing procedures to assess the risks of material misstatement of the consolidated financial statements, whether due to error or fraud, and performing procedures that respond to those risks. Such procedures included examining, on a test basis, evidence regarding the amounts and disclosures in the consolidated financial statements. Our audits also included evaluating the accounting principles used and significant estimates made by management, as well as evaluating the overall presentation of the consolidatedfinancial statements. Our audit of internal control over financial reporting included obtaining an understanding of internal control over financial reporting, assessing the risk that a material weakness exists, and testing and evaluating the design and operating effectiveness of internal control based on the assessed risk. Our audits also included performing such other procedures as we considered necessary in the circumstances. We believe that our audits provide a reasonable basis for our opinions.
As described in Management’s Annual Report on Internal Control over Financial Reporting, management has excluded Reata Pharmaceuticals, Inc. (Reata) from its assessment of internal control over financial reporting as of December 31, 2023, because it was acquired by the Company in a purchase business combination during 2023. We have also excluded Reata from our audit of internal control over financial reporting. Reata is a wholly-owned subsidiary whose total assets and total revenue excluded from management’s assessment and our audit of internal control over financial reporting represent 1.0% and 0.6%, respectively, of the related consolidated financial statement amounts as of and for the year ended December 31, 2023.
Definition and Limitations of Internal Control over Financial Reporting
A company’s internal control over financial reporting is a process designed to provide reasonable assurance regarding the reliability of financial reporting and the preparation of financial statements for external purposes in
accordance with generally accepted accounting principles. A company’s internal control over financial reporting includes those policies and procedures that (i) pertain to the maintenance of records that, in reasonable detail, accurately and fairly reflect the transactions and dispositions of the assets of the company; (ii) provide reasonable assurance that transactions are recorded as necessary to permit preparation of financial statements in accordance with generally accepted accounting principles, and that receipts and expenditures of the company are being made only in accordance with authorizations of management and directors of the company; and (iii) provide reasonable
assurance regarding prevention or timely detection of unauthorized acquisition, use, or disposition of the company’s assets that could have a material effect on the financial statements.
Because of its inherent limitations, internal control over financial reporting may not prevent or detect misstatements. Also, projections of any evaluation of effectiveness to future periods are subject to the risk that controls may become inadequate because of changes in conditions, or that the degree of compliance with the policies or procedures may deteriorate.
Critical Audit Matters
The critical audit matters communicated below are matters arising from the current period audit of the consolidated financial statements that were communicated or required to be communicated to the audit committee and that (i) relate to accounts or disclosures that are material to the consolidated financial statements and (ii) involved our especially challenging, subjective, or complex judgments. The communication of critical audit matters does not alter in any way our opinion on the consolidated financial statements, taken as a whole, and we are not, by communicating the critical audit matters below, providing separate opinions on the critical audit matters or on the accounts or disclosures to which they relate.
Reserves for Medicaid and Managed Care Rebates in the U.S. As described in Notes 1 and 5 to the consolidated financial statements, the Company recognized revenue from product sales, net of reserves, including contractual adjustments related to Medicaid and managed care rebates in the U.S. Within accrued expense and other, revenue-related reserves amounted to $926.5 million as of December 31, 2023. A portion of this balance includes contractual adjustments for Medicaid and managed care rebates in the U.S. Medicaid rebates relate to the Company’s estimated obligations to states under established reimbursement arrangements. The Company’s liability for Medicaid rebates consists of estimates for claims that a state will make for the current quarter, claims for prior quarters that have been estimated for which an invoice has not been received, invoices received for claims from the prior quarters that have not been paid and an estimate of potential claims that will be made for inventory that exists in the distribution channel at period end. Managed care rebates in the U.S. represent the Company’s estimated obligations to third-parties, primarily pharmacy benefit managers. These rebates result from performance-based goals, formulary position and price increase limit allowances (price protection). The calculation of the accrual for these rebates is based on an estimate of the coverage patterns and the resulting applicable contractual rebate rate(s) to be earned over a contractual period. Rebate accruals for Medicaid and managed care in the U.S. are recorded in the same period the related revenue is recognized, resulting in a reduction of product revenue and the establishment of a liability which is included in accrued expense and other current liabilities. The estimates of the reserves for Medicaid and managed care in the U.S. reflect historical experience, current contractual and statutory requirements, specific known market events and trends, industry data and forecasted customer buying and payment patterns. The principal considerations for our determination that performing procedures relating to reserves for Medicaid and managed care rebates in the U.S. is a critical audit matter are (i) the significant judgment by management due to the significant measurement uncertainty when developing the estimate of the reserves and (ii) a high degree of auditor judgment, subjectivity, and effort in performing procedures and evaluating assumptions related to historical experience, current contractual requirements, specific known market events, and forecasted customer buying and payment patterns. Addressing the matter involved performing procedures and evaluating audit evidence in connection with forming our overall opinion on the consolidated financial statements. These procedures included testing the effectiveness of controls relating to management's estimate of the reserves for Medicaid and managed care rebates in the U.S. These procedures also included, among others (i) developing an independent estimate of the reserves for Medicaid and managed care rebates in the U.S. by utilizing third-party data related to product demand, data related to price changes, the terms of the specific rebate programs, the historical trend of actual rebate claims paid and consideration of contractual requirement changes and market events; (ii) comparing the independent estimate to management’s estimate to evaluate the reasonableness of management's estimate; and (iii) testing, on a sample basis, rebate claims paid by the Company, including evaluating the claims for consistency with the contractual terms of the Company’s rebate agreements.
Acquisition of Reata - Valuation of Completed Technology and In-Process Research and Development Intangible Assets As described in Notes 1 and 2 to the consolidated financial statements, the Company completed the acquisition of Reata for total consideration of $7,193.4 million. Of the acquired intangible assets, $4,200.0 million of completed technology and $2,300.0 million of in-process research and development (IPR&D) were recorded. Management uses the multi-period excess earnings method, which is a form of the income approach, utilizing post-tax cash flows and discount rates in estimating the fair value of identifiable intangible assets acquired when allocating the purchase consideration paid for the acquisition. The estimates of the fair value of identifiable intangible assets involve significant judgment by management and include assumptions with measurement uncertainty, such as the amount and timing of projected cash flows, long-term sales forecasts, discount rate, and additionally for the IPR&D intangible asset, the timing and probability of regulatory and commercial success. The principal considerations for our determination that performing procedures relating to the valuation of completed technology and IPR&D intangible assets acquired in the acquisition of Reata is a critical audit matter are (i) the significant judgment by management due to the significant measurement uncertainty when developing the fair value estimate of the completed technology and IPR&D intangible assets acquired; (ii) a high degree of auditor judgment, subjectivity, and effort in performing procedures and evaluating management’s significant assumptions related to long-term sales forecasts and discount rate for the completed technology intangible asset and long-term sales forecasts, discount rate, and probability of regulatory and commercial success for the IPR&D intangible asset; and (iii) the audit effort involved the use of professionals with specialized skill and knowledge. Addressing the matter involved performing procedures and evaluating audit evidence in connection with forming our overall opinion on the consolidated financial statements. These procedures included testing the effectiveness of controls relating to the acquisition accounting, including controls over management’s valuation of the completed technology and IPR&D intangible assets acquired. These procedures also included, among others (i) reading the purchase agreement; (ii) testing management’s process for developing the fair value estimate of the completed technology and IPR&D intangible assets acquired; (iii) evaluating the appropriateness of the multi-period excess earnings method used by management; (iv) testing the completeness and accuracy of certain of the data used in the multi-period excess earnings method; and (v) evaluating the reasonableness of the significant assumptions used by management related to long-term sales forecasts and discount rate for the completed technology intangible asset and long-term sales forecasts, discount rate, and probability of regulatory and commercial success for the IPR&D intangible asset. Evaluating management’s assumptions related to long-term sales forecasts for the completed technology and IPR&D intangible assets and probability of regulatory and commercial success for the IPR&D intangible asset involved evaluating whether the assumptions used by management were reasonable considering (i) the current and past performance of the acquired business and (ii) whether the assumptions were consistent with evidence obtained in other areas of the audit. Evaluating management’s assumption related to long-term sales forecasts also involved considering the consistency with external market and industry data. Professionals with specialized skill and knowledge were used to assist in evaluating (i) the appropriateness of the multi-period excess earnings method and (ii) the reasonableness of the discount rate significant assumption for the completed technology and IPR&D intangible assets. /s/PricewaterhouseCoopers LLP Boston, Massachusetts February 1, 201813, 2024
We have served as the Company's auditor since 2003.
|