FORM 10-K
UNITED STATES
SECURITIES AND EXCHANGE COMMISSION
WASHINGTON, D.C. 20549
| | | | | | | | |
| ☒ | ANNUAL REPORT PURSUANT TO SECTION 13 OR 15(d) OF THE SECURITIES EXCHANGE ACT OF 1934 |
| For the fiscal year ended | December 31, 2022 |
| ☐ | TRANSITION REPORT PURSUANT TO SECTION 13 OR 15(d) OF THE SECURITIES EXCHANGE ACT OF 1934 |
| For the transition period from ______ to ______ |
| Commission file number | 1-10816 |
FORM 10-K
☒ ANNUAL REPORT PURSUANT TO SECTION 13 OR 15(d) OF THE
SECURITIES EXCHANGE ACT OF 1934
For the fiscal year ended December 31, 2017
OR
☐ TRANSITION REPORT PURSUANT TO SECTION 13 OR 15(d) OF THE
SECURITIES EXCHANGE ACT OF 1934
For the transition period from ____ to ____
Commission file number 1-10816
MGIC INVESTMENT CORPORATIONInvestment Corporation
(Exact name of registrant as specified in its charter)
|
| | | | | | | | | | |
WISCONSINWisconsin | | 39-1486475 |
| (State or other jurisdiction of incorporation or organization) | | (I.R.S. Employer Identification No.) |
|
| 250 E. Kilbourn Avenue | | |
MGIC PLAZA, 250 EAST KILBOURN AVENUE,Milwaukee, | Wisconsin | | 53202 |
MILWAUKEE, WISCONSIN | | 53202 |
| (Address of principal executive offices) | | (Zip Code) |
| (414) | | 347-6480 |
| (Registrant’s telephone number, including area code) |
(414) 347-6480
(Registrant’s telephone number, including area code)
Securities Registered Pursuantregistered pursuant to Section 12(b) of the Act:
| | | | | | | | | | | | | | |
| Title of each class | | Trading Symbol | | Name of each exchange on which registered |
| Common stock, par value $1 per share | | MTG | | New York Stock Exchange |
| | |
| Title of Each Class: | Common Stock, Par Value $1 Per Share |
| | Common Share Purchase Rights |
| Name of Each Exchange on Which | |
| Registered: | New York Stock Exchange |
Securities Registered Pursuant to Section 12(g) of the Act: None
Indicate by check mark if the registrant is a well-known seasoned issuer, as defined in Rule 405 of the Securities Act. Yes ☒ No ☐
☒Yes ☐No
Indicate by check mark if the registrant is not required to file reports pursuant to Section 13 or Section 15(d) of the Act. Yes ☐ No ☒
☐ Yes ☒ No
Indicate by check mark whether the Registrantregistrant (1) has filed all reports required to be filed by Section 13 or 15(d) of the Securities Exchange Act of 1934 during the preceding 12 months (or for such shorter period that the Registrantregistrant was required to file such reports), and (2) has been subject to such filing requirements for the past 90 days. ☒YesYes ☒ No ☐ No
Indicate by check mark whether the registrant has submitted electronically and posted on its corporate Web site, if any, every Interactive Data File required to be submitted and posted pursuant to Rule 405 of Regulation S-T during the preceding 12 months (or for such shorter period that the registrant was required to submit and post such files). ☒YesYes ☒ No ☐ No
Indicate by check mark if disclosure of delinquent filers pursuant to Item 405 of Regulation S-K is not contained herein, and will not be contained, to the best of Registrant’s knowledge, in definitive proxy or information statements incorporated by reference in Part III of this Form 10-K or any amendment to this Form 10-K. ☒
Indicate by check mark whether the registrant is a large accelerated filer, an accelerated filer, a non-accelerated filer, or a smaller reporting company or an emerging growth company. See the definitions of “large accelerated filer,” “accelerated filer,” and “smaller reporting company,” and "emerging“emerging growth company"company” in Rule 12b-2 of the Exchange Act. (Check one):
|
| | | | | | | | | | | | | | | | | | | | | | |
Large accelerated filer ☒ | ☒
| Accelerated filer ☐ |
| |
| Non-accelerated filer ☐ | Smaller reporting company | ☐ | Emerging growth company | ☐ |
| |
Emerging growth company ☐ | If an emerging growth company, indicate by check mark if the registrant has elected not to use the extended transition period for complying with any new or revised financial accounting standards provided pursuant to Section 13(a) of the Exchange Act. ☐
|
Indicate by check mark whether the registrant has filed a report on and attestation to its management's assessment of the effectiveness of its internal control over financial reporting under section 404(b) of the Sarbanes-Oxley Act (15 U.S.C. 7262(b)) by the registered public accounting firm that prepared or issued its audit report. ☒
Indicate by check mark whether the registrant is a shell company (as defined in Rule 12b-2 of the Exchange Act). YES ☐ Yes ☒NoNO ☒
State the aggregate market value of the voting and non-voting common stockequity held by non-affiliates computed by reference to the price at which the common equity was last sold, or the average bid and asked price of such common equity, as of the Registrant aslast business day of June 30, 2017:the registrant's most recently completed second fiscal quarter. : Approximately $4.1$4.6 billion*
MGIC Investment Corporation 2022 Form 10-K | 1
* Solely for purposes of computing such value and without thereby admitting that such persons are affiliates of the Registrant, shares held by directors and executive officers of the Registrant are deemed to be held by affiliates of the Registrant. Shares held are those shares beneficially owned for purposes of Rule 13d-3 under the Securities Exchange Act of 1934 but excluding shares subject to stock options.
Indicate the number of shares outstanding of each of the Registrant’sissuer’s classes of common stock, as of the latest practicable date: As of February 16, 2018: 370,862,19017, 2023, there were 290,428,422 shares of common stock of the registrant, par value $1.00 per share, outstanding.
The following documents have been incorporated by reference in this Form 10-K, as indicated:
|
| | | | | | | |
| Document | | Part and Item Number of Form 10-K Into Which Incorporated* |
Proxy Statement for the 20182023 Annual Meeting of Shareholders, provided such Proxy Statement is filed within 120 days after December 31, 2017.2022. If not so filed, the information provided in Items 10 through 14 of Part III will be included in an amended Form 10-K filed within such 120 day period. | | Items 10 through 14 of Part III |
* In each case, to the extent provided in the Items listed.
MGIC Investment Corporation 2022 Form 10-K | 2
MGIC Investment Corporation and Subsidiaries
|
| | | | | | | | | | |
| TABLE OF CONTENTS | Table of Contents |
| | Page No. |
| PART I | | | Page No. |
| PART I | | |
| | Item 1. | | |
| | Item 1A. | | |
| | Item 1B. | | |
| | Item 2. | | |
| | Item 3. | | |
| | Item 4. | | |
| PART II | | |
| | Item 5. | | |
| | Item 6. | Reserved. | | |
| | Item 7. | | |
| | Item 7A. | | |
| | Item 8. | | |
| | Item 9. | | |
| | Item 9A. | | |
| | Item 9B. | | |
| PART IIIItem 9C. | | |
| PART III | | |
| Item 10. | | |
| | Item 11. | | |
| | Item 12. | | |
| | Item 13. | | |
| | Item 14. | | |
| PART IV | | |
| | Item 15. | | |
| | Item 16. | | |
| | | | |
| | | |
| | | |
| | | |
| | | |
| | | |
| | | |
| | | |
| | | |
| | | |
| | | |
MGIC Investment Corporation 2017 Form 10-K | 3
|
| | | | | | | | | | | | | | | |
Glossary of terms and acronyms |
MGIC Investment Corporation
2017 Form 10-K
| | | | | | | | | | | | | | | |
MGIC Investment Corporation 2022 Form 10-K | 3
GLOSSARY OF TERMS AND ACRONYMSGlossary of terms and acronyms
/ A
ARMs
Adjustable rate mortgages
ABS
Asset-backed securities
ASC
Accounting Standards Codification
Available Assets
Assets, as designated under the PMIERs, that are readily available to pay claims, and include the most liquid investments
/ B
Book or book year
A group of loans insured in a particular calendar year
BPMI
Borrower-paid mortgage insurance
/ C
CECL
Current expected credit losses
CFPB
Consumer Financial Protection Bureau
CLO
Collateralized loan obligations
CMBS
Commercial mortgage-backed securities
COVID-19 Pandemic
An outbreak of the novel coronavirus disease, later named COVID-19. The outbreak of COVID-19 was declared a pandemic by the World Health Organization and a national emergency in the United States in March 2020
CRT
Credit risk transfer. The transfer of a portion of mortgage credit risk to the private sector through different forms of transactions and structures
/ D
DAC
Deferred insurance policy acquisition costs
Debt-to-income ("DTI") ratio
The ratio, expressed as a percentage, of a borrower's total debt payments to gross income
DirectDelinquent Loan
When referringA loan that is past due on a mortgage payment. A delinquent loan is typically reported to insuranceus by servicers when the loan has missed two or risk writtenmore payments. A loan will continue to be reported as delinquent until it becomes current or in force, "direct" means beforea claim payment has been made. A delinquent loan is also referred to as a default
Delinquency Rate
The percentage of insured loans that are delinquent
Direct
Before giving effect to reinsurance
/ E
ETFsEPS
Exchange traded fundsEarnings per share
Expense ratio
The ratio, expressed as a percentage, of the underwriting and operating expenses, net and amortization of DAC of our combined insurance operations (which excludes underwriting and operating expenses of our non-insurance operations) to NPW
/ F
Fannie Mae
Federal National Mortgage Association
FCRA
Fair Credit Reporting Act
FEMA
Federal Emergency Management Agency
FHA
Federal Housing Administration
FHFA
Federal Housing Finance Agency
FHLB
Federal Home Loan Bank of Chicago, of which MGIC is a member
FICO score
A measure of consumer credit risk provided by credit bureaus, typically produced from statistical models by Fair Isaac Corporation utilizing data collected by the credit bureaus
FOMC
Federal Open Market Committee
Freddie Mac
Federal Home Loan Mortgage Corporation
MGIC Investment Corporation 2017 Form 10-K | 4
|
| | | | | | | | | | | | | | | |
|
MGIC Investment Corporation
2017 Form 10-K
|
Glossary of Terms and Acronyms (continued) |
/ G
GAAP
Generally Accepted Accounting Principles in the United States
GSEs
Collectively, Fannie Mae and Freddie Mac
MGIC Investment Corporation 2022 Form 10-K | 4
MGIC Investment Corporation and Subsidiaries
/ H
HAMP
Home Affordable Modification Program
HARP
Home Affordable Refinance Program
Home Re Entities
Unaffiliated special purpose insurers domiciled in Bermuda that participate in our aggregate XOL transactions through the ILN market.
Home Re Transactions
Excess-of-loss reinsurance transactions with the Home Re Entities
HOPA
Homeowners Protection Act
HUD
Housing and Urban Development
/ I
IADAIBNR Reserves
Individual Assistance Disaster AreaLoss reserves established on loans we estimate are delinquent, but for which the delinquency has not been reported to us
IBNR
Losses incurred but not reported
IIF
Insurance in force, which for loans insured by us, is equal to the unpaid principal balance, as reported to us
/ JILN
JCTInsurance-linked notes
Joint Committee on Taxation
/ L
LAE
Loss adjustment expenses, which includes the costs of settling claims, including legal and other expenses and general expenses of administering the claims settlement process.
Legacy book
Mortgage insurance policies written prior to 2009
Loan-to-value ("LTV") ratio
The ratio, expressed as a percentage, of the dollar amount of the first mortgage loan to the value of the property at the time the loan became insured and does not reflect subsequent housing price appreciation or depreciation. Subordinate mortgages may also be present
Long-term debt:
5.375% Notes
5.375% Senior Notes due on November 2, 2015, with interest payable semi-annually on May 1 and November 1 of each year
5% Notes
5% Convertible Senior Notes due on May 1, 2017, with interest payable semi-annually on May 1 and November 1 of each year
2% Notes
2% Convertible Senior Notes due on April 1, 2020, with interest payable semi-annually on April 1 and October 1 of each year
5.75% Notes
5.75% Senior Notes
5.25% Notes
5.25% Senior Notes due on August 15, 2023,2028, with interest payable semi-annually on February 15 and August 15 of each year
9% Debentures
9% Convertible Junior Subordinated Debentures due on April 1, 2063, with interest payable semi-annually on April 1 and October 1 of each year
FHLB Advance or the Advance
1.91% Fixed rate advance from the FHLB due on February 10, 2023, with interest payable monthly
Loss ratio
The ratio, expressed as a percentage, of the sum of net incurred losses and loss adjustment expenses to NPEnet premiums earned
Low down payment loans or mortgages
Loans with less than 20% down payments
LPMI
Lender-paid mortgage insurance
/ M
MBA
Mortgage Bankers Association
MGIC Investment Corporation 2017 Form 10-K | 5
|
| | | | | | | | | | | | | | | |
|
MGIC Investment Corporation
2017 Form 10-K
|
Glossary of Terms and Acronyms (continued) |
MBS
Mortgage-backed securities
MD&A
Management's discussion and analysis of financial condition and results of operations
MGIC
Mortgage Guaranty Insurance Corporation, a subsidiary of MGIC Investment Corporation
MICMAC
MGIC IndemnityAssurance Corporation, a subsidiary of MGIC
Minimum Required Assets
The greater of $400 million or the total of the minimum amount of Available Assets that must be held under the PMIERs, which is based upon a percentageon an insurer's book of RIF weighted by certainand is calculated from tables of factors with several risk attributesdimensions, reduced for credit given for risk ceded under reinsurance transactions, and subject to a floor of $400 million
MPP
Minimum Policyholder Position, as required under certain state requirements. The “policyholder position” of a mortgage insurer is its net worth or surplus, contingency reserve and a portion of the reserves for unearned premiums
MGIC Investment Corporation 2022 Form 10-K | 5
MGIC Investment Corporation and Subsidiaries
/ N
N/A
Not applicable for the period presented
NAIC
The National Association of Insurance Commissioners
NIW
New Insurance Written, is the aggregate original principal amount of the mortgages that are insured during a period
N/M
Data, or calculation, deemed not meaningful for the period presented
NPE
The amount of premiums earned, net of premiums assumed and ceded under reinsurance agreements
NPL
Non-performing loan, which is a delinquent loan, at any stage in its delinquency
NPW
The amount of premiums written, net of premiums assumed and ceded under reinsurance agreements
/ O
OCI
Office of the Commissioner of Insurance of the State of Wisconsin
/ P
Persistency
The percentage of our insurance remaining in force from one year prior
PMI
Private Mortgage Insurance (as an industry or product type)
PMIERs
Private Mortgage Insurer Eligibility Requirements issued by the GSEseach of Fannie Mae and Freddie Mac to set forth requirements that an approved insurer must meet and maintain to provide mortgage guaranty insurance on loans delivered to or acquired by Fannie Mae or Freddie Mac, as applicable
Premium Rate
The contractual rate charged for coverage under our insurance policies
Premium Yield
The ratio of NPEpremium earned divided by the average IIF outstanding for the period measured
Primary Insurance
Insurance that provides mortgage default protection on individual loans. Primary insurance may be written on a "flow" basis, in which loans are insured in individual, loan-by-loan transactions, or on a "bulk" basis, in which each loan in a portfolio of loans is individually insured in a single bulk transaction
Profit Commission
Payments we receive from reinsurers under each of our quota share reinsurance transactions if the annual loss ratio is below levels specified in the quota share reinsurance transaction
/ Q
QSR Transaction
Quota share reinsurance transaction with a group of unaffiliated reinsurers
2015 QSR
Our QSR transaction that provided coverage on eligible NIW written prior to 2017
2017 QSR
Our QSR transaction that provided coverage on eligible NIW in 2017
2018 QSR
Our QSR transaction that provided coverage on eligible NIW in 2018
2019 QSR
Our QSR transaction that provided coverage on eligible NIW in 2019
2020 QSR
Our QSR transactions that provide coverage on eligible NIW in 2020
2021 QSR
Our QSR transactions that provide coverage on eligible NIW in 2021
2022 QSR
Our QSR transactions that provide coverage on eligible NIW in 2022
2023 QSR
Our QSR transactions that provide coverage on eligible NIW in 2023
Credit Union QSR
Our QSR transaction that provides coverage on eligible NIW from credit union institutions originated from April 1, 2020 through December 31, 2025
/ R
REMIC
Real Estate Mortgage Investment Conduit
RESPA
Real Estate Settlement Procedures Act
MGIC Investment Corporation 2022 Form 10-K | 6
MGIC Investment Corporation and Subsidiaries
RIF
Risk in force, which for an individual loan insured by us, is equal to the unpaid loan principal balance, as reported to us, multiplied by the insurance coverage percentage. RIF is sometimes referred to as exposure
MGIC Investment Corporation 2017 Form 10-K | 6
|
| | | | | | | | | | | | | | | |
|
MGIC Investment Corporation
2017 Form 10-K
|
Glossary of Terms and Acronyms (continued) |
Risk-to-capital
Under certain state regulations, the ratio of RIF, net of reinsurance and exposure on policies currently in default and for which loss reserves have been established, to the level of statutory capital
RMBS
Residential mortgage-backed securities
/ S
State Capital Requirements
Under certain state regulations, the minimum amount of statutory capital relative to risk in force (or similar measure)
/ T
TaxTILA
Truth in Lending Act
The U.S. tax reform enacted
Traditional XOL Transaction
Excess-of-loss reinsurance transaction with a group of unaffiliated reinsurers that provides coverage on December 22, 2017 and commonly referred to as the "Tax Cuts and Jobs Act"eligible NIW in 2022
/ U
Underwriting Expense Ratioexpense ratio
The ratio, expressed as a percentage, of the underwriting and operating expenses, net and amortization of DAC of our combined insurance operations (which excludes underwriting and operating expenses of our non-insurance subsidiaries) to NPWnet premiums written
Underwriting profit
NPENet premiums earned minus incurred losses and underwriting and operating expenses
USDA
U.S. Department of Agriculture
/ V
VA
U.S. Department of Veterans Affairs
VIE
Variable interest entity
/ X
XOL Transactions
Excess-of-loss reinsurance transactions executed through the Home Re Transactions and the Traditional XOL Transaction
MGIC Investment Corporation 20172022 Form 10-K | 7
|
| | | | | | | | | | | | | | | |
Business | | | | | | | | | | | | | | | |
MGIC Investment Corporation
2017 Form 10-K
| | | | | | | | | | | | | | | |
PART I
Item 1. Business
Business.
A. General
We are a holding company and through wholly-owned subsidiaries we provide private mortgage insurance, other mortgage credit risk management solutions, and ancillary services. In 2017,2022, our net premiums writtentotal revenues were $1.0$1.2 billion and our primary NIW was $49.1$76.4 billion. As of December 31, 2017,2022, our direct primary IIF was $194.9$295.3 billion and our direct primary RIF was $50.3$76.5 billion. For further information about our results of operations, see our consolidated financial statements in Item 8 and our MD&A.&A in Item 7. As of December 31, 2017,2022, our principal mortgage insurance subsidiary, MGIC, was licensed in all 50 states of the United States, the District of Columbia, Puerto Rico and Guam. During 2017,2022, we wrote new insurance in each of those jurisdictions.
Business Strategies2023 BUSINESS STRATEGIES
Our business strategies arecontinue to be to 1) prudently grow IIF,maximize the value we create through our mortgage credit enhancement activities; 2) pursue new business opportunitiesdifferentiate ourselves through our customer experience; 3) establish a competitive advantage through our digital and analytical capabilities; 4) excel at acquiring, managing and distributing mortgage credit risk and the related capital; 5) maintain financial strength through economic cycles; and 6) foster an environment that meetembraces diversity and best positions our return objectives, 3) preserve and expand our role and that of the PMI industry in housing finance policy, 4) manage and deploy capitalpeople to optimize the creation of shareholder value and 5) expand and develop the talents of our co-workers.succeed.
2022 ACCOMPLISHMENTS
Following are several of our 20172022 accomplishments that furthered our business strategies.
•Earned $865 million of net income ($2.79 per diluted share) for the year, compared to $635 million ($1.85 per diluted share) in 2021.
•Increased NIW from $47.9 billion in 2016 to $49.1 billion in 2017 and increasedprimary IIF by more than 7%7.6% year-over-year. The
•Expanded our reinsurance program by securing quota share reinsurance covering the majority of our 2022 and 2023 NIW, is consistent with the Company's risk and return goals.
Held leadership roles in key trade associations.
Continued to enhance the reputationexecuting excess of the Companyloss reinsurance through an ILN and the industry relativetraditional reinsurance market. These transactions allow us to potential reformbetter manage our risk profile and they provide an alternative source of housing finance policy.capital.
Decreased our long-term debt to shareholders' equity ratio from 46.7% as•Paid $800 million of December 31, 2016, to 26.5% as of December 31, 2017.
Increasedcash dividends from MGIC to our holding company. Maintained financial strength and capital flexibility while returning approximately $497 million in capital to shareholders:
◦Repurchased 8.7% of our shares outstanding at the beginning of the year.
◦Increased cash dividends by 25% in the second half of 2022.
•Repurchased $89 million of our 2063 Junior Convertible Debentures, which eliminated approximately 6.8 million potentially dilutive shares.
•Redeemed the outstanding principal balance of the 5.75% Senior Notes at a purchase price of $248 million plus accrued interest.
•Repaid the outstanding principal balance of the FHLB advance at a prepayment price of $156 million.
•Established a Transformation Management Office and Senior Leadership Team (the "SLT") to oversee technological investment governance and lead an enterprise-wide business prioritization process. Continued to meettransform our business processes along a number of dimensions, including modelling, pricing, data and analytics, application programming interfaces, sales and underwriting.
•Continued work on our Affordable Housing Strategy through ongoing participation in the financial requirementsAffordable Housing Advisory Board of the PMIERs with a comfortable cushion.
Maintained our traditionally low expense base.
Received upgraded ratings for MGIC from Moody'sMortgage Bankers Association and Standards and Poor's.
Negotiated a reinsurance agreement covering 2018 NIW.
Overviewsupport of the Private Mortgage Insurance IndustryUrban Institute's Housing Finance Innovation Forum, the National Housing Conference, the Coalition of Community Development Financial Institutions, the National Association of Hispanic Real Estate Professionals, the National Association of Real Estate Brokers, the National Conference of State Housing Agencies, and its Operating Environmentthe National Association of Local Housing Finance Agencies.
•Made significant progress in our diversity, equity and inclusion ("DEI") work, including the formation of a DEI Council, leadership participation in DEI Workshops, and the creation of a DEI site on the Company's intranet page.
OVERVIEW OF THE PRIVATE MORTGAGE INSURANCE INDUSTRY AND ITS OPERATING ENVIRONMENT
We established the modern PMI industry in 1957 to provide a private market alternative to federal government insurance programs. PMI covers losses from homeowner defaults on residential mortgage loans, reducing, and in some instances eliminating, the loss to the insured institution.
Fannie Mae and Freddie Mac ("the GSEs") have been the major purchasers of the mortgage loans underlying new insurance written by private mortgage insurers. The GSEs purchase residential mortgagesmortgage loans as part of their governmental mandate to provide liquidity in the secondary mortgage market. The GSEs cannot buy low down payment mortgage loans without certain forms of credit enhancement. Private mortgage insurance has generally been purchased by lenders in primary mortgage market transactions to satisfy this credit enhancement the primary form of which is PMI.requirement. Therefore, PMI facilitates the sale of low down payment mortgages in the secondary mortgage market to the GSEs and plays an important role in the housing finance system by assisting consumers, especially first-time and lower net-
MGIC Investment Corporation 2017 Form 10-K | 8
|
| | | | | | | | | | | | | | | |
| | | | | | | | | | | | | | | |
MGIC Investment Corporation
2017 Form 10-K
|
Business (continued) |
worthlow- and medium-wealth homebuyers, to finance homes with low down payment mortgages. PMI also reduces the regulatory capital that depository institutions are required to hold against certain low down payment mortgages that they hold as assets.
Because the GSEs have been the major purchasers of the mortgages underlying new insurance written by private mortgage insurers, the PMI industry in the U.S. is defined in large part by the requirements and practices of the GSEs. These requirements and practices, as well as those of the federal regulators that oversee the GSEs and lenders, impact the operating results and financial performance of private mortgage insurers. In 2008, the federal
MGIC Investment Corporation 2022 Form 10-K | 8
MGIC Investment Corporation and Subsidiaries
government took control of the GSEs through a conservatorship process. The FHFA is the conservator of the GSEs and has the authority to control and direct their operations.
In 2022 the past, membersGSEs submitted Equitable Housing Finance Plans to the FHFA. The Plans seek to advance equity in housing finance over a three year period and include potential changes to the GSEs’ business practices and policies. Specifically relating to mortgage insurance, (1) Fannie Mae’s Plan contemplates the creation of Congress have introduced several bills intendedspecial purchase credit program(s) ("SPCPs") targeted to changehistorically underserved borrowers with a goal of lowering costs for such borrowers through lower than standard mortgage insurance requirements; and (2) Freddie Mac’s Plan contemplates the creation of SPCPs targeted to historically underserved borrowers with the goals of (a) working with mortgage insurers to reduce costs for high LTV borrowers, and (b) updating mortgage insurance cancellation requirements. To the extent the business practices and policies of the GSEs regarding mortgage insurance coverage, costs and cancellation change, including more broadly than through SPCPs, such changes may negatively impact the FHA, however, no legislation has been enacted. The current Presidential administration has indicated that the conservatorship of the GSEs should end; however, it is unclear whether and when that would occur and how that would impact us. As a result of the matters referred to above, itmortgage insurance industry.
It is uncertain what role the GSEs, FHA and private capital, including private mortgage insurance, will play in the
domestic residential housing finance system in the
future or thefuture. The timing and impact
of any such changes on our
business. In addition, the timing of the impactbusiness of any resulting changes
on our business is uncertain.
Most meaningfulSome changes would require Congressional action to implement and it is difficult to estimate when
Congressionalany action would be final and how long any associated phase-in period may last.
See our risk factor titled “Changes in the business practices of the GSEs, federal legislation that changes their charters or a restructuring of the GSEs could reduce our revenues or increase our losses” in Item 1A.
The GSEs have private mortgage insurer eligibility requirements, or PMIERs,"PMIERs", for private mortgage insurers that insure loans delivered to or purchased by the GSEs. The financial requirements of the PMIERs require a mortgage insurer’s Available Assets to equal or exceed its Minimum Required Assets. While on an overall basis,MGIC is in compliance with the amount of Available Assets MGIC must hold in order to continuePMIERs and eligible to insure GSE loans is greaterpurchased by the GSEs. In calculating Minimum Required Assets, we receive significant credit for risk ceded under the PMIERs than the amount state regulation currently requires,our reinsurance transactions. See "Reinsurance" in this Item 1 for information about our reinsurance transactions mitigate the negative effect of the PMIERs on our returns. Seeand "Regulation – Direct Regulation" belowin this Item 1 for information about our compliance with the financial requirements of the PMIERs and about proposed changes to the PMIERs that are being recommended to the FHFA by the GSEs.
PMIERs.
The private mortgage insurance industry is greatly impacted by macroeconomic conditions that affect home loan originations and credit performance of home loans, including unemployment rates, home prices, restrictions on mortgage credit due to underwriting standards, interest rates, household formations and homeownership rates. TheDuring the years leading up to the financial crisis andof the downturn in the housing market that began in 2007 had a significant negative impact on the industry and our company. During the last several years preceding the financial crisis,2000s, the mortgage lending industry increasingly made home loans to individuals with higher risk credit profiles, at higher LTV ratios,profiles. In certain sections of this Annual Report, we discuss our insurance written in 2005-2008 separately from our insurance written in earlier and based on less documentation and verification of information regarding the borrower.later years. Beginning in 2007, job creation slowed and the housing markets began slowing in certain areas, with declines in certain other areas. In 2008 and 2009, employment in the U.S. decreased substantially and nearly all geographic areas in the U.S. experienced home price declines. Together, these conditions resulted in significant adverse developments for us and our industry and we reported a net loss in each of 2007 through 2013.industry. The operating environment for private mortgage insurers has materially improved in recent yearsafter the financial crisis, as the economy recovered.
The COVID-19 pandemic had a material impact on our 2020 financial results. The increased level of unemployment and
economic uncertainty resulted in an increase in the number of mortgage delinquencies for which we recorded increased loss reserves. After reaching 14.7% in April 2020, the unemployment rate declined through the end of 2021, and remained below 4% for most of 2022. The number of delinquent mortgages that we insure has recovered. For 2017,also declined through the end of 2022, after reaching its recent peak in June 2020. The decline in delinquent mortgages that we reportedinsure, along with favorable loss reserve development in 2022 resulted in our losses incurred significantly decreasing in 2022 compared to 2021, and our net income significantly increasing. For a discussion of $355.8 million.the various ways the COVID-19 pandemic may impact us in the future, see our Risk Factor titled "The COVID-19 pandemic may materially impact our business and future financial condition" in Item 1A.
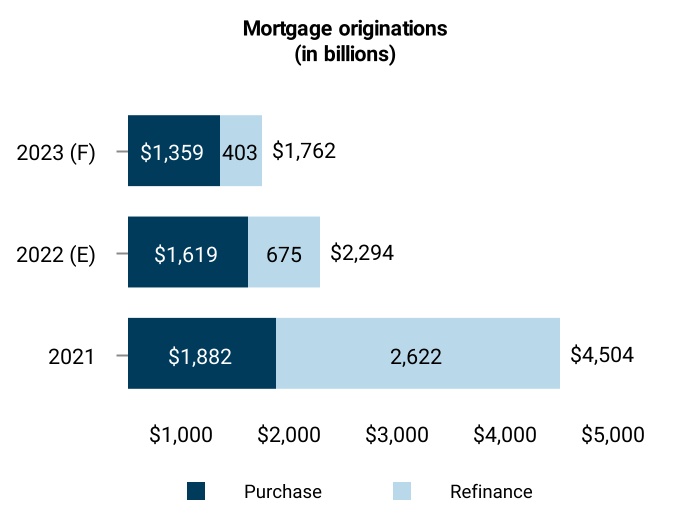
During 2017, $270In 2022, $405 billion of mortgages were insured with primary coverage by private mortgage insurers, compared to $270$585 for the full year of 2021, and $600 billion in 2016for full year 2020. The 2022 and $220 billion in 2015. These figures include $1.0 billion, $2.8 billion and $4.2 billion of bulk business and refinance transactions that2021 volumes were originated under HARP in 2017, 2016 and 2015, respectively. We do not include HARP transactions in our NIW total because we consider them a modification of the coverage on existing IIF. The 2017 volume of mortgages insured by private mortgage insurers was flat compared to 2016, as the increase in insurance on purchase mortgage originations offset the decrease in refinance transactions. Although the 2017 volume was significantly greater than the recent low in 2010 of $70 billion it remains belowand greater than the volumes of 2001 through 2007 when, on average, approximately $311 billion of mortgages were insured with primary coverage by private mortgage insurers. The high 2021 and 2020 volumes resulted, in part, from historically low interest rates driving sustained borrower demand, including for refinances, and the effect that the COVID-19 pandemic had on demand for homes.
For most of our business, we and other private mortgage insurers compete directly with federal and state governmental and quasi-governmental agencies that sponsor government-backed mortgage insurance
MGIC Investment Corporation 2017 Form 10-K | 9
|
| | | | | | | | | | | | | | | |
| | | | | | | | | | | | | | | |
MGIC Investment Corporation
2017 Form 10-K
|
Business (continued) |
programs, principally the FHA, VA and USDA. The publication Inside Mortgage Finance estimates that in 2017,2022, the FHA accounted for 35.6%26.7% of low down payment residential mortgages that were subject to FHA, VA, USDA or primary private mortgage insurance, up slightly from 35.5%compared to 24.7% in 2016. In the prior ten years,2021 and 23.4% in 2020. Since 2012, the FHA’s market share has been as low as 17.1% in 200723.4% (2020) and as high as 68.7% in 2009.42.1% (in 2012). Factors that influence the FHA’s market share include relative rates and fees, underwriting guidelines and loan limits of the FHA, VA, USDA, private mortgage insurers and the GSEs; lenders' perceptions of legal risks under FHA versus GSE programs; flexibility for the FHA to establish new products as a result of federal legislation and programs; returns expected to be obtained by lenders for Ginnie Mae securitization of FHA-insured loans compared to those obtained from selling loans to Fannie Mae or Freddie Macthe GSEs for securitization; and differences in policy terms, such as the ability of a borrower to cancel insurance coverage under certain circumstances. WeThe focus of the Presidential Administration on equitable housing finance and sustainable housing opportunities increases the likelihood of a reduction in the FHA’s mortgage insurance premium rates. Such a rate reduction would negatively impact our NIW; however, given the many factors that influence the FHA's market share, it is difficult to predict the impact. In addition, we also cannot predict how the factors listed above orthat affect the FHA’s share of NIW will change in the future.
Inside Mortgage Finance estimates that in 2017,2022, the VA accounted for 24.1%24.5% of all low down payment residential mortgages that were subject to FHA, VA, USDA or primary private mortgage insurance, down from 26.6%compared to 30.2% in 2016, which had been its highest level2021 and 30.9% in the prior ten years. In the prior ten years,2020. Since 2012, the VA's market share has been as low as 5.4% in 2007.22.8% (in 2013) and as high a 30.9% (in 2020). We believe that the VA’s market share has generally been increasing because of an increase ingrows as the number of borrowers that are eligible for the VA’s program whichincreases and when eligible borrowers opt to use the VA program when refinancing their
MGIC Investment Corporation 2022 Form 10-K | 9
MGIC Investment Corporation and Subsidiaries
mortgages. The VA program offers 100% LTV loans and charges a one-time funding fee that can be included in the loan amount, and because eligible borrowers have opted to use the VA program when refinancing their mortgages.
amount.
The private mortgage insurance industry also competes with alternatives to mortgage insurance, such as investors using risk mitigation and credit risk transfer techniques other than PMI, including capital market transactions structured to transfer risk of default on residentialentered into by the GSEs and banks; lenders and other investors holding mortgages investors willing to hold credit risk on their own balance sheets without credit enhancement,in portfolio and self-insuring; and “piggyback loans,” which combine a first lien loan with a second lien loan. In 2018, the GSEs initiated secondary mortgage market programs with loan level mortgage default coverage provided by various (re)insurers that are not mortgage insurers governed by PMIERs, and that are not selected by the lenders. While we view these programs as competing with traditional private mortgage insurance, we participate in them through an affiliate of MGIC.
The GSEs (and other investors) have also used other forms of credit enhancement that did not involve traditional private mortgage insurance, such as engaging in credit-linked note transactions executed in the capital markets, or using other forms of debt issuances or securitizations that transfer credit risk directly to other investors, including competitors and an affiliate of MGIC; and using other risk mitigation techniques in conjunction with reduced levels of private mortgage insurance coverage.
In addition to the FHA, VA, other governmental agencies and the alternatives to mortgage insurance discussed above, we also compete with other mortgage insurers. The level of competition, including price competition, within the private mortgage insurance industry has intensifiedremained intense over the past several years and is not expected to diminish.years. See "Our Products and Services – Sales and Marketing and Competition – Competition" below for more information about the impact on our business of competition in the private mortgage insurance industry.
In addition to being subject to the requirements and practices of the GSEs, private mortgage insurers are subject to comprehensive, detailed regulation by state insurance departments. The insurance laws of 16 jurisdictions, including Wisconsin, MGIC's domiciliary state, require a mortgage insurer to maintain a minimum amount of statutory capital relative to the RIF (or a similar measure) in order for the mortgage insurer to continue to write new business. The NAIC previously announced plans to revise the minimum capital and surplus requirements for mortgage insurers that are provided for in its Mortgage Guaranty Insurance Model Act. AIn December 2019, a working group of state regulators has been considering since 2016released an exposure draft of a revised Mortgage Guaranty Insurance Model Act and a risk-based capital framework to establish capital requirements for mortgage insurers, although no date has been establishedcertain items were not completely addressed by whichthe framework, including the treatment of ceded risk and minimum capital floors. In October 2022, the NAIC must propose revisionsworking group released a revised exposure draft of the Mortgage Guaranty Insurance Model Act that does not include changes to the capital requirements.
Due to the changing environment described above, as well as other factors discussed below, at this time the greatest uncertainty we face is whether private mortgage insurance will remain a significant credit enhancement alternative for low down payment single family mortgages. An increase in the use of alternatives to private mortgage insurance, such as credit-linked note transactions executed in the capital markets, or a possible restructuring or change in the chartersrequirements of the GSEs, could significantly affect our business. For additional information about this uncertainty, see our risk factors titled “The amount of insurance we write could be adversely affected if lenders and investors select alternatives to private mortgage insurance” and “Changes in the business practices of the GSEs, federal legislation that changes their charters or a restructuring of the GSEs could reduce our revenues or increase our losses” in Item 1A.existing Model Act.
General Information About Our CompanyGENERAL INFORMATION ABOUT OUR COMPANY
We are a Wisconsin corporation organized in 1984. Our principal office is located at MGIC Plaza, 250 East Kilbourn Avenue, Milwaukee, Wisconsin 53202 (telephone number (414) 347-6480). As used in this annual report, “we,” “our” and “us” refer to MGIC Investment Corporation’s consolidated operations or to MGIC
MGIC Investment Corporation 2017 Form 10-K | 10
|
| | | | | | | | | | | | | | | |
| | | | | | | | | | | | | | | |
MGIC Investment Corporation
2017 Form 10-K
|
Business (continued) |
Investment Corporation, as a separate
entity, as the context requires, and “MGIC” refers to Mortgage Guaranty Insurance Corporation.
Our revenues and losses may be materially affected by the risk factors that are included in Item 1A of this annual report. These risk factorsreport and are an integral part of this annual report. These risk factors may also cause actual results to differ materially from the results contemplated by forward looking statements that we may make. Forward looking statements consist of statements whichthat relate to matters other than historical fact. Among others, statements that include words such as we “believe,” “anticipate” or “expect,” or words of similar import, are forward looking statements. We are not undertaking any obligation to update any forward looking statements or other statements we may make even though these statements may be affected by events or circumstances occurring after the forward looking statements or other statements were made. No reader of this annual report should rely on these statements being current at any time other than the time at which this annual report was filed with the Securities and Exchange Commission.
B. Our Products and Services
Mortgage InsuranceMORTGAGE INSURANCE
In general, there are two principal types of private mortgage insurance: “primary” and “pool.”
Primary Insurance. Primary insurance provides mortgage default protection on individual loans and covers a percentage of the unpaid loan principal, delinquent interest and certain expenses associated with the default and subsequent foreclosure on the mortgage or sale approved by usof the underlying property (collectively, the “claim amount”). In addition to the loan principal, the claim amount is affected by the mortgage note rate and the time necessary to complete the foreclosure or sale process. For the past several years, the average time it took to receive a claim associated with a delinquency increased significantly from our historical experience of approximately twelve months, in part, due to new loss mitigation protocols established by servicers and to changes in some state foreclosure laws that may include, for example, a requirement for additional review and/or mediation processes. In recent quarters, the average time for servicers to process foreclosures has decreased, which has reduced the average time to receive a claim associated with new delinquent notices that do not cure. The insurer generally pays the coverage percentage of the claim amount specified in the primary policy but has the option to pay 100% of the claim amount and acquire title to the property. Primary insurance is generally written on first mortgage loans secured by owner occupied "single-family" homes, which are one-to-four family homes and condominiums. Primary insurance can be written on first liens secured by non-owner occupied single-family homes, which are referred to in the home mortgage lending industry as investor loans, and on vacation or second homes. Primary coverage can be used on any type of residential mortgage loan instrument approved by the mortgage insurer.
References in this document to amounts of insurance written or in force, risk written or in force, and other historical data related to our insurance refer only to direct (before giving effect to reinsurance) primary insurance, unless otherwise indicated. Primary insurance may be written on a flow basis, in which loans are insured in individual, loan-by-loan transactions, or may be written on a bulk basis, in which each loan in a portfolio of loans is individually insured in a single, bulk transaction. Our new primary insurance written was $49.1$76.4 billion in 2017,2022, compared to $47.9$120.2 billion in 20162021 and $43.0$112.1 billion in 2015.2020. The 2017 increase2022 decrease compared to 20162021 reflects an increasea decrease in the purchase mortgage originations we insured, offsettingas well as a decrease in the refinance transactionsmortgage originations we insured.
MGIC Investment Corporation 2022 Form 10-K | 10
MGIC Investment Corporation and Subsidiaries
The following table shows,charts show, on a direct basis, our primary IIF and primary RIF as of December 31 for the MGIC Book as of the datesyears indicated.
| | | | | | | | | | | | | | | | | | | | | | | | | | | | | | | | |
| Primary insurance and risk in force |
| (In billions) | | 2022 | | 2021 | | 2020 | | 2019 | | 2018 |
| Primary IIF | | $ | 295.3 | | | $ | 274.4 | | | $ | 246.6 | | | $ | 222.3 | | | $ | 209.7 | |
| Primary RIF | | 76.5 | | | 69.3 | | | 61.8 | | | 57.2 | | | 54.1 | |
|
| | | | | | | | | | | | | | | | | | | | | |
| | | | | | | | | | | | |
| Primary insurance in force and risk in force | | | December 31, |
| (in billions) | | 2017 | | 2016 | | 2015 | | 2014 | | 2013 |
| Direct Primary IIF | | $ | 194.9 |
| | $ | 182.0 |
| | $ | 174.5 |
| | $ | 164.9 |
| | $ | 158.7 |
|
| | Direct Primary RIF | | $ | 50.3 |
| | $ | 47.2 |
| | $ | 45.5 |
| | $ | 42.9 |
| | $ | 41.1 |
|
MGIC Investment Corporation 2017 Form 10-K | 11
|
| | | | | | | | | | | | | | | |
| | | | | | | | | | | | | | | |
MGIC Investment Corporation
2017 Form 10-K
|
Business (continued) |
For loans sold to Fannie Mae or Freddie Mac,a GSE, the coverage percentage must comply with the requirements established by the particular GSE to which the loan is delivered. The GSEs have different loan purchase programs that allow different levels of mortgage insurance coverage. Under the “charter coverage” program, on certain loans lenders may choose a mortgage insurance coverage percentage that is less than the GSEs’ “standard coverage” and only the minimum required by the GSEs’ charters, with the GSEs paying a lower price for such loans. In 2017, nearly all2022, a substantial majority of our volume was on loans with GSE standard or higher coverage.
For loans that are not sold to the GSEs, the lender determines the coverage percentage from those that we offer. Higher coverage percentages generally result in increased severity, which is the amount paid on a claim. We charge higher premium rates for higher coverage percentages. However, there can be no assurance that the higher premium rates adequately reflect the risks associated with higher coverage percentages. In accordance with GAAP for the mortgage insurance industry, loss reserves for losses are only established for policies covering delinquent loans. Because, historically,Historically, because relatively few defaultsdelinquencies occur in the early years of a book of business, the higher premium revenue from higher coverage has historically been recognized before any significant higher losses resulting from that higher coverage may be incurred. For more information, see “– Exposure“Exposure to Catastrophic Loss; Defaults;Delinquencies; Claims; Loss Mitigation – Claims.Mitigation.”
In general, mortgage insurance coverage cannot be terminated by the insurer. However, subject to certain restrictions on our rescission rights as are specified in our masterinsurance policy, and our Gold Cert Endorsement, we may terminate or rescind coverage for, among other reasons, non-payment of premium, certain material misrepresentations madeand fraud in connection with the application for the insurance policy or if the loan was never eligible for coverage under our policy. For more information including with regard to our Gold Cert Endorsement, see “– Exposure to Catastrophic Loss; Defaults; Claims; Loss Mitigation — Loss Mitigation.” Mortgage insurance coverage is renewable at the option of the insured lender, at the renewal rate fixed when the loan was initially insured. Lenders may cancel insurance written on a flow basis at any time at their option or because of mortgage repayment, which may be accelerated because of the refinancing of mortgages.
In the case of a loan purchased by Freddie Mac or Fannie Mae,a GSE, a borrower meetingmay request termination of insurance based on the home’s current value if certain conditions may requireLTV ratio and seasoning requirements are met and the mortgage servicerborrowers have an acceptable payment history. For loans seasoned between two and five years, the LTV ratio must be 75% or less, and for loans seasoned more than five years the LTV ratio must be 80% or less. If the borrower has made substantial improvements to cancel insurance upon the borrower’s request whenproperty, the principal balance ofGSEs allow for cancellation once the loan isLTV ratio reaches 80% or less of the home’s current value.
with no minimum seasoning requirement.
Mortgage insurance for loans secured by one-family, primary residences can be canceled under HOPA.the Homeowners Protection Act (“HOPA”). In general, HOPA requires a servicer to cancel the mortgage insurance if a borrower requests cancellation when the principal balance of the loan is first scheduled to reach 80% of
the original value of the property, or reaches that percentage through payments, if 1) the borrower is current on the loan and has a “good payment history” (as defined by the HOPA), 2) the borrower provides evidence as and if required by the mortgage owner, the borrower provides evidence that the value of the property has not declined below the original value, and 3) if required by the mortgage owner, the borrower certifies that the borrower’s equity in the property is not subject to a subordinate lien. Additionally, the HOPA requires mortgage insurance to terminate automatically when the principal balance of the loan is first scheduled to reach 78% of the original value of the property and the borrower is current on loan payments or thereafter becomes current. Annually, servicers must inform borrowers of their right to cancel or terminate mortgage insurance. The provisions of the HOPA described above apply only to borrower paid mortgage insurance, which is described below.
Coverage tends to continue for borrowers experiencing economic difficulties or living in areas experiencing home price depreciation. The persistency of coverage for those borrowers, coupled with cancellation of coverage for other borrowers, can increase the percentage of an insurer’s portfolio covering loans with more credit risk. This development can also occur during periods of heavy mortgage refinancing because borrowers experiencing property value appreciation are less likely to require mortgage insurance at the time of refinancing, while borrowers not experiencing property value appreciation are more likely to continue to require mortgage insurance at the time of refinancing or not qualify for refinancing at all (including if they have experienced economic difficulties) and thus remain subject to the mortgage insurance coverage.
The percentage of NIW on loans representing refinances was 11%3% for 2017,2022, compared to 20% for 20162021 and 19%36% for 2015.2020. When a borrower refinances a mortgage loan insured by us by paying it off in full with the proceeds of a new mortgage that is also insured by us, the insurance on that existing mortgage is cancelled, and insurance on the new mortgage is considered to be NIW. Therefore, continuation of our coverage from a refinanced loan to a new loan results in both a cancellation of insurance and NIW. When a lender and borrower modify a loan rather than replace it with a new one or enter into a new loan pursuant to a loan modification
MGIC Investment Corporation 2017 Form 10-K | 12
|
| | | | | | | | | | | | | | | |
| | | | | | | | | | | | | | | |
MGIC Investment Corporation
2017 Form 10-K
|
Business (continued) |
program, our insurance continues without being cancelled, assuming that we consent to the modification or new loan. As a result, such modifications or new loans including those modified under HARP, are not included in our NIW.
In addition to varying with the coverage percentage, our premium rates for insurance varyhave varied depending upon the perceived risk of a claim on the insured loan and thus takehave taken into account, among other things, the LTV ratio, the borrower’s credit score whetherand DTI ratio, the loan is a fixed payment loan or a non-fixed payment loan (a non-fixed payment loan is referred to innumber of borrowers, the home mortgage lending industry as an ARM),property location, the mortgage term and whether the property is the borrower’s primary residence. We generally utilizeIn recent years, the mortgage insurance industry has materially reduced its use of standard rate cards, which were fairly consistent among competitors, and correspondingly increased its use of (i)pricing systems that use a national, ratherspectrum of filed rates to allow for formulaic, risk-based pricing based on multiple attributes that may be quickly adjusted within certain parameters, and (ii) customized rate plans, both of which typically have rates lower than a regional or local, premiumthe standard rate policy. However, depending upon regional economic conditions, we have made, and may make, changes to our underwriting requirements to implement more restrictive standards in certain markets and for loan characteristics that we categorize as higher risk. Premium rates cannot be changed after the issuance of coverage.card.
The borrower’s mortgage loan instrument may require the borrower to pay the mortgage insurance premium. Our industry refers to the related mortgage insurance as “borrower-paid.”“borrower-paid” or BPMI. If the borrower is not required to pay the premium and
MGIC Investment Corporation 2022 Form 10-K | 11
MGIC Investment Corporation and Subsidiaries
mortgage insurance is required in connection with the origination of the loan, then the premium is paid by the lender, who may recover the premium through an increase in the note rate on the mortgage or higher origination fees. Our industry refers to the related mortgage insurance as “lender-paid.”“lender-paid” or LPMI. Most of our primary IIF is borrower-paid mortgage insurance.
BPMI.
There are several payment plans available to the borrower, or lender, as the case may be. Under the single premium plan, the borrower or lender pays us in advance a single payment covering a specified term exceeding twelve months. Under the monthly premium plan, the borrower or lender pays us a monthly premium payment to provide only one month of coverage. Under the annual premium plan, an annual premium is paid to us in advance, with annual renewal premiums paid in advance thereafter.
During 2017, 20162022, 2021 and 2015,2020, the single premium plan represented approximately 19%4%, 19%7% and 20%9%, respectively, of our NIW. The monthly premium plan represented approximately 81%96%, 81%93% and 79%91%, respectively. The annual premium plan represented less than 1% of NIW in each of those years. Depending onupon the actual life of a single premium policy and its premium rate relative to that of a monthly premium policy, a single premium policy may generate more or less premium than a monthly premium policy over its life.
Pool and Other Insurance. Pool insurance is generally used as an additional “credit enhancement” for certain secondary market mortgage transactions. Pool insurance generally covers the amount of the loss on a defaulted mortgage loan that exceeds the claim payment under the primary coverage, if primary insurance is required on that mortgage loan, as well as the total loss on a defaulted mortgage loan which did not require primary insurance. Pool insurance may have a stated aggregate loss limit for a pool of loans and may also have a deductible under which no losses are paid by the insurer until losses on the pool of loans exceed the deductible.
We have written no new pool riskinsurance since 2009,2008; however, for a variety of reasons, including responding to capital market alternatives to private mortgage insurancePMI and customer demands, we may write pool risk in the future. As of December 31, 2017, less than 1% of2022, our direct pool RIF was $276 million ($196 million on pool insurance. As noted in "Other Productspolicies with aggregate loss limits and Services – Other" below, an$80 million on pool policies without aggregate loss limits).
In connection with the GSEs' credit risk transfer programs, we provide insurance subsidiaryand reinsurance covering portions of MGIC has provided an immaterial amountthe credit risk related to certain reference pools of credit insurance whose structure is equivalent to pool insurance. That credit insurance is not included in discussions of pool insurance contained in this annual report.mortgages acquired by the GSEs.
MORTGAGE INSURANCE PORTFOLIO
Geographic Dispersion
Dispersion.The following tables reflect the percentage of primary RIF in the top 10 jurisdictions and top 10 core-based statistical areas for the MGIC Book at December 31, 2017. We refer to the insurance that has been written by MGIC (including MIC for portions of 2012 and 2013) as the "MGIC Book."2022.
MGIC Investment Corporation 2017 Form 10-K | 13
|
| | | | | | | | | | | | | | | |
| | | | | | | | | | | | | | | Top 10 jurisdictions – RIF |
MGIC Investment Corporation
2017 Form 10-K
| |
Business (continued)California | 8.3 | % |
| Texas | 7.6 | % |
| Florida | 6.7 | % |
| Pennsylvania | 4.9 | % |
| Illinois | 4.2 | % |
| Virginia | 3.9 | % |
| North Carolina | 3.8 | % |
| Ohio | 3.7 | % |
| Georgia | 3.7 | % |
| New York | 3.5 | % |
| Total | 50.3 | % |
Dispersion of Primary Risk in Force
|
| | | | |
| | |
Top 10 jurisdictions | California | 8.4 | % |
Florida | 6.9 | % |
| Texas | 6.2 | % |
| Pennsylvania | 5.3 | % |
| Ohio | 4.6 | % |
| Illinois | 4.3 | % |
| Michigan | 3.4 | % |
| Georgia | 3.3 | % |
| Virginia | 3.3 | % |
| New York | 3.1 | % |
| Total | 48.8 | % |
|
| | | |
| | |
| Top 10 core-based statistical areas | Chicago-Naperville-Arlington Heights | 2.8 | % – RIF |
Atlanta-Sandy Springs-Roswell | 2.4 | % |
| Washington-Arlington-Alexandria | 2.43.2 | % |
| Atlanta-Sandy Springs-Roswell | Minneapolis-St. Paul-Bloomington2.7 | 2.1 | % |
| Chicago-Naperville-Arlington Heights | Houston-Woodlands-Sugar Land2.7 | 2.0 | % |
| Houston-Woodlands-Sugar Land | Philadelphia2.3 | 1.9 | % |
| Minneapolis-St. Paul-Bloomington | 1.9 | % |
| Los Angeles-Long Beach-Glendale | 1.81.7 | % |
| Phoenix-Mesa-Scottsdale | Phoenix-Mesa-Scottsdale1.7 | 1.7 | % |
| Dallas-Plano-Irving | Riverside-San Bernardino-Ontario1.6 | 1.4 | % |
| Philadelphia | Portland-Vancouver-Hillsboro1.6 | 1.4 | % |
| Riverside-San Bernardino | Total1.5 | 19.9% |
| Total | 20.9 | % |
The percentages shown above for various core-based statistical areas can be affected by changes, from time to time, in the federal government’s definition of a core-based statistical area.
MGIC Investment Corporation 20172022 Form 10-K | 1412
MGIC Investment Corporation and Subsidiaries
|
| | | | | | | | | | | | | | | |
| | | | | | | | | | | | | | | |
MGIC Investment Corporation
2017 Form 10-K
|
Business (continued) |
Insurance In Force by Policy Year
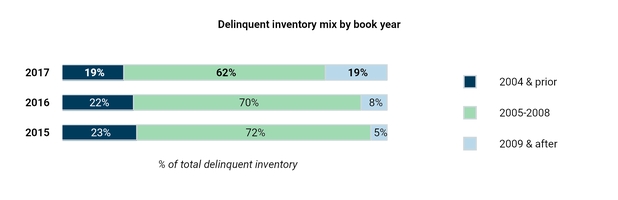
Year.The following table sets forth for the MGIC Book the dispersion ofand certain statistics associated with our primary IIF and RIF as of December 31, 2017,2022, by year(s) of policy origination since we began operations in 1985.
| | | | | | | | | | | | | | | | | | | | | | | | | | | | | | | | | | | | | | | | | |
| Primary insurance in force and risk in force by policy year | | Insurance in Force | | Risk in Force | Primary insurance in force and risk in force by policy year |
| Policy Year | Total (In millions) | | Percent of Total | | Total (In millions) | | Percent of Total | |
| 2004 and prior | $ | 4,629 |
| | 2.4 | % | | $ | 1,294 |
| | 2.6 | % | |
| | 2005 | 4,227 |
| | 2.2 | % | | 1,206 |
| | 2.4 | % | |
| | 2006 | 7,697 |
| | 3.9 | % | | 2,117 |
| | 4.2 | % | |
| | 2007 | 16,903 |
| | 8.7 | % | | 4,360 |
| | 8.7 | % | |
| | 2008 | 7,787 |
| | 4.0 | % | | 1,985 |
| | 3.9 | % | |
| | 2009 | 1,239 |
| | 0.6 | % | | 291 |
| | 0.6 | % | |
| | 2010 | 1,005 |
| | 0.5 | % | | 283 |
| | 0.6 | % | |
| | 2011 | 1,922 |
| | 1.0 | % | | 538 |
| | 1.0 | % | |
| | 2012 | 6,253 |
| | 3.2 | % | | 1,759 |
| | 3.5 | % | |
| | 2013 | 10,031 |
| | 5.1 | % | | 2,780 |
| | 5.5 | % | |
| | 2014 | 16,379 |
| | 8.4 | % | | 4,318 |
| | 8.6 | % | |
| | 2015 | 29,206 |
| | 15.0 | % | | 7,547 |
| | 15.0 | % | |
| | 2016 | 42,026 |
| | 21.6 | % | | 10,471 |
| | 20.8 | % | |
| | 2017 | 45,637 |
| | 23.4 | % | | 11,370 |
| | 22.6 | % | |
| | Total | $ | 194,941 |
| | 100.0 | % | | $ | 50,319 |
| | 100.0 | % | |
| ($ in millions) | | ($ in millions) | Insurance in Force | | Risk In Force | | Weighted Avg. Interest Rate | Delinquency Rate % | Cede Rate % | % of Original Remaining |
| Policy Year | | Policy Year | Total | % of Total | | Total | % of Total | |
| 2004 and prior | | 2004 and prior | $ | 1,475 | | 0.5 | % | | $ | 411 | | 0.5 | % | | 7.3 | % | 13.1 | % | — | % | N.M. |
| 2005-2008 | | 2005-2008 | 11,610 | | 3.9 | % | | 3,083 | | 4.0 | % | | 6.9 | % | 10.9 | % | — | % | 4.8 | % |
| 2009-2015 | | 2009-2015 | 6,457 | | 2.2 | % | | 1,754 | | 2.3 | % | | 4.3 | % | 4.7 | % | — | % | 3.6 | % |
| 2016 | | 2016 | 6,527 | | 2.2 | % | | 1,749 | | 2.3 | % | | 3.9 | % | 3.2 | % | — | % | 13.6 | % |
| 2017 | | 2017 | 7,839 | | 2.7 | % | | 2,059 | | 2.7 | % | | 4.2 | % | 3.8 | % | — | % | 15.9 | % |
| 2018 | | 2018 | 8,106 | | 2.7 | % | | 2,081 | | 2.8 | % | | 4.8 | % | 4.4 | % | — | % | 16.2 | % |
| 2019 | | 2019 | 17,285 | | 5.9 | % | | 4,447 | | 5.8 | % | | 4.1 | % | 2.2 | % | 1.5 | % | 26.6 | % |
| 2020 | | 2020 | 64,659 | | 21.9 | % | | 16,204 | | 21.2 | % | | 3.2 | % | 1.0 | % | 28.7 | % | 56.6 | % |
| 2021 | | 2021 | 100,796 | | 34.1 | % | | 26,004 | | 34.0 | % | | 3.1 | % | 0.9 | % | 29.2 | % | 85.5 | % |
| 2022 | | 2022 | 70,545 | | 23.9 | % | | 18,680 | | 24.4 | % | | 4.8 | % | 0.4 | % | 30.4 | % | 96.4 | % |
| Total | | Total | $ | 295,298 | | 100.0 | % | | $ | 76,472 | | 100.0 | % | | |
MGIC Investment Corporation 20172022 Form 10-K | 1513
MGIC Investment Corporation and Subsidiaries
|
| | | | | | | | | | | | | | | |
| | | | | | | | | | | | | | | |
MGIC Investment Corporation
2017 Form 10-K
|
Business (continued) |
Product Characteristics
Characteristics.The following table reflects, at the dates indicated and by the categories indicated, the total dollar amount of primary RIF for the MGIC Book and the percentage of that primary RIF, as determined on the basis of information available on the date of mortgage origination.
| | | | | | | | | | | |
| Characteristics of primary risk in force |
| | | |
| December 31, 2022 | | December 31, 2021 |
Primary RIF (In millions): | $ | 76,472 | | | $ | 69,337 | |
| Loan-to-value ratios: | | | |
| 95.01% and above | 15.2 | % | | 14.7 | % |
| 90.01 - 95.00% | 52.0 | % | | 50.4 | % |
| 85.01 - 90.00% | 27.2 | % | | 28.1 | % |
| 80.01 - 85.00% | 5.4 | % | | 6.4 | % |
| 80% and below | 0.2 | % | | 0.4 | % |
| Total | 100.0 | % | | 100.0 | % |
| Debt-to-income ratios: | | | |
| 45.01% and above | 15.6 | % | | 13.6 | % |
| 38.01% - 45.00% | 31.6 | % | | 31.5 | % |
| 38% and below | 52.8 | % | | 54.9 | % |
| Total | 100.0 | % | | 100.0 | % |
| Loan Type: | | | |
Fixed(1) | 99.5 | % | | 99.4 | % |
ARMs(2) | 0.5 | % | | 0.6 | % |
| Total | 100.0 | % | | 100.0 | % |
Original Insured Loan Amount:(3) | | | |
| Conforming loan limit and below | 97.3 | % | | 97.5 | % |
| Non-conforming | 2.7 | % | | 2.5 | % |
| Total | 100.0 | % | | 100.0 | % |
| Mortgage Term: | | | |
| 15-years and under | 1.1 | % | | 1.7 | % |
| Over 15 years | 98.9 | % | | 98.3 | % |
| Total | 100.0 | % | | 100.0 | % |
| Property Type: | | | |
| Single-family detached | 86.9 | % | | 86.9 | % |
| Condominium/Townhouse/Other attached | 12.5 | % | | 12.4 | % |
Other(4) | 0.6 | % | | 0.7 | % |
| Total | 100.0 | % | | 100.0 | % |
| Occupancy Status: | | | |
| Owner occupied | 97.8 | % | | 97.4 | % |
| Second home | 2.1 | % | | 2.4 | % |
| Investor property | 0.1 | % | | 0.2 | % |
| Total | 100.0 | % | | 100.0 | % |
| Documentation: | | | |
Reduced:(5) | | | |
| Stated | 0.6 | % | | 0.7 | % |
| No | 0.2 | % | | 0.3 | % |
| Full documentation | 99.2 | % | | 99.0 | % |
| Total | 100.0 | % | | 100.0 | % |
|
| | | | | | | | |
| | | | | |
| Characteristics of primary risk in force | | December 31, 2017 | | December 31, 2016 |
Primary RIF (In millions): | $ | 50,319 |
| | $ | 47,195 |
|
| | Loan-to-value ratios: | | | |
| | 95.01% and above | 13.8 | % | | 14.5 | % |
| | 90.01-95% | 52.0 | % | | 50.4 | % |
| | 85.01-90% | 28.3 | % | | 29.1 | % |
| | 80.01-85% | 4.9 | % | | 4.7 | % |
| | 80% and below | 1.0 | % | | 1.3 | % |
| | Total | 100.0 | % | | 100.0 | % |
| | Loan Type: | | | |
| | Fixed(1) | 98.2 | % | | 97.6 | % |
| | ARMs(2) | 1.8 | % | | 2.4 | % |
| | Total | 100.0 | % | | 100.0 | % |
| | Original Insured Loan Amount:(3) | | | |
| | Conforming loan limit and below | 97.6 | % | | 97.6 | % |
| | Non-conforming | 2.4 | % | | 2.4 | % |
| | Total | 100.0 | % | | 100.0 | % |
| | Mortgage Term: | | | |
| | 15-years and under | 2.1 | % | | 2.5 | % |
| | Over 15 years | 97.9 | % | | 97.5 | % |
| | Total | 100.0 | % | | 100.0 | % |
| | Property Type: | | | |
| | Single-family detached | 87.6 | % | | 87.6 | % |
| | Condominium/Townhouse/Other attached | 11.7 | % | | 11.7 | % |
| | Other(4) | 0.7 | % | | 0.7 | % |
| | Total | 100.0 | % | | 100.0 | % |
| | Occupancy Status: | | | |
| | Owner occupied | 97.3 | % | | 97.1 | % |
| | Second home | 2.0 | % | | 2.1 | % |
| | Investor property | 0.7 | % | | 0.8 | % |
| | Total | 100.0 | % | | 100.0 | % |
| | Documentation: | | | |
| | Reduced:(5) | | | |
| | Stated | 2.0 | % | | 2.5 | % |
| | No | 0.4 | % | | 0.6 | % |
| | Full documentation | 97.6 | % | | 96.9 | % |
| | Total | 100.0 | % | | 100.0 | % |
| | FICO Score:(6) | | | |
| | 740 and greater | 51.6 | % | | 49.3 | % |
| | 700 - 739 | 24.7 | % | | 24.3 | % |
| | 660 - 699 | 14.2 | % | | 15.1 | % |
| | 659 and less | 9.5 | % | | 11.3 | % |
| | Total | 100.0 | % | | 100.0 | % |
MGIC Investment Corporation 20172022 Form 10-K | 1614
MGIC Investment Corporation and Subsidiaries
|
| | | | | | | | | | | | | | | |
| | | | | | | | | | | | | | | |
MGIC Investment Corporation
2017 Form 10-K
|
Business (continued) |
| | | | | | | | | | | |
| Characteristics of primary risk in force |
| | | |
| December 31, 2022 | | December 31, 2021 |
FICO Score:(6) | | | |
| 760 and greater | 42.2 | % | | 42.1 | % |
| 740 - 759 | 17.7 | % | | 17.2 | % |
| 720 - 739 | 14.1 | % | | 13.7 | % |
| 700 - 719 | 11.1 | % | | 11.1 | % |
| 680 - 699 | 7.7 | % | | 7.9 | % |
| 660 - 679 | 3.3 | % | | 3.3 | % |
| 640 - 659 | 1.9 | % | | 2.2 | % |
| 639 and less | 2.0 | % | | 2.5 | % |
| Total | 100.0 | % | | 100.0 | % |
(1)Includes fixed rate mortgages with temporary buydowns (where in effect, the applicable interest rate is typically reduced by one or two percentage points during the first two years of the loan and then increased thereafter to the original interest rate), ARMs in which the initial interest rate is fixed for at least five years, and balloon payment mortgages (a loan with a maturity, typically five to seven years, that is shorter than the loan’s amortization period).
(2)Includes ARMs where payments adjust fully with interest rate adjustments. Also includes pay option ARMs and other ARMs with negative amortization features, which collectively at each of December 31, 2022 and 2021, represented and 0.1%, respectively, of primary RIF. As indicated in note (1), does not include ARMs in which the initial interest rate is fixed for at least five years. For both December 31, 2022 and 2021, ARMs with LTV ratios in excess of 90% represented 0.1%, of primary RIF, respectively.
(3)Loans within the conforming loan limit have an original principal balance that does not exceed the maximum original principal balance of loans that the GSEs will purchase. The conforming loan limit for one unit properties was $510,400 for 2020, $548,250 for 2021, and $647,200 for 2022, and is $726,200 for 2023. The limit for high cost communities has been higher and is $1,089,300 for 2023. Non-conforming loans are loans with an original principal balance above the conforming loan limit.
(4)Includes cooperatives and manufactured homes deemed to be real estate.
| |
(1)
| Includes fixed rate mortgages with temporary buydowns (where in effect, the applicable interest rate is typically reduced by one or two percentage points during the first two years of the loan), ARMs in which the initial interest rate is fixed for at least five years, and balloon payment mortgages (a loan with a maturity, typically five to seven years, that is shorter than the loan’s amortization period). |
| |
(2)
| Includes ARMs where payments adjust fully with interest rate adjustments. Also includes pay option ARMs and other ARMs with negative amortization features, which collectively at December 31, 2017 and 2016, represented 0.5% and 0.6%, respectively, of primary RIF. As indicated in note (1), does not include ARMs in which the initial interest rate is fixed for at least five years. As of December 31, 2017 and 2016, ARMs with LTV ratios in excess of 90% represented 0.4% and 0.5%, respectively, of primary RIF. |
| |
(3)
| Loans within the conforming loan limit have an original principal balance that does not exceed the maximum original principal balance of loans that the GSEs will purchase. The conforming loan limit for one unit properties was $417,000 from 2007 through 2016, $424,100 for 2017, and $453,100 for 2018. The limit for high cost communities has been higher and is $679,650 for 2018. Non-conforming loans are loans with an original principal balance above the conforming loan limit. |
| |
(4)
| Includes cooperatives and manufactured homes deemed to be real estate. |
| |
(5)
| Reduced documentation loans were originated prior to 2009 under programs in which there was a reduced level of verification or disclosure compared to traditional mortgage loan underwriting, including programs in which the borrower’s income and/or assets were disclosed in the loan application but there was no verification of those disclosures ("stated" documentation) and programs in which there was no disclosure of income or assets in the loan application ("no" documentation). In accordance with industry practice, loans approved by GSE and other automated underwriting (AU) systems under “doc waiver” programs that did not require verification of borrower income are classified by us as “full documentation.” Based in part on information provided by the GSEs, we estimate full documentation loans of this type were approximately 4% of 2007 NIW. Information for other periods is not available. We understand these AU systems granted such doc waivers for loans they judged to have higher credit quality. We also understand that the GSEs terminated their “doc waiver” programs in the second half of 2008. |
| |
(6)
| Represents the FICO score at loan origination. The weighted average “decision FICO score” at loan origination for NIW in 2017 and 2016 was 745 and 746, respectively. The FICO score for a loan with multiple borrowers is the lowest of the borrowers’ decision FICO scores. A borrower’s “decision FICO score” is determined as follows: if there are three FICO scores available, the middle FICO score is used; if two FICO scores are available, the lower of the two is used; if only one FICO score is available, it is used. A FICO score is a score based on a borrower’s credit history generated by a model developed by Fair Isaac Corporation. |
(5)Reduced documentation loans were originated prior to 2009 under programs in which there was a reduced level of verification or disclosure compared to traditional mortgage loan underwriting, including programs in which the borrower’s income and/or assets were disclosed in the loan application but there was no verification of those disclosures ("stated" documentation) and programs in which there was no disclosure of income or assets in the loan application ("no" documentation). In accordance with industry practice, loans approved by GSE and other automated underwriting (AU) systems under “doc waiver” programs that did not require verification of borrower income are classified by us as “full documentation.” We understand that the GSEs terminated their “doc waiver” programs in the second half of 2008.
(6)Represents the FICO score at loan origination. The weighted average “decision FICO score” at loan origination for NIW in 2022 was 747 compared to 749 in 2021. The FICO score for a loan with multiple borrowers is the lowest of the borrowers’ decision FICO scores. A borrower’s “decision FICO score” is determined as follows: if there are three FICO scores available, the middle FICO score is used; if two FICO scores are available, the lower of the two is used; if only one FICO score is available, it is used. A FICO score is a score based on a borrower’s credit history generated by a model developed by Fair Isaac Corporation.
MGIC Investment Corporation 2022 Form 10-K | 15
MGIC Investment Corporation and Subsidiaries
Other Products and Services
OTHER PRODUCTS AND SERVICES
Contract Underwriting. A non-insurance subsidiary of ours performsprovides contract underwriting services for lenders, underwritingpursuant to which loans are underwritten to conform to prescribed guidelines. The guidelines might be the lender's own guidelines or the guidelines of Fannie Mae, Freddie Mac or a non-GSE investor. These services are provided for loans that require private mortgage insurance as well as for loans that do not require private mortgage insurance.
Under our contract underwriting agreements, we may be required to provide certain remedies to our customers if certain standards relating to the quality of our underwriting work are not met, and we have an established reserve for such future obligations. The related contract underwriting remedy expense for each of the years ended December 31, 2017, 2016 and 2015, was immaterial to our consolidated financial statements. Claims for remedies may be made a number of years after the underwriting work was performed.
Other. We provide various fee-based services for the mortgage finance industry, such as analysis of loan originationsinsurance and portfolios, and mortgage lead generation. An insurance subsidiary of MGIC provides credit insurance forreinsurance related to certain mortgages under Fannie Mae and Freddie MacGSE credit risk transfer programs entered into in 2016.programs. The structure of these programs is equivalent to pool insurance and the amount of our risk associated with them is immaterial.
MGIC Investment Corporation 2017 Form 10-K | 17
|
| | | | | | | | | | | | | | | |
| | | | | | | | | | | | | | | |
MGIC Investment Corporation
2017 Form 10-K
|
Business (continued) |
Reinsurance Agreements
At December 31, 2017, approximately 78% of our IIF was subject to reinsurance agreements, compared to 76% at December 31, 2016. In 2017, approximately 84% of our NIW was subject to reinsurance agreements, compared to 89% in 2016.
External Reinsurance. We have in place a QSR transaction that became effective July 1, 2015, with a group of unaffiliated reinsurers that covers most of our insurance written from 2013 through 2016, and a portion of our insurance written prior to 2013. The transaction covers incurred losses, with renewal premium through December 31, 2024. The structure of the transaction is a 30% quota share for all policies covered, with a 20% ceding commission as well as a profit commission. Generally, under the transaction, we will receive a profit commission provided that the loss ratio on the loans covered under the agreement remains below 60%. We have in place a similar transaction covering most of our insurance written in 2017. We expect that in the first quarter of 2018, we will enter into a similar agreement covering most of our NIW in 2018, on terms no less favorable than our existing transactions. Although reinsuring against possible loan losses does not discharge us from liability to a policyholder, it reduces the amount of capital we are required to retain against potential future losses for PMIERs, rating agency and insurance regulatory purposes. The GSEs' approval of the reinsurancethese transactions is subject to several conditions and the transactions will be reviewed under the PMIERs at least annually by the GSEs. We may not receive full credit under the PMIERs for the risk ceded under our quota share reinsurance transactions. Early termination of the 2015 agreement can be elected by us effective December 31, 2018 for a fee, or under specified scenarios for no fee upon prior written notice. Early termination of the 2017 agreement can be elected by us effective December 31, 2021 for a fee, or under specified scenarios for no fee upon prior written notice. Further, at our sole discretion we may elect to terminate the 2015 and/or 2017 agreements if we will receive less than 90% of the full PMIERs credit amount for the risk ceded under the agreement in any required calculation period. The 2018 transaction is expected to have similar termination provisions.currently $226 million.
CUSTOMERS
Captive Reinsurance. In a captive reinsurance arrangement, the reinsurer is affiliated with the lender for whom MGIC provides mortgage insurance. Various state and federal regulators have conducted investigations regarding captive mortgage reinsurance arrangements in which we participated, in part, in order to consider compliance with RESPA. In 2013, we entered into a settlement agreement with the CFPB that resolved a federal investigation of MGIC’s participation in captive reinsurance arrangements without the CFPB or a court making any findings of wrongdoing. In accordance with this settlement, all of our active captive arrangements have been placed into run-off.
For further information about our reinsurance agreements, see Note 9 – “Reinsurance,” to our consolidated financial statements in Item 8.
Customers
Originators of residential mortgage loans such as savings institutions, commercial banks, mortgage brokers, credit unions, mortgage bankers and other lenders have historically determined the placement of mortgage insurance written on a flow basis and as a result are our customers. To obtain primary insurance from us written on a flow basis, a mortgage lender must first apply for and receive a mortgage guaranty master policy from us. Our top 10 customers none of whom represented more than 10% of our consolidated revenues, generated 22.9%33% of our NIW on a flow basis in 2017, compared to 24.1%2022, 36% in 20162021 and 23.4%41% in 2015. Our largest customer accounted for approximately 4% and 5% of our flow NIW in each of 2017 and 2016, respectively.2020. Our relationships with our customers could be adversely affected by a variety of factors, including if our premium rates are higher than can be obtained fromthose of our competitors, tightening of and adherence to our underwriting requirements which may result inare more restrictive than those of our declining to insure some of the loans originated bycompetitors, or our customers andare dissatisfied with our claims-paying practices (including insurance policy rescissions and curtailments that affect the customer.claim curtailments). Information about some of the other factors that can affect a mortgage insurer’s relationship with its customers can be found in our risk factor titled “Competition or changes in our relationships with our customers could reduce our revenues, reduce our premium yields and/or increase our losses” in Item 1A.
SALES AND MARKETING AND COMPETITION
MGIC Investment Corporation 2017 Form 10-K | 18
|
| | | | | | | | | | | | | | | |
| | | | | | | | | | | | | | | |
MGIC Investment Corporation
2017 Form 10-K
|
Business (continued) |
Sales and Marketing and Competition
Sales and Marketing. Our employees sell our insurance products throughout all regions of the United States, and in Puerto Rico, and Guam.
Competition. Our competition includes other mortgage insurers, governmental agencies and products designed to eliminate the need to purchase private mortgage insurance. For flow business, we and other private mortgage insurers compete directly with federal and state governmentalgovernment and quasi-governmental agencies, principally the FHA and the VA. The FHA, VA and USDA sponsor government-backed mortgage insurance programs, and it is estimated that during 2017, 2016 and 2015,2022, they accounted for a combined approximately 62.4%, 64.6% and 66.0%, respectively,52.8% of the total low down payment residential mortgages which were subject to FHA, VA, USDA or primary private mortgage insurance.insurance, compared to 56.8% and 56.1% in 2021 and 2020, respectively. For more information about the market share of the FHA and the VA, see “Overview of the Private Mortgage Insurance Industry and its Operating Environment” above.
In addition to competition from the FHA, VA and USDA, we and other private mortgage insurers face competition from state-supported mortgage insurance funds in several states. From time to time, other state legislatures and agencies consider expanding the authority of their state governments to insure residential mortgages.
The PMI industry is highly competitive. We believe that we currently compete with other private mortgage insurers based on pricing,premium rates, underwriting requirements, financial strength (including based on credit or financial strength ratings), customer relationships, name recognition, reputation, the strength of our management teamteams and field organization,organizations, the ancillary products and services provided to lenders, and the effective use
of technology and innovation in the delivery and servicing of our mortgage insurance products.
The U.S. PMI industry currently consists of six active mortgage insurers and their affiliates. The names of these mortgage insurers can be found in our risk factor titled “Competition or changes in our relationships with our customers could reduce our revenues, reduce our premium yields and/or increase our losses” in Item 1A. Until 2010, the PMI industry had not had new entrants in many years. Since 2010, two public companies have been formed and begun writing business and a worldwide insurer and reinsurer with mortgage insurance operations in Europe completed the purchase of two competitors.affiliates, including MGIC. Our market share (as measured by NIW) was 18.3%18.9% in 2017,2022, compared to 17.8%20.6% in 20162021 and 19.9%18.7% in 2015,2020, in each case excluding HARP refinances. (source: Inside Mortgage Finance). If we are unable to compete effectively in the current or any future markets as a result of the financial strength ratings assigned to our insurance subsidiaries, our future new insurance written could be negatively affected. Substantially allOur ability to participate in the non-GSE residential mortgage-backed securities market (the size of which has been limited since 2008, but may grow in the future), could depend on our ability to maintain and improve our investment grade ratings for our insurance written since 2008 has been for loans purchased bysubsidiaries. Although the GSEs. The GSEs'current PMIERs of each of the GSEs do not require an insurer to maintain minimum financial strength ratings. However, depending onratings, the evolution of housing finance reform, the level of issuances of non-GSE MBS may increase in the future. FinancialGSEs consider financial strength ratings mayto be considered by issuersimportant when using forms of non-GSE MBS in determining whether to purchase privatecredit enhancement other than traditional mortgage insurance for loans supporting such securities. insurance.
In assigning financial strength ratings, in addition to considering the adequacy of the mortgage insurer’s capital to withstand very high claim scenarios under assumptions determined by the rating agency, we believe rating agencies review a mortgage insurer’s historical and projected operating performance, franchise risk, business outlook, competitive position, management, corporate strategy, enterprise risk management and other factors. The rating agency issuing the financial strength rating can withdraw or change its rating at any time. At the time that this annual report was finalized, the financial strength of MGIC was rated Baa2A- (with a stable outlook) by A.M. Best, A3 (with a stable outlook) by Moody’s Investors Service and BBB+ (with a stable outlook) by Standard & Poor’s Rating Services.
MGIC Investment Corporation 2022 Form 10-K | 16
MGIC Investment Corporation and Subsidiaries
C. Risk Management
Enterprise Risk Management. ENTERPRISE RISK MANAGEMENT
The Company has an enterprise risk management (“ERM”) framework that it believes is commensurate with the size, nature and complexity of the Company’s business activities (all of which relate to insuring or reinsuring mortgage insurance)credit risk) and strategies. Among the key objectives of the ERM framework are to have a clear and well documented shared understanding, by senior management and the Board, of the Company’s risk management philosophy and overall appetite for risk, and that there are appropriate monitoring, management and reporting mechanisms to support the framework.
MGIC Investment Corporation 2017 Form 10-K | 19
|
| | | | | | | | | | | | | | | |
| | | | | | | | | | | | | | | |
MGIC Investment Corporation
2017 Form 10-K
|
Business (continued) |
Risk Governance. The Company maintains a Senior Management Oversight Committee (“SMOC”) that, at the management level, serves as its primary risk management governance organization. The SMOC seeks to maintain an enterprise-wide view of risk. The SMOC oversees the Company’s ERM framework; oversees the risks associated with strategic and business issues critical to the Company, monitoring the Company’smaintains an enterprise view of risk profile across thea set of identified key risks that may exist from time to time (see “Risk Identification and Assessment” below); and supportsprovides support and reporting to the Risk Management Committee of the Company’s Board of Directors (“RMC”). The SMOC, of which the CEO is a member, is chaired by the Company’s Executive Vice President and Chief Risk Officer, who is the principal management liaison to the RMC.
The Board implements its risk oversight function as a whole and through delegation to its Committees which meet regularly and report back to the full Board. The Risk Management and Controls. The Company’s management of risk uses the “three lines of defense” model. The front-line business units, whose activities create inherent risk exposures, represent the “first line of defense.” Front-line business units are responsible for ensuring risks are taken and managed within the guidelines established by the Company’s Risk Management (“RM”) group.
RM, alongCommittee coordinates with the Company’s separate compliance program, compriseBoard and other Board Committees regarding the “second line of defense” and are management and oversight functions that are primarily responsible for many aspects of the management of risk. RM is generally responsible for the ERM framework, for policies and metrics that dimension the risk tolerances of the Company’s business activities and for measurement and assessment of all key risks and reporting of those risksassignment to the SMOCBoard and the RMC.
Internal Audit forms the “third lineCommittees of defense” and serves in an independent assurance capacity. It reports to senior management and the Audit Committee of the Board regarding the effectiveness of the first and second lines of defense. Internal Audit is responsibleoversight responsibilities for establishing a comprehensive audit plan that covers all functions and identified material risks of the Company, communication of any material deficiencies to the SMOC and the Audit Committee, and determining whether corrective actions fully remediate any noted deficiencies.
Risk Identification and Assessment. The Company completes an annual key risk identification and assessment process that is focused on identifying and assessing those risks with the potentialconsidered to have the greatest impact on the Company’sCompany's ability to accomplish its strategic goals. TheseEach Committee's charter describes its principal responsibilities, including its oversight responsibility for applicable key risks include both risksrisks.
Corporate Sustainability Risk Governance. The Company maintains a Corporate Sustainability Executive Council that, are, at least in part, internalthe management level, supports the Company's on-going commitment to environmental, health and safety, corporate social responsibility, corporate governance, sustainability, and other public policy matters relevant to the Company (e.g., mortgage credit risk)Company. In performing this general responsibility, the Council has discretion to: adopt the Company’s general strategy with respect to sustainability matters; identify current and therefore, at least in part, within management’s direct control,emerging sustainability issues that may affect the Company’s business, strategy, operations, performance, or public image; make recommendations regarding policies, practices, procedures, or disclosures to address sustainability matters; oversee the Company’s internal and external reporting and disclosures surrounding sustainability matters; and advise on material concerns of shareholders or stakeholders regarding sustainability matters. The Corporate Sustainability Executive Council will make regular reports to the SLT and to the relevant Committee(s) of the Board of Directors of the Company.
The Board has delegated oversight for the following ESG matters to the following committees, who regularly report their actions to the Board:
•Risk Management Committee: Mortgage Credit Risk, including risks associated with climate change.
•Management Development, Nominating and Governance Committee: Corporate governance and human capital
management policies such as executive compensation; succession planning; recruitment, retention and development of management resources; workforce planning, recruitment morale and talent; diversity and inclusion initiatives; and work environment, including health and safety.
•Securities Investment Committee: Our investment portfolio; such oversight may include consideration of ESG factors.
•Audit Committee: Disclosure controls and procedures relating to financial reports made to the SEC, as well as ESG reports.
•Business Transformation and Technology Committee: Cybersecurity and business continuity.
Risk Management and Controls. The Company has established enterprise-wide policies, procedures and processes to allow it to identify, assess, monitor and manage the Company’s various risks. Management of these risks that are externalis an interdepartmental endeavor, with oversight by the Chief Risk Officer and the SMOC. The Company’s Internal Audit function, which reports to the Audit Committee of the Board of Directors, provides independent ongoing assessments of the Company’s management of certain enterprise risks and reports its findings to the Audit Committee.
Risk Identification and Assessment. On a regular basis, the Company (e.g.,monitors key risks with a focus on identifying risks or changes to risks with the greatest impact on the Company's ability to accomplish its strategic goals. In addition to the ongoing monitoring, the Company also identifies key risks in a bottom up process facilitated through questionnaires and discussions during an annual compliance and risk forum with co-workers across all business risk) and outside of management’s direct control.functions. The results of the identification process are reported to and assessment are reviewed and approved annually by both the SMOC and the RMC.
Risk Appetite. The Company has established risk appetite statements for each of its key risks, as well as quantitative or qualitative metrics used as thresholds for dimensioning the risk appetite for each key risk. The resulting risk appetite statements and associated metrics are reviewed and approved annually by the SMOC and presented to the RMC.RMC and/or the full Board.
Risk Reporting and Communication. RMThe Company's Risk Management department produces various analyses, reports and key risk indicators (“KRIs”) that are reported to the SMOC, the RMC and the Board quarterly. For our largest risk exposure, mortgage credit risk, these KRIs include risk factors for the Company’s NIW, IIF, quality control and claim activity.
activity, and the quarterly reports include performance relative to metrics and thresholds. Each of the other Board Committees also receive regular reporting concerning the risks they oversee.
Although the Company has in place the ERM framework discussed above, it may not be effective in identifying, or adequate in controlling or mitigating, the risks we face. For more information, see our Risk Factor titled "If our risk management programs are not effective in identifying, or adequate in controlling or mitigating, the risks we face, or if the models used in our businesses are inaccurate, it could have a material adverse impact on our business, results of operations and financial condition" in Item 1A.
Mortgage Credit RiskMORTGAGE CREDIT RISK
We believe that mortgage credit risk is materially affected by:
•the condition of the economy, including the direction of change in home prices and employment, in the area in which the property is located;
MGIC Investment Corporation 2017 Form 10-K | 20
|
| | | | | | | | | | | | | | | |
| | | | | | | | | | | | | | | |
MGIC Investment Corporation
2017 Form 10-K
|
Business (continued) |
•the borrower’s credit profile, including the borrower’s credit history, DTI ratio and cash reserves, and the
MGIC Investment Corporation 2022 Form 10-K | 17
MGIC Investment Corporation and Subsidiaries
willingness of a borrower with sufficient resources to make mortgage payments when the mortgage balance exceeds the value of the home;
•the loan product, which encompasses the LTV ratio, the type of loan instrument, including whether the instrument provides for fixed or variable payments and the amortization schedule, the type of property and the purpose of the loan;
•origination practices of lenders and the percentage of coverage on insured loans; and
•the size of insured loans.
We believe that, excluding other factors, claim incidence increases:
•during periods of economic contraction and home price depreciation, including when these conditions may not be nationwide, compared to periods of economic expansion and home price appreciation;
•for loans to borrowers with lower FICO scores compared to loans to borrowers with higher FICO scores;
•for loans to borrowers with higher DTI ratios compared to loans to borrowers with lower DTI ratios;
•for loans with less than full underwriting documentation compared to loans with full underwriting documentation;
•for loans with higher LTV ratios compared to loans with lower LTV ratios;
•for ARMsvariable payment loans when the reset interest rate significantly exceeds the interest rate at the time of loan origination;
•for loans that permit the deferral of principal amortization compared to loans that require principal amortization with each monthly payment;
•for loans in which the original loan amount exceeds the conforming loan limit compared to loans below that limit; and
•for cash out refinance loans compared to rate and term refinance loans.
Other types of loan characteristics relating to the individual loan or borrower may also affect the risk potential for a loan. The presence of a number of higher-risk characteristics in a loan materially increases the likelihood of a claim on such a loan unless there are other characteristics to mitigate the risk.
We charge higher premium rates to reflect the increased risk of claim incidence that we perceive is associated with a loan, although notloan. Not all higher risk characteristics are reflected in theour premium rate.rates; however, in 2019 we introduced MiQ, our risk-based pricing system that establishes our premium rates based on more risk attributes than were considered in 2018. There can be no assurance that our premium rates adequately reflect the increased risk, particularly in a period of economic recession, high unemployment, slowing home price appreciation or home
price declines.declines, or when extraordinary events occur, such as the Covid-19 pandemic, the Russia-Ukraine war, periods of extreme inflation, or environmental disasters related to changing climactic conditions. For additional information, see our risk factors in Item 1A, including the one titled “The premiums we charge may not be adequate to compensate us for our liabilities for losses and as a result any inadequacy could materially affect our financial condition and results of operations.”
Underwriting Insurance Applications. Applications for mortgage insurance are submitted to us through both our delegated and non-delegated options. Under the delegated option, applications are submitted to us electronically and we rely upon the lender’s representations and warranties that the data submitted is true, accurate and consistent with the documents in the lender's loan origination file, when making our insurance decision. If the loan data submitted meets the underwriting requirements, a commitment to insure the loan is immediately issued. If the requirements are not met, the loan is reviewed by one of our underwriters. Non-delegated applications are submitted with documents from the lender’s loan origination file. During loan set-up,
MGIC Investment Corporation 2017 Form 10-K | 21
|
| | | | | | | | | | | | | | | |
| | | | | | | | | | | | | | | |
MGIC Investment Corporation
2017 Form 10-K
|
Business (continued) |
data is entered from those application documents and electronically evaluated againstWe apply our underwriting requirements. An internally generated feedback report guides the mortgage insurance review as a full review of the mortgage documents is performed by one of our underwriters.guidelines, eligibility criteria and rating plans to determine coverage eligibility and premium rate. If the loan meets the underwriting requirements,is eligible for coverage, we will issue a commitment to insure the loan is issued.loan.
Beginning in 2013, we aligned most of our underwriting requirements with Fannie Mae and Freddie Mac for loans that receive and are processed in accordance with certain approval recommendations from a GSE automated underwriting system. Our underwriting requirements are available on our website at http://www.mgic.com/underwriting/index.html. Our underwriters are authorized to approve loans that do not meet all of our underwriting requirements provided appropriate offsetting factors can be identified. The number of loans for which underwriting exceptions were made, which in total are expected to have a somewhat higher claim incidence than loans that meet our guidelines, accounted for fewer than 2% of the loans we insured in each of 2016 and 2017.under certain circumstances.
Exposure to Catastrophic Losses; Defaults; Claims; Loss Mitigation
Exposure to Catastrophic Losses. The PMI industry experienced catastrophic losses in the mid-to-late 1980s, similar to the losses we experienced in 2007-2013. For background information about such losses in 2007-2013, as well as information about the effects of the COVID-19 pandemic, refer to “General – Overview of Private Mortgage Insurance Industry and its Operating Environment” above. To the extent our premium yield materially declines without either a corresponding decrease in our risk written or achieving other benefits, we become less likely to be able to withstand the occurrence of a catastrophic loss scenario.
DefaultsDelinquencies. The claim cycle on PMI generally begins with the insurer’s receipt of notification of a delinquency on an insured loan from the loan servicer. We considerFor reporting purposes, a loan is generally considered to be delinquent when it is two or more payments past due. Most servicers report delinquent loans to us within this two month period. The incidence of delinquency is affected by a variety of factors, including macroeconomic conditions, the level of borrower income growth, unemployment, health issues, family status, the level of interest rates, rates of home price appreciation or depreciation and general borrower creditworthiness. Delinquencies that are not cured result in a claim to us. See “– Claims.” Delinquencies may be cured by the borrower bringing current the delinquent loan payments or by a sale of the property and the satisfaction of all amounts due under the mortgage. In addition, when a policy is rescinded or a claim is denied we remove the loan from our delinquency inventory.
MGIC Investment Corporation 2022 Form 10-K | 18
MGIC Investment Corporation and Subsidiaries
The following table shows the number of insured primary and pool loans, in the MGIC Book, the related number of delinquent loans and the percentage of delinquent loans, or delinquency rate, as of December 31, 2013-2017.2018-2022.
| | | | | | | | | | | | | | | | | | | | | | | | | | | | | |
| Delinquency statistics for the MGIC book |
| | | | | | | | | |
| December 31, |
| 2022 | | 2021 | | 2020 | | 2019 | | 2018 |
| Primary Insurance: | | | | | | | | | |
| Insured loans in force | 1,180,419 | | 1,164,984 | | 1,126,079 | | 1,079,578 | | 1,058,292 |
| Delinquent loans | 26,387 | | 33,290 | | 57,710 | | 30,028 | | 32,898 |
| Delinquency rate – all loans | 2.2% | | 2.8% | | 5.1% | | 2.8% | | 3.1% |
| Defaulted loans in our claims received inventory | 267 | | 211 | | 159 | | 538 | | 809 |
| | | | | | | | | |
| Pool Insurance: | | | | | | | | | |
| Insured loans in force | 14,987 | | 16,342 | | 18,288 | | 20,318 | | 23,675 |
| Delinquent loans | 391 | | 498 | | 680 | | 653 | | 859 |
| Delinquency rate | 2.6% | | 3.1% | | 3.7% | | 3.2% | | 3.6% |
|
| | | | | | | | | | |
| | | | | | | | | | | |
| Delinquency statistics for the MGIC book | | December 31, |
| | 2017 | | 2016 | | 2015 | | 2014 | | 2013 |
| Primary Insurance: | | | | | | | | | |
| | Insured loans in force | 1,023,951 | | 998,294 | | 992,188 | | 968,748 | | 960,163 |
| | Delinquent loans | 46,556 | | 50,282 | | 62,633 | | 79,901 | | 103,328 |
| | Delinquency rate – all loans | 4.6% | | 5.0% | | 6.3% | | 8.3% | | 10.8% |
| | Defaulted loans in our claims received inventory | 954 | | 1,385 | | 2,769 | | 4,746 | | 6,948 |
| | | | | | | | | | | |
| | Pool Insurance: | | | | | | | | | |
| | Insured loans in force | 31,364 | | 39,071 | | 52,189 | | 62,869 | | 87,584 |
| | Delinquent loans | 1,309 | | 1,883 | | 2,739 | | 3,797 | | 6,563 |
| | Delinquency rate | 4.2% | | 4.8% | | 5.3% | | 6.0% | | 7.5% |
MGIC Investment Corporation 2017 Form 10-K | 22
|
| | | | | | | | | | | | | | | |
| | | | | | | | | | | | | | | |
MGIC Investment Corporation
2017 Form 10-K
|
Business (continued) |
Different geographical areas may experience different delinquency rates due to varying localized economic conditions from year to year.year and the amount of time it takes for foreclosures to be completed for uncured delinquencies. The following table showsprimary delinquency rate for the percentage of primary loans we insured that were delinquent as oftop 15 jurisdictions (based on December 31, 2017, 20162022 delinquency inventory) at December 31, 2022, 2021, and 2015 for2020 appears in table the 15 jurisdictions for which we paid the most claims during 2017.below.
| | | | | | | | | | | | | | | | | |
| Primary delinquency rate by jurisdiction |
| | | | | |
| | 2022 | | 2021 | | 2020 |
| Florida * | 3.1 | % | | 3.7 | % | | 7.5 | % |
| Texas | 2.3 | % | | 3.1 | % | | 6.1 | % |
| Illinois * | 2.6 | % | | 3.4 | % | | 5.9 | % |
| Pennsylvania * | 2.2 | % | | 2.5 | % | | 4.0 | % |
| New York * | 3.5 | % | | 4.3 | % | | 6.9 | % |
| California | 2.2 | % | | 3.2 | % | | 6.1 | % |
| Ohio * | 2.2 | % | | 2.4 | % | | 4.0 | % |
| Michigan | 1.9 | % | | 2.4 | % | | 4.0 | % |
| Georgia | 2.3 | % | | 3.1 | % | | 6.2 | % |
| New Jersey * | 2.9 | % | | 4.1 | % | | 7.0 | % |
| North Carolina | 1.7 | % | | 2.3 | % | | 4.2 | % |
| Maryland | 2.4 | % | | 3.3 | % | | 6.0 | % |
| Indiana | 2.3 | % | | 2.8 | % | | 4.4 | % |
| Virginia | 1.4 | % | | 1.9 | % | | 4.2 | % |
| Minnesota | 1.6 | % | | 2.0 | % | | 3.5 | % |
| All other jurisdictions | 2.0 | % | | 2.6 | % | | 4.6 | % |
| | | | | |
|
| Note: Asterisk denotes jurisdictions in the table above that predominately use a judicial foreclosure process, which generally increases the amount of time it takes for a foreclosure to be completed. |
|
| | | | | | | | | |
| | | | | | | |
| Jurisdiction delinquency rates | | December 31, |
| | 2017 | | 2016 | | 2015 |
| | New Jersey | 7.3 | % | | 11.3 | % | | 15.6 | % |
| | Florida | 9.5 |
| | 6.6 |
| | 10.1 |
|
| | New York | 8.0 |
| | 10.5 |
| | 12.7 |
|
| | Illinois | 4.1 |
| | 5.5 |
| | 7.1 |
|
| | Maryland | 5.4 |
| | 7.4 |
| | 9.4 |
|
| | Pennsylvania | 4.2 |
| | 5.3 |
| | 6.5 |
|
| | Puerto Rico | 24.2 |
| | 10.7 |
| | 12.0 |
|
| | California | 2.6 |
| | 3.1 |
| | 4.1 |
|
| | Ohio | 3.2 |
| | 4.2 |
| | 5.2 |
|
| | Massachusetts | 4.1 |
| | 6.1 |
| | 7.4 |
|
| | Connecticut | 4.4 |
| | 5.6 |
| | 7.1 |
|
| | Virginia | 2.8 |
| | 3.8 |
| | 4.9 |
|
| | Georgia | 4.5 |
| | 5.5 |
| | 6.5 |
|
| | Indiana | 4.2 |
| | 5.4 |
| | 6.5 |
|
| | Washington | 1.9 |
| | 2.9 |
| | 4.0 |
|
| | All other jurisdictions | 3.6 |
| | 4.2 |
| | 5.1 |
|
We believe the increase in delinquency rates from 2016 to 2017 in Florida and Puerto Rico reflect the impact of the 2017 hurricanes experienced in those areas. Based on our analysis and past experience, we do not expect the 2017 hurricane activity to result in a material increase in our incurred losses or paid claims. However, see our risk factor titled "Recent hurricanes may impact our incurred losses, the amount and timing of paid claims, our inventory of notices of default and our Minimum Required Assets under PMIERs" in Item 1A for factors that could cause our actual results to differ from our expectation.
The primary delinquency inventory in those same jurisdictions as ofat December 31, 2017, 20162022 and 20152021 appears in a table found in “Management’s Discussion and Analysis – Consolidated Results of Operations – Losses and expenses – Loss Reserves,” in Item 7.
Claims. Claims result from delinquencies that are not cured or a short sale that we approve. Whether a claim results from an uncured delinquency depends, in large part, on the borrower’s equity in the home at the time of delinquency, the borrower’s or the lender’s ability to sell the home for an amount sufficient to satisfy all amounts due under the mortgage and the willingness and ability of the borrower and lender to enter into a loan modification that provides for a cure of the delinquency. Various factors affect the frequency and amount of claims, including local home prices and employment levels, and interest rates. If a delinquency goes to claim, any premiumrenewal premiums collected fromto insure the loan during the time of delinquency toperiod between the time oflast paid installment and the claim payment is returned to the servicer along with the claim payment.
Under the terms of our master policy, the lender is required to file a claim for primary insurance with us within 60 days after it has acquired title to the underlying property (typically through foreclosure). For the past several years, the average time it took to receive a claim associated with a delinquency increased significantly from our historical experience of approximately twelve months,months. This was, in part, due to new loss mitigation protocols established by servicers and to changes in some state foreclosure laws that may include,have included, for example, a requirement for additional review and/or mediation processes. In recent quarters,Prior to the second quarter of 2020, we had begun to experience a decline in the average time forit took servicers to process foreclosures, has decreased, which hashad reduced the average time to receive a claim associated with new delinquent noticesdelinquencies that dodid not cure. Generally, the longer the period between delinquency and claim filing, the greater the size of the claim, or “severity.” It is difficult to estimate how long it may take for current and future delinquencies that do not cure to develop into paid claims. In light of the uncertainty caused by the COVID-19 pandemic, including the impact of foreclosure moratoriums and forbearance programs, the average number of missed payments at the time a claim is received has increased.
The majority of loans we insured from 2005 through 2008 (which represent 32% of the loans in the delinquency inventory) are covered by master policy terms that, except under certain circumstances, do not limit the number of years of accumulated interest that an insured may include in a claim. Under our current
MGIC Investment Corporation 20172022 Form 10-K | 2319
MGIC Investment Corporation and Subsidiaries
|
| | | | | | | | | | | | | | | |
| | | | | | | | | | | | | | | |
MGIC Investment Corporation
2017 Form 10-K
|
Business (continued) |
master policy terms, an insured can include accumulated interest only for the first three years the loan is delinquent.
Other determinants of claim severity are the amount of the mortgage loan, the coverage percentage on the loan, loss mitigation efforts, and local market conditions. For information about our primary average claim paid, see “Management’s Discussion and Analysis – Consolidated Results of Operations – Net Losses and LAE Paid,” in Item 7.
Within 60 days after a claim has been filed and all documents required to be submitted to us have been delivered, we generally have the option ofto either (1) payingpay the coverage percentage specified for thatthe insured loan, with the insured retaining title to the underlying property and receiving all proceeds from the eventual sale of the property (we have elected this option for the vast majority of claim payments in the recent past), (2) pay the loss on the sale of the property if it has already been sold (calculated by subtracting the sale proceeds from the claim amount) or (2) paying(3) pay 100% of the claim amount in exchange for the lender’s conveyance to us of good and marketable title to the property. After we receive title to a property, we sell it for our own account. If we fail to pay a claim timely, we would beare subject to additional interest expense.
Claim activity is not evenly spread throughout the coverage period of a book of primary business. Relatively few claims are typically received during the first two years following issuance of coverage on a loan. This isThe highest level of claim activity has typically followed by a period of rising claims which, based on industry experience, has historically reached its highest leveloccurred in the third and fourth years after the year of loan origination. Thereafter, the number of claims typically received has historicallytypically declined at a gradual rate, although the rate of decline can be affected by conditions in the economy, including slowing home price appreciation or home price depreciation. Moreover, when a loan is refinanced, because the new loan replaces, and is a continuation of, an earlier loan, the pattern of claims frequency for that new loan may be different from the historicaltypical pattern for other loans. Persistency, the condition of the economy, including unemployment, and other factors can affect the pattern of claim activity. For example, a weak economy can lead to claims from older books of business increasing, continuing at stable levels or experiencing a lower rate of decline. As of December 31, 2017, 58%2022, 80% of our primary RIF was written subsequent to December 31, 2014, 67%2019, 85% of our primary RIF was written subsequent to December 31, 2013,2018, and 73%88% of our primary RIF was written subsequent to December 31, 2012.2017. See “Our Products and Services – Mortgage Insurance – Primary Insurance In Force and Risk In Force by Policy Year” above.
Another important factor affecting MGIC Book losses is the amount of the average claim size, which is generally referred to as claim severity. The main determinants of claim severity are the amount of the mortgage loan, the coverage percentage on the loan, loss mitigation efforts and local market conditions. For information about our primary average claim paid, see “Management’s Discussion and Analysis – Consolidated Results of Operations – Net Losses and LAE Paid,” in Item 7.
Net losses paid and primary losses paid for the top 15 jurisdictions and all other jurisdictions for 2017, 2016 and 2015 appear in tables found in “Management’s Discussion and Analysis – Consolidated Results of
Operations – Losses and expenses – Net Losses and LAE Paid,” in Item 7.
Loss Mitigation.
Mitigation. Before paying a claim, generally we review the loan and servicing files to determine the appropriateness of the claim amount. ourOur insurance policies generally provide that we can reduce or deny a claim if the servicer did not comply with its obligations under our insurance policy, including the requirement to mitigate our loss by performing reasonable loss mitigation efforts or, for example, diligently pursuing a foreclosure or bankruptcy relief in a timely manner. We call such reduction of claims submitted to us “curtailments.” In each of 20172022 and 2016,2021, curtailments reduced our average claim paid by approximately 5.6%6.3% and 5.5%4.4%, respectively. The COVID-19-related foreclosure moratoriums and forbearance plans, along with increased home prices, resulted in decreased claims paid activity beginning in the second quarter of 2020. It is difficult to predict the level of curtailments once the foreclosure moratoriums and forbearance plans end.
When reviewing the loan file associated with a claim, we may determine that we have the right to rescind coverage on the loan. In our SEC reports, we refer to insurance rescissions and denials of claims as “rescissions” and variations of this term. The circumstances in which we are entitled to rescind coverage narrowed under more restrictive policy terms beginning in 2012. As a result of revised PMIERs requirements, we have narrowedrevised our master policy effective for new insurance written beginning March 1, 2020. Our ability to rescind insurance coverage has become further limited for insurance we have written in recent years. During the second quarter of 2012, we began writing a portion of our new insurancewrite under the Gold Cert Endorsement, which limited our ability to rescind coverage compared to ournew master policy, potentially resulting in effect at that time. Our rescission rights under our master policy introduced in 2014 are comparable to thosehigher losses than would be the case under our previous master policy, as modified by the Gold Cert Endorsement, but may be further narrowed if the GSEs permit modifications to them.policies. In recent quarters,years, an immaterial percentage of claims received in a quarter have been resolved by rescissions, down from the peak of approximately 28% in the first half of 2009.rescissions. We do not expect future rescissions will be a significant portion of the claims we resolve over the next few years.
Our loss reserving methodology incorporates our estimates of future rescissions, curtailments, and reversals of rescissions and curtailments. When we rescind coverage, we return all premiums previously paid to us under
MGIC Investment Corporation 2017 Form 10-K | 24
|
| | | | | | | | | | | | | | | |
| | | | | | | | | | | | | | | |
MGIC Investment Corporation
2017 Form 10-K
|
Business (continued) |
the policy and are relieved of our obligation to pay a claim under the policy. A variance between ultimate actual rescission, curtailment or reversal rates and our estimates, as a result of the outcome of litigation, settlements or other factors, could materially affect our losses.
When the insured disputes our right to rescind coverage or curtail a claim, we generally engage in discussions in an attempt to settle the dispute. If we are unable to reach a settlement, the outcome of a dispute ultimately wouldmay be determined by legal proceedings. Under ASC 450-20, until a liability associated with settlement discussions or legal proceedings becomes probable and can be reasonably estimated, we consider our claim payment or rescission resolved for financial reporting purposes and do not accrue an estimated loss. WhereWhen we have determineddetermine that a loss is probable and can be reasonably estimated, we have recordedrecord our best estimate of our probable loss. If we are not able to implement settlements we consider probable, we intend to defend MGIC vigorously against any related legal proceedings.
In addition to matters for which we have recorded a probable loss, we are involved in other discussions and/or proceedings with insureds with respect to our claims paying practices. Although it is reasonably possible that when these matters are resolved we will not prevail in all cases, we are unable to make a reasonable estimate or range of estimates of the potential liability. We estimate the maximum exposure associated with matters where a loss is reasonably possible to be approximately $285 million, although we believe (but can give no assurance that) we will ultimately resolve these matters for significantly less than this amount. This estimate of our maximum exposure does not include interest or consequential or exemplary damages.
Although loan modification programs continued to mitigate our losses in 2017, their impact has decreased significantly from the impact we experienced in 2008-2012.
Another loss mitigation technique available to us is obtaining a deficiency judgment against the borrower and attempting to recover some or all of the paid claim from the borrower. Various factors, including state laws that limit or eliminate our ability to pursue deficiency judgments and borrowers’ financial conditions, have limited
our recoveries in recent years to less than one-half of 1% of our paid claims.
Loss Reserves and Premium Deficiency Reserve
. A significant period of time typically elapses between the time when a borrower becomes delinquent on a mortgage payment, which is the event triggering a potential future claim payment by us, the reporting of the delinquency to us, the acquisition of the property by the lender (typically through foreclosure) or the sale of the property, with our approval, and the eventual payment of the claim related to the uncured delinquency or a rescission. To recognize the estimated liability for losses related to outstanding reported delinquencies, or delinquency inventory, we establish loss reserves. Loss reserves are established by estimating the number of loans in our delinquency inventory that will result in a claim payment, which is referred to as the claim rate, and further estimating the amount of the claim payment, which is referred to as claim severity. Our loss reserve estimates are established primarily based upon historical experience, including rescission and curtailment activity. In accordance with GAAP for the mortgage insurance industry, we generally do not establish losscase reserves for future claims on insured loans that are not currently delinquent.
We also establish reserves to provide for the estimated costs of settling claims, general expenses of administering the claims settlement process, legal fees and other fees (“loss adjustment expenses”), and for losses and loss adjustment expenses from delinquencies that have occurred, but which have not yet been reported to us.us (IBNR).
MGIC Investment Corporation 2022 Form 10-K | 20
MGIC Investment Corporation and Subsidiaries
Our reserving process bases our estimates of future events on our past experience. However, estimationFor further information about our loss reserving methodology, refer to “Management’s Discussion and Analysis – Critical Accounting Estimates,” in Item 7. Estimation of loss reserves is inherently judgmental and conditions that have affected the development of the loss reserves in the past may not necessarily affect development patterns in the future, in either a similar manner or to a similar degree. For further information, see our risk factors in Item 1A, including the ones titled “Because we establish loss reserves only upon a loan delinquency rather than based on estimates of our ultimate losses on risk in force, losses may have a disproportionate adverse effect on our earnings in certain periods,” and “Because loss reserve estimates are subject to uncertainties, paid claims may be substantially different than our loss reserves.”
MGIC Investment Corporation 2017 Form 10-K | 25
|
| | | | | | | | | | | | | | | |
| | | | | | | | | | | | | | | |
MGIC Investment Corporation
2017 Form 10-K
|
Business (continued) |
Our losses incurred from our RIF have declined in recent years in part due to the improving economy and the run-off of the insurance policies we wrote before the financial crisis. These factors resulted in fewer delinquent loans, as well as an improved cure rate on delinquent loans. Our losses incurred were $53.7$(254.6) million in 2017,2022, compared to $240.2$64.6 million and $364.8 million in 20162021 and $343.5 million2020, respectively. Our losses incurred in 2015.2020 were above the levels of the other years shown as a result of losses stemming from the COVID-19 pandemic. For information about the decrease in losses incurred from 20162020 to 2017,2022, including the amounts of losses incurred that are associated with delinquency notices received in the reporting year compared to losses incurred associated with delinquency notices received in prior years, see “Management’s DiscussionNote 8 – "Loss Reserves" to our consolidated financial statements in Item 8.D. Reinsurance Agreements
We have in place quota share reinsurance ("QSR") and
Analysis – Consolidated Resultsexcess of
Operations – Losses and expenses – Losses incurred, net,”loss reinsurance ("XOL") transactions providing various amounts of coverage on 85% of our risk in
Item 7.
After our reserves are initially established, we perform premium deficiency tests using best estimate assumptionsforce as of December 31, 2022. These transactions allow us to better manage our risk profile and because they reduce the testing date. amount of capital we are required to hold to comply with insurance regulatory requirements and the requirements of the GSEs' PMIERs.
Quota Share Transactions.At December 31, 2022 and 2021, approximately 68% and 78%, respectively, of our IIF was subject to quota share reinsurance ("QSR") transactions. In 2022 and 2021, approximately 87% and 82%, respectively, of our NIW was subject to QSR transactions.
Our QSR transactions are with unaffiliated reinsurers and cover most of our insurance written from 2020 through 2023, and a smaller percentage of our insurance written from 2024 through 2025. The weighted average coverage percentage of our QSR transactions was 33%, based on risk in force as of December 31, 2022.
The structure of the QSR transactions is a quota share of various percentages of the policies covered, with a ceding commission and a profit commission. Generally, under the transactions, we will receive an annual profit commission provided the annual loss ratio on the loans covered under the transactions remains below various percentages, depending upon the transaction.
Excess of Loss Transactions. We establishhave XOL transactions with a premium deficiency reserve, if necessary, whenpanel of unaffiliated reinsurers executed through the present valuetraditional reinsurance market (“Traditional XOL") and with unaffiliated special purpose insurers (“Home Re") transactions. Our Home Re transactions issued notes linked to the reinsurance coverage ("Insurance Linked Notes" or "ILNs"). Our XOL transactions provide XOL reinsurance coverage for a portion of expectedthe risk associated with certain mortgage insurance policies having
insurance coverage in force dates from July 1, 2016 through March 31, 2019 and January 1, 2020 through December 30, 2022, all dates inclusive.
For the reinsurance coverage periods, we retain the first layer of the respective aggregate losses, and the reinsurers will then provide second layer coverage up to the outstanding reinsurance coverage amount. We retain losses in excess of the outstanding reinsurance coverage amount. The aggregate XOL reinsurance coverage decreases over a period of either 10 of 12.5 years, depending on the transaction, subject to certain conditions, as the underlying covered mortgages amortize or are repaid, or mortgage insurance losses are paid.
The special purpose insurers financed the coverages with the proceeds of the ILNs in an aggregate amount equal to the initial reinsurance coverage amounts. Each ILN is non-recourse to any of our assets. The proceeds of the ILNs, which were deposited into reinsurance trusts for our benefit, will be the source of reinsurance claim payments to us and principal repayments on the ILNs.
Although reinsuring against possible loan losses does not discharge us from liability to a policyholder, it reduces the amount of capital we are required to retain against potential future losses for PMIERs, rating agency and expenses exceeds the present value of expected future premiums and already established reserves. Products are grouped,insurance regulatory purposes. The calculated credit for premium deficiency testing purposes,XOL reinsurance transactions under PMIERs is generally based on similaritiesthe PMIERs requirement of the covered loans and the attachment and detachment point of the coverage, all of which fluctuate over time. PMIERs credit is generally not given for the reinsured risk above the PMIERs requirement. The GSEs have discretion to further limit reinsurance credit under the PMIERs. The total credit for risk ceded under our reinsurance transactions is subject to periodic review by the GSEs.
For further information about our reinsurance agreements, including the Company's early termination rights, see Note 9 – “Reinsurance,” to our consolidated financial statements in the way products are acquired, servicedItem 8, and measured for profitability. In the fourth quarter of 2007, we recorded a premium deficiency reserve relating to Wall Street bulk transactions remainingour risk factor titled "Reinsurance may not always be available or its cost may increase" in our IIF. That premium deficiency reserve was eliminated in the second quarter of 2015.Item 1A.
C.E. Investment Portfolio
Policy and StrategyPOLICY AND STRATEGY
At December 31, 2017,2022, the fair value of our investment portfolio was approximately $5.0$5.4 billion. In addition, at December 31, 2017,2022, our total assets included approximately $99.9$333 million of cash and cash equivalents. At December 31, 2017,2022, approximately $647 million of our portfolio plusinvestments and cash and cash equivalents approximately $216 million was held by our parent company, and the remainder was held by our subsidiaries, primarily MGIC.
As of December 31, 2017,2022, approximately 78%95% of our investment portfolio (excluding cash and cash equivalents) was managed by Wellington Management Company, LLP,two external investment managers, although we maintain overall control of investment policy and strategy. We maintain direct management of the remainder of our investment portfolio. Unless otherwise indicated, the remainder of the discussion regarding our investment portfolio refers to our investment portfolio only and not to cash and cash equivalents.
The investment policy of our operating companies (primarily MGIC) emphasizes preservation of PMIERs assets, limiting
MGIC Investment Corporation 2022 Form 10-K | 21
MGIC Investment Corporation and Subsidiaries
portfolio volatility and maximizing total return with an emphasis on yield (subject to the other objectives). Our currentholding company investment policy emphasizes preservation of capital. Therefore,providing liquidity with minimal realized losses through holding high credit quality, low volatility assets. Consequently, our investment portfolio consists almost entirely of high-quality, investment grade, fixed income securities. Our investment portfolio strategy encompassesconsiders tax efficiency. The mix of tax-exempt municipal securities in our investment portfolio will be dependent upon their value, relative to taxable equivalent securities, determined in part by federal statutory tax rates. The goal is to maintain or grow net investment income through a combination of investment income and tax advantages. Also, ourOur investment policies and strategies are subject to change depending upon regulatory, economic and market conditions and our existing or anticipated financial condition and operating requirements.
Our investment policies in effect at December 31, 20172022 limit investments in the securities of a single issuer, other than the U.S. government, and generally limit the purchase of fixed income securities to those that are rated investment grade by at least one rating agency. They also limit the amount of investment in foreign governments and foreign domiciled securities and in any individual foreign country. In addition, the guidelines require the portfolio to carry a weighted average credit quality of at least an "A" rating.
The aggregate market value of the holdings of a single obligor, or type of investment, as applicable, is limited to:
|
| | |
U.S. government securities | | No limit |
Pre-refunded municipals escrowed in Treasury securities | | No limit |
U.S. government agencies (in total)(1)
| | 15% of portfolio market value |
Securities rated “AA” or “AAA” | | 3% of portfolio market value |
Securities rated “BBB” or “A” | | 2% of portfolio market value |
Foreign governments & foreign domiciled securities (in total) | | 10% of portfolio market value |
Individual AAA rated foreign countries | | 3% of portfolio market value |
Individual below AAA rated foreign countries | | 1% of portfolio market value |
| |
(1)
| As used with respect to our investment portfolio, U.S. government agencies include GSEs (which, in the sector table below are included as part of U.S. Treasuries) and Federal Home Loan Banks. |
MGIC Investment Corporation 2017 Form 10-K | 26
|
| | | | | | | | | | | | | | | |
| U.S. government and GNMA securities | | No limit |
| Pre-refunded municipals escrowed in Treasury securities | | | | | | | | | | | | | No limit |
MGIC Investment CorporationIndividual U.S. government agencies(1)
2017 Form 10-K
| | 10% of portfolio market value |
Business (continued)Individual securities rated “AAA” or “AA” (2) | | 3% of portfolio market value |
Individual securities rated “BBB” or “A” (2) | | 2% of portfolio market value |
Foreign governments & foreign domiciled securities (in total) (3) | | 25% of portfolio market value |
(1)As used with respect to our investment portfolio, U.S. government agencies include all GSEs and Federal Home Loan Banks.
(2)For the holding company, individual securities with a rating of "AA" or "AAA" may represent a maximum 10% of the portfolio market value and individual securities with a rating of "BBB" or "A" may represent a maximum 5%.
(3)For the holding company, there is no maximum aggregate limit for foreign government or foreign domiciled securities.
Investment Operations
At December 31, 2017,2022, the sectors ofrepresented in our investment portfolio were as shown in the table below:
|
| | | | |
| | |
| Investment portfolio - sectors | | Percentage of
Portfolio’s
Fair Value
|
| 1. Corporate | 41.6% |
| Percentage of Portfolio’s Fair Value |
| 1. Corporate | 41% |
| 2. Tax-Exempt Municipals | 28.618% |
| 3. Taxable Municipals | 12.922% |
| 4. Asset-Backed | 4. Asset Backed | 8.613% |
| 5. U.S. government and agency debt | 5. GNMA Pass-through Certificates | 3.62% |
| 6. GNMA and other agency mortgage-backed securities | 6. U.S Treasuries | 3.04% |
| 7. Escrowed/Prerefunded Municipals | 1.6 |
| 8. Equities and Other | 0.1 |
| | 100.0%100% |
We hadhave no derivative financial instruments in our investment portfolio. Securities with stated maturities due within up to one year, after one year and up to five years, after five years and up to ten years, and after ten years, represented 12%8%, 35%24%, 21%32% and 32%20%, respectively, of the total fair value of our investment in fixed income debtinvestment securities. ABS, RMBS, CMBSAsset-backed and CLOs representing 12% of the total fair value of our investment portfoliomortgage-backed securities are not included in these maturity categories as the expected maturities may differ tobe different from the stated maturities based ondepending upon the periodic payments during the life of the security. Asset-backed securities represent 13% of the investment portfolio (CLOs represent 6%, CMBS represent 5% and other asset-backed securities represent 2%). GNMA and other agency mortgage-backed securities represent 4% of the investment portfolio. Our pre-tax yield was 2.7%3.0%, 2.5%, and 2.6% for 2022, 2021, and 2.5% for 2017, 2016, and 2015,2020, respectively, and our after-tax yield was 2.0%2.5%, 1.9%2.1%, and 1.8%2.1% for 2017, 2016,2022, 2021, and 2015,2020, respectively.
Our ten largest holdings at December 31, 20172022 appear in the table below:
| | | | | | | | |
| Investment portfolio - Ten largest holdings |
| | |
| | Fair Value (In thousands) |
| 1 | New York St Dorm Auth Rev | $ | 73,595 | |
| 2 | Bank of America Corp | 40,719 | |
| 3 | New York NY City Transitional | 38,852 | |
| 4 | Chicago Transit Authority | 36,326 | |
| 5 | JP Morgan Chase | 35,271 | |
| 6 | Citigroup Inc | 31,532 | |
| 7 | Morgan Stanley | 31,478 | |
| 8 | City of Bridgeport CT | 30,363 | |
| 9 | Metropolitan Trans Auth NY | 27,650 | |
| 10 | Regatta VI Funding Ltd. | 27,445 | |
| | $ | 373,231 | |
|
| | |
| | |
Investment portfolio - top ten largest holdings | | Fair Value
(In thousands)
|
1. New York St Dorm Auth Rev | $59,312 |
| 2. Goldman Sachs Group | 54,698 |
| 3. GS Mortgage Securities Trust | 51,881 |
| 4. Comm Mortgage Trust | 46,730 |
| 5. JP Morgan Chase | 41,183 |
| 6. Chicago Airport Revenue | 40,871 |
| 7. New York City NY Transitional | 40,157 |
| 8. American Honda Finance | 38,934 |
| 9. Morgan Stanley | 36,717 |
| 10. Pennsylvania St Turnpike Comm | 36,001 |
| | $446,484 |
Note: This table excludes securities issued by the U.S. government or U.S. government agencies, the GSEs and the Federal Home Loan Banks.agencies.
MGIC Investment Corporation 20172022 Form 10-K | 2722
MGIC Investment Corporation and Subsidiaries
|
| | | | | | | | | | | | | | | |
| | | | | | | | | | | | | | | |
MGIC Investment Corporation
2017 Form 10-K
|
Business (continued) |
D.F. Regulation
Direct Regulation
We are subject to comprehensive, detailed regulation by state insurance departments. These regulations are principally designed for the protection of our insured policyholders, rather than for the benefit of investors. Although their scope varies, state insurance laws generally grant broad supervisory powers to agencies or officials to examine insurance companies and enforce rules or exercise discretion affecting almost every significant aspect of the insurance business.
In general, regulation of our subsidiaries’ businessbusinesses relates to:
•minimum capital levels and adequacy ratios;
•requirements regarding contingency reserves;
•premium rates and discrimination in pricing;
•licenses to transact business;businesses;
•policy forms;
premium rates;
•insurable loans;
•annual and other reports on financial condition;
•the basis upon which assets and liabilities must be stated;
requirements regarding contingency reserves equal to 50% of premiums earned;
minimum capital levels and adequacy ratios;
•reinsurance requirements;
•limitations on the types of investment instruments which may be held in an investment portfolio;
the size of risks and limits on coverage of individual risks which may be insured;•privacy;
•deposits of securities;
•transactions among affiliates;
•restrictions on transactions that have the effect of inducing lenders to place business with the insurer;
•cybersecurity;
•limits on dividends payable;payable (for a description of limits on dividends payable to us from MGIC, see Note 14 – “Statutory Information,” to our consolidated financial statements in Item 8); •suitability of officers and directors; and
•claims handling.
Future regulation is expected to address the use of algorithms, artificial intelligence and data and analytics to determine pricing and for other purposes.
Wisconsin, our domiciliary state, has adopted the Risk Management and Own Risk and Solvency Assessment Act, which was effective January 1, 2015 and requires, among other things, that we:
no less than annually,we conduct an Own Risk and Solvency Assessment ("ORSA"), at least annually, to assess the material risks associated with our business and our current and estimated projected future solvency position;
and maintain a risk management framework to assess, monitor, manage and report on material risks;risks. Wisconsin has also adopted the annual enterprise risk reporting and "Corporate Governance Disclosure" requirements of the NAIC Model Act.
provide a confidential high-level ORSA Summary Report annually to the OCI.
The insurance laws of 16 jurisdictions, including Wisconsin, our domiciliary state, require a mortgage insurer to maintain a minimum amount of statutory capital relative to the RIF (or a similar measure) in order for the mortgage insurer to continue to write new business. We refer to these requirements as the “State Capital Requirements.” While they vary among jurisdictions, currently the most common State Capital Requirements allow for
a maximum risk-to-capital ratio of 25 to 1. Wisconsin does not regulate capital by using a risk-to-capital measure but instead requires a minimum policyholder position. TheMGIC's “policyholder position” of a mortgage insurer isincludes its net worth or surplus and its contingency reserve and a portion of the reserves for unearned premiums.reserve.
At December 31, 2017,2022, MGIC’s risk-to-capital ratio was 9.510.2 to 1, below the maximum allowed by the jurisdictions with State Capital Requirements, and its policyholder position was $2.1$3.5 billion above the required MPP of $1.2$2.1 billion.
The NAIC previously announced plans to revise the minimum capital and surplus requirements for mortgage insurers that are provided for in its Mortgage Guaranty Insurance Model Act. AIn December 2019, a working group of state regulators has been considering since 2016released an exposure draft of a revised Mortgage Guaranty Insurance Model Act and a risk-based capital framework to establish capital requirements for mortgage insurers, although no date has been establishedcertain terms were not completely addressed by whichthe framework, including the treatment of ceded risk and minimum capital floors. In October 2022, the NAIC must propose revisionsworking group released a revised exposure draft of the Mortgage Guaranty Insurance Model Act that does not include changes to the capital requirements.requirements of the existing Model Act. See our risk factors “We may not continue to meet the GSEs’ mortgage insurer eligibility requirements and our returns may decrease as we are required to maintain significantly more capital in order to maintain our
MGIC Investment Corporation 2017 Form 10-K | 28
|
| | | | | | | | | | | | | | | |
| | | | | | | | | | | | | | | |
MGIC Investment Corporation
2017 Form 10-K
|
Business (continued) |
eligibility” and “State Capital requirements may prevent us from continuing to write new insurance on an uninterrupted basis” in Item 1A, for information about regulations governing our capital adequacy and our expectations regarding our future capital position. See "Management's Discussion and Analysis – Liquidity and Capital Resources – Capital Adequacy" in Item 7 for information about our current capital position.
Most states also regulate transactions betweenWe are required to establish statutory accounting contingency loss reserves in an amount equal to 50% of earned premiums. These amounts cannot be withdrawn for a period of 10 years, except as permitted by insurance companiesregulations. With regulatory approval, a mortgage insurance company may make early withdrawals from the contingency reserve when incurred losses exceed 35% of net premiums earned in a calendar year. Although MGIC holds assets in excess of its minimum statutory capital requirements and their parents or affiliatesits PMIERs financial requirements, the ability of MGIC to pay dividends is restricted by insurance regulation. In general, dividends in excess of prescribed limits are deemed “extraordinary” and have restrictionsmay not be paid if disapproved by the OCI. The level of ordinary dividends that may be paid without OCI approval is determined on transactions that havean annual basis. A dividend is extraordinary when the effectproposed dividend amount, plus dividends paid in the twelve months preceding the dividend payment date exceed the ordinary dividend level. In 2023, MGIC can pay $92 million of inducing lendersordinary dividends without OCI approval, before taking into consideration dividends paid in the preceding twelve months. In 2022, MGIC paid $800 million in dividends of cash and investments to place business with the insurer.holding company. For a description of limits on dividends payable to us from MGIC,further information, see Note 14 – “Statutory Information,” to our consolidated financial statements in Item 8.
Mortgage insurance premium rates are also subject to state regulation to protect policyholders against the adverse effects of excessive, inadequate or unfairly discriminatory rates and to encourage competition in the insurance marketplace. Any increase in premium rates must be justified, generally on the basis of the insurer’s loss experience, expenses and future trend
MGIC Investment Corporation 2022 Form 10-K | 23
MGIC Investment Corporation and Subsidiaries
analysis. The general mortgage default experience may also be considered. Premium rates are subject to review and challenge by state regulators.
We are required to establish statutory accounting contingency loss reserves in an amount equal to 50% of net earned premiums. These amounts cannot be withdrawn for a period of 10 years, except as permitted by insurance regulations. With regulatory approval a mortgage guaranty insurance company may make early withdrawals from the contingency reserve when incurred losses exceed 35% of net premiums earned in a calendar year. For further information, see Note 14 – “Statutory Information,” to our consolidated financial statements in Item 8.
Mortgage insurers are generally single-line companies, restricted to writing residential mortgage insurance business only. Although we, as an insurance holding company, are prohibited from engaging in certain transactions with MGIC or our other insurance subsidiaries without submission to and, in some instances, prior approval by applicable insurance departments, we are not subject to insurance company regulation on our non-insurance businesses.
Wisconsin’s insurance regulations generally provide that no person may acquire control of us unless the transaction in which control is acquired has been approved by the OCI. The regulations provide for a rebuttable presumption of control when a person owns or has the right to vote more than 10% of the voting securities. In addition, the insurance regulations of other states in which MGIC is licensed require notification to the state’s insurance department a specified time before a person acquires control of us. If regulators in these states disapprove the change of control, our licenses to conduct business in the disapproving states could be terminated. For further information about regulatory proceedings applicable to us and our industry, see “We are involved in legal proceedings and aresubject to the risk of additional legal proceedingscomprehensive regulation and other requirements, which we may fail to satisfy” in the future” in Item 1A.
The CFPB was established by the Dodd-Frank Act to regulate the offering and provision of consumer financial products or services under federal law. The CFPB’s 2014 rules implementing laws that require mortgage lenders to make ability-to-pay determinations prior to extending credit affectedaffect the characteristics of loans being originated and the volume of loans available to be insured. We are uncertain whether the CFPB will issue any other rules or regulations that affect our business. Such rules and regulations could have a material adverse effect on us.
As the most significant purchasers and sellers of conventional mortgage loans and beneficiaries of private mortgage insurance, Freddie Mac and Fannie Maethe GSEs impose financial and other requirements on private mortgage insurers in order for them to be eligible to insure loans sold to the GSEs (these requirements are referred to as the "PMIERs", as discussed above). These requirements are subject to change from time to time. Based on our interpretation of the financial requirements of the PMIERs, as of December 31, 2017,2022, MGIC’s Available Assets totaled $4.8$5.7 billion, or $0.8$2.3 billion in excess of its Minimum Required Assets. MGIC is in compliance with the requirements of the PMIERs and eligible to insure loans purchased by the GSEs. If MGIC ceases to be eligible to insure loans purchased by one or both of the GSEs, it would significantly reduce the volume of our new business writings. For information about matters that could negatively affect our compliance with the PMIERs, see our risk factor titled “We may not continue to meet the GSEs’ mortgage
MGIC Investment Corporation 2017 Form 10-K | 29
|
| | | | | | | | | | | | | | | |
| | | | | | | | | | | | | | | |
MGIC Investment Corporation
2017 Form 10-K
|
Business (continued) |
insurer eligibility requirements and our returns may decrease as we are required to maintain significantly more capital in order to maintain our eligibility” in Item 1A.
On December 18, 2017, we received a summary of proposed changes to the PMIERs that are being recommended to the FHFA by the GSEs. Once the PMIERs are finalized, we expect a six-month implementation period before the revised PMIERs are effective. We expect that effectiveness will not be earlier than the fourth quarter of 2018.
If the GSE-recommended changes are adopted with an effective date in the fourth quarter of 2018, we expect that at the effective date, MGIC would continue to have an excess of Available Assets over Minimum Required Assets, although this excess would be materially lower than it was at December 31, 2017 under the existing PMIERs, and that MGIC would continue to be able to pay quarterly dividends to our holding company at the $50 million quarterly rate at which they were paid in the fourth quarter of 2017. As a result, we expect cash at our holding company at December 31, 2018 would increase over what its December 31, 2017 level.
The FHFA ishas been the conservator of the GSEs since 2008 and has the authority to control and direct their operations. The increased role that the federal government has assumed in the residential mortgage markethousing finance system through the GSE conservatorship may increase the likelihood that the business practices of the GSEs change, including through administrative action, in ways that have a material adverse effect on us. In addition, these factors may increase the likelihoodus and that the charters of the GSEs are changed by new federal legislation. InFor more information about the past, members of Congress introduced several bills intended to scale back the GSEs; however, no legislation has been enacted. The new Presidential administration has indicated that the conservatorshipbusiness practices of the GSEs should end; however, it is unclear whether and when
that would occur and how that would impact us. As a result of the matters referred to above, it is uncertain what role the GSEs, FHA and private capital, including private mortgage insurance, will play in the domestic residential housing finance system in the future or the impact of any such changes on our business. In addition, the timing of the impact of any resulting changes on our business, is uncertain. Most meaningful changes would require Congressional action to implement and it is difficult to estimate when Congressional action would be final and how long any associated phase-in period may last. For additional information about the potential impact that any such changes in the GSE’s roles may have on us, see theour risk factor titled “Changes"Changes in the business practices of the GSEs, federal legislation that changes their charters or a restructuring of the GSEs could reduce our revenues or increase our losses”losses" in Item 1A.
In December 2013, the U.S. Treasury Department’s Federal Insurance Office released a report that calls for federal standards and oversight for mortgage insurers to be developed and implemented. It is uncertain if and when the standards and oversight will become effective and what form they will take.
Indirect Regulation
We are also indirectly, but significantly, impacted by regulations affecting purchasers of mortgage loans, such as Freddie Mac and Fannie Mae,the GSEs, and regulations affecting governmental insurers, such as the FHA and the VA, and lenders. See our risk factor titled “Changes in the business practices of the GSEs, federal legislation that changes their charters or a restructuring of the GSEs could reduce our revenues or increase our losses” in Item 1A for a discussion of how potential changes in the GSEs’ business practices could affect us. Private mortgage insurers, including MGIC, are highly dependent upon federal housing legislation and other laws and regulations to the extent they affect the demand for private mortgage insurance and the housing market generally. From time to time, those laws and regulations have been amended toin ways that affect competition from government agencies. Proposals are discussed from time to time by Congress and certain federal agencies to reform or modify the FHA and the Government National Mortgage Association, which securitizes mortgages insured by the FHA.
Mortgage insurance generally may be considered to be a “settlement service” for purposes of RESPA under applicable regulations. Subject to certain exceptions, in general, RESPA prohibits any person from giving or receiving any “thing of value” pursuant to an agreement or understanding to refer settlement services.
HOPA provides for the automatic termination, or cancellation upon a borrower’s request, of private mortgage insurance upon satisfaction of certain conditions. For more information, see "Our Products and Services" in Item 1.B.
FCRA imposes restrictions on the permissible use of credit report information. FCRA has been interpreted by some Federal Trade Commission staff and federal courts to require mortgage insurance companies to provide “adverse action” notices to consumers in the event an application for mortgage insurance is declined or offered at less than the best available rate for the loan program applied for on the basis of a review of the consumer’s credit.
The Office of the Comptroller of the Currency, the Federal Reserve Board, and the Federal Deposit Insurance Corporation have uniform guidelines on real estate lending by insured lending institutions under their supervision. The guidelines specify that a residential mortgage loan originated with a loan-to-value ratio of 90% or greater should have appropriate credit enhancement in the form of mortgage insurance or readily marketable collateral, although no depth of coverage percentage is specified in the guidelines.
MGIC Investment Corporation 2017 Form 10-K | 30
|
| | | | | | | | | | | | | | | |
| | | | | | | | | | | | | | | |
MGIC Investment Corporation
2017 Form 10-K
|
Business (continued) |
Lenders are subject to various laws, including the Home Mortgage Disclosure Act, the Community Reinvestment Act, the Equal Credit Opportunity Act, TILA, HOPA, the Secure and Fair Enforcement for Mortgage Licensing Act, FCRA, the Fair Debt Collection Practices Act, the Gramm-Leach-Bliley Act, and the Fair Housing Act, and Fannie Mae and Freddie Mac are subject to various laws, including laws relating to government sponsored enterprises, which may impose obligations or create incentives for increased lending to low and moderate income persons, or in targeted areas.
There can be no assurance that other federal laws and regulations affecting these institutions and entities will not
MGIC Investment Corporation 2022 Form 10-K | 24
MGIC Investment Corporation and Subsidiaries
change, or that new legislation or regulations will not be adopted which will adversely affect the private mortgage insurance industry.
G. Human Capital
In this regard, see2022, we placed a significant focus on supporting co-workers in their career journey, and connecting co-workers to each other and the risk factor titled “Changes in the business practicescommunity – from educating managers on hybrid team-building to curating dozens of the GSEs, federal legislation that changes their charters or a restructuringvolunteer opportunities.
The following table provides selected demographic information for our workforce as of
the GSEs could reduce our revenues or increase our losses” in Item 1A.
E. Employees
At December 31, 2017, we had 819 full- and part-time employees, approximately 35% of whom were assigned to our field offices. 2022.
| | | | | | | | |
| Demographics (as of December 31, 2022) |
| | |
| Number of Co-Workers | | 683 * |
| Average Tenure | | 12 years |
| Percent Female | | 56% |
| Percent Racial / Ethnic Minorities | | 19% |
| Turnover Rate | | 15% |
| Average Age | | 48 |
*The number of employees given aboveco-workers does not include “on-call” employees.co-workers. The number of “on-call” employeesco-workers can vary substantially, primarily as a result of changes in demand for contract underwriting services. In recent years, the number of “on-call” employeesco-workers has ranged from fewer than 5025 to more than 220.110.
Diversity, Equity & Inclusion F.In 2022 we established a DEI Executive Council, an internal group that consists of executive and cross-functional management that reports to the CEO and Corporate Sustainability Executive Council. The DEI Executive Council has undertaken a number of initiatives since its inception, including:
•Recognizing eight DEI observance days through co-worker education, engagement and action
•Launching DEI workshops and dialogue sessions for all MGIC officers
•Prioritizing DEI in each all-company meeting and engaging executive leadership in ongoing advocacy and endorsement
Total Rewards and Talent Practices
Our total rewards program is designed to provide a competitive package of benefits and compensation elements that recognize the unique needs of our workforce and their families. All full-time MGIC co-workers are eligible to participate in our health program, which is calibrated toward well-being through our popular Health Rewards program in addition to a comprehensive medical, dental and vision plan. We also recognize financial health as part of well-being, and so currently provide a 401(k) plan with company match and discretionary annual profit-sharing contributions. In 2022, we made changes designed to deliver more flexibility to co-workers at all stages of their careers by shifting from a legacy pension plan to increase 401(k) matching, enhancing retiree medical benefits, and expanding our retirement eligibility.
Our talent practices reflect a commitment to creating a positive co-worker experience and investing in development and career growth. In 2022, we rolled out an end-to-end career framework aimed at strengthening our talent pool, promoting equity across departments, setting clear expectations based on role, and creating more opportunities for internal mobility. We also
redesigned our annual bonus program to expand eligibility and give co-workers a greater opportunity to share in company success.
Co-Worker Sentiment
MGIC conducts an annual engagement survey to gauge co-worker sentiment. In 2022, we saw an 83% participation rate and added survey questions to gain deeper insight into co-worker inclusion and belonging. Based on the survey results, we identify and share with our Board of Directors and executive leadership several key areas of strength and opportunity. These strength and opportunities are shared with all co-workers for transparency, and leaders at all levels of the company are expected to play an active role in taking meaningful action in response. The annual engagement survey is complemented by additional quantitative, qualitative and passive listening mechanisms, ranging from new hire surveys to CEO-led focus groups.
Community Involvement
Our commitment to community is formalized under the banner of Giving Back, Together, and in 2022 included providing financial and in-kind support for organizations that support housing, youth programs, and the arts in our community and nationwide. We also provided paid time off for co-workers to volunteer or work at election polling places.
H. Website Access
We make available, free of charge, through our Internet website our Annual Reports on Form 10-K, Quarterly Reports on Form 10-Q, Current Reports on Form 8-K, and amendments to those reports filed or furnished pursuant to Section 13(a) or 15(d) of the Securities and Exchange Act of 1934Commission ("SEC") as soon as reasonably practicable after we electronically file these materials with the Securities and Exchange Commission.SEC. The address of our website is http://mtg.mgic.com, and such reports and amendments are accessible throughat the “Reports & Filings” link at such address.on our website (http://mtg.mgic.com). The inclusion of our website address in this report is an inactive textual reference only and is not intended to include or incorporate by reference the information on our website into this report.
MGIC Investment Corporation 20172022 Form 10-K | 3125
MGIC Investment Corporation and Subsidiaries
|
| | | | | | | | | | | | | | | |
Risk Factors | | | | | | | | | | | | | | | |
MGIC Investment Corporation
2017 Form 10-K
| | | | | | | | | | | | | | | |
PART I
Item 1A.
Risk Factors
As used below, “we,” “our” and “us” refer to MGIC Investment Corporation’s consolidated operations or to MGIC Investment Corporation, as the context requires; and “MGIC” refers to Mortgage Guaranty Insurance Corporation.
Risk Factors Relating to Global Events
Our actual results couldThe Russia-Ukraine war and/or other global events may adversely affect the U.S. economy and our business.
Russia's invasion of Ukraine has increased the already-elevated inflation rate, added more pressure to strained supply chains, and has increased volatility in the domestic and global financial markets. The war has impacted, and may impact, our business in various ways, including the following which are described in more detail in the remainder of these risk factors:
•The terms under which we are able to obtain excess-of-loss ("XOL") reinsurance through the insurance-linked notes ("ILN") market and the traditional reinsurance market have been negatively impacted and terms under which we are able to access those markets in the future may be affectedlimited or less attractive.
•The risk of a cybersecurity incident that affects our company may have increased.
•An extended or broadened war may negatively impact the domestic economy, which may increase unemployment and inflation, or decrease home prices, in each case leading to an increase in loan delinquencies.
•The volatility in the financial markets may impact the performance of our investment portfolio and our investment portfolio may include investments in companies or securities that are negatively impacted by the risk factors below. These risk factors are an integral part of this annual report. These risk factorswar.
Risk Factors Relating to the Mortgage Insurance Industry and its Regulation
Downturns in the domestic economy or declines in home prices may also cause actual resultsresult in more homeowners defaulting and our losses increasing, with a corresponding decrease in our returns.
Losses result from events that reduce a borrower’s ability or willingness to differ materially from the results contemplated by forward looking statements that we may make. Forward looking statements consist of statements which relate to matters other than historical fact, including matters that inherently refer to future events. Among others, statements that include wordsmake mortgage payments, such as “believe,” “anticipate,” “will”unemployment, health issues, changes in family status, and decreases in home prices that result in the borrower's mortgage balance exceeding the net value of the home. A deterioration in economic conditions, including an increase in unemployment, generally increases the likelihood that borrowers will not have sufficient income to pay their mortgages and can also adversely affect home prices.
High levels of unemployment may result in an increasing number of loan delinquencies and an increasing number of insurance claims; however, unemployment is difficult to predict given the uncertainty in the current market environment, including as a result of global events such as the COVID-19 pandemic, the Russia-Ukraine war, and the possibility of an economic recession. Since the beginning of 2021, inflation has increased dramatically. The impact that higher inflation rates will have on loan delinquencies is unknown.
The seasonally-adjusted Purchase-Only U.S. Home Price Index of the Federal Housing Finance Agency (the “FHFA”), which is based on single-family properties whose mortgages have been purchased or “expect,”securitized by Fannie Mae or wordsFreddie Mac, indicates that home prices fell 0.1% nationwide in November, 2022 compared to October, 2022. The 12 month change in home prices remains at historically high rates, but the rate of similar import, are forward looking statements. We are not undertaking any obligationgrowth is moderating: it increased by 6.7% in the first eleven months of 2022, after increasing 17.9%, 11.7%, and 5.9% in 2021, 2020 and 2019, respectively. The national average price-to-income ratio exceeds its historical average, in part as a result of recent home price appreciation outpacing increases in income. Affordability issues and the significant increase in interest rates in recent months has put downward pressure on home prices. Recent third-party forecasts predict that home prices will decline further. This decline may occur even absent a deterioration in economic conditions due to update any forward looking statementsdeclines in demand for homes, which in turn may result from changes in buyers’ perceptions of the potential for future appreciation, restrictions on and the cost of mortgage credit due to more stringent underwriting standards, higher interest rates, changes to the tax deductibility of mortgage interest, decreases in the rate of household formations, or other statements we may make even though these statements may be affected by eventsfactors.
Changes in the business practices of Fannie Mae and Freddie Mac's ("the GSEs"), federal legislation that changes their charters or circumstances occurring aftera restructuring of the forward looking statements or other statements were made. No reader of this annual report should rely on these statements being current at any time other than the time at which this annual report was filed with the Securities and Exchange Commission.
Competition or changes in our relationships with our customersGSEs could reduce our revenues reduce our premium yields and / or increase our losses.
Our private mortgage insurance competitors include:
Arch Mortgage Insurance Company,
Essent Guaranty, Inc.,
Genworth Mortgage Insurance Corporation,
National Mortgage Insurance Corporation, and
Radian Guaranty Inc.
The private mortgage insurance industry is highly competitive and is expected to remain so. We believe that we currently compete with other private mortgage insurers based on pricing, underwriting requirements, financial strength (including based on credit or financial strength ratings), customer relationships, name recognition, reputation, the strengthsubstantial majority of our management team and field organization, the ancillary products and services provided to lenders and the effective use of technology and innovation in the delivery and servicing of our mortgage insurance products.
Much of the competition in the industry has centered on pricing practices which, in the last few years included: (i) reductions in standard filed rates on borrower-paid policies, (ii) use by certain competitors of a spectrum of filed rates to allow for formulaic, risk-based pricing (commonly referred to as “black-box” pricing); and (iii) use of customized rates (discounted from published rates). The willingness of mortgage insurers to offer reduced pricing (through filed or customized rates) has been met with an increased demand from various lenders for reduced rate products. There can be no assurance that pricing competition will not intensify further, which could result in a decrease in our new insurance written and/or returns.
In 2016 and 2017, approximately 5% and 4%, respectively, of our new insurance written was for loans for which one lender was the original insured. Our relationships with our customers could be adversely affected by a variety of factors, including if our premium rates are higher than those of our competitors, our underwriting requirements result in our declining to insure some of the loans originated by our customers, or our insurance policy rescissions and claim curtailments affect the customer.
Certain of our competitors have access to capital at a lower cost of capital than we do (including, as a result of off-shore reinsurance vehicles, which are also tax-advantaged). As a result, they may be better positioned to
MGIC Investment Corporation 2017 Form 10-K | 32
|
| | | | | | | | | | | | | | | |
| | | | | | | | | | | | | | | |
MGIC Investment Corporation
2017 Form 10-K
| | | | | | | | | | | | | | | |
Risk factors (continued) |
compete outside of traditional mortgage insurance, including if Fannie Mae and Freddie Mac (the "GSEs") pursue alternative forms of credit enhancement. In addition, because of their tax advantages, certain competitors may be able to achieve higher after-tax rates of return on their NIW compared to us, which could allow them to leverage reduced pricing to gain market share.
Substantially all of our insurance written since 2008 has beenis for loans purchased by the GSEs.GSEs; therefore, the business practices of the GSEs greatly impact our business. In June 2022 the GSEs each published their Equitable Housing Finance Plans. The currentPlans seek to advance equity in housing finance over a three year period and include potential changes to the GSEs’ business practices and policies. Specifically relating to mortgage insurance, (1) Fannie Mae’s Plan contemplates the creation of special purchase credit program(s) ("SPCPs") targeted to historically underserved borrowers with a goal of lowering costs for such borrowers through lower than standard mortgage insurance requirements; and (2) Freddie Mac’s Plan contemplates the creation of SPCPs targeted to historically underserved borrowers with the goals of (a) working with mortgage insurers to reduce costs for high LTV borrowers, and (b) updating mortgage insurance cancellation requirements. To the extent the business practices and policies of the GSEs regarding mortgage insurance coverage, costs and cancellation change, including more broadly than through SPCPs, such changes may negatively impact the mortgage insurance industry.
Other business practices of the GSEs that affect the mortgage insurance industry include:
•The GSEs' private mortgage insurer eligibility requirements ("PMIERs"), the financial requirements of the GSEs require a mortgage insurer to maintain a minimum amount of assets to support its insured risk, aswhich are discussed in our risk factor titled “We may not continue to meet the GSEs’ private mortgage insurer eligibility requirements and our returns may decrease asif we are required to maintain more capital in order to maintain our eligibility.”
•The PMIERs do not require an insurer to maintain minimum financial strength ratings; however, our financial strength ratings can affect uscapital and collateral requirements for participants in the following ways:
A downgrade in our financial strength ratings could result in increased scrutiny of our financial condition by the GSEs and/or our customers, potentially resulting in a decrease in the amount of our new insurance written.
Our ability to participate in the non-GSE mortgage market (which has been limited since 2008, but may grow in the future), could depend on our ability to maintain and improve our investment grade ratings for our mortgage insurance subsidiaries. We could be competitively disadvantaged with some market participants because the financial strength ratings of our insurance subsidiaries are lower than those of some competitors. MGIC's financial strength rating from Moody’s is Baa2 (with a stable outlook) and from Standard & Poor’s is BBB+ (with a stable outlook).
Financial strength ratings may also play a greater role if the GSEs no longer operate in their current capacities, for example, due to legislative or regulatory action. In addition, although the PMIERs do not require minimum financial strength ratings, the GSEs consider financial strength ratings to be important when utilizingGSEs' alternative forms of credit enhancement other than traditional mortgage insurance, as discussed in
MGIC Investment Corporation 2022 Form 10-K | 26
MGIC Investment Corporation and Subsidiaries
our risk factor titled "The amount of insurance we write could be adversely affected if lenders and investors select alternatives to private mortgage insurance."
•The level of private mortgage insurance coverage, subject to the limitations of the GSEs’ charters, when private mortgage insurance is used as the required credit enhancement on low down payment mortgages (the GSEs generally require a level of mortgage insurance coverage that is higher than the level of coverage required by their charters; any change in the required level of coverage will impact our new risk written).
•The amount of loan level price adjustments and guaranty fees (which result in higher costs to borrowers) that the GSEs assess on loans that require private mortgage insurance. The requirements of the new GSE capital framework may lead the GSEs to increase their guaranty fees. In addition, the FHFA has indicated that it is reviewing the GSEs' pricing in connection with preparing them to exit conservatorship and to ensure that pricing subsidies benefit only affordable housing activities.
•Whether the GSEs select or influence the mortgage lender’s selection of the mortgage insurer providing coverage.
•The underwriting standards that determine which loans are eligible for purchase by the GSEs, which can affect the quality of the risk insured by the mortgage insurer and the availability of mortgage loans.
•The terms on which mortgage insurance coverage can be canceled before reaching the cancellation thresholds established by law and the business practices associated with such cancellations. For more information, see the above discussion of the GSEs' Equitable Housing Plans and our risk factor titled “Changes in interest rates, house prices or mortgage insurance cancellation requirements may change the length of time that our policies remain in force.”
•The programs established by the GSEs intended to avoid or mitigate loss on insured mortgages and the circumstances in which mortgage servicers must implement such programs.
•The terms that the GSEs require to be included in mortgage insurance policies for loans that they purchase, including limitations on the rescission rights of mortgage insurers.
•The extent to which the GSEs intervene in mortgage insurers’ claims paying practices, rescission practices or rescission settlement practices with lenders.
•The maximum loan limits of the GSEs compared to those of the FHA and other investors.
•The benchmarks established by the FHFA for loans to be purchased by the GSEs, which can affect the loans available to be insured. In December 2021, the FHFA established the benchmark levels for 2022-2024 purchases of low-income home mortgages, very low-income home mortgages and low-income refinance mortgages, each of which exceeded the 2021 benchmarks. The FHFA also established two new sub-goals: one targeting minority communities and the other targeting low-income neighborhoods.
The FHFA has been the conservator of the GSEs since 2008 and has the authority to control and direct their operations. The increased role that the federal government has assumed in the
residential housing finance system through the GSE conservatorships may increase the likelihood that the business practices of the GSEs change, including through administrative action, in ways that have a material adverse effect on us and that the charters of the GSEs are changed by new federal legislation.
It is uncertain what role the GSEs, FHA and private capital, including private mortgage insurance, will play in the residential housing finance system in the future. The timing and impact on our business of any resulting changes are uncertain. Many of the proposed changes would require Congressional action to implement and it is difficult to estimate when Congressional action would be final and how long any associated phase-in period may last.
We may not continue to meet the GSEs’ private mortgage insurer eligibility requirements and our returns may decrease if we are required to maintain more capital in order to maintain our eligibility.
We must comply with a GSE's PMIERs to be eligible to insure loans delivered to or purchased by that GSE. The PMIERs include financial requirements, as well as business, quality control and certain transaction approval requirements. The financial requirements of the PMIERs require a mortgage insurer’s “Available Assets” (generally only the most liquid assets of an insurer) to equal or exceed its “Minimum Required Assets” (which are generally based on an insurer’s book of risk in force and calculated from tables of factors with several risk dimensions, reduced for credit given for risk ceded under reinsurance agreements).
Based on our interpretation of the PMIERs, as of December 31, 2022, MGIC’s Available Assets totaled $5.7 billion, or $2.3 billion in excess of its Minimum Required Assets. MGIC is in compliance with the PMIERs and eligible to insure loans purchased by the GSEs. Our "Minimum Required Assets" reflect a credit for risk ceded under our quota share reinsurance ("QSR") and XOL reinsurance transactions, which are discussed in our risk factor titled "The mix of business we write affects our Minimum Required Assets under the PMIERs, our premium yields and the likelihood of losses occurring." The calculated credit for XOL reinsurance transactions under PMIERs is generally based on the PMIERs requirement of the covered loans and the attachment and detachment points of the coverage, all of which fluctuate over time. PMIERs credit is generally not given for the reinsured risk above the PMIERs requirement. The GSEs have discretion to further limit reinsurance credit under the PMIERs. Refer to “Consolidated Results of Operations – Reinsurance Transactions” in Part 7 for information about the calculated PMIERs credit for our XOL transactions. There is a risk we will not receive our current level of credit in future periods for ceded risk. In addition, we may not receive the same level of credit under future reinsurance transactions that we receive under existing transactions. If MGIC is not allowed certain levels of credit under the PMIERs, under certain circumstances, MGIC may terminate the reinsurance transactions without penalty.
The PMIERs generally require us to hold significantly more Minimum Required Assets for delinquent loans than for performing loans and the Minimum Required Assets required to be held increases as the number of payments missed on a delinquent loan increases. If the number of loan delinquencies increases for reasons discussed in these risk factors, or otherwise, it may cause our Minimum Required Assets to exceed
MGIC Investment Corporation 2022 Form 10-K | 27
MGIC Investment Corporation and Subsidiaries
our Available Assets. We are unable to predict the ultimate number of loans that will become delinquent.
If our Available Assets fall below our Minimum Required Assets, we would not be in compliance with the PMIERs. The PMIERs provide a list of remediation actions for a mortgage insurer's non-compliance, with additional actions possible in the GSEs' discretion. At the extreme, the GSEs may suspend or terminate our eligibility to insure loans purchased by them. Such suspension or termination would significantly reduce the volume of our new insurance written ("NIW"), the substantial majority of which is for loans delivered to or purchased by the GSEs. In addition to the increase in Minimum Required Assets associated with delinquent loans, factors that may negatively impact MGIC’s ability to continue to comply with the financial requirements of the PMIERs include the following:
•The GSEs may make the PMIERs more onerous in the future. The PMIERs provide that the factors that determine Minimum Required Assets will be updated periodically, or as needed if there is a significant change in macroeconomic conditions or loan performance. We do not anticipate that the regular periodic updates will occur more frequently than once every two years. The PMIERs state that the GSEs will provide notice 180 days prior to the effective date of updates to the factors; however, the GSEs may amend the PMIERs at any time, including by imposing restrictions specific to our company.
•The PMIERs may be changed in response to the final regulatory capital framework for the GSEs that was published in February 2022.
•Our future operating results may be negatively impacted by the matters discussed in the rest of these risk factors. Such matters could decrease our revenues, increase our losses or require the use of assets, thereby creating a shortfall in Available Assets.
Should capital be needed by MGIC in the future, capital contributions from our holding company may not be available due to competing demands on holding company resources, including for repayment of debt.
Because loss reserve estimates are subject to uncertainties, paid claims may be substantially different than our loss reserves.
When we establish case reserves, we estimate our ultimate loss on delinquent loans by estimating the number of such loans that will result in a claim payment (the "claim rate"), and further estimating the amount of the claim payment (the "claim severity"). Changes to our claim rate and claim severity estimates could have a material impact on our future results, even in a stable economic environment. Our estimates incorporate anticipated cures, loss mitigation activity, rescissions and curtailments. The establishment of loss reserves is subject to inherent uncertainty and requires significant judgment by management. Our actual claim payments may differ substantially from our loss reserve estimates. Our estimates could be affected by several factors, including a change in regional or national economic conditions as discussed in these risk factors and a change in the length of time loans are delinquent before claims are received. Generally, the longer a loan is delinquent before a claim is received, the greater the severity. As a result of foreclosure moratoriums and forbearance programs related to COVID-19, the average time it takes to receive claims has increased. Economic conditions may differ from region to region. Information about the geographic
dispersion of our risk in force and delinquency inventory can be found in our Annual Reports on Form 10-K and our Quarterly Reports on Form 10-Q. Prior to the COVID-19 pandemic, losses incurred generally followed a seasonal trend in which the second half of the year has weaker credit performance than the first half, with higher new default notice activity and a lower cure rate.
We are subject to comprehensive regulation and other requirements, which we may fail to satisfy.
We are subject to comprehensive regulation, including by state insurance departments. Many regulations are designed for the protection of our insured policyholders and consumers, rather than for the benefit of investors. Mortgage insurers, including MGIC, have in the past been involved in litigation and regulatory actions related to alleged violations of the anti-referral fee provisions of the Real Estate Settlement Procedures Act ("RESPA"), and the notice provisions of the Fair Credit Reporting Act ("FCRA"). While these proceedings in the aggregate did not result in material liability for MGIC, there can be no assurance that the outcome of future proceedings, if any, under these laws or others would not have a material adverse effect on us. To the extent that we are construed to make independent credit decisions in connection with our contract underwriting activities, we also could be subject to increased regulatory requirements under the Equal Credit Opportunity Act ("ECOA"), FCRA, and other laws. Under relevant laws, examination may also be made of whether a mortgage insurer's underwriting decisions have a disparate impact on persons belonging to a protected class in violation of the law.
Although their scope varies, state insurance laws generally grant broad supervisory powers to agencies or officials to examine insurance companies and enforce rules or exercise discretion affecting almost every significant aspect of the insurance business, including payment for the referral of insurance business, premium rates and discrimination in pricing, and minimum capital requirements. The increased use, by the private mortgage insurance industry, of risk-based pricing systems that establish premium rates based on more attributes than previously considered, and of algorithms, artificial intelligence and data and analytics, has ledto additional regulatory scrutiny of premium rates and of other matters such as discrimination in pricing and underwriting, data privacy and access to insurance. For more information about state capital requirements, see our risk factor titled “State capital requirements may prevent us from continuing to write new insurance on an uninterrupted basis.” For information about regulation of data privacy, see our risk factor titled “We could be materially adversely affected by a cyber security breach or failure of information security controls.” For more details about the various ways in which our subsidiaries are regulated, see “Business - Regulation” in Item 1.
While we have established policies and procedures to comply with applicable laws and regulations, many such laws and regulations are complex and it is not possible to predict the eventual scope, duration or outcome of any reviews or investigations nor is it possible to predict their effect on us or the mortgage insurance industry.
MGIC Investment Corporation 2022 Form 10-K | 28
MGIC Investment Corporation and Subsidiaries
Pandemics, hurricanes and other natural disasters may impact our incurred losses, the amount and timing of paid claims, our inventory of notices of default and our Minimum Required Assets under PMIERs.
Pandemics and other natural disasters, such as hurricanes, tornadoes, earthquakes, wildfires and floods, or other events related to changing climatic conditions, could trigger an economic downturn in the affected areas, or in areas with similar risks, which could result in a decline in our business and an increased claim rate on policies in those areas. Natural disasters, rising sea levels and/or fresh water shortages could lead to a decrease in home prices in the affected areas, or in areas with similar risks, which could result in an increase in claim severity on policies in those areas. In addition, the inability of a borrower to obtain hazard and/or flood insurance, or the increased cost of such insurance, could lead to an increase in delinquencies or a decrease in home prices in the affected areas. If we were to attempt to limit our new insurance written in affected areas, lenders may be unwilling to procure insurance from us anywhere.
Pandemics and other natural disasters could also lead to increased reinsurance rates or reduced availability of reinsurance. This may cause us to retain more risk than we otherwise would retain and could negatively affect our compliance with the financial requirements of State Capital Requirements and the PMIERs.
The PMIERs require us to maintain significantly more "Minimum Required Assets" for delinquent loans than for performing loans; however, the increase in Minimum Required Assets is not as great for certain delinquent loans in areas that the Federal Emergency Management Agency has declared major disaster areas and for certain loans whose borrowers have been affected by COVID-19. See our risk factor titled "We may not continue to meet the GSEs’ private mortgage insurer eligibility requirements and our returns may decrease if we are required to maintain more capital in order to maintain our eligibility."
In January 2021, the FHFA issued a Request for Input (“RFI”) regarding Climate and Natural Disaster Risk Management at the Regulated Entities (i.e., the GSEs and the Federal Home Loan Banks). The FHFA has instructed the GSEs to designate climate change as a priority concern and actively consider its effects in their decision making. It is possible that efforts to manage this risk by the FHFA, GSEs (including through GSE guideline or mortgage insurance policy changes) or others could materially impact the volume and characteristics of our NIW (including its policy terms), home prices in certain areas and defaults by borrowers in certain areas.
Reinsurance may not always be available or its cost may increase.
We have in place QSR and XOL reinsurance transactions providing various amounts of coverage on 85% of our risk in force as of December 31, 2022. Refer to Part 8, Note 9 – “Reinsurance” and Part 7 “Consolidated Results of Operations – Reinsurance Transactions” for more information about coverage under our reinsurance transactions. The reinsurance transactions reduce the tail-risk associated with stress scenarios. As a result, they reduce the capital that we are required to hold to support the risk and they allow us to earn higher returns on our business than we would without them. However, reinsurance may not always be available to us or available on similar terms, the reinsurance transactions subject us to counterparty credit risk, and the GSEs may change the credit they allow under the PMIERs for risk ceded
under our reinsurance transactions. Most of our XOL transactions were entered into in capital market transactions with special purpose insurers that issued notes linked to the reinsurance coverage ("Insurance Linked Notes" or "ILNs"). Our access to reinsurance may be disrupted and the terms under which we are able to obtain reinsurance may be less attractive than in the past due to volatility stemming from circumstances such as higher interest rates, increased inflation, global events such as the Russia-Ukraine war, and other factors. In 2022, execution of transactions for XOL reinsurance through the ILN market was more challenging, with increased pricing, down-sized transactions, and generally fewer transactions executed by mortgage insurers. If we are unable to compete effectivelyobtain reinsurance for our insurance written, the capital required to support our insurance written will not be reduced as discussed above and our returns may decrease absent an increase in our premium rates. An increase in our premium rates may lead to a decrease in our NIW.
Because we establish loss reserves only upon a loan delinquency rather than based on estimates of our ultimate losses on risk in force, losses may have a disproportionate adverse effect on our earnings in certain periods.
In accordance with accounting principles generally accepted in the currentUnited States, we establish case reserves for insurance losses and loss adjustment expenses only when delinquency notices are received for insured loans that are two or anymore payments past due and for loans we estimate are delinquent but for which delinquency notices have not yet been received (which we include in “IBNR”). Losses that may occur from loans that are not delinquent are not reflected in our financial statements, except when a "premium deficiency" is recorded. A premium deficiency would be recorded if the present value of expected future marketslosses and expenses exceeds the present value of expected future premiums and already established loss reserves on the applicable loans. As a result, future losses incurred on loans that are not currently delinquent may have a material impact on future results as delinquencies emerge. As of December 31, 2022, we had established case reserves and reported losses incurred for 26,387 loans in our delinquency inventory and our IBNR reserve totaled $21 million. The number of loans in our delinquency inventory may increase from that level as a result of economic conditions relating to current global events or other factors and our losses incurred may increase.
State capital requirements may prevent us from continuing to write new insurance on an uninterrupted basis.
The insurance laws of 16 jurisdictions, including Wisconsin, MGIC's domiciliary state, require a mortgage insurer to maintain a minimum amount of statutory capital relative to its risk in force (or a similar measure) in order for the financial strength ratings assignedmortgage insurer to continue to write new business. We refer to these requirements as the “State Capital Requirements.” While they vary among jurisdictions, the most common State Capital Requirements allow for a maximum risk-to-capital ratio of 25 to 1. A risk-to-capital ratio will increase if (i) the percentage decrease in capital exceeds the percentage decrease in insured risk, or (ii) the percentage increase in capital is less than the percentage increase in insured risk. Wisconsin does not regulate capital by using a risk-to-capital measure but instead requires a minimum policyholder position (“MPP”). MGIC's “policyholder position” includes its net worth or surplus, and its contingency reserve.
MGIC Investment Corporation 2022 Form 10-K | 29
MGIC Investment Corporation and Subsidiaries
At December 31, 2022 MGIC’s risk-to-capital ratio was 10.2 to 1, below the maximum allowed by the jurisdictions with State Capital Requirements, and its policyholder position was $3.5 billion above the required MPP of $2.1 billion. Our risk-to-capital ratio and MPP reflect full credit for the risk ceded under our quota share reinsurance and excess of loss transactions in the ILN market and traditional reinsurance market with unaffiliated reinsurers. It is possible that under the revised State Capital Requirements discussed below, MGIC will not be allowed full credit for the risk ceded under such transactions. If MGIC is not allowed an agreed level of credit under the State Capital Requirements, MGIC may terminate the reinsurance transactions, without penalty.
The NAIC previously announced plans to revise the State Capital Requirements that are provided for in its Mortgage Guaranty Insurance Model Act. In December 2019, a working group of state regulators released an exposure draft of a revised Mortgage Guaranty Insurance Model Act and a risk-based capital framework to establish capital requirements for mortgage insurers, although certain items were not completely addressed by the framework, including the treatment of ceded risk and minimum capital floors. In October 2022, the NAIC working group released a revised exposure draft of the Mortgage Guaranty Insurance Model Act that does not include changes to the capital requirements of the existing Model Act.
While MGIC currently meets the State Capital Requirements of Wisconsin and all other jurisdictions, it could be prevented from writing new business in the future in all jurisdictions if it fails to meet the State Capital Requirements of Wisconsin, or it could be prevented from writing new business in a particular jurisdiction if it fails to meet the State Capital Requirements of that jurisdiction, and in each case if MGIC does not obtain a waiver of such requirements. It is possible that regulatory action by one or more jurisdictions, including those that do not have specific State Capital Requirements, may prevent MGIC from continuing to write new insurance in such jurisdictions. If we are unable to write business in a particular jurisdiction, lenders may be unwilling to procure insurance from us anywhere. In addition, a lender’s assessment of the future ability of our insurance subsidiaries,operations to meet the State Capital Requirements or the PMIERs may affect its willingness to procure insurance from us. In this regard, see our risk factor titled “Competition or changes in our relationships with our customers could reduce our revenues, reduce our premium yields and/or increase our losses.” A possible future failure by MGIC to meet the State Capital Requirements or the PMIERs will not necessarily mean that MGIC lacks sufficient resources to pay claims on its insurance liabilities. You should read the rest of these risk factors for information about matters that could negatively affect MGIC’s compliance with State Capital Requirements and its claims paying resources.
If the volume of low down payment home mortgage originations declines, the amount of insurance that we write could decline.
The factors that may affect the volume of low down payment mortgage originations include the health of the U.S. economy, conditions in regional and local economies and the level of consumer confidence; restrictions on mortgage credit due to more stringent underwriting standards, liquidity issues or risk-retention and/or capital requirements affecting lenders; the level of home mortgage interest rates; housing affordability; new and existing housing availability; the rate of household formation, which is influenced, in part, by population and immigration trends;
homeownership rates; the rate of home price appreciation, which in times of heavy refinancing can affect whether refinanced loans have LTV ratios that require private mortgage insurance; and government housing policy encouraging loans to first-time homebuyers. A decline in the volume of low down payment home mortgage originations could decrease demand for mortgage insurance writtenand limit our NIW. For other factors that could decrease the demand for mortgage insurance, see our risk factor titled “The amount of insurance we write could be negatively affected.adversely affected if lenders and investors select alternatives to private mortgage insurance.”
The amount of insurance we write could be adversely affected if lenders and investors select alternatives to private mortgage insurance.
Alternatives to private mortgage insurance include:
lenders using FHA, VA and other government mortgage insurance programs,
•investors using risk mitigation and credit risk transfer techniques other than private mortgage insurance, or accepting credit risk without credit enhancement,
•lenders and other investors holding mortgages in portfolio and self-insuring,
•lenders using Federal Housing Administration ("FHA"), U.S. Department of Veterans Affairs ("VA") and other government mortgage insurance programs, and
•lenders originating mortgages using piggyback structures to avoid private mortgage insurance, such as a first mortgage with an 80% loan-to-value ("LTV") ratio and a second mortgage with a 10%, 15% or 20% loan-to-valueLTV ratio (referred to as 80-10-10, 80-15-5 or 80-20 loans, respectively) rather than a first mortgage with a 90%, 95% or 100% loan-to-valueLTV ratio that has private mortgage insurance.
The GSEs’ charters generally require credit enhancement for a low down payment mortgage loan (a loan in an amount that exceeds 80% of a home’s value) in order for such loan to be eligible for purchase by the GSEs. Private mortgage insurance generally has been purchased by lenders in primary mortgage market transactions to satisfy this credit enhancement requirement. In 2018, the GSEs initiated secondary mortgage market programs with loan level mortgage default coverage provided by various (re)insurers that are not mortgage insurers governed by PMIERs, and that are not selected by the lenders. These programs, which currently account for a small percentage of the low down payment market, compete with traditional private mortgage insurance and, due to differences in policy terms, they may offer premium rates that are below prevalent single premium lender-paid mortgage insurance ("LPMI") rates. We participate in these programs from time to time. See our risk factor titled “Changes in the business practices of Fannie Mae and Freddie Mac's ("the GSEs"), federal legislation that changes their charters or a restructuring of the GSEs could reduce our revenues or increase our losses” for a discussion of various business practices of the GSEs that may be changed, including through expansion or modification of these programs.
The GSEs (and other investors) have also used alternativeother forms of credit enhancement other thanthat did not involve traditional private mortgage insurance, such as obtaining insurance from non-mortgage insurers, engaging in credit-linked note transactions executed in the capital markets, or using other forms of debt issuances or securitizations that transfer credit risk directly to other investors;investors, including competitors and an affiliate of MGIC; using other risk mitigation techniques in conjunction
MGIC Investment Corporation 2022 Form 10-K | 30
MGIC Investment Corporation and Subsidiaries
with reduced levels of private mortgage insurance coverage; or accepting credit risk without credit enhancement. Although alternative forms of credit enhancement used by the GSEs in the past several years have not displaced primary mortgage
MGIC Investment Corporation 2017 Form 10-K | 33
|
| | | | | | | | | | | | | | | |
| | | | | | | | | | | | | | | |
MGIC Investment Corporation
2017 Form 10-K
| | | | | | | | | | | | | | | |
Risk factors (continued) |
insurance, we understand one GSE is marketing a “no MI” pilot program to lenders that would have loan level default coverage provided by various insurers that are not mortgage insurers and that are not selected by the lenders.
The FHA's share of the low down payment residential mortgages that were subject to FHA, VA, USDA or primary private mortgage insurance was 35.6%26.7% in 2017, 35.5%2022, 24.7% in 2016,2021, and 39.3%23.4% in 2015. In the past ten years,2020. Beginning in 2012, the FHA’s share has been as low as 17.1% in 200723.4% (in 2020) and as high as 68.7% in 2009.42.1% (in 2012). Factors that influence the FHA’s market share include relative rates and fees, underwriting guidelines and loan limits of the FHA, VA, private mortgage insurers and the GSEs; lenders' perceptions of legal risks under FHA versus GSE programs; flexibility for the FHA to establish new products as a result of federal legislation and programs; returns expected to be obtained by lenders for Ginnie Mae securitization of FHA-insured loans compared to those obtained from selling loans to Fannie Mae or Freddie Macthe GSEs for securitization; and differences in policy terms, such as the ability of a borrower to cancel insurance coverage under certain circumstances. WeOn February 22, 2023, the FHA announced a 30 bps decrease in its mortgage insurance premium rates. This rate reduction will negatively impact our NIW; however, given the many factors that influence the FHA's market share, it is difficult to predict the extent of the impact. In addition, we cannot predict how the factors that affect the FHA’s share of new insurance written will change in the future.
The VA's share of the low down payment residential mortgages that were subject to FHA, VA, USDA or primary private mortgage insurance was 24.1%24.5% in 2017, 26.6%2022, 30.2% in 2016,2021, and 23.9%30.9% in 2015. In the past ten years,2020. Beginning in 2012, the VA’s share has been as low as 5.4% in 200722.8% (in 2013) and as high as 26.6% in 2016.30.9% (in 2020). We believe that the VA’s market share has generally been increasing because of an increase ingrows as the number of borrowers that are eligible for the VA’s program whichincreases, and when eligible borrowers opt to use the VA program when refinancing their mortgages. The VA program offers 100% LTV ratio loans and charges a one-time funding fee that can be included in the loan amount.
Changes in interest rates, house prices or mortgage insurance cancellation requirements may change the length of time that our policies remain in force.
The premium from a single premium policy is collected upfront and generally earned over the estimated life of the policy. In contrast, premiums from monthly and annual premium policies are received each month or year, as applicable, and earned each month over the life of the policy. In each year, most of our premiums earned are from insurance that has been written in prior years. As a result, the length of time insurance remains in force, which is generally measured by persistency (the percentage of our insurance remaining in force from one year prior), is a significant determinant of our revenues. A higher than expected persistency rate may decrease the profitability from single premium policies because they will remain in force longer and may increase the incidence of claims that was estimated when the policies were written. A low persistency rate on monthly and annual premium policies will reduce future premiums but may also reduce the incidence of claims, while a high persistency on those policies will increase future premiums but may increase the incidence of claims.
Our persistency rate was 79.8% at December 31, 2022, 62.6% at December 31, 2021, and 60.5% at December 31, 2020. Since 2000, our year-end persistency ranged from a high of 84.7% at December 31, 2009 to a low of 47.1% at December 31, 2003. Our persistency rate is primarily affected by the level of current mortgage interest rates compared to the mortgage coupon rates on our insurance in force, which affects the vulnerability of the
insurance in force to refinancing; and the current amount and because eligibleof equity that borrowers have optedin the homes underlying our insurance in force. The amount of equity affects persistency in the following ways:
•Borrowers with significant equity may be able to userefinance their loans without requiring mortgage insurance.
•The Homeowners Protection Act (“HOPA”) requires servicers to cancel mortgage insurance when a borrower’s LTV ratio meets or is scheduled to meet certain levels, generally based on the VA program when refinancing their mortgages.original value of the home and subject to various conditions.
•The GSEs’ mortgage insurance cancellation guidelines apply more broadly than HOPA and also consider a home’s current value. For more information about the GSEs guidelines and business practices, and how they may change, see our risk factor titled “Changes in the business practices of Fannie Mae and Freddie Mac's ("the GSEs,GSEs"), federal legislation that changes their charters or a restructuring of the GSEs could reduce our revenues or increase our losses.”
The GSEs’ charters generally require credit enhancementWe are susceptible to disruptions in the servicing of mortgage loans that we insure and we rely on third-party reporting for information regarding the mortgage loans we insure.
We depend on reliable, consistent third-party servicing of the loans that we insure. An increase in delinquent loans may result in liquidity issues for servicers. When a mortgage loan that is collateral for a low down payment mortgage loan (a loan amount that exceeds 80% of a home’s value) in orderbacked security ("MBS") becomes delinquent, the servicer is usually required to continue to pay principal and interest to the MBS investors, generally for such loan to be eligiblefour months, even though the servicer is not receiving payments from borrowers. This may cause liquidity issues, especially for purchase by the GSEs. Lenders generally have used private mortgage insurance to satisfy this credit enhancement requirement and low down payment mortgages purchased by the GSEs generally are insured with private mortgage insurance. As a result, the business practicesnon-bank servicers (who service approximately 46% of the GSEs greatly impactloans underlying our business and include:
private mortgage insurer eligibility requirements of the GSEs (for information about the financial requirements includedinsurance in the PMIERs, see our risk factor titled “We may not continue to meet the GSEs’ private mortgage insurer eligibility requirements and our returns may decrease as we are required to maintain more capital in order to maintain our eligibility”),
the level of private mortgage insurance coverage, subject to the limitations of the GSEs’ charters (which may be changed by federal legislation), when private mortgage insurance is used as the required credit enhancement on low down payment mortgages,
the amount of loan level price adjustments and guaranty fees (which result in higher costs to borrowers) that the GSEs assess on loans that require private mortgage insurance,
whether the GSEs influence the mortgage lender’s selection of the mortgage insurer providing coverage and, if so, any transactions that are related to that selection,
the underwriting standards that determine which loans are eligible for purchase by the GSEs, which can affect the quality of the risk insured by the mortgage insurer and the availability of mortgage loans,
the terms on which mortgage insurance coverage can be canceled before reaching the cancellation thresholds established by law,
the programs established by the GSEs intended to avoid or mitigate loss on insured mortgages and the circumstances in which mortgage servicers must implement such programs,
the terms that the GSEs require to be included in mortgage insurance policies for loans that they purchase,
MGIC Investment Corporation 2017 Form 10-K | 34
|
| | | | | | | | | | | | | | | |
| | | | | | | | | | | | | | | |
MGIC Investment Corporation
2017 Form 10-K
| | | | | | | | | | | | | | | |
Risk factors (continued) |
the terms on which the GSEs offer lenders relief on their representations and warranties made at the time of sale of a loan to the GSEs, which creates pressure on mortgage insurers to limit their rescission rights to conform to such relief, and the extent to which the GSEs intervene in mortgage insurers’ claims paying practices, rescission practices or rescission settlement practices with lenders,and
the maximum loan limits of the GSEs compared to those of the FHA and other investors.
The Federal Housing Finance Agency (“FHFA”) has been the conservator of the GSEs since 2008 and has the authority to control and direct their operations. The increased role that the federal government has assumed in the residential housing finance system through the GSE conservatorship may increase the likelihood that the business practices of the GSEs change in ways that have a material adverse effect on us and that the charters of the GSEs are changed by new federal legislation. In the past, members of Congress have introduced several bills intended to change the business practices of the GSEs and the FHA; however, no legislation has been enacted. The Administration has indicated that the conservatorship of the GSEs should end; however, it is unclear whether and when that would occur and how that would impact us. As a result of the matters referred to above, it is uncertain what role the GSEs, FHA and private capital, including private mortgage insurance, will play in the residential housing finance system in the future or the impact of any such changes on our business. In addition, the timing of the impact of any resulting changes on our business is uncertain. Most meaningful changes would require Congressional action to implement and it is difficult to estimate when Congressional action would be final and how long any associated phase-in period may last.
We may not continue to meet the GSEs’ private mortgage insurer eligibility requirements and our returns may decrease as we are required to maintain more capital in order to maintain our eligibility.
We must comply with the PMIERs to be eligible to insure loans purchased by the GSEs. The PMIERs include financial requirements, as well as business, quality control and certain transaction approval requirements. The financial requirements of the PMIERs require a mortgage insurer’s “Available Assets” (generally only the most liquid assets of an insurer) to equal or exceed its “Minimum Required Assets” (which are based on an insurer’s book of business and are calculated from tables of factors with several risk dimensions and are subject to a floor amount). Based on our interpretation of the PMIERs,force as of December 31, 2017, MGIC’s Available Assets totaled $4.8 billion, or $0.8 billion in excess of its Minimum Required Assets. MGIC is in compliance with the PMIERs and eligible to insure loans purchased by the GSEs.
If MGIC ceases to be eligible to insure loans purchased by one or both of the GSEs, it would significantly reduce the volume of our new business writings. Factors that may negatively impact MGIC’s ability to continue to comply with the financial requirements of the PMIERs include the following:
On December 18, 2017, we received a summary of proposed changes to the PMIERs that are being recommended to the FHFA by the GSEs. Once the PMIERs are finalized, we expect a six-month implementation period before the revised PMIERs are effective. We expect that effectiveness will not be earlier than the fourth quarter of 2018.
If the GSE-recommended changes are adopted with an effective date in the fourth quarter of 2018, we expect that at the effective date, MGIC would continue to have an excess of Available Assets over Minimum Required Assets, although this excess would be materially lower than it was at December 31, 2017 under the existing PMIERs, and that MGIC would continue to be able to pay quarterly dividends to our holding company at the $50 million quarterly rate at which2022) because they were paid in the fourth quarter of 2017. As a result, we expect cash at our holding company at December 31, 2018 would increase over its December 31, 2017 level.
We have non-disclosure obligations to each of the GSEs and cannot provide further comment on the specific provisions of the GSE-recommended changes other than as described above. Until the GSEs and/or FHFA provide public disclosure of proposed or final changes to the existing PMIERs, we do not plan to update or correct anyhave the same sources of the disclosure above or provide any additional disclosure regarding any modificationsliquidity that may occur in the GSE-recommended changes to PMIERs.
MGIC Investment Corporation 2017 Form 10-K | 35
|
| | | | | | | | | | | | | | | |
| | | | | | | | | | | | | | | |
MGIC Investment Corporation
2017 Form 10-K
| | | | | | | | | | | | | | | |
Risk factors (continued) |
Our future operating results may be negatively impacted by the matters discussed in the rest of these risk factors. Such matters could decrease our revenues, increase our losses or require the use of assets, thereby creating a shortfall in Available Assets.
Should capital be needed by MGIC in the future, capital contributions from our holding company may not be available due to competing demands on holding company resources, including for repayment of debt.bank servicers have.
While on an overall basis, the amount of Available Assets MGIC must holdthere has been no disruption in order to continue to insure GSE loans increased under the PMIERs over what state regulation currently requires, our reinsurance transactions mitigate the negative effect of the PMIERs on our returns. In this regard, see the first bullet point above. In addition, reinsurance may not always be available to us or available on similar terms, and it subjects us to counterparty credit risk.
The benefit of our net operating loss carryforwards may become substantially limited.
As of December 31, 2017, we had approximately $742.1 million of net operating losses for tax purposes that we can use in certain circumstances to offset future taxable income and thus reduce our federal income tax liability. Any unutilized carryforwards are scheduled to expire atpremium receipts through the end of tax years 2032 through 2033. Our ability to utilize these net operating losses to offset2022, servicers who experience future taxable incomeliquidity issues may be significantly limitedless likely to advance premiums to us on policies covering delinquent loans or to remit premiums on policies covering loans that are not delinquent. Our policies generally allow us to cancel coverage on loans that are not delinquent if the premiums are not paid within a grace period.
An increase in delinquent loans or a transfer of servicing resulting from liquidity issues, may increase the operational burden on servicers, cause a disruption in the servicing of delinquent loans and reduce servicers’ abilities to undertake mitigation efforts that could help limit our losses.
The information presented in this report and on our website with respect to the mortgage loans we experience an “ownership change” as defined in Section 382insure is based on information reported to us by third parties, including the servicers and originators of the Internal Revenue Code of 1986, as amended (the “Code”). In general, an ownership change will occur if there is a cumulative change in our ownership by “5-percent shareholders” (as defined in the Code) that exceeds 50 percentage points over a rolling three-year period. A corporation that experiences an ownership change will generallymortgage loans, and information presented may be subject to an annual limitation on the corporation’s subsequent use of net operating loss carryovers that aroselapses or inaccuracies in reporting from pre-ownership change periods and use of losses that are subsequently recognized with respect to assets that had a built-in-loss on the date of the ownership change. The amount of the annual limitation generally equals the fair value of the corporation immediately before the ownership change multiplied by the long-term tax-exempt interest rate (subject to certain adjustments). To the extent that the limitation in a post-ownership-change year is not fully utilized, the amount of the limitation for the succeeding year will be increased.
While we have adopted our Amended and Restated Rights Agreement to minimize the likelihood of transactions in our stock resulting in an ownership change, future issuances of equity-linked securities or transactions in our stock and equity-linked securities that may not be within our control may cause us to experience an ownership change. If we experience an ownership change,such third parties. In many cases, we may not be ableaware that information reported to fully utilize our net operating losses, resulting in additional income taxes and a reduction in our shareholders’ equity.
We are involved in legal proceedings and are subject to the risk of additional legal proceedings in the future.
Before paying an insurance claim, we review the loan and servicing files to determine the appropriateness of the claim amount. When reviewing the files, we may determine that we have the right to rescind coverage on the loan. In our SEC reports, we refer to insurance rescissions and denials of claims collectivelyus is incorrect until such time as “rescissions” and variations of that term. In addition, our insurance policies generally provide that we can reduce or deny a claim ifis made against us under the servicer did not comply with its obligations under ourrelevant insurance policy. We calldo not consistently receive monthly policy status information from servicers for single premium policies, and may not be aware that the mortgage loans insured by such reduction of claims “curtailments.” In recent quarters, an immaterial percentage of claims received in a quarterpolicies have been resolved by rescissions. In each of 2016 and 2017, curtailments reduced our average claim paid by approximately 5.5% and 5.6%, respectively.
Our loss reserving methodology incorporates our estimates of future rescissions, curtailments, and reversals of rescissions and curtailments. A variance between ultimate actual rescission, curtailment and reversal rates and our estimates, as a result of the outcome of litigation, settlements or other factors, could materially affect our losses.
When the insured disputes our right to rescind coverage or curtail claims, we generally engage in discussions in anrepaid. We periodically attempt to settle the dispute. If we are unable to reach a settlement, the outcome of a dispute ultimately would be determined by legal proceedings.determine if coverage is still in force on
MGIC Investment Corporation 20172022 Form 10-K | 3631
|
| | | | | | | | | | | | | | | |
| | | | | | | | | | | | | | | |
MGIC Investment Corporation
2017 Form 10-K
| | | | | | | | | | | | | | | |
Risk factors (continued) |
Under ASC 450-20, until a liability associated with settlement discussions or legal proceedings becomes probable and can be reasonably estimated, we consider our claim payment or rescission resolved for financial reporting purposes and do not accrue an estimated loss. Where we have determined that a loss is probable and can be reasonably estimated, we have recorded our best estimate of our probable loss. If we are not able to implement settlements we consider probable, we intend to defend MGIC vigorously against any related legal proceedings.
In addition to matters for which we have recorded a probable loss, we are involved in other discussions and/or proceedings with insureds with respect to our claims paying practices. Although it is reasonably possible that when these matters are resolved we will not prevail in all cases, we are unable to make a reasonable estimate or range of estimates of the potential liability. We estimate the maximum exposure associated with matters where a loss is reasonably possible to be approximately $285 million, although we believe (but can give no assurance that) we will ultimately resolve these matters for significantly less than this amount. This estimate of our maximum exposure does not include interest or consequential or exemplary damages.
Mortgage insurers, including MGIC, have been involved in litigation and regulatory actions related to alleged violations of the anti-referral fee provisions of the Real Estate Settlement Procedures Act, which is commonly known as RESPA, and the notice provisions of the Fair Credit Reporting Act, which is commonly known as FCRA. While these proceedings in the aggregate have not resulted in material liability for MGIC, there can be no assurance that the outcome of future proceedings, if any, under these laws would not have a material adverse affect on us. In addition, various regulators, including the CFPB, state insurance commissioners and state attorneys general may bring other actions seeking various forms of relief in connection with alleged violations of RESPA. The insurance law provisions of many states prohibit paying for the referral of insurance business and provide various mechanisms to enforce this prohibition. While we believe our practices are in conformity with applicable laws and regulations, it is not possible to predict the eventual scope, duration or outcome of any such reviews or investigations nor is it possible to predict their effect on us or the mortgage insurance industry.
In addition to the matters described above, we are involved in other legal proceedings in the ordinary course of business. In our opinion, based on the facts known at this time, the ultimate resolution of these ordinary course legal proceedings will not have a material adverse effect on our financial position or results of operations.
We are subject to comprehensive regulation and other requirements, which we may fail to satisfy.
We are subject to comprehensive, detailed regulation by state insurance departments. These regulations are principally designed for the protection of our insured policyholders, rather than for the benefit of investors. Although their scope varies, state insurance laws generally grant broad supervisory powers to agencies or officials to examine insurance companies and enforce rules or exercise discretion affecting almost every significant aspect of the insurance business. State insurance regulatory authorities could take actions, including changes in capital requirements, that could have a material adverse effect on us. For more information about state capital requirements, see our risk factor titled “State capital requirements may prevent us from continuing to write new insurance on an uninterrupted basis.” To the extent that we are construed to make independent credit decisions in connection with our contract underwriting activities, we also could be subject to increased regulatory requirements under the Equal Credit Opportunity Act, commonly known as ECOA, FCRA, and other laws. For more details about the various ways in which our subsidiaries are regulated, see “Regulation” in Item 1 of this Annual Report. In addition to regulation by state insurance regulators, the CFPB may issue additional rules or regulations, which may materially affect our business.
In December 2013, the U.S. Treasury Department’s Federal Insurance Office released a report that calls for federal standards and oversight for mortgage insurers to be developed and implemented. It is uncertain if and when the standards and oversight will become effective and what form they will take.
Resolution of our dispute with the Internal Revenue Service could adversely affect us.
The Internal Revenue Service (“IRS”) completed examinations of our federal income tax returns for the years 2000 through 2007 and issued proposed assessments for taxes, interest and penalties related to our treatment
MGIC Investment Corporation 2017 Form 10-K | 37and Subsidiaries
|
| | | | | | | | | | | | | | | |
| | | | | | | | | | | | | | | |
MGIC Investment Corporation
2017 Form 10-K
| | | | | | | | | | | | | | | |
Risk factors (continued) |
such policies by asking the last servicer of record or through the flow-through income and loss from an investment in a portfolioperiodic reconciliation of residual interests of Real Estate Mortgage Investment Conduits (“REMICs”). The IRS indicatedloan information with certain servicers. It may be possible that it did not believe that, for various reasons, we had established sufficient tax basis in the REMIC residual interests to deduct the losses from taxable income. We appealed these assessments within the IRS and in August 2010, we reached a tentative settlement agreement with the IRS which was not finalized.
In 2014, we received Notices of Deficiency (commonly referred to as “90 day letters”) covering the 2000-2007 tax years. The Notices of Deficiency reflect taxes and penalties related to the REMIC matters of $197.5 million and at December 31, 2017, there would also be interest related to these matters of approximately $205.0 million. In 2007, we made a payment of $65.2 million to the United States Department of the Treasury which will reduce any amounts we would ultimately owe. The Notices of Deficiency also reflect additional amounts due of $261.4 million, which are primarily associated with the disallowance of the carryback of the 2009 net operating loss to the 2004-2007 tax years. We believe the IRS included the carryback adjustments as a precaution to keep open the statute of limitations on collection of the tax that was refunded when this loss was carried back, and not because the IRS actually intends to disallow the carryback permanently. Depending on the outcome of this matter, additional state income taxes and state interest may become due when a final resolution is reached. As of December 31, 2017, those state taxes and interest would approximate $85.8 million. In addition, there could also be state tax penalties. Our total amount of unrecognized tax benefits as of December 31, 2017 is $142.8 million, which represents the tax benefits generated by the REMIC portfolio included in our tax returns that we have not taken benefit for in our financial statements, including any related interest.
We filed a petition with the U.S. Tax Court contesting most of the IRS’ proposed adjustments reflected in the Notices of Deficiency and the IRS filed an answer to our petition which continued to assert their claim. The case has twice been scheduled for trial and in each instance, the parties jointly filed, and the U.S. Tax Court approved (most recently in February 2016), motions for continuance to postpone the trial date. Also in February 2016, the U.S. Tax Court approved a joint motion to consolidate for trial, briefing, and opinion, our case with similar cases of Radian Group, Inc., as successor to Enhance Financial Services Group, Inc., et al. The parties have reached agreement on all issues in the case and in the fourth quarter of 2017, the IRS submitted documentation reflecting the terms of the agreement to the Joint Committee on Taxation (“JCT”) for its review, which must be performed before a settlement can be completed. There is no assurance that a settlement will be completed. Based on information that we currently have regarding the status of our ongoing dispute, we recorded a provision for additional taxes and interest of $29.0 million in 2017.
Should a settlement not be completed, ongoing litigation to resolve our dispute with the IRS could be lengthy and costly in terms of legal fees and related expenses. We would need to make further adjustments, which could be material, to our tax provision and liabilities if our view of the probability of success in this matter changes, and the ultimate resolution of this matter could have a material negative impact on our effective tax rate, results of operations, cash flows, available assets and statutory capital. In this regard, see our risk factors titled “We may notreports continue to meet the GSEs’ privatereflect, as active, policies on mortgage insurer eligibility requirements and our returns may decrease as we are requiredloans that have been repaid.
Risk Factors Relating to maintain more capital in order to maintain our eligibility” and “State capital requirements may prevent us from continuing to write new insurance on an uninterrupted basis.”Our Business Generally
If our risk management programs are not effective in identifying, or adequate in controlling or mitigating, the risks we face, or if the models used in our businesses are inaccurate, it could have a material adverse impact on our business, results of operations and financial condition.
Our enterprise risk management program, described in "Business - Our Products and Services - Risk Management" in Item 1, may not be effective in identifying, or adequate in controlling or mitigating, the risks we face in our business.
We employ proprietary and third partythird-party models to project returns, pricefor a wide range of purposes, including the following: projecting losses, premiums, expenses, and returns; pricing products calculate reserves, generate projections(through our risk-based pricing system); determining the techniques used to estimate future pre-tax income and to evaluate loss recognition testing, evaluate risk, determineunderwrite insurance; estimating reserves; evaluating risk; determining internal capital requirements, performrequirements; and performing stress testing, and for other uses.testing. These models rely on estimates, projections, and projectionsassumptions that are inherently uncertain and may not always operate as intended. This can be especially true when extraordinary events occur, such as the COVID-19 pandemic, the Russia-Ukraine war, periods of extreme inflation, or environmental disasters related to changing climatic conditions. In addition, from timeour models are being continuously updated over time. Changes in models or model assumptions could lead to time we seek to improve certain models, and the conversion process may result in material changes to assumptions, including those aboutin our future expectations, returns, andor financial results. The models we employ are complex, which
MGIC Investment Corporation 2017 Form 10-K | 38
|
| | | | | | | | | | | | | | | |
| | | | | | | | | | | | | | | |
MGIC Investment Corporation
2017 Form 10-K
| | | | | | | | | | | | | | | |
Risk factors (continued) |
increases could increase our risk of error in their design, implementation, or use. Also, the associated input data, assumptions, and calculations may not always be correct or accurate and the controls we have in place to mitigate that riskthese risks may not be effective in all cases. The risks related to our models may increase when we change assumptions, and/or methodologies, or when we add or change modeling platforms. We have enhanced, and we intend to continue to enhance, our modeling capabilities. Moreover, we may use information we receive through enhancements to refine or otherwise change existing assumptions and/or methodologies.
Because we establish loss reserves only upon a loan delinquency rather than based
Information technology system failures or interruptions may materially impact our operations and adversely affect our financial results.
We are heavily dependent on estimatesour information technology systems to conduct our business. Our ability to efficiently operate our business depends significantly on the reliability and capacity of our ultimate lossessystems and technology. The failure of our systems and technology to operate effectively could affect our ability to provide our products and services to customers, reduce efficiency, or cause delays in operations. Significant capital investments might be required to remediate any such problems. We are also dependent on riskour ongoing relationships with key technology providers, including provisioning of their products and technologies, and their ability to support those products and technologies. The inability of these providers to successfully provide and support those products could have an adverse impact on our business and results of operations.
We are in force, lossesthe process of upgrading certain information systems, and transforming and automating certain business processes, and we continue to enhance our risk-based pricing system and our system for evaluating risk. Certain information systems have
been in place for a number of years and it has become increasingly difficult to support their operation. The implementation of technological and business process improvements, as well as their integration with customer and third-party systems when applicable, is complex, expensive and time consuming. If we fail to timely and successfully implement and integrate the new technology systems, if the third party providers upon which we are reliant do not perform as expected, if our legacy systems fail to operate as required, or if the upgraded systems and/or transformed and automated business processes do not operate as expected, it could have a material adverse impact on our business, business prospects and results of operations.
We could be materially adversely affected by a cyber security breach or failure of information security controls.
As part of our business, we maintain large amounts of confidential and proprietary information, including personal information of consumers and employees, on our servers and those of cloud computing services. Federal and state laws designed to promote the protection of such information require businesses that collect or maintain personal information to adopt information security programs, and to notify individuals, and in some jurisdictions, regulatory authorities, of security breaches involving personally identifiable information. All information technology systems are potentially vulnerable to damage or interruption from a variety of sources, including by cyber attacks, such as those involving ransomware. The Company discovers vulnerabilities and regularly blocks a high volume of attempts to gain unauthorized access to its systems. Globally, attacks are expected to continue accelerating in both frequency and sophistication with increasing use by actors of tools and techniques that will hinder the Company’s ability to identify, investigate and recover from incidents. Such attacks may also increase as a result of retaliation by Russia in response to actions taken by the U.S. and other countries in connection with Russia's military invasion of Ukraine. The Company operates under a hybrid workforce model and such model may be more vulnerable to security breaches.
While we have information security policies and systems in place to secure our information technology systems and to prevent unauthorized access to or disclosure of sensitive information, there can be no assurance with respect to our systems and those of our third-party vendors that unauthorized access to the systems or disclosure of the sensitive information, either through the actions of third parties or employees, will not occur. Due to our reliance on information technology systems, including ours and those of our customers and third-party service providers, and to the sensitivity of the information that we maintain, unauthorized access to the systems or disclosure of the information could adversely affect our reputation, severely disrupt our operations, result in a loss of business and expose us to material claims for damages and may require that we provide free credit monitoring services to individuals affected by a security breach.
Should we experience an unauthorized disclosure of information or a cyber attack, including those involving ransomware, some of the costs we incur may not be recoverable through insurance, or legal or other processes, and this may have a disproportionatematerial adverse effect on our earnings in certain periods.results of operations.
In accordance with accounting principles generally accepted in the United States, commonly referred to as GAAP,
MGIC Investment Corporation 2022 Form 10-K | 32
MGIC Investment Corporation and Subsidiaries
The mix of business we establish reserves for insurance losses and loss adjustment expenses only when notices of default on insured mortgage loans are received and for loans we estimate are in default but for which notices of default have not yet been reported to us by the servicers (this is often referred to as “IBNR”). Because our reserving method does not take account of losses that could occur from loans that are not delinquent, such losses are not reflected in our financial statements, except in the case where a premium deficiency exists. As a result, future losses on loans that are not currently delinquent may have a material impact on future results as such losses emerge.
Recent hurricanes may impact our incurred losses, the amount and timing of paid claims, our inventory of notices of default andwrite affects our Minimum Required Assets under PMIERs.the PMIERs, our premium yields and the likelihood of losses occurring.
The numberMinimum Required Assets under the PMIERs are, in part, a function of borrowers missing theirthe direct risk-in-force and the risk profile of the loans we insure, considering LTV ratio, credit score, vintage, Home Affordable Refinance Program ("HARP") status and delinquency status; and whether the loans were insured under lender-paid mortgage paymentsinsurance policies or other policies that are not subject to automatic termination consistent with the Homeowners Protection Act requirements for borrower-paid mortgage insurance. Therefore, if our direct risk-in-force increases through increases in the areas affected by recent hurricanes in Texas, Florida and Puerto Rico has increased. Despite the associated increase inNIW, or if our inventorymix of notices of default, based on our analysis and past experience, we do not expect the recent hurricane activitybusiness changes to result in a material increase in our incurred lossesinclude loans with higher LTV ratios or paid claims. However, the following factors could cause our actual results to differ from our expectation in the forward looking statement in the preceding sentence:
Third party reports that indicate the extent of flooding in the hurricane-affected areas may be understated.
Home values in hurricane-affected areas may decrease at the time claims are filed from their current levels thereby adversely affecting our ability to mitigate loss.
Hurricane-affected areas may experience deteriorating economic conditions resulting in more borrowers defaulting on their loans in the future (or failing to cure existing defaults) than we currently expect.
If an insured contests our claim denial or curtailment, there can be no assurancelower FICO scores, for example, all other things equal, we will prevail. We describe how claims under our policy are affected by damagebe required to the borrower’s homehold more Available Assets in our Current Report on Form 8-K filed with the SEC on September 14, 2017.
Due to the suspension of certain foreclosures by the GSEs, our receipt of claims associated with foreclosed mortgages in the hurricane-affected areas may be delayed.
The PMIERs require usorder to maintain significantly more "Minimum Required Assets" for delinquent loans than for performing loans. An increase in default notices may result in an increase in "Minimum Required Assets" and a decrease in the levelGSE eligibility.
The percentage of our excess "Available Assets" which isNIW from all single premium policies was 4.3% in 2022 and 7.4% in 2021, and has ranged from 4.3% in 2022 to 19.0% in 2017. Depending on the actual life of a single premium policy and its premium rate relative to that of a monthly premium policy, a single premium policy may generate more or less premium than a monthly premium policy over its life.
As discussed in our risk factor titled "Reinsurance may not always be available or its cost may increase," we have in place various QSR transactions. Although the transactions reduce our premiums, they have a lesser impact on our overall results, as losses ceded under the transactions reduce our losses incurred and the ceding commissions we receive reduce our underwriting expenses. The effect of the QSR transactions on the various components of pre-tax income will vary from period to period, depending on the level of ceded losses incurred. We also have in place various XOL reinsurance transactions under which we cede premiums. Under the XOL reinsurance transactions, for the respective reinsurance coverage periods, we retain the first layer of aggregate losses and the reinsurers provide second layer coverage up to the outstanding reinsurance coverage amount.
In addition to the effect of reinsurance on our premiums, we expect a decline in our premium yield because an increasing percentage of our insurance in force is from recent book years whose premium rates had been trending lower.
Our ability to rescind insurance coverage became more limited for new insurance written beginning in mid-2012, and it became further limited for new insurance written under our revised master policy that became effective March 1, 2020. These limitations may result in higher losses paid than would be the case under our previous master policies. In addition, our rescission rights temporarily have become more limited due to accommodations we made in connection with the COVID-19 pandemic. We waived our rescission rights in certain circumstances where the failure to make payments was associated with a COVID-19 pandemic-related forbearance.
From time to time, in response to market conditions, we change the types of loans that we insure. We also may change our underwriting guidelines, including by agreeing with certain approval recommendations from a GSE automated underwriting system. We also make exceptions to our underwriting requirements on a loan-by-loan basis and for certain customer programs. Our underwriting requirements are available on our website at http://www.mgic.com/underwriting/index.html.
Even when home prices are stable or rising, mortgages with certain characteristics have higher probabilities of claims. As of December 31, 2022, mortgages with these characteristics in our primary risk in force included mortgages with LTV ratios greater than 95% (15.0%), mortgages with borrowers having FICO scores below 680 (7.2%), including those with borrowers having FICO scores of 620-679 (6.2%), mortgages with limited underwriting, including limited borrower documentation (0.8%), and mortgages with borrowers having DTI ratios greater than 45% (or where no ratio is available) (15.6%), each attribute as determined at the time of loan origination. Loans with more than one of these attributes accounted for 4.4% of our primary risk in force as of December 31, 2022, and 4.1% of our primary risk in force as of December 31, 2021. When home prices increase, interest rates increase and/or the percentage of our NIW from purchase transactions increases, our NIW on mortgages with higher LTV ratios and higher DTI ratios may increase. Our NIW on mortgages with LTV ratios greater than 95% increased from 11% in 2021 to 12% in 2022 and our NIW on mortgages with DTI ratios greater than 45% increased from 14% in 2021 to 21% in 2022.
From time to time, we change the processes we use to underwrite loans. For example: we rely on information provided to us by lenders that was obtained from certain of the GSEs’ automated appraisal and income verification tools, which may produce results that differ from the results that would have been determined using different methods; we accept GSE appraisal waivers for certain refinance loans, the numbers of which have increased significantly beginning in 2020; and we accept GSE appraisal flexibilities that allow property valuations in certain transactions to be based on appraisals that do not involve an onsite or interior inspection of the property. Our acceptance of automated GSE appraisal and income verification tools, GSE appraisal waivers and GSE appraisal flexibilities may affect our pricing and risk assessment. We also continue to further automate our underwriting processes and it is possible that our automated processes result in our insuring loans that we would not otherwise have insured under our prior processes.
Approximately 72% of our 2022 and 72% of our 2021 NIW was originated under delegated underwriting programs pursuant to which the loan originators had authority on our behalf to underwrite the loans for our mortgage insurance. For loans originated through a delegated underwriting program, we depend on the originators' compliance with our guidelines and rely on the originators' representations that the loans being insured satisfy the underwriting guidelines, eligibility criteria and other requirements. While we have established systems and processes to monitor whether certain aspects of our underwriting guidelines were being followed by the originators, such systems may not ensure that the guidelines were being strictly followed at the time the loans were originated.
The widespread use of risk-based pricing systems by the private mortgage insurance industry (discussed in our risk factor titled "Competition or changes in our relationships with our customers could reduce our revenues, reduce our premium yields and / or increase our losses") makes it more difficult to compare our premium rates to those offered by our competitors. We may not be aware of industry rate changes until we observe that our mix of new insurance written has changed and our mix may fluctuate more as a result.
If state or federal regulations or statutes are changed in ways that ease mortgage lending standards and/or requirements, or if
MGIC Investment Corporation 2022 Form 10-K | 33
MGIC Investment Corporation and Subsidiaries
lenders seek ways to replace business in times of lower mortgage originations, it is possible that more mortgage loans could be originated with higher risk characteristics than are currently being originated, such as loans with lower FICO scores and higher DTI ratios. The focus of the new FHFA leadership on increasing homeownership opportunities for borrowers is likely to have this effect. Lenders could pressure mortgage insurers to insure such loans, which are expected to experience higher claim rates. Although we attempt to incorporate these higher expected claim rates into our underwriting and pricing models, there can be no assurance that the premiums earned and the associated investment income will be adequate to compensate for actual losses paid even under our current underwriting requirements.
The premiums we charge may not be adequate to compensate us for our liabilities for losses and as a result any inadequacy could materially affect our financial condition and results of operations.
When we set our premiums at policy issuance, we have expectations regarding likely performance of the insured risks over the long term. Generally, we cannot cancel mortgage insurance coverage or adjust renewal premiums during the life of a policy. As a result, higher than anticipated claims generally cannot be offset by premium increases on policies in force or mitigated by our non-renewal or cancellation of insurance coverage. Our premiums are subject to approval by state regulatory agencies, which can delay or limit our ability to increase premiums on future policies. In addition, our customized rate plans may delay our ability to increase premiums on future policies covered by such plans. The premiums we charge, the investment income we earn and the amount of reinsurance we carry may not be adequate to compensate us for the risks and costs associated with the insurance coverage provided to customers. An increase in the number or size of claims, compared to what we anticipated when we set the premiums, could adversely affect our results of operations or financial condition. Our premium rates are also based in part on the amount of capital we are required to hold against the insured risk. If the amount of capital we are required to hold increases from the amount we were required to hold when we set the premiums, our returns may be lower than we assumed. For a discussion of the amount of capital we are required to hold, see our risk factor titled "We may not continue to meet the GSEs’ private mortgage insurer eligibility requirements and our returns may decrease asif we are required to maintain more capital in order to maintain our eligibility."
Because loss reserve estimates are subject to uncertainties, paid claims may be substantially different than our loss reserves.
When we establish reserves, we estimate the ultimate loss on delinquent loans using estimated claim rates and claim amounts. The estimated claim rates and claim amounts represent our best estimates of what we will actually pay on the loans in default as of the reserve date and incorporate anticipated mitigation from
MGIC Investment Corporation 2017 Form 10-K | 39
|
| | | | | | | | | | | | | | | |
| | | | | | | | | | | | | | | |
MGIC Investment Corporation
2017 Form 10-K
| | | | | | | | | | | | | | | |
Risk factors (continued) |
rescissions and curtailments. The establishment of loss reserves is subject to inherent uncertainty and requires judgment by management. The actual amount of the claim payments may be substantially different than our loss reserve estimates. Our estimates could be affected by several factors, including a change in regional or national economic conditions, and a change in the length of time loans are delinquent before claims are received. The change in conditions may include changes in unemployment, affecting borrowers’ income and thus their ability to make mortgage payments, and changes in home prices, which may affect borrower willingness to continue to make mortgage payments when the value of the home is below the mortgage balance. Changes to our estimates could have a material impact on our future results, even in a stable economic environment. In addition, historically, losses incurred have followed a seasonal trend in which the second half of the year has weaker credit performance than the first half, with higher new default notice activity and a lower cure rate.
We rely on our management team and our business could be harmed if we are unable to retain qualified personnel or successfully develop and/or recruit their replacements.
Our success depends, in part, on the skills, working relationships and continued services of our management team and other key personnel. The unexpected departure of key personnel could adversely affect the conduct of our business. In such event, we would be required to obtain other personnel to manage and operate our business. In addition, we will be required to replace the knowledge and expertise of our aging workforce as our workers retire. In either case, there can be no assurance that we would be able to develop or recruit suitable replacements for the departing individuals; that replacements could be hired, if necessary, on terms that are favorable to us; or that we can successfully transition such replacements in a timely manner. We currently have not entered into any employment agreements with our officers or key personnel. Volatility or lack of performance in
our stock price may affect our ability to retain our key personnel or attract replacements should key personnel depart. Without a properly skilled and experienced workforce, our costs, including productivity costs and costs to replace employees may increase, and this could negatively impact our earnings.
IfCompetition or changes in our relationships with our customers could reduce our revenues, reduce our premium yields and / or increase our losses.
The private mortgage insurance industry is highly competitive and is expected to remain so. We believe we currently compete with other private mortgage insurers based on premium rates, underwriting requirements, financial strength (including based on credit or financial strength ratings), customer relationships, name recognition, reputation, strength of management teams and field organizations, the volumeancillary products and services provided to lenders, and the effective use of low down payment hometechnology and innovation in the delivery and servicing of our mortgage originations declines,insurance products.
Our relationships with our customers, which may affect the amount of our NIW, could be adversely affected by a variety of factors, including if our premium rates are higher than those of our competitors, our underwriting requirements are more restrictive than those of our competitors, or our customers are dissatisfied with our claims-paying practices (including insurance policy rescissions and claim curtailments).
In recent years, the industry has materially reduced its use of standard rate cards, which were fairly consistent among competitors, and correspondingly increased its use of (i) pricing systems that we write could decline.
The factorsuse a spectrum of filed rates to allow for formulaic, risk-based pricing based on multiple attributes that may affectbe quickly adjusted within certain parameters, and (ii) customized rate plans, both of which typically have rates lower than the volumestandard rate card. Our increased use of low down payment mortgage originations include:
restrictions on mortgage credit due to more stringent underwriting standards, liquidity issues or risk-retention and/or capital requirements affecting lenders,
reinsurance over the level of home mortgage interest rates,
the health of the domestic economy as well as conditions in regional and local economiespast several years, and the levelimproved credit profile and reduced loss expectations associated with loans insured after 2008, have helped to mitigate the negative effect of consumer confidence,
housing affordability,
new and existing housing availability,
the rate of household formation, which is influenced, in part, by population and immigration trends,
the rate of home price appreciation, which in times of heavy refinancing can affect whether refinanced loans have loan-to-value ratios that require private mortgage insurance, and
government housing policy encouraging loansdeclining premium rates on our expected returns. However, refer to first-time homebuyers.
A decline in the volume of low down payment home mortgage originations could decrease demand for mortgage insurance and decrease our new insurance written. For other factors that could decrease the demand for mortgage insurance, see our risk factor titled "Reinsurance may not always be available or its cost may increase" for a discussion of the risks associated with the availability of reinsurance, and our risk factors titled “Downturns in the domestic economy or declines in home prices may result in more homeowners defaulting and our losses increasing, with a corresponding decrease in our returns,” and “Pandemics, hurricanes and other natural disasters may impact our incurred losses, the amount and timing of paid claims, our inventory of notices of default and our Minimum Required Assets under PMIERs” for a discussion about risks associated with our NIW.
The widespread use of risk-based pricing systems by the private mortgage insurance industry makes it more difficult to compare our rates to those offered by our competitors. We may not be aware of industry rate changes until we observe that our volume of NIW has changed. In addition, business under customized rate plans is awarded by certain customers for only limited periods of time. As a result, our NIW may fluctuate more than it had in the past. Regarding the concentration of our new business, our top ten customers accounted for approximately 33% and 36% in the twelve months ended December 31, 2022 and December 31, 2021, respectively.
We monitor various competitive and economic factors while seeking to balance both profitability and market share considerations in developing our pricing strategies. Premium
MGIC Investment Corporation 2022 Form 10-K | 34
MGIC Investment Corporation and Subsidiaries
rates on NIW will change our premium yield (net premiums earned divided by the average insurance in force) over time as older insurance policies run off and new insurance policies with premium rates that are generally lower are written.
Certain of our competitors have access to capital at a lower cost than we do (including, through off-shore intercompany reinsurance vehicles, which have tax advantages that may increase if U.S. corporate income taxes increase). As a result, they may be able to achieve higher after-tax rates of return on their NIW compared to us, which could allow them to leverage reduced premium rates to gain market share, and they may be better positioned to compete outside of traditional mortgage insurance, including by participating in alternative forms of credit enhancement pursued by the GSEs discussed in our risk factor titled "The amount of insurance we write could be adversely affected if lenders and investors select alternatives to private mortgage insurance."
Although the current PMIERs of the GSEs do not require an insurer to maintain minimum financial strength ratings, our financial strength ratings can affect us in the ways set forth below. If we are unable to compete effectively in the current or any future markets as a result of the financial strength ratings assigned to our insurance subsidiaries, our future NIW could be negatively affected.
•A downgrade in our financial strength ratings could result in increased scrutiny of our financial condition by the GSEs and/or our customers, potentially resulting in a decrease in the amount of our NIW.
•Our ability to participate in the non-GSE residential mortgage-backed securities market (the size of which has been limited since 2008, but may grow in the future), could depend on our ability to maintain and improve our investment grade ratings for our insurance subsidiaries. We could be competitively disadvantaged with some market participants because the financial strength ratings of our insurance subsidiaries are lower than those of some competitors. MGIC's financial strength rating from A.M. Best is A- (with a stable outlook), from Moody’s is A3 (with a stable outlook) and from Standard & Poor’s is BBB+ (with a stable outlook).
•Financial strength ratings may also play a greater role if the GSEs no longer operate in their current capacities, for example, due to legislative or regulatory action. In addition, although the PMIERs do not require minimum financial strength ratings, the GSEs consider financial strength ratings to be important when using forms of credit enhancement other than traditional mortgage insurance, as discussed in our risk factor titled "The amount of insurance we write could be adversely affected if lenders and investors select alternatives to private mortgage insurance.”" The final GSE capital framework provides more capital credit for transactions with higher rated counterparties, as well as those who are diversified. Although we are currently unaware of a direct impact on MGIC, this could potentially become a competitive disadvantage in the future.
MGIC Investment Corporation 2017 Form 10-K | 40
|
| | | | | | | | | | | | | | | |
| | | | | | | | | | | | | | | |
MGIC Investment Corporation
2017 Form 10-K
| | | | | | | | | | | | | | | |
Risk factors (continued) |
State capital requirements may prevent us from continuing to write new insurance on an uninterrupted basis.
The insurance laws of 16 jurisdictions, including Wisconsin, MGIC's domiciliary state, require a mortgage insurer to maintain a minimum amount of statutory capital relativeStandard & Poor’s is considering changes to its rating methodologies for insurers, including mortgage insurers. It is uncertain what impact the changes will have, whether they will prompt similar moves at other rating agencies, or the extent to which they will impact how external parties evaluate the different rating levels.
We are subject to the risk in force (or a similar measure) in order forof legal proceedings.
Before paying an insurance claim, generally we review the mortgage insurerloan and servicing files to continue to write new business. We refer to these requirements asdetermine the “State Capital Requirements.” While they vary among jurisdictions, the most common State Capital Requirements allow for a maximum risk-to-capital ratio of 25 to 1. A risk-to-capital ratio will increase if (i) the percentage decrease in capital exceeds the percentage decrease in insured risk, or (ii) the percentage increase in capital is less than the percentage increase in insured risk. Wisconsin does not regulate capital by using a risk-to-capital measure but instead requires a minimum policyholder position (“MPP”). The “policyholder position” of a mortgage insurer is its net worth or surplus, contingency reserve and a portionappropriateness of the reserves for unearned premiums.
At December 31, 2017, MGIC’s risk-to-capital ratio was 9.5claim amount. When reviewing the files, we may determine that we have the right to 1, belowrescind coverage or deny a claim on the maximum allowed byloan (both referred to herein as “rescissions”). In addition, our insurance policies generally provide that we can reduce a claim if the jurisdictionsservicer did not comply with State Capital Requirements, and its policyholder position was $2.1 billion above the required MPP of $1.2 billion. In calculating our risk-to-capital ratio and MPP, we are allowed full credit for the risk cededobligations under our reinsurance transactionsinsurance policy (such reduction referred to as a “curtailment”). In recent years, an immaterial percentage of claims received have been resolved by rescissions. In 2022 and in 2021, curtailments reduced our average claim paid by approximately 6.3% and 4.4%, respectively. The COVID-19-related foreclosure moratoriums and forbearance plans, along with a groupincreased home prices, resulted in decreased claims paid activity beginning in the second quarter of unaffiliated reinsurers.2020. It is possible that underdifficult to predict the revised State Capital Requirements discussed below, MGIC will not be allowed full credit for the risk ceded to the reinsurers. If MGIC is not allowed an agreed level of credit under eithercurtailments once foreclosure activity returns to a more typical level. Our loss reserving methodology incorporates our estimates of future rescissions, curtailments, and reversals of rescissions and curtailments. A variance between ultimate actual rescission, curtailment and reversal rates and our estimates, as a result of the State Capital Requirementsoutcome of litigation, settlements or other factors, could materially affect our losses.
When the PMIERs, MGIC may terminateinsured disputes our right to rescind coverage or curtail claims, we generally engage in discussions in an attempt to settle the reinsurance transactions, without penalty. At this time, we expect MGIC to continue to comply with the current State Capital Requirements; however, you should read the rest of these risk factors for information about matters that could negatively affect such compliance.
At December 31, 2017, the risk-to-capital ratio of our combined insurance operations (which includes a reinsurance affiliate) was 10.5 to 1. Reinsurance transactions with our affiliate permit MGIC to write insurance with a higher coverage percentage than it could on its own under certain state-specific requirements. A higher risk-to-capital ratio on a combined basis may indicate that, in order for MGIC to continue to utilize reinsurance arrangements with its reinsurance affiliate, additional capital contributions to the affiliate could be needed.
The NAIC plans to revise the minimum capital and surplus requirements for mortgage insurers that are provided for in its Mortgage Guaranty Insurance Model Act. In May 2016, a working group of state regulators released an exposure draft of a risk-based capital framework to establish capital requirements for mortgage insurers, although no date has been established by which the NAIC must propose revisions to the capital requirements and certain items have not yet been completely addressed by the framework, including the treatment of ceded risk, minimum capital floors, and action level triggers. Currently we believe that the PMIERs contain the more restrictive capital requirements in most circumstances.
While MGIC currently meets the State Capital Requirements of Wisconsin and all other jurisdictions, it could be prevented from writing new business in the future in all jurisdictions if it fails to meet the State Capital Requirements of Wisconsin, or it could be prevented from writing new business in a particular jurisdiction if it fails to meet the State Capital Requirements of that jurisdiction, and in each case MGIC does not obtain a waiver of such requirements. It is possible that regulatory action by one or more jurisdictions, including those that do not have specific State Capital Requirements, may prevent MGIC from continuing to write new insurance in such jurisdictions.dispute. If we are unable to write business in all jurisdictions, lendersreach a settlement, the outcome of a dispute ultimately may be unwillingdetermined by legal proceedings. Under ASC 450-20, until a loss associated with settlement discussions or legal proceedings becomes probable and can be reasonably estimated, we consider our claim payment or rescission resolved for financial reporting purposes and do not accrue an estimated loss. When we determine that a loss is probable and can be reasonably estimated, we record our best estimate of our probable loss. In those cases, until settlement negotiations or legal proceedings are concluded (including the receipt of any necessary GSE approvals), it is possible that we will record an additional loss.
We have been named as a third-party defendant in a lawsuit that involves refunds of mortgage insurance premiums under the Homeowners Protection Act. We are monitoring litigation addressing similar issues in which we have not been named a defendant. We are unable to procure insurance from us anywhere. assess the potential impact of any such litigation at this time. In addition, a lender’s assessmentfrom time to time, we are involved in other disputes and legal proceedings in the ordinary course of business. In our opinion, based on the future abilityfacts known at this time, the ultimate resolution of our insurance operations to meet the State Capital Requirements or the PMIERs may affect its willingness to procure insurance from us. In this regard, see our risk factor titled “Competition or changes in our relationships with our customers could reduce our revenues, reduce our premium yields and/or increase our losses.” A possible future failure by MGIC to meet the State Capital Requirements or the PMIERsthese ordinary course disputes and legal proceedings will not necessarily mean that MGIC lacks sufficient resourceshave a material adverse effect on our financial position or results of operations.
The COVID-19 pandemic may materially impact our business and future financial condition.
The COVID-19 pandemic materially impacted our 2020 financial results. While the initial impact of COVID-19 on our business has moderated, the extent to pay claims on its insurance liabilities. While we believe MGIC has sufficient claims paying resources to meet its claim obligations on its insurance in force on a timely basis, you should read the rest of these risk factors for information about matters that could negatively affect MGIC’s claims paying resources.which COVID-19 may materially impact our business and future financial condition is uncertain and
MGIC Investment Corporation 20172022 Form 10-K | 4135
MGIC Investment Corporation and Subsidiaries
|
| | | | | | | | | | | | | | | |
| | | | | | | | | | | | | | | |
MGIC Investment Corporation
2017 Form 10-K
| | | | | | | | | | | | | | | |
Risk factors (continued) |
Downturnscannot be predicted. The magnitude of any future impact could be influenced by various factors, including the length and severity of the pandemic in the domestic economy or declinesUnited States, efforts to reduce the transmission of COVID-19, the level of unemployment, government initiatives and actions taken by the GSEs (including mortgage forbearance and modification programs), and the overall effects of COVID-19 on the economy. The COVID-19 pandemic may impact our business in other ways, as described in more detail in these risk factors.
Forbearance for borrowers who were affected by COVID-19 allows mortgage payments to be suspended for a period of time. Historically, forbearance plans have reduced the incidence of our losses on affected loans. However, given the uncertainty surrounding the long-term economic impact of COVID-19, it is difficult to predict the ultimate effect of COVID-19 related forbearances on our loss incidence. Whether a loan delinquency will cure, including through modification, when forbearance ends will depend on the economic circumstances of the borrower at that time. The severity of losses associated with delinquencies that do not cure will depend on economic conditions at that time, including home prices.
Our success depends, in part, on our ability to manage risks in our investment portfolio.
Our investment portfolio is an important source of revenue and is our primary source of claims paying resources. Although our investment portfolio consists mostly of highly-rated fixed income investments, our investment portfolio is affected by general economic conditions and tax policy, which may adversely affect the markets for credit and interest-rate-sensitive securities, including the extent and timing of investor participation in these markets, the level and volatility of interest rates and credit spreads and, consequently, the value of borrowers’ homes from their value atour fixed income securities. Prevailing market rates have increased for various reasons, including inflationary pressures, which has reduced the time their loans closed may result in more homeowners defaulting and our losses increasing, with a corresponding decrease in our returns.
Losses result from events that reduce a borrower’s ability or willingness to continue to make mortgage payments, such as unemployment, health issues, family status, and whether the home of a borrower who defaults on his mortgage can be sold for an amount that will cover unpaid principal and interest and the expenses of the sale. In general, favorable economic conditions reduce the likelihood that borrowers will lack sufficient income to pay their mortgages and also favorably affect thefair value of homes, thereby reducingour investment portfolio. The value of our investment portfolio may also be adversely affected by ratings downgrades, increased bankruptcies, and credit spreads widening. In addition, the collectability and valuation of our municipal bond portfolio may be adversely affected by budget deficits, and declining tax bases and revenues experienced by state and local municipalities. Our investment portfolio also includes commercial mortgage-backed securities, collateralized loan obligations, and asset-backed securities, which could be adversely affected by declines in some cases even eliminating a loss from a mortgage default. A deterioration in economic conditions, including an increasereal estate valuations, increases in unemployment, generally increases the likelihood that borrowers will not have sufficient income to pay their mortgages and can also adversely affect home prices, which in turn can influence the willingness of borrowers with sufficient resources to make mortgage payments to do so when the mortgage balance exceeds the value of the home. Home prices may decline even absentgeopolitical risks and/or financial market disruption, including a deterioration in economic conditions due to declines in demand for homes, which in turn may result from changes in buyers’ perceptions of the potential for future appreciation, restrictions on and the cost of mortgage credit due to more stringent underwriting standards, higher interest rates generally, changes to the deductibility of mortgage interest or mortgage insurance premiums for income tax purposes, decreases in the rate of household formations, or other factors. Recently enacted tax legislation could have some negative impact on home prices especially on higher priced homes, but we cannot predict the magnitude of the impact, if any,heightened collection risk on the values of the homes we insure. Changes in home prices and unemployment levels are inherently difficult to forecast given the uncertainty in the current market environment, including uncertainty about the effect of actions the federal government has taken and may take with respect to tax policies, mortgage finance programs and policies, and housing finance reform.
The mix of business we write affects our Minimum Required Assets under the PMIERs, our premium yields and the likelihood of losses occurring.
The Minimum Required Assets under the PMIERs are, in part, a function of the direct risk-in-force and the risk profile of the loans we insure, considering loan-to-value ratio, credit score, vintage, Home Affordable Refinance Program ("HARP") status and delinquency status; and whether the loans were insured under lender-paid mortgage insurance policies or other policies that are not subject to automatic termination consistent with the Homeowners Protection Act requirements for borrower paid mortgage insurance. Therefore, if our direct risk-in-force increases through increases in new insurance written, or if our mix of business changes to include loans with higher loan-to-value ratios or lower FICO scores, for example, or if we insure a higher percentage of loans under lender-paid mortgage insurance policies, all other things equal, we will be required to hold more Available Assets in order to maintain GSE eligibility.
The minimum capital required by the risk-based capital framework contained in the exposure draft released by the NAIC in May 2016 would be, in part, a function of certain loan and economic factors, including property location, loan-to-value ratio and credit score; general underwriting quality in the market at the time of loan origination; the age of the loan; and the premium rate we charge. Depending on the provisions of the capital requirements when they are released in final form and become effective, our mix of business may affect the minimum capital we are required to hold under the new framework.
Beginning in 2014, we have increased the percentage of our business from lender-paid single premium policies. Depending on the actual life of a single premium policy and its premium rate relative to that of a monthly premium policy, a single premium policy may generate more or less premium than a monthly premium policy over its life.
We have in place quota share reinsurance transactions with a group of unaffiliated reinsurers that cover most of our insurance written from 2013 through 2017, and a portion of our insurance written prior to 2013. Although the transactions reduce our premiums, they have a lesser impact on our overall results, as losses ceded under the transactions reduce our losses incurred and the ceding commissions we receive reduce our underwriting expenses. The net cost of reinsurance, with respect to a covered loan, is 6% (but can be lower if losses are materially higher than we expect). This cost is derived by dividing the reduction in our pre-tax net income from such loan with reinsurance by our direct (that is, without reinsurance) premiums from such loan. Although the
MGIC Investment Corporation 2017 Form 10-K | 42
|
| | | | | | | | | | | | | | | |
| | | | | | | | | | | | | | | |
MGIC Investment Corporation
2017 Form 10-K
| | | | | | | | | | | | | | | |
Risk factors (continued) |
net cost of the reinsurance is generally constant at 6%, the effect of the reinsurance on the various components of pre-tax income will vary from period to period, depending on the level of ceded losses. We expect that in the first quarter of 2018, we will enter into an agreement covering most of our new insurance written in 2018, on terms no less favorable than our existing transactions. The GSEs have approved the terms of our proposed 2018 QSR Transaction, however, the transactions will be reviewed under the PMIERs at least annually. We may not receive full credit under the PMIERs for the risk ceded under our quota share reinsurance transactions.
In addition to the effect of reinsurance on our premiums, we expect a modest decline in our premium yield resulting from the premium rates themselves: the books of business we wrote before 2009, which have a higher average premium rate than subsequent books of business, are expected to continue to decline as a percentage of the insurance in force; and the average premium rate on these books of business is also expected to decline as the premium rates reset to lower levels at the time the loans reach the ten-year anniversary of their initial coverage date. However, for loans that have utilized HARP, the initial ten-year period was reset to begin as of the date of the HARP transaction. As of December 31, 2017, approximately 1% of our total primary insurance in force was written in 2008, has not been refinanced under HARP and is subject to a reset after ten years.
The circumstances in which we are entitled to rescind coverage have narrowed for insurance we have written in recent years. During the second quarter of 2012, we began writing a portion of our new insurance under an endorsement to our then existing master policy (the “Gold Cert Endorsement”), which limited our ability to rescind coverage compared to that master policy. To comply with requirements of the GSEs, we introduced our current master policy in 2014. Our rescission rights under our current master policy are comparable to those under our previous master policy, as modified by the Gold Cert Endorsement, but may be further narrowed if the GSEs permit modifications to them. Our current master policy is filed as Exhibit 99.19 to our quarterly report on Form 10-Q for the quarter ended September 30, 2014 (filed with the SEC on November 7, 2014). All of our primary new insurance on loans with mortgage insurance application dates on or after October 1, 2014, was written under our current master policy. As of December 31, 2017, approximately 74% of our flow, primary insurance in force was written under our Gold Cert Endorsement or our current master policy.
From time to time, in response to market conditions, we change the types of loans that we insure and the requirements under which we insure them. We also change our underwriting guidelines, in part through aligning some of them with Fannie Mae and Freddie Mac for loans that receive and are processed in accordance with certain approval recommendations from a GSE automated underwriting system.underlying loans. As a result of changes tothese matters, we may not achieve our underwriting guidelinesinvestment objectives and requirements (including those related to debt to income ("DTI") ratios, credit scores, and the manner in which income levels and property values are determined) and other factors, our business written beginninga reduction in the second halfmarket value of 2013 is expected toour investments could have a somewhat higher claim incidence than business written in 2009 through the first half of 2013, but materially below that on business written in 2005-2008. However, we believe this business presents an acceptable level of risk. The number of loans we insured with DTIs greater than 45% increased in the second half of 2017 after the requirements of a GSE automated underwriting system were made more liberal; however, effective for loans we insure beginning in March 2018, we increased the credit score required in connection with such loans. Our underwriting requirements are availableadverse effect on our website at http://www.mgic.com/underwriting/index.html. We monitor the competitive landscape and will make adjustments to our pricing and underwriting guidelines as warranted. We also make exceptions to our underwriting requirements on a loan-by-loan basis and for certain customer programs. Together, the number of loans for which exceptions were made, which in total are expected to have a somewhat higher claim incidence than loans that meet our guidelines, accounted for fewer than 2% of the loans we insured in each of 2016 and 2017.
Even when home prices are stable or rising, mortgages with certain characteristics have higher probabilities of claims. These characteristics include loans with higher loan-to-value ratios, lower FICO scores, limited underwriting, including limited borrower documentation, or higher DTI ratios, as well as loans having combinations of higher risk factors. As of December 31, 2017, approximately 13.8% of our primary risk in force covered loans with LTV ratios greater than 95%, 3.0% covered loans whose borrowers had FICO scores below 620, 2.8% covered loans with limited underwriting, including limited borrower documentation, and 13.2% covered loans whose borrowers had DTI ratios greater than 45% (or where no ratio is available), each attribute as determined at the time of loan origination. An individual loan may have more than one of these attributes. A material number of these loans were originated in 2005 - 2007 or the first half of 2008. For information about
MGIC Investment Corporation 2017 Form 10-K | 43
|
| | | | | | | | | | | | | | | |
| | | | | | | | | | | | | | | |
MGIC Investment Corporation
2017 Form 10-K
| | | | | | | | | | | | | | | |
Risk factors (continued) |
our classification of loans by FICO score and documentation, see footnotes (5) and (6) to the Characteristics of Primary Risk in Force table under “Business - Our Products and Services” in Item 1 of this Annual Report.
As of December 31, 2017, approximately 1% of our primary risk in force consisted of adjustable rate mortgages in which the initial interest rate may be adjusted during the five years after the mortgage closing (“ARMs”). We classify as fixed rate loans adjustable rate mortgages in which the initial interest rate is fixed during the five years after the mortgage closing. If interest rates should rise between the time of origination of such loans and when their interest rates may be reset, claims on ARMs and adjustable rate mortgages whose interest rates may only be adjusted after five years would be substantially higher than for fixed rate loans. In addition, we have insured “interest-only” loans, which may also be ARMs, and loans with negative amortization features, such as pay option ARMs. We believe claim rates on these loans will be substantially higher than on loans without scheduled payment increases that are made to borrowers of comparable credit quality.
If state or federal regulations or statutes are changed in ways that ease mortgage lending standards and/or requirements, or if lenders seek ways to replace business in times of lower mortgage originations, it is possible that more mortgage loans could be originated with higher risk characteristics than are currently being originated, such as loans with lower FICO scores and higher DTIs. Lenders could pressure mortgage insurers to insure such loans. Although we attempt to incorporate these higher expected claim rates into our underwriting and pricing models, there can be no assurance that the premiums earned and the associated investment income will be adequate to compensate for actual losses even under our current underwriting requirements. We do, however, believe that our insurance written beginning in the second half of 2008 will generate underwriting profits.
The premiums we charge may not be adequate to compensate us for our liabilities for losses and as a result any inadequacy could materially affect ourliquidity, financial condition and results of operations.
We set premiums
For the significant portion of our investment portfolio that is held by MGIC, to receive full capital credit under insurance regulatory requirements and under the PMIERs, we generally are limited to investing in investment grade fixed income securities whose yields reflect their lower credit risk profile. Our investment income depends upon the size of the portfolio and its reinvestment at the time a policy is issued basedprevailing interest rates. A prolonged period of low investment yields would have an adverse impact on our expectations regarding likely performanceinvestment income as would a decrease in the size of the insured risks over the long-term. Our premiums are subjectportfolio.
We structure our investment portfolio to approval by state regulatory agencies, which can delay or limitsatisfy our ability to increaseexpected liabilities, including claim payments in our premiums. Generally, we cannot cancel mortgage insurance coveragebusiness. If we underestimate our liabilities or adjust renewal premiums duringimproperly structure our investments to meet these liabilities, we could have unexpected losses resulting from the lifeforced liquidation of a mortgage insurance policy. As a result, higher than anticipated claims generally cannot be offset by premium increases on policies in force or mitigated by our non-renewal or cancellation of insurance coverage. The premiums we charge, and the associated investmentfixed income may not be adequate to compensate us for the risks and costs associated with the insurance coverage provided to customers. An increase in the number or size of claims, compared to what we anticipate,investments before their maturity, which could adversely affect our results of operations or financial condition. operations.
Our premium ratesholding company debt obligations are also basedmaterial.
At December 31, 2022, we had approximately $647 million in partcash and investments at our holding company and our holding company’s long-term debt obligations were $671 million in aggregate principal amount. Annual debt service on the amountlong-term debt obligations outstanding as of capital we are required to hold against the insured risk. If the amount of capital we are required to hold increases from the amount we were required to hold when a policy was written, we cannot adjust premiums to compensate for this and our returns may be lower than we assumed.December 31, 2022, is approximately $36 million.
The losses we have incurred on our 2005-2008 books of business have exceeded our premiums from those books. Our current expectation is that the incurred losses from those books, although declining, will continue to generate a material portion of our total incurred losses for a number of years. The ultimate amount of these losses will depend in part on general economic conditions, including unemployment, and the direction of home prices.
Welong-term debt obligations are susceptible to disruptions in the servicing of mortgage loans that we insure.
We depend on reliable, consistent third-party servicing of the loans that we insure. Over the last several years, the mortgage loan servicing industry has experienced consolidation and an increase in the number of specialty servicers servicing delinquent loans. The resulting change in the composition of servicers could lead to disruptions in the servicing of mortgage loans coveredowed by our insurance policies. Further changes in the servicing industry resulting in the transfer of servicing could cause a disruption in the servicing of delinquent loans which could reduce servicers’ ability to undertake mitigation efforts that could help limit our losses. Future housing market conditions could lead to additional increases in delinquencies and transfers of servicing.
holding company, MGIC Investment Corporation, 2017 Form 10-K | 44
|
| | | | | | | | | | | | | | | |
| | | | | | | | | | | | | | | |
MGIC Investment Corporation
2017 Form 10-K
| | | | | | | | | | | | | | | |
Risk factors (continued) |
Changes in interest rates, house prices or mortgage insurance cancellation requirements may changeand not its subsidiaries. The payment of dividends from MGIC is the length of time that our policies remain in force.
The premium from a single premium policy is collected upfront and generally earned over the estimated life of the policy. In contrast, premiums from a monthly premium policy are received and earned each month over the life of the policy. In each year, mostprincipal source of our premiums earnedholding company cash inflow. Other sources of holding company cash inflow include settlements under intercompany tax and expense sharing agreements, investment income and raising capital in the public markets. Although MGIC holds assets in excess of its minimum statutory capital requirements and its PMIERs financial requirements, the ability of MGIC to pay dividends is restricted by insurance regulation. In general, dividends in excess of prescribed limits are deemed “extraordinary” and may not be paid if disapproved by the OCI. In 2023, MGIC can pay $92 million of ordinary dividends without OCI approval, before taking into consideration dividends paid in the preceding twelve months. A dividend is extraordinary when the proposed dividend amount plus dividends paid in the last twelve months from insurance that has been writtenthe dividend payment date exceed the ordinary dividend level. In the twelve months ended December 31, 2022, MGIC paid $800 million in prior years. As a result,dividends to the lengthholding company. Future dividend payments from MGIC to the holding company will be determined in consultation with the board of time insurance remains in force, which is generally measured by persistency (the percentagedirectors, and after considering any updated estimates about our business.
Repurchases of our insurance remaining in forcecommon stock may be made from one year prior), is a significant determinanttime to time on the open market (including through 10b5-1 plans) or through privately negotiated transactions. In 2022, we repurchased approximately 27.8 million shares, using approximately $386 million of our revenues. Future premiums on our monthly premium policies in force represent a material portion of our claims paying resources and a low persistency rate will reduce those future premiums. In contrast, a higher than expected persistency rate will decrease the profitability from single premium policies because they will remain in force longer than was estimated when the policies were written.
The monthly premium policies for the substantial majority of loans we insured provides that, for the first ten years of the policy, the premium is determined by the product of the premium rate and the initial loan balance; thereafter, a lower premium rate is applied to the initial loan balance. The initial ten-year period is reset when the loan is refinanced under HARP. The premiums on many of the policies in our 2007 book of business that were not refinanced under HARP reset in 2017.holding company resources. As of December 31, 2017, approximately 1%2022, we had $114 million of authorization remaining to repurchase our total primary insurancecommon stock through the end of 2023 under a share repurchase program approved by our Board of Directors in force was written in 2008, has not been refinanced under HARP,October 2021. If any capital contributions to our subsidiaries are required, such contributions would decrease our holding company cash and is subject to a rate reset after ten years.
Our persistency rate was 80.1% at December 31, 2017, 76.9% at December 31, 2016 and 79.7% at December 31, 2015. Since 2000, our year-end persistency ranged from a high of 84.7% at December 31, 2009 to a low of 47.1% at December 31, 2003.
Our persistency rate is primarily affected by the level of current mortgage interest rates compared to the mortgage coupon rates on our insurance in force, which affects the vulnerability of the insurance in force to refinancing. Our persistency rate is also affected by the mortgage insurance cancellation policies of mortgage investors along with the current value of the homes underlying the mortgages in the insurance in force.investments.
Your ownership in our company may be diluted by additional capital that we raise or if the holders of our outstanding convertible debt convert that debt into shares of our common stock.raise.
As noted above under our risk factor titled “We may not continue to meet the GSEs’ private mortgage insurer eligibility requirements and our returns may decrease asif we are required to maintain more capital in order to maintain our eligibility,” although we are currently in compliance with the requirements of the PMIERs, there can be no assurance that we would not seek to issue non-dilutiveadditional debt capital or to raise additional equity or equity-linked capital to manage our capital position under the PMIERs or for other purposes. Any future issuance of equity securities may dilute your ownership interest in our company. In addition, the market price of our common stock could decline as a result of
MGIC Investment Corporation 2022 Form 10-K | 36
MGIC Investment Corporation and Subsidiaries
sales of a large number of shares or similar securities in the market or the perception that such sales could occur.
At December 31, 2017, we had outstanding $390 million principal amount of 9% Convertible Junior Subordinated Debentures due in 2063 ("9% Debentures") (of which approximately $133 million was purchased, and is held, by MGIC, and is eliminated on the consolidated balance sheet). The principal amount of the 9% Debentures is currently convertible, at the holder’s option, at an initial conversion rate, which is subject to adjustment, of 74.0741 common shares per $1,000 principal amount of debentures. This represents an initial conversion price of approximately $13.50 per share. We may redeem the 9% Debentures in whole or in part from time to time, at our option, at a redemption price equal to 100% of the principal amount of the 9% Debentures being redeemed, plus any accrued and unpaid interest, if the closing sale price of our common stock exceeds $17.55may fluctuate significantly, which may make it difficult for holders to resell common stock when they want or at least 20 ofa price they find attractive.
The market price for our common stock may fluctuate significantly. In addition to the 30 trading days preceding notice ofrisk factors described herein, the redemption.
Wefollowing factors may have an adverse impact on the right, and may elect, to defer interest payable under the debenturesmarket price for our common stock: changes in general conditions in the future. If a holder elects to convert its debentures,economy, the interest that has been deferredmortgage insurance industry or the financial markets; announcements by us or our competitors of acquisitions or strategic initiatives; our actual or anticipated quarterly and annual operating results; changes in expectations of future financial performance (including incurred losses on our insurance in force); changes in estimates of securities analysts or rating agencies; actual or anticipated changes in our share repurchase program or dividends; changes in operating performance or market valuation of companies in the debentures being converted is also convertible into sharesmortgage insurance industry; the addition or departure of key personnel; changes in tax law; and adverse press or news announcements affecting us or the industry. In addition, ownership by certain types of investors may affect the market price and trading volume of our common stock. For example, ownership in our common stock by investors such as index funds and exchange-traded funds can affect the stock’s price when those investors must purchase or sell our common stock because the investors have experienced significant cash inflows or outflows, the index to which our common stock belongs has been rebalanced, or our common stock is added to and/or removed from an index (due to changes in our market capitalization, for example).
The conversion rate for such deferred interestCompany may be adversely impacted by the transition from LIBOR as a reference rate.
The United Kingdom’s Financial Conduct Authority, which regulates LIBOR, announced that after 2021 it would no longer publish one-week and two-month tenor USD LIBOR and that after June 30, 2023, it would no longer publish all other USD LIBOR tenors. Efforts are underway to identify and transition to a set of alternative reference rates. The set of alternative rates includes the Secured Overnight Financing Rate (“SOFR”), which the Federal Reserve Bank of New York began publishing in 2018. Because SOFR is calculated based on different criteria than LIBOR, SOFR and LIBOR may diverge.
While it is not currently possible to determine precisely whether, or to what extent, the average price that our shares traded at during a 5-day period immediately priorreplacement of LIBOR would affect us, the implementation of alternative benchmark rates to the election to convert the
MGIC Investment Corporation 2017 Form 10-K | 45
|
| | | | | | | | | | | | | | | |
| | | | | | | | | | | | | | | |
MGIC Investment Corporation
2017 Form 10-K
| | | | | | | | | | | | | | | |
Risk factors (continued) |
associated debentures. WeLIBOR may elect to pay cash for some or all of the shares issuable upon a conversion of the debentures.
For a discussion of the dilutive effects of our convertible securities on our earnings per share, see Note 4 – “Earnings Per Share” to our consolidated financial statements in this Annual Report. We currently have no plans to repurchase common stock but regularly consider appropriate uses for resources of our holding company. In addition, we have in the past, and may in the future, purchase our debt securities.
Our holding company debt obligations materially exceed our holding company cash and investments.
At December 31, 2017, we had approximately $216 million in cash and investments at our holding company and our holding company’s debt obligations were $815 million in aggregate principal amount, consisting of $425 million of 5.75% Senior Notes due in 2023 ("5.75% Notes") and $390 million of 9% Debentures (of which approximately $133 million was purchased, and is held, by MGIC, and is eliminated on the consolidated balance sheet). Annual debt service on the 5.75% Notes and 9% Debentures outstanding as of December 31, 2017, is approximately $60 million (of which approximately $12 million will be paid to MGIC and will be eliminated on the consolidated statement of operations).
The 5.75% Senior Notes and 9% Debentures are obligations of our holding company, MGIC Investment Corporation, and not of its subsidiaries. The payment of dividends from our insurance subsidiaries which, other than investment income and raising capital in the public markets, is the principal source of our holding company cash inflow, is restricted by insurance regulation. MGIC is the principal source of dividend-paying capacity. In 2017, MGIC paid a total of $140 million in dividends to our holding company. We expect MGIC to continue to pay quarterly dividends. We ask the OCI not to object before MGIC pays dividends. If any additional capital contributions to our subsidiaries were required, such contributions would decrease our holding company cash and investments. As described in our Current Report on Form 8-K filed on February 11, 2016, MGIC borrowed $155 million from the Federal Home Loan Bank of Chicago. This is an obligation of MGIC and not of our holding company.
We could be adversely affected if personal information on consumers that we maintain is improperly disclosed and our information technology systems may become outdated and we may not be able to make timely modifications to support our products and services.
As part of our business, we maintain large amounts of personal information on consumers. While we believe we have appropriate information security policies and systems to prevent unauthorized disclosure, there can be no assurance that unauthorized disclosure, either through the actions of third parties or employees, will not occur. Unauthorized disclosure could adversely affect our reputation, result in a loss of business and expose us to material claims for damages.
We rely on the efficient and uninterrupted operation of complex information technology systems. All information technology systems are potentially vulnerable to damage or interruption from a variety of sources, including through the actions of third parties. Due to our reliance on our information technology systems, their damage or interruption could severely disrupt our operations, which could have a material adverse effect on our business, business prospects and results of operations.
In addition,operations or financial condition. We have three primary types of transactions that involve financial instruments referencing LIBOR. First, as of December 31, 2022, approximately 6% of the fair value of our investment portfolio consisted of securities referencing LIBOR. Second, as of December 31, 2022, approximately $0.4 billion of our risk in force was on adjustable rate mortgages whose interest is referenced to one-month USD LIBOR. A change in reference rate associated with these loans may affect their principal balance, which may affect our risk-in-force and the amount of Minimum Required Assets we are required to maintain under PMIERs. A change in reference rate may also affect the amount of principal and/or accrued interest we are required to pay in the processevent of upgrading certaina claim payment. Third, the premiums under most of our information systems2018-2021 XOL reinsurance agreements executed through insurance linked noted transactions are determined, in part, by the difference
between interest payable on the reinsurers’ notes which reference one-month USD LIBOR and earnings from a pool of securities receiving interest that have been in place for a number of years. The implementation of these technological improvements is complex, expensive and time consuming. If we fail to timely and successfully implement the new technology systems, or if the systems do not operate as expected, it could have an adverse impactmay reference LIBOR (in 2022, our total premiums on our business, business prospects and results of operations.such transactions were approximately $36.4 million).
MGIC Investment Corporation 20172022 Form 10-K | 4637
MGIC Investment Corporation and Subsidiaries
|
| | | | | | | | | | | | | | | |
Item 1B. Unresolved Staff Comments Properties, Legal Proceedings, Mine Safety Disclosures | | | | | | | | |
MGIC Investment Corporation
2017 Form 10-K
| | | | | | | | | | | | | | | |
Item 1B.
Unresolved Staff Comments.
None.
Item 2.
Properties
At December 31, 2017,2022, we leasedhad no office space leases in various cities throughout the United States under leases expiring between 2018 and 2021 and which requiredthat require monthly rental payments that in the aggregate are immaterial.payments.
We own our headquarters facility and an additional office/warehouse facility, both located in Milwaukee, Wisconsin, which contain an aggregate of approximately 310,000 square feet of space.
Item 3. Legal Proceedings
Legal Proceedings.
In 2014, we received Notices of Deficiency (commonly referred to as “90 day letters”) covering the 2000-2007 tax years. The Notices of Deficiency reflect taxes and penalties related to the REMIC matters of $197.5 million and at December 31, 2017, there would also be interest related to these matters of approximately $205.0 million. In 2007, we made a payment of $65.2 million to the United States Department of the Treasury which will reduce any amounts we would ultimately owe. The Notices of Deficiency also reflect additional amounts due of $261.4 million, which are primarily associated with the disallowance of the carryback of the 2009 net operating loss to the 2004-2007 tax years. We believe the IRS included the carryback adjustments as a precaution to keep open the statute of limitations on collection of the tax that was refunded when this loss was carried back, and not because the IRS actually intends to disallow the carryback permanently. Depending on the outcome of this matter, additional state income taxes and state interest may become due when a final resolution is reached. As of December 31, 2017, those state taxes and interest would approximate $85.8 million. In addition, there could also be state tax penalties. Our total amount of unrecognized tax benefits as of December 31, 2017 is $142.8 million, which represents the tax benefits generated by the REMIC portfolio included in our tax returns that we have not taken benefit for in ourconsolidated financial statements including any related interest.in Item 8.
We filed a petition with the U.S. Tax Court contesting most of the IRS’ proposed adjustments reflected in the Notices of Deficiency and the IRS filed an answer to our petition which continued to assert their claim. The case has twice been scheduled for trial and in each instance, the parties jointly filed, and the U.S. Tax Court approved (most recently in February 2016), motions for continuance to postpone the trial date. Also in February 2016, the U.S. Tax Court approved a joint motion to consolidate for trial, briefing, and opinion, our case with similar cases of Radian Group, Inc., as successor to Enhance Financial Services Group, Inc., et al. The parties have reached agreement on all issues in the case and in the fourth quarter of 2017, the IRS submitted documentation reflecting the terms of the agreement to the JCT for its review, which must be performed before a settlement can be completed. There is no assurance that a settlement will be completed. Based on information that we currently have regarding the status of our ongoing dispute, we recorded a provision for additional taxes and interest of $29.0 million in 2017.
Item 4. Mine Safety Disclosures
Not Applicable.
MGIC Investment Corporation 20172022 Form 10-K | 4738
|
| | | | | | | | | | | | | | | |
Unresolved Staff Comments, Properties, Legal Proceedings, Mine Safety Disclosures | | | | | | | | |
MGIC Investment Corporation
2017 Form 10-K
| | | | | | | | | | | | | | | |
Should a settlement not be completed, ongoing litigation to resolve our dispute with the IRS could be lengthy and costly in terms of legal fees and related expenses. We would need to make further adjustments, which could be material, to our tax provision and liabilities if our view of the probability of success in this matter changes, and the ultimate resolution of this matter could have a material negative impact on our effective tax rate, results of operations, cash flows, available assets and statutory capital. In this regard, see our risk factors titled “We may not continue to meet the GSEs’ private mortgage insurer eligibility requirements and our returns may decrease as we are required to maintain more capital in order to maintain our eligibility” and “State capital requirements may prevent us from continuing to write new insurance on an uninterrupted basis” in Item 1A.
In addition to the above litigation (including arbitration), we face other litigation, regulatory risks and disputes. For additional information about such other litigation and regulatory risks, you should review our risk factors titled “We are involved in legal proceedings and are subject to the risk of additional legal proceedings in the future” in Item 1A.
Item 4.
Mine Safety Disclosures.
Not Applicable.
MGIC Investment Corporation 2017 Form 10-K | 48and Subsidiaries
|
| | | | | | | | | | | | | | | |
Information About Our Executive Officers of the Registrant |
MGIC Investment Corporation
2017 Form 10-K
| | | | | | | | | | | | | | | |
Executive Officers of the Registrant
Certain information with respect to our executive officers as of February 23, 201822, 2023 is set forth below:
|
| | | | | | | |
| | | |
| Executive officers of the registrant |
|
| Name and Age | | Title |
Patrick Sinks, 61Timothy J. Mattke, 47 | | Chief Executive Officer and Director of MGIC Investment Corporation and MGIC |
| Salvatore A. Miosi, 56 | | President and Chief ExecutiveOperating Officer of MGIC Investment Corporation and MGIC; Director of MGIC Investment Corporation and MGIC |
| Nathan H. Colson, 39 | Timothy J. Mattke, 42 | | Executive Vice President and Chief Financial Officer of MGIC Investment Corporation and MGIC |
| James J. Hughes, 5560 | | Executive Vice President – Sales and Business Development of MGIC |
| Paula C. Maggio, 54 | Jeffrey H. Lane, 68 | | Executive Vice President, General Counsel and Secretary of MGIC Investment Corporation and MGIC |
| Steven M. Thompson, 60 | Stephen C. Mackey, 57 | | Executive Vice President and Chief Risk Officer of MGIC Investment Corporation and MGIC |
| Robert J. Candelmo, 59 | Salvatore A. Miosi, 51 | | Executive Vice President – Business Strategy and Operations of MGIC |
| Gregory A. Chi, 58 | | Senior Vice President – Information Services and Chief Information Officer of MGIC |
Mr. SinksMattke has served as our Chief Executive Officer since March 2015 and has been our and MGIC’s President since January 2006. He was Executive Vice President – Field Operations of MGIC from January 2004 to January 2006 and was Senior Vice President – Field Operations of MGIC from July 2002 to January 2004. From March 1985 to July 2002,2019. Before then, he held various positions within MGIC’s finance and accounting organization, the last of which was Senior Vice President, Controller and Chief Accounting Officer. Mr. Sinks has been a director of MGIC Investment Corporation and MGIC since July 2014.
Mr. Mattke hashad been the Company’s Chief Financial Officer since March 2014. He served as the Company’sfrom 2014 to 2019, and its Controller from 2009 through Marchto 2014. He joined the Company in 2006. Prior to his becoming Controller, he was Assistant Controller of MGIC beginning in August 2007 and prior to that was a manager in MGIC’s accounting department. Before joining MGIC, Mr. Mattke was an audit manager and an auditor with PricewaterhouseCoopers LLP, the Company’s independent registered accounting firm.
Mr. Miosi has served as our President and Chief Operating Officer since 2019. Before then, he had been Executive Vice President – Business Strategy and Operations since 2017. He served as Senior Vice President – Business Strategy and Operations of MGIC from 2015 to 2017, and Vice President – Marketing from 2004 to 2015. Mr. Miosi joined the company in 1988 and has also held a variety of leadership positions in the operations, technology and marketing divisions.
Mr. Colson has served as our Executive Vice President and Chief Financial Officer since 2019. Before then, he had been MGIC's Vice President – Finance during 2019 and its Assistant Treasurer from 2016 to 2019. He joined MGIC in 2014 and prior to becoming Assistant Treasurer, he held positions in its Risk Management Department. Before joining MGIC, Mr. Colson was with PricewaterhouseCoopers LLP, the Company’s independent registered accounting firm.
Mr. Hughes has served as Executive Vice President – Sales and Business Development of MGIC since January 2017. He served as Senior Vice President – Sales and Business Development of MGIC from 2015 to January 2017, and Vice President, Managing Director in the sales area from 2001 to 2015. He joined MGIC in 1987 and prior to becoming Vice President, Managing Director, he had been an Account Manager and a Sales Manager. On January 17, 2023 Mr. Hughes provided notice of his intent to retire, effective August 1, 2023. On April 1, 2023 Mr. Hughes will step down from his role as Executive Vice-President - Sales and Business Development and serve as a Special Advisor to the CEO until his retirement date.
Mr. Lane
Ms. Maggio joined the Company in 2018 and has served as our and MGIC’s Executive Vice President, General Counsel and Secretary since January 2008 and prior thereto as our Seniorthen. Prior to joining the Company, Ms. Maggio had been Executive Vice President, General Counsel and Secretary of Retail Properties of America, Inc. from August 19962016 to January 2008. For more than five years prior2018, Executive Vice President, General Counsel and Secretary of Strategic Hotels & Resorts, Inc. (SHR) from 2012 to his2015, and in various other leadership roles with SHR since joining us, Mr. Lane was a partner of Foley & Lardner, a lawthat firm headquartered in Milwaukee, Wisconsin. In January 2017, Mr. Lane informed us that he plans2000. Prior to retire after his successor takes office and there is an appropriate transition period.joining SHR, Ms. Maggio had been in private legal practice from 1994-2000.
Mr. Mackey joined MGIC in June 2015 andThompson has served as MGIC's Executive Vice President and Chief Risk Officer since September 2015.2019. Before joining MGIC, Mr. Mackey was with JP Morgan Chase & Company from March 2011 until June 2015, where he held a number of senior leadership positions, including Managing Director, Firmwide Market Risk, Senior Vice President and Risk Management Executive in Mortgage Banking and Senior Vice President and Controller in Mortgage Banking. He has a diverse professional background prior to JP Morgan that includes 13 years with Fannie Mae wherethen, he had been aInterim Chief Risk Officer during 2019, and Vice President.President Credit Policy and Pricing from 2016 to 2019. He joined MGIC in 1998 and prior to being named Vice President Credit Policy and Pricing, he held several management positions in its Risk Management Department, including Vice President – Risk Management from 2000 to 2016.
Mr. MiosiCandelmo has served as Executive Vice President – Business Strategy and Operations since January 2017. He served asMGIC's Senior Vice President – Business Strategy and Operations of MGIC from 2015 to January 2017, and Vice President - Marketing from 2004 to 2015. Mr. Miosi joined the company in 1988 and has also held a variety of leadership positions in the operations, technology and marketing divisions.
Mr. Chi joined MGIC in February 2012 and has served as MGIC’s Senior Vice President – Information Services and Chief Information Officer since March 2012.2019. He joined MGIC in 2014 as its Vice President – Chief Technology Officer. Prior to joining MGIC, Mr. ChiCandelmo had been Senior Vice President of Enterprise DeliveryInformation Services with SunTrust Bank since 2008. Prior to joining SunTrust, Mr. ChiCandelmo had been Vice President, Information Technology Development Application with MetLife, Inc. since 2005. Prior to that, Mr. Chi held various senior management positions inother leadership roles within the financial services industry.information technology discipline.
MGIC Investment Corporation 20172022 Form 10-K | 4939
MGIC Investment Corporation and Subsidiaries
|
| | | | | | | | | | | | | | | |
Market for Registrant's Common Equity, Related Stockholder Matters and Issuer Purchases of Equity Securities | | | | | |
MGIC Investment Corporation
2017 Form 10-K
| | | | | | | | | | | | | | | |
PART II
Item 5.
Market for Registrant’s Common Equity, Related Stockholder Matters and Issuer Purchases of Equity Securities.Securities
| |
(a) | Our Common Stock is listed on the New York Stock Exchange under the symbol “MTG.” The following table sets forth for 2017 and 2016 by calendar quarter the high and low sales prices of our Common Stock on the New York Stock Exchange.
|
|
| | | | | | | | | | | | | | | | | |
| | | | | | | | | | |
| Common stock sales prices | | 2017 | | 2016 |
| Quarter | High | | Low | | High | | Low |
| | First | $ | 11.35 |
| | $ | 9.68 |
| | $ | 8.72 |
| | $ | 5.63 |
|
| | Second | 11.40 |
| | 9.84 |
| | 7.85 |
| | 5.36 |
|
| | Third | 12.65 |
| | 10.64 |
| | 8.23 |
| | 5.45 |
|
| | Fourth | 15.64 |
| | 12.26 |
| | 10.58 |
| | 7.84 |
|
No cash dividends have been paid since July 2008. The payment of any future dividends is subject to the discretion of our Board and will depend on many factors, including our operating results, financial condition and capital position. See Note 7 – “Debt,” to our consolidated financial statements in Item 8 for dividend restrictions during interest deferral periods related to our 9% Debentures. We are a holding company and the payment of dividends from our insurance subsidiaries is restricted by insurance regulations. For a discussion of these restrictions, see “Management’s Discussion and Analysis — Liquidity and Capital Resources” in Item 7 of this annual report and Note 14 – “Statutory Information,” to our consolidated financial statements in Item 8.
As of February 7, 2018,17, 2023, the number of shareholders of record was 201.274. In addition, we estimate there are approximately 40,90075,654 beneficial owners of shares held by brokers and fiduciaries.
Information regarding equity compensation plans is contained in Item 12.
(b)Not applicable.
(c)Issuer Purchases of Equity Securities
The following table provides information about purchases of MGIC Investment Corporation 2017common stock by us during the three months ended December 31, 2022.
| | | | | | | | | | | | | | | | | | | | | | | | | | | | | | | | |
| Share repurchases |
| Period Beginning | | Period Ending | | Total number of shares purchased | | Average price paid per share | | Total number of shares purchased as part of publicly announced plans or programs | | Approximate dollar value of shares that may yet be purchased under the program (1) |
| October 1, 2022 | | October 31, 2022 | | 2,564,592 | | | $ | 12.96 | | | 2,564,592 | | | $ | 160,583,743 | |
| November 1, 2022 | | November 30, 2022 | | 1,770,926 | | | $ | 13.49 | | | 1,770,926 | | | $ | 136,687,570 | |
| December 1, 2022 | | December 31, 2022 | | 1,720,794 | | | $ | 13.02 | | | 1,720,794 | | | $ | 114,286,213 | |
| | | | 6,056,312 | | | $ | 13.13 | | | 6,056,312 | | | |
| | | | | | | | | | |
(1)In October 2021, our Board of Directors authorized a share repurchase program under which as of December 31, 2022 we may repurchase up to an additional $114 million of our common stock through the end of 2023. Repurchases may be made from time to time on the open market (including through 10b5-1 plans) or through privately negotiated transactions. The repurchase program may be suspended for periods or discontinued at any time.
MGIC Investment Corporation 2022 Form 10-K | 5040
|
| | | | | | | | | | | | | | | |
Selected Financial and Other Data | | | | | | | | | | | | |
MGIC Investment Corporation
2017 Form 10-K
| | | | | | | | | | | | | | | |
|
| | | | | | | | | | | | | | | | | | | | | | |
| | Item 6. | | | | | | | | | | |
| | Selected Financial Data | | | | | | | | | | |
| | | | | | | | | | | | |
| | | | | | | | | | | | | |
| | | | As of and for the Years Ended December 31, |
| | (In thousands, except per share data) | | 2017 | | 2016 | | 2015 | | 2014 | | 2013 |
| Summary of operations | Revenues: | | | | | | | | | | |
| Net premiums written | | $ | 997,955 |
| | $ | 975,091 |
| | $ | 1,020,277 |
| | $ | 881,962 |
| | $ | 923,481 |
|
| | Net premiums earned | | 934,747 |
| | 925,226 |
| | 896,222 |
| | 844,371 |
| | 943,051 |
|
| | Investment income, net | | 120,871 |
| | 110,666 |
| | 103,741 |
| | 87,647 |
| | 80,739 |
|
| | Realized investment gains, net including net impairment losses | | 249 |
| | 8,932 |
| | 28,361 |
| | 1,357 |
| | 5,731 |
|
| | Other revenue | | 10,187 |
| | 17,659 |
| | 12,964 |
| | 9,259 |
| | 9,914 |
|
| | Total revenues | | 1,066,054 |
| | 1,062,483 |
| | 1,041,288 |
| | 942,634 |
| | 1,039,435 |
|
| | | | | | | | | | | | |
| | Losses and expenses: | | | | |
| | |
| | |
| | |
|
| | Losses incurred, net | | 53,709 |
| | 240,157 |
| | 343,547 |
| | 496,077 |
| | 838,716 |
|
| | Change in premium deficiency reserve | | — |
| | — |
| | (23,751 | ) | | (24,710 | ) | | (25,320 | ) |
| | Underwriting and other expenses | | 170,749 |
| | 160,409 |
| | 164,366 |
| | 146,059 |
| | 192,518 |
|
| | Interest expense | | 57,035 |
| | 56,672 |
| | 68,932 |
| | 69,648 |
| | 79,663 |
|
| | Loss on debt extinguishment | | 65 |
| | 90,531 |
| | 507 |
| | 837 |
| | — |
|
| | Total losses and expenses | | 281,558 |
| | 547,769 |
| | 553,601 |
| | 687,911 |
| | 1,085,577 |
|
| | Income (loss) before tax | | 784,496 |
| | 514,714 |
| | 487,687 |
| | 254,723 |
| | (46,142 | ) |
| | Provision for (benefit from) income taxes (1) | | 428,735 |
| | 172,197 |
| | (684,313 | ) | | 2,774 |
| | 3,696 |
|
| | Net income (loss) | | $ | 355,761 |
| | $ | 342,517 |
| | $ | 1,172,000 |
| | $ | 251,949 |
| | $ | (49,838 | ) |
| | | | | | | | | | | | |
| | Weighted average common shares outstanding (2) | | 394,766 |
| | 431,992 |
| | 468,039 |
| | 413,547 |
| | 311,754 |
|
| | | | | | | | | | | | |
| | Diluted income (loss) per share | | $ | 0.95 |
| | $ | 0.86 |
| | $ | 2.60 |
| | $ | 0.64 |
| | $ | (0.16 | ) |
| | Dividends per share | | $ | — |
| | $ | — |
| | $ | — |
| | $ | — |
| | $ | — |
|
| | | | | | | | | | | | |
| Balance sheet data | Total investments | | $ | 4,990,561 |
| | $ | 4,692,350 |
| | $ | 4,663,206 |
| | $ | 4,612,669 |
| | $ | 4,866,819 |
|
| Cash and cash equivalents | | 99,851 |
| | 155,410 |
| | 181,120 |
| | 197,882 |
| | 332,692 |
|
| | Total assets | | 5,619,499 |
| | 5,734,529 |
| | 5,868,343 |
| | 5,251,414 |
| | 5,582,579 |
|
| | Loss reserves | | 985,635 |
| | 1,438,813 |
| | 1,893,402 |
| | 2,396,807 |
| | 3,061,401 |
|
| | Premium deficiency reserve | | — |
| | — |
| | — |
| | 23,751 |
| | 48,461 |
|
| | Short- and long-term debt | | 573,560 |
| | 572,406 |
| | — |
| | 61,883 |
| | 82,662 |
|
| | Convertible senior notes | | — |
| | 349,461 |
| | 822,301 |
| | 830,015 |
| | 826,300 |
|
| | Convertible junior subordinated debentures | | 256,872 |
| | 256,872 |
| | 389,522 |
| | 389,522 |
| | 389,522 |
|
| | Shareholders' equity | | 3,154,526 |
| | 2,548,842 |
| | 2,236,140 |
| | 1,036,903 |
| | 744,538 |
|
| | Book value per share | | 8.51 |
| | 7.48 |
| | 6.58 |
| | 3.06 |
| | 2.20 |
|
| |
(1)
| In 2017, we remeasured our net deferred tax assets at the lower enacted corporate income tax rate under the Tax Act. Also, in 2017, we recorded an additional income tax provision for our expected IRS settlement. In the third quarter of 2015 we reversed the valuation allowance against our deferred tax assets. See Note 12 – "Income Taxes" to our consolidated financial statements in Item 8 for a discussion of these tax related matters and their impact on our consolidated financial statements. |
| |
(2)
| Includes dilutive shares in years with net income. See Note 4 – "Earnings Per Share" to our consolidated financial statements in Item 8 for a discussion of our Earnings Per Share. |
MGIC Investment Corporation 2017and Subsidiaries
Item 6. Reserved.
MGIC Investment Corporation 2022 Form 10-K | 5141
|
| | | | | | | | | | | | | | | |
|
MGIC Investment Corporation
2017 Form 10-K
|
Selected Financial and Other Data (continued) |
|
| | | | | | | | | | | | | | | | | | | | | | |
| | | | | | | | | | | | |
| | | | Years Ended December 31, |
| | | | 2017 | | 2016 | | 2015 | | 2014 | | 2013 |
| Other data | New primary insurance written ($ millions) | | $ | 49,123 |
| | $ | 47,875 |
| | $ | 43,031 |
| | $ | 33,439 |
| | $ | 29,796 |
|
| | New primary risk written ($ millions) | | $ | 12,217 |
| | $ | 11,831 |
| | $ | 10,824 |
| | $ | 8,530 |
| | $ | 7,541 |
|
| | | | | | | | | | | | |
| | IIF (at year-end) ($ millions) | | | | | | |
| | |
| | |
|
| | Direct primary IIF | | $ | 194,941 |
| | $ | 182,040 |
| | $ | 174,514 |
| | $ | 164,919 |
| | $ | 158,723 |
|
| | RIF (at year-end) ($ millions) | | | | | | | | | | |
| | Direct primary RIF | | $ | 50,319 |
| | $ | 47,195 |
| | $ | 45,462 |
| | $ | 42,946 |
| | $ | 41,060 |
|
| | Direct pool RIF | | | | | | |
| | |
| | |
|
| | With aggregate loss limits | | 236 |
| | 244 |
| | 271 |
| | 303 |
| | 376 |
|
| | Without aggregate loss limits | | 235 |
| | 303 |
| | 388 |
| | 505 |
| | 636 |
|
| | | | | | | | | | | | |
| | Primary loans in default ratios | | | | | | |
| | |
| | |
|
| | Policies in force | | 1,023,951 |
| | 998,294 |
| | 992,188 |
| | 968,748 |
| | 960,163 |
|
| | Loans in default | | 46,556 |
| | 50,282 |
| | 62,633 |
| | 79,901 |
| | 103,328 |
|
| | Percentage of loans in default | | 4.55 | % | | 5.04 | % | | 6.31 | % | | 8.25 | % | | 10.76 | % |
| | | | | | | | | | | | |
| | Insurance operating ratios (GAAP) | | | | | | | | | | |
| | Loss ratio | | 5.7 | % | | 26.0 | % | | 38.3 | % | | 58.8 | % | | 88.9 | % |
| | Expense ratio | | 16.0 | % | | 15.3 | % | | 14.9 | % | | 14.7 | % | | 18.6 | % |
| | | | | | | | | | | | |
| | Risk-to-capital ratio (statutory) | | | | | | | | |
| | |
|
| | Mortgage Guaranty Insurance Corporation | | 9.5:1 |
| | 10.7:1 |
| | 12.1:1 |
| | 14.6:1 |
| | 15.8:1 |
|
| | Combined insurance companies | | 10.5:1 |
| | 12.0:1 |
| | 13.6:1 |
| | 16.4:1 |
| | 18.4:1 |
|
MGIC Investment Corporation 2017 Form 10-K | 52
Item 7.
Management’s Discussion and Analysis of Financial Condition and Results of Operations.Operations
IntroductionINTRODUCTION
As used below, “we” and “our” refer to MGIC Investment Corporation’s consolidated operations or to MGIC Investment Corporation, as a separate entity, as the context requires. References to "we" and "our" in the context of debt obligations refer to MGIC Investment Corporation. See the "Glossary of terms and acronyms" for definitions and descriptions of terms used throughout this annual report. The Risk Factors contained in Item 1A discuss trends and uncertainties affecting us and are an integral part of the MD&A.
The following is a discussion and analysis of the financial conditions and results of operations for the years ended December 31, 2022 and 2021, including comparisons between 2022 and 2021. Comparisons between 2021 and 2020 have been omitted from this Form 10-K, but can be found in "Item 7 - Management's Discussion and Analysis of Financial Condition and Results of Operations" in our Annual Report on Form 10-K for the year ended December 31, 2021 filed with the SEC.
Forward Looking and Other Statements
As discussed under “Forward Looking Statements and Risk Factors” in Item 1A of Part 1 of this Report, actual results may differ materially from the results contemplated by forward looking statements. We are not undertaking any obligation to update any forward looking statements or other statements we may make in the following discussion or elsewhere in this document even though these statements may be affected by events or circumstances occurring after the forward looking statements or other statements were made. Therefore, no reader of this document should rely on these statements being current as of any time other than the time at which this document was filed with the Securities and Exchange Commission.
MGIC Investment Corporation 20172022 Form 10-K | 5342
|
| | | | | | | | | | | | | | | |
Management's Discussion and Analysis | | | | | | | | | | | | | | |
MGIC Investment Corporation
2017 Form 10-K
| Overview | | | | | | | | | | | | | | |
| | | | | | | | | | | | | | |
| | | | | | | | | | | | | | | |
OVERVIEW
Overview
This Overview of the MD&A highlights selected information and may not contain all of the information that is important to readers of this Annual Report. Hence, this Overview is qualified by the information that appears elsewhere in this Annual Report, including the other portions of the MD&A.
Through ourMGIC, the principal subsidiary of MGIC Investment Corporation, we are a leading provider of PMI inserve lenders throughout the United States as measuredhelping families achieve homeownership sooner by $194.9making affordable low-down-payment mortgages a reality through the use of private mortgage insurance. At December 31, 2022 MGIC had $295.3 billion of primary IIF on a consolidated basis at December 31, 2017.IIF.
| | | | | | | | | | | | | | | | | | | | | |
| Summary of financial results of MGIC Investment Corporation | |
| | | | | | | |
| | Year Ended December 31, | | | |
| (in millions, except per share data) | | 2022 | | 2021 | | Change | |
| Selected statement of operations data | | | | | | | |
| Net premiums earned | | $ | 1,007.1 | | | $ | 1,014.4 | | | (1) | % | |
| Investment income, net of expenses | | 167.5 | | | 156.4 | | | 7 | % | |
| Losses incurred, net | | (254.6) | | | 64.6 | | | N/M | |
| Other underwriting and operating expenses, net | | 236.7 | | | 198.4 | | | 19 | % | |
| Loss on debt extinguishment | | 40.2 | | | 36.9 | | | 9 | % | |
| Income before tax | | 1,090.0 | | | 801.8 | | | 36 | % | |
| Provision for income taxes | | 224.7 | | | 166.8 | | | 35 | % | |
| Net income | | 865.3 | | | 635.0 | | | 36 | % | |
| Diluted income per share | | $ | 2.79 | | | $ | 1.85 | | | 51 | % | |
| | | | | | | |
Non-GAAP Financial Measures (1) | | | | | | | |
| Adjusted pre-tax operating income | | $ | 1,140.0 | | | $ | 831.7 | | | 37 | % | |
| Adjusted net operating income | | 904.8 | | | 658.6 | | | 37 | % | |
| Adjusted net operating income per diluted share | | $ | 2.91 | | | $ | 1.91 | | | 52 | % | |
SUMMARY OF 2022 FINANCIAL RESULTS
|
| | | | | | | | | | | | | |
| | | | | | | | | |
| Summary financial results of MGIC Investment Corporation | | | Year Ended December 31, | | |
| (in millions, except per share data) | | 2017 | | 2016 | | Change |
| Selected statement of operations data | | | | | | |
| Total revenues | | $ | 1,066.1 |
| | $ | 1,062.5 |
| | — | % |
| | Losses incurred, net | | 53.7 |
| | 240.2 |
| | (78 | )% |
| | Loss on debt extinguishment | | 0.1 |
| | 90.5 |
| | N/M |
|
| | Income before tax | | 784.5 |
| | 514.7 |
| | 52 | % |
| | Provision for income taxes | | 428.7 |
| | 172.2 |
| | 149 | % |
| | Net income | | 355.8 |
| | 342.5 |
| | 4 | % |
| | Diluted income per share | | $ | 0.95 |
| | $ | 0.86 |
| | 10 | % |
| | | | | | | | |
| | Non-GAAP Financial Measures (1) | | | | | | |
| | Adjusted pre-tax operating income | | $ | 784.3 |
| | $ | 596.3 |
| | 32 | % |
| | Adjusted net operating income | | 517.7 |
| | 396.3 |
| | 31 | % |
| | Adjusted net operating income per diluted share | | $ | 1.36 |
| | $ | 0.99 |
| | 37 | % |
Summary of 2017 financial results
Net income of $355.8$865.3 million for 20172022 increased by $13.2$230.4 million when compared to the prior year, driven by lower losses incurred, net and the absence of significant losses on debt extinguishment in the current year, partially offset by an increase in the provision for income taxes discussed below. Diluteddiluted income per share of $0.95$2.79 increased by 10%51% when compared to the prior year. The increase in net income primarily reflects a decrease in losses incurred, partially offset by a higher provision for income taxes and other underwriting and operating expenses, net. Diluted income per share increased due to an increase in net income and a decrease in the number of diluted weighted average shares outstanding.
Adjusted net operating income of $517.7for 2022 was $904.8 million for 2017 (2016: $396.3(2021: $658.6 million) and adjusted net operating income per diluted share of $1.36 (2016: $0.99) each increased from the prior year primarily due to lower losses incurred, net.was $2.91 (2021: $1.91). Adjusted net operating income for 2022 and 2021 included adjustments for a loss on debt extinguishment and net realized investment gains (losses).
Losses incurred, net were $53.7$(254.6) million, down 78% asa decrease of $319.1 million compared with losses incurred of $64.6 million for the prior year. While new delinquency notices added approximately $149.6 million to losses incurred in 2022, our re-estimation of loss reserves on previously received delinquency notices resulted in favorable development of approximately $404.1 million, primarily related to a decrease in the estimated claim rate on delinquencies. The favorable development primarily resulted from greater than expected cure rates, as borrower reinstatements and servicer mitigation efforts resulted in more cures than originally estimated. Additionally, home price
appreciation experienced in recent years has allowed borrowers to cure their delinquencies through the sale of their property. In 2021, new delinquentdelinquency notices declined and we experienced higheradded approximately $124.6 million to losses incurred, while our re-estimation of loss reserves on previously received delinquency notices resulted in $60 million of favorable reserveloss development on prior year delinquencies when comparedprimarily due to the prior year. New delinquent noticesdecrease in 2017 increased slightly compared to the prior year due to hurricane activity in the third quarter of 2017, however the estimated claim rate on new notices was approximately 10%, down from approximately 12.5% in thedelinquencies received prior year. Our estimated claim rate on new notices primarily reflects improved cure activity due to the current economic environment, but also reflects a materially lower estimated claim rate on our estimate of new notices causedCOVID-19 pandemic. This was offset by hurricanes. When excluding our estimate of new notices caused by hurricanes, our new notice claim rate was approximately 10.5%.
The loss on debt extinguishment recorded during 2016 reflects the repurchasesrecognition of a portionprobable loss of $6.3 million related to litigation of our outstanding 2%claims paying practices and 5% Notes at amounts above our carrying values. The lossadverse development on debt extinguishment also reflects MGIC's purchase of a portion of our 9% Debentures for which a loss was recognized as the difference between the fair valueLAE reserves and carrying value of the liability component on the purchase date. See Note 7 - "Debt" to our consolidated financial statements for further discussion of the accounting for these transactions.reinsurance.
The increase in our provision for income taxes to $224.7 million in 2017 as2022 compared to the prior year$166.8 million in 2021 was primarily due to a remeasurement of our deferred tax assets to reflect the lower corporate income tax rate under the Tax Act, thean increase in income before tax. Our effective tax rate for 2022 was 20.6% compared to 20.8% for 2021.
Other underwriting and operating expenses, net increased to $236.7 million in 2022 from $198.4 million in 2021 primarily due to higher expenses related to our technology investments, particularly in data and analytics, and an additional tax provision recorded for the expectedincrease in pension expense. Pension expenses increased in 2022 as a result of settlement of our IRSaccounting charges during 2022.
MGIC Investment Corporation 20172022 Form 10-K | 5443
MGIC Investment Corporation and Subsidiaries
|
| | | | | | | | | | | | | | | |
Management's Discussion and Analysis |
MGIC Investment Corporation
2017 Form 10-K
|
Overview (continued) |
BUSINESS ENVIRONMENT
Economic conditions
litigation. See Note 12 - "Income taxes"Due to our consolidated financial statements for further discussion on the Tax Acthigher interest rates and expected IRS settlement.
During 2017, MGIC paid $140 million in dividends to our holding company.
Business environment
Current U.S. economic conditions continue to support favorable housing fundamentals, such as low unemployment, household formations, and appreciating home values. Given the supply and demand dynamics of the current market,higher home prices are expectedin 2022, there was a decrease in home purchases in 2022 after a strong 2021. Higher interest rates also decreased refinance activity during 2022, after a robust 2021. This resulted in a decrease in our NIW, to further appreciate$76.4 billion in 2018. Home price appreciation can have2022 when compared to $120.2 billion in 2021.
The level of interest rates, and home prices may change in the future. For the possible effects of such changes, see our risk factors titled "If the volume of low down payment home mortgage originations declines, the amount of insurance that we write could decline,” “Downturns in the domestic economy or declines in home prices may result in more homeowners defaulting and our losses increasing, with a dampening effect on home purchase activity as it reduces affordability for some borrowers, conversely it may increase the demand forcorresponding decrease in our returns,” and “Changes in interest rates, house prices or mortgage insurance and/or amountcancellation requirements may change the length of mortgagetime that our policies remain in force."
Mortgage insurance due to decreased ability of borrowers to fund a similar down payment percentage absent the appreciation. This recent periodmarket
The past several years of favorable housing fundamentals coupled with,and in our view, high lending standards, has providedgenerally favorable risk characteristics of our recently insured loans contributed to a favorable credit backdrop for the business we have writtengrowing insurance in recent years. In that regard, we have experiencedforce. Higher interest rates and home prices, resulted in a declining delinquent inventory and lower losses and claims paid. Our most recent book years continuedecrease in our NIW in 2022 when compared to experience a low level of losses.2021.
The 10 year (and other) U.S. Treasury benchmarkpercentage of our NIW with DTI ratios over 45% and LTV's over 95% increased in 2022 when compared with 2021. The increase was primarily driven by higher home prices and interest rates, have increased in recent quarters and mortgage interest rates in response have been, on average,a higher during 2017 comparedpercentage of NIW from purchase transactions.
Refer to the historically low rates"Mortgage Insurance Portfolio" for additional discussion of 2016. The gradual increase in mortgage interest rates benefited our business in 2017 as persistency increased, while not materially impacting affordability for first-time homebuyers. Further increases in mortgage rates may impact affordability, which could slow housing activity. Historically however, purchase origination volume has been impacted more by the level and direction of consumer confidence than by changes in interest rates.our NIW mix during 2022.
Competition
PMI.The private mortgage insurance industry remains intenselyis highly competitive and in some instances, companies have loweris expected to remain so. We believe that we currently compete with other private mortgage insurers based on premium rates, underwriting requirements, financial strength (including based on credit or financial strength ratings), customer relationships, name recognition, reputation, strength of management teams and field organizations, the ancillary products and services provided to protectlenders, and the effective use of technology and innovation in the delivery and servicing of our mortgage insurance products.
Pricing practices
In recent years, the industry has materially reduced its use of standard rate cards, which were fairly consistent among competitors, and correspondingly increased its use of (i) "risk-based pricing systems" that use a spectrum of filed rates to allow for formulaic, risk-based pricing based on multiple attributes that may be quickly adjusted within certain parameters, and (ii) customized rate plans, both of which typically have rates lower than the standard rate card. Our increased use of reinsurance over the past several years, and the improved credit profile and reduced loss expectations associated with loans insured after 2008, have helped to mitigate the negative effect of declining premium rates on our expected returns.
For information about competition in the private mortgage insurance industry, see our risk factor titled “Competition or grow
changes in our relationships with our customers could reduce our revenues, reduce our premium yields and/or increase our losses" in Item 1A.
GSE Risk Share Transactions
In 2018, the GSEs initiated secondary mortgage market share.programs with loan level mortgage default coverage provided by various (re)insurers that are not mortgage insurers governed by PMIERs, and that are not selected by the lenders. Due to differences in policy terms, these programs may offer premium rates that are below prevalent single premium LPMI rates. While we view these programs as competing with traditional private mortgage insurance, we participate in these programs from time to time.
The GSEs (and other investors) have also used other forms of credit enhancement that did not involve traditional private mortgage insurance, such as engaging in credit-linked note transactions executed in the capital markets, or using other forms of debt issuances or securitizations that transfer credit risk directly to other investors, including competitors and an affiliate of MGIC; using other risk mitigation techniques in conjunction with reduced levels of private mortgage insurance coverage; or accepting credit risk without credit enhancement.
Government programs. PMI also competes against government mortgage insurance programs such as the FHA, VA, and USDA, primarily for lower FICO score business. The combined market share of primary mortgage insurance written by government programs continuedcontinues to exceed that written by PMI in 2017, however PMI recaptured share from those programs due to writing a higher percentage of purchase originations when compared to government programs. Generally, PMI industry share is 3-4 times higher for purchase originations than refinance originations. Amongst private mortgage insurers, our market share increased slightly from the prior year to 18.3% (source: Inside Mortgage Finance).2022 and 2021.
Refer to "Mortgage Insurance PortfolioPortfolio" for additional discussion ofon market share, the 20172022 business environment and the impact it had on operating measures including NIW, IIF and RIF.
Since December 31, 2015 we have operatedPMIERs
We operate under the requirements of the PMIERs of the GSEs in order to insure loans delivered to or purchased by them. The PMIERs include financial requirements thatas well as business, quality control and certain transactional approval requirements. The financial requirements of the PMIERs require a mortgage insurer’s "Available Assets" (generally only the most liquid assets of an approved mortgage insurerinsurer) to have Available Assets that meetequal or exceed its Minimum"Minimum Required Assets.Assets" (which are based on an insurer's book of risk in force, calculated from tables of factors with several risk dimensions, reduced for credit given for risk ceded under reinsurance transactions, and subject to a floor amount). Based on our application of PMIERs, MGIC's Available Assets under PMIERs totaled $4.8$5.7 billion, an excess of $0.8$2.3 billion over its Minimum Required Assets at December 31, 2017.2022.
A summary of GSE-recommended PMIERs revisions were issued to us late in the fourth quarter of 2017. Refer to "Capital - GSEs" below for a discussion of the impact such revisions are expected to have on our excess Available Assets at their effective date, which is expected to be no earlier than the fourth quarter of 2018.
Business outlook for 2018MGIC Investment Corporation 2022 Form 10-K | 44
MGIC Investment Corporation and Subsidiaries
BUSINESS OUTLOOK FOR 2023
Our outlook for 20182023 should be viewed against the backdrop of the business environment discussed above.
NIW.NIW
Our NIW is affected by total mortgage originations, the percentage of total mortgage originations utilizingusing private mortgage insurance (the "PMI penetration rate"), and our market share within the PMI industry. As of late January 2018,2023, the total average mortgage origination forecasts from the Fannie Mae and MBA indicate mortgage originations of $1.8 trillion in 2023, compared to an estimated $2.3 trillion in 2022. Both purchase originations and refinance transactions are forecasted to decline in 2018 from 2017 levels due2023 when compared to declines2022. As a result of the decrease in refinancingforecasted mortgage originations, we are expecting NIW to be lower in 2023 compared to 2022.
The widespread use of risk based pricing systems by the PMI industry makes it more difficult to compare our rates to those offered by our competitors. We may not be aware of industry rate changes until we observe that our volume of NIW has changed. In addition, business under customized rate plans is awarded by certain customers for only limited periods of time. As a result, our NIW may fluctuate more than offsetting a slight increaseit had in purchase originations. We expect the PMI penetration rate to increase because historically PMI has captured a share of purchase originations, which are forecastpast.
IIF
Our IIF increased 7.6% in 2022 and is expected to be a higher percentage of total originations, that is estimated to be 3-4 times greater
MGIC Investment Corporation 2017 Form 10-K | 55
|
| | | | | | | | | | | | | | | |
Management's Discussion and Analysis |
MGIC Investment Corporation
2017 Form 10-K
|
Overview (continued) |
than that of refinancing originations. Similar to 2017, an increaserelatively flat in the PMI penetration rate should serve to mitigate the decline in total mortgage originations. Although our expectation is for our 2018 NIW to increase slightly from 2017, this will be highly dependent on the actual size of the mortgage origination market, the mix of originations, and competition.
Impact of tax reform. In the fourth quarter of 2017, the Tax Act was enacted that, among other things, reduced federal income tax rates on corporations and eliminated the corporate Alternative Minimum Tax ("AMT"). The reduction in the corporate income tax rate will reduce our effective tax rate in 2018 and we expect it to be approximately 21%, compared to approximately 34% when excluding the impact of remeasuring our net deferred tax assets due to the Tax Act and the additional provision recorded for our expected IRS settlement in 2017. In recent years, we have utilized NOLs to reduce our taxes payable, however we were subject to paying taxes under the AMT. The elimination of the corporate AMT eliminates any cash taxes that would have been paid in 2018. We do not expect the changes to individual income taxes included in the Tax Act to materially impact our business.
IIF and RIF.2023. Our book of IIF is the mainan important driver of our future revenues, and earnings and its growth is driven by our ability to generate NIW and retain existing policies in force,the retention of our IIF, as measured by our persistency. Interest rates influence both our NIW and persistency. InGenerally speaking, in a rising rate environment, total mortgage originations may decline; however, absent material accumulated home price appreciation since the issuance of a policy, we would also expect policy cancellation rates to decline, and in turn increase persistency, although the impact generally lags the change in interest rates. HigherIn 2023, we expect interest rates could reduce affordability for borrowers, which could slow housing activity,to remain elevated compared to recent years and home prices to decline.
Results of particular importance to our industry, slow first-time home buyer purchase activity, resulting in less NIW. Historically however, purchase origination volume has beenoperations
Premiums. Our direct premiums written and earned are impacted more by the level and direction of consumer confidence than by changes in interest rates. We expect our IIF will continue to grow in 2018 due toduring the level of NIW we expect to write in 2018period and our expected persistency.
Resultsin force premium yield, both of operations. We expect our earned premiums growth rate in 2018 to be comparable to that experienced in 2017. The headwinds that have limited earned premium growth in recent years, even with a larger book of IIF,which are expected to persistbe relatively flat in 2023 when compared to a certain extent2022. Premiums earned are also impacted by the amount of accelerated premiums from single premium policy cancellations, which generally decrease as refinance activity decreases. Our unearned premium decreased to $195.3 million at December 31, 2022 from $241.7 million at December 31, 2021.
Our net premiums written and earned are primarily impacted by the changes in 2018. Our premium yield is expected to declinethe direct premiums written and earned noted above and by the amount of premiums we cede under our quota share and excess of loss reinsurance transactions. The amount of premiums we cede in 2018 from 2017, primarily due to changing premium rates, as more fully discussed along with other factors2023 will be affected by any changes in our reinsurance coverage. Premiums we cede under our quota share transactions is also impacted by the profit commission we receive. The amount of profit commission is variable year-to-year and is dependent on the amount of losses incurred ceded. In 2022, negative losses incurred increased the profit commission we received, resulting in lower ceded premiums. Increases in ceded losses incurred will benefit our losses incurred line, but will result in lower profit commission and higher ceded premiums.
Investment income. Net investment income is a material contributor to our results of operations. We expect increasing IIF to counteract the effect on earned premium of a lower premium yield.
In addition to more earned premiums, our revenues are expected to include highernet investment income in 20182023 to increase in comparison to 2022, primarily due to the increasing size of our investment portfolio, combined with higher average investment yields. We expect 2018 losses incurred with respect to delinquent notices receivedThe amount of investment income will be impacted by the change in the current year (2018) toyield we can earn on investments and the level of invested assets. The level of invested assets will primarily be lower thanimpacted by the comparable amount for 2017 asof cash we expect to receive feweruse in financing activities relative to our cash from operations. The magnitude of any change in our invested asset level will be subject to the timing of our financing activities.
Losses. Losses incurred, net is impacted by the level of new delinquent noticesdelinquency notices. Generally, on our primary business, the highest claim frequency years have been the third and fourth year after loan origination. As of December 31, 2022, 80% of our primary RIF was written subsequent to December 31, 2019, 85% of our primary RIF was written subsequent to December 31, 2018, and 88% of our primary RIF was written subsequent to December 31, 2017. The pattern of claim frequency can be affected by many factors, including persistency and deteriorating economic conditions.
Our claims paid activity slowed at the start of the COVID-19 pandemic primarily due to forbearance and foreclosure moratoriums put in 2018.place. Claim activity has not yet returned to pre-COVID-19 levels. We cannot predictexpect net losses and LAE paid to increase, however, the amount, if any,magnitude and timing of 2018 lossesthe increases are uncertain.
Underwriting and operating expenses, net. We expect underwriting and operating expenses, net to be modestly lower in 2023 compared to 2022. In recent years, we have made additional investments in our technology, particularly in data and analytics and will continue to make similar investments in 2023. Pension expenses also increased in 2022 as a result of settlement accounting charges incurred with respectduring 2022. In 2023, we expect to delinquent notices receivedincur settlement accounting charges as a result of lump sum settlements for employees who retired in prior years. The Tax Act will reducethe fourth quarter of 2022.
Income taxes. We expect our 2023 effective tax rate to be approximately 21%, which will reduce.
CAPITAL
MGIC dividend payments to our holding company
The ability of MGIC to pay dividends is restricted by insurance regulation. Amounts in excess of prescribed limits are deemed “extraordinary” and may not be paid if disapproved by the provision for income tax we record against any incomeOCI. A dividend is extraordinary when the proposed dividend amount, plus dividends paid in the twelve months preceding the dividend payment date exceed the ordinary dividend level. In 2023, MGIC could pay $92 million of ordinary dividends without OCI approval, before tax. Excludingtaking into consideration dividends paid in the impactpreceding twelve months. In 2022 and 2021, MGIC paid a cash and/or investment security dividend of remeasuring$800 million and $400 million, respectively, to our net deferred tax assets dueholding company. Future dividend payments from MGIC to the Tax Actholding company will continue to be determined in consultation with the board.
MGIC Investment Corporation 2022 Form 10-K | 45
MGIC Investment Corporation and Subsidiaries
Share repurchase programs
Repurchases may be made from time to time on the additional provision recordedopen market (including through 10b5-1 plans) or through privately negotiated transactions. The repurchase programs may be suspended for periods or discontinued at any time. We repurchased approximately 27.8 million shares in 2022 using approximately $386 million of holding company resources. In 2021, we repurchased approximately 19.0 million shares of our expected IRS settlement,common stock using approximately $291 million of holding company resources. As of December 31, 2022, we had $114 million of authorization remaining to repurchase our effective tax ratecommon stock through the end of 2023 under a share repurchase program approved by our Board of Directors in 2017 would have beenOctober 2021.
The following table shows details of our share repurchase programs.
| | | | | | | | | | | |
| Repurchase Program | Expiration Date | Repurchased (in millions) | Authorization Remaining
(in millions) |
| | | |
| 2020 Authorization | December 31, 2021 | $ | 300 | | $ | — | |
| 2021 Authorization | December 31, 2023 | $ | 386 | | $ | 114 | |
As of December 31, 2022, we had approximately 34%.293 million shares of common stock outstanding which was a decrease of 8.4% from December 31, 2021.
PMIERs.Dividends to shareholders
In December 2017,the first and second quarters of 2022, we receivedpaid quarterly cash dividends of $0.08 per share to shareholders which totaled $51.0 million. In the third and fourth quarters of 2022, we paid quarterly cash dividends of $0.10 per share which totaled $60.7 million. On January 24, 2023, the Board of Directors declared a summaryquarterly cash dividend to holders of proposed changesthe company's common stock of $0.10 per share payable on March 2, 2023, to shareholders of record at the close of business on February 17, 2023.
For information about how the payment of dividends by our holding company will result in an adjustment to the PMIERsconversion rate and price of our convertible securities, see our risk factor titled “Your ownership in our company may be diluted by additional capital that are being recommended to the FHFA by the GSEs. We expect the revised PMIERs to be finalizedwe raise” in 2018 and effective no earlier than the fourth quarter of 2018. See "Capital - GSEs" below for our discussion of the proposed changes we have received.Item 1A.
Capital
GSEs
We must comply with thea GSE's PMIERs to be eligible to insure loans delivered to or purchased by the GSEs. In addition to theirthat GSE. The PMIERs include financial requirements, the PMIERs includeas well as business, quality control and certain transaction approval requirements. The financial requirements of the PMIERs require a mortgage insurer’s “Available Assets” (generally only the most liquid assets of an insurer) to equal or exceed its “Minimum Required Assets” (which are generally based on an insurer’s book of risk in force and are calculated from tables of factors with several risk dimensions, reduced for credit given for risk ceded under reinsurance transactions).
The PMIERs generally require us to hold significantly more Minimum Required Assets for delinquent loans than for performing loans and the Minimum Required Assets required to be held increases as the number of payments missed on a delinquent loan increases.
If MGIC ceases to be eligible to insure loans purchased by one or both of the GSEs, it would significantly reduce the volume of our NIW. FactorsNIW, the substantial majority of which is for loans delivered to or purchased by the GSEs. In addition to the increase in Minimum Required Assets associated with delinquent loans, factors that may negatively impact MGIC’s ability to continue to comply with the financial requirements of the PMIERs include the following:
MGIC Investment Corporation 2017 Form 10-K | 56
|
| | | | | | | | | | | | | | | |
Management's Discussion and Analysisè
| The GSEs may make the PMIERs more onerous in the future. The PMIERs provide that the factors that determine Minimum Required Assets will be updated periodically, or as needed if there is a significant change in macroeconomic conditions or loan performance. We do not anticipate that the regular periodic updates will occur more frequently than once every two years. The PMIERs state that the GSEs will provide notice 180 days prior to the effective date of updates to the factors; however, the GSEs may amend any portion of the PMIERs at any time. |
MGIC Investment Corporationè
2017 Form 10-K
| The PMIERS may be changed in response to the final regulatory capital framework for the GSEs which was established in February 2022. |
Overview (continued)è | Our future operating results may be negatively impacted by the matters discussed in our Risk Factors. Such matters could decrease our revenues, increase our losses or require the use of assets, thereby creating a shortfall in Available Assets. |
| è | Should capital be needed by MGIC in the future, capital contributions from our holding company may not be available due to competing demands on holding company resources, including for repayment of debt. |
On December 18, 2017,Our reinsurance transactions enable us to earn higher returns on our business than we received a summary of proposed changes towould without them because they reduce the PMIERs that are being recommended to the FHFA by the GSEs. Once the PMIERs are finalized, we expect a six-month implementation period before the revised PMIERs are effective. We expect that effectiveness will not be earlier than the fourth quarter of 2018.
If the GSE-recommended changes are adopted with an effective date in the fourth quarter of 2018, we expect that at the effective date, MGIC would continue to have an excess of Available Assets over Minimum Required Assets although this excess wouldwe must hold under PMIERs. However, reinsurance may not always be materially lower than it was at December 31, 2017available to us, or available on similar terms and our reinsurance subjects us to counterparty credit risk. Our access to reinsurance may be disrupted and the terms under the existing PMIERs, and that MGIC would continue to bewhich we are able to pay quarterly dividends to our holding company at the $50 million quarterly rate at which they were paidobtain reinsurance may be less attractive than in the fourth quarterpast due to volatility stemming from circumstances such as higher interest rates, increased inflation, global events such as the Russia-Ukraine war, and other factors. In 2022, execution of 2017. As a result, we expect cash at our holding company at December 31, 2018 would increase over what ittransactions for XOL reinsurance through the ILN market was at December 31, 2017.more challenging primarily due to increased pricing.
We have non-disclosure obligationsThe calculated credit for XOL Transactions under PMIERs is generally based on the PMIERs requirement of the covered loans and the attachment and detachment point of the coverage. PMIERs credit is generally not given for the reinsured risk above the PMIERs requirement. Our existing reinsurance transactions are subject to each ofperiodic review by the GSEs and cannot provide further comment onthere is a risk we will not receive our current level of credit in future periods for the specific provisions of the GSE-recommended changes other than as described above. Until the GSEs and/or FHFA provide public disclosure of proposed or final changes to the existing PMIERs,risk ceded under them. In addition, we do not plan to update or correct any of the disclosure above or provide any additional disclosure regarding any modifications that may occur in the GSE-recommended changes to PMIERs.
Our future operating results may be negatively impacted by the matters discussed in our risk factors. Such matters could decrease our revenues, increase our losses or require the use of assets, thereby creating a shortfall in Available Assets.
Should capital be needed by MGIC in the future, capital contributions from our holding company may not be available due to competing demands on holding company resources, including for repaymentreceive the same level of debt.
While on an overall basis, the amountcredit under future transactions that we receive under existing transactions. If MGIC is not allowed certain levels of Available Assets MGIC must hold in order to continue to insure GSE loans increasedcredit under the PMIERs, over what state regulation currently requires, ourunder certain circumstances, MGIC may terminate the reinsurance transactions mitigate the negative effect of the PMIERs on our returns.without penalties.
State Regulations
The insurance laws of 16 jurisdictions, including Wisconsin, our domiciliary state, require a mortgage insurer to maintain a minimum amount of statutory capital relative to its RIF (or a similar measure) in order for the mortgage insurer to continue to write new business. We refer to these requirements as the “State Capital Requirements.” While they vary among jurisdictions, the most common State Capital Requirements allow for a maximum risk-to-capital ratio of 25 to 1. A risk-to-capital ratio will increase if (i) the percentage decrease in capital exceeds the percentage
MGIC Investment Corporation 2022 Form 10-K | 46
MGIC Investment Corporation and Subsidiaries
decrease in insured risk, or (ii) the percentage increase in capital is less than the percentage increase in insured risk. Wisconsin does not regulate capital by using a risk-to-capital measure but instead requires ana MPP. MGIC's "policyholder position" includes its net worth or surplus and its, contingency reserve.
At December 31, 2017,2022, MGIC’s risk-to-capital ratio was 9.510.2 to 1, below the maximum allowed by the jurisdictions with State Capital Requirements, and its policyholder position was $2.1$3.5 billion above the required MPP of $1.2$2.1 billion. In calculating ourOur risk-to-capital ratio and MPP we are allowedreflect full credit for the risk ceded under our reinsurance transaction with a group of unaffiliated reinsurers.transactions. It is possible that under the revised State Capital Requirements discussed below, MGIC will not be allowed full credit for the risk ceded to the reinsurers.under such transactions. If MGIC is not allowed an agreed level of credit under either the State Capital Requirements or the PMIERs, MGIC may terminate the reinsurance transaction,transactions, without penalty. At this time, we expect MGIC to continue to comply with the current State Capital Requirements; however, you should readrefer to our risk factorsfactor titled “State capital requirements may prevent us from continuing to write new insurance on an uninterrupted basis” in Item 1A for more information about matters that could negatively affect such compliance. At December 31, 2017, the risk-to-capital ratio of our combined insurance operations (which includes a reinsurance affiliate) was 10.5 to 1. Reinsurance transactions with our affiliate permit MGIC to write insurance with a higher coverage percentage than it could on its own under certain state-specific requirements.
The NAIC previously announced plans to revise the minimum capital and surplus requirements for mortgage insurers that are provided for in its Mortgage Guaranty Insurance Model Act. AIn 2019, a working group of state regulators has been considering since 2016released an exposure draft of a revised Mortgage Guaranty Insurance Model Act and a risk-based capital framework to establish capital requirements for mortgage
MGIC Investment Corporation 2017 Form 10-K | 57
|
| | | | | | | | | | | | | | | |
Management's Discussion and Analysis |
MGIC Investment Corporation
2017 Form 10-K
|
Overview (continued) |
insurers, although no date has been established by which the NAIC must propose revisions to the capital requirements and certain items havewere not yet been completely addressed by the framework, including the treatment of ceded risk and minimum capital floors, and action level triggers. Currently we believefloors. In October 2022, the NAIC working group released a revised exposure draft of the Mortgage Guaranty Insurance Model Act that does not include changes to the PMIERs contain the more restrictive capital requirements in most circumstances.
of the existing Model Act.
GSE reformREFORM
The FHFA has been the conservator of the GSEs since 2008 and has the authority to control and direct their operations. The increased role that the federal government has assumed in the residential housing finance system through the GSE conservatorship may increase the likelihood that the business practices of the GSEs change, including through administrative action, in ways that have a material adverse effect on us and that the charters of the GSEs are changed by new federal legislation. In the past, members of Congress have introduced several bills intended to change the business practices of the GSEs and the FHA; however, no legislation has been enacted. The Administration has indicated that the conservatorship of the GSEs should end; however, it is unclear whether and when that would occur and how that would impact us. As a result of the matters referred to above, it
It is uncertain what role the GSEs, FHA and private capital, including PMI,private mortgage insurance, will play in the residential housing finance system in the future or thefuture. The timing and impact of any such changes on our business. In addition, the timing of the impactbusiness of any resulting changes on our business is uncertain. Most meaningfulMany of the proposed changes would require Congressional action to implement and it is difficult to estimate when Congressional action would be final and how long any associated phase-in period may last.
For additional information about the business practices of the GSEs, see our risk factorRisk Factor titled “Changes in the business practices of Fannie Mae and Freddie Mac's ("the GSEs,GSEs"), federal legislation that changes their charters or a restructuring of the GSEs could reduce our revenues or increase our losses”losses.” in Item 1A.
Loan modifications and other similar programs
COVID-19 PANDEMIC
The federal government, including through the U.S. Department of the Treasury and the GSEs, and several lenders have modification and refinance programs to make outstanding loans more affordable to borrowersCOVID-19 pandemic materially impacted our 2020 financial results, as we reserved for losses associated with the goalincreased delinquency notices received. Through December 31, 2022, the vast majority of reducing the number of foreclosures. These programs included HAMP, which expired at the end of 2016, and HARP, which is scheduled to expire at the end of 2018. The GSEsthose delinquency notices have introduced other loan modifications programs to replace HAMP.
From 2008 through 2012, we were notified of modifications that cured, delinquencies that, had they become paid claims, would have resultedresulting in a material increasedecrease in losses incurred as we recognized favorable loss development.
Forbearance for borrowers who were affected by COVID-19 allows mortgage payments to be suspended for a period of time. Historically, forbearance plans have reduced the incidence of our incurred losses. More recently, the number of modifications has decreased significantly. Nearly all of the reported loan modifications were for loans insured in 2009 and prior.
We cannot determine the total benefit we may derive from loan modification programs, particularlylosses on affected loans. However, given the uncertainty aroundsurrounding the re-default rates for defaulted loanslong-term economic impact of COVID-19, it is difficult to predict the ultimate effect of COVID-19 related forbearances on our loss incidence. Whether a loan delinquency will cure, including through modification, when forbearance ends will depend on the economic circumstances of the borrower at that have been modified. Our loss reservestime. The severity of losses associated with delinquencies that do not account for potential re-defaults of current loans.cure will depend on economic conditions at that time, including home prices.
Table t.01 showsForeclosures on mortgages purchased or securitized by the percentage of our primary RIFGSEs were suspended through July 31, 2021. Under a CFPB rule that has been modified as ofwas effective through December 31, 2017.2021, with limited exceptions, servicers were required to ensure that at least one temporary procedural safeguard had been met before referring 120-day delinquent loans for foreclosure. Claim activity has not yet returned to pre-COVID-19 levels.
For additional information about how the COVID-19 pandemic may impact our future financial results, business, liquidity, and/or financial condition, see our Risk Factor titled “The COVID-19 pandemic may materially impact our business and future financial condition.”
FACTORS AFFECTING OUR RESULTS
Our current and future business, results of operations and financial condition are impacted by macroeconomic conditions such as rising interest rates, home prices, housing demand, level of employment, inflation, restrictions and costs on mortgage credit, and other factors. For additional information on how on our business may be impacted see our Risk Factor titled “Downturns in the domestic economy or declines in home prices may result in more homeowners defaulting and our losses increasing, with a corresponding decrease in our returns.”
As noted above, the COVID-19 pandemic may adversely affect our future business, results of operations, and financial condition.
The future effects of changing climatic conditions on our business is uncertain. For information about possible effects, please refer to our Risk Factor titled “Pandemics, hurricanes and other natural disasters may impact our incurred losses, the amount and timing of paid claims, our inventory of notices of default and our Minimum Required Assets under PMIERs.”
|
| | | | | | |
| | Table | t.01 | | | | |
| Modifications | Policy Year | | HARP (1) Modifications | | HAMP & Other Modifications |
| | 2003 and Prior | | 11.0% | | 40.5% |
| | 2004 | | 19.2% | | 43.3% |
| | 2005 | | 25.0% | | 41.0% |
| | 2006 | | 28.7% | | 39.6% |
| | 2007 | | 40.4% | | 31.1% |
| | 2008 | | 55.6% | | 18.6% |
| | 2009 | | 36.8% | | 5.4% |
| | 2010 - 2017 | | —% | | 0.2% |
| | | | | | |
| | Total | | 8.1% | | 7.4% |
| |
(1)
| Includes proprietary programs that are substantially the same as HARP. |
MGIC Investment Corporation 20172022 Form 10-K | 5847
MGIC Investment Corporation and Subsidiaries
|
| | | | | | | | | | | | | | | |
Management's Discussion and Analysis |
MGIC Investment Corporation
2017 Form 10-K
|
Overview (continued) |
Approximately 15.5% of our total primary RIF has been modified as of December 31, 2017. Based on loan count at December 31, 2017, the loans associated with 96.8% of all HARP modifications and 75.6% of HAMP and other modifications were current.
Factors affecting our results
Our results of operations are affected by:
Premiums written and earned
Premiums written and earned in a year are influenced by:
•NIW, which increases IIF. Many factors affect NIW, including the volume of low down payment home mortgage originations and competition to provide credit enhancement on those mortgages from the FHA, the VA, other mortgage insurers, and other alternatives to mortgage insurance, including GSE programs that may reduce or eliminate the demand for mortgage insurance and other alternatives to mortgage insurance. NIW does not include loans previously insured by us that are modified, such as loans modified under HARP.
•Cancellations, which reduce IIF. Cancellations due to refinancings are affected by the level of current mortgage interest rates compared to the mortgage coupon rates throughout the in force book, current home values compared to values when the loans in the in force book were insured and the terms on which mortgage credit is available. Home price appreciation can give homeowners the right to cancel mortgage insurance on their loans if sufficient home equity is achieved. Cancellations also result from policy rescissions, which require us to return any premiums received on the rescinded policies, and claim payments, which require us to return any premium received on the related policies from the date of default on the insured loans. Cancellations of single premium policies, which are generally non-refundable, result in immediate recognition of any remaining unearned premium.
•Premium rates, which are affected by product type, competitive pressures, the risk characteristics of the insured loans, and the percentage of coverage on the insured loans.loans, and PMIERs capital requirements. The substantial majority of our monthly and annual mortgage insurance premiums are under premium plans for which, for the first ten years of the policy, the amount of premium is determined by multiplying the initial premium rate by the original loan balance; thereafter, the premium rate resets to a lower rate used for the remaining life of the policy. However, for loans that have utilized HARP, the initial ten-year period resets as of the date of the HARP transaction. The remainder of our monthly and annual premiums are under premium plans for which premiums are determined by a fixed percentage of the loan’s amortizing balance over the life of the policy.
| |
• | Premiums ceded, net of a profit commission, under reinsurance agreements. See Note 9 – “Reinsurance” to our consolidated financial statements for a discussion of our reinsurance agreements. |
•Premiums ceded, net of profit commission under our QSR Transactions, and premiums ceded under our XOL Transactions, are primarily affected by the percentage of our IIF subject to our reinsurance transactions. The profit commission under our QSR Transactions also varies inversely with the level of ceded losses incurred on a “dollar for dollar” basis and can be eliminated at ceded loss levels higher than what we have experienced on our QSR Transactions. As a result, lower levels of losses incurred result in a higher profit commission and less benefit from ceded losses incurred; higher levels of losses incurred result in more benefit from ceded losses incurred and a lower profit commission (or for certain levels of accident year loss ratios, its elimination). See Note 9 – “Reinsurance” to our consolidated financial statements for a discussion of our reinsurance transactions.
•Premiums earned are generated by the insurance that is in force during all or a portion of the period. A change in the
average IIF in the current period compared to an earlier period is a factor that will increase (when the average in force is higher) or reduce (when it is lower) premiums written and earned in the current period, although this effect may be enhanced (or mitigated) by differences in the average premium rate between the two periods, as well as by premiums that are returned or expected to be returned in connection with claim payments and rescissions, and premiums ceded under reinsurance agreements. Also, NIW and cancellations during a period will generally have a greater effect on premiums written and earned in subsequent periods than in the period in which these events occur.factors discussed above.
Investment income
Our investment portfolio is composed principally of investment grade fixed income securities. The principal factors that influence investment income are the size of the portfolio and its yield. As measured by amortized cost (which excludes changes in fair value, such as from changes in interest rates), the size of the investment portfolio is mainly a function of cash generated from (or used in) operations, such as NPW,net premiums written, investment income, net claim payments and expenses, and cash provided by (or used for) non-operating activities, such as debt or stock issuances or repurchases.repurchases, and dividends.
MGIC Investment Corporation 2017 Form 10-K | 59
|
| | | | | | | | | | | | | | | |
Management's Discussion and Analysis |
MGIC Investment Corporation
2017 Form 10-K
|
Overview (continued) |
Losses incurred
Losses incurred are the current expense that reflects estimatedclaim payments, costs of settling claims, and changes in our estimates of payments that will ultimately be made as a result of delinquencies on insured loans. As explained under “Critical Accounting PoliciesEstimates” below, except in the case of a premium deficiency reserve, we recognize an estimate of this expense only for delinquent loans. ThePrior to the COVID-19 pandemic, the level of new delinquencies has historically followed a seasonal pattern, with new delinquencies in the first part of the year lower than new delinquencies in the latter part of the year, though this pattern can be affected by theyear. The state of the economy, and local housing markets.markets, and various other factors, including the COVID-19 pandemic, may result in delinquencies not following the typical pattern. Losses incurred are generally affected by:
•The state of the economy, including unemployment and housing values, each of which affects the likelihood that loans will become delinquent and whether loans that are delinquent cure their delinquency.
•The product mix of the in force book, with loans having higher risk characteristics generally resulting in higher delinquencies and claims.
•The size of loans insured, with higher average loan amounts tending to increase losses incurred.incurred losses.
•The percentage of coverage on insured loans, with deeper average coverage tending to increase incurred losses.
•The rate at which we rescind policies or curtail claims. Our estimated loss reserves incorporate our estimates of future rescissions of policies and curtailments of claims, and reversals of rescissions and curtailments. We collectively refer to such rescissions and denials as “rescissions” and variations of this term. We call reductions to claims "curtailments."
•The distribution of claims over the life of a book. Historically, the first few years after loans are originated are a period of relatively low claims, with claims increasing substantially for several years subsequent and then declining, although persistency, the condition of the economy, including unemployment and housing prices, and other factors can affect this pattern. For example, a weak economy or housing
MGIC Investment Corporation 2022 Form 10-K | 48
MGIC Investment Corporation and Subsidiaries
value declines can lead to claims from older books increasing, continuing at stable levels or experiencing a lower rate of decline. See further information under “Mortgage insurance earnings and cash flow cycle” below.
| |
• | Losses ceded under reinsurance agreements. See Note 9 – “Reinsurance” to our consolidated financial statements for a discussion of our reinsurance agreements. |
Underwriting and other expenses
Most of our operating expenses are fixed, with some variability due to contract underwriting volume. Contract underwriting generates fee income included in “Other revenue.” Underwriting and other expenses are net of any ceding commission associated with our•Losses ceded under reinsurance agreements.transactions. See Note 9 – “Reinsurance” to our consolidated financial statements for a discussion of our reinsurance agreements.transactions.
Underwriting and other expenses
Underwriting and other expenses includes items such as employee compensation, fees for professional and consulting services, depreciation and maintenance expense, and premium taxes, and are reported net of ceding commissions associated with our QSR Transactions. Employee compensation expenses are variable due to share-based compensation, changes in benefits, and changes in headcount (which can fluctuate due to volume of NIW). See Note 9 – “Reinsurance” to our consolidated financial statements for a discussion of ceding commission on our QSR Transactions.
Interest expense
Other
Certain activities that we do not consider being part of our fundamental operating activities may also impact our results of operations and are described below.
Net realized investment gainsGains (losses) on investments and other financial instruments
Realized•Fixed income securities. Investment gains and losses are a function ofreflect the difference between the amount received on the sale of a fixed income security and the fixed income security’s cost basis, as well as any "other than temporary"credit allowances and any impairments ("OTTI") recognized in earnings.on securities we intend to sell prior to recovery of its amortized cost basis. The amount received on the sale of fixed income securities is affected by the coupon rate of the security compared to the yield of comparable securities at the time of sale.
•Equity securities. Investment gains and losses are accounted for as a function of the periodic change in fair value.
MGIC
•Financial instruments. Investment Corporation 2017 Form 10-K | 60
|
| | | | | | | | | | | | | | | |
Management's Discussion and Analysis |
MGIC Investment Corporation
2017 Form 10-K
|
Overview (continued) |
Loss on debt extinguishment
At times, we may undertakeGains and losses on debt extinguishment result from discretionary activities that are undertaken to enhance our capital position, improve our debt profile and/or reduce potential dilution from our outstanding convertible debt. Extinguishing our outstanding debt obligations early through these discretionary activities may result in losses primarily driven by the payment of consideration in excess of our carrying value.value , and the write off of
unamortized debt issuance costs on the extinguished portion of the debt.
Mortgage insurance earnings and cash flow cycleMORTGAGE INSURANCE EARNINGS AND CASH FLOW CYCLE
In general, the majority of any underwriting profit that a book generates occurs in the early years of the book, with the largest portion of any underwriting profit realized in the first year following the year the book was written. Subsequent years of a book may result in either underwriting profit or underwriting losses. This pattern of results typically occurs because relatively few of the claimsincurred losses on delinquencies that a book will ultimately experience typically occur in the first few years of the book, when premium revenue is highest, while subsequent years are affected by declining premium revenues, as the number of insured loans decreases (primarily due to loan prepayments) and increasing losses. The typical pattern is also a function of premium rates generally resetting to lower levels after ten years. The state of the economy, local housing markets and various other factors, including the COVID-19 pandemic, may result in delinquencies not following the typical pattern.
CYBERSECURITY
As part of our business, we maintain large amounts of confidential and proprietary information, including personal information of consumers and employees, on our servers and those of cloud computing services. Federal and state laws designed to promote the protection of such information require businesses that collect or maintain personal information to adopt information security programs, and to notify individuals, and in some jurisdictions, regulatory authorities, of security breaches involving personally identifiable information. All information technology systems are potentially vulnerable to damage or interruption from a variety of sources, including by cyber attacks, such as those involving ransomware. The Company discovers vulnerabilities and regularly blocks a high volume of attempts to gain unauthorized access to its systems. Globally, attacks are expected to continue accelerating in both frequency and sophistication with increasing use by actors of tools and techniques that will hinder the Company’s ability to identify, investigate and recover from incidents. Such attacks may also increase as a result of retaliation by Russia in response to actions taken by the U.S. and other countries in connection with Russia's military invasion of Ukraine. The Company operates under a hybrid workforce model and such model may be more vulnerable to security breaches.
While we have information security policies and systems in place to secure our information technology systems and to prevent unauthorized access to or disclosure of sensitive information, there can be no assurance with respect to our systems and those of our third-party vendors that unauthorized access to the systems or disclosure of the sensitive information, either through the actions of third parties or employees, will not occur. Due to our reliance on information technology systems, including ours and those of our customers and third-party service providers, and to the sensitivity of the information that we maintain, unauthorized access to the systems or disclosure of the information could adversely affect our reputation, severely disrupt our operations, result in a loss of business and expose us to material claims for damages and may require that we provide
MGIC Investment Corporation 20172022 Form 10-K | 6149
MGIC Investment Corporation and Subsidiaries
|
| | | | | | | | | | | | | | | |
Management's Discussion and Analysis | | | | | | | | | | | | |
MGIC Investment Corporation
2017 Form 10-K
| | | | | | | | | | | | | | | |
| | | | | | | | | | | | | | |
| | | | | | | | | | | | | | | |
free credit monitoring services to individuals affected by a security breach.For additional information about our IT systems and cybersecurity, see our risk factor titled “Information technology system failures or interruptions may materially impact our operations and adversely affect our financial results" and "We could be materially adversely affected by a cyber security breach or failure of information security controls." in Item 1A.
ExplanationMGIC Investment Corporation 2022 Form 10-K | 50
MGIC Investment Corporation and reconciliation of our use of non-GAAP financial measuresSubsidiaries
Non-GAAP financial measures
EXPLANATION AND RECONCILIATION OF OUR USE OF NON-GAAP FINANCIAL MEASURES
NON-GAAP FINANCIAL MEASURES
We believe that use of the Non-GAAP measures of adjusted pre-tax operating income (loss), adjusted net operating income (loss) and adjusted net operating income (loss) per diluted share facilitate the evaluation of the company's core financial performance thereby providing relevant information to investors. These measures are not recognized in accordance with GAAP and should not be viewed as alternatives to GAAP measures of performance.
Adjusted pre-tax operating income (loss)is defined as GAAP income (loss) before tax, excluding the effects of net realized investment gains (losses), gain (loss)and losses on debt extinguishment, net impairment losses recognized in income (loss) and infrequent or unusual non-operating items where applicable.
Adjusted net operating income (loss)is defined as GAAP net income (loss) excluding the after-tax effects of net realized investment gains (losses), gain (loss)and losses on debt extinguishment, net impairment losses recognized in income (loss), and infrequent or unusual non-operating items where applicable and the effects of changes in our deferred tax valuation allowance.applicable. The amounts of adjustments to components of pre-tax operating income (loss) are tax effected using a federal statutory tax rate of 35%21%.
Adjusted net operating income (loss) per diluted shareis calculated in a manner consistent with the accounting standard regarding earnings per share by dividing (i) adjusted net operating income (loss) after making adjustments for interest expense on convertible debt, whenever the impact is dilutive by (ii) diluted weighted average common shares outstanding, which reflects share dilution from unvested restricted stock units and from convertible debt when dilutive under the "if-converted"“if-converted” method.
Although adjusted pre-tax operating income (loss) and adjusted net operating income (loss) exclude certain items that have occurred in the past and are expected to occur in the future, the excluded items represent items that are: (1) not viewed as part of the operating performance of our primary activities; or (2) impacted by both discretionary and other economic or regulatory factors and are not necessarily indicative of operating trends, or both. These adjustments, along with the reasons for their treatment, are described below. Trends in the profitability of our fundamental operating activities can be more clearly identified without the fluctuations of these adjustments. Other companies may calculate these measures differently. Therefore, their measures may not be comparable to those used by us.
| |
(1) | Net realized investment gains (losses). The recognition of net realized investment gains or losses can vary significantly across periods as the timing of individual securities sales is highly discretionary and is influenced by such factors as market opportunities, our tax and capital profile, and overall market cycles.(1)Net realized investment gains (losses). The recognition of net realized investment gains or losses can vary significantly across periods as the timing of individual securities sales is highly discretionary and is influenced by such factors as market opportunities, our tax and capital profile, and overall market cycles. (2)Gains and losses on debt extinguishment. Gains and losses on debt extinguishment result from discretionary activities that are undertaken to enhance our capital position, improve our debt profile, and/or reduce potential dilution from our outstanding convertible debt. (3)Infrequent or unusual non-operating items. Items that are non-recurring in nature and are not part of our primary operating activities. |
| |
(2) | Gains and losses on debt extinguishment. Gains and losses on debt extinguishment result from discretionary activities that are undertaken to enhance our capital position, improve our debt profile, and/or reduce potential dilution from our outstanding convertible debt.
|
| |
(3) | Net impairment losses recognized in earnings. The recognition of net impairment losses on investments can vary significantly in both size and timing, depending on market credit cycles, individual issuer performance, and general economic conditions.
|
| |
(4) | Infrequent or unusual non-operating items. Our income tax expense for 2017 reflects the remeasurement of our net deferred tax assets to reflect the lower corporate income tax rate under the Tax Act. Our income tax expense also includes amounts related to our IRS dispute and is related to past transactions which are non-recurring in nature and are not part of our primary operating activities.
|
MGIC Investment Corporation 20172022 Form 10-K | 6251
|
| | | | | | | | | | | | | | | |
Management's Discussion and Analysis |
MGIC Investment Corporation
2017 Form 10-K
|
Non-GAAP (continued) |
|
| | | | | | | | | | | | | | | | | | | | | | | | | | | | | | | | | | | | | |
| Non-GAAP reconciliations |
| |
| Reconciliation of Income before tax / Net income to Adjusted pre-tax operating income / Adjusted net operating income: |
| |
| | | Years Ended December 31, |
| | | 2017 | | 2016 | | 2015 |
| (in thousands) | | Pre-tax | | Tax provision (benefit) | | Net (after-tax) | | Pre-tax | | Tax provision (benefit) | | Net (after-tax) | | Pre-tax | | Tax provision (benefit) | | Net (after-tax) |
| Income before tax / Net income | | $ | 784,496 |
| | $ | 428,735 |
| | $ | 355,761 |
| | 514,714 |
| | 172,197 |
| | 342,517 |
| | 487,687 |
| | (684,313 | ) | | 1,172,000 |
|
| Adjustments: | | | | | | | | | | | | | | | | | | |
| Additional income tax provision related to the rate decrease included in the Tax Act | | — |
| | (132,999 | ) | | 132,999 |
| | — |
| | — |
| | — |
| | — |
| | — |
| | — |
|
| Additional income tax provision related to IRS litigation | | — |
| | (29,039 | ) | | 29,039 |
| | — |
| | (731 | ) | | 731 |
| | — |
| | (580 | ) | | 580 |
|
| Net realized investment gains | | (249 | ) | | (87 | ) | | (162 | ) | | (8,932 | ) | | (3,126 | ) | | (5,806 | ) | | (28,361 | ) | | (9,926 | ) | | (18,435 | ) |
| Loss on debt extinguishment | | 65 |
| | 23 |
| | 42 |
| | 90,531 |
| | 31,686 |
| | 58,845 |
| | 507 |
| | 177 |
| | 330 |
|
| Effect of change in deferred tax asset valuation allowance | | — |
| | — |
| | — |
| | — |
| | — |
| | — |
| | — |
| | 847,810 |
| | (847,810 | ) |
| Adjusted pre-tax operating income / Adjusted net operating income | | $ | 784,312 |
| | $ | 266,633 |
| | $ | 517,679 |
| | $ | 596,313 |
| | $ | 200,026 |
| | $ | 396,287 |
| | $ | 459,833 |
| | $ | 153,168 |
| | $ | 306,665 |
|
| | | | | | | | | | | | | | | | | | | |
| Reconciliation of Net income per diluted share to Adjusted net operating income per diluted share: |
| | | | | | | | | | | | | | | | | | | |
| Weighted average diluted shares outstanding | | | | | | 394,766 |
| | | | | | 431,992 |
| | | | | | 468,039 |
|
| Net income per diluted share | | | | | | $ | 0.95 |
| | | | | | $ | 0.86 |
| | | | | | $ | 2.60 |
|
| Additional income tax provision related to the rate decrease included in the Tax Act | | | | | | 0.34 |
| | | | | | — |
| | | | | | — |
|
| Additional income tax provision related to IRS litigation | | | | | | 0.07 |
| | | | | | — |
| | | | | | — |
|
| Net realized investment gains | | | | | | — |
| | | | | | (0.01 | ) | | | | | | (0.04 | ) |
| Loss on debt extinguishment | | | | | | — |
| | | | | | 0.14 |
| | | | | | — |
|
| Effect of change in deferred tax asset valuation allowance | | | | | | — |
| | | | | | — |
| | | | | | (1.81 | ) |
| Adjusted net operating income per diluted share | | | | | | $ | 1.36 |
| | | | | | $ | 0.99 |
| | | | | | $ | 0.75 |
|
MGIC Investment Corporation 2017and Subsidiaries
| | | | | | | | | | | | | | | | | | | | | | | | | | | | | | | | | | | | | | | | | | | | |
| Non-GAAP reconciliations |
|
| Reconciliation of Income before tax / Net income to Adjusted pre-tax operating income / Adjusted net operating income: |
|
| | Years Ended December 31, |
| | 2022 | | 2021 | | |
| (in thousands) | | Pre-tax | | Tax Effect | | Net
(after-tax) | | Pre-tax | | Tax Effect | | Net
(after-tax) | | | | | | |
| Income before tax / Net income | | $ | 1,090,034 | | | $ | 224,685 | | | $ | 865,349 | | | 801,777 | | | 166,794 | | | 634,983 | | | | | | | |
| Adjustments: | | | | | | | | | | | | | | | | | | |
| | | | | | | | | | | | | | | | | | |
| | | | | | | | | | | | | | | | | | |
| Net realized investment (gains) losses | | 9,745 | | | 2,046 | | | 7,699 | | | (7,009) | | | (1,472) | | | (5,537) | | | | | | | |
| Loss on debt extinguishment | | 40,199 | | | 8,442 | | | 31,757 | | | 36,914 | | | 7,752 | | | 29,162 | | | | | | | |
| Adjusted pre-tax operating income / Adjusted net operating income | | $ | 1,139,978 | | | $ | 235,173 | | | $ | 904,805 | | | $ | 831,682 | | | $ | 173,074 | | | $ | 658,608 | | | | | | | |
| | | | | | | | | | | | | | | | | | |
| Reconciliation of Net income per diluted share to Adjusted net operating income per diluted share: |
| | | | | | | | | | | | | | | | | | |
| Weighted average diluted shares outstanding | | | | | | 311,229 | | | | | | | 351,308 | | | | | | | |
| Net income per diluted share | | | | | | $ | 2.79 | | | | | | | $ | 1.85 | | | | | | | |
| | | | | | | | | | | | | | | | | | |
| | | | | | | | | | | | | | | | | | |
| Net realized investment (gains) losses | | | | | | 0.02 | | | | | | | (0.02) | | | | | | | |
| Loss on debt extinguishment | | | | | | 0.10 | | | | | | | 0.08 | | | | | | | |
| Adjusted net operating income per diluted share | | | | | | $ | 2.91 | | | | | | | $ | 1.91 | | | | | | | |
MGIC Investment Corporation 2022 Form 10-K | 6352
MGIC Investment Corporation and Subsidiaries
MORTGAGE INSURANCE PORTFOLIO
|
| | | | | | | | | | | | | | | |
Management's Discussion and Analysis | | | | | | | | | | | | |
MGIC Investment Corporation
2017 Form 10-K
| | | | | | | | | | | | | | | |
| | | | | | | | | | | | | | |
| | | | | | | | | | | | | | | |
Mortgage Insurance Portfolio
MortgageThe total amount of mortgage originations
The primary mortgage insurance market is estimated to have declined in 2017 (table t.02), due to lower refinancing originations (chart c.01). Refinance originations fell as a resultgenerally influenced by the level of higher mortgagenew and existing home sales, interest rates, on average, but continued solid housing fundamentals, such as household formations, low unemployment,the percentage of homes purchased for cash, and low interest rates supported homethe level of refinance activity. PMI market share of total mortgage originations is influenced by the mix of purchase activity. Mortgage origination estimates indicate that the decline inand refinance volume offset an increase in purchase volume in 2017 compared to the prior year. Mortgage originations in 2018 are forecast to decrease from 2017 estimated levels because of an additional decline in refinancing volume as mortgage interest rates are anticipated to trend higher. However, purchase originations are expected to increase again which generally has a greater impact on theoriginations. PMI industry as historically the industry'smarket share is 3-4 times higher for purchase originations than refinancing originations. Competition from government mortgage insurance programs, discussed below, will also continue to impactimpacted by the market share of PMI. In considerationtotal originations of these factors, our 2018 NIW is expectedthe FHA, VA, USDA, and other alternatives to mortgage insurance, including GSE programs that may reduce or eliminate the demand for mortgage insurance.
Total mortgage originations in 2022 as compared to 2021 reflects higher interest rates and home prices, contributing to a decrease in home purchase activity in 2022 after a strong 2021. Total mortgage originations are forecasted to be slightly higher than that of 2017.lower in 2023, in comparison to the last two years. Both purchase and refinance markets are forecasted to decrease in 2023 when compared to estimates for 2022.
E - Estimated, F- Forecast
Source: GSEsFannie Mae and MBA estimates/forecasts as of January 2018. Amounts2023. Amounts represent the average of all sources.
As a result of the forecasted decrease in mortgage originations discussed above, our 2023 NIW is expected to be lower than 2022. |
| | | | | | | | |
| | Table | t.02 | | | | | | |
| Estimated total of PMI, FHA, USDA, and VA primary mortgage insurance | (in billions) | | 2017 | | 2016 | | 2015 |
| Primary mortgage insurance | | $719 | | $762 | | $646 |
The total estimated mortgage insurance volume is shown below.
| | | | | | | | | | | | | | | | |
| Estimated total of PMI, FHA, USDA, and VA primary mortgage insurance |
| | | | | | |
| (in billions) | | Twelve Months Ended December 31, 2022 | | Twelve Months Ended December 31, 2021 | | |
| Primary mortgage insurance | | $858 | | $1,352 | | |
Source: Inside Mortgage Finance - February 15, 201817, 2023 or SEC filings. Includes HARP NIW.
MORTGAGE INSURANCE INDUSTRY Mortgage insurance industry (see tables t.03 and t.04)
We compete against five other private mortgage insurers, as well as government mortgage insurance programs, such asincluding those offered by the FHA, VA, and USDA. We believe that we currently compete with other private mortgage insurers based on pricing, underwriting requirements, financial strength, customer relationships, name recognition, reputation, the strengthRefer to "Overview - Business Environment - Competition" for a discussion of our management team and field organization,competitive position.
PMI's market share is primarily impacted by competition from government mortgage insurance programs. The PMI industry's market share in 2022 increased compared to the ancillary products and services provided to lenders andmarket share in 2021.
| | | | | | | | | |
| Estimated primary MI market share |
| | | |
| (% of total primary MI volume) | Twelve Months Ended December 31, 2022 | Twelve Months Ended December 31, 2021 | |
| PMI | 47.2% | 43.2% | |
| FHA | 26.7% | 24.7% | |
| VA | 24.5% | 30.2% | |
| USDA | 1.7% | 1.9% | |
Source: Inside Mortgage Finance - February 17, 2023 or SEC filings. Includes HARP NIW.
MGIC's estimated market share within the effective use of technology and innovationPMI industry is shown in the deliverytable below. Our risk-based pricing engine, MiQ, allows for frequent granular pricing changes including those to address our view of emerging and servicingevolving market conditions and risk. We expect our market share to decline in first quarter of 2023 due to actions taken in 2022 reflective of our mortgage insurance products. Muchviews of risk return. Additional discussion of the competition incompetitive landscape of the industry centers onrefer to "Overview - Business Environment - Competition" and additional discussion of pricing practices which, in the last few years included: (i) reductions in standard filed rates on BPMI policies, (ii) use by certain competitors of a spectrum of filed ratesrefer to allow for formulaic, risk-based pricing (commonly referred to as "black-box" pricing); and (iii) use of customized rates (discounted from published rates). These pricing practices were driven by both the implementation of the financial requirements of the PMIERs, as well as industry competition to maintain"Overview - Business Environment - Pricing Practices" | | | | | | | | | |
| Estimated MGIC market share |
| | | |
| (% of total primary private MI volume) | Twelve Months Ended December 31, 2022 | Twelve Months Ended December 31, 2021 | |
| MGIC | 18.9% | 20.6% | |
Source: Inside Mortgage Finance - February 17, 2023 or grow market share. The result of pricing changes in 2016, in which we participated, generally decreased filed premium rates on higher-FICO score loans and increased rates onSEC filings. Includes HARP NIW.
MGIC Investment Corporation 20172022 Form 10-K | 6453
MGIC Investment Corporation and Subsidiaries
|
| | | | | | | | | | | | | | | |
Management's Discussion and Analysis |
MGIC Investment Corporation
2017 Form 10-K
|
Mortgage Insurance Portfolio (continued) |
NEW INSURANCE WRITTEN
The following tables provide information about loan characteristics associated with our NIW.
lower-FICO score loans. We also continue to use authority set forth in our rate filings to provide customized premium rates to qualified lenders. We believe our current rates allow us to compete effectively across many FICO scores; however, there is no assurance that pricing competition will not intensify further, which could result in a decrease inThe percentage of our NIW and/or returns.
with DTI ratios over 45% and LTV's over 95% increased in 2022 compared with 2021. The FHA offers fixed premiumincreases were primarily driven by higher home prices and interest rates, across all FICO scores and often has lower monthly premium rates across lower FICO business, which are effectively cross-subsidized by higher-FICO score premium rates. As a result, we have seen, and expect to continue to see some lenders utilize FHA insurance for the lower-FICO score business for which we compete. However, not all lower-FICO score business is migrating to the FHA because PMI may be cancelable when FHA insurance is not, lenders value our customer service, PMI continues to be an efficient and cost-effective alternative to the FHA for many borrowers, and some lenders perceive greater legal risks under FHA versus GSE programs. Any reduction in premium rates by the FHA that create a larger payment differential than at present could result in more business utilizing FHA mortgage insurance.
Even though the PMI industry's pricing changes raised premiums on lower-FICO score loans in 2016, the PMI industry captured a greater share of the total low down payment (PMI and government programs) insured volume in 2017 and 2016, when compared to the respective prior year (see table t.03). In addition to a higher mix of purchase originations, the increases in PMI share were due in part to new 97% LTV loan offerings from lenders that sell loans to the GSEs, which provided an alternative to similar FHA loan programs for qualified borrowers, and some lenders are shifting business away from the FHA due to perceived legal risks.
Our market share increased in 2017 when compared to 2016. The decline in our market share in 2016 from 2015 levels was due to the overall competitive environment, and we believe the decline was principally attributable to our maintaining greater pricing discipline than certain competitors in LPMI single premium policies. We plan to continue to focus on writing new insurance that meets our risk-adjusted return thresholds across the spectrum of loans we insure and providing market-leading customer service.
|
| | | | | |
| | Table | t.03 | | | |
| Estimated primary MI market share | (% of total primary MI volume) | 2017 | 2016 | 2015 |
| PMI | 37.6% | 35.4% | 34.0% |
| FHA | 35.6% | 35.5% | 39.3% |
| | VA | 24.1% | 26.6% | 23.9% |
| | USDA | 2.7% | 2.5% | 2.8% |
Source: Inside Mortgage Finance - February 15, 2018. Includes HARP NIW.
|
| | | | | |
| | Table | t.04 | | | |
| Estimated MGIC market share | (% of total primary private MI volume) | 2017 | 2016 | 2015 |
| MGIC | 18.3% | 17.8% | 19.9% |
Source: Inside Mortgage Finance - February 15, 2018 or SEC filings. Excludes HARP NIW.
New insurance written
From our perspective, the 2017 NIW has favorable underlying risk characteristics as we and lenders, in our view, maintained high underwriting standards, despite an increase in the percentage of business with LTVs 95% and above (see table t.06) and the GSEs underwriting requirements for DTIs became more liberal in the second half of 2017. We maintained a high percentage of monthly premium business, which is almost exclusively BPMI (see table t.07). Refinancing activity declined in 2017 compared to 2016 when it was particularly strong due to historically low mortgage interest rates that persisted for much of that year. The percentage of NIW from LTVs 95.01% and above increased due to 97%purchase transactions.
| | | | | | | | | | | | | | | | |
| Primary NIW by FICO score |
| | | | | | |
| | Years Ended December 31, |
| (% of primary NIW) | | 2022 | | 2021 | | |
| 760 and greater | | 43.1 | % | | 45.6 | % | | |
| 740 - 759 | | 18.5 | % | | 17.5 | % | | |
| 720 - 739 | | 14.9 | % | | 13.7 | % | | |
| 700 - 719 | | 10.9 | % | | 11.1 | % | | |
| 680 - 699 | | 7.3 | % | | 7.3 | % | | |
| 660 - 679 | | 3.3 | % | | 2.7 | % | | |
| 640 - 659 | | 1.3 | % | | 1.6 | % | | |
| 639 and less | | 0.7 | % | | 0.5 | % | | |
| Total | | 100 | % | | 100 | % | | |
| | | | | | | | | | | | | | | | |
| Primary NIW by loan-to-value |
| | | | | | |
| | Years Ended December 31, |
| (% of primary NIW) | | 2022 | | 2021 | | |
| 95.01% and above | | 12.3 | % | | 10.8 | % | | |
| 90.01% to 95.00% | | 49.3 | % | | 43.7 | % | | |
| 85.01% to 90.00% | | 28.0 | % | | 30.0 | % | | |
| 80.01% to 85% | | 10.4 | % | | 15.5 | % | | |
| Total | | 100 | % | | 100 | % | | |
| | | | | | | | | | | | | | | | |
| Primary NIW by debt-to-income ratio |
| | | | | | |
| | Years Ended December 31, |
| (% of primary NIW) | | 2022 | | 2021 | | |
| 45.01% and above | | 21.3 | % | | 13.6 | % | | |
| 38.01% to 45.00% | | 32.3 | % | | 30.0 | % | | |
| 38.00% and below | | 46.4 | % | | 56.4 | % | | |
| Total | | 100 | % | | 100 | % | | |
| | | | | | | | | | | | | | | | |
| Primary NIW by policy payment type |
| | | | | | |
| | Years Ended December 31, |
| (% of primary NIW) | | 2022 | | 2021 | | |
| Monthly premiums | | 95.7 | % | | 92.5 | % | | |
| Single premiums | | 4.3 | % | | 7.4 | % | | |
| Annual Premiums | | — | % | | 0.1 | % | | |
| | | | | | | | | | | | | | | | |
| Primary NIW by type of mortgage |
| | | | | | |
| | Years Ended December 31, |
| (% of primary NIW) | | 2022 | | 2021 | | |
| Purchases | | 97.4 | % | | 79.7 | % | | |
| Refinances | | 2.6 | % | | 20.3 | % | | |
We consider a variety of loan characteristics when accessing the risk of a loan. The following tables provides information about loans with one or more of the following characteristics associated with our NIW: LTV programs offered by lenders, whileratios greater than 95%, mortgages with borrowers having FICO scores below 680, including those with borrowers having FICO scores of 620-679, mortgages with borrowers having DTI ratios greater than 45%, each attribute as determined at the percentagetime of NIW from LTVs 90.00% down to 80.01% declined due to a lower amount of refinancing originations by borrowers whose home values increased but still were required to have PMI.loan origination.
| | | | | | | | | | | | | | | | |
| Primary NIW by number of attributes discussed above |
| | | | | | |
| | Years Ended December 31, |
| (% of primary NIW) | | 2022 | | 2021 | | |
| One | | 31.5 | % | | 26.2 | % | | |
| Two or More | | 3.6 | % | | 1.5 | % | | |
MGIC Investment Corporation 2017 Form 10-K | 65
|
| | | | | | | | | | | | | | | |
Management's Discussion and Analysis |
MGIC Investment Corporation
2017 Form 10-K
|
Mortgage Insurance Portfolio (continued) |
|
| | | | | | | | | | | |
| | Table | t.05 | | | | | | |
| Primary NIW by FICO score | | | Years Ended December 31, |
| (% of primary NIW) | | 2017 | | 2016 | | 2015 |
| | 740 and greater | | 58.6 | % | | 59.1 | % | | 57.7 | % |
| | 700 - 739 | | 26.0 | % | | 25.5 | % | | 25.2 | % |
| | 660 - 699 | | 12.1 | % | | 12.3 | % | | 13.6 | % |
| | 659 and less | | 3.3 | % | | 3.1 | % | | 3.5 | % |
| | Total | | 100 | % | | 100 | % | | 100 | % |
|
| | | | | | | | | | | |
| | Table | t.06 | | | | | | |
| Loan-to-Value | | | Years Ended December 31, |
| | (% of primary NIW) | | 2017 | | 2016 | | 2015 |
| | 95.01% and above | | 10.7 | % | | 5.8 | % | | 4.4 | % |
| | 90.01% to 95.00% | | 46.5 | % | | 47.8 | % | | 50.1 | % |
| | 85.01% to 90.00% | | 29.5 | % | | 31.7 | % | | 33.1 | % |
| | 80.01% to 85% | | 13.3 | % | | 14.7 | % | | 12.4 | % |
|
| | | | | | | | | | | |
| | Table | t.07 | | | | | | |
| Policy payment type | | | Years Ended December 31, |
| (% of primary NIW) | | 2017 | | 2016 | | 2015 |
| | Monthly premiums | | 80.8 | % | | 80.6 | % | | 79.3 | % |
| | Single premiums | | 19.0 | % | | 19.1 | % | | 20.4 | % |
| | Annual Premiums | | 0.2 | % | | 0.3 | % | | 0.3 | % |
|
| | | | | | | | | | | |
| | Table | t.08 | | | | | | |
| Type of mortgage | | | Years Ended December 31, |
| | (% of primary NIW) | | 2017 | | 2016 | | 2015 |
| | Purchases | | 88.6 | % | | 80.4 | % | | 81.3 | % |
| | Refinances | | 11.4 | % | | 19.6 | % | | 18.7 | % |
IIF andAND RIF (see table t.09)
Our book of IIF grew 7.6% in 2017 due to2022, and 11.3% in 2021, as NIW growth and a 10% decline in cancellations, each when compared to the prior year.more than offset policy cancellations. Cancellation activity is primarily due toimpacted by refinancing activity, but is also impacted by rescissions, cancellations due to claim payment, and policies cancelled when borrowers achieve the required amount of home equity.equity, and cancellations due to claim payment. Refinancing activity has historically been affected by the level of mortgage interest rates and the level of home price appreciation. Cancellations generally move inversely to the change in the direction of interest rates, although they generally lag a change in direction.
Persistency
Persistency.Our persistency at December 31, 20172022 was 80.1%79.8% compared to 76.9%62.6% at December 31, 2016.2021. Since 2000, our year-end persistency ranged from a high of 84.7% at December 31, 2009 to a low of 47.1% at December 31, 2003. WithOur persistency rate is primarily affected by the current and expected level of current mortgage interest rates we expect a low levelcompared to the mortgage coupon rates on our IIF, which affects the vulnerability of refinance activitythe IIF to refinancing; and the current amount of equity that borrowers have in the homes underlying our persistency in 2018 will be comparable to that of 2017.IIF.
| | | | | | | | | | | | | | | | | | | |
| Insurance in force and risk in force |
| | | | | | | |
| | Years Ended December 31, |
| ($ in billions) | | 2022 | | 2021 | | |
| NIW | | $ | 76.4 | | | $ | 120.2 | | | |
| Cancellations | | (55.5) | | | (92.4) | | | |
| Increase in primary IIF | | $ | 20.9 | | | $ | 27.8 | | | |
| | | | | | |
| Direct primary IIF as of December 31, | | $ | 295.3 | | | $ | 274.4 | | | |
| | | | | | | |
| | | | | | |
| Direct primary RIF as of December 31, | | $ | 76.5 | | | $ | 69.3 | | | |
| | | | | | | |
|
| | | | | | | | | | | | | | |
| | Table | t.09 | | | | | | |
| Insurance in force and risk in force | | | Years Ended December 31, |
| ($ in billions) | | 2017 | | 2016 | | 2015 |
| | NIW | | $ | 49.1 |
| | $ | 47.9 |
| | $ | 43.0 |
|
| | Cancellations | | (36.2 | ) | | (40.4 | ) | | (33.4 | ) |
| | Increase in primary IIF | | $ | 12.9 |
| | $ | 7.5 |
| | $ | 9.6 |
|
| | | | | | | | |
| | Direct primary IIF as of December 31, | | $ | 194.9 |
| | $ | 182.0 |
| | $ | 174.5 |
|
| | | | | | | | |
| | Direct primary RIF as of December 31, | | $ | 50.3 |
| | $ | 47.2 |
| | $ | 45.5 |
|
MGIC Investment Corporation 20172022 Form 10-K | 6654
MGIC Investment Corporation and Subsidiaries
|
| | | | | | | | | | | | | | | |
Management's Discussion and Analysis |
MGIC Investment Corporation
2017 Form 10-K
|
Mortgage Insurance Portfolio (continued) |
CREDIT PROFILE OF OUR PRIMARY RIF
Credit profile of our primary RIF(see table t.10)
The proportion of our total primary RIF written after 2008 has been steadily increasing in proportion to our total primary RIF. Our 2009 and later books possess significantly improved risk characteristics when compared to our 2005-2008 origination years. The loans we insured beginning in 2009, on average, have substantially higher FICO scoresbooks. Modification and lower LTVs than those insured in 2005-2008. The credit profile of our pre-2009 RIF has benefited fromrefinance programs, such as HARP.HAMP and HARP, allowswhich expired at the end of 2016 and 2018, respectively, but have been replaced by other GSE modification programs, make outstanding loans more affordable to borrowers who are not delinquent, but who may not otherwise be ablewith the goal of reducing the number of foreclosures. As of December 31, 2022, modifications accounted for approximately 4.2% of our total primary RIF, compared to refinance their loans under the current GSE underwriting standards due to, for example, the current LTV exceeding 100%, to refinance and lower their note rate.5.4% at December 31, 2021. Loans associated with 96.8%87% of all our HARP modifications were current as of December 31, 2017. The aggregate of our 2009-2017 books and our HARP modifications accounted for approximately 86% of our total primary RIF at December 31, 2017.
Table t.10 presents2022. For additional information on the composition of our primary RIF see "Business - Our Products and Services"
The composition of our primary RIF by policy year as of December 31, 2017, 2016,2022 and 2015.2021 is shown below:
| | | | Table | t.10 | | | | | | | | | | | | | | | | | | | | | |
| Primary risk in force | | | December 31, 2017 | | December 31, 2016 | | December 31, 2015 | Primary risk in force |
| ($ in billions) | | RIF | % of RIF | | RIF | % of RIF | | RIF | % of RIF | |
| | 2009+ | | $ | 39,248 |
| 78 | % | | $ | 33,368 |
| 71 | % | | $ | 28,339 |
| 62 | % | |
| | 2005 - 2008 (HARP) | | 3,773 |
| 7 | % | | 4,489 |
| 9 | % | | 5,237 |
| 12 | % | |
| | Other years (HARP) | | 308 |
| 1 | % | | 396 |
| 1 | % | | 509 |
| 1 | % | |
| | Subtotal | | 43,330 |
| 86 | % | | 38,253 |
| 81 | % | | 34,085 |
| 75 | % | |
| | Other years (Non-HARP) | | 1,095 |
| 2 | % | | 1,475 |
| 3 | % | | 1,933 |
| 4 | % | |
| | 2005- 2008 (Non-HARP) | | 5,894 |
| 12 | % | | 7,467 |
| 16 | % | | 9,444 |
| 21 | % | |
| | Subtotal | | 6,989 |
| 14 | % | | 8,942 |
| 19 | % | | 11,377 |
| 25 | % | |
| | Total Primary RIF | | $ | 50,319 |
| 100 | % | | $ | 47,195 |
| 100 | % | | $ | 45,462 |
| 100 | % | |
| ($ in millions) | | ($ in millions) | | December 31, 2022 | | December 31, 2021 |
| 2004 and prior | | 2004 and prior | | 411 | | 500 |
| 2005 - 2008 | | 2005 - 2008 | | 3,083 | | 3,728 |
| 2009 - 2015 | | 2009 - 2015 | | 1,753 | | 2,865 |
| 2016 - 2022 | | 2016 - 2022 | | 71,225 | | 62,244 | |
| Total | | Total | | 76,472 | | 69,337 |
Pool and other insurancePOOL AND OTHER INSURANCE
MGIC has written no new pool insurance since 2008, however, for a variety of reasons, including responding to capital market alternatives to private mortgage insurance and customer demands, MGIC may write pool risk in the future. Our direct pool RIF was $471$276 million ($236196 million on pool policies with aggregate loss limits and $235$80 million on pool policies without aggregate loss limits) at December 31, 20172022 compared to $547$305 million ($244206 million on pool policies with aggregate loss limits and $303$99 million on pool policies without aggregate loss limits) at December 31, 2016.2021. If claim payments associated with a specific pool reach the aggregate loss limit, the remaining IIF within the pool would be cancelled and any remaining defaults under the pool would be removed from our default inventory.
In connection with the second halfGSEs' CRT programs, an insurance subsidiary of 2016 we participated in GSEMGIC provides insurance and reinsurance covering portions of the credit risk transfer transactions through an affiliaterelated to certain reference pools of MGIC. Each GSE launched a new credit risk transfer offering that involved credit insurance policies with a pool structure that primarily covered loansmortgages acquired by the GSEs. Our RIF, as reported to be deliveredus, related to the GSE in the future. The policies provide additional coverage beyond primary mortgage insurance on 30-year fixed-rate mortgages with 80.01-95% LTVs. These transactions were immaterial to our financial statements in 2017these programs was approximately $226 million and 2016$321 million as of December 31, 2022 and given the risk insured, are expected to remain immaterial to our financial statements in future periods. We did not enter into any GSE credit risk transfer transactions during 2017 and any future participation will need to be evaluated based upon the terms offered and expected returns.December 31, 2021, respectively.
MGIC Investment Corporation 20172022 Form 10-K | 6755
MGIC Investment Corporation and Subsidiaries
|
| | | | | | | | | | | | | | | |
Management's Discussion and Analysis | | | | | | | | | | | | |
MGIC Investment Corporation
2017 Form 10-K
| | | | | | | | | | | | | | | |
| | | | | | | | | | | | | | |
| | | | | | | | | | | | | | | |
CONSOLIDATED RESULTS OF OPERATIONS
Consolidated Results of Operations
The following section of the MD&A provides a comparative discussion of our Consolidated Results of Operations for the three-yeartwo-year period ended December 31, 2017.2022. For a discussion of the Critical Accounting PoliciesEstimates used by us that affect the Consolidated Results of Operations, see "Critical Accounting Policies"Estimates" below.
Revenues
| | | | | | | | | | | | | | | | | | | | |
| Revenues |
| | | | | | |
| | Year Ended December 31, |
| (In millions) | | 2022 | | 2021 | | % Change |
| Net premiums written | | $ | 960.7 | | | $ | 969.0 | | | (1) | |
| | | | | | |
| Net premiums earned | | $ | 1,007.1 | | | $ | 1,014.4 | | | (1) | |
| Investment income, net of expenses | | 167.5 | | | 156.4 | | | 7 | |
| Net gains (losses) on investments and other financial instruments | | (7.5) | | | 5.9 | | | N/M |
| Other revenue | | 5.6 | | | 9.0 | | | (38) | |
| Total revenues | | $ | 1,172.8 | | | $ | 1,185.7 | | | (1) | |
|
| | | | | | | | | | | | | |
| | | | | | | | |
| Revenues | | | Year Ended December 31, |
| | (in millions) | | 2017 | | 2016 | | 2015 |
| | Net premiums written | | $ | 998.0 |
| | $ | 975.1 |
| | $ | 1,020.3 |
|
| | | | | | | | |
| | Net premiums earned | | $ | 934.7 |
| | $ | 925.2 |
| | $ | 896.2 |
|
| | Investment income, net of expenses | | 120.9 |
| | 110.7 |
| | 103.7 |
|
| | Net realized investment gains | | 0.2 |
| | 8.9 |
| | 28.4 |
|
| | Other revenue | | 10.2 |
| | 17.7 |
| | 13.0 |
|
| | Total revenues | | $ | 1,066.0 |
| | $ | 1,062.5 |
| | $ | 1,041.3 |
|
Net premiums written and earned
2017 decreased 1%, respectively, in 2022 compared to 2016. NPW increased 2% fromwith the prior year, due to a decline in premium refunds and lower ceded premiums due to a higher profit commission. Premium refunds declined and our profit commission increased due to lower losses incurred. NPE increased slightly from the prior year due to a decline in premium refunds and lower ceded premiums, which offset lower premiums from our IIF during the year as our premium yield (discussed below) decreased.
2016 compared to 2015.NPW decreased 4% from the prior year primarily because ceded premiums were lower in 2015 due to the commutation of our 2013 QSR Transaction in the third quarter of 2015, which was a non-recurring transaction. As part of the commutation, unearned ceded premiums were remitted back to us from the reinsurers, and we returned the related ceding commissions, which had the effect of increasing our profit commission. Partially offsetting the higher 2016 ceded premiums was an increase in new business premiums in 2016 and a reduction in premium refunds due to lower claim activity.
NPE increased 3% in 2016 compared to 2015 reflecting higher earned premiums from single premium policies and lower premium refunds. The increase in earned premiums on single premium policies was driven by refinance activity as single premium policies are generally non-refundable.year. The decrease in premium refunds was due to lower claim activity. The increase in net premiums earned was offset in part by the effects of our 2013 QSR Transaction commutation in 2015, which resulted in a non-recurring increase in our profit commission.
See "Overview – Factors Affecting Our Results" above for additional factors that also influence the amount of net premiums written and earned in 2022 compared to the prior year is primarily due to a year.decrease in the direct premium yield, offset by a decrease in ceded premiums written and earned.
MGIC Investment Corporation 2017 Form 10-K | 68
|
| | | | | | | | | | | | | | | |
Management's Discussion and Analysis |
MGIC Investment Corporation
2017 Form 10-K
|
Consolidated Results of Operations (continued) |
Premium yieldyields
Premium yield is NPEnet premiums earned divided by average IIF during the year and is influenced by a number of key drivers, which have a varying impact from period to period. Table t.11 reconciles the change inThe following table provides information related to our premium yield for 2022, and 2021.
| | | | | | | | | | | | |
| Premium Yield |
| | |
| | Year Ended December 31, |
| (in basis points) | | 2022 | 2021 | |
| In force portfolio yield | (1) | | 39.4 | | 42.2 | | |
| Premium refunds | | 0.1 | | (0.6) | | |
| Accelerated earnings on single premium policies | | 1.0 | | 3.2 | | |
| Total direct premium yield | | 40.5 | | 44.8 | | |
| Ceded premiums earned, net of profit commission and assumed premiums | (2) | | (5.2) | | (5.9) | | |
| Net premium yield | | 35.3 | | 38.9 | | |
(1) Total direct premiums earned, excluding premium refunds and accelerated premiums from single premium policy cancellations divided by average primary insurance in force.
(2) Assumed premiums include those from our participation in GSE CRT programs, of which the years ended 2017impact on the net premium yield was 0.3 bps in 2022 and 2016 from0.4 bps in 2021
Changes in the net premium yields when compared to the respective prior years.
|
| | | | | | | | |
| | Table | t.11 | | | | |
| Premium yield | (in basis points) | | 2017 | | 2016 |
| | Premium yield - prior year | | 51.9 |
| | 52.8 |
|
| | Reconciliation: | | | | |
| | Change in premium rates | | (3.8 | ) | | (3.0 | ) |
| | Change in premium refunds and accruals | | 1.3 |
| | 2.6 |
|
| | Single premium policy persistency | | (0.6 | ) | | 1.0 |
|
| | Reinsurance | | 0.8 |
| | (1.5 | ) |
| | Premium yield - end of year | | 49.6 |
| | 51.9 |
|
Change in premium rates
Changing premium rates decreased our premium yield in 2017 and 2016 primarily due toyear periods reflect the following factors.following:
The books we wrote in 2009 and after have a lower average premium rate than prior books due to several factors, including, lower risk characteristics.
The monthly premium program used for the substantial majority of loans we insured provides for a set premium rate for the first ten years of the policy and a lower premium rate thereafter. The initial ten-year period is reset when the loan is refinanced under HARP. As of December 31, 2017, approximately 1% of our total primary IIF was written in 2008, has not been refinanced under HARP, and is subject to a rate reset beginning in 2018.
2017 compared to 2016. The reduction in our 2017 premium yield compared to 2016 was primarily due to the increase in the percentage of our IIF that was written in 2009 and after to 79% as of December 31, 2017 from 72% as of December 31, 2016. In addition, as of December 31, 2016 approximately 4% of our total IIF was written in 2007 and was subject to premium rate resets in 2017, which resulted in a reduction in our premium yield. Our 2017 premium yield also reflects the full-year impact of IIF written in 2006 that was subject to premium rate resets during 2016.
2016 compared to 2015. The reduction in our 2016 premium yield compared to 2015 was primarily due to the increase in the percentage of our IIF that was written in 2009 and after to 72% as of December 31, 2016 from 63% as of December 31, 2015. In addition, as of December 31, 2015, approximately 2% of our total IIF was written in 2006 and was subject to premium rate resets in 2016, which resulted in a reduction in our premium yield. Our 2016 premium yield also reflects the full-year impact of IIF written in 2005 that was subject to premium rate resets during 2015.
Change in premium refunds and premium refund accruals (excluding most single premium policies)
Premium refunds upon claim payment or rescission decrease our premium yield. Generally, the level of premiums we refund and our premium refund accrual are highly variable from period to period.
| |
– | When a policy is cancelled for a reason other than rescission or claim payment, all premium that is non-refundable is immediately earned and any refundable premium from the cancellation date is returned to the servicer or borrower. Non-refundable premium, primarily associated with our single premium policies, is discussed below. |
| |
– | When a policy is rescinded, all previously collected premium is returned to the servicer. When a policy is cancelled due to claim payment, we return any premium received since the date of default. |
2017 compared to 2016. Our losses incurred, net declined in 2017 from 2016 levels resulting in lower amounts of premium refunds, and our lower estimated claim rate is a factor in estimating premiums to be refunded in future periods. Refer to Note 8 - "Loss Reserves" in our consolidated financial statements for the
MGIC Investment Corporation 2017 Form 10-K | 69
|
| | | | | | | | | | | | | | | |
Management's Discussion and AnalysisIn force Portfolio Yield |
MGIC Investment Corporation
2017 Form 10-K
|
Consolidated Results of Operations (continued) |
amount we had accrued for our estimate of premiums to be refunded on expected claim payments as of December 31, 2017 and 2016, respectively.
2016 compared to 2015. Our net losses and LAE paid and ending delinquent inventory both declined in 2016 from 2015 levels resulting in less premium being refunded and reducing the amount we estimated to be refunded in future periods.
Single premium policy persistency
Generally, the premium on a single premium policy is not refundable and is earned over the estimated policy life. Therefore, if persistency is less than was assumed when the policy was written, the effective premium yield will increase.
2017 compared to 2016. The effect of cancellations of single premium policies prior to the completion of their estimated policy life on our earned premiums was approximately $9 million less in 2017 than 2016. Cancellation activity in 2016 was elevated as historically low mortgage interest rates led to high refinancing activity.
2016 compared to 2015. The effect of cancellations of single premium policies prior to the completion of their estimated policy life on our earned premiums was approximately $19 million more in 2016 than 2015. Cancellation activity in 2016 was elevated as historically low mortgage interest rates led to high refinancing activity.
Reinsurance
The use of reinsurance lowers our premium yield, however the magnitude of the impact varies from period to period due to the following considerations.
è
| |
– | The amountA larger percentage of our IIF coveredis from book years with lower premium rates due to a decline in premium rates in recent years resulting from pricing competition, insuring mortgages with lower risk characteristics, lower required capital, the availability of reinsurance and certain policies undergoing premium rate resets on their ten-year anniversaries. |
| Premium Refunds |
è
| Premium refunds are primarily driven by reinsurance affectsclaim activity and our estimate of refundable premiums on our delinquency inventory. The low level of claims received have resulted in a lower level of premium refunds. Our estimate of refundable premium on our delinquency inventory fluctuates with changes in our delinquency inventory and our estimate of the amountnumber of loans in our delinquency inventory that will result in a claim. |
| Accelerated earnings on single premium policies |
è
| The lower level of refinance transactions has reduced the benefit from accelerated earned premium from cancellation of single premium policies prior to their estimated policy life. |
| Ceded premiums earned, net of profit commission and assumed premiums |
è
| Ceded premiums earned, net of profit commission adversely impacts our net premium yield. Ceded premiums earned, net of profit commission, are associated with the QSR Transactions and the XOL Transactions. Assumed premiums consists primarily of premiums and losses incurred that are subject to the 30% cede rate. We cede premiums earned and received, which are reduced by a profit commission that varies by the level of losses we cede.from GSE CRT programs. See “Reinsurance Transactions“ below for further discussion on our reinsurance transactions. |
2017 compared to 2016. The adverse impact of reinsurance to
As discussed in our Risk Factor titled "Competition or changes in our relationships with our customers could reduce our revenues, reduce our premium yields and/or increase our losses," the private mortgage insurance industry is highly competitive and premium rates have declined over the past several years. With the smaller origination market, higher persistency rate, and continued high credit quality for NIW expected in 2023, we expect our in force portfolio premium yield in 2017 was 0.8 basis points less than in 2016, as our average IIFto remain relatively flat during 2023.
MGIC Investment Corporation 2022 Form 10-K | 56
MGIC Investment Corporation and Subsidiaries
See "Overview – Factors Affecting Our Results" above for additional factors that also influence the year increased by a higher percentage than the increase inamount of net premiums ceded, before considering our profit commission. In addition, our profit commission increased in 2017 compared to 2016 due to a lower level of ceded losses incurred, thereby resultingwritten and earned in a lower amount of earned premiums ceded on a net basis.year.
2016 compared to 2015. The adverse impact ofREINSURANCE TRANSACTIONS
Quota share reinsurance to our premium yield in 2016 was 1.5 basis points more than in 2015, which was in part due the commutation of our 2013 QSR Transaction in 2015 that resulted in a non-recurring increase in our profit commission and in turn reduced ceded premiums.
Our reinsurance affects premiums, underwriting expenses and losses incurred and should be analyzed by reviewing its total effect on our statements of operations, as discussed below under “Reinsurance agreements.”
Reinsurance agreements
Our quota share reinsurance affects various lines of our statements of operations and therefore we believe it should be analyzed by reviewing its total effect on our pre-tax net income, as described below.
We cede a fixed percentage of premiums earned and received on insurance covered by the agreement.
We receive the benefit of a profit commission through a reduction in the premiums we cede. The profit commission varies directly and inversely with the level of losses on a "dollar for dollar" basis and is eliminated at levels of losses that we do not expect to occur. This means that lower levels of losses result in a higher profit commission and less benefit from ceded losses; higher levels of losses result in more benefit from ceded losses and a lower profit commission (or for levels of losses we do not expect, its elimination).
MGIC Investment Corporation 2017 Form 10-K | 70
|
| | | | | | | | | | | | | | | |
Management's Discussionè | We cede a fixed percentage of premiums earned and Analysisreceived on insurance covered by the agreements. |
MGIC Investment Corporation
2017 Form 10-K
è | We receive the benefit of a profit commission through a reduction in the premiums we cede. The profit commission varies inversely with the level of losses incurred on a "dollar for dollar" basis and can be eliminated at loss levels higher than we are currently experiencing. As a result, lower levels of losses incurred result in a higher profit commission and less benefit from ceded losses incurred, higher levels of ceded losses incurred result in more benefit from ceded losses incurred and a lower profit commission (or for certain levels of losses of accident year loss ratios, its elimination). |
Consolidated Resultsè | We receive the benefit of Operations (continued)a ceding commission through a reduction in underwriting expenses equal to 20% of premiums ceded (before the effect of the profit commission). |
| è | We cede a fixed percentage of losses incurred on insurance covered by the agreements. |
We receive the benefit of a ceding commission through a reduction in underwriting expenses equal to 20% of premiums ceded (before the effect of the profit commission).
We cede a fixed percentage of losses incurred on insurance covered by the agreement.
Table t.12 belowThe following table provides information related to our quota share reinsurance agreementsQSR Transactions for 2017, 2016,2022 and 2015.2021.
| | | | | | | | | | | | | | | | |
| Quota share reinsurance |
| | | | | | |
| | As of and For the Years Ended December 31, |
| (Dollars in thousands) | | 2022 | | 2021 | | |
| Statements of operations: |
| Ceded premiums written and earned, net of profit commission | | $ | 86,435 | | | $ | 118,537 | | | |
| % of direct premiums written | | 8 | % | | 11 | % | | |
| % of direct premiums earned | | 7 | % | | 10 | % | | |
| Profit commission | | 176,084 | | | 153,759 | | | |
| Ceding commissions | | 52,071 | | | 53,460 | | | |
| Ceded losses incurred | | (19,837) | | | 9,862 | | | |
| | | | | | |
| Mortgage insurance portfolio: |
| Ceded RIF (in millions) | | | | | | |
| 2015 QSR | | $ | — | | | $ | 889 | | | |
| 2019 QSR | | — | | | 1,539 | | | |
| 2020 QSR | | 3,902 | | | 4,754 | | | |
| 2021 QSR | | 6,809 | | | 7,470 | | | |
| 2022 QSR | | 5,027 | | | — | | | |
| Credit Union QSR | | 2,261 | | | 1,594 | | | |
| Total ceded RIF | | $ | 17,999 | | | $ | 16,246 | | | |
Ceded premiums written, and earned net of profit commission decreased in 2022 when compared with the prior year primarily due to an increase in the profit commission, which reduces ceded premiums written and earned. The increase in profit commission was driven by negative losses incurred in 2022. |
| | | | | | | | | | | | | | | |
| | Table | t.12 | | | | | | | |
| Quota Share Reinsurance | | | As of and For the Years Ended December 31, | |
| (Dollars in thousands) | | 2017 | | 2016 | | 2015 | |
| | NIW subject to quota share reinsurance agreements | | 84 | % | | 89 | % | | 91 | % | |
| | IIF subject to quota share reinsurance agreements | | 78 | % | | 76 | % | | 73 | % | |
| | | | | | | | | |
| | Statements of operations: | | | | | | | |
| | Ceded premiums written, net of profit commission | | $ | 120,974 |
| | $ | 125,460 |
| | $ | 41,233 |
| (1) |
| | % of direct premiums written | | 11 | % | | 11 | % | | 4 | % | |
| | Ceded premiums earned, net of profit commission | | $ | 120,974 |
| | $ | 125,460 |
| | $ | 88,587 |
| (1) |
| | % of direct premiums earned | | 11 | % | | 12 | % | | 9 | % | |
| | Profit commission | | $ | 125,629 |
| | $ | 112,685 |
| | $ | 112,847 |
| (1) |
| | Ceding commissions | | $ | 49,321 |
| | $ | 47,629 |
| | $ | 30,816 |
| (1) |
| | Ceded losses incurred | | $ | 22,336 |
| | $ | 30,201 |
| | $ | 17,484 |
| (1) |
| | | | | | | | | |
| | Mortgage insurance portfolio: | | | | | | | |
| | Ceded RIF (in millions) | | $ | 11,849 |
| | $ | 10,764 |
| | $ | 9,887 |
| |
| | | | | | | | | |
| |
(1)
| As discussed in Note 9 - "Reinsurance" to our consolidated financial statements, the 2013 QSR Transaction was commuted on July 1, 2015 and replaced with our 2015 QSR Transaction, which increased the IIF and corresponding RIF covered by reinsurance. Premiums are ceded on an earned and received basis under the 2015 QSR Transaction. |
Ceded losses incurred for the year ended December 31, 2022 reflect favorable loss reserve development on previously received delinquency notices. See "Losses Incurred, net” below for discussion of our loss reserves.
We terminated our 2015 and 2019 QSR Transactions effective December 31, 2022 and incurred an early termination fee of $2 million on our 2019 QSR Transaction. We terminated our 2017 and 2018 QSR Transactions effective December 31, 2021 and incurred an early termination fee of $5 million. The termination of the QSR Transactions reduce the amount of IIF and RIF subject to QSR transactions.
Covered Risk
The amountpercentages of our NIW, new risk written, IIF, and RIF subject to our QSR Transactions variesas shown in the following table will vary from period to period in part due to loan level exclusion terms. For example, our 2017 QSR Transaction excludes NIW with amortization terms of 20 years or less, but allows higher limits of DTI and loan levels than our 2015 QSR Transaction. In addition, the QSR Transactions contain coverage thresholds that may be triggered depending on the mix of our risk written during the period. Theperiod and the number of loans we insured with DTIs greater than 45%active QSR Transactions.
| | | | | | | | | | | | | | | | |
| Quota share reinsurance |
| | | | | | |
| | As of and For the Years Ended December 31, |
| | 2022 | | 2021 | | |
| NIW subject to QSR Transactions | | 87.4 | % | | 81.9 | % | | |
| New Risk Written subject to QSR Transactions | | 93.0 | % | | 90.5 | % | | |
| IIF subject to QSR Transactions | | 67.9 | % | | 78.4 | % | | |
| RIF subject to QSR Transactions | | 73.0 | % | | 77.9 | % | | |
| | | | | | |
The NIW subject to quota share reinsurance increased in the second half of 2017 after the requirements of the GSE underwriting guidelines were made more liberal.2022 compared to 2021. The risk written on those loansincrease was driven by a decrease in refinance transactions which resulted in a decrease in NIW with DTIs greaterLTVs less than 45% exceeded theor equal to 85%, which generally have lower coverage limit under our 2017 QSR Transaction resulting in the percentage of NIW covered in 2017 to declinepercentages, and are excluded from the prior year.QSR Transactions.
The effects2023 QSR Transaction.
We have agreed to terms on a quota share transaction with a group of our QSR Transactions described and presented above result in a net pre-tax cost of the reinsurance, with respect to a covered loan, of 6% (but can be lower if losses are materially higher than we expect). This cost is derived by dividing the reduction in our pre-tax net income from such loans with reinsurance by our direct (that is, without reinsurance) premiums from such loans. Although the net cost of the reinsurance is generally constant at 6%, the effect of the reinsurance on the various components of pre-tax income discussed above will vary from period to period, depending on the level of ceded losses. Although the use of reinsurance reduces our pre-tax net income, we receive credit under the PMIERs for risk ceded under our 2017 and 2015 QSR Transactions, which mitigates the negative effect of the PMIERs on our returns.
2018 QSR Transaction
We expect that in the first quarter of 2018, we will enter into an agreementunaffiliated reinsurers covering most of our NIW in 2018,2023 (with an additional 10.0% quota share). This is in addition to the reinsurance agreements executed in 2022 that included a 15% quota share on terms no less favorable thaneligible 2023 NIW.
MGIC Investment Corporation 2022 Form 10-K | 57
MGIC Investment Corporation and Subsidiaries
Excess of loss reinsurance
We have Excess-of-loss transactions (“XOL Transactions”) with a panel of unaffiliated reinsurers executed through the traditional reinsurance market (“Traditional XOL Transaction”) and with unaffiliated special purpose insurers (“Home Re Transactions”).
The 2022 Traditional XOL Transaction provides $142.6 million of reinsurance coverage on eligible NIW in 2022. The Traditional XOL Transaction has contractual termination date after approximately ten years, with an optional termination date after seven years and quarterly thereafter. For the covered policies, we retain the first layer of the aggregate losses paid, and the reinsurers will then provide second layer coverage up to the outstanding reinsurance coverage amount. We retain losses paid in excess of the outstanding reinsurance coverage amount. The reinsurance coverage is subject to adjustment based on the risk characteristics of the covered loans. The reinsurance premiums ceded to the Traditional XOL Transaction are based off the remaining reinsurance coverage levels.
The Home Re Transactions are executed with unaffiliated special purpose entities (“Home Re Entities”) through the issuance of insurance linked notes (“ILNs”). At December 31, 2022 our existing QSR transactions. ComparedHome Re Transactions provided $1.6 billion of loss coverage on a portfolio of policies having an in force date from July 1, 2016 through March 31, 2019, and from January 1, 2020 through December 31, 2021; all dates inclusive. For this reinsurance coverage, we retain the first layer of the respective aggregate losses paid, and a Home Re Entity will then provide second layer coverage up to the outstanding reinsurance amount.
As of December 31, 2022, the premiums under most of our 2017 QSR Transaction,2018-2021 reference the proposed 2018 QSR Transaction increasesone-month LIBOR. As discussed in our risk factor titled "The Company may be adversely impacted by the transition from LIBOR as a reference rate," the ICE Benchmark Administration, the administrator of LIBOR, will cease publishing all USD LIBOR tenors on June 30, 2023.
The initial attachment and detachment, current attachment and detachment, and PMIERs required asset credit for each of our XOL Transactions as of December 31, 2022, are as follows:
| | | | | | | | | | | | | | | | | | | | |
| ($ In thousands) | | Initial Attachment % (1) | Initial Detachment % (2) | Current Attachment % (1) | Current Detachment % (2) | PMIERs Required Asset Credit |
| Home Re 2018-1 | | 2.25% | 6.50% | 11.67% | 21.66% | $ | — | |
| Home Re 2019-1 | | 2.50% | 6.75% | 14.79% | 31.56% | — | |
| Home Re 2020-1 | | 3.00% | 7.50% | 6.20% | 8.76% | — | |
| Home Re 2021-1 | | 2.25% | 6.50% | 3.28% | 7.58% | 178,788 | |
| Home Re 2021-2 | | 2.10% | 6.50% | 2.56% | 7.31% | 315,126 | |
| Home Re 2022-1 | | 2.75% | 6.75% | 2.96% | 7.28% | 454,318 | |
| 2022 Traditional XOL | | 2.60% | 7.10% | 2.60% | 7.10% | 137,831 | |
(1) The percentage represents the cumulative losses as a percentage of NIW withadjusted risk in force that MGIC retains prior to the following loan level characteristics subject to coverage: (1) LTV ratiosXOL taking losses.
(2) The percentage represents the cumulative losses as a percentage of 95%adjusted risk in force that must be reached before MGIC begins absorbing losses after the XOL layer
We ceded premiums on our XOL Transactions of $69.9 million and greater,$44.5 million for the years ended December 31, 2022 and (2) DTIs greater than 45%; however, the 2018 QSR Transaction excludes all NIW with LTV ratios of 85% and below. 2021, respectively.
See Note 9 - "Reinsurance""Reinsurance," to our consolidated financial statementstatements for additional discussion on the terms of our proposed transaction. The GSEs have approved the terms of our proposed 2018 QSR Transaction.XOL Transactions.
INVESTMENT INCOME, NET
MGIC Investment Corporation 2017 Form 10-K | 71
|
| | | | | | | | | | | | | | | |
Management's Discussion and Analysis |
MGIC Investment Corporation
2017 Form 10-K
|
Consolidated Results of Operations (continued) |
In addition to more reinsurance coverage on NIW having DTIs 45% and greater, effective for March 2018, we increased the credit score required in connection with loans that have a DTI greater than 45%.
Table t.13 below provides information related to our captive reinsurance agreements for 2017, 2016, and 2015.
|
| | | | | | | | | | | | | | | |
| | Table | t.13 | | | | | | | |
| Captive Reinsurance | | | As of and For the Years Ended December 31, | |
| (Dollars in thousands) | | 2017 | | 2016 | | 2015 | |
| | IIF subject to captive reinsurance agreements | | 1 | % | | 2 | % | | 3 | % | |
| | | | | | | | | |
| | Statements of operations: | | | | | | | |
| | Ceded premiums written | | $ | 4,467 |
| | $ | 7,987 |
| | $ | 13,547 |
| |
| | % of direct premiums written | | 0.4 | % | | 0.7 | % | | 1.3 | % | |
| | Ceded premiums earned | | $ | 4,476 |
| | $ | 8,090 |
| | $ | 13,650 |
| |
| | % of direct premiums earned | | 0.4 | % | | 0.8 | % | | 1.4 | % | |
| | Ceded losses incurred | | $ | (1,135 | ) | | $ | 3,994 |
| | $ | 10,187 |
| |
Investment income
2017 compared to 2016.Net investment income increased 9% to $121 million in 2017 compared to $111 million in 2016. The increase in investment income was due to higher average investment yields, as well as a higher average investment portfolio balance.
2016 compared to 2015.Net investment income increased 7% to $111$167.5 million in 20162022 compared to $104$156.4 million in 2015. The increase in2021. Net investment income was due tobenefited from higher average investment yields.
NET GAINS (LOSSES) ON INVESTMENTS AND OTHER FINANCIAL INSTRUMENTS
Net realized investment gains
Net realized investment gains in 2017 were immaterial to our consolidated financial results. Net realized investment gains were $9 million in 2016 and $28 million in 2015. The net realized gains in 2015 reflect security sales primarily from our fixed income portfolio to realize gains under favorable market conditions.
Chart c.02 below shows the net unrealized gains (losses) position of our investment portfolio as of December 31, 2017, 2016,on investments and 2015.other financial instruments in 2022 and 2021 were $(7.5) million and $5.9 million, respectively.
The net unrealized gains (losses) position of our investments as of December 31, 2017, 2016, 2015 was primarily caused by changes in interest rates between the time of purchase and the respective year end. See Note 5 - "Investments" for additional information on our investment portfolio.
MGIC Investment Corporation 2017 Form 10-K | 72
|
| | | | | | | | | | | | | | | |
Management's Discussion and Analysis |
MGIC Investment Corporation
2017 Form 10-K
|
Consolidated Results of Operations (continued) |
Other revenue
2017 compared to 2016.Other revenue decreased to $10M in 2017 from $18M in 2016, due to lower contract underwriting revenues and a non-recurring gain in 2016 of approximately $4 million related to changes in foreign currency exchange rates upon our substantial liquidation of our Australian operations.
2016 compared to 2015.Other revenue increased to $18M in 2016 from $13$5.6 million in 2015 primarily due to the substantial liquidation of our Australian operations for which we recognized approximately $42022 from $9.0 million of gains related to changes in foreign currency exchange rates in 2016. Other revenue also increased compared to the prior year due to an increase in contract underwriting fees attributable to higher mortgage origination volumes.2021.
MGIC Investment Corporation 2022 Form 10-K | 58
MGIC Investment Corporation and Subsidiaries
Losses and expenses
| | | | | | | | | | | | | | | | | | | | |
| | Year Ended December 31, |
| (In millions) | | 2022 | | 2021 | | % Change |
| Losses incurred, net | | $ | (254.6) | | | $ | 64.6 | | | N/M |
| Amortization of deferred policy acquisition costs | | 12.4 | | | 12.6 | | | (2) | |
| Other underwriting and operating expenses, net | | 236.7 | | | 198.4 | | | 19 | |
| Interest expense | | 48.1 | | | 71.4 | | | (33) | |
| Loss on debt extinguishment | | 40.2 | | | 36.9 | | | 9 | |
| Total losses and expenses | $ | 82.8 | | | $ | 383.9 | | | (78) | |
|
| | | | | | | | | | | | | | |
| | | | | | | | | |
| Losses and expenses | | | Year Ended December 31, |
| (in millions) | | 2017 | | 2016 | | 2015 |
| | Losses incurred, net | | $ | 53.7 |
| | $ | 240.2 |
| | $ | 343.5 |
|
| | Change in premium deficiency reserve | | — |
| | — |
| | (23.8 | ) |
| | Amortization of deferred policy acquisition costs | | 11.1 |
| | 9.6 |
| | 8.8 |
|
| | Other underwriting and operating expenses, net | | 159.6 |
| | 150.8 |
| | 155.6 |
|
| | Interest expense | | 57.0 |
| | 56.7 |
| | 68.9 |
|
| | Loss on debt extinguishment | | 0.1 |
| | 90.5 |
| | 0.5 |
|
| | Total losses and expenses | | $ | 281.5 |
| | $ | 547.8 |
| | $ | 553.6 |
|
LOSSES INCURRED, NET
Losses incurred, net
As discussed in “Critical Accounting Policies”Estimates” below and consistent with industry practices, we establish case loss reserves for future claims only foron delinquent loans that are currently delinquent. The terms “delinquent” and “default” are used interchangeably by us. We consider a loan delinquent when it iswere reported to us as two or more payments past due. Lossdue and have not become current or resulted in a claim payment. Such loans are referred to as being in our delinquency inventory. Case loss reserves are established based on estimating the number of loans in our defaultdelinquency inventory that will result in a claim payment, which is referred to as the claim rate, and further estimating the amount of the claim payment, which is referred to as claim severity.
IBNR reserves are established for delinquencies estimated to have occurred prior to the close of an accounting period, but have not yet been reported to us. IBNR reserves are established using estimated delinquencies, claim rates and claim severities.
Estimation of losses is inherently judgmental. Even in a stable environment, changes to our estimates could result in a material impact to our consolidated results of operations and financial position. The conditions that affect the claim rate and claim severity include the current and future state of the domestic economy, including unemployment, and the current and future strength of local housing markets.markets; exposure on insured loans; the amount of time between delinquency and claim filing; and curtailments and rescissions. The actual amount of the claim payments may be substantially different than our loss reserve estimates. Our estimates could be adversely affected by several factors, including a deterioration of regional or national economic conditions, including unemployment, leading to a reduction in borrowerborrowers’ income and thus their ability to make mortgage payments, the impact of past and future government initiatives and actions taken by the GSEs (including mortgage forbearance programs and foreclosure moratoriums), and a drop in housing values that could result in, among other things, greater losses on loans, and may affect borrower willingness to continue to make mortgage payments when the net value of the home is below the mortgage balance. Historically,Loss reserves in the future will also be dependent on the number of loans reported to us as delinquent.
Prior to the COVID-19 pandemic, losses incurred have followed a seasonal trend in which the second half of the year has weaker credit performance than the first half, with higher new notice activity and a lower cure rate. The state of the economy, local housing markets and various other factors, may result in delinquencies not following the typical pattern.
As discussed in our Risk Factors titled “The Covid-19 pandemic may materially impact our business, and future financial condition," the magnitude of any future impact of the COVID-19 pandemic on our incurred losses is uncertain and cannot be predicted. As discussed in our Risk Factor titled “Because we
establish loss reserves only upon a loan delinquency rather than based on estimates of our ultimate losses on risk in force, losses may have a disproportionate adverse effect on our earnings in certain periods” if we have not received a notice of delinquency with respect to a loan and if we have not estimated the loan to be delinquent as of December 31, 2022 and recorded an IBNR reserve, then we have not yet recorded an incurred loss with respect to that loan.
Our estimates are also affected by any agreements we enter into regarding our claims paying
practices, such as the settlement agreements discussed in Note 17 – “Litigation and Contingencies” to our consolidated financial statements. Changes to our estimates could result in a material impact to our consolidated results of operations and financial position, even in a stable economic environment.practices.
2017 compared to 2016.Losses incurred, net decreased 78% to $54$(254.6) million compared to $240$64.6 million in 2016. The decrease was2021, primarily due to bothfavorable loss reserve development. While new delinquency notices added approximately $149.6 million to losses incurred in 2022, our re-estimation of loss reserves on previously received delinquency notices resulted in favorable development of approximately $404.1 million primarily related to a decrease in losses and LAE incurred in respect to delinquencies reported in the current year and favorable development on prior year delinquencies. Losses incurred with respect to delinquencies reported in the current year declined as we estimated a lower claim rate on new notices in the current year, which offset the slight increase in new notices received. The increase in new
MGIC Investment Corporation 2017 Form 10-K | 73
|
| | | | | | | | | | | | | | | |
Management's Discussion and Analysis |
MGIC Investment Corporation
2017 Form 10-K
|
Consolidated Results of Operations (continued) |
notices was caused by hurricane activity in the third quarter of 2017. Favorable development on prior year delinquencies occurred in 2017 and 2016 due to a lower estimated claim rate on previously reporteddelinquencies. The favorable development primarily resulted from greater than expected cure rates, as borrower reinstatements and servicer mitigation efforts resulted in more cures than originally estimated. Additionally, home price appreciation experienced in recent years has allowed borrowers to cure their delinquencies partially offset by increases inthrough the sale of their property. In 2021, new delinquency notices added approximately $124.6 million to losses incurred, and our expected severity assumptionre-estimation of loss reserves on previously reported delinquencies. During 2017, cure activity on loans that were delinquent twelve months or more was significantly higher than our previous estimates.
2016 comparedreceived delinquency notices resulted in $60.0 million of favorable loss development, primarily due to 2015. Losses incurred, net decreased 30% to $240 million compared to $344 million in 2015. The decrease was due both to athe decrease in losses and LAE incurred in respect to delinquencies reported in the current year and favorable development on prior year delinquencies. Current year losses declined due to a 9% reduction in new notices received and a lower estimated claim rate on those notices. Favorable development ondelinquencies received prior year delinquencies occurred in 2016 and 2015 due to a lower estimated claim rate on previously reported delinquencies, partiallythe COVID-19 pandemic. This was offset by increases in our expected severity assumption on previously reported delinquencies. In 2015, the amountrecognition of development was also favorably impacted by $21a probable loss of $6.3 million due to re-estimation of previously recorded reserves related to disputes onlitigation of our claims paying practices and IBNR, partially offset by increases in our expected severity assumptionadverse development on previously reported delinquencies.LAE reserves and reinsurance.
MGIC Investment Corporation 2022 Form 10-K | 59
MGIC Investment Corporation and Subsidiaries
See "Claim"New notice claim rate" and "Claims severity" below for additional factors and trends that impact these loss reserve assumptions.
| | | | | | | | | | | | | | |
| Composition of losses incurred |
| | | | |
| | Year Ended December 31, |
| (In millions) | | 2022 | | 2021 |
| Current year / New notices | | $ | 149.6 | | | $ | 124.6 | |
| Prior year reserve development | | (404.1) | | | (60.0) | |
| Losses incurred, net | | $ | (254.5) | | | $ | 64.6 | |
|
| | | | | | | | | | | | | | |
| | Table | t.14 | | | | | | |
| Composition of losses incurred | | | Year Ended December 31, |
| (in millions) | | 2017 | | 2016 | | 2015 |
| | Current year / New notices | | $ | 285 |
| | $ | 388 |
| | $ | 454 |
|
| | Prior year reserve development | | (231 | ) | | (148 | ) | | (110 | ) |
| | Losses incurred, net | | $ | 54 |
| | $ | 240 |
| | $ | 344 |
|
Loss ratio(see chart c.03)
The loss ratio is the ratio, expressed as a percentage, of the sum of incurred losses and LAE, net to net premiums earned. The declinedecrease in the loss ratio in 20172022 when compared to 2016, and2021 was primarily due to a decrease in 2016 when compared to 2015 reflects the lower level of losses incurred net.as discussed above.
| | | | | | | | | | | | | | | | |
| | Year Ended December 31, |
| | 2022 | | 2021 | | |
| Loss ratio | | (25.3) | % | | 6.4 | % | | |
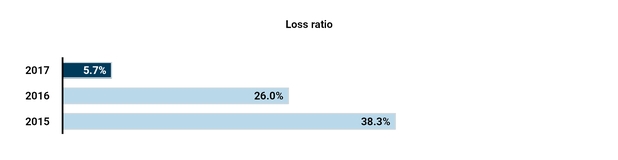
MGIC Investment Corporation and Subsidiaries
New notice claim rate(see chart c.04)
YTD 2017: ~10.0% comparedThe table below presents our new delinquency notices received, delinquency inventory, percentage of delinquent loans in forbearance, and the average number of missed payments for the loans in our delinquency inventory by policy year:
| | | | | | | | | | | | | | |
| | | | |
| New notices and delinquency inventory during the period |
| December 31, 2022 |
| Policy Year | New Notices | Delinquency Inventory | % of Delinquency Inventory in Forbearance | Avg. Number of Missed Payments of Delinquency Inventory |
| 2004 and prior | 3,695 | | 2,471 | | 13.4 | % | 18 |
| 2005-2008 | 11,702 | | 8,317 | | 11.9 | % | 19 |
| 2009-2015 | 3,115 | | 2,017 | | 12.4 | % | 12 |
| 2016 | 2,090 | | 1,249 | | 15.9 | % | 10 |
| 2017 | 2,797 | | 1,719 | | 16.9 | % | 10 |
| 2018 | 3,289 | | 2,060 | | 17.8 | % | 9 |
| 2019 | 3,199 | | 1,823 | | 21.7 | % | 9 |
| 2020 | 5,067 | | 2,558 | | 35.4 | % | 7 |
| 2021 | 6,656 | | 3,307 | | 43.9 | % | 5 |
| 2022 | 1,378 | | 866 | | 37.1 | % | 3 |
| Total | 42,988 | | 26,387 | | 20.9 | % | 12 |
Claim rate on new notices (1) | 8 | % | | | |
| | | | |
| December 31, 2021 |
| Policy Year | New Notices | Delinquency Inventory | % of Delinquency Inventory in Forbearance | Avg. Number of Missed Payments of Delinquency Inventory |
| 2004 and prior | 3,893 | | 2,829 | | 21.4 | % | 19 |
| 2005-2008 | 13,070 | | 10,882 | | 24.3 | % | 19 |
| 2009-2015 | 4,040 | | 3,400 | | 34.9 | % | 13 |
| 2016 | 2,375 | | 2,004 | | 43.5 | % | 12 |
| 2017 | 3,384 | | 2,949 | | 46.6 | % | 12 |
| 2018 | 3,902 | | 3,412 | | 49.3 | % | 12 |
| 2019 | 4,163 | | 3,340 | | 58.1 | % | 11 |
| 2020 | 5,623 | | 3,308 | | 63.4 | % | 8 |
| 2021 | 1,982 | | 1,166 | | 40.9 | % | 4 |
| Total | 42,432 | | 33,290 | | 39.5 | % | 14 |
Claim rate on new notices (1) | 8 | % | | | |
| (1) Claim rate is the respective full year weighted average rate and is rounded to the nearest whole percent. |
Historically, forbearance plans have reduced the incidence of our losses on affected loans. However, given the uncertainty surrounding the long-term economic impact of COVID-19, it is difficult to YTD 2016: ~12.5%. The estimated claim ratepredict the ultimate effect of COVID-19 related forbearances on new notices in each quarter of 2017 was lower thanour loss incidence. Whether a loan delinquency will cure, including through modification, when forbearance ends will depend on the comparable periodeconomic circumstances of the prior year which reflects the currentborrower at that time. The severity of losses associated with delinquencies that do not cure will depend on economic environment and our expectation of cure activity on the notices received. We also estimated a materially lower new notice claim rate for those notices received in the fourth quarter of 2017conditions at that we estimated to have been caused by hurricane activity that occurred in the third quarter of 2017. When excluding our estimate of new notices caused by hurricanes, our new notice claim rate was approximately 10.5%.
time, including home prices.
MGIC Investment Corporation 20172022 Form 10-K | 7461
MGIC Investment Corporation and Subsidiaries
Claims severity
Factors that impact claim severity include:
|
| | | | | | | | | | | | | | | |
Management's Discussion and Analysisè | economic conditions at that time, including home prices compared to home prices at the time of placement of coverage |
MGIC Investment Corporation
2017 Form 10-K
è | exposure on the loan, which is the unpaid principal balance of the loan times our insurance coverage percentage, |
Consolidated Resultsè | length of Operations (continued) |
YTD 2016: ~12.5% compared to YTD 2015: ~13.0%. The estimated claim rate on new notices in 2016 declined, which reflected the economic environment at the time and our expectation of cure activity on the notices received.
The increase in new notices in 2017 compared to 2016 was driven by hurricane activity in the third quarter of 2017.
| time between delinquency and claim filing (which impacts the amount of interest and expenses, with a longer period between default and claim filing generally increasing severity), and |
| è | | |
| Chart | c.04curtailments. |
| |
(1)
| Claim rate is the respective full year weighted average rate and is rounded to nearest whole percent. |
New notice activity continues to be primarily driven by loans insured in 2008 and prior, which continue to experience a cycle whereby many loans become delinquent, cure, and become delinquent again (see chart c.05). As a result of this cycle significant judgment is required in establishing the estimated claim rate.
Claims severity (see table t.15)
Factors that impact claim severity include the exposure on the loan (the unpaid principal balance of the loan times our insurance coverage percentage), the amount of time between delinquency and claim filing (which impacts the amount of interest and expenses, with a longer period between default and claim filing generally increasing severity) and curtailments. As discussed in Note 8 - "Loss Reserves," the average time for servicers to process foreclosures has recently shortened. Therefore, we expect the average number of missed payments at the time a claim is received to be approximately 18 to 24 for new notices received, compared to an average of 35 missed payments for claims received in recent periods. Our our loss reserves estimates take into consideration trends over time, because the development of the delinquencies may vary from period to period without establishing a meaningful trend. An increase in loss mitigation activities, primarily third party acquisitions (sometimes referred to as “short sales”), has resulted in a decrease in the average claim paid and the average claim paid as a percentage of exposure in recent years. At the start of the COVID-19 pandemic, the level of claims received decreased. Claim activity and the average claims paid as a percentage of exposure has not yet returned to pre-COVID-19 levels. The magnitude and timing of the increases are uncertain.
MGIC Investment Corporation 2017 Form 10-K | 75
|
| | | | | | | | | | | | | | | |
Management's Discussion and Analysis |
MGIC Investment Corporation
2017 Form 10-K
|
Consolidated Results of Operations (continued) |
The majority of loans from 2005 through 2008insured prior to 2009 (which represent 62%41% of the loans in the delinquentdelinquency inventory) are covered by master policy terms that, except under certain circumstances, do not limit the number of years that an insured can include interest when filing a claim. Under our current master policy terms, an insured can include accumulated interest when filing a claim only for the first three years the loan is delinquent. In each case, the insured must comply with theirits obligations under the terms of the applicable master policy.
|
| | | | | | | | | | | | | | | |
| | Table | | t.15 | | | | | | |
| Claims severity trend | Period | | Average exposure on claim paid | | Average claim paid | | % Paid to exposure | | Average number of missed payments at claim received date |
| | Q4 2017 | | $ | 44,437 |
| | $ | 49,177 |
| | 110.7 | % | | 36 |
|
| | Q3 2017 | | 43,313 |
| | 46,389 |
| | 107.1 | % | | 35 |
|
| | Q2 2017 | | 44,747 |
| | 49,105 |
| | 109.7 | % | | 35 |
|
| | Q1 2017 | | 44,238 |
| | 49,110 |
| | 111.0 | % | | 35 |
|
| | | | | | | | | | |
| | Q4 2016 | | 43,200 |
| | 48,297 |
| | 111.8 | % | | 35 |
|
| | Q3 2016 | | 43,747 |
| | 48,050 |
| | 109.8 | % | | 34 |
|
| | Q2 2016 | | 43,709 |
| | 47,953 |
| | 109.7 | % | | 35 |
|
| | Q1 2016 | | 44,094 |
| | 49,281 |
| | 111.8 | % | | 34 |
|
| | | | | | | | | | |
| | Q4 2015 | | 44,342 |
| | 49,134 |
| | 110.8 | % | | 35 |
|
| | Q3 2015 | | 44,159 |
| | 48,156 |
| | 109.1 | % | | 33 |
|
| | Q2 2015 | | 44,683 |
| | 48,587 |
| | 108.7 | % | | 34 |
|
| | Q1 2015 | | 44,403 |
| | 47,366 |
| | 106.7 | % | | 33 |
|
| | | | | | | | | | |
| | Note: Table excludes material settlements. Settlements include amounts paid in settlement disputes for claims paying practices and NPL commutations. |
| | | | | | | | | | | | | | | | | | | | | | | | | | |
| Claims severity trend |
| | | | | | | | |
| Period | | Average exposure on claim paid | | Average claim paid | | % Paid to exposure | | Average number of missed payments at claim received date |
| Q4 2022 | | $ | 38,903 | | | $ | 28,492 | | | 73.2 | % | | 41 | |
| Q3 2022 | | 37,625 | | | 23,461 | | | 62.4 | % | | 46 | |
| Q2 2022 | | 44,106 | | | 27,374 | | | 62.1 | % | | 41 | |
| Q1 2022 | | 38,009 | | | 27,662 | | | 72.8 | % | | 45 | |
| Q4 2021 | | 43,485 | | | 32,722 | | | 75.2 | % | | 42 | |
| Q3 2021 | | 42,468 | | | 36,138 | | | 85.1 | % | | 34 | |
| Q2 2021 | | 40,300 | | | 34,068 | | | 84.5 | % | | 36 | |
| Q1 2021 | | 46,807 | | | 36,725 | | | 78.5 | % | | 34 | |
| | | | | | | | |
| Note: Table excludes material settlements. Settlements include amounts paid in settlement of disputes for claims paying practices and/or commutations of policies. |
MGIC Investment Corporation 2022 Form 10-K | 62
MGIC Investment Corporation and Subsidiaries
The length of time a loan is in the delinquency inventory can differ from the number of payments that the borrower has not made or is considered delinquent. These differences typically result from a borrower making monthly payments that do not result in the loan becoming fully current. The number of payments that a borrower is delinquent is shown in the following table.
| | | | | | | | | | | | | | | | | |
| Primary delinquent inventory - number of payments delinquent |
| | | | | |
| |
| | | 2022 | | 2021 |
| 3 payments or less | | 11,484 | | | 9,529 | |
| 4 - 11 payments | | 8,026 | | | 9,208 | |
12 payments or more (1) | | 6,877 | | | 14,553 | |
| Total | | 26,387 | | | 33,290 | |
| | | | |
| 3 payments or less | | 44 | % | | 28 | % |
| 4 - 11 payments | | 30 | % | | 28 | % |
| 12 payments or more | | 26 | % | | 44 | % |
| Total | | 100 | % | | 100 | % |
(1)Approximately 28% and 13% of the loans in the primary delinquency inventory with 12 payments or more delinquent have at least 36 payments delinquent as of December 31, 2022, and 2021, respectively.
NET LOSSES AND LAE PAID
Net losses and LAE paid were flat in 2022 compared to 2021, while direct losses paid decreased slightly in 2022 compared to 2021. Our claims paid activity slowed at the start of the COVID-19 pandemic primarily due to forbearance and foreclosure moratoriums put in place. We expect net losses and LAE paid to increase, however, the magnitude and timing of the increases are uncertain.
This section provides information
The losses and LAE paid on our claim payment trendsreinsurance terminations decreased in 2022 when compared to 2021. The decrease is primarily due to the losses and exposure on our outstanding RIF forLAE recoverable from reinsurers at time of termination of the three years ending2015 and 2019 QSR Transactions (effective December 31, 2017. Table t.162022), compared to the losses and LAE recoverable from reinsurers at time of termination of the 2017 and 2018 QSR transaction (effective December 31, 2021). In a reinsurance termination, amounts for any incurred but unpaid losses are due to us from the reinsurer
The table below presents our net losses and LAE paid for the years ended December 31, 2017, 20162022 and 2015.2021.
| | | | | | | | | | | | | | | | | | |
| Net losses and LAE paid | | |
| | | | | | | | |
| (in millions) | | 2022 | | 2021 | | | | |
| Total primary (excluding settlements) | | $ | 35 | | | $ | 43 | | | | | |
Claims paying practices and NPL settlements (1) | | 8 | | | 14 | | | | | |
| Pool | | — | | | — | | | | | |
| | | | | | | | |
| Direct losses paid | | 43 | | | 57 | | | | | |
| Reinsurance | | (1) | | | (2) | | | | | |
| Net losses paid | | 42 | | | 55 | | | | | |
| LAE | | 8 | | | 14 | | | | | |
| Net losses and LAE paid before terminations | | 50 | | | 69 | | | | | |
Reinsurance terminations (2) | | (18) | | | (36) | | | | | |
| Net losses and LAE paid | | $ | 32 | | | $ | 33 | | | | | |
| | | | | | | | |
| Average claim paid | | $ | 26,715 | | | $ | 34,956 | | | | | |
|
| | | | | | | | | | | | | | |
| | Table | t.16 | | | | | | |
| Net losses and LAE paid | (in millions) | | 2017 | | 2016 | | 2015 |
| Total primary (excluding settlements) | | $ | 446 |
| | $ | 599 |
| | $ | 767 |
|
| | Claims paying practice settlements and NPL commutations (1) | | 54 |
| | 53 |
| | 10 |
|
| | Pool (2) | | 10 |
| | 56 |
| | 68 |
|
| | Other | | — |
| | (1 | ) | | 5 |
|
| | Direct losses paid | | 510 |
| | 707 |
| | 850 |
|
| | Reinsurance | | (23 | ) | | (23 | ) | | (23 | ) |
| | Net losses paid | | 487 |
| | 684 |
| | 827 |
|
| | LAE | | 18 |
| | 20 |
| | 22 |
|
| | Net losses and LAE paid before terminations | | 505 |
| | 704 |
| | 849 |
|
| | Reinsurance terminations | | — |
| | (3 | ) | | (15 | ) |
| | Net losses and LAE paid | | $ | 505 |
| | $ | 701 |
| | $ | 834 |
|
| |
(2)
| 2016 and 2015 each include $42 million paid under the terms of our settlement with Freddie Mac as discussed in Note 8 - "Loss Reserves" to our consolidated financial statements. |
Net losses and LAE paid decreased 28% in 2017 compared to 2016 due to lower claim activity on our primary business and the completion of our settlement payments to Freddie Mac in 2016 related to our pool business.
MGIC Investment Corporation 2017 Form 10-K | 76
|
| | | | | | | | | | | | | | | |
Management's Discussion and Analysis |
MGIC Investment Corporation
2017 Form 10-K
|
Consolidated Results of Operations (continued) |
Net losses and LAE paid decreased 16% in 2016 compared to 2015 due to lower claim activity on our primary business. During each of 2017 and 2016, losses paid included payments for settlements of disputes for claims paying practices andand/or commutations of coveragepolicies
(2)See Note 9 - "Reinsurance" for additional information on pools of NPLs as we continue to resolve legacy delinquencies. We believe losses and LAE paid will be lower in 2018 compared to 2017.our reinsurance terminations
Primary losses paid for the top 15 jurisdictions (based on 2017 losses paid, excluding settlement amounts) and all other jurisdictions for the years ended December 31, 2017, 2016 and 2015 appear in table t.17 below.
|
| | | | | | | | | | | | | | |
| | Table | t.17 | | | | | | |
| Paid losses by jurisdiction | (in millions) | | 2017 | | 2016 | | 2015 |
| New Jersey | | $ | 61 |
| | $ | 60 |
| | $ | 44 |
|
| | Florida | | 49 |
| | 85 |
| | 154 |
|
| | New York | | 37 |
| | 35 |
| | 31 |
|
| | Illinois | | 28 |
| | 43 |
| | 60 |
|
| | Maryland | | 23 |
| | 29 |
| | 45 |
|
| | Pennsylvania | | 22 |
| | 26 |
| | 33 |
|
| | Puerto Rico | | 18 |
| | 17 |
| | 14 |
|
| | California | | 17 |
| | 27 |
| | 38 |
|
| | Ohio | | 16 |
| | 21 |
| | 26 |
|
| | Massachusetts | | 13 |
| | 14 |
| | 15 |
|
| | Connecticut | | 11 |
| | 14 |
| | 18 |
|
| | Virginia | | 10 |
| | 15 |
| | 16 |
|
| | Georgia | | 10 |
| | 13 |
| | 19 |
|
| | Indiana | | 9 |
| | 10 |
| | 12 |
|
| | Washington | | 8 |
| | 15 |
| | 24 |
|
| | All other jurisdictions | | 114 |
| | 175 |
| | 218 |
|
| | Total primary (excluding settlements) | | $ | 446 |
| | $ | 599 |
| | $ | 767 |
|
| | |
| | Note: Jurisdictions in italics in the table above are those that predominately use a judicial foreclosure process, which generally increases the amount of time it takes for a foreclosure to be completed. |
The primary average claim paid for the top 5 jurisdictions (based on 2017 losses paid, excluding settlement amounts) for the years ended December 31, 2017, 2016 and 2015 appears in table t.18 below. The primary average claim paid can vary materially from period to period based upon a variety of factors, including the local market conditions, average loan amount, average coverage percentage, the amount of time between delinquency and claim filing, and our loss mitigation efforts on loans for which claims are paid.
|
| | | | | | | | | | | | | |
| | Table | t.18 | | | | | |
| Primary average claim paid | | 2017 | | 2016 | | 2015 |
| New Jersey | $ | 87,333 |
| | $ | 81,955 |
| | $ | 74,160 |
|
| | Florida | 62,751 |
| | 60,737 |
| | 58,709 |
|
| | New York | 81,043 |
| | 70,869 |
| | 68,341 |
|
| | Illinois | 46,089 |
| | 50,047 |
| | 49,673 |
|
| | Maryland | 73,569 |
| | 72,396 |
| | 77,404 |
|
| | All other jurisdictions | 39,146 |
| | 40,828 |
| | 41,065 |
|
| | All jurisdictions | 48,476 |
| | 48,416 |
| | 47,931 |
|
| | |
| | Note: Jurisdictions in italics in the table above are those that predominately use a judicial foreclosure process, which generally increases the amount of time it takes for a foreclosure to be completed. |
MGIC Investment Corporation 2017 Form 10-K | 77
|
| | | | | | | | | | | | | | | |
Management's Discussion and Analysis |
MGIC Investment Corporation
2017 Form 10-K
|
Consolidated Results of Operations (continued) |
The primary average exposureRIF on delinquent loans as of December 31, 2022 and 2021 and for the top 5 jurisdictions (based on 2017 losses paid, excluding settlement amounts) for the years ended December 31, 2017, 2016 and 20152022 delinquency inventory) appears in table t.19 below.the following table.
| | | | | | | | | | | | | |
| Primary average RIF - delinquent loans |
| | | | | |
| 2022 | | 2021 | | |
| Florida | $ | 59,515 | | | $ | 56,227 | | | |
| Texas | 53,364 | | | 51,037 | | | |
| Illinois | 41,640 | | | 40,798 | | | |
| Pennsylvania | 40,993 | | | 39,523 | | | |
| New York | 74,760 | | | 74,836 | | | |
| All other jurisdictions | 51,693 | | | 51,652 | | | |
| Total all jurisdictions | $ | 52,511 | | | $ | 51,887 | | | |
|
| | | | | | | | | | | | | |
| | Table | t.19 | | | | | |
| Primary average exposure | | 2017 | | 2016 | | 2015 |
| New Jersey | $ | 64,279 |
| | $ | 63,351 |
| | $ | 62,496 |
|
| | Florida | 50,608 |
| | 49,908 |
| | 49,095 |
|
| | New York | 53,052 |
| | 52,006 |
| | 50,964 |
|
| | Illinois | 41,510 |
| | 40,696 |
| | 40,368 |
|
| | Maryland | 65,788 |
| | 63,812 |
| | 62,912 |
|
| | All other jurisdictions | 48,539 |
| | 46,481 |
| | 44,887 |
|
| | All jurisdictions | 49,142 |
| | 47,276 |
| | 45,820 |
|
Loss reserves
OurThe primary default rateaverage RIF on all loans was $64,784 and $59,518 at December 31, 2017 was 4.55% (2016: 5.04%, 2015: 6.31%). 2022 and December 31, 2021, respectively. The increase is primarily due to an increase in loans from recent years which generally have larger loan balances.
MGIC Investment Corporation 2022 Form 10-K | 63
MGIC Investment Corporation and Subsidiaries
LOSS RESERVES
Our primary delinquentdelinquency inventory was 46,556 loans26,387 at December 31, 2017,2022, representing a decrease of 7%21% from 2016 and 26% from 2015.December 31, 2021. We also experienced a decrease in the average direct reserve per default as shown in the table below. The reduction in our primary delinquent inventoryaverage direct reserve per default is influenced by the result of the total number of delinquent loans: (1) that have cured; (2) for which claimconsecutive months a borrower has been delinquent. Generally, a defaulted loan with more missed payments have been made; or (3) that have resultedis more likely to result in rescission, claim denial, or removal from inventory due to settlements of claims paying disputes or commutations of coverage of pools of NPLs, collectively, exceeding the total number of new delinquencies on insured loans. In recent periods, we have experienced improved cure rates and thea claim. The number of delinquencies in inventory with twelve or more missed payments has been declining. Generally, the fewer missed payments a delinquent loan has the lower the likelihood it will result in a claim. Our commutations of coverage on pools of NPLs have each been completed with amounts paid approximating the loss reserves previously established on the delinquent loans. We expect our delinquent inventory to decline in 2018 from 2017 levels.
The primary and pool loss reserves as ofat December 31,
2017, 2016 and 2015 appear in2022 decreased when compared to the prior year. (See Note 8 -"Loss Reserves," table t.20 below. |
| | | | | | | | | | | | | | | | | | | | | | | |
| | Table | t.20 | | | | | | | | | |
| Gross reserves | | | December 31, |
| | | | 2017 | | 2016 | | 2015 |
| | Primary: | | | | | | | | | |
| | Direct loss reserves (in millions) | | $ | 913 |
| | | $ | 1,334 |
| | | $ | 1,681 |
| |
| | IBNR and LAE | | 58 |
| | | 79 |
| | | 126 |
| |
| | Total primary loss reserves | | 971 |
| | | 1,413 |
| | | 1,807 |
| |
| | Ending delinquent inventory | | | 46,556 |
| | | 50,282 |
| | | 62,633 |
|
| | Percentage of loans delinquent (default rate) | | | 4.55 | % | | | 5.04 | % | | | 6.31 | % |
| | Average direct reserve per default | | | $ | 20,851 |
| | | $ | 28,104 |
| | | $ | 28,859 |
|
| | Primary claims received inventory included in ending delinquent inventory | | | 954 |
| | | 1,385 |
| | | 2,769 |
|
| | Pool (1): | | | | | | | | | |
| | Direct loss reserves (in millions): | | | | | | | | | |
| | With aggregate loss limits | | 10 |
| | | 18 |
| | | 34 |
| |
| | Without aggregate loss limits | | 4 |
| | | 7 |
| | | 9 |
| |
| | Reserves related to Freddie Mac settlement (2) | — |
| | | — |
| | | 42 |
| |
| | Total pool direct loss reserves | | 14 |
| | | 25 |
| |
| 85 |
| |
| | Ending delinquent inventory: | | | | | | | | | |
| | With aggregate loss limits | | | 952 |
| | | 1,382 |
| | | 2,126 |
|
| | Without aggregate loss limits | | | 357 |
| | | 501 |
| | | 613 |
|
| | Total pool ending delinquent inventory | |
|
| 1,309 |
| |
|
| 1,883 |
| |
|
| 2,739 |
|
| | Pool claims received inventory included in ending delinquent inventory | | | 42 |
| | | 72 |
| | | 60 |
|
| | Other gross reserves (in millions) | | 1 |
| | | 1 |
| | | 1 |
| |
MGIC Investment Corporation 2017 Form 10-K | 78
|
| | | | | | | | | | | | | | | |
Management's Discussion and Analysis |
MGIC Investment Corporation
2017 Form 10-K
|
Consolidated Results of Operations (continued) |
| |
(1)
| Since a number of our pool policies include aggregate loss limits and/or deductibles, we do not disclose an average direct reserve per default for our pool business. |
| |
(2)
| See our Form 8-K filed with the Securities and Exchange Commission on November 30, 2012 for a discussion of our settlement with Freddie Mac regarding a pool policy. As of December 31, 2016, we had completed our obligation under this settlement agreement. |
8.4.) The average direct reserve per default (table t.20)is also impacted by the average RIF on delinquent loans as shown above.
The gross reserves as of December 31, 2017 declined when compared to2022, and 2021 appear in the prior years primarily due to delinquenciestable below.
| | | | | | | | | | | | | | | | | | | | | | | | | |
| Gross loss reserves | | |
| | | | | | | | | | | |
| | December 31, |
| | 2022 | | 2021 | | | | |
| Primary: | | | | | | | | | | | |
Case reserves (In millions) | | $ | 498 | | | | $ | 795 | | | | | | | |
| IBNR and LAE | | 56 | | | | 82 | | | | | | | |
| Total primary direct loss reserves | | 554 | | | | 877 | | | | | | | |
| Ending delinquency inventory | | | 26,387 | | | | 33,290 | | | | | | |
| Percentage of loans delinquent (default rate) | | | 2.22 | % | | | 2.84 | % | | | | | |
| Average direct reserve per default | | | $ | 20,994 | | | | $ | 26,156 | | | | | | |
| Primary claims received inventory included in ending delinquency inventory | | | 267 | | | | 211 | | | | | | |
Other gross loss reserves (2) (In millions) | | 4 | | | | 7 | | | | | | | |
(1)Since a number of our pool policies include aggregate loss limits and/or deductibles, we estimated to be caused by hurricane activity that remained in our ending delinquent inventory at December 31, 2017, which have a materially lower new notice claim rate than other new notices received. When excluding the estimated hurricane delinquencies, thedo not disclose an average direct reserve per default was $24,000, which is still lower than recent years, because the claim rate on new notices (excluding hurricane new notices)for our pool business.
(2)Other gross loss reserves includes direct and estimated claim rate on previously reported delinquenciesassumed reserves that remain inare not included within our delinquent inventory declined in 2017.primary loss reserves.
MGIC Investment Corporation 2022 Form 10-K | 64
MGIC Investment Corporation and Subsidiaries
The primary defaultdelinquency inventory for the top 15 jurisdictions (based on 2017 losses paid, excluding settlement amounts)December 31, 2022 delinquency inventory) at December 31, 2017, 20162022, and 20152021 appears in table t.21the below.
|
| | | | | | | | | | |
| | Table | t.21 | | | | | |
| Primary delinquent inventory by jurisdiction | | 2017 | | 2016 | | 2015 |
| New Jersey | 1,749 |
| | 2,586 |
| | 3,498 |
|
| Florida | 6,501 |
| | 4,150 |
| | 5,903 |
|
| | New York | 2,387 |
| | 3,171 |
| | 3,901 |
|
| | Illinois | 2,136 |
| | 2,649 |
| | 3,301 |
|
| | Maryland | 1,026 |
| | 1,312 |
| | 1,609 |
|
| | Pennsylvania | 2,403 |
| | 2,984 |
| | 3,574 |
|
| | Puerto Rico | 3,761 |
| | 1,844 |
| | 2,221 |
|
| | California | 1,402 |
| | 1,590 |
| | 2,019 |
|
| | Ohio | 2,025 |
| | 2,614 |
| | 3,209 |
|
| | Massachusetts | 759 |
| | 1,108 |
| | 1,390 |
|
| | Connecticut | 574 |
| | 690 |
| | 832 |
|
| | Virginia | 731 |
| | 885 |
| | 1,109 |
|
| | Georgia | 1,550 |
| | 1,853 |
| | 2,225 |
|
| | Indiana | 1,178 |
| | 1,532 |
| | 1,895 |
|
| | Washington | 495 |
| | 754 |
| | 1,049 |
|
| | All other jurisdictions | 17,879 |
| | 20,560 |
| | 24,898 |
|
| | Total | 46,556 |
| | 50,282 |
| | 62,633 |
|
| | |
| | Note: Jurisdictions in italics in the table above are those that predominately use a judicial foreclosure process, which generally increases the amount of time it takes for a foreclosure to be completed. |
Florida, Puerto Rico, and Texas (included in all other jurisdictions) each experienced an increase in their delinquent inventory as of December 31, 2017 compared to December 31, 2016. The increases were driven by hurricane activity in the third quarter of 2017, which resulted in significant new notice activity in the fourth quarter of 2017, of which a substantial majority of those notices remained in our delinquent inventory as of December 31, 2017.
MGIC Investment Corporation 2017 Form 10-K | 79
|
| | | | | | | | | | | | | | | |
Management's Discussion and Analysis |
MGIC Investment Corporation
2017 Form 10-K
|
Consolidated Results of Operations (continued) |
| | | | | | | | | | | | | |
| Primary delinquency inventory by jurisdiction |
| | | | | |
| | 2022 | | 2021 | | |
| Florida * | 2,414 | | | 2,948 | | | |
| Texas | 1,935 | | | 2,572 | | | |
| Illinois * | 1,640 | | | 2,082 | | | |
| Pennsylvania * | 1,525 | | | 1,672 | | | |
| New York * | 1,399 | | | 1,674 | | | |
| California | 1,336 | | | 1,852 | | | |
| Ohio * | 1,322 | | | 1,458 | | | |
| Michigan | 965 | | | 1,144 | | | |
| Georgia | 954 | | | 1,272 | | | |
| New Jersey * | 841 | | | 1,169 | | | |
| North Carolina | 753 | | | 987 | | | |
| Maryland | 719 | | | 929 | | | |
| Indiana | 622 | | | 736 | | | |
| Virginia | 582 | | | 766 | | | |
| Minnesota | 573 | | | 725 | | | |
| All other jurisdictions | 8,807 | | | 11,304 | | | |
| Total | 26,387 | | | 33,290 | | | |
|
| Note: Asterisk denotes jurisdictions in the table above that predominately use a judicial foreclosure process, which generally increases the amount of time it takes for a foreclosure to be completed. |
The primary defaultdelinquency inventory by policy year at December 31, 2017, 20162022 and 20152021 appears in table t.22 below.the following table.
|
| | | | | | | | | | |
| | Table | t.22 | | | | | |
| Primary delinquent inventory by policy year | | 2017 | | 2016 | | 2015 |
| 2004 and prior | 8,739 |
| | 11,116 |
| | 14,599 |
|
| 2005 | 4,916 |
| | 5,826 |
| | 7,890 |
|
| | 2006 | 7,719 |
| | 9,267 |
| | 11,853 |
|
| | 2007 | 12,807 |
| | 15,816 |
| | 20,000 |
|
| | 2008 | 3,455 |
| | 4,140 |
| | 5,418 |
|
| | 2009 | 315 |
| | 421 |
| | 515 |
|
| | 2010 | 199 |
| | 222 |
| | 274 |
|
| | 2011 | 266 |
| | 246 |
| | 246 |
|
| | 2012 | 549 |
| | 364 |
| | 388 |
|
| | 2013 | 957 |
| | 686 |
| | 615 |
|
| | 2014 | 1,757 |
| | 1,142 |
| | 672 |
|
| | 2015 | 1,992 |
| | 814 |
| | 163 |
|
| | 2016 | 1,930 |
| | 222 |
| | — |
|
| | 2017 | 955 |
| | — |
| | — |
|
| | Total | 46,556 |
| | 50,282 |
| | 62,633 |
|
The delinquent inventory for most policy years includes new notices from hurricane impacted areas that have not cured. As a result, delinquencies, including in our most recent policy years, were greater than they otherwise would have been.
The losses we have incurred on our 2005 through 2008 books have exceeded our premiums from those books. Although uncertainty remains with respect to the ultimate losses we will experience on these books of business, as we continue to write new insurance on high-quality loans, those books are a declining percentage of our total mortgage insurance portfolio. Our 2005 through 2008 books of business represented approximately 19% and 25% of our total primary RIF at December 31, 2017 and 2016, respectively. Approximately 39% and 38% of the remaining primary RIF on our 2005 through 2008 books of business benefited from HARP as of December 31, 2017, and December 31, 2016, respectively.
| | | | | | | | | | | | | |
| Primary delinquency inventory by policy year |
| | | | | |
| 2022 | | 2021 | | |
| 2004 and prior | 2,471 | | | 2,829 | | | |
| 2004 and prior %: | 9 | % | | 8 | % | | |
| 2005 | 1,438 | | | 1,703 | | | |
| 2006 | 2,388 | | | 2,928 | | | |
| 2007 | 3,680 | | | 4,973 | | | |
| 2008 | 811 | | | 1,278 | | | |
| 2005 - 2008 % | 32 | % | | 33 | % | | |
| 2009 | 51 | | | 84 | | | |
| 2010 | 31 | | | 56 | | | |
| 2011 | 43 | | | 79 | | | |
| 2012 | 72 | | | 143 | | | |
| 2013 | 243 | | | 441 | | | |
| 2014 | 633 | | | 1,055 | | | |
| 2015 | 944 | | | 1,542 | | | |
| 2009 - 2015 % | 8 | % | | 10 | % | | |
| 2016 | 1,249 | | | 2,004 | | | |
| 2017 | 1,719 | | | 2,949 | | | |
| 2018 | 2,060 | | | 3,412 | | | |
| 2019 | 1,823 | | | 3,340 | | | |
| 2020 | 2,558 | | | 3,308 | | | |
| 2021 | 3,307 | | | 1,166 | | | |
| 2022 | 866 | | | — | | | |
| 2016 and later %: | 51 | % | | 49 | % | | |
| Total | 26,387 | | | 33,290 | | | |
On our primary business, the highest claim frequency years have typically been the third and fourth year after the year of loan origination. However, the pattern of claimsclaim frequency can be affected by many factors, including persistency and deteriorating economic conditions. Low persistency can accelerate the period in the life of a book during which the highest claim frequency occurs. Deteriorating economic conditions can result in increasing claims following a period of declining claims. As of December 31, 2017, 58% of our primary RIF
MGIC Investment Corporation 2017 Form 10-K | 80
|
| | | | | | | | | | | | | | | |
Management's Discussion and Analysis |
MGIC Investment Corporation
2017 Form 10-K
|
Consolidated Results of Operations (continued) |
was written subsequent to December 31, 2014, 67%2022, 80% of our primary RIF was written subsequent to December 31, 2013, and 73%2019, 85% of our primary RIF was written subsequent to December 31, 2012.2018, and 88% of our primary RIF was written subsequent to December 31, 2017.
Underwriting and other expenses, netUNDERWRITING AND OTHER EXPENSES, NET
2017 compared to 2016.Underwriting and other expenses includes items such as employee compensation costs, fees for professional and consulting services, depreciation and maintenance expense, and premium taxes, and are reported net of ceding commissions.
Underwriting and other expenses, net for 20172022 increased when compared to 2016$236.7 million from $198.4 million in 2021. The increase was primarily due to higher compensation, professional services,expenses related to our technology investments, particularly in data and depreciation expenses.
2016 compared to 2015.Underwritinganalytics, and other expenses for 2016 decreased when compared to 2015, primarily due to an increase in ceding commissions from reinsurers, offset by increasespension expense. Pension expenses increased in compensation costs2022 as a result of settlement accounting charges during 2022. In 2023, we expect to incur settlement accounting charges as a result of lump sum settlements for employees who retired in the fourth quarter of 2022.
MGIC Investment Corporation 2022 Form 10-K | 65
MGIC Investment Corporation and professional services.Subsidiaries
Underwriting expense ratio
| | | | | | | | | | | | | | | | |
| | Year Ended December 31, |
| | 2022 | | 2021 | | |
| Underwriting expense ratio | | 25.2 | % | | 20.6 | % | | |
The underwriting expense ratio is the ratio, expressed as a percentage, of the underwriting and operating expenses, net and amortization of DAC of our combined insurance operations (which excludes underwriting and operating expenses of our non-insurance operations)subsidiaries) to NPW, and is presented in chart c.07 below for the past three years.
net premiums written. The increase in the underwriting expense ratio increased in 2017 when2022 compared to 2016 waswith 2021 due to an increase in underwriting expenses offsetand slight decreases in part by an increase in our NPW. The increase in the underwriting expense ratio in 2016 when compared to 2015 was primarily due tonet premiums written.
LOSS ON DEBT EXTINGUISHMENT
In 2022, we recorded a decrease in NPW.
Interest expense
2017 compared to 2016. Interest expense for 2017 was relatively flat with 2016 as a full-year of interest on our 5.75% Notes issued in August 2016 offset lower interest due to the maturity of our 5% Notes and extinguishment of our 2% Notes.
2016 compared to 2015.Interest expense for 2016 decreased from 2015 primarily due to MGIC's purchase of a portion of our 9% Debentures and the maturity of our 5.375% Notes. We also repurchased portions of our 5% and 2% Notes at various times during 2016, but we incurred new debt obligations to execute the repurchases thereby offsetting any reductions in interest expense from the repurchases.
Loss on debt extinguishment
Lossloss on debt extinguishment in 2016 reflectsof $40.2 million, related to the repurchases of a portion our 9% Debentures, the redemption of our 5.75% Senior Notes, and the repayment of the outstanding 2% and 5% Notes at amounts above our carrying values. Theprincipal balance of the FHLB Advance. In 2021, we recorded a loss on debt extinguishment from MGIC's purchase of a portion$36.9 million associated with the repurchase of most of our 9% Debentures represents the difference between the fair value and carrying value of the liability component on the purchase date.Debentures.
MGIC Investment Corporation 2017 Form 10-K | 81
|
| | | | | | | | | | | | | | | |
Management's Discussion and Analysis |
MGIC Investment Corporation
2017 Form 10-K
|
Consolidated Results of Operations (continued) |
Income tax expense (benefit) and effective tax rate
|
| | | | | | | | | | | | | | |
| | Table | t.23 | | | | | | |
| Income tax provision (benefit) and effective tax rate | (in millions, except rate) | | 2017 | | 2016 | | 2015 |
| Income before tax | | $ | 784,496 |
| | $ | 514,714 |
| | $ | 487,687 |
|
| Provision for (benefit from) income taxes | | 428,735 |
| | 172,197 |
| | (684,313 | ) |
| | Effective tax provision (benefit) rate | | 54.7 | % | | 33.5 | % | | (140.3 | )% |
2017 compared to 2016. Income tax expense for 2017 increased compared to 2016. The increase was due to a remeasurement of net deferred tax assets at the lower corporate income tax rate under the Tax Act, the increase in income before tax, and an additional tax provision recorded for the expected settlement of our IRS litigation. See Note 127 - "Income taxes""Debt" to our consolidated financial statements for furthera discussion on our debt.
INTEREST EXPENSE
Interest expense for 2022 was $48.1 million compared to $71.4 million for 2021. The decrease is due to the Tax Act and expected IRS settlement. debt transactions discussed above.
INCOME TAX EXPENSE AND EFFECTIVE TAX RATE
| | | | | | | | | | | | | | | | |
| Income tax provision and effective tax rate |
| | | | | | |
| (In millions, except rate) | | 2022 | | 2021 | | |
| Income before tax | | $ | 1,090 | | | $ | 802 | | | |
| Provision for income taxes | | 225 | | | 167 | | | |
| Effective tax rate | | 20.6 | % | | 20.8 | % | | |
The difference betweenincrease in our statutory tax rate of 35% and our effective tax provision rate of 54.7% in 2017for income taxes for 2022 compared to 2021 was primarily due to the remeasurement of deferred tax assets at the lower corporatean increase in income before tax. Our effective tax rate for 2022 and 2021 approximated the additional tax provision recorded for the expected settlement of our IRS litigation. The difference between ourfederal statutory income tax rate of 35% and our effective tax provision rate of 33.5% in 2016 was primarily due to the benefits of tax preferenced securities.21%.
2016 compared to 2015.Income tax expense for 2016 increased compared to 2015. This change is primarily due to the reversal of our deferred tax valuation allowance in 2015 and because we were required to establish a full tax provision for 2016. The difference between our statutory tax rate of 35% and our effective tax provision rate of 33.5% in 2016 was primarily due to the benefits of tax preferenced securities. The difference between our statutory tax rate of 35% and our effective tax (benefit) rate on our pre-tax income of (140.3%) in 2015 was primarily due to the impact of the changes in our valuation allowance against our deferred tax assets.
MGIC Investment Corporation 20172022 Form 10-K | 8266
MGIC Investment Corporation and Subsidiaries
|
| | | | | | | | | | | | | | | |
Management's Discussion and Analysis | | | | | | |
MGIC Investment Corporation
2017 Form 10-K
| | | | | | | | | | | | | | | |
| | | | | | | | | | | | | | |
| | | | | | | | | | | | | | | |
BALANCE SHEET REVIEW
The following sections focus on the assets and liabilities experiencing major developments in 2022.
Balance Sheet Analysis
Consolidated balance sheets - Assets
As of December 31, 2017, total assets were $5,619 million compared to $5,735 million in the prior year. | | | | | | | | | | | | | | | | | |
| As of December 31, | | |
| (in thousands) | 2022 | | 2021 | | % Change |
| Investments | $ | 5,424,688 | | | $ | 6,606,749 | | | (18) | |
| Cash and cash equivalents | 327,384 | | | 284,690 | | | 15 | |
| Premiums receivable | 58,000 | | | 56,540 | | | 3 | |
| Reinsurance recoverable on loss reserves | 28,240 | | | 66,905 | | | (58) | |
| Reinsurance recoverable on paid losses | 18,081 | | | 36,275 | | | (50) | |
| Deferred incomes taxes, net | 124,769 | | | — | | | N/M |
| Other assets | 232,631 | | | 273,849 | | | (15) | |
| Total Assets | $ | 6,213,793 | | | $ | 7,325,008 | | | (15) | |
INVESTMENT PORTFOLIO
The investment portfolio increaseddecreased to $4,991 million$5.4 billion as of December 31, 2017 (2016: $4,692 million). Deferred income tax assets decreased2022 (2021: $6.6 billion), primarily due to $234.4 million as of December 31, 2017 (2016: $607.7 million) as our net income utilized a portiondecrease in the fair value of our net operating loss carryforwardsinvestment portfolio due to the increase in the prevailing market interest rates and our net deferred tax assets were remeasured at the lower corporate tax rate under the Tax Act.reduction of debt outstanding.
STRUCTURE OF BALANCE SHEET
% OF TOTAL ASSETS
|
| | | | | | | | |
| (in thousands) | | December 31, 2017 | | December 31, 2016 |
| Assets | | $ | 5,619,499 |
| | $ | 5,734,529 |
|
Investments Analysis
The return we generate on our investment portfolio is an important component of our consolidated financial results. Our investment portfolio primarily consists of a diverse mix of highly rated fixed income securities (see table t.26) and targets an intermediate 4 to 6 year duration thatsecurities. The investment portfolio is designed to achieve the following main portfolio objectives:
|
| | | | | | | | | | | | | |
•Operating Companies (1) | protect principal; | • | meet projected liabilities; andHolding Company |
•è | maximize statutory capital;Preserve PMIERs assets | • | maximizeè | Provide liquidity with minimized realized loss |
| è | Maximize total return with emphasis on book yield, subject to theour other objectives.objectives | | è | Maintain highly liquid, low volatility assets |
•è | minimize realized losses;Limit portfolio volatility | | è | Maintain high credit quality |
| è | Duration 3.5 to 5.5 years | | è | Duration maximum of 2.5 years |
(1)Primarily MGIC
To achieve our portfolio objectives, our asset allocation considers the risk and return parameters of the various asset classes in which we invest. This asset allocation is informed by, and based on, the following factors:
|
| | | |
• | economic and market outlooks; | • | liquidity; |
• | diversification effects; | • | capital considerations; and |
• | security duration; | • | income tax rates. |
MGIC Investment Corporation 2017 Form 10-K | 83
|
| | | | | | | | | | | | | | | |
Management's Discussionè | economic and Analysismarket outlooks; |
MGIC Investment Corporation
2017 Form 10-K
è | diversification effects; |
Balance Sheet Analysis (continued)è | security duration; |
| è | liquidity; |
| è | capital considerations; and |
| è | income tax rates. |
Table t.25 shows theThe average duration and embedded investment yield of our investment portfolio as of December 31, 2017, 2016,2022 and 2015.2021 is shown in the following table.
| | | | | | | | | | | | | | | | | | | |
| Portfolio duration and embedded investment yield |
| | | | | | | |
| | December 31, |
| | 2022 | | 2021 | | |
| Duration (in years) | | 4.3 | | 4.5 | | |
Pre-tax yield (1) | | 3.0% | | 2.5% | | |
After-tax yield (1) | | 2.5% | | 2.1% | | |
|
| | | | | | | | |
| | Table | t.25 | | | | | | |
| Portfolio duration and embedded investment yield | | | December 31, |
| | | 2017 | | 2016 | | 2015 |
| Duration (in years) | | 4.3 | | 4.6 | | 4.7 |
| | Pre-tax yield (1) (% of average investment portfolio assets) | | 2.7% | | 2.6% | | 2.5% |
| | After-tax yield (1) (% of average investment portfolio assets) | | 2.0% | | 1.9% | | 1.8% |
| |
(1)
| Embedded investment yield is calculated on a yield-to-worst basis. |
The credit risk of specific securitiesa security is evaluated through analysis of the security's underlying fundamentals, including the issuer's sector, scale, profitability, debt coverage, and ratings. The investment policy guidelines limit the amount of our credit exposure to any one issue, issuer and type of instrument. Table t.26The following table shows the security ratings of our fixed income investments as of December 31, 20172022 and 2016.2021.
MGIC Investment Corporation 2022 Form 10-K | 67
MGIC Investment Corporation and Subsidiaries
|
| | | | | | | | | | |
| | Table | t.26 | | | | | | | | |
| Fixed income security ratings | % of fixed income securities at fair value | | Security Ratings (1) |
| Period | | AAA | | AA | | A | | BBB |
| | December 31, 2017 | | 21% | | 26% | | 36% | | 17% |
| | December 31, 2016 | | 25% | | 28% | | 32% | | 15% |
| |
(1)
| Ratings are provided by one or more of: Moody's, Standard & Poor's and Fitch Ratings. If three ratings are available, the middle rating is utilized; otherwise the lowest rating is utilized. |
| | | | | | | | | | | | | | | | | | | | | | | | | | | | | |
| Fixed income security ratings |
| % of fixed income securities at fair value |
| | Security Ratings (1) |
| Period | | AAA | | AA | | A | | BBB |
| December 31, 2022 | | 18% | | 28% | | 34% | | 20% |
| December 31, 2021 | | 18% | | 26% | | 36% | | 20% |
The increase(1)Ratings are provided by one or more of: Moody's, Standard & Poor's and Fitch Ratings. If three ratings are available, the middle rating is used; if two FICO scores are available, the lower of the two is used; if only one FICO score is available, it is used.
Our investment portfolio was invested in “A” rated securities reflects marketplace ratings of corporate bondscomparable security types for the years ended December 31, 2022 and our increased concentration in that sector.
December 31, 2021. See Note 5 – “Investments” to our consolidated financial statements for additional disclosure on our investment portfolio.
Investments outlook
The U.S. economyFederal Open Market Committee (“FOMC”) raised the federal funds rate seven times throughout 2022 from 0.25% to 4.5% as it weighed the ongoing economic impacts of tight labor markets, supply chain disruptions and other macroeconomic factors that elevated inflationary measures. In February, 2023 the FOMC increased the federal funds rate by an additional 0.25% and signaled continued restrictive monetary policy in response to growinflationary pressures. Market yields have increased in 2017response to the FOMC’s actions, which has resulted in a decrease in our fixed income investment valuations. The actions of the FOMC and is expected toother ongoing macroeconomic factors could create significant economic uncertainty, such as increasing recessionary concerns, which may result in a widening of credit spreads. Market volatility resulting from these factors may continue to grow in 2018. Against this positive macroeconomic backdrop, which includes very low unemployment, inflation pressures are seen rising. The FOMC, increased its benchmark interest rate 75 basis points during 2017impact our investment valuations and its view is the benchmark will increase another 75 basis points in 2018. Our investment portfolio of fixed income securities is subject to interest rate risk and its fair value is likely to decline in a rising interest rate environment. returns.
We seek to manage our exposure to interest rate risk and volatility by maintaining a diverse mix of high qualityhigh-quality securities with an intermediate duration profile.
While higher interest rates may adversely impact the fair values of our fixed income securities,investments, they present ana near-term opportunity to reinvestfor investment income and proceeds from security maturities into higher yielding securities. The Tax Act issecurities with yields in excess of the book yield on our portfolio. Increases in market-based portfolio yields are expected to have implications for allocations of our fixed income securities. All other things equal, the lower corporate income tax rate reduces the benefit of owning tax-exempt fixed income securities, therefore, our overall allocation to these securities may change over time.
Deferred income taxes
Our deferred income taxes primarily relate toresult in higher net operating loss carryforwards from operating losses experienced in prior years that we expect will offset taxableinvestment income in future periods. During 2017,In addition to fixed income securities, we also hold cash and cash equivalents which yield returns that trend with changes in the federal funds rate.
As of December 31, 2022, approximately 6% of the fair value of our investment portfolio consisted of securities referencing LIBOR. As discussed in our risk factor titled "The Company may be adversely impacted by the transition from LIBOR as a reference rate," the ICE Benchmark Administration, the administrator of LIBOR, will cease publishing all USD LIBOR tenors on June 30, 2023.
CASH AND CASH EQUIVALENTS
Cash and cash equivalents increased to $327.4 million, as of December 31, 2022 (2021: $284.7 million), as net cash generated from operating was substantially used in financing activities.
DEFERRED INCOME TAXES
Our net deferred tax assets were remeasured to reflect the lower corporateasset was $124.8 million at December 31, 2022 and is separately stated in our consolidated balance sheets as Deferred income taxes, net. Our net deferred income tax rate under the Tax Act. The remeasurement of our net deferred tax assetsliability was a discrete period item that increased our tax provision by $133$39.4 million for the year endedat December 31, 20172021 and decreasedis included as a component of Other liabilities in our consolidated balance sheets. The change in our deferred income tax asset and liability was primarily due to the tax effect of unrealized losses generated by a like amount.the investment portfolio during 2022. We owned $661.7 million and $426.3 million of tax and loss bonds at December 31, 2022 and December 31, 2021, respectively. See Note 12- "Income Taxes"12 – “Income Taxes” to our consolidated financial statements for further discussionadditional disclosure on the Tax Act. Ascomponents of December 31, 2017, our deferred tax asset is recordedassets and liabilities.
REINSURANCE RECOVERABLE ON PAID LOSSES
Reinsurance recoverable on paid losses decreased to $18.1 million at $234.4 million.
MGIC Investment Corporation 2017 Form 10-K | 84
|
| | | | | | | | | | | | | | | |
Management's Discussion and Analysis |
MGIC Investment Corporation
2017 Form 10-K
|
Balance Sheet Analysis (continued) |
Other tax matters
We continue to have unresolved tax matters primarily related to reviews of our 2000-2007 federal income tax returns by the IRS. We have reached agreement with the IRS on all issues for those years andDecember 31, 2022 (2021: $36.3 million). The decrease in the fourth quarterreinsurance recoverable on paid losses is primarily due from the losses recoverable from reinsurers at time of 2017, the IRS submitted documentation reflecting the termstermination of the agreement2015 and 2019 QSR Transactions (effective December 31, 2022), compared to the JCT for its review, which must be performed before a settlement can be completed. There is no assurance that a settlement will be completed. Our consolidated financial statements reflect our estimateslosses recoverable from reinsurers at time of termination of the tax contingencies discussed more fully in Note 12 - "Income Taxes"2017 and 2018 QSR transaction (effective December 31, 2021). In a reinsurance termination, amounts for any incurred but unpaid losses are due to our consolidated financial statements. Based on information we currently have regardingus from the status of the dispute, we recorded a provision for additional taxes and interest of $29.0 million in 2017.reinsurers.
Liabilities and Shareholders' EquityOTHER ASSETS
Total liabilitiesOther assets decreased 23% to $2,465$111 million as of December 31, 2017 from $3,186 million as of December 31, 2016. Loss reserves, which represent our estimated liability for losses and settlement expenses under our mortgage guaranty insurance policies, net of related reinsurance balances recoverable, decreased 32% to $937 million as of December 31, 2017 from $1,388 million as of December 31, 2016. This decrease was2022 (2021: $134 million), primarily driven by the payment of losses during 2017 and favorable development on delinquencies received in prior years, offset in part by losses incurred on new delinquency notices received in 2017. Unearned premiums increased 19% to $393 million as of December 31, 2017 (2016: $330 million), primarily due to an increase in the amount of NIW from single premium policies. Long-term debt, at carrying value, declined 30% to $830 million as of December 31, 2017 versus $1,179 million as of December 31, 2016 due to the maturity of our 5% Notes and conversion and partial redemption of our 2% Notes. See Note 7 - "Debt" for further discussion of these transactions. Other liabilities increased 7% to $256 million as of December 31, 2017 (2016: $238 million), primarily due to increases in our income taxes payable, primarily due to our expected IRS settlement, and in our pension plan benefit obligation, offset in part by declines in our premium refund accrual and other liabilities.
Total equity increased 24% to $3,155 million as of December 31, 2017 from $2,549 million as of December 31, 2016. This increase from the prior year was driven by net income generated during 2017 and the conversion of our 2% Notes to shares of our common stock.
STRUCTURE OF BALANCE SHEET
% OF TOTAL LIABILITIES AND EQUITY
|
| | | | | | | | |
| (in thousands) | | December 31, 2017 | | December 31, 2016 |
| Liabilities and equity | | $ | 5,619,499 |
| | $ | 5,734,529 |
|
MGIC Investment Corporation 2017 Form 10-K | 85
|
| | | | | | | | | | | | | | | |
Management's Discussion and Analysis |
MGIC Investment Corporation
2017 Form 10-K
|
Balance Sheet Analysis (continued) |
Benefit plans
We have a non-contributory defined benefit pension plan covering substantially all domestic employees, as well as a supplemental executive retirement plan. Retirement benefits are based on compensation and years of service. We maintain plan assets to fund our defined benefit pension plan obligations. The supplemental executive retirement plan benefits are accrued for and are paid from MGIC assets following employee retirements. As of December 31, 2017, we have accrued a $6.4 million liability related to our defined benefit pension plan as the projected obligation was in excess of plan assets, while at December 31, 2016, it had plan assets in excess of the projected obligation. Our projected benefit obligations under these plans are subject to numerous actuarial assumptions that may change in the future and as a result could substantially increase or decrease our obligations. Plan assets held to pay our defined benefit pension plan obligations are primarily invested in a portfolio of debt securities to preserve capital and to provide monthly cash flows aligned with the liability component of our obligations, with a lesser percentage invested in a mix of equity securities. If the performance of our invested plan assets differs from our expectations, thenet funded status of theour employee benefit pension plan may decline, even with no significant change in the obligations.plans. SeeNote 11 - "Benefit Plans" to our consolidated financial statements for a complete discussion of these plans and their effectadditional disclosure on the consolidated financial statements.our employee benefit plans.
MGIC Investment Corporation 20172022 Form 10-K | 8668
MGIC Investment Corporation and Subsidiaries
Consolidated balance sheets - Liabilities and equity
| | | | | | | | | | | | | | | | | | | | |
| | As of December 31, | | |
| (In thousands) | | 2022 | | 2021 | | % Change |
| Liabilities | | | | | | |
| Loss reserves | | $ | 557,988 | | | $ | 883,522 | | | (37) | |
| Unearned premiums | | 195,289 | | | 241,690 | | | (19) | |
| Long-term debt | | 662,810 | | | 1,146,712 | | | (42) | |
| Other liabilities | | 154,966 | | | 191,702 | | | (19) | |
| Total Liabilities | | $ | 1,571,053 | | | $ | 2,463,626 | | | (36) | |
| | | | | | |
| Shareholders' equity | | | | | | |
| Common stock | | $ | 371,353 | | | $ | 371,353 | | | — | |
| Paid-in capital | | 1,798,842 | | | 1,794,906 | | | — | |
| Treasury stock | | (1,050,238) | | | (675,265) | | | 56 | |
| AOCI, net of tax | | (481,511) | | | 119,697 | | | (502) | |
| Retained earnings | | 4,004,294 | | | 3,250,691 | | | 23 | |
| Total | | $ | 4,642,740 | | | $ | 4,861,382 | | | (4) | |
LOSS RESERVES AND REINSURANCE RECOVERABLE ON LOSS RESERVES
Our loss reserves include estimates of losses and settlement expenses on (1) loans in our delinquency inventory (known as case reserves), (2) IBNR delinquencies, and (3) LAE. Our gross reserves are reduced by reinsurance recoverable on loss reserves to calculate a net reserve balance. Loss reserves decreased to $558.0 million as of December 31, 2022, from $883.5 million of December 31, 2021. Reinsurance recoverables on loss reserves were $28.2 million and $66.9 million as of December 31, 2022 and December 31, 2021, respectively. The decrease in loss reserves from 2022 to 2021 is primarily due to favorable development of $404.1 million on previously received delinquency notices, partially offset by loss reserves established on new delinquency notices. The reinsurance recoverable on loss reserves is impacted by the change in direct reserves and the percentage of our delinquency inventory covered by reinsurance transactions.
LONG-TERM DEBT
Our long-term debt decreased to $662.8 million as of December 31, 2022 from $1,146.7 million as of December 31, 2021 as we paid down our long-term debt in 2022. We repurchased $89.1 million in aggregate principal amount of our 9% Debentures, repaid the outstanding balance of the FHLB Advance of $155.0 million and we redeemed the $242.3 million of aggregate principal outstanding on our 5.75% Senior Notes due in 2023.
UNEARNED PREMIUM
Our unearned premium decreased to $195.3 million as of December 31, 2022 from $241.7 million as of December 31, 2021 primarily due to the run-off of our existing portfolio of single premium policies outpacing the level of NIW from single premium policies.
OTHER LIABILITIES
Other liabilities decreased to $155.0 million as of December 31, 2022 (2021: $191.7 million), primarily due to decreases in our deferred income tax liability, accrual for premium refunds, and interest payable. These were partially offset by an increase in our liability for pension obligation.
SHAREHOLDER'S EQUITY
The decrease in shareholders' equity represents a decrease in the fair value of our investments portfolio discussed above, repurchases of our common stock, and dividends paid to shareholders, partially offset by net income in 2022.
|
| | | | | | | | | | | | | | | |
Management's Discussion and Analysis | | | | | | | | | | | | |
MGIC Investment Corporation 2022 Form 10-K | 69 2017 Form 10-K
| | | | | | | | | | | | | | | |
| | | | | | | | | | | | | | |
| | | | | | | | | | | | | | | |
MGIC Investment Corporation and Subsidiaries
LIQUIDITY AND CAPITAL RESOURCES
Liquidity and Capital Resources
Consolidated Cash Flow AnalysisCONSOLIDATED CASH FLOW ANALYSIS
We have three primary types of cash flows: (1) operating cash flows, which consist mainly of cash generated by our insurance operations and income earned on our investment portfolio, less amounts paid for claims, interest expense and operating expenses, (2) investing cash flows related to the purchase, sale and maturity of investments and purchases of property and equipment and (3) financing cash flows generally from activities that impact our capital structure, such as changes in debt and shares outstanding.outstanding, and dividend payments. The following table summarizes these three cash flows on a consolidated basis for the last threetwo years.
| | | | | | | | | | | | | | |
| Summary of consolidated cash flows |
| | | | |
| | | Years ended December 31, |
| (In thousands) | | 2022 | | 2021 |
| Total cash provided by (used in): | | | | |
| Operating activities | | $ | 650,012 | | | $ | 696,317 | |
| Investing activities | | 410,485 | | | (160,749) | |
| Financing activities | | (1,032,542) | | | (527,290) | |
| Increase (decrease) in cash and cash equivalents and restricted cash and cash equivalents | | $ | 27,955 | | | $ | 8,278 | |
|
| | | | | | | | | | | | | | |
| | Table | t.28 | | | | | | |
| Summary of consolidated cash flows | | | Years ended December 31, |
| (in thousands) | | 2017 | | 2016 | | 2015 |
| Net cash and cash equivalents provided by (used in): | | | | | | |
| | Operating activities | | $ | 406,657 |
| | $ | 224,760 |
| | $ | 161,395 |
|
| | Investing activities | | (303,641 | ) | | (93,392 | ) | | (96,958 | ) |
| | Financing activities | | (158,575 | ) | | (157,078 | ) | | (81,199 | ) |
| | Decrease in cash and cash equivalents | | $ | (55,559 | ) | | $ | (25,710 | ) | | $ | (16,762 | ) |
Operating activities
The following list highlights the major sources and uses of cash flow from operating activities:
| | | | | |
| Sources |
| + | Premiums received |
| + | Loss payments from reinsurers |
| + | Investment income |
| |
SourcesUses |
+- | Premiums receivedClaim payments |
+- | Loss payments from reinsurers |
+ | Investment income |
| |
Uses |
- | Claim payments |
- | Premium ceded to reinsurers |
| - | Interest expense |
| - | Operating expenses |
| - | Tax payments |
| |
Our largest source of cash is from premiums received from our insurance policies, which we receive on a monthly installment basis for most policies. Premiums are received at the beginning of the coverage period for single premium and annual premium policies. Our largest cash outflow is generally for claims that arise when a delinquency results in an insured loss. BecauseBased on historical experience, we expect our future claim payments associated with established case loss reserves to pay out at or within 5 years, with the paymentmajority of future claim payments made within one to three years. Our claims occurs afterpaid activity slowed at the receiptstart of the premium, often years later, weCOVID-19 pandemic primarily due to forbearance and foreclosure moratoriums put in place. We expect net losses and LAE paid to increase, however, the magnitude and timing of the increases are uncertain.
We invest our claims paying resourcesnet cash flow in various investment securities that earn interest. We also use cash to pay for our ongoing expenses such as salaries, debt interest, professional services and rent. occupancy costs.
We also utilizehave purchase obligations totaling approximately $22 million which consist primarily of contracts related to our continued investment in our information technology infrastructure in the normal course of business. The majority of these obligations are under contracts that give us cancellation rights with notice. In the next twelve months we anticipate we will pay approximately $10 million for our purchase obligations.
In connection with our reinsurance to manage the risktransactions, we take on our insurance policies. We cede, or pay out, part of the premiums we receive to our reinsurers and collect cash back when lossesclaims subject to our reinsurance coverage are paid.
Net cash provided by operating activities in 2017 increased2022 decreased compared to 20162021 primarily due to a lower level of losses paid and an increase in income taxes paid, increase in underwriting and operating expenses paid, a decrease in investment income collected, and a decrease in premiums received. This was partially offset by a decrease in losses paid, net premiums written, offsetof reinsurance settlements and a decrease in part by increases in payments for interest and other expenses.payments.
Net cash provided by operating activities in 2016 increased compared to 2015 primarily due to a lower level of losses paid. The increase was offset in part by the commutation of our 2013 QSR Transaction in 2015, which resulted in a return to us of unearned ceded premiums written and settlement of our profit commission accrued during the term of the agreement.
MGIC Investment Corporation 2017 Form 10-K | 87
|
| | | | | | | | | | | | | | | |
Management's Discussion and Analysis |
MGIC Investment Corporation
2017 Form 10-K
|
Liquidity and Capital Resources (continued) |
Investing activities
The following list highlights the major sources and uses of cash flow from investing activities:
| | | | | |
| Sources |
| + | Proceeds from sales of investments |
| + | Proceeds from maturity of fixed income securities |
| |
SourcesUses |
+- | Proceeds from fixed income securities sold, called or maturedPurchases of investments |
+- | Decreases in restricted cash |
| |
Uses |
- | Purchases of fixed income securities |
- | Purchases of property and equipment |
We maintain an investment portfolio that is primarily invested in a diverse mix of fixed income securities. As of December 31, 2017,2022, our portfolio had a fair value of $5.0$5.4 billion, an increasea decrease of $298.2 million,$1.2 billion, or 6.4%17.9% from December 31, 2016.2021. Net cash flows provided by investing activities in 2022 primarily reflect sales and maturities of fixed income and equity securities during the year that exceeded purchases as proceeds were used in financing activities. Net cash used in investing activities in 2021 primarily reflects purchases of fixed income and equity securities during the year that exceeded sales of such securities as cash from operations was available for additional investment. In addition to investment portfolio activities, our investing activities included additions to property and equipment. Beginning in 2016, we began an initiative to update our corporate headquarters building and continued our investment in our technology infrastructure to enhance our ability to conduct business and execute our strategies.
Net cash flows used in investing activities in 2017
MGIC Investment Corporation 2022 Form 10-K | 70
MGIC Investment Corporation and 2016 primarily reflect purchasing fixed income securities in an amount that exceeded our proceeds from sales and maturities of fixed income securities during the year as cash from operations was available for additional investment.Subsidiaries
Net cash flows used in investing activities in 2015 primarily reflect purchasing investment securities in an amount that exceeded our proceeds from sales and maturities of fixed income securities during the year. This outflow was offset in part by a reduction of cash restricted in its use.
Financing activities
The following list highlights the major sources and uses of cash flow from financing activities:
|
| | | | |
| Sources |
| + | Proceeds from debt and/or common stock issuances |
| |
| Uses |
| - | Repayment/repurchase of debt |
| - | Repurchase of common stock |
| - | Payment of debt issuance costsdividends to shareholders |
| - | Payment of withholding taxes related to share-based compensation net share settlement |
Net cash flows used in financing activities for 2017 included the repayment at maturityin 2022 primarily reflects repurchase of our 5%common stock, repayment of our 5.75% Notes redemptionand our FHLB Advance, the repurchase of a most of our 9% Debentures and payment of dividends to shareholders. Net cash flows used in financing activities in 2021 primarily reflect repurchases of our common stock, repurchase of a portion of our 2% Notes, expenses paid9% Debentures, payment of dividends to establish our revolving credit facilityshareholders and the payment of withholding taxes related to share-based compensation net share settlement.
Cash flows used in financing activities for 2016 included the repurchase of a portion of the outstanding principal on our 5% Notes and 2% Notes, the purchase by MGIC of a portion of the outstanding principal on our 9% Debentures, and payment of withholding taxes related to share-based compensation net share settlement. MGIC's ownership of our 9% Debentures is eliminated in consolidation. These transactions were offset in part by cash inflows from the issuance of long-term debt, including an FHLB borrowing and our 5.75% Notes, net of related issuance fees.
Net cash flows used in financing activities for 2015 include the repayment of our 5.375% Notes, repurchases of a portion of our 5% Notes, and payment of withholding taxes related to share-based compensation net share settlement, offset in part by tax benefits related to share-based compensation.
* * *
MGIC Investment Corporation 2017 Form 10-K | 88
|
| | | | | | | | | | | | | | | |
Management's Discussion and Analysis |
MGIC Investment Corporation
2017 Form 10-K
|
Liquidity and Capital Resources (continued) |
For a further discussion of matters affecting our cash flows, see "Balance Sheet AnalysisReview" above and "Debt at our Holding Company"Company and Holding Company Liquidity" below.
CapitalizationCAPITALIZATION
Capital Risk
Capital risk is the risk of adverse impact on our ability to comply with capital requirements (regulatory and GSE) and to maintain the level, structure and composition of capital required for meeting financial performance objectives.
A strong capital position is essential to our business strategy and is important to maintain a competitive position in our industry. Our capital strategy focuses on long-term stability, which enables us to build and invest in our business, even in a stressed environment.
Our capital management objectives are to:
| | | | | |
| è | influence and ensure compliance with capital requirements, |
| è | maintain access to capital and reinsurance markets, |
| è | manage our capital to support our business strategies and the competing priorities of relevant stakeholders |
| è | assess appropriate uses for capital that cannot be deployed in support of our business strategies, including the size and form of capital return to shareholders, and |
| è | support business opportunities by enabling capital flexibility and efficiently using company resources. |
cultivate relationships with intermediaries and end-providers to ensure access to capital and reinsurance markets,
size the level of capital to balance competitive needs, handle contingencies and create shareholder value,
position our mix of debt, equity and/or reinsurance to support our business strategy while considering the competing needs of credit ratings, regulators and shareholders, and
enable capital flexibility to support business opportunities.
These objectives are achieved through ongoing monitoring and management of our capital position, mortgage insurance portfolio stress modeling, and a capital governance framework. Capital management is intended to be flexible in order to react to a range of potential events. The focus we place on any individual objective may change over time due to factors that include, but are not limited to, economic conditions, changes at the GSEs, competition, and alternative transactions to transfer mortgage risk.
Capital Structure
Table t.29The following table summarizes our capital structure as of December 31, 2017, 2016,2022, and 2015.2021.
| | | | | | | | | | | | | | | | |
| | | | | | |
| | | | | | |
| (In thousands, except ratio) | | 2022 | | 2021 | | |
| Common stock, paid-in capital, retained earnings, less treasury stock | | $ | 5,124,251 | | | $ | 4,741,685 | | | |
| Accumulated other comprehensive loss, net of tax | | (481,511) | | | 119,697 | | | |
| Total shareholders' equity | | 4,642,740 | | | 4,861,382 | | | |
| Long-term debt, par value | | 671,086 | | | 1,157,500 | | | |
| Total capital resources | | $ | 5,313,826 | | | $ | 6,018,882 | | | |
| | | | | | |
| Ratio of long-term debt to shareholders' equity | | 14.5 | % | | 23.8 | % | | |
|
| | | | | | | | | | | | | | |
| | Table | t.29 | | | | | | |
| | (in thousands, except ratio) | | 2017 | | 2016 | | 2015 |
| | Common stock, paid-in capital, retained earnings, less treasury stock | | $ | 3,198,309 |
| | $ | 2,623,942 |
| | $ | 2,297,020 |
|
| | Accumulated other comprehensive loss, net of tax | | (43,783 | ) | | (75,100 | ) | | (60,880 | ) |
| | Total shareholders' equity | | 3,154,526 |
| | 2,548,842 |
| | 2,236,140 |
|
| | Long-term debt, par value | | 836,872 |
| | 1,189,472 |
| | 1,223,025 |
|
| | Total capital resources | | $ | 3,991,398 |
| | $ | 3,738,314 |
| | $ | 3,459,165 |
|
| | | | | | | | |
| | Ratio of long-term debt to shareholders' equity | | 26.5 | % | | 46.7 | % | | 54.7 | % |
TotalThe decrease in shareholders' equity increased in 2017 from2022 represents a decrease in the prior year primarily due tofair value of our investments portfolio, repurchases of our common stock, and dividends paid, partially offset by net income during 2017 and conversion of substantially all of our then-remaining 2% Notes into shares of common stock.in 2022. See Note 13 - "Shareholders' Equity" for further information on the 2% Notes conversion. The increase in shareholders' equity in 2016 from 2015 was due to net income in 2016, which was offset in part by the cost of repurchasing the shares of common stock issued in connection with the repurchase of a portion of our 2% Notes.information.
Debt at our holding company and holding company liquidityDEBT AT OUR HOLDING COMPANY AND HOLDING COMPANY LIQUIDITY
Debt obligations - holding company
Chart c.10 shows the outstanding principal amount of the debt obligations of our holding company as of December 31, 2017 and 2016. The 5.75%5.25% Notes and 9% Debentures are obligations of our holding company, MGIC Investment Corporation, and not of its subsidiaries. MGIC's ownership of $132.7 million of our holding
MGIC Investment Corporation 2017 Form 10-K | 89
|
| | | | | | | | | | | | | | | |
Management's Discussion and Analysis |
MGIC Investment Corporation
2017 Form 10-K
|
Liquidity and Capital Resources (continued) |
company's 9% Debentures is eliminated in consolidation, but they remain outstanding obligations owed by our holding company to MGIC.
The outstanding principal on our holding company's debt declined $353 million, or 30.2%, during 2017 as a result of the conversion and partial redemption of our 2% Notes and the maturity of our 5% Notes. See Note 7 - "Debt" for further information on our outstandingWe have no debt obligations and transactions impacting our consolidated financial statements in 2017 and 2016.
Chart c.11 showsdue within the remaining time to maturity of our holding company debt obligations.
The conversion and partial redemption of our 2% Notes and maturity of our 5% Notes in 2017 eliminated the debt obligations with a maturity less than five years. The remaining outstanding holding company debt obligations have more than five years to maturity asnext twelve months. As of December 31, 2017. 2022, our 5.25% Notes had $650 million of outstanding principal due in 2028 and our 9% Debentures had $21.1 million of outstanding principal due in April 2063.
In 2022, we repurchased $89.1 aggregate principal of our 9% debentures, redeemed the outstanding principal balance on our 5.75% Notes, and repaid the outstanding balance of our FHLB advance.
The 9% Debentures are a convertible debt issuance. Subject to certain limitations and restrictions, holders of the 9% Debenturesmay convert their notes into shares of our common stock at their option prior to certain dates prescribed under the terms of their issuance, in which case our corresponding obligation will be eliminated prior to the scheduled maturity.
See Note 7 - "Debt" for further information on our outstanding debt obligations and transactions impacting our consolidated financial statements in 2022 and 2021.
MGIC Investment Corporation 2017 Form 10-K | 90
|
| | | | | | | | | | | | | | | |
Management's Discussion and Analysis |
MGIC Investment Corporation
2017 Form 10-K
|
Liquidity and Capital Resources (continued) |
Liquidity analysis - holding company
As of December 31, 2017,2022, and December 31, 2021, we had approximately $216$647 million and $663 million, respectively, in cash and investments at our holding company. These resources are maintained primarily to service our debt interest expense, pay debt maturities, repurchase outstanding debt obligations as opportunities arise,shares, pay dividends to shareholders, and to settle intercompany obligations. We may also use available holding company cash to repurchase shares of our common stock. While these assets are held, we generate investment income that serves to offset a portion of our interest expense. Investment income and thecash requirements. The payment of dividends from our insurance subsidiariesMGIC are the principal sourcessource of holding company cash inflow. MGIC is the principal source of dividends,inflow and their payment is restricted by insurance regulation. See Note 14 - "Statutory Information"“Statutory Information” to our consolidated financial statementsstatement for additional information about MGIC's
MGIC Investment Corporation 2022 Form 10-K | 71
MGIC Investment Corporation and Subsidiaries
MGIC’s dividend restrictions. The payment of dividends from MGIC is also influenced by our view of the appropriate level of excess PMIERs Available Assets to maintain in excess of Minimum Required Assets. Other sources of holding company cash inflow include any unused capacity on our unsecured revolving credit facility and raisingmaintain. Raising capital in the public markets.markets is another potential source of holding company liquidity. The ability to raise capital in the public markets is subject to prevailing market conditions, investor demand for the securities to be issued, and our deemed creditworthiness.
Over the next twelve months the principal demand on holding company resources will be interest payments on our 5.75%5.25% Notes and 9% Debentures approximating $60 million. We expect MGIC will continue to pay dividends of$36.0 million, based on the debt outstanding at least $50 million per quarter in 2018. Our unsecured revolving credit facility provides $175 million of borrowing capacity, of which no amount is currently drawn.December 31, 2022. We believe our holding company has sufficient sources of liquidity to meet its payment obligations for the foreseeable future.
During 2022 and 2021, we used approximately $386 million and $291 million respectively, of available holding company cash to repurchase shares of our common stock. Through February 17, 2023 we used approximately $42.6 million of available holding company cash to repurchase shares of our common stock. The repurchase programs may be suspended or discontinued at any time. See “Overview - Capital” of this MD&A for a discussion of our share repurchase programs.
We may use additional holding company cash to repurchase additional shares or to repurchase our outstanding debt obligations. Such repurchases may be material, may be made for cash (funded by debt) and/or exchanges for other securities, and may be made in open market purchases (including through 10b5-1 plans), privately negotiated acquisitions or other transactions. See "Overview-Capital" of this MD&A for a discussion of our share repurchase programs.
In 2017,2022, we used $110.9 million to pay cash dividends to shareholders. On January 24, 2023, our Board of Directors declared a quarterly cash dividend of $0.10 per common share to shareholders of record on February 17, 2023, payable on March 2, 2023.
Our holding company cash and investments decreased by $67$16 million, to $216$647 million as of December 31, 2017. Cash outflows included $1502022.
Significant cash and investments inflows during the year:
•$800 million dividends received from MGIC,
•$94 million intercompany tax receipts, and
•$8 million of investment income.
Significant cash outflows during the year:
•$386 million of net share repurchase transactions,
•$248 million of 5.75% Notes redemption,
•$121 million of 9% Debenture repurchases,
•$111 million of cash dividends paid to repay our 5% Notes at maturityshareholders, and $67
•$53 million of interest payments of which approximately $12 million was paid to MGIC for the portion ofon our 5.75% Notes, 5.25% Notes, and 9% Debentures owned by MGIC. Cash inflows primarily included $140 million of dividends received from MGIC.Debentures.
The net unrealized losses on our holding company investment portfolio were approximately $1.8$14.0 million at December 31, 20172022 and the portfolio had a modified duration of approximately 1.81.1 years.
Scheduled debt maturities beyond the next twelve months include $425$650 million of our 5.75%5.25% Notes in 20232028 and $389.5$21.1 million of our 9% Debentures in 2063, of which MGIC owns $132.7 million.2063. The principal amount of the 9% Debentures is currently convertible, at the holder’s option, at an initiala conversion rate, which is subject to adjustment, of 74.074177.962 common shares per $1,000 principal amount of debentures. This represents an initiala conversion price of approximately $13.50$12.83 per share. We may redeem the 9% Debentures in whole or in part from time to time, at our option, at a redemption price equal to 100% of the principal amount of the 9% Debentures being redeemed, plus any accrued and unpaid interest, if the closing sale price of our common stock exceeds $17.55$16.67 (adjusted pro rata for changes in the conversion price) for at least 20 of the 30 trading days preceding notice of the redemption. We expect to provide a redemption notice for the Debentures when this requirement is met and would expect the majority of the holders of the Debentures would elect to convert their Debentures into common stock before the redemption date. Under the terms of the Debenture, we may pay cash in lieu of issuing shares.
See Note 7 – “Debt” to our consolidated financial statements for additional information about the conversion terms of our 9% Debentures and the terms of our indebtedness, including our option to defer interest.long term debt. The description in Note 7 - “Debt" to our consolidated financial statements is qualified in its entirety by the terms of the notes and debentures. The terms of our 9% Debentures are contained in the Indenture dated as of March 28, 2008, between us and U.S. Bank National Association filed as an exhibit to our Form 10-Q filed with the SEC on May 12, 2008. The terms of our 5.75%5.25% Notes are contained in a Supplemental Indenture, dated as of August 5, 2016,12, 2020, between us and U.S. Bank National Association, as trustee, which is included as an exhibit to our 8-K filed with the SEC on August 5, 2016,12, 2020, and in the Indenture dated as of October 15, 2000 between us and the trustee.
Although not anticipated in the near term, we may also contribute funds to our insurance operations to comply with the PMIERs or the State Capital Requirements. See “Overview – Capital” above for a discussion of these requirements. See the discussion of our non-insurance contract underwriting services in Note 17 – “Litigation and Contingencies” to our consolidated financial statements for other possible uses of holding company resources.
We may from time to time acquire our debt obligations through cash purchases and/or exchanges for other securities. We may also from time to time acquire our common stock through cash purchases, including with
MGIC Investment Corporation 2017 Form 10-K | 91
|
| | | | | | | | | | | | | | | |
Management's Discussion and Analysis |
MGIC Investment Corporation
2017 Form 10-K
|
Liquidity and Capital Resources (continued) |
funds provided by debt. We may make such acquisitions in open market purchases, privately negotiated acquisitions or other transactions. The amounts involved may be material.
Debt at subsidiariesDEBT AT SUBSIDIARIES
MGIC is a member of the FHLB. Membership in the FHLB, which provides MGIC access to an additional source of liquidity via a secured lending facility. MGIC has $155.0 million inIn the formfirst quarter of a fixed rate advance from2022, we prepaid the FHLB outstanding. Interest on the Advance is payable monthly at an annual rate, fixed for the term of the Advance, of 1.91%. The principal of the Advance matures on February 10, 2023. MGIC may prepay the Advance at any time. Such prepayment would be below par if interest rates have risen after the Advance was originated, or above par if interest rates have declined. The Advance is secured by eligible collateral in the form of pledged securities from the investment portfolio, whose market value must be maintained at 102% of theoutstanding principal balance of $155.0 million on the Advance.FHLB Advance and incurred a prepayment fee of $1.3 million.
Capital Adequacy
PMIERs
We operate under the PMIERseach of the GSEs that became effective December 31, 2015. The PMIERS were most recently revised in December 2016, but the revision had no impact on our calculation of Available Assets or Minimum Required Assets, or on our operations.GSE's PMIERs. Refer to "Overview - Capital - GSEs" of this MD&A for further discussion of PMIERs.
As of December 31, 2017,2022, MGIC’s Available Assets under PMIERs totaled approximately $4.8$5.7 billion, an excess of approximately $0.8$2.3 billion over its Minimum Required Assets; and MGIC is in compliance with the requirements of the PMIERs and eligible to insure loans delivered to or purchased by the GSEs. Maintaining a sufficient level of excess Available Assets will allow MGIC to remain in compliance with the PMIERs financial requirements, including, we believe, torequirements.
MGIC Investment Corporation 2022 Form 10-K | 72
MGIC Investment Corporation and Subsidiaries
The table below presents the extent they are revised. Our QSR Transactions provided an aggregate of approximately $0.8 billion of PMIERsPMIERS capital credit as of December 31, 2017. for our reinsurance transactions.
| | | | | | | | | | | | | | |
| PMIERs - Reinsurance Credit |
| | | | |
| | | December 31, |
| (In millions) | | 2022 | | 2021 |
| QSR Transactions | | $ | 1,228 | | | $ | 1,129 | |
| Home Re Transactions | | 948 | | | 765 | |
| Traditional XOL Transactions | | 138 | | | — | |
| Total capital credit for Reinsurance Transactions | | $ | 2,314 | | | $ | 1,894 | |
Our 20182023 QSR transaction terms are expectedgenerally comparable to be no less favorable than our 2017 and 2015existing QSR transactions and will also provide PMIERs capital credit. Refer to Note 9 - "Reinsurance" to our consolidated financial statements for additional information on our QSRreinsurance transactions. The PMIERs generally require us to hold significantly more Minimum Required Assets for delinquent loans than for performing loans and the Minimum Required Assets required to be held increases as the number of payments missed on a delinquent loan increases.
We plan to continuously comply with the PMIERs through our operational activities or through the contribution of funds from our holding company, subject to demands on the holding company's resources, as outlined above.
Risk-to-capitalRISK-TO-CAPITAL
We compute our risk-to-capital ratio on a separate company statutory basis, as well as on a combined insurance operations basis. The risk-to-capital ratio is our net RIF divided by our policyholders’ position. Our net RIF includes both primary and pool RIF and excludes risk on policies that are currently in default and for which case loss reserves have been established and thosethe risk covered by reinsurance. The risk amount includes pools of loans with contractual aggregate loss limits and without these limits. Policyholders’MGIC's policyholders’ position consists primarily of statutory policyholders’ surplus (which increases as a result of statutory net income and decreases as a result of statutory net loss and dividends paid), plus the statutory contingency reserve and a portion of the reserves for unearned premiums.reserve. The statutory contingency reserve is reported as a liability on the statutory balance sheet. A mortgage insurance company is required to make annual additions to a contingency reserve of approximately 50% of net earned premiums. These contributions must generally be maintained for a period of ten years. However, with regulatory approval a mortgage insurance company may make early withdrawals from the contingency reserve when incurred losses exceed 35% of net earned premiums in a calendar year.
MGIC Investment Corporation 2017 Form 10-K | 92
|
| | | | | | | | | | | | | | | |
Management's Discussion and Analysis |
MGIC Investment Corporation
2017 Form 10-K
|
Liquidity and Capital Resources (continued) |
Table t.30The table below presents MGIC’s separate companyMGIC's risk-to-capital calculation.
|
| | | | | | | | | | |
| | Table | t.30 | | | | |
| Risk-to-capital - MGIC separate company | | | | December 31, |
| (in millions, except ratio) | | 2017 | | 2016 |
RIF - net (1) | | $ | 31,144 |
| | $ | 28,668 |
|
| | Statutory policyholders' surplus | | $ | 1,620 |
| | $ | 1,505 |
|
| | Statutory contingency reserve | | 1,654 |
| | 1,181 |
|
| | Statutory policyholders' position | | $ | 3,274 |
| | $ | 2,686 |
|
| | Risk-to-capital | | 9.5:1 |
| | 10.7:1 |
|
| |
(1)
| RIF – net, as shown in the table above, is net of reinsurance and exposure on policies currently in default and for which loss reserves have been established. |
| | | | | | | | | | | | | | |
| Risk-to-capital - MGIC |
| | | | |
| | | December 31, |
| (In millions, except ratio) | | 2022 | | 2021 |
RIF - net (1) | | $ | 56,292 | | | $ | 50,298 | |
| Statutory policyholders' surplus | | $ | 921 | | | $ | 1,217 | |
| Statutory contingency reserve | | 4,597 | | | 4,056 | |
| Statutory policyholders' position | | $ | 5,518 | | | $ | 5,273 | |
| Risk-to-capital | | 10.2:1 | | 9.5:1 |
Table t.31 below presents our combined insurance companies’ risk-to-capital calculation (which includes a(1)RIF – net, as shown in the table above, is net of reinsurance affiliate). Reinsurance transactions with our affiliate permit MGIC to write insurance with a higher coverage percentage than it couldand exposure on its own under certain state-specific requirements.policies currently delinquent $1.4 billion at December 31, 2022 and $1.8 billion at December 31, 2021 and for which case loss reserves have been established.
|
| | | | | | | | | | |
| | Table | t.31 | | | | |
| Risk-to-capital - Combined insurance companies | | | December 31, |
| (in millions, except ratio) | | 2017 | | 2016 |
RIF - net (1) | | $ | 36,818 |
| | $ | 34,465 |
|
| | Statutory policyholders' surplus | | $ | 1,622 |
| | $ | 1,507 |
|
| | Statutory contingency reserve | | 1,897 |
| | 1,360 |
|
| | Statutory policyholders' position | | $ | 3,519 |
| | $ | 2,867 |
|
| | Risk-to-capital | | 10.5:1 |
| | 12.0:1 |
|
| |
(1)
| RIF – net, as shown in the table above, is net of reinsurance and exposure on policies currently delinquent ($2.3 billion at December 31, 2017 and $2.6 billion at December 31, 2016) and for which loss reserves have been established.
|
The reductions2022 increase in MGIC's and our combined insurance companies risk-to-capital in 2017 werewas due to an increase in RIF, net of reinsurance, partially offset by an increase in our statutory policyholder's position. The increase in statutory policyholders' position was primarily due to an increase in statutory contingency reserves partiallyand net income during 2022, offset by andividends paid to our holding company of $800 million. The increase in net RIF in both calculations. Ourour RIF, net of reinsurance, increased in 2017,was primarily due to an increase in our IIF.IIF and the termination of our 2015 and 2019 QSR Transaction, offset by a decrease in our reduction to risk on policies that are currently in default for which loss reserves have been established. Our risk-to-capital ratio will decreaseincrease if the percentage increase in capital exceeds the percentage increasedecrease in insured risk.
For additional information regarding regulatory capital see Note 14 – “Statutory Information” to our consolidated financial statements as well as our risk factor titled “State“State capital requirements may prevent us from continuing to write new insurance on an uninterrupted basis”basis” in Item IA1A.
Financial Strength Ratings
|
| | | | | | | |
| | | |
| MGIC financial strength ratings | Rating Agency | Rating | Outlook |
Moody's Investor Services | Baa2 | Stable |
| Rating Agency | Rating | Outlook |
| Moody's Investors Service | A3 | Stable |
| Standard and Poor's Rating Services | BBB+ | Stable |
| A.M. Best | A- | Stable |
| | | | | | | | |
| MAC financial strength ratings |
| | |
| Rating Agency | Rating | Outlook |
| A.M. Best | A- | Stable |
For further information about the importance of MGIC’s ratings and rating methodologies, see our risk factor titled “We may not continue to meet the GSEs’ private mortgage insurer eligibility requirements and our returns may decrease as we are required to maintain more capital in order to maintain our eligibility” and “Competition“Competition or changes in our relationships with our customers could reduce our revenues, reduce our premium yields and/and / or increase our losses”losses” in Item 1A.1A.
MGIC Investment Corporation 20172022 Form 10-K | 93
|
| | | | | | | | | | | | | | | |
Management's Discussion and Analysis | | | | | | | | | | | | |
MGIC Investment Corporation
2017 Form 10-K
| | | | | | | | | | | | | | | |
| | | | | | | | | | | | | | |
| | | | | | | | | | | | | | | |
Contractual Obligations
As of December 31, 2017, the approximate future payments under our contractual obligations of the type described in the table below are as follows:
|
| | | | | | | | | | | | | | | | | | | | | | |
| | Table | t.32 | | | | | | | | | | |
| Contractual obligations | | | Payments due by period |
| | | | | Less than | | | | | | More than |
| | (in millions) | | Total | | 1 year | | 1-3 years | | 3-5 years | | 5 years |
| | Long-term debt obligations | | $ | 2,052.3 |
| | $ | 51.3 |
| | $ | 102.0 |
| | $ | 101.1 |
| | $ | 1,797.9 |
|
| | Operating lease obligations | | 2.3 |
| | 0.8 |
| | 1.4 |
| | 0.1 |
| | — |
|
| | Tax obligations | | 55.0 |
| | 55.0 |
| | — |
| | — |
| | — |
|
| | Purchase obligations | | 16.5 |
| | 15.3 |
| | 1.2 |
| | — |
| | — |
|
| | Pension, SERP and other post-retirement benefit plans | | 326.1 |
| | 29.8 |
| | 65.9 |
| | 67.0 |
| | 163.4 |
|
| | Other long-term liabilities | | 985.6 |
| | 369.6 |
| | 447.5 |
| | 168.5 |
| | — |
|
| | Total | | $ | 3,437.8 |
| | 521.8 |
| | $ | 618.0 |
| | $ | 336.7 |
| | $ | 1,961.3 |
|
Our long-term debt obligations as of December 31, 2017 include their related interest and are discussed in Note 7 – “Debt” to our consolidated financial statements and under “Liquidity and Capital Resources” above. Our operating lease obligations include operating leases on certain office space, data processing equipment and autos, as discussed in Note 16 – “Leases” to our consolidated financial statements. Tax obligations consist primarily of amounts related to our current dispute with the IRS, as discussed in Note 12 – “Income Taxes” to our consolidated financial statements. Purchase obligations consist primarily of agreements to purchase items related to our ongoing infrastructure projects and information technology investments in the normal course of business. See Note 11 - “Benefit Plans” to our consolidated financial statements for discussion of expected benefit payments under our benefit plans.Our other long-term liabilities represent the loss reserves established to recognize the liability for losses and LAE related to existing defaults on insured mortgage loans. The timing of the future claim payments associated with the established loss reserves was determined primarily based on two key assumptions: the length of time it takes for a notice of delinquency to develop into a received claim and the length of time it takes for a received claim to be ultimately paid. The future claim payment periods are estimated based on historical experience, and could emerge differently than this estimate, in part, due to uncertainty regarding how certain factors, such as loss mitigation protocols established by servicers and changes in some state foreclosure laws that may include, for example, a requirement for additional review and/or mediation process.
See Note 8 – “Loss Reserves” to our consolidated financial statements and “Critical Accounting Policies” below for additional information on our loss reserves. In accordance with GAAP for the mortgage insurance industry, we establish loss reserves only for delinquent loans. Because our reserving method does not take account of the impact of future losses that could occur from loans that are not delinquent, our obligation for ultimate losses that we expect to occur under our policies in force at any period end is not reflected in our consolidated financial statements or in the table above.
MGIC Investment Corporation 2017 Form 10-K | 94and Subsidiaries
CRITICAL ACCOUNTING ESTIMATES |
| | | | | | | | | | | | | | | |
Management's Discussion and Analysis | | | | | | | | | | | | |
MGIC Investment Corporation
2017 Form 10-K
| | | | | | | | | | | | | | | |
| | | | | | | | | | | | | | |
| | | | | | | | | | | | | | | |
Critical Accounting Policies
The accounting policiesestimate described below requirerequires significant judgments and estimates in the preparation of our consolidated financial statements.
LossLOSS RESERVES
The estimation of case loss reserves is subject to inherent uncertainty and requires significant judgement by management. Changes to our estimates could result in a material impact to our consolidated results and financial position, even in a stable economic environment.
Case Reserves
Case reserves are established for reportedestimated insurance losses and LAE based on when notices of delinquency on insured mortgage loans are received. Such loans are referred to as being in our delinquency inventory. For reporting purposes, we consider a loan delinquent when it is two or more payments past due.due and has not become current or resulted in a claim payment. Even though the accounting standard, ASC 944, regarding accounting and reporting by insurance entities specifically excluded mortgage insurance from its guidance relating to loss reserves, we establish loss reserves using the general principles contained in the insurance standard. However, consistent with industry standards for mortgage insurers, we do not establish case loss reserves for future claims on insured loans which are not currently delinquent.
We establish reserves using estimated claim rates and claim severities in estimating the ultimate loss.
The estimated claim rates and claim severities represent whatare used to determine the amount we estimate will actually be paid on the delinquent loans as of the reserve date. If a policy is rescinded we do not expect that it will result in a claim payment and thus the rescission generally reduces the historical claim rate used in establishing reserves. In addition, if a loan cures its delinquency, including through a successful loan modifications that result in a cure being reported to us,modification, the cure reduces the historical claim rate used in establishing reserves. Our methodology to estimate claim rates and claim amounts is based on our review of recent trends in the delinquent inventory. To establish reserves, we utilize a reserving model that continually incorporates historical data into the estimated claim rate. The model also incorporates an estimate for the amount of the claim we will pay, or severity. The severity is estimated using the historical percentage of our claimclaims paid compared to our loan exposure,exposures, as well as the RIF of the loans currently in default. We do not utilize an explicit rescission rate in our reserving methodology, but rather our reserving methodology incorporates the effects rescission activity has had on our historical claim rate and claim severities. We review recent trends in the claim rate, claim severity, levels of defaults by geography and average loan exposure. As a result, the process to determine reserves does not include quantitative ranges of outcomes that are reasonably likely to occur.
The claim rates and claim severities are affected by external events, including actual economic conditions such as changes in unemployment rate,rates, interest raterates or housing values;values, pandemics and natural disasters. Our estimation process does not include a correlation between claim rates and claim amountsseverities to projected economic conditions such as changes in unemployment rate,rates, interest raterates or housing values. Our experience is that analysis of that nature would not produce reliable results as the change in one economic condition cannot be isolated to determine its sole
specific effect on our ultimate paid losses because iteach economic condition is also influenced by other economic conditions at the same time.conditions. Additionally, the changes and interactioninteractions of these economic conditions are not likely homogeneous throughout the regions in which we conduct business. Each economic environmentcondition influences our ultimate paid losses differently, even if apparently similar in nature. Furthermore, changes in economic conditions may not necessarily be reflected in our loss development in the quarter or year in which the changes occur. Actual claim results oftengenerally lag changes in economic conditions by at least nine to twelve months.
Our estimates are also affected by any agreements we enter into regarding our claims paying practices such as the settlement agreements discussed in Note 17 – “Litigation and Contingencies” to our consolidated financial statements.
In considering the potential sensitivity of the factors underlying ourOur estimate of loss reserves is sensitive to changes in claim rate and claim severity; it is possible that even a relatively small change in our estimated claim rate or claim severity could have a material impact on reserves and, correspondingly, on our consolidated results of operations even in a stable economic environment. For example, as of December 31, 2022, assuming all other factors remain constant, a $1,000 increase/decrease in the average claim severity reserve factor would change the reserve amount by approximately +/- $18$10 million. A 1one percentage point increase/decrease in the average claim rate reserve factor would change the reserve amount by approximately +/- $26 million as of December 31, 2017.$15 million. Historically, it has not been uncommon for us to
MGIC Investment Corporation 2017 Form 10-K | 95
|
| | | | | | | | | | | | | | | |
Management's Discussion and Analysis |
MGIC Investment Corporation
2017 Form 10-K
|
Critical Accounting Policies (continued) |
experience variability in the development of the loss reserves through the end of the following year at this level or higher, as shown by the historical development of our loss reserves in the table below:
| | | | | | | | | | | | | | | | | |
| Historical development of loss reserves |
| | | | | |
| (In thousands) | | Losses incurred related to prior years (1) | | Reserve at end of prior year |
| 2022 | | (404,130) | | | 883,522 | |
| 2021 | | (60,015) | | | 880,537 | |
| 2020 | | 19,604 | | | 555,334 | |
| 2019 | | (71,006) | | | 674,019 | |
| 2018 | | (167,366) | | | 985,635 | |
| | | | |
| | | | | |
| | | | | |
| | | | | |
|
| | | | | | | | | | |
| | Table | t.33 | | | | |
| Historical development of loss reserves | (In thousands) | | Losses incurred related to prior years (1) | | Reserve at end of prior year |
| 2017 | | $ | (231,204 | ) | | $ | 1,438,813 |
|
| | 2016 | | (147,658 | ) | | 1,893,402 |
|
| | 2015 | | (110,302 | ) | | 2,396,807 |
|
| | 2014 | | (100,359 | ) | | 3,061,401 |
|
| | 2013 | | (59,687 | ) | | 4,056,843 |
|
| |
(1)
| A negative number for a prior year indicates a redundancy of loss reserves. |
(1)A negative number for a prior year indicates a redundancy of loss reserves. A positive number for a prior year indicates a deficiency of loss reserves.
IBNR Reserves
Reserves are also established for estimated IBNR, which results from delinquencies occurring prior to the close of an accounting period, but which have not been reported to us. Consistent with reserves for reported defaults, IBNR reserves are established using estimated claim rates and claim severities for the estimated number of delinquencies not reported. As of December 31, 2017 and 2016, we had IBNR reserves of approximately $35 million and $54 million, respectively.
The actual amount of the claim payments may be substantially different than our loss reserve estimates. Our estimates could be adversely affected by several factors, including a deterioration of regional or national economic conditions, including unemployment, leading to a reduction in borrower income and thus their ability to make mortgage payments, and a drop in housing values, that could result in, among other things, greater losses on loans, and may affect borrower willingness to continue to make mortgage payments when the value of the home is below the mortgage balance.
LAE
Reserves are also established for the estimated costs of settling claims, including legal and other expenses and general expenses of administering the claims settlement process.
Revenue recognition
When a policy term ends, the primary mortgage insurance written by us is renewable at the insured’s option through continued payment of the premium in accordance with the schedule established at the inception of the policy life. We have no ability to reunderwrite or reprice these policies after issuance. Premiums written under policies having single and annual premium payments are initially deferred as unearned premium reserve and earned over the policy life. Premiums written on policies covering more than one year are amortized over the policy life in relationship to the anticipated incurred loss pattern based on historical experience. Premiums written on annual policies are earned on a monthly pro rata basis. Premiums written on monthly policies are earned as the monthly coverage is provided. When a policy is cancelled, all premium that is non-refundable is immediately earned. Any refundable premium is returned to the servicer or borrower. Policies may be cancelled by the insured, or due to rescissions or claim payment. When a policy is rescinded, all previously collected premium is returned to the servicer and when a claim is paid, all premium collected since the date of default is returned. The liability associated with our estimate of premium to be returned is accrued for separately and this liability is included in “Other liabilities” on our consolidated balance sheets. Changes in these liabilities and the actual return of premium affect premiums written and earned.
Fee income of our non-insurance subsidiaries is earned and recognized as the services are provided and the customer is obligated to pay.
MGIC Investment Corporation 20172022 Form 10-K | 9674
|
| | | | | | | | | | | | | | | |
Management's Discussion and Analysis |
MGIC Investment Corporation
2017 Form 10-K
|
Critical Accounting Policies (continued) |
Deferred insurance policy acquisition costs
Costs directly associated with the successful acquisition of mortgage insurance business, consisting of employee compensation and other policy issuance and underwriting expenses, are initially deferred and reported as deferred insurance policy acquisition costs ("DAC"). The deferred costs are net of any ceding commissions received associated with our reinsurance agreements. For each underwriting year of business, these costs are amortized to income in proportion to estimated gross profits over the estimated life of the policies. We utilize anticipated investment income in our calculation. This includes accruing interest on the unamortized balance of DAC. The estimates for each underwriting year are reviewed quarterly and updated when necessary to reflect actual experience and any changes to key variables such as persistency or loss development.
Because our insurance premiums are earned over time, changes in persistency result in DAC being amortized against revenue over a longer or shorter period of time. However, even a 10% change in persistency would not have a material effect on the amortization of DAC in the subsequent year.
Fair value measurements
Investment Portfolio
Our entire investment portfolio is classified as available-for-sale and is reported at fair value or, for certain equity securities carried at cost, amounts that approximate fair value. The related unrealized investment gains or losses are, after considering the related tax expense or benefit, recognized as a component of accumulated other comprehensive income in shareholders' equity. Realized investment gains and losses on investments are recognized in income based upon specific identification of securities sold.
To determine the fair value of securities available-for-sale in Level 1 and Level 2 of the fair value hierarchy, independent pricing sources have been utilized. One price is provided per security based on observable market data. To ensure securities are appropriately classified in the fair value hierarchy, we review the pricing techniques and methodologies of the independent pricing sources and believe that their policies adequately consider market activity, either based on specific transactions for the issue valued or based on modeling of securities with similar credit quality, duration, yield and structure that were recently traded. A variety of inputs are utilized by the independent pricing sources including benchmark yields, reported trades, non-binding broker/dealer quotes, issuer spreads, two sided markets, benchmark securities, bids, offers and reference data including data published in market research publications. Inputs may be weighted differently for any security, and not all inputs are used for each security evaluation.
Market indicators, industry and economic events are also considered. This information is evaluated using a multidimensional pricing model. This model combines all inputs to arrive at a value assigned to each security. Quality controls are performed by the independent pricing sources throughout this process, which include reviewing tolerance reports, trading information, data changes, and directional moves compared to market moves. In addition, on a quarterly basis, we perform quality controls over values received from the pricing sources which also include reviewing tolerance reports, trading information, data changes, and directional moves compared to market moves. We have not made any adjustments to the prices obtained from the independent pricing sources.
In accordance with fair value guidance, we applied the following fair value hierarchy in order to measure fair value for assets and liabilities:
Level 1 - Quoted prices for identical instruments in active markets that we can access. Financial assets utilizing Level 1 inputs primarily include U.S. Treasury securities and certain equity securities.
Level 2 - Quoted prices for similar instruments in active markets; quoted prices for identical or similar instruments in markets that are not active; and inputs, other than quoted prices, that are observable in the marketplace for the financial instrument. The observable inputs are used in valuation models to calculate the fair value of the financial instruments. Financial assets utilizing Level 2 inputs primarily include obligations of U.S. government corporations and agencies, corporate bonds, mortgage-backed securities, and certain municipal bonds.
MGIC Investment Corporation 2017 Form 10-K | 97
|
| | | | | | | | | | | | | | | |
Management's Discussion and Analysis |
MGIC Investment Corporation
2017 Form 10-K
|
Critical Accounting Policies (continued) |
Level 3 - Valuations derived from valuation techniques in which one or more significant inputs or value drivers are unobservable, or for certain equity securities, from their par value due to restrictions that require them to be redeemed or sold only to the security issuer at par value. The inputs used to derive the fair value of Level 3 securities reflect our own assumptions about the assumptions a market participant would use in pricing an asset or liability. Our non-financial assets that are classified as Level 3 securities consist of real estate acquired through claim settlement. The fair value of real estate acquired is the lower of our acquisition cost or a percentage of the appraised value. The percentage applied to the appraised value is based upon our historical sales experience adjusted for current trends.
Unrealized losses and other-than-temporary impairment ("OTTI")
Each quarter we perform reviews of our investments in order to determine whether declines in fair value below amortized cost were considered other-than-temporary. In evaluating whether a decline in fair value is other-than-temporary, we consider several factors including, but not limited to:
| |
▪ | our intent to sell the security or whether it is more likely than not that we will be required to sell the security before recovery of its amortized cost basis; |
| |
▪ | the present value of the discounted cash flows we expect to collect compared to the amortized cost basis of the security; |
| |
▪ | extent and duration of the decline; |
| |
▪ | failure of the issuer to make scheduled interest or principal payments; |
| |
▪ | change in rating below investment grade; and |
| |
▪ | adverse conditions specifically related to the security, an industry, or a geographic area. |
Based on our evaluation, we will record an OTTI adjustment on a security if we intend to sell the impaired security, if it is more likely than not that we will be required to sell the impaired security prior to recovery of its amortized cost basis, or if the present value of the discounted cash flows we expect to collect is less than the amortized costs basis of the security. If the fair value of a security is below its amortized cost at the time of our intent to sell, the security is classified as other-than-temporarily impaired and the full amount of the impairment is recognized as a loss in the statement of operations. Otherwise, when a security is considered to be other-than-temporarily impaired, the losses are separated into the portion of the loss that represents the credit loss; and the portion that is due to other factors. The credit loss portion is recognized as a loss in the statement of operations, while the loss due to other factors is recognized in accumulated other comprehensive income (loss), net of taxes. A credit loss is determined to exist if the present value of the discounted cash flows, using the security’s original yield, expected to be collected from the security is less than the cost basis of the security.
Fair Value Option
For the years ended December 31, 2017, 2016, and 2015, we did not elect the fair value option for any financial instruments acquired, or issued, such as our outstanding debt obligations, for which the primary basis of accounting is not fair value.
MGIC Investment Corporation 2017 Form 10-K | 98
|
| | | | | | | | | | | | | | | |
Quantitative and Qualitative Disclosures About Market Risk | | | | | | | | | | | |
MGIC Investment Corporation
2017 Form 10-K
| | | | | | | | | | | | | | | |
Item 7A.
Quantitative and Qualitative Disclosures About Market Risk.Risk
Our investment portfolio is essentially a fixed income portfolio and is exposed to market risk. Important drivers of the market risk are credit spread risk and interest rate risk.
Credit spread risk is the risk that we will incur a loss due to adverse changes in credit spreads. Credit spread is the additional yield on fixed income securities above the risk-free rate (typically referenced as the yield on U.S. Treasury securities) that market participants require to compensate them for assuming credit, liquidity and/or prepayment risks.
We manage credit risk via our investment policy guidelines which primarily require us to place our investments in investment grade securities and limit the amount of our credit exposure to any one issue, issuer and type of instrument. Guideline and investment portfolio detail is available in "Business – Section C, Investment Portfolio" in Item 1.
Interest rate risk is the risk that we will incur a loss due to adverse changes in interest rates relative to the characteristics of our interest bearing assets.
One of the measures used to quantify interest rate this exposure is modified duration. Modified duration measures the price sensitivity of the assets to the changes in spreads. At December 31, 2017,2022, the modified duration of our fixed income investment portfolio was 4.3 years, which means that an instantaneous parallel shift in the yield curve of 100 basis points would result in a change of 4.3% in the fair value of our fixed income portfolio. For an upward shift in the yield curve, the fair value of our portfolio would decrease and for a downward shift in the yield curve, the fair value would increase. A discussion of portfolio strategy appears in "Management's"Management's Discussion and Analysis – Balance Sheet Analysis– Investments"Review– Investment Portfolio" in Item 7.
MGIC Investment Corporation 20172022 Form 10-K | 9975
Item 8.
Financial Statements and Supplementary Data.Data
The following consolidated financial statements are filed pursuant to this Item 8:
|
| | | | | | | |
| | | |
| Index to consolidated financial statements | | Page No. |
| | |
| Page No. |
Consolidated balance sheets at December 31, 20172022 and 20162021 | |
| 2022 | |
| 2022 | |
| 2022 | |
| 2022 | |
| | |
| | |
| | |
| | |
| | |
| | |
| | |
| | |
| | |
| | |
| | |
| | |
| | |
| | |
| | |
| | |
| | |
| | |
| | |
| | |
MGIC Investment Corporation 20172022 Form 10-K | 10076
| | | | | | | | | | | | | | | | | | | | |
| MGIC INVESTMENT CORPORATION AND SUBSIDIARIES |
| CONSOLIDATED BALANCE SHEETS |
|
| | | | December 31, |
| (In thousands) | | Note | | 2022 | | 2021 |
| Assets | | | | | | |
| Investment portfolio: | | | | | | |
| Fixed income, available-for-sale, at fair value (amortized cost, 2022 - $5,926,785; 2021 - $6,397,658) | | | | $ | 5,409,698 | | | $ | 6,587,581 | |
| Equity securities, at fair value (cost, 2022 - $15,924; 2021 - $15,838) | | | | 14,140 | | | 16,068 | |
| Other invested assets, at cost | | | | 850 | | | 3,100 | |
| Total investment portfolio | | | | 5,424,688 | | | 6,606,749 | |
| | | | | | |
| Cash and cash equivalents | | | | 327,384 | | | 284,690 | |
| Restricted cash and cash equivalents | | | | 5,529 | | | 20,268 | |
| Accrued investment income | | | | 55,178 | | | 51,902 | |
| Reinsurance recoverable on loss reserves | | | | 28,240 | | | 66,905 | |
| Reinsurance recoverable on paid losses | | | | 18,081 | | | 36,275 | |
| Premiums receivable | | | | 58,000 | | | 56,540 | |
| Home office and equipment, net | | | | 41,419 | | | 45,614 | |
| Deferred insurance policy acquisition costs | | | | 19,062 | | | 21,671 | |
| Deferred income taxes, net | | | | 124,769 | | | — | |
| Other assets | | | | 111,443 | | | 134,394 | |
| Total assets | | | | $ | 6,213,793 | | | $ | 7,325,008 | |
| | | | | | |
| Liabilities and shareholders' equity | | | | | | |
| Liabilities: | | | | | | |
| Loss reserves | | | | $ | 557,988 | | | $ | 883,522 | |
| Unearned premiums | | | | 195,289 | | | 241,690 | |
| Federal Home Loan Bank Advance | | | | — | | | 155,000 | |
| Senior notes | | | | 641,724 | | | 881,508 | |
| Convertible junior subordinated debentures | | | | 21,086 | | | 110,204 | |
| Other liabilities | | | | 154,966 | | | 191,702 | |
| Total liabilities | | | | 1,571,053 | | | 2,463,626 | |
| Contingencies | | | | | | |
| Shareholders' equity: | | | | | | |
| Common stock (one dollar par value, shares authorized 1,000,000; shares issued 2022 - 371,353; 2021 - 371,353; shares outstanding 2022 - 293,433; 2021 - 320,336) | | | | 371,353 | | | 371,353 | |
| Paid-in capital | | | | 1,798,842 | | | 1,794,906 | |
| Treasury stock at cost (shares 2022 - 77,920; 2021 - 51,017) | | | | (1,050,238) | | | (675,265) | |
| Accumulated other comprehensive (loss) income, net of tax | | | | (481,511) | | | 119,697 | |
| Retained earnings | | | | 4,004,294 | | | 3,250,691 | |
| Total shareholders' equity | | | | 4,642,740 | | | 4,861,382 | |
| Total liabilities and shareholders' equity | | | | $ | 6,213,793 | | | $ | 7,325,008 | |
See accompanying notes to consolidated financial statements.
MGIC Investment Corporation 2022 Form 10-K | 77
| | | | | | | | | | | | | | | | | | | | | | | | | | | | | |
| MGIC INVESTMENT CORPORATION AND SUBSIDIARIES | |
| CONSOLIDATED STATEMENTS OF OPERATIONS | |
| |
| | | | Years Ended December 31, | |
| (In thousands, except per share data) | | Note | | 2022 | | 2021 | | 2020 | |
| Revenues: | | | | | | | | | |
| Premiums written: | | | | | | | | | |
| Direct | | | | $ | 1,108,570 | | | $ | 1,123,117 | | | $ | 1,106,632 | | |
| Assumed | | | | 8,535 | | | 8,924 | | | 10,837 | | |
| Ceded | | | | (156,373) | | | (163,031) | | | (188,727) | | |
| Net premiums written | | | | 960,732 | | | 969,010 | | | 928,742 | | |
| Decrease (increase) in unearned premiums | | | | 46,401 | | | 45,409 | | | 93,201 | | |
| Net premiums earned | | | | 1,007,133 | | | 1,014,419 | | | 1,021,943 | | |
| | | | | | | | | |
| Investment income, net of expenses | | | | 167,476 | | | 156,438 | | | 154,396 | | |
| Net gains (losses) on investments and other financial instruments | | | | (7,463) | | | 5,861 | | (1) | 12,576 | | (1) |
| Other revenue | | | | 5,639 | | | 8,957 | | (1) | 10,231 | | (1) |
| Total revenues | | | | 1,172,785 | | | 1,185,675 | | | 1,199,146 | | |
| | | | | | | | | |
| Losses and expenses: | | | | | | | | | |
| Losses incurred, net | | | | (254,565) | | | 64,577 | | | 364,774 | | |
| Amortization of deferred policy acquisition costs | | | | 12,366 | | | 12,602 | | | 12,380 | | |
| Other underwriting and operating expenses, net | | | | 236,697 | | | 198,445 | | | 176,398 | | |
| Loss on debt extinguishment | | | | 40,199 | | | 36,914 | | | 26,736 | | |
| Interest expense | | | | 48,054 | | | 71,360 | | | 59,595 | | |
| Total losses and expenses | | | | 82,751 | | | 383,898 | | | 639,883 | | |
| Income before tax | | | | 1,090,034 | | | 801,777 | | | 559,263 | | |
| Provision for income taxes | | | | 224,685 | | | 166,794 | | | 113,170 | | |
| Net income | | | | $ | 865,349 | | | $ | 634,983 | | | $ | 446,093 | | |
| | | | | | | | | |
| Earnings per share: | | | | | | | | | |
| Basic | | | | $ | 2.83 | | | $ | 1.90 | | | $ | 1.31 | | |
| Diluted | | | | $ | 2.79 | | | $ | 1.85 | | | $ | 1.29 | | |
| | | | | | | | | |
| Weighted average common shares outstanding - basic | | | | 305,847 | | | 334,330 | | | 339,953 | | |
| Weighted average common shares outstanding - diluted | | | | 311,229 | | | 351,308 | | | 359,293 | | |
| | | | | | | | | |
(1) Certain amounts have been reclassified to conform with current year presentation
See accompanying notes to consolidated financial statements.
MGIC Investment Corporation 2022 Form 10-K | 78
| | | | | | | | | | | | | | | | | | | | | | | | | | |
| MGIC INVESTMENT CORPORATION AND SUBSIDIARIES |
| CONSOLIDATED STATEMENTS OF COMPREHENSIVE INCOME |
|
| | | | Years Ended December 31, |
| (In thousands) | | Note | | 2022 | | 2021 | | 2020 |
| Net income | | | | $ | 865,349 | | | $ | 634,983 | | | $ | 446,093 | |
| Other comprehensive income (loss), net of tax: | | | | | | | | |
| Change in unrealized investment gains and losses | | 5/10 | | (558,534) | | | (122,099) | | | 133,616 | |
| Benefit plans adjustment | | | | (42,674) | | | 24,975 | | | 10,497 | |
| | | | | | | | |
| Other comprehensive income (loss), net of tax | | | | (601,208) | | | (97,124) | | | 144,113 | |
| Comprehensive income | | | | $ | 264,141 | | | $ | 537,859 | | | $ | 590,206 | |
See accompanying notes to consolidated financial statements.
MGIC Investment Corporation 2022 Form 10-K | 79
| | | | | | | | | | | | | | | | | | | | | | | | | | |
| MGIC INVESTMENT CORPORATION AND SUBSIDIARIES |
| CONSOLIDATED STATEMENTS OF SHAREHOLDERS' EQUITY |
|
| | | | | Years Ended December 31, |
| (In thousands) | | Note | | 2022 | | 2021 | | 2020 |
| Common stock | | | | | | | | |
| | | | | | | | |
| | | | | | | | |
| | | | | | | | |
| Balance, beginning and end of year | | | | 371,353 | | | 371,353 | | | 371,353 | |
| | | | | | | | |
| Paid-in capital | | | | | | | | |
| Balance, beginning of year | | | | 1,794,906 | | | 1,862,042 | | | 1,869,719 | |
| Cumulative effect of debt with conversion options accounting standards update | | | | — | | | (68,289) | | | — | |
| Balance, beginning of period, as adjusted | | | | 1,794,906 | | | 1,793,753 | | | 1,869,719 | |
| | | | | | | | |
| | | | | | | | |
| Reacquisition of convertible junior subordinated debentures-equity component | | | | — | | | — | | | (2,673) | |
| | | | | | | | |
| Reissuance of treasury stock, net under share-based compensation plans | | | | (20,835) | | | (15,956) | | | (18,807) | |
| | | | | | | | |
| Equity compensation | | | | 24,771 | | | 17,109 | | | 13,803 | |
| Balance, end of year | | | | 1,798,842 | | | 1,794,906 | | | 1,862,042 | |
| | | | | | | | |
| Treasury stock | | | | | | | | |
| Balance, beginning of year | | | | (675,265) | | | (393,326) | | | (283,196) | |
| Purchases of common stock | | | | (385,714) | | | (290,818) | | | (119,997) | |
| | | | | | | | |
| Reissuance of treasury stock, net under share-based compensation plans | | | | 10,741 | | | 8,879 | | | 9,867 | |
| Balance, end of year | | | | (1,050,238) | | | (675,265) | | | (393,326) | |
| | | | | | | | |
| Accumulated other comprehensive income (loss) | | | | | | | | |
| Balance, beginning of year | | | | 119,697 | | | 216,821 | | | 72,708 | |
| | | | | | | | |
| Other comprehensive (loss) income | | | | (601,208) | | | (97,124) | | | 144,113 | |
| | | | | | | | |
| Balance, end of year | | | | (481,511) | | | 119,697 | | | 216,821 | |
| | | | | | | | |
| Retained earnings | | | | | | | | |
| Balance, beginning of year | | | | 3,250,691 | | | 2,642,096 | | | 2,278,650 | |
| Cumulative effect of debt with conversion options accounting standards update | | | | — | | | 68,289 | | | — | |
| Balance, beginning of period, as adjusted | | | | 3,250,691 | | | 2,710,385 | | | 2,278,650 | |
| | | | | | | | |
| | | | | | | | |
| Net income | | | | 865,349 | | | 634,983 | | | 446,093 | |
| Cash dividends | | | | (111,746) | | | (94,677) | | | (82,647) | |
| | | | | | | | |
| | | | | | | | |
| Balance, end of year | | | | 4,004,294 | | | 3,250,691 | | | 2,642,096 | |
| | | | | | | | |
| Total shareholders' equity | | | | $ | 4,642,740 | | | $ | 4,861,382 | | | $ | 4,698,986 | |
See accompanying notes to consolidated financial statements.
MGIC Investment Corporation 2022 Form 10-K | 80
| | | | | | | | | | | | | | | | | | | | |
| MGIC INVESTMENT CORPORATION AND SUBSIDIARIES |
| CONSOLIDATED STATEMENTS OF CASH FLOWS |
| | | | | | |
| | Years Ended December 31, |
| (In thousands) | | 2022 | | 2021 | | 2020 |
| Cash flows from operating activities: | | | | | | |
| Net income | | $ | 865,349 | | | $ | 634,983 | | | $ | 446,093 | |
| Adjustments to reconcile net income to net cash provided by operating activities: | | | | | | |
| Depreciation and other amortization | | 54,252 | | | 66,014 | | | 57,812 | |
| Deferred tax expense (benefit) | | (4,367) | | | 5,188 | | | 27,475 | |
| Equity compensation | | 24,771 | | | 17,109 | | | 13,803 | |
| Loss on debt extinguishment | | 40,199 | | | 36,914 | | | 26,736 | |
| Net (gains) losses on investments and other financial instruments | | 7,463 | | | (5,861) | | | (12,576) | |
| Change in certain assets and liabilities: | | | | | | |
| Accrued investment income | | (3,276) | | | (1,905) | | | (292) | |
| Reinsurance recoverable on loss reserves | | 38,665 | | | 28,137 | | | (73,401) | |
| Reinsurance recoverable on paid losses | | 18,194 | | | (35,606) | | | 852 | |
| Premiums receivable | | (1,460) | | | (496) | | | (457) | |
| Deferred insurance policy acquisition costs | | 2,609 | | | (110) | | | (3,030) | |
| Profit commission receivable | | 4,724 | | | (19,245) | | | 4,586 | |
| Loss reserves | | (325,534) | | | 2,985 | | | 325,203 | |
| Unearned premiums | | (46,401) | | | (45,409) | | | (93,203) | |
| Return premium accrual | | (11,800) | | | 7,200 | | | (500) | |
| Current income taxes | | (8,549) | | | 5,429 | | | 6,271 | |
| Other, net | | (4,827) | | | 990 | | | 6,937 | |
| Net cash provided by operating activities | | 650,012 | | | 696,317 | | | 732,309 | |
| Cash flows from investing activities: | | | | | | |
| Purchases of investments | | (674,406) | | | (1,531,129) | | | (2,636,972) | |
| Proceeds from sales of investments | | 399,661 | | | 473,904 | | | 836,851 | |
| Proceeds from maturity of fixed income securities | | 688,484 | | | 900,591 | | | 1,030,926 | |
| | | | | | |
| Additions to property and equipment | | (3,254) | | | (4,115) | | | (3,311) | |
| Net cash provided by (used in) investing activities | | 410,485 | | | (160,749) | | | (772,506) | |
| Cash flows from financing activities: | | | | | | |
| Proceeds from issuance of senior notes | | — | | | — | | | 640,250 | |
| Purchase of senior notes | | — | | | — | | | (179,735) | |
| Payment of original issue discount - senior notes | | — | | | — | | | (2,969) | |
| Purchase of convertible junior subordinated debentures | | (89,118) | | | (98,610) | | | (36,392) | |
| Payment of original issue discount- convertible junior subordinated debentures | | — | | | — | | | (15,049) | |
| Redemption of 5.75% senior notes | | (242,296) | | | — | | | — | |
| Repayment of FHLB advance | | (155,000) | | | — | | | — | |
| Cash portion of loss on debt extinguishment | | (39,514) | | | (36,914) | | | (25,266) | |
| Repurchase of common stock | | (385,573) | | | (290,818) | | | (119,997) | |
| Dividends paid | | (110,947) | | | (94,219) | | | (82,061) | |
| Payment of debt issuance costs | | — | | | — | | | (2,020) | |
| Payment of withholding taxes related to share-based compensation net share settlement | | (10,094) | | | (6,729) | | | (8,940) | |
| Net cash (used in) provided by financing activities | | (1,032,542) | | | (527,290) | | | 167,821 | |
| Net increase in cash and cash equivalents and restricted cash and cash equivalents | | 27,955 | | | 8,278 | | | 127,624 | |
| Cash and cash equivalents and restricted cash and cash equivalents at beginning of year | | 304,958 | | | 296,680 | | | 169,056 | |
| Cash and cash equivalents and restricted cash and cash equivalents at end of year | | $ | 332,913 | | | $ | 304,958 | | | $ | 296,680 | |
See accompanying notes to consolidated financial statements.
MGIC Investment Corporation 2022 Form 10-K | 81
MGIC Investment Corporation and Subsidiaries
|
| | | | | | | | | | | |
Consolidated Financial Statements and Notes | | | | | | | | |
MGIC Investment Corporation
2017 Form 10-K
| | | | | | | | | | | |
Table of Contents
|
| | | | | | | | | | | | |
| | | MGIC INVESTMENT CORPORATION AND SUBSIDIARIES |
| | | CONSOLIDATED BALANCE SHEETS |
| | | | | | | | | |
| | | | | | | December 31, |
| | | (In thousands) | | Note | | 2017 | | 2016 |
| | | Assets | | | | | | |
| | | Investment portfolio: | | | | | | |
| | | Securities, available-for-sale, at fair value: | | | | | | |
| | | Fixed income (amortized cost, 2017 - $4,946,278; 2016 - $4,717,211) | | | | $ | 4,983,315 |
| | $ | 4,685,222 |
|
| | | Equity securities | | | | 7,246 |
| | 7,128 |
|
| | | Total investment portfolio | | | | 4,990,561 |
| | 4,692,350 |
|
| | | | | | | | | |
| | | Cash and cash equivalents | | | | 99,851 |
| | 155,410 |
|
| | | Accrued investment income | | | | 46,060 |
| | 44,073 |
|
| | | Reinsurance recoverable on loss reserves | | | | 48,474 |
| | 50,493 |
|
| | | Reinsurance recoverable on paid losses | | | | 3,872 |
| | 4,964 |
|
| | | Premiums receivable | | | | 54,045 |
| | 52,392 |
|
| | | Home office and equipment, net | | | | 44,936 |
| | 36,088 |
|
| | | Deferred insurance policy acquisition costs | | | | 18,841 |
| | 17,759 |
|
| | | Deferred income taxes, net | | | | 234,381 |
| | 607,655 |
|
| | | Other assets | | | | 78,478 |
| | 73,345 |
|
| | | Total assets | | | | $ | 5,619,499 |
| | $ | 5,734,529 |
|
| | | | | | | | | |
| | | Liabilities and shareholders' equity | | | | | | |
| | | Liabilities: | | | | | | |
| | | Loss reserves | | | | $ | 985,635 |
| | $ | 1,438,813 |
|
| | | Unearned premiums | | | | 392,934 |
| | 329,737 |
|
| | | FHLB Advance | | | | 155,000 |
| | 155,000 |
|
| | | Senior notes | | | | 418,560 |
| | 417,406 |
|
| | | Convertible senior notes | | | | — |
| | 349,461 |
|
| | | Convertible junior subordinated debentures | | | | 256,872 |
| | 256,872 |
|
| | | Other liabilities | | | | 255,972 |
| | 238,398 |
|
| | | Total liabilities | | | | 2,464,973 |
| | 3,185,687 |
|
| | | Contingencies | | | |
|
| |
|
|
| | | Shareholders' equity: | | | | | | |
| | | Common stock (one dollar par value, shares authorized 1,000,000; shares issued 2017 - 370,567; 2016 - 359,400; outstanding 2017 - 370,567; 2016 - 340,663) | | | | 370,567 |
| | 359,400 |
|
| | | Paid-in capital | | | | 1,850,582 |
| | 1,782,337 |
|
| | | Treasury stock (shares at cost 2016 - 18,737) | | | | — |
| | (150,359 | ) |
| | | Accumulated other comprehensive loss, net of tax | | | | (43,783 | ) | | (75,100 | ) |
| | | Retained earnings | | | | 977,160 |
| | 632,564 |
|
| | | Total shareholders' equity | | | | 3,154,526 |
| | 2,548,842 |
|
| | | Total liabilities and shareholders' equity | | | | $ | 5,619,499 |
| | $ | 5,734,529 |
|
See accompanying notes to consolidated financial statements.
MGIC Investment Corporation 2017 Form 10-K | 101
|
| NOTE 1 | | | | | | | | | | | |
Consolidated Financial Statements and Notes |
MGIC Investment Corporation
2017 Form 10-K
| | | | | | | | | | | |
Table of Contents
|
| | | | | | | | | | | | | | | | |
| | | MGIC INVESTMENT CORPORATION AND SUBSIDIARIES |
| | | CONSOLIDATED STATEMENTS OF OPERATIONS |
| | | | | | | | | | | |
| | | | | | | Years Ended December 31, |
| | | (In thousands, except per share data) | | Note | | 2017 | | 2016 | | 2015 |
| | | Revenues: | | | | | | | | |
| | | Premiums written: | | | | | | | | |
| | | Direct | | | | $ | 1,121,776 |
| | $ | 1,107,923 |
| | $ | 1,074,490 |
|
| | | Assumed | | | | 1,905 |
| | 1,053 |
| | 1,178 |
|
| | | Ceded | | | | (125,726 | ) | | (133,885 | ) | | (55,391 | ) |
| | | Net premiums written | | | | 997,955 |
| | 975,091 |
| | 1,020,277 |
|
| | | Increase in unearned premiums | | | | (63,208 | ) | | (49,865 | ) | | (124,055 | ) |
| | | Net premiums earned | | | | 934,747 |
| | 925,226 |
| | 896,222 |
|
| | | | | | | | | | | |
| | | Investment income, net of expenses | | | | 120,871 |
| | 110,666 |
| | 103,741 |
|
| | | Net realized investment gains | | | | 249 |
| | 8,932 |
| | 28,361 |
|
| | | Other revenue | | | | 10,187 |
| | 17,659 |
| | 12,964 |
|
| | | Total revenues | | | | 1,066,054 |
| | 1,062,483 |
| | 1,041,288 |
|
| | | | | | | | | | | |
| | | Losses and expenses: | | | | |
| | |
| | |
|
| | | Losses incurred, net | | | | 53,709 |
| | 240,157 |
| | 343,547 |
|
| | | Change in premium deficiency reserve | | | | — |
| | — |
| | (23,751 | ) |
| | | Amortization of deferred policy acquisition costs | | | | 11,111 |
| | 9,646 |
| | 8,789 |
|
| | | Other underwriting and operating expenses, net | | | | 159,638 |
| | 150,763 |
| | 155,577 |
|
| | | Interest expense | | | | 57,035 |
| | 56,672 |
| | 68,932 |
|
| | | Loss on debt extinguishment | | | | 65 |
| | 90,531 |
| | 507 |
|
| | | Total losses and expenses | | | | 281,558 |
| | 547,769 |
| | 553,601 |
|
| | | Income before tax | | | | 784,496 |
| | 514,714 |
| | 487,687 |
|
| | | Provision for (benefit from) income taxes | | | | 428,735 |
| | 172,197 |
| | (684,313 | ) |
| | | Net income | | | | $ | 355,761 |
| | $ | 342,517 |
| | $ | 1,172,000 |
|
| | | | | | | | | | | |
| | | Earnings per share: | | | | |
| | |
| | |
|
| | | Basic | | | | $ | 0.98 |
| | $ | 1.00 |
| | $ | 3.45 |
|
| | | Diluted | | | | $ | 0.95 |
| | $ | 0.86 |
| | $ | 2.60 |
|
| | | | | | | | | | | |
| | | Weighted average common shares outstanding - basic | | | | 362,380 |
| | 342,890 |
| | 339,552 |
|
| | | Weighted average common shares outstanding - diluted | | | | 394,766 |
| | 431,992 |
| | 468,039 |
|
| | | | | | | | | | | |
| | | Dividends per share | | | | $ | — |
| | $ | — |
| | $ | — |
|
See accompanying notes to consolidated financial statements.
MGIC Investment Corporation 2017 Form 10-K | 102
|
| | | | | | | | | | | |
Consolidated Financial Statements and Notes |
MGIC Investment Corporation
2017 Form 10-K
| | | | | | | | | | | |
Table of Contents
|
| | | | | | | | | | | | | | | | |
| | | MGIC INVESTMENT CORPORATION AND SUBSIDIARIES |
| | | CONSOLIDATED STATEMENTS OF COMPREHENSIVE INCOME |
| | | | | | | | | | | |
| | | | | | | Years Ended December 31, |
| | | (In thousands) | | Note | | 2017 | | 2016 | | 2015 |
| | | Net income | | | | $ | 355,761 |
| | $ | 342,517 |
| | $ | 1,172,000 |
|
| | | Other comprehensive income (loss), net of tax: | | | | | | | | |
| | | Change in unrealized investment gains and losses | | | | 47,547 |
| | (3,649 | ) | | 40,403 |
|
| | | Benefit plans adjustment | | | | (5,839 | ) | | (9,620 | ) | | (15,714 | ) |
| | | Foreign currency translation adjustment | | | | 31 |
| | (951 | ) | | (4,228 | ) |
| | | Other comprehensive income (loss), net of tax | | | | 41,739 |
| | (14,220 | ) | | 20,461 |
|
| | | Comprehensive income | | | | $ | 397,500 |
| | $ | 328,297 |
| | $ | 1,192,461 |
|
See accompanying notes to consolidated financial statements.
MGIC Investment Corporation 2017 Form 10-K | 103
|
| | | | | | | | | | | |
Consolidated Financial Statements and Notes |
MGIC Investment Corporation
2017 Form 10-K
| | | | | | | | | | | |
Table of Contents
|
| | | | | | | | | | | | | | | |
| | MGIC INVESTMENT CORPORATION AND SUBSIDIARIES |
| | CONSOLIDATED STATEMENTS OF SHAREHOLDERS' EQUITY |
| | | | | | | | | | |
| | | | | | Years Ended December 31, |
| | (In thousands) | | Note | | 2017 | | 2016 | | 2015 |
| | Common stock | | | | | | | | |
| | Balance, beginning of year | | | | $ | 359,400 |
| | $ | 340,097 |
| | $ | 340,047 |
|
| | Issuance of common stock | | | | 10,386 |
| | 18,313 |
| | — |
|
| | Net common stock issued under share-based compensation plans | | | | 781 |
| | 990 |
| | 50 |
|
| | Balance, end of year | | | | 370,567 |
| | 359,400 |
| | 340,097 |
|
| | | | | | | | | | |
| | Paid-in capital | | | | |
| | |
| | |
| | Balance, beginning of year | | | | 1,782,337 |
| | 1,670,238 |
| | 1,663,592 |
|
| | Cumulative effect of share-based compensation accounting standard update | | | | 49 |
| | — |
| | — |
|
| | Issuance of common stock | | | | 60,903 |
| | 113,146 |
| | — |
|
| | Net common stock issued under share-based compensation plans | | | | (7,602 | ) | | (6,020 | ) | | (478 | ) |
| | Reissuance of treasury stock, net under share-based compensation plans | | | | — |
| | (130 | ) | | (6,894 | ) |
| | Tax benefit from share-based compensation | | | | — |
| | 67 |
| | 2,116 |
|
| | Equity compensation | | | | 14,895 |
| | 11,373 |
| | 11,902 |
|
| | Reacquisition of convertible junior subordinated debentures-equity component | | | | — |
| | (6,337 | ) | | — |
|
| | Balance, end of year | | | | 1,850,582 |
| | 1,782,337 |
| | 1,670,238 |
|
| | | | | | | | | | |
| | Treasury stock | | | | |
| | |
| | |
| | Balance, beginning of year | | | | (150,359 | ) | | (3,362 | ) | | (32,937 | ) |
| | Purchases of common stock | | | | — |
| | (147,127 | ) | | — |
|
| | Reissuance of treasury stock, net | | | | 150,359 |
| | — |
| | — |
|
| | Reissuance of treasury stock, net under share-based compensation plans | | | | — |
| | 130 |
| | 29,575 |
|
| | Balance, end of year | | | | — |
| | (150,359 | ) | | (3,362 | ) |
| | | | | | | | | | |
| | Accumulated other comprehensive loss | | | | |
| | |
| | |
| | Balance, beginning of year | | | | (75,100 | ) | | (60,880 | ) | | (81,341 | ) |
| | Other comprehensive income (loss) | | | | 41,739 |
| | (14,220 | ) | | 20,461 |
|
| | Cumulative effect to reclassify certain tax effects from accumulated other comprehensive loss | | | | (10,422 | ) | | — |
| | — |
|
| | Balance, end of year | | | | (43,783 | ) | | (75,100 | ) | | (60,880 | ) |
| | | | | | | | | | |
| | Retained earnings (deficit) | | | | |
| | |
| | |
| | Balance, beginning of year | | | | 632,564 |
| | 290,047 |
| | (852,458 | ) |
| | Cumulative effect of share-based compensation accounting standard update | | | | 153 |
| | — |
| | — |
|
| | Net income | | | | 355,761 |
| | 342,517 |
| | 1,172,000 |
|
| | Reissuance of treasury stock, net | | | | (21,740 | ) | | — |
| | — |
|
| | Reissuance of treasury stock, net under share-based compensation plans | | | | — |
| | — |
| | (29,495 | ) |
| | Cumulative effect to reclassify certain tax effects from accumulated other comprehensive loss | | | | 10,422 |
| | — |
| | — |
|
| | Balance, end of year | | | | 977,160 |
| | 632,564 |
| | 290,047 |
|
| | | | | | | | | | |
| | Total shareholders' equity | | | | $ | 3,154,526 |
| | $ | 2,548,842 |
| | $ | 2,236,140 |
|
See accompanying notes to consolidated financial statements.
MGIC Investment Corporation 2017 Form 10-K | 104
|
| | | | | | | | | | | |
Consolidated Financial Statements and Notes |
MGIC Investment Corporation
2017 Form 10-K
| | | | | | | | | | | |
Table of Contents
|
| | | | | | | | | | | | | |
| | MGIC INVESTMENT CORPORATION AND SUBSIDIARIES |
| | CONSOLIDATED STATEMENTS OF CASH FLOWS |
| | | | | | | | |
| | | | Years Ended December 31, |
| | (In thousands) | | 2017 | | 2016 | | 2015 |
| | Cash flows from operating activities: | | | | | | |
| | Net income | | $ | 355,761 |
| | $ | 342,517 |
| | $ | 1,172,000 |
|
| | Adjustments to reconcile net income to net cash provided by operating activities: | | | | | | |
| | Depreciation and other amortization | | 64,430 |
| | 61,342 |
| | 52,559 |
|
| | Deferred tax expense (benefit) | | 355,044 |
| | 162,356 |
| | (692,810 | ) |
| | Net realized investment gains | | (249 | ) | | (8,932 | ) | | (28,361 | ) |
| | Loss on debt extinguishment | | 65 |
| | 90,531 |
| | 507 |
|
| | Change in certain assets and liabilities: | | |
| | |
| | |
|
| | Accrued investment income | | (1,987 | ) | | (3,849 | ) | | (9,706 | ) |
| | Prepaid reinsurance premium | | 11 |
| | 101 |
| | 47,457 |
|
| | Reinsurance recoverable on loss reserves | | 2,019 |
| | (6,006 | ) | | 13,354 |
|
| | Reinsurance recoverable on paid losses | | 1,092 |
| | (1,645 | ) | | 3,105 |
|
| | Premiums receivable | | (1,653 | ) | | (3,923 | ) | | 8,973 |
|
| | Deferred insurance policy acquisition costs | | (1,082 | ) | | (2,518 | ) | | (3,001 | ) |
| | Profit commission receivable | | (2,844 | ) | | (747 | ) | | 64,525 |
|
| | Loss reserves | | (453,178 | ) | | (454,589 | ) | | (503,405 | ) |
| | Premium deficiency reserve | | — |
| | — |
| | (23,751 | ) |
| | Unearned premiums | | 63,197 |
| | 49,764 |
| | 76,559 |
|
| | Return premium accrual | | (25,400 | ) | | (18,800 | ) | | (9,600 | ) |
| | Income taxes payable - current | | 49,178 |
| | 1,123 |
| | 2,518 |
|
| | Other, net | | 2,253 |
| | 18,035 |
| | (9,528 | ) |
| | Net cash provided by operating activities | | 406,657 |
| | 224,760 |
| | 161,395 |
|
| | Cash flows from investing activities: | | | | | | |
| | Purchases of investments: | | | | | | |
| | Fixed income | | (1,293,616 | ) | | (1,360,386 | ) | | (2,462,844 | ) |
| | Equity securities | | (79 | ) | | (3,197 | ) | | (2,623 | ) |
| | Proceeds from sales of fixed income | | 246,908 |
| | 728,042 |
| | 1,796,153 |
|
| | Proceeds from maturity of fixed income | | 759,212 |
| | 547,444 |
| | 559,774 |
|
| | Proceeds from sale of equity securities | | — |
| | 5,257 |
| | — |
|
| | Net increase in restricted cash | | — |
| | — |
| | 17,212 |
|
| | Additions to property and equipment | | (16,066 | ) | | (10,552 | ) | | (4,630 | ) |
| | Net cash used in investing activities | | (303,641 | ) | | (93,392 | ) | | (96,958 | ) |
| | Cash flows from financing activities: | | | | | | |
| | Proceeds from revolving credit facility | | 150,000 |
| | — |
| | — |
|
| | Repayment of revolving credit facility | | (150,000 | ) | | — |
| | — |
|
| | Proceeds from issuance of long-term debt | | — |
| | 573,094 |
| | — |
|
| | Repayment of long-term debt | | — |
| | — |
| | (61,953 | ) |
| | Purchase or repayment of convertible senior notes | | (145,620 | ) | | (363,778 | ) | | (11,152 | ) |
| | Payment of original issue discount - convertible senior notes | | (4,504 | ) | | (11,250 | ) | | (345 | ) |
| | Purchase of convertible junior subordinated debentures | | — |
| | (100,860 | ) | | — |
|
| | Payment of original issue discount-convertible junior subordinated debentures | | — |
| | (41,540 | ) | | — |
|
| | Cash portion of loss on debt extinguishment | | — |
| | (59,460 | ) | | (507 | ) |
| | Repurchase of common stock | | — |
| | (147,127 | ) | | — |
|
| | Payment of debt issuance costs | | (1,630 | ) | | (1,127 | ) | | — |
|
| | Payment of withholding taxes related to share-based compensation net share settlement | | (6,821 | ) | | (5,030 | ) | | (7,242 | ) |
| | Net cash used in financing activities | | (158,575 | ) | | (157,078 | ) | | (81,199 | ) |
| | Net decrease in cash and cash equivalents | | (55,559 | ) | | (25,710 | ) | | (16,762 | ) |
| | Cash and cash equivalents at beginning of year | | 155,410 |
| | 181,120 |
| | 197,882 |
|
| | Cash and cash equivalents at end of year | | $ | 99,851 |
| | $ | 155,410 |
| | $ | 181,120 |
|
See accompanying notes to consolidated financial statements.
MGIC Investment Corporation 2017 Form 10-K | 105
|
| | | | | | | | | | | |
Consolidated Financial Statements and Notes |
MGIC Investment Corporation
2017 Form 10-K
| | | | | | | | | | | |
| | | | | | | | | | | |
MGIC INVESTMENT CORPORATION AND SUBSIDIARIES
NOTES TO CONSOLIDATED FINANCIAL STATEMENTS
December 31, 2017, 2016 and 2015
Note 1. Nature of Business
MGIC Investment Corporation is a holding company which, through Mortgage Guaranty Insurance Corporation ("MGIC"), is principally engaged in the mortgage insurance business. We provide mortgage insurance to lenders throughout the United States and to government sponsored entities to protect against loss from defaults on low down payment residential mortgage loans. Our principal product is primary mortgage insurance. Primary mortgage insurance provides mortgage default protection on individual loans and covers a percentage of the unpaid loan principal, delinquent interest and certain expenses associated with the default and subsequent foreclosure or sale approved by us. Through certain non-insuranceus, of the underlying property. MGIC Assurance Corporation ("MAC") and MGIC Indemnity Corporation ("MIC"), insurance subsidiaries we also provide various services for the mortgage finance industry, such as contract underwriting, analysis of loan originations and portfolios, and mortgage lead generation. An insurance subsidiary of MGIC, provides creditprovide insurance for certain mortgages under Fannie Mae and Freddie Mac (the "GSEs") credit risk transfer programs in transactions entered into in 2016.programs.
Through certain non-insurance subsidiaries, we also provide certain services for the mortgage finance industry, such as contract underwriting.
At December 31, 2017,2022, our direct domestic primary insurance in force ("IIF") was $194.9$295.3 billion, which represents the principal balance in our records of all mortgage loans that we insure, and our direct domestic primary risk in force ("RIF") was $50.3$76.5 billion, which represents the IIF multiplied by the insurance coverage percentage.
Substantially allThe substantial majority of our insurance written since 2008 has beenNIW is for loans purchased by the GSEs. We operate under the Private Mortgage Insurer Eligibility RequirementsThe current private mortgage insurer eligibility requirements ("PMIERs") of the GSEs that became effective December 31, 2015include financial requirements, as well as business, quality control and which have been amended from time to time.certain transactional approval requirements. The financial requirements of the PMIERs require a mortgage insurer’s "Available Assets" (generally only the most liquid assets of an insurer) to equal or exceed its "Minimum Required Assets" (which are based on an insurer's book of risk in force, calculated from tables of factors with several risk dimensions and subject to a floor amount)dimensions). Based on our interpretationapplication of the PMIERs, as of December 31, 2017,2022, MGIC’s Available Assets are in excess of its Minimum Required Assets; and MGIC is in compliance with the financial requirements of the PMIERs and eligible to insure loans purchased by the GSEs.
The COVID-19 pandemic materially impacted our 2020 financial results as we reserved for losses associated with the increased delinquency inventory. Through December 31, 2022 the vast majority of those delinquency notices have cured resulting in favorable loss reserve development. We have addressed the impacts of COVID-19 throughout this document. Note 2. Basis of Presentation
Basis of presentation
| | | | | | | | |
| NOTE 2 | | Basis of Presentation |
BASIS OF PRESENTATION
The accompanying consolidated financial statements have been prepared in accordance with accounting principles generally accepted in the United States of America ("GAAP"), as codified in the Accounting Standards Codification ("ASC"). Our consolidated financial statements include the accounts of MGIC Investment Corporation and its majority-owned subsidiaries. Intercompany transactions and balances have been eliminated. In accordance with GAAP, we are required to make estimates and assumptions that affect the reported amounts of assets and liabilities and disclosure of contingent assets and liabilities at the date of the consolidated financial statements and the reported amounts of revenues and expenses during the reporting periods. Actual results could differ from those estimates.
SUBSEQUENT EVENTS
We have considered subsequent events through the date of this filing.
Reclassifications
Certain reclassifications to 2016 and 2015 amounts have been made in the accompanying consolidated financial statements to conform to the 2017 presentation. See Note 3 - "Significant Accounting Policies" for a discussion of our adoption of accounting guidance in 2017 that resulted in other reclassifications.
MGIC Investment Corporation 20172022 Form 10-K | 10782
MGIC Investment Corporation and Subsidiaries
|
| | | | | | | | | | | | | | | |
Consolidated Financial Statements and NotesNOTE 3 |
MGIC Investment Corporation
2017 Form 10-K
|
Notes (continued)Significant Accounting Policies |
Note 3. Significant Accounting Policies
Cash and Cash EquivalentsCASH AND CASH EQUIVALENTS
We consider money market funds and investments with original maturities of three months or less to be cash equivalents.
FairRESTRICTED CASH AND CASH EQUIVALENTS
Restricted cash and cash equivalents consists of cash and money market funds held in trusts for the benefit of contractual counterparties under reinsurance agreements or for other contractual restrictions.
FAIR VALUE MEASUREMENTS
We carry certain financial instruments at fair value measurementsand disclose the fair value of all financial instruments. Our financial instruments carried at fair value are predominantly measured on a recurring basis. Financial instruments measured on a nonrecurring basis are subject to fair value adjustments only in certain circumstances (for example, when there is evidence of impairment).
The authoritative accounting guidance includesfair value of an asset or liability is defined as the price that would be received upon a framework for measuring fair value.sale of an asset, or paid to transfer a liability, in an orderly transaction between market participants at the measurement date. Fair value is disclosedbased on quoted market prices or inputs, where available. If prices or quotes are not available, fair value is based on valuation models or other valuation techniques that consider relevant transaction characteristics (such as maturity) and use as inputs observable or unobservable market parameters including yield curves, interest rates, volatilities, equity or debt prices, and credit curves. Valuation adjustments may be made to ensure that financial instruments are recorded at fair value, as described below.
For the years ended December 31, 2022, 2021, and 2020, we did not elect to measure any financial instruments acquired, or issued, such as our outstanding debt obligations, at fair value for which the primary basis of accounting is not fair value.
Valuation process
We use independent pricing sources to determine the fair value of a substantial majority of our financial instruments, which primarily consist of assets in our investment portfolio, but also includes cash and cash equivalents and restricted cash and cash equivalents. A variety of inputs are used; in approximate order of priority, they are: benchmark yields, reported trades, broker/dealer quotes, issuer spreads, two-sided markets, benchmark securities, bids, offers, and reference data including market research publications.
Market indicators, industry, and economic events are also considered. The inputs listed above are evaluated using a multidimensional pricing model. This model combines all inputs to arrive at a value assigned to each security. Quality controls are performed by the independent pricing sources throughout this process, which include reviewing tolerance reports, trading information, data changes, and directional moves compared to market moves.
On a quarterly basis, we perform quality controls over values received from the pricing sources which also include reviewing tolerance reports, data changes, and directional moves compared
to market moves. We have not made any adjustments to the prices obtained from the independent pricing sources.
Valuation hierarchy
A three-level valuation hierarchy has been established under GAAP for disclosure of fair value measurements. The valuation hierarchy that prioritizesis based on the transparency of inputs to the valuation techniques used to measure fair value and includes Levels 1, 2, and 3.of a financial instrument as of the measurement date. To determine the fair value of securities available-for-sale in Level 1 and Level 2 of the fair value hierarchy, independent pricing sources, as described below, have been utilized. One price is provided per security based on observable market data. To ensure securities are appropriately classified in the fair value hierarchy, we review the pricing techniques and methodologies of the independent pricing sources and believe that their policies adequately consider market activity, either based on specific transactions for the issue valued or based on modeling of securities with similar credit quality, duration, yield and structure that were recently traded. A variety of inputs are utilized by the independent pricing sources including benchmark yields, reported trades, non-binding broker/dealer quotes, issuer spreads, two sided markets, benchmark securities, bids, offers and reference data including data published in market research publications. Inputs may be weighted differently for any security, and not all inputs are used for each security evaluation.
Market indicators, industry and economic events are also considered. This information is evaluated using a multidimensional pricing model. This model combines all inputs to arrive at a value assigned to each security. Quality controls are performed by the independent pricing sources throughout this process, which include reviewing tolerance reports, trading information, data changes, and directional moves compared to market moves. In addition, on a quarterly basis, we perform quality controls over values received from the pricing sources which also include reviewing tolerance reports, trading information, data changes, and directional moves compared to market moves. We have not made any adjustments to the prices obtained from the independent pricing sources.
In accordance with fair value accounting guidance, we applied the following fair value hierarchy in order to measure fair value for assets and liabilities:
Level 1 - Quoted prices for identical instruments in active markets that we can access. Financial assets utilizing Level 1 inputs primarily include U.S. Treasury securities and certain equity securities.
Level 2 - Quoted prices for similar instruments in active markets that we can access; quoted prices for identical or similar instruments in markets that are not active; and inputs, other than quoted prices, that are observable in the marketplace for the instrument. The observable inputs are used in valuation models to calculate the fair value of the instruments. Financial assets utilizing Level 2 inputs primarily include obligations of U.S. government corporations and agencies, corporate bonds, mortgage-backed securities, asset-backed securities, and most municipal bonds.
The independent pricing sources utilize these approaches to determine the fair value of the instruments in Level 2 of the fair value hierarchy based on type of instrument:
Corporate Debt & U.S. Government and Agency Bondsthree levels are evaluated by surveying the dealer community, obtaining relevant trade data, benchmark quotes and spreads and incorporating this information into the evaluation process.
Obligations of U.S. States & Political Subdivisions are evaluated by tracking, capturing, and analyzing quotes for active issues and trades reported via the Municipal Securities Rulemaking Board records. Daily briefings and reviews of current economic conditions, trading levels, spread relationships, and the slope of the yield curve provide further data for evaluation.
MGIC Investment Corporation 2017 Form 10-K | 108
|
| | | | | | | | | | | | | | | |
Consolidatedè | Level 1 | Quoted prices for identical instruments in active markets that we can access. Financial Statementsassets using Level 1 inputs primarily include U.S. Treasury securities, money market funds, treasury bills, and Notescertain equity securities. |
| è | Level 2 | MGIC Investment Corporation
2017 Form 10-KQuoted prices for similar instruments in active markets that we can access; quoted prices for identical or similar instruments in markets that are not active; and inputs, other than quoted prices, that are observable in the marketplace for the instrument. The observable inputs are used in valuation models to calculate the fair value of the instruments. Financial assets using Level 2 inputs primarily include obligations of U.S. government corporations and agencies, corporate bonds, mortgage-backed securities, asset-backed securities, most municipal bonds, and commercial paper.
The independent pricing sources used for our Level 2 investments vary by type of investment. See Note 6 - "Fair Value Measurements" for further information. |
Notes (continued)è | Level 3 | Valuations derived from valuation techniques in which one or more significant inputs or value drivers are unobservable or, from par values due to restrictions on certain securities that require them to be redeemed or sold only to the security issuer at par value. The inputs used to derive the fair value of Level 3 securities reflect our own assumptions about the assumptions a market participant would use in pricing an asset or liability. Our non-financial assets that are classified as Level 3 securities consist of real estate acquired through claim settlement and embedded derivatives related to our Home Re Transactions. The fair value of real estate acquired is the lower of our acquisition cost or a percentage of the appraised value. The percentage applied to the appraised value is based upon our historical sales experience adjusted for current trends. The fair value of our embedded derivatives reflects the present value impact of the variation in investment income on the assets held by the reinsurance trusts and the contractual reference rate on Home Re Transactions used to calculate the reinsurance premiums we estimate we will pay over the estimated remaining life. |
Residential Mortgage-Backed Securities ("RMBS")
MGIC Investment Corporation 2022 Form 10-K | 83
MGIC Investment Corporation and Subsidiaries
INVESTMENTS
Fixed income securities.Our fixed income securities are evaluated by monitoring interest rate movements, and other pertinent data daily. Incoming market data is enriched to derive spread, yield and/or price data as appropriate, enabling known data points to be extrapolated for valuation application across a range of related securities.
Commercial Mortgage-Backed Securities ("CMBS") are evaluated using valuation techniques that reflect market participants’ assumptions and maximize the use of relevant observable inputs including quoted prices for similar assets, benchmark yield curves and market corroborated inputs. Evaluation utilizes regular reviews of the inputs for securities covered, including executed trades, broker quotes, credit information, collateral attributes and/or cash flow waterfall as applicable.
Asset-Backed Securities ("ABS") are evaluated using spreads and other information solicited from market buy-and-sell-side sources, including primary and secondary dealers, portfolio managers, and research analysts. Cash flows are generated for each tranche, benchmark yields are determined, and deal collateral performance and tranche level attributes including trade activity, bids, and offers are applied, resulting in tranche specific prices.
Collateralized loan obligations ("CLO")Collateralized Loan Obligations are evaluated by manager rating, seniority in the capital structure, assumptions about prepayment, default and recovery and their impact on cash flow generation. Loan level net asset values are determined and aggregated for tranches and as a final step prices are checked against available recent trade activity.
Level 3 - Valuations derived from valuation techniques in which one or more significant inputs or value drivers are unobservable or, for certain equity securities, from their par value due to restrictions that require them to be redeemed or sold only to the security issuer at par value. The inputs used to derive the fair value of Level 3 securities reflect our own assumptions about the assumptions a market participant would use in pricing an asset or liability. Our non-financial assets that are classified as Level 3 securities consist of real estate acquired through claim settlement. The fair value of real estate acquired is the lower of our acquisition cost or a percentage of the appraised value. The percentage applied to the appraised value is based upon our historical sales experience adjusted for current trends.
Investments
Our entire investment portfolio is classified as available-for-sale and isare reported at fair value or, for certain equity securities carried at cost, amounts that approximate fair value. The related unrealized investment gains or losses are, after considering the related tax expense or benefit, recognized as a component of accumulated other comprehensive income (loss) in shareholders' equity. Realized investment gains and losses on fixed income securities are reported in income based upon specific identification of securities. Any changes in the credit allowance are also be reported in income within "Net gains (losses) on investments and other financial instruments" on the consolidated statement of operations.
Equity securities. Equity securities are reported at fair value, except for certain securities that are carried at cost. Equity securities carried at cost are reported as Other invested assets. Realized investment gains and losses on equity securities are reported in income based upon specific identification of securities sold. (See Note 5 – “Investments.”)Any change in fair value of equity securities are also be reported in income within "Net gains (losses) on investments and other financial instruments" on the consolidated statement of operations. .
Other invested assets.Other invested assets are carried at cost. These assets represent our investment in Federal Home Loan Bank of Chicago ("FHLB") stock, which due to restrictions, is required to be redeemed or sold only to the security issuer at par value.
Accrued Investment Income. We report accrued investment income separately from securities. Accrued investment income is written off through net realized investment gains (losses) if, and at the time, the issuer of the security defaults or is expected to default on payments.
Unrealized losses and allowance for credit losses
Each quarter we perform reviews of our investments in order to determine whether declinessecurities in fair value below amortized cost were considered other-than-temporary. In evaluating whether a decline in fair value is other-than-temporary, we consideran unrealized loss position are impaired by considering several factors including, but not limited to:
| | | | | |
▪è | our intent to sell the security or whether it is more likely than not that we will be required to sell the security before recovery of its amortized cost basis; |
| |
▪è | the present value of the discounted cash flows we expect to collect compared to the amortized cost basis of the security; |
| |
▪ | extent and duration of the decline; |
| |
▪è | failure of the issuer to make scheduled interest or principal payments; |
| è | |
▪ | a change in rating to below investment grade; and |
| è | |
▪ | adverse conditions specifically related to the security, an industry, or a geographic area. |
Based on our evaluation, we will record a realized loss on an other-than-temporary impairment ("OTTI") adjustment on aimpaired security if we intend to sell, the impaired security, if it is more likely than not that we will be required to sell the impaired securityit prior to recovery of its amortized cost basis, or if the present value of the discounted cash flows we expect to collect is less than the amortized cost basis of the security. If the fair value of a security is below its
MGIC Investment Corporation 2017 Form 10-K | 109
|
| | | | | | | | | | | | | | | |
Consolidated Financial Statements and Notes |
MGIC Investment Corporation
2017 Form 10-K
|
Notes (continued) |
amortized cost at the time of our intent to sell, the security is classified as other-than-temporarily impaired and the full amount of the impairment is recognized as a loss in the statement of operations. Otherwise, whenWhen a security is considered to be other-than-temporarily impaired, but when a sale is not intended or is not likely, the losses areloss is separated into the portion of the loss that represents the credit loss and the portion that is due to other factors. TheA credit loss portion is recognized as a lossrecorded, subject to reversal, in the consolidated statement of operations while thewithin "Net gains (losses) on investments and other financial instruments." The loss due to other factors is recognized in accumulated other comprehensive loss, net of taxes. A credit loss is determined to exist if the present value of the discounted cash flows, using the security’s original yield, expected to be collected from the security is less than the cost basis of the security.
Home office and equipmentHOME OFFICE AND EQUIPMENT
Home office and equipment is carried at cost net of depreciation. For financial reporting purposes, depreciation is determined on a straight-line basis for the home office and equipment over estimated lives ranging from 3 to 45 years. For income tax purposes, we use accelerated depreciation methods.
Home office and equipment is shown net of accumulated depreciation of $33.9$57.1 million, $30.6$55.4 million and $26.1$51.2 million as of December 31, 2017, 20162022, 2021 and 2015,2020, respectively. Depreciation expense for the years ended December 31, 2017, 20162022, 2021 and 20152020 was $5.4$4.9 million, $4.6$5.6 million and $3.2$6.3 million, respectively.
Deferred Insurance Policy Acquisition CostsDEFERRED INSURANCE POLICY ACQUISITION COSTS
Costs directly associated with the successful acquisition of mortgage insurance business, consisting of employee compensation and other policy issuance and underwriting expenses, are initially deferred and reported as deferred insurance policy acquisition costs ("DAC"). The deferred costs are net of any ceding commissions received associated with our reinsurance agreements. For each underwriting year of business, these costs are amortized to income in proportion to estimated gross profits over the estimated life of the policies. We utilize anticipated investment income in our calculation. This includes accruing interest on the unamortized balance of DAC. The estimates for each underwriting year are reviewed quarterly and updated when necessary to reflect actual experience and any changes to key variables such as persistency or loss development.
LOSS RESERVES
Loss Reserves
Reserves are established for insurance lossesreserves include case reserves, incurred but not reported ("IBNR") reserves, and loss adjustment expensesexpense ("LAE") reserves.
Case reserves and LAE reserves are established when we receive notices of defaultdelinquency on insured mortgage loans. Weloans are received. Such loans are referred to as being in our delinquency inventory. For reporting purposes, we consider a loan in defaultdelinquent when it is two or more payments past due.due and has not become current or resulted in a claim payment. Even though the accounting standard, ASC 944, regarding accounting and reporting by insurance entities specifically excludes mortgage insurance from its guidance relating to loss reserves, we establish loss reserves using the general principles contained in the insurance standard. However, consistent with industry standards for mortgage insurers, we do not establish losscase reserves for future claims on insured loans whichthat are not currently in default. Lossdelinquent.
Case reserves are established by estimating the number of loans in our delinquency inventory of delinquent loans that will result in a claim payment, which is referred to as the claim rate, and further estimating the amount of the claim payment, which is referred to as claim
MGIC Investment Corporation 2022 Form 10-K | 84
MGIC Investment Corporation and Subsidiaries
severity. Our losscase reserve estimates are primarily established based upon historical experience, including rescissions of policies, curtailments of claims, and loan modification activity. Adjustments to reserve estimates are reflected in the financial statements in the years in which the adjustments are made. The liability for reinsurance assumed is based on information provided by the ceding companies.
ReservesIBNR reserves are also established for delinquencies estimated losses from defaults occurringto have occurred prior to the close of an accounting period, on notices of defaultbut have not yet been reported to us. These incurred but notConsistent with case reserves for reported ("IBNR")delinquencies, IBNR reserves are also established using estimated claim rates and claim severities.
ReservesLAE reserves are also established for the estimated costs of settling claims, including legal and other expenses, and general expenses of administering the claims settlement process. Reserves
Our loss reserve estimates are also affected by any agreements we enter into regarding our claims paying practices, as discussed in Note 17 – “Litigation and Contingencies” to our consolidated financial statements.
Premium Deficiency ReservePREMIUM DEFICIENCY RESERVE
After our loss reserves are initially established, we perform premium deficiency tests using our best estimate assumptions as of the testing date.future premium, losses and LAE paid. Premium deficiency reserves are established, if necessary, when the present value of expected future losses and expensesLAE paid exceeds the present value of expected future premium
MGIC Investment Corporation 2017 Form 10-K | 110
|
| | | | | | | | | | | | | | | |
Consolidated Financial Statements and Notes |
MGIC Investment Corporation
2017 Form 10-K
|
Notes (continued) |
and already established loss reserves. Products are grouped for premium deficiency testing purposes based on similarities in the way the products are acquired, serviced and measured for profitability.
The calculation of premium deficiency reserves requires the use of significant judgments and estimates to determine the present value of future premium and present value of expected losses and expenses on our business. Similar to our loss reserve estimates, our estimates for premium deficiency reserves could be adversely affected by several factors discussed in Note 8 - Loss Reserves. To the extent premium patterns and actual loss experience differ from the assumptions used in calculating the premium deficiency reserves, the differences between the actual results and our estimate will affect future period earnings and could be material.
We established a premium deficiency reserve in 2007 on our Wall Street Bulk business, which we also ceased writing in that year. The premium deficiency reserve was eliminated in 2015 and our consolidated statement of operations for the year ended December 31, 2015 was affected by a decrease in our premium deficiency reserves of $24 million.
Revenue RecognitionREVENUE RECOGNITION
We write policies which are guaranteed renewable contracts at the insured's option on a monthly, single, or annual premium basis. We have no ability to reunderwritere-underwrite or reprice these contracts.policies. Premiums written on monthly premium policies are earned as coverage is provided. Premiums written on single premium policies and annual premium policies are initially deferred as unearned premium reserve and earned over the estimated policy life. Premiums written on single premium policies are amortized over the policy life in relationship to the anticipated incurred loss pattern based on historical experience.reserve. Premiums written on annual premium policies are earned on a monthly pro rata basis. Premiums written on policies covering more than one year are amortized over the estimated policy life based on historical experience, which includes the anticipated incurred loss pattern. When a policy is cancelled for a reason other than rescission or claim payment, all premium that is non-refundable is immediately earned. Any refundable premium is returned to the servicer or borrower. When a policy is cancelled due to rescission, all previously collected premium is returned, to the servicer and whenWhen a policy is cancelled because a claim is paid, premium collected since the date of defaultdelinquency is returned.
The liability associated with our estimate of premium to be returned is accrued for separately and included in "Other liabilities" on our consolidated balance sheets. When a premium deficiency exists the premium refund liability is included in “Premium deficiency reserves” on our consolidated balance sheets. Changes in these liabilities affect premiums writtenthis liability, and earned and change in premium deficiency reserve, respectively. Thethe actual return of premiumpremiums for all periods, affects premiums written and earned.
We assess whether a credit loss allowance is required for our premium receivable. We consider collectability trends and
industry development, among other things. Any estimated credit loss would be immediately recognized.
Fee income of our non-insurance subsidiaries is earned and recognized as the services are provided and the customer is obligated to pay. Fee income consists primarily of contract underwriting and related fee-based services provided to lenders and is included in “Other revenue” on the consolidated statements of operations.
Income TaxesINCOME TAXES
Deferred income taxes are provided under the liability method, which recognizes the future tax effects of temporary differences between amounts reported in the consolidated financial statements and the tax bases of these items. The expectedestimated tax effects are computed at the enacted regular federal statutory income tax rate. Using this method, we have recorded a net deferredChanges in tax asset primarily duelaws, rates, regulations, and policies or the final determination of tax audits or examinations, could materially affect our estimates and can be significant to netour operating losses incurred in prior years. During 2017, netresults. We evaluate the realizability of the deferred tax assets were remeasured atbased on the lower corporateweight of all available positive and negative evidence. Deferred tax rate enacted under the U.S. tax reform legislation signed into law in the fourth quarter of 2017 (the "Tax Act"). See Note 12- "Income Taxes" for discussion of the impact of the Tax Act on our consolidated financial statements.
On a quarterly basis, we review the need to maintain a deferred tax asset valuation allowance as an offset to the net deferred tax asset, before valuation allowance. We analyze several factors, among whichassets are the severity and frequency of operating losses, our capacity for the carryback or carryforward of any losses, the existence and current level of taxable operating income, operating results on a three year cumulative basis, the expected occurrence of future income or loss, the expiration dates of the carryforwards, the cyclical nature of our operating results, and available tax planning strategies. Based on our analysis, we reduced our benefit from income tax through the recognition ofby a valuation allowance from the first quarter of 2009 through the second quarter of 2015. In the third quarter of 2015, as discussed in Note 12 – “Income Taxes,” we concluded
MGIC Investment Corporation 2017 Form 10-K | 111
|
| | | | | | | | | | | | | | | |
Consolidated Financial Statements and Notes |
MGIC Investment Corporation
2017 Form 10-K
|
Notes (continued) |
thatif it wasis more likely than not that ourall or some portion of the deferred tax assets wouldwill not be fully realizablerealized.
The recognition of a tax position is determined using a two-step approach. The first step applies a more-likely-than-not threshold for recognition and derecognition. The second step measures the tax position as the greatest amount of benefit that is cumulatively greater than 50% likely to be realized. When evaluating a tax position for recognition and measurement, we reversedpresume that the valuation allowance.
tax position will be examined by the relevant taxing authority that has full knowledge of all relevant information. We provide for uncertain tax positions and the relatedrecognize interest accrued and penalties based onrelated to unrecognized tax benefits in our assessment of whether aprovision for income taxes.
Federal tax law permits mortgage guaranty insurance companies to deduct from taxable income, subject to certain limitations, the amounts added to contingency loss reserves that are recorded for regulatory purposes. The amounts we deduct must generally be included in taxable income in the tenth subsequent year. The deduction is allowed only to the extent that we purchase and hold U.S. government non-interest-bearing tax and loss bonds in an amount equal to the tax benefit is more likely than notattributable to be sustained under any examination by taxing authorities.the deduction. We account for these purchases as a payment of current federal income tax. (See "Note 12 - Income Taxes.")
Benefit PlansBENEFIT PLANS
We have a non-contributory defined benefit pension plan covering substantially all employees, as well as a supplemental executive retirement plan. Effective January 1, 2023, these plans are frozen (no future benefits will be accrued for participants due to employment and no new participants will be added). Retirement benefits arewere based on compensation and years of service.service, utilizing a cash balance formula. Under the cash balance formula, participants’ accounts were credited each year with an employer contribution. Participants will continue to earn interest credits on their retirement benefits. We recognize these retirement benefit costs over the period during which employees render the service that qualifies them for benefits. Our policy is to fund pension cost as required under the Employee Retirement Income Security Act of 1974.
MGIC Investment Corporation 2022 Form 10-K | 85
MGIC Investment Corporation and Subsidiaries
We offer both medical and dental benefits for retired domestic employees, their eligible spouses and dependents until the retiree reaches thedependents. Eligibility for coverage is based on meeting certain years of service and retirement age of 65. Under the plan retirees pay a premium for these benefits.qualifications. We accrue the estimated costs of retiree medical and dental benefits over the period during which employees render the service that qualifies them for benefits. (See Note 11 – “Benefit Plans.”)
ReinsuranceREINSURANCE
We cede insurance risk through the use of quota share reinsurance transactions and excess of loss reinsurance transactions. We have excess of loss transactions executed through the traditional reinsurance market and with Home Re, special purpose insurers. Premiums and losses incurred are ceded pursuant to the terms of our quota share reinsurance transactions. Reinsurance premiums ceded under our traditional reinsurance transaction are based off the remaining reinsured coverage levels. Reinsurance premiums ceded under our Home Re transactions are composed of coverage, initial expense and supplemental premiums. The coverage premiums are generally calculated as the difference between the amount of interest payable by the Home Re Entity on the remaining reinsurance coverage levels, and the investment income collected on the collateral assets held in the reinsurance trust account and used to collateralize the Home Re Entity's reinsurance obligation to MGIC.
Loss reserves and unearned premiums are reported before taking credit for amounts ceded under reinsurance agreements.transactions. Ceded loss reserves are reflected as "Reinsurance recoverable on loss reserves." Ceded unearned premiums are included in “Other assets.” Amounts due from reinsurers on paid claims are reflected as “Reinsurance recoverable on paid losses.” Ceded premiums payable, net of ceding commission and profit commission are included in “Other liabilities.” Any profitProfit commissions are included with “Premiums written – Ceded” and any ceding commissions are included with “Other underwriting and operating expenses, net.” We remain liable for all insurance ceded. (See Note 9 – “Reinsurance.”)
Share-Based CompensationWe assess whether a credit loss allowance is required for our reinsurance recoverables. In assessing whether a credit allowance should be established, we consider several factors including, but not limited to, the credit ratings of individual reinsurers, investor reports for our excess of loss transactions, collateral held in trust accounts in which MGIC is the sole beneficiary, and aging of outstanding reinsurance recoverable balances.
Assumed reinsurance is based on information received from the ceding company.
See Note 9 – “Reinsurance" for discussion of our variable interest entity ("VIE") policy on the Home Re Transactions.
SHARE-BASED COMPENSATION
We have certain share-based compensation plans. Under the fair value method, compensation cost is measured at the grant date based on the fair value of the award and is recognized over the service period which generally corresponds to the vesting period. Awards under our plans generally vest over periods ranging from one to three years.years, although awards to our non-employee directors vest immediately. (See Note 15 – “Share-based Compensation Plans.”)
Earnings per Share
EARNINGS PER SHARE
Basic earnings per share ("EPS") is calculated by dividing net income by the weighted average number of shares of common stock outstanding. The computation of basic EPS includes as "participating securities" an immaterial number of unvested share-based compensation awards that contain non-forfeitable rights to dividends or dividend equivalents, whether paid or unpaid, under the "two-class" method. Our participating securities are composed of vested restricted stock and restricted stock units ("RSUs") with non-forfeitable rights to dividends (of which none have been declared since the issuance of these participating securities).dividends. Diluted EPS includes the components of basic EPS and also gives effect to dilutive common stock equivalents. We calculate diluted EPS using the treasury stock method and if-converted method. Under the treasury stock method, diluted EPS reflects the potential dilution that could occur if our unvested restricted stock units result in the issuance of common stock. Under the if-converted method, diluted EPS reflects the potential dilution that could occur if our convertible debt instruments result in the issuance of9% Debentures are converted to common stock. The determination of potentially issuable shares does not consider the satisfaction of the conversion requirements and the shares are included in the determination of diluted EPS as of the beginning of the period, if dilutive. In addition to our 9% Debentures, of which a portion remain outstanding, we previously had several senior note debt issuances that could have resulted in contingently issuable shares and we considered each potential issuance of shares separately to reflect the maximum potential dilution for the period the debt issuances were outstanding. For purposes of calculating basic and diluted EPS, vested restricted stock and RSUs are considered outstanding.
RELATED PARTY TRANSACTIONS
In 2022, there were no material related party transactions. In 2021 MGIC distributed to the holding company, as a dividend, its investment in MGIC Credit Assurance Corporation. In 2020 MGIC Reinsurance Corporation of Wisconsin, a subsidiary of MGIC, merged with MGIC.
Related party transactions
There were no related party transactions during 2017, 2016 or 2015.
MGIC Investment Corporation 20172022 Form 10-K | 11286
|
| | | | | | | | | | | | | | | |
Consolidated Financial Statements and Notes |
MGIC Investment Corporation
2017 Form 10-K
|
Notes (continued) |
Recent accounting and reporting developments
Accounting standards effective in 2017, or early adopted, and relevant to our financial statements
Table 3.1 shows the relevant amendments to accounting standards that have been implemented for the fiscal year beginning January 1, 2017; none had a material impact on our consolidated financial statements or disclosures.
|
| | | | | |
| Table | 3.1 | | | |
Standard / Interpretation | | | | Effective date |
Amended Standards | | | |
| ASC 220 | Income Statement - Reporting Comprehensive Income | |
| | • | ASU 2018-02 - Reclassification of Certain Tax Effects from Accumulated Other Comprehensive Income
| January 1, 2019 |
| ASC 718 | Compensation - Stock Compensation | |
| | • | ASU 2016-09 - Improvements to Employee Share-Based Compensation Accounting | January 1, 2017 |
Reclassification of Certain Tax Effects from Accumulated Other Comprehensive Income
In February 2018, the Financial Accounting Standards Board ("FASB") issued updated guidance that allows an election to reclassify stranded tax effects resulting from the Tax Act's newly enacted federal corporate income tax rate of 21% from accumulated other comprehensive income to retained earnings in an amount that reflects the effect of the change in tax rate on the gross deferred tax amounts and related valuation allowances, if any, at the date of the enactment of the Tax Act related to items remaining in accumulated comprehensive income (loss). Other than the effect of the change in tax rate, we have no other income tax effects related to the application of the Tax Act that are reclassified from accumulated other comprehensive income (loss) to retained earnings. Absent the updated guidance, we generally would remove stranded tax effects lodged in accumulated other comprehensive income (loss) at the time the circumstances under which these tax effects originally arose no longer exist. The updated guidance is effective for annual periods beginning after December 15, 2018, including interim periods within those annual periods. Early adoption is permitted and we adopted this guidance electing to reclass stranded tax effects from the Tax Act to retained earnings for the fourth quarter ending December 31, 2017.
| |
◦ | Adoption impact: We recorded a cumulative effect adjustment that reclassified $10.4 million from accumulated other comprehensive loss to retained earnings to reflect the difference between the amount initially credited to other comprehensive income (loss) and the amount that would have been credited at the newly enacted federal corporate tax rate. The effect of this reclassification increases our retained earnings and increases our accumulated other comprehensive loss, with no change to our total shareholders' equity as of December 31, 2017.
|
Improvements to Employee Share-Based Compensation Accounting
In March 2016, the FASB issued updated guidance that simplifies several aspects of the accounting for employee share-based compensation including the accounting for income taxes, forfeitures, and statutory tax withholding requirements, as well as classification of related amounts within the statement of cash flows. Specifically, the updated guidance requires the following:
Tax effects related to share-based compensation are made through the statement of operations at the time of settlement instead of recognizing them in paid-in capital.
| |
◦ | Adoption impact: We recognized discrete tax benefits of $1.6 million in the provision for income taxes on our statement of operations for the year ended December 31, 2017 related to excess tax benefits upon vesting of share-based awards during the period.
|
Recognition of a tax benefit is no longer required to be delayed until it reduces current taxes payable.
| |
◦ | Adoption impact: We recognized an immaterial cumulative effect adjustment in opening retained earnings as of January 1, 2017 related to the recognition of a deferred tax asset related to suspended tax benefits from vesting transactions occurring in prior years and from the elimination of our forfeiture estimate on share-based awards, which was previously applied only to awards with service conditions. |
MGIC Investment Corporation 2017 Form 10-K | 113and Subsidiaries
|
| | | | | | | | | | | | | | | |
Consolidated Financial Statements and Notes |
MGIC Investment Corporation
2017 Form 10-K
|
Notes (continued) |
Tax related cash flows resulting from share-based compensation are to be reported as operating activities on the statement of cash flows, instead of as an inflow from financing activities and an outflow from operating activities.
| |
◦ | Adoption impact: We reclassified excess tax benefits related to share-based compensation for 2016 and 2015 to operating activities from financing activities. |
Shares withheld by an employer for tax-withholding purposes upon vesting of equity compensation represents a cash outflow required to be classified as a financing activity on the statements of cash flows.
| |
◦ | Adoption impact: We reclassified employee taxes paid for withheld shares for 2016 and 2015 to financing activities from operating activities. |
The update also allows, for tax withholding purposes, entities to withhold an amount of shares up to the employee’s maximum individual tax rate (as opposed to the minimum statutory tax rate) in the relevant jurisdiction without resulting in liability classification of the award. A change in tax withholding is to be applied on a modified retrospective approach.
Prospective Accounting Standards
Table 3.23.1 shows the relevant new amendments to accounting standards, which are not yet effective or adopted.
|
| | | | | |
| Table | 3.2 | | | |
Standard / Interpretation | | | | Effective date |
Amended Standards | | | |
| ASC 718 | Compensation - Stock Compensation | |
| | • | ASU 2017-09 - Scope of Modification Accounting | January 1, 2018 |
| ASC 715 | Compensation - Retirement Benefits | |
| | • | ASU 2017-07 - Improving the Presentation of Net Periodic Pension Cost and Net Periodic Postretirement Benefit Cost | January 1, 2018 |
| ASC 310 | Receivables - Nonrefundable Fees and Other Costs | |
| | • | ASU 2017-08 - Premium Amortization on Purchased Callable Debt Securities | January 1, 2019 |
| ASC 326 | Financial Instruments - Credit Losses | |
| | • | ASU 2016-13 - Measurement of Credit Losses on Financial Instruments | January 1, 2020 |
| ASC 825 | Financial Instruments - Overall | |
| | • | ASU 2016-01 - Recognition and Measurement of Financial Assets and Financial Liabilities | January 1, 2018 |
Stock Compensation - Scope of Modification Accounting
In May 2017, the FASB issued updated guidance related to a change in the terms or conditions (modification) of a share-based award. The updated guidance provides that an entity should account for the effects of a modification unless the fair value and vesting conditions of the modified award and the classification of the award (equity or liability instrument) are the same as the original award immediately before the modification. The updated guidance addresses the current diversity in practice on applying modification accounting, as some entities evaluate whether changes to awards are substantive, which is not prescribed within the current accounting guidance. The updated guidance is effective for annual periods beginning after December 15, 2017, including interim periods within those annual periods. We are currently evaluating the impacts the adoption of this guidance will have on our consolidated financial statements, but do not expect it to have a material impact on our consolidated financial statements or disclosures.
Improving the Presentation of Net Periodic Pension Cost and Net Periodic Postretirement Benefit Cost
In March 2017, the FASB issued updated guidance that improves the reporting of net benefit cost in the financial statements. The updated guidance requires that an employer report the service cost component in the same financial statement caption as other compensation costs arising from services rendered by
MGIC Investment Corporation 2017 Form 10-K | 114
|
| | | | | | | | | | | | | | | |
Consolidated Financial Statements and NotesStandard / Interpretation |
MGIC Investment Corporation
2017 Form 10-K
Table | 3.1 | | |
Notes (continued) | | | |
| Amended Standards | Effective date |
| | |
| | | |
| ASC 944 | Long-Duration Contracts | |
| • | ASU 2018-12 - Financial Services - Insurance (Topic 944): Targeted Improvements to the Accounting for Long-Duration Contracts | January 1, 2023 |
| ASC 848 | Reference Rate Reform | |
| • | ASU 2020-06 - Reference Rate Report (Topic 848): Deferral of the Sunset Date of Topic 848. | January 1, 2023 |
| Inflation Reduction Act | |
| • | Inflation Reduction Act of 2022 | January 1, 2023 |
employees duringTargeted Improvements for Long Duration Contracts: ASU 2018-12
In August 2018, the period. The other componentsFASB issued guidance which simplifies the amortization of net benefit cost are requireddeferred insurance policy acquisition costs. It also provides updates to be presented in the statement of operations separately from the service cost componentrecognition, measurement, presentation and outside a subtotal of income from operations, if one is presented. Current guidance doesdisclosure requirements for long duration contracts, which generally do not prescribe where the amount of net benefit cost should be presented in an employer’s statement of operations and does not require entitiesapply to disclose by line item the amount of net benefit cost that is included in the statement of operations.mortgage insurance. The updated guidance isrequires deferred acquisition costs to be amortized on a constant level basis over the expected term of the related contracts, versus in proportion to premium, gross profits, or gross margins. In November 2020, FASB issued ASU 2020-11 deferring the effective date, so that it applies for annual periods beginning after December 15, 2017,2022, including interim periods within those annual periods. We are currently evaluatinghave evaluated the impactsimpact of the adoption of this guidance will have on our consolidated financial statements, but doand determined it will not expect ithave a material impact.
Reference Rate Reform: ASU 2022-06
In March 2020, the FASB issued ASU 2020-04 to provide temporary optional guidance to ease the potential burden in accounting for (or recognizing the effects of) reference rate reform. It provided optional expedients and exceptions for applying generally accepted accounting principles to contracts, hedging relationships and other transactions affected by reference rate reform if certain criteria are met. In December 2022, the FASB issued ASU 2022-06, extending the election and application from March 12, 2020 through December 31, 2024 (originally December 31, 2022). The adoption of, and future elections under, this standard are not expected to have a material impact on our consolidated financial statements as the standard will ease, if warranted, the requirements for accounting for the future effects of reference rate reform. We continue to monitor the impact the discontinuance of LIBOR or disclosures.
Premium Amortization on Purchased Callable Debt Securities
In March 2017, the FASB issued updated guidance to amend the amortization period for premiums on certain purchased callable debt securities, shortening the amortization period to the earliest call date. Under current GAAP, there is diversity in practice in the amortization period for premiums of callable debt securities and in how the potential for exercise of a call is factored into current impairment assessments. This updated guidance aligns with how callable debt securities, in the United States, are generally quoted, priced, and traded, which incorporates consideration of calls (also referred to as “yield-to-worst” pricing). The updated guidance is effective for annual periods beginning after December 15, 2018, including interim periods within those annual periods. Early adoption is permitted, including adoption in an interim period. We are currently evaluating the impacts the adoption of this guidanceother reference rates will have on our consolidated financial statements, butcontracts and other transactions.
Inflation Reduction Act
The Inflation Reduction Act of 2022 includes provisions for a 1% excise tax on net stock repurchases and a 15% corporate minimum tax. Both of these taxes are effective in 2023. We do not expect itthese tax provisions to have a material impact on our consolidated financial statements or disclosures. We currently account for premium amortization on our purchased callable debt securities on a yield-to-worst basis, which generally aligns with the earliest call date.statements.
Measurement of Credit Losses on Financial Instruments
In June 2016, the FASB issued updated guidance that requires immediate recognition of estimated credit losses expected to occur over the remaining life of many financial instruments. Entities will be required to utilize a current expected credit losses (“CECL”) methodology that incorporates their forecasts of future economic conditions into their loss estimate unless such forecasts are not reasonable and supportable, in which case the entity will revert to historical loss experience. Any allowance for CECL reduces the amortized cost basis of the financial instrument to the amount an entity expects to collect. Credit losses relating to available-for-sale fixed maturity securities are to be recorded through an allowance for credit losses, rather than a write-down of the asset, with the amount of the allowance limited to the amount by which fair value is less than amortized cost. In addition, the length of time a security has been in an unrealized loss position will no longer impact the determination of whether a credit loss exists. The updated guidance is not prescriptive about certain aspects of estimating expected credit losses, including the specific methodology to use, and therefore will require significant judgment in application. The updated guidance is effective for annual periods beginning after December 15, 2019, including interim periods within those annual periods. Early adoption is permitted for annual and interim periods in fiscal years beginning after December 15, 2018. We are currently evaluating the impacts the adoption of this guidance will have on our consolidated financial statements, but do not expect it to have a material impact on our consolidated financial statements or disclosures.
Recognition and Measurement of Financial Assets and Financial Liabilities
In January 2016, the FASB issued updated guidance to address the recognition, measurement, presentation, and disclosure of certain financial instruments. The updated guidance requires equity investments, except those accounted for under the equity method of accounting, that have a readily determinable fair value to be measured at fair value with changes in fair value recognized in net income. Equity investments that do not have readily determinable fair values may be remeasured at fair value either upon the occurrence of an observable price change or upon identification of an impairment. A qualitative assessment for impairment is required for equity investments without readily determinable fair values. The updated guidance also eliminates the requirement to disclose the method and significant assumptions used to estimate the fair value of financial instruments measured at amortized cost on the balance sheet. Further, the updated guidance clarifies that entities should evaluate the need for a valuation allowance on a deferred tax asset related to available-for-sale securities in combination with the entity's other deferred tax assets. The updated guidance is effective for annual periods beginning after December 15, 2017, including interim periods within those
MGIC Investment Corporation 20172022 Form 10-K | 11587
MGIC Investment Corporation and Subsidiaries
|
| | | | | | | | | | | | | | | |
Consolidated Financial Statements and NotesNOTE 4 |
MGIC Investment Corporation
2017 Form 10-K
|
Notes (continued)Earnings Per Share |
annual periods and will require recognition of a cumulative effect adjustment at adoption. We do not currently expect the adoption of this guidance to impact our consolidated financial statements or disclosures.
Note 4. Earnings Per Share
Table 4.1 reconciles basic and diluted EPS amounts:
| | | | | | | | | | | | | | | | | | | | | | | |
| Earnings per share |
| Table | 4.1 | | | | | | |
| | Years Ended December 31, |
| (In thousands, except per share data) | | 2022 | | 2021 | | 2020 |
| Basic earnings per share: | | | | | | |
| Net income | | $ | 865,349 | | | $ | 634,983 | | | $ | 446,093 | |
| Weighted average common shares outstanding - basic | | 305,847 | | | 334,330 | | | 339,953 | |
| Basic earnings per share | | $ | 2.83 | | | $ | 1.90 | | | $ | 1.31 | |
| Diluted earnings per share: | | | | | | |
| Net income | | $ | 865,349 | | | $ | 634,983 | | | $ | 446,093 | |
Interest expense, net of tax (1): | | | | | | |
| 9% Debentures | | 3,228 | | | 14,343 | | | 17,004 | |
| Diluted income available to common shareholders | | $ | 868,577 | | | $ | 649,326 | | | $ | 463,097 | |
| Weighted-average shares - basic | | 305,847 | | | 334,330 | | | 339,953 | |
| Effect of dilutive securities: | | | | | | |
| Unvested restricted stock units | | 1,917 | | | 1,782 | | | 1,589 | |
| 9% Debentures | | 3,465 | | | 15,196 | | | 17,751 | |
| Weighted average common shares outstanding - diluted | | 311,229 | | | 351,308 | | | 359,293 | |
| Diluted income per share | | $ | 2.79 | | | $ | 1.85 | | | $ | 1.29 | |
| | | | | | |
|
| | | | | | | | | | | | | | |
| | Table | 4.1 | | | | | | |
| Earnings per share | | | Years Ended December 31, |
| (In thousands, except per share data) | | 2017 | | 2016 | | 2015 |
| | Basic earnings per share: | | | | | | |
| | Net income | | $ | 355,761 |
| | $ | 342,517 |
| | $ | 1,172,000 |
|
| | Weighted average common shares outstanding - basic | | 362,380 |
| | 342,890 |
| | 339,552 |
|
| | Basic earnings per share | | $ | 0.98 |
| | $ | 1.00 |
| | $ | 3.45 |
|
| | Diluted earnings per share: | | | | | | |
| | Net income | | $ | 355,761 |
| | $ | 342,517 |
| | $ | 1,172,000 |
|
| | Interest expense, net of tax (1): | | | | | | |
| | 2% Notes | | 907 |
| | 6,111 |
| | 7,928 |
|
| | 5% Notes | | 1,709 |
| | 6,362 |
| | 12,228 |
|
| | 9% Debentures | | 15,027 |
| | 15,893 |
| | 22,786 |
|
| | Diluted income available to common shareholders | | $ | 373,404 |
| | $ | 370,883 |
| | $ | 1,214,942 |
|
| | Weighted-average shares - Basic | | 362,380 |
| | 342,890 |
| | 339,552 |
|
| | Effect of dilutive securities: | | | | | | |
| | Unvested restricted stock units | | 1,493 |
| | 1,470 |
| | 2,113 |
|
| | 2% Notes | | 8,317 |
| | 54,450 |
| | 71,917 |
|
| | 5% Notes | | 3,548 |
| | 13,107 |
| | 25,603 |
|
| | 9% Debentures | | 19,028 |
| | 20,075 |
| | 28,854 |
|
| | Weighted average common shares outstanding - diluted | | 394,766 |
| | 431,992 |
| | 468,039 |
|
| | Diluted income per share | | $ | 0.95 |
| | $ | 0.86 |
| | $ | 2.60 |
|
| |
(1)
| Interest expense for the years ended December 31, 2017, 2016 and 2015 has been tax effected at a rate of 35%.
|
(1) Interest expense has been tax effected at a rate of 21%.
The computation of diluted EPS for the years ended December 31, 2017, 2016, and 2015 includes weighted average unvested restricted stock units outstanding of 1.5 million, 1.5 million, and 2.1 million, respectively.
For the years ended December 31, 2017, 2016,2022, 2021, and 2015,2020, all of our then outstanding Convertible Senior Notes and Convertible Junior Subordinated9% Debentures are reflected in diluted earnings per share using the “if-converted” method. Under this method, if dilutive, the common stock related to the outstanding Convertible Senior Notes and/or Convertible Junior9% Debentures is assumed issued as of the beginning of the reporting period and the related interest expense, net of tax, is added back to earnings in calculating diluted EPS.
MGIC Investment Corporation 20172022 Form 10-K | 11688
MGIC Investment Corporation and Subsidiaries
|
| | | | | | | | | | | | | | | |
Consolidated Financial Statements and NotesNOTE 5 |
MGIC Investment Corporation
2017 Form 10-K
Investments |
Notes (continued) |
FIXED INCOME SECURITIES
Note 5. Investments
The amortized cost, gross unrealized gains and losses and fair valueOur fixed income securities consisted of the investment portfoliofollowing as of December 31, 20172022 and 2016 are shown below:2021:
| | | | | | | | | | | | | | | | | | | | | | | | | | | | | |
| Details of fixed income investment securities by category as of December 31, 2022 |
| Table | 5.1a | | | | | | | | |
| (In thousands) | | Amortized Cost | | Gross Unrealized Gains | | Gross Unrealized Losses | | Fair Value |
| U.S. Treasury securities and obligations of U.S. government corporations and agencies | | $ | 145,581 | | | $ | 2 | | | $ | (9,683) | | | $ | 135,900 | |
| Obligations of U.S. states and political subdivisions | | 2,400,261 | | | 4,866 | | | (256,073) | | | 2,149,054 | |
| Corporate debt securities | | 2,416,475 | | | 1,043 | | | (196,377) | | | 2,221,141 | |
| ABS | | 126,723 | | | 5 | | | (6,041) | | | 120,687 | |
| RMBS | | 223,743 | | | 10 | | | (25,744) | | | 198,009 | |
| CMBS | | 257,785 | | | 22 | | | (20,591) | | | 237,216 | |
| CLOs | | 337,656 | | | 5 | | | (7,829) | | | 329,832 | |
| Foreign government debt | | 4,486 | | | — | | | (699) | | | 3,787 | |
| Commercial paper | | 14,075 | | | — | | | (3) | | | 14,072 | |
| Total fixed income securities | | $ | 5,926,785 | | | $ | 5,953 | | | $ | (523,040) | | | $ | 5,409,698 | |
| | | | Table | 5.1a | | | | | | | | | |
| Details of investments by category - current year | | | December 31, 2017 | |
| (In thousands) | | Amortized Cost | | Gross Unrealized Gains | | Gross Unrealized Losses (1) | | Fair Value | |
| | U.S. Treasury securities and obligations of U.S. government corporations and agencies | | $ | 179,850 |
| | $ | 274 |
| | $ | (1,278 | ) | | $ | 178,846 |
| |
| | Obligations of U.S. states and political subdivisions | | 2,105,063 |
| | 56,210 |
| | (8,749 | ) | | 2,152,524 |
| |
| | Corporate debt securities | | 2,065,475 |
| | 10,532 |
| | (9,169 | ) | | 2,066,838 |
| |
| | ABS | | 4,925 |
| | — |
| | (2 | ) | | 4,923 |
| |
| | RMBS | | 189,153 |
| | 60 |
| | (7,364 | ) | | 181,849 |
| |
| | CMBS | | 301,014 |
| | 1,204 |
| | (4,906 | ) | | 297,312 |
| |
| | CLOs | | 100,798 |
| | 304 |
| | (79 | ) | | 101,023 |
| |
| | Total debt securities | | 4,946,278 |
| | 68,584 |
| | (31,547 | ) | | 4,983,315 |
| |
| | Equity securities | | 7,223 |
| | 39 |
| | (16 | ) | | 7,246 |
| |
| | Total investment portfolio | | $ | 4,953,501 |
| | $ | 68,623 |
| | $ | (31,563 | ) | | $ | 4,990,561 |
| |
| Details of fixed income investment securities by category as of December 31, 2021 | | Details of fixed income investment securities by category as of December 31, 2021 |
| Table | | Table | 5.1b | |
| (In thousands) | | (In thousands) | | Amortized Cost | | Gross Unrealized Gains | | Gross Unrealized Losses | | Fair Value |
| U.S. Treasury securities and obligations of U.S. government corporations and agencies | | U.S. Treasury securities and obligations of U.S. government corporations and agencies | | $ | 133,990 | | | $ | 285 | | | $ | (868) | | | $ | 133,407 | |
| Obligations of U.S. states and political subdivisions | | Obligations of U.S. states and political subdivisions | | 2,408,688 | | | 133,361 | | | (7,396) | | | 2,534,653 | |
| Corporate debt securities | | Corporate debt securities | | 2,704,586 | | | 75,172 | | | (13,776) | | | 2,765,982 | |
| ABS | | ABS | | 150,888 | | | 830 | | | (1,008) | | | 150,710 | |
| RMBS | | RMBS | | 309,991 | | | 2,397 | | | (3,278) | | | 309,110 | |
| CMBS | | CMBS | | 315,330 | | | 5,736 | | | (1,936) | | | 319,130 | |
| CLOs | | CLOs | | 360,436 | | | 609 | | | (106) | | | 360,939 | |
| Foreign government debt | | Foreign government debt | | 13,749 | | | — | | | (99) | | | 13,650 | |
| Total fixed income securities | | Total fixed income securities | | $ | 6,397,658 | | | $ | 218,390 | | | $ | (28,467) | | | $ | 6,587,581 | |
|
| | | | | | | | | | | | | | | | | | |
| | Table | 5.1b | | | | | | | | |
| Details of investments by category - prior year | | | December 31, 2016 |
| (In thousands) | | Amortized Cost | | Gross Unrealized Gains | | Gross Unrealized Losses (1) | | Fair Value |
| | U.S. Treasury securities and obligations of U.S. government corporations and agencies | | $ | 73,847 |
| | $ | 407 |
| | $ | (724 | ) | | $ | 73,530 |
|
| | Obligations of U.S. states and political subdivisions | | 2,147,458 |
| | 20,983 |
| | (25,425 | ) | | 2,143,016 |
|
| | Corporate debt securities | | 1,756,461 |
| | 6,059 |
| | (18,610 | ) | | 1,743,910 |
|
| | ABS | | 59,519 |
| | 74 |
| | (28 | ) | | 59,565 |
|
| | RMBS | | 231,733 |
| | 102 |
| | (7,626 | ) | | 224,209 |
|
| | CMBS | | 327,042 |
| | 769 |
| | (7,994 | ) | | 319,817 |
|
| | CLOs | | 121,151 |
| | 226 |
| | (202 | ) | | 121,175 |
|
| | Total debt securities | | 4,717,211 |
| | 28,620 |
| | (60,609 | ) | | 4,685,222 |
|
| | Equity securities | | 7,144 |
| | 8 |
| | (24 | ) | | 7,128 |
|
| | Total investment portfolio | | $ | 4,724,355 |
| | $ | 28,628 |
| | $ | (60,633 | ) | | $ | 4,692,350 |
|
| |
(1)
| There were no OTTI losses recorded in other comprehensive (loss) income as of December 31, 2017 and 2016.
|
As discussed in Note 7 - "Debt" we are required to pledge collateral of at least 102% of the outstanding principal balance of the FHLB Advance. As of December 31, 2017, that collateral is included in our total investment portfolio amount shown above with a total fair value of $166.9 million.
We had $13.6$11.8 million and $13.4 million of investments at fair value on deposit with various states as of December 31, 20172022 and 2016,2021, respectively, due to regulatory requirements of those state insurance departments.
In connection with our insurance and reinsurance activities within MAC and MIC, insurance subsidiaries of MGIC, we are required to maintain assets in trusts for the benefit of contractual counterparties, which had investments at fair value of $128.4 million and $189.8 million at December 31, 2022 and 2021, respectively. The decrease is primarily due to a decline in collateral required as the risk in force covered by these insurance and reinsurance activities has decreased.
MGIC Investment Corporation 20172022 Form 10-K | 11789
MGIC Investment Corporation and Subsidiaries
|
| | | | | | | | | | | | | | | |
Consolidated Financial Statements and Notes |
MGIC Investment Corporation
2017 Form 10-K
|
Notes (continued) |
Table 5.2 compares theThe amortized cost and fair values of debtfixed income securities at December 31, 2022, by contractual maturity, as of December 31, 2017.
|
| | | | | | | | | | |
| | Table | 5.2 | | | | |
| Debt securities maturity schedule | | | December 31, 2017 |
| (In thousands) | | Amortized Cost | | Fair Value |
| | Due in one year or less | | $ | 541,755 |
| | $ | 541,695 |
|
| | Due after one year through five years | | 1,547,712 |
| | 1,544,943 |
|
| | Due after five years through ten years | | 925,751 |
| | 929,883 |
|
| | Due after ten years | | 1,335,170 |
| | 1,381,687 |
|
| | | | 4,350,388 |
| | 4,398,208 |
|
| | | | | | |
| | ABS | | 4,925 |
| | 4,923 |
|
| | RMBS | | 189,153 |
| | 181,849 |
|
| | CMBS | | 301,014 |
| | 297,312 |
|
| | CLOs | | 100,798 |
| | 101,023 |
|
| | Total as of December 31, 2017 | | $ | 4,946,278 |
| | $ | 4,983,315 |
|
The analysisare shown in table 5.2 is based upon contractual maturity. below. Actual maturities maywill differ from contractual maturities because certain borrowers may have the right to call or prepay certain obligations with or without call or prepayment penalties. Because most mortgage and asset-backed securities provide for periodic payments throughout their lives, they are listed separately in the table.separate categories.
| | | | | | | | | | | | | | | | | |
| Fixed income securities maturity schedule |
| Table | 5.2 | | | | |
| | December 31, 2022 |
| (In thousands) | | Amortized Cost | | Fair Value |
| Due in one year or less | | $ | 452,188 | | | $ | 445,210 | |
| Due after one year through five years | | 1,358,606 | | | 1,288,152 | |
| Due after five years through ten years | | 1,890,875 | | | 1,713,608 | |
| Due after ten years | | 1,279,209 | | | 1,076,984 | |
| | 4,980,878 | | | 4,523,954 | |
| | | | |
| ABS | | 126,723 | | | 120,687 | |
| RMBS | | 223,743 | | | 198,009 | |
| CMBS | | 257,785 | | | 237,216 | |
| CLOs | | 337,656 | | | 329,832 | |
| Total as of December 31, 2022 | | $ | 5,926,785 | | | $ | 5,409,698 | |
Tables 5.3a
EQUITY SECURITIES
The cost and 5.3b show the componentsfair value of our unrealized losses on our investment portfolioinvestments in the amount of $32 million and $61 millionequity securities as of December 31, 20172022 and 2016, respectively.December 31, 2021 are shown in tables 5.3a and 5.3b below.
| | | | | | | | | | | | | | | | | | | | | | | | | | | | | |
| Details of equity investment securities as of December 31, 2022 |
| Table | 5.3a | | | | | | | | |
| (In thousands) | | Cost | | Gross gains | | Gross losses | | Fair Value |
| Equity securities | | 15,924 | | | — | | | (1,784) | | | 14,140 | |
| | | | | | | | | | | | | | | | | | | | | | | | | | | | | |
| Details of equity investment securities as of December 31, 2021 |
| Table | 5.3b | | | | | | | | |
| (In thousands) | | Cost | | Gross gains | | Gross losses | | Fair Value |
| Equity securities | | 15,838 | | | 264 | | | (34) | | | 16,068 | |
NET GAINS (LOSSES) ON INVESTMENTS AND OTHER FINANCIAL INSTRUMENTS
The net gains (losses) on investments and other financial instruments and the proceeds from the sale of fixed income securities classified as available-for-sale are shown in table 5.4 below.
| | | | | | | | | | | | | | | | | | | | |
| Details of net gains (losses) on investments and other financial instruments |
| Table | 5.4 | | | | | |
| (in thousands) | December 31, 2022 | | December 31, 2021 | | December 31, 2020 |
| | | | | | |
| Fixed income securities | | | | | |
| Gains on sales | 7,152 | | | 8,980 | | | 21,272 | |
| Losses on sales | (15,477) | | | (1,942) | | | (8,809) | |
| Change in credit allowance | — | | | 49 | | | (49) | |
| Impairments | (1,415) | | | — | | | (331) | |
| Equity securities gains (losses) | | | | | |
| Gains (losses) on sales | (7) | | | 4 | | | 1,344 | |
| Market adjustment | (2,013) | | | (463) | | | 552 | |
Change in embedded derivative on Home Re Transactions (1) | 4,269 | | | (721) | | | (1,176) | |
| Other | | | | | |
| Gains (losses) on sales | 2 | | | (33) | | | (231) | |
| Market adjustment | 26 | | | (13) | | | 4 | |
| Net gains (losses) on investments and other financial instruments | (7,463) | | | 5,861 | | | 12,576 | |
| | | | | | |
| Proceeds from sales of fixed income securities | 397,553 | | | 471,783 | | | 803,401 | |
| Proceeds from sales of equity securities | 97 | | | 2,621 | | | 25,693 | |
|
| | | | | | | | | | | | | | | | | | | | | | | | | | |
| | Table | 5.3a | | | | | | | | | | | | |
| Investments unrealized losses - current year | December 31, 2017 | | Less Than 12 Months | | 12 Months or Greater | | Total |
| (In thousands) | | Fair Value | | Unrealized Losses | | Fair Value | | Unrealized Losses | | Fair Value | | Unrealized Losses |
| | U.S. Treasury securities and obligations of U.S. government corporations and agencies | | $ | 144,042 |
| | $ | (796 | ) | | $ | 31,196 |
| | $ | (482 | ) | | $ | 175,238 |
| | $ | (1,278 | ) |
| | Obligations of U.S. states and political subdivisions | | 505,311 |
| | (3,624 | ) | | 211,684 |
| | (5,125 | ) | | 716,995 |
| | (8,749 | ) |
| | Corporate debt securities | | 932,350 |
| | (4,288 | ) | | 200,716 |
| | (4,881 | ) | | 1,133,066 |
| | (9,169 | ) |
| | ABS | | 4,923 |
| | (2 | ) | | — |
| | — |
| | 4,923 |
| | (2 | ) |
| | RMBS | | 14,979 |
| | (280 | ) | | 166,329 |
| | (7,084 | ) | | 181,308 |
| | (7,364 | ) |
| | CMBS | | 51,096 |
| | (358 | ) | | 138,769 |
| | (4,548 | ) | | 189,865 |
| | (4,906 | ) |
| | CLOs | | 14,243 |
| | (7 | ) | | 3,568 |
| | (72 | ) | | 17,811 |
| | (79 | ) |
| | Equity securities | | 226 |
| | (2 | ) | | 431 |
| | (14 | ) | | 657 |
| | (16 | ) |
| | Total investment portfolio | | $ | 1,667,170 |
| | $ | (9,357 | ) | | $ | 752,693 |
| | $ | (22,206 | ) | | $ | 2,419,863 |
| | $ | (31,563 | ) |
MGIC Investment Corporation 20172022 Form 10-K | 11890
MGIC Investment Corporation and Subsidiaries
OTHER INVESTED ASSETS
Our other invested assets balances includes an investment in Federal Home Loan Bank ("FHLB") stock that is carried at cost, which due to its nature approximates fair value. Ownership of FHLB stock provides access to a secured lending facility. In the first quarter of 2022, we repaid the outstanding principal balance of our Federal Home Loan Bank Advance ("FHLB Advance") and accordingly reduced our investment in FHLB stock. At December 31, 2021, the FHLB Advance amount was secured by $167.2 million of eligible collateral. As a result of the prepayment of the FHLB Advance in 2022, we are no longer required to maintain collateral.
UNREALIZED INVESTMENT LOSSES
Tables 5.5a and 5.5b below summarize, for all available-for-sale investments in an unrealized loss position as of December 31, 2022 and 2021, the aggregate fair value and gross unrealized loss by the length of time those securities have been continuously in an unrealized loss position. The fair value amounts reported in tables 5.5a and 5.5b below are estimated using the process described in Note 6 - "Fair Value Measurements" to these consolidated financial statements. | | | | | | | | | | | | | | | | | | | | | | | | | | | | | | | | | | | | | | | | | |
| Unrealized loss aging for securities by type and length of time as of December 31, 2022 |
| Table | 5.5a | | | | | | | | | | | | |
| | Less Than 12 Months | | 12 Months or Greater | | Total |
| (In thousands) | | Fair Value | | Unrealized Losses | | Fair Value | | Unrealized Losses | | Fair Value | | Unrealized Losses |
| U.S. Treasury securities and obligations of U.S. government corporations and agencies | | $ | 67,531 | | | $ | (3,583) | | | $ | 76,246 | | | $ | (6,100) | | | $ | 143,777 | | | $ | (9,683) | |
| Obligations of U.S. states and political subdivisions | | 1,344,272 | | | (157,903) | | | 360,956 | | | (98,170) | | | 1,705,228 | | | (256,073) | |
| Corporate debt securities | | 1,488,255 | | | (109,976) | | | 758,732 | | | (86,401) | | | 2,246,987 | | | (196,377) | |
| ABS | | 53,201 | | | (1,008) | | | 67,073 | | | (5,033) | | | 120,274 | | | (6,041) | |
| RMBS | | 77,563 | | | (8,572) | | | 136,179 | | | (17,172) | | | 213,742 | | | (25,744) | |
| CMBS | | 166,973 | | | (12,951) | | | 70,792 | | | (7,640) | | | 237,765 | | | (20,591) | |
| CLOs | | 213,461 | | | (4,644) | | | 114,459 | | | (3,185) | | | 327,920 | | | (7,829) | |
| Foreign government debt | | — | | | — | | | 3,787 | | | (699) | | | 3,787 | | | (699) | |
| Commercial paper | | — | | | — | | | 3,816 | | | (3) | | | 3,816 | | | (3) | |
| Total | | $ | 3,411,256 | | | $ | (298,637) | | | $ | 1,592,040 | | | $ | (224,403) | | | $ | 5,003,296 | | | $ | (523,040) | |
| | | | | | | | | | | | | | | | | | | | | | | | | | | | | | | | | | | | | | | | | |
| Unrealized loss aging for securities by type and length of time as of December 31, 2021 |
| Table | 5.5b | | | | | | | | | | | | |
| | Less Than 12 Months | | 12 Months or Greater | | Total |
| (In thousands) | | Fair Value | | Unrealized Losses | | Fair Value | | Unrealized Losses | | Fair Value | | Unrealized Losses |
| U.S. Treasury securities and obligations of U.S. government corporations and agencies | | $ | 91,154 | | | $ | (790) | | | $ | 2,616 | | | $ | (78) | | | $ | 93,770 | | | $ | (868) | |
| Obligations of U.S. states and political subdivisions | | 452,021 | | | (7,189) | | | 15,540 | | | (207) | | | 467,561 | | | (7,396) | |
| Corporate debt securities | | 865,085 | | | (13,260) | | | 10,997 | | | (516) | | | 876,082 | | | (13,776) | |
| ABS | | 100,064 | | | (998) | | | 1,552 | | | (10) | | | 101,616 | | | (1,008) | |
| RMBS | | 180,586 | | | (2,548) | | | 31,641 | | | (730) | | | 212,227 | | | (3,278) | |
| CMBS | | 89,889 | | | (1,887) | | | 1,511 | | | (49) | | | 91,400 | | | (1,936) | |
| CLOs | | 177,663 | | | (71) | | | 21,973 | | | (35) | | | 199,636 | | | (106) | |
| Foreign government debt | | 13,649 | | | (99) | | | — | | | — | | | 13,649 | | | (99) | |
| Total | | $ | 1,970,111 | | | $ | (26,842) | | | $ | 85,830 | | | $ | (1,625) | | | $ | 2,055,941 | | | $ | (28,467) | |
The change in net unrealized gains (losses) of investments is shown in table 5.6 below.
| | | | | | | | | | | | | | | | | | | | | | | |
| Change in net unrealized gains (losses) |
| Table | 5.6 | | | | | | |
| (In thousands) | | 2022 | | 2021 | | 2020 |
| Fixed income securities | | $ | (707,005) | | | $ | (154,555) | | | $ | 169,135 | |
| | | | | | |
| | | | | | |
| | | | | | |
MGIC Investment Corporation 2022 Form 10-K | 91
MGIC Investment Corporation and Subsidiaries
There were 1,226 and 610 securities in an unrealized loss position as of December 31, 2022 and 2021, respectively. Based on current facts and circumstances, we believe the unrealized losses as of December 31, 2022 presented in table 5.5a above are not indicative of the ultimate collectability of the current amortized cost of the securities. The unrealized losses in all categories of our investments were primarily caused by an increase in prevailing interest rates. We also rely upon estimates of several credit and non-credit factors in our review and evaluation of individual investments to determine whether a credit impairment exists. All of the securities in an unrealized loss position are current with respect to their interest obligations.
The source of net investment income is shown in table 5.7 below.
| | | | | | | | | | | | | | | | | | | | | | | |
| Net investment income |
| Table | 5.7 | | | | | | |
| (In thousands) | | 2022 | | 2021 | | 2020 |
| Fixed income securities | | $ | 166,306 | | | $ | 160,030 | | | $ | 157,065 | |
| Equity securities | | 437 | | | 471 | | | 620 | |
| Cash equivalents | | 5,049 | | | 75 | | | 1,648 | |
| Other | | 51 | | | 22 | | | 275 | |
| Investment income | | 171,843 | | | 160,598 | | | 159,608 | |
| Investment expenses | | (4,367) | | | (4,160) | | | (5,212) | |
| Net investment income | | $ | 167,476 | | | $ | 156,438 | | | $ | 154,396 | |
MGIC Investment Corporation 2022 Form 10-K | 92
MGIC Investment Corporation and Subsidiaries
|
| | | | | | | | | | | | | | | |
Consolidated Financial Statements and Notes |
MGIC Investment Corporation
2017 Form 10-K
|
Notes (continued) |
|
| | | | | | | | | | | | | | | | | | | | | | | | | | |
| | Table | 5.3b | | | | | | | | | | | | |
| Investments unrealized losses - prior year | December 31, 2016 | | Less Than 12 Months | | 12 Months or Greater | | Total |
| (In thousands) | | Fair Value | | Unrealized Losses | | Fair Value | | Unrealized Losses | | Fair Value | | Unrealized Losses |
| | U.S. Treasury securities and obligations of U.S. government corporations and agencies | | $ | 48,642 |
| | $ | (724 | ) | | $ | — |
| | $ | — |
| | $ | 48,642 |
| | $ | (724 | ) |
| | Obligations of U.S. states and political subdivisions | | 1,136,676 |
| | (24,918 | ) | | 13,681 |
| | (507 | ) | | 1,150,357 |
| | (25,425 | ) |
| | Corporate debt securities | | 915,777 |
| | (16,771 | ) | | 35,769 |
| | (1,839 | ) | | 951,546 |
| | (18,610 | ) |
| | ABS | | 3,366 |
| | (28 | ) | | 656 |
| | — |
| | 4,022 |
| | (28 | ) |
| | RMBS | | 46,493 |
| | (857 | ) | | 171,326 |
| | (6,769 | ) | | 217,819 |
| | (7,626 | ) |
| | CMBS | | 205,545 |
| | (7,529 | ) | | 38,587 |
| | (465 | ) | | 244,132 |
| | (7,994 | ) |
| | CLOs | | 13,278 |
| | (73 | ) | | 34,760 |
| | (129 | ) | | 48,038 |
| | (202 | ) |
| | Equity securities | | 568 |
| | (15 | ) | | 137 |
| | (9 | ) | | 705 |
| | (24 | ) |
| | Total investment portfolio | | $ | 2,370,345 |
| | $ | (50,915 | ) | | $ | 294,916 |
| | $ | (9,718 | ) | | $ | 2,665,261 |
| | $ | (60,633 | ) |
For those securities in an unrealized loss position, the length of time the securities were in such a position, is measured by their month-end fair values. The unrealized losses in all categories of our investments as of December 31, 2017 and 2016 were primarily caused by changes in interest rates between the time of purchase and the respective year end. There were 586 and 607 securities in an unrealized loss position as of December 31, 2017 and 2016, respectively. As of December 31, 2017, the fair value as a percent of amortized cost of the securities in an unrealized loss position was 99% and approximately 27% of the securities in an unrealized loss position were backed by the U.S. Government.
The source of net investment income is shown in Table 5.4 below.
|
| | | | | | | | | | | | | | |
| | Table | 5.4 | | | | | | |
| Investment income by source | (In thousands) | | 2017 | | 2016 | | 2015 |
| Fixed income | | $ | 122,105 |
| | $ | 112,513 |
| | $ | 105,882 |
|
| | Equity securities | | 206 |
| | 182 |
| | 208 |
|
| | Cash equivalents | | 1,447 |
| | 754 |
| | 191 |
|
| | Other | | 620 |
| | 433 |
| | 455 |
|
| | Investment income | | 124,378 |
| | 113,882 |
| | 106,736 |
|
| | Investment expenses | | (3,507 | ) | | (3,216 | ) | | (2,995 | ) |
| | Net investment income | | $ | 120,871 |
| | $ | 110,666 |
| | $ | 103,741 |
|
For the years ended December 31, 2017, 2016, and 2015, there were no OTTI losses in earnings.
The net realized investment gains (table 5.5) and the change in unrealized gains (losses) of investments (table 5.6) are shown below.
|
| | | | | | | | | | | | | | |
| | Table | 5.5 | | | | | | |
| Net realized investment gains | (In thousands) | | 2017 | | 2016 | | 2015 |
| Fixed income | | $ | 228 |
| | $ | 5,310 |
| | $ | 28,335 |
|
| | Equity securities | | 21 |
| | 3,622 |
| | 26 |
|
| | Other | | — |
| | — |
| | — |
|
| | Total net realized investment gains | | $ | 249 |
| | $ | 8,932 |
| | $ | 28,361 |
|
MGIC Investment Corporation 2017 Form 10-K | 119
|
| NOTE 6 | | | | | | | | | | | | | | | |
Consolidated Financial Statements and Notes |
MGIC Investment Corporation
2017 Form 10-K
|
Notes (continued) |
|
| | | | | | | | | | | | | | |
| | Table | 5.6 | | | | | | |
| Change in unrealized gains (losses) | (In thousands) | | 2017 | | 2016 | | 2015 |
| Fixed income | | $ | 69,026 |
| | $ | (5,403 | ) | | $ | (33,687 | ) |
| Equity securities | | 39 |
| | (36 | ) | | (32 | ) |
| | Other | | (13 | ) | | 14 |
| | 1 |
|
| | Total increase (decrease) in unrealized gains/losses | | $ | 69,052 |
| | $ | (5,425 | ) | | $ | (33,718 | ) |
Gross realized gains and losses on investments are shown in Table 5.7 below.
|
| | | | | | | | | | | | | | |
| | Table | 5.7 | | | | | | |
| Gross realized investment gains | (In thousands) | | 2017 | | 2016 | | 2015 |
| Gross realized gains | | $ | 1,599 |
| | $ | 11,909 |
| | $ | 30,039 |
|
| | Gross realized losses | | (1,350 | ) | | (2,977 | ) | | (1,678 | ) |
| | Net realized gains on securities | | $ | 249 |
| | $ | 8,932 |
| | $ | 28,361 |
|
Note 6. Fair Value Measurements
Recurring fair value measurements
The following describes the valuation methodologies generally used by the independent pricing sources, or by us, to measure financial instruments at fair value, including the general classification of such financial instruments pursuant to the valuation hierarchy.
•Fixed income securities:
U.S. Treasury Securities and Obligations of U.S. Government Corporations and Agencies: Securities with valuations derived from quoted prices for identical instruments in active markets that we can access are categorized in Level 1 of the fair value hierarchy. Securities valued by surveying the dealer community, obtaining relevant trade data, benchmark quotes and spreads and incorporating this information in the valuation process are categorized as Level 2 of the fair value hierarchy.
Corporate Debt are valued by surveying the dealer community, obtaining relevant trade data, benchmark quotes and spreads and incorporating this information into the valuation process. These securities are generally categorized in Level 2 of the fair value hierarchy.
Obligations of U.S. States & Political Subdivisions are valued by tracking, capturing, and analyzing quotes for active issues and trades reported via the Municipal Securities Rulemaking Board records. Daily briefings and reviews of current economic conditions, trading levels, spread relationships, and the slope of the yield curve provide further data for evaluation. These securities are generally categorized in Level 2 of the fair value hierarchy.
Residential Mortgage-Backed Securities ("RMBS") are valued by monitoring interest rate movements, and other pertinent data daily. Incoming market data is enriched to derive spread, yield and/or price data as appropriate, enabling known data points to be extrapolated for valuation application across a range of related securities. These securities are generally categorized in Level 2 of the fair value hierarchy.
Commercial Mortgage-Backed Securities ("CMBS") are valued using techniques that reflect market participants’ assumptions and maximize the use of relevant observable inputs including quoted prices for similar assets, benchmark yield curves and market corroborated inputs. Evaluation uses regular reviews of the inputs for securities covered, including executed trades, broker quotes, credit information, collateral attributes and/or cash flow waterfall as applicable. These securities are generally categorized in Level 2 of the fair value hierarchy.
Asset-Backed Securities ("ABS") are valued using spreads and other information solicited from market buy-and-sell-side sources, including primary and secondary dealers, portfolio managers, and research analysts. Cash flows are generated for each tranche, benchmark yields are determined, and deal collateral performance and tranche level attributes including trade activity, bids, and offers are applied, resulting in tranche specific prices. These securities are generally categorized in Level 2 of the fair value hierarchy.
Collateralized loan obligations ("CLOs") are valued by evaluating manager rating, seniority in the capital structure, assumptions about prepayment, default and recovery and their impact on cash flow generation. Loan level net asset values are determined and aggregated for tranches and as a final step prices are checked against available recent trade activity. These securities are generally categorized in Level 2 of the fair value hierarchy.
Foreign government debt is valued by surveying the dealer community, obtaining relevant trade data, benchmark quotes and spreads and incorporating this information into the valuation process. These securities are generally categorized in Level 2 of the fair value hierarchy.
Commercial Paper, with an original maturity greater than 90 days, is valued using market data for comparable instruments of similar maturity and average yields. These securities are categorized in Level 2 of the fair value hierarchy.
•Equity securities: Consist of actively traded, exchange-listed equity securities, including exchange traded funds (“ETFs”) and Bond Mutual Funds, with valuations derived from quoted prices for identical assets in active markets that we can access. These securities are valued in Level 1 of the fair value hierarchy.
•Cash Equivalents: Consists of money market funds and treasury bills with valuations derived from quoted prices for identical assets in active markets that we can access. These securities are valued in level 1 of the fair value hierarchy. Instruments in this category valued using market data for comparable instruments are classified as level 2 in the fair value hierarchy.
MGIC Investment Corporation 2022 Form 10-K | 93
MGIC Investment Corporation and Subsidiaries
Assets measured at fair value, included those listed, by hierarchy level, in the following tables as of December 31, 20172022 and 2016:
|
| | | | | | | | | | | | | | | | | | |
| | Table | 6.1a | | | | | | | | |
| Fair value hierarchy - current year | December 31, 2017 | | |
| (In thousands) | | Fair Value | | Quoted Prices in Active Markets for Identical Assets (Level 1) | | Significant Other Observable Inputs (Level 2) | | Significant Unobservable Inputs (Level 3) |
| | U.S. Treasury securities and obligations of U.S. government corporations and agencies | | $ | 178,846 |
| | $ | 81,598 |
| | $ | 97,248 |
| | $ | — |
|
| | Obligations of U.S. states and political subdivisions | | 2,152,524 |
| | — |
| | 2,152,253 |
| | 271 |
|
| | Corporate debt securities | | 2,066,838 |
| | — |
| | 2,066,838 |
| | — |
|
| | ABS | | 4,923 |
| | — |
| | 4,923 |
| | — |
|
| | RMBS | | 181,849 |
| | — |
| | 181,849 |
| | — |
|
| | CMBS | | 297,312 |
| | — |
| | 297,312 |
| | — |
|
| | CLOs | | 101,023 |
| | — |
| | 101,023 |
| | — |
|
| | Total debt securities | | 4,983,315 |
| | 81,598 |
| | 4,901,446 |
| | 271 |
|
| | Equity securities (1) | | 7,246 |
| | 2,978 |
| | — |
| | 4,268 |
|
| | Total investments | | $ | 4,990,561 |
| | $ | 84,576 |
| | $ | 4,901,446 |
| | $ | 4,539 |
|
| | Real estate acquired (2) | | $ | 12,713 |
| | $ | — |
| | $ | — |
| | $ | 12,713 |
|
MGIC Investment Corporation 2017 Form 10-K | 120
|
| | | | | | | | | | | | | | | |
Consolidated Financial Statements and Notes |
MGIC Investment Corporation
2017 Form 10-K
|
Notes (continued) |
|
| | | | | | | | | | | | | | | | | | |
| | Table | 6.1b | | | | | | | | |
| Fair value hierarchy - prior year | December 31, 2016 | | |
| (In thousands) | | Fair Value | | Quoted Prices in Active Markets for Identical Assets (Level 1) | | Significant Other Observable Inputs (Level 2) | | Significant Unobservable Inputs (Level 3) |
| | U.S. Treasury securities and obligations of U.S. government corporations and agencies | | $ | 73,530 |
| | $ | 30,690 |
| | $ | 42,840 |
| | $ | — |
|
| | Obligations of U.S. states and political subdivisions | | 2,143,016 |
| | — |
| | 2,142,325 |
| | 691 |
|
| | Corporate debt securities | | 1,743,910 |
| | — |
| | 1,743,910 |
| | — |
|
| | ABS | | 59,565 |
| | — |
| | 59,565 |
| | — |
|
| | RMBS | | 224,209 |
| | — |
| | 224,209 |
| | — |
|
| | CMBS | | 319,817 |
| | — |
| | 319,817 |
| | — |
|
| | CLOs | | 121,175 |
| | — |
| | 121,175 |
| | — |
|
| | Total debt securities | | 4,685,222 |
| | 30,690 |
| | 4,653,841 |
| | 691 |
|
| | Equity securities (1) | | 7,128 |
| | 2,860 |
| | — |
| | 4,268 |
|
| | Total investments | | $ | 4,692,350 |
| | $ | 33,550 |
| | $ | 4,653,841 |
| | $ | 4,959 |
|
| | Real estate acquired (2) | | $ | 11,748 |
| | $ | — |
| | $ | — |
| | $ | 11,748 |
|
| |
(1)
| Equity securities in Level 32021 are carried at cost, which approximates fair value. |
| |
(2)
| Real estate acquired through claim settlement, which is held for sale, is reported in other assets on the consolidated balance sheets. |
Reconciliations of Level 3 assets
For assets and liabilities measured at fair value using significant unobservable inputs (Level 3), a reconciliation of the beginning and ending balances for the years ended December 31, 2017, 2016, and 2015 is shown in the following tables. There were no transfers into or out of Level 3 in those yearstables 6.1a and there we no losses included in earnings for those years attributable to the change in unrealized losses on assets still held at the end of each applicable year.
|
| | | | | | | | | | | | | | | | | | |
| | Table | 6.2a | | | | | | | | |
| Development of assets and liabilities classified within level 3 - current year | (In thousands) | | Debt Securities | | Equity Securities | | Total Investments | | Real Estate Acquired |
| Balance at December 31, 2016 | | $ | 691 |
| | $ | 4,268 |
| | $ | 4,959 |
| | $ | 11,748 |
|
| Total realized/unrealized gains (losses): | | | | | | | | |
| Included in earnings and reported as losses incurred, net | | — |
| | — |
| | — |
| | (1,315 | ) |
| | Purchases | | — |
| | — |
| | — |
| | 34,749 |
|
| | Sales | | (420 | ) | | — |
| | (420 | ) | | (32,469 | ) |
| | Balance at December 31, 2017 | | $ | 271 |
| | $ | 4,268 |
| | $ | 4,539 |
| | $ | 12,713 |
|
|
| | | | | | | | | | | | | | | | | | |
| | Table | 6.2b | | | | | | | | |
| Development of assets and liabilities classified within level 3 - prior year | (In thousands) | | Debt Securities | | Equity Securities | | Total Investments | | Real Estate Acquired |
| Balance at December 31, 2015 | | $ | 1,228 |
| | $ | 2,855 |
| | $ | 4,083 |
| | $ | 12,149 |
|
| Total realized/unrealized gains (losses): | | |
| | |
| | |
| | |
|
| | Included in earnings and reported as net realized investment gains | | — |
| | 3,579 |
| | 3,579 |
| | — |
|
| | Included in earnings and reported as losses incurred, net | | — |
| | — |
| | — |
| | (1,142 | ) |
| | Purchases | | — |
| | 4,258 |
| | 4,258 |
| | 36,859 |
|
| | Sales | | (537 | ) | | (6,424 | ) | | (6,961 | ) | | (36,118 | ) |
| | Balance at December 31, 2016 | | $ | 691 |
| | $ | 4,268 |
| | $ | 4,959 |
| | $ | 11,748 |
|
MGIC Investment Corporation 2017 Form 10-K | 121
|
| | | | | | | | | | | | | | | |
Consolidated Financial Statements and Notes |
MGIC Investment Corporation
2017 Form 10-K
|
Notes (continued) |
|
| | | | | | | | | | | | | | | | | | |
| | Table | 6.2c | | | | | | | | |
| Development of assets and liabilities classified within level 3 - two years prior | (In thousands) | | Debt Securities | | Equity Securities | | Total Investments | | Real Estate Acquired |
| Balance at December 31, 2014 | | $ | 1,846 |
| | $ | 321 |
| | $ | 2,167 |
| | $ | 12,658 |
|
| Total realized/unrealized gains (losses): | | | | | | | | |
| Included in earnings and reported as losses incurred, net | | — |
| | — |
| | — |
| | (2,322 | ) |
| | Purchases | | 7 |
| | 2,534 |
| | 2,541 |
| | 34,624 |
|
| | Sales | | (625 | ) | | — |
| | (625 | ) | | (32,811 | ) |
| | Balance at December 31, 2015 | | $ | 1,228 |
| | $ | 2,855 |
| | $ | 4,083 |
| | $ | 12,149 |
|
Level 3 securities within total investments consisted primarily of equity securities that can only be redeemed or sold at their par value and only to the security issuer.
Authoritative guidance over disclosures about the6.1b below. The fair value of the assets is estimated using the process described above, and more fully in Note 3 - "Significant Accounting Policies" to the consolidated financial instruments requires additional disclosure for financial instruments not measured at fair value. statements in this Form 10-K. | | | | | | | | | | | | | | | | | | | | | | | |
| Assets carried at fair value by hierarchy level as of December 31, 2022 |
| Table | 6.1a | | | | | | |
| (In thousands) | | Fair Value | | Quoted Prices in Active Markets for Identical Assets (Level 1) | | Significant Other Observable Inputs (Level 2) |
| U.S. Treasury securities and obligations of U.S. government corporations and agencies | | $ | 135,900 | | | $ | 116,897 | | | $ | 19,003 | |
| Obligations of U.S. states and political subdivisions | | 2,149,054 | | | — | | | 2,149,054 | |
| Corporate debt securities | | 2,221,141 | | | — | | | 2,221,141 | |
| ABS | | 120,687 | | | — | | | 120,687 | |
| RMBS | | 198,009 | | | — | | | 198,009 | |
| CMBS | | 237,216 | | | — | | | 237,216 | |
| CLOs | | 329,832 | | | — | | | 329,832 | |
| Foreign government debt | | 3,787 | | | — | | | 3,787 | |
| Commercial paper | | 14,072 | | | — | | | 14,072 | |
| Total fixed income securities | | 5,409,698 | | | 116,897 | | | 5,292,801 | |
| Equity securities | | 14,140 | | | 14,140 | | | — | |
| Cash equivalents | | 328,756 | | (1) | 324,129 | | | 4,627 | |
| Total | | $ | 5,752,594 | | | $ | 455,166 | | | $ | 5,297,428 | |
| | | | | | | | | | | | | | | | | | | | | | | |
| Assets carried at fair value by hierarchy level as of December 31, 2021 |
| Table | 6.1b | | | | | | |
| (In thousands) | | Fair Value | | Quoted Prices in Active Markets for Identical Assets (Level 1) | | Significant Other Observable Inputs (Level 2) |
| U.S. Treasury securities and obligations of U.S. government corporations and agencies | | $ | 133,407 | | | $ | 102,153 | | | $ | 31,254 | |
| Obligations of U.S. states and political subdivisions | | 2,534,653 | | | — | | | 2,534,653 | |
| Corporate debt securities | | 2,765,982 | | | — | | | 2,765,982 | |
| ABS | | 150,710 | | | — | | | 150,710 | |
| RMBS | | 309,110 | | | — | | | 309,110 | |
| CMBS | | 319,130 | | | — | | | 319,130 | |
| CLOs | | 360,939 | | | — | | | 360,939 | |
| Foreign government debt | | 13,650 | | | — | | | 13,650 | |
| Total fixed income securities | | 6,587,581 | | | 102,153 | | | 6,485,428 | |
| Equity securities | | 16,068 | | | 16,068 | | | — | |
| Cash equivalents | | 254,230 | | (1) | 254,230 | | | — | |
| Total | | $ | 6,857,879 | | | $ | 372,451 | | | $ | 6,485,428 | |
| (1) Includes restricted cash equivalents | | |
Certain financial instruments, including insurance contracts, are excluded from these fair value disclosure requirements. The carrying values of cash and cash equivalents (Level 1) and accrued investment income (Level 2) approximated their fair values. Additional fair value disclosures related to our investment portfolio are included inNote 5 – “Investments.- "Investments."”
In addition to the assets carried at fair value discussed above, we have embedded derivatives carried at fair value related to our Home Re Transactions that are classified as Other liabilities or Other assets in our consolidated balance sheets. The estimated fair value related to our embedded derivatives reflects the present value impact of the variation in investment income on the assets held by the reinsurance trusts and the contractual reference rate on the Home Re Transactions used to calculate the reinsurance premiums we estimate we will pay over the estimated remaining life. These liabilities or assets are categorized in Level 3 of the fair value hierarchy. At December 31, 2022 and 2021, the fair value of the embedded derivatives was an asset of $2.5 million and a liability of $1.8 million, respectively. (See Note 4 - "Reinsurance" for more information about our reinsurance programs.)
MGIC Investment Corporation 2022 Form 10-K | 94
MGIC Investment Corporation and Subsidiaries
Real estate acquired through claim settlement is carried at fair values and is reported in “Other assets” on the consolidated balance sheet. These assets are categorized as Level 3 of the fair value hierarchy. Purchases of real estate acquired was $3.5 million and $4.8 million for the years ended December 31, 2022, and 2021, respectively. Sales of real estate acquired was $4.0 million and $4.8 million for the years ended December 31, 2022, and 2021, respectively.
FINANCIAL LIABILITIES NOT MEASURED AT FAIR VALUE
Other invested assets include an investment in FHLB stock that is carried at cost, which due to restrictions that require it to be redeemed or sold only to the security issuer at par value, approximates fair value. The fair value of other invested assets is categorized as Level 2.
Financial liabilities not measured atinclude our outstanding debt obligations. The fair value
Financial liabilities are incurred in the normal coursevalues of our business. 5.25% Notes and 9% Debentures were based on observable market prices. In all cases the fair values of the financial liabilities below are categorized as level 2.
Table 6.3 compares presents the carrying value and fair value of our financial assets and liabilities disclosed, but not carried, at fair value as of December 31, 20172022 and 2016.2021.
| | | | | | | | | | | | | | | | | | | | | | | | | | | | | |
| Financial liabilities not carried at fair value |
| Table | 6.3 | | | | | | | | |
| | December 31, 2022 | | December 31, 2021 |
| (In thousands) | | Carrying Value | | Fair Value | | Carrying Value | | Fair Value |
| Financial assets | | | | | | | | |
| Other invested assets | | $ | 850 | | | $ | 850 | | | $ | 3,100 | | | $ | 3,100 | |
| Financial liabilities | | | | | | | | |
| FHLB Advance | | $ | — | | | $ | — | | | $ | 155,000 | | | $ | 157,585 | |
| 5.75% Notes | | — | | | — | | | 241,255 | | | 256,213 | |
| 5.25% Notes | | 641,724 | | | 600,938 | | | 640,253 | | | 686,875 | |
| 9% Debentures | | 21,086 | | | 28,085 | | | 110,204 | | | 151,000 | |
| Total financial liabilities | | $ | 662,810 | | | $ | 629,023 | | | $ | 1,146,712 | | | $ | 1,251,673 | |
MGIC Investment Corporation 2022 Form 10-K | 95
|
| | | | | | | | | | | | | | | | | | |
| | Table | 6.3 | | | | | | | | |
| Fair value measurements - liabilities | | | December 31, 2017 | | December 31, 2016 |
| (In thousands) | | Carrying Value | | Fair Value | | Carrying Value | | Fair Value |
| FHLB Advance | | $ | 155,000 |
| | $ | 152,124 |
| | $ | 155,000 |
| | $ | 151,905 |
|
| | 5% Notes | | — |
| | — |
| | 144,789 |
| | 147,679 |
|
| | 2% Notes | | — |
| | — |
| | 204,672 |
| | 308,605 |
|
| | 5.75% Notes | | 418,560 |
| | 465,473 |
| | 417,406 |
| | 445,987 |
|
| | 9% Debentures | | 256,872 |
| | 353,507 |
| | 256,872 |
| | 323,040 |
|
| | Total financial liabilities | | $ | 830,432 |
| | $ | 971,104 |
| | $ | 1,178,739 |
| | $ | 1,377,216 |
|
The fair values of our 5% Notes, 2% Notes, 5.75% Notes, and 9% Debentures were based on observable market prices and the fair value of the FHLB Advance was estimated using discounted cash flows on current incremental borrowing rates for similar borrowing arrangements, and in all cases they are categorized as Level 2. See Note 7 - "Debt" for a description of the financial liabilities in table 6.3.
The 5.75% Notes and 9% Debentures are obligations of our holding company, MGIC Investment Corporation and not of its subsidiaries.Subsidiaries
MGIC Investment Corporation 2017 Form 10-K | 122
|
| | | | | | | | | | | | | | | |
Consolidated Financial Statements and NotesNOTE 7 |
MGIC Investment Corporation
2017 Form 10-K
|
Notes (continued)Debt |
DEBT OBLIGATIONS
Note 7. Debt
Debt obligations
Table 7.1 shows the parcarrying value of our long-term debt obligations and their aggregate carrying values as of December 31, 20172022 and 2016.2021.
| | | | | | | | | | | | | | | | | |
| Long-term debt obligations |
| Table | 7.1 | | | | |
| | December 31, |
| (In millions) | | 2022 | | 2021 |
| FHLB Advance - 1.91%, due February 2023 | | $ | — | | | $ | 155.0 | |
| 5.75% Notes, due August 2023 | | — | | | 241.3 | |
| 5.25% Notes, due August 2028 (par value: $650 million) | | 641.7 | | | 640.2 | |
| 9% Debentures, due April 2063 | | 21.1 | | | 110.2 | |
| Long-term debt, carrying value | | $ | 662.8 | | | $ | 1,146.7 | |
|
| | | | | | | | | | |
| | Table | 7.1 | | | | |
| Long-term debt obligations | | | December 31, |
| (In millions) | | 2017 | | 2016 |
| | FHLB Advance | | $ | 155.0 |
| | $ | 155.0 |
|
| | 5% Notes | | — |
| | 145.0 |
|
| | 2% Notes | | — |
| | 207.6 |
|
| | 5.75% Notes | | 425.0 |
| | 425.0 |
|
| | 9% Debentures | | 256.9 |
| | 256.9 |
|
| | Long-term debt, par value | | 836.9 |
| | 1,189.5 |
|
| | Debt issuance costs | | (6.5 | ) | | (10.8 | ) |
| | Long-term debt, carrying value | | $ | 830.4 |
| | $ | 1,178.7 |
|
Table 7.2 shows the interest payments, on a consolidated basis, for our debtThe 5.25% Senior Notes ("5.25% Notes") and 9% Convertible Junior Subordinated Debentures (“9% Debentures”) are obligations outstanding during 2017 and 2016.
|
| | | | | | | | | | |
| | Table | 7.2 | | | | |
| Interest payments on debt obligations | | | Years Ended December 31, |
| (In millions) | | 2017 | | 2016 |
| Revolving credit facility | | $ | 0.9 |
| | $ | — |
|
| | FHLB Advance | | 3.0 |
| | 2.4 |
|
| | 5% Notes | | 3.6 |
| | 10.6 |
|
| | 2% Notes | | 2.1 |
| | 9.1 |
|
| | 5.75% Notes | | 25.1 |
| | — |
|
| | 9% Debentures | | 23.1 |
| | 27.4 |
|
| | Total interest payments | | $ | 57.8 |
| | $ | 49.5 |
|
2% Notes
On March 21, 2017, we issued an irrevocable notice of redemption in respect of our outstanding 2% Convertible Senior Notes due April 1, 2020 ("2% Notes"), with a redemption date of April 21, 2017. In April, holders of approximately $202.5 million of the outstanding principal exercised their rights to convert their notes to shares of our common stock. The remaining $5.1 million of outstanding principal was redeemed for cash. The conversions of the 2% Notes at a rate of 143.8332 shares per $1,000 principal amount resulted in the issuance of approximately 29.1 million shares of our common stock in April 2017. The conversions and cash redemption eliminated our debt obligation. A loss on debt extinguishment of $0.07 million was recognized on notes redeemed for cash. No gain or loss was recognized from the conversions as the outstanding debt issuance costs associated with the conversions were included in the carrying value of the notes, which was credited to shareholders' equity at the time of conversion.holding company, MGIC Investment Corporation.
In the third quarter of 2016,2022 Transactions
During 2022, we entered into privately negotiated agreements to repurchase $292.4repurchased $89.1 million in aggregate principal of our outstanding 2% Notes9% Debentures at a purchase price of $362.1$121.2 million plus accrued interest. We funded the purchases with $230.7 million in cash, using proceeds from the issuanceThe repurchase of our 5.75% Notes, and by issuing to certain sellers approximately 18.39% Debentures resulted in a $32.1 million shares of our common stock. The excess of the purchase price over carrying value is reflected as a loss on debt extinguishment of $74.3 million on our consolidated statement of operations for the year ended December 31, 2016. The shares issued as consideration for the notes repurchases were repurchased asand a reduction of December 31, 2016 using cash from our 5.75% Notes issuance. The repurchases of the 2% Notes reduced6.8 million potentially dilutive shares by approximately 42.1 million shares, without consideringshares.
The Federal Home Loan Bank Advance (the “FHLB Advance”) was an obligation of MGIC. In the shares issued as partial consideration in the purchasesfirst quarter of the 2% Notes or the repurchase of shares to offset such shares issued.
MGIC Investment Corporation 2017 Form 10-K | 123
|
| | | | | | | | | | | | | | | |
Consolidated Financial Statements and Notes |
MGIC Investment Corporation
2017 Form 10-K
|
Notes (continued) |
Interest on the 2% Notes was payable semi-annually in arrears on April 1 and October 1 of each year. Debt issuance costs were being amortized to interest expense over the contractual life of the notes.
Credit Facility
On March 21, 2017, we entered into a Credit Agreement with various lenders which provides for a $175 million unsecured revolving credit facility maturing on March 21, 2020. Revolving credit borrowings bear interest at a floating rate, which will be, at our option, either a eurocurrency rate or a base rate, in each case plus an applicable margin. The applicable margin is subject to adjustment based on our senior unsecured long-term debt rating, or if we do not have such a rating, our corporate or issuer rating. Amounts under the facility may be borrowed, repaid and reborrowed from time to time until the maturity of the revolving credit facility. Voluntary prepayments and commitment reductions are permitted at any time without fee subject to a minimum dollar requirement and, for outstanding eurocurrency loans, customary breakage costs.
We are required under the Credit Agreement to pay commitment fees on the average daily amount of the unused revolving commitments of the lenders, and an annual administrative fee to the administrative agent. The Credit Agreement contains affirmative, negative and financial covenants which are customary for financings of this type, including, among other things, limits on the creation of liens, limits on the incurrence of indebtedness, restrictions on dispositions, maximum debt-to-capital ratio, minimum consolidated stockholders' equity, minimum policyholder's position of MGIC, and compliance with the financial requirements of the PMIERs. The Credit Agreement includes customary events of default for facilities of this type (with customary grace periods, as applicable) and provides that, upon the occurrence of an event of default, payments of all outstanding loans may be accelerated and/or the lenders' commitments may be terminated. Upon the occurrence of certain insolvency or bankruptcy related events of default, all amounts payable under the Credit Agreement shall automatically become immediately due and payable, and the lenders' commitments will automatically terminate. In addition, upon the occurrence of certain insolvency or bankruptcy related events of default, or the failure to pay interest, principal or fees, the interest rates on all outstanding obligations will be increased.
In March 2017, we borrowed $150 million under the revolving credit facility, to fund a portion of the redemption price of the 2% Notes if holders did not elect to convert their 2% Notes. In April, we repaid the amount borrowed under the revolving credit facility because most holders elected to convert their notes. Costs incurred to enter into the Credit Agreement have been deferred and recorded as Other assets and will be amortized over the term of the Credit Agreement.
5% Notes
On May 1, 2017, our 5% Notes due in 2017 ("5% Notes") matured and2022, we repaid the outstanding $145principal balance of the FHLB Advance at a prepayment price of $156.3 million, in aggregate par value, plus accrued interest with cash at our holding company. Interest on the 5% Notes was payable semi-annually in arrears on May 1 and November 1incurring a prepayment fee of each year.$1.3 million.
In 2016,July 2022, we repurchased $188.5 million in aggregateredeemed the outstanding principal balance of our 5%the 5.75% Senior Notes at(“5.75% Notes”) through a purchasemake-whole price of $195.5$248.4 million plus accrued interest using funds held at our holding company.interest. The excess of the purchasemake-whole price over the carrying value, was reflected asplus the write-off of unamortized issuance costs on the par value, resulted in a $6.8 million loss on debt extinguishment of $7.9 million on our consolidated statement of operations. Our 2016 5% Notes repurchases reduced our potentially dilutive shares by approximately 14.0 million shares.
5.75% Notes
In August 2016, we issued $425 million aggregate principal amount of 5.75% Senior Notes due in 2023 ("5.75% Notes") and received net proceeds, after the deduction of underwriting fees, of $418.1 million. Interest on the 5.75% Notes is payable semi-annually on February 15 and August 15 of each year, commencing on February 15, 2017. We have the option to redeem these notes, in whole or in part, at any time or from time to time prior to maturity at a redemption price equal to the greater of (i)100% of the aggregate principal amount of the notes to be redeemed and (ii) theextinguishment. The make-whole amount which iswas calculated as the sum of the present values of the remaining scheduled payments of principal and interest discounted at the treasury rate defined in the notes plus 50 basis points and accrued interest. The 5.75% Notes were an obligation of our holding company.
2021 Transactions
In December 2021, we repurchased $98.6 million in aggregate principal amount of our 9% Debentures at a purchase price of $135.5 million, plus accrued interest. The repurchase of 9% Debentures resulted in each case, accrued interest thereon to, but excluding, the redemption date. Ina $36.9 million loss on debt extinguishment on our consolidated statement of operations and a reduction in our potentially dilutive shares by approximately 7.5 million shares.
2020 Transactions
MGIC Investment Corporation 2017 Form 10-K | 124
|
| | | | | | | | | | | | | | | |
Consolidated Financial Statements and Notes |
MGIC Investment Corporation
2017 Form 10-K
|
Notes (continued) |
In August 2020, we issued $650 million aggregate principal amount of 5.25% Notes, which are due in 2028 and received net proceeds, after the deduction of underwriting fees, of $640.3 million. In addition to underwriting fees, we incurred approximately $1.2$2.0 million of other expenses associated with the issuance of these notes.
We repurchased $182.7 million in aggregate principal amount of our 5.75% notes at a purchase price of $197.8 million, plus accrued interest, using proceeds from the 5.25% Notes issuance. The excess of the purchase price over the carrying value, plus the write-off of unamortized issuance costs on the par value, is reflected as a loss on debt extinguishment of $16.5 million on our consolidated statement of operations.
We repurchased $48.1 million in aggregate principal amount of our 9% Debentures at a purchase price of $61.6 million, plus accrued interest, using proceeds from the 5.25% Notes issuance. The repurchase of 9% Debentures resulted in a $10.2 million loss on debt extinguishment on our consolidated statement of operations; a reduction in our shareholders' equity of $2.7 million related to the reacquisition of the equity component of the 9% Debentures; and a reduction in our potentially dilutive shares by approximately 3.6 million shares.
5.25% Notes
Interest on the 5.25% Notes is payable semi-annually on February 15 and August 15. Prior to August 15, 2023, we may redeem the 5.25% Notes at an amount equal to the sum of (a) the greater of: (i) the sum of the principal amount and the make-whole amount; and (ii) 102.625% of principal; and (b) accrued and unpaid interest. The make-whole amount is the excess of: (1) the present value of the remaining principal, premium and interest payments that would be payable with respect to the note if such note were redeemed on August 15, 2023 (at 102.625% of principal), computed using a discount rate equal to the treasury rate specified in the notes, plus 50 basis points, over (2) the outstanding principal amount of such note.
On and after August 15, 2023, we may redeem the notes at 102.625% of principal; on or after August 15, 2024, we may redeem the notes at 101.313% of principal; and on or after August 15, 2025, we may redeem the notes at 100% of principal; in each case, plus accrued and unpaid interest.
The 5.75%5.25% Notes have covenants and events of default customary for securities of this nature, including customary events of default, and further provide that the trustee or holders of at least 25% in aggregate principal amount of the outstanding 5.75%5.25% Notes may declare them immediately due and payable upon the occurrence of certain events of default after the expiration of the applicable grace period. In addition, in the case of an event of default arising from certain events of bankruptcy, insolvency or reorganization relating to the Company or any of its significant subsidiaries, the 5.75%5.25% Notes will become due and payable immediately. This description is not intended to be complete in all respects and is qualified in its entirety by the terms of the 5.75%5.25% Notes, including their covenants and events of default. We were in compliance with all covenants as of December 31, 2017.2022.
The net proceeds from the 5.75% Notes issuance were primarily used as (i) cash consideration to repurchase a portion of our 2% Notes, and (ii) to repurchase the shares issued as partial consideration in the repurchases of our 2% Notes, as described above. The remaining proceeds are being held for general corporate purposes.
FHLB Advance
In February 2016, MGIC borrowed $155.0 million in the form of a fixed rate advance from the Federal Home Loan Bank of Chicago ("FHLB Advance"). Interest on the Advance is payable monthly at an annual rate, fixed for the term of the Advance, of 1.91%. The principal of the Advance matures on February 10, 2023. MGIC may prepay the Advance at any time. Such prepayment would be below par if interest rates have risen after the Advance was originated, or above par if interest rates have declined. The Advance is secured by eligible collateral whose market value must be maintained at 102% of the principal balance of the Advance. MGIC provided eligible collateral from its investment portfolio.
MGIC Investment Corporation 2022 Form 10-K | 96
MGIC Investment Corporation and Subsidiaries
9% Debentures
As of December 31, 2017 and 2016 we had outstanding $256.9 million principal amount of our 9% Debentures due in 2063 ("9% Debentures"). In February 2016, MGIC purchased $132.7 million in aggregate principal of our outstanding 9% Debentures at a purchase price of $150.7 million, plus accrued interest. The 9% Debentures include a conversion feature that allows us, at our option, to make a cash payment to converting holders in lieu of issuing shares of common stock upon conversion of the 9% Debentures. The accounting standards applicable to extinguishment of debt with a cash conversion feature require the consideration paid to be allocated between the extinguishment of the liability component and reacquisition of the equity component. The purchase ofInterest on the 9% Debentures resulted in an $8.3 million lossis payable semi-annually on debt extinguishment on the consolidated statement of operations for the year ended December 31, 2016, which represents the difference between the fair valueApril 1 and the carrying value of the liability component on the purchase date. In addition, our shareholders’ equity was separately reduced by $6.3 million related to the reacquisition of the equity component. For GAAP accounting purposes, the 9% Debentures owned by MGIC are considered retired and are eliminated in our consolidated financial statements and the underlying common stock equivalents, approximately 9.8 million shares, are not included in the computation of diluted shares.
October 1 each year. The 9% Debentures are currently convertible, at the holder's option, at an initiala conversion rate, which is subject to adjustment, of 74.074177.9620 common shares per $1,000 principal amount of the 9% Debentures at any time prior to the maturity date. This represents an initiala conversion price of approximately $13.50$12.83 per share. If a holder elects to convert their 9% Debentures, deferred interest, if any, owed on the 9% Debentures being converted is also converted into shares of our common stock. The conversion rate for any deferred interest is based on the average price that our shares traded at during a 5-day period immediately prior to the election to convert. We have 19.0 million authorized
The 9% Debentures include a feature that allows us, at our option, to make a cash payment to converting holders in lieu of issuing shares reserved forof common stock upon conversion under ourof the 9% debentures.
Debentures. We may redeem the 9% Debentures in whole or in part from time to time, at our option, at a redemption price equal to 100% of the principal amount of the 9% Debentures being redeemed, plus any accrued and unpaid interest, if the closing sale price of our common stock exceeds $17.55$16.67 (adjusted pro rata for changes in the conversion price) for at least 20 of the 30 trading days preceding notice of the redemption.
MGIC Investment Corporation 2017 Form 10-K | 125
|
| | | | | | | | | | | | | | | |
Consolidated Financial Statements and Notes |
MGIC Investment Corporation
2017 Form 10-K
|
Notes (continued) |
Interest on the 9% Debentures is payable semi-annually in arrears on April 1 and October 1 of each year. As long as no event of default with respect to the debentures has occurred and is continuing, we may defer interest, under an optional deferral provision, for one or more consecutive interest periods up to 10 years without giving rise to an event of default. Deferred interest will accrue additional interest at the rate then applicable to the debentures. During an optional deferral period we may not pay or declare dividends on our common stock.
When interest on the 9% Debentures is deferred, we are required, not later than a specified time, to use reasonable commercial efforts to begin selling qualifying securities to persons who are not our affiliates. The specified time is one business day after we pay interest on the 9% Debentures that was not deferred, or if earlier, the fifth anniversary of the scheduled interest payment date on which the deferral started. Qualifying securities are common stock, certain warrants and certain non-cumulative perpetual preferred stock. The requirement to use such efforts to sell such securities is called the Alternative Payment Mechanism.
The net proceeds of Alternative Payment Mechanism sales are to be applied to the payment of deferred interest, including the compound portion. We cannot pay deferred interest other than from the net proceeds of Alternative Payment Mechanism sales, except at the final maturity of the debentures or at the tenth anniversary of the start of the interest deferral. The Alternative Payment Mechanism does not require us to sell common stock or warrants before the fifth anniversary of the interest payment date on which that deferral started if the net proceeds (counting any net proceeds of those securities previously sold under the Alternative Payment Mechanism) would exceed the 2% cap. The 2% cap is 2% of the average closing price of our common stock times the number of our outstanding shares of common stock. The average price is determined over a specified period ending before the issuance of the common stock or warrants being sold, and the number of outstanding shares is determined as of the date of our most recent publicly released financial statements.
We are not required to issue under the Alternative Payment Mechanism a total of more than 10 million shares of common stock, including shares underlying qualifying warrants. In addition, we may not issue under the Alternative Payment Mechanism qualifying preferred stock if the total net proceeds of all issuances would exceed 25% of the aggregate principal amount of the debentures.
The Alternative Payment Mechanism does not apply during any period between scheduled interest payment dates if there is a “market disruption event” that occurs over a specified portion of such period. Market disruption events include any material adverse change in domestic or international economic or financial conditions.
The provisions of the 9% Debentures are complex. TheThis description above is not intended to be complete in all respects. Moreover, that descriptionrespects and is qualified in its entirety by the terms of the 9% Debentures, including their covenants and events of default. We were in compliance with all covenants at December 31, 2017.2022. The 9% Debentures rank junior to all of our existing and future senior indebtedness.
Note 8. Loss ReservesInterest payments were $53.7 million during 2022, $71.7 million during 2021 and $54.3 million during 2020.
MGIC Investment Corporation 2022 Form 10-K | 97
MGIC Investment Corporation and Subsidiaries
As described in Note 3 – “Summary of Significant Accounting Policies – Loss Reserves,” we establish case reserves and loss adjustment expenses ("LAE") reserves on delinquent loans that were reported to recognize the estimated liability for lossesus as two or more payments past due and LAE relatedhave not become current or resulted in a claim payment. Such loans are referred to defaults on insured mortgage loans. Lossas being in our delinquency inventory. Case reserves are established by estimating the number of loans in our delinquency inventory of delinquent loans that will result in a claim payment, which is referred to as the claim rate, and further estimating the amount of the claim payment, which is referred to as claim severity.
IBNR reserves are established for estimated losses from delinquencies we estimate have occurred prior to the close of an accounting period, but have not yet been reported to us. IBNR reserves are also established using estimated claim rates and claim severities.
Estimation of losses is inherently judgmental. The conditions that affect the claim rate and claim severity include the current and future state of the domestic economy, including unemployment and the current and future strength of local housing markets; exposure on insured loans; the amount of time between defaultdelinquency and claim filing;filing (all else being equal, the longer the period between delinquency and claim filing, the greater the severity); and curtailments and rescissions. The actual amount of the claim payments may be substantially different than our loss reserve estimates. Our estimates could be adversely affected by several factors, including a deterioration of regional or national economic conditions, including unemployment, leading to a reduction in borrowers’ income and thus their ability to make mortgage payments, the impact of past and future government initiatives and actions taken by the GSEs (including mortgage forbearance programs and foreclosure moratoriums), and a drop in housing values which may affect borrower willingness to continue to make mortgage payments when the value of the
MGIC Investment Corporation 2017 Form 10-K | 126
|
| | | | | | | | | | | | | | | |
Consolidated Financial Statements and Notes |
MGIC Investment Corporation
2017 Form 10-K
|
Notes (continued) |
home is below the mortgage balance. Loss reserves in future periods will also be dependent on the number of loans reported to us as delinquent.
Changes to our estimates could result in a material impact to our consolidated results of operations and financial position, even in a stable economic environment. Given the uncertainty of the macroeconomic environment, including the effectiveness of loss mitigation efforts, change in home prices, and changes in unemployment, our loss reserve estimates may continue to be impacted.
In considering the potential sensitivity of the factors underlying our estimate of loss reserves, it is possible that even a relatively small change in our estimated claim rate or claim severity could have a material impact on loss reserves and, correspondingly, on our consolidated results of operations even in a stable economic environment. For example, as of December 31, 2022, assuming all other factors remain constant, a $1,000 increase/decrease in the average severity reserve factor would change the loss reserve amount by approximately +/- $10 million. A one percentage point increase/decrease in the average claim rate reserve factor would change the loss reserve amount by approximately +/- $15 million.
The “Losses incurred” section of table 8.1 below shows losses incurred on delinquencies that occurred in the current year and in prior years. The amount of losses incurred relating to delinquencies that occurred in the current year represents the estimated amount to be ultimately paid on such delinquencies. The amount of losses incurred relating to delinquencies that occurred in prior years represents the difference between the actual claim rate and claim severity associated with those delinquencies resolved in the current year compared to the estimated claim rate and claim severity at the prior year-end, as well as a re-estimation of amounts to be ultimately paid on delinquencies continuing from the end of the prior year. This re-estimation of the claim rate and claim severity is the result of our review of current trends in the delinquentdelinquency inventory, such as percentages of defaultsdelinquencies that have resulted in a claim, the amount of the claims relative to the average loan exposure, changes in the relative level of delinquencies by geography and changes in average loan exposure.
Losses incurred on delinquencies that occurred in the current year decreasedincreased in 20172022, compared to 20162021. The increase is primarily due to an increase in estimated severity on current year delinquencies. In addition, there was a decrease in IBNR reserve estimates by $5.9 million in 2021, while IBNR estimates increased by $2.3 million in 2022.
In 2022, we experienced favorable loss development of $404.1 million on previously received delinquencies primarily related to a decrease in the estimated claim raterate. The favorable development primarily resulted from greater than expected cure rates, as borrower reinstatements and servicer mitigation efforts resulted in more cures than originally estimated. Additionally, home price appreciation experienced in recent years has allowed borrowers to cure their delinquencies through the sale of their property. For the year ended December 31, 2021 we experienced favorable loss development of $60.0 million on recently reported delinquencies, and in 2016 compared to 2015,previously received notices primarily due to athe decrease in the number of new delinquencies, net of cures, as well as a decrease in the estimated claim rate on recently reported delinquencies.
See "Hurricane activity" below for additional information on new notice activity and items in our delinquent inventory fromdelinquencies received prior to the hurricane impacted areas. Based on our analysis and past experience, new notices received in areas impacted by hurricanes generally cure at a higher rate than notices received in the normal course of business and we have estimated a materially lower claim rate on the estimated new notices causedCOVID-19 pandemic. This was offset by the hurricane activity; however,recognition of a probable loss of $6.3 million related to litigation of our estimated severity was similar to other new notices received.claims paying practices and adverse development on LAE reserves and reinsurance.
MGIC Investment Corporation 2022 Form 10-K | 98
MGIC Investment Corporation and Subsidiaries
The “Losses paid” section of table 8.1 below shows the amount of losses paid on delinquent notices receiveddelinquencies that occurred in the current year and losses paid on delinquent notices receiveddelinquencies that occurred in prior years. For several years,At the start of the COVID-19 pandemic, the level of claims received decreased and the average time it took to receive a claim associated with a delinquency had increased significantly from our historical experience of approximately twelve months. This was, in part, dueincreased. Claim activity has not yet returned to new loss mitigation protocols established by servicers and to changes in some state foreclosure laws that may include, for example, a requirement for additional review and/or mediation processes. In recent quarters, we have experienced a decline in the average time servicers are utilizing to process foreclosures, which has reduced the average time to receive a claim associated with new delinquent notices that do not cure. All else being equal, the longer the period between delinquency and claim filing, the greater the severity.pre-COVID-19 levels.
Our estimate of premiums to be refunded on expected claim payments is accrued for separately in "Other liabilities" on our consolidated balance sheets and approximated $61 million and $85 million at December 31, 2017 and 2016, respectively.
During 2017 and 2016, our losses paid included amounts paid upon commutation of coverage on pools of non-performing loans ("NPLs"), and in 2016 our losses paid also included amounts paid in connection with settlements for disputes concerning our claims paying practices. Losses paid in 2015 included amounts paid in connection with settlements for disputes concerning our claims paying practices. The impacts of the commutations of coverage on NPLs and/or settlements in each of the past three years were as follows:
2017 - 1,337 notices removed from default inventory with an amount paid of $54 million,
2016 - 1,273 notices removed from default inventory with an amount paid of $53 million,
2015 - 1,121 notices removed from default inventory with an amount paid of $10 million.
In each of 2016 and 2015, we paid $42 million in connection with a 2012 settlement agreement with Freddie Mac regarding the aggregate loss limit under certain pool insurance policies. The final payment under that settlement agreement was made on December 1, 2016.
MGIC Investment Corporation 2017 Form 10-K | 127
|
| | | | | | | | | | | | | | | |
Consolidated Financial Statements and Notes |
MGIC Investment Corporation
2017 Form 10-K
|
Notes (continued) |
Table 8.1 provides a reconciliation of beginning and ending loss reserves as of and for each of the past three years:
| | | | | | | | | | | | | | | | | | | | | | | |
| Development of loss reserves |
| Table | 8.1 | | | | | | |
| (In thousands) | | 2022 | | 2021 | | 2020 |
| Reserve at beginning of year | | $ | 883,522 | | | $ | 880,537 | | | $ | 555,334 | |
| Less reinsurance recoverable | | 66,905 | | | 95,042 | | | 21,641 | |
| Net reserve at beginning of year | | 816,617 | | | 785,495 | | | 533,693 | |
| | | | | | |
| Losses incurred: | | | | | | |
| Losses and LAE incurred in respect of delinquent notices received in: | | | | | | |
| Current year | | 149,565 | | | 124,592 | | | 345,170 | |
Prior years (1) | | (404,130) | | | (60,015) | | | 19,604 | |
| Total losses incurred | | (254,565) | | | 64,577 | | | 364,774 | |
| | | | | | |
| Losses paid: | | | | | | |
| Losses and LAE paid in respect of delinquent notices received in: | | | | | | |
| Current year | | 362 | | | 664 | | | 3,069 | |
| Prior years | | 49,626 | | | 68,769 | | | 109,923 | |
Reinsurance terminations (2) | | (17,684) | | | (35,978) | | | (20) | |
| Total losses paid | | 32,304 | | | 33,455 | | | 112,972 | |
| Net reserve at end of year | | 529,748 | | | 816,617 | | | 785,495 | |
| Plus reinsurance recoverables | | 28,240 | | | 66,905 | | | 95,042 | |
| Reserve at end of year | | $ | 557,988 | | | $ | 883,522 | | | $ | 880,537 | |
(1)A positive number for prior year loss development indicates a deficiency of prior year reserves. A negative number for prior year loss development indicates a redundancy of prior year loss reserves. See the following table for more information about prior year loss development.
(2)In a reinsurance termination, amounts for any incurred but unpaid losses are due to us from the reinsurers. As a result, the amount due from the reinsurers is reclassified from reinsurance recoverable on loss reserves to reinsurance recoverable on paid losses, resulting in no impact to losses incurred. (See Note 9 - "Reinsurance") The prior year development of the reserves in 2022, 2021 and 2020 is reflected in the table 8.2 below.
| | | | | | | | | | | | | | | | | | | | | | | |
| Reserve development on previously received delinquencies |
| Table | 8.2 | | | | | | |
| (In thousands) | | 2022 | | 2021 | | 2020 |
| (Decrease) in estimated claim rate on primary delinquencies | | $ | (400,577) | | | $ | (82,904) | | | $ | (2,536) | |
| Increase (decrease) in estimated claim severity on primary delinquencies | | (21,995) | | | 310 | | | 13,535 | |
| Change in estimates related to pool reserves, LAE reserves, reinsurance and other | | 18,442 | | | 22,579 | | | 8,605 | |
Total prior year loss development (1) | | $ | (404,130) | | | $ | (60,015) | | | $ | 19,604 | |
(1)A positive number for prior year loss development indicates a deficiency of prior year loss reserves. A negative number for prior year loss development indicates a redundancy of prior year loss reserves.
|
| | | | | | | | | | | | | | |
| | Table | 8.1 | | | | | | |
| Development of reserves for losses and loss adjustment expenses | (In thousands) | | 2017 | | 2016 | | 2015 |
| Reserve at beginning of year | | $ | 1,438,813 |
| | $ | 1,893,402 |
| | $ | 2,396,807 |
|
| Less reinsurance recoverable | | 50,493 |
| | 44,487 |
| | 57,841 |
|
| Net reserve at beginning of year | | 1,388,320 |
| | 1,848,915 |
| | 2,338,966 |
|
| | | | | | | | |
| | Losses incurred: | | | | | | |
| | Losses and LAE incurred in respect of delinquent notices received in: | | | | | | |
| | Current year | | 284,913 |
| | 387,815 |
| | 453,849 |
|
| | Prior years (1) | | (231,204 | ) | | (147,658 | ) | | (110,302 | ) |
| | Total losses incurred | | 53,709 |
| | 240,157 |
| | 343,547 |
|
| | | | | | | | |
| | Losses paid: | | | | | | |
| | Losses and LAE paid in respect of delinquent notices received in: | | | | | | |
| | Current year | | 11,267 |
| | 14,823 |
| | 25,980 |
|
| | Prior years | | 493,300 |
| | 689,258 |
| | 823,058 |
|
| | Reinsurance terminations (2) | | 301 |
| | (3,329 | ) | | (15,440 | ) |
| | Total losses paid | | 504,868 |
| | 700,752 |
| | 833,598 |
|
| | Net reserve at end of year | | 937,161 |
| | 1,388,320 |
| | 1,848,915 |
|
| | Plus reinsurance recoverables | | 48,474 |
| | 50,493 |
| | 44,487 |
|
| | Reserve at end of year | | $ | 985,635 |
| | $ | 1,438,813 |
| | $ | 1,893,402 |
|
| |
(1)
| A negative number for prior year losses incurred indicates a redundancy of prior year loss reserves. See table 8.2 below for more information about prior year loss development. |
| |
(2)
| In a termination, the reinsurance agreement is cancelled, with no future premium ceded and amounts for any incurred but unpaid losses paid to us. Amounts paid to (received from) reinsurers result in an increase (decrease) in net losses paid. The change in net losses paid on our losses incurred is offset by a corresponding change in the reinsurance recoverable, resulting in no net impact on losses incurred. (See Note 9 – “Reinsurance”). |
Table 8.2 below shows the development of reserves in 2017, 2016 and 2015 for previously received delinquencies.
|
| | | | | | | | | | | | | | |
| | Table | 8.2 | | | | | | |
| Reserve development on previously received delinquencies | (In millions) | | 2017 | | 2016 | | 2015 |
| Decrease in estimated claim rate on primary delinquencies | | $ | (248 | ) | | $ | (148 | ) | | $ | (141 | ) |
| Increase in estimated severity on primary delinquencies | | 9 |
| | 9 |
| | 43 |
|
| Change in estimates related to pool reserves, LAE reserves, reinsurance and other | | 8 |
| | (9 | ) | | (12 | ) |
| | Total prior year loss development (1) | | $ | (231 | ) | | $ | (148 | ) | | $ | (110 | ) |
| |
(1)MGIC Investment Corporation 2022 Form 10-K | 99
MGIC Investment Corporation and Subsidiaries
| A negative number for prior year loss development indicates a redundancy of prior year loss reserves. |
For the years ended December 31, 2017, 2016 and 2015, we experienced favorable development on previously received delinquencies. This development was, in part, due to the resolution of approximately 67%, 63% and 60% for the years ended December 31, 2017, 2016 and 2015, respectively, of the prior year delinquent inventory, with improved cure rates. During 2017, cure activity on loans that were delinquent twelve months or more was significantly higher than our previous estimates. During 2015, the claim rate development was also favorably impacted by re-estimations of previously recorded reserves relating to disputes on our claims paying practices and adjustments to IBNR. The favorable development for the years ended 2017, 2016, and 2015 was offset, in part, by an increase in the estimated severity on previously reported delinquencies remaining in the delinquent inventory.
Delinquent Inventory
A rollforwardroll-forward of our primary delinquentdelinquency inventory for the years ended December 31, 2017, 2016,2022, 2021, and 20152020 appears in table 8.3 below. The information concerning new notices and cures is compiled from monthly reports received from loan servicers. The level of new notice and cure activity reported in a particular month
MGIC Investment Corporation 2017 Form 10-K | 128
|
| | | | | | | | | | | | | | | |
Consolidated Financial Statements and Notes |
MGIC Investment Corporation
2017 Form 10-K
|
Notes (continued) |
can be influenced by, among other things, the date on which a servicer generates its report, the number of business days in a month and transfers of servicing between loan servicers.
|
| | | | | | | | | | | |
| | Table | 8.3 | | | | | | |
| Delinquent inventory rollforward | | | 2017 | | 2016 | | 2015 |
| Delinquent inventory at beginning of year | | 50,282 |
| | 62,633 |
| | 79,901 |
|
| New Notices | | 68,268 |
| | 67,434 |
| | 74,315 |
|
| | Cures | | (61,094 | ) | | (65,516 | ) | | (73,610 | ) |
| | Paids (including those charged to a deductible or captive) | | (9,206 | ) | | (12,367 | ) | | (16,004 | ) |
| | Rescissions and denials | | (357 | ) | | (629 | ) | | (848 | ) |
| | Other items removed from inventory | | (1,337 | ) | | (1,273 | ) | | (1,121 | ) |
| | Delinquent inventory at end of year | | 46,556 |
| | 50,282 |
| | 62,633 |
|
2017 delinquent inventory
Hurricane activity
New default notice activity increased in 2017 compared to | | | | | | | | | | | | | | | | | | | | | | | |
| Primary delinquency inventory roll-forward |
| Table | 8.3 | | | | | | |
| | 2022 | | 2021 | | 2020 |
| Beginning delinquent inventory | | 33,290 | | | 57,710 | | | 30,028 | |
| New Notices | | 42,988 | | | 42,432 | | | 106,099 | |
| Cures | | (48,262) | | | (64,896) | | | (76,107) | |
| Paid claims | | (1,305) | | | (1,223) | | | (2,245) | |
| Rescissions and denials | | (35) | | | (38) | | | (65) | |
| Other items removed from inventory | | (289) | | | (695) | | | — | |
| Ending delinquent inventory | | 26,387 | | | 33,290 | | | 57,710 | |
During 2022 and 2021, our losses paid included amounts paid upon commutation of coverage on pools of non-performing loans. As a result of these payments 289 items were removed from the prior year (particularly in the fourth quarter) because of hurricane activity that primarily impacted Puerto Rico, Texas, and Florida in the third quarter of 2017. In response to the hurricanes, the Federal Emergency Management Agency has declared Individual Assistance Disaster Areas ("IADA") which we are utilizing to identify new notices of delinquency for reserving and loss mitigation purposes. We received 9,294 new notices of delinquency on loans in the IADAs in the fourth quarter of 2017, which compares to 1,968 new notices in the same areas in the fourth quarter of 2016. Loans in our ending delinquent inventory within the IADAs were 12,446 and 7,162 as of December 31, 2017 and 2016, respectively.
The new notice activity from hurricane impacted areas in the fourth quarter of 2017 has increased the percentage of our delinquent inventory that has been delinquent for three months or less (table 8.4) and correspondingly our percentage of delinquent inventory with three payments or less (table 8.5) delinquent has also increased.an amount paid of $4.6 million in 2022. During 2021, 695 items were removed from delinquency inventory with an amount paid of $13.8 million.
2016 and 2015 delinquent inventory
The decrease in the primary delinquent inventory experienced during 2016 and 2015 from the respective prior year was generally across all markets and all book years prior to 2013. In 2016 and 2015, the percentage of loans in the inventory that had been delinquent for 12 or more consecutive months had decreased compared to the respective prior year.
Historically as a delinquency ages it becomesis more likely to result in a claim. The percentage of loans that have been delinquent for 12 or more consecutive months and the number of loans in our primary claims received inventory have been affected by our suspended rescissions and the resolution of certain of those rescissions discussed below and in Note 17 - "Litigation and Contingencies". The number of consecutive months that a borrower has been delinquent is shown in the table 8.4 below.
| | | | | | | | | | | | | | | | | | | | | | | |
| Primary delinquency inventory - consecutive months delinquent |
| Table | 8.4 | | | | | | |
| | December 31, |
| | 2022 | | 2021 | | 2020 |
| 3 months or less | | 8,820 | | 7,586 | | 11,542 |
| 4 - 11 months | | 8,217 | | 7,990 | | 34,620 |
12 months or more (1) | | 9,350 | | 17,714 | | 11,548 |
| Total | | 26,387 | | 33,290 | | 57,710 |
| | | | | | |
| 3 months or less | | 33 | % | | 23 | % | | 20 | % |
| 4 - 11 months | | 31 | % | | 24 | % | | 60 | % |
| 12 months or more | | 36 | % | | 53 | % | | 20 | % |
| Total | | 100 | % | | 100 | % | | 100 | % |
| | | | | | |
| Primary claims received inventory included in ending delinquent inventory | | 267 | | | 211 | | | 159 | |
(1)Approximately 36%, 20%, and 31% of the delinquent inventory that has been delinquent for 12 consecutive months or more has been delinquent for at least 36 consecutive months as of December 31, 2022, 2021 and 2020, respectively.
|
| | | | | | | | | | | | | | | | | | | | |
| | Table | 8.4 | | | | | | | | | | | | |
| Delinquent inventory - consecutive months delinquent | | | December 31, |
| | | 2017 | | 2016 | | 2015 |
| 3 months or less | | 17,119 |
| | 37 | % | | 12,194 |
| | 24 | % | | 13,053 |
| | 21 | % |
| 4 - 11 months | | 12,050 |
| | 26 | % | | 13,450 |
| | 27 | % | | 15,763 |
| | 25 | % |
| | 12 months or more (1) | | 17,387 |
| | 37 | % | | 24,638 |
| | 49 | % | | 33,817 |
| | 54 | % |
| | Total primary delinquent inventory | | 46,556 |
| | 100 | % | | 50,282 |
| | 100 | % | | 62,633 |
| | 100 | % |
| | | | | | | | | | | | | | |
| | Primary claims received inventory included in ending delinquent inventory | | 954 |
| | 2 | % | | 1,385 |
| | 3 | % | | 2,769 |
| | 4 | % |
| |
(1)
| Approximately 45%, 47% and 50% of the primary delinquent inventory delinquent for 12 consecutive months or more has been delinquent for at least 36 consecutive months as of December 31, 2017, 2016 and 2015, respectively.
|
COVID-19 Pandemic Delinquencies
We experienced an increase in new delinquency notices in the second and third quarters of 2020 because of the impacts of the COVID-19 pandemic, including the high level of unemployment and economic uncertainty resulting from measures to reduce the transmission of COVID-19. Forbearance programs enacted by the GSEs provided for payment forbearance on mortgages to borrowers experiencing a hardship during the COVID-19 pandemic. Historically, forbearance plans have reduced the incidence of our losses on affected loans. Through December 31, 2022 the vast majority of the delinquencies received in the second and third quarter of 2020 have cured.
POOL INSURANCE DEFAULT INVENTORY
Pool insurance default inventory was 391 at December 31, 2022, 498 at December 31, 2021, and 680 at December 31, 2020.
PREMIUM REFUNDS
Our estimate of premiums to be refunded on expected claim payments is accrued for separately in "Other liabilities" on our consolidated balance sheets and approximated $25.5 million and $37.3 million at December 31, 2022 and 2021, respectively. The decrease is driven by a decrease in delinquency inventory as well as a decrease inventory that is twelve or more months delinquent.
MGIC Investment Corporation 20172022 Form 10-K | 129100
MGIC Investment Corporation and Subsidiaries
|
| | | | | | | | | | | | | | | |
Consolidated Financial Statements and NotesNOTE 9 |
MGIC Investment Corporation
2017 Form 10-K
|
Notes (continued)Reinsurance |
The length of time a loan is in the delinquent inventory can differ from the number of payments that the borrower has not made or is considered delinquent. These differences typically result from a borrower making monthly payments that do not result in the loan becoming fully current. The number of payments that a borrower is delinquent is shown in table 8.5 below.
|
| | | | | | | | | | | | | | | | | | | | |
| | Table | 8.5 | | | | | | | | | | | | |
| Delinquent inventory - number of payments delinquent | | | December 31, |
| | | 2017 | | 2016 | | 2015 |
| 3 payments or less | | 21,678 |
| | 46 | % | | 18,419 |
| | 36 | % | | 20,360 |
| | 33 | % |
| 4 - 11 payments | | 12,446 |
| | 27 | % | | 12,892 |
| | 26 | % | | 15,092 |
| | 24 | % |
| | 12 payments or more | | 12,432 |
| | 27 | % | | 18,971 |
| | 38 | % | | 27,181 |
| | 43 | % |
| | Total primary delinquent inventory | | 46,556 |
| | 100 | % | | 50,282 |
| | 100 | % | | 62,633 |
| | 100 | % |
Pool insurance default inventory decreased to 1,309 at December 31, 2017 from 1,883 at December 31, 2016 and 2,739 at December 31, 2015.
Claims paying practices
Our loss reserving methodology incorporates our estimates of future rescissions. A variance between ultimate actual rescission rates and our estimates, as a result of the outcome of litigation, settlements or other factors, could materially affect our losses. Our estimate of premiums to be refunded on expected future rescissions is accrued for separately and is included in "Other liabilities" on our consolidated balance sheets.
For information about discussions and legal proceedings with customers with respect to our claims paying practices, including settlements that we believe are probable, as defined in ASC 450-20, see Note 17 – “Litigation and Contingencies.”
Note 9. Reinsurance
Our consolidated financial statements reflect the effects of assumed and ceded reinsurance transactions. Assumed reinsurance refers to the acceptance of certain insurance risks that other insurance companies have underwritten. Ceded reinsurance involves transferring certain insurance risks (along with, in the case of quota share reinsurance, the related earned premiums) we have underwritten to other insurance companies who agree to share these risks. The purpose of ceded reinsurance is to protect us, at a cost, against a fixed percentage of losses arising from our mortgage guaranty policies covered by the agreement and to manage our capital requirements under PMIERs. Reinsurance is currently placed on a quota-sharequota share and excess of loss basis but we also havehad immaterial captive reinsurance agreements that remainwere in effect. The reinsurance agreements we have entered into are discussed below.effect through December 31, 2020.
Table 9.1 below shows the effect of all reinsurance agreements on premiums earned and losses incurred as reflected in the consolidated statements of operations.
| | | | | | | | | | | | | | | | | | | | | | | |
| Reinsurance |
| Table | 9.1 | | | | | | |
| | Years ended December 31, |
| (In thousands) | | 2022 | | 2021 | | 2020 |
| Premiums earned: | | | | | | |
| Direct | | $ | 1,154,728 | | | $ | 1,167,592 | | | $ | 1,199,824 | |
| Assumed | | 8,778 | | | 9,858 | | | 10,848 | |
Ceded - quota share reinsurance (1) | | (86,435) | | | (118,537) | | | (167,930) | |
| Ceded - excess-of-loss reinsurance | | (69,938) | | | (44,494) | | | (20,799) | |
| Total ceded | | (156,373) | | | (163,031) | | | (188,729) | |
| Net premiums earned | | $ | 1,007,133 | | | $ | 1,014,419 | | | $ | 1,021,943 | |
| | | | | | |
| Losses incurred: | | | | | | |
| Direct | | $ | (274,072) | | | $ | 74,496 | | | $ | 442,194 | |
| Assumed | | (330) | | | (57) | | | 555 | |
| Ceded - quota share reinsurance | | 19,837 | | | (9,862) | | | (77,975) | |
| Losses incurred, net | | $ | (254,565) | | | $ | 64,577 | | | $ | 364,774 | |
| | | | | | | |
| Other Reinsurance Impacts: | | | | | | |
Profit commission on quota share reinsurance (1) | | $ | 176,084 | | | $ | 153,759 | | | $ | 72,425 | |
| Ceding commission on quota share reinsurance | | 52,071 | | | 53,460 | | | 48,077 | |
(1)Ceded premiums earned are shown net of profit commission.
QUOTA SHARE REINSURANCE
We have entered into quota share reinsurance ("QSR") transactions with panels of third-party reinsurers to cede a fixed quota share percentage of premiums earned and received and losses incurred on insurance covered by the transactions. We receive the benefit of a ceding commission equal to 20% of premiums ceded before profit commission. We also receive the benefit of a profit commission through a reduction of premiums we cede. The profit commission varies inversely with the level of losses on a “dollar for dollar” basis and can be eliminated at annual loss ratios higher than we have experienced on our QSR transactions.
Each of our QSR transactions typically have annual loss ratio caps of 300% and lifetime loss ratios of 200%.
|
| | | | | | | | | | | | | | |
| | Table | 9.1 | | | | | | |
| Reinsurance | | | Years ended December 31, |
| | (In thousands) | | 2017 | | 2016 | | 2015 |
| | Premiums earned: | | | | | | |
| | Direct | | $ | 1,059,973 |
| | $ | 1,058,545 |
| | $ | 997,892 |
|
| | Assumed | | 509 |
| | 662 |
| | 1,178 |
|
| | Ceded | | (125,735 | ) | | (133,981 | ) | | (102,848 | ) |
| | Net premiums earned | | $ | 934,747 |
| | $ | 925,226 |
| | $ | 896,222 |
|
| | | | | | | | |
| | Losses incurred: | | | | | | |
| | Direct | | $ | 74,727 |
| | $ | 273,207 |
| | $ | 369,680 |
|
| | Assumed | | 183 |
| | 1,138 |
| | 1,552 |
|
| | Ceded | | (21,201 | ) | | (34,188 | ) | | (27,685 | ) |
| | Net losses incurred | | $ | 53,709 |
| | $ | 240,157 |
| | $ | 343,547 |
|
MGIC Investment Corporation 20172022 Form 10-K | 130101
MGIC Investment Corporation and Subsidiaries
Table 9.2 below provides additional detail regarding our QSR transactions in effect during 2022.
| | | | | | | | | | | | | | | | | | | | | | | | | | | | | |
| Reinsurance |
| Table | 9.2 | | | | | | | | |
| | |
| Quota Share Contract | | Covered Policy Years | Quota Share % | | Annual Loss Ratio to Exhaust Profit Commission (1) | | Contractual Termination Date |
2015 QSR (2) | | Prior to 2017 | 15.0 | % | | 68.0 | % | | December 31, 2031 |
2019 QSR (2) | | 2019 | 30.0 | % | | 62.0 | % | | December 31, 2030 |
| 2020 QSR | | 2020 | 12.5 | % | | 62.0 | % | | December 31, 2031 |
| 2020 QSR and 2021 QSR | | 2020 | 17.5 | % | | 62.0 | % | | December 31, 2032 |
| 2020 QSR and 2021 QSR | | 2021 | 17.5 | % | | 61.9 | % | | December 31, 2032 |
| 2021 QSR and 2022 QSR | | 2021 | 12.5 | % | | 57.5 | % | | December 31, 2032 |
| 2021 QSR and 2022 QSR | | 2022 | 15.0 | % | | 57.5 | % | | December 31, 2033 |
| 2022 QSR and 2023 QSR | | 2022 | 15.0 | % | | 62.0 | % | | December 31, 2033 |
| 2022 QSR and 2023 QSR | | 2023 | 15.0 | % | | 62.0 | % | | December 31, 2034 |
Credit Union QSR (3) | | 2020-2025 | 65.0 | % | | 50.0 | % | | December 31, 2039 |
(1)We will receive a profit commission provided the annual loss ratio on policies covered under the transaction remains below this ratio.
(2)2015 and 2019 QSR Transactions were terminated effective December 31, 2022.
(3)Eligible credit union business written before April 1, 2020 was covered by our 2019 and prior QSR Transactions.
We have agreed to terms with a group of unaffiliated reinsurers for a reinsurance transaction with an effective date of January 1, 2023 with a similar structure to our existing QSR transactions that will cover most of our NIW in 2023 (with an additional 10.0% quota share). Generally, we will receive an annual profit commission provided the annual loss ratio on the loans covered under the transaction remain below 58.5%.
We can elect to terminate the QSR Transactions under specified scenarios without penalty upon prior written notice, including if we will receive less than 90% (80% for the Credit Union QSR Transaction) of the full credit amount under the PMIERs, full financial statement credit or full credit under applicable regulatory capital requirements for the risk ceded in any required calculation period. Early termination of the QSR agreements can also be elected by us for a fee, or under specified scenarios for no fee upon prior written notice.
Table 9.3 provides additional detail regarding optional termination dates and optional reductions to our quota share percentage which can, in each case be elected by us for a fee. The optional reduction to the quota share percentage would give us an option to reduce our quota share percentage from the original percentage as shown in table 9.2 to the percentage showed in 9.3.
|
| | | | | | | | | | | | | | | | | | | |
Consolidated Financial Statements and NotesReinsurance |
MGIC Investment Corporation
2017 Form 10-K
|
Notes (continued) |
Quota share reinsurance
Each of the reinsurers under our 2017 and 2015 quota share reinsurance agreements ("2017 QSR Transaction" and "2015 QSR Transaction", respectively) and proposed 2018 quota share reinsurance agreement ("2018 QSR Transaction") has an insurer financial strength rating of A- or better by Standard and Poor's Rating Services, A.M. Best, or both.
2017 QSR Transaction. Effective January 1, 2017, this transaction provides coverage on new business written from the effective date through December 29, 2017 that meets certain eligibility requirements. The agreement cedes losses incurred and premiums on or after the effective date through December 31, 2028 at which time the agreement expires. Early termination of the agreement can be elected by us effective December 31, 2021 for a fee, or under specified scenarios for no fee upon prior written notice, including if we will receive less than 90% of the full credit amount under the PMIERs for the risk ceded in any required calculation period.
2015 QSR Transaction. Effective July 1, 2015, this transaction provides coverage on policies that were in the 2013 quota share reinsurance agreement ("2013 QSR Transaction"); additional qualifying in force policies as of the agreement effective date which either had no history of defaults, or where a single default had been cured for twelve or more months at the agreement effective date; and all qualifying new insurance written through December 31, 2016. Compared to the 2013 QSR Transaction, the 2015 QSR Transaction increased the amount of our IIF covered by reinsurance and the amount of premiums and losses that will be ceded. The agreement cedes losses incurred and premiums on or after the effective date through December 31, 2024, at which time the agreement expires. Early termination of the agreement can be elected by us effective December 31, 2018 for a fee, or under specified scenarios for no fee upon prior written notice, including if we will receive less than 90% of the full credit amount under the PMIERs for the risk ceded in any required calculation period.
The structure of the 2017 and 2015 QSR Transactions are both 30% quota share agreements for all policies covered, with a 20% ceding commission as well as a profit commission. Generally, under each transaction, we will receive a profit commission provided that the loss ratio on the loans covered under the agreement remains below 60%, with higher levels of losses ceded reducing our profit commission.
2013 QSR Transaction.Effective July 1, 2015, we commuted and settled our 2013 QSR Transaction. The settlement included unearned premiums, loss reserves, and profit commission. The commutation resulted in an increase in net premiums written and earned of $69.4 million and $11.6 million, respectively, and a decrease in ceding commissions of $11.6 million in the third quarter of 2015. Receipt of our profit commission of $142.5 million, in addition to other premium and loss amounts, was also completed as part of the settlement.
2018 QSR Transaction. We have agreed to terms on a 2018 QSR Transaction with a group of unaffiliated reinsurers to manage our exposure to losses resulting from the covered mortgage guaranty insurance policies and to provide reinsurance capital credit under the PMIERs. The GSEs have approved the terms of our proposed 2018 QSR Transaction. The 2018 QSR Transaction is expected to be executed during the first quarter of 2018 with an effective date of January 1, 2018, and will provide coverage on new business written January 1, 2018 through December 31, 2018 that meets certain eligibility requirements. Under the agreed upon terms, the 2018 QSR Transaction will cede losses incurred and premiums on or after the effective date through December 31, 2029, at which time the agreement expires. Early termination of the agreement can be elected by us effective December 31, 2021, and annually thereafter, for a fee, or under specified scenarios for no fee upon prior written notice, including if we will receive less than 90% of the full credit amount under the PMIERs for the risk ceded in any required calculation period.
The agreed upon structure of the 2018 QSR Transaction is a 30% quota share for all policies covered, with a 20% ceding commission as well as a profit commission. Generally, under the 2018 QSR Transaction, we will receive a profit commission provided that the loss ratio on the loans covered under the agreement remains below 54%.
MGIC Investment Corporation 2017 Form 10-K | 131
|
| | | | | | | | | Table 9.3 | | | | | | |
Consolidated Financial Statements and Notes |
MGIC Investment Corporation
2017 Form 10-K
|
Notes (continued) |
Table 9.2 provides a summary of our quota share reinsurance agreements, excluding captive agreements, for 2017, 2016 and 2015.
|
| | | | | | | | | | | | | | |
| | Table | 9.2 | | | | | | |
| Quota share reinsurance | | | Years ended December 31, |
| (In thousands) | | 2017 | | 2016 | | 2015 (3) |
| | Ceded premiums written, net of profit commission (1) | | $ | 120,974 |
| | $ | 125,460 |
| | $ | 41,233 |
|
| | Ceded premiums earned, net of profit commission (1) | | 120,974 |
| | 125,460 |
| | 88,587 |
|
| | Ceded losses incurred | | 22,336 |
| | 30,201 |
| | 17,484 |
|
| | Ceding commissions (2) | | 49,321 |
| | 47,629 |
| | 30,816 |
|
| | Profit commission | | 125,629 |
| | 112,685 |
| | 112,847 |
|
| |
| Quota Share Contract | Covered Policy Years | Optional Termination Date (1) | Since Optional Quota Share % Reduction Date (2) | | Optional Reduced Quota Share % |
| 2020 QSR | 2020 | June 30, 2023 | January 1, 2023 | | 10.5% or 8% |
| 2020 QSR and 2021 QSR | 2020 | June 30, 2023 | January 1, 2023 | | 14.5% or 12% |
| 2020 QSR and 2021 QSR | 2021 | December 31, 2023 | January 1, 2023 | | 14.5% or 12% |
| 2021 QSR and 2022 QSR | 2021 | December 31, 2023 | January 1, 2023 | | 10.5% or 8% |
| 2021 QSR and 2022 QSR | 2022 | December 31, 2024 | July 1, 2015, premiums are ceded on an earned and received basis as defined in our QSR Transactions currently in effect.2023 |
| 12.5% or 10% |
(2)
2022 QSR and 2023 QSR | Ceding commissions are reported within Other underwriting and operating expenses, net on the consolidated statements of operations.2022 |
| December 31, 2024 | July 1, 2023 | | 12.5% or 10% |
(3)
2022 QSR and 2023 QSR | The year ended 2023
| December 31, 2015 includes the non-recurring impact of commuting our 2013 QSR Transaction (see "2013 QSR Transaction" above for additional information). The commutation had no impact on ceded losses incurred.2025 | July 1, 2024 | | 12.5% or 10% |
(1) We can elect early termination of the QSR transaction beginning on this date, and bi-annually thereafter.
(2) We can elect to reduce the quota share percentage beginning on this date, and bi-annually thereafter.
We incurred an early termination fee of $2.2 million for the termination of our 2019 QSR Transaction effective December 31, 2022 and $5.0 million for the termination of our 2017 and 2018 QSR Transactions effective December 31, 2021. We also terminated our 2015 QSR Transaction effective December 31, 2022. The reinsurance recoverable on paid losses due from reinsurers for loss and LAE reserves incurred at the time of termination includes $17.7 million as of December 31, 2022 from reinsurers participating in the 2015 and 2019 QSR Transactions and included $36.0 million as of December 31, 2021 due from reinsurers participating in the 2017 and 2018 QSR Transactions.
Ceded premiums written and earned, net of profit commission, decreased in 2022 due to the increase in profit commission. The increase in profit commission was a result of ceded losses incurred. Ceded losses incurred for the year ended December 31, 2022 primarily reflect favorable loss reserve development. See Note 8 - “Loss Reserves” for discussion of our loss reserves.
MGIC Investment Corporation 2022 Form 10-K | 102
MGIC Investment Corporation and Subsidiaries
Under the terms of our QSR Transactions currently in effect, reinsuranceceded premiums, ceding commissions, profit commission, and profit commissionceded loss paid and LAE paid are settled net on a quarterly basis. The reinsurance premiumceded premiums due after deducting the related ceding commission and profit commission is reported within "Other liabilities" on the consolidated balance sheets.
The reinsurance recoverable on loss reserves related to our QSR Transactions was $39.3$28.2 million as of December 31, 20172022 and $31.8$66.9 million as of December 31, 2016.2021. The reinsurance recoverable balance is secured by funds on deposit from the reinsurers, the minimum amount of which areis based on the greater of 1) a reinsurer's funding requirements under PMIERs or 2) ceded reserves and unpaid losses. Each of PMIERs that address ceded risk.the reinsurers under our quota share reinsurance agreements described above has an insurer financial strength rating of A- or better (or a comparable rating) by Standard and Poor's Rating Services, A.M. Best, Moody's, or a combination of the three. An allowance for credit losses was not required for 2022 or 2021.
EXCESS OF LOSS REINSURANCE
Captive
We have Excess-of-loss transactions (“XOL Transactions”) with a panel of unaffiliated reinsurers executed through the traditional reinsurance
In the past, MGIC also obtained captive reinsurance. In a captive reinsurance arrangement, the reinsurer is affiliated with the lender for whom MGIC provides mortgage insurance. As part of our settlement with the Consumer Financial Protection Bureau ("CFPB" market (“Traditional XOL Transaction”) in 2013 and with unaffiliated special purpose insurers (“Home Re Transactions”).
The 2022 Traditional XOL Transaction provides reinsurance coverage on eligible NIW in 2022. For the Minnesota Departmentcovered policies, we retain the first layer of Commercethe aggregate losses paid, and the reinsurers will then provide second layer coverage up to the outstanding reinsurance coverage amount. We retain losses paid in 2015, MGIC has agreedexcess of the outstanding reinsurance coverage amount. The reinsurance coverage is subject to not enter intoadjustment based on the risk characteristics of the covered loans.
We can elect to terminate our Traditional XOL Transaction under specified scenarios without penalty upon prior written notice, including if we will receive less than the full credit amount under the PMIERs, full financial statement credit or full credit under applicable regulatory capital requirements for the risk ceded in any new captiverequired calculation period. The reinsurance agreementpremiums ceded to the Traditional XOL Transaction are based off the remaining reinsurance coverage levels. The reinsured coverage levels are secured by funds on deposit from reinsurers, the minimum amount of which is based on the greater of 1) a reinsurer's funding requirements under PMIERs or reinsure any new loans under any existing captive2) ceded reserves and unpaid losses.
The Home Re Transactions are executed with unaffiliated special purpose insurers (“Home Re Entities”). For the reinsurance agreement forcoverage periods, we retain the first layer of the respective aggregate losses paid, and a Home Re Entity will then provide second layer coverage up to the outstanding reinsurance coverage amount. We retain losses paid in excess of the outstanding reinsurance coverage amount. Subject to certain conditions, the reinsurance coverage decreases over a period of teneither 10 or 12.5 years, subsequentdepending on the transaction, as the underlying covered mortgages amortize or are repaid, or mortgage insurance losses are paid.
The Home Re Entities financed the coverages by issuing mortgage insurance-linked notes (“ILNs”) to unaffiliated investors in an aggregate amount equal to the initial reinsurance coverage amounts. Each ILN is non-recourse to any assets of MGIC or affiliates. The proceeds of the ILNs, which were deposited into reinsurance trusts for the benefit of MGIC, will be the source of reinsurance claim payments to MGIC and principal repayments on the ILNs.
When a “Trigger Event” is in effect, as defined in the related insurance-linked notes transaction agreements, payment of principal on the related notes will be suspended and the reinsurance coverage available to MGIC under the transactions will not be reduced by such principal payments. As of December 31, 2022, a "Trigger Event" has occurred on our Home Re 2019-1 transaction because the reinsured principal balance of loans that were reported 60 or more days delinquent exceeded a percentage of the total reinsured principal balance of loans specified under each transaction. A "Trigger Event" has also occurred on the Home Re 2022-1 transaction because the credit enhancement of the most senior tranche is less than the target credit enhancement.
MGIC Investment Corporation 2022 Form 10-K | 103
MGIC Investment Corporation and Subsidiaries
Table 9.4a and 9.4b provides a summary of our XOL Transactions as of December 31, 2022, December 31, 2021 and December 31, 2020.
| | | | | | | | | | | | | | | | | | | | |
| Excess of Loss Reinsurance |
| 9.4a | | | | | | |
| ($ in thousands) | Issue Date | Policy In force Dates | Optional Call/ Termination Date (1) | Legal Maturity | Initial First Layer Retention | Initial Excess of Loss Reinsurance Coverage |
| Home Re 2022-1, Ltd. | April 26, 2022 | May 29, 2021 - December 31, 2021 | April 25, 2028 | 12.5 years | $325,589 | $473,575 |
| Home Re 2021-2, Ltd. | August 3, 2021 | January 1, 2021 - May 28, 2021 | July 25, 2028 | 12.5 years | 190,159 | 398,429 |
| Home Re 2021-1, Ltd. | February 2, 2021 | August 1, 2020 - December 31, 2020 | January 25, 2028 | 12.5 years | 211,159 | 398,848 |
| Home Re 2020-1, Ltd. | October 29, 2020 | January 1, 2020 - July 31, 2020 | October 25, 2027 | 10 years | 275,283 | 412,917 |
| Home Re 2019-1, Ltd. | May 25, 2019 | January 1, 2018 - March 31, 2019 | May 25, 2026 | 10 years | 185,730 | 315,739 |
| Home Re 2018-1, Ltd. | October 30, 2018 | July 1, 2016 - December 31, 2017 | October 25, 2025 | 10 years | 168,691 | 318,636 |
| 2022 Traditional XOL | April 1, 2022 | January 1, 2022 - December 30, 2022 | January 1, 2030 | 10 years | 82,523 | 142,642 |
(1)We have the right to terminate the Home Re Transactions under certain circumstances and on any payment date on or after the respective settlements. InOptional Call date. We can elect early termination of the Traditional XOL Transaction beginning on this date, and quarterly thereafter.
| | | | | | | | | | | | | | | | | | | | | | | | | | | | | | | | | | | | | | |
| | | | | | | | | | | | |
| 9.4b | | Remaining First Layer Retention | | Remaining Excess of Loss Reinsurance Coverage |
| ($ in thousands) | | December 31, 2022 | | December 31, 2021 | | December 31, 2020 | | December 31, 2022 | | December 31, 2021 | | December 31, 2020 |
| Home Re 2022-1, Ltd. | | $ | 325,576 | | | $ | — | | | $ | — | | | $ | 473,575 | | | $ | — | | | $ | — | |
| Home Re 2021-2, Ltd. | | 190,097 | | | 190,159 | | | — | | | 352,084 | | | 398,429 | | | — | |
| Home Re 2021-1, Ltd. | | 211,102 | | | 211,142 | | | — | | | 277,053 | | | 387,830 | | | — | |
| Home Re 2020-1, Ltd. | | 274,871 | | | 275,204 | | | 275,283 | | | 113,247 | | | 234,312 | | | 412,917 | |
| Home Re 2019-1, Ltd. | | 183,540 | | | 183,917 | | | 184,514 | | | 208,146 | | | 208,146 | | | 208,146 | |
| Home Re 2018-1, Ltd. | | 164,849 | | | 165,365 | | | 166,005 | | | 140,993 | | | 218,343 | | | 218,343 | |
| 2022 Traditional XOL | | 82,517 | | | — | | | — | | | 142,642 | | | — | | | — | |
MGIC Investment Corporation 2022 Form 10-K | 104
MGIC Investment Corporation and Subsidiaries
The reinsurance premiums ceded to each Home Re Entity are composed of coverage, initial expense and supplemental premiums. The coverage premiums are generally calculated as the difference between the amount of interest payable by the Home Re Entity on the remaining reinsurance coverage levels, and the investment income collected on the collateral assets held in reinsurance trust account and used to collateralize the Home Re Entity's reinsurance obligation to MGIC. The amount of monthly reinsurance coverage premium ceded will fluctuate due to changes in the reference rate and changes in money market rates that affect investment income collected on the assets in the reinsurance trust. The Home Re 2021-2 and Home Re 2022-1 Transactions references SOFR, while the remaining Home Re Transactions reference the one-month LIBOR. As a result, we concluded that each Home Re Transaction contains an embedded derivative that is accounted for separately as a freestanding derivative. The fair values of the derivatives at December 31, 2022 and December 31, 2021, were not material to our consolidated balance sheet, and the change in fair values during the years ended December 31, 2022, December 31, 2021 and December 31, 2020 were not material to our consolidated statements of operations. (see Note 5 - "Investments" and Note 6 - "Fair Value Measurements" ).
At the time the Home Re Transactions were entered into, we concluded that each Home Re Entity is a variable interest entity (“VIE”). A VIE is a legal entity that does not have sufficient equity at risk to finance its activities without additional subordinated financial support or is structured such that equity investors lack the ability to make sufficient decisions relating to the entity’s operations through voting rights or do not substantively participate in gains and losses of the entity. Given that MGIC (1) does not have the unilateral power to direct the activities that most significantly affect each Home Re Entity’s economic performance and (2) does not have the obligation, outside the terms of the reinsurance agreement, to absorb losses or the right to receive benefits of each Home Re Entity that could be significant to the Home Re Entity, consolidation of the Home Re Entities is not required.
We are required to disclose our maximum exposure to loss, which we consider to be an amount that we could be required to record in our statements of operations, as a result of our involvement with the VIEs under our Home Re Transactions. As of December 31, 2022, December 31, 2021 and December 31, 2020, we did not have material exposure to the VIEs as we have no investment in the VIEs and had no reinsurance claim payments due from the VIEs under our reinsurance transactions. We are unable to determine the timing or extent of claims from losses that are ceded under the reinsurance transactions. The VIE assets are deposited in reinsurance trusts for the benefit of MGIC that will be the source of reinsurance claim payments to MGIC. The purpose of the reinsurance trusts is to provide security to MGIC for the obligations of the VIEs under the reinsurance transactions. The trustee of the reinsurance trusts, a recognized provider of corporate trust services, has established segregated accounts within the reinsurance trusts for the benefit of MGIC, pursuant to the trust agreements. The trust agreements are governed by, and construed in accordance with, the CFPB settlement, alllaws of our active captive arrangements were placed into run-off. In addition, the GSEs will not approve any futureState of New York. If the trustee of the reinsurance or risk sharing transaction withtrusts failed to distribute claim payments to us as provided in the reinsurance trusts, we would incur a mortgage enterprise or an affiliate of a mortgage enterprise.
The reinsurance recoverable on loss reserves related to captiveour losses ceded under the reinsurance transactions and deemed unrecoverable. We are also unable to determine the impact such
possible failure by the trustee to perform pursuant to the reinsurance trust agreements was $9 million atmay have on our consolidated financial statements. As a result, we are unable to quantify our maximum exposure to loss related to our involvement with the VIEs. MGIC has certain termination rights under the reinsurance transactions should its claims not be paid. We consider our exposure to loss from our reinsurance transactions with the VIEs to be remote.
Table 9.5 presents the total assets of the Home Re Entities as of December 31, 2017 which was supported by $80 million of trust assets, while at2022 , December 31, 2016 the reinsurance recoverable on loss reserves related to captive agreements was $19 million which was supported by $91 million of trust assets. Each captive reinsurer is required to maintain a separate trust account to support its combined reinsured risk on all annual books. MGIC is the sole beneficiary of the trusts.
MGIC Investment Corporation 2017 Form 10-K | 132
2021 and December 31, 2020. |
| | | | | | | | | | | | | | | |
Consolidated Financial Statements and NotesHome Re Entities total assets |
MGIC Investment Corporation
2017 Form 10-K
Table | 9.5 | | |
Notes (continued) | | |
| (In thousands) | | |
| Home Re Entity | | Total VIE Assets |
| December 31, 2022 | | |
| Home Re 2018-1 Ltd. | | $ | 146,822 | |
| Home Re 2019-1 Ltd. | | 208,146 | |
| Home Re 2020-1 Ltd. | | 119,159 | |
| Home Re 2021-1 Ltd. | | 285,039 | |
| Home Re 2021-2 Ltd. | | 357,340 | |
| Home Re 2022-1 Ltd. | | 473,575 | |
| | |
| December 31, 2021 | | |
| Home Re 2018-1 Ltd. | | $ | 218,343 | |
| Home Re 2019-1 Ltd. | | 208,146 | |
| Home Re 2020-1 Ltd. | | 251,387 | |
| Home Re 2021-1 Ltd. | | 398,848 | |
| Home Re 2021-2 Ltd. | | 398,429 | |
| | |
| December 31, 2020 | | |
| Home Re 2018-1 Ltd. | | $ | 218,343 | |
| Home Re 2019-1 Ltd. | | 208,146 | |
| Home Re 2020-1 Ltd. | | 412,917 | |
The reinsurance trust agreements provide that the trust assets may generally only be invested in certain money market funds that (1) invest at least 99.5% of their total assets in cash or direct U.S. federal government obligations, such as U.S. Treasury bills, as well as other short-term securities backed by the full faith and credit of the U.S. federal government or issued by an agency of the U.S. federal government, (2) have a principal stability fund rating of “AAAm” by S&P or a money market fund rating of “Aaa-mf” by Moody’s as of the Closing Date and thereafter maintain any rating with either S&P or Moody’s, and (3) are permitted investments under the applicable credit for reinsurance laws and applicable PMIERs credit for reinsurance requirements.
MGIC Investment Corporation 2022 Form 10-K | 105
MGIC Investment Corporation and Subsidiaries
| | | | | | | | |
| NOTE 10 | | Other Comprehensive Income (Loss) |
The pretax components of our other comprehensive income (loss) and related income tax benefit (expense) benefit for the years ended December 31, 2017, 20162022, 2021 and 20152020 are included in table 10.1 below: below.
| | | | | | | | | | | | | | | | | | | | | | | |
| Components of other comprehensive income (loss) |
| Table | 10.1 | | | | | | |
| (In thousands) | | 2022 | | 2021 | | 2020 |
| Net unrealized investment (losses) gains arising during the period | | $ | (707,005) | | | $ | (154,555) | | | $ | 169,135 | |
| Income tax benefit (expense) | | 148,471 | | | 32,456 | | | (35,519) | |
| Net of taxes | | (558,534) | | | (122,099) | | | 133,616 | |
| | | | | | |
| Net changes in benefit plan assets and obligations | | (54,017) | | | 31,613 | | | 13,288 | |
| Income tax benefit (expense) | | 11,343 | | | (6,638) | | | (2,791) | |
| Net of taxes | | (42,674) | | | 24,975 | | | 10,497 | |
| | | | | | |
| | | | | | |
| | | | | | |
| | | | | | |
| | | | | | |
| Total other comprehensive income (loss) | | (761,022) | | | (122,942) | | | 182,423 | |
| Total income tax benefit (expense) | | 159,814 | | | 25,818 | | | (38,310) | |
| Total other comprehensive income (loss), net of tax | | $ | (601,208) | | | $ | (97,124) | | | $ | 144,113 | |
|
| | | | | | | | | | | | | | |
| | Table | 10.1 | | | | | | |
| Components of other comprehensive income (loss) | (In thousands) | | 2017 | | 2016 | | 2015 |
| Net unrealized investment gains (losses) arising during the year | | $ | 69,052 |
| | $ | (5,425 | ) | | $ | (33,718 | ) |
| Income tax (expense) benefit | | (21,505 | ) | | 1,776 |
| | 11,738 |
|
| | Valuation allowance (1) | | — |
| | — |
| | 62,383 |
|
| | Net of taxes | | 47,547 |
| | (3,649 | ) | | 40,403 |
|
| | | | | | | | |
| | Net changes in benefit plan assets and obligations | | (8,983 | ) | | (14,799 | ) | | (12,818 | ) |
| | Income tax benefit | | 3,144 |
| | 5,179 |
| | 4,487 |
|
| | Valuation allowance (1) | | — |
| | — |
| | (7,383 | ) |
| | Net of taxes | | (5,839 | ) | | (9,620 | ) | | (15,714 | ) |
| | | | | | | | |
| | Net changes in unrealized foreign currency translation adjustment | | 45 |
| | (1,463 | ) | | (5,699 | ) |
| | Income tax (expense) benefit | | (14 | ) | | 512 |
| | 2,000 |
|
| | Valuation allowance (1) | | — |
| | — |
| | (529 | ) |
| | Net of taxes | | 31 |
| | (951 | ) | | (4,228 | ) |
| | | | | | | | |
| | Total other comprehensive income (loss) | | 60,114 |
| | (21,687 | ) | | (52,235 | ) |
| | Total income tax (expense) benefit, net of valuation allowance | | (18,375 | ) | | 7,467 |
| | 72,696 |
|
| | Total other comprehensive income (loss), net of tax | | $ | 41,739 |
| | $ | (14,220 | ) | | $ | 20,461 |
|
The pretax and related income tax benefit (expense) components of the amounts reclassified from our accumulated other comprehensive loss ("AOCL"income (loss) ( "AOCI") to our consolidated statements of operations for the years endedDecember 31, 2017, 20162022, 2021 and 20152020 are included in table 10.2 below: below.
| | | | | | | | | | | | | | | | | | | | | | | |
| Reclassifications from Accumulated Other Comprehensive Income (Loss) |
| Table | 10.2 | | | | | | |
| (In thousands) | | 2022 | | 2021 | | 2020 |
Reclassification adjustment for net realized (losses) gains (1) | | $ | (9,860) | | | $ | 10,455 | | | $ | 13,862 | |
| Income tax benefit (expense) | | 2,070 | | | (2,195) | | | (2,912) | |
| Net of taxes | | (7,790) | | | 8,260 | | | 10,950 | |
| | | | | | |
Reclassification adjustment related to benefit plan assets and obligations (2) | (16,750) | | | (9,779) | | | (15,968) | |
| Income tax benefit (expense) | | 3,518 | | | 2,053 | | | 3,353 | |
| Net of taxes | | (13,232) | | | (7,726) | | | (12,615) | |
| | | | | | |
| | | | | | |
| | | | | | |
| | | | | | |
| | | | | | |
| Total reclassifications | | (26,610) | | | 676 | | | (2,106) | |
| Income tax benefit (expense) | | 5,588 | | | (142) | | | 441 | |
| Total reclassifications, net of tax | | $ | (21,022) | | | $ | 534 | | | $ | (1,665) | |
(1)(Decreases) increases Net gains (losses) on investments and other financial instruments on the consolidated statements of operations.
(2)Decreases (increases) Other underwriting and operating expenses, net on the consolidated statements of operations.
|
| | | | | | | | | | | | | | |
| | Table | 10.2 | | | | | | |
| Reclassifications from AOCL | (In thousands) | | 2017 | | 2016 | | 2015 |
Reclassification adjustment for net realized (losses) gains included in net income (1) | | $ | (2,580 | ) | | $ | 6,207 |
| | $ | 11,693 |
|
| | Income tax benefit (expense) | | 903 |
| | (2,050 | ) | | (4,076 | ) |
| | Valuation allowance (2) | | — |
| | — |
| | 3,635 |
|
| | Net of taxes | | (1,677 | ) | | 4,157 |
| | 11,252 |
|
| | | | | | | | |
| | Reclassification adjustment related to benefit plan assets and obligations (3) | 906 |
| | 1,480 |
| | 2,184 |
|
| | Income tax (expense) | | (317 | ) | | (518 | ) | | (764 | ) |
| | Valuation allowance (2) | | — |
| | — |
| | 574 |
|
| | Net of taxes | | 589 |
| | 962 |
| | 1,994 |
|
| | | | | | | | |
| | Reclassification adjustment related to foreign currency (4) | | — |
| | 1,467 |
| | — |
|
| | Income tax (expense) | | — |
| | (513 | ) | | — |
|
| | Net of taxes | | — |
| | 954 |
| | — |
|
| | | | | | | | |
| | Total reclassifications | | (1,674 | ) | | 9,154 |
| | 13,877 |
|
| | Total income tax benefit (expense), net of valuation allowance | | 586 |
| | (3,081 | ) | | (631 | ) |
| | Total reclassifications, net of tax | | $ | (1,088 | ) | | $ | 6,073 |
| | $ | 13,246 |
|
MGIC Investment Corporation 20172022 Form 10-K | 133106
MGIC Investment Corporation and Subsidiaries
A roll-forward of AOCI for the years ended December 31, 2022, 2021, and 2020, including amounts reclassified from AOCI, is included in table 10.3 below.
| | | | | | | | | | | | | | | | | | | | | | | | | |
| Roll-forward of Accumulated Other Comprehensive Income (Loss) |
| Table | 10.3 | | | | | | | | |
| (In thousands) | | Net unrealized gains and losses on available-for-sale securities | | Net benefit plan assets and obligations recognized in shareholders' equity | | | | Total AOCI |
| Balance, December 31, 2019, net of tax | | $ | 138,521 | | | $ | (65,813) | | | | | $ | 72,708 | |
| Other comprehensive income (loss) before reclassifications | | 144,566 | | | (2,118) | | | | | 142,448 | |
| Less: Amounts reclassified from AOCI | | 10,950 | | | (12,615) | | | | | (1,665) | |
| Balance, December 31, 2020, net of tax | | 272,137 | | | (55,316) | | | | | 216,821 | |
| Other comprehensive income (loss) before reclassifications | | (113,839) | | | 17,249 | | | | | (96,590) | |
| Less: Amounts reclassified from AOCI | | 8,260 | | | (7,726) | | | | | 534 | |
| Balance, December 31, 2021, net of tax | | 150,038 | | | (30,341) | | | | | 119,697 | |
| Other comprehensive income (loss) before reclassifications | | (566,324) | | | (55,906) | | | | | (622,230) | |
| Less: Amounts reclassified from AOCI | | (7,790) | | | (13,232) | | | | | (21,022) | |
| Balance, December 31, 2022, net of tax | | $ | (408,496) | | | $ | (73,015) | | | | | $ | (481,511) | |
MGIC Investment Corporation 2022 Form 10-K | 107
MGIC Investment Corporation and Subsidiaries
|
| | | | | | | | | | | | | | | |
Consolidated Financial Statements and NotesNOTE 11 |
MGIC Investment Corporation
2017 Form 10-K
|
Notes (continued)Benefit Plans |
| |
(1)
| (Decreases) increases Net realized investment gains on the consolidated statements of operations. |
| |
(3)
| Decreases (increases) Other underwriting and operating expenses, net on the consolidated statements of operations. |
| |
(4)
| Increases (decreases) Other revenue on the consolidated statements of operations. |
A rollforward of AOCL for the years ended December 31, 2017, 2016, and 2015, including amounts reclassified from AOCL, is included in table 10.3 below.
|
| | | | | | | | | | | | | | | | | | |
| | Table | 10.3 | | | | | | | | |
| Rollforward of AOCL | (In thousands) | | Net unrealized gains and losses on available-for-sale securities | | Net benefit plan assets and obligations recognized in shareholders' equity | | Net unrealized foreign currency translation | | Total AOCL |
| | Balance, December 31, 2014, net of tax | | $ | (57,551 | ) | | $ | (28,938 | ) | | $ | 5,148 |
| | $ | (81,341 | ) |
| | Other comprehensive income (loss) before reclassifications | | 51,655 |
| | (13,720 | ) | | (4,228 | ) | | 33,707 |
|
| | Less: Amounts reclassified from AOCL | | 11,252 |
| | 1,994 |
| | — |
| | 13,246 |
|
| | Balance, December 31, 2015, net of tax | | (17,148 | ) | | (44,652 | ) | | 920 |
| | (60,880 | ) |
| | Other comprehensive income (loss) before reclassifications | | 508 |
| | (8,658 | ) | | 3 |
| | (8,147 | ) |
| | Less: Amounts reclassified from AOCL | | 4,157 |
| | 962 |
| | 954 |
| | 6,073 |
|
| | Balance, December 31, 2016, net of tax | | (20,797 | ) | | (54,272 | ) | | (31 | ) | | (75,100 | ) |
| | Other comprehensive income (loss) before reclassifications | | 45,870 |
| | (5,250 | ) | | 31 |
| | 40,651 |
|
| | Less: Amounts reclassified from AOCL | | (1,677 | ) | | 589 |
| | — |
| | (1,088 | ) |
| | Less: Amounts reclassified for lower enacted corporate tax rate | | (2,525 | ) | | 12,947 |
| | — |
| | 10,422 |
|
| | Balance, December 31, 2017, net of tax | | $ | 29,275 |
| | $ | (73,058 | ) | | $ | — |
| | (43,783 | ) |
MGIC Investment Corporation 2017 Form 10-K | 134
|
| | | | | | | | | | | | | | | |
Consolidated Financial Statements and Notes |
MGIC Investment Corporation
2017 Form 10-K
|
Notes (continued) |
Note 11. Benefit Plans
We have a non-contributory defined benefit pension plan covering substantially all domestic employees, as well as a supplemental executive retirement plan. Effective January 1, 2023, these plans are frozen (no future benefits will be accrued for participants due to employment and no new participants will be added). Participants in these plans are fully vested in their benefits as of December 31, 2022. We also offer both medical and dental benefits for retired domestic employees, and their eligible spouses and dependents under a postretirement benefit plan. The following tables 11.1,, 11.2,, and 11.3 provide the components of aggregate annual net periodic benefit cost for each of the years ended December 31, 2017, 2016,2022, 2021, and 20152020 and changes in the benefit obligation and the funded status of the pension, supplemental executive retirement and other postretirement benefit plans as recognized in the consolidated balance sheets as of December 31, 20172022 and 2016.2021.
| | | | | | | | | | | | | | | | | | | | | | | | | | | | | | | | | | | | | | | | | |
| Components of net periodic benefit cost |
| Table | 11.1 | | | | | | | | | | | | |
| | | Pension and Supplemental Executive Retirement Plans | | Other Postretirement Benefits |
| (In thousands) | | 12/31/2022 | | 12/31/2021 | | 12/31/2020 | | 12/31/2022 | | 12/31/2021 | | 12/31/2020 |
| Company Service Cost | | $ | 7,153 | | | $ | 7,569 | | | $ | 7,342 | | | $ | 1,307 | | | $ | 1,508 | | | $ | 1,263 | |
| Interest Cost | | 12,461 | | | 11,276 | | | 13,036 | | | 694 | | | 648 | | | 832 | |
| Expected Return on Assets | | (18,064) | | | (20,657) | | | (22,139) | | | (10,502) | | | (8,863) | | | (7,407) | |
| | | | | | | | | | | | |
| | | | | | | | | | | | |
| Amortization of: | | | | | | | | | | | | |
| Net Transition Obligation/(Asset) | | — | | | — | | | — | | | — | | | — | | | — | |
| Net Prior Service Cost/(Credit) | | (163) | | | (239) | | | (247) | | | 489 | | | 213 | | | 51 | |
| Net Losses/(Gains) | | 5,726 | | | 5,490 | | | 6,578 | | | (3,103) | | | (1,697) | | | (783) | |
| | | | | | | | | | | | |
| | | | | | | | | | | | |
| Cost of Settlements and Curtailments | | 13,801 | | | 6,012 | | | 10,369 | | | — | | | — | | | — | |
| Net Periodic Benefit Cost | | $ | 20,914 | | | $ | 9,451 | | | $ | 14,939 | | | $ | (11,115) | | | $ | (8,191) | | | $ | (6,044) | |
|
| | | | | | | | | | | | | | | | | | | | | | | | | | |
| | Table | 11.1 | | | | | | | | | | | | |
| Components of net periodic benefit cost | | | Pension and Supplemental Executive Retirement Plans | | Other Postretirement Benefits |
| (in thousands) | | 12/31/2017 | | 12/31/2016 | | 12/31/2015 | | 12/31/2017 | | 12/31/2016 | | 12/31/2015 |
| | 1. Company Service Cost | | $ | 9,556 |
| | $ | 9,130 |
| | $ | 10,256 |
| | $ | 813 |
| | $ | 751 |
| | $ | 833 |
|
| | 2. Interest Cost | | 15,475 |
| | 15,906 |
| | 15,847 |
| | 706 |
| | 704 |
| | 697 |
|
| | 3. Expected Return on Assets | | (20,099 | ) | | (19,508 | ) | | (21,109 | ) | | (5,248 | ) | | (4,886 | ) | | (4,991 | ) |
| | 4. Other Adjustments | | — |
| | — |
| | — |
| | — |
| | — |
| | — |
|
| | Subtotal | | 4,932 |
| | 5,528 |
| | 4,994 |
| | (3,729 | ) | | (3,431 | ) | | (3,461 | ) |
| | 5. Amortization of: | | |
| | |
| | |
| | |
| | |
| | |
|
| | a. Net Transition Obligation/(Asset) | | — |
| | — |
| | — |
| | — |
| | — |
| | — |
|
| | b. Net Prior Service Cost/(Credit) | | (426 | ) | | (687 | ) | | (845 | ) | | (6,649 | ) | | (6,649 | ) | | (6,649 | ) |
| | c. Net Losses/(Gains) | | 6,169 |
| | 5,856 |
| | 5,485 |
| | — |
| | — |
| | (175 | ) |
| | Total Amortization | | 5,743 |
| | 5,169 |
| | 4,640 |
| | (6,649 | ) | | (6,649 | ) | | (6,824 | ) |
| | 6. Net Periodic Benefit Cost | | 10,675 |
| | 10,697 |
| | 9,634 |
| | (10,378 | ) | | (10,080 | ) | | (10,285 | ) |
| | 7. Cost of settlements | | — |
| | 1,277 |
| | 3,172 |
| | — |
| | — |
| | — |
|
| | 8. Total Expense for Year | | $ | 10,675 |
| | $ | 11,974 |
| | $ | 12,806 |
| | $ | (10,378 | ) | | $ | (10,080 | ) | | $ | (10,285 | ) |
| | | | | | | | | | | | | | | | | | | | | | | | | | | | | |
| Development of funded status |
| Table | 11.2 | | | | | | | | |
| | | Pension and Supplemental Executive Retirement Plans | | Other Postretirement Benefits |
| (In thousands) | | 12/31/2022 | | 12/31/2021 | | 12/31/2022 | | 12/31/2021 |
| Actuarial Value of Benefit Obligations | | | | | | | | |
| Measurement Date | | 12/31/2022 | | 12/31/2021 | | 12/31/2022 | | 12/31/2021 |
| Accumulated Benefit Obligation | | $ | 274,975 | | | $ | 390,747 | | | $ | 29,580 | | | $ | 25,635 | |
| | | | | | | | |
| Funded Status/Asset (Liability) on the Consolidated Balance Sheet | | | | | | | | |
| Benefit Obligation | | $ | (274,975) | | | $ | (391,698) | | | $ | (29,580) | | | $ | (25,635) | |
| Plan Assets at Fair Value | | 250,674 | | | 391,555 | | | 111,154 | | | 140,839 | |
| Funded Status - Overfunded/Asset | | N/A | | N/A | | $ | 81,574 | | | $ | 115,204 | |
| Funded Status - Underfunded/Liability | | (24,301) | | | (143) | | | N/A | | N/A |
| | | | | | | | | | | | | | | | | | | | | | | | | | | | | |
| Accumulated other comprehensive (income) loss |
| Table | 11.3 | | | | | | | | |
| | | Pension and Supplemental Executive Retirement Plans | | Other Postretirement Benefits |
| (In thousands) | | 12/31/2022 | | 12/31/2021 | | 12/31/2022 | | 12/31/2021 |
| Net Actuarial (Gain)/Loss | | $ | 89,711 | | | $ | 84,045 | | | $ | (13,781) | | | $ | (47,352) | |
| Net Prior Service Cost/(Credit) | | 3,245 | | | (747) | | | 13,249 | | | 2,461 | |
| Net Transition Obligation/(Asset) | | — | | | — | | | — | | | — | |
| Total at Year End | | $ | 92,956 | | | $ | 83,298 | | | $ | (532) | | | $ | (44,891) | |
|
| | | | | | | | | | | | | | | | | | |
| | Table | 11.2 | | | | | | | | |
| Development of funded status | | | Pension and Supplemental Executive Retirement Plans | | Other Postretirement Benefits |
| | (in thousands) | | 12/31/2017 | | 12/31/2016 | | 12/31/2017 | | 12/31/2016 |
| | Actuarial Value of Benefit Obligations | | | | | | | | |
| | 1. Measurement Date | | 12/31/2017 |
| | 12/31/2016 |
| | 12/31/2017 |
| | 12/31/2016 |
|
| | 2. Accumulated Benefit Obligation | | $ | 411,996 |
| | $ | 360,423 |
| | $ | 24,716 |
| | $ | 17,378 |
|
| | | | | | | | | | |
| | Funded Status/Asset (Liability) on the Consolidated Balance Sheet | | | | | | | | |
| | 1. Projected Benefit Obligation | | $ | (417,770 | ) | | $ | (369,808 | ) | | $ | (24,716 | ) | | $ | (17,378 | ) |
| | 2. Plan Assets at Fair Value | | 401,142 |
| | 360,900 |
| | 85,303 |
| | 70,408 |
|
| | 3. Funded Status - Overfunded/Asset | | N/A |
| | N/A |
| | $ | 60,587 |
| | $ | 53,030 |
|
| | 4. Funded Status - Underfunded/Liability | | (16,628 | ) | | (8,908 | ) | | N/A |
| | N/A |
|
|
| | | | | | | | | | | | | | | | | | |
| | Table | 11.3 | | | | | | | | |
| Accumulated other comprehensive income (loss) | | | Pension and Supplemental Executive Retirement Plans | | Other Postretirement Benefits |
| (in thousands) | | 12/31/2017 | | 12/31/2016 | | 12/31/2017 | | 12/31/2016 |
| 1. Net Actuarial (Gain)/Loss | | $ | 109,904 |
| | $ | 103,861 |
| | $ | (10,234 | ) | | $ | (6,088 | ) |
| | 2. Net Prior Service Cost/(Credit) | | (1,850 | ) | | (2,286 | ) | | (5,342 | ) | | (11,991 | ) |
| | 3. Net Transition Obligation/(Asset) | | — |
| | — |
| | — |
| | — |
|
| | 4. Total at Year End | | $ | 108,054 |
| | $ | 101,575 |
| | $ | (15,576 | ) | | $ | (18,079 | ) |
MGIC Investment Corporation 2017 Form 10-K | 135
|
| | | | | | | | | | | | | | | |
Consolidated Financial Statements and Notes |
MGIC Investment Corporation
2017 Form 10-K
|
Notes (continued) |
The amortization of gains and losses resulting from differences in actual experience different from assumed experience or changes in assumptions including discount rates is included as a component of Net Periodic Benefit Cost/(Income) for the year. The gain or loss in excess of a 10% corridor is amortized by the average remaining life expectancy for the pension and supplemental executive retirement plans and by the average remaining service period of participating employees expected to receive benefits under the other postretirement benefits plan.
MGIC Investment Corporation 2022 Form 10-K | 108
MGIC Investment Corporation and Subsidiaries
Table 11.4 shows the changes in the projected benefit obligation for 2017the years ended December 31, 2022 and 2016.2021.
| | | | | | | | | | | | | | | | | | | | | | | | | | | | | |
| Change in projected benefit / accumulated benefit |
| Table | 11.4 | | | | | | | | |
| | | Pension and Supplemental Executive Retirement Plans | | Other Postretirement Benefits |
| (In thousands) | | 12/31/2022 | | 12/31/2021 | | 12/31/2022 | | 12/31/2021 |
| Benefit Obligation at Beginning of Year | | $ | 391,698 | | | $ | 423,713 | | | $ | 25,635 | | | $ | 28,714 | |
| Company Service Cost | | 7,153 | | | 7,569 | | | 1,307 | | | 1,508 | |
| Interest Cost | | 12,461 | | | 11,276 | | | 694 | | | 648 | |
| Plan Participants' Contributions | | — | | | — | | | 463 | | | 456 | |
| Net Actuarial (Gain)/Loss | | (83,240) | | | (10,018) | | | (8,123) | | | (3,574) | |
| Benefit Payments from Fund | | (13,165) | | | (12,866) | | | (1,504) | | | (1,963) | |
| Benefit Payments Paid Directly by Company | | (114) | | | (362) | | | — | | | — | |
| Plan Amendments | | 3,247 | | | 2 | | | 11,278 | | | — | |
| Curtailments | | (352) | | | — | | | — | | | — | |
Settlement Payments from Fund (1) | | (42,713) | | | (27,616) | | | — | | | — | |
| Other Adjustment | | — | | | — | | | (170) | | | (154) | |
| Benefit Obligation at End of Year | | $ | 274,975 | | | $ | 391,698 | | | $ | 29,580 | | | $ | 25,635 | |
|
| | | | | | | | | | | | | | | | | | |
| | Table | 11.4 | | | | | | | | |
| Change in projected benefit / accumulated benefit obligation | | | Pension and Supplemental Executive Retirement Plans | | Other Postretirement Benefits |
| (in thousands) | | 12/31/2017 | | 12/31/2016 | | 12/31/2017 | | 12/31/2016 |
| 1. Benefit Obligation at Beginning of Year | | $ | 369,808 |
| | $ | 349,483 |
| | $ | 17,378 |
| | $ | 16,423 |
|
| | 2. Company Service Cost | | 9,556 |
| | 9,130 |
| | 813 |
| | 751 |
|
| | 3. Interest Cost | | 15,475 |
| | 15,906 |
| | 706 |
| | 704 |
|
| | 4. Plan Participants' Contributions | | — |
| | — |
| | 395 |
| | 408 |
|
| | 5. Net Actuarial (Gain)/Loss due to Assumption Changes | | 38,496 |
| | 14,450 |
| | 5,981 |
| | 497 |
|
| | 6. Net Actuarial (Gain)/Loss due to Plan Experience | | 2,338 |
| | 5,428 |
| | 924 |
| | 357 |
|
| | 7. Benefit Payments from Fund (1) | | (17,578 | ) | | (21,831 | ) | | (1,404 | ) | | (1,678 | ) |
| | 8. Benefit Payments Directly by Company | | (335 | ) | | (2,669 | ) | | — |
| | — |
|
| | 9. Plan Amendments | | 10 |
| | 16 |
| | — |
| | — |
|
| | 10. Other Adjustment | | — |
| | (105 | ) | | (77 | ) | | (84 | ) |
| | 11. Benefit Obligation at End of Year | | $ | 417,770 |
| | $ | 369,808 |
| | $ | 24,716 |
| | $ | 17,378 |
|
| |
(1)
| Includes lump sum payments of $6.3 million and $11.2 million in 2017 and 2016, respectively, from our pension plan to eligible participants, which were former employees with vested benefits.
|
(1)Represents lump sum payments from our pension plan to eligible participants, who were former employees with vested benefits.
The increase in ouractuarial gains for 2022 and 2021, reported above, for the pension and supplemental executive retirement plans obligation in 2017 compared to 2016 wasand the other postretirement benefits plan were primarily due to a decreasean increase in the discount rate used to calculate the obligation and a lower amount of benefits paid from the fund.obligations. The increase in our other postretirement plan obligation was primarily due a decrease in the discount rate usedincreased to calculate the obligation.5.60% at December 31, 2022 from 3.05% at December 31, 2021. See Table 11.8 below includes11.7 for the actuarial assumptions used to calculate the benefit obligations of our plans for 20172022 and 2016.2021.
Tables 11.5 and 11.6 shows the changes in the fair value of the net assets available for plan benefits and changes in other comprehensive income (loss) during 2017for the years ended December 31, 2022 and 2016.2021.
| | | | | | | | | | | | | | | | | | | | | | | | | | | | | |
| Change in plan assets |
| Table | 11.5 | | | | | | | | |
| | | Pension and Supplemental Executive Retirement Plans | | Other Postretirement Benefits |
| (In thousands) | | 12/31/2022 | | 12/31/2021 | | 12/31/2022 | | 12/31/2021 |
| Fair Value of Plan Assets at Beginning of Year | | $ | 391,555 | | | $ | 411,245 | | | $ | 140,839 | | | $ | 119,024 | |
| Actual Return on Assets | | (91,303) | | | 13,992 | | | (28,088) | | | 23,773 | |
| Company Contributions | | 6,414 | | | 7,162 | | | — | | | — | |
| Plan Participants' Contributions | | — | | | — | | | 463 | | | 456 | |
| Benefit Payments from Fund | | (13,165) | | | (12,866) | | | (1,504) | | | (1,963) | |
| Benefit Payments Paid Directly by Company | | (114) | | | (362) | | | — | | | — | |
| Settlement Payments from Fund | | (42,713) | | | (27,616) | | | — | | | — | |
| Other Adjustment | | — | | | — | | | (556) | | | (451) | |
| Fair Value of Plan Assets at End of Year | | $ | 250,674 | | | $ | 391,555 | | | $ | 111,154 | | | $ | 140,839 | |
| | | | | | | | | |
| Change in accumulated other comprehensive income (loss) ("AOCI") | | | | | | |
| Table | 11.6 | | | | | | | | |
| | | Pension and Supplemental Executive Retirement Plans | | Other Postretirement Benefits |
| (In thousands) | | 12/31/2022 | | 12/31/2021 | | 12/31/2022 | | 12/31/2021 |
| AOCI in Prior Year | | $ | 83,298 | | | $ | 97,911 | | | $ | (44,891) | | | $ | (27,892) | |
| Increase/(Decrease) in AOCI | | | | | | | | |
| Recognized during year - Prior Service (Cost)/Credit | | 745 | | | 239 | | | (489) | | | (213) | |
| Recognized during year - Net Actuarial (Losses)/Gains | | (20,109) | | | (11,502) | | | 3,103 | | | 1,697 | |
| Occurring during year - Prior Service Cost | | 3,247 | | | 2 | | | 11,277 | | | — | |
| Occurring during year - Net Actuarial Losses/(Gains) | | 25,775 | | | (3,352) | | | 30,468 | | | (18,483) | |
| | | | | | | | |
| | | | | | | | |
| AOCI in Current Year | | $ | 92,956 | | | $ | 83,298 | | | $ | (532) | | | $ | (44,891) | |
|
| | | | | | | | | | | | | | | | | | |
| | Table | 11.5 | | | | | | | | |
| Change in plan assets | | | Pension and Supplemental Executive Retirement Plans | | Other Postretirement Benefits |
| | (in thousands) | | 12/31/2017 | | 12/31/2016 | | 12/31/2017 | | 12/31/2016 |
| | 1. Fair Value of Plan Assets at Beginning of Year | | $ | 360,900 |
| | $ | 350,107 |
| | $ | 70,408 |
| | $ | 65,568 |
|
| | 2. Company Contributions | | 9,435 |
| | 11,369 |
| | — |
| | — |
|
| | 3. Plan Participants' Contributions | | — |
| | — |
| | 395 |
| | 408 |
|
| | 4. Benefit Payments from Fund | | (17,578 | ) | | (21,831 | ) | | (1,404 | ) | | (1,678 | ) |
| | 5. Benefit Payments paid directly by Company | | (335 | ) | | (2,669 | ) | | — |
| | — |
|
| | 6. Actual Return on Assets | | 48,720 |
| | 23,924 |
| | 16,299 |
| | 6,518 |
|
| | 7. Other Adjustment | | — |
| | — |
| | (395 | ) | | (408 | ) |
| | 8. Fair Value of Plan Assets at End of Year | | $ | 401,142 |
| | $ | 360,900 |
| | $ | 85,303 |
| | $ | 70,408 |
|
MGIC Investment Corporation 20172022 Form 10-K | 136109
MGIC Investment Corporation and Subsidiaries |
| | | | | | | | | | | | | | | |
Consolidated Financial Statements and Notes |
MGIC Investment Corporation
2017 Form 10-K
|
Notes (continued) |
|
| | | | | | | | | | | | | | | | | | |
| | Table | 11.6 | | | | | | | | |
| Change in accumulated other comprehensive income (loss) ("AOCI") | | | Pension and Supplemental Executive Retirement Plans | | Other Postretirement Benefits |
| (in thousands) | | 12/31/2017 | | 12/31/2016 | | 12/31/2017 | | 12/31/2016 |
| 1. AOCI in Prior Year | | $ | 101,575 |
| | $ | 92,647 |
| | $ | (18,079 | ) | | $ | (23,951 | ) |
| 2. Increase/(Decrease) in AOCI | | |
| | |
| | |
| | |
|
| | a. Recognized during year - Prior Service (Cost)/Credit | | 426 |
| | 687 |
| | 6,649 |
| | 6,649 |
|
| | b. Recognized during year - Net Actuarial (Losses)/Gains | | (6,169 | ) | | (5,856 | ) | | — |
| | — |
|
| | c. Occurring during year - Prior Service Cost | | 10 |
| | 16 |
| | — |
| | — |
|
| | d. Occurring during year - Net Actuarial Losses/(Gains) | | 12,212 |
| | 15,358 |
| | (4,146 | ) | | (777 | ) |
| | e. Occurring during year - Net Settlement Losses/(Gains) | | — |
| | (1,277 | ) | | — |
| | — |
|
| | f. Other adjustments | | — |
| | — |
| | — |
| | — |
|
| | 3. AOCI in Current Year | | $ | 108,054 |
| | $ | 101,575 |
| | $ | (15,576 | ) | | $ | (18,079 | ) |
Table 11.7 shows the amount of amortization on components of net periodic benefit costs expected to be recognized during the year ending December 31, 2018.
|
| | | | | | | | | | |
| | Table | 11.7 | | | | |
| Amortization expected to be recognized during next fiscal year ending | | | Pension and Supplemental Executive Retirement Plans | | Other Postretirement Benefits |
| (In thousands) | | 12/31/2018 | | 12/31/2018 |
| 1. Amortization of Net Transition Obligation/(Asset) | | $ | — |
| | $ | — |
|
| | 2. Amortization of Prior Service Cost/(Credit) | | (349 | ) | | (4,104 | ) |
| | 3. Amortization of Net Losses/(Gains) | | 7,140 |
| | (183 | ) |
The projected benefit obligations, net periodic benefit costs and accumulated postretirement benefit obligation for the plans were determined using the following weighted average assumptions.
| | | | | | | | | | | | | | | | | | | | | | | | | | | | | |
| Actuarial assumptions |
| Table | 11.7 | | | | | | | | |
| | | Pension and Supplemental Executive Retirement Plans | | Other Postretirement Benefits |
| | | 12/31/2022 | | 12/31/2021 | | 12/31/2022 | | 12/31/2021 |
| Weighted-Average Assumptions Used to Determine | | | | | | | | |
| Benefit Obligations at year end | | | | | | | | |
| 1. Discount Rate | | 5.60 | % | | 3.05 | % | | 5.60 | % | | 2.85 | % |
| 2. Rate of Compensation Increase | | 3.00 | % | | 3.00 | % | | N/A | | N/A |
| 3. Cash balance interest crediting rate | | 3.97 | % | | 2.80 | % | | N/A | | N/A |
| | | | | | | | |
| Weighted-Average Assumptions Used to Determine | | | | | | | | |
| Net Periodic Benefit Cost for Year | | | | | | | | |
| 1. Discount Rate | | 3.70 | % | | 2.80 | % | | 2.85 | % | | 2.35 | % |
| 2. Expected Long-term Return on Plan Assets | | 5.25 | % | | 5.25 | % | | 7.50 | % | | 7.50 | % |
| 3. Rate of Compensation Increase | | 3.00 | % | | 3.00 | % | | N/A | | N/A |
| | | | | | | | |
| Assumed Health Care Cost Trend Rates at year end | | | | | | | | |
| 1. Health Care Cost Trend Rate Assumed for Next Year | | N/A | | N/A | | 7.00 | % | | 6.50 | % |
| 2. Rate to Which the Cost Trend Rate is Assumed to Decline (Ultimate Trend Rate) | | N/A | | N/A | | 5.00 | % | | 5.00 | % |
| 3. Year That the Rate Reaches the Ultimate Trend Rate | | N/A | | N/A | | 2031 | | 2028 |
|
| | | | | | | | | | | | | | |
| | Table | 11.8 | | | | | | | | |
| Actuarial assumptions | | | Pension and Supplemental Executive Retirement Plans | | Other Postretirement Benefits |
| | | | 12/31/2017 | | 12/31/2016 | | 12/31/2017 | | 12/31/2016 |
| | Weighted-Average Assumptions Used to Determine | | | | | | | | |
| | Benefit Obligations at year end | | | | | | | | |
| | 1. Discount Rate | | 3.75 | % | | 4.30 | % | | 3.55 | % | | 3.95 | % |
| | 2. Rate of Compensation Increase | | 3.00 | % | | 3.00 | % | | N/A |
| | N/A |
|
| | | | | | | | | | |
| | Weighted-Average Assumptions Used to Determine | | |
| | |
| | |
| | |
|
| | Net Periodic Benefit Cost for Year | | |
| | |
| | |
| | |
|
| | 1. Discount Rate | | 4.30 | % | | 4.65 | % | | 3.95 | % | | 4.30 | % |
| | 2. Expected Long-term Return on Plan Assets | | 5.75 | % | | 5.75 | % | | 7.50 | % | | 7.50 | % |
| | 3. Rate of Compensation Increase | | 3.00 | % | | 3.00 | % | | N/A |
| | N/A |
|
| | | | | | | | | | |
| | Assumed Health Care Cost Trend Rates at year end | | |
| | |
| | |
| | |
|
| | 1. Health Care Cost Trend Rate Assumed for Next Year | | N/A |
| | N/A |
| | 6.50 | % | | 6.50 | % |
| | 2. Rate to Which the Cost Trend Rate is Assumed to Decline (Ultimate Trend Rate) | | N/A |
| | N/A |
| | 5.00 | % | | 5.00 | % |
| | 3. Year That the Rate Reaches the Ultimate Trend Rate | | N/A |
| | N/A |
| | 2024 |
| | 2020 |
|
In selecting a discount rate, we performed a hypothetical cash flow bond matching exercise, matching our expected pension plan and postretirement medical plan cash flows, respectively, against a selected portfolio of high quality corporate bonds. The modeling was performed using a bond portfolio of noncallable bonds with at least $50 million outstanding. The average yield of these hypothetical bond portfolios was used as the
MGIC Investment Corporation 2017 Form 10-K | 137
|
| | | | | | | | | | | | | | | |
Consolidated Financial Statements and Notes |
MGIC Investment Corporation
2017 Form 10-K
|
Notes (continued) |
benchmark for determining the discount rate. In selecting the expected long-term rate of return on assets, we considered the average rate of earnings expected on the classes of funds invested or to be invested to provide for the benefits of these plans. This included considering the trusts' targeted asset allocation for the year and the expected returns likely to be earned over the next 20 years.
The year-end asset allocations of the plans are shown in table 11.911.8 below.
| | | | | | | | | | | | | | | | | | | | | | | | | | | | | |
| Plan assets |
| Table | 11.8 | | | | | | | | |
| | | Pension Plan | | Other Postretirement Benefits |
| | | 12/31/2022 | | 12/31/2021 | | 12/31/2022 | | 12/31/2021 |
| Equity Securities | | 20 | % | | 21 | % | | 100 | % | | 100 | % |
| Debt Securities | | 80 | % | | 79 | % | | — | % | | — | % |
| Total | | 100 | % | | 100 | % | | 100 | % | | 100 | % |
|
| | | | | | | | | | | | | | |
| | Table | 11.9 | | | | | | | | |
| Plan assets | | | Pension Plan | | Other Postretirement Benefits |
| | | | 12/31/2017 | | 12/31/2016 | | 12/31/2017 | | 12/31/2016 |
| | 1. Equity Securities | | 21 | % | | 23 | % | | 100 | % | | 100 | % |
| | 2. Debt Securities | | 79 | % | | 77 | % | | — | % | | — | % |
| | 3. Total | | 100 | % | | 100 | % | | 100 | % | | 100 | % |
In accordance with fairFair value guidance, we applied the followingis disclosed using a fair value hierarchy in orderthat prioritizes the inputs to valuation techniques used to measure fair value of our benefitas described in Note 6 - "Fair Value Measurements".
The following describes the valuation methodologies used for pension plan assets:and other postretirement benefits plan assets at fair value.
•Domestic Mutual Funds: Securities are priced at the net asset value ("NAV"), which is the closing price published by the mutual fund on the reporting date. These financial assets are categorized as Level 1 – Quoted pricesin the fair value hierarchy.
•U.S. Government Securities: See Note 6 - "Fair Value Measurements" for identical instruments in active markets that we can access. Financial assets utilizing Level 1 inputs include equity securities, mutual funds, money market funds, certaina discussion of the valuation methodologies for U.S. Treasury Securities and Obligations of U.S. Government Corporations and Agencies. •Foreign Debt: These financial assets are represented by corporate debt securities issued by entities domiciled outside of the United States. See Note 6 - "Fair Value Measurements" for a discussion of the valuation methodologies for Corporate Debt.
MGIC Investment Corporation 2022 Form 10-K | 110
MGIC Investment Corporation and exchange traded funds ("ETFs").Subsidiaries
Level 2 – Quoted prices for similar instruments in active markets; quoted prices for identical or similar instruments in markets that•Pooled Equity Accounts: Pooled Equity Account assets are not active; and inputs, other than quoted prices, that are observable inrepresented by the marketplace forunits held by the instrument.plan. The observable inputs are used in valuation models to calculateredemption value is determined based on the NAV of the underlying units. The NAV is derived from the aggregate fair value of the instruments. Financial assets utilizing Level 2 inputs include certain municipal, corporate and foreign bonds, obligations of U.S. government corporations and agencies, and pooled equity accounts.
To determine the fair value of securities in Level 1 and Level 2underlying investments less any liabilities as of the fair value hierarchy, independent pricing sources have been utilized. One price is provided per security based on observable market data. To ensure securitiesreporting date. These financial assets are appropriately classifiedcategorized as Level 2 in the fair value hierarchy, we review the pricing techniques and methodologies of the independent pricing sources and believe that their policies adequately consider market activity, either based on specific transactions for the issue valued or based on modeling of securities with similar credit quality, duration, yield and structure that were recently traded. A variety of inputs are utilized by the independent pricing sources including benchmark yields, reported trades, non-binding broker/dealer quotes, issuer spreads, two sided markets, benchmark securities, bids, offers and reference data including market research publications. Inputs may be weighted differently for any security, and not all inputs are used for each security evaluation. Market indicators, industry and economic events are also considered. This information is evaluated using a multidimensional pricing model. In addition, on a quarterly basis, we perform quality controls over values received from the pricing source (the “Trustee”) which include comparing values to other independent pricing sources. In addition, we review annually the Trustee’s auditor’s report on internal controls in order to determine that their controls around valuing securities are operating effectively. We have not made any adjustments to the prices obtained from the independent sources.hierarchy.
MGIC Investment Corporation 2017 Form 10-K | 138
|
| | | | | | | | | | | | | | | |
Consolidated Financial Statements and Notes |
MGIC Investment Corporation
2017 Form 10-K
|
Notes (continued) |
Tables 11.10a11.9a and 11.10b11.9b set forth by level, within the fair value hierarchy, the pension plan assets and related accrued investment income at fair value as of December 31, 20172022 and 2016.2021. There were no securities that utilizedused Level 3 inputs.
| | | | | | | | | | | | | | | | | | | | | | | |
| Pension plan assets at fair value as of December 31, 2022 |
| Table | 11.9a | | | | | | |
| (In thousands) | | Level 1 | | Level 2 | | Total |
| Domestic mutual funds | | $ | 67 | | | $ | — | | | $ | 67 | |
| U.S. government securities | | 13,328 | | | — | | | 13,328 | |
| Corporate debt securities | | | | | | |
| Corporate debt securities and other | | — | | | 146,854 | | | 146,854 | |
| Non-government foreign debt securities | | — | | | 20,793 | | | 20,793 | |
| Municipal bonds | | — | | | 18,336 | | | 18,336 | |
| Pooled equity accounts | | — | | | 51,296 | | | 51,296 | |
| Total Assets at fair value | | $ | 13,395 | | | $ | 237,279 | | | $ | 250,674 | |
|
| | | | | | | | | | | | | | |
| | Table | 11.10a | | | | | | |
| Pension plan - current year | Assets at fair value as of December 31, 2017 |
| (in thousands) | | Level 1 | | Level 2 | | Total |
| | Domestic Mutual Funds | | $ | 1,006 |
| | $ | — |
| | $ | 1,006 |
|
| | Corporate Bonds | | — |
| | 202,840 |
| | 202,840 |
|
| | U.S. Government Securities | | 17,996 |
| | 1,400 |
| | 19,396 |
|
| | Municipal Bonds | | — |
| | 62,293 |
| | 62,293 |
|
| | Foreign Bonds | | — |
| | 32,949 |
| | 32,949 |
|
| | ETFs | | 5,734 |
| | — |
| | 5,734 |
|
| | Pooled Equity Accounts | | — |
| | 76,924 |
| | 76,924 |
|
| | Total Assets at fair value | | $ | 24,736 |
| | $ | 376,406 |
| | $ | 401,142 |
|
| | | | | | | | | | | | | | | | | | | | | | | |
| Pension plan assets at fair value as of December 31, 2021 |
| Table | 11.9b | | | | | | |
| (In thousands) | | Level 1 | | Level 2 | | Total |
| Domestic mutual funds | | $ | 4,071 | | | $ | — | | | $ | 4,071 | |
| U.S. government securities | | 32,947 | | | — | | | 32,947 | |
| Corporate debt Securities | | | | | | |
| Corporate debt securities and other | | — | | | 221,033 | | | 221,033 | |
| Non-government foreign debt securities | | — | | | 34,103 | | | 34,103 | |
| Municipal bonds | | — | | | 20,093 | | | 20,093 | |
| Pooled equity accounts | | — | | | 79,308 | | | 79,308 | |
| Total Assets at fair value | | $ | 37,018 | | | $ | 354,537 | | | $ | 391,555 | |
|
| | | | | | | | | | | | | | |
| | Table | 11.10b | | | | | | |
| Pension plan - prior year | Assets at fair value as of December 31, 2016 |
| (in thousands) | | Level 1 | | Level 2 | | Total |
| | Domestic Mutual Funds | | $ | 11,805 |
| | $ | — |
| | $ | 11,805 |
|
| | Corporate Bonds | | — |
| | 178,412 |
| | 178,412 |
|
| | U.S. Government Securities | | 6,761 |
| | 354 |
| | 7,115 |
|
| | Municipal Bonds | | — |
| | 63,492 |
| | 63,492 |
|
| | Foreign Bonds | | — |
| | 27,917 |
| | 27,917 |
|
| | ETFs | | 5,694 |
| | — |
| | 5,694 |
|
| | Pooled Equity Accounts | | — |
| | 66,465 |
| | 66,465 |
|
| | Total Assets at fair value | | $ | 24,260 |
| | $ | 336,640 |
| | $ | 360,900 |
|
The pension plan has implemented a strategy to reduce risk through the use of a targeted funded ratio. The liability driven component is key to the asset allocation. The liability driven component seeks to align the duration of the fixed income asset allocation with the expected duration of the plan liabilities or benefit payments. Overall asset allocation is dynamic and specifies target allocation weights and ranges based on the funded status.
An improvement in funded status results in the de-risking of the portfolio, allocating more funds to fixed income and less to equity. A decline in funded status would result in a higher allocation to equity. The maximum equity allocation is 40%.
MGIC Investment Corporation 2022 Form 10-K | 111
MGIC Investment Corporation and Subsidiaries
The equity investments utilizeuse combinations of mutual funds, ETFs, and pooled equity account structures focused on the following strategies:
|
| | | | | | | | | | | | | | | | |
| Strategy | | Objective | | Investment types |
| Return seeking growth | | Funded ratio improvement over the long term | | ● | Global quality growth |
| | ● | Global low volatility |
| Return seeking bridge | | Downside protection in the event of a declining equity market | | ● | Enduring asset |
| | ● | Durable company |
The fixed income objective is to preserve capital and to provide monthly cash flows for the payment of plan liabilities. Fixed income investments can include government, government agency, corporate, mortgage-backed, asset-backed, and municipal securities, and other classes of bonds. The duration of the fixed income portfolio has an objective of being within one year of the duration of the accumulated benefit obligation. The fixed income investments have an objective of a weighted average credit of A3/A-/A- by Moody’s, S&P, and Fitch, respectively.
MGIC Investment Corporation 2017 Form 10-K | 139
|
| | | | | | | | | | | | | | | |
Consolidated Financial Statements and Notes |
MGIC Investment Corporation
2017 Form 10-K
|
Notes (continued) |
Tables 11.11a11.10a and 11.11b11.10b set forth the other postretirement benefits plan assets at fair value as of December 31, 20172022 and 2016.2021. All are Level 1 assets.
| | | | | | | | | | | |
| Other postretirement benefits plan assets at fair value as of December 31, 2022 |
| Table | 11.10a | | |
| (In thousands) | | Level 1 |
| Domestic Mutual Funds | | $ | 89,584 | |
| International Mutual Funds | | 21,570 | |
| Total Assets at fair value | | $ | 111,154 | |
|
| | | | | | | | | | |
| | Table | 11.11a | | | | |
| Other postretirement benefits plan - current year | Assets at fair value as of December 31, 2017 |
| (in thousands) | | Level 1 | | Total |
| Domestic Mutual Funds | | $ | 64,489 |
| | $ | 64,489 |
|
| | International Mutual Funds | | 20,814 |
| | 20,814 |
|
| | Total Assets at fair value | | $ | 85,303 |
| | $ | 85,303 |
|
| | | | | | | | | | | |
| Other postretirement benefits plan assets at fair value as of December 31, 2021 |
| Table | 11.10b | | |
| (In thousands) | | Level 1 |
| Domestic Mutual Funds | | $ | 112,770 | |
| International Mutual Funds | | 28,069 | |
| Total Assets at fair value | | $ | 140,839 | |
|
| | | | | | | | | | |
| | Table | 11.11b | | | | |
| Other postretirement benefits plan - prior year | Assets at fair value as of December 31, 2016 |
| (in thousands) | | Level 1 | | Total |
| Domestic Mutual Funds | | $ | 54,426 |
| | $ | 54,426 |
|
| | International Mutual Funds | | 15,982 |
| | 15,982 |
|
| | Total Assets at fair value | | $ | 70,408 |
| | $ | 70,408 |
|
Our postretirement plan portfolio is designed to achieve the following objectives over each market cycle and for at least 5 years:
è Total return should exceed growth in the Consumer Price Index by 5.75% annually
èAchieve competitive investment results
The primary focus in developing asset allocation ranges for the portfolio is the assessment of the portfolio's investment objectives and the level of risk that is acceptable to obtain those objectives. To achieve these objectives the minimum and maximum allocation ranges for fixed income securities and equity securities are:
| | | | | | | | | | | |
| | Minimum | | Maximum |
| Equities (long only) | 70 | % | | 100 | % |
| Real estate | 0 | % | | 15 | % |
| Commodities | 0 | % | | 10 | % |
| Fixed income/Cash | 0 | % | | 10 | % |
|
| | | | | |
| | Minimum | | Maximum |
| Equities (long only) | 70 | % | | 100 | % |
| Real estate | 0 | % | | 15 | % |
| Commodities | 0 | % | | 10 | % |
| Fixed income/Cash | 0 | % | | 10 | % |
Given the long term nature of this portfolio and the lack of any immediate need for significant cash flow, it is anticipated that the equity investments will consist of growth stocks and will typically be at the higher end of the allocation ranges above.
Investment in international mutual funds is limited to a maximum of 30% of the equity range. The allocation as of December 31, 20172022 included 3%2% that was primarily invested in equity securities of emerging market countries and another 21%17% was invested in securities of companies primarily based in Europe and the Pacific Basin.
Tables 11.12 and 11.13 show the current and estimated future contributions and benefit payments.
|
| | | | | | | | | | |
| | Table | 11.12 | | | | |
| Company contributions | | | Pension and Supplemental Executive Retirement Plans | | Other Postretirement Benefits |
| | (in thousands) | | 12/31/2017 | | 12/31/2017 |
| | Company Contributions for the Year Ending: | | | | |
| | 1. Current | | $ | 9,435 |
| | $ | — |
|
| | 2. Current + 1 | | 10,950 |
| | — |
|
MGIC Investment Corporation 2017 Form 10-K | 140
|
| | | | | | | | | | | | | | | |
Consolidated Financial Statements and Notes |
MGIC Investment Corporation
2017 Form 10-K
|
Notes (continued) |
|
| | | | | | | | | | |
| | Table | 11.13 | | | | |
| Benefit payments - total | | | Pension and Supplemental Executive Retirement Plans | | Other Postretirement Benefits |
| | (in thousands) | | 12/31/2017 | | 12/31/2017 |
| | Actual Benefit Payments for the Year Ending: | | | | |
| | 1. Current | | $ | 17,913 |
| | $ | 1,086 |
|
| | Expected Benefit Payments for the Year Ending: | | |
| | |
|
| | 2. Current + 1 | | 28,639 |
| | 1,174 |
|
| | 3. Current + 2 | | 33,127 |
| | 1,368 |
|
| | 4. Current + 3 | | 29,669 |
| | 1,689 |
|
| | 5. Current + 4 | | 31,085 |
| | 1,944 |
|
| | 6. Current + 5 | | 31,899 |
| | 2,044 |
|
| | 7. Current + 6 - 10 | | 151,512 |
| | 11,914 |
|
Health care sensitivities
For measurement purposes for the other postyear ended December 31, 2022, we contributed $6.4 million to the pension and supplemental executive retirement benefitsplans. We do not expect to make a contribution to the pension plan in 2023 and distributions from the increase in health care costs is estimatedsupplemental executive retirement plan will be funded as incurred. We did not make a contribution to be 6.5% for 2017 and 2018, decreasing to 5.0% by 2024 and remaining at this level beyond.
Assumed health care cost trend rates have a significant effect on the amounts reported for the other postretirement benefits plan. A 1 percentage point changeplan in 2022 and we do not expect to make a contribution in 2023.
Expected future benefit payments from the health care trend rate assumption would have the following effects on other postretirement benefits:plans are shown in Table 11.12 below.
| | | | | | | | | | | | | | | | | |
| Expected future benefit payments |
| Table | 11.12 | | | | |
| | | Pension and Supplemental Executive Retirement Plans | | Other Postretirement Benefits |
| (In thousands) | | 12/31/2022 | | 12/31/2022 |
| | | | |
| | | | |
| | | | |
| Current + 1 | | 23,966 | | | 2,211 | |
| Current + 2 | | 23,309 | | | 2,476 | |
| Current + 3 | | 23,104 | | | 2,780 | |
| Current + 4 | | 23,363 | | | 2,886 | |
| Current + 5 | | 23,194 | | | 2,929 | |
| Current + 6 - 10 | | 102,588 | | | 16,102 | |
|
| | | | | | | | | | |
| | Table | 11.14 | | | | |
| Health care trend rate assumption | (in thousands) | | 1-Percentage Point Increase | | 1-Percentage Point Decrease |
| | Effect on total service and interest cost components | | $ | 252 |
| | $ | (217 | ) |
| | Effect on postretirement benefit obligation | | 3,093 |
| | (2,748 | ) |
Profit sharing and 401(k)PROFIT SHARING AND 401(K)
We have a profit sharing and 401(k) savings plan for employees. At the discretion of the Board of Directors, we may make a contribution to the plan of up to 5% of each participant's eligible compensation. We provide a matching 401(k) savings contribution for employees on their before-tax contributions at a rate of 80% of the first $1,000 contributed and 40% of the next $2,000 contributed. For employees hired after January 1, 2014, the match is 100% up to the first 4% contributed. We recognized expenses related to these plans of $6.0 million, $5.9 million and $5.1$7.6 million in 2017, 20162022 and 2015, respectively.$8.0 million in both 2021 and 2020. Effective January 1, 2023, we will provide a matching 401(k) savings contribution for employees of 200% up to the first 2% contributed and 100% of the next 2% contributed.
MGIC Investment Corporation 20172022 Form 10-K | 141112
MGIC Investment Corporation and Subsidiaries
|
| | | | | | | | | | | | | | | |
Consolidated Financial Statements and NotesNOTE 12 |
MGIC Investment Corporation
2017 Form 10-K
|
Notes (continued)Income Taxes |
Note 12. Income Taxes
Net deferred tax assets and liabilities(liabilities) as reported on the consolidated balance sheet as of December 31, 20172022 and 20162021 are shown in table 12.1 below. At December 31, 2021 the deferred tax liability is included as follows:a component of Other liabilities on the consolidated balance sheet.
| | | | | | | | | | | | | | | | | |
| Deferred tax assets and liabilities |
| Table | 12.1 | | | | |
| (In thousands) | | 2022 | | 2021 |
| Total deferred tax assets | | $ | 144,819 | | | $ | 32,331 | |
| Total deferred tax liabilities | | (20,050) | | | (71,743) | |
| Net deferred tax asset (liability) | | $ | 124,769 | | | $ | (39,412) | |
|
| | | | | | | | | | |
| | Table | 12.1 | | | | |
| Deferred tax assets and liabilities | (in thousands) | | 2017 | | 2016 |
| Total deferred tax assets | | $ | 258,663 |
| | $ | 636,449 |
|
| Total deferred tax liabilities | | (24,282 | ) | | (28,794 | ) |
| | Net deferred tax asset | | $ | 234,381 |
| | $ | 607,655 |
|
Table 12.2 includes the components of the net deferred tax asset (liability) as of December 31, 20172022 and 2016.2021.
| | | | | | | | | | | | | | | | | |
| Deferred tax components |
| Table | 12.2 | | | | |
| (In thousands) | | 2022 | | 2021 |
| Unearned premium reserves | | $ | 16,209 | | | $ | 19,116 | |
| Benefit plans | | (9,444) | | | (21,360) | |
| Loss reserves | | 1,785 | | | 4,034 | |
| Unrealized depreciation (appreciation) in investments | | 108,588 | | | (39,883) | |
| Deferred policy acquisition cost | | (4,003) | | | (4,551) | |
| Deferred compensation | | 6,806 | | | 6,118 | |
| Research and experimental costs | | 9,719 | | | — | |
| Other, net | | (4,891) | | | (2,886) | |
| Net deferred tax asset (liability) | | $ | 124,769 | | | $ | (39,412) | |
|
| | | | | | | | | | |
| | Table | 12.2 | | | | |
| Deferred tax components | (in thousands) | | 2017 | | 2016 |
| Unearned premium reserves | | $ | 29,196 |
| | $ | 40,153 |
|
| | Benefit plans | | (7,162 | ) | | (12,350 | ) |
| | Federal net operating loss | | 155,839 |
| | 520,812 |
|
| | Loss reserves | | 4,994 |
| | 10,883 |
|
| | Unrealized (appreciation) depreciation in investments | | (7,782 | ) | | 11,211 |
|
| | Mortgage investments | | 8,963 |
| | 17,751 |
|
| | Deferred compensation | | 7,265 |
| | 12,517 |
|
| | AMT credit carryforward | | 37,017 |
| | 2,215 |
|
| | Other, net | | 6,051 |
| | 4,463 |
|
| | Net deferred tax asset | | $ | 234,381 |
| | $ | 607,655 |
|
We review the need to maintain a deferred tax asset valuation allowance on a quarterly basis. We analyze several factors, among which are the severity and frequency of operating losses, our capacity for the carryback or carryforward of any losses, the existence and current level of taxable operating income, operating results on a three year cumulative basis, the expected occurrence of future income or loss, the expiration dates of the carryforwards, the cyclical nature of our operating results, and available tax planning strategies. Based on our analysis, we reduced our benefit from income tax through the recognition of a valuation allowance from the first quarter of 2009 through the second quarter of 2015.
In the third quarter of 2015, we concludedbelieve that it was more likely than not that ourall gross deferred tax assets would beat December 31, 2022 and 2021 are fully realizable and that theno valuation allowance was no longer necessary and we reversed the valuation allowance. For the year ended December 31, 2015, we reversed $161.1 million of our valuation allowance based on income from 2015. The portion of the valuation allowance reversed related to deferred tax assets that are expected to be realized in future years, totaling $747.5 million, is treated as a discrete period item and is recognized as a component of the tax provision in continuing operations in the period of reversal. Furthermore, in determining the discrete period impact from the reversal, we removed the prior period disproportionate tax effects that had arisen in other comprehensive income because of the valuation allowance. This reduced the amount of tax benefit included in net income and resulted in an allocation of tax benefit of $60.8 million to components of other comprehensive income.has been established.
MGIC Investment Corporation 2017 Form 10-K | 142
|
| | | | | | | | | | | | | | | |
Consolidated Financial Statements and Notes |
MGIC Investment Corporation
2017 Form 10-K
|
Notes (continued) |
Table 12.3 provides a rollforward of our deferred tax asset valuation allowance for the year ended December 31, 2015.
|
| | | | | | |
| | Table | 12.3 | | |
| Deferred tax valuation allowance rollforward | (in millions) | | For the year ended December 31, 2015 |
| Balance at December 31, 2014 | | $ | 902.3 |
|
| | | |
| | Reduction in tax provision in current year | | (161.1 | ) |
| | Amounts recorded in other comprehensive income in the current year | | 6.3 |
|
| | Change in valuation allowance for deferred tax assets in the current year | | (154.8 | ) |
| | | | |
| | Reduction in tax provision for amounts to be realized in future years | | (686.7 | ) |
| | Amounts recorded in other comprehensive income to be realized in future years | | (60.8 | ) |
| | Change in valuation allowance for deferred tax assets realizable in future years | | (747.5 | ) |
| | | | |
| | Balance at December 31, 2015 | | $ | — |
|
Table 12.4 shows the effect of the change in valuation allowance on the provision for (benefit from) income taxes for the year ended December 31, 2015.
|
| | | | | | |
| | Table | 12.4 | | |
| Provision for (benefit from) income taxes | (in thousands) | | 2015 |
| Provision for income taxes before valuation allowance | | $ | 163,497 |
|
| Change in valuation allowance | | (161,158 | ) |
| | Reversal of valuation allowance | | (686,652 | ) |
| | Benefit from income taxes | | $ | (684,313 | ) |
The change in the valuation allowance that was included in other comprehensive income was a decrease $54.5 million for the year ended December 31, 2015.
Giving full effect to the carryback of net operating losses for federal income tax purposes, we have approximately $742 million of net operating loss ("NOL") carryforwards on a regular tax basis as of December 31, 2017. Any unutilized carryforwards are scheduled to expire at the end of tax years 2032 and 2033.
Table 12.5 summarizes the components of the provision for (benefit from) income taxes:
| | | | | | | | | | | | | | | | | | | | | | | |
| Provision for (benefit from) income taxes |
| Table | 12.3 | | | | | | |
| (In thousands) | | 2022 | | 2021 | | 2020 |
| Current federal | | $ | 228,259 | | | $ | 161,055 | | | $ | 85,574 | |
| Deferred federal | | (5,235) | | | 4,392 | | | 28,244 | |
| Other | | 1,661 | | | 1,347 | | | (648) | |
| Provision for income taxes | | $ | 224,685 | | | $ | 166,794 | | | $ | 113,170 | |
|
| | | | | | | | | | | | | | |
| | Table | 12.5 | | | | | | |
| Provision for (benefit from) income taxes | (in thousands) | | 2017 | | 2016 | | 2015 |
| Current Federal | | $ | 73,348 |
| | $ | 9,470 |
| | $ | 8,067 |
|
| Deferred Federal | | 351,677 |
| | 160,657 |
| | (686,652 | ) |
| | Other | | 3,710 |
| �� | 2,070 |
| | (5,728 | ) |
| | Provision for (benefit from) income taxes | | $ | 428,735 |
| | $ | 172,197 |
| | $ | (684,313 | ) |
Our income tax expense for 2017 reflects the remeasurement of our net deferred tax assets to reflect the lower corporate tax rate of 21% under the Tax Act, effective January 1, 2018. As a result of the lower tax rate, we have recorded a decrease to our net deferred tax assets of $133 million with a corresponding increase to our deferred income tax expense for the year ended December 31, 2017.
We paid $22.0 million, $4.5 million, and $5.4 million inCurrent federal income tax payments were $236.5 million, $155.3 million, and $79.6 million in 2017, 20162022, 2021 and 2015,2020, respectively. At December 31, 2022 we owned $661.7 million of tax and loss bonds.
MGIC Investment Corporation 2017 Form 10-K | 143
|
| | | | | | | | | | | | | | | |
Consolidated Financial Statements and Notes |
MGIC Investment Corporation
2017 Form 10-K
|
Notes (continued) |
Table 12.612.4 reconciles the federal statutory income tax rate to our effective tax provision (benefit) rate.
| | | | | | | | | | | | | | | | | | | | |
| Effective tax rate reconciliation |
| Table | 12.4 | | | | | |
| | 2022 | | 2021 | | 2020 |
| Federal statutory income tax rate | 21.0 | % | | 21.0 | % | | 21.0 | % |
| | | | | |
| | | | | |
| Tax exempt municipal bond interest | (0.5) | % | | (0.6) | % | | (0.9) | % |
| Other, net | 0.1 | % | | 0.4 | % | | 0.1 | % |
| Effective tax rate | 20.6 | % | | 20.8 | % | | 20.2 | % |
|
| | | | | | | | | | |
| | Table | 12.6 | | | | | |
| Effective tax rate reconciliation | | 2017 | | 2016 | | 2015 |
| Federal statutory income tax rate | 35.0 | % | | 35.0 | % | | 35.0 | % |
| | Additional income tax provision related to the rate decrease included in the Tax Act | 17.0 | % | | — | % | | — | % |
| | Additional income tax provision related to IRS litigation | 3.7 | % | | 0.1 | % | | 0.1 | % |
| | Valuation allowance | — | % | | — | % | | (173.8 | )% |
| | Tax exempt municipal bond interest | (1.4 | )% | | (1.9 | )% | | (0.8 | )% |
| | Other, net | 0.4 | % | | 0.3 | % | | (0.8 | )% |
| | Effective tax provision (benefit) rate | 54.7 | % | | 33.5 | % | | (140.3 | )% |
As previously disclosed, the Internal Revenue Service ("IRS") completed examinations of our federal incomeWe have not recorded any uncertain tax returns for the years 2000 through 2007positions during 2022 and issued proposed assessments for taxes, interest2021 and penalties related to our treatment of the flow-through income and loss from an investment in a portfolio of residual interests of Real Estate Mortgage Investment Conduits ("REMICs"). The IRS indicated that it did not believe that, for various reasons, we had established sufficienthave no unrecognized tax basis in the REMIC residual interests to deduct the losses from taxable income. We appealed these assessments within the IRS and in August 2010, we reached a tentative settlement agreement with the IRS which was not finalized.
In 2014, we received Notices of Deficiency (commonly referred to as “90 day letters”) covering the 2000-2007 tax years. The Notices of Deficiency reflect taxes and penalties related to the REMIC matters of $197.5 million andbenefits at December 31, 2017, there would also be interest related to these matters of approximately $205.0 million. In 2007, we made a payment of $65.2 million to the United States Department of the Treasury which will reduce any amounts we would ultimately owe. The Notices of Deficiency also reflect additional amounts due of $261.4 million, which are primarily associated with the disallowance of the carryback of the 2009 net operating loss to the 2004-2007 tax years. We believe the IRS included the carryback adjustments as a precaution to keep open the statute of limitations on collection of the tax that was refunded when this loss was carried back,2022 and not because the IRS actually intends to disallow the carryback permanently. Depending on the outcome of this matter, additional state income taxes and state interest may become due when a final resolution is reached. As of December 31, 2017, those state taxes and interest would approximate $85.8 million. In addition, there could also be state tax penalties. Our total amount of unrecognized tax benefits as of December 31, 2017 is $142.8 million, which represents the tax benefits generated by the REMIC portfolio included in our tax returns that we have not taken benefit for in our financial statements, including any related interest.
We filed a petition with the U.S. Tax Court contesting most of the IRS’ proposed adjustments reflected in the Notices of Deficiency and the IRS filed an answer to our petition which continued to assert their claim. The case has twice been scheduled for trial and in each instance, the parties jointly filed, and the U.S. Tax Court approved (most recently in February 2016), motions for continuance to postpone the trial date. Also in February 2016, the U.S. Tax Court approved a joint motion to consolidate for trial, briefing, and opinion, our case with similar cases of Radian Group, Inc., as successor to Enhance Financial Services Group, Inc., et al. The parties have reached agreement on all issues in the case and in the fourth quarter of 2017, the IRS submitted documentation reflecting the terms of the agreement to the Joint Committee on Taxation ("JCT") for its review, which must be performed before a settlement can be completed. There is no assurance that a settlement will be completed. Based on information that we currently have regarding the status of our ongoing dispute, we recorded a provision for additional taxes and interest of $29.0 million in 2017.
Should a settlement not be completed, ongoing litigation to resolve our dispute with the IRS could be lengthy and costly in terms of legal fees and related expenses. We would need to make further adjustments, which could be material, to our tax provision and liabilities if our view of the probability of success in this matter changes, and the ultimate resolution of this matter could have a material negative impact on our effective tax rate, results of operations, cash flows, available assets and statutory capital. In this regard, see Note 14 - "Statutory Information."
MGIC Investment Corporation 2017 Form 10-K | 144
|
| | | | | | | | | | | | | | | |
Consolidated Financial Statements and Notes |
MGIC Investment Corporation
2017 Form 10-K
|
Notes (continued) |
Under current guidance, when evaluating a tax position for recognition and measurement, an entity shall presume that the tax position will be examined by the relevant taxing authority that has full knowledge of all relevant information. The interpretation adopts a benefit recognition model with a two-step approach, a more-likely-than-not threshold for recognition and derecognition, and a measurement attribute that is the greatest amount of benefit that is cumulatively greater than 50% likely of being realized. A reconciliation of the beginning and ending amount of unrecognized tax benefits is shown in table 12.7.
|
| | | | | | | | | | | | | | |
| | Table | 12.7 | | | | | | |
| Unrecognized tax benefits reconciliation | (in thousands) | | 2017 | | 2016 | | 2015 |
| Balance at beginning of year | | $ | 108,245 |
| | $ | 107,120 |
| | $ | 106,230 |
|
| Additions based on tax positions related to the current year | | — |
| | — |
| | — |
|
| | Additions for tax positions of prior years | | 35,003 |
| | 1,125 |
| | 890 |
|
| | Reductions for tax positions of prior years | | (427 | ) | | — |
| | — |
|
| | Settlements | | — |
| | — |
| | — |
|
| | Balance at end of year | | $ | 142,821 |
| | $ | 108,245 |
| | $ | 107,120 |
|
The total amount of the unrecognized tax benefits related to our aforementioned REMIC issue, which would affect our effective tax rate, is $129.3 million.2021. We recognize interest accrued and penalties related to unrecognized tax benefits in income taxes. During 2017, we recognized $23.1 million in interest. As of December 31, 2017 and 2016, we had $52.0 million and $28.9 million of accrued interest related to uncertain tax positions, respectively. The statute of limitations related to the consolidated federal income tax return is closed for all years prior to 2000. It is reasonably possible that our 2000-2007 federal tax case will be resolved, other than through litigation. If it is resolved under the basis of settlement as disclosed above, our total unrecognized tax benefits would be reduced by $142.8 million during 2018. After taking into account prior payments and the effect of available net operating loss carrybacks, any net cash outflows would approximate $55 million.2019.
Note 13. Shareholders' Equity
Change in accounting principle
As of January 1, 2017, we adopted the updated guidance of "Improvements to Employee Share-Based Compensation Accounting."The adoption of this guidance resulted in an immaterial cumulative effect adjustment to our 2017 beginning retained earnings. For the year ending December 31, 2017, we adopted the updated guidance of "Reclassification of Certain Tax Effects from Accumulated Other Comprehensive Income."The adoption of this guidance resulted in a $10.4 million reclassification from accumulated other comprehensive loss to retained earnings during the fourth quarter of 2017. Each of these adoptions are more fully described in Note 3 - "Significant Accounting Policies."
2017 Capital transactions
2% Notes
As described in Note 7 - "Debt" in April 2017 holders of approximately $202.5 million of the outstanding principal amount of our 2% Notes exercised their rights to convert their notes into shares of our common stock resulting in the delivery of approximately 29.1 million shares of our common stock to the holders. The transactions included the delivery of approximately 18.7 million from our treasury stock and an additional 10.4 million of newly issued shares. Shareholders' equity was increased by the carrying value of the notes at the time of conversion.
2016 Capital transactions
As described in Note 7 - "Debt," in 2016 we issued approximately 18.3 million shares of our common stock as consideration for the purchase of certain of our 2% Notes. As of December 31, 2016, we had repurchased all of the shares issued as partial consideration for our 2% Notes repurchases. The weighted average price paid for the share repurchases was $8.03, which included commissions, and the aggregate purchase amount was $147.1 million.
MGIC Investment Corporation 20172022 Form 10-K | 145113
MGIC Investment Corporation and Subsidiaries
|
| | | | | | | | | | | | | | | |
Consolidated Financial Statements and NotesNOTE 13 |
MGIC Investment Corporation
2017 Form 10-K
|
Notes (continued)Shareholders' Equity |
CHANGE IN ACCOUNTING POLICY
As describedof January 1, 2021, we adopted the updated guidance for "Accounting for Convertible Instruments and Contracts in Note 7 - "Debt" the purchasean Entity’s Own Equity”. The application of a portion of our 9% Debentures by MGIC, and corresponding elimination of the purchased 9% Debentures in consolidation,this guidance resulted in a reduction$68.3 million cumulative effect adjustment to our consolidated shareholders' equity of approximately $6.3 million as of December 31, 2016. This reduction represents the allocated portion of the consideration paid2021 beginning retained earnings and paid-in capital to reacquire the equity component ofreflect the 9% Debentures, net of tax. The reduction was recognized in paid-in capital and was less than the amount ascribed to paid-in capital at original issuance of the 9% Debentures.
Shareholders Rights Agreement
Our Amended and Restated Rights Agreement dated July 23, 2015 seeks to diminish the risk that our ability to use our NOLs to reduce potential future federal income tax obligations may become substantially limited and to deter certain abusive takeover practices. The benefit of the NOLs would be substantially limited, and the timing of the usage of the NOLs could be substantially delayed,Debenture as if we werehad always accounted for the debt as a liability in its entirety.
SHARE REPURCHASE PROGRAMS
Repurchases may be made from time to experience an “ownership change” as defined by Section 382 of the Internal Revenue Code.
Under the Agreement each outstanding share of our Common Stock is accompanied by one Right. The Distribution Date occurstime on the earlier of ten days after a public announcement that a person has become an Acquiring Person,open market (including through 10b5-1 plans) or ten business days after a person announces or begins a tender offer in which consummation of such offer would result in a person becoming an Acquiring Person. An Acquiring Person is any person that becomes, by itself or together with its affiliates and associates, a beneficial owner of 5% or more of thethrough privately negotiated transactions. In 2022, we repurchased approximately 27.8 million shares of our Common Stock then outstanding, but excludes, among others, certain exempt and grandfathered persons as defined in the Agreement. The Rights are not exercisable until the Distribution Date. Each Right will initially entitle shareholders to buy one-tenth of onecommon stock at a weighted average cost per share of $13.89, which included commissions. We may repurchase up to an additional $114 million of our Common Stockcommon stock through the end of 2023 under a share repurchase program approved by our Board of Directors in October 2021. In 2023, through February 17, we repurchased approximately 3.1 million shares of our common stock at a Purchase Priceweighted average cost per share of $45 per full share (equivalent to $4.50 for each one-tenth share), subject to adjustment. Each exercisable Right (subject to certain limitations) will entitle its holder to purchase, at the Rights’ then-current Purchase Price, a number$13.65, which included commissions.
In 2021, we repurchased approximately 19.0 million shares of our common stock at a weighted average cost per share of $15.30, which included commissions.
During 2020, we repurchased approximately 9.6 million shares of Common Stock (or if after the Shares Acquisition Date, we are acquired in a business combination,our common shares of the acquiror) having a market value at the time equal to twice the Purchase Price. The Rights will expire on August 1, 2018, or earlier as described in the Agreement. The Rights are redeemablestock at a priceweighted average cost per share of $0.001$12.47, which included commissions.
CASH DIVIDENDS
In the first and second quarters of 2022, we paid quarterly cash dividends of $0.08 per Right at any time priorshare to shareholders which totaled $51.0 million. In the time a person becomes an Acquiring Person. Other than certain amendments,third and fourth quarters of 2022, we paid quarterly cash dividends of $0.10 per share which totaled $60.7 million. On January 24, 2023, the Board of Directors may amend the Rights in any respect without the consent of thedeclared a quarterly cash dividend to holders of the Rights.company's common stock of $0.10 per share payable on March 2, 2023, to shareholders of record at the close of business on February 17, 2023.
Note 14. Statutory Information
Statutory Accounting Principles | | | | | | | | |
| NOTE 14 | | Statutory Information |
STATUTORY ACCOUNTING PRINCIPLES
The statutory financial statements of our insurance companies are presented on the basis of accounting principles prescribed, or practices permitted, by the Office of the Commissioner of Insurance of the State of Wisconsin (the "OCI"), which has adopted the National Association of Insurance Commissioners ("NAIC") Statements of Statutory Accounting Principles ("SSAP") as the basis of its statutory accounting principles. In converting from statutory to GAAP, typical adjustments include deferral of policy acquisition costs, the inclusion of net unrealized holding gains or losses in shareholders' equity relating to fixed maturitiesincome securities, and the inclusion of statutory non-admitted assets.
In addition to the typical adjustments from statutory to GAAP, mortgage insurance companies are required to maintain contingency loss reserves equal to 50% of premiums earned under SSAP and principles prescribed by the OCI, and suchOCI. Such amounts cannot be withdrawn for a period of ten years except as permitted by insurance regulations. With regulatory approval, a mortgage guaranty insurance company may make early withdrawals from the contingency reserve when incurred losses exceed 35% of net premiums earned in a calendar year. For the year ended 2017, MGIC's losses incurred were 5% of net premiums earned.2022, MGIC did not withdraw amounts from its contingency reserve. Changes in contingency loss reserves impact the statutory statement of operations. Contingency loss reserves are not reflected as liabilities under GAAP and changes in contingency loss reserves do not impact the GAAP statements of operations. A premium deficiency reserve
As a mortgage guaranty insurer, we are eligible for a tax deduction, subject to certain limitations, under Section 832(e) of the IRC for amounts required by state law or regulation to be set aside in statutory contingency reserves. The deduction is allowed only to the extent that may be recorded onwe purchase tax and loss bonds (“T&L Bonds”) in an amount equal to the tax benefit derived from deducting any portion of our statutory contingency reserves. Under statutory accounting practices, purchases of T&L Bonds are accounted for as investments. Under GAAP, purchases of T&L Bonds are accounted for as a GAAP basis whenpayment of current taxes.
The OCI recognizes only statutory accounting principles prescribed, or practices permitted, by the present valueState of expected future lossesWisconsin for determining and expenses exceedsreporting the present valuefinancial condition and results of expected future premiums and already establishedoperations of an insurance company. The OCI has adopted certain prescribed accounting practices that differ from those found in other states. Specifically, Wisconsin domiciled companies record changes in the contingency loss reserves may not be recorded onthrough the income statement as a statutory basis if the present value of expected future premiums and already establishedchange in underwriting deduction. As a result, in periods in which MGIC is increasing contingency loss reserves, and statutory contingency reserves, exceeds the present value of expected future losses and expenses. On a GAAP basis, when calculating a premium deficiencynet income is reduced.
MGIC Investment Corporation 20172022 Form 10-K | 146114
MGIC Investment Corporation and Subsidiaries |
| | | | | | | | | | | | | | | |
Consolidated Financial Statements and Notes |
MGIC Investment Corporation
2017 Form 10-K
|
Notes (continued) |
reserve policies are grouped based on how they are acquired, serviced and measured. On a statutory basis, a premium deficiency reserve is calculated on all policies in force.
The statutory net income, (loss), policyholders'policyholders’ surplus, and contingency reserve liability of theour insurance subsidiaries, of our holding companyincluding MGIC, are showshown in table 14.1 below. 14.1.
| | | | | | | | | | | | | | | | | | | | | | | |
| Statutory financial information of insurance subsidiaries |
| Table | 14.1 | | | | | | |
| | As of and for the Years Ended December 31, |
| (In thousands) | | 2022 | | 2021 | | 2020 |
| Statutory net income | | $ | 440,944 | | | $ | 295,811 | | | $ | 65,201 | |
| Statutory policyholders' surplus | | 924,977 | | | 1,220,714 | | | 1,339,509 | |
| Contingency reserve | | 4,669,724 | | | 4,126,604 | | | 3,585,864 | |
The decrease in statutory policyholders' surplus from December 31, 2021 to December 31, 2022 is primarily due to dividend payments to the parent company (discussed below), offset by statutory net loss in 2015 was driven byincome.
For the dissolution of an MGIC non-insurance subsidiary. The surplus amounts included in the following table are the combined policyholders' surplus of our insurance operations as utilized in our risk-to-capital calculations.
|
| | | | | | | | | | | | | | | |
| | Table | 14.1 | | | | | | | |
| Statutory financial information of holding company insurance subsidiaries | | | As of and for the Years Ended December 31, | |
| (in thousands) | | 2017 | | 2016 | | 2015 | |
| Statutory net income (loss) | | $ | 310,776 |
| | $ | 106,326 |
| | $ | (72,767 | ) | (1) |
| Statutory policyholders' surplus | | 1,622,115 |
| | 1,506,475 |
| | 1,608,214 |
| (1) |
| | Contingency reserve | | 1,896,701 |
| | 1,360,088 |
| | 826,706 |
| |
| |
(1)
| The dissolution of an MGIC non-insurance subsidiary in 2015 hadyears ended December 31, 2022, 2021, and 2020 there were no impact on statutory surplus as the equity value of the investment was fully reflected in surplus as an unrealized loss prior to 2015. |
The surplus contributions made to MGIC dividends paid by MGIC, andor distributions from other insurance subsidiaries to us,us. Dividends paid by MGIC are shown in table 14.2 below.
| | | | | | | | | | | | | | | | | | | | | | | |
| Surplus contributions and dividends of insurance subsidiaries |
| Table | 14.2 | | | | | | |
| | Years Ended December 31, |
| (In thousands) | | 2022 | | 2021 | | 2020 |
| | | | | | |
Dividends paid by MGIC to the parent company (1) | | $ | 800,000 | | | 400,000 | | | 390,000 | |
| | | | | | |
|
| | | | | | | | | | | | | |
| | Table | 14.2 | | | | | | | |
| Surplus contributions and dividends of insurance subsidiaries | | | Years Ended December 31, | |
| (in thousands) | | 2017 | | 2016 | | 2015 | |
| Additions to the surplus of MGIC from parent company funds | | $ | — |
| | 36,025 |
| | — |
| |
| Dividends paid by MGIC to the parent company | | $ | 140,000 |
| | 64,000 |
| | — |
| |
| | Distributions from other insurance subsidiaries to the parent company | | $ | — |
| | 52,001 |
| | 38,500 |
| |
Statutory Capital RequirementsSTATUTORY CAPITAL REQUIREMENTS
The insurance laws of 16 jurisdictions, including Wisconsin, our domiciliary state, require a mortgage insurer to maintain a minimum amount of statutory capital relative to the RIF (or a similar measure) in order for the mortgage insurer to continue to write new business. We refer to these requirements as the “State Capital Requirements” and, together with the GSE Financial Requirements, the “Financial Requirements.” While they vary among jurisdictions, the most common State Capital Requirements allow for a maximum risk-to-capital ratio of 25 to 1. A risk-to-capital ratio will increase if (i) the percentage decrease in capital exceeds the percentage decrease in insured risk, or (ii) the percentage increase in capital is less than the percentage increase in insured risk. Wisconsin does not regulate capital by using a risk-to-capital measure but instead requires a minimum policyholder position ("MPP"). TheMGIC's “policyholder position” of a mortgage insurer isincludes its net worth or surplus, and its contingency reserve and a portion of the reserves for unearned premiums.loss reserve.
At December 31, 2017,2022, MGIC’s risk-to-capital ratio was 9.510.2 to 1, below the maximum allowed by the jurisdictions with State Capital Requirements and its policyholder position was $2.1$3.5 billion above the required MPP of $1.2$2.1 billion. In calculatingThe calculation of our risk-to-capital ratio and MPP we are allowed fullreflect credit for the risk ceded under our reinsurance transaction with a group of unaffiliated reinsurers.transactions. It is possible that under the revised State Capital Requirements discussed below, MGIC will not be allowed full credit for the risk ceded to the reinsurers. If MGIC is not allowed an agreed level of credit under either the
State Capital Requirements or the financial requirements of the PMIERs, MGIC may terminate the reinsurance agreement,agreements, without penalty. At this time, we expect MGIC to continue to comply with the current State Capital Requirements; however, you should read the rest of these financial statement footnotes for information about matters that could negatively affect such compliance.
At December 31, 2017, the risk-to-capital ratio of our combined insurance operations (which includes a reinsurance affiliate) was 10.5 to 1. Reinsurance transactions with our affiliate permit MGIC to write insurance with a higher coverage percentage than it could on its own under certain state-specific requirements. A higher
MGIC Investment Corporation 2017 Form 10-K | 147
|
| | | | | | | | | | | | | | | |
Consolidated Financial Statements and Notes |
MGIC Investment Corporation
2017 Form 10-K
|
Notes (continued) |
risk-to-capital ratio on a combined basis may indicate that, in order for MGIC to continue to utilize reinsurance arrangements with its reinsurance affiliate, additional capital contributions to the affiliate could be needed.
The NAIC previously announced plans to revise the minimum capital and surplus requirements for mortgage insurersState Capital Requirements that are provided for in its Mortgage Guaranty Insurance Model Act. In May 2016,December 2019, a working group of state regulators released an exposure draft of a revised Mortgage Guaranty Insurance Model Act and a risk-based capital framework to establish capital requirements for mortgage insurers, although no date has been established by which the NAIC must propose revisions to the capital requirements and certain items havewere not yet been completely addressed by the framework, including the treatment of ceded risk and minimum capital floors, and action level triggers. Currently we believefloors. In October 2022, the NAIC working group released a revised exposure draft of the Mortgage Guaranty Insurance Model Act that does not include changes to the PMIERs contain the more restrictive capital requirements in most circumstances.
While MGIC currently meets the State Capital Requirements of Wisconsin and all other jurisdictions, it could be prevented from writing new business in the future in all jurisdictions if it fails to meet the State Capital Requirements of Wisconsin, or it could be prevented from writing new business in a particular jurisdiction if it fails to meet the State Capital Requirements of that jurisdiction and in each case MGIC does not obtain a waiver of such requirements. It is possible that regulatory action by one or more jurisdictions, including those that do not have specific State Capital Requirements, may prevent MGIC from continuing to write new insurance in such jurisdictions. If we are unable to write business in all jurisdictions, lenders may be unwilling to procure insurance from us anywhere. In addition, a lender’s assessment of the future ability of our insurance operations to meet the State Capital Requirements or the PMIERs may affect its willingness to procure insurance from us. A possible future failure by MGIC to meet the State Capital Requirements or the PMIERs will not necessarily mean that MGIC lacks sufficient resources to pay claims on its insurance liabilities. While we believe MGIC has sufficient claims paying resources to meet its claim obligations on its IIF on a timely basis, you should read the rest of these financial statement footnotes for information about matters that could negatively affect MGIC’s claims paying resources.existing Model Act.
Dividend restrictionsDIVIDEND RESTRICTIONS
In 2017, MGIC paid a total of $140 million in dividends to our holding company, and we expect MGIC to continue to pay quarterly dividends. During 2016, distributions of $52 million were paid to our holding company from other insurance subsidiaries. These distributions were completed in conjunction with the transfer of risk and the final dissolution of those insurance entities during 2016. Our holding company subsequently contributed the majority of the funds to MGIC in relation to the transfer of risk. During 2015, distributions of $38.5 million were paid to our holding company from other insurance subsidiaries.
MGIC is subject to statutory regulations as to payment of dividends. The maximum amount of dividends that MGIC may pay in any twelve-month period without regulatory approval by the OCI is the lesser of adjusted statutory net income or 10% of statutory policyholders' surplus as of the preceding calendar year end. Adjusted statutory net income is defined for this purpose to be the greater of statutory net income, net of realized investment gains, for the calendar year preceding the date of the dividend or statutory net income, net of realized investment gains, for the three calendar years preceding the date of the dividend less dividends paid within the first two of the preceding three calendar years. The OCI recognizes only statutory accounting principles prescribed, or practices permitted,maximum dividend that could be paid is reduced by the State of Wisconsin for determining and reporting the financial condition and results of operations of an insurance company. The OCI has adopted certain prescribed accounting practices that differ from those found in other states. Specifically, Wisconsin domiciled companies record changesdividends paid in the contingency reserves throughtwelve months preceding the income statement as a changedividend payment date. Before making any dividend payments in underwriting deduction. As a result, in periods in which 2023, we will notify the OCI to ensure it does not object.
MGIC is increasing contingency reserves, statutory net income is reduced. For the year ended December 31, 2017, MGIC’s statutory net income was reduced by $473 million to account for the increase in contingency reserves.Investment Corporation 2022 Form 10-K | 115
MGIC Investment Corporation and Subsidiaries
Note 15. Share-based Compensation Plans
| | | | | | | | |
| NOTE 15 | | Share-based Compensation Plans |
We have certain share-based compensation plans. Under the fair value method, compensation cost is measured at the grant date based on the fair value of the award and is recognized over the service period which generally corresponds to the vesting period. Awards under our plans generally vest over periods ranging from one to three years.years, although awards to our non-employee directors vest immediately.
MGIC Investment Corporation 2017 Form 10-K | 148
|
| | | | | | | | | | | | | | | |
Consolidated Financial Statements and Notes |
MGIC Investment Corporation
2017 Form 10-K
|
Notes (continued) |
We have an omnibus incentive plan that was adopted on April 23, 2015.2020. When the 2020 plan was adopted, no further awards could be made under our previous 2015 plan. The purpose of the 20152020 plan is to motivate and incentincentivize performance by, and to retain the services of, key employees and non-employee directors through receipt of equity-based and other incentive awards under the plan. The maximum number of shares of stock that can be awarded under the 2015 plan is 10.0 million. Awards issued under the plan that are subsequently forfeited will not count against the limit on the maximum number of shares that may be issued under the plan. The 20152020 plan provides for the award of stock options, stock appreciation rights, restricted stock and restricted stock units, as well as cash incentive awards. No awards may be granted after April 23, 20252030 under the 20152020 plan. The vesting provisions of options, restricted stock and restricted stock units are determined at the time of grant. Shares issuedAt December 31, 2022, 6.9 million shares were available for future grant under the 2015 plan will be newly issued shares.2020 plan.
The compensation cost that has been charged against income for share-based plans was $14.9$24.7 million, $11.4$17.1 million, and $11.9$13.8 million for the years ended December 31, 2017, 20162022, 2021 and 2015,2020, respectively. The related income tax benefit recognized for share-based plans was $5.2$2.1 million, $4.0$1.8 million, and $4.2$1.7 million for the years ended December 31, 2017, 2016,2022, 2021, and 2015,2020, respectively.
Table 15.1 summarizes restricted stock or restricted stock unit (collectively called “restricted stock”) activity during 2017.2022.
| | | | | | | | | | | | | | |
| Restricted stock |
| Table | 15.1 | | | |
| | Weighted Average Grant Date Fair Market Value | | Shares |
| Restricted stock outstanding at December 31, 2021 | $ | 12.88 | | | 4,146,088 | |
Granted (1) | 15.45 | | | 1,273,979 | |
| Vested | 12.35 | | | (1,549,098) | |
| Forfeited | 13.00 | | | (294,290) | |
| Restricted stock outstanding at December 31, 2022 | $ | 14.02 | | | 3,576,679 | |
|
| | | | | | | | |
| | Table | 15.1 | | | |
| | | Weighted Average Grant Date Fair Market Value | | Shares |
| | Restricted stock outstanding at December 31, 2016 | $ | 7.44 |
| | 3,146,672 |
|
| | Granted | 10.41 |
| | 1,631,744 |
|
| | Vested | 7.71 |
| | (1,409,347 | ) |
| | Forfeited | 8.43 |
| | (68,460 | ) |
| | Restricted stock outstanding at December 31, 2017 | $ | 8.78 |
| | 3,300,609 |
|
At December 31, 2017,2022, the 3.33.6 million shares of restricted stock outstanding consisted of 2.52.8 million shares that are subject to performance conditions (“performance shares”) and 0.8, 0.7 million shares that are subject only to service conditions (“time vested shares”)., and 0.1 million shares related to non-employee director shares. The weighted-average grant date fair value of restricted stock granted during 20162021 and 20152020 was $5.66$12.83 and $9.03,$13.62, respectively. The fair value of restricted stock granted is the closing price of the common stock on the New York Stock Exchange on the date of grant or previous trading day if the Exchange is closed on the date of grant. The total fair value of
restricted stock vested during 2017, 20162022, 2021 and 20152020 was $15.3$23.3 million, $12.2$15.1 million, and $17.2$20.4 million, respectively.
As of December 31, 2017,2022, there was $13.2$17.0 million of total unrecognized compensation cost related to non-vested share-based compensation agreements granted under the plans. Of this total, $9.9$12.3 million of unrecognized compensation costs relate to performance shares and $3.3$4.7 million relates to time vested shares. A portion of the unrecognized costs associated with the performance shares may or may not be recognized in future periods, depending upon whether or not the performance and service conditions are met. The cost associated with the time vested shares is expected to be recognized over a weighted-average period of 1.51.6 years.
At December 31, 2017, 6.7 million shares were available for future grant under the 2015 Omnibus Incentive Plan.
MGIC Investment Corporation 2017 Form 10-K | 149
|
| | | | | | | | | | | | | | | |
Consolidated Financial Statements and NotesNOTE 16 |
MGIC Investment Corporation
2017 Form 10-K
|
Notes (continued)Leases |
Note 16. Leases
We lease certain office space as well as data processing equipment and autos under operating leases that expire during the next fivefour years. Generally, rental payments are fixed.
Table 16.1 shows minimum the future operating lease payments as of December 31, 2017.2022.
| | | | | | | | | | | |
| Minimum future operating lease payments |
| Table | 16.1 | | |
| (In thousands) | | Amount |
| 2023 | | $ | 908 | |
| 2024 | | 831 | |
| 2025 | | 667 | |
| 2026 | | 152 | |
| 2027 and thereafter | | — | |
| Total | | $ | 2,558 | |
|
| | | | | | |
| | Table | 16.1 | | |
| Minimum future operating lease payments | (in thousands) | | Amount |
| 2018 | | $ | 808 |
|
| 2019 | | 823 |
|
| | 2020 | | 583 |
|
| | 2021 | | 48 |
|
| | 2022 and thereafter | | — |
|
| | Total | | $ | 2,262 |
|
Total rentallease expense under operating leases was $2.0$1.2 million in 2017, $2.12022, $1.3 million in 2016,2021, and $2.2$1.9 million in 2015.2020.
Note 17. MGIC Investment Corporation 2022 Form 10-K | 116
MGIC Investment Corporation and Subsidiaries
| | | | | | | | |
| NOTE 17 | | Litigation and Contingencies |
Before paying an insurance claim, generally we review the loan and servicing files to determine the appropriateness of the claim amount. When reviewing the files, we may determine that we have the right to rescind coverage or deny a claim on the loan. We referloan (both referred to insurance rescissions and denials of claims collectivelyherein as “rescissions” and variations of that term.). In addition, our insurance policies generally provide that we can reduce or deny a claim if the servicer did not comply with its obligations under our insurance policy. We call suchpolicy (such reduction of claims “curtailments.” In recent quarters, an immaterial percentage of claims received in a quarter have been resolved by rescissions. In 2016 and 2017, curtailments reduced our average claim paid by approximately 5.5% and 5.6%, respectively.
Our loss reserving methodology incorporates our estimates of future rescissions, curtailments, and reversals of rescissions and curtailments. A variance between ultimate actual rescission, curtailment, and reversal rates and our estimates,referred to as a result of the outcome of litigation, settlements or other factors, could materially affect our losses."curtailment").
When the insured disputes our right to rescind coverage or curtail claims, we generally engage in discussions in an attempt to settle the dispute. If we are unable to reach a settlement, the outcome of a dispute ultimately wouldmay be determined by legal proceedings.
Under ASC 450-20, until a liabilityloss associated with settlement discussions or legal proceedings becomes probable and can be reasonably estimated, we consider our claim payment or rescission resolved for financial reporting purposes and do not accrue an estimated loss. WhereWhen we have determineddetermine that a loss is probable and can be reasonably estimated, we have recordedrecord our best estimate of our probable loss. IfIn those cases, until settlement negotiations or legal proceedings are concluded (including the receipt of any necessary GSE approvals), it is possible that we will record an additional loss.
We have been named as a third-party defendant in a lawsuit that involves refunds of mortgage insurance premiums under the Homeowners Protection Act. We are not able to implement settlements we consider probable, we intend to defend MGIC vigorously against any related legal proceedings.
In addition to matters formonitoring litigation addressing similar issues in which we have recordednot been named a probable loss,defendant. We are unable to assess the potential impact of any such litigation at this time. In addition, from time to time, we are involved in other discussions and/or proceedings with insureds with respect to our claims paying practices. Although it is reasonably possible that when these matters are resolved we will not prevail in all cases, we are unable to make a reasonable estimate or range of estimates of the potential liability. We estimate the maximum exposure associated with matters where a loss is reasonably possible to be approximately $285 million, although we believe (but can give no assurance that) we will ultimately resolve these matters for significantly less than this amount. This estimate of our maximum exposure does not include interest or consequential or exemplary damages.
MGIC Investment Corporation 2017 Form 10-K | 150
|
| | | | | | | | | | | | | | | |
Consolidated Financial Statementsdisputes and Notes |
MGIC Investment Corporation
2017 Form 10-K
|
Notes (continued) |
Mortgage insurers, including MGIC, have been involved in litigation and regulatory actions related to alleged violations of the anti-referral fee provisions of the Real Estate Settlement Procedures Act, which is commonly known as RESPA, and the notice provisions of the Fair Credit Reporting Act, which is commonly known as FCRA.
While these proceedings in the aggregate have not resulted in material liability for MGIC, there can be no assurance that the outcome of future proceedings, if any, under these laws would not have a material adverse affect on us. In addition, various regulators, including the CFPB, state insurance commissioners and state attorneys general may bring other actions seeking various forms of relief in connection with alleged violations of RESPA. The insurance law provisions of many states prohibit paying for the referral of insurance business and provide various mechanisms to enforce this prohibition. While we believe our practices are in conformity with applicable laws and regulations, it is not possible to predict the eventual scope, duration or outcome of any such reviews or investigations nor is it possible to predict their effect on us or the mortgage insurance industry.
Through a non-insurance subsidiary, we utilize our underwriting skills to provide an outsourced underwriting service to our customers known as contract underwriting. As part of the contract underwriting activities, that subsidiary is responsible for the quality of the underwriting decisions in accordance with the terms of the contract underwriting agreements with customers. That subsidiary may be required to provide certain remedies to its customers if certain standards relating to the quality of our underwriting work are not met, and we have an established reserve for such future obligations. Claims for remedies may be made a number of years after the underwriting work was performed. The related contract underwriting remedy expense for the years ended December 31, 2017, 2016, and 2015, respectively, was immaterial to our consolidated financial statements.
In addition to the matters described above, we are involved in other legal proceedings in the ordinary course of business. In our opinion, based on the facts known at this time, the ultimate resolution of these ordinary course disputes and legal proceedings will not have a material adverse effect on our financial position or consolidated results of operations.
MGIC Investment Corporation 20172022 Form 10-K | 151
|
| | | | | | | | | | | | | | | |
Consolidated Financial Statements and Notes |
MGIC Investment Corporation
2017 Form 10-K
|
Notes (continued) |
Note 18. Unaudited Quarterly Financial Data
|
| | | | | | | | | | | | | | | | | | | | | | |
| | Table: | 18.1a | | | | | | | | | | |
| Unaudited quarterly financial data - current year | 2017: | | Quarter | | Full |
| (in thousands, except per share data) | | First | | Second | | Third | | Fourth | | Year |
| Net premiums earned | | $ | 229,103 |
| | $ | 231,136 |
| | $ | 237,083 |
| | $ | 237,425 |
| | $ | 934,747 |
|
| | Investment income, net of expenses | | 29,477 |
| | 29,716 |
| | 30,402 |
| | 31,276 |
| | 120,871 |
|
| | Realized (losses) gains | | (122 | ) | | (42 | ) | | (47 | ) | | 460 |
| | 249 |
|
| | Other revenue | | 2,422 |
| | 2,502 |
| | 2,922 |
| | 2,341 |
| | 10,187 |
|
| | Loss incurred, net | | 27,619 |
| | 27,339 |
| | 29,747 |
| | (30,996 | ) | | 53,709 |
|
| | Underwriting and other expenses, net | | 59,304 |
| | 55,292 |
| | 56,146 |
| | 57,042 |
| | 227,784 |
|
| | Loss on debt extinguishment | | — |
| | 65 |
| | — |
| | — |
| | 65 |
|
| | Provision for income tax | | 84,159 |
| | 61,994 |
| | 64,440 |
| | 218,142 |
| | 428,735 |
|
| | Net income | | 89,798 |
| | 118,622 |
| | 120,027 |
| | 27,314 |
| | 355,761 |
|
| | Income per share (a) (b): | | |
| | |
| | |
| | |
| | |
|
| | Basic | | 0.26 |
| | 0.32 |
| | 0.32 |
| | 0.07 |
| | 0.98 |
|
| | Diluted | | 0.24 |
| | 0.31 |
| | 0.32 |
| | 0.07 |
| | 0.95 |
|
|
| | | | | | | | | | | | | | | | | | | | | | |
| | Table: | 18.1b | | | | | | | | | | |
| Unaudited quarterly financial data - prior year | 2016: | | Quarter | | Full |
| (in thousands, except per share data) | | First | | Second | | Third | | Fourth | | Year |
| Net premiums earned | | $ | 221,341 |
| | $ | 231,456 |
| | $ | 237,376 |
| | $ | 235,053 |
| | $ | 925,226 |
|
| | Investment income, net of expenses | | 27,809 |
| | 27,248 |
| | 27,515 |
| | 28,094 |
| | 110,666 |
|
| | Realized gains (losses) | | 3,056 |
| | 836 |
| | 5,092 |
| | (52 | ) | | 8,932 |
|
| | Other revenue | | 6,373 |
| | 3,994 |
| | 3,867 |
| | 3,425 |
| | 17,659 |
|
| | Loss incurred, net | | 85,012 |
| | 46,590 |
| | 60,897 |
| | 47,658 |
| | 240,157 |
|
| | Underwriting and other expenses, net | | 56,439 |
| | 49,837 |
| | 53,981 |
| | 56,824 |
| | 217,081 |
|
| | Loss on debt extinguishment | | 13,440 |
| | 1,868 |
| | 75,223 |
| | — |
| | 90,531 |
|
| | Provision for income tax | | 34,497 |
| | 56,018 |
| | 27,131 |
| | 54,551 |
| | 172,197 |
|
| | Net income | | 69,191 |
| | 109,221 |
| | 56,618 |
| | 107,487 |
| | 342,517 |
|
| | Income per share (a) (b): | | |
| | |
| | |
| | |
| | |
|
| | Basic | | 0.20 |
| | 0.32 |
| | 0.16 |
| | 0.31 |
| | 1.00 |
|
| | Diluted | | 0.17 |
| | 0.26 |
| | 0.14 |
| | 0.28 |
| | 0.86 |
|
| |
(a)
| Due to the use of weighted average shares outstanding when calculating earnings per share, the sum of the quarterly per share data may not equal the per share data for the year. |
| |
(b)
| In periods where convertible debt instruments are dilutive to earnings per share the “if-converted” method of computing diluted EPS requires an interest expense adjustment, net of tax, to net income available to shareholders. See Note 4 – “Earnings Per Share” for further discussion on our calculation of diluted EPS. |
MGIC Investment Corporation 2017 Form 10-K | 152
Report of Independent Registered Public Accounting Firm
To the Board of Directors and Shareholders of
MGIC Investment Corporation:Corporation
Opinions on the Financial Statements and Internal Control over Financial Reporting
We have audited the accompanying consolidated balance sheets of MGIC Investment Corporation and its subsidiaries (the “Company”) as of December 31, 20172022 and 2016,2021, and the related consolidated statements of operations, of comprehensive income shareholders’(loss), of shareholders' equity and of cash flows for each of the three years in the period ended December 31, 2017,2022, including the related notes and financial statement schedules listed in the index appearing under Item 15 (a)15(a)(2) (collectively referred to as the “consolidated financial statements”).We also have audited the Company's internal control over financial reporting as of December 31, 2017,2022, based on criteria established in Internal Control - Integrated Framework(2013)issued by the Committee of Sponsoring Organizations of the Treadway Commission (COSO).
In our opinion, the consolidated financial statements referred to above present fairly, in all material respects, the financial position of the Company as of December 31, 20172022 and 2016, 2021, and the results of theirits operations and theirits cash flows for each of the three years in the period ended December 31, 20172022 in conformity with accounting principles generally accepted in the United States of America. Also in our opinion, the Company maintained, in all material respects, effective internal control over financial reporting as of December 31, 2017,2022, based on criteria established in Internal Control - Integrated Framework(2013)issued by the COSO.
Basis for Opinions
The Company's management is responsible for these consolidated financial statements, for maintaining effective internal control over financial reporting, and for its assessment of the effectiveness of internal control over financial reporting, included in Management’s Report on Internal Control over Financial Reporting appearing under Item 9A. Our responsibility is to express opinions on the Company’s consolidated financial statements and on the Company's internal control over financial reporting based on our audits. We are a public accounting firm registered with the Public Company Accounting Oversight Board (United States) ("PCAOB")(PCAOB) and are required to be independent with respect to the Company in accordance with the U.S. federal securities laws and the applicable rules and regulations of the Securities and Exchange Commission and the PCAOB.
We conducted our audits in accordance with the standards of the PCAOB. Those standards require that we plan and perform the audits to obtain reasonable assurance about whether the consolidated financial statements are free of material misstatement, whether due to error or fraud, and whether effective internal control over financial reporting was maintained in all material respects.
Our audits of the consolidated financial statements included performing procedures to assess the risks of material misstatement of the consolidated financial statements, whether due to error or fraud, and performing procedures that respond to those risks. Such procedures included examining, on a test basis, evidence regarding the amounts and disclosures in the
consolidatedfinancial statements. Our audits also included evaluating the accounting principles used and significant estimates made by management, as well as evaluating the overall presentation of the consolidatedfinancial statements. Our audit of internal control over financial reporting included obtaining an understanding of internal control over financial reporting, assessing the risk that a material weakness exists, and testing and evaluating the design and operating effectiveness of internal control based on the assessed risk. Our audits also included performing such other procedures as we considered necessary in the circumstances. We believe that our audits provide a reasonable basis for our opinions.
Definition and Limitations of Internal Control over Financial Reporting
A company’s internal control over financial reporting is a process designed to provide reasonable assurance regarding the reliability of financial reporting and the preparation of financial statements for external purposes in accordance with generally accepted accounting principles. A company’s internal control over financial reporting includes those policies and procedures that (i) pertain to the maintenance of records that, in reasonable detail, accurately and fairly reflect the transactions and dispositions of the assets of the company; (ii) provide reasonable assurance that transactions are recorded as necessary to permit preparation of financial statements in accordance with generally accepted accounting principles, and that receipts and expenditures of the company are being made only in accordance with authorizations of management and directors of the company; and (iii) provide reasonable assurance regarding prevention or timely detection of unauthorized acquisition, use, or disposition of the company’s assets that could have a material effect on the financial statements.
Because of its inherent limitations, internal control over financial reporting may not prevent or detect misstatements. Also, projections of any evaluation of effectiveness to future periods are subject to the risk that controls may become inadequate because of changes in conditions, or that the degree of compliance with the policies or procedures may deteriorate.
Critical Audit Matters
The critical audit matter communicated below is a matter arising from the current period audit of the consolidated financial statements that was communicated or required to be communicated to the audit committee and that (i) relates to accounts or disclosures that are material to the consolidated financial statements and (ii) involved our especially challenging, subjective, or complex judgments. The communication of critical audit matters does not alter in any way our opinion on the consolidated financial statements, taken as a whole, and we are not, by communicating the critical audit matter below, providing a separate opinion on the critical audit matter or on the accounts or disclosures to which it relates.
Valuation of Loss Reserves – Primary Case Reserves
As described in Notes 3 and 8 to the consolidated financial statements, the Company establishes case reserves for estimated insurance losses when notices of delinquency on insured mortgage loans are received. As of December 31, 2022, the Company’s recorded loss reserves were $558 million. A significant portion of total loss reserves relate to primary case reserves established for the Company’s primary insurance business. Case reserves are established by estimating the
MGIC Investment Corporation 2022 Form 10-K | 118
number of loans in the delinquency inventory that will result in a claim payment, which is referred to as the claim rate, and further estimating the amount of the claim payment, which is referred to as claim severity. The Company’s case reserve estimates are primarily established based upon historical experience, including rescissions of policies, curtailments of claims, and loan modification activity. The conditions that affect the claim rate and claim severity include the current and future state of the domestic economy, including unemployment and the current and future strength of local housing markets; exposure on insured loans; the amount of time between delinquency and claim filing; and curtailments and rescissions.
The principal considerations for our determination that performing procedures relating to the valuation of loss reserves – primary case reserves is a critical audit matter are (i) the significant judgment by management when developing the estimate of the primary case reserves; (ii) a high degree of auditor judgment, subjectivity, and effort in performing procedures and evaluating the audit evidence relating to the claim rate and claim severity significant assumptions; and (iii) the audit effort involved the use of professionals with specialized skill and knowledge.
Addressing the matter involved performing procedures and evaluating audit evidence in connection with forming our overall opinion on the consolidated financial statements. These procedures included testing the effectiveness of controls relating to the valuation of loss reserves, including controls over the development of significant assumptions related to the claim rate and claim severity. These procedures also included, among others, the involvement of professionals with specialized skill and knowledge to assist in developing an independent estimate of the primary case reserves and comparing this independent estimate to management’s recorded primary case reserves to evaluate the reasonableness of the recorded primary case reserves. Developing the independent estimate involved testing the completeness and accuracy of data provided by management and independently developing assumptions related to the claim rate and claim severity.
/s/ PricewaterhouseCoopers LLP
Milwaukee, Wisconsin
February 23, 201822, 2023
We have served as the Company’s auditor since 1985.1985, which includes periods before the Company became subject to SEC reporting requirements.
MGIC Investment Corporation 2022 Form 10-K | 119
MGIC Investment Corporation and Subsidiaries
|
| | | | | | | | | | | | | | | |
Changes in and Disagreements with Accountants on Accounting and Financial Disclosure, Controls and Procedures, and Other Information |
MGIC Investment Corporation
2017 Form 10-K
| | | | | | | | | | | | | | | |
Item 9.
Changes in and Disagreements with Accountants on Accounting and Financial Disclosure.Disclosure
None.
Item 9A.
Controls and Procedures.Procedures
Management’s Conclusion Regarding the Effectiveness of Disclosure ControlsMANAGEMENT'S CONCLUSION REGARDING THE EFFECTIVENESS OF DISCLOSURE CONTROLS
Our management, with the participation of our principal executive officer and principal financial officer, has evaluated our disclosure controls and procedures (as defined in Rule 13a-15(e) and 15d-15(e) under the Securities Exchange Act of 1934, as amended), as of the end of the period covered by this annual report. Based on such evaluation, our principal executive officer and principal financial officer concluded that such controls and procedures were effective as of the end of such period.
Management’s Report on Internal Control Over Financial ReportingMANAGEMENT'S REPORT ON INTERNAL CONTROL OVER FINANCIAL REPORTING
Our management is responsible for establishing and maintaining adequate internal control over financial reporting (as defined in Exchange Act Rule 13a-15(f) and 15d-15(f)). Our internal control over financial reporting is designed to provide reasonable assurance regarding the reliability of financial reporting and the preparation of financial statements for external purposes in accordance with generally accepted accounting principles. Because of its inherent limitations, however, internal control over financial reporting may not prevent or detect misstatements. Also, projections of any evaluation of effectiveness to future periods are subject to the risk that controls may become inadequate because of changes in conditions, or that the degree of compliance with the policies or procedures may deteriorate.
Our management, with the participation of our principal executive officer and principal financial officer, has evaluated the effectiveness of our internal control over financial reporting using the framework in Internal Control – Integrated Framework (2013) issued by the Committee of Sponsoring Organizations of the Treadway Commission. Based on such evaluation, our management concluded that our internal control over financial reporting was effective as of December 31, 2017.2022.
PricewaterhouseCoopers LLP, an independent registered public accounting firm, has audited the consolidated financial statements and effectiveness of internal control over financial reporting as of December 31, 2017,2022, as stated in their report which appears herein.
Changes in Internal Control during the Fourth QuarterCHANGES IN INTERNAL CONTROL DURING THE FOURTH QUARTER
There wasare no changechanges in our internal control over financial reporting (as defined in Rule 13a-15(f) and Rule 15d-15(f) under the Exchange Act) that occurred during the fourth quarter of 2017ended December 31, 2022 that have materially affected, or isare reasonably likely to materially affect, our internal control over financial reporting.
Item 9B.
Other Information.Information
None.
Item 9C. Disclosure Regarding Foreign Jurisdictions that Prevent Inspections
Not Applicable.
MGIC Investment Corporation 20172022 Form 10-K | 155120
MGIC Investment Corporation and Subsidiaries
PART III
|
| | | | | | | | | | | | | | | |
Item 10. Directors, Executive Officers and Corporate Governance Executive Compensation, Security Ownership of Certain Beneficial Owners and Management and Related Stockholder Matters, Certain Relationships and Related Transactions, and Director Independence, Principal Accountant Fees and Services |
MGIC Investment Corporation
2017 Form 10-K
| | | | | | | | | | | | | | | |
| | | | | | | | | | | | | | | |
PART III
Item 10.
Directors, Executive Officers and Corporate Governance.
This information (other than on the executive officers) will be included in our Proxy Statement for the 20182023 Annual Meeting of Shareholders, and is hereby incorporated by reference, provided such Proxy Statement is filed within 120 days after December 31, 2017.2022. If not so filed, such information will be included in an amended Form 10-K filed within such 120 day period. The information on the executive officers appears at the end of Part I of this Form 10-K.
Our Code of Business Conduct and Ethics is available on our website (http://mtg.mgic.com) under the “Leadership & Governance; Documents” links. Written copies of our Code of Business Conduct and Ethics are available to any shareholder who submits a written request to our Secretary, addressed to: MGIC Investment Corporation, Secretary, P.O. Box 488, Milwaukee, WI 53201. We intend to disclose on our website any waivers and amendments to our Code of Business Conduct and Ethics that are required to be disclosed under Item 5.05 of Form 8-K.
Item 11.
Executive Compensation.Compensation
This information will be included in our Proxy Statement for the 20182023 Annual Meeting of Shareholders and is hereby incorporated by reference, provided such Proxy Statement is filed within 120 days after December 31, 2017.2022. If not so filed, such information will be included in an amended Form 10-K filed within such 120 day period.
Item 12.
Security Ownership of Certain Beneficial Owners and Management and Related Stockholder Matters.Matters
This information, other than information regarding equity compensation plans required by Item 201(d) of Regulation S-K of the Securities and Exchange Commission which appears below, will be included in our Proxy Statement for the 20182023 Annual Meeting of Shareholders, and is hereby incorporated by reference, provided such Proxy Statement is filed within 120 days after December 31, 2017.2022. If not so filed, such information will be included in an amended Form 10-K filed within such 120 day period.
The table below sets forth certain information, as of December 31, 2017,2022, about the number of securities remaining available for future issuance under our equity compensation plans. No options, warrants or rights were outstanding at that date under any compensation plan or individual compensation arrangement with us. We have no compensation plan under which our equity securities may be issued that has not been approved by shareholders. Share units or phantom shares, which have no voting power and can be settled only in cash, are not considered to be equity securities for this purpose.
|
| | | | | | | | | | |
| | (a) | | (b) | | (c) | |
| Plan Category | Number of Securities to be Issued Upon Exercise of Outstanding Options, Warrants and Rights | | Weighted Average Exercise Price of Outstanding Options, Warrants and Rights | | Number of Securities Remaining Available For Future Issuance Under Equity Compensation Plans (Excluding Securities Reflected in Column (a)) | |
| Equity compensation plans approved by security holders | 3,291,876 |
| (1) | $ | — |
| | 6,728,908 |
| (2) |
| Equity compensation plans not approved by security holders | — |
| | — |
| | — |
| |
| Total | 3,291,876 |
| (1) | $ | — |
| | 6,728,908 |
| (2) |
MGIC Investment Corporation 2017 Form 10-K | 156
|
| | | | | | | | | | | | | | | |
Directors, Executive Officers | | | | Equity compensation plans approved by security holders |
| (a) | | Number of Securities to be Issued Upon Exercise of Outstanding Options, Warrants and Corporate Governance, ExecutiveRights (1) | | 3,571,629 | |
| (b) | | Weighted Average Exercise Price of Outstanding Options, Warrants and Rights | | — | |
| (c) | | Number of Securities Remaining Available For Future Issuance Under Equity Compensation Security Ownership of Certain Beneficial Owners and Management and Related Stockholder Matters,Plans (Excluding Securities Reflected in Row (a)) (2) | | 6,935,399 | |
(1)Includes 1,237,367 restricted stock units (RSUs) granted under our 2015 Omnibus Incentive Plan (the “2015 Plan”) for which shares will be issued if certain criteria are met. Of the RSUs granted under the 2015 Plan, 1,130,159 are subject to performance conditions and the remaining RSUs are subject to service conditions. Also includes 2,334,262 RSUs granted under our 2020 Omnibus Incentive Plan for which shares will be issued in the future, provided the service conditions are met. Of the RSUs granted under the 2020 Plan, 1,700,455 are subject to performance conditions, 526,977 subject to service conditions, and the remainder are related to non-employee director restricted stock units.
(2)Reflects shares available for granting. All of these shares are available under our 2020 Plan.
Item 13. Certain Relationships and Related Transactions, and Director Independence
Principal Accountant Fees and ServicesMGIC Investment Corporation
2017 Form 10-K
| | | | | | | | | | | | | | | |
| | | | | | | | | | | | | | | |
| |
(1)
| Includes 2,770,602 restricted stock units (RSUs) granted under our 2015 Omnibus Incentive Plan (the “2015 Plan”) for which shares will be issued if certain criteria are met. Of the RSUs granted under the 2015 Plan, 2,119,423 are subject to performance conditions and the remaining RSUs are subject to service conditions. Includes 495,405 RSUs granted under our 2011 Omnibus Incentive Plan (the “2011 Plan”) for which shares will be issued if certain criteria are met. Of the RSUs granted under the 2011 Plan, 366,269 RSUs are subject to performance conditions and the remaining RSUs are subject to service conditions. Also includes 25,869 vested RSUs granted under our 2002 Stock Incentive Plan for which shares will be issued in the future. |
| |
(2)
| Reflects shares available for granting. All of these shares are available under our 2015 Plan. |
Item 13.
Certain Relationships and Related Transactions, and Director Independence.
To the extent applicable, this information will be included in our Proxy Statement for the 20182023 Annual Meeting of Shareholders, and is hereby incorporated by reference, provided such Proxy Statement is filed within 120 days after December 31, 2017.2022. If not so filed, such information will be included in an amended Form 10-K filed within such 120 day period.
MGIC Investment Corporation 2022 Form 10-K | 121
Item 14.
Principal Accountant Fees and Services.Services
This information will be included in our Proxy Statement for the 20182023 Annual Meeting of Shareholders, and is hereby incorporated by reference, provided such Proxy Statement is filed within 120 days after December 31, 2017.2022. If not so filed, such information will be included in an amended Form 10-K filed within such 120 day period.
MGIC Investment Corporation 20172022 Form 10-K | 157122
MGIC Investment Corporation and Subsidiaries
PART IV
Item 15. Exhibits and Financial Statement Schedules
(a)
|
| | | | | | | | | | | | | | | |
Exhibits and Financial Statements, Form 10-K Summary (optional) |
MGIC Investment Corporation
2017 Form 10-K
1 | | | | | | | | | | | | | | | |
| | | | | | | | | | | | | | | |
PART IV
Item 15.
Exhibits and Financial Statement Schedules.
(a)
|
| |
1. | Financial statements. The following financial statements are filed in Item 8 of this annual report: |
|
| | | | |
| Consolidated balance sheets at December 31, 20172022 and 20162021 |
| Consolidated statements of operations for each of the three years in the period ended December 31, 20172022 |
| Consolidated statements of comprehensive income for each of the three years in the period ended December 31, 20172022 |
| Consolidated statements of shareholders’ equity for each of the three years in the period ended December 31, 20172022 |
| Consolidated statements of cash flows for each of the three years in the period ended December 31, 20172022 |
| Notes to consolidated financial statements |
| Report of independent registered public accounting firm |
|
| | | | |
2.2 | Financial statement schedules. The following financial statement schedules are filed as part of this Form 10-K and appear immediately following the signature page: |
| | | | | | | | |
| | Page |
| | Page |
| Schedule I - Summary of investments, other than investments in related parties at December 31, 20172022 | |
| Schedule II - Condensed financial information of Registrant | |
| Condensed balance sheets at December 31, 20172022 and 20162021 | |
| Condensed statements of operations for each of the three years in the period ended December 31, 20172022 | |
| Condensed statements of cash flows for each of the three years in the period ended December 31, 20172022 | |
| Supplementary notes to parent company financial statements | |
| Schedule IV – Reinsurance for each of the three years in the period ended December 31, 2022 | |
| All other schedules are omitted since the required information is not present or is not present in amounts sufficient to require submission of the schedules, or because the information required is included in the consolidated financial statements and notes thereto. | |
|
| | | | |
3.3 | Exhibits. The accompanying Index to Exhibits is incorporated by reference in answer to this portion of this Item and, except as otherwise indicated in the next sentence, the Exhibits listed in such Index are filed as part of this Form 10-K. Exhibit 32 is not filed as part of this Form 10-K but accompanies this Form 10-K. |
MGIC Investment Corporation 20172022 Form 10-K | 158123
|
| | | | | | | | | | | | | | | |
Exhibits and Financial Statements, Form 10-K Summary (optional) |
MGIC Investment Corporation
2017 Form 10-K
| | | | | | | | | | | | | | | |
| | | | | | | | | | | | | | | |
INDEX TO EXHIBITS
The agreements included as exhibits to this report are included to provide information regarding their terms and are not intended to provide any other factual or disclosure information about the Company or any of its subsidiaries or the other parties to the agreements. The agreements may contain representations and warranties by each of the parties to the applicable agreement. These representations and warranties have been made solely for the benefit of the other parties to the applicable agreement and:
•should not in all instances be treated as categorical statements of fact, but rather as a way of allocating the risk to one of the parties if those statements provide to be inaccurate;
•have been qualified by disclosures that were made to the other party in connection with the negotiation of the applicable agreement, which disclosures are not necessarily reflected in the agreement;
•may apply standards of materiality in a way that is different from what may be viewed as material to you or other investors; and
•were made only as of the date of the applicable agreement or such other date or dates as may be specified in the agreement and are subject to more recent developments.
Accordingly, these representations and warranties may not describe the actual state of affairs as of the date they were made or at any other time. Additional information about the Company and its subsidiaries may be found elsewhere in this report and the Company’s other public filings, which are available without charge through the SEC’s website at http://www.sec.gov or on the Company's website. See Item 1 “Business – Website Address.”
| | | | | | | Incorporated by Reference | | | | | Incorporated by Reference |
Exhibit Number | | Description of Exhibit | | Form | | Exhibit(s) | | Filing Date | Exhibit Number | | Description of Exhibit | | Form | | Exhibit(s) | | Filing Date |
| 3.1 | | | | 10-Q | | 3.1 | | August 8, 2013 | 3.1 | | | | 10-Q | | 3.1 | | August 8, 2013 |
| 3.2 | | | | 8-K | | 3.2 | | July 28, 2017 | 3.2 | | | | 8-K | | 3.2 | | January 27, 2023 |
| 4.1 | | | | 10-Q | | 3.1 | | August 8, 2013 | 4.1 | | | | 10-Q | | 3.1 | | August 8, 2013 |
| 4.2 | | | | 8-K | | 3.2 | | July 28, 2017 | 4.2 | | | | 8-K | | 3.2 | | January 27, 2023 |
| 4.3 | | | | 8-A/A | | 4.1 | | July 24, 2015 | | | | |
| 4.4 | | | | 8-K | | 4.1 | | October 19, 2000 | 4.4 | | | | 8-K | | 4.1 | | October 19, 2000 |
| 4.6 | | | | 10-Q | | 4.6 | | May 12, 2008 | 4.6 | | | | 10-Q | | 4.6 | | May 12, 2008 |
| 4.8 | | | | 8-K | | 4.1 | | August 5, 2016 | |
| 4.1 | | 4.1 | | | | 8-K | | 4.10 | | August 12, 2020 |
| | | [We are a party to various other agreements with respect to our long-term debt. These agreements are not being filed pursuant to Reg. S-K Item 601(b) (4) (iii) (A). We hereby agree to furnish a copy of such agreements to the Commission upon its request.] | | | | | | | | | [We are a party to various other agreements with respect to our long-term debt. These agreements are not being filed pursuant to Reg. S-K Item 601(b) (4) (iii) (A). We hereby agree to furnish a copy of such agreements to the Commission upon its request.] | | | | | | |
| 10.2.4 | | | | 10-K | | 10.2.4 | | March 16, 2005 | 10.2.4 | | | | 10-K | | 10.2.4 | | March 16, 2005 |
| 10.2.5 | | | | 10-K | | 10.2.5 | | March 16, 2005 | 10.2.5 | | | | 10-K | | 10.2.5 | | March 16, 2005 |
| 10.2.14 | | | | 10-K | | 10.2.14 | | February 26, 2016 | |
| 10.2.15 | | | | 10-K | | 10.2.15 | | February 26, 2016 | |
| 10.2.16 | | | | 10-K | | 10.2.16 | | February 21, 2017 | |
| 10.2.24 | | 10.2.24 | | | | 10-K | | 10.2.24 | | February 23, 2021 |
| 10.2.25 | | 10.2.25 | | | | 10-Q | | 10.2.25 | | May 5, 2021 |
| 10.2.26 | | 10.2.26 | | | | 10-K | | 10.2.26 | | February 23, 2022 |
| 10.2.27 | | 10.2.27 | | | | 10Q | | 10.2.27 | | May 4, 2022 |
| 10.2.28 | | 10.2.28 | | | | 10K | | 10.2.28 | | February 22, 2023 |
| 10.2.29 | | 10.2.29 | | | | 10K | | 10.2.29 | | February 22, 2023 |
| 10.3.1 | | 10.3.1 | | | | 10-K | | 10.3.1 | | March 1, 2011 |
| 10.3.3 | | 10.3.3 | | | | DEF 14A | | App. A | | March 24, 2015 |
| 10.3.4 | | 10.3.4 | | | | DEF 14A | | App. C | | March 20, 2020 |
| 10.6 | | 10.6 | | | |
| 10.8 | | 10.8 | | | |
MGIC Investment Corporation 20172022 Form 10-K | 159124
| | | | | | | | | | | | | | | | | | | | | | | | | | |
| | | | | Incorporated by Reference |
Exhibit Number | | Description of Exhibit | | Form | | Exhibit(s) | | Filing Date |
| 10.11.5 | | | | 10-Q | | 10.11.5 | | May 5, 2021 |
| | | | | | | | |
| | | | | | | | |
| 23 | | | | | | | | |
| | | | | | | | |
| | | | | | | | |
| | | | | | | | |
| 99.1 | | | | 10-K | | 99.1 | | March 2, 2009 |
| 99.2 | | | | 10-K | | 99.2 | | March 2, 2009 |
| 99.7 | | | | 10-Q | | 99.7 | | May 10, 2012 |
| 99.19 | | | | 10-Q | | 99.19 | | November 7, 2014 |
| 99.25 | | | | 10-Q | | 99.25 | | May 7, 2015 |
| 99.26 | | | | 10-K | | 10.2.15 | | February 26, 2016 |
| 99.27 | | | | 10-Q | | 99.27 | | May 5, 2017 |
| 99.28 | | | | 10-Q | | 99.28 | | May 7, 2020 |
| 99.29 | | | | 10-Q | | 99.29 | | May 7, 2020 |
| 101.INS | | XBRL Instance Document | | | | | | |
| 101.SCH | | XBRL Taxonomy Extension Schema Document | | | | | | |
| 101.CAL | | XBRL Taxonomy Extension Calculation Linkbase Document | | | | | | |
| 101.DEF | | XBRL Taxonomy Extension Definition Linkbase Document | | | | | | |
| 101.LAB | | XBRL Taxonomy Extension Label Linkbase Document | | | | | | |
| 101.PRE | | XBRL Taxonomy Extension Presentation Linkbase Document | | | | | | |
| 104 | | Cover Page Interactive Data File (formatted as Inline XBRL and contained in Exhibit 101)
| | | | | | |
|
| | | | | | | | | | | | | | | |
Exhibits and Financial Statements, Form 10-K Summary (optional) |
MGIC Investment Corporation
2017 Form 10-K
* | | | | | | | | | | | | | | | |
| | | | | | | | | | | | | | | |
|
| | | | | | | | |
| | | | | Incorporated by Reference |
Exhibit Number | | Description of Exhibit | | Form | | Exhibit(s) | | Filing Date |
| 10.2.17 | | | | 10-K | | 10.2.17 | | February 21, 2017 |
| 10.2.18 | | | | | | | | |
| 10.2.19 | | | | | | | | |
| 10.3 | | | | 10-K | | 10.7 | | March 29, 2000 |
| 10.3.1 | | | | 10-K | | 10/3/2001 | | March 1, 2011 |
| 10.3.2 | | | | DEF 14A | | App. B | | March 31, 2011 |
| 10.3.3 | | | | DEF 14A | | App. A | | March 24, 2015 |
| 10.5 | | | | 10-K | | 10.10 | | March 29, 2000 |
| 10.6 | | | | | | | | |
| 10.7 | | | | 8-K | | 10.7 | | January 29, 2014 |
| 10.8 | | | | 10-K | | 10.8 | | February 27, 2015 |
| 10.9 | | MGIC Investment Corporation 1993 Restricted Stock Plan for Non-Employee Directors. [File 001‑10816] * | | 10-K | | 10.24 | | March 25, 1994 |
| 10.10 | | Two Forms of Award Agreement under MGIC Investment Corporation 1993 Restricted Stock Plan for Non-Employee Directors.* | | 10-Q | | 10.27 and 10.28 | | August 12, 1994 |
| 10.11.1 | | | | 10-K | | 10.11.1 | | February 27, 2015 |
| 10.11.2 | | | | 10-K | | 10.11.2 | | February 27, 2015 |
| 10.12 | | | | 10-K | | 10.12 | | March 1, 2013 |
| 10.16 | | | | 10-Q | | 10.2 | | May 6, 2016 |
| 12 | | | | | | | | |
| 21 | | | | | | | | |
| 23 | | | | | | | | |
| 31.1 | | | | | | | | |
| 31.2 | | | | | | | | |
| 32 | | | | | | | | |
| 99.1 | | | | 10-K | | 99.1 | | March 2, 2009 |
| 99.2 | | | | 10-K | | 99.2 | | March 2, 2009 |
| 99.7 | | | | 10-Q | | 99.7 | | May 10, 2012 |
| 99.19 | | | | 10-Q | | 99.19 | | November 7, 2014 |
| 99.25 | | | | 10-Q | | 99.3 | | May 7, 2015 |
| 99.26 | | | | 10-K | | 10.2.15 | | February 26, 2016 |
| 99.27 | | | | 10-Q | | 99.27 | | May 5, 2017 |
MGIC Investment Corporation 2017 Form 10-K | 160
|
| | | | | | | | | | | | | | | |
Exhibits and Financial Statements, Form 10-K Summary (optional) |
MGIC Investment Corporation
2017 Form 10-K
| | | | | | | | | | | | | | | |
| | | | | | | | | | | | | | | |
|
| | | | | | | | |
| | | | Incorporated by Reference |
Exhibit
Number
| | Description of Exhibit | | Form
| | Exhibit(s)
| | Filing Date
|
101.INS | | | | | | | | |
101.SCH | | XBRL Taxonomy Extension Schema Document | | | | | | |
101.CAL | | | | | | | | |
101.DEF | | | | | | | | |
101.LAB | | | | | | | | |
101.PRE | | | | | | | | |
|
| |
* | Denotes a management contract or compensatory plan. |
| ** | Certain portions of this Exhibit are redacted and covered by a confidential treatment request that has been granted. Omitted portions have been filed separately with the Securities and Exchange Commission. |
| † | Filed herewith. |
| †† | Furnished herewith. |
MGIC Investment Corporation 2022 Form 10-K | 125
Item 16.
Form 10-K Summary.Summary
Not applicable.
MGIC Investment Corporation 20172022 Form 10-K | 161126
SIGNATURES
Pursuant to the requirements of Section 13 or 15(d) of the Securities Exchange Act of 1934, the registrant has duly caused this report to be signed on its behalf by the undersigned, thereunto duly authorized, on February 23, 2018.22, 2023.
MGIC INVESTMENT CORPORATION
|
| | | | |
/s/ Patrick SinksTimothy J. Mattke | |
Patrick SinksTimothy J. Mattke | |
President, Chief Executive Officer and Director | |
Pursuant to the requirements of the Securities Exchange Act of 1934, this report has been signed below as of the date set forth above by the following persons on behalf of the registrant and in the capacities indicated.
| | | | | | | | |
/s/ Timothy J. Mattke
| /s/ Jay C. Hartzell | | Timothy J. Mattke | | Jay C. Hartzell, Director | | Chief Executive Officer and Director | | | | | | | | /s/ Timothy A. Holt | | /s/ Nathaniel H. Colson | | Timothy A. Holt, Director | | Nathaniel H. Colson | | | | Executive Vice President and | | | | Chief Financial Officer | | /s/ Jodeen A. Kozlak | | (Principal Financial Officer) | | Jodeen A. Kozlak, Director | | | | | | | | /s/ Julie K. Sperber | | /s/ Michael E. Lehman | | Julie K. Sperber | | Michael E. Lehman, Director | | Vice President, Controller and | | | | Chief Accounting Officer | | | | (Principal Accounting Officer) | | /s/ Teresita M. Lowman | | | Teresita M. Lowman | | | | | /s/ Analisa M. Allen | | | | Analisa M. Allen, Director | | /s/ Gary A. Poliner | | | Gary A. Poliner, Director | | | | | /s/ Daniel A. Arrigoni | | | | Daniel A. Arrigoni, Director | | /s/ Sheryl L. Sculley | | | Sheryl L. Sculley, Director | | | | | /s/ C. Edward Chaplin | | | | C. Edward Chaplin, Director | | /s/ Mark M. Zandi | | | Mark M. Zandi, Director | | | | | /s/ Curt S. Culver | | | | Curt S. Culver, Director | | | | | | /s/ Patrick Sinks | | /s/ Curt S. Culver | Patrick Sinks | | Curt S. Culver, Director | President, Chief Executive Officer and Director | | | | | | | | /s/ Timothy A. Holt | /s/ Timothy J. Mattke | | Timothy A. Holt, Director | Timothy J. Mattke | | | Executive Vice President and | | | Chief Financial Officer | | /s/ Kenneth M. Jastrow, II | (Principal Financial Officer) | | Kenneth M. Jastrow, II, Director | | | | | | | /s/ Julie K. Sperber | | /s/ Michael E. Lehman | Julie K. Sperber | | Michael E. Lehman, Director | Vice President, Controller and | | | Chief Accounting Officer | | | (Principal Accounting Officer) | | /s/ Melissa B. Lora | | | Melissa B. Lora, Director | | | | /s/ Daniel A. Arrigoni | | | Daniel A. Arrigoni, Director | | /s/ Gary A. Poliner | | | Gary A. Poliner, Director | | | | /s/ Cassandra C. Carr | | | Cassandra C. Carr, Director | | /s/ Mark M. Zandi | | | Mark M. Zandi, Director | | | | /s/ C. Edward Chaplin | | | C. Edward Chaplin, Director | | |
MGIC Investment Corporation 20172022 Form 10-K | 162127
MGIC INVESTMENT CORPORATION SCHEDULE I — SUMMARY OF INVESTMENTS -
OTHER THAN INVESTMENTS IN RELATED PARTIES | | | | | | | | | | | | | | | | | | | | | SCHEDULE I — Summary of investments - Other than investments in related parties - December 31, 2022
| (In thousands)
Type of Investment | | Amortized Cost | | Fair Value | | Amount at which shown in the balance sheet | | Fixed income: | | | | | | | | Bonds: | | | | | | | | U.S. Treasury securities and obligations of U.S. government corporations and agencies | | $ | 145,581 | | | $ | 135,900 | | | $ | 135,900 | | | Obligations of U.S. states and political subdivisions | | 2,400,261 | | | 2,149,054 | | | 2,149,054 | | | Foreign governments | | 4,486 | | | 3,787 | | | 3,787 | | | Public utilities | | 267,319 | | | 266,895 | | | 266,895 | | | ABS | | 126,723 | | | 120,687 | | | 120,687 | | | CLOs | | 337,656 | | | 329,832 | | | 329,832 | | | Mortgage-backed | | 481,528 | | | 435,224 | | | 435,224 | | | All other corporate debt securities | | 2,149,156 | | | 1,954,247 | | | 1,954,247 | | | Commercial paper | | 14,075 | | | 14,072 | | | 14,072 | | | Total fixed income | | 5,926,785 | | | 5,409,698 | | | 5,409,698 | | | | | | | | | | Equity securities: | | | | | | | | Common stocks: | | | | | | | | Industrial, miscellaneous and all other | | 15,924 | | | 14,140 | | | 14,140 | | | Total equity securities | | 15,924 | | | 14,140 | | | 14,140 | | | | | | | | | | Total investments | | $ | 5,942,709 | | | $ | 5,423,838 | | | $ | 5,423,838 | |
December 31, 2017
| | | | | | | | | | | | | | | | | | | | | | | | | | (In thousands)
Type of Investment | | Amortized Cost | | Fair Value | | Amount at which shown in the balance sheet | | | Fixed income: | | | | | | | | | Bonds: | | | | | | | | | United States Government and government agencies and authorities | | $ | 179,850 |
| | $ | 178,846 |
| | $ | 178,846 |
| | | States, municipalities and political subdivisions | | 2,105,063 |
| | 2,152,524 |
| | 2,152,524 |
| | | Public utilities | | 222,619 |
| | 222,806 |
| | 222,806 |
| | | Asset-backed securities | | 4,925 |
| | 4,923 |
| | 4,923 |
| | | Collateralized loan obligations | | 100,798 |
| | 101,023 |
| | 101,023 |
| | | Mortgage-backed | | 490,167 |
| | 479,161 |
| | 479,161 |
| | | All other corporate bonds | | 1,842,856 |
| | 1,844,032 |
| | 1,844,032 |
| | | Total fixed income | | 4,946,278 |
| | 4,983,315 |
| | 4,983,315 |
| | | | | | | | | | | | Equity securities: | | |
| | |
| | |
| | | Common stocks: | | |
| | |
| | |
| | | Industrial, miscellaneous and all other | | 7,223 |
| | 7,246 |
| | 7,246 |
| | | Total equity securities | | 7,223 |
| | 7,246 |
| | 7,246 |
| | | | | | | | | | | | Total investments | | $ | 4,953,501 |
| | $ | 4,990,561 |
| | $ | 4,990,561 |
|
MGIC Investment Corporation 20172022 Form 10-K | 163128
MGIC INVESTMENT CORPORATION SCHEDULE II - CONDENSED FINANCIAL INFORMATION OF REGISTRANT
CONDENSED BALANCE SHEETS
PARENT COMPANY ONLY
| | | | | | | | | | | | | | | | | | | | | | December 31, | | | (In thousands) | | 2017 | | 2016 | | | ASSETS | | | | | | | Fixed income (amortized cost, 2017 – $195,846; 2016 – $247,396) | | $ | 194,061 |
| | $ | 245,435 |
| | | Cash and cash equivalents | | 22,247 |
| | 37,666 |
| | | Investment in subsidiaries, at equity in net assets | | 3,567,034 |
| | 3,150,671 |
| | | Accounts receivable - affiliates | | 1,414 |
| | 780 |
| | | Income taxes - current and deferred | | 192,570 |
| | 289,703 |
| | | Accrued investment income | | 1,941 |
| | 1,749 |
| | | Other assets | | 1,275 |
| | 80 |
| | | Total assets | | $ | 3,980,542 |
| | $ | 3,726,084 |
| | | | | | | | | | LIABILITIES AND SHAREHOLDERS' EQUITY | | |
| | |
| | | Liabilities: | | |
| | |
| | | Senior notes | | $ | 418,560 |
| | $ | 417,406 |
| | | Convertible senior notes | | — |
| | 349,461 |
| | | Convertible junior subordinated debentures | | 389,522 |
| | 389,522 |
| | | Accrued interest | | 17,934 |
| | 20,853 |
| | | Total liabilities | | 826,016 |
| | 1,177,242 |
| | | | | | | | | | Shareholders’ equity: | | |
| | |
| | | Common stock, (one dollar par value, shares authorized 1,000,000; shares issued 2017 – 370,567; 2016 – 359,400; outstanding 2017 – 370,567; 2016 – 340,663) | | 370,567 |
| | 359,400 |
| | | Paid-in capital | | 1,850,582 |
| | 1,782,337 |
| | | Treasury stock (shares at cost 2016 – 18,737) | | — |
| | (150,359 | ) | | | Accumulated other comprehensive loss, net of tax | | (43,783 | ) | | (75,100 | ) | | | Retained earnings | | 977,160 |
| | 632,564 |
| | | Total shareholders’ equity | | 3,154,526 |
| | 2,548,842 |
| | | Total liabilities and shareholders’ equity | | $ | 3,980,542 |
| | $ | 3,726,084 |
|
| | | | | | | | | | | | | | | SCHEDULE II - Condensed Financial Information of Registrant Condensed Balance Sheets Parent Company Only | | | December 31, | | (In thousands) | | 2022 | | 2021 | | ASSETS | | | | | | Fixed income, available-for-sale, at fair value (amortized cost, 2022 – $419,751 ; 2021 – $550,324) | | $ | 407,509 | | | $ | 538,872 | | | Cash and cash equivalents | | 239,404 | | | 124,164 | | | Investment in subsidiaries, at equity in net assets | | 4,502,261 | | | 4,964,954 | | | Accounts receivable - affiliates | | 864 | | | 2,130 | | | Income taxes - current and deferred | | 167,966 | | | 242,427 | | | Accrued investment income | | 3,387 | | | 2,642 | | | Total assets | | $ | 5,321,391 | | | $ | 5,875,189 | | | | | | | | LIABILITIES AND SHAREHOLDERS' EQUITY | | | | | | Liabilities: | | | | | | Senior notes | | $ | 641,724 | | | $ | 881,508 | | | Convertible junior subordinated debentures | | 21,086 | | | 110,204 | | | Accrued interest | | 13,271 | | | 20,501 | | | Other liabilities | | 2,570 | | | 1,594 | | | Total liabilities | | 678,651 | | | 1,013,807 | | | | | | | | Shareholders’ equity: | | | | | | Common stock (one dollar par value, shares authorized 1,000,000; shares issued 2022 - 371,353; 2021 - 371,353; shares outstanding 2022 - 293,433; 2021 - 320,336) | | 371,353 | | | 371,353 | | | Paid-in capital | | 1,798,842 | | | 1,794,906 | | | Treasury stock at cost (shares 2022 - 77,920; 2021 - 51,017) | | (1,050,238) | | | (675,265) | | | Accumulated other comprehensive income, net of tax | | (481,511) | | | 119,697 | | | Retained earnings | | 4,004,294 | | | 3,250,691 | | | Total shareholders’ equity | | 4,642,740 | | | 4,861,382 | | | Total liabilities and shareholders’ equity | | $ | 5,321,391 | | | $ | 5,875,189 | |
See accompanying supplementary notes to Parent Company condensed financial statements.
MGIC Investment Corporation 20172022 Form 10-K | 164129
MGIC INVESTMENT CORPORATION SCHEDULE II - CONDENSED FINANCIAL INFORMATION OF REGISTRANT
CONDENSED STATEMENTS OF OPERATIONS
PARENT COMPANY ONLY
| | | | | | | | | | | | | | | | | | | | | | | | | | | | Years Ended December 31, | | | (In thousands) | | 2017 | | 2016 | | 2015 | | | Revenues: | | | | | | | | | Investment income, net of expenses | | $ | 3,177 |
| | $ | 3,807 |
| | $ | 7,586 |
| | | Net realized investment (losses) gains | | (13 | ) | | 646 |
| | 357 |
| | | Total revenues | | 3,164 |
| | 4,453 |
| | 7,943 |
| | | | | | | | | | | | Expenses: | | |
| | |
| | |
| | | Operating expenses | | 642 |
| | 1,409 |
| | 582 |
| | | Interest expense | | 65,972 |
| | 64,598 |
| | 68,932 |
| | | Loss on debt extinguishment | | 65 |
| | 82,234 |
| | 507 |
| | | Total expenses | | 66,679 |
| | 148,241 |
| | 70,021 |
| | | Loss before tax | | (63,515 | ) | | (143,788 | ) | | (62,078 | ) | | | Provision for (benefit from) income taxes | | 95,517 |
| | (52,575 | ) | | (125,487 | ) | | | Equity in net income of subsidiaries | | 514,793 |
| | 433,730 |
| | 1,108,591 |
| | | Net income | | 355,761 |
| | 342,517 |
| | 1,172,000 |
| | | Other comprehensive income (loss), net of tax | | 41,739 |
| | (14,220 | ) | | 20,461 |
| | | Comprehensive income | | $ | 397,500 |
| | $ | 328,297 |
| | $ | 1,192,461 |
|
| | | | | | | | | | | | | | | | | | | | | SCHEDULE II - Condensed Financial Information of Registrant Condensed Statements of Operations Parent Company Only | | | Years Ended December 31, | | (In thousands) | | 2022 | | 2021 | | 2020 | | Revenues: | | | | | | | | Investment income, net of expenses | | $ | 7,193 | | | $ | 3,850 | | | $ | 7,090 | | | Net realized investment gains (losses) | | (2,628) | | | 490 | | | 1,454 | | | Total revenues | | 4,565 | | | 4,340 | | | 8,544 | | | | | | | | | | Expenses: | | | | | | | | Operating expenses | | 1,575 | | | 1,644 | | | 719 | | | Interest expense | | 47,601 | | | 68,359 | | | 65,472 | | | Loss on debt extinguishment | | 38,870 | | | 36,914 | | | 35,033 | | | Total expenses | | 88,046 | | | 106,917 | | | 101,224 | | | Loss before tax | | (83,481) | | | (102,577) | | | (92,680) | | | (Benefit from) provision for income taxes | | (17,851) | | | (21,240) | | | (18,431) | | | Equity in net income of subsidiaries | | 930,979 | | | 716,320 | | | 520,342 | | | Net income | | 865,349 | | | 634,983 | | | 446,093 | | | Other comprehensive income (loss), net of tax | | (601,208) | | | (97,124) | | | 144,113 | | | Comprehensive income | | $ | 264,141 | | | $ | 537,859 | | | $ | 590,206 | |
See accompanying supplementary notes to Parent Company condensed financial statements.
MGIC Investment Corporation 20172022 Form 10-K | 165130
MGIC INVESTMENT CORPORATION SCHEDULE II - CONDENSED FINANCIAL INFORMATION OF REGISTRANT
CONDENSED STATEMENTS OF CASH FLOWS
PARENT COMPANY ONLY
| | | | | | | | | | | | | | | | | | | | | | | | | | | | Years Ended December 31, | | | (In thousands) | | 2017 | | 2016 | | 2015 | | | Cash flows from operating activities: | | | | | | | | | Net income | | $ | 355,761 |
| | $ | 342,517 |
| | $ | 1,172,000 |
| | | Adjustments to reconcile net income to net cash provided by (used in) operating activities: | | |
| | |
| | |
| | | Equity in net income of subsidiaries | | (514,793 | ) | | (433,730 | ) | | (1,108,591 | ) | | | Dividends received from subsidiaries | | 110,145 |
| | 64,000 |
| | 6,500 |
| | | Deferred tax benefit | | 96,741 |
| | (55,988 | ) | | (125,532 | ) | | | Loss on debt extinguishment | | 65 |
| | 82,234 |
| | 507 |
| | | Other | | 18,716 |
| | 16,722 |
| | 31,701 |
| | | Change in certain assets and liabilities: | | |
| | |
| | |
| | | Accounts receivable - affiliates | | (634 | ) | | 158 |
| | (626 | ) | | | Income taxes receivable | | 297 |
| | 3,602 |
| | (8,308 | ) | | | Accrued investment income | | (192 | ) | | 1,951 |
| | (265 | ) | | | Accrued interest | | (2,819 | ) | | 6,811 |
| | (652 | ) | | | Net cash provided by (used in) operating activities | | 63,287 |
| | 28,277 |
| | (33,266 | ) | | | Cash flows from investing activities: | | |
| | |
| | |
| | | Capital distributions from subsidiaries | | — |
| | 51,987 |
| | 32,000 |
| | | Capital contributions to subsidiaries | | — |
| | (36,025 | ) | | — |
| | | Purchase of fixed income | | (97,091 | ) | | (194,751 | ) | | (295,010 | ) | | | Sale of fixed income | | 176,960 |
| | 330,142 |
| | 386,385 |
| | | Net cash provided by investing activities | | 79,869 |
| | 151,353 |
| | 123,375 |
| | | Cash flows from financing activities: | | |
| | |
| | |
| | | Proceeds from revolving credit facility | | 150,000 |
| | — |
| | — |
| | | Repayment of revolving credit facility | | (150,000 | ) | | — |
| | — |
| | | Net proceeds from issuance of long-term debt | | — |
| | 418,094 |
| | — |
| | | Repayment of long-term debt | | — |
| | — |
| | (61,953 | ) | | | Repurchase of convertible senior notes | | (150,124 | ) | | (426,191 | ) | | (12,004 | ) | | | Repurchase of common stock | | — |
| | (147,127 | ) | | — |
| | | Payment of debt issuance costs | | (1,630 | ) | | (1,127 | ) | | — |
| | | Payment of withholding taxes related to share-based compensation net share settlement | | (6,821 | ) | | (5,030 | ) | | (7,242 | ) | | | Net cash used in financing activities | | (158,575 | ) | | (161,381 | ) | | (81,199 | ) | | | Net (decrease) increase in cash and cash equivalents | | (15,419 | ) | | 18,249 |
| | 8,910 |
| | | Cash and cash equivalents at beginning of year | | 37,666 |
| | 19,417 |
| | 10,507 |
| | | Cash and cash equivalents at end of year | | $ | 22,247 |
| | $ | 37,666 |
| | $ | 19,417 |
|
| | | | | | | | | | | | | | | | | | | | | SCHEDULE II - Condensed Financial Information of Registrant Condensed Statements of Cash Flows Parent Company Only | | | Years Ended December 31, | | (In thousands) | | 2022 | | 2021 | | 2020 | | Cash flows from operating activities: | | | | | | | | Net income | | $ | 865,349 | | | $ | 634,983 | | | $ | 446,093 | | | Adjustments to reconcile net income to net cash provided by operating activities: | | | | | | | | Equity in net income of subsidiaries | | (930,979) | | | (716,320) | | | (520,342) | | | Dividends received from subsidiaries | | 626,695 | | | 400,000 | | | 221,024 | | | Deferred tax (benefit) expense | | 119,588 | | | (21,551) | | | (18,252) | | | | | | | | | | Loss on debt extinguishment | | 38,870 | | | 36,914 | | | 35,033 | | | Other | | 33,619 | | | 29,799 | | | 19,088 | | | Change in certain assets and liabilities: | | | | | | | | Accounts receivable - affiliates | | 1,266 | | | (680) | | | 972 | | | Income taxes receivable | | (43,123) | | | (306) | | | — | | | Accrued investment income | | 931 | | | 1,118 | | | (1,262) | | | Accrued interest | | (7,230) | | | (2,503) | | | 5,076 | | | Net cash provided by operating activities | | 704,986 | | | 361,454 | | | 187,430 | | | Cash flows from investing activities: | | | | | | | | | | | | | | | | | | | | | | Purchases of investments | | (1,457) | | | (339,384) | | | (1,131,060) | | | Proceeds from sales of investments | | 287,924 | | | 556,384 | | | 812,188 | | | Net cash provided by (used in) investing activities | | 286,467 | | | 217,000 | | | (318,872) | | | Cash flows from financing activities: | | | | | | | | Proceeds from issuance of senior notes | | — | | | — | | | 640,250 | | | Purchase of senior notes | | — | | | — | | | (179,735) | | | | | | | | | | Payment of original issue discount - senior notes | | — | | | — | | | (2,969) | | | Purchase of convertible junior subordinated debentures | | (89,118) | | | (98,610) | | | (36,392) | | | Payment of original issue discount - convertible junior subordinated debentures | | — | | | — | | | (15,049) | | | Redemption of 5.75% senior notes | | (242,296) | | | — | | | — | | | Cash portion of loss on debt extinguishment | | (38,185) | | | (36,914) | | | (25,266) | | | Repurchase of common stock | | (385,573) | | | (290,818) | | | (119,997) | | | Dividends paid | | (110,947) | | | (94,219) | | | (82,061) | | | Payment of debt issuance costs | | — | | | — | | | (2,020) | | | Payment of withholding taxes related to share-based compensation net share settlement | | (10,094) | | | (6,729) | | | (8,940) | | | Net cash provided by (used in) financing activities | | (876,213) | | | (527,290) | | | 167,821 | | | Net increase (decrease) in cash and cash equivalents | | 115,240 | | | 51,164 | | | 36,379 | | | Cash and cash equivalents at beginning of year | | 124,164 | | | 73,000 | | | 36,621 | | | Cash and cash equivalents at end of year | | $ | 239,404 | | | $ | 124,164 | | | $ | 73,000 | |
See accompanying supplementary notes to Parent Company condensed financial statements.
MGIC Investment Corporation 20172022 Form 10-K | 166131
SCHEDULE II — CONDENSED FINANCIAL INFORMATION OF REGISTRANT PARENT COMPANY ONLY SUPPLEMENTARY NOTES
Note A
The accompanying Parent Company financial statements should be read in conjunction with the consolidated financial statements and notes to consolidated financial statements appearing this annual report.
Note B
Our insurance subsidiaries are subject to statutory regulations as to maintenance of policyholders’ surplus and payment of dividends. The maximum amount of dividends that the insurance subsidiaries may pay in any twelve-month period without regulatory approval by the OCI is the lesser of adjusted statutory net income or 10% of statutory policyholders’ surplus as of the preceding calendar year end. Adjusted statutory net income is defined for this purpose to be the greater of statutory net income, net of realized investment gains, for the calendar year preceding the date of the dividend or statutory net income, net of realized investment gains, for the three calendar years preceding the date of the dividend less dividends paid within the first two of the preceding three calendar years. The maximum dividend that could be paid is reduced by dividends paid in the twelve months preceding the dividend payment date.
The payment of dividends from our insurance subsidiariesMGIC is the principal source of cash inflow for MGIC Investment Corporation, our holding company, other than investment income and raising capital in the public markets. The payment of dividends by our insurance subsidiaries is restricted by insurance regulation as discussed above. MGIC is the principal source of dividend-paying capacity and, in 2017, it paid a total of $140$800 million, $400 million and $390 million in dividends in cash and fixed income securities to our holding company during 2022, 2021 and we expect MGIC to continue to pay quarterly dividends. During 2016, MGIC paid a total of $64 million in dividends to our holding company and distributions of $52 million were paid to our holding company from other insurance subsidiaries. These distributions were completed in conjunction with the transfer of risk and the final dissolution of those insurance entities during 2016. Our holding company subsequently contributed the majority of the funds, approximately $36 million, to MGIC in relation to the transfer of risk. During 2015, distributions of $38.5 million, which includes dividends of $6.5 million, were paid to the holding company from other insurance subsidiaries.2020, respectively. No contributions were made to our insurance subsidiaries in 20172022, 2021 or 2015.2020.
Note C
The senior notes and convertible junior subordinated debentures ("9% Debentures"), discussed in Note 7 – “Debt” to our consolidated financial statements, are obligations of MGIC Investment Corporation, our holding company, and not of its subsidiaries. In February 2016, MGIC purchased $132.7 million in aggregate principal of the 9% Debentures. The details of this transaction are discussed in Note 7 – “Debt” to our consolidated financial statements. The 9% Debentures owned by MGIC remain obligations of our holding company. The carrying amount outstanding of the 9% Debentures of $389.5 million is reported on the Parent Company only condensed balance sheet. For GAAP accounting purposes, the 9% Debentures owned by MGIC are eliminated in our consolidated financial statements.
MGIC Investment Corporation 20172022 Form 10-K | 167132
MGIC INVESTMENT CORPORATION SCHEDULE IV — REINSURANCE | | | | | | | | | | | | | | | | | | | | | | | | | | | | | | | | | SCHEDULE IV — Reinsurance Mortgage Insurance Premiums Earned Years Ended December 31, 2022, 2021 and 2020 | | | | | | | | | | | | | (Dollars in thousands) | | Gross Amount | | Ceded to Other Companies | | Assumed From Other Companies | | Net Amount | | Percentage of Amount Assumed to Net | | Years ended December 31, | | | | | | | | | | | | 2022 | | $ | 1,154,728 | | | $ | 156,373 | | | $ | 8,778 | | | $ | 1,007,133 | | | 0.9 | % | | 2021 | | 1,167,592 | | | 163,031 | | | 9,858 | | | 1,014,419 | | | 1.0 | % | | 2020 | | 1,199,824 | | | 188,729 | | | 10,848 | | | 1,021,943 | | | 1.1 | % |
MORTGAGE INSURANCE PREMIUMS EARNED
Years Ended December 31, 2017, 2016 and 2015
| | | | | | | | | | | | | | | | | | | | | | | | | | | | | | | | | | | | | (Dollars in thousands) | | Gross Amount | | Ceded to Other Companies | | Assumed From Other Companies | | Net Amount | | Percentage of Amount Assumed to Net | | | Years ended December 31, | | | | | | | | | | | | | 2017 | | $ | 1,059,973 |
| | $ | 125,735 |
| | $ | 509 |
| | $ | 934,747 |
| | 0.1 | % | | | 2016 | | 1,058,545 |
| | 133,981 |
| | 662 |
| | 925,226 |
| | 0.1 | % | | | 2015 | | 997,892 |
| | 102,848 |
| | 1,178 |
| | 896,222 |
| | 0.1 | % |
MGIC Investment Corporation 20172022 Form 10-K | 168133 |