FORM 10-K
UNITED STATES SECURITIES AND EXCHANGE COMMISSION
WASHINGTON, D.C. 20549
| | | | | | | | |
| ☒ | ANNUAL REPORT PURSUANT TO SECTION 13 OR 15(d) OF THE SECURITIES EXCHANGE ACT OF 1934 |
| For the fiscal year ended | December 31, 20222023 |
| ☐ | TRANSITION REPORT PURSUANT TO SECTION 13 OR 15(d) OF THE SECURITIES EXCHANGE ACT OF 1934 |
| For the transition period from ______ to ______ |
| Commission file number | 1-10816 |
MGIC Investment Corporation
(Exact name of registrant as specified in its charter)
| | | | | | | | | | | |
| Wisconsin | | 39-1486475 |
| (State or other jurisdiction of incorporation or organization) | | (I.R.S. Employer Identification No.) |
| 250 E. Kilbourn Avenue | | |
| Milwaukee, | Wisconsin | | 53202 |
| (Address of principal executive offices) | | (Zip Code) |
| (414) | | 347-6480 |
| (Registrant’s telephone number, including area code) |
Securities registered pursuant to Section 12(b) of the Act:
| | | | | | | | | | | | | | |
| Title of each class | | Trading Symbol | | Name of each exchange on which registered |
| Common stock, par value $1 per share | | MTG | | New York Stock Exchange |
| | | | |
Securities Registered Pursuant to Section 12(g) of the Act: None
Indicate by check mark if the registrant is a well-known seasoned issuer, as defined in Rule 405 of the Securities Act. Yes ☒ No ☐
Indicate by check mark if the registrant is not required to file reports pursuant to Section 13 or Section 15(d) of the Act. Yes ☐ No ☒
Indicate by check mark whether the registrant (1) has filed all reports required to be filed by Section 13 or 15(d) of the Securities Exchange Act of 1934 during the preceding 12 months (or for such shorter period that the registrant was required to file such reports), and (2) has been subject to such filing requirements for the past 90 days. Yes ☒ No ☐
Indicate by check mark whether the registrant has submitted electronically every Interactive Data File required to be submitted pursuant to Rule 405 of Regulation S-T during the preceding 12 months (or for such shorter period that the registrant was required to submit such files). Yes ☒ No ☐
Indicate by check mark whether the registrant is a large accelerated filer, an accelerated filer, a non-accelerated filer, a smaller reporting company or an emerging growth company. See the definitions of “large accelerated filer,” “accelerated filer,” “smaller reporting company,” and “emerging growth company” in Rule 12b-2 of the Exchange Act. (Check one):
| | | | | | | | | | | | | | | | | | | | | | | |
| Large accelerated filer | ☒
| Accelerated filer ☐ | Non-accelerated filer ☐ | Smaller reporting company | ☐ | Emerging growth company | ☐ |
| If an emerging growth company, indicate by check mark if the registrant has elected not to use the extended transition period for complying with any new or revised financial accounting standards provided pursuant to Section 13(a) of the Exchange Act. ☐ |
Indicate by check mark whether the registrant has filed a report on and attestation to its management's assessment of the effectiveness of its internal control over financial reporting under section 404(b) of the Sarbanes-Oxley Act (15 U.S.C. 7262(b)) by the registered public accounting firm that prepared or issued its audit report. ☒
If the securities are registered pursuant to Section 12(b) of the Act, indicate by check mark whether the financial statements of the registrant included in the filing reflect the correction of an error to previously issued financial statements. ☐
Indicate by check mark whether any of those error corrections are restatements the required a recovery analysis of incentive-based compensation received by any of the registrant's executive officers during the relevant recovery period pursuant §240.10D-1(b). ☐
Indicate by check mark whether the registrant is a shell company (as defined in Rule 12b-2 of the Exchange Act). YES ☐ NO ☒
MGIC Investment Corporation 2023 Form 10-K | 1
State the aggregate market value of the voting and non-voting common equity held by non-affiliates computed by reference to the price at which the common equity was last sold, or the average bid and asked price of such common equity, as of the last business day of the registrant's most recently completed second fiscal quarter. : Approximately $4.6$4.4 billion*
MGIC Investment Corporation 2022 Form 10-K | 1
* Solely for purposes of computing such value and without thereby admitting that such persons are affiliates of the Registrant, shares held by directors and executive officers of the Registrant are deemed to be held by affiliates of the Registrant. Shares held are those shares beneficially owned for purposes of Rule 13d-3 under the Securities Exchange Act of 1934 but excluding shares subject to stock options.
Indicate the number of shares outstanding of each of the issuer’s classes of common stock, as of the latest practicable date: As of February 17, 2023,16, 2024, there were 290,428,422269,669,667 shares of common stock of the registrant, par value $1.00 per share, outstanding.
The following documents have been incorporated by reference in this Form 10-K, as indicated:
| | | | | | | | |
| Document | | Part and Item Number of Form 10-K Into Which Incorporated* |
Proxy Statement for the 20232024 Annual Meeting of Shareholders, provided such Proxy Statement is filed within 120 days after December 31, 2022.2023. If not so filed, the information provided in Items 10 through 14 of Part III will be included in an amended Form 10-K filed within such 120 day period. | | Items 10 through 14 of Part III |
* In each case, to the extent provided in the Items listed.
MGIC Investment Corporation 20222023 Form 10-K | 2
MGIC Investment Corporation and Subsidiaries
| | | | | | | | | | | |
| Table of Contents |
| | Page No. |
| PART I | | |
| Item 1. | | |
| Item 1A. | | |
| Item 1B. | | |
| Item 1C. | Cybersecurity | |
| Item 2. | | |
| Item 3. | | |
| Item 4. | | |
| PART II | | |
| Item 5. | | |
| Item 6. | Reserved. | |
| Item 7. | | |
| Item 7A. | | |
| Item 8. | | |
| Item 9. | | |
| Item 9A. | | |
| Item 9B. | | |
| Item 9C. | | |
| PART III | | |
| Item 10. | | |
| Item 11. | | |
| Item 12. | | |
| Item 13. | | |
| Item 14. | | |
| PART IV | | |
| Item 15. | | |
| Item 16. | | |
| | |
| | |
MGIC Investment Corporation 20222023 Form 10-K | 3
Glossary of terms and acronyms
/ A
ARMs
Adjustable rate mortgages
ABS
Asset-backed securities
Annual Persistency
The percentage of our insurance remaining in force from one year prior. As of September 30, 2023, we refined our methodology for calculating our Annual Persistency by excluding the amortization of the principal balance. All prior periods have been revised
ASC
Accounting Standards Codification
Available Assets
Assets, as designated under the PMIERs, that are readily available to pay claims, and include the most liquid investments
/ B
Book or book year
A group of loans insured in a particular calendar year
BPMI
Borrower-paid mortgage insurance
BPS
Basis Points
/ C
CECL
Current expected credit losses covered under ASC 326
CFPB
Consumer Financial Protection Bureau
CLO
Collateralized loan obligations
CMBS
Commercial mortgage-backed securities
COVID-19 Pandemic
An outbreak of the novel coronavirus disease, later named COVID-19. The outbreak of COVID-19 was declared a pandemic by the World Health Organization and a national emergency in the United States in March 2020
CRT
Credit risk transfer. The transfer of a portion of mortgage credit risk to the private sector through different forms of transactions and structures
/ D
DAC
Deferred insurance policy acquisition costs
Debt-to-income ("DTI") ratio
The ratio, expressed as a percentage, of a borrower's total debt payments to gross income
Delinquent Loan
A loan that is past due on a mortgage payment. A delinquent loan is typically reported to us by servicers when the loan has missed two or more payments. A loan will continue to be reported as delinquent until it becomes current or a claim payment has been made. A delinquent loan is also referred to as a default
Delinquency Rate
The percentage of insured loans that are delinquent
Direct
Before giving effect to reinsurance
/ E
EPS
Earnings per share
/ F
Fannie Mae
Federal National Mortgage Association
FCRA
Fair Credit Reporting Act
FHA
Federal Housing Administration
FHFA
Federal Housing Finance Agency
FHLB
Federal Home Loan Bank of Chicago, of which MGIC is a member
MGIC Investment Corporation 2023 Form 10-K | 4
MGIC Investment Corporation and Subsidiaries
FICO score
A measure of consumer credit risk provided by credit bureaus, typically produced from statistical models by Fair Isaac Corporation utilizing data collected by the credit bureaus
Freddie Mac
Federal Home Loan Mortgage Corporation
/ G
GAAP
Generally Accepted Accounting Principles in the United States
GSEs
Government Sponsored Enterprise. Collectively, Fannie Mae and Freddie Mac
MGIC Investment Corporation 2022 Form 10-K | 4
MGIC Investment Corporation and Subsidiaries
/ H
HAMP
Home Affordable Modification Program
HARP
Home Affordable Refinance Program
Home Re Entities
Unaffiliated special purpose insurers domiciled in Bermuda that participate in our aggregate XOL transactionsTransactions through the ILN market.
Home Re Transactions
Excess-of-loss reinsurance transactions with the Home Re Entities
HOPA
Homeowners Protection Act
HUD
Housing and Urban Development
/ I
IBNR Reserves
Loss reserves established on loans we estimate are delinquent, but for which the delinquency has not been reported to us
IIF
Insurance in force, which for loans insured by us, is equal to the unpaid principal balance, as reported to us
ILN
Insurance-linked notes
/ L
LAE
Loss adjustment expenses, which includes the costs of settling claims, including legal and other expenses and general expenses of administering the claims settlement process.
Loan-to-value ("LTV") ratio
The ratio, expressed as a percentage, of the dollar amount of the first mortgage loan to the value of the property at the time the loan became insured and does not reflect subsequent housing price appreciation or depreciation. Subordinate mortgages may also be present
Long-term debt:
5.75% Notes
5.75% Senior Notes
5.25% Notes
5.25% Senior Notes due on August 15, 2028, with interest payable semi-annually on February 15 and August 15 of each year
9% Debentures
9% Convertible Junior Subordinated Debentures due on April 1, 2063, with interest payable semi-annually on April 1 and October 1 of each year
FHLB Advance or the Advance
1.91% Fixed rate advance from the FHLB
Loss ratio
The ratio, expressed as a percentage, of the sum of net incurred losses and loss adjustment expensesincurred to net premiums earned
Low down payment loans or mortgages
Loans with less than 20% down payments
LPMI
Lender-paid mortgage insurance
/ M
MBS
Mortgage-backed securities
MD&A
Management's discussion and analysis of financial condition and results of operations
MGIC
Mortgage Guaranty Insurance Corporation, a subsidiary of MGIC Investment Corporation
MAC
MGIC Assurance Corporation, a subsidiary of MGIC
Minimum Required Assets
The minimum amount of Available Assets that must be held under the PMIERs, which is based on an insurer's book of RIF and is calculated from tables of factors with several risk dimensions, reduced for credit given for risk ceded under reinsurance transactions, and subject to a floor of $400 million
MGIC Investment Corporation 2023 Form 10-K | 5
MGIC Investment Corporation and Subsidiaries
MPP
Minimum Policyholder Position, as required under certain state requirements. The “policyholder position” of a mortgage insurer is its net worth or surplus, contingency reserve and a portion of the reserves for unearned premiums
MGIC Investment Corporation 2022 Form 10-K | 5
MGIC Investment Corporation and Subsidiaries
/ N
N/A
Not applicable for the period presented
NAIC
The National Association of Insurance Commissioners
NIW
New Insurance Written, is the aggregate original principal amount of the mortgages that are insured during a period
N/M
Data, or calculation, deemed not meaningful for the period presented
NPL Settlement
Non-performing loan,The commutation of coverage on non-performing loans, which is aare delinquent loan,loans, at any stage in its delinquency
/ O
OCI
Office of the Commissioner of Insurance of the State of Wisconsin
/ P
Persistency
The percentage of our insurance remaining in force from one year prior
PMI
Private Mortgage Insurance (as an industry or product type)
PMIERs
Private Mortgage Insurer Eligibility Requirements issued by each of Fannie Mae and Freddie Mac to set forth requirements that an approved insurer must meet and maintain to provide mortgage guaranty insurance on loans delivered to or acquired by Fannie Mae or Freddie Mac, as applicable
Premium Rate
The contractual rate charged for coverage under our insurance policies
Premium Yield
The ratio of premium earned divided by the average IIF outstanding for the period measured
Primary Insurance
Insurance that provides mortgage default protection on individual loans. Primary insurance may be written on a "flow" basis, in which loans are insured in individual, loan-by-loan transactions, or on a "bulk" basis, in which each loan in a portfolio of loans is individually insured in a single bulk transaction
Profit Commission
Payments we receive from reinsurers under each of our quota share reinsurance transactions if the annual loss ratio is below levels specified in the quota share reinsurance transaction
/ Q
QSR Transaction
Quota share reinsurance transaction with a group of unaffiliated reinsurers
20152020 QSR
Our QSR transaction that provided coverage on eligible NIW written prior to 2017
2017 QSR
Our QSR transaction that provided coverage on eligible NIW in 2017
2018 QSR
Our QSR transaction that provided coverage on eligible NIW in 2018
2019 QSR
Our QSR transaction that provided coverage on eligible NIW in 2019
2020 QSR
Our QSR transactions that provide coverage on eligible NIW in 2020
2021 QSR
Our QSR transactions that provideprovides coverage on eligible NIW in 2021
2022 QSR
Our QSR transactions that provide coverage on eligible NIW in 2022
2023 QSR
Our QSR transactionstransaction that provideprovides coverage on eligible NIW in 2023
2024 QSR
Our QSR transaction that provides coverage on eligible NIW in 2024
Credit Union QSR
Our QSR transaction that provides coverage on eligible NIW from credit union institutions originated from April 1, 2020 through December 31, 2025
/ R
RESPA
Real Estate Settlement Procedures Act
MGIC Investment Corporation 2022 Form 10-K | 6
MGIC Investment Corporation and Subsidiaries
RIF
Risk in force, which for an individual loan insured by us, is equal to the unpaid loan principal balance, as reported to us, multiplied by the insurance coverage percentage. RIF is sometimes referred to as exposure
Risk-to-capital
Under certain state regulations, the ratio of RIF, net of reinsurance and exposure on policies currently in default and for which loss reserves have been established, to the level of statutory capital
RMBS
Residential mortgage-backed securities
MGIC Investment Corporation 2023 Form 10-K | 6
MGIC Investment Corporation and Subsidiaries
/ S
State Capital Requirements
Under certain state regulations, the minimum amount of statutory capital relative to risk in force (or similar measure)
/ T
TILA
Truth in Lending Act
Traditional XOL Transaction
Excess-of-loss reinsurance transaction with a group of unaffiliated reinsurers
2022 Traditional XOL
Our XOL transaction that provides coverage on eligible NIW in 2022
2023 Traditional XOL
Our XOL transaction that provides coverage on eligible NIW in 2023
/ U
Underwriting expense ratio
The ratio, expressed as a percentage, of the other underwriting and operating expenses, net and amortization of DAC of our combined insurance operations (which excludes underwriting and operating expenses of our non-insurance subsidiaries) to net premiums written
Underwriting profit
Net premiums earned minus losses incurred, lossesnet and other underwriting and operating expenses, net
USDA
U.S. Department of Agriculture
/ V
VA
U.S. Department of Veterans Affairs
VIE
Variable interest entity
/ X
XOL Transactions
Excess-of-loss reinsurance transactions executed through the Home Re Transactions and the Traditional XOL TransactionTransactions
MGIC Investment Corporation 20222023 Form 10-K | 7
Item 1. Business
A. General
We are a holding company and through wholly-owned subsidiaries we provide private mortgage insurance, other mortgage credit risk management solutions, and ancillary services. In 2022,2023, our total revenues were $1.2 billion and our primary NIW was $76.4$46.1 billion. As of December 31, 2022,2023, our direct primary IIF was $295.3$293.5 billion and our direct primary RIF was $76.5$77.2 billion. For further information about our results of operations, see our consolidated financial statements in Item 8 and our MD&A in Item 7. As of December 31, 2022,2023, our principal mortgage insurance subsidiary, MGIC, was licensed in all 50 states of the United States, the District of Columbia, Puerto Rico and Guam. During 2022,2023, we wrote new insurance in each of those jurisdictions.
20232024 BUSINESS STRATEGIES
Our business strategies continue to be to 1) maximize the value we create through our mortgage credit enhancement activities; 2) differentiate ourselves through our customer experience; 3) establish a competitive advantage through our digital and analytical capabilities; 4) excel at acquiring, managing and distributing mortgage credit risk and the related capital; 5) maintain financial strength through economic cycles; and 6) foster an environment that embraces diversity and best positions our people to succeed.
20222023 ACCOMPLISHMENTS
Following are several of our 20222023 accomplishments that furthered our business strategies.
•Earned $865$713 million of net income ($2.792.49 per diluted share) for the year, compared to $635$865 million ($1.852.79 per diluted share) in 2021.
•Increased primary IIF by more than 7.6% year-over-year.2022.
•Expanded our reinsurance program by securing quota share reinsurance covering the majority of our 2022 and 20232024 NIW, and executingentered into a $330 million excess of loss reinsurance agreement executed through an ILNa mortgage insurance linked notes transaction in the capital market, and the traditionalplaced a forward-commitment excess of loss reinsurance market.agreement covering 2023 NIW. These transactions allow us to better manage our risk profile, and they provide an alternative source of capital.
•Conducted tender offers on certain tranches of our Home Re 2019-1 Ltd., Home Re 2021-1 Ltd., and Home Re 2021-2 Ltd insurance linked notes that were not providing efficient PMIERs benefit. The tender offers resulted in the reduction in the insurance-linked notes of $187.1 million for the Home Re 2019-1 Ltd, $91.1 million for the Home Re 2021-1 Ltd., and $106.7 million for the Home Re 2021-2 Ltd.
•Paid $800$600 million of cash dividends from MGIC to our holding company.
•Maintained financial strength and capital flexibility while returning approximately $497$465 million in capital to shareholders:
◦Repurchased 8.7%7.4% of our shares outstanding at the beginning of the year.
◦Increased cash dividends to shareholders by 25%15% in the second half of 2022.2023.
•Repurchased $89 million of our 2063 Junior Convertible Debentures, which eliminated approximately 6.8 million potentially dilutive shares.
•Redeemed the outstanding principal balance of the 5.75% Senior Notes at a purchase price$21.1 million on our 9% Convertible Junior Subordinated Debentures ("9% Debentures) for cash of $248$28.6 million plus accrued interest.
•Repaid the outstanding principal balancein lieu of the FHLB advance at a prepayment priceissuing shares of $156 million.common stock.
•Established a Transformationan Enterprise Project Management Office to prioritize and Senior Leadership Team (the "SLT") to overseemonitor the progress of our technological investment governanceinitiatives and lead an enterprise-wide business prioritization process.investments. Continued to transform our business processes along a number of dimensions, including modelling, pricing, data and analytics, application programming interfaces, salesmodeling, and underwriting.data management.
•Continued work on our Affordable Housing Strategy through ongoing participation in the Affordable Housing Advisory Board of the Mortgage Bankers Associationsponsored research, partnerships, and support offor local and national organizations including the Urban Institute's Housing Finance Innovation Forum, the National Housing Conference, the Coalition of Community Development Financial Institutions theCoalition, National Association of Hispanic Real Estate Professionals, theNational Association of Local Housing Financing Agencies, National Association of Real Estate Brokers, theand National Conference of State Housing Agencies, and the National Association of Local Housing Finance Agencies.
•Made significantContinued to make progress in our diversity, equity and inclusion ("DEI") work, including the formationlaunch of our "DEI Compass" webinar series, co-worker learning and development opportunities, and a DEI Council, leadership participation in DEI Workshops,community grant program whereby co-workers nominated non-profit organizations to which the Company made donations.
MGIC Investment Corporation 2023 Form 10-K | 8
MGIC Investment Corporation and the creation of a DEI site on the Company's intranet page.Subsidiaries
OVERVIEW OF THE PRIVATE MORTGAGE INSURANCE INDUSTRY AND ITS OPERATING ENVIRONMENT
We established the modern PMI industry in 1957 to provide a private market alternative to federal government insurance programs. PMI covers losses from homeowner defaults on residential mortgage loans, reducing, and in some instances eliminating, the loss to the insured institution.
Fannie Mae and Freddie Mac ("the GSEs") have been the major purchasers of the mortgage loans underlying new insurance written by private mortgage insurers. The GSEs purchase residential mortgage loans as part of their governmental mandate to provide liquidity in the secondary mortgage market. The GSEs cannot buy low down payment mortgage loans without certain forms of credit enhancement. Private mortgage insurance has generally been purchased by lenders in primary mortgage market transactions to satisfy this credit enhancement requirement. Therefore, PMI facilitates the sale of low down payment mortgages in the secondary mortgage market to the GSEs and plays an important role in the housing finance system by assisting consumers, especially first-time and low- and medium-wealth homebuyers, to finance homes with low down payment mortgages. PMI also reduces the regulatory capital that depository institutions are required to hold against certain low down payment mortgages that they hold as assets.
Because the GSEs have been the major purchasers of the mortgages underlying new insurance written by private mortgage insurers, the PMI industry in the U.S. is defined in large part by the requirements and practices of the GSEs. These requirements and practices, as well as those of the federal regulators that oversee the GSEs and lenders, impact the operating results and financial performance of private mortgage insurers. In 2008, the federal
MGIC Investment Corporation 2022 Form 10-K | 8
MGIC Investment Corporation and Subsidiaries
government took control of the GSEs through a conservatorship process. The FHFA is the conservator of the GSEs and has the authority to control and direct their operations.
In 2022 the GSEs submittedeach published Equitable Housing Finance Plans to the FHFA.("Plans"). Updated Plans were subsequently published by each GSE in April 2023. The Plans seek to advance equity in housing finance over a three yearthree-year period and include potential changes to the GSEs’ business practices and policies. Specifically relating to mortgage insurance, (1) Fannie Mae’s Plan contemplatesincludes the creation of special purchasepurpose credit program(s) ("SPCPs") targeted to historically underserved borrowers with a goal of lowering costs for such borrowers through lower than standard mortgage insurance requirements; and (2) Freddie Mac’s Plan contemplatesincludes plans to work with mortgage insurers to look for ways to lower mortgage costs, the creation of SPCPs targeted to historically underserved borrowers, withand the goalsplanned purchase of (a) working with mortgage insurers to reduce costs for high LTV borrowers, and (b) updating mortgage insurance cancellation requirements.loans originated through lender-created SPCPs. To the extent the business practices and policies of the GSEs regarding mortgage insurance coverage, costs and cancellation change, including more broadly than through SPCPs, such changes may negatively impact the mortgage insurance industry.
It is uncertain what role the GSEs, FHA and private capital, including private mortgage insurance, will play in the residential housing finance system in the future. The timing and impact on our business of any resulting changes is uncertain. Some changes would require Congressional action to implement and it is difficult to estimate when any action would be final and how long any associated phase-in period may last.
The GSEs have private mortgage insurer eligibility requirements, or "PMIERs", for private mortgage insurers that insure loans delivered to or purchased by the GSEs. The financial requirements of the PMIERs require a mortgage insurer’s Available Assets to equal or exceed its Minimum Required Assets. MGIC is in compliance with the PMIERs and eligible to insure loans purchased by the GSEs. In calculating Minimum Required Assets, we receiveMGIC receives significant credit for risk ceded under our reinsurance transactions. See "Reinsurance" in this Item 1 for information about our reinsurance transactions and "Regulation – Direct Regulation" in this Item 1 for information about our compliance with the financial requirements of the PMIERs.
The private mortgage insurance industry is greatly impacted by macroeconomic conditions that affect home loan originations and credit performance of home loans, including unemployment rates, home prices, restrictions on mortgage credit due to underwriting standards, interest rates, household formations and homeownership rates. During the years leading up to the financial crisis of the 2000s, the mortgage lending industry increasingly made home loans with higher risk profiles. In certain sections of this Annual Report, we discuss our insurance written in 2005-2008 separately from our insurance written in earlier and later years. Beginning in 2007, job creation slowed and the housing markets began slowing in certain areas, with declines in certain other areas. In 2008 and 2009, employment in the U.S. decreased substantially and nearly all geographic areas in the U.S. experienced home price declines. Together, these conditions resulted in significant adverse developments for us and our industry. The operating environment for private mortgage insurers materially improved after the financial crisis, as the economy recovered.
The COVID-19 pandemic had a material impact on our 2020 financial results. The increased level of unemployment and
economic uncertainty resulted in an increase in the number of mortgage delinquenciesour delinquency inventory for which we recorded increased loss reserves. After reaching 14.7% in April 2020,Since that time, our mortgage delinquency inventory has decreased significantly and is below the unemployment rate declined throughlevels seen immediately before the endonset of 2021, and remained below 4% for most of 2022.the pandemic. The number of delinquent mortgages that we insure has also declined through the end of 2022, after reaching its recent peak in June 2020. Theoverall decline in delinquent mortgages that we insure,the delinquency inventory, along with favorable loss reserve development in 2022recent years has resulted in ourdecreased losses incurred significantly decreasing in 2022 compared to 2021, and ourincreased net income significantly increasing. For a discussion of the various ways the COVID-19 pandemic may impact us in the future, see our Risk Factor titled "The COVID-19 pandemic may materially impact our business and future financial condition" in Item 1A.income.
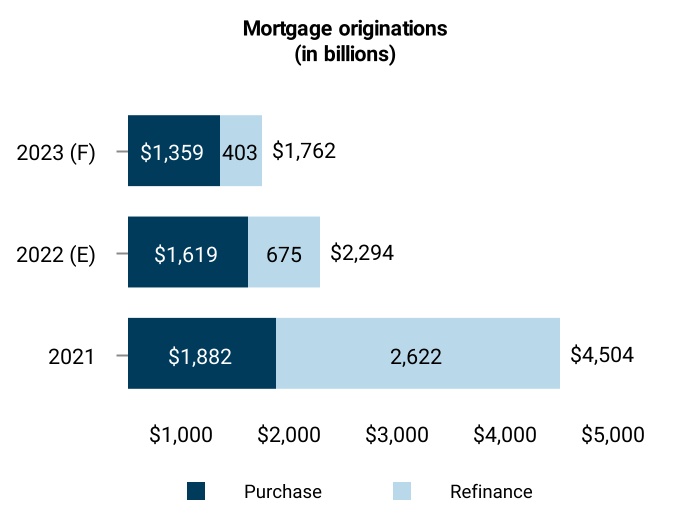
In 2022, $4052023, $284 billion of mortgages were insured with primary coverage by private mortgage insurers, compared to $585$405 for the full year of 2021,2022, and $600$585 billion for full year 2020. The 2022 and 2021 volumes were significantly greater than the recent low in 2010 of $70 billion and greater than the volumes of 2001 through 2007 when, on average, approximately $311 billion of mortgages were insured with primary coverage by private mortgage insurers.2021. The high 2021 and 2020 volumesvolume resulted, in part, from historically low interest rates driving sustained borrower demand, including for refinances, and the effect that the COVID-19 pandemic had on demand for homes.
For most of our business, we and other private mortgage insurers compete directly with federal and state governmental and quasi-governmental agencies that sponsor government-backed mortgage insurance programs, principally the FHA, VA and USDA. The publication Inside Mortgage Finance estimates that in 2022,2023, the FHA accounted for 26.7%33.2% of low down payment residential mortgages
MGIC Investment Corporation 2023 Form 10-K | 9
MGIC Investment Corporation and Subsidiaries
that were subject to FHA, VA, USDA or primary private mortgage insurance, compared to 26.7% in 2022 and 24.7% in 2021 and 23.4% in 2020.2021. Since 2012, the FHA’s market share has been as low as 23.4% (2020) and as high as 42.1% (in 2012). Factors that influence the FHA’s market share include relative rates and fees, underwriting guidelines and loan limits of the FHA, VA, private mortgage insurers and the GSEs; lenders' perceptions of legal risks under FHA versus GSE programs; flexibility for the FHA to establish new products as a result of federal legislation and programs; returns expected to be obtained by lenders for Ginnie Mae securitization of FHA-insured loans compared to those obtained from selling loans to the GSEs for securitization; and differences in policy terms, such as the ability of a borrower to cancel insurance coverage under certain circumstances. The focus ofOn February 22, 2023, the Presidential Administration on equitable housing finance and sustainable housing opportunities increases the likelihood ofFHA announced a reduction30-basis point decrease in the FHA’sits mortgage insurance premium rates. Such aThis rate reduction wouldhas negatively impactimpacted our NIW; however, given the many factors that influence the FHA's market share, it is difficultNIW. We are unable to predict the impact. In addition, we also cannot predictextent of any further impact on our NIW or how the factors that affect the FHA’sFHA's share of NIW will change in the future.
Inside Mortgage Finance estimates that in 2022,2023, the VA accounted for 24.5%21.5% of all low down payment residential mortgages that were subject to FHA, VA, USDA or primary private mortgage insurance, compared to 24.5% in 2022 and 30.2% in 2021 and 30.9% in 2020.2021. Since 2012, the VA's market share has been as lowhigh as 22.8% (in 2013) and as high a 30.9% (in 2020). The VA's 2023 market share was the lowest since 2013 (22.8%). We believe that the VA’s market share grows as the number of borrowers that are eligible for the VA’s program increases and when eligible borrowers opt to use the VA program when refinancing their
MGIC Investment Corporation 2022 Form 10-K | 9
MGIC Investment Corporation and Subsidiaries
mortgages. The VA program offers 100% LTV loans and charges a one-time funding fee that can be included in the loan amount.
The private mortgage insurance industry also competes with alternatives to mortgage insurance, such as investors using risk mitigation and credit risk transfer techniques other than PMI, including capital market transactions entered into by the GSEs and banks; lenders and other investors holding mortgages in portfolio and self-insuring; and “piggyback loans,” which combine a first lien loan with a second lien loan. In 2018, the GSEs initiated secondary mortgage market programs with loan level mortgage default coverage provided by various (re)insurers that are not mortgage insurers governed by PMIERs, and that are not selected by the lenders. While we view these programs as competing with traditional private mortgage insurance, we participate in them through an affiliate of MGIC.
The GSEs (and other investors) have also used other forms of credit enhancement that did not involve traditional private mortgage insurance, such as engaging in credit-linked note transactions executed in the capital markets, orand using other forms of debt issuances or securitizations that transfer credit risk directly to other investors, including competitors and an affiliate of MGIC; and using other risk mitigation techniques in conjunction with reduced levels of private mortgage insurance coverage.
In addition to the FHA, VA, other governmental agencies and the alternatives to mortgage insurance discussed above, we compete with other mortgage insurers. The level of competition, including price competition, within the private mortgage insurance industry has remained intense over the past several years. See "Our Products and Services – Sales and Marketing and Competition – Competition" below for more information about the impact on our business of competition in the private mortgage insurance industry.
In addition to being subject to the requirements and practices of the GSEs, private mortgage insurers are subject to comprehensive, detailed regulation by state insurance departments. The insurance laws of 16 jurisdictions, including Wisconsin, MGIC's domiciliary state, require a mortgage insurer to maintain a minimum amount of statutory capital relative to the RIF (or a similar measure) in order for the mortgage insurer to continue to write new business. The NAIC previously announced plans to revise the minimum capital and surplus requirements for mortgage insurers that are provided forAdditionally, in its Mortgage Guaranty Insurance Model Act. In December 2019, a working group of state regulators released an exposure draft of2023 a revised Mortgage Guaranty Insurance Model Act and a risk-based capital framework to establish capital requirements for mortgage insurers, although certain items were not completely addressedwas adopted by the framework, including the treatment of ceded riskNAIC. The revised Model Act includes requirements relating to, among other things: (i) capital and minimum capital floors. In October 2022,requirements, and contingency reserves; (ii) restrictions on mortgage insurers’ investments in notes secured by mortgages; (iii) prudent underwriting standards and formal underwriting guidelines; (iv) the NAIC working group released a revised exposure draftestablishment of the Mortgageformal, internal “Mortgage Guaranty Insurance Model Act that does not include changesQuality Control Programs” with respect to the capital requirements of the existing Model Act.in-force business; and (v) reinsurance and prohibitions on captive reinsurance arrangements.
GENERAL INFORMATION ABOUT OUR COMPANY
We are a Wisconsin corporation organized in 1984. Our principal office is located at MGIC Plaza, 250 East Kilbourn Avenue, Milwaukee, Wisconsin 53202 (telephone number (414) 347-6480). As used in this annual report, “we,” “our” and “us” refer to MGIC Investment Corporation’s consolidated operations or to MGIC Investment Corporation, as a separate
entity, as the context requires, and “MGIC” refers to Mortgage Guaranty Insurance Corporation.
Our revenues and losses may be materially affected by the risk factors that are included in Item 1A of this annual report and are an integral part of this annual report. These risk factors may also cause actual results to differ materially from the results contemplated by forward looking statements that we may make. Forward looking statements consist of statements that relate to matters other than historical fact. Among others, statements that include words such as we “believe,” “anticipate” or “expect,” or words of similar import, are forward looking statements. We are not undertaking any obligation to update any forward looking statements or other statements we may make even though these statements may be affected by events or circumstances occurring after the forward looking statements or other statements were made. No reader of this annual report should rely on these statements being current at any time other than the time at which this annual report was filed with the Securities and Exchange Commission.
MGIC Investment Corporation 2023 Form 10-K | 10
MGIC Investment Corporation and Subsidiaries
B. Our Products and Services
MORTGAGE INSURANCE
In general, there are two principal types of private mortgage insurance: “primary” and “pool.”
Primary Insurance.Insurance
Primary insurance provides mortgage default protection on individual loans and covers a percentage of the unpaid loan principal, delinquent interest and certain expenses associated with the default and subsequent foreclosure on the mortgage or sale of the underlying property (collectively, the “claim amount”). In addition to the loan principal, the claim amount is affected by the mortgage note rate and the time necessary to complete the foreclosure or sale process. The insurer generally pays the coverage percentage of the claim amount specified in the primary policy but has the option to pay 100% of the claim amount and acquire title to the property. Primary insurance is generally written on first mortgage loans secured by owner occupied "single-family" homes, which are one-to-four family homes and condominiums. Primary insurance can be written on first liens secured by non-owner occupied single-family homes, which are referred to in the home mortgage lending industry as investor loans, and on vacation or second homes. Primary coverage can be used on any type of residential mortgage loan instrument approved by the mortgage insurer.
References in this document to amounts of insurance written or in force, risk written or risk in force, and other historical data related to our insurance refer only to direct (before giving effect to reinsurance) primary insurance, unless otherwise indicated. Primary insurance may be written on a flow basis, in which loans are insured in individual, loan-by-loan transactions, or may be written on a bulk basis, in which each loan in a portfolio of loans is individually insured in a single, bulk transaction. Our new primary insurance written was $46.1 billion in 2023, compared to $76.4 billion in 2022 compared toand $120.2 billion in 2021 and $112.1 billion in 2020.2021. The 20222023 decrease compared to 20212022 reflects a decrease insmaller purchase mortgage originations we insured, as well as a decrease in refinance mortgage originations we insured.market.
MGIC Investment Corporation 2022 Form 10-K | 10
MGIC Investment Corporation and Subsidiaries
The following charts show, on a direct basis, our primary IIF and primary RIF as of December 31 for the years indicated.
| | Primary insurance and risk in force | Primary insurance and risk in force | Primary insurance and risk in force |
| (In billions) | (In billions) | | 2022 | | 2021 | | 2020 | | 2019 | | 2018 | (In billions) | | 2023 | | 2022 | | 2021 | | 2020 | | 2019 |
| Primary IIF | Primary IIF | | $ | 295.3 | | | $ | 274.4 | | | $ | 246.6 | | | $ | 222.3 | | | $ | 209.7 | |
| Primary RIF | Primary RIF | | 76.5 | | | 69.3 | | | 61.8 | | | 57.2 | | | 54.1 | |
For loans sold to a GSE, the coverage percentage must comply with the requirements established by the particular GSE to which the loan is delivered. The GSEs have different loan purchase programs that allow different levels of mortgage insurance coverage. Under the “charter coverage” program, on certain loans lenders may choose a mortgage insurance coverage percentage that is less than the GSEs’ “standard coverage” and only the minimum required by the GSEs’ charters, with the GSEs paying a lower price for such loans. In 2022,2023, a substantial majority of our volume was on loans with GSE standard or higher coverage.
For loans that are not sold to the GSEs, the lender determines the coverage percentage from those that we offer. Higher coverage percentages generally result in increased severity, which is the amount paid on a claim. We charge higher premium rates for higher coverage percentages. However, there can be no assurance that the higher premium rates adequately reflect the risks associated with higher coverage percentages. In accordance with GAAP for the mortgage insurance industry, loss reserves are only established for policies covering delinquent loans. Historically, because relatively few delinquencies occur in the early years of a book of business, the higher premium revenue from higher coverage has been recognized before any significant higher losses resulting from that higher coverage may be incurred. For more information, see “Exposure to Catastrophic Loss; Delinquencies; Claims; Loss Mitigation.”
In general, mortgage insurance coverage cannot be terminated by the insurer. However, subject to certain restrictions on our rescission rights as specified in our insurance policy, we may terminate or rescind coverage for, among other reasons, non-payment of premium, certain material misrepresentations and fraud in connection with the application for the insurance policy. Mortgage insurance coverage isunder monthly or annual premium plans are renewable at the option of the insured lender, at the renewal rate fixed when the loan was initially insured. Lenders may cancel insurance written on a flow basis at any time at their option or because of mortgage repayment, which may be accelerated because of the refinancing of mortgages.
In the case of a loan purchased by a GSE, a borrower may request termination of insurance based on the home’s current value if certain LTV ratio and seasoning requirements are met and the borrowers have an acceptable payment history. For loans seasoned between two and five years, the LTV ratio must be 75% or less, and for loans seasoned more than five years the LTV ratio must be 80% or less. If the borrower has made substantial improvements to the property, the GSEs allow for cancellation once the LTV ratio reaches 80% or less with no minimum seasoning requirement.
Mortgage insurance for loans secured by one-family, primary residences can be canceled under the Homeowners Protection Act (“HOPA”). In general, HOPA requires a servicer to cancel the mortgage insurance if a borrower requests cancellation when the principal balance of the loan is first scheduled to reach 80% of
the original value of the property, or reaches that percentage through payments, if 1) the borrower is current on the loan and has a “good payment history” (as defined by HOPA), 2) if required by the mortgage owner, the borrower provides evidence that the value of the property has not declined below the original value, and 3) if required by the mortgage owner, the borrower certifies that the borrower’s equity in the property is not subject to a subordinate lien. Additionally, HOPA requires mortgage insurance to terminate automatically when the principal balance of the loan is first scheduled to reach 78% of the original
MGIC Investment Corporation 2023 Form 10-K | 11
MGIC Investment Corporation and Subsidiaries
value of the property and the borrower is current on loan payments or thereafter becomes current. Annually, servicers must inform borrowers of their right to cancel or terminate mortgage insurance. The provisions of HOPA described above apply only to borrower paid mortgage insurance, which is described below.
Coverage tends to continue for borrowers experiencing economic difficulties or living in areas experiencing home price depreciation. The persistency of coverage for those borrowers, coupled with cancellation of coverage for other borrowers, can increase the percentage of an insurer’s portfolio covering loans with more credit risk. This development can also occur during periods of heavy mortgage refinancing because borrowers experiencing property value appreciation are less likely to require mortgage insurance at the time of refinancing, while borrowers not experiencing property value appreciation are more likely to continue to require mortgage insurance at the time of refinancing or not qualify for refinancing at all (including if they have experienced economic difficulties) and thus remain subject to the mortgage insurance coverage.
The percentage of NIW on loans representing refinances was 2% for 2023, compared to 3% for 2022 compared toand 20% for 2021 and 36% for 2020.2021. When a borrower refinances a mortgage loan insured by us by paying it off in full with the proceeds of a new mortgage that is also insured by us, the insurance on that existing mortgage is cancelled, and insurance on the new mortgage is considered to be NIW. Therefore, continuation of our coverage from a refinanced loan to a new loan results in both a cancellation of insurance and NIW. When a lender and borrower modify a loan rather than replace it with a new one or enter into a new loan pursuant to a loan modification program, our insurance continues without being cancelled, assuming that we consent to the modification or new loan. As a result, such modifications or new loans are not included in our NIW.
In addition to varying with the coverage percentage, our premium rates for insurance have varied depending upon the perceived risk of a claim on the insured loan and thus have taken into account, among other things, the LTV ratio, the borrower’s credit score and DTI ratio, the number of borrowers, the property location, the mortgage term and whether the property is the borrower’s primary residence. In recent years, the mortgage insurance industry has materially reduced its use of standard rate cards, which were fairly consistent among competitors, and correspondingly increased its use of (i)"risk based pricing systemssystems" that use a spectrum of filed rates to allow for formulaic, risk-based pricing based on multiple attributes that may be quickly adjusted within certain parameters, and (ii) customized rate plans, both of which typically have rates lower than the standard rate card.plans.
The borrower’s mortgage loan instrument may require the borrower to pay the mortgage insurance premium. Our industry refers to the related mortgage insurance as “borrower-paid” or BPMI. If the borrower is not required to pay the premium and
MGIC Investment Corporation 2022 Form 10-K | 11
MGIC Investment Corporation and Subsidiaries
mortgage insurance is required in connection with the origination of the loan, then the premium is paid by the lender, who may recover the premium through an increase in the note rate on the mortgage or higher origination fees. Our industry refers to the related mortgage insurance as “lender-paid” or LPMI. Most of our primary IIF is BPMI.
There are several payment plans available to the borrower, or lender, as the case may be. Under the single premium plan, the borrower or lender pays us in advance a single payment covering a specified term exceeding twelve months. Under the monthly premium plan, the borrower or lender pays us a monthly premium payment to provide only one month of coverage. Under the annual premium plan, an annual premium is paid to us in advance, with annual renewal premiums paid in advance thereafter.
During 2023, 2022 2021 and 2020,2021, the single premium plan represented approximately 4%, 7%4% and 9%7%, respectively, of our NIW. The monthly premium plan represented approximately 96%, 93%96% and 91%93%, respectively. The annual premium plan represented less than 1% of NIW in each of those years. Depending upon the actual life of a single premium policy and its premium rate relative to that of a monthly premium policy, a single premium policy may generate more or less premium than a monthly premium policy over its life.
Pool and Other Insurance.Insurance
Pool insurance is generally used as an additional “credit enhancement” for certain secondary market mortgage transactions. Pool insurance generally covers the amount of the loss on a defaulted mortgage loan that exceeds the claim payment under the primary coverage, if primary insurance is required on that mortgage loan, as well as the total loss on a defaulted mortgage loan which did not require primary insurance. Pool insurance may have a stated aggregate loss limit for a pool of loans and may also have a deductible under which no losses are paid by the insurer until losses on the pool of loans exceed the deductible. We have written no new pool insurance since 2008; however, for a variety of reasons, including responding to capital market alternatives to PMI and customer demands, we may write pool risk in the future. As of December 31, 2022,2023, our direct pool RIF was $276$256 million ($196186 million on pool policies with aggregate loss limits and $80$70 million on pool policies without aggregate loss limits).
In connection with the GSEs' credit risk transfer programs, we provide insurance and reinsurance covering portions of the credit risk related to certain reference pools of mortgages acquired by the GSEs. The amount of risk associated with these transactions is currently $310 million.
MGIC Investment Corporation 2023 Form 10-K | 12
MGIC Investment Corporation and Subsidiaries
MORTGAGE INSURANCE PORTFOLIO
Geographic Dispersion.Dispersion
The following tables reflect the percentage of primary RIF in the top 10 jurisdictions and top 10 core-basedmetropolitan statistical areas at December 31, 2022.2023.
| | | | | |
| Top 10 jurisdictions – RIF |
| |
| California | 8.38.6 | % |
| Texas | 7.67.7 | % |
| Florida | 6.7 | % |
| Pennsylvania | 4.95.1 | % |
| Illinois | 4.24.1 | % |
| Virginia | 3.9 | % |
| North Carolina | 3.83.7 | % |
| Ohio | 3.73.6 | % |
| Georgia | 3.73.5 | % |
| New York | 3.5 | % |
| Total | 50.350.4 | % |
| | | | | |
Top 10 core-basedmetropolitan-based statistical areas – RIF |
| |
| New York-Newark-Jersey City | 4.3 | % |
| Washington-Arlington-Alexandria | 3.24.1 | % |
| Chicago-Naperville-Arlington Heights | 3.3 | % |
| Atlanta-Sandy Springs-Roswell | 2.72.6 | % |
| Philadelphia-Camden-Wilmington | Chicago-Naperville-Arlington Heights2.6 | 2.7% |
| Dallas-Fort Worth | 2.4 | % |
| Los Angeles-Long Beach-Anaheim | 2.3 | % |
| Houston-Woodlands-Sugar Land | 2.32.2 | % |
| Minneapolis-St. Paul-Bloomington | 1.9 | % |
Los Angeles-Long Beach-Glendale | 1.7 | % |
| Phoenix-Mesa-Scottsdale | 1.7 | % |
Dallas-Plano-Irving | 1.6 | % |
Philadelphia | 1.6 | % |
Riverside-San Bernardino | 1.51.8 | % |
| Total | 20.927.5 | % |
The percentages shown above for various core-basedmetropolitan-based statistical areas can be affected by changes, from time to time, in the federal government’s definition of a core-based statistical area.
MGIC Investment Corporation 2022 Form 10-K | 12
MGIC Investment Corporation and Subsidiaries
Policy Year.Year
The following table sets forth the dispersion and certain statistics associated with our primary IIF and RIF as of December 31, 2022,2023, by year(s) of policy origination since we began operations in 1985.
| | Primary insurance in force and risk in force by policy year | Primary insurance in force and risk in force by policy year | Primary insurance in force and risk in force by policy year |
| ($ in millions) | Insurance in Force | | Risk In Force | | Weighted Avg. Interest Rate | Delinquency Rate % | Cede Rate % | % of Original Remaining |
| ($ in billions) | | ($ in billions) | Insurance in Force | | Risk In Force | | Weighted Avg. Interest Rate | Delinquency Rate % | Cede Rate % | % of Original Remaining IIF |
| Policy Year | Policy Year | Total | % of Total | | Total | % of Total | | Weighted Avg. Interest Rate | Delinquency Rate % | Cede Rate % | % of Original Remaining |
| 2004 and prior | 2004 and prior | $ | 1,475 | | 0.5 | % | | $ | 411 | | 0.5 | % | |
| 2004 and prior | |
| 2004 and prior | | $ | 1.2 | | 0.4 | % | | $ | 0.3 | | 0.4 | % | | 7.4 | % | 12.7 | % | — | % | N.M. |
| 2005-2008 | 2005-2008 | 11,610 | | 3.9 | % | | 3,083 | | 4.0 | % | | 6.9 | % | 10.9 | % | — | % | 4.8 | % | 2005-2008 | $ | 9.9 | | 3.4 | 3.4 | % | | $ | 2.6 | | 3.4 | 3.4 | % | | 7.0 | % | 10.6 | % | — | % | 4.1 | % |
| 2009-2015 | 6,457 | | 2.2 | % | | 1,754 | | 2.3 | % | | 4.3 | % | 4.7 | % | — | % | 3.6 | % |
| 2016 | 6,527 | | 2.2 | % | | 1,749 | | 2.3 | % | | 3.9 | % | 3.2 | % | — | % | 13.6 | % |
| 2017 | 7,839 | | 2.7 | % | | 2,059 | | 2.7 | % | | 4.2 | % | 3.8 | % | — | % | 15.9 | % |
| 2018 | 8,106 | | 2.7 | % | | 2,081 | | 2.8 | % | | 4.8 | % | 4.4 | % | — | % | 16.2 | % |
| 2019 | 17,285 | | 5.9 | % | | 4,447 | | 5.8 | % | | 4.1 | % | 2.2 | % | 1.5 | % | 26.6 | % |
| 2009-2019 | | 2009-2019 | $ | 35.6 | | 12.1 | % | | $ | 9.4 | | 12.1 | % | | 4.3 | % | 3.5 | % | — | % | 9.1 | % |
| 2020 | 2020 | 64,659 | | 21.9 | % | | 16,204 | | 21.2 | % | | 3.2 | % | 1.0 | % | 28.7 | % | 56.6 | % | 2020 | $ | 50.8 | | 17.3 | 17.3 | % | | $ | 13.2 | | 17.2 | 17.2 | % | | 3.2 | % | 1.2 | % | 5.0 | % | 44.4 | % |
| 2021 | 2021 | 100,796 | | 34.1 | % | | 26,004 | | 34.0 | % | | 3.1 | % | 0.9 | % | 29.2 | % | 85.5 | % | 2021 | $ | 86.5 | | 29.5 | 29.5 | % | | $ | 22.8 | | 29.6 | 29.6 | % | | 3.1 | % | 1.4 | % | 29.7 | % | 73.4 | % |
| 2022 | 2022 | 70,545 | | 23.9 | % | | 18,680 | | 24.4 | % | | 4.8 | % | 0.4 | % | 30.4 | % | 96.4 | % | 2022 | $ | 66.3 | | 22.6 | 22.6 | % | | $ | 17.6 | | 22.8 | 22.8 | % | | 4.9 | % | 1.2 | % | 30.5 | % | 89.3 | % |
| Total | $ | 295,298 | | 100.0 | % | | $ | 76,472 | | 100.0 | % | | |
| 2023 | | 2023 | $ | 43.3 | | 14.7 | % | | $ | 11.2 | | 14.5 | % | | 6.6 | % | 0.2 | % | 26.5 | % | 96.0 | % |
Total (1) | |
MGIC Investment Corporation 20222023 Form 10-K | 13
MGIC Investment Corporation and Subsidiaries
Product Characteristics.Characteristics
The following table reflects, at the dates and by the categories indicated, the total dollar amount of primary RIF and the percentage of that primary RIF, as determined on the basis of information available on the date of mortgage origination.
| | Characteristics of primary risk in force | Characteristics of primary risk in force | Characteristics of primary risk in force |
| | December 31, 2022 | | December 31, 2021 |
Primary RIF (In millions): | $ | 76,472 | | | $ | 69,337 | |
| December 31, 2023 | |
| December 31, 2023 | |
| December 31, 2023 | | | December 31, 2022 |
Primary RIF (In billions): | |
| Loan-to-value ratios: | Loan-to-value ratios: | |
| 95.01% and above | |
| 95.01% and above | |
| 95.01% and above | 95.01% and above | 15.2 | % | | 14.7 | % | 15.7 | % | | 15.2 | % |
| 90.01 - 95.00% | 90.01 - 95.00% | 52.0 | % | | 50.4 | % | 90.01 - 95.00% | 52.4 | % | | 52.0 | % |
| 85.01 - 90.00% | 85.01 - 90.00% | 27.2 | % | | 28.1 | % | 85.01 - 90.00% | 27.2 | % | | 27.2 | % |
| 80.01 - 85.00% | 80.01 - 85.00% | 5.4 | % | | 6.4 | % | 80.01 - 85.00% | 4.5 | % | | 5.4 | % |
| 80% and below | 80% and below | 0.2 | % | | 0.4 | % | 80% and below | 0.2 | % | | 0.2 | % |
| Total | Total | 100.0 | % | | 100.0 | % | Total | 100.0 | % | | 100.0 | % |
| Debt-to-income ratios: | Debt-to-income ratios: | |
| 45.01% and above | 45.01% and above | 15.6 | % | | 13.6 | % |
| 45.01% and above | |
| 45.01% and above | | 17.5 | % | | 15.6 | % |
| 38.01% - 45.00% | 38.01% - 45.00% | 31.6 | % | | 31.5 | % | 38.01% - 45.00% | 31.8 | % | | 31.6 | % |
| 38% and below | 38% and below | 52.8 | % | | 54.9 | % | 38% and below | 50.7 | % | | 52.8 | % |
| Total | Total | 100.0 | % | | 100.0 | % | Total | 100.0 | % | | 100.0 | % |
| Loan Type: | Loan Type: | |
Fixed(1) | Fixed(1) | 99.5 | % | | 99.4 | % |
Fixed(1) | |
Fixed(1) | | 99.6 | % | | 99.5 | % |
ARMs(2) | ARMs(2) | 0.5 | % | | 0.6 | % | ARMs(2) | 0.4 | % | | 0.5 | % |
| Total | Total | 100.0 | % | | 100.0 | % | Total | 100.0 | % | | 100.0 | % |
Original Insured Loan Amount:(3) | Original Insured Loan Amount:(3) | |
| Conforming loan limit and below | |
| Conforming loan limit and below | |
| Conforming loan limit and below | Conforming loan limit and below | 97.3 | % | | 97.5 | % | 97.3 | % | | 97.3 | % |
| Non-conforming | Non-conforming | 2.7 | % | | 2.5 | % | Non-conforming | 2.7 | % | | 2.7 | % |
| Total | Total | 100.0 | % | | 100.0 | % | Total | 100.0 | % | | 100.0 | % |
| Mortgage Term: | Mortgage Term: | |
| 15-years and under | 15-years and under | 1.1 | % | | 1.7 | % |
| 15-years and under | |
| 15-years and under | | 0.7 | % | | 1.1 | % |
| Over 15 years | Over 15 years | 98.9 | % | | 98.3 | % | Over 15 years | 99.3 | % | | 98.9 | % |
| Total | Total | 100.0 | % | | 100.0 | % | Total | 100.0 | % | | 100.0 | % |
| Property Type: | Property Type: | |
| Single-family detached | |
| Single-family detached | |
| Single-family detached | Single-family detached | 86.9 | % | | 86.9 | % | 86.7 | % | | 86.9 | % |
| Condominium/Townhouse/Other attached | Condominium/Townhouse/Other attached | 12.5 | % | | 12.4 | % | Condominium/Townhouse/Other attached | 12.6 | % | | 12.5 | % |
Other(4) | Other(4) | 0.6 | % | | 0.7 | % | Other(4) | 0.7 | % | | 0.6 | % |
| Total | Total | 100.0 | % | | 100.0 | % | Total | 100.0 | % | | 100.0 | % |
| Occupancy Status: | Occupancy Status: | |
| Owner occupied | Owner occupied | 97.8 | % | | 97.4 | % |
| Owner occupied | |
| Owner occupied | | 98.1 | % | | 97.8 | % |
| Second home | Second home | 2.1 | % | | 2.4 | % | Second home | 1.8 | % | | 2.1 | % |
| Investor property | Investor property | 0.1 | % | | 0.2 | % | Investor property | 0.1 | % | | 0.1 | % |
| Total | Total | 100.0 | % | | 100.0 | % | Total | 100.0 | % | | 100.0 | % |
| Documentation: | Documentation: | |
Reduced:(5) | Reduced:(5) | |
Reduced:(5) | |
Reduced:(5) | |
| Stated | |
| Stated | |
| Stated | Stated | 0.6 | % | | 0.7 | % | 0.5 | % | | 0.6 | % |
| No | No | 0.2 | % | | 0.3 | % | No | 0.2 | % | | 0.2 | % |
| Full documentation | Full documentation | 99.2 | % | | 99.0 | % | Full documentation | 99.3 | % | | 99.2 | % |
| Total | Total | 100.0 | % | | 100.0 | % | Total | 100.0 | % | | 100.0 | % |
MGIC Investment Corporation 20222023 Form 10-K | 14
MGIC Investment Corporation and Subsidiaries
| | Characteristics of primary risk in force | Characteristics of primary risk in force | Characteristics of primary risk in force |
| | December 31, 2022 | | December 31, 2021 |
| December 31, 2023 | |
| December 31, 2023 | |
| December 31, 2023 | | | December 31, 2022 |
FICO Score:(6) | FICO Score:(6) | |
| 760 and greater | |
| 760 and greater | |
| 760 and greater | 760 and greater | 42.2 | % | | 42.1 | % | 43.1 | % | | 42.2 | % |
| 740 - 759 | 740 - 759 | 17.7 | % | | 17.2 | % | 740 - 759 | 17.9 | % | | 17.7 | % |
| 720 - 739 | 720 - 739 | 14.1 | % | | 13.7 | % | 720 - 739 | 14.1 | % | | 14.1 | % |
| 700 - 719 | 700 - 719 | 11.1 | % | | 11.1 | % | 700 - 719 | 10.8 | % | | 11.1 | % |
| 680 - 699 | 680 - 699 | 7.7 | % | | 7.9 | % | 680 - 699 | 7.3 | % | | 7.7 | % |
| 660 - 679 | 660 - 679 | 3.3 | % | | 3.3 | % | 660 - 679 | 3.2 | % | | 3.3 | % |
| 640 - 659 | 640 - 659 | 1.9 | % | | 2.2 | % | 640 - 659 | 1.8 | % | | 1.9 | % |
| 639 and less | 639 and less | 2.0 | % | | 2.5 | % | 639 and less | 1.8 | % | | 2.0 | % |
| Total | Total | 100.0 | % | | 100.0 | % | Total | 100.0 | % | | 100.0 | % |
(1)Includes fixed rate mortgages with temporary buydowns (where in effect, the applicable interest rate is typically reduced by one or two percentage points during the first two years of the loan and then increased thereafter to the original interest rate), ARMs in which the initial interest rate is fixed for at least five years, and balloon payment mortgages (a loan with a maturity, typically five to seven years, that is shorter than the loan’s amortization period).
(2)Includes ARMs where payments adjust fully with interest rate adjustments. Also includes pay option ARMs and other ARMs with negative amortization features, which collectively at each of December 31, 20222023 and 2021,2022, represented and 0.1%, respectively, of primary RIF. As indicated in note (1), does not include ARMs in which the initial interest rate is fixed for at least five years. For both December 31, 20222023 and 2021,2022, ARMs with LTV ratios in excess of 90% represented 0.1%, of primary RIF, respectively.
(3)Loans within the conforming loan limit have an original principal balance that does not exceed the maximum original principal balance of loans that the GSEs will purchase. The conforming loan limit for one unit properties was $510,400 for 2020, $548,250 for 2021, and $647,200 for 2022, and is $726,200 for 2023.2023, and is $766,550 for 2024. The limit for high cost communities has been higher and is $1,089,300$1,149,825 for 2023.2024. Non-conforming loans are loans with an original principal balance above the conforming loan limit.
(4)Includes cooperatives and manufactured homes deemed to be real estate.
(5)Reduced documentation loans were originated prior to 2009 under programs in which there was a reduced level of verification or disclosure compared to traditional mortgage loan underwriting, including programs in which the borrower’s income and/or assets were disclosed in the loan application but there was no verification of those disclosures ("stated" documentation) and programs in which there was no disclosure of income or assets in the loan application ("no" documentation). In accordance with industry practice, loans approved by GSE and other automated underwriting (AU) systems under “doc waiver” programs that did not require verification of borrower income are classified by us as “full documentation.” We understand that the GSEs terminated their “doc waiver” programs in the second half of 2008.
(6)Represents the FICO score at loan origination. The weighted average “decision FICO score” at loan origination for NIW in 20222023 was 747753 compared to 749747 in 2021.2022. The FICO score for a loan with multiple borrowers is the lowest of the borrowers’ decision FICO scores. A borrower’s “decision FICO score” is determined as follows: if there are three FICO scores available, the middle FICO score is used; if two FICO scores are available, the lower of the two is used; if only one FICO score is available, it is used. A FICO score is a score based on a borrower’s credit history generated by a model developed by Fair Isaac Corporation.
MGIC Investment Corporation 2022 Form 10-K | 15
MGIC Investment Corporation and Subsidiaries
OTHER PRODUCTS AND SERVICES
Contract Underwriting.
A non-insurance subsidiary of ours provides contract underwriting services for lenders, pursuant to which loans are underwritten to conform to prescribed guidelines. The guidelines might be the lender's own guidelines or the guidelines of Fannie Mae, Freddie Mac or a non-GSE investor. These services are provided for loans that require private mortgage insurance as well as for loans that do not require private mortgage insurance.
Other. We provide insurance and reinsurance related to certain mortgages under GSE credit risk transfer programs. The amount of risk associated with these transactions is currently $226 million.
CUSTOMERS
Originators of residential mortgage loans such as savings institutions, commercial banks, mortgage brokers, credit unions, mortgage bankers and other lenders have historically determined the placement of mortgage insurance written on a flow basis and as a result are our customers. To obtain primary insurance from us, written on a flow basis, a mortgage lender must first apply for and receive a mortgage guaranty master policy from us. Our top 10 customers generated 33%37% of our NIW on a flow basis in 2022, 36%2023 and 33% in 2021 and 41% in 2020.2022. Our relationships with our customers could be adversely affected by a variety of factors, including if our premium rates are higher than those of our competitors, our underwriting requirements are more restrictive than those of our competitors, or our customers are dissatisfied with our claims-paying practices (including insurance policy rescissions and claim curtailments). Information about some of the other factors that can affect a mortgage insurer’s relationship with its customers can be found in our risk factor titled “Competition or changes in our relationships with our customers could reduce our revenues, reduce our premium yields and/or increase our losses” in Item 1A.
MGIC Investment Corporation 2023 Form 10-K | 15
MGIC Investment Corporation and Subsidiaries
SALES AND MARKETING AND COMPETITION
Sales and Marketing.Marketing
Our employees sell our insurance products throughout all regions of the United States, Puerto Rico, and Guam.
Competition.Competition
Our competition includes other mortgage insurers, governmental agencies and products designed to eliminate the need to purchase private mortgage insurance. For flow business, weWe and other private mortgage insurers compete directly with federal and state government and quasi-governmental agencies, principally the FHA and the VA. The FHA, VA and USDA sponsor government-backed mortgage insurance programs, and it is estimated that during 2022,2023, they accounted for a combined approximately 52.8%55.9% of the total low down payment residential mortgages which were subject to FHA, VA, USDA or primary private mortgage insurance, compared to 56.8% and 56.1%52.8% in 2021 and 2020, respectively.2022. For more information about the market share of the FHA and the VA, see “Overview of the Private Mortgage Insurance Industry and its Operating Environment” above.
The PMI industry is highly competitive. We believe that we currently compete with other private mortgage insurers based on premium rates, underwriting requirements, financial strength (including based on credit or financial strength ratings), customer relationships, name recognition, reputation, strength of management teams and field organizations, the ancillary products and services provided to lenders, and the effective use
of technology and innovation in the delivery and servicing of our mortgage insurance products.
The U.S. PMI industry currently consists of six active mortgage insurers and their affiliates, including MGIC. Our market share (as measured by NIW) was 16.3% in 2023, compared to 18.9% in 2022, compared to 20.6% in 2021 and 18.7% in 2020, in each case excluding HARP refinances.2022. (source: Inside Mortgage Finance).
If we are unable to compete effectively in the current or any future markets as a result of the financial strength ratings assigned to our insurance subsidiaries, our future new insurance written could be negatively affected. Our ability to participate in the non-GSE residential mortgage-backed securities market (the size of which has been limited since 2008, but may grow in the future), could depend on our ability to maintain and improve our investment grade ratings for our insurance subsidiaries. Although the current PMIERs of each of the GSEs do not require an insurer to maintain minimum financial strength ratings, the GSEs consider financial strength ratings to be important when using forms of credit enhancement other than traditional mortgage insurance.
In assigning financial strength ratings, in addition to considering the adequacy of the mortgage insurer’s capital to withstand very high claim scenarios under assumptions determined by the rating agency, we believe rating agencies review a mortgage insurer’s historical and projected operating performance, franchise risk, business outlook, competitive position, management, corporate strategy, enterprise risk management and other factors. The rating agency issuing the financial strength rating can withdraw or change its rating at any time. At the time that this annual report was finalized, the financial strength of MGIC was rated A- (with a stablepositive outlook) by A.M. Best, A3 (with a stable outlook) by Moody’s Investors Service and BBB+A- (with a stable outlook) by Standard & Poor’s Rating Services.
MGIC Investment Corporation 2022 Form 10-K | 16
MGIC Investment Corporation MGIC's Standard and SubsidiariesPoor's Rating was upgraded to A- in January of 2024.
C. Risk Management
ENTERPRISE RISK MANAGEMENT
The Company has an enterprise risk management (“ERM”) framework that it believes is commensurate with the size, nature and complexity of the Company’s business activities (all of which relate to insuring or reinsuring mortgage credit risk) and strategies. Among the key objectives of the ERM framework are to have a clear and well documented shared understanding, by senior management and the Board, of the Company’s risk management philosophy and overall appetite for risk, and that there are appropriate monitoring, management and reporting mechanisms to support the framework.
Risk Governance.
The Company maintains a Senior Management Oversight Committee (“SMOC”) that, at the management level, serves as its primary risk management governance organization. The SMOC oversees the Company’s ERM framework; maintains an enterprise view of risk across a set of identified key risks that may exist from time to time (see “Risk Identification and Assessment” below); and provides support and reporting to the Risk Management Committee of the Company’s Board of Directors (“RMC”). The SMOC, of which the CEO is a member, is chaired by the Company’s Executive Vice President and Chief Risk Officer, who is the principal management liaison to the RMC.
The Board implements its risk oversight function as a whole and through delegation to its Committees which meet regularly and report back to the full Board. The Risk Management Committee coordinates with the Board and other Board Committees regarding the assignment to the Board and Committees of oversight responsibilities for all risks considered to have the greatest impact on the Company's ability to accomplish its strategic goals. Each Committee's charter describes its principal responsibilities, including its oversight responsibility for applicable key risks.
Corporate Sustainability Risk Governance.
The Company maintains a Corporate Sustainability Executive Council that, at the management level, supports the Company's on-going commitment to environmental, health and safety, corporate social responsibility, corporate governance, sustainability, and other public
MGIC Investment Corporation 2023 Form 10-K | 16
MGIC Investment Corporation and Subsidiaries
policy matters relevant to the Company. In performing this general responsibility, the Council has discretion to: adopt the Company’s general strategy with respect to sustainability matters; identify current and emerging sustainability issues that may affect the Company’s business, strategy, operations, performance, or public image; make recommendations regarding policies, practices, procedures, or disclosures to address sustainability matters; oversee the Company’s internal and external reporting and disclosures surrounding sustainability matters; and advise on material concerns of shareholders or stakeholders regarding sustainability matters. The Corporate Sustainability Executive Council will make regular reports to the SLT and to the relevant Committee(s) of the Board of Directors of the Company.
The Board has delegated oversight for the following ESGsustainability matters to the following committees, who regularly report their actions to the Board:
•Risk Management Committee: Mortgage Credit Risk, including risks associated with climate change.
•Management Development, Nominating and Governance Committee: Corporate governance and human capital
management policies such as executive compensation; succession planning; recruitment, retention and development of management resources; workforce planning, recruitment morale and talent; diversity and inclusion initiatives; and work environment, including health and safety.
•Securities Investment Committee: Our investment portfolio; such oversight may include consideration of ESGsustainability factors.
•Audit Committee: Disclosure controls and procedures relating to financial reports made to the SEC as well as ESGand corporate sustainability reports.
•Business Transformation and Technology Committee: Cybersecurity and business continuity.
Risk Management and Controls.
The Company has established enterprise-wide policies, procedures and processes to allow it to identify, assess, monitor and manage the Company’s various risks. Management of these risks is an interdepartmental endeavor, with oversight by the Chief Risk Officer and the SMOC. The Company’s Internal Audit function, which reports to the Audit Committee of the Board of Directors, provides independent ongoing assessments of the Company’s management of certain enterprise risks and reports its findings to the Audit Committee.
Risk Identification and Assessment.
On a regular basis, the Company monitors key risks with a focus on identifying risks or changes to risks with the greatest impact on the Company's ability to accomplish its strategic goals. In addition to the ongoing monitoring, the Company also identifies key risks in a bottom up process facilitated through questionnaires and discussions during an annual compliance and risk forum with co-workers across all business functions. The results of the identification process are reported to and reviewed annually by the SMOC and presented to the RMC and/or the full Board.
Risk Reporting and Communication. The Company's Risk Management department produces various analyses, reports and key risk indicators (“KRIs”) that are reported to the SMOC, the RMC and the Board quarterly. For our largest risk exposure, mortgage credit risk, these KRIs include risk factors for the Company’s NIW, IIF, quality control and claim activity, and the quarterly reports include performance relative to metrics and thresholds. Each of the other Board Committees also receive regular reporting concerning the risks they oversee.
Although the Company has in place the ERM framework discussed above, it may not be effective in identifying, or adequate in controlling or mitigating, the risks we face. For more information, see our Risk Factor titled "If our risk management programs are not effective in identifying, or adequate in controlling or mitigating, the risks we face, or if the models used in our businesses are inaccurate, it could have a material adverse impact on our business, results of operations and financial condition" in Item 1A.
MORTGAGE CREDIT RISK
We believe that mortgage credit risk is materially affected by:
•the condition of the economy, including the direction of change in home prices and employment, in the area in which the property is located;
•the borrower’s credit profile, including the borrower’s credit history, DTI ratio and cash reserves, and the
MGIC Investment Corporation 2022 Form 10-K | 17
MGIC Investment Corporation and Subsidiaries
willingness of a borrower with sufficient resources to make mortgage payments when the mortgage balance exceeds the value of the home;
•the loan product, which encompasses the LTV ratio, the type of loan instrument, including whether the instrument provides for fixed or variable payments and the amortization schedule, the type of property and the purpose of the loan;
•origination practices of lenders and the percentage of coverage on insured loans; and
•the size of insured loans.
We believe that, excluding other factors, claim incidence increases:
MGIC Investment Corporation 2023 Form 10-K | 17
MGIC Investment Corporation and Subsidiaries
•during periods of economic contraction and home price depreciation, including when these conditions may not be nationwide, compared to periods of economic expansion and home price appreciation;
•for loans to borrowers with lower FICO scores compared to loans to borrowers with higher FICO scores;
•for loans to borrowers with higher DTI ratios compared to loans to borrowers with lower DTI ratios;
•for loans with less than full underwriting documentation compared to loans with full underwriting documentation;
•for loans with higher LTV ratios compared to loans with lower LTV ratios;
•for variable payment loans when the reset interest rate significantly exceeds the interest rate at the time of loan origination;
•for loans that permit the deferral of principal amortization compared to loans that require principal amortization with each monthly payment;
•for loans in which the original loan amount exceeds the conforming loan limit compared to loans below that limit; and
•for cash out refinance loans compared to rate and term refinance loans.
Other types of loan characteristics relating to the individual loan or borrower may also affect the risk potential for a loan. The presence of a number of higher-risk characteristics in a loan materially increases the likelihood of a claim on such a loan unless there are other characteristics to mitigate the risk.
We charge higher premium rates to reflect the increased risk of claim incidence that we perceive is associated with a loan. Not all higher risk characteristics are reflected in our premium rates; however, in 2019 we introduced MiQ, our risk-based pricing system that establishes our premium rates based on more risk attributes than were considered in 2018.previously considered. There can be no assurance that our premium rates adequately reflect the increased risk, particularly in a period of economic recession, high unemployment, slowing home price appreciation or home
price declines, or when extraordinary events occur, such as the Covid-19 pandemic, the Russia-Ukraine war,pandemics, wars, periods of extreme inflation, or environmental disasters related to changing climactic conditions. For additional information, see our risk factors in Item 1A, including the one titled “The premiums we charge may not be adequate to compensate us for our liabilities for losses and as a result any inadequacy could materially affect our financial condition and results of operations.”
Underwriting Insurance Applications.Applications
Applications for mortgage insurance are submitted to us through both our delegated and non-delegated options. Under the delegated option, applications are submitted to us electronically and we rely upon the lender’s representations and warranties that the data submitted is true, accurate and consistent with the documents in the lender's loan origination file, when making our insurance decision. If the loan data submitted meets the underwriting requirements, a commitment to insure the loan is immediately issued. If the requirements are not met, the loan is reviewed by one of our underwriters. Non-delegated applications are submitted with documents from the lender’s loan origination file. We apply our underwriting guidelines, eligibility criteria and rating plans to determine coverage eligibility and premium rate. If the loan is eligible for coverage, we will issue a commitment to insure the loan.
Beginning in 2013, we aligned most of our underwriting requirements with Fannie Mae and Freddie Mac for loans that receive and are processed in accordance with certain approval recommendations from a GSE automated underwriting system. Our underwriting requirements are available on our website at http://www.mgic.com/underwriting/index.html. Our underwriters are authorized to approve loans that do not meet all of our underwriting requirements under certain circumstances.
Exposure to Catastrophic Losses.Losses
The PMI industry experienced catastrophic losses in the mid-to-late 1980s, similar to the losses we experienced in 2007-2013. For background information about such losses in 2007-2013, as well as information about the effects of the COVID-19 pandemic, refer to “General – Overview of Private Mortgage Insurance Industry and its Operating Environment” above.
Delinquencies.
The claim cycle on PMI generally begins with the insurer’s receipt of notification of a delinquency on an insured loan from the loan servicer. For reporting purposes, a loan is generally considered to be delinquent when it is two or more payments past due. Most servicers report delinquent loans to us within this two month period. The incidence of delinquency is affected by a variety of factors, including macroeconomic conditions, the level of borrower income growth, unemployment, health issues, family status, the level of interest rates, rates of home price appreciation or depreciation and general borrower creditworthiness. Delinquencies that are not cured result in a claim to us. See “– Claims.” Delinquencies may be cured by the borrower bringing current the delinquent loan payments or by a sale of the property and the satisfaction of all amounts due under the mortgage. In addition, when a policy is rescinded or a claim is denied we remove the loan from our delinquency inventory.
The following table shows the number of insured primary loans, the related number of delinquent loans, the percentage of delinquent loans, and delinquency rate, as of December 31, 2019-2023.
MGIC Investment Corporation 20222023 Form 10-K | 18
MGIC Investment Corporation and Subsidiaries
| | | | | | | | | | | | | | | | | | | | | | | | | | | | | |
| Delinquency statistics for the MGIC book |
| | | | | | | | | |
| December 31, |
| 2023 | | 2022 | | 2021 | | 2020 | | 2019 |
| Primary Insurance: | | | | | | | | | |
| Insured loans in force | 1,139,796 | | 1,180,419 | | 1,164,984 | | 1,126,079 | | 1,079,578 |
| Delinquent loans | 25,650 | | 26,387 | | 33,290 | | 57,710 | | 30,028 |
| Delinquency rate – all loans | 2.25% | | 2.22% | | 2.80% | | 5.11% | | 2.78% |
| Delinquent loans in our claims received inventory | 302 | | 267 | | 211 | | 159 | | 538 |
| | | | | | | | | |
The following table shows the number of insured primary and pool loans, the related number of delinquent loans and the percentage of delinquent loans, or delinquency rate, as of December 31, 2018-2022.
| | | | | | | | | | | | | | | | | | | | | | | | | | | | | |
| Delinquency statistics for the MGIC book |
| | | | | | | | | |
| December 31, |
| 2022 | | 2021 | | 2020 | | 2019 | | 2018 |
| Primary Insurance: | | | | | | | | | |
| Insured loans in force | 1,180,419 | | 1,164,984 | | 1,126,079 | | 1,079,578 | | 1,058,292 |
| Delinquent loans | 26,387 | | 33,290 | | 57,710 | | 30,028 | | 32,898 |
| Delinquency rate – all loans | 2.2% | | 2.8% | | 5.1% | | 2.8% | | 3.1% |
| Defaulted loans in our claims received inventory | 267 | | 211 | | 159 | | 538 | | 809 |
| | | | | | | | | |
| Pool Insurance: | | | | | | | | | |
| Insured loans in force | 14,987 | | 16,342 | | 18,288 | | 20,318 | | 23,675 |
| Delinquent loans | 391 | | 498 | | 680 | | 653 | | 859 |
| Delinquency rate | 2.6% | | 3.1% | | 3.7% | | 3.2% | | 3.6% |
Different geographical areas may experience different delinquency rates due to varying localized economic conditions from year to year and the amount of time it takes for foreclosures to be completed for uncured delinquencies. The primary delinquency rate for the top 15 jurisdictions (based on December 31, 20222023 delinquency inventory) at December 31, 2023, 2022, 2021, and 20202021 appears in table the below.
| | Primary delinquency rate by jurisdiction | Primary delinquency rate by jurisdiction | Primary delinquency rate by jurisdiction |
| | | |
| | | | 2022 | | 2021 | | 2020 | 2023 | | 2022 | | 2021 |
| Florida * | Florida * | 3.1 | % | | 3.7 | % | | 7.5 | % | Florida * | 2.8 | % | | 3.1 | % | | 3.7 | % |
| Texas | Texas | 2.3 | % | | 3.1 | % | | 6.1 | % | Texas | 2.5 | % | | 2.3 | % | | 3.1 | % |
| Illinois * | Illinois * | 2.6 | % | | 3.4 | % | | 5.9 | % | Illinois * | 2.7 | % | | 2.6 | % | | 3.4 | % |
| Pennsylvania * | Pennsylvania * | 2.2 | % | | 2.5 | % | | 4.0 | % | Pennsylvania * | 2.1 | % | | 2.2 | % | | 2.5 | % |
| California | | California | 2.3 | % | | 2.2 | % | | 3.2 | % |
| New York * | New York * | 3.5 | % | | 4.3 | % | | 6.9 | % | New York * | 3.4 | % | | 3.5 | % | | 4.3 | % |
| California | 2.2 | % | | 3.2 | % | | 6.1 | % |
| Ohio * | Ohio * | 2.2 | % | | 2.4 | % | | 4.0 | % | Ohio * | 2.2 | % | | 2.2 | % | | 2.4 | % |
| Michigan | Michigan | 1.9 | % | | 2.4 | % | | 4.0 | % | Michigan | 2.3 | % | | 1.9 | % | | 2.4 | % |
| Georgia | Georgia | 2.3 | % | | 3.1 | % | | 6.2 | % | Georgia | 2.5 | % | | 2.3 | % | | 3.1 | % |
| New Jersey * | New Jersey * | 2.9 | % | | 4.1 | % | | 7.0 | % | New Jersey * | 2.6 | % | | 2.9 | % | | 4.1 | % |
| North Carolina | North Carolina | 1.7 | % | | 2.3 | % | | 4.2 | % | North Carolina | 1.7 | % | | 1.7 | % | | 2.3 | % |
| Maryland | Maryland | 2.4 | % | | 3.3 | % | | 6.0 | % | Maryland | 2.3 | % | | 2.4 | % | | 3.3 | % |
| Indiana | 2.3 | % | | 2.8 | % | | 4.4 | % |
| Indiana * | | Indiana * | 2.5 | % | | 2.3 | % | | 2.8 | % |
| Minnesota | | Minnesota | 1.6 | % | | 1.6 | % | | 2.0 | % |
| Virginia | Virginia | 1.4 | % | | 1.9 | % | | 4.2 | % | Virginia | 1.4 | % | | 1.4 | % | | 1.9 | % |
| Minnesota | 1.6 | % | | 2.0 | % | | 3.5 | % |
| All other jurisdictions | All other jurisdictions | 2.0 | % | | 2.6 | % | | 4.6 | % | All other jurisdictions | 2.0 | % | | 2.0 | % | | 2.6 | % |
| | Note: Asterisk denotes jurisdictions in the table above that predominately use a judicial foreclosure process, which generally increases the amount of time it takes for a foreclosure to be completed. | | | Note: Asterisk denotes jurisdictions in the table above that predominately use a judicial foreclosure process, which generally increases the amount of time it takes for a foreclosure to be completed. | |
| | Note: Asterisk denotes jurisdictions in the table above that predominately use a judicial foreclosure process, which generally increases the amount of time it takes for a foreclosure to be completed. | |
The primary delinquency inventory in those same jurisdictions at December 31, 20222023 and 20212022 appears in “Management’s Discussion and Analysis – Consolidated Results of Operations – Losses and expenses – Loss Reserves,” in Item 7.
Claims
Claims.Claims result from delinquencies that are not cured or a short sale that we approve.cured. . Whether a claim results from an uncured delinquency depends, in large part, on the borrower’s equity in the home at the time of delinquency, the borrower’s or the lender’s ability to sell the home for an amount sufficient to satisfy all amounts due under the mortgage and the willingness and ability of the borrower and lender to enter into a loan modification that provides for a cure of the delinquency. Various factors affect the frequency and amount of claims, including local home prices and employment levels, and interest rates. If a delinquency goes to claim, any renewal premiums collected to insure the loan during the time period between the last paid installment and the claim payment is returned to the servicer along with the claim payment.
Under the terms of our master policy, the lender is required to file a claim for primary insurance with us within 60 days after it has acquired title to the underlying property (typically through foreclosure). For several years, the average time it took to receive a claim associated with a delinquency increased significantly from our historical experience of approximately twelve months. This was, in part, due to new loss mitigation protocols established by servicers and to changes in some state foreclosure laws that may have included, for example, a requirement for additional review and/or mediation processes. Prior to the second quarter of 2020, we had begun to experience a decline in the average time it took servicers to process foreclosures, which had reduced the average time to receive a claim associated with new delinquencies that did not cure. Generally, the longer the period between delinquency and claim filing, the greater the size of the claim, or “severity.” It is difficult to estimate how long it may take for current and future delinquencies that do not cure to develop into paid claims. In light of the uncertainty caused by the COVID-19 pandemic, including the impact of foreclosure moratoriums and forbearance programs, the average number of missed payments at the time a claim is received has increased.
The majority of loans we insured from 2005 through 2008prior to 2014 (which represent 32%37% of the loans in the delinquency inventory) are covered by master policy terms that, except under certain circumstances, do not limit the number of years of accumulated interest that an insured may include in a claim. Under our current
MGIC Investment Corporation 20222023 Form 10-K | 19
MGIC Investment Corporation and Subsidiaries
master policy terms, an insured can include accumulated interest only for the first three years the loan is delinquent.
Other determinants of claim severity are the amount of the mortgage loan, the coverage percentage on the loan, loss mitigation efforts, and local market conditions. For information about our primary average claim paid, see “Management’s Discussion and Analysis – Consolidated Results of Operations – Net Losses and LAE Paid,” in Item 7.
Within 60 days after a claim has been filed and all documents required to be submitted to us have been delivered, we generally have the option to either (1) pay the coverage percentage specified for the insured loan, with the insured retaining title to the underlying property and receiving all proceeds from the eventual sale of the property (we have elected this option for the majority of claim payments in the recent past), (2) pay the loss on the sale of the property if it has already been sold (calculated by subtracting the sale proceeds from the claim amount) or (3) pay 100% of the claim amount in exchange for conveyance to us of good and marketable title to the property. After we receive title to a property, we sell it for our own account. If we fail to pay a claim timely, we are subject to additional interest expense.
Claim activity is not evenly spread throughout the coverage period of a book of primary business. Relatively few claims are typically received during the first two years following issuance of coverage on a loan. The highest level of claim activity has typically occurred in the third and fourth years after the year of loan origination. Thereafter, the number of claims received has typically declined at a gradual rate, although the rate of decline can be affected by conditions in the economy, including slowing home price appreciation or home price depreciation. Moreover, when a loan is refinanced, because the new loan replaces, and is a continuation of, an earlier loan, the pattern of claims frequency for that new loan may be different from the typical pattern for other loans. Persistency, the condition of the economy, including unemployment, and other factors can affect the pattern of claim activity. For example, a weak economy can lead to claims from older books of business increasing, continuing at stable levels or experiencing a lower rate of decline. As of December 31, 2022, 80%2023, 67% of our primary RIF was written subsequent to December 31, 2020, 84% of our primary RIF was written subsequent to December 31, 2019, 85%and 89% of our primary RIF was written subsequent to December 31, 2018, and 88% of our primary RIF was written subsequent to December 31, 2017.2018. See “Our Products and Services – Mortgage Insurance – Primary Insurance In Force and Risk In Force by Policy Year” above.
Loss Mitigation.
Before paying a claim, generally we review the loan and servicing files to determine the appropriateness of the claim amount. Our insurance policies generally provide that we can reduce or deny a claim if the servicer did not comply with its obligations under our insurance policy, including the requirement to mitigate our loss by performing reasonable loss mitigation efforts or, for example, diligently pursuing a foreclosure or bankruptcy relief in a timely manner. We call such reduction of claims submitted to us “curtailments."curtailments.” In each of 20222023 and 2021,2022, curtailments reduced our average claim paid by approximately 6.3%5.4% and 4.4%6.3%, respectively. The COVID-19-related foreclosure moratoriums and forbearance plans, along with increased home prices, resulted in decreased claims paid activity beginning in the second quarter of 2020. It is difficult to predict the level of curtailments oncethat will occur in the future as loans that were subject to these foreclosure moratoriums and forbearance plans end.work their way through the claim process.
When reviewing the loan file associated with a claim, we may determine that we have the right to rescind coverage on the loan. In our SEC reports, we refer to insurance rescissions and denials of claims as “rescissions” and variations of this term. The circumstances in which we are entitled to rescind coverage narrowed under more restrictive policy terms beginning in 2012. As a result of revised PMIERs requirements, we have revised our master policy effective for new insurance written beginning March 1, 2020. Our ability to rescind insurance coverage has become further limited for insurance we write under the new master policy, potentially resulting in higher losses than would be the case under our previous master policies. In recent years, an immaterial percentage of claims received in a quarter have been resolved by rescissions. We do not expect future rescissions will be a significant portion of the claims we resolve over the next few years.
Our loss reserving methodology incorporates our estimates of future rescissions, curtailments, and reversals of rescissions and curtailments. When we rescind coverage, we return all premiums previously paid to us under the policy and are relieved of our obligation to pay a claim under the policy. A variance between ultimate actual rescission, curtailment or reversal rates and our estimates, as a result of the outcome of litigation, settlements or other factors, could materially affect our losses.
When the insured disputes our right to rescind coverage or curtail a claim, we generally engage in discussions in an attempt to settle the dispute. If we are unable to reach a settlement, the outcome of a dispute ultimately may be determined by legal proceedings. Under ASC 450-20, until a liabilityloss associated with settlement discussions or legal proceedings becomes probable and can be reasonably estimated, we consider our claim payment or rescission resolved for financial reporting purposes and do not accrue an estimated loss. When we determine that a loss is probable and can be reasonably estimated, we record our best estimate of our probable loss.
Loss Reserves.
A significant period of time typically elapses between the time when a borrower becomes delinquent on a mortgage payment, which is the event triggering a potential future claim payment by us, the reporting of the delinquency to us, the acquisition of the property by the lender (typically through foreclosure) or the sale of the property, and the eventual payment of the claim related to the uncured delinquency or a rescission. To recognize the estimated liability for losses related to outstanding reported delinquencies, we establish loss reserves by estimating the number of loans in our delinquency inventory that will result in a claim payment, which is referred to as the claim rate, and further estimating the amount of the claim payment, which is referred to as claim severity. Our loss reserve estimates are established primarily based upon historical experience, including rescission and curtailment activity. In accordance with GAAP for the mortgage insurance industry, we generally do not establish case reserves for future claims on insured loans that are not currently delinquent.
MGIC Investment Corporation 2023 Form 10-K | 20
MGIC Investment Corporation and Subsidiaries
We also establish reserves to provide for the estimated costs of settling claims, general expenses of administering the claims settlement process, legal fees and other fees (“loss adjustment expenses”), and for losses and loss adjustment expenses from delinquencies that have occurred, but have not yet been reported to us (IBNR).
MGIC Investment Corporation 2022 Form 10-K | 20
MGIC Investment Corporation and Subsidiaries
Our reserving process bases our estimates of future events on our past experience. For further information about our loss reserving methodology, refer to “Management’s Discussion and Analysis – Critical Accounting Estimates,” in Item 7. Estimation of loss reserves is inherently judgmental and conditions that have affected the development of the loss reserves in the past may not necessarily affect development patterns in the future, in either a similar manner or to a similar degree. For further information, see our risk factors in Item 1A, including the ones titled “Because we establish loss reserves only upon a loan delinquency rather than based on estimates of our ultimate losses on risk in force, losses may have a disproportionate adverse effect on our earnings in certain periods,” and “Because loss reserve estimates are subject to uncertainties, paid claims may be substantially different than our loss reserves.”
Our losses incurred were $(20.9) million in 2023, compared to $(254.6) million and $64.6 million in 2022 compared to $64.6 million and $364.8 million in 2021, and 2020, respectively. Our losses incurred in 2020 were above the levels of the other years shown as a result of losses stemming from the COVID-19 pandemic. For information about losses incurred from 20202021 to 2022,2023, including the amounts of losses incurred that are associated with delinquency notices received in the reporting year compared to losses incurred associated with delinquency notices received in prior years, see Note 8 – "Loss Reserves" to our consolidated financial statements in Item 8.
D. Reinsurance Agreements
We have in place quota share reinsurance ("QSR") and excess of loss reinsurance ("XOL") transactions providing various amounts of coverage on 85% of our risk in force as of December 31, 2022.2023. These transactions allow us to better manage our risk profile, and because they reduce the amount of capital we are required to hold to comply with insurance regulatory requirements and the requirements of the GSEs' PMIERs. Our reinsurance strategy focuses on reinsuring our most recent or future NIW, while recapturing risk on attractive seasoned vintages.
QUOTA SHARE TRANSACTIONS
Our QSR Transactions are with unaffiliated reinsurers. As of December 31, 2023, our QSR transactions cover most of our insurance written from 2021 through 2024, and a smaller percentage of our insurance written from 2025. The weighted average coverage percentage of our QSR transactions was 32.0%, based on risk in force as of December 31, 2023.
Quota Share Transactions.
At December 31, 2023 and 2022, approximately 60.4% and 2021, approximately 68% and 78%67.9%, respectively, of our IIF was subject to quota share reinsurance ("QSR") transactions. In 2023 and 2022, approximately 86.8% and 2021, approximately 87% and 82%87.4%, respectively, of our NIW was subject to QSR transactions.
Our QSR transactions are with unaffiliated reinsurers and cover most of our insurance written from 2020 through 2023, and a smaller percentage of our insurance written from 2024 through 2025. The weighted average coverage percentage of our QSR transactions was 33%, based on risk in force as of December 31, 2022.
The structure of the QSR transactions is a quota share of various percentages of the policies covered, with a ceding commission and a profit commission. Generally, under the transactions, we will receive an annualThe profit commission providedunder our QSR Transactions also varies inversely with the annuallevel of ceded losses incurred on a “dollar for dollar” basis and can be eliminated at ceded loss ratiolevels higher than what we have experienced on the loans covered under the transactions remains below various percentages, depending upon the transaction.our QSR Transactions
Excess of Loss Transactions. EXCESS OF LOSS TRANSACTIONS
We have XOL transactions with a panel of unaffiliated reinsurers executed through the traditional reinsurance market (“Traditional XOL") and with unaffiliated special purpose insurers (“Home Re") transactions. Our Home Re transactions issued notes linked to the reinsurance coverage ("Insurance Linked Notes" or "ILNs"). Our XOL transactions provide XOL reinsurance coverage for a portion of the risk associated with certain mortgage insurance policies having
insurance coverage in force dates from July 1, 2016 through March 31, 2019 and January 1, 2020 through December 30, 2022,29, 2023, all dates inclusive.
For the reinsurance coverage periods, we retain the first layer of the respective aggregate losses, and the reinsurers will then provide second layer coverage up to the outstanding reinsurance coverage amount. We retain losses in excess of the outstanding reinsurance coverage amount. The aggregate XOL reinsurance coverage decreases over a period of either 10 of 12.5 years, depending on the transaction, subject to certain conditions, as the underlying covered mortgages amortize or are repaid, or mortgage insurance losses are paid.
The special purpose insurersHome Re Entities financed the coverages with the proceeds of the ILNs in an aggregate amount equal to the initial reinsurance coverage amounts. Each ILN is non-recourse to any of our assets. The proceeds of the ILNs, which were deposited into reinsurance trusts for our benefit, will be the source of reinsurance claim payments to us and principal repayments on the ILNs.
Although reinsuring against possible loan losses does not discharge us from liability to a policyholder, it reduces the amount of capital we are required to retain against potential future losses for PMIERs, rating agency and insurance regulatory purposes. The calculated credit for XOL reinsurance transactions under PMIERs is generally based on the PMIERs requirement of the covered loans and the attachment and detachment point of the coverage, all of which fluctuate over time. PMIERs credit is generally not given for the reinsured risk above the PMIERs requirement. The GSEs have discretion to further limit reinsurance credit under the PMIERs. The total credit for risk ceded under our reinsurance transactions is subject to periodic review by the GSEs.
MGIC Investment Corporation 2023 Form 10-K | 21
MGIC Investment Corporation and Subsidiaries
For further information about our reinsurance agreements, including the Company's early termination rights, see Note 9 – “Reinsurance,” to our consolidated financial statements in Item 8, and our risk factor titled "Reinsurance may not always be available unavailable at current levels and prices, and/or its costthe GSEs may increase"reduce the amount of capital credit we receive for our reinsurance transactions" in Item 1A.
E. Investment Portfolio
POLICY AND STRATEGY
At December 31, 2022,2023, the fair value of our investment portfolio was approximately $5.4$5.7 billion. In addition, at December 31, 2022,2023, our total assets included approximately $333$364 million of cash and cash equivalents. At December 31, 2022,2023, approximately $647$918 million of investments and cash and cash equivalents was held by our parent company, and the remainder was held by our subsidiaries, primarily MGIC.
As of December 31, 2022,2023, approximately 95%92% of our investment portfolio (excluding cash and cash equivalents) was managed by two external investment managers, although we maintain overall control of investment policy and strategy. We maintain direct management of the remainder of our investment portfolio. Unless otherwise indicated, the remainder of the discussion regarding our investment portfolio refers to our investment portfolio only and not to cash and cash equivalents.
The investment policyOur management is responsible for the execution of our operating companies (primarily MGIC)investment strategy and compliance with the adopted investment policies, and review of investment performance and strategy with the Securities Investment Committee of the Board of Directors on a quarterly basis.
Our current strategy for the investment portfolio emphasizes the following: preservation of PMIERs assets, limiting
MGIC Investment Corporation 2022 Form 10-K | 21
MGIC Investment Corporation and Subsidiaries
portfolio volatility, and maximizing total return with an emphasis on yield, (subject to the other objectives). Our holding company investment policy emphasizesand providing sufficient liquidity with minimal realized losses through holding high credit quality, low volatility assets.to meet expected and unexpected obligations. Consequently, our investment portfolio consists almost entirely of high-quality, investment grade, fixed income securities. Our investment portfolio strategy considers tax efficiency. The mix of tax-exempt municipal securities in our investment portfolio will be dependent upon their value, relative to taxable equivalent securities, determined in part by federal statutory tax rates. Our investment policies and strategies are subject to change depending upon regulatory, economic and market conditions and our existing or anticipated financial condition and operating requirements.
Our investment policies in effect at December 31, 2022 limit investments in the securities of a single issuer, other than the U.S. government, and generally limit the purchase of fixed income securities to those that are rated investment grade by at least one rating agency. They also limit the amount of investment in foreign governments and foreign domiciled securities and in any individual foreign country. In addition, the guidelines require the portfolio to carry a weighted average credit quality of at least an "A" rating.
The aggregate market value of the holdings of a single obligor, or type of investment, as applicable, is limited to:
| | | | | | | | |
U.S. government and GNMA securities | | No limit |
Pre-refunded municipals escrowed in Treasury securities | | No limit |
Individual U.S. government agencies(1)
| | 10% of portfolio market value |
Individual securities rated “AAA” or “AA” (2)
| | 3% of portfolio market value |
Individual securities rated “BBB” or “A” (2)
| | 2% of portfolio market value |
Foreign governments & foreign domiciled securities (in total) (3)
| | 25% of portfolio market value |
(1)As used with respect to our investment portfolio, U.S. government agencies include all GSEs and Federal Home Loan Banks.
(2)For the holding company, individual securities with a rating of "AA" or "AAA" may represent a maximum 10% of the portfolio market value and individual securities with a rating of "BBB" or "A" may represent a maximum 5%.
(3)For the holding company, there is no maximum aggregate limit for foreign government or foreign domiciled securities.
Investment Operations
At December 31, 2022,2023, the sectors represented in our investment portfolio were as shown in the table below:
| | | | | |
| Investment portfolio - sectors | |
| |
| Percentage of Portfolio’s Fair Value |
| 1. Corporate | 41%44% |
| 2. Tax-Exempt Municipals | 18%10% |
| 3. Taxable Municipals | 22%23% |
| 4. Asset-Backed | 13% |
| 5. U.S. government and agency debt | 2%3% |
| 6. GNMA and other agency mortgage-backed securities | 4%7% |
| 100% |
We have no derivative financial instruments in our investment portfolio. Securities with stated maturities due within up to one year, after one year and up to five years, after five years and up to ten years, and after ten years, represented 8%11%, 24%26%, 32%30%, and 20%14%, respectively, of the total fair value of our fixed income investment securities. Asset-backed and mortgage-backed securities are not included in these maturity categories as the expected maturities may be different from the stated maturities depending upon the periodic payments during the life of the security. Asset-backed securities represent 13% of the investment portfolio (CLOs represent 6%, CMBS represent 5%4% and other asset-backed securities represent 2%3%). GNMA and other agency mortgage-backed securities represent 4%7% of the investment portfolio. Our pre-tax yield was 3.0%3.7%, 2.5%3.0%, and 2.6%2.5% for 2023, 2022, 2021, and 2020,2021, respectively, and our after-tax yield was 2.5%3.0%, 2.1%2.5%, and 2.1% for 2023, 2022, 2021, and 2020,2021, respectively.
MGIC Investment Corporation 2023 Form 10-K | 22
MGIC Investment Corporation and Subsidiaries
Our ten largest holdings at December 31, 20222023 appear in the table below:
| | Investment portfolio - Ten largest holdings | Investment portfolio - Ten largest holdings | Investment portfolio - Ten largest holdings |
| | Fair Value (In thousands) |
| (In thousands) | |
| (In thousands) | |
| (In thousands) | | Fair Value |
| 1 | 1 | New York St Dorm Auth Rev | $ | 73,595 | |
| 2 | 2 | Bank of America Corp | 40,719 | |
| 3 | 3 | New York NY City Transitional | 38,852 | |
| 4 | 4 | Chicago Transit Authority | 36,326 | |
| 5 | 5 | JP Morgan Chase | 35,271 | |
| 6 | 6 | Citigroup Inc | 31,532 | |
| 7 | 7 | Morgan Stanley | 31,478 | |
| 8 | 8 | City of Bridgeport CT | 30,363 | |
| 9 | 9 | Metropolitan Trans Auth NY | 27,650 | |
| 10 | 10 | Regatta VI Funding Ltd. | 27,445 | |
| $ | 373,231 | |
| | $ | |
Note: This table excludes securities issued by the U.S. government or U.S. government agencies.
MGIC Investment Corporation 2022 Form 10-K | 22
MGIC Investment Corporation and Subsidiaries
F. Regulation
Direct RegulationDIRECT REGULATION
We are subject to comprehensive, detailed regulation by state insurance departments. These regulations are principally designed for the protection of our insured policyholders, rather than for the benefit of investors. Although their scope varies, state insurance laws generally grant broad supervisory powers to agencies or officials to examine insurance companies and enforce rules or exercise discretion affecting almost every significant aspect of the insurance business.
In general, regulation of our subsidiaries’ businesses relates to:
•minimum capital levels and adequacy ratios;
•requirements regarding contingency reserves;
•premium rates and discrimination in pricing;
•licenses to transact businesses;
•policy forms;
•insurable loans;
•annual and other reports on financial condition;
•the basis upon which assets and liabilities must be stated;
•reinsurance requirements;
•limitations on the types of investment instruments which may be held in an investment portfolio;
•privacy;
•deposits of securities;
•transactions among affiliates;
•restrictions on transactions that have the effect of inducing lenders to place business with the insurer;
•cybersecurity;
•limits on dividends payable (for a description of limits on dividends payable to us from MGIC, see Note 14 – “Statutory Information,” to our consolidated financial statements in Item 8); •suitability of officers and directors; and
•claims handling.
Future regulation is expected to address the use of algorithms, artificial intelligence and data and analytics to determine pricing and for other purposes.
Wisconsin, our domiciliary state, has adopted the Risk Management and Own Risk and Solvency Assessment Act, which requires, among other things, that we conduct an Own Risk and Solvency Assessment ("ORSA"), at least annually, to assess the material risks associated with our business and our current and estimated projected future solvency position; and maintain a risk management
MGIC Investment Corporation 2023 Form 10-K | 23
MGIC Investment Corporation and Subsidiaries
framework to assess, monitor, manage and report on material risks. Wisconsin has also adopted the annual enterprise risk reporting, group capital calculation, and "Corporate Governance Disclosure" requirements of the NAIC Model Act.
The insurance laws of 16 jurisdictions, including Wisconsin, our domiciliary state, require a mortgage insurer to maintain a minimum amount of statutory capital relative to the RIF (or a similar measure) in order for the mortgage insurer to continue to write new business. We refer to these requirements as the “State Capital Requirements.” While they vary among jurisdictions, currently the most common State Capital Requirements allow for
a maximum risk-to-capital ratio of 25 to 1. Wisconsin does not regulate capital by using a risk-to-capital measure but instead requires a minimum policyholder position. MGIC's “policyholder position” includes its net worth or surplus and its contingency reserve.
At December 31, 2022,2023, MGIC’s risk-to-capital ratio was 10.2 to 1, below the maximum allowed by the jurisdictions with State Capital Requirements, and its policyholder position was $3.5$3.6 billion above the required MPP of $2.1$2.2 billion.
The NAIC previously announced plans to revise the minimum capital and surplus requirements for mortgage insurers that are provided for in itsestablished a Mortgage Guaranty Insurance Model Act. In December 2019, a working group of state regulators released an exposureWorking Group to determine and make recommendations to the NAIC’s Financial Condition Committee as to what, if any, changes to make to the solvency and other regulations relating to mortgage guaranty insurers. A draft of a revised Mortgage Guaranty Insurance Model Act and a risk-based capital framework to establish capital requirements for mortgage insurers, although certain terms were not completely addressedwas adopted by the framework, includingFinancial Condition Committee in July 2023 and by the treatment of ceded riskExecutive Committee and Plenary NAIC in August 2023. The revised Model Act includes requirements relating to, among other things: (i) capital and minimum capital floors. In October 2022,requirements, and contingency reserves; (ii) restrictions on mortgage insurers’ investments in notes secured by mortgages; (iii) prudent underwriting standards and formal underwriting guidelines; (iv) the NAIC working group released aestablishment of formal, internal “Mortgage Guaranty Quality Control Programs” with respect to in-force business; and (v) reinsurance and prohibitions on captive reinsurance arrangements. It is uncertain when the revised exposure draftModel Act will be adopted in any jurisdiction. The provisions of the Mortgage Guaranty Insurance Model Act, that doesif adopted in their final form, are not includeexpected to have a material adverse effect on our business. It is unknown whether any changes will be made by state legislatures prior to adoption, and the capital requirements ofeffect changes, if any, will have on the existing Model Act.mortgage guaranty insurance market generally, or on our business. See our risk factors “We may not continue to meet the GSEs’ mortgage insurer eligibility requirements and our returns may decrease as we are required to maintain significantly more capital in order to maintain our eligibility” and “State Capital requirements may prevent us from continuing to write new insurance on an uninterrupted basis” in Item 1A, for information about regulations governing our capital adequacy and our expectations regarding our future capital position. See "Management's Discussion and Analysis – Liquidity and Capital Resources – Capital Adequacy" in Item 7 for information about our current capital position.
We are required to establish statutory accounting contingency loss reserves in an amount equal to 50% of earned premiums. These amounts cannot be withdrawn for a period of 10 years, except as permitted by insurance regulations. With regulatory approval, a mortgage insurance company may make early withdrawals from the contingency reserve when incurred losses exceed 35% of net premiums earned in a calendar year. Although MGIC holds assets in excess of its minimum statutory capital requirements and its PMIERs financial requirements, the ability of MGIC to pay dividends is restricted by insurance regulation. In general, dividends in excess of prescribed limits are deemed “extraordinary” and may not be paid if disapproved by the OCI. The level of ordinary dividends that may be paid without OCI approval is determined on an annual basis. A dividend is extraordinary when the proposed dividend amount, plus dividends paid in the twelve months preceding the dividend payment date exceed the ordinary dividend level. In 2023,2024, MGIC can pay $92$64 million of ordinary dividends without OCI approval, before taking into consideration dividends paid in the preceding twelve months. In 2022,2023, MGIC paid $800$600 million in dividends of cash and investments to the holding company. For further information, see Note 14 – “Statutory Information,” to our consolidated financial statements in Item 8.
Mortgage insurance premium rates are subject to state regulation to protect policyholders against the adverse effects of excessive, inadequate or unfairly discriminatory rates and to encourage competition in the insurance marketplace. Any increase in premium rates must be justified, generally on the basis of the insurer’s loss experience, expenses and future trend
MGIC Investment Corporation 2022 Form 10-K | 23
MGIC Investment Corporation and Subsidiaries
analysis. The general mortgage default experience may also be considered. Premium rates are subject to review and challenge by state regulators.
Mortgage insurers are generally single-line companies, restricted to writing residential mortgage insurance business only. Although we, as an insurance holding company, are prohibited from engaging in certain transactions with MGIC or our other insurance subsidiaries without submission to and, in some instances, prior approval by applicable insurance departments, we are not subject to insurance company regulation on our non-insurance businesses.
Wisconsin’s insurance regulations generally provide that no person may acquire control of us unless the transaction in which control is acquired has been approved by the OCI. The regulations provide for a rebuttable presumption of control when a person owns or has the right to vote more than 10% of the voting securities. In addition, the insurance regulations of other states in which MGIC is licensed require notification to the state’s insurance department a specified time before a person acquires control of us. If regulators in these states disapprove the change of control, our licenses to conduct business in the disapproving states could be terminated. For further information about regulatory proceedings applicable to us and our industry, see “We are subject to comprehensive regulation and other requirements, which we may fail to satisfy” in Item 1A.
The CFPB’s rules implementing laws that require mortgage lenders to make ability-to-pay determinations prior to extending credit affect the characteristics of loans being originated and the volume of loans available to be insured. We are uncertain whether the CFPB will issue any other rules or regulations that affect our business. Such rules and regulations could have a material adverse effect on us.
MGIC Investment Corporation 2023 Form 10-K | 24
MGIC Investment Corporation and Subsidiaries
As the most significant purchasers and sellers of conventional mortgage loans and beneficiaries of private mortgage insurance, the GSEs impose financial and other requirements on private mortgage insurers in order for them to be eligible to insure loans sold to the GSEs (these requirements are referred to as the "PMIERs", as discussed above). These requirements are subject to change from time to time. Based on our interpretation of the financial requirements of the PMIERs, as of December 31, 2022,2023, MGIC’s Available Assets totaled $5.7$5.8 billion, or $2.3$2.4 billion in excess of its Minimum Required Assets. MGIC is in compliance with the requirements of the PMIERs and eligible to insure loans purchased by the GSEs. If MGIC ceases to be eligible to insure loans purchased by one or both of the GSEs, it would significantly reduce the volume of our new business writings. For information about matters that could negatively affect our compliance with the PMIERs, see our risk factor titled “We may not continue to meet the GSEs’ mortgage insurer eligibility requirements and our returns may decrease as we are required to maintain significantly more capital in order to maintain our eligibility” in Item 1A.
The FHFA has been the conservator of the GSEs since 2008 and has the authority to control and direct their operations. The increased role that the federal government has assumed in the residential housing finance system through the GSE conservatorship may increase the likelihood that the business practices of the GSEs change, including through administrative action, in ways that have a material adverse effect on us and that the charters of the GSEs are changed by new federal legislation. For more information about the business practices of the GSEs
that impact our business, see our risk factor titled "Changes in the business practices of Fannie Mae and Freddie Mac ("the GSEs,GSEs"), federal legislation that changes their charters or a restructuring of the GSEs could reduce our revenues or increase our losses"losses." in Item 1A
Indirect RegulationINDIRECT REGULATION
We are also indirectly, but significantly, impacted by regulations affecting purchasers of mortgage loans, such as the GSEs, and regulations affecting governmental insurers, such as the FHA and the VA, and lenders. Private mortgage insurers, including MGIC, are highly dependent upon federal housing legislation and other laws and regulations to the extent they affect the demand for private mortgage insurance and the housing market generally. From time to time, those laws and regulations have been amended in ways that affect competition from government agencies. Proposals are discussed from time to time by Congress and certain federal agencies to reform or modify the FHA and the Government National Mortgage Association, which securitizes mortgages insured by the FHA.
Mortgage insurance generally may be considered to be a “settlement service” for purposes of RESPA under applicable regulations. Subject to certain exceptions, in general, RESPA prohibits any person from giving or receiving any “thing of value” pursuant to an agreement or understanding to refer settlement services.
HOPA provides for the automatic termination, or cancellation upon a borrower’s request, of private mortgage insurance upon satisfaction of certain conditions. For more information, see "Our Products and Services" in Item 1.B.
FCRA imposes restrictions on the permissible use of credit report information. FCRA has been interpreted by some Federal Trade Commission staff and federal courts to require mortgage insurance companies to provide “adverse action” notices to consumers in the event an application for mortgage insurance is declined or offered at less than the best available rate for the loan program applied for on the basis of a review of the consumer’s credit.
The Office of the Comptroller of the Currency, the Federal Reserve Board, and the Federal Deposit Insurance Corporation have uniform guidelines on real estate lending by insured lending institutions under their supervision. The guidelines specify that a residential mortgage loan originated with a loan-to-value ratio of 90% or greater should have appropriate credit enhancement in the form of mortgage insurance or readily marketable collateral, although no depth of coverage percentage is specified in the guidelines.
Lenders are subject to various laws, including the Home Mortgage Disclosure Act, the Community Reinvestment Act, the Equal Credit Opportunity Act, TILA, HOPA, the Secure and Fair Enforcement for Mortgage Licensing Act, FCRA, the Fair Debt Collection Practices Act, the Gramm-Leach-Bliley Act, and the Fair Housing Act, andAct. Fannie Mae and Freddie Mac are subject to various laws, including laws relating to government sponsored enterprises, which may impose obligations or create incentives for increased lending to low and moderate income persons, or in targeted areas.
There can be no assurance that other federal laws and regulations affecting these institutions and entities will not
MGIC Investment Corporation 2022 Form 10-K | 24
MGIC Investment Corporation and Subsidiaries
change, or that new legislation or regulations will not be adopted which will adversely affect the private mortgage insurance industry.
MGIC Investment Corporation 2023 Form 10-K | 25
MGIC Investment Corporation and Subsidiaries
G. Human Capital
Our talent practices reflect a commitment to creating a positive co-worker experience. In 2022,2023, we placed a significant focus on supportingcontinued to support our co-workers in their career journey,journeys and connecting co-workersworked to further connect them to each other and the community – from educating managers on hybrid team-building to curating dozens of volunteer opportunities.community.
The following table provides selected demographic information for our workforce asAs of December 31, 2022.
| | | | | | | | |
Demographics (as of December 31, 2022) |
| | |
Number of Co-Workers | | 683 * |
Average Tenure | | 12 years |
Percent Female | | 56% |
Percent Racial / Ethnic Minorities | | 19% |
Turnover Rate | | 15% |
Average Age | | 48 |
*The number of2023, we had 627 co-workers does not include “on-call”including "on-call" and part-time co-workers. The number of “on-call” co-workers can vary substantially, primarily as a result of changes in demand for contract underwriting services. In recent years, the number of “on-call” co-workers has ranged from fewer than 2510 to more than 110.
Diversity, EquityDIVERSITY EQUITY & InclusionINCLUSION ("DEI")
In 20222023 we established afurthered the work of our DEI Executive Council, an internal group that consists of executive and cross-functional management that reports to the CEO and Corporate Sustainability Executive Council.management. The DEI Executive Council has undertaken a number of initiatives since its inception, including:
•Recognizing eightten DEI observance daysobservances through co-worker education, engagement, action, and actioncharitable contributions
•Launching DEI workshops and dialogue sessions for all MGIC officers
•Prioritizing DEI in each all-company meetingmeetings and engaging executive leadership in ongoing advocacy and endorsement
Total Rewards and Talent PracticesTOTAL REWARDS AND TALENT PRACTICES
Our total rewards program is designed to provide a competitive package of benefits and compensation elements that recognize the unique needs of our workforce and their families. All full-time MGIC co-workers are eligible to participate in our health program, which is calibrated toward well-being through our popular Health Rewards program in addition to a comprehensive medical, dental and vision plan. We also recognize financial health as part of well-being, and so currently provide a 401(k) plan with a company match and discretionary annual profit-sharing contributions. In 2022, we made changes designed to deliver more flexibility to co-workers at all stages of their careers by shifting from a legacy pension plan to increase 401(k) matching, enhancing retiree medical benefits, and expanding our retirement eligibility.
Our talent practices reflect a commitment to creating a positive co-worker experience and investing in development and career growth. In 2022, we rolled out an end-to-end career framework aimed at strengthening our talent pool, promoting equity across departments, setting clear expectations based on role, and creating more opportunities for internal mobility. We also
redesigned our annual bonus program to expand eligibility and give co-workers a greater opportunity to share in company success.
Co-Worker SentimentCO-WORKER SENTIMENT
MGIC conducts an annual engagement survey to gauge co-worker sentiment. In 2022, we saw an 83% participation ratesentiment and added survey questionsconnection to gain deeper insight into co-worker inclusion and belonging.company values. Based on the survey results, we identify and share with our Board of Directors and executive leadership several key areas of strength and opportunity. These strengthFor transparency, these strengths and opportunities are shared with all co-workers, for transparency, and leaders at all levels of the company are expected to play an active role in taking meaningful action in response. The annual engagement survey is complemented by additional quantitative, qualitative and passive listening mechanisms, ranging from new hire surveys to CEO-led focus groups.
Community InvolvementCOMMUNITY INVOLVEMENT
Our commitment to community is formalized under the banner of Giving Back, Together, and in 20222023 included providing financial and in-kind support for organizations that support housing, youth programs, and the arts in our community and nationwide. We also provided paid time off for co-workers to volunteer or work at election polling places.
H. Website Access
We make available, free of charge, our Annual Reports on Form 10-K, Quarterly Reports on Form 10-Q, Current Reports on Form 8-K, and amendments to those reports filed or furnished to the Securities and Exchange Commission ("SEC") as soon as reasonably practicable after we electronically file these materials with the SEC. The reports and amendments are accessible at the “Reports & Filings” link on our website (http://mtg.mgic.com). The inclusion of our website address in this report is an inactive textual reference only and is not intended to include or incorporate by reference the information on our website into this report.
MGIC Investment Corporation 20222023 Form 10-K | 2526
MGIC Investment Corporation and Subsidiaries
PART I
Item 1A. Risk Factors
As used below, “we,” “our” and “us” refer to MGIC Investment Corporation’s consolidated operations or to MGIC Investment Corporation, as the context requires; and “MGIC” refers to Mortgage Guaranty Insurance Corporation.
Risk Factors Relating to Global Events
The Russia-Ukraine warWars and/or other global events may adversely affect the U.S. economy and our business.
Russia's invasion of Ukraine hasWars and/or other global events may result in increased the already-elevated inflation rate, added more pressure torates, strained supply chains, and has increased volatility in the domestic and global financial markets. The war has impacted,Wars and/or other global events have in the past and may continue to impact our business in various ways, including the following which are described in more detail in the remainder of these risk factors:
•The terms under which we are able to obtain quota share reinsurance ("QSR") and/or excess-of-loss ("XOL") reinsurance through the insurance-linked notes ("ILN") market and the traditional reinsurance market have beenmay be negatively impacted and terms under which we are able to access those markets in the future may be limited or less attractive.
•The risk of a cybersecurity incident that affects our company may have increased.increase.
•An extended or broadened warWars may negatively impact the domestic economy, which may increase unemployment and inflation, or decrease home prices, in each case leading to an increase in loan delinquencies.
•The volatility in the financial markets may impact the performance of our investment portfolio and our investment portfolio may include investments in companies or securities that are negatively impacted by the war.wars and/or other global events.
Risk Factors Relating to the Mortgage Insurance Industry and its Regulation
Downturns in the domestic economy or declines in home prices may result in more homeowners defaulting and our losses increasing, with a corresponding decrease in our returns.
Losses result from events that reduce a borrower’s ability or willingness to make mortgage payments, such as unemployment, health issues, changes in family status, and decreases in home prices that result in the borrower's mortgage balance exceeding the net value of the home. A deterioration in economic conditions, including an increase in unemployment, generally increases the likelihood that borrowers will not have sufficient income to pay their mortgages and can also adversely affect home prices.
High levels of unemployment may result in an increasing number of loan delinquencies and an increasing number of insurance claims; however, unemployment is difficult to predict given the uncertainty in the current market environment, including as a result of global events such as wars, instability in the COVID-19 pandemic, the Russia-Ukraine war,financial services industry, and the possibility of an economic recession. Since the beginning of 2021, inflation has increased dramatically. The impact that higher inflation rates will have on loan delinquencies is unknown.
The seasonally-adjusted Purchase-Only U.S. Home Price Index of the Federal Housing Finance Agency (the “FHFA”), which is based on single-family properties whose mortgages have been purchased or securitized by Fannie Mae or Freddie Mac, indicates that home prices fell 0.1%increased 0.3% nationwide in November, 20222023 compared to October, 2022. The2023. Although the 12 month change in home prices remains atrecently reached historically high rates, but the rate of growth is moderating: it increased by 6.7%6.5% in the first eleven months of 2022,2023, after increasing 17.9%, 11.7%6.8%, and 5.9%17.8% in 2021, 20202022 and 2019,2021, respectively. The national average price-to-income ratio exceeds its historical average, in part as a result of recent home price appreciation outpacing increases in income. Affordability issues and the significant increase in interest rates in recent months hascan put downward pressure on home prices. Recent third-party forecasts predict thatA decline in home prices will decline further. This decline may occur even absent a deterioration in economic conditions due to declines in demand for homes, which in turn may result from changes in buyers’ perceptions of the potential for future appreciation, restrictions on and the cost of mortgage credit due to more stringent underwriting standards, higher interest rates, changes to the tax deductibility of mortgage interest, decreases in the rate of household formations, or other factors.
Changes in the business practices of Fannie Mae and Freddie Mac'sMac ("the GSEs"), federal legislation that changes their charters or a restructuring of the GSEs could reduce our revenues or increase our losses.
The substantial majority of our NIWnew insurance written ("NIW") is for loans purchased by the GSEs; therefore, the business practices of the GSEs greatly impact our business. In June 2022 the GSEs each published their Equitable Housing Finance Plans.Plans ("Plans"). Updated Plans were subsequently published by each GSE in April 2023. The Plans seek to advance equity in housing finance over a three yearthree-year period and include potential changes to the GSEs’ business practices and policies. Specifically relating to mortgage insurance, (1) Fannie Mae’s Plan contemplatesincludes the creation of special purchasepurpose credit program(s) ("SPCPs") targeted to historically underserved borrowers with a goal of lowering costs for such borrowers through lower than standard mortgage insurance requirements; and (2) Freddie Mac’s Plan contemplatesincludes plans to work with mortgage insurers to look for ways to lower mortgage costs, the creation of SPCPs targeted to historically underserved borrowers, withand the goalsplanned purchase of (a) working with mortgage insurers to reduce costs for high LTV borrowers, and (b) updating mortgage insurance cancellation requirements.loans originated through lender-created SPCPs. To the extent the business practices and policies of the GSEs regarding mortgage insurance coverage, costs and cancellation change, including more broadly than through SPCPs, such changes may negatively impact the mortgage insurance industry.industry and our financial results.
Other business practices of the GSEs that affect the mortgage insurance industry include:
MGIC Investment Corporation 2023 Form 10-K | 27
MGIC Investment Corporation and Subsidiaries
•The GSEs' private mortgage insurer eligibility requirements ("PMIERs"), the financial requirements of which are discussed in our risk factor titled “We may not continue to meet the GSEs’ private mortgage insurer eligibility requirements and our returns may decrease if we are required to maintain more capital in order to maintain our eligibility.”
•The capital and collateral requirements for participants in the GSEs' alternative forms of credit enhancement discussed in
MGIC Investment Corporation 2022 Form 10-K | 26
MGIC Investment Corporation and Subsidiaries
our risk factor titled "The amount of insurance we write could be adversely affected if lenders and investors select alternatives to private mortgage insurance or are unable to obtain capital relief for mortgage insurance."
•The level of private mortgage insurance coverage, subject to the limitations of the GSEs’ charters, when private mortgage insurance is used as the required credit enhancement on low down payment mortgages (the GSEs generally require a level of mortgage insurance coverage that is higher than the level of coverage required by their charters; any change in the required level of coverage will impact our new risk written).
•The amount of loan level price adjustments and guaranty fees (which result in higher costs to borrowers) that the GSEs assess on loans that require private mortgage insurance. The requirements of the new GSE capital framework may lead the GSEs to increase their guaranty fees. In addition, the FHFA has indicated that it is reviewing the GSEs' pricing in connection with preparing them to exit conservatorship and to ensure that pricing subsidies benefit only affordable housing activities.
•Whether the GSEs select or influence the mortgage lender’s selection of the mortgage insurer providing coverage.
•The underwriting standards that determine which loans are eligible for purchase by the GSEs, which can affect the quality of the risk insured by the mortgage insurer and the availability of mortgage loans.
•The terms on which mortgage insurance coverage can be canceled before reaching the cancellation thresholds established by law and the business practices associated with such cancellations. If the GSEs or other mortgage investors change their practices regarding the timing of cancellation of mortgage insurance due to home price appreciation, policy goals, changing risk tolerances or otherwise, we could experience an unexpected reduction in our insurance in force ("IIF"), which would negatively impact our business and financial results. For more information, see the above discussion of the GSEs' Equitable Housing Plans and our risk factor titled “Changes in interest rates, house prices or mortgage insurance cancellation requirements may change the length of time that our policies remain in force.”
•The programs established by the GSEs intended to avoid or mitigate loss on insured mortgages and the circumstances in which mortgage servicers must implement such programs.
•The terms that the GSEs require to be included in mortgage insurance policies for loans that they purchase, including limitations on the rescission rights of mortgage insurers.
•The extent to which the GSEs intervene in mortgage insurers’ claims paying practices, rescission practices or rescission settlement practices with lenders.
•The maximum loan limits of the GSEs compared to those of the FHAFederal Housing Administration ("FHA") and other investors.
•The benchmarks established by the FHFA for loans to be purchased by the GSEs, which can affect the loans available to be insured. In December 2021, the FHFA established the benchmark levels for 2022-2024 purchases of low-income home mortgages, very low-income home mortgages and low-income refinance mortgages, each of which exceeded the 2021 benchmarks. The FHFA also established two new sub-goals: one targeting minority communities and the other targeting low-income neighborhoods.
The FHFA has been the conservator of the GSEs since 2008 and has the authority to control and direct their operations. Given that the Director of the FHFA is removable by the President at will, the agency's agenda, policies and actions are influenced by the then-current administration. The increased role that the federal government has assumed in the
residential housing finance system through the GSE conservatorships may increase the likelihood that the business practices of the GSEs change, including through administrative action, in ways thatadministration changes and actions. Such changes could have a material adverse effect on usus. The GSEs also possess substantial market power, which enables them to influence our business and that the charters of the GSEs are changed by new federal legislation.mortgage insurance industry in general.
It is uncertain what role the GSEs, FHA and private capital, including private mortgage insurance, will play in the residential housing finance system in the future. The timing and impact on our business of any resulting changes are uncertain. Many of the proposedFor changes that would require Congressional action to implement and it is difficult to estimate when Congressional action would be final and how long any associated phase-in period may last.
We may not continue to meet the GSEs’ private mortgage insurer eligibility requirements and our returns may decrease if we are required to maintain more capital in order to maintain our eligibility.
We must comply with a GSE's PMIERs to be eligible to insure loans delivered to or purchased by that GSE. The PMIERs include financial requirements, as well as business, quality control and certain transaction approval requirements. The PMIERs provide that the GSEs may amend any provision of the PMIERs or impose additional requirements with an effective date specified by the GSEs.
MGIC Investment Corporation 2023 Form 10-K | 28
MGIC Investment Corporation and Subsidiaries
The financial requirements of the PMIERs require a mortgage insurer’s “Available Assets” (generally only the most liquid assets of an insurer) to equal or exceed its “Minimum Required Assets” (which are generally based on an insurer’s book of risk in force and calculated from tables of factors with several risk dimensions, reduced for credit given for risk ceded under reinsurance agreements).
Based on our interpretation of the PMIERs, as of December 31, 2022,2023, MGIC’s Available Assets totaled $5.7$5.8 billion, or $2.3$2.4 billion in excess of its Minimum Required Assets. MGIC is in compliance with the PMIERs and eligible to insure loans purchased by the GSEs. Our "Minimum Required Assets" reflect a credit for risk ceded under our quota share reinsurance ("QSR")QSR and XOL reinsurance transactions, which are discussed in our risk factor titled "TheOur underwriting practices and the mix of business we write affects our Minimum Required Assets under the PMIERs, our premium yields and the likelihood of losses occurring." The calculated credit for XOL reinsurance transactions under PMIERs is generally based on the PMIERs requirement of the covered loans and the attachment and detachment points of the coverage, all of which fluctuate over time. PMIERs credit is generally not given for the reinsured risk above the PMIERs requirement. The GSEs have discretion to further limit reinsurance credit under the PMIERs. Refer to “Consolidated Results of Operations – Reinsurance Transactions” in Part 7I, Item 2 of our Quarterly Report on Form 10-Q for information about the calculated PMIERs credit for our XOL transactions. There is a risk we will not receive our current level of credit in future periods for ceded risk. In addition, we may not receive the same level of credit under future reinsurance transactions that we receive under existing transactions. If MGIC is not allowed certain levels of credit under the PMIERs, under certain circumstances, MGIC may terminate the reinsurance transactions without penalty.
The PMIERs generally require us to hold significantly more Minimum Required Assets for delinquent loans than for performing loans and the Minimum Required Assets required to be held increases as the number of payments missed on a delinquent loan increases. If the number of loan delinquencies increases for reasons discussed in these risk factors, or otherwise, it may cause our Minimum Required Assets to exceed
MGIC Investment Corporation 2022 Form 10-K | 27
MGIC Investment Corporation and Subsidiaries
our Available Assets. We are unable to predict the ultimate number of loans that will become delinquent.
If our Available Assets fall below our Minimum Required Assets, we would not be in compliance with the PMIERs. The PMIERs provide a list of remediation actions for a mortgage insurer's non-compliance, with additional actions possible in the GSEs' discretion. At the extreme, the GSEs may suspend or terminate our eligibility to insure loans purchased by them. Such suspension or termination would significantly reduce the volume of our new insurance written ("NIW"),NIW, the substantial majority of which is for loans delivered to or purchased by the GSEs. In addition to the increase in Minimum Required Assets associated with delinquent loans, factors that may negatively impact MGIC’s ability to continue to comply with the financial requirements of the PMIERs include the following:
•The GSEs may make the PMIERs more onerous in the future. The PMIERs provide that the factors that determine Minimum Required Assets will be updated periodically, or as needed if there is a significant change in macroeconomic conditions or loan performance. We do not anticipate that the regular periodic updates will occur more frequently than once every two years. The PMIERs state that the GSEs will provide notice 180 days prior to the effective date of updates to the factors; however, the GSEs may amend the PMIERs at any time, including by imposing restrictions specific to our company.
•The PMIERs may be changed in response to the final regulatory capital framework for the GSEs that was published in February 2022.
•Our future operating results may be negatively impacted by the matters discussed in the rest of these risk factors. Such matters could decrease our revenues, increase our losses or require the use of assets, thereby creating a shortfall in Available Assets.
Should capital be needed by MGIC in the future, capital contributions from our holding company may not be available due to competing demands on holding company resources, including for repayment of debt.
Because loss reserve estimates are subject to uncertainties, paid claims may be substantially different than our loss reserves.
When we establish case reserves, we estimate our ultimate loss on delinquent loans by estimating the number of such loans that will result in a claim payment (the "claim rate"), and further estimating the amount of the claim payment (the "claim severity"). Changes to our claim rate and claim severity estimates could have a material impact on our future results, even in a stable economic environment. Our estimates incorporate anticipated cures, loss mitigation activity, rescissions and curtailments. The establishment of loss reserves is subject to inherent uncertainty and requires significant judgment by management. Our actual claim payments may differ substantially from our loss reserve estimates. Our estimates could be affected by several factors, including a change in regional or national economic conditions as discussed in these risk factors and a change in the length of time loans are delinquent before claims are received. Generally, the longer a loan is delinquent before a claim is received, the greater the severity. As a result of foreclosureForeclosure moratoriums and forbearance programs related to COVID-19,increase the average time it takes to receive claims has increased.claims. Economic conditions may differ from region to region. Information about the geographic
dispersion of our risk in force and delinquency inventory can be found in our Annual Reports on Form 10-K and our Quarterly Reports on Form 10-Q. Prior to the COVID-19 pandemic, losses incurred generally followed a seasonal trend in which the second half of the year has weaker credit performance than the first half, with higher new default notice activity and a lower cure rate.
We are subject to comprehensive regulation and other requirements, which we may fail to satisfy.
We are subject to comprehensive regulation, including by state insurance departments. Many regulations are designed for the protection of our insured policyholders and consumers, rather than for the benefit of investors. Mortgage insurers, including MGIC, have in the past been involved in litigation and regulatory actions related to alleged violations of the anti-referral fee provisions of the Real Estate Settlement Procedures Act ("RESPA"), and the notice provisions of the Fair Credit Reporting Act ("FCRA"). While these proceedings in the aggregate did not result in material liability for MGIC, there can be no assurance that the outcome of future proceedings, if any, under these laws or others would not have a material adverse effect on us.
We provide contract underwriting services, including on loans for which we are not providing mortgage insurance. These services are subject to federal and state regulation. Our failure to meet the standards set forth in the applicable regulations would subject us to potential regulatory action. To the extent that we are construed to make independent credit decisions in connection with our contract underwriting activities, we also could be subject to increased regulatory requirements under the Equal Credit Opportunity Act ("ECOA"), FCRA, and other laws. Under relevant laws, examination may also be made of whether a mortgage insurer's underwriting decisions have a disparate impact on persons belonging to a protected class in violation of the law.
Although their scope varies, state insurance laws generally grant broad supervisory powers to agencies or officials to examine insurance companies and enforce rules or exercise discretion affecting almost every significant aspect of the insurance business, including payment for the referral of insurance business, premium rates and discrimination in pricing, and minimum capital requirements. The increased use, by the private mortgage insurance industry, of risk-based pricing systems that establish premium
MGIC Investment Corporation 2023 Form 10-K | 29
MGIC Investment Corporation and Subsidiaries
rates based on more attributes than previously considered, and of algorithms, artificial intelligence and data and analytics, has led to additional regulatory scrutiny of premium rates and of other matters such as discrimination in pricing and underwriting, data privacy and access to insurance. For more information about state capital requirements, see our risk factor titled “State capital requirements may prevent us from continuing to write new insurance on an uninterrupted basis.” For information about regulation of data privacy, see our risk factor titled “We could be materially adversely affected by a cyber securitycybersecurity breach or failure of information security controls.” For more details about the various ways in which our subsidiaries are regulated, see “Business - Regulation” in Item 1.1 of our Annual Report on Form 10-K for the year ended December 31, 2022.
While we have established policies and procedures to comply with applicable laws and regulations, many such laws and regulations are complex and it is not possible to predict the eventual scope, duration or outcome of any reviews or investigations nor is it possible to predict their effect on us or the mortgage insurance industry.
MGIC Investment Corporation 2022 Form 10-K | 28
MGIC Investment Corporation and Subsidiaries
Pandemics, hurricanes and other natural disasters may impact our incurred losses, the amount and timing of paid claims, our inventory of notices of default and our Minimum Required Assets under PMIERs.
Pandemics and other natural disasters, such as hurricanes, tornadoes, earthquakes, wildfires and floods, or other events related to changing climatic conditions,climate change, could trigger an economic downturn in the affected areas, or in areas with similar risks, which could result in a declinedecrease in our businesshome prices and an increased claim rate on policiesand claim severity in those areas. NaturalDue to the increased frequency and severity of natural disasters, rising sea levels and/some homeowners' insurers are withdrawing from certain states or fresh water shortages could leadareas that they deem to a decrease in home prices in the affected areas, or in areas with similar risks, which could result in an increase in claim severity on policies in those areas. In addition,be high risk. Even though we do not generally insure losses related to property damage, the inability of a borrower to obtain hazard and/or flood insurance, or the increased cost of such insurance, could lead to an increase in delinquencies or a decrease in home prices in the affected areas. If we were to attempt to limitareas and an increase in delinquencies and our new insurance written in affected areas, lenders may be unwilling to procure insurance from us anywhere.incurred losses.
Pandemics and other natural disasters could also lead to increased reinsurance rates or reduced availability of reinsurance. This may cause us to retain more risk than we otherwise would retain and could negatively affect our compliance with the financial requirements of State Capital Requirements and the PMIERs.
The PMIERs require us to maintain significantly more "Minimum Required Assets" for delinquent loans than for performing loans; however, the increase in Minimum Required Assets is not as great for certain delinquent loans in areas that the Federal Emergency Management Agency has declared major disaster areas and for certain loans whose borrowers have been affected by COVID-19.loans. See our risk factor titled "We may not continue to meet the GSEs’ private mortgage insurer eligibility requirements and our returns may decrease if we are required to maintain more capital in order to maintain our eligibility."
In January 2021, the FHFA issued a Request for Input (“RFI”) regarding Climateis working to incorporate climate risk considerations into its policy development and Natural Disaster Risk Management at the Regulated Entities (i.e., the GSEs and the Federal Home Loan Banks).processes. The FHFA has also instructed the GSEs to designate climate change as a priority concern and actively consider its effects in their decision making. In 2022, FHFA established internal working groups and a steering committee in order to monitor the GSEs' management of climate risk. It is possible that efforts to manage this riskthese risks by the FHFA, GSEs (including through GSE guideline or mortgage insurance policy changes) or others could materially impact the volume and characteristics of our NIW (including its policy terms), home prices in certain areas and defaults by borrowers in certain areas.
Reinsurance may not always be available unavailable at current levels and prices, and/or its costthe GSEs may increase.reduce the amount of capital credit we receive for our reinsurance transactions.
We have in place QSR and XOL reinsurance transactions providing various amounts of coverage on 85% of our risk in force as of December 31, 2022.2023. Refer to Part 8,1, Note 94 – “Reinsurance” and Part 71, Item 2 “Consolidated Results of Operations – Reinsurance Transactions” of our Quarterly Report on Form 10-Q, for more information about coverage under our reinsurance transactions. The reinsurance transactions reduce the tail-risk associated with stress scenarios. As a result, they reduce the risk-based capital that we are required to hold to support the risk and they allow us to earn higher returns on risk-based capital for our business than we would without them. However, reinsurancemarket conditions impact the availability and cost of reinsurance. Reinsurance may not always be available to us, or available only on similar terms theor at costs that we consider unacceptable. If we are not able to obtain reinsurance we will be required to hold additional capital to support our risk in force.
Reinsurance transactions subject us to counterparty credit risk, including the financial capability of the reinsurers to make payments for losses ceded to them under the reinsurance agreements. As reinsurance does not relieve us of our obligation to pay claims to our policyholders, our inability to recover losses from a reinsurer could have a material impact on our results of operations and thefinancial condition.
The GSEs may change the credit they allow under the PMIERs for risk ceded
under our reinsurance transactions. Most of our XOL transactionsIf the GSEs were entered intoto reduce the credit that we receive for reinsurance under the PMIERs, it could result in capital market transactions with special purpose insurers that issued notes linked to the reinsurance coverage ("Insurance Linked Notes" or "ILNs"). Our access to reinsurance may be disrupted and the terms under which we are able to obtain reinsurance may be less attractive than in the past due to volatility stemming from circumstances such as higher interest rates, increased inflation, global events such as the Russia-Ukraine war, and other factors. In 2022, execution of transactions for XOL reinsurance through the ILN market was more challenging, with increased pricing, down-sized transactions, and generally fewer transactions executed by mortgage insurers. If we are unable to obtain reinsurance for our insurance written, the capital required to support our insurance written will not be reduced as discussed above and ourdecreased returns may decrease absent an increase in our premium rates. An increase in our premium rates to adjust for a decrease in reinsurance credit may lead to a decrease in our NIW.NIW and net income.
Because we establish loss reserves only upon a loan delinquency rather than based on estimates of our ultimate losses on risk in force, losses may have a disproportionate adverse effect on our earnings in certain periods.
In accordance with accounting principles generally accepted in the United States, we establish case reserves for insurance losses and loss adjustment expenses only when delinquency notices are received for insured loans that are two or more payments past due and for loans we estimate are delinquent but for which delinquency notices have not yet been received (which we include in “IBNR”). Losses
MGIC Investment Corporation 2023 Form 10-K | 30
MGIC Investment Corporation and Subsidiaries
that may occur from loans that are not delinquent are not reflected in our financial statements, except when a "premium deficiency" is recorded. A premium deficiency would be recorded if the present value of expected future losses and expenses exceeds the present value of expected future premiums and already established loss reserves on the applicable loans. As a result, future losses incurred on loans that are not currently delinquent may have a material impact on future results as delinquencies emerge. As of December 31, 2022,2023, we had established case reserves and reported losses incurred for 26,38725,650 loans in our delinquency inventory and our IBNR reserve totaled $21$22 million. The number of loans in our delinquency inventory may increase from that level as a result of economic conditions relating to current global events or other factors and our losses incurred may increase.
State capital requirements may prevent us from continuing to write new insurance on an uninterrupted basis.
The insurance laws of 16 jurisdictions, including Wisconsin, MGIC's domiciliary state, require a mortgage insurer to maintain a minimum amount of statutory capital relative to its risk in force (or a similar measure) in order for the mortgage insurer to continue to write new business. We refer to these requirements as the “State Capital Requirements.” While they vary among jurisdictions, the most common State Capital Requirements allow for a maximum risk-to-capital ratio of 25 to 1. A risk-to-capital ratio will increase if (i) the percentage decrease in capital exceeds the percentage decrease in insured risk, or (ii) the percentage increase in capital is less than the percentage increase in insured risk. Wisconsin does not regulate capital by using a risk-to-capital measure but instead requires a minimum policyholder position (“MPP”). MGIC's “policyholder position” includes its net worth, or surplus, and its contingency reserve.
MGIC Investment Corporation 2022 Form 10-K | 29
MGIC Investment Corporation and Subsidiaries
At December 31, 20222023, MGIC’s risk-to-capital ratio was 10.2 to 1, below the maximum allowed by the jurisdictions with State Capital Requirements, and its policyholder position was $3.5$3.6 billion above the required MPP of $2.1$2.2 billion. Our risk-to-capital ratio and MPP reflect full credit for the risk ceded under our quota share reinsurance and excess of loss transactions in the ILN market and traditional reinsurance marketagreements with unaffiliated reinsurers. It is possible that under the revised State Capital Requirements discussed below, MGIC will not be allowed full credit for the risk ceded under such transactions. If MGIC is not allowed an agreed level of credit under the State Capital Requirements, MGIC may terminate the reinsurance transactions, without penalty.
The NAIC previously announced plans to revise the State Capital Requirements that are provided for in itsestablished a Mortgage Guaranty Insurance Model Act. In December 2019, a working group of state regulators released an exposureWorking Group to determine and make recommendations to the NAIC’s Financial Condition Committee as to what, if any, changes to make to the solvency and other regulations relating to mortgage guaranty insurers. A draft of a revised Mortgage Guaranty Insurance Model Act and a risk-based capital framework to establish capital requirements for mortgage insurers, although certain items were not completely addressedwas adopted by the framework, includingFinancial Condition Committee in July 2023 and by the treatment of ceded riskExecutive Committee and Plenary NAIC in August 2023. The revised Model Act includes requirements relating to, among other things: (i) capital and minimum capital floors. In October 2022,requirements, and contingency reserves; (ii) restrictions on mortgage insurers’ investments in notes secured by mortgages; (iii) prudent underwriting standards and formal underwriting guidelines; (iv) the NAIC working group released aestablishment of formal, internal “Mortgage Guaranty Quality Control Programs” with respect to in-force business; and (v) reinsurance and prohibitions on captive reinsurance arrangements. It is uncertain when the revised exposure draftModel Act will be adopted in any jurisdiction. The provisions of the Mortgage Guaranty Insurance Model Act, that doesif adopted in their final form, are not includeexpected to have a material adverse effect on our business. It is unknown whether any changes will be made by state legislatures prior to adoption, and the capital requirements ofeffect changes, if any, will have on the existing Model Act.mortgage guaranty insurance market generally, or on our business.
While MGIC currently meets the State Capital Requirements of Wisconsin and all other jurisdictions, it could be prevented from writing new business in the future in all jurisdictions if it fails to meet the State Capital Requirements of Wisconsin, or it could be prevented from writing new business in a particular jurisdiction if it fails to meet the State Capital Requirements of that jurisdiction, and in each case if MGIC does not obtain a waiver of such requirements. It is possible that regulatory action by one or more jurisdictions, including those that do not have specific State Capital Requirements, may prevent MGIC from continuing to write new insurance in such jurisdictions. If we are unable to write business in a particular jurisdiction, lenders may be unwilling to procure insurance from us anywhere. In addition, a lender’s assessment of the future ability of our insurance operations to meet the State Capital Requirements or the PMIERs may affect its willingness to procure insurance from us. In this regard, see our risk factor titled “Competition or changes in our relationships with our customers could reduce our revenues, reduce our premium yields and/or increase our losses.” A possible future failure by MGIC to meet the State Capital Requirements or the PMIERs will not necessarily mean that MGIC lacks sufficient resources to pay claims on its insurance liabilities. You should read the rest of these risk factors for information about matters that could negatively affect MGIC’s compliance with State Capital Requirements and its claims paying resources.
If the volume of low down payment home mortgage originations declines, the amount of insurance that we write could decline.
The factors that may affect the volume of low down payment mortgage originations include the health of the U.S. economy,economy; conditions in regional and local economies and the level of consumer confidence; the health and stability of the financial services industry; restrictions on mortgage credit due to more stringent underwriting standards, liquidity issues or risk-retention and/or capital requirements affecting lenders; the level of home mortgage interest rates; housing affordability; new and existing housing availability; the rate of household formation, which is influenced, in part, by population and immigration trends;
homeownership rates; the rate of home price appreciation, which in times of heavy refinancing can affect whether refinanced loans have LTV ratios that require private mortgage insurance; and government housing policy encouraging loans to first-time homebuyers. A decline in the volume of low down payment home mortgage originations could decrease demand for mortgage insurance and limit our NIW. For other factors that could decrease the demand for mortgage insurance, see our risk factor titled “The amount of insurance we write could be adversely affected if lenders and investors select alternatives to private mortgage insurance or are unable to obtain capital relief for mortgage insurance.”
MGIC Investment Corporation 2023 Form 10-K | 31
MGIC Investment Corporation and Subsidiaries
The amount of insurance we write could be adversely affected if lenders and investors select alternatives to private mortgage insurance or are unable to obtain capital relief for mortgage insurance.
Alternatives to private mortgage insurance include:
•investors using risk mitigation and credit risk transfer techniques other than private mortgage insurance, or accepting credit risk without credit enhancement,
•lenders and other investors holding mortgages in portfolio and self-insuring,
•lenders using Federal Housing Administration ("FHA"),FHA, U.S. Department of Veterans Affairs ("VA") and other government mortgage insurance programs, and
•lenders originating mortgages using piggyback structures to avoid private mortgage insurance, such as a first mortgage with an 80% loan-to-value ("LTV") ratio and a second mortgage with a 10%, 15% or 20% LTV ratio rather than a first mortgage with a 90%, 95% or 100% LTV ratio that has private mortgage insurance.
The GSEs’ charters generally require credit enhancement for a low down payment mortgage loan (a loan in an amount that exceeds 80% of a home’s value) in order for such loan to be eligible for purchase by the GSEs. Private mortgage insurance generally has been purchased by lenders in primary mortgage market transactions to satisfy this credit enhancement requirement. In 2018, the GSEs initiated secondary mortgage market programs with loan level mortgage default coverage provided by various (re)insurers that are not mortgage insurers governed by PMIERs, and that are not selected by the lenders. These programs, which currently account for a small percentage of the low down payment market, compete with traditional private mortgage insurance and, due to differences in policy terms, they may offer premium rates that are below prevalent single premium lender-paid mortgage insurance ("LPMI") rates. We participate in these programs from time to time. See our risk factor titled “Changes in the business practices of Fannie Mae and Freddie Mac's ("the GSEs"), federal legislation that changes their charters or a restructuring of the GSEs could reduce our revenues or increase our losses” for a discussion of various business practices of the GSEs that may be changed, including through expansion or modification of these programs.
The GSEs (and other investors) have also used other forms of credit enhancement that did not involve traditional private mortgage insurance, such as engaging in credit-linked note transactions executed in the capital markets, or using other forms of debt issuances or securitizations that transfer credit risk directly to other investors, including competitors and an affiliate of MGIC; using other risk mitigation techniques in conjunction
MGIC Investment Corporation 2022 Form 10-K | 30
MGIC Investment Corporation and Subsidiaries
with reduced levels of private mortgage insurance coverage; or accepting credit risk without credit enhancement.
If the FHA or other government-supported mortgage insurance programs increase their share of the mortgage insurance market, our business could be affected. The FHA's share of the low down payment residential mortgages that were subject to FHA, VA, USDA or primary private mortgage insurance was 33.2% in 2023, 26.7% in 2022, and 24.7% in 2021, and 23.4% in 2020.2021. Beginning in 2012, the FHA’s share has been as low as 23.4% (in 2020) and as high as 42.1% (in 2012). Factors that influence the FHA’s market share include relative rates and fees, underwriting guidelines and loan limits of the FHA, VA, private mortgage insurers and the GSEs; changes to the GSEs' business practices; lenders' perceptions of legal risks under FHA versus GSE programs; flexibility for the FHA to establish new products as a result of federal legislation and programs; returns expected to be obtained by lenders for Ginnie Mae securitization of FHA-insured loans compared to those obtained from selling loans to the GSEs for securitization; and differences in policy terms, such as the ability of a borrower to cancel insurance coverage under certain circumstances. On February 22, 2023, the FHA announced a 30 bps30-basis point decrease in its mortgage insurance premium rates. This rate reduction willhas negatively impactimpacted our NIW; however, given the many factors that influence the FHA's market share, it is difficultNIW. We are unable to predict the extent of the impact. In addition, we cannot predictany further impact on our NIW or how the factors that affect the FHA’sFHA's share of new insurance writtenNIW will change in the future.
The VA's share of the low down payment residential mortgages that were subject to FHA, VA, USDA or primary private mortgage insurance was 21.5% in 2023, 24.5% in 2022, and 30.2% in 2021, and 30.9% in 2020.2021. Beginning in 2012, the VA’s share has been as low as 22.8% (in 2013) and as high as 30.9% (in 2020). We believe that the VA’s market share grows as the number of borrowers that are eligible for the VA’s program increases, and when eligible borrowers opt to use the VA program when refinancing their mortgages. The VA program offers 100% LTV ratio loans and charges a one-time funding fee that can be included in the loan amount.
In July 2023, the Federal Reserve Board, Federal Deposit Insurance Corporation, and the Office of the Comptroller of the Currency proposed a revised regulatory capital rule that would impose higher capital standards on large U.S. banks. Under the proposed regulation's new expanded risk-based approach, affected banks would no longer receive risk-based capital relief for mortgage insurance on loans held in their portfolios. If adopted as proposed, the regulation is expected to have a negative effect on our NIW; however, at this time it is difficult to predict the extent of the impact.
Changes in interest rates, house prices or mortgage insurance cancellation requirements may change the length of time that our policies remain in force.
The premium from a single premium policy is collected upfront and generally earned over the estimated life of the policy. In contrast, premiums from monthly and annual premium policies are received each month or year, as applicable, and earned each month over the life of the policy. In each year, most of our premiums earned are from insurance that has been written in prior years. As a result, the length of time insurance remains in force, which is generally measured by persistency (the percentage of our insurance remaining in force from one year prior), is a significant determinant of our revenues. A higher than expected persistency rate may decrease the profitability from single premium policies because they will remain in force longer and may increase the incidence of claims that was
MGIC Investment Corporation 2023 Form 10-K | 32
MGIC Investment Corporation and Subsidiaries
estimated when the policies were written. A low persistency rate on monthly and annual premium policies will reduce future premiums but may also reduce the incidence of claims, while a high persistency on those policies will increase future premiums but may increase the incidence of claims.
Our annual persistency rate was 79.8%86.1% at December 31, 2023, 82.2% at December 31, 2022, 62.6%and 66.0% at December 31, 2021, and 60.5% at December 31, 2020.2021. Since 2000,2018, our year-endannual persistency rate ranged from a high of 84.7%86.3% at December 31, 2009September 30, 2023 to a low of 47.1%60.7% at DecemberMarch 31, 2003.2021. Our persistency rate is primarily affected by the level of current mortgage interest rates compared to the mortgage coupon rates on our insurance in force, which affects the vulnerability of the
insurance in force IIF to refinancing; and the current amount of equity that borrowers have in the homes underlying our insurance in force. The amount of equity affects persistency in the following ways:
•Borrowers with significant equity may be able to refinance their loans without requiring mortgage insurance.
•The Homeowners Protection Act (“HOPA”) requires servicers to cancel mortgage insurance when a borrower’s LTV ratio meets or is scheduled to meet certain levels, generally based on the original value of the home and subject to various conditions.conditions and exclusions.
•The GSEs’ mortgage insurance cancellation guidelines apply more broadly than HOPA and also consider a home’s current value. For more information about the GSEsGSEs' guidelines and business practices, and how they may change, see our risk factor titled “Changes in the business practices of Fannie Mae and Freddie Mac'sMac ("the GSEs"), federal legislation that changes their charters or a restructuring of the GSEs could reduce our revenues or increase our losses.”
We are susceptible to disruptions in the servicing of mortgage loans that we insure and we rely on third-party reporting for information regarding the mortgage loans we insure.
We depend on reliable, consistent third-party servicing of the loans that we insure. An increase in delinquent loans may result in liquidity issues for servicers. When a mortgage loan that is collateral for a mortgage backedmortgage-backed security ("MBS") becomes delinquent, the servicer is usually required to continue to pay principal and interest to the MBS investors, generally for four months, even though the servicer is not receiving payments from borrowers. This may cause liquidity issues, especially for non-bank servicers (who service approximately 46%47% of the loans underlying our insurance in forceIIF as of December 31, 2022)2023) because they do not have the same sources of liquidity that bank servicers have.
While there has been no disruption in our premium receipts through the endfourth quarter of 2022,2023, servicers who experience future liquidity issues may be less likely to advance premiums to us on policies covering delinquent loans or to remit premiums on policies covering loans that are not delinquent. Our policies generally allow us to cancel coverage on loans that are not delinquent if the premiums are not paid within a grace period.
An increase in delinquent loans or a transfer of servicing resulting from liquidity issues, may increase the operational burden on servicers, cause a disruption in the servicing of delinquent loans and reduce servicers’ abilities to undertake mitigation efforts that could help limit our losses.
The information presented in this report and on our website with respect to the mortgage loans we insure is based on information reported to us by third parties, including the servicers and originators of the mortgage loans, and information presented may be subject to lapses or inaccuracies in reporting from such third parties. In many cases, we may not be aware that information reported to us is incorrect until such time as a claim is made against us under the relevant insurance policy. We do not consistently receive monthly policy status information from servicers for single premium policies, and may not be aware that the mortgage loans insured by such policies have been repaid. We periodically attempt to determine if coverage is still in force on
MGIC Investment Corporation 2022 Form 10-K | 31
MGIC Investment Corporation and Subsidiaries
such policies by asking the last servicer of record or through the periodic reconciliation of loan information with certain servicers. It may be possible that our reports continue to reflect, as active, policies on mortgage loans that have been repaid.
Risk Factors Relating to Our Business Generally
If our risk management programs are not effective in identifying, or adequate in controlling or mitigating, the risks we face, or if the models used in our businesses are inaccurate, it could have a material adverse impact on our business, results of operations and financial condition.
Our enterprise risk management program, described in "Business - Our Products and Services - Risk Management" in Item 1 of our Annual Report on Form 10-K for the year ended December 31, 2023, may not be effective in identifying, or adequate in controlling or mitigating, the risks we face in our business.
We employ proprietary and third-party models for a wide range of purposes, including the following: projecting losses, premiums, expenses, and returns; pricing products (through our risk-based pricing system); determining the techniques used to underwrite insurance; estimating reserves; evaluating risk; determining internal capital requirements; and performing stress testing. These models rely on estimates, projections, and assumptions that are inherently uncertain and may not always operate as intended. This can be especially true when extraordinary events occur, such as the COVID-19 pandemic, the Russia-Ukraine war,wars, periods of extreme inflation, pandemics, or environmental disasters related to changing climatic conditions. In addition, our models are being continuously updated over time. Changes in models or model assumptions could lead to material changes in our future expectations, returns, or financial results. The models we employ are complex, which could increase our risk of error in their design, implementation, or use. Also, the associated input data, assumptions, and calculations may not always be correct or accurate and the controls we have in place to mitigate these risks may not be effective in
MGIC Investment Corporation 2023 Form 10-K | 33
MGIC Investment Corporation and Subsidiaries
all cases. The risks related to our models may increase when we change assumptions, methodologies, or modeling platforms. Moreover, we may use information we receive through enhancements to refine or otherwise change existing assumptions and/or methodologies.
Information technology system failures or interruptions may materially impact our operations andand/or adversely affect our financial results.
We are heavily dependent on our information technology systems to conduct our business. Our ability to efficiently operate our business depends significantly on the reliability and capacity of our systems and technology. The failure of our systems and technology, or our disaster recovery and business continuity plans, to operate effectively could affect our ability to provide our products and services to customers, reduce efficiency, or cause delays in operations. Significant capital investments might be required to remediate any such problems. We are also dependent on our ongoing relationships with key technology providers, including provisioning of their products and technologies, and their ability to support those products and technologies. The inability of these providers to successfully provide and support those products could have an adverse impact on our business and results of operations.
We are in the process of upgrading certainFrom time to time we upgrade, automate or otherwise transform our information systems, and transforming and automating certain business processes, and we continue to enhance our risk-based pricing system, and our system for evaluating risk. Certain information systems have
been in place for a number of years and it has become increasingly difficult to support their operation. The implementation of technological and business process improvements, as well as their integration with customer and third-party systems when applicable, is complex, expensive and time consuming. If we fail to timely and successfully implement and integrate the new technology systems, if the third party providers upon which we are reliant do not perform as expected, if our legacy systems fail to operate as required, or if the upgraded systems and/or transformed and automated business processes do not operate as expected, it could have a material adverse impact on our business, business prospects and results of operations.
We could be materially adversely affected by a cyber securitycybersecurity breach or failure of information security controls.
As part of our business, we maintain large amounts of confidential and proprietary information including personal information of consumers and employees,both on our own servers and those of cloud computing services. FederalThis includes personal information of consumers and our employees. Personal information is subject to an increasing number of federal and state laws designed to promoteand regulations regarding privacy and data security, as well as contractual commitments. Any failure or perceived failure by us, or by the protection of such information require businesses that collect or maintain personalvendors with whom we share this information, to adopt information security programs, andcomply with such obligations may result in damage to notify individuals, and in some jurisdictions,our reputation, financial losses, litigation, increased costs, regulatory authorities, of security breaches involving personally identifiable information. penalties or customer dissatisfaction.
All information technology systems are potentially vulnerable to damage or interruption from a variety of sources, including by cyber attacks, such as those involving ransomware. The Company discovers vulnerabilitiesWe regularly defend against threats to our data and regularly blocks a high volume of attempts to gainsystems, including malware and computer virus attacks, unauthorized access, system failures and disruptions. Threats have the potential to its systems. jeopardize the information processed and stored in, and transmitted through, our computer systems and networks and otherwise cause interruptions or malfunctions in our operations, which could result in damage to our reputation, financial losses, litigation, increased costs, regulatory penalties or customer dissatisfaction. We could be similarly affected by threats against our vendors and/or third-parties with whom we share information.
Globally, attacks are expected to continue accelerating in both frequency and sophistication with increasing use by actors of tools and techniques that willmay hinder the Company’s ability to identify, investigate and recover from incidents. Such attacks may also increase as a result of retaliation by Russia in response tothreat actors against actions taken by the U.S. and other countries in connection with Russia's military invasion of Ukraine.wars and other global events. The Company operates under a hybrid workforce model and such model may be more vulnerable to security breaches.
While we have information security policies and systems in place to secure our information technology systems and to prevent unauthorized access to or disclosure of sensitive information, there can be no assurance with respect to our systems and those of our third-party vendors that unauthorized access to the systems or disclosure of the sensitive information, either through the actions of third parties or employees, will not occur. Due to our reliance on information technology systems, including ours and those of our customers and third-party service providers, and to the sensitivity of the information that we maintain, unauthorized access to the systems or disclosure of the information could adversely affect our reputation, severely disrupt our operations, result in a loss of business and expose us to material claims for damages and may require that we provide free credit monitoring services to individuals affected by a security breach.
Should we experience an unauthorized disclosure of information or a cyber attack, including those involving ransomware, some of the costs we incur may not be recoverable through insurance, or legal or other processes, and this may have a material adverse effect on our results of operations.
MGIC Investment Corporation 2022 Form 10-K | 32
MGIC Investment CorporationOur underwriting practices and Subsidiaries
Thethe mix of business we write affects our Minimum Required Assets under the PMIERs, our premium yields and the likelihood of losses occurring.
The Minimum Required Assets under the PMIERs are, in part, a function of the direct risk-in-force and the risk profile of the loans we insure, considering LTV ratio, credit score, vintage, Home Affordable Refinance Program ("HARP") status and delinquency status; and whether the loans were insured under lender-paid mortgage insurance policies or other policies that are not subject to automatic termination consistent with the Homeowners Protection Act requirements for borrower-paid mortgage insurance. Therefore, if our
MGIC Investment Corporation 2023 Form 10-K | 34
MGIC Investment Corporation and Subsidiaries
direct risk-in-force increases through increases in NIW, or if our mix of business changes to include loans with higher LTV ratios or lower FICO scores, for example, all other things equal, we will be required to hold more Available Assets in order to maintain GSE eligibility.
The percentage of our NIW from all single premium policies was 4.0% in 2023. Beginning in 2012, the annual percentage of our NIW from single policies has been as low as 4.3% in 2022 and 7.4%as high as 20.4% in 2021, and has ranged from 4.3% in 2022 to 19.0% in 2017.2015. Depending on the actual life of a single premium policy and its premium rate relative to that of a monthly premium policy, a single premium policy may generate more or less premium than a monthly premium policy over its life.
As discussed in our risk factor titled "Reinsurance may not always be available or its cost may increase," we have in place various QSR transactions. Although the transactions reduce our premiums, they have a lesser impact on our overall results, as losses ceded under the transactions reduce our losses incurred and the ceding commissions we receive reduce our underwriting expenses. The effect of the QSR transactions on the various components of pre-tax income will vary from period to period, depending on the level of ceded losses incurred. We also have in place various XOL reinsurance transactions under which we cede premiums. Under the XOL reinsurance transactions, for the respective reinsurance coverage periods, we retain the first layer of aggregate losses and the reinsurers provide second layer coverage up to the outstanding reinsurance coverage amount.
In addition to the effect of reinsurance on our premiums, we expect a decline in our premium yield because an increasing(net premiums earned divided by the average insurance in force) over time as a large percentage of our insurance in forcecurrent IIF is from recent book years whosewith lower premium rates had been trending lower.due a decline in premium rates in recent years resulting from pricing competition, insuring mortgages with lower risk characteristics, lower required capital, and certain policies undergoing premium rate resets on their ten-year anniversaries. Refinance transactions on single premium policies benefit our premium yield due to the impact of accelerated earned premium from cancellation prior to their estimated life. Recent low levels of refinance transactions have reduced that benefit.
Our ability to rescind insurance coverage became more limited for new insurance written beginning in mid-2012, and it became further limited for new insurance written under our revised master policy that became effective March 1, 2020. These limitations may result in higher losses paid than would be the case under our previous master policies. In addition, our rescission rights temporarily have become more limited due to accommodations we made in connection with the COVID-19 pandemic. We waived our rescission rights in certain circumstances where the failure to make payments was associated with a COVID-19 pandemic-related forbearance.
From time to time, in response to market conditions, we change the types of loans that we insure. We also may change our underwriting guidelines, including by agreeing with certain approval recommendations from a GSE automated underwriting system. We also make exceptions to our underwriting requirements on a loan-by-loan basis and for certain customer programs. Our underwriting requirements are available on our website at http://www.mgic.com/underwriting/index.html.
Even when home prices are stable or rising, mortgages with certain characteristics have higher probabilities of claims. As of December 31, 2022,2023, mortgages with these characteristics in our primary risk in force included mortgages with LTV ratios greater than 95% (15.0%(16%), mortgages with borrowers having FICO scores below 680 (7.2%(7%), including those with borrowers having FICO scores of 620-679 (6.2%(6%), mortgages with limited underwriting, including limited borrower documentation (0.8%(1%), and mortgages with borrowers having DTI ratios greater than 45% (or where no ratio is available) (15.6%(18%), each attribute asis determined at the time of loan origination. Loans with more than one of these attributes accounted for 4.4%5% of our primary risk in force as of December 31, 2023, and 4% of our primary risk in force as of December 31, 2022 and 4.1% of our primary risk in force as of December 31, 2021. When home prices increase, interest rates increase and/or the percentage of our NIW from purchase transactions increases, our NIW on mortgages with higher LTV ratios and higher DTI ratios may increase. Our NIW on mortgages with LTV ratios greater than 95% increased from 11% in 2021 towas 12% in 20222023 and our2022. Our NIW on mortgages with DTI ratios greater than 45% increased from 14%was 26% in 2021 to2023 and 21% in 2022.
From time to time, we change the processes we use to underwrite loans. For example: we rely on information provided to us by lenders that was obtained from certain of the GSEs’ automated appraisal and income verification tools, which may produce results that differ from the results that would have been determined using different methods; we accept GSE appraisal waivers for certain refinance loans, the numbers of which have increased significantly beginning in 2020;loans; and we accept GSE appraisal flexibilities that allow property valuations in certain transactions to be based on appraisals that do not involve an onsite or interior inspection of the property. Our acceptance of automated GSE appraisal and income verification tools, GSE appraisal waivers and GSE appraisal flexibilities may affect our pricing and risk assessment. We also continue to further automate our underwriting processes and it is possible that our automated processes result in our insuring loans that we would not otherwise have insured under our prior processes.
Approximately 72%71% of our 2022NIW during 2023 and 72% of our 20212022 NIW was originated under delegated underwriting programs pursuant to which the loan originators had authority on our behalf to underwrite the loans for our mortgage insurance. For loans originated through a delegated underwriting program, we depend on the originators' compliance with our guidelines and rely on the originators' representations that the loans being insured satisfy the underwriting guidelines, eligibility criteria and other requirements. While we have established systems and processes to monitor whether certain aspects of our underwriting guidelines were being followed by the originators, such systems may not ensure that the guidelines were being strictly followed at the time the loans were originated.
The widespread use of risk-based pricing systems by the private mortgage insurance industry (discussed in our risk factor titled "Competition or changes in our relationships with our customers could reduce our revenues, reduce our premium yields and / or increase our losses") makes it more difficult to compare our premium rates to those offered by our competitors. We may not be aware of industry rate changes until we observe that our mix of new insurance written has changed and our mix may fluctuate more as a result.
MGIC Investment Corporation 2023 Form 10-K | 35
MGIC Investment Corporation and Subsidiaries
If state or federal regulations or statutes are changed in ways that ease mortgage lending standards and/or requirements, or if
MGIC Investment Corporation 2022 Form 10-K | 33
MGIC Investment Corporation and Subsidiaries
lenders seek ways to replace business in times of lower mortgage originations, it is possible that more mortgage loans could be originated with higher risk characteristics than are currently being originated, such as loans with lower FICO scores and higher DTI ratios. The focus of the new FHFA leadership on increasing homeownership opportunities for borrowers is likely to have this effect. Lenders could pressure mortgage insurers to insure such loans, which are expected to experience higher claim rates. Although we attempt to incorporate these higher expected claim rates into our underwriting and pricing models, there can be no assurance that the premiums earned and the associated investment income will be adequate to compensate for actual losses paid even under our current underwriting requirements.
The premiums we charge may not be adequate to compensate us for our liabilities for losses and as a result any inadequacy could materially affect our financial condition and results of operations.
When we set our premiums at policy issuance, we have expectations regarding likely performance of the insured risks over the long term. Generally, we cannot cancel mortgage insurance coverage or adjust renewal premiums during the life of a policy. As a result, higher than anticipated claims generally cannot be offset by premium increases on policies in force or mitigated by our non-renewal or cancellation of insurance coverage. Our premiums are subject to approval by state regulatory agencies, which can delay or limit our ability to increase premiums on future policies. In addition, our customized rate plans may delay our ability to increase premiums on future policies covered by such plans. The premiums we charge, the investment income we earn and the amount of reinsurance we carry may not be adequate to compensate us for the risks and costs associated with the insurance coverage provided to customers. An increase in the number or size of claims, compared to what we anticipated when we set the premiums, could adversely affect our results of operations or financial condition. Our premium rates are also based in part on the amount of capital we are required to hold against the insured risk. If the amount of capital we are required to hold increases from the amount we were required to hold when we set the premiums, our returns may be lower than we assumed. For a discussion of the amount of capital we are required to hold, see our risk factor titled "We may not continue to meet the GSEs’ private mortgage insurer eligibility requirements and our returns may decrease if we are required to maintain more capital in order to maintain our eligibility."
Actual or perceived instability in the financial services industry or non-performance by financial institutions or transactional counterparties could materially impact our business.
Limited liquidity, defaults, non-performance or other adverse developments that affect financial institutions, transactional counterparties or other companies in the financial services industry with which we do business, or concerns or rumors about the possibility of such events, have in the past and may in the future lead to market-wide liquidity problems. Such conditions may negatively impact our results and/or financial condition. While we are unable to predict the full impact of these conditions, they may lead to among other things: disruption to the mortgage market, delayed access to deposits or other financial assets; losses of deposits in excess of federally-insured levels; reduced access to, or increased costs associated with, funding sources and other credit arrangements adequate to finance our current or future operations; increased regulatory pressure; the inability of our counterparties and/or customers to meet their obligations to us; economic downturn; and rising unemployment levels. Refer to our risk factor titled “Downturns in the domestic economy or declines in home prices may result in more homeowners defaulting and our losses increasing, with a corresponding decrease in our returns” for more information about the potential effects of a deterioration of economic conditions on our business.
We routinely execute transactions with counterparties in the financial services industry, including commercial banks, brokers and dealers, investment banks, reinsurers, and our customers. Many of these transactions expose us to credit risk and losses in the event of a default by a counterparty or customer. Any such losses could have a material adverse effect on our financial condition and results of operations.
We rely on our management team and our business could be harmed if we are unable to retain qualified personnel or successfully develop and/or recruit their replacements.
Our success depends, in part, on the skills, working relationships and continued services of our management team and other key personnel. The unexpected departure of key personnel could adversely affect the conduct of our business. In such event, we would be required to obtain other personnel to manage and operate our business. In addition, we will be required to replace the knowledge and expertise of our aging workforce as our workers retire. In either case, there can be no assurance that we would be able to develop or recruit suitable replacements for the departing individuals; that replacements could be hired, if necessary, on terms that are favorable to us; or that we can successfully transition such replacements in a timely manner. We currently have not entered into any employment agreements with our officers or key personnel. Volatility or lack of performance in
our stock price may affect our ability to retain our key personnel or attract replacements should key personnel depart. Without a properly skilled and experienced workforce, our costs, including productivity costs and costs to replace employees may increase, and this could negatively impact our earnings.
Competition or changes in our relationships with our customers could reduce our revenues, reduce our premium yields and / or increase our losses.
The private mortgage insurance industry is highly competitive and is expected to remain so. We believe we currently compete with other private mortgage insurers based on premium rates, underwriting requirements, financial strength (including based on credit or financial strength ratings), customer relationships, name recognition, reputation, strength of management teams and field organizations, the
MGIC Investment Corporation 2023 Form 10-K | 36
MGIC Investment Corporation and Subsidiaries
ancillary products and services provided to lenders, and the effective use of technology and innovation in the delivery and servicing of our mortgage insurance products.
Our relationships with our customers, which may affect the amount of our NIW, could be adversely affected by a variety of factors, including if our premium rates are higher than those of our competitors, our underwriting requirements are more restrictive than those of our competitors, or our customers are dissatisfied with our claims-paying practices (including insurance policy rescissions and claim curtailments)., or the availability of alternatives to mortgage insurance.
In recent years, the industry has materially reduced its use of standard rate cards, which were fairly consistent among competitors, and correspondingly increased its use of (i) pricing systems that use a spectrum of filed rates to allow for formulaic, risk-based pricing based on multiple attributes that may be quickly adjusted within certain parameters, and (ii) customized rate plans, both of which typically have rates lower than the standard rate card. Our increased use of reinsurance over the past several years, and the improved credit profile and reduced loss expectations associated with loans insured after 2008, have helped to mitigate the negative effect of declining premium rates on our expected returns. However, refer to our risk factor titled "Reinsurance may not always be available or its cost may increase" for a discussion of the risks associated with the availability of reinsurance, and our risk factors titled “Downturns in the domestic economy or declines in home prices may result in more homeowners defaulting and our losses increasing, with a corresponding decrease in our returns,” and “Pandemics, hurricanes and other natural disasters may impact our incurred losses, the amount and timing of paid claims, our inventory of notices of default and our Minimum Required Assets under PMIERs” for a discussion about risks associated with our NIW.
plans. The widespread use of risk-based pricing systems by the private mortgage insurance industry makes it more difficult to compare our rates to those offered by our competitors. We may not be aware of industry rate changes until we observe that our volume of NIW has changed. In addition, business under customized rate plans is awarded by certain customers for only limited periods of time. As a result, our NIW may fluctuate more than it had in the past. Failure to maintain our business relationships and business volumes with our largest customers could materially impact our business. Regarding the concentration of our new business, our top ten customers accounted for approximately 33%37% and 36%33% in the twelve months ended December 31, 20222023 and December 31, 2021,2022, respectively.
We monitor various competitive and economic factors while seeking to balance both profitability and market share considerations in developing our pricing strategies. Premium
MGIC Investment Corporation 2022 Form 10-K | 34
MGIC Investment Corporation and Subsidiaries
rates on NIW will change ourOur premium yield (net premiums earned divided by the average insurance in force)is expected to decline over time as older insurance policies with premium rates that are generally higher run off and new insurance policies with premium rates that are generally lower are written.remain on our books.
Certain of our competitors have access to capital at a lower cost than we do (including, through off-shore intercompany reinsurance vehicles, which have tax advantages that may increase if U.S. corporate income taxes increase). As a result, they may be able to achieve higher after-tax rates of return on their NIW compared to us, which could allow them to leverage reduced premium rates to gain market share, and they may be better positioned to compete outside of traditional mortgage insurance, including by participating in alternative forms of credit enhancement pursued by the GSEs discussed in our risk factor titled "The amount of insurance we write could be adversely affected if lenders and investors select alternatives to private mortgage insurance or are unable to obtain capital relief for mortgage insurance."
Although the currentAdverse rating agency actions could have a material adverse impact on our business, results of operations and financial condition.
Financial strength ratings, which various rating agencies publish as independent opinions of an insurer's financial strength and ability to meet ongoing insurance and contract obligations, are important to maintaining public confidence in our mortgage insurance coverage and our competitive position. PMIERs of the GSEs do not require an insurerrequires approved insurers to maintain minimum financial strength ratings,at least one rating with a rating agency acceptable to the respective GSEs. Downgrades in our financial strength ratings cancould materially affect usour business and results of operations, including in the ways set forth below. If we are unabledescribed below:
•Our failure to compete effectively inmaintain a rating acceptable to the current or any future marketsGSEs could impact our eligibility as a result of the financial strength ratings assigned to our insurance subsidiaries, our future NIW could be negatively affected.an approved insurer under PMIERs.
•A downgrade in our financial strength ratings could result in increased scrutiny of our financial condition by the GSEs and/or our customers, potentially resulting in a decrease in the amount of our NIW.
•If we are unable to compete effectively in the current or any future markets as a result of the financial strength ratings assigned to our insurance subsidiaries, our future NIW could be negatively affected.
•Our ability to participate in the non-GSE residential mortgage-backed securities market (the size of which has been limited since 2008, but may grow in the future), could depend on our ability to maintain and improve our investment grade ratings for our insurance subsidiaries. We could be competitively disadvantaged with some market participants because the financial strength ratings of our insurance subsidiaries are lower than those of some competitors. MGIC's financial strength rating from A.M. Best is A- (with a stablepositive outlook), from Moody’s is A3 (with a stable outlook) and from Standard & Poor’s is BBB+ (with A- (with a stable outlook).
•Financial strength ratings may also play a greater role if the GSEs no longer operate in their current capacities, for example, due to legislative or regulatory action. In addition, although the PMIERs do not require minimum financial strength ratings, the GSEs consider financial strength ratings to be important when using forms of credit enhancement other than traditional mortgage insurance, as discussed in our risk factor titled "The amount of insurance we write could be adversely affected if lenders and investors select alternatives to private mortgage insurance or are unable to obtain capital relief for mortgage insurance." The final GSE capital framework provides more capital credit for transactions with higher rated counterparties, as well as those who are diversified. Although we are currently unaware of a direct impact on MGIC, this could potentially become a competitive disadvantage in the future.
Standard & Poor’s is considering changes•Downgrades to its rating methodologies for insurers, including mortgage insurers. It is uncertain what impact the changes will have, whether they will prompt similar moves at other rating agencies,our ratings or the extentratings of our mortgage insurance subsidiary could adversely affect our cost of funds, liquidity, and access to which they will impact how external parties evaluate the different rating levels.capital markets.
MGIC Investment Corporation 2023 Form 10-K | 37
MGIC Investment Corporation and Subsidiaries
We are subject to the risk of legal proceedings.
BeforeWe operate in a highly regulated industry that is subject to the risk of litigation and regulatory proceedings, including related to our claims paying an insurance claim, generallypractices. From time to time, we revieware a party to material litigation and are also subject to legal and regulatory claims, assertions, actions, reviews, audits, inquiries and investigations. Additional lawsuits, legal and regulatory proceedings and inquiries or other matters may arise in the loanfuture. The outcome of future legal and servicing filesregulatory proceedings, inquiries or other matters could result in adverse judgments, settlements, fines, injunctions, restitutions or other relief which could require significant expenditures or have a material adverse effect on our business prospects, results of operations and financial condition. See our risk factor titled "We are subject to determine the appropriateness of the claim amount. When reviewing the files,comprehensive regulation and other requirements, which we may determine that we have the rightfail to rescind coverage or deny a claim on the loan (both referredsatisfy" for additional information about risks related to herein as “rescissions”)government enforcement actions. In addition, our insurance policies generally provide that we can reduce a claim if the servicer did not comply with its obligations under our insurance policy (such reduction referred to as a “curtailment”). In recent years, an immaterial percentage of claims received have been resolved by rescissions. In 2022 and in 2021, curtailments reduced our average claim paid by approximately 6.3% and 4.4%, respectively. The COVID-19-related foreclosure moratoriums and forbearance plans, along with increased home prices, resulted in decreased claims paid activity beginning in the second quarter of 2020. It is difficult to predict the level of curtailments once foreclosure activity returns to a more typical level. Our loss reserving methodology incorporates our estimates of future rescissions, curtailments, and reversals of rescissions and curtailments. A variance between ultimate actual rescission, curtailment and reversal rates and our estimates, as a result of the outcome of litigation, settlements or other factors, could materially affect our losses.
When the insured disputes our right to rescind coverage or curtail claims, we generally engage in discussions in an attempt to settle the dispute. If we are unable to reach a settlement, the outcome of a dispute ultimately may be determined by legal proceedings. Under ASC 450-20, until a loss associated with settlement discussions or legal proceedings becomes probable and can be reasonably estimated, we consider our claim payment or rescission resolved for financial reporting purposes and do not accrue an estimated loss. When we determine that a loss is probable and can be reasonably estimated, we record our best estimate of our probable loss. In those cases, until settlement negotiations or legal proceedings are concluded (including the receipt of any necessary GSE approvals), it is possible that we will record an additional loss.
We have been named as a third-party defendant in a lawsuit that involves refunds of mortgage insurance premiums under the Homeowners Protection Act. We are monitoring litigation addressing similar issues in which we have not been named a defendant. We are unable to assess the potential impact of any such litigation at this time. In addition, fromFrom time to time, we are involved in other disputes and legal proceedings in the ordinary course of business. In our opinion, based on the facts known at this time, the ultimate resolution of these ordinary course disputes and legal proceedings will not have a material adverse effect on our financial position or results of operations.
The COVID-19 pandemic may materially impact Under ASC 450-20, until a loss associated with settlement discussions or legal proceedings becomes probable and can be reasonably estimated, we do not accrue an estimated loss. When we determine that a loss is probable and can be reasonably estimated, we record our business and future financial condition.
The COVID-19 pandemic materially impacted our 2020 financial results. While the initial impact of COVID-19 on our business has moderated, the extent to which COVID-19 may materially impact our business and future financial condition is uncertain and
MGIC Investment Corporation 2022 Form 10-K | 35
MGIC Investment Corporation and Subsidiaries
cannot be predicted. The magnitude of any future impact could be influenced by various factors, including the length and severity of the pandemic in the United States, efforts to reduce the transmission of COVID-19, the level of unemployment, government initiatives and actions taken by the GSEs (including mortgage forbearance and modification programs), and the overall effects of COVID-19 on the economy. The COVID-19 pandemic may impact our business in other ways, as described in more detail in these risk factors.
Forbearance for borrowers who were affected by COVID-19 allows mortgage payments to be suspended for a period of time. Historically, forbearance plans have reduced the incidencebest estimate of our losses on affected loans. However, given the uncertainty surrounding the long-term economic impact of COVID-19,probable loss. In those cases, until settlement negotiations or legal proceedings are concluded it is difficult to predict the ultimate effect of COVID-19 related forbearances on our loss incidence. Whether a loan delinquencypossible that we will cure, including through modification, when forbearance ends will depend on the economic circumstances of the borrower at that time. The severity of losses associated with delinquencies that do not cure will depend on economic conditions at that time, including home prices.
Our success depends, in part, on our ability to manage risks in our investment portfolio.
Our investment portfolio is an important source of revenue and is our primary source of claims paying resources. Although our investment portfolio consists mostly of highly-rated fixed income investments, our investment portfolio is affected by general economic conditions and tax policy, which may adversely affect the markets for credit and interest-rate-sensitive securities, including the extent and timing of investor participation in these markets, the level and volatility of interest rates and credit spreads and, consequently, the value of our fixed income securities. Prevailing market rates have increased for various reasons, including inflationary pressures, which has reduced the fair value of our investment portfolio.portfolio holdings relative to their amortized cost. The value of our investment portfolio may also be adversely affected by ratings downgrades, increased bankruptcies, and credit spreads widening. In addition, the collectability and valuation of our municipal bond portfolio may be adversely affected by budget deficits, and declining tax bases and revenues experienced by state and local municipalities. Our investment portfolio also includes commercial mortgage-backed securities, collateralized loan obligations, and asset-backed securities, which could be adversely affected by declines in real estate valuations, increases in unemployment, geopolitical risks and/or financial market disruption, including more restrictive lending conditions and a heightened collection risk on the underlying loans. As a result of these matters, we may not achieve our investment objectives and a reduction in the market value of our investments could have an adverse effect on our liquidity, financial condition and results of operations.
We carry certain financial instruments at fair value and disclose the fair value of all financial instruments. Valuations use inputs and assumptions that are not always observable or may require estimation; valuation methods may be complex and may also require estimation, thereby resulting in values that are less certain and may vary significantly from the value at which the investments may be ultimately sold. For additional information about the methodologies, estimates and assumptions we use in determining the fair value of our investments refer to Note 3 of Item 8 in Part II our Annual Report on Form 10-K for the year ended December 31, 2023 - "Fair Value Measurements."
Federal budget deficit concerns and the potential for political conflict over the U.S. government’s debt limit may increase the possibility of a default by the U.S. government on its debt obligations, related credit-rating downgrades, or an economic recession in the United States. Many of our investment securities are issued by the U.S. government and government agencies and sponsored entities. As a result of uncertain domestic political conditions, including potential future federal government shutdowns, the possibility of the federal government defaulting on its obligations due to debt ceiling limitations or other unresolved political issues, investments in financial instruments issued or guaranteed by the federal government pose liquidity risks. Any potential downgrades by rating agencies in long-term sovereign credit ratings, as well as sovereign debt issues facing the governments of other countries, could have a material adverse impact on financial markets and economic conditions worldwide.
For the significant portion of our investment portfolio that is held by MGIC, to receive full capital credit under insurance regulatory requirements and under the PMIERs, we generally are limited to investing in investment grade fixed income securities whose yields reflect their lower credit risk profile. Our investment income depends upon the size of the portfolio and its reinvestment at prevailing interest rates. A prolonged period of low investment yields would have an adverse impact on our investment income as would a decrease in the size of the portfolio.
We structure our investment portfolio to satisfy our expected liabilities, including claim payments in our mortgage insurance business. If we underestimate our liabilities or improperly structure our investments to meet these liabilities, we could have unexpected losses resulting from the forced liquidation of fixed income investments before their maturity, which could adversely affect our results of operations.
MGIC Investment Corporation 2023 Form 10-K | 38
MGIC Investment Corporation and Subsidiaries
Our holding company debt obligations are material.
At December 31, 2022,2023, we had approximately $647$918 million in cash and investments at our holding company and our holding company’s long-term debt obligations were $671$650 million in aggregate principal amount. Annual debt service on the long-term debt obligations outstanding as of December 31, 2022,2023, is approximately $36$34 million.
The long-term debt obligations are owed by our holding company, MGIC Investment Corporation, and not its subsidiaries. The payment of dividends from MGIC is the principal source of our holding company cash inflow. Other sources of holding company cash inflow include settlements under intercompany tax and expense sharing agreements, investment income and raising capital in the public markets. The payment of dividends on our common shares in the future depends largely on the earnings and cash flows of MGIC, and is additionally subject to regulatory approval as described below. Although MGIC holds assets in excess of its minimum statutory capital requirements and its PMIERs financial requirements, the ability of MGIC to pay dividends is restricted by insurance regulation. In general, dividends in excess of prescribed limits are deemed “extraordinary” and may not be paid if disapproved by the OCI. In 2023,2024, MGIC can pay $92$64 million of ordinary dividends without OCI approval, before taking into consideration dividends paid in the preceding twelve months. A dividend is extraordinary when the proposed dividend amount plus dividends paid in the last twelve months from the dividend payment date exceed the ordinary dividend level. In the twelve months ended December 31, 2022,2023, MGIC paid $800$600 million in dividends to the holding company. Future dividend payments from MGIC to the holding company will be determined in consultation with the board of directors, and after considering any updated estimates about our business.
Repurchases of our common stock may be made from time to time on the open market (including through 10b5-1 plans) or through privately negotiated transactions. In 2022, we repurchased approximately 27.8 million shares, using approximately $386 million of holding company resources. As of December 31, 2022, we had $114 million of authorization remaining to repurchase our common stock through the end of 2023 under a share repurchase program approved by our Board of Directors in October 2021. If any capital contributions to our subsidiaries are required, such contributions would decrease our holding company cash and investments.
Your ownership in our company may be diluted by additional capital that we raise.
As noted above under our risk factor titled “We may not continue to meet the GSEs’ private mortgage insurer eligibility requirements and our returns may decrease if we are required to maintain more capital in order to maintain our eligibility,” although we are currently in compliance with the requirements of the PMIERs, there can be no assurance that we would not seek to issue additional debt capital or to raise additional equity or equity-linked capital to manage our capital position under the PMIERs or for other purposes. Any future issuance of equity securities may dilute your ownership interest in our company. In addition, the market price of our common stock could decline as a result of
MGIC Investment Corporation 2022 Form 10-K | 36
MGIC Investment Corporation and Subsidiaries
sales of a large number of shares or similar securities in the market or the perception that such sales could occur.
The price of our common stock may fluctuate significantly, which may make it difficult for holders to resell common stock when they want or at a price they find attractive.
The market price for our common stock may fluctuate significantly. In addition to the risk factors described herein, the following factors may have an adverse impact on the market price for our common stock: changes in general conditions in the economy, the mortgage insurance industry or the financial markets;stability of markets and financial services industry; announcements by us or our competitors of acquisitions or strategic initiatives; our actual or anticipated quarterly and annual operating results; changes in expectations of future financial performance (including incurred losses on our insurance in force); changes in estimates of securities analysts or rating agencies; actual or anticipated changes in our share repurchase program or dividends; changes in operating performance or market valuation of companies in the mortgage insurance industry; the addition or departure of key personnel; changes in tax law; and adverse press or news announcements affecting us or the industry. In addition, ownership by certain types of investors may affect the market price and trading volume of our common stock. For example, ownership in our common stock by investors such as index funds and exchange-traded funds can affect the stock’s price when those investors must purchase or sell our common stock because the investors have experienced significant cash inflows or outflows, the index to which our common stock belongs has been rebalanced, or our common stock is added to and/or removed from an index (due to changes in our market capitalization, for example).
The Company may be adversely impacted by the transition from LIBOR as a reference rate.
The United Kingdom’s Financial Conduct Authority, which regulates LIBOR, announced that after 2021 it would no longer publish one-week and two-month tenor USD LIBOR and that after June 30, 2023, it would no longer publish all other USD LIBOR tenors. Efforts are underway to identify and transition to a set of alternative reference rates. The set of alternative rates includes the Secured Overnight Financing Rate (“SOFR”), which the Federal Reserve Bank of New York began publishing in 2018. Because SOFR is calculated based on different criteria than LIBOR, SOFR and LIBOR may diverge.
While it is not currently possible to determine precisely whether, or to what extent, the replacement of LIBOR would affect us, the implementation of alternative benchmark rates to LIBOR may have an adverse effect on our business, results of operations or financial condition. We have three primary types of transactions that involve financial instruments referencing LIBOR. First, as of December 31, 2022, approximately 6% of the fair value of our investment portfolio consisted of securities referencing LIBOR. Second, as of December 31, 2022, approximately $0.4 billion of our risk in force was on adjustable rate mortgages whose interest is referenced to one-month USD LIBOR. A change in reference rate associated with these loans may affect their principal balance, which may affect our risk-in-force and the amount of Minimum Required Assets we are required to maintain under PMIERs. A change in reference rate may also affect the amount of principal and/or accrued interest we are required to pay in the event of a claim payment. Third, the premiums under most of our 2018-2021 XOL reinsurance agreements executed through insurance linked noted transactions are determined, in part, by the difference
between interest payable on the reinsurers’ notes which reference one-month USD LIBOR and earnings from a pool of securities receiving interest that may reference LIBOR (in 2022, our total premiums on such transactions were approximately $36.4 million).
MGIC Investment Corporation 20222023 Form 10-K | 3739
MGIC Investment Corporation and Subsidiaries
Item 1B. Unresolved Staff Comments
None.
Item 1C. Cybersecurity
MGIC’s Information Security Program includes information security policies, annual risk assessments and analyses, threat monitoring and alerting, vulnerability management, incident response, and data loss prevention controls. With this program, MGIC seeks to prevent, detect, and respond to unauthorized access, use, or disclosure of confidential information.
MGIC’s Information Risk Management (IRM) team is responsible for safeguarding the organization's information assets, data, and technology infrastructure from security threats and vulnerabilities. The IRM team’s primary focus is the protection of the confidentiality, integrity, and availability of sensitive information and compliance with relevant laws, regulations, and industry standards.
Various aspects of the Information Security Program are subject to periodic audit by the Company’s Internal Audit department or third-party professionals engaged by the Internal Audit department. Such audits vary from year-to-year but are generally focused on compliance with stated control activities, standards, and internal policies, as well as maintaining the integrity and independence of the audit process. Cybersecurity risk reviews such as SOC2, SOX controls, Penetration Tests, and regulatory controls are conducted by independent third parties.
The Information Security Program also incorporates a vendor due diligence process that is designed to evaluate whether a vendor or third-party service provider that receives confidential data meets MGIC’s information security governance, risk, and compliance requirements. The process includes assessing and managing the cyber risks associated with engaging third-party vendors and reviewing their information security practices.
In the event of a suspected or threatened cybersecurity incident, the Company’s Chief Information Security Officer (“CISO”) determines whether to activate the Company’s Cyber Incident Response Team (“CIRT”), composed of different subject matter experts from applicable domains such as network, infrastructure, and application areas in order to evaluate the technical issues relative to the incident. The CIRT is overseen by the CISO. If necessary, the CIRT may engage third-party cybersecurity experts to evaluate and/or remediate the incident. In the event that the CIRT confirms that the incident relates to a cybersecurity incident or compromise of MGIC’s computer systems, the CISO will notify the General Counsel, who will advise the Chief Executive Officer ("CEO"), who is a member of the Board of Directors. In addition to advising the CEO, the General Counsel will also convene an established committee whose members include the General Counsel, Chief Financial Officer, Senior Vice President of Investor Relations, and Chief Accounting Officer in order to determine if the event is a material cybersecurity incident so as to trigger an Item 1.05 filing on Form 8-K. If a determination is made that the event is material, or if the CEO or General Counsel otherwise determines it advisable, the CEO or General Counsel, or a delegate thereof, shall notify the Chairman of the Board, Lead Independent Director, and Chairpersons of the Board’s Business Technology and Transformation Committee (the “BTTC”) and Audit Committee.
To our knowledge, there have been no cybersecurity incidents that have materially affected or are reasonably likely to materially affect the Company.
If a cybersecurity incident were to occur, it could affect our operations, results of operations, or financial condition as described in our Risk Factors titled “Information technology system failures or interruptions may materially impact our operations and/or adversely affect our financial results” and “We could be materially adversely affected by a cybersecurity breach or failure of information security controls."
The CISO partners with the Company’s Risk Department to promote alignment of cybersecurity risk management strategy with the broader risk management strategy for the organization. The integration of information security into the overall enterprise risk management framework enables collaboration on the identification, assessment, mitigation and monitoring of cybersecurity risks that have the potential to materially impact the operation of the Company.
The Risk Management Committee of the Board coordinates with the Board and other Board committees regarding the assignment to the Board and Committees of oversight responsibilities for all identified key risks to the Company. Risks related to cybersecurity are overseen by the BTTC. The BTTC monitors cybersecurity risks associated with both internal and external actors, including third-party vendors and service providers. Additional information about the BTTC’s role in overseeing risks related to cybersecurity and information technology generally can be found in the Committee’s Charter at mtg.mgic.com/corporate-governance/highlights.
The CISO provides quarterly updates about the Company’s cybersecurity program to the BTTC. Updates may include topics such as management’s efforts to identify and monitor risks, investments to improve the Company’s detection and response systems, the results of risk assessments, compliance with controls, vendor oversight, strategic technology planning, and if necessary, the status of any new, ongoing, or prior cybersecurity incident. The CISO also periodically attends the BTTC meetings.
MGIC Investment Corporation 2023 Form 10-K | 40
MGIC Investment Corporation and Subsidiaries
The Company’s current CISO, Jennifer Westphal, is responsible for assessing and managing the material risks posed by cybersecurity threats. Ms. Westphal has over 25 years of experience in information technology, with 18 of those years focused on cybersecurity. Ms. Westphal has been with the Company for more than ten years and was promoted to the position of CISO in January 2021. Prior to 2021, Ms. Westphal served as the Deputy CISO and before that, as the Director of Information Risk Management.
Item 2. Properties
At December 31, 2022,2023, we had no office space leases in the United States that require monthly rental payments.
We own our headquarters facility and an additional office/warehouse facility, both located in Milwaukee, Wisconsin, which contain an aggregate ofcontains approximately 310,000220,000 square feet of space.
Item 3. Legal Proceedings
Item 4. Mine Safety Disclosures
Not Applicable.
MGIC Investment Corporation 20222023 Form 10-K | 3841
MGIC Investment Corporation and Subsidiaries
Information About Our Executive Officers
Certain information with respect to our executive officers as of February 22, 202321, 2024 is set forth below:
| | | | | | | | |
| Executive officers of the registrant |
|
| Name and Age | | Title |
Timothy J. Mattke, 4748 | | Chief Executive Officer and Director of MGIC Investment Corporation and MGIC |
Salvatore A. Miosi, 5657 | | President and Chief Operating Officer of MGIC Investment Corporation and MGIC |
Nathan H. Colson, 3940 | | Executive Vice President and Chief Financial Officer of MGIC Investment Corporation and MGIC |
James J. Hughes, 60 | | Executive Vice President – Sales and Business Development of MGIC |
Paula C. Maggio, 5455 | | Executive Vice President, General Counsel and Secretary of MGIC Investment Corporation and MGIC |
Steven M. Thompson, 6061 | | Executive Vice President and Chief Risk Officer of MGIC |
Robert J. Candelmo, 5960 | | Senior Vice President and Chief Information Officer of MGIC |
Mr. Mattke has served as our Chief Executive Officer since 2019. Before then, he had been the Company’s Chief Financial Officer from 2014 to 2019, and its Controller from 2009 to 2014. He joined the Company in 2006. Prior to his becoming Controller, he was Assistant Controller of MGIC beginning in 2007 and prior to that was a manager in MGIC’s accounting department. Before joining MGIC, Mr. Mattke was with PricewaterhouseCoopers LLP, the Company’s independent registered accounting firm.
Mr. Miosi has served as our President and Chief Operating Officer since 2019. Before then, he had been Executive Vice President – Business Strategy and Operations since 2017. He served as Senior Vice President – Business Strategy and Operations of MGIC from 2015 to 2017, and Vice President – Marketing from 2004 to 2015. Mr. Miosi joined the company in 1988 and has also held a variety of leadership positions in the operations, technology and marketing divisions.
Mr. Colson has served as our Executive Vice President and Chief Financial Officer since 2019. Before then, he had been MGIC's Vice President – Finance during 2019 and its Assistant Treasurer from 2016 to 2019. He joined MGIC in 2014 and prior to becoming Assistant Treasurer, he held positions in its Risk Management Department. Before joining MGIC, Mr. Colson was with PricewaterhouseCoopers LLP, the Company’s independent registered accounting firm.
Mr. Hughes has served as Executive Vice President – Sales and Business Development of MGIC since 2017. He served as Senior Vice President – Sales and Business Development of MGIC from 2015 to 2017, and Vice President, Managing Director in the sales area from 2001 to 2015. He joined MGIC in 1987 and prior to becoming Vice President, Managing Director, he had been an Account Manager and a Sales Manager. On January 17, 2023 Mr. Hughes provided notice of his intent to retire, effective August 1, 2023. On April 1, 2023 Mr. Hughes will step down from his role as Executive Vice-President - Sales and Business Development and serve as a Special Advisor to the CEO until his retirement date.
Ms. Maggio joined the Company in 2018 and has served as Executive Vice President, General Counsel and Secretary since then. Prior to joining the Company, Ms. Maggio had been Executive Vice President, General Counsel and Secretary of Retail Properties of America, Inc. from 2016 to 2018, Executive Vice President, General Counsel and Secretary of Strategic Hotels & Resorts, Inc. (SHR) from 2012 to 2015, and in various other leadership roles with SHR since joining that firm in 2000. Prior to joining SHR, Ms. Maggio had been in private legal practice from 1994-2000.
Mr. Thompson has served as MGIC's Executive Vice President and Chief Risk Officer since 2019. Before then, he had been Interim Chief Risk Officer during 2019, and Vice President Credit Policy and Pricing from 2016 to 2019. He joined MGIC in 1998 and prior to being named Vice President Credit Policy and Pricing, he held several management positions in its Risk Management Department, including Vice President – Risk Management from 2000 to 2016. On November 6, 2023, Mr. Thompson provided notice of his intent to retire, effective March 22, 2024. Mr. Colson will assume responsibility for overseeing the Risk Management Department upon Mr. Thompson's retirement.
Mr. Candelmo has served as MGIC's Senior Vice President and Chief Information Officer since 2019. He joined MGIC in 2014 as its Vice President – Chief Technology Officer. Prior to joining MGIC, Mr. Candelmo had been Senior Vice President of Enterprise Information Services with SunTrust Bank since 2008. Prior to joining SunTrust, Mr. Candelmo had held various other leadership roles within the information technology discipline.
MGIC Investment Corporation 20222023 Form 10-K | 3942
MGIC Investment Corporation and Subsidiaries
PART II
Item 5. Market for Registrant’s Common Equity, Related Stockholder Matters and Issuer Purchases of Equity Securities
(a)Our Common Stock is listed on the New York Stock Exchange under the symbol “MTG.”
As of February 17, 2023,16, 2024, the number of shareholders of record was 274.177. In addition, we estimate there are approximately 75,65490,250 beneficial owners of shares held by brokers and fiduciaries.
Information regarding equity compensation plans is contained in Item 12.
(b)Not applicable.
(c)Issuer Purchases of Equity Securities
The following table provides information about purchases of MGIC Investment Corporation common stock by us during the three months ended December 31, 2022.2023.
| | | | | | | | | | | | | | | | | | | | | | | | | | | | | | | | |
| Share repurchases |
| Period Beginning | | Period Ending | | Total number of shares purchased | | Average price paid per share | | Total number of shares purchased as part of publicly announced plans or programs | | Approximate dollar value of shares that may yet be purchased under the program (1) |
| October 1, 2022 | | October 31, 2022 | | 2,564,592 | | | $ | 12.96 | | | 2,564,592 | | | $ | 160,583,743 | |
| November 1, 2022 | | November 30, 2022 | | 1,770,926 | | | $ | 13.49 | | | 1,770,926 | | | $ | 136,687,570 | |
| December 1, 2022 | | December 31, 2022 | | 1,720,794 | | | $ | 13.02 | | | 1,720,794 | | | $ | 114,286,213 | |
| | | | 6,056,312 | | | $ | 13.13 | | | 6,056,312 | | | |
| | | | | | | | | | |
| | | | | | | | | | | | | | | | | | | | | | | | | | | | | | | | |
| Share repurchases |
| Period Beginning | | Period Ending | | Total number of shares purchased | | Average price paid per share | | Total number of shares purchased as part of publicly announced plans or programs | | Approximate dollar value of shares that may yet be purchased under the program (1) |
| 10/1/2023 | | 10/31/2023 | | 2,627,520 | | | $ | 16.86 | | | 2,627,520 | | | $ | 352,143,837 | |
| 11/1/2023 | | 11/30/2023 | | 2,372,521 | | | $ | 17.48 | | | 2,372,521 | | | $ | 310,661,722 | |
| 12/1/2023 | | 12/31/2023 | | 1,982,517 | | | $ | 18.63 | | | 1,982,517 | | | $ | 273,735,272 | |
| | | | 6,982,558 | | | $ | 17.57 | | | 6,982,558 | | | |
| | | | | | | | | | |
(1)In October 2021,April 2023, our Board of Directors authorized a share repurchase program under which as of December 31, 20222023 we may repurchase up to an additional $114$274 million of our common stock through the end of 2023.July 1, 2025. Repurchases may be made from time to time on the open market (including through 10b5-1 plans) or through privately negotiated transactions. The repurchase program may be suspended for periods or discontinued at any time.
MGIC Investment Corporation 20222023 Form 10-K | 4043
MGIC Investment Corporation and Subsidiaries
Item 6. Reserved.
MGIC Investment Corporation 20222023 Form 10-K | 4144
MGIC Investment Corporation and Subsidiaries
Item 7. Management’s Discussion and Analysis of Financial Condition and Results of Operations
INTRODUCTION
As used below, “we” and “our” refer to MGIC Investment Corporation’s consolidated operations or to MGIC Investment Corporation, as a separate entity, as the context requires. References to "we" and "our" in the context of debt obligations refer to MGIC Investment Corporation. See the "Glossary of terms and acronyms" for definitions and descriptions of terms used throughout this annual report. The Risk Factors contained in Item 1A discuss trends and uncertainties affecting us and are an integral part of the MD&A.
The following is a discussion and analysis of the financial conditions and results of operations for the years ended December 31, 20222023 and 2021,2022, including comparisons between 2023 and 2022. Comparisons between 2022 and 2021. Comparisons between 2021 and 2020 have been omitted from this Form 10-K, but can be found in "Item 7 - Management's Discussion and Analysis of Financial Condition and Results of Operations" in our Annual Report on Form 10-K for the year ended December 31, 20212022 filed with the SEC.
Forward Looking and Other Statements
As discussed under “Forward Looking Statements and Risk Factors” in Item 1A of Part 1 of this Report, actual results may differ materially from the results contemplated by forward looking statements. We are not undertaking any obligation to update any forward looking statements or other statements we may make in the following discussion or elsewhere in this document even though these statements may be affected by events or circumstances occurring after the forward looking statements or other statements were made. Therefore, no reader of this document should rely on these statements being current as of any time other than the time at which this document was filed with the Securities and Exchange Commission.
MGIC Investment Corporation 20222023 Form 10-K | 4245
This Overview of the MD&A highlights selected information and may not contain all of the information that is important to readers of this Annual Report. Hence, this Overview is qualified by the information that appears elsewhere in this Annual Report, including the other portions of the MD&A.
Through MGIC, the principal subsidiary of MGIC Investment Corporation, we serve lenders throughout the United States helping families achieve homeownership sooner by making affordable low-down-payment mortgages a reality through the use of private mortgage insurance. At December 31, 20222023 MGIC had $295.3$293.5 billion of primary IIF.
| | Summary of financial results of MGIC Investment Corporation | Summary of financial results of MGIC Investment Corporation | |
| Summary of financial results of MGIC Investment Corporation | |
| Summary of financial results of MGIC Investment Corporation | |
| | | Year Ended December 31, | |
| | Year Ended December 31, | | |
| | Year Ended December 31, | |
| | | Year Ended December 31, | |
| (in millions, except per share data) | |
| (in millions, except per share data) | |
| (in millions, except per share data) | (in millions, except per share data) | | 2022 | | 2021 | | Change | |
| Selected statement of operations data | Selected statement of operations data | | |
| Selected statement of operations data | |
| Selected statement of operations data | |
| Net premiums earned | |
| Net premiums earned | |
| Net premiums earned | Net premiums earned | | $ | 1,007.1 | | | $ | 1,014.4 | | | (1) | % | |
| Investment income, net of expenses | Investment income, net of expenses | | 167.5 | | | 156.4 | | | 7 | % | |
| Investment income, net of expenses | |
| Investment income, net of expenses | |
| Losses incurred, net | |
| Losses incurred, net | |
| Losses incurred, net | Losses incurred, net | | (254.6) | | | 64.6 | | | N/M | |
| Other underwriting and operating expenses, net | Other underwriting and operating expenses, net | | 236.7 | | | 198.4 | | | 19 | % | |
| Other underwriting and operating expenses, net | |
| Other underwriting and operating expenses, net | |
| Loss on debt extinguishment | |
| Loss on debt extinguishment | |
| Loss on debt extinguishment | Loss on debt extinguishment | | 40.2 | | | 36.9 | | | 9 | % | |
| Income before tax | Income before tax | | 1,090.0 | | | 801.8 | | | 36 | % | |
| Income before tax | |
| Income before tax | |
| Provision for income taxes | |
| Provision for income taxes | |
| Provision for income taxes | Provision for income taxes | | 224.7 | | | 166.8 | | | 35 | % | |
| Net income | Net income | | 865.3 | | | 635.0 | | | 36 | % | |
| Net income | |
| Net income | |
| Diluted income per share | |
| Diluted income per share | |
| Diluted income per share | Diluted income per share | | $ | 2.79 | | | $ | 1.85 | | | 51 | % | |
| Non-GAAP Financial Measures (1) | Non-GAAP Financial Measures (1) | | |
| Non-GAAP Financial Measures (1) | |
| Non-GAAP Financial Measures (1) | |
| Adjusted pre-tax operating income | |
| Adjusted pre-tax operating income | |
| Adjusted pre-tax operating income | Adjusted pre-tax operating income | | $ | 1,140.0 | | | $ | 831.7 | | | 37 | % | |
| Adjusted net operating income | Adjusted net operating income | | 904.8 | | | 658.6 | | | 37 | % | |
| Adjusted net operating income | |
| Adjusted net operating income | |
| Adjusted net operating income per diluted share | Adjusted net operating income per diluted share | | $ | 2.91 | | | $ | 1.91 | | | 52 | % | |
| Adjusted net operating income per diluted share | |
| Adjusted net operating income per diluted share | |
SUMMARY OF 20222023 FINANCIAL RESULTS
Net income offor 2023 was $712.9 million (2022: $865.3 million for 2022 increased by $230.4 million when compared to the prior year,million) and diluted income per share of $2.79 increased by 51% when compared to the prior year.was $2.49 (2022: $2.79). The increasedecrease in net income is primarily reflects a decrease in losses incurred, partially offset by a higher provision for income taxes and other underwriting and operating expenses, net. Diluted income per share increased due to an increase in losses incurred and a decrease in net premiums earned. This was partially offset by an increase in investment income, net of expenses, a decrease in loss on debt extinguishment, and a decrease in our provision for income taxes. Diluted income per share decreased primarily due to a decrease in net income, andpartially offset by a decrease in the number of diluted weighted average shares outstanding.
Adjusted net operating income for 20222023 was $904.8$724.4 million (2021: $658.6(2022: $904.8 million) and adjusted net operating income per diluted share was $2.91 (2021: $1.91)$2.53 (2022: $2.91). AdjustedThe decrease in adjusted net operating income in 2023 compared to 2022 is primarily due to a decrease in net income. The decrease in 2023 adjusted net operating income per diluted share compared to 2022 is primarily due to a decrease in adjusted net operating income, partially offset by a decrease in the number of diluted weighted average shares outstanding.
Premiums earned for 2022 and 2021 included adjustments2023 were $952.6 million, compared with $1,007.1 million for the same period last year. The decrease in premiums earned compared with the prior year is primarily due to an increase in ceded premiums that was the result of a lossdecrease in the profit commission earned on debt extinguishment andour QSR Transactions.
Net investment income in 2023 was $214.7 million, compared with $167.5 million in the prior year. The increase in net realized investment gains (losses).income was due to an increase of 80 basis points in the average investment yield.
Losses incurred, net were $(254.6) million, a decrease of $319.1$(20.9) million, compared with losses incurred of $64.6$(254.6) million for the prior year. While new delinquency notices added approximately $149.6$187.7 million to losses incurred in 2022,2023, our re-estimation of loss reserves on previously received delinquency notices resulted in favorable development of $208.5 million. In 2022, new delinquency notices added approximately $149.6 million to losses incurred, offset by re-estimation of loss reserves on previously received delinquency notices resulted in favorable development of $404.1 million,million. The favorable development for both periods primarily related toresulted from a decrease in the estimatedexpected claim rate on previously received delinquencies. The favorable development primarily resulted from greater than expected cure rates, as borrower reinstatements and servicer mitigation efforts resulted in more cures than originally estimated. Additionally, homeHome price
appreciation experienced in recent years has allowed some borrowers to cure their delinquencies through the sale of their property. In 2021, new delinquency notices added approximately $124.6 million to losses incurred, while our re-estimation of loss reserves on previously received delinquency notices resulted in $60 million of favorable loss development primarily due to the decrease in the claim rate on delinquencies received prior to the COVID-19 pandemic. This was offset by the recognition of a probable loss of $6.3 million related to litigation of our claims paying practices and adverse development on LAE reserves and reinsurance.
The increase in our provision for income taxes to $224.7 million in 2022 compared to $166.8 million in 2021 was primarily due to an increase in income before tax. Our effective tax rate for 2022 was 20.6% compared to 20.8% for 2021.
Other underwriting and operating expenses, net increased to $236.7 million in 2022 from $198.4 million in 2021 primarily due to higher expenses related to our technology investments, particularly in data and analytics, and an increase in pension expense. Pension expenses increased in 2022 as a result of settlement accounting charges during 2022.
MGIC Investment Corporation 20222023 Form 10-K | 4346
MGIC Investment Corporation and Subsidiaries
We did not record a loss on debt extinguishment in 2023. In 2022, we recorded a loss on debt extinguishment of $40.2 million, related to the repurchase of a portion of our 9% Debentures, the redemption of our 5.75% Senior Notes, and the repayment of the outstanding principal balance of our FHLB advance. See Note 7 - “Debt” to our consolidated financial statements for a discussion of the 9% Debenture conversion in 2023.
Our provision for income taxes decreased to $189.3 million in 2023 compared to $224.7 million in 2022 primarily due to a decrease in income before tax. Our effective tax rate for 2023 was 21.0% compared to 20.6% for 2022.
BUSINESS ENVIRONMENT
Economic conditions
DueHome purchases decreased in 2023, compared to 2022, due to higher interest rates and higher home prices in 2022, there was a decrease in home purchases in 2022 after a strong 2021.prices. Higher interest rates also resulted in decreased refinance activity during 2022, after a robust 2021.2023. This resulted inled to a decrease in our NIW, to $46.1 billion in 2023 compared to $76.4 billion in 2022 when compared to $120.2 billion in 2021.2022.
The level of interest rates and home prices may change in the future. For information about the possible effects of such changes, see our risk factors titled "If the volume of low down payment home mortgage originations declines, the amount of insurance that we write could decline,” “Downturns in the domestic economy or declines in home prices may result in more homeowners defaulting and our losses increasing, with a corresponding decrease in our returns,” and “Changes in interest rates, house prices or mortgage insurance cancellation requirements may change the length of time that our policies remain in force."
Mortgage insurance market
The paststrong credit quality of our insurance portfolio reflects several years of favorable housing fundamentals and in our view, generally favorable risk characteristics ofon our recently insured loans contributed to a growingloans. Our insurance in force. Higher interest rates and home prices, resulted inforce was relatively flat during the year as a decrease in ourresult of a lower NIW, in 2022 when compared to 2021.offset by increased annual persistency.
The percentage of our NIW with DTI ratios over 45% and LTV'sLTVs over 95% increased in 2022 when compared with 2021. The increase was primarily driven by higher home prices and interest rates, and a higherwill fluctuate based on the mortgage conditions that could include the percentage of NIW from purchase transactions.
transactions, changes in home prices, changes in mortgage rates, and GSE activities. Refer to "Mortgage Insurance Portfolio" for additional discussion of changes ininformation on our NIW mix during 2022.
Competition
PMI.PMI
The private mortgage insurance industry is highly competitive and is expected to remain so. We believe that we currently compete with other private mortgage insurers based on premium rates, underwriting requirements, financial strength (including based on credit or financial strength ratings), customer relationships, name recognition, reputation, strength of management teams and field organizations, the ancillary products and services provided to lenders, and the effective use of technology and innovation in the delivery and servicing of our mortgage insurance products.
Pricing practices
In recent years, the industry has materially reduced its use of standard rate cards, which were fairly consistent among competitors, and correspondingly increased its use of (i) "risk-based pricing systems" that use a spectrum of filed rates to allow for formulaic, risk-based pricing based on multiple attributes that may be quickly adjusted within certain parameters, and (ii) customized rate plans,plans. We monitor various competitive and economic factors while seeking to balance both of which typically have rates lower than the standard rate card. Our increased use of reinsurance over the past several years,profitability and the improved credit profile and reduced loss expectations associated with loans insured after 2008, have helped to mitigate the negative effect of declining premium rates onmarket share considerations in developing our expected returns.pricing strategies.
For information about competition in the private mortgage insurance industry, see our risk factor titled “Competition or
changes in our relationships with our customers could reduce our revenues, reduce our premium yields and/or increase our losses" in Item 1A.
GSE Risk Share Transactions
In 2018, the GSEs initiated secondary mortgage market programs with loan level mortgage default coverage provided by various (re)insurers that are not mortgage insurers governed by PMIERs, and that are not selected by the lenders. DueThese programs, which currently account for a small percentage of the low down payment market, compete with traditional private mortgage insurance and, due to differences in policy terms, these programsthey may offer premium rates that are below prevalent single premium LPMI rates. While we view these programs as competing with traditional privatelender-paid mortgage insurance we("LPMI") rates. We participate in these programs from time to time.
The GSEs (and other investors) have also used other forms of credit enhancement that did not involve traditional private mortgage insurance, such as engaging in credit-linked note transactions executed in the capital markets, or using other forms of debt issuances or securitizations that transfer credit risk directly to other investors, including competitors and an affiliate of MGIC; using other risk mitigation techniques in conjunction with reduced levels of private mortgage insurance coverage; or accepting credit risk without credit enhancement.
Government programs.
MGIC Investment Corporation 2023 Form 10-K | 47
MGIC Investment Corporation and Subsidiaries
Government programs
PMI also competes against government mortgage insurance programs such as the FHA, VA, and USDA, primarily for lower FICO score business. The combined market share of primary mortgage insurance written by government programs continues to exceed that written by PMI in 2022both 2023 and 2021.2022.
Refer to "Mortgage Insurance Portfolio" for additional discussion on market share the 2022 business environment and the impact it had onour operating measures including NIW, IIF and RIF.
PMIERs
We operate under the requirements of the PMIERs of the GSEs in order to insure loans delivered to or purchased by them. The PMIERs include financial requirements as well as business, quality control and certain transactional approval requirements. The financial requirements of the PMIERs require a mortgage insurer’s "Available Assets" (generally only the most liquid assets of an insurer) to equal or exceed its "Minimum Required Assets" (which are based on an insurer's book of risk in force, calculated from tables of factors with several risk dimensions, reduced for credit given for risk ceded under reinsurance transactions, and subject to a floor amount). Based on our application of PMIERs, MGIC's Available Assets under PMIERs totaled $5.7$5.8 billion, an excess of $2.3$2.4 billion over its Minimum Required Assets at December 31, 2022.2023.
MGIC Investment Corporation 2022 Form 10-K | 44
MGIC Investment Corporation and Subsidiaries
BUSINESS OUTLOOK FOR 20232024
Our outlook for 20232024 should be viewed against the backdrop of the business environment discussed above.
NIW
Our NIW is affected by total mortgage originations, the percentage of total mortgage originations using private mortgage insurance (the "PMI penetration rate"), and our market share within the PMI industry. As of January 2023,2024, the total average mortgage origination forecasts from the Fannie Mae and the MBA indicate mortgage originations of $1.8$2.0 trillion in 2023,2024, compared to an estimated $2.3$1.6 trillion in 2022.2023. Both purchase originations and refinance transactions are forecasted to declineincrease in 20232024 when compared to 2022. As a result of the decrease in forecasted mortgage originations, we2023. We are expecting NIW to be lowerincrease slightly in 20232024 compared to 2022.2023.
The widespread use of risk based pricing systems by the PMI industry makes it more difficult to compare our rates to those offered by our competitors. We may not be aware of industry rate changes until we observe that our volume of NIW has changed. In addition, business under customized rate plans is awarded by certain customers for only limited periods of time. As a result, our NIW may fluctuate more than it had in the past.
IIF
Our IIF increased 7.6%decreased 0.6% in 20222023 and is expected to beremain relatively flat in 2023.2024. Our book of IIF is an important driver of our future revenues, and its growth is driven by our ability to generate NIW and the retention of our IIF, as measured by our annual persistency. Interest rates influence both our NIW and persistency. Generally speaking, in a rising rate environment, total mortgage originations may decline; however, absent material accumulated home price appreciation since the issuance of a policy, we would also expect policy cancellation rates to decline, and in turn increase annual persistency, although the impact generally lags the change in interest rates. In 2023,2024, we expect interest rates to remain elevated compared to recent years and the rate of growth in home prices to decline.continue to moderate.
Results of operations
Premiums.Premiums
Our direct premiums written and earned are impacted by our IIF during the period and our in force premium yield, both of which are expected to be relatively flat in 20232024 when compared to 2022.2023. Premiums earned are also impacted by the amount of accelerated premiums from single premium policy cancellations, which generally decrease as refinance activity decreases. Our unearned premium decreased to $157.8 million at December 31, 2023 from $195.3 million at December 31, 2022 from $241.7 million at December 31, 2021.2022.
Our net premiums written and earned are primarily impacted by the changes in the direct premiums written and earned noted above and by the amount of premiums we cede under our quota share and excess of loss reinsurance transactions. The amount of premiums we cede in 20232024 will be affected by any changes in our reinsurance coverage. Premiums we cede under our quota share transactions isare also impacted by the profit commission we receive. The amount of profit commission is variable year-to-year and is dependent on the amount of losses incurred ceded. In 2023, compared to 2022, negativethe increase in ceded losses incurred increaseddecreased the profit commission we received, resulting in lowerhigher ceded premiums. Increases in ceded losses incurred will benefit our losses incurred line, but will result in lower profit commission and higher ceded premiums.
Investment income.income
Net investment income is a material contributor to our results of operations. We expect net investment income in 20232024 to increase in comparison to 2022,2023, primarily due to higher average investment yields. The amount of investment income will be impacted by the
MGIC Investment Corporation 2023 Form 10-K | 48
MGIC Investment Corporation and Subsidiaries
change in the yield we can earn on investments and the level of invested assets. The level of invested assets will primarily be impacted by the amount of cash we expect to use in financing activities relative to our cash from operations. The magnitude of any change in our invested asset level will be subject to the timing of our financing activities.
Losses.Losses
Losses incurred, net is impacted by the level of new delinquency notices. Generally, on our primary business, the highest claim frequency years have been the third and fourth year after loan origination. As of December 31, 2022, 80%2023, 67% of our primary RIF was written subsequent to December 31, 2020, 84% of our primary RIF was written subsequent to December 31, 2019, 85%and 89% of our primary RIF was written subsequent to December 31, 2018, and 88% of our primary RIF was written subsequent to December 31, 2017.2018. The pattern of claim frequency can be affected by many factors, including annual persistency and deteriorating economic conditions.
Our claims paid activity slowed at the start of the COVID-19 pandemic primarily due to forbearance and foreclosure moratoriums put in place. Claim activityplace, and it has not yet returnedappreciably increased from those suppressed levels. Home price appreciation experienced in recent years has allowed some borrowers to pre-COVID-19 levels.cure their delinquencies through the sale of their property. In addition, an increase in third party property sales prior to claim settlement, has resulted in a decrease in the average claim paid on the claims we do receive. We expect net losses and LAE paid to increase,increase; however, the magnitude and timing of the increases are uncertain.
Underwriting and operating expenses, net.net
We expect underwriting and operating expenses, net to be modestly lower in 20232024 compared to 2022. In recent years, we have made additional investments in our technology, particularly in data and analytics and will continue to make similar investments in 2023. Pension expenses also increased in 2022 as a result of settlement accounting charges incurred during 2022. In 2023, we expect to incur settlement accounting charges as a result of lump sum settlements for employees who retired in the fourth quarter of 2022.
Income taxes.taxes
We expect our 20232024 effective tax rate to be approximately 21%.
CAPITAL
MGIC dividend payments to our holding company
The ability of MGIC to pay dividends is restricted by insurance regulation. Amounts in excess of prescribed limits are deemed “extraordinary” and may not be paid if disapproved by the OCI. A dividend is extraordinary when the proposed dividend amount, plus dividends paid in the twelve months preceding the dividend payment date exceed the ordinary dividend level. In 2023,2024, MGIC couldcan pay $92$64 million of ordinary dividends without OCI approval, before taking into consideration dividends paid in the preceding twelve months. In 20222023 and 2021,2022, MGIC paid a cash and/or investment security dividend of $800$600 million and $400$800 million, respectively, to our holding company. Future dividend payments from MGIC to the holding company will continue to be determined in consultation with the board.
Dividends to shareholders
MGIC Investment Corporation 2022 Form 10-K | 45
MGIC Investment CorporationIn the first and Subsidiariessecond quarters of 2023, we paid quarterly cash dividends of $0.10 per share to shareholders which totaled $58.8 million. In the third and fourth quarters of 2023, we paid quarterly cash dividends of $0.115 per share which totaled $65.3 million. On January 23, 2024, the Board of Directors declared a quarterly cash dividend to holders of the company's common stock of $0.115 per share payable on March 5, 2024, to shareholders of record at the close of business on February 15, 2024. We expect to continue to make dividend payments to shareholders in 2024.
Share repurchase programs
Repurchases may be made from time to time on the open market (including through 10b5-1 plans) or through privately negotiated transactions. The repurchase programs may be suspended for periods or discontinued at any time. We repurchased approximately 27.821.7 million shares in 20222023 using approximately $386$340.6 million of holding company resources. In 2021,2022, we repurchased approximately 19.027.8 million shares of our common stock using approximately $291$385.7 million of holding company resources. As of December 31, 2022,In 2024, we had $114 million of authorization remaining to repurchase our common stock through the end of 2023 under aexpect share repurchase program approved byprograms will remain our Boardprimary means of Directors in October 2021.returning capital to shareholders.
The following table shows details of our share repurchase programs.
| | Repurchase Program | Repurchase Program | Expiration Date | Repurchased (in millions) | Authorization Remaining
(in millions) | Repurchase Program | Repurchased during 2023 (in millions) | Authorization Remaining (in millions) at 12/31/23 | Expiration Date |
| | 2020 Authorization | December 31, 2021 | $ | 300 | | $ | — | |
| 2021 Authorization | 2021 Authorization | December 31, 2023 | $ | 386 | | $ | 114 | |
| 2021 Authorization | |
| 2021 Authorization | | $ | 114 | | $ | — | | N/A |
| 2023 Authorization | | 2023 Authorization | $ | 226 | | $ | 274 | | July 1, 2025 |
As of December 31, 2022,2023, we had approximately 293272.5 million shares of common stock outstanding which was a decrease of 8.4%7.2% from December 31, 2021.
Dividends to shareholders
In the first and second quarters of 2022, we paid quarterly cash dividends of $0.08 per share to shareholders which totaled $51.0 million. In the third and fourth quarters of 2022, we paid quarterly cash dividends of $0.10 per share which totaled $60.7 million. On January 24, 2023, the Board of Directors declared a quarterly cash dividend to holders of the company's common stock of $0.10 per share payable on March 2, 2023, to shareholders of record at the close of business on February 17, 2023.
For information about how the payment of dividends by our holding company will result in an adjustment to the conversion rate and price of our convertible securities, see our risk factor titled “Your ownership in our company may be diluted by additional capital that we raise” in Item 1A.2022.
GSEs
We must comply with a GSE's PMIERs to be eligible to insure loans delivered to or purchased by that GSE. The PMIERs include financial requirements, as well as business, quality control and certain transaction approval requirements. The PMIERs provide that the GSEs may amend any provision of the PMIERs or impose additional requirements with an effective date specified by the GSEs. If MGIC ceases to be eligible to insure loans purchased by one or both of the GSEs, it would significantly reduce the volume of our NIW, the substantial majority of which is for loans delivered to or purchased by the GSEs.
MGIC Investment Corporation 2023 Form 10-K | 49
MGIC Investment Corporation and Subsidiaries
The financial requirements of the PMIERs require a mortgage insurer’s “Available Assets” (generally only the most liquid assets of an insurer) to equal or exceed its “Minimum Required Assets” (which are generally based on an insurer’s book of risk in force and are calculated from tables of factors with several risk dimensions, reduced for credit given for risk ceded under reinsurance transactions)transactions, and subject to a floor amount). Based on our interpretation of the PMIERs as of December 31, 2023, MGIC’s Available Assets totaled $5.8 billion, or $2.4 billion in excess of its Minimum Required Assets.
The PMIERs generally require us to hold significantly more Minimum Required Assets for delinquent loans than for performing loans and the Minimum Required Assets required to be held increases as the number of payments missed on a delinquent loan increases.
If MGIC ceases to be eligible to insure loans purchased by one or both of the GSEs, it would significantly reduce the volume of our NIW, the substantial majority of which is for loans delivered to or purchased by the GSEs. In addition to the increase in Minimum Required Assets associated with delinquent loans, factors that may negatively impact MGIC’s ability to continue to comply with the financial requirements of the PMIERs include the following:
| | | | | |
è
| The GSEs may make the PMIERs more onerous in the future. The PMIERs provide that the factors that determine Minimum Required Assets will be updated periodically, or as needed if there is a significant change in macroeconomic conditions or loan performance. We do not anticipate that the regular periodic updates will occur more frequently than once every two years. The PMIERs state that the GSEs will provide notice 180 days prior to the effective date of updates to the factors; however, the GSEs may amend any portion of the PMIERs at any time. |
è
| The PMIERS may be changed in response to the final regulatory capital framework for the GSEs which was established in February 2022. |
è | Our future operating results may be negatively impacted by the matters discussed in our Risk Factors. Such matters could decrease our revenues, increase our losses or require the use of assets, thereby creating a shortfall in Available Assets. |
è | Should capital be needed by MGIC in the future, capital contributions from our holding company may not be available due to competing demands on holding company resources, including for repayment of debt. |
Our reinsurance transactions enable us to earn higher returns on our businessMinimum Required Assets than we would without them because they generally reduce the Minimum Required Assets we must hold under PMIERs. However, reinsurance may not always be available to us, or available only on similar terms, and our reinsurance subjects us to counterparty credit risk. Our access to reinsurance may be disrupted and the terms under whichor costs, that we are able to obtain reinsurance may be less attractive than in the past due to volatility stemming from circumstances such as higher interest rates, increased inflation, global events such as the Russia-Ukraine war, and other factors. In 2022, execution of transactions for XOL reinsurance through the ILN market was more challenging primarily due to increased pricing.find unacceptable.
The calculated credit for XOL Transactions under PMIERs is generally based on the PMIERs requirement of the covered loans and the attachment and detachment point of the coverage. PMIERs credit is generally not given for the reinsured risk above the PMIERs requirement. Our existing reinsurance transactions are subject to periodic review by the GSEs and there is a risk we will not receive our current level of credit in future periods for the risk ceded under them. In addition, we may not receive the same level of credit under future transactions that we receive under existing transactions. If MGIC is not allowed certain levels of credit under the PMIERs, under certain circumstances, MGIC may terminate the reinsurance transactions without penalties.
For additional information about our reinsurance transactions, see our Risk Factor titled “Reinsurance may be unavailable at current levels and prices, and/or the GSEs may reduce the amount of capital credit we receive for our reinsurance transactions.” in Item 1A.
GSE Reform
The FHFA has been the conservator of the GSEs since 2008 and has the authority to control and direct their operations. Given that the Director of the FHFA is removable by the President at will, the agency's agenda, policies and actions are influenced by the then-current administration. The increased role that the federal government has assumed in the residential housing finance system through the GSE conservatorships may increase the likelihood that the business practices of the GSEs change, including through administration changes and actions. Such changes could have a material adverse effect on us.
It is uncertain what role the GSEs, FHA and private capital, including private mortgage insurance, will play in the residential housing finance system in the future. The timing and impact on our business of any resulting changes is uncertain. Many of the proposed changes would require Congressional action to implement and it is difficult to estimate when Congressional action would be final and how long any associated phase-in period may last.
For additional information about the business practices of the GSEs, see our Risk Factor titled “Changes in the business practices of Fannie Mae and Freddie Mac ("the GSEs"), federal legislation that changes their charters or a restructuring of the GSEs could reduce our revenues or increase our losses.” in Item 1A.
State Regulations
The insurance laws of 16 jurisdictions, including Wisconsin, our domiciliary state, require a mortgage insurer to maintain a minimum amount of statutory capital relative to its RIF (or a similar measure) in order for the mortgage insurer to continue to write new business. We refer to these requirements as the “State Capital Requirements.” While they vary among jurisdictions, the most common State Capital Requirements allow for a maximum risk-to-capital ratio of 25 to 1. A risk-to-capital ratio will increase if (i) the percentage decrease in capital exceeds the percentage
MGIC Investment Corporation 2022 Form 10-K | 46
MGIC Investment Corporation and Subsidiaries
decrease in insured risk, or (ii) the percentage increase in capital is less than the percentage increase in insured risk. Wisconsin does not regulate capital by using a risk-to-capital measure but instead requires a MPP. MGIC's "policyholder position" includes its net worth or surplus and its contingency reserve.
At December 31, 2022,2023, MGIC’s risk-to-capital ratio was 10.2 to 1, below the maximum allowed by the jurisdictions with State Capital Requirements, and its policyholder position was $3.5$3.6 billion above the required MPP of $2.1$2.2 billion. OurThe calculation of our risk-to-capital ratio and MPP reflect full credit for the risk ceded under our reinsurance transactions. It is possible that under the revised State Capital Requirements discussed below, MGIC will not be allowed full credit for the risk ceded under such transactions. If MGIC is not allowed an agreed level of credit under either the State Capital Requirements or the PMIERs, MGIC may terminate the reinsurance transactions, without penalty.
MGIC Investment Corporation 2023 Form 10-K | 50
MGIC Investment Corporation and Subsidiaries
The NAIC established a Mortgage Guaranty Insurance Working Group to determine and make recommendations to the NAIC’s Financial Condition Committee as to what, if any, changes to make to the solvency and other regulations relating to mortgage guaranty insurers. A draft of a revised Mortgage Guaranty Insurance Model Act was adopted by the Financial Condition Committee in July 2023 and by the Executive Committee and Plenary NAIC in August 2023. The revised Model Act includes requirements relating to, among other things: (i) capital and minimum capital requirements, and contingency reserves; (ii) restrictions on mortgage insurers’ investments in notes secured by mortgages; (iii) prudent underwriting standards and formal underwriting guidelines; (iv) the establishment of formal, internal “Mortgage Guaranty Quality Control Programs” with respect to in-force business; and (v) reinsurance and prohibitions on captive reinsurance arrangements. It is uncertain when the revised Model Act will be adopted in any jurisdiction. The provisions of the Model Act, if adopted in their final form, are not expected to have a material adverse effect on our business. It is unknown whether any changes will be made by state legislatures prior to adoption, and the effect changes, if any, will have on the mortgage guaranty insurance market generally, or on our business. At this time, we expect MGIC to continue to comply with the current State Capital Requirements; however, refer to our risk factor titled “State capital requirements may prevent us from continuing to write new insurance on an uninterrupted basis” in Item 1A for more information about matters that could negatively affect such compliance. The NAIC previously announced plans to revise the minimum capital and surplus requirements for mortgage insurers that are provided for in its Mortgage Guaranty Insurance Model Act. In 2019, a working group of state regulators released an exposure draft of a revised Mortgage Guaranty Insurance Model Act and a risk-based capital framework to establish capital requirements for mortgage insurers, although certain items were not completely addressed by the framework, including the treatment of ceded risk and minimum capital floors. In October 2022, the NAIC working group released a revised exposure draft of the Mortgage Guaranty Insurance Model Act that does not include changes to the capital requirements of the existing Model Act.
GSE REFORM
The FHFA has been the conservator of the GSEs since 2008 and has the authority to control and direct their operations. The increased role that the federal government has assumed in the residential housing finance system through the GSE conservatorship may increase the likelihood that the business practices of the GSEs change, including through administrative action, in ways that have a material adverse effect on us and that the charters of the GSEs are changed by new federal legislation.
It is uncertain what role the GSEs, FHA and private capital, including private mortgage insurance, will play in the residential housing finance system in the future. The timing and impact on our business of any resulting changes is uncertain. Many of the proposed changes would require Congressional action to implement and it is difficult to estimate when Congressional action would be final and how long any associated phase-in period may last.
For additional information about the business practices of the GSEs, see our Risk Factor titled “Changes in the business practices of Fannie Mae and Freddie Mac's ("the GSEs"), federal legislation that changes their charters or a restructuring of the GSEs could reduce our revenues or increase our losses.” in Item 1A.
COVID-19 PANDEMIC
The COVID-19 pandemic materially impacted our 2020 financial results, as we reserved for losses associated with the increased delinquency notices received. Through December 31, 2022, the vast majority of those delinquency notices have cured, resulting in a decrease in losses incurred as we recognized favorable loss development.
Forbearance for borrowers who were affected by COVID-19 allows mortgage payments to be suspended for a period of time. Historically, forbearance plans have reduced the incidence of our losses on affected loans. However, given the uncertainty surrounding the long-term economic impact of COVID-19, it is difficult to predict the ultimate effect of COVID-19 related forbearances on our loss incidence. Whether a loan delinquency will cure, including through modification, when forbearance ends will depend on the economic circumstances of the borrower at that time. The severity of losses associated with delinquencies that do not cure will depend on economic conditions at that time, including home prices.
Foreclosures on mortgages purchased or securitized by the GSEs were suspended through July 31, 2021. Under a CFPB rule that was effective through December 31, 2021, with limited exceptions, servicers were required to ensure that at least one temporary procedural safeguard had been met before referring 120-day delinquent loans for foreclosure. Claim activity has not yet returned to pre-COVID-19 levels.
For additional information about how the COVID-19 pandemic may impact our future financial results, business, liquidity, and/or financial condition, see our Risk Factor titled “The COVID-19 pandemic may materially impact our business and future financial condition.”compliance with State Capital Requirements.
FACTORS AFFECTING OUR RESULTS
Our current and future business, results of operations and financial condition are impacted by macroeconomic conditions, such as rising interest rates, home prices, housing demand, level of employment, inflation, pandemics, restrictions and costs on mortgage credit, and other factors. For additional information on how on our business may be impacted see our Risk Factor titled “Downturns in the domestic economy or declines in home prices may result in more homeowners defaulting and our losses increasing, with a corresponding decrease in our returns.”
As noted above, the COVID-19 pandemic may adversely affect our future business, results of operations, and financial condition.
The future effects of changing climatic conditionsclimate change on our business isare uncertain. For information about possible effects, please refer to our Risk Factor titled “Pandemics, hurricanes and other natural disasters may impact our incurred losses, the amount and timing of paid claims, our inventory of notices of default and our Minimum Required Assets under PMIERs.”
MGIC Investment Corporation 2022 Form 10-K | 47
MGIC Investment Corporation and Subsidiaries
Our results of operations are affected by:
Premiums written and earned
Premiums written and earned in a year are influenced by:
•NIW, which increases IIF. Many factors affect NIW, including the volume of low down payment home mortgage originations and competition to provide credit enhancement on those mortgages from the FHA, the VA, other mortgage insurers, and other alternatives to mortgage insurance, including GSE programs that may reduce or eliminate the demand for mortgage insurance. NIW does not include loans previously insured by us that are modified, such as loans modified under HARP.
•Cancellations, which reduce IIF. Cancellations due to refinancings are affected by the level of current mortgage interest rates compared to the mortgage coupon rates throughout the in force book, current home values compared to values when the loans in the in force book were insured and the terms on which mortgage credit is available. Home price appreciation can give homeowners the right to cancel mortgage insurance on their loans if sufficient home equity is achieved. Cancellations also result from policy rescissions, which require us to return any premiums received on the rescinded policies, and claim payments, which require us to return any premium received on the related policies from the date of default on the insured loans. Cancellations of single premium policies, which are generally non-refundable, result in immediate recognition of any remaining unearned premium.
•Premium rates, which are affected by product type, competitive pressures, the risk characteristics of the insured loans, the percentage of coverage on the insured loans, and PMIERs capital requirements. The substantial majority of our monthly and annual mortgage insurance premiums are under premium plans for which, for the first ten years of the policy, the amount of premium is determined by multiplying the initial premium rate by the original loan balance; thereafter, the premium rate resets to a lower rate used for the remaining life of the policy. The remainder of our monthly and annual premiums are under premium plans for which premiums are determined by a fixed percentage of the loan’s amortizing balance over the life of the policy.
•Premiums ceded, net of profit commission under our QSR Transactions, and premiums ceded under our XOL Transactions, are primarily affected by the percentage of our IIF subject to our reinsurance transactions. The profit commission under our QSR Transactions also varies inversely with the level of ceded losses incurred on a “dollar for dollar” basis and can be eliminated at ceded loss levels higher than what we have experienced on our QSR Transactions. As a result, lower levels of losses incurred result in a higher profit commission and less benefit from ceded losses incurred; higher levels of losses incurred result in more benefit from ceded losses incurred and a lower profit commission (or for certain levels of accident year loss ratios, its elimination). See Note 9 – “Reinsurance” to our consolidated financial statements for a discussion of our reinsurance transactions.
•Premiums earned are generated by the insurance that is in force during all or a portion of the period. A change in the
average IIF in the current period compared to an earlier period is a factor that will increase (when the average in force is higher) or reduce (when it is lower) premiums written and earned in the current period, although this effect may be enhanced (or mitigated) by the factors discussed above.
MGIC Investment Corporation 2023 Form 10-K | 51
MGIC Investment Corporation and Subsidiaries
Investment income
Our investment portfolio is composed principally of investment grade fixed income securities. The principal factors that influence investment income are the size of the portfolio and its yield. As measured by amortized cost (which excludes changes in fair value, such as from changes in interest rates), the size of the investment portfolio is mainly a function of cash generated from (or used in) operations, such as net premiums written, investment income, net claim payments and expenses, and cash provided by (or used for) non-operating activities, such as debt or stock issuances or repurchases, and dividends.
Losses incurred
Losses incurred are the current expense that reflects claim payments, costs of settling claims, and changes in our estimates of payments that will ultimately be made as a result of delinquencies on insured loans. As explained under “Critical Accounting Estimates” below, except in the case of a premium deficiency reserve, we recognize an estimate of this expense only for delinquent loans. Prior to the COVID-19 pandemic, theThe level of new delinquencies has historically followed a seasonal pattern, with new delinquencies in the first part of the year lower than new delinquencies in the latter part of the year. The state of the economy, local housing markets, and various other factors, including the COVID-19 pandemic,pandemics, may result in delinquencies not following the typical pattern. Losses incurred are generally affected by:
•The state of the economy, including unemployment and housing values, each of which affects the likelihood that loans will become delinquent and whether loans that are delinquent cure their delinquency.
•The product mix of the in force book, with loans having higher risk characteristics generally resulting in higher delinquencies and claims.
•The size of loans insured, with higher average loan amounts on delinquent loans tending to increase incurred losses.
•The percentage of coverage on insured loans, with deeper average coverage on delinquent loans tending to increase incurred losses.
•The rate at which we rescind policies or curtail claims. Our estimated loss reserves incorporate our estimates of future rescissions of policies and curtailments of claims, and reversals of rescissions and curtailments. We collectively refer to such rescissions and denials as “rescissions” and variations of this term. We call reductions to claims "curtailments."
•The distribution of claims over the life of a book. Historically, the first few years after loans are originated are a period of relatively low claims, with claims increasing substantially for several years subsequent and then declining, although annual persistency, the condition of the economy, including unemployment and housing prices, and other factors can affect this pattern. For example, a weak economy or housing
MGIC Investment Corporation 2022 Form 10-K | 48
MGIC Investment Corporation and Subsidiaries
value declines can lead to claims from older books increasing, continuing at stable levels or experiencing a lower rate of decline. See further information under “Mortgage insurance earnings and cash flow cycle” below.
•Losses ceded under reinsurance transactions. See Note 9 – “Reinsurance” to our consolidated financial statements for a discussion of our reinsurance transactions.
Underwriting and other expenses
Underwriting and other expenses includes items such as employee compensation, fees for professional and consulting services, depreciation and maintenance expense, and premium taxes, and are reported net of ceding commissions associated with our QSR Transactions. Employee compensation expenses are variable due to share-based compensation, changes in benefits, and changes in headcount (which can fluctuate due to volume of NIW). See Note 9 – “Reinsurance” to our consolidated financial statements for a discussion of ceding commission on our QSR Transactions.
Interest expense
Other
Certain activities that we do not consider being part of our fundamental operating activities may also impact our results of operations and are described below.
Gains (losses) on investments and other financial instruments
•Fixed income securities. Investment gains and losses reflect the difference between the amount received on the sale of a fixed income security and the fixed income security’s cost basis, as well as any credit allowances and any impairments on securities we intend to sell prior to recovery of its amortized cost basis. The amount received on the sale of fixed income securities is affected by the coupon rate of the security compared to the yield of comparable securities at the time of sale.
•Equity securities. Investment gains and losses are accounted for as a function of the periodic change in fair value.
MGIC Investment Corporation 2023 Form 10-K | 52
MGIC Investment Corporation and Subsidiaries
•Financial instruments. Investment gains and losses on the embedded derivative on our Home Re Transactions reflect the present value impact of the variation in investment income on assets on the insurance-linked notes held by the reinsurance trusts and the contractual reference rate used to calculate the reinsurance premiums we estimate we will pay over the estimated remaining life.
Loss on debt extinguishment
Gains and losses on debt extinguishment result from discretionary activities that are undertaken to enhance our capital position and / or improve our debt profile and/or reduce potential dilution from our outstanding convertible debt.profile. Extinguishing our outstanding debt obligations early through these discretionary activities may result in losses primarily driven by the payment of consideration in excess of our carrying value, , and the write off of
unamortized debt issuance costs on the extinguished portion of the debt.
MORTGAGE INSURANCE EARNINGS AND CASH FLOW CYCLE
In general, the majority of any underwriting profit that a book generates occurs in the early years of the book, with the largest portion of any underwriting profit realized in the first year following the year the book was written. Subsequent years of a book may result in either underwriting profit or underwriting losses. This pattern of results typically occurs because relatively few of the incurred losses on delinquencies that a book will ultimately experience typically occur in the first few years of the book, when premium revenue is highest, while subsequent years are affected by declining premium revenues, as the number of insured loans decreases (primarily due to loan prepayments) and increasing losses. The typical pattern is also a function of premium rates generally resetting to lower levels after ten years. The state of the economy, local housing markets and various other factors including the COVID-19 pandemic, may result in delinquencies not following the typical pattern.
CYBERSECURITY
As part of our business, we maintain large amounts of confidential and proprietary information including personal information of consumers and employees,both on our own servers and those of cloud computing services. FederalThis includes personal information of consumers and our employees. Personal information is subject to an increasing number of federal and state laws designed to promoteand regulations regarding privacy and data security, as well as contractual commitments. Any failure or perceived failure by us, or by the protection of such information require businesses that collect or maintain personalvendors with whom we share this information, to adopt information security programs, andcomply with such obligations may result in damage to notify individuals, and in some jurisdictions,our reputation, financial losses, litigation, increased costs, regulatory authorities, of security breaches involving personally identifiable information. penalties or customer dissatisfaction.
All information technology systems are potentially vulnerable to damage or interruption from a variety of sources, including by cyber attacks, such as those involving ransomware. The Company discovers vulnerabilitiesWe regularly defend against threats to our data and regularly blocks a high volume of attempts to gainsystems, including malware and computer virus attacks, unauthorized access, system failures and disruptions. Threats have the potential to its systems. jeopardize the information processed and stored in, and transmitted through, our computer systems and networks and otherwise cause interruptions or malfunctions in our operations, which could result in damage to our reputation, financial losses, litigation, increased costs, regulatory penalties or customer dissatisfaction. We could be similarly affected by threats against our vendors and/or third-parties with whom we share information.
Globally, attacks are expected to continue accelerating in both frequency and sophistication with increasing use by actors of tools and techniques that willmay hinder the Company’s ability to identify, investigate and recover from incidents. Such attacks may also increase as a result of retaliation by Russia in response tothreat actors against actions taken by the U.S. and other countries in connection with Russia's military invasion of Ukraine.wars and other global events. The Company operates under a hybrid workforce model and such model may be more vulnerable to security breaches.
While we have information security policies and systems in place to secure our information technology systems and to prevent unauthorized access to or disclosure of sensitive information, there can be no assurance with respect to our systems and those of our third-party vendors that unauthorized access to the systems or disclosure of the sensitive information, either through the actions of third parties or employees, will not occur. Due to our reliance on information technology systems, including ours and those of our customers and third-party service providers, and to the sensitivity of the information that we maintain, unauthorized access to the systems or disclosure of the information could adversely affect our reputation, severely disrupt our operations, result in a loss of business and expose us to material claims for damages and may require that we provide
MGIC Investment Corporation 2022 Form 10-K | 49
MGIC Investment Corporation and Subsidiaries
free credit monitoring services to individuals affected by a security breach.
Should we experience an unauthorized disclosure of information or a cyber attack, including those involving ransomware, some of the costs we incur may not be recoverable through insurance, or legal or other processes, and this may have a material adverse effect on our results of operations.
For additional information about our IT systems and cybersecurity, see our risk factor titled “Information technology system failures or interruptions may materially impact our operations and adversely affect our financial results" and "We could be materially adversely affected by a cyber security breach or failure of information security controls." in Item 1A and Item 1C. Cybersecurity.
MGIC Investment Corporation 20222023 Form 10-K | 5053
MGIC Investment Corporation and Subsidiaries
EXPLANATION AND RECONCILIATION OF OUR USE OF NON-GAAP FINANCIAL MEASURES
NON-GAAP FINANCIAL MEASURES
We believe that use of the Non-GAAP measures of adjusted pre-tax operating income (loss), adjusted net operating income (loss) and adjusted net operating income (loss) per diluted share facilitate the evaluation of the company's core financial performance thereby providing relevant information to investors. These measures are not recognized in accordance with GAAP and should not be viewed as alternatives to GAAP measures of performance.
Adjusted pre-tax operating income (loss) is defined as GAAP income (loss) before tax, excluding the effects of net realized investment gains (losses), gain and losses on debt extinguishment, and infrequent or unusual non-operating items where applicable.
Adjusted net operating income (loss) is defined as GAAP net income (loss) excluding the after-tax effects of net realized investment gains (losses), gain and losses on debt extinguishment, and infrequent or unusual non-operating items where applicable. The amounts of adjustments to components of pre-tax operating income (loss) are tax effected using a federal statutory tax rate of 21%.
Adjusted net operating income (loss) per diluted share is calculated in a manner consistent with the accounting standard regarding earnings per share by dividing (i) adjusted net operating income (loss) after making adjustments for interest expense on convertible debt, whenever the impact is dilutive by (ii) diluted weighted average common shares outstanding, which reflects share dilution from unvested restricted stock units and from convertible debt when dilutive under the “if-converted” method.
Although adjusted pre-tax operating income (loss) and adjusted net operating income (loss) exclude certain items that have occurred in the past and are expected to occur in the future, the excluded items represent items that are: (1) not viewed as part of the operating performance of our primary activities; or (2) impacted by both discretionary and other economic or regulatory factors and are not necessarily indicative of operating trends, or both. These adjustments, along with the reasons for their treatment, are described below. Trends in the profitability of our fundamental operating activities can be more clearly identified without the fluctuations of these adjustments. Other companies may calculate these measures differently. Therefore, their measures may not be comparable to those used by us.
(1)Net realized investment gains (losses). The recognition of net realized investment gains or losses can vary significantly across periods as the timing of individual securities sales is highly discretionary and is influenced by such factors as market opportunities, our tax and capital profile, and overall market cycles.
(2)Gains and losses on debt extinguishment. Gains and losses on debt extinguishment result from discretionary activities that are undertaken to enhance our capital position, improve our debt profile, and/or reduce potential dilution from our outstanding convertible debt.
(3)Infrequent or unusual non-operating itemsitems. . Items that are non-recurring in nature and are not part of our primary operating activities.
MGIC Investment Corporation 20222023 Form 10-K | 5154
MGIC Investment Corporation and Subsidiaries
| | Non-GAAP reconciliations | |
| Non-GAAP reconciliations | |
Non-GAAP reconciliations | | Reconciliation of Income before tax / Net income to Adjusted pre-tax operating income / Adjusted net operating income: | | Reconciliation of Income before tax / Net income to Adjusted pre-tax operating income / Adjusted net operating income: | |
| Reconciliation of Income before tax / Net income to Adjusted pre-tax operating income / Adjusted net operating income: | |
| Reconciliation of Income before tax / Net income to Adjusted pre-tax operating income / Adjusted net operating income: | |
| Reconciliation of Income before tax / Net income to Adjusted pre-tax operating income / Adjusted net operating income: | |
| Reconciliation of Income before tax / Net income to Adjusted pre-tax operating income / Adjusted net operating income: | |
| Reconciliation of Income before tax / Net income to Adjusted pre-tax operating income / Adjusted net operating income: | |
| Reconciliation of Income before tax / Net income to Adjusted pre-tax operating income / Adjusted net operating income: | |
| Reconciliation of Income before tax / Net income to Adjusted pre-tax operating income / Adjusted net operating income: | |
| Reconciliation of Income before tax / Net income to Adjusted pre-tax operating income / Adjusted net operating income: | |
| Reconciliation of Income before tax / Net income to Adjusted pre-tax operating income / Adjusted net operating income: | |
| Reconciliation of Income before tax / Net income to Adjusted pre-tax operating income / Adjusted net operating income: | |
| Reconciliation of Income before tax / Net income to Adjusted pre-tax operating income / Adjusted net operating income: | |
| Reconciliation of Income before tax / Net income to Adjusted pre-tax operating income / Adjusted net operating income: | |
| Reconciliation of Income before tax / Net income to Adjusted pre-tax operating income / Adjusted net operating income: | |
| Reconciliation of Income before tax / Net income to Adjusted pre-tax operating income / Adjusted net operating income: | |
| Reconciliation of Income before tax / Net income to Adjusted pre-tax operating income / Adjusted net operating income: | |
| Reconciliation of Income before tax / Net income to Adjusted pre-tax operating income / Adjusted net operating income: | |
| Reconciliation of Income before tax / Net income to Adjusted pre-tax operating income / Adjusted net operating income: | |
| Reconciliation of Income before tax / Net income to Adjusted pre-tax operating income / Adjusted net operating income: | |
| Reconciliation of Income before tax / Net income to Adjusted pre-tax operating income / Adjusted net operating income: | |
| Reconciliation of Income before tax / Net income to Adjusted pre-tax operating income / Adjusted net operating income: | |
| Reconciliation of Income before tax / Net income to Adjusted pre-tax operating income / Adjusted net operating income: | |
| Reconciliation of Income before tax / Net income to Adjusted pre-tax operating income / Adjusted net operating income: | |
| Reconciliation of Income before tax / Net income to Adjusted pre-tax operating income / Adjusted net operating income: | |
| Reconciliation of Income before tax / Net income to Adjusted pre-tax operating income / Adjusted net operating income: | |
| Reconciliation of Income before tax / Net income to Adjusted pre-tax operating income / Adjusted net operating income: | |
| Reconciliation of Income before tax / Net income to Adjusted pre-tax operating income / Adjusted net operating income: | |
| Reconciliation of Income before tax / Net income to Adjusted pre-tax operating income / Adjusted net operating income: | |
| Reconciliation of Income before tax / Net income to Adjusted pre-tax operating income / Adjusted net operating income: | |
| Reconciliation of Income before tax / Net income to Adjusted pre-tax operating income / Adjusted net operating income: | |
| Reconciliation of Income before tax / Net income to Adjusted pre-tax operating income / Adjusted net operating income: | |
| Reconciliation of Income before tax / Net income to Adjusted pre-tax operating income / Adjusted net operating income: | |
| Reconciliation of Income before tax / Net income to Adjusted pre-tax operating income / Adjusted net operating income: | |
| Reconciliation of Income before tax / Net income to Adjusted pre-tax operating income / Adjusted net operating income: | |
| Reconciliation of Income before tax / Net income to Adjusted pre-tax operating income / Adjusted net operating income: | |
| Reconciliation of Income before tax / Net income to Adjusted pre-tax operating income / Adjusted net operating income: | |
| Reconciliation of Income before tax / Net income to Adjusted pre-tax operating income / Adjusted net operating income: | |
| Reconciliation of Income before tax / Net income to Adjusted pre-tax operating income / Adjusted net operating income: | |
| | Years Ended December 31, |
| 2022 | | 2021 | |
| | Years Ended December 31, | |
| | Years Ended December 31, | |
| | Years Ended December 31, | |
| | Years Ended December 31, | |
| | Years Ended December 31, | |
| | Years Ended December 31, | |
| | Years Ended December 31, | |
| | Years Ended December 31, | |
| | Years Ended December 31, | |
| | Years Ended December 31, | |
| | Years Ended December 31, | |
| | Years Ended December 31, | |
| | Years Ended December 31, | |
| | Years Ended December 31, | |
| | Years Ended December 31, | |
| | Years Ended December 31, | |
| | Years Ended December 31, | |
| | Years Ended December 31, | |
| | Years Ended December 31, | |
| | Years Ended December 31, | |
| | Years Ended December 31, | |
| | Years Ended December 31, | |
| | Years Ended December 31, | |
| | Years Ended December 31, | |
| | Years Ended December 31, | |
| | Years Ended December 31, | |
| | Years Ended December 31, | |
| | Years Ended December 31, | |
| | Years Ended December 31, | |
| | Years Ended December 31, | |
| | Years Ended December 31, | |
| | Years Ended December 31, | |
| | Years Ended December 31, | |
| | Years Ended December 31, | |
| | Years Ended December 31, | |
| | Years Ended December 31, | |
| | Years Ended December 31, | |
| | Years Ended December 31, | |
| | Years Ended December 31, | |
| | 2023 | |
| (in thousands) | |
| (in thousands) | |
| (in thousands) | (in thousands) | | Pre-tax | | Tax Effect | | Net
(after-tax) | | Pre-tax | | Tax Effect | | Net
(after-tax) | |
| Income before tax / Net income | Income before tax / Net income | | $ | 1,090,034 | | | $ | 224,685 | | | $ | 865,349 | | | 801,777 | | | 166,794 | | | 634,983 | | |
| Income before tax / Net income | |
| Income before tax / Net income | |
| Adjustments: | |
| Adjustments: | |
| Adjustments: | Adjustments: | | | | |
| | Net realized investment (gains) losses | Net realized investment (gains) losses | | 9,745 | | | 2,046 | | | 7,699 | | | (7,009) | | | (1,472) | | | (5,537) | | |
| | Net realized investment (gains) losses | |
| | Net realized investment (gains) losses | |
| Loss on debt extinguishment | Loss on debt extinguishment | | 40,199 | | | 8,442 | | | 31,757 | | | 36,914 | | | 7,752 | | | 29,162 | | |
| Loss on debt extinguishment | |
| Loss on debt extinguishment | |
| Adjusted pre-tax operating income / Adjusted net operating income | |
| Adjusted pre-tax operating income / Adjusted net operating income | |
| Adjusted pre-tax operating income / Adjusted net operating income | Adjusted pre-tax operating income / Adjusted net operating income | | $ | 1,139,978 | | | $ | 235,173 | | | $ | 904,805 | | | $ | 831,682 | | | $ | 173,074 | | | $ | 658,608 | | |
| Reconciliation of Net income per diluted share to Adjusted net operating income per diluted share: | | | Reconciliation of Net income per diluted share to Adjusted net operating income per diluted share: | |
| | Reconciliation of Net income per diluted share to Adjusted net operating income per diluted share: | |
| | Weighted average diluted shares outstanding | Weighted average diluted shares outstanding | | 311,229 | | | | | 351,308 | | |
| Weighted average diluted shares outstanding | |
| Weighted average diluted shares outstanding | |
| Net income per diluted share | |
| Net income per diluted share | |
| Net income per diluted share | Net income per diluted share | | $ | 2.79 | | | | | $ | 1.85 | | |
| | Net realized investment (gains) losses | Net realized investment (gains) losses | | 0.02 | | | | | (0.02) | | |
| | Net realized investment (gains) losses | |
| | Net realized investment (gains) losses | |
| Loss on debt extinguishment | |
| Loss on debt extinguishment | |
| Loss on debt extinguishment | Loss on debt extinguishment | | 0.10 | | | | | 0.08 | | |
| Adjusted net operating income per diluted share | Adjusted net operating income per diluted share | | $ | 2.91 | | | | | $ | 1.91 | | |
| Adjusted net operating income per diluted share | |
| Adjusted net operating income per diluted share | |
MGIC Investment Corporation 20222023 Form 10-K | 5255
MGIC Investment Corporation and Subsidiaries
MORTGAGE INSURANCE PORTFOLIO
MORTGAGE ORIGINATIONS
Our NIW is affected by the total mortgage originations, the percentage of total mortgage originations using PMI, and our market share within the PMI industry.
The total amount of mortgage originations is generally influenced by the level of new and existing home sales, interest rates, the percentage of homes purchased for cash, and the level of refinance activity. PMI market share of total mortgage originations is influenced by the mix of purchase and refinance originations. PMI market share is also impacted by the market share of total originations of the FHA, VA, USDA, and other alternatives to mortgage insurance, including GSE programs that may reduce or eliminate the demand for mortgage insurance.
Total mortgage originations in 20222023, as compared to 20212022, reflects higher interest rates and home prices, contributing to a decrease in home purchase activity in 2022 after a strong 2021.2023. Total mortgage originations are forecasted to be lowerhigher in 2023,2024, in comparison to the last two years.2023. Both purchase and refinance markets are forecasted to decreaseincrease in 20232024 when compared to estimates for 2022.2023.
E - Estimated, F- Forecast
Source: Fannie Mae and MBA estimates/forecasts as of January 2023.2024. Amounts represent the average of all sources.
As a result of the forecasted decrease in mortgage originations discussed above, our 2023 NIW is expected to be lower than 2022.
The total estimated mortgage insurance volume is shown below.
| | Estimated total of PMI, FHA, USDA, and VA primary mortgage insurance | |
| Estimated total of PMI, FHA, USDA, and VA primary mortgage insurance | |
Estimated total of PMI, FHA, USDA, and VA primary mortgage insurance | | | (in billions) | (in billions) | | Twelve Months Ended December 31, 2022 | | Twelve Months Ended December 31, 2021 | |
| (in billions) | |
| (in billions) | |
| Primary mortgage insurance | Primary mortgage insurance | | $858 | | $1,352 | |
| Primary mortgage insurance | |
| Primary mortgage insurance | |
Source: Inside Mortgage Finance - February 17, 202315, 2024 or SEC filings. Includes HARP NIW.
MORTGAGE INSURANCE INDUSTRY
We compete against five other private mortgage insurers, as well as government mortgage insurance programs, including those offered by the FHA, VA, and USDA. Refer to "Overview - Business Environment - Competition" for a discussion of our competitive position.
PMI's market share is primarily impacted by competition from government mortgage insurance programs. The PMI industry's market share in 2022 increased2023 decreased compared to the market share in 2021.2022.
| | Estimated primary MI market share | |
| Estimated primary MI market share | |
Estimated primary MI market share | | | (% of total primary MI volume) | (% of total primary MI volume) | Twelve Months Ended December 31, 2022 | Twelve Months Ended December 31, 2021 | |
| (% of total primary MI volume) | |
| (% of total primary MI volume) | |
| PMI | |
| PMI | |
| PMI | PMI | 47.2% | 43.2% | |
| FHA | FHA | 26.7% | 24.7% | |
| FHA | |
| FHA | |
| VA | |
| VA | |
| VA | VA | 24.5% | 30.2% | |
| USDA | USDA | 1.7% | 1.9% | |
| USDA | |
| USDA | |
Source: Inside Mortgage Finance - February 17, 202315, 2024 or SEC filings. Includes HARP NIW.
MGIC Investment Corporation 2023 Form 10-K | 56
MGIC Investment Corporation and Subsidiaries
MGIC's estimated market share within the PMI industry is shown in the table below. Our risk-based pricing engine, MiQ, allows for frequent granular pricing changes including those to address our view of emerging and evolving market conditions and risk. We expect our market share to decline in first quarter of 2023 due to actions taken in 2022 reflective of our views of risk return. Additional discussion of the competitive landscape of the industry refer to "Overview - Business Environment - Competition" and additional discussion of pricing practices refer to "Overview - Business Environment - Pricing Practices" | | Estimated MGIC market share | |
| Estimated MGIC market share | |
Estimated MGIC market share | | | (% of total primary private MI volume) | (% of total primary private MI volume) | Twelve Months Ended December 31, 2022 | Twelve Months Ended December 31, 2021 | |
| (% of total primary private MI volume) | |
| (% of total primary private MI volume) | |
| MGIC | MGIC | 18.9% | 20.6% | |
| MGIC | |
| MGIC | |
Source: Inside Mortgage Finance - February 17, 202315, 2024 or SEC filings. Includes HARP NIW.
MGIC Investment Corporation 2022 Form 10-K | 53
MGIC Investment Corporation and Subsidiaries
NEW INSURANCE WRITTEN
The following tables provide information about loan characteristics associated with our NIW.
The percentage of our NIW with DTI ratios over 45% and LTV'sLTVs over 95% increased in 2022 compared with 2021. The increases were primarily driven by higher home prices and interest rates, and a higherwill fluctuate based on the mortgage conditions that could include the percentage of NIW from purchase transactions.transactions, changes in home prices, changes in mortgage rates, and GSE activities.
| Primary NIW by FICO score | | Primary NIW by FICO score | |
| Primary NIW by FICO score | |
| | Years Ended December 31, |
| | Years Ended December 31, | |
| | Years Ended December 31, | |
| | Years Ended December 31, | |
| (% of primary NIW) | (% of primary NIW) | | 2022 | | 2021 | |
| 760 and greater | 760 and greater | | 43.1 | % | | 45.6 | % | |
| 760 and greater | |
| 760 and greater | |
| 740 - 759 | |
| 740 - 759 | |
| 740 - 759 | 740 - 759 | | 18.5 | % | | 17.5 | % | |
| 720 - 739 | 720 - 739 | | 14.9 | % | | 13.7 | % | |
| 720 - 739 | |
| 720 - 739 | |
| 700 - 719 | |
| 700 - 719 | |
| 700 - 719 | 700 - 719 | | 10.9 | % | | 11.1 | % | |
| 680 - 699 | 680 - 699 | | 7.3 | % | | 7.3 | % | |
| 680 - 699 | |
| 680 - 699 | |
| 660 - 679 | |
| 660 - 679 | |
| 660 - 679 | 660 - 679 | | 3.3 | % | | 2.7 | % | |
| 640 - 659 | 640 - 659 | | 1.3 | % | | 1.6 | % | |
| 640 - 659 | |
| 640 - 659 | |
| 639 and less | |
| 639 and less | |
| 639 and less | 639 and less | | 0.7 | % | | 0.5 | % | |
| Total | Total | | 100 | % | | 100 | % | |
| Total | |
| Total | |
| Primary NIW by loan-to-value | | Primary NIW by loan-to-value | |
| Primary NIW by loan-to-value | |
| | Years Ended December 31, |
| | Years Ended December 31, | |
| | Years Ended December 31, | |
| | Years Ended December 31, | |
| (% of primary NIW) | (% of primary NIW) | | 2022 | | 2021 | |
| 95.01% and above | 95.01% and above | | 12.3 | % | | 10.8 | % | |
| 95.01% and above | |
| 95.01% and above | |
| 90.01% to 95.00% | |
| 90.01% to 95.00% | |
| 90.01% to 95.00% | 90.01% to 95.00% | | 49.3 | % | | 43.7 | % | |
| 85.01% to 90.00% | 85.01% to 90.00% | | 28.0 | % | | 30.0 | % | |
| 85.01% to 90.00% | |
| 85.01% to 90.00% | |
| 80.01% to 85% | |
| 80.01% to 85% | |
| 80.01% to 85% | 80.01% to 85% | | 10.4 | % | | 15.5 | % | |
| Total | Total | | 100 | % | | 100 | % | |
| Total | |
| Total | |
| Primary NIW by debt-to-income ratio | | Primary NIW by debt-to-income ratio | |
| Primary NIW by debt-to-income ratio | |
| | Years Ended December 31, |
| | Years Ended December 31, | |
| | Years Ended December 31, | |
| | Years Ended December 31, | |
| (% of primary NIW) | (% of primary NIW) | | 2022 | | 2021 | |
| 45.01% and above | 45.01% and above | | 21.3 | % | | 13.6 | % | |
| 45.01% and above | |
| 45.01% and above | |
| 38.01% to 45.00% | |
| 38.01% to 45.00% | |
| 38.01% to 45.00% | 38.01% to 45.00% | | 32.3 | % | | 30.0 | % | |
| 38.00% and below | 38.00% and below | | 46.4 | % | | 56.4 | % | |
| 38.00% and below | |
| 38.00% and below | |
| Total | Total | | 100 | % | | 100 | % | |
| Total | |
| Total | |
| | | | | | | | | | | | | | | | |
| Primary NIW by policy payment type |
| | | | | | |
| | Years Ended December 31, |
| (% of primary NIW) | | 2022 | | 2021 | | |
| Monthly premiums | | 95.7 | % | | 92.5 | % | | |
| Single premiums | | 4.3 | % | | 7.4 | % | | |
| Annual Premiums | | — | % | | 0.1 | % | | |
| | | | | | | | | | | | | | | | |
| Primary NIW by type of mortgage |
| | | | | | |
| | Years Ended December 31, |
| (% of primary NIW) | | 2022 | | 2021 | | |
| Purchases | | 97.4 | % | | 79.7 | % | | |
| Refinances | | 2.6 | % | | 20.3 | % | | |
| | | | | | | | | | | | | | | | |
| Primary NIW by policy payment type |
| | | | | | |
| | Years Ended December 31, |
| (% of primary NIW) | | 2023 | | 2022 | | |
| Monthly premiums | | 96.0 | % | | 95.7 | % | | |
| Single premiums | | 4.0 | % | | 4.3 | % | | |
| Annual Premiums | | — | % | | — | % | | |
MGIC Investment Corporation 2023 Form 10-K | 57
MGIC Investment Corporation and Subsidiaries
| | | | | | | | | | | | | | | | |
| Primary NIW by type of mortgage |
| | | | | | |
| | Years Ended December 31, |
| (% of primary NIW) | | 2023 | | 2022 | | |
| Purchases | | 98.2 | % | | 97.4 | % | | |
| Refinances | | 1.8 | % | | 2.6 | % | | |
We consider a variety of loan characteristics when accessing the risk of a loan. The following tables provides information about loans with one or more of the following characteristics associated with our NIW: LTV ratios greater than 95%, mortgages with borrowers having FICO scores below 680, including those with borrowers having FICO scores of 620-679, and mortgages with borrowers having DTI ratios greater than 45%, each attribute as determined at the time of loan origination.
| Primary NIW by number of attributes discussed above | | Primary NIW by number of attributes discussed above | |
| Primary NIW by number of attributes discussed above | |
| | Years Ended December 31, |
| | Years Ended December 31, | |
| | Years Ended December 31, | |
| | Years Ended December 31, | |
| (% of primary NIW) | (% of primary NIW) | | 2022 | | 2021 | |
| One | One | | 31.5 | % | | 26.2 | % | |
| One | |
| One | |
| Two or More | Two or More | | 3.6 | % | | 1.5 | % | |
| Two or More | |
| Two or More | |
IIF AND RIF
Our IIF grewwas flat in 2023, compared to 2022. Our IIF increased 7.6% in 2022 and 11.3% in 2021, as NIW more thanwas partially offset policyby cancellations. Cancellation activity is impacted by refinancing activity, policies cancelled when borrowers achieve the required amount of home equity, and cancellations due to claim payment. Refinancing activity has historically been affected by the level of mortgage interest rates and the level of home price appreciation. Cancellations generally move inversely to the change in the direction of interest rates, although they generally lag a change in direction.
Annual Persistency. Our annual persistency at December 31, 20222023 was 79.8%86.1% compared to 62.6%82.2% at December 31, 2021.2022. Since 2000,2018, our year-endannual persistency ranged from a high of 84.7%86.3% at December 31, 2009September 30, 2023 to a low of 47.1%60.7% at DecemberMarch 31, 2003.2021. Our persistency rate is primarily affected by the level of current mortgage interest rates compared to the mortgage coupon rates on our IIF, which affects the vulnerability of the IIF to refinancing; and the current amount of equity that borrowers have in the homes underlying our IIF.
| | | | | | | | | | | | | | | | | | | |
| Insurance in force and risk in force |
| | | | | | | |
| | Years Ended December 31, |
| ($ in billions) | | 2022 | | 2021 | | |
| NIW | | $ | 76.4 | | | $ | 120.2 | | | |
| Cancellations | | (55.5) | | | (92.4) | | | |
| Increase in primary IIF | | $ | 20.9 | | | $ | 27.8 | | | |
| | | | | | |
| Direct primary IIF as of December 31, | | $ | 295.3 | | | $ | 274.4 | | | |
| | | | | | | |
| | | | | | |
| Direct primary RIF as of December 31, | | $ | 76.5 | | | $ | 69.3 | | | |
| | | | | | | |
MGIC Investment Corporation 2022 Form 10-K | 54
MGIC Investment Corporation and Subsidiaries | | | | | | | | | | | | | | | | |
| Insurance in force and risk in force |
| | | | | | |
| | Years Ended December 31, |
| ($ in billions) | | 2023 | | 2022 | | |
| NIW | | $ | 46.1 | | | $ | 76.4 | | | |
| Cancellations | | (47.9) | | | (55.5) | | | |
| Increase (decrease) in primary IIF | | $ | (1.8) | | | $ | 20.9 | | | |
| | | | | | |
| Direct primary IIF as of December 31, | | $ | 293.5 | | | $ | 295.3 | | | |
| | | | | | |
| | | | | | |
| Direct primary RIF as of December 31, | | $ | 77.2 | | | $ | 76.5 | | | |
| | | | | | |
CREDIT PROFILE OF OUR PRIMARY RIF
Our 2009 and later books possess significantly improved risk characteristics when compared to our 2005-2008 books. Modification and refinance programs, such as HAMP and HARP, which expired at the end of 2016 and 2018, respectively, but have been replaced by other GSE modification programs, make outstanding loans more affordable to borrowers with the goal of reducing the number of foreclosures. As of December 31, 2022,2023, modifications accounted for approximately 4.2%3.6% of our total primary RIF, compared to 5.4%4.2% at December 31, 2021.2022. Loans associated with 87%87.3% of all our modifications were current as of December 31, 2022.2023. For additional information on the composition of our primary RIF see "Business - Our Products and Services"
MGIC Investment Corporation 2023 Form 10-K | 58
MGIC Investment Corporation and Subsidiaries
The composition of our primary RIF by policy year as of December 31, 20222023 and 20212022 is shown below:
| | Primary risk in force | Primary risk in force | Primary risk in force |
| | ($ in millions) | ($ in millions) | | December 31, 2022 | | December 31, 2021 |
| ($ in millions) | |
| ($ in millions) | | | December 31, 2023 | | December 31, 2022 |
| 2004 and prior | 2004 and prior | | 411 | | 500 | 2004 and prior | | 347 | | 411 |
| 2005 - 2008 | 2005 - 2008 | | 3,083 | | 3,728 | 2005 - 2008 | | 2,634 | | 3,083 |
| 2009 - 2015 | | 1,753 | | 2,865 |
| 2016 - 2022 | | 71,225 | | 62,244 | |
| 2009 - 2019 | | 2009 - 2019 | | 9,372 | | | 12,090 |
| 2020 | |
| 2021 | |
| 2022 | |
| 2023 | |
| Total | Total | | 76,472 | | 69,337 | Total | | 77,170 | | 76,472 |
POOL AND OTHER INSURANCE
MGIC has written no new pool insurance since 2008, however, for a variety of reasons, including responding to capital market alternatives to private mortgage insurance and customer demands, MGIC may write pool risk in the future. Our direct pool RIF was $256 million ($186 million on pool policies with aggregate loss limits and $70 million on pool policies without aggregate loss limits) at December 31, 2023 compared to $276 million ($196 million on pool policies with aggregate loss limits and $80 million on pool policies without aggregate loss limits) at December 31, 2022 compared to $305 million ($206 million on pool policies with aggregate loss limits and $99 million on pool policies without aggregate loss limits) at December 31, 2021.2022. If claim payments associated with a specific pool reach the aggregate loss limit, the remaining IIF within the pool would be cancelled and any remaining defaults under the pool would be removed from our default inventory.
In connection with the GSEs' CRT programs, an insurance subsidiary of MGIC provides insurance and reinsurance covering portions of the credit risk related to certain reference pools of mortgages acquired by the GSEs. Our RIF, as reported to us, related to these programs was approximately $226$310 million and $321$226 million as of December 31, 20222023 and December 31, 2021,2022, respectively.
MGIC Investment Corporation 20222023 Form 10-K | 5559
MGIC Investment Corporation and Subsidiaries
CONSOLIDATED RESULTS OF OPERATIONS
The following section of the MD&A provides a comparative discussion of our Consolidated Results of Operations for the two-year period ended December 31, 2022.2023. For a discussion of the Critical Accounting Estimates used by us that affect the Consolidated Results of Operations, see "Critical Accounting Estimates" below.
RevenuesREVENUES
| | Revenues | Revenues | Revenues |
| | Year Ended December 31, |
| | Year Ended December 31, | |
| | Year Ended December 31, | |
| | Year Ended December 31, | |
| (In millions) | (In millions) | | 2022 | | 2021 | | % Change | (In millions) | | 2023 | | 2022 | | % Change |
| Net premiums written | Net premiums written | | $ | 960.7 | | | $ | 969.0 | | | (1) | |
| | Net premiums earned | Net premiums earned | | $ | 1,007.1 | | | $ | 1,014.4 | | | (1) | |
| Net premiums earned | |
| Net premiums earned | |
| Investment income, net of expenses | Investment income, net of expenses | | 167.5 | | | 156.4 | | | 7 | |
| Net gains (losses) on investments and other financial instruments | Net gains (losses) on investments and other financial instruments | | (7.5) | | | 5.9 | | | N/M |
| Other revenue | Other revenue | | 5.6 | | | 9.0 | | | (38) | |
| Total revenues | | $ | 1,172.8 | | | $ | 1,185.7 | | | (1) | |
Total revenues (1) | |
(1) May not foot due to rounding | |
NET PREMIUMS WRITTEN AND EARNED
Net premiums written and earned decreased 1%, respectively,5% in 20222023 compared with the prior year. The decrease in premiums written and earned in 20222023 compared to the prior year is primarily due to an increase in ceded premiums that was the result of a decrease in the direct premium yield, offset by a decrease in ceded premiums written and earned.profit commission earned on our QSR Transactions.
Premium yields
Premium yield is net premiums earned divided by average IIF during the year and is influenced by a number of key drivers, which have a varying impact from period to period. The following table provides information related to our premium yield for 2022,2023, and 2021.2022.
| Premium Yield | | Premium Yield | |
| Premium Yield | |
| | Year Ended December 31, |
| | Year Ended December 31, | |
| | Year Ended December 31, | |
| | Year Ended December 31, | |
| (in basis points) | (in basis points) | | 2022 | 2021 | |
| In force portfolio yield | In force portfolio yield | (1) | | 39.4 | | 42.2 | | |
| In force portfolio yield | |
| In force portfolio yield | |
| Premium refunds | |
| Premium refunds | |
| Premium refunds | Premium refunds | | 0.1 | | (0.6) | | |
| Accelerated earnings on single premium policies | Accelerated earnings on single premium policies | | 1.0 | | 3.2 | | |
| Accelerated earnings on single premium policies | |
| Accelerated earnings on single premium policies | |
| Total direct premium yield | |
| Total direct premium yield | |
| Total direct premium yield | Total direct premium yield | | 40.5 | | 44.8 | | |
| Ceded premiums earned, net of profit commission and assumed premiums | Ceded premiums earned, net of profit commission and assumed premiums | (2) | | (5.2) | | (5.9) | | |
| Ceded premiums earned, net of profit commission and assumed premiums | |
| Ceded premiums earned, net of profit commission and assumed premiums | |
| Net premium yield | Net premium yield | | 35.3 | | 38.9 | | |
| Net premium yield | |
| Net premium yield | |
(1) Total direct premiums earned, excluding premium refunds and accelerated premiums from single premium policy cancellations divided by average primary insurance in force.
(2) Ceded premiums for reinsurance cancellation activities decreased the premium yield by 0.5 bps in 2023 and 0.1 bps in 2022. Assumed premiums include those from our participation in GSE CRT programs, of which the impact on the net premium yield was 0.4 bps in 2023 and 0.3 bps in 2022 and 0.4 bps in 20212022.
Changes in the net premium yields when compared to the respective prior year periods reflect the following:
| | | | | |
| In force Portfolio Yield |
è
| A larger percentage of our IIF is from book years with lower premium rates due to a decline in premium rates in recent years resulting from pricing competition, insuring mortgagesan in force book with lower risk characteristics, lower required capital, the availability of reinsurance, and certain policies undergoing premium rate resets on their ten-year anniversaries. |
| | | | | |
| Premium Refunds |
è
| Premium refunds are primarily driven by claim activity and our estimate of refundable premiums on our delinquency inventory. The low level of claims received have resulted in a lower level of premium refunds. Our estimate of refundable premium on our delinquency inventory fluctuates with changes in our delinquency inventory and our estimate of the number of loans in our delinquency inventory that will result in a claim. |
| | | | | |
| Accelerated earnings on single premium policies |
è
| The lower level of refinance transactions hashave reduced the benefit from accelerated earned premium from cancellation of single premium policies prior to their estimated policy life. |
MGIC Investment Corporation 2023 Form 10-K | 60
MGIC Investment Corporation and Subsidiaries
| | | | | |
| Ceded premiums earned, net of profit commission and assumed premiums |
è
| Ceded premiums earned, net of profit commission adversely impactsimpact our net premium yield. Ceded premiums earned, net of profit commission, are associated with the QSR Transactions and the XOL Transactions. Assumed premiums consists primarily of premiums from GSE CRT programs. See “Reinsurance Transactions“ below for further discussion on our reinsurance transactions. |
As discussed in our Risk Factor titled "Competition or changes in our relationships with our customers could reduce our revenues, reduce our premium yields and/or increase our losses," the private mortgage insurance industry is highly competitive and premium rates have declined over the past several years. With the smaller origination market, higher persistency rate, and continued high credit quality for NIW expected in 2023,2024, we expect our in force portfolio premium yield to remain relatively flat during 2023.
MGIC Investment Corporation 2022 Form 10-K | 56
MGIC Investment Corporation and Subsidiaries
REINSURANCE TRANSACTIONS
Quota share reinsuranceShare Reinsurance
Our quota share reinsurance affects various lines of our statements of operations and therefore we believe it should be analyzed by reviewing its total effect on our pre-tax income, as described below.
| | | | | |
| è | We cede a fixed percentage of premiums earned and received on insurance covered by the agreements.transactions. |
| è | We receive the benefit of a profit commission through a reduction in the premiums we cede. The profit commission varies inversely with the level of losses incurred on a "dollar for dollar" basis and can be eliminated at loss levels higher than what we are currently experiencing.have experienced. As a result, lower levels of ceded losses incurred result in a higher profit commission and less benefit from ceded losses incurred, and a higher profit commission; higher levels of ceded losses incurred result in more benefit from ceded losses incurred and a lower profit commission (or for certain levels of losses of accident year loss ratios, its elimination). |
| è | We receive the benefit of a ceding commission through a reduction in underwriting expenses equal to 20% of premiums ceded (before the effect of the profit commission). |
| è | We cede a fixed percentage of losses incurred on insurance covered by the agreements.transactions. |
The following table provides information related to our QSR Transactions for 20222023 and 2021.2022.
| | | | | | | | | | | | | | | | |
| Quota share reinsurance |
| | | | | | |
| | As of and For the Years Ended December 31, |
| (Dollars in thousands) | | 2023 | | 2022 | | |
| Statements of operations: |
| Ceded premiums written and earned, net of profit commission | | $ | 123,955 | | | $ | 86,435 | | | |
| % of direct premiums written | | 11 | % | | 8 | % | | |
| % of direct premiums earned | | 11 | % | | 7 | % | | |
| Profit commission | | 133,145 | | | 176,084 | | | |
| Ceding commissions | | 50,397 | | | 52,071 | | | |
| Ceded losses incurred | | 15,623 | | | (19,837) | | | |
| | | | | | |
| Mortgage insurance portfolio: | | | | | | |
| Ceded RIF (in millions) | | | | | | |
| 2020 QSR | | — | | | 3,902 | | | |
| 2021 QSR | | 6,060 | | | 6,809 | | | |
| 2022 QSR | | 4,693 | | | 5,027 | | | |
| 2023 QSR | | 2,391 | | | — | | | |
| Credit Union QSR | | 2,608 | | | 2,261 | | | |
| Total ceded RIF | | $ | 15,752 | | | $ | 17,999 | | | |
| | | | | | | | | | | | | | | | |
| Quota share reinsurance |
| | | | | | |
| | As of and For the Years Ended December 31, |
| (Dollars in thousands) | | 2022 | | 2021 | | |
| Statements of operations: |
| Ceded premiums written and earned, net of profit commission | | $ | 86,435 | | | $ | 118,537 | | | |
| % of direct premiums written | | 8 | % | | 11 | % | | |
| % of direct premiums earned | | 7 | % | | 10 | % | | |
| Profit commission | | 176,084 | | | 153,759 | | | |
| Ceding commissions | | 52,071 | | | 53,460 | | | |
| Ceded losses incurred | | (19,837) | | | 9,862 | | | |
| | | | | | |
| Mortgage insurance portfolio: |
| Ceded RIF (in millions) | | | | | | |
| 2015 QSR | | $ | — | | | $ | 889 | | | |
| 2019 QSR | | — | | | 1,539 | | | |
| 2020 QSR | | 3,902 | | | 4,754 | | | |
| 2021 QSR | | 6,809 | | | 7,470 | | | |
| 2022 QSR | | 5,027 | | | — | | | |
| Credit Union QSR | | 2,261 | | | 1,594 | | | |
| Total ceded RIF | | $ | 17,999 | | | $ | 16,246 | | | |
Ceded premiums written, and earned net of profit commission decreasedincreased in 20222023 when compared with the prior year primarily due to an increasea decrease in the profit commission, which reducesincreases ceded premiums written and earned. The increasedecrease in profit commission was driven by negativethe increase in losses incurred. Ceded losses incurred in 2022.are impacted by the delinquencies covered by our QSR Transactions, our estimates of payments that will be ultimately made on those delinquencies, and claim payments covered by our QSR Transactions.
Ceded losses incurred for the year endedWe terminated our 2020 QSR Transactions effective December 31, 2022 reflect favorable loss reserve development on previously received delinquency notices. See "Losses Incurred, net” below for discussion2023 and incurred an early termination fee of our loss reserves.
$5 million. We terminated our 2015 and 2019 QSR Transactions effective December 31, 2022 and incurred an early termination fee of $2 million on our 2019 QSR Transaction. We terminated our 2017 and 2018 QSR Transactions effective December 31, 2021 and incurred an early termination fee of $5 million. The termination of the QSR Transactions reduce the amount of IIF and RIF subject to QSR transactions.
MGIC Investment Corporation 2023 Form 10-K | 61
MGIC Investment Corporation and Subsidiaries
Covered Risk
The percentages of our NIW, new risk written, IIF, and RIF subject to our QSR Transactions as shown in the following table will vary from period to period in part due to the mix of our risk written during the period and the number of active QSR Transactions.
| Quota share reinsurance | | Quota share reinsurance | |
| Quota share reinsurance | |
| | As of and For the Years Ended December 31, |
| 2022 | | 2021 | |
| | As of and For the Years Ended December 31, | |
| | As of and For the Years Ended December 31, | |
| | As of and For the Years Ended December 31, | |
| | 2023 | |
| NIW subject to QSR Transactions | |
| NIW subject to QSR Transactions | |
| NIW subject to QSR Transactions | NIW subject to QSR Transactions | | 87.4 | % | | 81.9 | % | |
| New Risk Written subject to QSR Transactions | New Risk Written subject to QSR Transactions | | 93.0 | % | | 90.5 | % | |
| New Risk Written subject to QSR Transactions | |
| New Risk Written subject to QSR Transactions | |
| IIF subject to QSR Transactions | |
| IIF subject to QSR Transactions | |
| IIF subject to QSR Transactions | IIF subject to QSR Transactions | | 67.9 | % | | 78.4 | % | |
| RIF subject to QSR Transactions | RIF subject to QSR Transactions | | 73.0 | % | | 77.9 | % | |
| RIF subject to QSR Transactions | |
| RIF subject to QSR Transactions | |
|
The NIWdecrease in IIF and RIF subject to quota share reinsurance increased in 2022 comparedQSR Transactions was primarily due to 2021. The increase was driven by a decrease in refinance transactions which resulted in a decrease in NIW with LTVs less than or equal to 85%, which generally have lower coverage percentages, and are excluded from the termination of our 2020 QSR Transactions.Transaction at December 31, 2023.
20232024 QSR Transaction.Transaction
We have agreed to terms onexecuted a quota share transaction30% QSR Transaction with a group of unaffiliated reinsurers covering most of our NIWnew insurance written in 2023 (with an additional 10.0% quota share). This is in addition to the reinsurance agreements executed in 2022 that included a 15% quota share on eligible 2023 NIW.2024.
MGIC Investment Corporation 2022 Form 10-K | 57
MGIC Investment Corporation and Subsidiaries
ExcessWe have excess of loss reinsurance
We have Excess-of-loss transactions (“XOL Transactions”) with a panelpanels of unaffiliated reinsurers executed through the traditional reinsurance market (“Traditional XOL Transaction”) and with unaffiliated special purpose insurers (“Home Re Transactions”).
The 2022For policies covered by our Traditional XOL Transaction provides $142.6 million of reinsurance coverage on eligible NIW in 2022. The Traditional XOL Transaction has contractual termination date after approximately ten years, with an optional termination date after seven years and quarterly thereafter. For the covered policies,Transactions, we retain the first layer of the aggregate losses paid, and the reinsurers will then provide second layer coverage up to the outstanding reinsurance coverage amount. We retain losses paid in excess of the outstanding reinsurance coverage amount. The reinsurance coverage is subject to adjustment based on the risk characteristics of the covered loans.loans until the initial excess of loss reinsurance coverage layer has been finalized. The reinsurance premiums ceded to the2022 Traditional XOL Transaction are based off the remainingprovides $142.6 million of reinsurance coverage levels.on eligible NIW in 2022. The 2023 Traditional XOL Transaction provides $96.9 million of reinsurance coverage on eligible NIW in 2023.
The Home Re Transactions are executed with unaffiliated special purpose entities (“Home Re Entities”) through the issuance of insurance linked notes (“ILNs”). At December 31, 20222023 our Home Re Transactions provided $1.6$1.2 billion of loss coverage on a portfolio of policies having an in force date from July 1, 2016 through March 31, 2019, and from January 1, 2020 through December 31, 2021;2021,and from June 1, 2022 through August 31, 2023; all dates inclusive. For this reinsurance coverage, we retain the first layer of the respective aggregate losses paid, and a Home Re Entity will then provide second layer coverage up to the outstanding reinsurance amount.
As of December 31, 2022, the premiums under most of our 2018-2021 reference the one-month LIBOR. As discussed in our risk factor titled "The Company may be adversely impacted by the transition from LIBOR as a reference rate," the ICE Benchmark Administration, the administrator of LIBOR, will cease publishing all USD LIBOR tenors on June 30, 2023.
The initial attachment and detachment, current attachment, andcurrent detachment, and PMIERs required asset credit for each of our XOL Transactions as of December 31, 2022,2023, are as follows:
| | ($ In thousands) | ($ In thousands) | | Initial Attachment % (1) | Initial Detachment % (2) | Current Attachment % (1) | Current Detachment % (2) | PMIERs Required Asset Credit | ($ In thousands) | | Initial Attachment % (1) | Initial Detachment % (2) | Current Attachment % (1) | Current Detachment % (2) | PMIERs Required Asset Credit |
| Home Re 2018-1 | Home Re 2018-1 | | 2.25% | 6.50% | 11.67% | 21.66% | $ | — | |
| Home Re 2019-1 | Home Re 2019-1 | | 2.50% | 6.75% | 14.79% | 31.56% | — | |
| Home Re 2020-1 | Home Re 2020-1 | | 3.00% | 7.50% | 6.20% | 8.76% | — | |
| Home Re 2021-1 | Home Re 2021-1 | | 2.25% | 6.50% | 3.28% | 7.58% | 178,788 | |
| Home Re 2021-2 | Home Re 2021-2 | | 2.10% | 6.50% | 2.56% | 7.31% | 315,126 | |
| Home Re 2022-1 | Home Re 2022-1 | | 2.75% | 6.75% | 2.96% | 7.28% | 454,318 | |
| Home Re 2023-1 | |
| 2022 Traditional XOL | 2022 Traditional XOL | | 2.60% | 7.10% | 2.60% | 7.10% | 137,831 | |
| 2023 Traditional XOL | |
(1) The percentage represents the cumulative losses as a percentage of adjusted risk in force that MGIC retains prior to the XOL taking losses.
(2) The percentage represents the cumulative losses as a percentage of adjusted risk in force that must be reached before MGIC begins absorbing losses after the XOL layer
In October, 2023 Home Re 2019-1 Ltd., Home Re 2021-1 Ltd., and Home Re 2021-2 Ltd completed tender offers for certain tranches of the mortgage insurance-linked notes that supported the reinsurance agreements with MGIC. The tender offer resulted in the reduction in the insurance-linked notes of $187.1 million for the Home Re 2019-1 Ltd, $91.1 million for the Home Re 2021-1 Ltd., and $106.7 million for the Home Re 2021-2 Ltd. The reinsurance coverage corresponding to the tendered notes was terminated. MGIC incurred approximately $8.0 million of additional ceded premium in the fourth quarter associated with the tender premiums and associated expenses.
MGIC Investment Corporation 2023 Form 10-K | 62
MGIC Investment Corporation and Subsidiaries
We ceded premiums on our XOL Transactions of $69.9$78.9 million and $44.5$69.9 million for the years ended December 31, 20222023 and 2021,2022, respectively.
See Note 9 - "Reinsurance," to our consolidated financial statements for additional discussion of our XOL Transactions.
INVESTMENT INCOME, NET
Net investment income increased 7%28% to $214.7 million in 2023 compared to $167.5 million in 2022 compared to $156.4 million2022. The increase in 2021. Netnet investment income benefited from higherwas primarily due to an increase of approximately 80 basis points in average investment yields.
NET GAINS (LOSSES) ON INVESTMENTSLOSSES AND OTHER FINANCIAL INSTRUMENTSEXPENSES
Net gains (losses) on investments and other financial instruments in 2022 and 2021 were $(7.5) million and $5.9 million, respectively.
OTHER REVENUE
Other revenue decreased to $5.6 million in 2022 from $9.0 million in 2021.
MGIC Investment Corporation 2022 Form 10-K | 58
MGIC Investment Corporation and Subsidiaries
Losses and expenses
| | Year Ended December 31, |
| | Year Ended December 31, | | | | Year Ended December 31, |
| (In millions) | (In millions) | | 2022 | | 2021 | | % Change | (In millions) | | 2023 | | 2022 | | % Change |
| Losses incurred, net | Losses incurred, net | | $ | (254.6) | | | $ | 64.6 | | | N/M |
| Amortization of deferred policy acquisition costs | Amortization of deferred policy acquisition costs | | 12.4 | | | 12.6 | | | (2) | |
| Other underwriting and operating expenses, net | Other underwriting and operating expenses, net | | 236.7 | | | 198.4 | | | 19 | |
| Loss on debt extinguishment | |
| Interest expense | Interest expense | | 48.1 | | | 71.4 | | | (33) | |
| Loss on debt extinguishment | | 40.2 | | | 36.9 | | | 9 | |
| Total losses and expenses | $ | 82.8 | | | $ | 383.9 | | | (78) | |
Total losses and expenses (1) | |
(1) May not foot due to rounding | |
LOSSES INCURRED, NET
As discussed in “Critical Accounting Estimates” below and consistent with industry practices, we establish case loss reserves for future claims on delinquent loans that were reported to us as two payments past due and have not become current or resulted in a claim payment. Such loans are referred to as being in our delinquency inventory. Case loss reserves are established based on estimating the number of loans in our delinquency inventory that will result in a claim payment, which is referred to as the claim rate, and further estimating the amount of the claim payment, which is referred to as claim severity.
IBNR reserves are established for estimated losses from delinquencies estimated towe estimate have occurred prior to the close of an accounting period, but have not yet been reported to us. IBNR reserves are also established using estimated delinquencies, claim rates and claim severities.
Estimation of losses is inherently judgmental. Even in a stable environment, changes to our estimates could result in a material impact to our consolidated results of operations and financial position. The conditions that affect the claim rate and claim severity include the current and future state of the domestic economy, including unemployment, and the current and future strength of local housing markets; exposure on insured loans; the amount of time between delinquency and claim filing;filing (all else being equal, the longer the period between delinquency and claim filing, the greater the severity); and curtailments and rescissions. The actual amount of the claim payments may be substantially different than our loss reserve estimates. Our estimates could be adversely affected by several factors, including a deterioration of regional or national economic conditions, including unemployment, leading to a reduction in borrowers’ income and thus their ability to make mortgage payments, the impact of past and future government initiatives and actions taken by the GSEs (including mortgage forbearance programs and foreclosure moratoriums), and a drop in housing values that could result in, among other things, greater losses on loans, andwhich may affect borrower willingness to continue to make mortgage payments when the net value of the home is below the mortgage balance. Loss reserves in the future periods will also be dependent on the number of loans reported to us as delinquent.
Prior to the COVID-19 pandemic, losses incurred have followed a seasonal trend in which the second half of the year has weaker credit performance than the first half, with higher new notice activity and a lower cure rate. The state of the economy, local housing markets and various other factors, may result in delinquencies not following the typical pattern.
As discussed inFor information on how pandemics and other disasters could affect losses incurred, net see our Risk Factors titled “The Covid-19 pandemic“Pandemics, hurricanes and other disasters may materially impact our business, and future financial condition," the magnitude of any future impact of the COVID-19 pandemic on our incurred losses, is uncertainthe amount and cannot be predicted.timing of paid claims, our inventory of notices of default and our Minimum Required Assets under PMIERs". As discussed in our Risk Factor titled “Because we
establish loss reserves only upon a loan delinquency rather than based on estimates of our ultimate losses on risk in force, losses may have a disproportionate adverse effect on our earnings in certain periods” if we have not received a notice of delinquency with respect to a loan and if we have not estimated the loan to be delinquent as of December 31, 2022 and recorded an2023, through our IBNR reserve, then we have not yet recorded an incurred loss with respect to that loan.
Our estimates are also affected by any agreements we enter into regarding our claims paying practices.
Losses incurred, net decreasedincreased to $(20.9) million compared to $(254.6) million compared to $64.6 million in 2021, primarily due to favorable loss reserve development.2022. While new delinquency notices added approximately $149.6$187.7 million to losses incurred in 2022,2023, our re-estimation of loss reserves on previously received delinquency notices resulted in favorable development of approximately $404.1 million primarily related to a decrease in the estimated claim rate on delinquencies. The favorable development primarily resulted from greater than expected cure rates, as borrower reinstatements and servicer mitigation efforts resulted in more cures than originally estimated. Additionally, home price appreciation experienced in recent years has allowed borrowers to cure their delinquencies through the sale of their property.$208.5 million. In 2021,2022, new delinquency notices added approximately $124.6$149.6 million to losses incurred, andoffset by our re-estimation of loss reserves on previously received delinquency notices resulted in $60.0$404.1 million of favorable loss development. The favorable development for both periods primarily due to theresulted from a decrease in the expected claim rate on delinquenciespreviously received prior to the COVID-19 pandemic. This was offset by the recognition of a probable loss of $6.3 million related to litigation of our claims paying practices and adverse development on LAE reserves and reinsurance.
MGIC Investment Corporation 20222023 Form 10-K | 5963
MGIC Investment Corporation and Subsidiaries
delinquencies. Home price appreciation experienced in recent years has allowed some borrowers to cure their delinquencies through the sale of their property.
See "New notice claim rate" and "Claims severity" below for additional factors and trends that impact these loss reserve assumptions.
| | Composition of losses incurred | Composition of losses incurred | Composition of losses incurred |
| | Year Ended December 31, |
| | Year Ended December 31, | |
| | Year Ended December 31, | |
| | Year Ended December 31, | |
| (In millions) | (In millions) | | 2022 | | 2021 | (In millions) | | 2023 | | 2022 |
| Current year / New notices | Current year / New notices | | $ | 149.6 | | | $ | 124.6 | |
| Prior year reserve development | Prior year reserve development | | (404.1) | | | (60.0) | |
| Losses incurred, net | | $ | (254.5) | | | $ | 64.6 | |
Losses incurred, net (1) | |
(1) May not foot due to rounding | |
Loss ratio
The loss ratio is the ratio, expressed as a percentage, of the sum of incurred losses and LAE,incurred, net to net premiums earned. The decreaseincrease in the loss ratio in 20222023 when compared to 20212022 was primarily due to a decreaseincrease in losses incurred as discussed above.
| | | | | | | | | | | | | | | | |
| | Year Ended December 31, |
| | 2022 | | 2021 | | |
| Loss ratio | | (25.3) | % | | 6.4 | % | | |
| | | | | | | | | | | | | | | | |
| | Year Ended December 31, |
| | 2023 | | 2022 | | |
| Loss ratio | | (2.2) | % | | (25.3) | % | | |
MGIC Investment Corporation 20222023 Form 10-K | 6064
MGIC Investment Corporation and Subsidiaries
New notice claim rate
The table below presents our new delinquency notices received, delinquency inventory, percentage of delinquent loans in forbearance, and the average number of missed payments for the loans in our delinquency inventory by policy year:
| | New notices and delinquency inventory during the period | | New notices and delinquency inventory during the period | |
| New notices and delinquency inventory during the period | |
| December 31, 2023 | |
| Policy Year | |
| Policy Year | |
| Policy Year | | New Delinquency Notices Received in the Year Ended | Delinquency Inventory | Avg. Number of Missed Payments of Delinquency Inventory |
| 2004 and prior | | 2004 and prior | 3,392 | | 2,072 | | 18 |
| 2005-2008 | | 2005-2008 | 10,807 | | 7,008 | | 17 |
| 2009-2015 | | 2009-2015 | 2,607 | | 1,414 | | 11 |
| 2016 | | 2016 | 1,824 | | 954 | | 9 |
| 2017 | | 2017 | 2,518 | | 1,365 | | 9 |
| 2018 | | 2018 | 3,118 | | 1,750 | | 8 |
| 2019 | | 2019 | 3,080 | | 1,550 | | 7 |
| 2020 | | 2020 | 5,028 | | 2,383 | | 6 |
| 2021 | | 2021 | 8,754 | | 4,237 | | 5 |
| 2022 | | 2022 | 5,150 | | 2,605 | | 5 |
| 2023 | | 2023 | 547 | | 312 | | 3 |
| Total | | Total | 46,825 | | 25,650 | | 11 |
Claim rate on new notices (1) | |
| | December 31, 2022 |
| December 31, 2022 | |
| | December 31, 2022 | |
| | December 31, 2022 | |
| Policy Year | |
| Policy Year | |
| Policy Year | Policy Year | New Notices | Delinquency Inventory | % of Delinquency Inventory in Forbearance | Avg. Number of Missed Payments of Delinquency Inventory | New Delinquency Notices Received in the Year Ended | Delinquency Inventory | Avg. Number of Missed Payments of Delinquency Inventory |
| 2004 and prior | 2004 and prior | 3,695 | | 2,471 | | 13.4 | % | 18 | 2004 and prior | 3,695 | | 2,471 | 2,471 | | 18 | 18 |
| 2005-2008 | 2005-2008 | 11,702 | | 8,317 | | 11.9 | % | 19 | 2005-2008 | 11,702 | | 8,317 | 8,317 | | 19 | 19 |
| 2009-2015 | 2009-2015 | 3,115 | | 2,017 | | 12.4 | % | 12 | 2009-2015 | 3,115 | | 2,017 | 2,017 | | 12 | 12 |
| 2016 | 2016 | 2,090 | | 1,249 | | 15.9 | % | 10 | 2016 | 2,090 | | 1,249 | 1,249 | | 10 | 10 |
| 2017 | 2017 | 2,797 | | 1,719 | | 16.9 | % | 10 | 2017 | 2,797 | | 1,719 | 1,719 | | 10 | 10 |
| 2018 | 2018 | 3,289 | | 2,060 | | 17.8 | % | 9 | 2018 | 3,289 | | 2,060 | 2,060 | | 9 | 9 |
| 2019 | 2019 | 3,199 | | 1,823 | | 21.7 | % | 9 | 2019 | 3,199 | | 1,823 | 1,823 | | 9 | 9 |
| 2020 | 2020 | 5,067 | | 2,558 | | 35.4 | % | 7 | 2020 | 5,067 | | 2,558 | 2,558 | | 7 | 7 |
| 2021 | 2021 | 6,656 | | 3,307 | | 43.9 | % | 5 | 2021 | 6,656 | | 3,307 | 3,307 | | 5 | 5 |
| 2022 | 2022 | 1,378 | | 866 | | 37.1 | % | 3 | 2022 | 1,378 | | 866 | 866 | | 3 | 3 |
| Total | Total | 42,988 | | 26,387 | | 20.9 | % | 12 | Total | 42,988 | | 26,387 | 26,387 | | 12 | 12 |
Claim rate on new notices (1) | Claim rate on new notices (1) | 8 | % | |
| | December 31, 2021 |
| Policy Year | New Notices | Delinquency Inventory | % of Delinquency Inventory in Forbearance | Avg. Number of Missed Payments of Delinquency Inventory |
| 2004 and prior | 3,893 | | 2,829 | | 21.4 | % | 19 |
| 2005-2008 | 13,070 | | 10,882 | | 24.3 | % | 19 |
| 2009-2015 | 4,040 | | 3,400 | | 34.9 | % | 13 |
| 2016 | 2,375 | | 2,004 | | 43.5 | % | 12 |
| 2017 | 3,384 | | 2,949 | | 46.6 | % | 12 |
| 2018 | 3,902 | | 3,412 | | 49.3 | % | 12 |
| 2019 | 4,163 | | 3,340 | | 58.1 | % | 11 |
| 2020 | 5,623 | | 3,308 | | 63.4 | % | 8 |
| 2021 | 1,982 | | 1,166 | | 40.9 | % | 4 |
| Total | 42,432 | | 33,290 | | 39.5 | % | 14 |
Claim rate on new notices (1) | 8 | % | |
(1) Claim rate is the respective full year weighted average rate and is rounded to the nearest whole percent. | | (1) Claim rate is the respective full year weighted average rate. | |
| (1) Claim rate is the respective full year weighted average rate. | |
| (1) Claim rate is the respective full year weighted average rate. | |
Historically, forbearance plans have reduced the incidence of our losses on affected loans. However, given the uncertainty surrounding the long-term economic impact of COVID-19, it is difficult to predict the ultimate effect of COVID-19 related forbearances on our loss incidence. Whether a loan delinquency will cure, including through modification, when forbearance ends will depend on the economic circumstances of the borrower at that time. The severity of losses associated with delinquencies that do not cure will depend on economic conditions at that time, including home prices.
MGIC Investment Corporation 2022 Form 10-K | 61
MGIC Investment Corporation and Subsidiaries
Claims severity
Factors that impact claim severity include:
| | | | | |
| è | economic conditions at that time, including home prices compared to home prices at the time of placement of coverage |
| è | exposure on the loan, which is the unpaid principal balance of the loan times our insurance coverage percentage, |
| è | length of time between delinquency and claim filing (which impacts the amount of interest and expenses, with a longer period between default and claim filing generally increasing severity), and |
| è | curtailments. |
As discussed in Note 8 - "Loss Reserves," our loss reserves estimates take into consideration trends over time, because the development of the delinquencies may vary from period to period without establishing a meaningful trend. An increase in loss mitigation activities, primarily third party acquisitions (sometimes referredproperty sales, prior to as “short sales”),claim settlement has resulted in a decrease in the average claim paid and the average claim paid as a percentage of exposure in recent years. AtWith the startonset of the COVID-19 pandemic, the level of claims received decreased. Claim activity and the average claims paid as a percentage of exposure has not yet returned to pre-COVID-19 levels. The magnitude and timing of the increases are uncertain.
The majority of loans insured prior to 20092014 (which represent 41%37% of the loans in the delinquency inventory) are covered by master policy terms that, except under certain circumstances, do not limit the number of years that an insured can include interest when filing a claim.
MGIC Investment Corporation 2023 Form 10-K | 65
MGIC Investment Corporation and Subsidiaries
Under our current master policy terms, an insured can include accumulated interest when filing a claim only for the first three years the loan is delinquent. In each case, the insured must comply with its obligations under the terms of the applicable master policy.
| | Claims severity trend | Claims severity trend | Claims severity trend |
| | Period | Period | | Average exposure on claim paid | | Average claim paid | | % Paid to exposure | | Average number of missed payments at claim received date |
| Period | |
| Period | | | Average exposure on claim paid | | Average claim paid | | % Paid to exposure | | Average number of missed payments at claim received date |
| Q4 2023 | |
| Q3 2023 | |
| Q2 2023 | |
| Q1 2023 | |
| Q4 2022 | Q4 2022 | | $ | 38,903 | | | $ | 28,492 | | | 73.2 | % | | 41 | |
| Q3 2022 | Q3 2022 | | 37,625 | | | 23,461 | | | 62.4 | % | | 46 | |
| Q2 2022 | Q2 2022 | | 44,106 | | | 27,374 | | | 62.1 | % | | 41 | |
| Q1 2022 | Q1 2022 | | 38,009 | | | 27,662 | | | 72.8 | % | | 45 | |
| Q4 2021 | | 43,485 | | | 32,722 | | | 75.2 | % | | 42 | |
| Q3 2021 | | 42,468 | | | 36,138 | | | 85.1 | % | | 34 | |
| Q2 2021 | | 40,300 | | | 34,068 | | | 84.5 | % | | 36 | |
| Q1 2021 | | 46,807 | | | 36,725 | | | 78.5 | % | | 34 | |
| Note: Table excludes material settlements. Settlements include amounts paid in settlement of disputes for claims paying practices and/or commutations of policies. | | Note: Table excludes material settlements. Settlements include amounts paid in settlement of disputes for claims paying practices and/or commutations of policies. | |
| Note: Table excludes material settlements. Settlements include amounts paid in settlement of disputes for claims paying practices and/or commutations of policies. | |
MGIC Investment Corporation 2022 Form 10-K | 62
MGIC Investment Corporation and Subsidiaries
The length of time a loan is in the delinquency inventory can differ from the number of payments that the borrower has not made or is considered delinquent. These differences typically result from a borrower making monthly payments that do not result in the loan becoming fully current. Generally, a defaulted loan with more missed payments is more likely to result in a claim. The number of payments that a borrower is delinquent is shown in the following table.
| | Primary delinquent inventory - number of payments delinquent | Primary delinquent inventory - number of payments delinquent | Primary delinquent inventory - number of payments delinquent |
| | | | 2023 | |
| | | | 2022 | | 2021 |
| | 2023 | |
| | | 2023 | | | 2022 |
| 3 payments or less | 3 payments or less | | 11,484 | | | 9,529 | |
| 4 - 11 payments | 4 - 11 payments | | 8,026 | | | 9,208 | |
12 payments or more (1) | 12 payments or more (1) | | 6,877 | | | 14,553 | |
| Total | Total | | 26,387 | | | 33,290 | |
| | 3 payments or less | 3 payments or less | | 44 | % | | 28 | % |
| 3 payments or less | |
| 3 payments or less | | | 50 | % | | 44 | % |
| 4 - 11 payments | 4 - 11 payments | | 30 | % | | 28 | % | 4 - 11 payments | | 31 | % | | 30 | % |
| 12 payments or more | 12 payments or more | | 26 | % | | 44 | % | 12 payments or more | | 19 | % | | 26 | % |
| Total | Total | | 100 | % | | 100 | % | Total | | 100 | % | | 100 | % |
(1)Approximately 28%34% and 13%28% of the loans in the primary delinquency inventory with 12 payments or more delinquent have at least 36 payments delinquent as of December 31, 2023, and 2022, and 2021, respectively.
NET LOSSES AND LAE PAID
Net losses and LAE paid in 2023 were flat in 2022 compared to 2021, while direct losses paid decreased slightly in 2022 compared to 2021.consistent with 2022. Our claims paid activity slowed at the start of the COVID-19 pandemic primarily due to forbearance and foreclosure moratoriums put in place.place, and it has not yet appreciably increased from those suppressed levels. Home price appreciation experienced in recent years has allowed some borrowers to cure their delinquencies through the sale of their property. In addition, an increase in third party property sales prior to claim settlement has resulted in a decrease in the average claim paid on the claims we do receive. We expect net losses and LAE paid to increase, however, the magnitude and timing of the increases are uncertain.
The losses
MGIC Investment Corporation 2023 Form 10-K | 66
MGIC Investment Corporation and LAE paid on reinsurance terminations decreased in 2022 when compared to 2021. The decrease is primarily due to the losses and LAE recoverable from reinsurers at time of termination of the 2015 and 2019 QSR Transactions (effective December 31, 2022), compared to the losses and LAE recoverable from reinsurers at time of termination of the 2017 and 2018 QSR transaction (effective December 31, 2021). In a reinsurance termination, amounts for any incurred but unpaid losses are due to us from the reinsurerSubsidiaries
The table below presents our net losses and LAE paid for 20222023 and 2021.2022.
| | Net losses and LAE paid | Net losses and LAE paid | | Net losses and LAE paid |
| | (in millions) | (in millions) | | 2022 | | 2021 | |
| (in millions) | |
| (in millions) | | | 2023 | | 2022 |
| Total primary (excluding settlements) | Total primary (excluding settlements) | | $ | 35 | | | $ | 43 | | |
Claims paying practices and NPL settlements (1) | | 8 | | | 14 | | |
| NPL settlements | |
| Pool | Pool | | — | | | — | | |
| | Direct losses paid | |
| Direct losses paid | |
| Direct losses paid | Direct losses paid | | 43 | | | 57 | | |
| Reinsurance | Reinsurance | | (1) | | | (2) | | |
| Net losses paid | Net losses paid | | 42 | | | 55 | | |
| LAE | LAE | | 8 | | | 14 | | |
| Net losses and LAE paid before terminations | Net losses and LAE paid before terminations | | 50 | | | 69 | | |
Reinsurance terminations (2) | | (18) | | | (36) | | |
Reinsurance terminations (1) | |
| Net losses and LAE paid | Net losses and LAE paid | | $ | 32 | | | $ | 33 | | |
| | Average claim paid | | $ | 26,715 | | | $ | 34,956 | | |
Average claim paid (2) | |
Average claim paid (2) | |
Average claim paid (2) | |
(1)See Note 8 - "Loss Reserves" for additional information on our settlements of disputes for claims paying practices and/or commutations of policies (2)Excludes amounts paid in NPL settlements
The primary average claim paid can vary materially from period to period based upon a variety of factors, including the local market conditions, average loan amount, average coverage percentage, the amount of time between delinquency and claim filing, and our loss mitigation efforts on loans for which claims are paid.
The primary average RIF on delinquent loans as of December 31, 20222023 and 20212022 and for the top 5 jurisdictions (based on December 31, 20222023 delinquency inventory) appears in the following table.
| Primary average RIF - delinquent loans | | Primary average RIF - delinquent loans | |
| Primary average RIF - delinquent loans | |
| | 2022 | | 2021 | |
| 2023 | |
| 2023 | |
| 2023 | |
| Florida | |
| Florida | |
| Florida | Florida | $ | 59,515 | | | $ | 56,227 | | |
| Texas | Texas | 53,364 | | | 51,037 | | |
| Texas | |
| Texas | |
| Illinois | |
| Illinois | |
| Illinois | Illinois | 41,640 | | | 40,798 | | |
| Pennsylvania | Pennsylvania | 40,993 | | | 39,523 | | |
| New York | 74,760 | | | 74,836 | | |
| Pennsylvania | |
| Pennsylvania | |
| California | |
| California | |
| California | |
| All other jurisdictions | |
| All other jurisdictions | |
| All other jurisdictions | All other jurisdictions | 51,693 | | | 51,652 | | |
| Total all jurisdictions | Total all jurisdictions | $ | 52,511 | | | $ | 51,887 | | |
| Total all jurisdictions | |
| Total all jurisdictions | |
The primary average RIF on all loans was $64,784$67,705 and $59,518$64,784 at December 31, 20222023 and December 31, 2021,2022, respectively. The increase is primarily due to an increase in loans from recent years which generally have larger loan balances.
MGIC Investment Corporation 2022 Form 10-K | 63
MGIC Investment Corporation and Subsidiaries
LOSS RESERVES
Our primary delinquency inventory was 26,387 at December 31, 2022, representing a decrease of 21% from December 31, 2021. We also experienced a decrease in the average direct reserve per default as shown in the table below. The average direct reserve per default is influenced by the number of consecutive months a borrower has been delinquent. Generally, a defaulted loan with more missed payments is more likely to result in a claim. The number of delinquencies in inventory with twelve or more missed payments at December 31, 2022 decreased when compared to the prior year. (See Note 8 -"Loss Reserves," table 8.4.) The average direct reserve per default is also impacted by the average RIF on delinquent loans as shown above.
The gross reserves as of December 31, 2022,2023, and 20212022 appear in the table below.
| | Gross loss reserves | Gross loss reserves | |
| Gross loss reserves | |
| Gross loss reserves | |
| | | December 31, | |
| | December 31, |
| | December 31, | |
| | 2022 | | 2021 | |
| | December 31, | |
| | 2023 | |
| Primary: | |
| Primary: | |
| Primary: | Primary: | | | | | | |
Case reserves (In millions) | Case reserves (In millions) | | $ | 498 | | | | $ | 795 | | | |
Case reserves (In millions) | |
Case reserves (In millions) | |
| IBNR and LAE | |
| IBNR and LAE | |
| IBNR and LAE | IBNR and LAE | | 56 | | | | 82 | | | |
| Total primary direct loss reserves | Total primary direct loss reserves | | 554 | | | | 877 | | | |
| Total primary direct loss reserves | |
| Total primary direct loss reserves | |
| Ending delinquency inventory | |
| Ending delinquency inventory | |
| Ending delinquency inventory | Ending delinquency inventory | | 26,387 | | | | 33,290 | | |
| Percentage of loans delinquent (default rate) | Percentage of loans delinquent (default rate) | | 2.22 | % | | | 2.84 | % | |
| Percentage of loans delinquent (default rate) | |
| Percentage of loans delinquent (default rate) | |
| Average direct reserve per default | |
| Average direct reserve per default | |
| Average direct reserve per default | Average direct reserve per default | | $ | 20,994 | | | | $ | 26,156 | | |
| Primary claims received inventory included in ending delinquency inventory | Primary claims received inventory included in ending delinquency inventory | | 267 | | | | 211 | | |
Other gross loss reserves (2) (In millions) | | 4 | | | | 7 | | | |
| Primary claims received inventory included in ending delinquency inventory | |
| Primary claims received inventory included in ending delinquency inventory | |
Other gross loss reserves (1) (In millions) | |
Other gross loss reserves (1) (In millions) | |
Other gross loss reserves (1) (In millions) | |
(1)Since a number of our pool policies include aggregate loss limits and/or deductibles, we do not disclose an average direct reserve per default for our pool business.
(2)Other gross loss reserves includes direct and assumed reserves that are not included within our primary loss reserves.
MGIC Investment Corporation 20222023 Form 10-K | 6467
MGIC Investment Corporation and Subsidiaries
The primary delinquency inventory for the top 15 jurisdictions (based on December 31, 20222023 delinquency inventory) at December 31, 2022,2023, and 20212022 appears in table the below.
| | Primary delinquency inventory by jurisdiction | Primary delinquency inventory by jurisdiction | Primary delinquency inventory by jurisdiction |
| | | |
| | | | 2022 | | 2021 | | 2023 | | 2022 |
| Florida * | Florida * | 2,414 | | | 2,948 | | |
| Texas | Texas | 1,935 | | | 2,572 | | |
| Illinois * | Illinois * | 1,640 | | | 2,082 | | |
| Pennsylvania * | Pennsylvania * | 1,525 | | | 1,672 | | |
| California | |
| New York * | New York * | 1,399 | | | 1,674 | | |
| California | 1,336 | | | 1,852 | | |
| Ohio * | Ohio * | 1,322 | | | 1,458 | | |
| Michigan | Michigan | 965 | | | 1,144 | | |
| Georgia | Georgia | 954 | | | 1,272 | | |
| New Jersey * | New Jersey * | 841 | | | 1,169 | | |
| North Carolina | North Carolina | 753 | | | 987 | | |
| Maryland | Maryland | 719 | | | 929 | | |
| Indiana | 622 | | | 736 | | |
| Indiana * | |
| Minnesota | |
| Virginia | Virginia | 582 | | | 766 | | |
| Minnesota | 573 | | | 725 | | |
| All other jurisdictions | All other jurisdictions | 8,807 | | | 11,304 | | |
| Total | Total | 26,387 | | | 33,290 | | |
| Note: Asterisk denotes jurisdictions in the table above that predominately use a judicial foreclosure process, which generally increases the amount of time it takes for a foreclosure to be completed. | | Note: Asterisk denotes jurisdictions in the table above that predominately use a judicial foreclosure process, which generally increases the amount of time it takes for a foreclosure to be completed. | |
| Note: Asterisk denotes jurisdictions in the table above that predominately use a judicial foreclosure process, which generally increases the amount of time it takes for a foreclosure to be completed. | |
| Note: Asterisk denotes jurisdictions in the table above that predominately use a judicial foreclosure process, which generally increases the amount of time it takes for a foreclosure to be completed. | |
| Note: Asterisk denotes jurisdictions in the table above that predominately use a judicial foreclosure process, which generally increases the amount of time it takes for a foreclosure to be completed. | |
| Note: Asterisk denotes jurisdictions in the table above that predominately use a judicial foreclosure process, which generally increases the amount of time it takes for a foreclosure to be completed. | |
| Note: Asterisk denotes jurisdictions in the table above that predominately use a judicial foreclosure process, which generally increases the amount of time it takes for a foreclosure to be completed. | |
| Note: Asterisk denotes jurisdictions in the table above that predominately use a judicial foreclosure process, which generally increases the amount of time it takes for a foreclosure to be completed. | |
| Note: Asterisk denotes jurisdictions in the table above that predominately use a judicial foreclosure process, which generally increases the amount of time it takes for a foreclosure to be completed. | |
| Note: Asterisk denotes jurisdictions in the table above that predominately use a judicial foreclosure process, which generally increases the amount of time it takes for a foreclosure to be completed. | |
| Note: Asterisk denotes jurisdictions in the table above that predominately use a judicial foreclosure process, which generally increases the amount of time it takes for a foreclosure to be completed. | |
| Note: Asterisk denotes jurisdictions in the table above that predominately use a judicial foreclosure process, which generally increases the amount of time it takes for a foreclosure to be completed. | |
The primary delinquency inventory by policy year at December 31, 20222023 and 20212022 appears in the following table.
| | | | | | | | | | | |
| Primary delinquency inventory by policy year |
| | | |
| 2023 | | 2022 |
| 2004 and prior | 2,072 | | | 2,471 | |
| 2004 and prior %: | 8 | % | | 9 | % |
| 2005 | 1,289 | | | 1,438 | |
| 2006 | 2,015 | | | 2,388 | |
| 2007 | 3,029 | | | 3,680 | |
| 2008 | 675 | | | 811 | |
| 2005 - 2008 % | 27 | % | | 32 | % |
| 2009 | 37 | | | 51 | |
| 2010 | 25 | | | 31 | |
| 2011 | 25 | | | 43 | |
| 2012 | 43 | | | 72 | |
| 2013 | 158 | | | 243 | |
| 2014 | 434 | | | 633 | |
| 2015 | 692 | | | 944 | |
| 2009 - 2015 % | 6 | % | | 8 | % |
| 2016 | 954 | | | 1,249 | |
| 2017 | 1,365 | | | 1,719 | |
| 2018 | 1,750 | | | 2,060 | |
| 2019 | 1,550 | | | 1,823 | |
| 2020 | 2,383 | | | 2,558 | |
| 2021 | 4,237 | | | 3,307 | |
| 2022 | 2,605 | | | 866 | |
| 2023 | 312 | | | — | |
| 2016 and later %: | 59 | % | | 51 | % |
| Total | 25,650 | | | 26,387 | |
| | | | | | | | | | | | | |
| Primary delinquency inventory by policy year |
| | | | | |
| 2022 | | 2021 | | |
| 2004 and prior | 2,471 | | | 2,829 | | | |
| 2004 and prior %: | 9 | % | | 8 | % | | |
| 2005 | 1,438 | | | 1,703 | | | |
| 2006 | 2,388 | | | 2,928 | | | |
| 2007 | 3,680 | | | 4,973 | | | |
| 2008 | 811 | | | 1,278 | | | |
| 2005 - 2008 % | 32 | % | | 33 | % | | |
| 2009 | 51 | | | 84 | | | |
| 2010 | 31 | | | 56 | | | |
| 2011 | 43 | | | 79 | | | |
| 2012 | 72 | | | 143 | | | |
| 2013 | 243 | | | 441 | | | |
| 2014 | 633 | | | 1,055 | | | |
| 2015 | 944 | | | 1,542 | | | |
| 2009 - 2015 % | 8 | % | | 10 | % | | |
| 2016 | 1,249 | | | 2,004 | | | |
| 2017 | 1,719 | | | 2,949 | | | |
| 2018 | 2,060 | | | 3,412 | | | |
| 2019 | 1,823 | | | 3,340 | | | |
| 2020 | 2,558 | | | 3,308 | | | |
| 2021 | 3,307 | | | 1,166 | | | |
| 2022 | 866 | | | — | | | |
| 2016 and later %: | 51 | % | | 49 | % | | |
| Total | 26,387 | | | 33,290 | | | |
MGIC Investment Corporation 2023 Form 10-K | 68
MGIC Investment Corporation and Subsidiaries
On our primary business, the highest claim frequency years have typically been the third and fourth year after loan origination. However, the pattern of claim frequency can be affected by many factors, including persistency and deteriorating economic conditions. Deteriorating economic conditions can result in increasing claims following a period of declining claims. As of December 31, 2022, 80%2023, 67% of our primary RIF was written subsequent to December 31, 2020, 84% of our primary RIF was written subsequent to December 31, 2019, 85%and 89% of our primary RIF was written subsequent to December 31, 2018, and 88% of our primary RIF was written subsequent to December 31, 2017.2018.
UNDERWRITING AND OTHER EXPENSES, NET
Underwriting and other expenses includes items such as employee compensation costs, fees for professional and consulting services, depreciation and maintenance expense, and premium taxes, and are reported net of ceding commissions.
Underwriting and other expenses, net for 2022 increased2023 decreased to $226.0 million from $236.7 million from $198.4 million in 2021.2022. The increasedecrease was primarily due to highera decrease in expenses related to our technology investments, particularlyprofessional and consulting services and a decrease in data and analytics, and an increase in pension expense. Pension expenses increased in 2022 as a result ofrelated to settlement accounting charges during 2022. In 2023, we expect to incur settlement accounting charges as a result of lump sum settlements for employees who retired in the fourth quarter of 2022.
charges.
MGIC Investment Corporation 2022 Form 10-K | 65
MGIC Investment Corporation and Subsidiaries
| | | | | | | | | | | | | | | | |
| | Year Ended December 31, |
| | 2022 | | 2021 | | |
| Underwriting expense ratio | | 25.2 | % | | 20.6 | % | | |
| | | | | | | | | | | | | | | | |
| | Year Ended December 31, |
| | 2023 | | 2022 | | |
| Underwriting expense ratio | | 25.5 | % | | 25.2 | % | | |
The underwriting expense ratio is the ratio, expressed as a percentage, of the underwriting and operating expenses, net and amortization of DAC of our combined insurance operations (which excludes underwriting and operating expenses of our non-insurance subsidiaries) to net premiums written. The underwriting expense ratio increased in 20222023 compared with 20212022 due to an increase in underwriting expenses and slight decreasesa decrease in net premiums written.written, partially offset by a decrease in underwriting and operating expenses, net.
LOSS ON DEBT EXTINGUISHMENT
In 2023, we did not record a loss on debt extinguishment. In 2022, we recorded a loss on debt extinguishment of $40.2 million, related to the repurchases of a portion our 9% Debentures, the redemption of our 5.75% Senior Notes, and the repayment of the outstanding principal balance of the FHLB Advance. In 2021, we recorded a loss on debt extinguishment of $36.9 million associated with the repurchase of most of our 9% Debentures.
See Note 7 - "Debt" to our consolidated financial statements for a discussion on our debt.of the 9% Debenture conversion in 2023.
INTEREST EXPENSE
Interest expense for 20222023 was $48.1$36.9 million compared to $71.4$48.1 million for 2021.2022. The decrease is due to the debt transactions discussed above.
INCOME TAX EXPENSE AND EFFECTIVE TAX RATE
| Income tax provision and effective tax rate | | Income tax provision and effective tax rate | |
| Income tax provision and effective tax rate | |
| | (In millions, except rate) | | 2022 | | 2021 | |
| (In thousands, except rate) | |
| (In thousands, except rate) | |
| (In thousands, except rate) | |
| Income before tax | |
| Income before tax | |
| Income before tax | Income before tax | | $ | 1,090 | | | $ | 802 | | |
| Provision for income taxes | Provision for income taxes | | 225 | | | 167 | | |
| Provision for income taxes | |
| Provision for income taxes | |
| Effective tax rate | Effective tax rate | | 20.6 | % | | 20.8 | % | |
| Effective tax rate | |
| Effective tax rate | |
The increasedecrease in our provision for income taxes for 20222023 compared to 20212022 was primarily due to an increasea decrease in income before tax. Our effective tax rate for 20222023 and 20212022 approximated the federal statutory income tax rate of 21%.
MGIC Investment Corporation 20222023 Form 10-K | 6669
MGIC Investment Corporation and Subsidiaries
BALANCE SHEET REVIEW
The following sections focus on the assets and liabilities experiencing major developments in 2022.2023.
Consolidated balance sheets - Assets
| | As of December 31, | |
| As of December 31, | |
| (in thousands) | |
| (in thousands) | |
| (in thousands) | (in thousands) | 2022 | | 2021 | | % Change | 2023 | | 2022 | | % Change |
| Investments | Investments | $ | 5,424,688 | | | $ | 6,606,749 | | | (18) | |
| Cash and cash equivalents | Cash and cash equivalents | 327,384 | | | 284,690 | | | 15 | |
| Premiums receivable | 58,000 | | | 56,540 | | | 3 | |
| Reinsurance recoverable on loss reserves | Reinsurance recoverable on loss reserves | 28,240 | | | 66,905 | | | (58) | |
| Reinsurance recoverable on paid losses | Reinsurance recoverable on paid losses | 18,081 | | | 36,275 | | | (50) | |
| Deferred incomes taxes, net | Deferred incomes taxes, net | 124,769 | | | — | | | N/M |
| Other assets | Other assets | 232,631 | | | 273,849 | | | (15) | |
| Total Assets | Total Assets | $ | 6,213,793 | | | $ | 7,325,008 | | | (15) | |
INVESTMENT PORTFOLIO
The investment portfolio decreasedincreased to $5.4$5.7 billion as of December 31, 2022 (2021: $6.62023 (2022: $5.4 billion), primarily due to a decreasean increase in the fair value of our investment portfolio, dueoffset by repurchases of our stock, and dividends paid to the increase in the prevailing market interest rates and the reduction of debt outstanding.shareholders.
The return we generate on our investment portfolio is an important component of our consolidated financial results. Our investment portfolio primarily consists of a diverse mix of highly rated fixed income securities. The investment portfolio is designed to achieve the following objectives:
| | | | | | | | | | | | | | |
Operating Companies (1) | | Holding Company |
| è | Preserve PMIERs assets | | è | Provide liquidity with minimized realized loss |
| è | Maximize total return with emphasis on book yield, subject to our other objectives | | è | Maintain highly liquid, low volatility assets |
| è | Limit portfolio volatility | | è | Maintain high credit quality |
| è | Duration 3.5 to 5.5 years | | è | Duration maximum of 2.5 years |
(1)Primarily MGIC
To achieve our portfolio objectives, our asset allocation considers the risk and return parameters of the various asset classes in which we invest. This asset allocation is informed by, and based on, the following factors:
| | | | | |
| è | economic and market outlooks; |
| è | diversification effects; |
| è | security duration; |
| è | liquidity; |
| è | capital considerations; and |
| è | income tax rates. |
The average duration and embedded investment yield of our investment portfolio as of December 31, 20222023 and 20212022 is shown in the following table.
| Portfolio duration and embedded investment yield | | Portfolio duration and embedded investment yield | |
| Portfolio duration and embedded investment yield | |
| | | December 31, |
| | 2022 | | 2021 | |
| Duration (in years) | | 4.3 | | 4.5 | |
| | December 31, | |
| | December 31, | |
| | December 31, | |
| | 2023 | |
| Effective Duration (in years) | |
| Effective Duration (in years) | |
| Effective Duration (in years) | |
Pre-tax yield (1) | |
Pre-tax yield (1) | |
Pre-tax yield (1) | Pre-tax yield (1) | | 3.0% | | 2.5% | |
After-tax yield (1) | After-tax yield (1) | | 2.5% | | 2.1% | |
After-tax yield (1) | |
After-tax yield (1) | |
(1)Embedded investment yield is calculated on a yield-to-worst basis.
The credit risk of a security is evaluated through analysis of the security's underlying fundamentals, including the issuer's sector, scale, profitability, debt coverage, and ratings. The investment policy guidelines limit the amount of our credit exposure to any one issue, issuer and type of instrument. The following table shows the security ratings of our fixed income investments as of December 31, 20222023 and 2021.2022.
MGIC Investment Corporation 20222023 Form 10-K | 6770
MGIC Investment Corporation and Subsidiaries
| | Fixed income security ratings | Fixed income security ratings | Fixed income security ratings |
| % of fixed income securities at fair value | % of fixed income securities at fair value | % of fixed income securities at fair value |
| | Security Ratings (1) |
| | Security Ratings (1) | | | | Security Ratings (1) |
| Period | Period | | AAA | | AA | | A | | BBB | Period | | AAA | | AA | | A | | BBB |
| December 31, 2023 | | December 31, 2023 | | 12% | | 34% | | 35% | | 19% |
| December 31, 2022 | December 31, 2022 | | 18% | | 28% | | 34% | | 20% | December 31, 2022 | | 18% | | 28% | | 34% | | 20% |
| December 31, 2021 | | 18% | | 26% | | 36% | | 20% |
(1)Ratings are provided by one or more of: Moody's, Standard & Poor's and Fitch Ratings. If three ratings are available, the middle rating is used; if two FICO scores are available,used, otherwise the lowerlowest rating is used.
The decrease in fixed income securities with an AAA rating at December 31, 2023, was primarily from the downgrade of the two is used; if only one FICO score is available, it is used.United States government’s credit rating to AA+ by Fitch in the third quarter.
Our investment portfolio was invested in comparable security types for the years ended December 31, 20222023 and December 31, 2021.2022. See Note 5 – “Investments” to our consolidated financial statements for additional disclosure on our investment portfolio.
Investments outlook
The Federal Open Market Committee (“FOMC”) raised the federal funds rate sevenfour times throughout 20222023 from 0.25%4.50% to 4.5%5.50% as it weighed the ongoing economic impacts of tight labor markets, supply chain disruptions and other macroeconomic factors that elevated inflationary measures.balanced maintaining a sufficiently restrictive monetary policy to return inflation to its long-run target, while also achieving its employment goals. In February, 2023January, 2024, the FOMC increasedheld the federal funds rate by an additional 0.25%at 5.25% to 5.50%. The FOMC acknowledged recent inflation data has demonstrated it is on a trajectory to return to their 2% inflation target, but rate cuts will not be warranted until the FOMC has greater confidence that inflation will remain sustainably at target and signaled continuedinflation risks are balanced with other economic risks. The forward curve, which currently includes several rate cuts this year indicates a shift toward a less restrictive monetaryFOMC policy in response to inflationary pressures. Market yields have increased in response tothrough the end of 2024. The lagged effects of the FOMC’s actions which has resulted in a decrease in our fixed income investment valuations. The actions of the FOMC and other ongoing macroeconomic and geopolitical factors could create significant economic uncertainty such as increasing recessionary concerns,and alter forward rate expectations, which may result in a widening ofinterest rate and credit spreads.spread volatility. Market volatility resulting from these factors, mayparticularly the absolute level of rates and the rate of change, will continue to impact our investment valuations and returns.
The changes in unrealized investment gains and losses generally do not impact the management of our investment portfolio. We seek to manage our exposure to interest rate risk and volatility by maintaining a diverse mix of high-quality securities with an intermediate duration profile.profile and generally hold fixed income investments until maturity. The quality of our fixed income portfolio remains very high and changes in unrealized gains and losses have little impact on our cash flows, statutory surplus, or other capital requirements.
While a higher interest ratesrate environment may continue to adversely impact the fair values of ourexisting fixed income investments, they present a near-termit presents an opportunity for continued investment into securities with yields in excess of the book yield on our portfolio. Increases in market-based portfolio yields are expected to result in higher net investment income in future periods. In addition to fixed income securities, we also hold cash and cash equivalents which yield returns that trend with changes ingenerally reflect the federal funds rate.
As of December 31, 2022, approximately 6% of the fair value of our investment portfolio consisted of securities referencing LIBOR. As discussed in our risk factor titled "The Company may be adversely impacted by the transition from LIBOR as a reference rate," the ICE Benchmark Administration, the administrator of LIBOR, will cease publishing all USD LIBOR tenors on June 30, 2023.
CASH AND CASH EQUIVALENTS
Cash and cash equivalents increased to $327.4$363.7 million, as of December 31, 2022 (2021: $284.72023 (2022: $327.4 million), as net cash generated from operating activities was substantially used in financing activities.
REINSURANCE RECOVERABLE ON PAID LOSSES
Reinsurance recoverable on paid losses decreased to $9.9 million at December 31, 2023 (2022: $18.1 million). At December 31, 2023, the reinsurance recoverable on paid losses was primarily comprised of losses recoverable from reinsurers at the time of the termination of our 2020 QSR Transaction. At December 31, 2022 the reinsurance recoverable on paid losses was primarily composed of losses recoverable from reinsurers at the time of termination of the 2015 and 2019 QSR Transactions. Generally, in a reinsurance termination, amounts for any incurred but unpaid losses are due to us from the reinsurers.
DEFERRED INCOME TAXES
Our net deferred tax asset was $79.8 million and $124.8 million at December 31, 20222023 and is separately stated in our consolidated balance sheets as Deferred income taxes, net. Our net deferred income tax liability was $39.4 million at December 31, 2021 and is included as a component of Other liabilities in our consolidated balance sheets.2022, respectively. The changedecrease in our deferred income tax asset and liability was primarily due to the tax effect ofon unrealized lossesgains generated by the investment portfolio during 2022.2023. We owned $661.7$848.6 million and $426.3$661.7 million of tax and loss bonds at December 31, 20222023 and December 31, 2021,2022, respectively. See Note 12 – “Income Taxes”“Income Taxes” to our consolidated financial statements for additional disclosure on the components of our deferred tax assets and liabilities.
REINSURANCE RECOVERABLE ON PAID LOSSES
Reinsurance recoverable on paid losses decreased to $18.1 million at December 31, 2022 (2021: $36.3 million). The decrease in the reinsurance recoverable on paid losses is primarily due from the losses recoverable from reinsurers at time of termination of the 2015 and 2019 QSR Transactions (effective December 31, 2022), compared to the losses recoverable from reinsurers at time of termination of the 2017 and 2018 QSR transaction (effective December 31, 2021). In a reinsurance termination, amounts for any incurred but unpaid losses are due to us from the reinsurers.
OTHER ASSETS
Other assets decreased to $111 million as of December 31, 2022 (2021: $134 million), primarily driven by a change in the net funded status of our employee benefit plans. See Note 11 - "Benefit Plans" to our consolidated financial statements for additional disclosure on our employee benefit plans.
MGIC Investment Corporation 20222023 Form 10-K | 6871
MGIC Investment Corporation and Subsidiaries
Consolidated balance sheets - Liabilities and equity
| | As of December 31, | |
| | As of December 31, | |
| (In thousands) | |
| (In thousands) | |
| (In thousands) | (In thousands) | | 2022 | | 2021 | | % Change | | 2023 | | 2022 | | % Change |
| Liabilities | Liabilities | |
| Loss reserves | |
| Loss reserves | |
| Loss reserves | Loss reserves | | $ | 557,988 | | | $ | 883,522 | | | (37) | |
| Unearned premiums | Unearned premiums | | 195,289 | | | 241,690 | | | (19) | |
| Long-term debt | Long-term debt | | 662,810 | | | 1,146,712 | | | (42) | |
| Other liabilities | Other liabilities | | 154,966 | | | 191,702 | | | (19) | |
| Total Liabilities | Total Liabilities | | $ | 1,571,053 | | | $ | 2,463,626 | | | (36) | |
| | Shareholders' equity | Shareholders' equity | |
| Shareholders' equity | |
| Shareholders' equity | |
| Common stock | |
| Common stock | |
| Common stock | Common stock | | $ | 371,353 | | | $ | 371,353 | | | — | |
| Paid-in capital | Paid-in capital | | 1,798,842 | | | 1,794,906 | | | — | |
| Treasury stock | Treasury stock | | (1,050,238) | | | (675,265) | | | 56 | |
| AOCI, net of tax | AOCI, net of tax | | (481,511) | | | 119,697 | | | (502) | |
| Retained earnings | Retained earnings | | 4,004,294 | | | 3,250,691 | | | 23 | |
| Total | Total | | $ | 4,642,740 | | | $ | 4,861,382 | | | (4) | |
LOSS RESERVES AND REINSURANCE RECOVERABLE ON LOSS RESERVES
Our loss reserves include estimates of losses and settlement expenses on (1) loans in our delinquency inventory (known as case reserves), (2) IBNR delinquencies, and (3) LAE. Our gross reserves are reduced by reinsurance recoverable on loss reserves to calculate a net reserve balance. Loss reserves decreased to $558.0$505.4 million as of December 31, 2022,2023, from $883.5$558.0 million of December 31, 2021.2022. Reinsurance recoverables on loss reserves were $28.2$33.3 million and $66.9$28.2 million as of December 31, 20222023 and December 31, 2021,2022, respectively. The decrease in loss reserves from 2022 to 2021 is primarily due to favorable development of $404.1$208.5 million on previously received delinquency notices, partially offset by loss reserves established on new delinquency notices. The reinsurance recoverable on loss reserves is impacted by the change in direct reserves and the percentage of our delinquency inventory covered by reinsurance transactions.
LONG-TERM DEBT
Our long-term debt decreased to $643.2 million as of December 31, 2023 from $662.8 million as of December 31, 2022 from $1,146.7 million as of December 31, 2021 as we paid down our long-term debt in 2022. We repurchased $89.1 million in aggregate principal amountUnder the terms of our 9% Debentures, repaidwe exercised our option to redeem the outstanding balanceprincipal of $21.1 million. Prior to the redemption date, substantially all holders elected to convert into shares of our common stock. We elected to pay cash in lieu of issuing shares. See Note 7 - "Debt" to our consolidated financial statements for discussion of the FHLB Advance of $155.0 million and we redeemed the $242.3 million of aggregate principal outstanding on our 5.75% Senior Notes due9% Debenture conversion in 2023.
UNEARNED PREMIUM
Our unearned premium decreased to $157.8 million as of December 31, 2023 from $195.3 million as of December 31, 2022 from $241.7 million as of December 31, 2021 primarily due to the run-off of unearned premium on our existing portfolio of single premium policies, outpacing the level of NIW frompartially offset by new premium written on single premium policies.
OTHER LIABILITIES
Other liabilities decreased to $155.0 million as of December 31, 2022 (2021: $191.7 million), primarily due to decreases in our deferred income tax liability, accrual for premium refunds, and interest payable. These were partially offset by an increase in our liability for pension obligation.
SHAREHOLDER'S EQUITY
The decreaseincrease in shareholders' equity represents a decreaseis primarily due to net income and an increase in the fair value of our investmentsinvestment portfolio, discussed above,partially offset by repurchases of our common stock and dividends paid to shareholders partially offset by net income in 2022.2023.
MGIC Investment Corporation 20222023 Form 10-K | 6972
MGIC Investment Corporation and Subsidiaries
LIQUIDITY AND CAPITAL RESOURCES
CONSOLIDATED CASH FLOW ANALYSIS
We have three primary types of cash flows: (1) operating cash flows, which consist mainly of cash generated by our insurance operations and income earned on our investment portfolio, less amounts paid for claims, interest expense and operating expenses, (2) investing cash flows related to the purchase, sale and maturity of investments and purchases of property and equipment and (3) financing cash flows generally from activities that impact our capital structure, such as changes in debt and shares outstanding, and dividend payments. The following table summarizes these three cash flows on a consolidated basis for the last two years.
| | Summary of consolidated cash flows | Summary of consolidated cash flows | Summary of consolidated cash flows |
| | | |
| | | | | Years ended December 31, | | Years ended December 31, |
| (In thousands) | (In thousands) | | 2022 | | 2021 | (In thousands) | | 2023 | | 2022 |
| Total cash provided by (used in): | Total cash provided by (used in): | |
| Operating activities | Operating activities | | $ | 650,012 | | | $ | 696,317 | |
| Operating activities | |
| Operating activities | |
| Investing activities | Investing activities | | 410,485 | | | (160,749) | |
| Financing activities | Financing activities | | (1,032,542) | | | (527,290) | |
| Increase (decrease) in cash and cash equivalents and restricted cash and cash equivalents | Increase (decrease) in cash and cash equivalents and restricted cash and cash equivalents | | $ | 27,955 | | | $ | 8,278 | |
Operating activities
The following list highlights the major sources and uses of cash flow from operating activities:
| | | | | |
| Sources |
| + | Premiums received |
| + | Loss payments from reinsurers |
| + | Investment income |
| |
| Uses |
| - | Claim payments |
| - | Premium ceded to reinsurers |
| - | Interest expense |
| - | Operating expenses |
| - | Tax payments |
| |
Our largest source of cash is from premiums received from our insurance policies, which we receive on a monthly installment basis for most policies. Premiums are received at the beginning of the coverage period for single premium and annual premium policies. Our largest cash outflow is generally for claims that arise when a delinquency results in an insured loss. Based on historical experience, we expect our future claim payments associated with established case loss reserves to pay out at or within 5 years, with the majority of future claim payments made within one to three years. Our claims paid activity slowed at the start of the COVID-19 pandemic primarily due to forbearance and foreclosure moratoriums put in place.place and it has not yet appreciably increased from these suppressed levels. Home price appreciation experienced in recent years has allowed some borrowers to cure their delinquencies through the sale of their property. In addition, an increase in third party property sales prior to claim settlement, has resulted in a decrease in the average claim paid on the claims we do receive. We expect net losses and LAE paid to increase, however, the magnitude and timing of the increases are uncertain.
We invest our net cash flow in various investment securities that earn interest. We also use cash to pay for our ongoing expenses such as salaries, debt interest, professional services and occupancy costs.
In connection with our reinsurance transactions, we cede, or pay out, part of the premiums we receive to our reinsurers and collect cash when claims subject to our reinsurance coverage are paid.
Net cash provided by operating activities in 2023 increased compared to 2022 primarily due to a decrease in income tax payments, a decrease in underwriting and operating expenses paid, a decrease in interest payments, and an increase in investment income collected. This was offset by a decrease in premiums received and an increase in loss payments.
We also have purchase obligations totaling approximately $22$14.1 million which consist primarily of contracts related to our continued investment in our information technology infrastructure in the normal course of business. The majority of these obligations are under contracts that give us cancellation rights with notice. In the next twelve months we anticipate we will pay approximately $10$6.7 million for our purchase obligations.
In connection with our reinsurance transactions, we cede, or pay out, part of the premiums we receive to our reinsurersMGIC Investment Corporation 2023 Form 10-K | 73
MGIC Investment Corporation and collect cash when claims subject to our reinsurance coverage are paid.Subsidiaries
Net cash provided by operating activities
We expect to make a contribution to our qualified pension plan in 2022 decreased2024 of $25.0 million. The net funded status (the market value of our plan assets compared to 2021 primarily duethe projected benefit obligation) will impact future contributions to an increase in income taxes paid, increase in underwriting and operating expenses paid, a decrease in investment income collected, and a decrease in premiums received. This was partially offset by a decrease in losses paid, net of reinsurance settlements and a decrease in interest payments.our qualified pension plan.
Investing activities
The following list highlights the major sources and uses of cash flow from investing activities:
| | | | | |
| Sources |
| + | Proceeds from sales of investments |
| + | Proceeds from maturity of fixed income securities |
| |
| Uses |
| - | Purchases of investments |
- | Purchases of property and equipment |
We maintain an investment portfolio that is primarily invested in a diverse mix of fixed income securities. As of December 31, 2022,2023, our portfolio had a fair value of $5.7 billion compared to $5.4 billion a decrease of $1.2 billion, or 17.9% fromat December 31, 2021.2022. Net cash flows provided by investing activities in 2023 primarily reflects purchases of fixed income securities during the period that exceeded sales and maturities of fixed income securities during the period as cash from operations was available for additional investment. Net cash used in investing activities in 2022 primarily reflectreflects sales and maturities of fixed income and equity securities during the year that exceeded purchases as proceeds were used in financing activities. Net cash used in investing activities in 2021 primarily reflects purchases of fixed income and equity securities during the year that exceeded sales of such securities as cash from operations was available for additional investment. In addition to investment portfolio activities, our investing activities included investment in our technology infrastructure to enhance our ability to conduct business and execute our strategies.
MGIC Investment Corporation 2022 Form 10-K | 70
MGIC Investment Corporation and Subsidiaries
Financing activities
The following list highlights the major sources and uses of cash flow from financing activities:
| | | | | |
| Sources |
| + | Proceeds from debt and/or common stock issuances |
| |
| Uses |
| - | Repayment/repurchase of debt |
| - | Repurchase of common stock |
| - | Payment of dividends to shareholders |
| - | Payment of withholding taxes related to share-based compensation net share settlement |
Net cash flows used in financing activities in 2023 primarily reflects the repurchases of our common stock, dividends to shareholders, and the conversion of our 9% Debentures. Net cash flows used in financing activities in 2022 primarily reflects the repurchase of our common stock, repayment of our 5.75% Notes and our FHLB Advance, the repurchase of a most of our 9% Debentures and payment of dividends to shareholders. Net cash flows used in financing activities in 2021 primarily reflect repurchases of our common stock, repurchase of a portion of our 9% Debentures, payment of dividends to shareholders and the payment of withholding taxes related to share-based compensation net share settlement.
For a further discussion of matters affecting our cash flows, see "Balance Sheet Review" above and "Debt at our Holding Company and Holding Company Liquidity" below.
CAPITALIZATION
Capital Risk
Capital risk is the risk of adverse impact on our ability to comply with capital requirements (regulatory and GSE) and to maintain the level, structure and composition of capital required for meeting financial performance objectives.
A strong capital position is essential to our business strategy and is important to maintain a competitive position in our industry. Our capital strategy focuses on long-term stability, which enables us to build and invest in our business, even in a stressed environment.
Our capital management objectives are to:
| | | | | |
| è | influence and ensuremaintain compliance with capital requirements, |
| è | maintain access to capital and reinsurance markets, |
| è | manage our capital to support our business strategies and the competing priorities of relevant stakeholders |
| è | assess appropriate uses for capital that cannot be deployed in support of our business strategies, including the size and form of capital return to shareholders, and |
| è | support business opportunities by enabling capital flexibility and efficiently using company resources. |
These objectives are achieved through ongoing monitoring and management of our capital position, mortgage insurance portfolio stress modeling, and a capital governance framework. Capital management is intended to be flexible in order to react to a range of potential events. The focus we place on any individual objective may change over time due to factors that include, but are not limited to, economic conditions, changes at the GSEs, competition, and alternative transactions to transfer mortgage risk.
MGIC Investment Corporation 2023 Form 10-K | 74
MGIC Investment Corporation and Subsidiaries
Capital Structure
The following table summarizes our capital structure as of December 31, 2022,2023, and 2021.2022.
| | | (In thousands, except ratio) | (In thousands, except ratio) | | 2022 | | 2021 | |
| (In thousands, except ratio) | |
| (In thousands, except ratio) | |
| Common stock, paid-in capital, retained earnings, less treasury stock | |
| Common stock, paid-in capital, retained earnings, less treasury stock | |
| Common stock, paid-in capital, retained earnings, less treasury stock | Common stock, paid-in capital, retained earnings, less treasury stock | | $ | 5,124,251 | | | $ | 4,741,685 | | |
| Accumulated other comprehensive loss, net of tax | Accumulated other comprehensive loss, net of tax | | (481,511) | | | 119,697 | | |
| Accumulated other comprehensive loss, net of tax | |
| Accumulated other comprehensive loss, net of tax | |
| Total shareholders' equity | |
| Total shareholders' equity | |
| Total shareholders' equity | Total shareholders' equity | | 4,642,740 | | | 4,861,382 | | |
| Long-term debt, par value | Long-term debt, par value | | 671,086 | | | 1,157,500 | | |
| Long-term debt, par value | |
| Long-term debt, par value | |
| Total capital resources | |
| Total capital resources | |
| Total capital resources | Total capital resources | | $ | 5,313,826 | | | $ | 6,018,882 | | |
| | Ratio of long-term debt to shareholders' equity | Ratio of long-term debt to shareholders' equity | | 14.5 | % | | 23.8 | % | |
| | Ratio of long-term debt to shareholders' equity | |
| | Ratio of long-term debt to shareholders' equity | |
The decreaseincrease in shareholders' equity in 2022 represents a decrease2023 primarily relates to net income and an increase in the fair value of our investmentsinvestment portfolio, partially offset by repurchases of our common stock and dividends paid partially offset by net incometo shareholders in 2022.2023. See Note 13 - "Shareholders' Equity" for further information.
DEBT AT OUR HOLDING COMPANY AND HOLDING COMPANY LIQUIDITYCAPITALIZATION
Debt obligations - holding company
The 5.25% Notes and 9% Debentures are obligations of our holding company, MGIC Investment Corporation, and not of its subsidiaries. We have no debt obligations due within the next twelve months. As of December 31, 2022,2023, our holding company's debt obligations was $650 million in aggregate principal amount consisting of our 5.25% Notes had $650 million of outstanding principal due in 2028 and our 9% Debentures had $21.1 million of outstanding principal due in April 2063.2028.
In 2022, we repurchased $89.1 aggregate principal2023, under the terms of our 9% debentures, redeemedDebentures, we exercised our option to redeem the outstanding principal balance on our 5.75% Notes, and repaidof $21.1 million. Prior to the outstanding balance of our FHLB advance.
The 9% Debentures are a convertible debt issuance. Subjectredemption date, substantially all holders elected to certain limitations and restrictions, holders of the 9% Debenturesmay convert their notes into shares of our common stock at their option priorstock. We elected to certain dates prescribed under the termspay cash in lieu of their issuance, in which case our corresponding obligation will be eliminated prior to the scheduled maturity.issuing shares.
See Note 7 - "Debt" for further information on our outstanding debt obligations and transactions impacting our consolidated financial statements in 20222023 and 2021.2022.
Liquidity analysis - holding company
As of December 31, 2022,2023, and December 31, 2021,2022, we had approximately $647$918 million and $663$647 million, respectively, in cash and investments at our holding company. These resources are maintained primarily to service our debt interest expense, pay debt maturities, repurchase shares, pay dividends to shareholders, and to settle intercompany obligations. While these assets are held, we generate investment income that serves to offset a portion of our cash requirements. The payment of dividends from MGIC are the principal source of holding company cash inflow and their payment is restricted by insurance regulation. See Note 14 - “Statutory Information” to our consolidated financial statement for additional information about
MGIC Investment Corporation 2022 Form 10-K | 71
MGIC Investment Corporation and Subsidiaries
MGIC’s dividend restrictions. The payment of dividends from MGIC is also influenced by our view of the appropriate level of excess PMIERs Available Assets to maintain.maintain, which can change over time. Raising capital in the public markets is another potential source of holding company liquidity. The ability to raise capital in the public markets is subject to prevailing market conditions, investor demand for the securities to be issued, and our deemed creditworthiness.
Over the next twelve months the principal demand on holding company resources will be interest payments on our 5.25% Notes and 9% Debentures approximating $36.0$34.0 million, based on the debt outstanding at December 31, 2022.2023. We believe our holding company has sufficient sources of liquidity to meet its payment obligations for the foreseeable future.
During 20222023 and 2021,2022, we used approximately $386$340.6 million and $291$385.7 million respectively, of available holding company cash to repurchase shares of our common stock. Through February 17, 202316, 2024 we used approximately $42.6$55.8 million of available holding company cash to repurchase shares of our common stock. The repurchase programs may be suspended or discontinued at any time. See
In 2023, we used $122.9 million to pay cash dividends to shareholders. On January 23, 2024, our Board of this MD&A forDirectors declared a discussionquarterly cash dividend of our$0.115 per common share repurchase programs.to shareholders of record on February 15, 2024, payable on March 5, 2024. We expect to continue to make dividend payments to shareholders in 2024.
We may use additional holding company cash to repurchase additional shares or to repurchase our outstanding debt obligations. Such repurchases may be material, may be made for cash (funded by debt) and/or exchanges for other securities, and may be made in open market purchases (including through 10b5-1 plans), privately negotiated acquisitions or other transactions. In 2024, we expect share repurchase programs will remain our primary means of returning capital to shareholders. See "Overview-Capital" of this MD&A for a discussion of our share repurchase programs.
In 2022, we used $110.9 million to pay cash dividends to shareholders. On January 24, 2023, our Board of Directors declared a quarterly cash dividend of $0.10 per common share to shareholders of record on February 17, 2023, payable on March 2, 2023.
Our holding company cash and investments decreased $16 million, to $647 million as of December 31, 2022.
Significant cash and investments inflows at our holding company during the year:year were:
•$800600.0 million dividends received from MGIC,
•$94133.9 million intercompany tax receipts, and
MGIC Investment Corporation 2023 Form 10-K | 75
MGIC Investment Corporation and Subsidiaries
•$820.6 million of investment income.
Significant cash outflows at our holding company during the year:year were:
•$386337.2 million of net share repurchase transactions,
•$248 million of 5.75% Notes redemption,
•$121 million of 9% Debenture repurchases,
•$111122.9 million of cash dividends paid to shareholders, and
•$5335.1 million of interest payments on our 5.75% Notes, 5.25% Notes,outstanding debt obligations, and
•$28.6 million cash paid in lieu of issuing shares on the conversion of our 9% Debentures.
The net unrealized losses on our holding company investment portfolio were approximately $14.0$8.7 million at December 31, 20222023 and the portfolio had a modified duration of approximately 1.11.5 years.
Scheduled debt maturities beyond the next twelve months include $650 million of our 5.25% Notes in 2028 and $21.1 million of our 9% Debentures in 2063. The principal amount of the 9% Debentures is currently convertible, at the holder’s option, at a conversion rate, which is subject to adjustment, of 77.962 common shares per $1,000 principal amount of debentures. This represents a conversion price of approximately $12.83 per share. We may redeem the 9% Debentures in whole or in part from time to time, at our option, at a redemption price equal to 100% of the principal amount of the 9% Debentures being redeemed, plus any accrued and unpaid interest, if the closing sale price of our common stock exceeds $16.67 (adjusted pro rata for changes in the conversion price) for at least 20 of the 30 trading days preceding notice of the redemption. We expect to provide a redemption notice for the Debentures when this requirement is met and would expect the majority of the holders of the Debentures would elect to convert their Debentures into common stock before the redemption date. Under the terms of the Debenture, we may pay cash in lieu of issuing shares.2028.
See Note 7 – “Debt” to our consolidated financial statements for additional information about our long term debt. The description in Note 7 - “Debt" to our consolidated financial statements is qualified in its entirety by the terms of the notes and debentures. The terms of our 9% Debentures are contained in the Indenture dated as of March 28, 2008, between us and U.S. Bank National Association filed as an exhibit to our Form 10-Q filed with the SEC on May 12, 2008. The terms of our 5.25% Notes are contained in a Supplemental Indenture, dated as of August 12, 2020, between us and U.S. Bank National Association, as trustee, which is included as an exhibit to our 8-K filed with the SEC on August 12, 2020, and in the Indenture dated as of October 15, 2000 between us and the trustee.
Although not anticipated in the near term, we may also contribute funds to our insurance operations to comply with the PMIERs or the State Capital Requirements. See “Overview – Capital” above for a discussion of these requirements.
DEBT AT SUBSIDIARIES
MGIC did not have any outstanding debt obligations at December 31, 2023. MGIC is a member of the FHLB, which provides MGIC access to an additional source of liquidity viathrough a secured lending facility. In the first quarter of 2022, we prepaid the outstanding principal balance of $155.0 million onWe may borrow from the FHLB Advance and incurred a prepayment fee of $1.3 million.at any time.
Capital Adequacy
PMIERs
We operate under each of the GSE's PMIERs. Refer to "Overview - Capital - GSEs" of this MD&A for further discussion of PMIERs.
As of December 31, 2022,2023, MGIC’s Available Assets under the PMIERs totaled approximately $5.7$5.8 billion, an excess of approximately $2.3$2.4 billion over its Minimum Required Assets; and MGIC is in compliance with the requirements of the PMIERs and eligible to insure loans delivered to or purchased by the GSEs. Maintaining a sufficient level of excess Available Assets will allow MGIC to remain in compliance with the PMIERs financial requirements.
MGIC Investment Corporation 2022 Form 10-K | 72
MGIC Investment Corporation and Subsidiaries
The table below presents the PMIERS capital credit for our reinsurance transactions.
| | PMIERs - Reinsurance Credit | PMIERs - Reinsurance Credit | PMIERs - Reinsurance Credit |
| | | |
| | | | | December 31, | | December 31, |
| (In millions) | (In millions) | | 2022 | | 2021 | (In millions) | | 2023 | | 2022 |
| QSR Transactions | QSR Transactions | | $ | 1,228 | | | $ | 1,129 | |
| Home Re Transactions | Home Re Transactions | | 948 | | | 765 | |
| Traditional XOL Transactions | Traditional XOL Transactions | | 138 | | | — | |
| Total capital credit for Reinsurance Transactions | Total capital credit for Reinsurance Transactions | | $ | 2,314 | | | $ | 1,894 | |
Our 20232024 QSR transaction terms are generally comparable to our existing QSR transactions and will also provide PMIERs capital credit. Refer to Note 9 - "Reinsurance" to our consolidated financial statements for additional information on our reinsurance transactions.
The PMIERs generally require us to hold significantly more Minimum Required Assets for delinquent loans than for performing loans and the Minimum Required Assets required to be held increases as the number of payments missed on a delinquent loan increases. Refer to "Overview - Capital - GSEs" of this MD&A and our risk factor titled “We may not continue to meet the GSEs’ private mortgage insurer eligibility requirements and our returns may decrease if we are required to maintain more capital in order to maintain our eligibility” in Item 1A. for further discussion of PMIERs.
We plan to continuously comply with the PMIERs through our operational activities or through the contribution of funds from our holding company, subject to demands on the holding company's resources, as outlined above.
RISK-TO-CAPITAL
We compute our risk-to-capital ratio on a separate company statutory basis, as well as on a combined insurance operations basis. The risk-to-capital ratio is our net RIF divided by our policyholders’ position. Our net RIF includes both primary and pool RIF and excludes risk on policies that are currently in default and for which case loss reserves have been established and the risk covered by reinsurance. The risk amount includes pools of loans with contractual aggregate loss limits and without these limits. MGIC's policyholders’ position
MGIC Investment Corporation 2023 Form 10-K | 76
MGIC Investment Corporation and Subsidiaries
consists primarily of statutory policyholders’ surplus (which increases as a result of statutory net income and decreases as a result of statutory net loss and dividends paid), plus the statutory contingency reserve. The statutory contingency reserve is reported as a liability on the statutory balance sheet. A mortgage insurance company is required to make annual additions to a contingency reserve of approximately 50% of earned premiums. These contributions must generally be maintained for a period of ten years. However, with regulatory approval a mortgage insurance company may make early withdrawals from the contingency reserve when incurred losses exceed 35% of earned premiums in a calendar year.
The table below presents MGIC's risk-to-capital calculation.
| | Risk-to-capital - MGIC | Risk-to-capital - MGIC | Risk-to-capital - MGIC |
| | | |
| | | | | December 31, | | December 31, |
| (In millions, except ratio) | (In millions, except ratio) | | 2022 | | 2021 | (In millions, except ratio) | | 2023 | | 2022 |
RIF - net (1) | RIF - net (1) | | $ | 56,292 | | | $ | 50,298 | |
| Statutory policyholders' surplus | Statutory policyholders' surplus | | $ | 921 | | | $ | 1,217 | |
| Statutory contingency reserve | Statutory contingency reserve | | 4,597 | | | 4,056 | |
| Statutory policyholders' position | Statutory policyholders' position | | $ | 5,518 | | | $ | 5,273 | |
| Risk-to-capital | Risk-to-capital | | 10.2:1 | | 9.5:1 | Risk-to-capital | | 10.2:1 | | 10.2:1 |
(1)RIF – net, as shown in the table above, is net of reinsurance and exposure on policies currently delinquent ($1.6 billion at December 31, 2023 and $1.4 billion at December 31, 2022 and $1.8 billion at December 31, 20212022) and for which case loss reserves have been established.
The 2022 increase in MGIC's risk-to-capital was due to an increase in RIF, net of reinsurance, partially offset by an increase in our statutory policyholder's position. The increase in statutory policyholders' position was primarily due to an increase in statutory contingency reserves and net income during 2022,2023, offset by dividends paid to our holding company of $800$600 million. The increase in our RIF, net of reinsurance, was primarily due to an increase in our IIF and the termination of our 2015 and 2019 QSR Transaction, offset by a decrease in our reduction to risk on policies that are currently in default for which loss reserves have been established. Our risk-to-capital ratio will increase if the percentage increase in capital exceeds the percentage decrease in insured risk.
For additional information regarding regulatory capital see Note 14 – “Statutory Information” to our consolidated financial statements as well as our risk factor titled “State“State capital requirements may prevent us from continuing to write new insurance on an uninterrupted basis”basis” in Item 1A.
Financial Strength Ratings
| | | | | | | | | | | | | | | | | | | | |
| MGIC financial strength ratings | | MAC financial strength ratings |
| | | | | | |
| Rating Agency | Rating | Outlook |
| Rating Agency | Rating | Outlook |
| Moody's Investors Service | A3 | Stable | | A.M. Best | A- | Positive |
Standard and Poor's Rating Services(1) | BBB+A- | Stable | | | | |
| A.M. Best | A- | StablePositive | | | | |
| | | | | | | | |
MAC financial strength ratings(1)MGIC's Standard and Poor's Rating was upgraded to A- in January of 2024. |
| | |
Rating Agency | Rating | Outlook |
A.M. Best | A- | Stable |
For further information about the importance of MGIC’s ratings and rating methodologies, see our risk factor titled “Competition“Competition or changes in our relationships with our customers could reduce our revenues, reduce our premium yields and / or increase our losses”losses” in Item 1A.
MGIC Investment Corporation 20222023 Form 10-K | 7377
MGIC Investment Corporation and Subsidiaries
CRITICAL ACCOUNTING ESTIMATES
The accounting estimate described below requires significant judgments and estimates in the preparation of our consolidated financial statements.
LOSS RESERVES
The estimation of case loss reserves is subject to inherent uncertainty and requires significant judgement by management. Changes to our estimates could result in a material impact to our consolidated results and financial position, even in a stable economic environment.
Case Reserves
Case reserves are established for estimated insurance losses when notices of delinquency on insured mortgage loans are received. Such loans are referred to as being in our delinquency inventory. For reporting purposes, we consider a loan delinquent when it is two or more payments past due and has not become current or resulted in a claim payment. Even though the accounting standard, ASC 944, regarding accounting and reporting by insurance entities specifically excluded mortgage insurance from its guidance relating to loss reserves, we establish loss reserves using the general principles contained in the insurance standard. However, consistent with industry standards for mortgage insurers, we do not establish case loss reserves for future claims on insured loans which are not currently delinquent.
We establish reserves using estimated claim rates and claim severities in estimating the ultimate loss.
The estimated claim rates and claim severities are used to determine the amount we estimate will actually be paid on the delinquent loans as of the reserve date. If a policy is rescinded we do not expect that it will result in a claim payment and thus the rescission generally reduces the historical claim rate used in establishing reserves. In addition, if a loan cures its delinquency, including through a successful loan modification, the cure reduces the historical claim rate used in establishing reserves. To establish reserves, we utilize a reserving model that continually incorporates historical data into the estimated claim rate. The model also incorporates an estimate for the amount of the claim we will pay, or severity. The severity is estimated using the historical percentage of our claims paid compared to our loan exposures, as well as the RIF of the loans currently in default. We do not utilize an explicit rescission rate in our reserving methodology, but rather our reserving methodology incorporates the effects rescission activity has had on our historical claim rate and claim severities. We review recent trends in the claim rate, claim severity, levels of defaults by geography and average loan exposure. As a result, the process to determine reserves does not include quantitative ranges of outcomes that are reasonably likely to occur.
The claim rates and claim severities are affected by external events, including actual economic conditions such as changes in unemployment rates, interest rates or housing values, pandemics and natural disasters. Our estimation process does not include a correlation between claim rates and claim severities to projected economic conditions such as changes in unemployment rates, interest rates or housing values. Our experience is that analysis of that nature would not produce reliable results as the change in one economic condition cannot be isolated to determine its
specific effect on our ultimate paid losses because each economic condition is also influenced by other economic conditions. Additionally, the changes and interactions of these economic conditions are not likely homogeneous throughout the regions in which we conduct business. Each economic condition influences our ultimate paid losses differently, even if apparently similar in nature. Furthermore, changes in economic conditions may not necessarily be reflected in our loss development in the quarter or year in which the changes occur. Actual claim results generally lag changes in economic conditions by at least nine to twelve months.
Our estimates are also affected by any agreements we enter into regarding our claims paying practices as discussed in Note 17 – “Litigation and Contingencies” to our consolidated financial statements.
Our estimate of loss reserves is sensitive to changes in claim rate and claim severity; it is possible that even a relatively small change in our estimated claim rate or claim severity could have a material impact on reserves and, correspondingly, on our consolidated results of operations even in a stable economic environment. For example, as of December 31, 2022,2023, assuming all other factors remain constant, a $1,000 increase/decrease in the average claim severity reserve factor would change the reserve amount by approximately +/- $10$8 million. A one percentage point increase/decrease in the average claim rate reserve factor would change the reserve amount by approximately +/- $15$16 million.
MGIC Investment Corporation 2023 Form 10-K | 78
MGIC Investment Corporation and Subsidiaries
Historically, it has not been uncommon for us to experience variability in the development of the loss reserves through the end of the following year at this level or higher, as shown by the historical development of our loss reserves in the table below:
| | | | | | | | | | | | | | | | | |
| Historical development of loss reserves |
| | | | | |
| (In thousands) | | Losses incurred related to prior years (1) | | Reserve at end of prior year |
| 2022 | | (404,130) | | | 883,522 | |
| 2021 | | (60,015) | | | 880,537 | |
| 2020 | | 19,604 | | | 555,334 | |
| 2019 | | (71,006) | | | 674,019 | |
| 2018 | | (167,366) | | | 985,635 | |
| | | | |
| | | | | |
| | | | | |
| | | | | |
| | | | | | | | | | | | | | |
| Historical development of loss reserves |
| | | | |
| (In thousands) | | Losses incurred related to prior years (1) | | Reserve at end of prior year |
| 2023 | | (208,514) | | | 557,988 | |
| 2022 | | (404,130) | | | 883,522 | |
| 2021 | | (60,015) | | | 880,537 | |
| 2020 | | 19,604 | | | 555,334 | |
| 2019 | | (71,006) | | | 674,019 | |
| | | | |
| | | | |
| | | | |
| | | | |
(1)A negative number for a prior year indicates a redundancy of loss reserves. A positive number for a prior year indicates a deficiency of loss reserves.
MGIC Investment Corporation 20222023 Form 10-K | 7479
Item 7A. Quantitative and Qualitative Disclosures About Market Risk
Our investment portfolio is essentially a fixed income portfolio and is exposed to market risk. Important drivers of the market risk are credit spread risk and interest rate risk.
Credit spread risk is the risk that we will incur a loss due to adverse changes in credit spreads. Credit spread is the additional yield on fixed income securities above the risk-free rate (typically referenced as the yield on U.S. Treasury securities) that market participants require to compensate them for assuming credit, liquidity and/or prepayment risks.
We manage credit risk via our investment policy guidelines which primarily require us to place our investments in investment grade securities and limit the amount of our credit exposure to any one issue, issuer and type of instrument. Guideline and investment portfolio detail is available in "Business – Section C, Investment Portfolio" in Item 1.
Interest rate risk is the risk that we will incur a loss due to adverse changes in interest rates relative to the characteristics of our interest bearing assets.
One of the measures used to quantify this exposure is modified duration. Modified duration measures the price sensitivity of the assets to the changes in spreads. At December 31, 2022,2023, the modifiedeffective duration of our fixed income investment portfolio was 4.33.8 years, which means that an instantaneous parallel shift in the yield curve of 100 basis points would result in a change of 4.3%3.8% in the fair value of our fixed income portfolio. For an upward shift in the yield curve, the fair value of our portfolio would decrease and for a downward shift in the yield curve, the fair value would increase. A discussion of portfolio strategy appears in "Management's Discussion and Analysis – Balance Sheet Review– Investment Portfolio" in Item 7.
MGIC Investment Corporation 20222023 Form 10-K | 7580
Item 8. Financial Statements and Supplementary Data
The following consolidated financial statements are filed pursuant to this Item 8:
| | | | | | | | |
| Index to consolidated financial statements |
| | |
| Page No. |
Consolidated balance sheets at December 31, 20222023 and 20212022 | |
Consolidated statements of operations for each of the three years in the period ended December 31, 20222023 | |
Consolidated statements of comprehensive income for each of the three years in the period ended December 31, 20222023 | |
Consolidated statements of shareholders' equity for each of the three years in the period ended December 31, 20222023 | |
Consolidated statements of cash flows for each of the three years in the period ended December 31, 20222023 | |
| |
| |
| |
| |
| |
| |
| |
| |
| |
| |
| |
| |
| |
| |
| |
| |
| |
| |
| |
MGIC Investment Corporation 20222023 Form 10-K | 7681
| | | | | | | | | | | | | | | | | | | | |
| MGIC INVESTMENT CORPORATION AND SUBSIDIARIES |
| CONSOLIDATED BALANCE SHEETS |
|
| | | | December 31, |
| (In thousands) | | Note | | 2022 | | 2021 |
| Assets | | | | | | |
| Investment portfolio: | | | | | | |
| Fixed income, available-for-sale, at fair value (amortized cost, 2022 - $5,926,785; 2021 - $6,397,658) | | | | $ | 5,409,698 | | | $ | 6,587,581 | |
| Equity securities, at fair value (cost, 2022 - $15,924; 2021 - $15,838) | | | | 14,140 | | | 16,068 | |
| Other invested assets, at cost | | | | 850 | | | 3,100 | |
| Total investment portfolio | | | | 5,424,688 | | | 6,606,749 | |
| | | | | | |
| Cash and cash equivalents | | | | 327,384 | | | 284,690 | |
| Restricted cash and cash equivalents | | | | 5,529 | | | 20,268 | |
| Accrued investment income | | | | 55,178 | | | 51,902 | |
| Reinsurance recoverable on loss reserves | | | | 28,240 | | | 66,905 | |
| Reinsurance recoverable on paid losses | | | | 18,081 | | | 36,275 | |
| Premiums receivable | | | | 58,000 | | | 56,540 | |
| Home office and equipment, net | | | | 41,419 | | | 45,614 | |
| Deferred insurance policy acquisition costs | | | | 19,062 | | | 21,671 | |
| Deferred income taxes, net | | | | 124,769 | | | — | |
| Other assets | | | | 111,443 | | | 134,394 | |
| Total assets | | | | $ | 6,213,793 | | | $ | 7,325,008 | |
| | | | | | |
| Liabilities and shareholders' equity | | | | | | |
| Liabilities: | | | | | | |
| Loss reserves | | | | $ | 557,988 | | | $ | 883,522 | |
| Unearned premiums | | | | 195,289 | | | 241,690 | |
| Federal Home Loan Bank Advance | | | | — | | | 155,000 | |
| Senior notes | | | | 641,724 | | | 881,508 | |
| Convertible junior subordinated debentures | | | | 21,086 | | | 110,204 | |
| Other liabilities | | | | 154,966 | | | 191,702 | |
| Total liabilities | | | | 1,571,053 | | | 2,463,626 | |
| Contingencies | | | | | | |
| Shareholders' equity: | | | | | | |
| Common stock (one dollar par value, shares authorized 1,000,000; shares issued 2022 - 371,353; 2021 - 371,353; shares outstanding 2022 - 293,433; 2021 - 320,336) | | | | 371,353 | | | 371,353 | |
| Paid-in capital | | | | 1,798,842 | | | 1,794,906 | |
| Treasury stock at cost (shares 2022 - 77,920; 2021 - 51,017) | | | | (1,050,238) | | | (675,265) | |
| Accumulated other comprehensive (loss) income, net of tax | | | | (481,511) | | | 119,697 | |
| Retained earnings | | | | 4,004,294 | | | 3,250,691 | |
| Total shareholders' equity | | | | 4,642,740 | | | 4,861,382 | |
| Total liabilities and shareholders' equity | | | | $ | 6,213,793 | | | $ | 7,325,008 | |
See accompanying notes to consolidated financial statements.
MGIC Investment Corporation 2022 Form 10-K | 77
| | | | | | | | | | | | | | | | | | | | | | | | | | | | | |
| MGIC INVESTMENT CORPORATION AND SUBSIDIARIES | |
| CONSOLIDATED STATEMENTS OF OPERATIONS | |
| |
| | | | Years Ended December 31, | |
| (In thousands, except per share data) | | Note | | 2022 | | 2021 | | 2020 | |
| Revenues: | | | | | | | | | |
| Premiums written: | | | | | | | | | |
| Direct | | | | $ | 1,108,570 | | | $ | 1,123,117 | | | $ | 1,106,632 | | |
| Assumed | | | | 8,535 | | | 8,924 | | | 10,837 | | |
| Ceded | | | | (156,373) | | | (163,031) | | | (188,727) | | |
| Net premiums written | | | | 960,732 | | | 969,010 | | | 928,742 | | |
| Decrease (increase) in unearned premiums | | | | 46,401 | | | 45,409 | | | 93,201 | | |
| Net premiums earned | | | | 1,007,133 | | | 1,014,419 | | | 1,021,943 | | |
| | | | | | | | | |
| Investment income, net of expenses | | | | 167,476 | | | 156,438 | | | 154,396 | | |
| Net gains (losses) on investments and other financial instruments | | | | (7,463) | | | 5,861 | | (1) | 12,576 | | (1) |
| Other revenue | | | | 5,639 | | | 8,957 | | (1) | 10,231 | | (1) |
| Total revenues | | | | 1,172,785 | | | 1,185,675 | | | 1,199,146 | | |
| | | | | | | | | |
| Losses and expenses: | | | | | | | | | |
| Losses incurred, net | | | | (254,565) | | | 64,577 | | | 364,774 | | |
| Amortization of deferred policy acquisition costs | | | | 12,366 | | | 12,602 | | | 12,380 | | |
| Other underwriting and operating expenses, net | | | | 236,697 | | | 198,445 | | | 176,398 | | |
| Loss on debt extinguishment | | | | 40,199 | | | 36,914 | | | 26,736 | | |
| Interest expense | | | | 48,054 | | | 71,360 | | | 59,595 | | |
| Total losses and expenses | | | | 82,751 | | | 383,898 | | | 639,883 | | |
| Income before tax | | | | 1,090,034 | | | 801,777 | | | 559,263 | | |
| Provision for income taxes | | | | 224,685 | | | 166,794 | | | 113,170 | | |
| Net income | | | | $ | 865,349 | | | $ | 634,983 | | | $ | 446,093 | | |
| | | | | | | | | |
| Earnings per share: | | | | | | | | | |
| Basic | | | | $ | 2.83 | | | $ | 1.90 | | | $ | 1.31 | | |
| Diluted | | | | $ | 2.79 | | | $ | 1.85 | | | $ | 1.29 | | |
| | | | | | | | | |
| Weighted average common shares outstanding - basic | | | | 305,847 | | | 334,330 | | | 339,953 | | |
| Weighted average common shares outstanding - diluted | | | | 311,229 | | | 351,308 | | | 359,293 | | |
| | | | | | | | | |
| | | | | | | | | | | | | | | | | | | | | | | |
| MGIC INVESTMENT CORPORATION AND SUBSIDIARIES | |
| CONSOLIDATED BALANCE SHEETS | |
| |
| | | | December 31, | |
| (In thousands) | | Note | | 2023 | | 2022 | |
| Assets | | | | | | | |
| Investment portfolio: | | | | | | | |
| Fixed income, available-for-sale, at fair value (amortized cost 2023 - $5,939,483; 2022 - $5,859,688) | | | | $ | 5,601,540 | | | $ | 5,342,667 | | (1) |
| Short-term, fixed income, available-for-sale, at fair value (amortized cost 2023 - $121,539; 2022 - $67,097) | | | | 121,573 | | | 67,031 | | (1) |
| Equity securities, at fair value (cost, 2023 - $16,025; 2022 - $15,924) | | | | 14,771 | | | 14,140 | | |
| Other invested assets, at cost | | | | 850 | | | 850 | | |
| Total investment portfolio | | | | 5,738,734 | | | 5,424,688 | | |
| | | | | | | |
| Cash and cash equivalents | | | | 363,666 | | | 327,384 | | |
| Restricted cash and cash equivalents | | | | 6,978 | | | 5,529 | | |
| Accrued investment income | | | | 58,774 | | | 55,178 | | |
| Reinsurance recoverable on loss reserves | | | | 33,302 | | | 28,240 | | |
| Reinsurance recoverable on paid losses | | | | 9,896 | | | 18,081 | | |
| Premiums receivable | | | | 58,499 | | | 58,000 | | |
| Home office and equipment, net | | | | 38,755 | | | 41,419 | | |
| Deferred insurance policy acquisition costs | | | | 14,591 | | | 19,062 | | |
| Deferred income taxes, net | | | | 79,782 | | | 124,769 | | |
| Other assets | | | | 135,403 | | | 111,443 | | |
| Total assets | | | | $ | 6,538,380 | | | $ | 6,213,793 | | |
| | | | | | | |
| Liabilities and shareholders' equity | | | | | | | |
| Liabilities: | | | | | | | |
| Loss reserves | | | | $ | 505,379 | | | $ | 557,988 | | |
| Unearned premiums | | | | 157,779 | | | 195,289 | | |
| Senior notes | | | | 643,196 | | | 641,724 | | |
| Convertible junior subordinated debentures | | | | — | | | 21,086 | | |
| Other liabilities | | | | 160,009 | | | 154,966 | | |
| Total liabilities | | | | 1,466,363 | | | 1,571,053 | | |
| Contingencies | | | | | | | |
| Shareholders' equity: | | | | | | | |
| Common stock ($1.00 par value, shares authorized 1,000,000; shares issued 2023 - 371,353; 2022 - 371,353; shares outstanding 2023 - 272,494; 2022 - 293,433) | | | | 371,353 | | | 371,353 | | |
| Paid-in capital | | | | 1,808,113 | | | 1,798,842 | | |
| Treasury stock at cost (shares 2023 - 98,859; 2022 - 77,920) | | | | (1,384,293) | | | (1,050,238) | | |
| Accumulated other comprehensive income (loss), net of tax | | | | (316,281) | | | (481,511) | | |
| Retained earnings | | | | 4,593,125 | | | 4,004,294 | | |
| Total shareholders' equity | | | | 5,072,017 | | | 4,642,740 | | |
| Total liabilities and shareholders' equity | | | | $ | 6,538,380 | | | $ | 6,213,793 | | |
(1) Certain amounts have been reclassified to conform with current year presentation
See accompanying notes to consolidated financial statements.
MGIC Investment Corporation 20222023 Form 10-K | 7882
| | | | | | | | | | | | | | | | | | | | | | | | | | | | | |
| MGIC INVESTMENT CORPORATION AND SUBSIDIARIES | |
| CONSOLIDATED STATEMENTS OF OPERATIONS | |
| |
| | | | Years Ended December 31, | |
| (In thousands, except per share data) | | Note | | 2023 | | 2022 | | 2021 | |
| Revenues: | | | | | | | | | |
| Premiums written: | | | | | | | | | |
| Direct | | | | $ | 1,105,027 | | | $ | 1,108,570 | | | $ | 1,123,117 | | |
| Assumed | | | | 12,835 | | | 8,535 | | | 8,924 | | |
| Ceded | | | | (202,821) | | | (156,373) | | | (163,031) | | |
| Net premiums written | | | | 915,041 | | | 960,732 | | | 969,010 | | |
| Decrease (increase) in unearned premiums | | | | 37,510 | | | 46,401 | | | 45,409 | | |
| Net premiums earned | | | | 952,551 | | | 1,007,133 | | | 1,014,419 | | |
| | | | | | | | | |
| Investment income, net of expenses | | | | 214,740 | | | 167,476 | | | 156,438 | | |
| Net gains (losses) on investments and other financial instruments | | | | (14,141) | | | (7,463) | | | 5,861 | | |
| Other revenue | | | | 1,952 | | | 5,639 | | | 8,957 | | |
| Total revenues | | | | 1,155,102 | | | 1,172,785 | | | 1,185,675 | | |
| | | | | | | | | |
| Losses and expenses: | | | | | | | | | |
| Losses incurred, net | | | | (20,856) | | | (254,565) | | | 64,577 | | |
| Amortization of deferred insurance policy acquisition costs | | | | 10,820 | | | 12,366 | | | 12,602 | | |
| Other underwriting and operating expenses, net | | | | 226,004 | | | 236,697 | | | 198,445 | | |
| Loss on debt extinguishment | | | | — | | | 40,199 | | | 36,914 | | |
| Interest expense | | | | 36,905 | | | 48,054 | | | 71,360 | | |
| Total losses and expenses | | | | 252,873 | | | 82,751 | | | 383,898 | | |
| Income before tax | | | | 902,229 | | | 1,090,034 | | | 801,777 | | |
| Provision for income taxes | | | | 189,280 | | | 224,685 | | | 166,794 | | |
| Net income | | | | $ | 712,949 | | | $ | 865,349 | | | $ | 634,983 | | |
| | | | | | | | | |
| Earnings per share: | | | | | | | | | |
| Basic | | | | $ | 2.51 | | | $ | 2.83 | | | $ | 1.90 | | |
| Diluted | | | | $ | 2.49 | | | $ | 2.79 | | | $ | 1.85 | | |
| | | | | | | | | |
| Weighted average common shares outstanding - basic | | | | 283,605 | | | 305,847 | | | 334,330 | | |
| Weighted average common shares outstanding - diluted | | | | 287,155 | | | 311,229 | | | 351,308 | | |
| | | | | | | | | |
| | | | | | | | | | | | | | | | | | | | | | | | | | |
| MGIC INVESTMENT CORPORATION AND SUBSIDIARIES |
| CONSOLIDATED STATEMENTS OF COMPREHENSIVE INCOME |
|
| | | | Years Ended December 31, |
| (In thousands) | | Note | | 2022 | | 2021 | | 2020 |
| Net income | | | | $ | 865,349 | | | $ | 634,983 | | | $ | 446,093 | |
| Other comprehensive income (loss), net of tax: | | | | | | | | |
| Change in unrealized investment gains and losses | | 5/10 | | (558,534) | | | (122,099) | | | 133,616 | |
| Benefit plans adjustment | | | | (42,674) | | | 24,975 | | | 10,497 | |
| | | | | | | | |
| Other comprehensive income (loss), net of tax | | | | (601,208) | | | (97,124) | | | 144,113 | |
| Comprehensive income | | | | $ | 264,141 | | | $ | 537,859 | | | $ | 590,206 | |
See accompanying notes to consolidated financial statements.
MGIC Investment Corporation 20222023 Form 10-K | 7983
| | | | | | | | | | | | | | | | | | | | | | | | | | |
| MGIC INVESTMENT CORPORATION AND SUBSIDIARIES |
| CONSOLIDATED STATEMENTS OF SHAREHOLDERS' EQUITY |
|
| | | | | Years Ended December 31, |
| (In thousands) | | Note | | 2022 | | 2021 | | 2020 |
| Common stock | | | | | | | | |
| | | | | | | | |
| | | | | | | | |
| | | | | | | | |
| Balance, beginning and end of year | | | | 371,353 | | | 371,353 | | | 371,353 | |
| | | | | | | | |
| Paid-in capital | | | | | | | | |
| Balance, beginning of year | | | | 1,794,906 | | | 1,862,042 | | | 1,869,719 | |
| Cumulative effect of debt with conversion options accounting standards update | | | | — | | | (68,289) | | | — | |
| Balance, beginning of period, as adjusted | | | | 1,794,906 | | | 1,793,753 | | | 1,869,719 | |
| | | | | | | | |
| | | | | | | | |
| Reacquisition of convertible junior subordinated debentures-equity component | | | | — | | | — | | | (2,673) | |
| | | | | | | | |
| Reissuance of treasury stock, net under share-based compensation plans | | | | (20,835) | | | (15,956) | | | (18,807) | |
| | | | | | | | |
| Equity compensation | | | | 24,771 | | | 17,109 | | | 13,803 | |
| Balance, end of year | | | | 1,798,842 | | | 1,794,906 | | | 1,862,042 | |
| | | | | | | | |
| Treasury stock | | | | | | | | |
| Balance, beginning of year | | | | (675,265) | | | (393,326) | | | (283,196) | |
| Purchases of common stock | | | | (385,714) | | | (290,818) | | | (119,997) | |
| | | | | | | | |
| Reissuance of treasury stock, net under share-based compensation plans | | | | 10,741 | | | 8,879 | | | 9,867 | |
| Balance, end of year | | | | (1,050,238) | | | (675,265) | | | (393,326) | |
| | | | | | | | |
| Accumulated other comprehensive income (loss) | | | | | | | | |
| Balance, beginning of year | | | | 119,697 | | | 216,821 | | | 72,708 | |
| | | | | | | | |
| Other comprehensive (loss) income | | | | (601,208) | | | (97,124) | | | 144,113 | |
| | | | | | | | |
| Balance, end of year | | | | (481,511) | | | 119,697 | | | 216,821 | |
| | | | | | | | |
| Retained earnings | | | | | | | | |
| Balance, beginning of year | | | | 3,250,691 | | | 2,642,096 | | | 2,278,650 | |
| Cumulative effect of debt with conversion options accounting standards update | | | | — | | | 68,289 | | | — | |
| Balance, beginning of period, as adjusted | | | | 3,250,691 | | | 2,710,385 | | | 2,278,650 | |
| | | | | | | | |
| | | | | | | | |
| Net income | | | | 865,349 | | | 634,983 | | | 446,093 | |
| Cash dividends | | | | (111,746) | | | (94,677) | | | (82,647) | |
| | | | | | | | |
| | | | | | | | |
| Balance, end of year | | | | 4,004,294 | | | 3,250,691 | | | 2,642,096 | |
| | | | | | | | |
| Total shareholders' equity | | | | $ | 4,642,740 | | | $ | 4,861,382 | | | $ | 4,698,986 | |
| | | | | | | | | | | | | | | | | | | | | | | | | | |
| MGIC INVESTMENT CORPORATION AND SUBSIDIARIES |
| CONSOLIDATED STATEMENTS OF COMPREHENSIVE INCOME |
|
| | | | Years Ended December 31, |
| (In thousands) | | Note | | 2023 | | 2022 | | 2021 |
| Net income | | | | $ | 712,949 | | | $ | 865,349 | | | $ | 634,983 | |
| Other comprehensive income (loss), net of tax: | | | | | | | | |
| Change in unrealized investment gains and losses | | 5 | | 141,548 | | | (558,534) | | | (122,099) | |
| Benefit plans adjustment | | | | 23,682 | | | (42,674) | | | 24,975 | |
| | | | | | | | |
| Other comprehensive income (loss), net of tax | | | | 165,230 | | | (601,208) | | | (97,124) | |
| Comprehensive income | | | | $ | 878,179 | | | $ | 264,141 | | | $ | 537,859 | |
See accompanying notes to consolidated financial statements.
MGIC Investment Corporation 20222023 Form 10-K | 8084
| | | | | | | | | | | | | | | | | | | | |
| MGIC INVESTMENT CORPORATION AND SUBSIDIARIES |
| CONSOLIDATED STATEMENTS OF CASH FLOWS |
| | | | | | |
| | Years Ended December 31, |
| (In thousands) | | 2022 | | 2021 | | 2020 |
| Cash flows from operating activities: | | | | | | |
| Net income | | $ | 865,349 | | | $ | 634,983 | | | $ | 446,093 | |
| Adjustments to reconcile net income to net cash provided by operating activities: | | | | | | |
| Depreciation and other amortization | | 54,252 | | | 66,014 | | | 57,812 | |
| Deferred tax expense (benefit) | | (4,367) | | | 5,188 | | | 27,475 | |
| Equity compensation | | 24,771 | | | 17,109 | | | 13,803 | |
| Loss on debt extinguishment | | 40,199 | | | 36,914 | | | 26,736 | |
| Net (gains) losses on investments and other financial instruments | | 7,463 | | | (5,861) | | | (12,576) | |
| Change in certain assets and liabilities: | | | | | | |
| Accrued investment income | | (3,276) | | | (1,905) | | | (292) | |
| Reinsurance recoverable on loss reserves | | 38,665 | | | 28,137 | | | (73,401) | |
| Reinsurance recoverable on paid losses | | 18,194 | | | (35,606) | | | 852 | |
| Premiums receivable | | (1,460) | | | (496) | | | (457) | |
| Deferred insurance policy acquisition costs | | 2,609 | | | (110) | | | (3,030) | |
| Profit commission receivable | | 4,724 | | | (19,245) | | | 4,586 | |
| Loss reserves | | (325,534) | | | 2,985 | | | 325,203 | |
| Unearned premiums | | (46,401) | | | (45,409) | | | (93,203) | |
| Return premium accrual | | (11,800) | | | 7,200 | | | (500) | |
| Current income taxes | | (8,549) | | | 5,429 | | | 6,271 | |
| Other, net | | (4,827) | | | 990 | | | 6,937 | |
| Net cash provided by operating activities | | 650,012 | | | 696,317 | | | 732,309 | |
| Cash flows from investing activities: | | | | | | |
| Purchases of investments | | (674,406) | | | (1,531,129) | | | (2,636,972) | |
| Proceeds from sales of investments | | 399,661 | | | 473,904 | | | 836,851 | |
| Proceeds from maturity of fixed income securities | | 688,484 | | | 900,591 | | | 1,030,926 | |
| | | | | | |
| Additions to property and equipment | | (3,254) | | | (4,115) | | | (3,311) | |
| Net cash provided by (used in) investing activities | | 410,485 | | | (160,749) | | | (772,506) | |
| Cash flows from financing activities: | | | | | | |
| Proceeds from issuance of senior notes | | — | | | — | | | 640,250 | |
| Purchase of senior notes | | — | | | — | | | (179,735) | |
| Payment of original issue discount - senior notes | | — | | | — | | | (2,969) | |
| Purchase of convertible junior subordinated debentures | | (89,118) | | | (98,610) | | | (36,392) | |
| Payment of original issue discount- convertible junior subordinated debentures | | — | | | — | | | (15,049) | |
| Redemption of 5.75% senior notes | | (242,296) | | | — | | | — | |
| Repayment of FHLB advance | | (155,000) | | | — | | | — | |
| Cash portion of loss on debt extinguishment | | (39,514) | | | (36,914) | | | (25,266) | |
| Repurchase of common stock | | (385,573) | | | (290,818) | | | (119,997) | |
| Dividends paid | | (110,947) | | | (94,219) | | | (82,061) | |
| Payment of debt issuance costs | | — | | | — | | | (2,020) | |
| Payment of withholding taxes related to share-based compensation net share settlement | | (10,094) | | | (6,729) | | | (8,940) | |
| Net cash (used in) provided by financing activities | | (1,032,542) | | | (527,290) | | | 167,821 | |
| Net increase in cash and cash equivalents and restricted cash and cash equivalents | | 27,955 | | | 8,278 | | | 127,624 | |
| Cash and cash equivalents and restricted cash and cash equivalents at beginning of year | | 304,958 | | | 296,680 | | | 169,056 | |
| Cash and cash equivalents and restricted cash and cash equivalents at end of year | | $ | 332,913 | | | $ | 304,958 | | | $ | 296,680 | |
| | | | | | | | | | | | | | | | | | | | | | | | | | |
| MGIC INVESTMENT CORPORATION AND SUBSIDIARIES |
| CONSOLIDATED STATEMENTS OF SHAREHOLDERS' EQUITY |
|
| | | | | Years Ended December 31, |
| (In thousands) | | Note | | 2023 | | 2022 | | 2021 |
| Common stock | | | | | | | | |
| | | | | | | | |
| | | | | | | | |
| | | | | | | | |
| Balance, beginning and end of year | | | | 371,353 | | | 371,353 | | | 371,353 | |
| | | | | | | | |
| Paid-in capital | | | | | | | | |
| Balance, beginning of year | | | | 1,798,842 | | | 1,794,906 | | | 1,862,042 | |
| Cumulative effect of debt with conversion options accounting standards update | | | | — | | | — | | | (68,289) | |
| Balance, beginning of period, as adjusted | | | | 1,798,842 | | | 1,794,906 | | | 1,793,753 | |
| | | | | | | | |
| | | | | | | | |
| Conversion of 9% Debentures, net of tax | | 7 | | (5,315) | | | — | | | — | |
| | | | | | | | |
| Reissuance of treasury stock, net under share-based compensation plans | | | | (17,021) | | | (20,835) | | | (15,956) | |
| | | | | | | | |
| Equity compensation | | | | 31,607 | | | 24,771 | | | 17,109 | |
| Balance, end of year | | | | 1,808,113 | | | 1,798,842 | | | 1,794,906 | |
| | | | | | | | |
| Treasury stock | | | | | | | | |
| Balance, beginning of year | | | | (1,050,238) | | | (675,265) | | | (393,326) | |
| Purchases of common stock | | | | (343,819) | | | (385,714) | | | (290,818) | |
| | | | | | | | |
| Reissuance of treasury stock, net under share-based compensation plans | | | | 9,764 | | | 10,741 | | | 8,879 | |
| Balance, end of year | | | | (1,384,293) | | | (1,050,238) | | | (675,265) | |
| | | | | | | | |
| Accumulated other comprehensive income (loss) | | | | | | | | |
| Balance, beginning of year | | | | (481,511) | | | 119,697 | | | 216,821 | |
| | | | | | | | |
| Other comprehensive income (loss) | | | | 165,230 | | | (601,208) | | | (97,124) | |
| | | | | | | | |
| Balance, end of year | | | | (316,281) | | | (481,511) | | | 119,697 | |
| | | | | | | | |
| Retained earnings | | | | | | | | |
| Balance, beginning of year | | | | 4,004,294 | | | 3,250,691 | | | 2,642,096 | |
| Cumulative effect of debt with conversion options accounting standards update | | | | — | | | — | | | 68,289 | |
| Balance, beginning of period, as adjusted | | | | 4,004,294 | | | 3,250,691 | | | 2,710,385 | |
| | | | | | | | |
| | | | | | | | |
| Net income | | | | 712,949 | | | 865,349 | | | 634,983 | |
| Cash dividends | | | | (124,118) | | | (111,746) | | | (94,677) | |
| | | | | | | | |
| | | | | | | | |
| Balance, end of year | | | | 4,593,125 | | | 4,004,294 | | | 3,250,691 | |
| | | | | | | | |
| Total shareholders' equity | | | | $ | 5,072,017 | | | $ | 4,642,740 | | | $ | 4,861,382 | |
See accompanying notes to consolidated financial statements.
MGIC Investment Corporation 20222023 Form 10-K | 8185
| | | | | | | | | | | | | | | | | | | | |
| MGIC INVESTMENT CORPORATION AND SUBSIDIARIES |
| CONSOLIDATED STATEMENTS OF CASH FLOWS |
| | | | | | |
| | Years Ended December 31, |
| (In thousands) | | 2023 | | 2022 | | 2021 |
| Cash flows from operating activities: | | | | | | |
| Net income | | $ | 712,949 | | | $ | 865,349 | | | $ | 634,983 | |
| Adjustments to reconcile net income to net cash provided by operating activities: | | | | | | |
| Depreciation and other amortization | | 35,230 | | | 54,252 | | | 66,014 | |
| Deferred tax expense (benefit) | | 1,065 | | | (4,367) | | | 5,188 | |
| Equity compensation | | 31,607 | | | 24,771 | | | 17,109 | |
| Loss on debt extinguishment | | — | | | 40,199 | | | 36,914 | |
| Net (gains) losses on investments and other financial instruments | | 14,141 | | | 7,463 | | | (5,861) | |
| Change in certain assets and liabilities: | | | | | | |
| Accrued investment income | | (3,596) | | | (3,276) | | | (1,905) | |
| Reinsurance recoverable on loss reserves | | (5,062) | | | 38,665 | | | 28,137 | |
| Reinsurance recoverable on paid losses | | 8,185 | | | 18,194 | | | (35,606) | |
| Premiums receivable | | (499) | | | (1,460) | | | (496) | |
| Deferred insurance policy acquisition costs | | 4,471 | | | 2,609 | | | (110) | |
| Profit commission receivable | | 5,108 | | | 4,724 | | | (19,245) | |
| Loss reserves | | (52,609) | | | (325,534) | | | 2,985 | |
| Unearned premiums | | (37,510) | | | (46,401) | | | (45,409) | |
| Return premium accrual | | (4,400) | | | (11,800) | | | 7,200 | |
| Current income taxes | | (4,143) | | | (8,549) | | | 5,429 | |
| Other, net | | 8,025 | | | (4,827) | | | 990 | |
| Net cash provided by operating activities | | 712,962 | | | 650,012 | | | 696,317 | |
| Cash flows from investing activities: | | | | | | |
| Purchases of investments | | (1,469,540) | | | (674,406) | | | (1,531,129) | |
| Proceeds from sales of investments | | 376,598 | | | 399,661 | | | 473,904 | |
| Proceeds from maturity of fixed income securities | | 913,415 | | | 688,484 | | | 900,591 | |
| | | | | | |
| Proceeds from sale of property and equipment | | 2,336 | | | — | | | — | |
| Additions to property and equipment | | (1,999) | | | (3,254) | | | (4,115) | |
| Net cash (used in) provided by investing activities | | (179,190) | | | 410,485 | | | (160,749) | |
| Cash flows from financing activities: | | | | | | |
| | | | | | |
| | | | | | |
| | | | | | |
| Conversion / purchase of convertible junior subordinated debentures | | (28,637) | | | (89,118) | | | (98,610) | |
| | | | | | |
| Redemption of 5.75% senior notes | | — | | | (242,296) | | | — | |
| Repayment of FHLB advance | | — | | | (155,000) | | | — | |
| Cash portion of loss on debt extinguishment | | — | | | (39,514) | | | (36,914) | |
| Repurchase of common stock | | (337,182) | | | (385,573) | | | (290,818) | |
| Dividends paid | | (122,965) | | | (110,947) | | | (94,219) | |
| | | | | | |
| Payment of withholding taxes related to share-based compensation net share settlement | | (7,257) | | | (10,094) | | | (6,729) | |
| Net cash used in financing activities | | (496,041) | | | (1,032,542) | | | (527,290) | |
| Net increase in cash and cash equivalents and restricted cash and cash equivalents | | 37,731 | | | 27,955 | | | 8,278 | |
| Cash and cash equivalents and restricted cash and cash equivalents at beginning of year | | 332,913 | | | 304,958 | | | 296,680 | |
| Cash and cash equivalents and restricted cash and cash equivalents at end of year | | $ | 370,644 | | | $ | 332,913 | | | $ | 304,958 | |
See accompanying notes to consolidated financial statements.
MGIC Investment Corporation 2023 Form 10-K | 86
MGIC Investment Corporation and Subsidiaries
| | | | | | | | |
NOTE 1 | | Note 1. Nature of Business |
MGIC Investment Corporation is a holding company which, through Mortgage Guaranty Insurance Corporation ("MGIC"), is principally engaged in the mortgage insurance business. We provide mortgage insurance to lenders throughout the United States and to government sponsored entities to protect against loss from defaults on low down payment residential mortgage loans. Primary mortgage insurance provides mortgage default protection on individual loans and covers a percentage of the unpaid loan principal, delinquent interest and certain expenses associated with the default and subsequent foreclosure or sale approved by us, of the underlying property. MGIC Assurance Corporation ("MAC") and MGIC Indemnity Corporation ("MIC"), insurance subsidiaries of MGIC, provide insurance for certain mortgages under Fannie Mae and Freddie Mac (the "GSEs") credit risk transfer programs.
Through certain non-insurance subsidiaries, we also provide certain services for the mortgage finance industry, such as contract underwriting.
At December 31, 2022,2023, our direct primary insurance in force ("IIF") was $295.3$293.5 billion, which represents the unpaid principal balance in our records of all mortgage loans that we insure, as reported to us, and our direct primary risk in force ("RIF") was $76.5$77.2 billion, which represents the IIF multiplied by the insurance coverage percentage.
The substantial majority of our NIWnew insurance written ("NIW") is for loans purchased by the GSEs. The current private mortgage insurer eligibility requirements ("PMIERs") of the GSEs include financial requirements, as well as business, quality control and certain transactional approval requirements. The financial requirements of the PMIERs require a mortgage insurer’s "Available Assets" (generally only the most liquid assets of an insurer) to equal or exceed its "Minimum Required Assets" (which are based on an insurer's book of risk in force, calculated from tables of factors with several risk dimensions). Based on our application of the PMIERs, as of December 31, 2022,2023, MGIC’s Available Assets are in excess of its Minimum Required Assets; and MGIC is in compliance with the PMIERs and eligible to insure loans purchased by the GSEs.
The COVID-19 pandemic materially impacted our 2020 financial resultsThrough certain non-insurance subsidiaries, we also provide certain services for the mortgage finance industry, such as we reserved for losses associated with the increased delinquency inventory. Through December 31, 2022 the vast majority of those delinquency notices have cured resulting in favorable loss reserve development. We have addressed the impacts of COVID-19 throughout this document.contract underwriting.
| | | | | | | | |
NOTE 2 | | Note 2. Basis of Presentation |
BASIS OF PRESENTATION
The accompanying consolidated financial statements have been prepared in accordance with accounting principles generally accepted in the United States of America ("GAAP"), as codified in the Accounting Standards Codification ("ASC"). Our consolidated financial statements include the accounts of MGIC Investment Corporation and its majority-owned subsidiaries. Intercompany transactions and balances have been eliminated. In accordance with GAAP, we are required to make estimates and assumptions that affect the reported amounts of assets and liabilities and disclosure of contingent assets and liabilities at the date of the consolidated financial statements and the reported amounts of revenues and expenses during the reporting periods. Actual results could differ from those estimates.
SUBSEQUENT EVENTS
We have considered subsequent events through the date of this filing.
MGIC Investment Corporation 20222023 Form 10-K | 8287
MGIC Investment Corporation and Subsidiaries
| | | | | | | | |
NOTE 3 | | Significant Accounting Policies |
CASH AND CASH EQUIVALENTS
We consider money market funds and investments with original maturities of three months or less to be cash equivalents.
RESTRICTED CASH AND CASH EQUIVALENTS
Restricted cash and cash equivalents consists of cash and money market funds held in trusts for the benefit of contractual counterparties under reinsurance agreements or for other contractual restrictions.
FAIR VALUE MEASUREMENTS
We carry certain financial instruments at fair value and disclose the fair value of all financial instruments. Our financial instruments carried at fair value are predominantly measured on a recurring basis. Financial instruments measured on a nonrecurring basis are subject to fair value adjustments only in certain circumstances (for example, when there is evidence of impairment).
The fair value of an asset or liability is defined as the price that would be received upon a sale of an asset, or paid to transfer a liability, in an orderly transaction between market participants at the measurement date. Fair value is based on quoted market prices or inputs, where available. If prices or quotes are not available, fair value is based on valuation models or other valuation techniques that consider relevant transaction characteristics (such as maturity) and use as inputs observable or unobservable market parameters including yield curves, interest rates, volatilities, equity or debt prices, and credit curves. Valuation adjustments may be made to ensure that financial instruments are recorded at fair value, as described below.
For the years endedAs of December 31, 2022, 2021,2023 and 2020,2022, we did not elect to measure any financial instruments acquired, or issued, such as our outstanding debt obligations, at fair value for which the primary basis of accounting is not fair value.
Valuation process
We use independent pricing sources to determine the fair value of a substantial majority of our financial instruments, which primarily consist of assets in our investment portfolio, but also includes cash and cash equivalents and restricted cash and cash equivalents. A variety of inputs are used; in approximate order of priority, they are: benchmark yields, reported trades, broker/dealer quotes, issuer spreads, two-sided markets, benchmark securities, bids, offers, and reference data including market research publications.
Market indicators, industry, and economic events are also considered.
The inputs listed above are evaluated using a multidimensional pricing model. This model combines all inputs to arrive at a value assigned to each security. Quality controls are performed by the independent pricing sources throughout this process, which include reviewing tolerance reports, trading information, data changes, and directional moves compared to market moves.
On a quarterly basis, we perform quality controls over values received from the pricing sources which also include reviewing tolerance reports, data changes, and directional moves compared
to market moves. We have not made any adjustments to the prices obtained from the independent pricing sources.
Valuation hierarchy
A three-level valuation hierarchy has been established under GAAP for disclosure of fair value measurements. The valuation hierarchy is based on the transparency of inputs to the valuation of a financial instrument as of the measurement date. To determine the fair value of securities available-for-sale in Level 1 and Level 2 of the fair value hierarchy, independent pricing sources, as described below, have been utilized. One price is provided per security based on observable market data. To ensure securities are appropriately classified in the fair value hierarchy, we review the pricing techniques and methodologies of the independent pricing sources and believe that their policies adequately consider market activity, either based on specific transactions for the issue valued or based on modeling of securities with similar credit quality, duration, yield and structure that were recently traded.
The three levels are defined as follows:
| | | | | | | | |
| è | Level 1 | Quoted prices for identical instruments in active markets that we can access. Financial assets using Level 1 inputs primarily include U.S. Treasury securities, money market funds, treasury bills, and certain equity securities. |
| | | | | | | | |
| è | Level 2 | Quoted prices for similar instruments in active markets that we can access; quoted prices for identical or similar instruments in markets that are not active; and inputs, other than quoted prices, that are observable in the marketplace for the instrument. The observable inputs are used in valuation models to calculate the fair value of the instruments. Financial assets using Level 2 inputs primarily include obligations of U.S. government corporations and agencies, corporate bonds, mortgage-backed securities, asset-backed securities, most municipal bonds, and commercial paper.
The independent pricing sources used for our Level 2 investments vary by type of investment. See Note 6 - "Fair Value Measurements" for further information. |
MGIC Investment Corporation 2023 Form 10-K | 88
MGIC Investment Corporation and Subsidiaries
| | | | | | | | |
| è | Level 3 | Valuations derived from valuation techniques in which one or more significant inputs or value drivers are unobservable or, from par values due to restrictions on certain securities that require them to be redeemed or sold only to the security issuer at par value.unobservable. The inputs used to derive the fair value of Level 3 securities reflect our own assumptions about the assumptions a market participant would use in pricing an asset or liability. Our non-financial assets that are classified as Level 3 securities consist of real estate acquired through claim settlement and embedded derivatives related to our Home Re Transactions. The fair value of real estate acquired is the lower of our acquisition cost or a percentage of the appraised value. The percentage applied to the appraised value is based upon our historical sales experience adjusted for current trends. The fair value of our embedded derivatives reflects the present value impact of the variation in investment income on the assets held by the reinsurance trusts and the contractual reference rate on Home Re Transactions used to calculate the reinsurance premiums we estimate we will pay over the estimated remaining life. |
MGIC Investment Corporation 2022 Form 10-K | 83
MGIC Investment Corporation and Subsidiaries
INVESTMENTS
Fixed income securities. Our fixed income securities are classified as available-for-sale and are reported at fair value. Fixed income securities with original maturities less than one year and greater than three months are classified as short-term on our consolidated balance sheet. The related unrealized investment gains or losses are, after considering the related tax expense or benefit, recognized as a component of accumulated other comprehensive income (loss) in shareholders' equity. Realized investment gains and losses on fixed income securities are reported in income based upon specific identification of securities. Any changes in the credit allowance are also be reported in incomesecurities within "Net gains (losses) on investments and other financial instruments" on the consolidated statement of operations.operations, along with any changes in the credit allowance.
Equity securities. Equity securities are reported at fair value, except for certain securities that are carried at cost. Equity securities carried at cost are reported as Other invested assets. Realized investment gains and losses on equity securities are reported in income based upon specific identification of securities sold. Any change in fair value of equity securities are also be reported in incomesold within "Net gains (losses) on investments and other financial instruments" on the consolidated statement of operations. .operations, along with any changes in the fair value.
Other invested assets. Other invested assets are carried at cost. These assets represent our investment in Federal Home Loan Bank of Chicago ("FHLB") stock, which due to restrictions, is required to be redeemed or sold only to the security issuer at par value.
Accrued Investment Income. We report accrued investment income separately from securities. Accrued investment income is written off through net realized investment gains (losses) if, and at the time, the issuer of the security defaults or is expected to default on payments.
Unrealized losses and allowance for credit losses
Each quarter we determine whether securities in an unrealized loss position are impaired by considering several factors including, but not limited to:
| | | | | |
| è | our intent to sell the security or whether it is more likely than not that we will be required to sell the security before recovery of its amortized cost basis; |
| è | the present value of the discounted cash flows we expect to collect compared to the amortized cost basis of the security; |
| è | failure of the issuer to make scheduled interest or principal payments; |
| è | a change in rating to below investment grade; and |
| è | adverse conditions specifically related to the security, an industry, or a geographic area. |
Based on our evaluation, we will record a realized lossan impairment on an impaireda security if we intend to sell, if it is more likely than not that we will be required to sell it prior to recovery of its amortized cost basis, or if the present value of the discounted cash flows we expect to collect is less than the amortized cost basis of the security.
When a security is considered to be impaired, but when a sale is not intended or is not likely, the loss is separated into the portion that represents the credit loss and the portion that is due to other factors. A credit loss is recorded, subject to reversal, in the consolidated statement of operations within "Net gains (losses) on investments and other financial instruments." The loss due to other factors is recognized in accumulated other comprehensive loss, net of taxes. A credit loss is determined to exist if the present value of the discounted cash flows, using the security’s original yield, expected to be collected from the security is less than the cost basis of the security.
HOME OFFICE AND EQUIPMENT
Home office and equipment is carried at cost net of depreciation. For financial reporting purposes, depreciation is determined on a straight-line basis for the home office and equipment over estimated lives ranging from 3 to 45 years. For income tax purposes, we use accelerated depreciation methods.
Home office and equipment is shown net of accumulated depreciation of $57.1 million, $55.4$59.2 million and $51.2$57.1 million as of December 31, 2022, 20212023 and 2020,2022, respectively. Depreciation expense for the years ended December 31, 2023, 2022 and 2021 and 2020 was $4.6 million, $4.9 million $5.6 million and $6.3$5.6 million, respectively.
MGIC Investment Corporation 2023 Form 10-K | 89
MGIC Investment Corporation and Subsidiaries
DEFERRED INSURANCE POLICY ACQUISITION COSTS
Costs directly associated with the successful acquisition of mortgage insurance business, consisting of employee compensation and other policy issuance and underwriting expenses, are initially deferred and reported as deferred insurance policy acquisition costs ("DAC"). The deferred costs are reported net of any ceding commissions received associated with our reinsurance agreements.transactions. For each underwriting year of business, these costs are amortized to income in proportion to estimated gross profits over the estimated life of the policies. We do not utilize anticipated investment income in our calculation. This includes accruing interest on the unamortized balance of DAC. The estimates for each underwriting year are reviewed quarterly and updated when necessary to reflect actual experience and any changes to key variables such as persistency or loss development.
LOSS RESERVES
Loss reserves include case reserves, incurred but not reported ("IBNR") reserves, and loss adjustment expense ("LAE") reserves.
Case reserves and LAE reserves are established when notices of delinquency on insured mortgage loans are received. Such loans are referred to as being in our delinquency inventory. For reporting purposes, we consider a loan delinquent when it is two or more payments past due and has not become current or resulted in a claim payment. Even though the accounting standard, ASC 944, regarding accounting and reporting by insurance entities specifically excludes mortgage insurance from its guidance relating to loss reserves, we establish loss reserves using the general principles contained in the insurance standard. However, consistent with industry standards for mortgage insurers, we do not establish case reserves for future claims on insured loans that are not currently delinquent.
Case reserves are established by estimating the number of loans in our delinquency inventory that will result in a claim payment, which is referred to as the claim rate, and further estimating the amount of the claim payment, which is referred to as claim
MGIC Investment Corporation 2022 Form 10-K | 84
MGIC Investment Corporation and Subsidiaries
severity. Our case reserve estimates are primarily established based upon historical experience, including rescissions of policies, curtailments of claims, and loan modification activity. Adjustments to reserve estimates are reflected in the financial statements in the years in which the adjustments are made. The liabilityLoss reserves for reinsurance assumed isare based on information provided by the ceding companies.
IBNR reserves are established for delinquencies estimated to have occurred prior to the close of an accounting period, but have not yet been reported to us. Consistent with case reserves for reported delinquencies, IBNR reserves are also established using estimated claim rates and claim severities.
LAE reserves are established for the estimated costs of settling claims, including legal and other expenses, and general expenses of administering the claims settlement process.
Our loss reserve estimates are also affected by any agreements we enter into regarding our claims paying practices, as discussed in Note 17 – “Litigation and Contingencies” to our consolidated financial statements.
PREMIUM DEFICIENCY RESERVE
After our loss reserves are established, we perform premium deficiency tests using our best estimate of future premium, losses and LAE paid. Premium deficiency reserves are established, if necessary, when the present value of expected future losses and LAE paid exceeds the present value of expected future premium and already established loss reserves.
REVENUE RECOGNITION
We write policies which are guaranteed renewable at the insured's option on a monthly, single, or annual premium basis. We have no ability to re-underwrite or reprice these policies. Premiums written on monthly premium policies are earned as coverage is provided. Premiums written on single premium policies and annual premium policies are initially deferred as unearned premium reserve. Premiums written on annual premium policies are earned on a monthly pro rata basis. Premiums written on policies covering more than one year are amortized over the estimated policy life based on historical experience, which includes the anticipated incurred loss pattern. When a policy is cancelled for a reason other than rescission or claim payment, all premium that is non-refundable is immediately earned. Any refundable premium is returned to the servicer or borrower. When a policy is cancelled due to rescission, all previously collected premium is returned,returned. When a policy is cancelled because a claim is paid, premium collected since the date of delinquency is returned.
The liability associated with our estimate of premium to be returned is accrued for separately and included in "Other liabilities" on our consolidated balance sheets. Changes in this liability, and the actual return of premiums for all periods, affects premiums written and earned.
We assess whether a credit loss allowance is required for our premium receivable. We consider collectability trends and
industry development, among other things. Any estimated credit loss would be immediately recognized.
Fee income of our non-insurance subsidiaries is earned and recognized as the services are provided and the customer is obligated to pay. Fee income consists primarily of contract underwriting and related fee-based services provided to lenders and is included in “Other revenue” on the consolidated statements of operations.
MGIC Investment Corporation 2023 Form 10-K | 90
MGIC Investment Corporation and Subsidiaries
INCOME TAXES
Deferred income taxes are provided under the liability method, which recognizes the future tax effects of temporary differences between amounts reported in the consolidated financial statements and the tax bases of these items. The estimated tax effects are computed at the enacted federal statutory income tax rate. Changes in tax laws, rates, regulations, and policies or the final determination of tax audits or examinations, could materially affect our estimates and can be significant to our operating results. We evaluate the realizability of the deferred tax assets based on the weight of all available positive and negative evidence. Deferred tax assets are reduced by a valuation allowance if it is more likely than not that all or some portion of the deferred tax assets will not be realized.
The recognition of a tax position is determined using a two-step approach. The first step applies a more-likely-than-not threshold for recognition and derecognition. The second step measures the tax position as the greatest amount of benefit that is cumulatively greater than 50% likely to be realized. When evaluating a tax position for recognition and measurement, we presume that the tax position will be examined by the relevant taxing authority that has full knowledge of all relevant information. We recognize interest accrued and penalties related to unrecognized tax benefits in our provision for income taxes.
Federal tax law permits mortgage guaranty insurance companies to deduct from taxable income, subject to certain limitations, the amounts added to contingency loss reserves that are recorded for regulatory purposes. The amounts we deduct must generally be included in taxable income in the tenth subsequent year. The deduction is allowed only to the extent that we purchase and hold U.S. government non-interest-bearing tax and loss bonds in an amount equal to the tax benefit attributable to the deduction. We account for these purchases as a payment of current federal income tax. (See "Note 12 - Income Taxes.")
BENEFIT PLANS
We have a non-contributory defined benefit pension plan, covering substantially all employees, as well as a supplemental executive retirement plan.plan, that covered eligible employees as of December 31, 2022, utilizing a cash balance formula. Effective January 1, 2023, these plans arewere frozen (no future benefits will be accrued for participants due to employment and no new participants will be added). Retirement benefits were based on compensation and years of service, utilizing a cash balance formula. Under the cash balance formula, participants’ accounts were credited each year with an employer contribution. Participants will continue to earn interest credits on their retirement benefits. We recognize thesethe ongoing retirement benefit costs over the period during which employees render the service that qualifies them for benefits.of these plans as they are incurred. Our policy is to fund pension costcosts as required under the Employee Retirement Income Security Act of 1974.
MGIC Investment Corporation 2022 Form 10-K | 85
MGIC Investment Corporation and Subsidiaries
We offer both medical and dental benefits for retired domestic employees, their eligible spouses and dependents. Eligibility for coverage is based on meeting certain years of service and retirement age qualifications. We accrue the estimated costs of retiree medical and dental benefits over the period during which employees render the service that qualifies them for benefits. (See Note 11 – “Benefit Plans.”)
REINSURANCE
We cede insurance risk through the use of quota share reinsurance transactions ("QSR") and excess of loss reinsurance transactions. We have excess of loss transactions executed through the traditional reinsurance market and with Home Re special purpose insurers. Premiums and losses incurred on our QSR Transactions are ceded pursuant to the terms of our quota share reinsurance transactions.agreements. Reinsurance premiums ceded under our traditional reinsurance transactiontransactions are based off the remaining reinsured coverage levels. Reinsurance premiums ceded under our Home Re transactionsagreements are composed of coverage, initial expense and supplemental premiums. The coverage premiums are generally calculated as the difference between the amount of interest payable by the Home Re Entity on the remaining reinsurance coverage levels, and the investment income collected on the collateral assets held in the reinsurance trust account and used to collateralize the Home Re Entity's reinsurance obligation to MGIC.
Loss reserves are reported before taking credit for amounts ceded under reinsurance transactions. Ceded loss reserves are reflected as "Reinsurance recoverable on loss reserves." Amounts due from reinsurers on paid claims are reflected as “Reinsurance recoverable on paid losses.” Ceded premiums payable, net of ceding commission and profit commission are included in “Other liabilities.” Profit commissions are included with “Premiums written – Ceded” and ceding commissions are included with “Other underwriting and operating expenses, net.” We remain liable for all insurance ceded. (See Note 9 – “Reinsurance.”)
We assess whether a credit loss allowance is required for our reinsurance recoverables. In assessing whether a credit allowance should be established, we consider several factors including, but not limited to, the credit ratings of individual reinsurers, investor reports for our excess of loss transactions,Home Re Transactions, collateral held in trust accounts in which MGIC is the sole beneficiary, and aging of outstanding reinsurance recoverable balances.
Assumed reinsurance is based on information received from the ceding company.
See Note 9 – “Reinsurance" for discussion of our variable interest entity ("VIE") policy on the Home Re Transactions.
SHARE-BASED COMPENSATION
We have certain share-based compensation plans. Under the fair value method, compensation cost is measured at the grant date based on the fair value of the award and is recognized over the service period which generally corresponds to the vesting period. Awards under our plans generally vest over periods ranging from one to three years, although awards to our non-employee directors vest immediately. Any forfeitures of awards are recognized as they occur. (See Note 15 – “Share-based Compensation Plans.”)
MGIC Investment Corporation 2023 Form 10-K | 91
MGIC Investment Corporation and Subsidiaries
EARNINGS PER SHARE
Basic earnings per share ("EPS") is calculated by dividing net income by the weighted average number of shares of common stock outstanding. The computation of basic EPS includes asOur "participating securities" an immaterial number of unvested share-based compensation awards that contain non-forfeitable rights to dividends or dividend equivalents, whether paid or unpaid, under the "two-class" method. Our participating securities are composed of vested restricted stock and restricted stock units ("RSUs") with non-forfeitable rights to dividends. Diluted EPS includes the components of basic EPS and also gives effect to dilutive common stock equivalents. We calculate diluted EPS using the treasury stock method and if-converted method. Under the treasury stock method, diluted EPS reflects the potential dilution that could occur if our unvested restricted stock units result in the issuance of common stock. Under the if-converted method, diluted EPS reflects the potential dilution that could occur if our 9% Debentures are converted to common stock. The determination of potentially issuable shares does not consider the satisfaction of the conversion requirements and the shares are included in the determination of diluted EPS as of the beginning of the period, if dilutive. For purposes of calculating basic and diluted EPS, vested RSUs are considered outstanding. In the third quarter of 2023, under the terms of our 9% Debentures, we exercised our option to redeem the outstanding principal. (See Note 7 - “Debt”.)
RELATED PARTY TRANSACTIONS
In 2023 and 2022, there were no material related party transactions. In 2021 MGIC distributed to the holding company, as a dividend, its investment in MGIC Credit Assurance Corporation. In 2020 MGIC Reinsurance Corporation of Wisconsin, a subsidiary of MGIC, merged with MGIC.
MGIC Investment Corporation 2022 Form 10-K | 86
MGIC Investment CorporationAccounting standards and Subsidiaries
Prospective Accounting Standards
Table 3.1 shows thelaws and regulations effective in 2023, or early adopted, and relevant new amendments to accounting standards, which are not yet effective or adopted.
| | | | | | | | | | | | | | |
Standard / Interpretation |
Table | 3.1 | | |
| | | |
Amended Standards | Effective date |
| | |
| | | |
ASC 944 | Long-Duration Contracts | |
| • | ASU 2018-12 - Financial Services - Insurance (Topic 944): Targeted Improvements to the Accounting for Long-Duration Contracts | January 1, 2023 |
ASC 848 | Reference Rate Reform | |
| • | ASU 2020-06 - Reference Rate Report (Topic 848): Deferral of the Sunset Date of Topic 848. | January 1, 2023 |
Inflation Reduction Act | |
| • | Inflation Reduction Act of 2022 | January 1, 2023 |
Targeted Improvements for Long Duration Contracts: ASU 2018-12
In August 2018, the FASB issued guidance which simplifies the amortization of deferred insurance policy acquisition costs. It also provides updates to the recognition, measurement, presentation and disclosure requirements for long duration contracts, which generally do not apply to mortgage insurance. The updated guidance requires deferred acquisition costs to be amortized on a constant level basis over the expected term of the related contracts, versus in proportion to premium, gross profits, or gross margins. In November 2020, FASB issued ASU 2020-11 deferring the effective date, so that it applies for annual periods beginning after December 15, 2022, including interim periods within those annual periods. We have evaluated the impact of the adoption of this guidance will have on our consolidated financial statements and determined it will not have a material impact.are described below:
Reference Rate Reform: ASU 2022-06
In March 2020, the FASB issued ASU 2020-04 to provide temporary optional guidance to ease the potential burden in accounting for (or recognizing the effects of) reference rate reform. It provided optional expedients and exceptions for applying generally accepted accounting principles to contracts, hedging relationships and other transactions affected by reference rate reform if certain criteria are met. In December 2022, the FASB issued ASU 2022-06, extending the election and application from March 12, 2020 through December 31, 2024 (originally December 31, 2022). The adoptionFuture elections of and future elections under, this standard are not expected to have a material impact on our consolidated financial statements as the standard will ease, if warranted, the requirements for accounting for the future effects of reference rate reform. We continue to monitorhave evaluated the impact the discontinuance of LIBOR or other reference rates will have on our contractsconsolidated financial statements and other transactions.have determined it will not have a material impact.
Inflation Reduction Act
TheOn August 16, 2022, the Inflation Reduction Act of 2022(the “IRA”) was enacted and signed into law in the United States. The IRA includes provisions for a 15% corporate minimum tax and a 1% excise tax on net stock repurchases and a 15% corporate minimum tax.repurchases. Both of these taxes are effective in 2023. We doThese provisions did not expect these tax provisions to have a material impact on our consolidated financial statements.results, including our annual estimated effective tax rate.
PROSPECTIVE ACCOUNTING AND REPORTING DEVELOPMENTS
Relevant new amendments to accounting standards, which are not yet effective or adopted.
Improvements to Income Tax Disclosures: ASU 2023-09
In December 2023, the FASB issued ASU 2023-09 to enhance the transparency and decision usefulness of income tax disclosures. Income tax disclosures will require consistent categories and greater disaggregations of information in the rate reconciliation and disclosure of income taxes paid disaggregated by jurisdiction. ASU 2023-09 is effective for annual periods beginning after December 15, 2024 on a prospective basis. Early adoption is permitted. We are currently evaluating the impacts the adoption of this guidance will have on our disclosures, but do not expect it will have a material impact.
MGIC Investment Corporation 20222023 Form 10-K | 8792
MGIC Investment Corporation and Subsidiaries
| | | | | | | | |
NOTE 4 | | Note 4. Earnings Per Share |
Table 4.1 reconciles basic and diluted EPS amounts:
| | Earnings per share | Earnings per share | Earnings per share |
| Table | Table | 4.1 | |
| | Years Ended December 31, |
| | Years Ended December 31, | |
| | Years Ended December 31, | |
| | Years Ended December 31, | |
| (In thousands, except per share data) | (In thousands, except per share data) | | 2022 | | 2021 | | 2020 | (In thousands, except per share data) | | 2023 | | 2022 | | 2021 |
| Basic earnings per share: | Basic earnings per share: | |
| Net income | |
| Net income | |
| Net income | Net income | | $ | 865,349 | | | $ | 634,983 | | | $ | 446,093 | |
| Weighted average common shares outstanding - basic | Weighted average common shares outstanding - basic | | 305,847 | | | 334,330 | | | 339,953 | |
| Basic earnings per share | Basic earnings per share | | $ | 2.83 | | | $ | 1.90 | | | $ | 1.31 | |
| Diluted earnings per share: | Diluted earnings per share: | |
| Net income | | $ | 865,349 | | | $ | 634,983 | | | $ | 446,093 | |
| Net Income | |
| Net Income | |
| Net Income | |
Interest expense, net of tax (1): | Interest expense, net of tax (1): | |
| 9% Debentures | |
| 9% Debentures | |
| 9% Debentures | 9% Debentures | | 3,228 | | | 14,343 | | | 17,004 | |
| Diluted income available to common shareholders | Diluted income available to common shareholders | | $ | 868,577 | | | $ | 649,326 | | | $ | 463,097 | |
| Weighted-average shares - basic | Weighted-average shares - basic | | 305,847 | | | 334,330 | | | 339,953 | |
| Effect of dilutive securities: | Effect of dilutive securities: | |
| Unvested restricted stock units | Unvested restricted stock units | | 1,917 | | | 1,782 | | | 1,589 | |
| Unvested restricted stock units | |
| Unvested restricted stock units | |
| 9% Debentures | 9% Debentures | | 3,465 | | | 15,196 | | | 17,751 | |
| Weighted average common shares outstanding - diluted | Weighted average common shares outstanding - diluted | | 311,229 | | | 351,308 | | | 359,293 | |
| Diluted income per share | Diluted income per share | | $ | 2.79 | | | $ | 1.85 | | | $ | 1.29 | |
|
(1) Interest expense has been tax effected at a rate of 21%.
For the years ended December 31, 2022, 2021, and 2020, allAll of our outstanding 9% Debentures arewere reflected in diluted earnings per share using the “if-converted” method. Under this method, if dilutive, the common stock related to the outstanding 9% Debentures is assumed issued as of the beginning of the reporting period and the related interest expense, net of tax, is added back to earnings in calculating diluted EPS. In the third quarter of 2023, under the terms of our 9% Debentures, we exercised our option to redeem the outstanding principal. (See Note 7- "Debt".)
MGIC Investment Corporation 20222023 Form 10-K | 8893
MGIC Investment Corporation and Subsidiaries
| | | | | | | | |
NOTE 5 | Note 5. Investments | |
FIXED INCOME SECURITIES
Our fixed income securities consisted of the following as of December 31, 20222023 and 2021:2022:
| Details of fixed income investment securities by category as of December 31, 2022 | | Details of fixed income investment securities by category as of December 31, 2023 | | Details of fixed income investment securities by category as of December 31, 2023 |
| Table | Table | 5.1a | |
| (In thousands) | |
| (In thousands) | |
| (In thousands) | (In thousands) | | Amortized Cost | | Gross Unrealized Gains | | Gross Unrealized Losses | | Fair Value | | Amortized Cost | | Gross Unrealized Gains | | Gross Unrealized Losses | | Fair Value |
| U.S. Treasury securities and obligations of U.S. government corporations and agencies | U.S. Treasury securities and obligations of U.S. government corporations and agencies | | $ | 145,581 | | | $ | 2 | | | $ | (9,683) | | | $ | 135,900 | |
| Obligations of U.S. states and political subdivisions | Obligations of U.S. states and political subdivisions | | 2,400,261 | | | 4,866 | | | (256,073) | | | 2,149,054 | |
| Corporate debt securities | Corporate debt securities | | 2,416,475 | | | 1,043 | | | (196,377) | | | 2,221,141 | |
| ABS | ABS | | 126,723 | | | 5 | | | (6,041) | | | 120,687 | |
| RMBS | RMBS | | 223,743 | | | 10 | | | (25,744) | | | 198,009 | |
| CMBS | CMBS | | 257,785 | | | 22 | | | (20,591) | | | 237,216 | |
| CLOs | CLOs | | 337,656 | | | 5 | | | (7,829) | | | 329,832 | |
| Foreign government debt | Foreign government debt | | 4,486 | | | — | | | (699) | | | 3,787 | |
| Commercial paper | Commercial paper | | 14,075 | | | — | | | (3) | | | 14,072 | |
| Total fixed income securities | Total fixed income securities | | $ | 5,926,785 | | | $ | 5,953 | | | $ | (523,040) | | | $ | 5,409,698 | |
| Details of fixed income investment securities by category as of December 31, 2021 | | Details of fixed income investment securities by category as of December 31, 2022 | | Details of fixed income investment securities by category as of December 31, 2022 |
| Table | Table | 5.1b | |
| (In thousands) | |
| (In thousands) | |
| (In thousands) | (In thousands) | | Amortized Cost | | Gross Unrealized Gains | | Gross Unrealized Losses | | Fair Value | | Amortized Cost | | Gross Unrealized Gains | | Gross Unrealized Losses | | Fair Value |
| U.S. Treasury securities and obligations of U.S. government corporations and agencies | U.S. Treasury securities and obligations of U.S. government corporations and agencies | | $ | 133,990 | | | $ | 285 | | | $ | (868) | | | $ | 133,407 | |
| Obligations of U.S. states and political subdivisions | Obligations of U.S. states and political subdivisions | | 2,408,688 | | | 133,361 | | | (7,396) | | | 2,534,653 | |
| Corporate debt securities | Corporate debt securities | | 2,704,586 | | | 75,172 | | | (13,776) | | | 2,765,982 | |
| ABS | ABS | | 150,888 | | | 830 | | | (1,008) | | | 150,710 | |
| RMBS | RMBS | | 309,991 | | | 2,397 | | | (3,278) | | | 309,110 | |
| CMBS | CMBS | | 315,330 | | | 5,736 | | | (1,936) | | | 319,130 | |
| CLOs | CLOs | | 360,436 | | | 609 | | | (106) | | | 360,939 | |
| Foreign government debt | Foreign government debt | | 13,749 | | | — | | | (99) | | | 13,650 | |
| Commercial paper | |
| Total fixed income securities | Total fixed income securities | | $ | 6,397,658 | | | $ | 218,390 | | | $ | (28,467) | | | $ | 6,587,581 | |
We had $11.8$12.2 million and $13.4$11.8 million of investments at fair value on deposit with various states as of December 31, 20222023 and 2021,2022, respectively, due to regulatory requirements of those state insurance departments.
In connection with our insurance and reinsurance activities within MAC and MIC, insurance subsidiaries of MGIC, we are required to maintain assets in trusts for the benefit of contractual counterparties, which had investments at fair value of $128.4$156.9 million and $189.8$128.4 million at December 31, 20222023 and 2021,2022, respectively. The decreaseincrease is primarily due to a declinean increase in collateral required as the risk in force covered by these insurance and reinsurance activities has decreased.increased.
MGIC Investment Corporation 20222023 Form 10-K | 8994
MGIC Investment Corporation and Subsidiaries
The amortized cost and fair values of fixed income securities at December 31, 2022,2023, by contractual maturity, are shown in table 5.2 below. Actual maturities will differ from contractual maturities because borrowers may have the right to call or prepay obligations with or without call or prepayment penalties. Because most mortgage and asset-backed securities provide for periodic payments throughout their lives, they are listed in separate categories.
| Fixed income securities maturity schedule | | Table | Table | 5.2 | |
| | December 31, 2022 |
| | December 31, 2023 | |
| | December 31, 2023 | |
| | December 31, 2023 | |
| (In thousands) | (In thousands) | | Amortized Cost | | Fair Value | (In thousands) | | Amortized Cost | | Fair Value |
| Due in one year or less | Due in one year or less | | $ | 452,188 | | | $ | 445,210 | |
| Due after one year through five years | Due after one year through five years | | 1,358,606 | | | 1,288,152 | |
| Due after five years through ten years | Due after five years through ten years | | 1,890,875 | | | 1,713,608 | |
| Due after ten years | Due after ten years | | 1,279,209 | | | 1,076,984 | |
| | 4,919,963 | |
| | | 4,980,878 | | | 4,523,954 | |
| | ABS | |
| ABS | |
| ABS | |
| ABS | |
| ABS | |
| ABS | ABS | | 126,723 | | | 120,687 | |
| RMBS | RMBS | | 223,743 | | | 198,009 | |
| CMBS | CMBS | | 257,785 | | | 237,216 | |
| CLOs | CLOs | | 337,656 | | | 329,832 | |
| Total as of December 31, 2022 | | $ | 5,926,785 | | | $ | 5,409,698 | |
| Total as of December 31, 2023 | |
EQUITY SECURITIES
The cost and fair value of investments in equity securities as of December 31, 20222023 and December 31, 20212022 are shown in tables 5.3a and 5.3b below.
| Details of equity investment securities as of December 31, 2022 | | Details of equity investment securities as of December 31, 2023 | | Details of equity investment securities as of December 31, 2023 |
| Table | Table | 5.3a | |
| (In thousands) | (In thousands) | | Cost | | Gross gains | | Gross losses | | Fair Value |
| (In thousands) | |
| (In thousands) | | | Cost | | Fair value gains | | Fair value losses | | Fair Value |
| Equity securities | Equity securities | | 15,924 | | | — | | | (1,784) | | | 14,140 | |
| Details of equity investment securities as of December 31, 2021 | | Details of equity investment securities as of December 31, 2022 | | Details of equity investment securities as of December 31, 2022 |
| Table | Table | 5.3b | |
| (In thousands) | (In thousands) | | Cost | | Gross gains | | Gross losses | | Fair Value |
| (In thousands) | |
| (In thousands) | | | Cost | | Fair value gains | | Fair value losses | | Fair Value |
| Equity securities | Equity securities | | 15,838 | | | 264 | | | (34) | | | 16,068 | |
MGIC Investment Corporation 2023 Form 10-K | 95
MGIC Investment Corporation and Subsidiaries
NET GAINS (LOSSES) ON INVESTMENTS AND OTHER FINANCIAL INSTRUMENTS
The net gains (losses) on investments and other financial instruments and the proceeds from the sale of fixed income securities classified as available-for-sale and equity securities are shown in table 5.4 below.
| | Details of net gains (losses) on investments and other financial instruments | Details of net gains (losses) on investments and other financial instruments | Details of net gains (losses) on investments and other financial instruments |
| Table | Table | 5.4 | |
| (in thousands) | (in thousands) | December 31, 2022 | | December 31, 2021 | | December 31, 2020 |
| (in thousands) | |
| (in thousands) | | December 31, 2023 | | December 31, 2022 | | December 31, 2021 |
| | Fixed income securities | Fixed income securities | |
| Fixed income securities | |
| Fixed income securities | |
| Gains on sales | |
| Gains on sales | |
| Gains on sales | Gains on sales | 7,152 | | | 8,980 | | | 21,272 | |
| Losses on sales | Losses on sales | (15,477) | | | (1,942) | | | (8,809) | |
| Change in credit allowance | Change in credit allowance | — | | | 49 | | | (49) | |
| Impairments | Impairments | (1,415) | | | — | | | (331) | |
| Equity securities gains (losses) | Equity securities gains (losses) | |
| Gains (losses) on sales | Gains (losses) on sales | (7) | | | 4 | | | 1,344 | |
| Market adjustment | (2,013) | | | (463) | | | 552 | |
| Gains (losses) on sales | |
| Gains (losses) on sales | |
| Changes in fair value | |
Change in embedded derivative on Home Re Transactions (1) | Change in embedded derivative on Home Re Transactions (1) | 4,269 | | | (721) | | | (1,176) | |
| Other | Other | |
| Gains (losses) on sales | |
| Gains (losses) on sales | |
| Gains (losses) on sales | Gains (losses) on sales | 2 | | | (33) | | | (231) | |
| Market adjustment | Market adjustment | 26 | | | (13) | | | 4 | |
| Net gains (losses) on investments and other financial instruments | Net gains (losses) on investments and other financial instruments | (7,463) | | | 5,861 | | | 12,576 | |
| | Proceeds from sales of fixed income securities | Proceeds from sales of fixed income securities | 397,553 | | | 471,783 | | | 803,401 | |
| Proceeds from sales of fixed income securities | |
| Proceeds from sales of fixed income securities | |
| Proceeds from sales of equity securities | Proceeds from sales of equity securities | 97 | | | 2,621 | | | 25,693 | |
MGIC Investment Corporation 2022 Form 10-K | 90
MGIC Investment Corporation and Subsidiaries
OTHER INVESTED ASSETS
Our other invested assets balances includes an investment in Federal Home Loan Bank ("FHLB") stock that is carried at cost, which due to its nature approximates fair value. Ownership of FHLB stock provides access to a secured lending facility. In the first quarter of 2022, we repaid the outstanding principal balance of our Federal Home Loan Bank Advance ("FHLB Advance") and accordingly reduced our investment in FHLB stock. At December 31, 2021, the FHLB Advance amount was secured by $167.2 million of eligible collateral. As a result of the prepayment of the FHLB Advance in 2022, we are no longer required to maintain collateral.
UNREALIZED INVESTMENT LOSSES
Tables 5.5a and 5.5b below summarize, for all available-for-sale investments in an unrealized loss position as of December 31, 20222023 and 2021,2022, the aggregate fair value and gross unrealized loss by the length of time those securities have been continuously in an unrealized loss position. The fair value amounts reported in tables 5.5a and 5.5b below are estimated using the process described in Note 6 - "Fair Value Measurements" to these consolidated financial statements. | Unrealized loss aging for securities by type and length of time as of December 31, 2022 | | Unrealized loss aging for securities by type and length of time as of December 31, 2023 | | Unrealized loss aging for securities by type and length of time as of December 31, 2023 |
| Table | Table | 5.5a | |
| | Less Than 12 Months | | 12 Months or Greater | | Total |
| | Less Than 12 Months | |
| | Less Than 12 Months | |
| | Less Than 12 Months | | | 12 Months or Greater | | Total |
| (In thousands) | (In thousands) | | Fair Value | | Unrealized Losses | | Fair Value | | Unrealized Losses | | Fair Value | | Unrealized Losses | (In thousands) | | Fair Value | | Unrealized Losses | | Fair Value | | Unrealized Losses | | Fair Value | | Unrealized Losses |
| U.S. Treasury securities and obligations of U.S. government corporations and agencies | U.S. Treasury securities and obligations of U.S. government corporations and agencies | | $ | 67,531 | | | $ | (3,583) | | | $ | 76,246 | | | $ | (6,100) | | | $ | 143,777 | | | $ | (9,683) | |
| Obligations of U.S. states and political subdivisions | Obligations of U.S. states and political subdivisions | | 1,344,272 | | | (157,903) | | | 360,956 | | | (98,170) | | | 1,705,228 | | | (256,073) | |
| Corporate debt securities | Corporate debt securities | | 1,488,255 | | | (109,976) | | | 758,732 | | | (86,401) | | | 2,246,987 | | | (196,377) | |
| ABS | ABS | | 53,201 | | | (1,008) | | | 67,073 | | | (5,033) | | | 120,274 | | | (6,041) | |
| RMBS | RMBS | | 77,563 | | | (8,572) | | | 136,179 | | | (17,172) | | | 213,742 | | | (25,744) | |
| CMBS | CMBS | | 166,973 | | | (12,951) | | | 70,792 | | | (7,640) | | | 237,765 | | | (20,591) | |
| CLOs | CLOs | | 213,461 | | | (4,644) | | | 114,459 | | | (3,185) | | | 327,920 | | | (7,829) | |
| Foreign government debt | Foreign government debt | | — | | | — | | | 3,787 | | | (699) | | | 3,787 | | | (699) | |
| Commercial paper | | — | | | — | | | 3,816 | | | (3) | | | 3,816 | | | (3) | |
| | Total | Total | | $ | 3,411,256 | | | $ | (298,637) | | | $ | 1,592,040 | | | $ | (224,403) | | | $ | 5,003,296 | | | $ | (523,040) | |
| Total | |
| Total | |
| | | | | | | | | | | | | | | | | | | | | | | | | | | | | | | | | | | | | | | | | |
| Unrealized loss aging for securities by type and length of time as of December 31, 2021 |
| Table | 5.5b | | | | | | | | | | | | |
| | Less Than 12 Months | | 12 Months or Greater | | Total |
| (In thousands) | | Fair Value | | Unrealized Losses | | Fair Value | | Unrealized Losses | | Fair Value | | Unrealized Losses |
| U.S. Treasury securities and obligations of U.S. government corporations and agencies | | $ | 91,154 | | | $ | (790) | | | $ | 2,616 | | | $ | (78) | | | $ | 93,770 | | | $ | (868) | |
| Obligations of U.S. states and political subdivisions | | 452,021 | | | (7,189) | | | 15,540 | | | (207) | | | 467,561 | | | (7,396) | |
| Corporate debt securities | | 865,085 | | | (13,260) | | | 10,997 | | | (516) | | | 876,082 | | | (13,776) | |
| ABS | | 100,064 | | | (998) | | | 1,552 | | | (10) | | | 101,616 | | | (1,008) | |
| RMBS | | 180,586 | | | (2,548) | | | 31,641 | | | (730) | | | 212,227 | | | (3,278) | |
| CMBS | | 89,889 | | | (1,887) | | | 1,511 | | | (49) | | | 91,400 | | | (1,936) | |
| CLOs | | 177,663 | | | (71) | | | 21,973 | | | (35) | | | 199,636 | | | (106) | |
| Foreign government debt | | 13,649 | | | (99) | | | — | | | — | | | 13,649 | | | (99) | |
| Total | | $ | 1,970,111 | | | $ | (26,842) | | | $ | 85,830 | | | $ | (1,625) | | | $ | 2,055,941 | | | $ | (28,467) | |
MGIC Investment Corporation 2023 Form 10-K | 96
MGIC Investment Corporation and Subsidiaries
| | | | | | | | | | | | | | | | | | | | | | | | | | | | | | | | | | | | | | | | | |
| Unrealized loss aging for securities by type and length of time as of December 31, 2022 |
| Table | 5.5b | | | | | | | | | | | | |
| | Less Than 12 Months | | 12 Months or Greater | | Total |
| (In thousands) | | Fair Value | | Unrealized Losses | | Fair Value | | Unrealized Losses | | Fair Value | | Unrealized Losses |
| U.S. Treasury securities and obligations of U.S. government corporations and agencies | | $ | 67,531 | | | $ | (3,583) | | | $ | 76,246 | | | $ | (6,100) | | | $ | 143,777 | | | $ | (9,683) | |
| Obligations of U.S. states and political subdivisions | | 1,344,272 | | | (157,903) | | | 360,956 | | | (98,170) | | | 1,705,228 | | | (256,073) | |
| Corporate debt securities | | 1,488,255 | | | (109,976) | | | 758,732 | | | (86,401) | | | 2,246,987 | | | (196,377) | |
| ABS | | 53,201 | | | (1,008) | | | 67,073 | | | (5,033) | | | 120,274 | | | (6,041) | |
| RMBS | | 77,563 | | | (8,572) | | | 136,179 | | | (17,172) | | | 213,742 | | | (25,744) | |
| CMBS | | 166,973 | | | (12,951) | | | 70,792 | | | (7,640) | | | 237,765 | | | (20,591) | |
| CLOs | | 213,461 | | | (4,644) | | | 114,459 | | | (3,185) | | | 327,920 | | | (7,829) | |
| Foreign government debt | | — | | | — | | | 3,787 | | | (699) | | | 3,787 | | | (699) | |
| Commercial paper | | — | | | — | | | 3,816 | | | (3) | | | 3,816 | | | (3) | |
| Total | | $ | 3,411,256 | | | $ | (298,637) | | | $ | 1,592,040 | | | $ | (224,403) | | | $ | 5,003,296 | | | $ | (523,040) | |
The change in net unrealized gains (losses) of investments is shown in table 5.6 below.
| | | | | | | | | | | | | | | | | | | | | | | |
| Change in net unrealized gains (losses) |
| Table | 5.6 | | | | | | |
| (In thousands) | | 2022 | | 2021 | | 2020 |
| Fixed income securities | | $ | (707,005) | | | $ | (154,555) | | | $ | 169,135 | |
| | | | | | |
| | | | | | |
| | | | | | |
MGIC Investment Corporation 2022 Form 10-K | 91
MGIC Investment Corporation and Subsidiaries
| | | | | | | | | | | | | | | | | | | | | | | |
| Change in net unrealized gains (losses) |
| Table | 5.6 | | | | | | |
| (In thousands) | | 2023 | | 2022 | | 2021 |
| Fixed income securities | | $ | 179,174 | | | $ | (707,005) | | | $ | (154,555) | |
| | | | | | |
| | | | | | |
| | | | | | |
There were 1,2261,021 and 6101,226 securities in an unrealized loss position as of December 31, 20222023 and 2021,2022, respectively. Based on current facts and circumstances, we believe the unrealized losses as of December 31, 20222023 presented in table 5.5a above are not indicative of the ultimate collectability of the current amortized costpar value of the securities. The unrealized losses in all categories of our investments were primarily caused by an increase in prevailing interest rates. We also rely upon estimates of several credit and non-credit factors in our review and evaluation of individual investments to determine whether a credit impairment exists. All of the securities in an unrealized loss position are current with respect to their interest obligations.
The source of net investment income is shown in table 5.7 below.
| | | | | | | | | | | | | | | | | | | | | | | |
| Net investment income |
| Table | 5.7 | | | | | | |
| (In thousands) | | 2022 | | 2021 | | 2020 |
| Fixed income securities | | $ | 166,306 | | | $ | 160,030 | | | $ | 157,065 | |
| Equity securities | | 437 | | | 471 | | | 620 | |
| Cash equivalents | | 5,049 | | | 75 | | | 1,648 | |
| Other | | 51 | | | 22 | | | 275 | |
| Investment income | | 171,843 | | | 160,598 | | | 159,608 | |
| Investment expenses | | (4,367) | | | (4,160) | | | (5,212) | |
| Net investment income | | $ | 167,476 | | | $ | 156,438 | | | $ | 154,396 | |
| | | | | | | | | | | | | | | | | | | | | | | |
| Net investment income |
| Table | 5.7 | | | | | | |
| (In thousands) | | 2023 | | 2022 | | 2021 |
| Fixed income securities | | $ | 202,655 | | | $ | 166,306 | | | $ | 160,030 | |
| Equity securities | | 529 | | | 437 | | | 471 | |
| Cash equivalents | | 16,111 | | | 5,049 | | | 75 | |
| Other | | 44 | | | 51 | | | 22 | |
| Investment income | | 219,339 | | | 171,843 | | | 160,598 | |
| Investment expenses | | (4,599) | | | (4,367) | | | (4,160) | |
| Net investment income | | $ | 214,740 | | | $ | 167,476 | | | $ | 156,438 | |
MGIC Investment Corporation 20222023 Form 10-K | 9297
MGIC Investment Corporation and Subsidiaries
| | | | | | | | |
NOTE 6 | | Note 6. Fair Value Measurements |
Recurring fair value measurements
The following describes the valuation methodologies generally used by the independent pricing sources, or by us, to measure financial instruments at fair value, including the general classification of such financial instruments pursuant to the valuation hierarchy.
•Fixed income securities:
U.S. Treasury Securities and Obligations of U.S. Government Corporations and Agencies: Securities with valuations derived from quoted prices for identical instruments in active markets that we can access are categorized in Level 1 of the fair value hierarchy. Securities valued by surveying the dealer community, obtaining relevant trade data, benchmark quotes and spreads and incorporating this information in the valuation process are categorized as Level 2 of the fair value hierarchy.
Corporate Debt Securities are valued by surveying the dealer community, obtaining relevant trade data, benchmark quotes and spreadsspread, and broker/dealer quotes and incorporating this information into the valuation process. These securities are generally categorized in Level 2 of the fair value hierarchy.
Obligations of U.S. States & Political Subdivisions are valued by tracking, capturing, and analyzing quotes for active issues and trades reported via the Municipal Securities Rulemaking Board records. Daily briefings and reviews of current economic conditions, trading levels, spread relationships, and the slope of the yield curve provide further data for evaluation. These securities are generally categorized in Level 2 of the fair value hierarchy.
Residential Mortgage-Backed Securities ("RMBS") are valued by monitoring interest rate movements, and other pertinent data daily. Incoming market data is enriched to derive spread, yield and/or price data as appropriate, enabling known data points to be extrapolated for valuation application across a range of related securities. These securities are generally categorized in Level 2 of the fair value hierarchy.
Commercial Mortgage-Backed Securities ("CMBS") are valued using techniques that reflect market participants’ assumptions and maximize the use of relevant observable inputs including quoted prices for similar assets, benchmark yield curves and market corroborated inputs. Evaluation uses regular reviews of the inputs for securities covered, including executed trades, broker quotes, credit information, collateral attributes and/or cash flow waterfall as applicable. These securities are generally categorized in Level 2 of the fair value hierarchy.
Asset-Backed Securities ("ABS") are valued using spreads and other information solicited from market buy-and-sell-side sources, including primary and secondary dealers, portfolio managers, and research analysts. Cash flows are generated for each tranche, benchmark yields are determined, and deal collateral performance and tranche level attributes including trade activity, bids, and offers are applied, resulting in tranche specific prices. These securities are generally categorized in Level 2 of the fair value hierarchy.
Collateralized loan obligations ("CLOs") are valued by evaluating manager rating, seniority in the capital structure, assumptions about prepayment, default and recovery and their impact on cash flow generation. Loan level net asset values are determined and aggregated for tranches and as a final step prices are checked against available recent trade activity. These securities are generally categorized in Level 2 of the fair value hierarchy.
Foreign government debt is valued by surveying the dealer community, obtaining relevant trade data, benchmark quotes and spreads and incorporating this information into the valuation process. These securities are generally categorized in Level 2 of the fair value hierarchy.
Commercial Paper, with an original maturity greater than 90 days, is valued using market data for comparable instruments of similar maturity and average yields. These securities are categorized in Level 2 of the fair value hierarchy.
•Equity securities: Consist of actively traded, exchange-listed equity securities, including exchange traded funds (“ETFs”) and Bond Mutual Funds, with valuations derived from quoted prices for identical assets in active markets that we can access. These securities are valued in Level 1 of the fair value hierarchy.
•Cash Equivalents: Consists of money market funds and treasury bills with valuations derived from quoted prices for identical assets in active markets that we can access. These securities are valued in level 1 of the fair value hierarchy. Instruments in this category valued using market data for comparable instruments are classified as level 2 in the fair value hierarchy.
MGIC Investment Corporation 20222023 Form 10-K | 9398
MGIC Investment Corporation and Subsidiaries
Assets measured at fair value, by hierarchy level, as of December 31, 20222023 and 20212022 are shown in tables 6.1a and 6.1b below. The fair value of the assets is estimated using the process described above, and more fully in Note 3 - "Significant Accounting Policies" to the consolidated financial statements in this Form 10-K. | Assets carried at fair value by hierarchy level as of December 31, 2022 | | Assets carried at fair value by hierarchy level as of December 31, 2023 | | Assets carried at fair value by hierarchy level as of December 31, 2023 |
| Table | Table | 6.1a | |
| (In thousands) | |
| (In thousands) | |
| (In thousands) | (In thousands) | | Fair Value | | Quoted Prices in Active Markets for Identical Assets (Level 1) | | Significant Other Observable Inputs (Level 2) | | Fair Value | | Quoted Prices in Active Markets for Identical Assets (Level 1) | | Significant Other Observable Inputs (Level 2) |
| U.S. Treasury securities and obligations of U.S. government corporations and agencies | U.S. Treasury securities and obligations of U.S. government corporations and agencies | | $ | 135,900 | | | $ | 116,897 | | | $ | 19,003 | |
| Obligations of U.S. states and political subdivisions | Obligations of U.S. states and political subdivisions | | 2,149,054 | | | — | | | 2,149,054 | |
| Corporate debt securities | Corporate debt securities | | 2,221,141 | | | — | | | 2,221,141 | |
| ABS | ABS | | 120,687 | | | — | | | 120,687 | |
| RMBS | RMBS | | 198,009 | | | — | | | 198,009 | |
| CMBS | CMBS | | 237,216 | | | — | | | 237,216 | |
| CLOs | CLOs | | 329,832 | | | — | | | 329,832 | |
| Foreign government debt | Foreign government debt | | 3,787 | | | — | | | 3,787 | |
| Commercial paper | Commercial paper | | 14,072 | | | — | | | 14,072 | |
| Total fixed income securities | Total fixed income securities | | 5,409,698 | | | 116,897 | | | 5,292,801 | |
| Equity securities | Equity securities | | 14,140 | | | 14,140 | | | — | |
| Cash equivalents | | 328,756 | | (1) | 324,129 | | | 4,627 | |
Cash equivalents(1) | |
| Total | Total | | $ | 5,752,594 | | | $ | 455,166 | | | $ | 5,297,428 | |
| Assets carried at fair value by hierarchy level as of December 31, 2021 | | Assets carried at fair value by hierarchy level as of December 31, 2022 | | Assets carried at fair value by hierarchy level as of December 31, 2022 |
| Table | Table | 6.1b | |
| (In thousands) | |
| (In thousands) | |
| (In thousands) | (In thousands) | | Fair Value | | Quoted Prices in Active Markets for Identical Assets (Level 1) | | Significant Other Observable Inputs (Level 2) | | Fair Value | | Quoted Prices in Active Markets for Identical Assets (Level 1) | | Significant Other Observable Inputs (Level 2) |
| U.S. Treasury securities and obligations of U.S. government corporations and agencies | U.S. Treasury securities and obligations of U.S. government corporations and agencies | | $ | 133,407 | | | $ | 102,153 | | | $ | 31,254 | |
| Obligations of U.S. states and political subdivisions | Obligations of U.S. states and political subdivisions | | 2,534,653 | | | — | | | 2,534,653 | |
| Corporate debt securities | Corporate debt securities | | 2,765,982 | | | — | | | 2,765,982 | |
| ABS | ABS | | 150,710 | | | — | | | 150,710 | |
| RMBS | RMBS | | 309,110 | | | — | | | 309,110 | |
| CMBS | CMBS | | 319,130 | | | — | | | 319,130 | |
| CLOs | CLOs | | 360,939 | | | — | | | 360,939 | |
| Foreign government debt | Foreign government debt | | 13,650 | | | — | | | 13,650 | |
| Commercial Paper | |
| Total fixed income securities | Total fixed income securities | | 6,587,581 | | | 102,153 | | | 6,485,428 | |
| Equity securities | Equity securities | | 16,068 | | | 16,068 | | | — | |
Cash equivalents | Cash equivalents | | 254,230 | | (1) | 254,230 | | | — | |
| Total | Total | | $ | 6,857,879 | | | $ | 372,451 | | | $ | 6,485,428 | |
| (1) Includes restricted cash equivalents | (1) Includes restricted cash equivalents | |
Certain financial instruments, including insurance contracts, are excluded from these fair value disclosure requirements. The carrying values of cash and cash equivalents (Level 1) and accrued investment income (Level 2) approximated their fair values. Additional fair value disclosures related to our investment portfolio are included in Note 5 - "Investments."
In addition to the assets carried at fair value discussed above, we have embedded derivatives carried at fair value related to our Home Re Transactions that are classified as Other liabilities or Other assets in our consolidated balance sheets. The estimated fair value related to our embedded derivatives reflects the present value impact of the variation in investment income on the assets held by the reinsurance trusts and the contractual reference rate on the Home Re Transactions used to calculate the reinsurance premiums we estimate we will pay over the estimated remaining life. These liabilities or assets are categorized in Level 3 of the fair value hierarchy. At December 31, 20222023 and 2021,2022, the fair value of the embedded derivatives was an asset of $2.5$2.4 million and a liability of $1.8$2.5 million, respectively. (See Note 4 - "Reinsurance" for more information about our reinsurance programs.Home Re Transactions.)
MGIC Investment Corporation 2022 Form 10-K | 94
MGIC Investment Corporation and Subsidiaries
Real estate acquired through claim settlement is carried at fair values and is reported in “Other assets” on the consolidated balance sheet. These assets are categorized as Level 3 of the fair value hierarchy. Purchases of real estate acquired was $3.5$0.6 million and $4.8
MGIC Investment Corporation 2023 Form 10-K | 99
MGIC Investment Corporation and Subsidiaries
$3.5 million for the years ended December 31, 2022,2023, and 2021,2022, respectively. Sales of real estate acquired was $4.0were $3.8 million and $4.8$4.0 million for the years ended December 31, 2022,2023, and 2021,2022, respectively.
FINANCIAL LIABILITIES NOT MEASURED AT FAIR VALUE
Other invested assets include an investment in FHLB stock that is carried at cost, which due to restrictions that require it to be redeemed or sold only to the security issuer at par value, approximates fair value. The fair value of other invested assets is categorized as Level 2.
Financial liabilities include our outstanding debt obligations. The fair values of our 5.25% Notes and 9% Debentures were based on observable market prices. In all cases the fair values of the financial liabilities below are categorized as level 2.
Table 6.3 presents the carrying value and fair value of our financial assets and liabilities disclosed, but not carried, at fair value as of December 31, 20222023 and 2021.2022.
| | Financial liabilities not carried at fair value | Financial liabilities not carried at fair value | Financial liabilities not carried at fair value |
| Table | Table | 6.3 | |
| | December 31, 2022 | | December 31, 2021 |
| | December 31, 2023 | |
| | December 31, 2023 | |
| | December 31, 2023 | | | December 31, 2022 |
| (In thousands) | (In thousands) | | Carrying Value | | Fair Value | | Carrying Value | | Fair Value | (In thousands) | | Carrying Value | | Fair Value | | Carrying Value | | Fair Value |
| Financial assets | Financial assets | |
| Other invested assets | Other invested assets | | $ | 850 | | | $ | 850 | | | $ | 3,100 | | | $ | 3,100 | |
| Other invested assets | |
| Other invested assets | |
| Financial liabilities | Financial liabilities | |
| FHLB Advance | | $ | — | | | $ | — | | | $ | 155,000 | | | $ | 157,585 | |
| 5.75% Notes | | — | | | — | | | 241,255 | | | 256,213 | |
| 5.25% Notes | |
| 5.25% Notes | |
| 5.25% Notes | 5.25% Notes | | 641,724 | | | 600,938 | | | 640,253 | | | 686,875 | |
| 9% Debentures | 9% Debentures | | 21,086 | | | 28,085 | | | 110,204 | | | 151,000 | |
| Total financial liabilities | Total financial liabilities | | $ | 662,810 | | | $ | 629,023 | | | $ | 1,146,712 | | | $ | 1,251,673 | |
MGIC Investment Corporation 20222023 Form 10-K | 95100
MGIC Investment Corporation and Subsidiaries
DEBT OBLIGATIONS
Table 7.1 shows the carrying value of our long-term debt obligations as of December 31, 20222023 and 2021.2022.
| | Long-term debt obligations | Long-term debt obligations | Long-term debt obligations |
| Table | Table | 7.1 | |
| | December 31, |
| (In millions) | | 2022 | | 2021 |
| FHLB Advance - 1.91%, due February 2023 | | $ | — | | | $ | 155.0 | |
| 5.75% Notes, due August 2023 | | — | | | 241.3 | |
| | December 31, | |
| | December 31, | |
| | December 31, | |
| (In thousands) | | (In thousands) | | 2023 | | 2022 |
| 5.25% Notes, due August 2028 (par value: $650 million) | 5.25% Notes, due August 2028 (par value: $650 million) | | 641.7 | | | 640.2 | |
| 9% Debentures, due April 2063 | 9% Debentures, due April 2063 | | 21.1 | | | 110.2 | |
| Long-term debt, carrying value | | $ | 662.8 | | | $ | 1,146.7 | |
| Long-term debt obligations, carrying value | |
The 5.25% Senior Notes ("5.25% Notes") and 9% Convertible Junior Subordinated Debentures (“9% Debentures”) are obligationsis an obligation of our holding company, MGIC Investment Corporation.
2023 Transactions
In the third quarter of 2023, under the terms of our 9% Debentures, we exercised our option to redeem the outstanding principal of $21.1 million. The 9% Debentures were convertible into shares of MGIC common stock at a rate of 77.9620 shares per $1,000 principal amount. Prior to the redemption date, substantially all holders elected to convert into shares of common stock. Under the terms of the 9% Debentures, we paid cash of $28.6 million in lieu of issuing shares of common stock. The conversion of our 9% Debentures resulted in a $5.3 million reduction in our shareholders’ equity, net of tax, and a reduction of 1.6 million potentially dilutive shares.
2022 Transactions
During 2022, we repurchased $89.1 million in aggregate principal of our 9% Debentures at a purchase price of $121.2 million plus accrued interest. The repurchase of our 9% Debentures resulted in a $32.1 million loss on debt extinguishment on our consolidated statement of operations and a reduction of 6.8 million potentially dilutive shares.
The Federal Home Loan Bank Advance (the “FHLB Advance”) was an obligation of MGIC. In the first quarter of 2022, we repaid the outstanding principal balance of the FHLB Advance at a prepayment price of $156.3 million, incurring a prepayment fee of $1.3 million.
In July 2022, we redeemed the outstanding principal balance of the 5.75% Senior Notes (“5.75% Notes”) through a make-whole price of $248.4 million plus accrued interest. The excess of the make-whole price over the carrying value, plus the write-off of unamortized issuance costs on the par value, resulted in a $6.8 million loss on debt extinguishment. The make-whole amount was calculated as the sum of the present values of the remaining scheduled payments of principal and interest discounted at the treasury rate defined in the notes plus 50 basis points and accrued interest. The 5.75% Notes were an obligation of our holding company.
2021 Transactions
In December 2021, we repurchased $98.6 million in aggregate principal amount of our 9% Debentures at a purchase price of $135.5 million, plus accrued interest. The repurchase of our 9% Debentures resulted in a $36.9 million loss on debt extinguishment on our consolidated statement of operations and a reduction in our potentially dilutive shares by approximately 7.5 million shares.
2020 Transactions
In August 2020, we issued $650 million aggregate principal amount of 5.25% Notes, which are due in 2028 and received net proceeds, after the deduction of underwriting fees, of $640.3 million. In addition to underwriting fees, we incurred approximately $2.0 million of other expenses associated with the issuance of these notes.
We repurchased $182.7 million in aggregate principal amount of our 5.75% notes at a purchase price of $197.8 million, plus accrued interest, using proceeds from the 5.25% Notes issuance. The excess of the purchase price over the carrying value, plus the write-off of unamortized issuance costs on the par value, is reflected as a loss on debt extinguishment of $16.5 million on our consolidated statement of operations.
We repurchased $48.1 million in aggregate principal amount of our 9% Debentures at a purchase price of $61.6 million, plus accrued interest, using proceeds from the 5.25% Notes issuance. The repurchase of 9% Debentures resulted in a $10.2 million loss on debt extinguishment on our consolidated statement of operations; a reduction in our shareholders' equity of $2.7 million related to the reacquisition of the equity component of the 9% Debentures; and a reduction in our potentially dilutive shares by approximately 3.6 million shares.
5.25% Notes
Interest on the 5.25% Notes is payable semi-annually on February 15 and August 15. Prior to August 15, 2023, we may redeem the 5.25% Notes at an amount equal to the sum of (a) the greater of: (i) the sum of the principal amount and the make-whole amount; and (ii) 102.625% of principal; and (b) accrued and unpaid interest. The make-whole amount is the excess of: (1) the present value of the remaining principal, premium and interest payments that would be payable with respect to the note if such note were redeemed on August 15, 2023 (at 102.625% of principal), computed using a discount rate equal to the treasury rate specified in the notes, plus 50 basis points, over (2) the outstanding principal amount of such note.
On and afterUntil August 15, 2023,2024, we may redeem the notes at 102.625% of principal; on or after August 15, 2024, we may redeem the notes at 101.313% of principal; and on or after August 15, 2025, we may redeem the notes at 100% of principal; in each case, plus accrued and unpaid interest.
The 5.25% Notes have covenants and events of default, which are customary for securities of this nature, and further provide that the trustee or holders of at least 25% in aggregate principal amount of the outstanding 5.25% Notes may declare them immediately due and payable upon the occurrence of certain events of default after the expiration of the applicable grace period. In addition, in the case of an event of default arising from certain events of bankruptcy, insolvency or reorganization relating to the Company or any of its significant subsidiaries, the 5.25% Notes will become due and payable immediately. This description is not intended to be complete in all respects and is qualified in its entirety by the terms of the 5.25% Notes, including their covenants and events of default. We were in compliance with all covenants as of December 31, 2022.2023.
MGIC Investment Corporation 2022 Form 10-K | 96
MGIC Investment Corporation and Subsidiaries
9% Debentures
Interest on the 9% Debentures iswas payable semi-annually on April 1 and October 1 of each year. The 9% Debentures are currentlywere convertible, at the holder'sholders' option, at a conversion rate, which is subject to adjustment, of 77.9620into common shares per $1,000 principal amount of the 9% Debentures at any time prior to the maturity date. This represents a conversion price of approximately $12.83 per share. If a holder elects to convert their 9% Debentures, deferred interest, if any, owed on the 9% Debentures being converted is also converted into shares of our common stock. The conversion rate for any deferred interest is based on the average price that our shares traded at during a 5-day period immediately prior to the election to convert.
shares. The 9% Debentures includeincluded a feature that allowsallowed us, at our option, to make a cash payment to converting holders in lieu of issuing shares of common stock upon conversion of the 9% Debentures. We may redeem the 9% Debentures in whole or in part from time to time, at our option, at a redemption price equal to 100% of the principal amount of the 9% Debentures being redeemed, plus any accrued and unpaid interest, if the closing sale price of our common stock exceeds $16.67 (adjusted pro rata for changes in the conversion price) for at least 20 of the 30 trading days preceding notice of the redemption.
This description is not intended to be complete in all respects
MGIC Investment Corporation 2023 Form 10-K | 101
MGIC Investment Corporation and is qualified in its entirety by the terms of the 9% Debentures, including their covenants and events of default. We were in compliance with all covenants at December 31, 2022. The 9% Debentures rank junior to all of our existing and future senior indebtedness.Subsidiaries
INTEREST PAYMENTS
Interest payments were $35.1 million during 2023, $53.7 million during 2022 and $71.7 million during 2021 and $54.3 million during 2020.2021.
MGIC Investment Corporation 2022 Form 10-K | 97
MGIC Investment Corporation and Subsidiaries
As described in Note 3 – “Summary of Significant Accounting Policies – Loss Reserves,” we establish case reserves and loss adjustment expenses ("LAE") reserves on delinquent loans that were reported to us as two or more payments past due and have not become current or resulted in a claim payment. Such loans are referred to as being in our delinquency inventory. Case reserves are established by estimating the number of loans in our delinquency inventory that will result in a claim payment, which is referred to as the claim rate, and further estimating the amount of the claim payment, which is referred to as claim severity.
IBNR reserves are established for estimated losses from delinquencies we estimate have occurred prior to the close of an accounting period, but have not yet been reported to us. IBNR reserves are also established using estimated claim rates and claim severities.
Estimation of losses is inherently judgmental. The conditions that affect the claim rate and claim severity include the current and future state of the domestic economy, including unemployment and the current and future strength of local housing markets; exposure on insured loans; the amount of time between delinquency and claim filing (all else being equal, the longer the period between delinquency and claim filing, the greater the severity); and curtailments and rescissions. The actual amount of the claim payments may be substantially different than our loss reserve estimates. Our estimates could be adversely affected by several factors, including a deterioration of regional or national economic conditions, including unemployment, leading to a reduction in borrowers’ income and thus their ability to make mortgage payments, the impact of past and future government initiatives and actions taken by the GSEs (including mortgage forbearance programs and foreclosure moratoriums), and a drop in housing values which may affect borrower willingness to continue to make mortgage payments when the value of the home is below the mortgage balance. Loss reserves in future periods will also be dependent on the number of loans reported to us as delinquent.
Changes to our estimates could result in a material impact to our consolidated resultsstatements of operations and financial position, even in a stable economic environment. Given the uncertainty of the macroeconomic environment, including the effectiveness of loss mitigation efforts, changechanges in home prices, and changes in unemployment,level of employment, our loss reserve estimates may continue to be impacted.
In considering the potential sensitivity of the factors underlying our estimate of loss reserves, it is possible that even a relatively small change in our estimated claim rate or claim severity could have a material impact on loss reserves and, correspondingly, on our consolidated resultsstatements of operations even in a stable economic environment. For example, as of December 31, 2022,2023, assuming all other factors remain constant, a $1,000 increase/decrease in the average severity reserve factor would change the loss reserve amount by approximately +/- $10$8 million. A one percentage point increase/decrease in the average claim rate reserve factor would change the loss reserve amount by approximately +/- $15$16 million.
The “Losses incurred” section of table 8.1 below shows losses incurred on delinquencies that occurred in the current year and in prior years. The amount of losses incurred relating to delinquencies that occurred in the current year represents the estimated amount to be ultimately paid on such delinquencies. The amount of losses incurred relating to delinquencies that occurred in prior years represents the difference between the actual claim rate and claim severity associated with those delinquencies resolved in the current year compared to the estimated claim rate and claim severity at the prior year-end, as well as a re-estimation of amounts to be ultimately paid on delinquencies continuing from the end of the prior year. This re-estimation of the claim rate and claim severity is the result of our review of current trends in the delinquency inventory, such as percentages of delinquencies that have resulted in a claim, the amount of the claims relative to the average loan exposure, changes in the relative level of delinquencies by geography and changes in average loan exposure.
Losses incurred on delinquencies that occurredreceived in the current year increased in 2022,2023 compared to 2021.2022. The increase is primarily due to an increase in estimated severity on current year delinquencies. In addition, there was a decreasedelinquencies and an increase in IBNR reserve estimates by $5.9 million in 2021, while IBNR estimates increased by $2.3 million in 2022.new delinquencies reported.
In 2023 and 2022, we experienced favorable loss development of $208.5 million and $404.1 million, respectively, on previouslydelinquencies received delinquenciesin prior years. The favorable development for both periods primarily related toresulted from a decrease in the estimatedexpected claim rate. The favorable development primarily resulted from greater than expected cure rates, as borrower reinstatements and servicer mitigation efforts resulted in more cures than originally estimated. Additionally, homerate on previously received delinquencies. Home price appreciation experienced in recent years has allowed some borrowers to cure their delinquencies through the sale of their property. For the year ended December 31, 2021 we experienced favorable loss development of $60.0 million on previously received notices primarily due to the decrease in the claim rate on delinquencies received prior to the COVID-19 pandemic. This was offset by the recognition of a probable loss of $6.3 million related to litigation of our claims paying practices and adverse development on LAE reserves and reinsurance.
MGIC Investment Corporation 20222023 Form 10-K | 98102
MGIC Investment Corporation and Subsidiaries
The “Losses paid” section of table 8.1 below shows the amount of losses paid on delinquencies that occurredreceived in the current year and losses paid on delinquencies that occurred in prior years. At the start of the COVID-19 pandemic, the level of claims received decreased and the average time it took to receive a claim increased. Claim activity has not yet returned to pre-COVID-19 levels.
Table 8.1 provides a reconciliation of beginning and ending loss reserves as of and for the past three years:
| | Development of loss reserves | Development of loss reserves | Development of loss reserves |
| Table | Table | 8.1 | |
| (In thousands) | |
| (In thousands) | |
| (In thousands) | (In thousands) | | 2022 | | 2021 | | 2020 | | 2023 | | 2022 | | 2021 |
| Reserve at beginning of year | Reserve at beginning of year | | $ | 883,522 | | | $ | 880,537 | | | $ | 555,334 | |
| Less reinsurance recoverable | Less reinsurance recoverable | | 66,905 | | | 95,042 | | | 21,641 | |
| Net reserve at beginning of year | Net reserve at beginning of year | | 816,617 | | | 785,495 | | | 533,693 | |
| | Losses incurred: | Losses incurred: | |
| Losses incurred: | |
| Losses incurred: | |
| Losses incurred: | |
| Losses incurred: | |
| Losses incurred: | |
| Losses and LAE incurred in respect of delinquent notices received in: | Losses and LAE incurred in respect of delinquent notices received in: | |
| Losses and LAE incurred in respect of delinquent notices received in: | |
| Losses and LAE incurred in respect of delinquent notices received in: | |
| Current year | |
| Current year | |
| Current year | Current year | | 149,565 | | | 124,592 | | | 345,170 | |
Prior years (1) | Prior years (1) | | (404,130) | | | (60,015) | | | 19,604 | |
| Total losses incurred | Total losses incurred | | (254,565) | | | 64,577 | | | 364,774 | |
| | Losses paid: | Losses paid: | |
| Losses paid: | |
| Losses paid: | |
| Losses paid: | |
| Losses paid: | |
| Losses paid: | |
| Losses and LAE paid in respect of delinquent notices received in: | Losses and LAE paid in respect of delinquent notices received in: | |
| Losses and LAE paid in respect of delinquent notices received in: | |
| Losses and LAE paid in respect of delinquent notices received in: | |
| Current year | |
| Current year | |
| Current year | Current year | | 362 | | | 664 | | | 3,069 | |
| Prior years | Prior years | | 49,626 | | | 68,769 | | | 109,923 | |
Reinsurance terminations (2) | Reinsurance terminations (2) | | (17,684) | | | (35,978) | | | (20) | |
| Total losses paid | Total losses paid | | 32,304 | | | 33,455 | | | 112,972 | |
| Net reserve at end of year | Net reserve at end of year | | 529,748 | | | 816,617 | | | 785,495 | |
| Plus reinsurance recoverables | Plus reinsurance recoverables | | 28,240 | | | 66,905 | | | 95,042 | |
| Reserve at end of year | Reserve at end of year | | $ | 557,988 | | | $ | 883,522 | | | $ | 880,537 | |
(1)A positive number for prior year loss development indicates a deficiency of prior year reserves. A negative number for prior year loss development indicates a redundancy of prior year loss reserves. See the following table for more information about prior year loss development.
(2)In a reinsurance termination, amounts for any incurred but unpaid losses are due to us from the reinsurers. As a result, the amount due from the reinsurers is reclassified from reinsurance recoverable on loss reserves to reinsurance recoverable on paid losses, resulting in no impact to losses incurred. (See Note 9 - "Reinsurance") The prior year loss reserve development offor the reserves in 2022, 2021 and 2020past three years is reflected in the table 8.2 below.
| | Reserve development on previously received delinquencies | Reserve development on previously received delinquencies | Reserve development on previously received delinquencies |
| Table | Table | 8.2 | |
| (In thousands) | (In thousands) | | 2022 | | 2021 | | 2020 |
| (Decrease) in estimated claim rate on primary delinquencies | | $ | (400,577) | | | $ | (82,904) | | | $ | (2,536) | |
| Increase (decrease) in estimated claim severity on primary delinquencies | | (21,995) | | | 310 | | | 13,535 | |
| Change in estimates related to pool reserves, LAE reserves, reinsurance and other | | 18,442 | | | 22,579 | | | 8,605 | |
| (In thousands) | |
| (In thousands) | | | 2023 | | 2022 | | 2021 |
| Increase (decrease) in estimated claim rate on primary defaults | |
| Change in estimates related to severity on primary defaults, pool reserves, LAE reserves, reinsurance, and other | |
Total prior year loss development (1) | Total prior year loss development (1) | | $ | (404,130) | | | $ | (60,015) | | | $ | 19,604 | |
(1)A positive number for prior year loss development indicates a deficiency of prior year loss reserves. A negative number for prior year loss development indicates a redundancy of prior year loss reserves.
MGIC Investment Corporation 20222023 Form 10-K | 99103
MGIC Investment Corporation and Subsidiaries
DELINQUENCY INVENTORY
A roll-forward of our primary delinquency inventory for the years ended December 31, 2023, 2022, 2021, and 20202021 appears in table 8.3 below. The information concerning new notices and cures is compiled from monthly reports received from loan servicers. The level of new notice and cure activity reported in a particular month can be influenced by, among other things, the date on which a servicer generates its report, the number of business days in a month and transfers of servicing between loan servicers.
| | | | | | | | | | | | | | | | | | | | | | | |
| Primary delinquency inventory roll-forward |
| Table | 8.3 | | | | | | |
| | 2022 | | 2021 | | 2020 |
| Beginning delinquent inventory | | 33,290 | | | 57,710 | | | 30,028 | |
| New Notices | | 42,988 | | | 42,432 | | | 106,099 | |
| Cures | | (48,262) | | | (64,896) | | | (76,107) | |
| Paid claims | | (1,305) | | | (1,223) | | | (2,245) | |
| Rescissions and denials | | (35) | | | (38) | | | (65) | |
| Other items removed from inventory | | (289) | | | (695) | | | — | |
| Ending delinquent inventory | | 26,387 | | | 33,290 | | | 57,710 | |
During 2022 and 2021, our losses paid included amounts paid upon commutation of coverage on pools of non-performing loans. As a result of these payments 289 items were removed from the delinquency inventory with an amount paid of $4.6 million in 2022. During 2021, 695 items were removed from delinquency inventory with an amount paid of $13.8 million. | | | | | | | | | | | | | | | | | | | | | | | |
| Primary delinquency inventory roll-forward |
| Table | 8.3 | | | | | | |
| | 2023 | | 2022 | | 2021 |
| Beginning delinquent inventory | | 26,387 | | | 33,290 | | | 57,710 | |
| New Notices | | 46,825 | | | 42,988 | | | 42,432 | |
| Cures | | (46,108) | | | (48,262) | | | (64,896) | |
| Paid claims | | (1,328) | | | (1,305) | | | (1,223) | |
| Rescissions and denials | | (45) | | | (35) | | | (38) | |
| Other items removed from inventory | | (81) | | | (289) | | | (695) | |
| Ending delinquent inventory | | 25,650 | | | 26,387 | | | 33,290 | |
Historically as a delinquency ages it is more likely to result in a claim. The number of consecutive months that a borrower has been delinquent is shown in table 8.4 below.
| | Primary delinquency inventory - consecutive months delinquent | Primary delinquency inventory - consecutive months delinquent | Primary delinquency inventory - consecutive months delinquent |
| Table | Table | 8.4 | |
| | December 31, |
| | 2022 | | 2021 | | 2020 |
| | December 31, | |
| | December 31, | |
| | December 31, | |
| | 2023 | | | | 2023 | | 2022 | | 2021 |
| 3 months or less | 3 months or less | | 8,820 | | 7,586 | | 11,542 |
| 4 - 11 months | 4 - 11 months | | 8,217 | | 7,990 | | 34,620 |
12 months or more (1) | 12 months or more (1) | | 9,350 | | 17,714 | | 11,548 |
| Total | Total | | 26,387 | | 33,290 | | 57,710 |
| | 3 months or less | 3 months or less | | 33 | % | | 23 | % | | 20 | % |
| 3 months or less | |
| 3 months or less | |
| 3 months or less | |
| 3 months or less | |
| 3 months or less | | | 36 | % | | 33 | % | | 23 | % |
| 4 - 11 months | 4 - 11 months | | 31 | % | | 24 | % | | 60 | % | 4 - 11 months | | 35 | % | | 31 | % | | 24 | % |
| 12 months or more | 12 months or more | | 36 | % | | 53 | % | | 20 | % | 12 months or more | | 29 | % | | 36 | % | | 53 | % |
| Total | Total | | 100 | % | | 100 | % | | 100 | % | Total | | 100 | % | | 100 | % | | 100 | % |
| | Primary claims received inventory included in ending delinquent inventory | Primary claims received inventory included in ending delinquent inventory | | 267 | | | 211 | | | 159 | |
| Primary claims received inventory included in ending delinquent inventory | |
| Primary claims received inventory included in ending delinquent inventory | |
| Primary claims received inventory included in ending delinquent inventory | |
| Primary claims received inventory included in ending delinquent inventory | |
| Primary claims received inventory included in ending delinquent inventory | |
(1)Approximately 36%37%, 20%36%, and 31%20% of the delinquent inventory that has been delinquent for 12 consecutive months or more has been delinquent for at least 36 consecutive months as of December 31, 2023, 2022 2021 and 2020,2021, respectively.
COVID-19 Pandemic Delinquencies
We experienced an increase in new delinquency notices in the second and third quarters of 2020 because of the impacts of the COVID-19 pandemic, including the high level of unemployment and economic uncertainty resulting from measures to reduce the transmission of COVID-19. Forbearance programs enacted by the GSEs provided for payment forbearance on mortgages to borrowers experiencing a hardship during the COVID-19 pandemic. Historically, forbearance plans have reduced the incidence of our losses on affected loans. Through December 31, 2022 the vast majority of the delinquencies received in the second and third quarter of 2020 have cured.
POOL INSURANCE DEFAULT INVENTORY
Pool insurance default inventory was 391 at December 31, 2022, 498 at December 31, 2021, and 680 at December 31, 2020.
PREMIUM REFUNDS
Our estimate of premiums to be refunded on expected claim payments is accrued for separately in "Other liabilities" on our consolidated balance sheets and approximated $25.5was $21.1 million and $37.3$25.5 million at December 31, 2023 and 2022, and 2021, respectively. The decrease is driven by a decrease in delinquency inventory as well as a decrease inventory that is twelve or more months delinquent.
MGIC Investment Corporation 20222023 Form 10-K | 100104
MGIC Investment Corporation and Subsidiaries
| | | | | | | | |
NOTE 9 | | Note 9. Reinsurance |
Our consolidated financial statements reflect the effects of assumed and ceded reinsurance transactions. Assumed reinsurance refers to the acceptance of certain insurance risks that other insurance companies have underwritten. Ceded reinsurance involves transferring certain insurance risks (along with, in the case of quota share reinsurance, the related earned premiums) we have underwritten to other insurance companies who agree to share these risks. The purpose of ceded reinsurance is to protect us, at a cost, against losses arising from our mortgage guaranty policies covered by the agreement and to manage our capital requirements under PMIERs. Reinsurance is currently placed on a quota share and excess of loss basis but we also had immaterial captive reinsurance agreements that were in effect through December 31, 2020.basis.
Table 9.1 below shows the effect of all reinsurance agreements on premiums earned and losses incurred as reflected in the consolidated statements of operations.
| | Reinsurance | Reinsurance | Reinsurance |
| Table | Table | 9.1 | |
| | Years ended December 31, |
| | Years ended December 31, | |
| | Years ended December 31, | |
| | Years ended December 31, | |
| (In thousands) | (In thousands) | | 2022 | | 2021 | | 2020 | (In thousands) | | 2023 | | 2022 | | 2021 |
| Premiums earned: | Premiums earned: | |
| Direct | |
| Direct | |
| Direct | Direct | | $ | 1,154,728 | | | $ | 1,167,592 | | | $ | 1,199,824 | |
| Assumed | Assumed | | 8,778 | | | 9,858 | | | 10,848 | |
Ceded - quota share reinsurance (1) | Ceded - quota share reinsurance (1) | | (86,435) | | | (118,537) | | | (167,930) | |
| Ceded - excess-of-loss reinsurance | Ceded - excess-of-loss reinsurance | | (69,938) | | | (44,494) | | | (20,799) | |
| Total ceded | Total ceded | | (156,373) | | | (163,031) | | | (188,729) | |
| Net premiums earned | Net premiums earned | | $ | 1,007,133 | | | $ | 1,014,419 | | | $ | 1,021,943 | |
| | Losses incurred: | Losses incurred: | |
| Losses incurred: | |
| Losses incurred: | |
| Losses incurred: | |
| Losses incurred: | |
| Losses incurred: | |
| Direct | |
| Direct | |
| Direct | Direct | | $ | (274,072) | | | $ | 74,496 | | | $ | 442,194 | |
| Assumed | Assumed | | (330) | | | (57) | | | 555 | |
| Ceded - quota share reinsurance | Ceded - quota share reinsurance | | 19,837 | | | (9,862) | | | (77,975) | |
| Losses incurred, net | Losses incurred, net | | $ | (254,565) | | | $ | 64,577 | | | $ | 364,774 | |
| | Other Reinsurance Impacts: | Other Reinsurance Impacts: | |
| Other Reinsurance Impacts: | |
| Other Reinsurance Impacts: | |
Profit commission on quota share reinsurance (1) | |
Profit commission on quota share reinsurance (1) | |
Profit commission on quota share reinsurance (1) | Profit commission on quota share reinsurance (1) | | $ | 176,084 | | | $ | 153,759 | | | $ | 72,425 | |
| Ceding commission on quota share reinsurance | Ceding commission on quota share reinsurance | | 52,071 | | | 53,460 | | | 48,077 | |
(1)Ceded premiums earned are shown net of profit commission.
QUOTA SHARE REINSURANCE
We have entered into quota share reinsurance ("QSR")QSR transactions with panels of third-party reinsurers to cede a fixed quota share percentage of premiums earned and received and losses incurred on insurance covered by the transactions. We receive the benefit of a ceding commission equal to 20% of premiums ceded before profit commission. We also receive the benefit of a profit commission through a reduction of premiums we cede. The profit commission varies inversely with the level of losses on a “dollar for dollar” basis and can be eliminated at annual loss ratios higher than we have experienced on our QSR transactions. Ceded losses incurred are impacted by the delinquencies covered by our QSR Transactions, our estimates of payments that will be ultimately made on those delinquencies, and claim payments covered by our QSR Transactions.
Each of our QSR transactions typically have annual loss ratio caps of 300% and lifetime loss ratios of 200%.
MGIC Investment Corporation 20222023 Form 10-K | 101105
MGIC Investment Corporation and Subsidiaries
Table 9.2 below provides additional detail regarding our QSR transactions in effect during 2022.2023.
| | Reinsurance | Reinsurance | Reinsurance |
| Table | Table | 9.2 | |
| | Quota Share Contract | Quota Share Contract | | Covered Policy Years | Quota Share % | | Annual Loss Ratio to Exhaust Profit Commission (1) | | Contractual Termination Date |
2015 QSR (2) | | Prior to 2017 | 15.0 | % | | 68.0 | % | | December 31, 2031 |
2019 QSR (2) | | 2019 | 30.0 | % | | 62.0 | % | | December 31, 2030 |
| | Quota Share Contract | |
| | Quota Share Contract | | | Covered Policy Years | Quota Share % | | Annual Loss Ratio to Exhaust Profit Commission (1) | | Contractual Termination Date |
| 2020 QSR | 2020 QSR | | 2020 | 12.5 | % | | 62.0 | % | | December 31, 2031 | 2020 QSR | | 2020 | 12.5 | % | | 62.0 | % | | (2) |
| 2020 QSR and 2021 QSR | 2020 QSR and 2021 QSR | | 2020 | 17.5 | % | | 62.0 | % | | December 31, 2032 | 2020 QSR and 2021 QSR | | 2020 | 17.5 | % | | 62.0 | % | | (2) |
| 2020 QSR and 2021 QSR | 2020 QSR and 2021 QSR | | 2021 | 17.5 | % | | 61.9 | % | | December 31, 2032 | 2020 QSR and 2021 QSR | | 2021 | 17.5 | % | | 61.9 | % | | December 31, 2032 |
| 2021 QSR and 2022 QSR | 2021 QSR and 2022 QSR | | 2021 | 12.5 | % | | 57.5 | % | | December 31, 2032 | 2021 QSR and 2022 QSR | | 2021 | 12.5 | % | | 57.5 | % | | December 31, 2032 |
| 2021 QSR and 2022 QSR | 2021 QSR and 2022 QSR | | 2022 | 15.0 | % | | 57.5 | % | | December 31, 2033 | 2021 QSR and 2022 QSR | | 2022 | 15.0 | % | | 57.5 | % | | December 31, 2033 |
| 2022 QSR and 2023 QSR | 2022 QSR and 2023 QSR | | 2022 | 15.0 | % | | 62.0 | % | | December 31, 2033 | 2022 QSR and 2023 QSR | | 2022 | 15.0 | % | | 62.0 | % | | December 31, 2033 |
| 2022 QSR and 2023 QSR | 2022 QSR and 2023 QSR | | 2023 | 15.0 | % | | 62.0 | % | | December 31, 2034 | 2022 QSR and 2023 QSR | | 2023 | 15.0 | % | | 62.0 | % | | December 31, 2034 |
Credit Union QSR (3) | | 2020-2025 | 65.0 | % | | 50.0 | % | | December 31, 2039 |
| 2023 QSR | | 2023 QSR | | 2023 | 10.0 | % | | 58.5 | % | | December 31, 2034 |
| Credit Union QSR | | Credit Union QSR | | 2020-2025 | 65.0 | % | | 50.0 | % | | December 31, 2039 |
(1)We will receive a profit commission provided the annual loss ratio on policies covered under the transaction remains below this ratio.
(2)2015 and 20192020 QSR Transactions covering 2020 policy year were terminated effective December 31, 2022.
(3)Eligible credit union business written before April 1, 2020 was covered by our 2019 and prior QSR Transactions.2023.
We have agreed to termsexecuted a 30.0% QSR Transaction with a group of unaffiliated reinsurers for a reinsurance transaction with an effective date of January 1, 20232024 with a similar structure to our existing QSR transactions that will cover most of our NIW in 2023 (with an additional 10.0% quota share).2024. Generally, we will receive an annual profit commission provided the annual loss ratio on the loans covered under the transaction remainremains below 58.5%56.0%.
We can elect to terminate the QSR Transactions under specified scenarios without penalty upon prior written notice, including if we will receive less than 90% (80% for the Credit Union QSR Transaction) of the full credit amount under the PMIERs, full financial statement credit or full credit under applicable regulatory capital requirements for the risk ceded in any required calculation period. Early termination of the QSR agreements can also be elected by us for a fee, or under specified scenarios for no fee upon prior written notice.
Table 9.3 provides additional detail regarding optional termination dates and optional reductions to our quota share percentage which can, in each case be elected by us for a fee. TheUnder the optional reduction to the quota share percentage, would give us an option towe may reduce our quota share percentage from the original percentage as shown in table 9.2 to the percentage showed in 9.3.
| | | | | | | | | | | | | | | | | | | | |
| Reinsurance |
| Table 9.3 | | | | | | |
| |
| Quota Share Contract | Covered Policy Years | Optional Termination Date (1) | Optional Quota Share % Reduction Date (2) | | Optional Reduced Quota Share % |
2020 QSR | 2020 | June 30, 2023 | January 1, 2023 | | 10.5% or 8% |
2020 QSR and 2021 QSR | 2020 | June 30, 2023 | January 1, 2023 | | 14.5% or 12% |
| 2020 QSR and 2021 QSR | 2021 | December 31, 2023June 30, 2024 | January 1, 20232024 | | 14.5% or 12% |
| 2021 QSR and 2022 QSR | 2021 | December 31, 2023June 30, 2024 | January 1, 20232024 | | 10.5% or 8% |
| 2021 QSR and 2022 QSR | 2022 | December 31, 2024 | JulyJanuary 1, 20232024 | | 12.5% or 10% |
| 2022 QSR and 2023 QSR | 2022 | December 31, 2024 | JulyJanuary 1, 20232024 | | 12.5% or 10% |
| 2022 QSR and 2023 QSR | 2023 | December 31, 2025 | July 1, 2024 | | 12.5% or 10% |
| 2023 QSR | 2023 | December 31, 2025 | July 1, 2024 | | 8% or 7% |
(1) We can elect early termination of the QSR transaction beginning on this date, and bi-annually thereafter.
(2) We can elect to reduce the quota share percentage beginning on this date, and bi-annually thereafter.
We incurred an early termination fee of $5.1 million for our 2020 QSR Transaction effective December 31, 2023, $2.2 million for the termination of our 2019 QSR Transaction effective December 31, 2022 and $5.0 million for the termination of our 2017 and 2018 QSR Transactions effective December 31, 2021. We also terminated our 2015 QSR Transaction effective December 31, 2022. The reinsurance recoverable on paid losses due from reinsurers for loss and LAE reserves incurred at the time of termination includes $9.4 million as December 31, 2023 from reinsurer participating in the 2020 QSR Transaction and $17.7 million as of December 31, 2022 from reinsurers participating in the 2015 and 2019 QSR Transactions and included $36.0 million as of December 31, 2021 due from reinsurers participating in the 2017 and 2018 QSR Transactions.
Ceded premiums written and earned, net of profit commission, decreased in 2022 due to the increase in profit commission. The increase in profit commission was a result of ceded losses incurred. Ceded losses incurred for the year ended December 31, 2022 primarily reflect favorable loss reserve development. See Note 8 - “Loss Reserves” for discussion of our loss reserves.
MGIC Investment Corporation 2022 Form 10-K | 102
MGIC Investment Corporation and Subsidiaries
Under the terms of our QSR Transactions, currently in effect, ceded premiums, ceding commissions, profit commission, and ceded loss paid and LAE paid are settled net on a quarterly basis. The ceded premiums due after deducting the related ceding commission and profit commission is reported within "Other liabilities" on the consolidated balance sheets.
The reinsurance recoverable on loss reserves related to our QSR Transactions was $33.3 million as of December 31, 2023 and $28.2 million as of December 31, 2022 and $66.9 million as of December 31, 2021.2022. The reinsurance recoverable balance is secured by funds on deposit from the reinsurers (which does not include letters of credit), the minimum amount of which is based on the greater of 1) a reinsurer's funding requirements under PMIERs or 2) ceded reserves and unpaid losses. Each of the reinsurers under our quota share reinsurance agreements described above
MGIC Investment Corporation 2023 Form 10-K | 106
MGIC Investment Corporation and Subsidiaries
has an insurer financial strength rating of A- or better (or a comparable rating) by Standard and Poor's Rating Services, A.M. Best, Moody's, or a combination of the three. An allowance for credit losses was not required foras of December 31, 2023 or December 31, 2022 or 2021.
EXCESS OF LOSS REINSURANCE
We have Excess-of-loss transactions (“XOL Transactions”)Transactions with a panel of unaffiliated reinsurers executed through the traditional reinsurance market (“Traditional XOL Transaction”Transactions”) and with unaffiliated special purpose insurers (“Home Re Transactions”).
The 2022For the policies covered under our Traditional XOL Transaction provides reinsurance coverage on eligible NIW in 2022. For the covered policies,Transactions, we retain the first layer of the aggregate losses paid, and the reinsurers will then provide second layer coverage up to the outstanding reinsurance coverage amount. We retain losses paid in excess of the outstanding reinsurance coverage amount. The reinsurance coverage is subject to adjustment based on the risk characteristics of the covered loans.loans until the initial excess of loss reinsurance coverage layer has been finalized.
We can elect to terminate our Traditional XOL TransactionTransactions under specified scenarios without penalty upon prior written notice, including if we will receive less than the full credit amount under the PMIERs, full financial statement credit or full credit under applicable regulatory capital requirements for the risk ceded in any required calculation period. The reinsurance premiums ceded tounder the Traditional XOL TransactionTransactions are based off the remaining reinsurance coverage levels. The reinsured coverage levels are secured by funds on deposit from reinsurers (which does not include letters of credit), the minimum amount of which is based on the greater of 1) a reinsurer's funding requirements under PMIERs or 2) ceded reserves and unpaid losses. Each of the reinsurers under our Traditional XOL Transactions has an insurer financial strength rating of A- or better (or a comparable rating) by Standard and Poor’s Rating Services, A.M. Best, Moody’s, or a combination of the three.
The Home Re Transactions are executed with unaffiliated special purpose insurers (“Home Re Entities”). For the reinsurance coverage periods, we retain the first layer of the respective aggregate losses paid, and a Home Re Entity will then provide second layer coverage up to the outstanding reinsurance coverage amount. We retain losses paid in excess of the outstanding reinsurance coverage amount. Subject to certain conditions, the reinsurance coverage decreases over a period of either 10 or 12.5 years, depending on the transaction, as the underlying covered mortgages amortize or are repaid, or mortgage insurance losses are paid.
The Home Re Entities financed the coverages by issuing mortgage insurance-linked notes (“ILNs”) to unaffiliated investors in an aggregate amount equal to the initial reinsurance coverage amounts. Each ILN is non-recourse to any assets of MGIC or affiliates. The proceeds of the ILNs, which were deposited into reinsurance trusts for the benefit of MGIC, will be the source of reinsurance claim payments to MGIC and principal repayments on the ILNs.
When a “Trigger Event” is in effect, as definedIn October 2023, Home Re 2019-1 Ltd., Home Re 2021-1 Ltd., and Home Re 2021-2 Ltd conducted tender offers for certain tranches of the mortgage insurance-linked notes that supported the reinsurance agreements with MGIC. The tender offer resulted in the relatedreduction in the insurance-linked notes transaction agreements, paymentof $187.1 million for the Home Re 2019-1 Ltd, $91.1 million for the Home Re 2021-1 Ltd., and $106.7 million for the Home Re 2021-2 Ltd. The reinsurance coverage corresponding to the tendered notes was terminated. MGIC incurred $8.0 million of additional ceded premium in the fourth quarter associated with the cost of the tender offer premiums and associated expenses.
Payment of principal on the related insurance-linked notes will be suspended and the reinsurance coverage available to MGIC under the transactions will not be reduced by such principal payments.payments until a target level of credit enhancement is obtained or if certain thresholds or “Trigger Events” are reached, as defined in the related insurance-linked notes transaction agreement. As of December 31, 2022,2023, a "Trigger Event" has occurred on our Home Re 2019-1 transaction because the reinsured principal balance of loans that were reported 60 or more days delinquent exceeded a percentage of the total reinsured principal balance of loans specified under eachthe transaction. A "Trigger Event" has also occurred on the Home Re 2022-12023-1 transaction because the target level of credit enhancement ofon the most senior tranche is less than the target credit enhancement.has not been met.
In January 2024, we exercised our optional call feature to terminate the reinsurance agreement with Home Re 2020-1, Ltd. In connection with the termination, the insurance linked notes issued by Home Re 2020-1 Ltd. will be redeemed in full.
MGIC Investment Corporation 20222023 Form 10-K | 103107
MGIC Investment Corporation and Subsidiaries
Table 9.4a , 9.4b, and 9.4b provides9.4c provide a summary of our XOL Transactions as of December 31, 2022,2023, December 31, 20212022 and December 31, 2020.2021.
| | | | | | | | | | | | | | | | | | | | |
| Excess of Loss Reinsurance |
| 9.4a | | | | | | |
| ($ in thousands) | Issue Date | Policy In force Dates | Optional Call/ Termination Date (1) | Legal Maturity | Initial First Layer Retention | Initial Excess of Loss Reinsurance Coverage |
| Home Re 2022-1, Ltd. | April 26, 2022 | May 29, 2021 - December 31, 2021 | April 25, 2028 | 12.5 years | $325,589 | $473,575 |
| Home Re 2021-2, Ltd. | August 3, 2021 | January 1, 2021 - May 28, 2021 | July 25, 2028 | 12.5 years | 190,159 | 398,429 |
| Home Re 2021-1, Ltd. | February 2, 2021 | August 1, 2020 - December 31, 2020 | January 25, 2028 | 12.5 years | 211,159 | 398,848 |
| Home Re 2020-1, Ltd. | October 29, 2020 | January 1, 2020 - July 31, 2020 | October 25, 2027 | 10 years | 275,283 | 412,917 |
| Home Re 2019-1, Ltd. | May 25, 2019 | January 1, 2018 - March 31, 2019 | May 25, 2026 | 10 years | 185,730 | 315,739 |
| Home Re 2018-1, Ltd. | October 30, 2018 | July 1, 2016 - December 31, 2017 | October 25, 2025 | 10 years | 168,691 | 318,636 |
| 2022 Traditional XOL | April 1, 2022 | January 1, 2022 - December 30, 2022 | January 1, 2030 | 10 years | 82,523 | 142,642 |
| | | | | | | | | | | | | | |
| Excess of Loss Reinsurance |
| 9.4a | | | | |
| ($ in thousands) | Issue Date | Policy In force Dates | Optional Call/ Termination Date (1) | Legal Maturity |
| 2023 Traditional XOL | April 1, 2023 | January 1, 2023 - December 29, 2023 | January 1, 2031 | 10 years |
| 2022 Traditional XOL | April 1, 2022 | January 1, 2022 - December 30, 2022 | January 1, 2030 | 10 years |
| Home Re 2023-1, Ltd. | October 23, 2023 | June 1, 2022 - August 31, 2023 | October 25, 2028 | 10 years |
| Home Re 2022-1, Ltd. | April 26, 2022 | May 29, 2021 - December 31, 2021 | April 25, 2028 | 12.5 years |
| Home Re 2021-2, Ltd. | August 3, 2021 | January 1, 2021 - May 28, 2021 | July 25, 2028 | 12.5 years |
| Home Re 2021-1, Ltd. | February 2, 2021 | August 1, 2020 - December 31, 2020 | January 25, 2028 | 12.5 years |
| Home Re 2020-1, Ltd. | October 29, 2020 | January 1, 2020 - July 31, 2020 | October 25, 2027 | 10 years |
| Home Re 2019-1, Ltd. | May 25, 2019 | January 1, 2018 - March 31, 2019 | May 25, 2026 | 10 years |
| Home Re 2018-1, Ltd. | October 30, 2018 | July 1, 2016 - December 31, 2017 | October 25, 2025 | 10 years |
(1)We have the right to terminate the Home Re Transactions under certain circumstances, including an optional call feature that provides us the right to terminate if the outstanding principal balance of the related insurance-linked notes falls below 10% of the initial principal balance of the related insurance-linked notes, and on any payment date on or after the respective Optional Call date.Date. We can elect early termination of the Traditional XOL TransactionTransactions beginning on this date, and quarterly thereafter.
| | | | | | | | | | | | | | | | | | | | | | | | | | | | | | | | | | | | | | |
| | | | | | | | | | | | |
| 9.4b | | Remaining First Layer Retention | | Remaining Excess of Loss Reinsurance Coverage |
| ($ in thousands) | | December 31, 2022 | | December 31, 2021 | | December 31, 2020 | | December 31, 2022 | | December 31, 2021 | | December 31, 2020 |
| Home Re 2022-1, Ltd. | | $ | 325,576 | | | $ | — | | | $ | — | | | $ | 473,575 | | | $ | — | | | $ | — | |
| Home Re 2021-2, Ltd. | | 190,097 | | | 190,159 | | | — | | | 352,084 | | | 398,429 | | | — | |
| Home Re 2021-1, Ltd. | | 211,102 | | | 211,142 | | | — | | | 277,053 | | | 387,830 | | | — | |
| Home Re 2020-1, Ltd. | | 274,871 | | | 275,204 | | | 275,283 | | | 113,247 | | | 234,312 | | | 412,917 | |
| Home Re 2019-1, Ltd. | | 183,540 | | | 183,917 | | | 184,514 | | | 208,146 | | | 208,146 | | | 208,146 | |
| Home Re 2018-1, Ltd. | | 164,849 | | | 165,365 | | | 166,005 | | | 140,993 | | | 218,343 | | | 218,343 | |
| 2022 Traditional XOL | | 82,517 | | | — | | | — | | | 142,642 | | | — | | | — | |
| | | | | | | | | | | | | | |
| Excess of Loss Reinsurance | | |
| 9.4b | | Remaining First Layer Retention |
| ($ in thousands) | Initial First Layer Retention | December 31, 2023 | December 31, 2022 | December 31, 2021 |
| 2023 Traditional XOL | $70,578 | $ | 70,578 | | $ | $ |
| 2022 Traditional XOL | 82,523 | 82,346 | | 82,517 | | |
| Home Re 2023-1, Ltd. | 272,961 | 272,961 | | | |
| Home Re 2022-1, Ltd. | 325,589 | 325,001 | | 325,576 | | |
| Home Re 2021-2, Ltd. | 190,159 | 189,403 | | 190,097 | | 190,159 | |
| Home Re 2021-1, Ltd. | 211,159 | 210,831 | | 211,102 | | 211,142 | |
| Home Re 2020-1, Ltd. | 275,283 | 261,280 | | 275,051 | | 275,204 | |
| Home Re 2019-1, Ltd. | 185,730 | 182,722 | | 183,540 | | 183,917 | |
| Home Re 2018-1, Ltd. | 168,691 | 164,335 | | 164,849 | | 165,365 | |
| | | | | | | | | | | | | | | | | | | | |
| 9.4c | | | | Remaining Excess of Loss Reinsurance Coverage (1) |
| ($ in thousands) | Initial Excess of Loss Reinsurance Coverage (1) | Initial Funding Percentage (2) | Funding Percentage at 12/31/2023 (2) | December 31, 2023 | December 31, 2022 | December 31, 2021 |
| 2023 Traditional XOL | $ | 96,942 | | N/A | N/A | $ | 96,942 | | $ | $ |
| 2022 Traditional XOL | 142,642 | | N/A | N/A | 142,642 | | 142,642 | | |
| Home Re 2023-1, Ltd. | 330,277 | | 97 | % | 97 | % | 330,277 | | | |
| Home Re 2022-1, Ltd. | 473,575 | | 100 | % | 100 | % | 420,731 | | 473,575 | | |
Home Re 2021-2, Ltd. (3) | 398,429 | | 100 | % | 68 | % | 173,960 | | 352,084 | | 398,429 | |
Home Re 2021-1, Ltd. (3) | 398,848 | | 100 | % | 65 | % | 117,982 | | 277,053 | | 387,830 | |
| Home Re 2020-1, Ltd. | 412,917 | | 100 | % | 100 | % | 41,846 | | 113,247 | | 234,312 | |
Home Re 2019-1, Ltd. (3) | 315,739 | | 100 | % | 10 | % | 21,039 | | 208,146 | | 208,146 | |
| Home Re 2018-1, Ltd. | 318,636 | | 100 | % | 100 | % | 69,762 | | 140,993 | | 218,343 | |
(1)The initial and remaining excess of loss reinsurance coverage is reduced by the applicable funding percentage.
(2)The funding percentage represents the aggregate outstanding note balances divided by the aggregate ending coverage amounts.
(3)The funding percentage on the 2021-1, 2021-2, and 2019-1 were reduced from 100% after the tender offers were conducted in the fourth quarter of 2023.
MGIC Investment Corporation 20222023 Form 10-K | 104108
MGIC Investment Corporation and Subsidiaries
The reinsurance premiums ceded to each Home Re Entity are composed of coverage, initial expense and supplemental premiums. The coverage premiums are generally calculated as the difference between the amount of interest payable by the Home Re Entity on the remaining reinsurance coverage levels, and the investment income collected on the collateral assets held in reinsurance trust account and used to collateralize the Home Re Entity's reinsurance obligation to MGIC. The amount of monthly reinsurance coverage premium ceded will fluctuate due to changes in the reference rate and changes in money market rates that affect investment income collected on the assets in the reinsurance trust. The Home Re 2021-2 and Home Re 2022-1 Transactions references SOFR, while the remaining Home Re Transactions reference the one-month LIBOR. As a result, we concluded that each Home Re Transaction contains an embedded derivative that is accounted for separately as a freestanding derivative. The fair values of the derivatives at December 31, 20222023 and December 31, 2021,2022, were not material to our consolidated balance sheet, and the change in fair values during the years ended December 31, 2022,2023, December 31, 20212022 and December 31, 20202021 were not material to our consolidated statements of operations. (see Note 5 - "Investments""Investments" and Note 6 - "Fair"Fair Value Measurements"Measurements" ).
At the time the Home Re Transactions were entered into, we concluded that each Home Re Entity is a variable interest entity (“VIE”). A VIE is a legal entity that does not have sufficient equity at risk to finance its activities without additional subordinated financial support or is structured such that equity investors lack the ability to make sufficient decisions relating to the entity’s operations through voting rights or do not substantively participate in gains and losses of the entity. Given that MGIC (1) does not have the unilateral power to direct the activities that most significantly affect each Home Re Entity’s economic performance and (2) does not have the obligation, outside the terms of the reinsurance agreement, to absorb losses or the right to receive benefits of each Home Re Entity that could be significant to the Home Re Entity, consolidation of the Home Re Entities is not required.
We are required to disclose our maximum exposure to loss, which we consider to be an amount that we could be required to record in our statements of operations, as a result of our involvement with the VIEs under our Home Re Transactions. As of December 31, 2022,2023, December 31, 20212022 and December 31, 2020,2021, we did not have material exposure to the VIEs as we have no investment in the VIEs and had no reinsurance claim payments due from the VIEs under our reinsurance transactions. We are unable to determine the timing or extent of claims from losses that are ceded under the reinsurance transactions. The VIE assets are deposited in reinsurance trusts for the benefit of MGIC that will be the source of reinsurance claim payments to MGIC. The purpose of the reinsurance trusts is to provide security to MGIC for the obligations of the VIEs under the reinsurance transactions. The trustee of the reinsurance trusts, a recognized provider of corporate trust services, has established segregated accounts within the reinsurance trusts for the benefit of MGIC, pursuant to the trust agreements. The trust agreements are governed by, and construed in accordance with, the laws of the State of New York. If the trustee of the reinsurance trusts failed to distribute claim payments to us as provided in the reinsurance trusts, we would incur a loss related to our losses ceded under the reinsurance transactions and deemed unrecoverable. We are also unable to determine the impact such
possible failure by the trustee to perform pursuant to the reinsurance trust agreements may have on our consolidated financial statements. As a result, we are unable to quantify our maximum exposure to loss related to our involvement with the VIEs. MGIC has certain termination rights under the reinsurance transactions should its claims not be paid. We consider our exposure to loss from our reinsurance transactions with the VIEs to be remote.
Table 9.5 presents the total assets of the Home Re Entities as of December 31, 20222023 , December 31, 20212022 and December 31, 2020.2021.
| | | | | | | | | | | |
Home Re Entities total assets |
Table | 9.5 | | |
| | |
(In thousands) | | |
Home Re Entity | | Total VIE Assets |
December 31, 2022 | | |
Home Re 2018-1 Ltd. | | $ | 146,822 | |
Home Re 2019-1 Ltd. | | 208,146 | |
Home Re 2020-1 Ltd. | | 119,159 | |
Home Re 2021-1 Ltd. | | 285,039 | |
Home Re 2021-2 Ltd. | | 357,340 | |
Home Re 2022-1 Ltd. | | 473,575 | |
| | |
December 31, 2021 | | |
Home Re 2018-1 Ltd. | | $ | 218,343 | |
Home Re 2019-1 Ltd. | | 208,146 | |
Home Re 2020-1 Ltd. | | 251,387 | |
Home Re 2021-1 Ltd. | | 398,848 | |
Home Re 2021-2 Ltd. | | 398,429 | |
| | |
December 31, 2020 | | |
Home Re 2018-1 Ltd. | | $ | 218,343 | |
Home Re 2019-1 Ltd. | | 208,146 | |
Home Re 2020-1 Ltd. | | 412,917 | |
| | | | | | | | | | | | | | | | | |
| Home Re Entities total assets | | |
| Table | 9.5 | | | | |
| | | | |
| (In thousands) | | | | |
| Home Re Entity | | Total VIE Assets |
| | December 31, 2023 | December 31, 2022 | December 31, 2021 |
| Home Re 2023-1 Ltd. | | $ | 330,277 | | $ | — | | $ | — | |
| Home Re 2022-2 Ltd. | | 427,279 | | 473,575 | | — | |
| Home Re 2021-2 Ltd. | | 174,431 | | 357,340 | | 398,429 | |
| Home Re 2021-1 Ltd. | | 118,043 | | 285,039 | | 398,848 | |
| Home Re 2020-1 Ltd. | | 41,846 | | 119,159 | | 251,387 | |
| Home Re 2019-1 Ltd. | | 21,039 | | 208,146 | | 208,146 | |
| Home Re 2018-1 Ltd. | | 73,872 | | 146,822 | | 218,343 | |
| | | | |
The reinsurance trust agreements provide that the trust assets may generally only be invested in certain money market funds that (1) invest at least 99.5% of their total assets in cash or direct U.S. federal government obligations, such as U.S. Treasury bills, as well as other short-term securities backed by the full faith and credit of the U.S. federal government or issued by an agency of the U.S. federal government, (2) have a principal stability fund rating of “AAAm” by S&P or a money market fund rating of “Aaa-mf” by Moody’s as of the Closing Date and thereafter maintain any rating with either S&P or Moody’s, and (3) are permitted investments under the applicable credit for reinsurance laws and applicable PMIERs credit for reinsurance requirements.
The total calculated PMIERs credit for risk ceded under our XOL Transactions is generally based on the PMIERs requirement of the covered policies and the attachment and detachment points of the coverage, all of which fluctuate over time. (see Note 1 - "Nature of Business" and Note 2 - "Basis of Presentation" ).
MGIC Investment Corporation 20222023 Form 10-K | 105109
MGIC Investment Corporation and Subsidiaries
| | | | | | | | |
NOTE 10 | | Note 10. Other Comprehensive Income (Loss) |
The pretax components of our other comprehensive income (loss) and related income tax benefit (expense) for the years ended December 31, 2023, 2022 2021 and 20202021 are included in table 10.1 below.
| | Components of other comprehensive income (loss) | Components of other comprehensive income (loss) | Components of other comprehensive income (loss) |
| Table | Table | 10.1 | |
| (In thousands) | (In thousands) | | 2022 | | 2021 | | 2020 |
| (In thousands) | |
| (In thousands) | | | 2023 | | 2022 | | 2021 |
| Net unrealized investment (losses) gains arising during the period | Net unrealized investment (losses) gains arising during the period | | $ | (707,005) | | | $ | (154,555) | | | $ | 169,135 | |
| Income tax benefit (expense) | | 148,471 | | | 32,456 | | | (35,519) | |
| Income tax (expense) benefit | |
| Net of taxes | Net of taxes | | (558,534) | | | (122,099) | | | 133,616 | |
| | Net changes in benefit plan assets and obligations | |
| Net changes in benefit plan assets and obligations | |
| Net changes in benefit plan assets and obligations | |
| Net changes in benefit plan assets and obligations | |
| Net changes in benefit plan assets and obligations | |
| Net changes in benefit plan assets and obligations | Net changes in benefit plan assets and obligations | | (54,017) | | | 31,613 | | | 13,288 | |
| Income tax benefit (expense) | Income tax benefit (expense) | | 11,343 | | | (6,638) | | | (2,791) | |
| Net of taxes | Net of taxes | | (42,674) | | | 24,975 | | | 10,497 | |
| | | Total other comprehensive income (loss) | Total other comprehensive income (loss) | | (761,022) | | | (122,942) | | | 182,423 | |
| | Total other comprehensive income (loss) | |
| | Total other comprehensive income (loss) | |
| Total income tax benefit (expense) | Total income tax benefit (expense) | | 159,814 | | | 25,818 | | | (38,310) | |
| Total other comprehensive income (loss), net of tax | Total other comprehensive income (loss), net of tax | | $ | (601,208) | | | $ | (97,124) | | | $ | 144,113 | |
The pretax and related income tax benefit (expense) components of the amounts reclassified from our accumulated other comprehensive income (loss) ( "AOCI") to our consolidated statements of operations for the years ended December 31, 2023, 2022 2021 and 20202021 are included in table 10.2 below.
| | Reclassifications from Accumulated Other Comprehensive Income (Loss) | Reclassifications from Accumulated Other Comprehensive Income (Loss) | Reclassifications from Accumulated Other Comprehensive Income (Loss) |
| Table | Table | 10.2 | |
| (In thousands) | |
| (In thousands) | |
| (In thousands) | (In thousands) | | 2022 | | 2021 | | 2020 | | 2023 | | 2022 | | 2021 |
Reclassification adjustment for net realized (losses) gains (1) | Reclassification adjustment for net realized (losses) gains (1) | | $ | (9,860) | | | $ | 10,455 | | | $ | 13,862 | |
| Income tax benefit (expense) | Income tax benefit (expense) | | 2,070 | | | (2,195) | | | (2,912) | |
| Net of taxes | Net of taxes | | (7,790) | | | 8,260 | | | 10,950 | |
| Reclassification adjustment related to benefit plan assets and obligations (2) | |
Reclassification adjustment related to benefit plan assets and obligations (2) | |
Reclassification adjustment related to benefit plan assets and obligations (2) | |
Reclassification adjustment related to benefit plan assets and obligations (2) | |
Reclassification adjustment related to benefit plan assets and obligations (2) | |
Reclassification adjustment related to benefit plan assets and obligations (2) | Reclassification adjustment related to benefit plan assets and obligations (2) | (16,750) | | | (9,779) | | | (15,968) | |
| Income tax benefit (expense) | Income tax benefit (expense) | | 3,518 | | | 2,053 | | | 3,353 | |
| Net of taxes | Net of taxes | | (13,232) | | | (7,726) | | | (12,615) | |
| | | Total reclassifications | Total reclassifications | | (26,610) | | | 676 | | | (2,106) | |
| | Total reclassifications | |
| | Total reclassifications | |
| | Total reclassifications | |
| | Total reclassifications | |
| | Total reclassifications | |
| Income tax benefit (expense) | Income tax benefit (expense) | | 5,588 | | | (142) | | | 441 | |
| Total reclassifications, net of tax | Total reclassifications, net of tax | | $ | (21,022) | | | $ | 534 | | | $ | (1,665) | |
(1)(Decreases) increases Net gains (losses) on investments and other financial instruments on the consolidated statements of operations.
(2)Decreases (increases) Other underwriting and operating expenses, net on the consolidated statements of operations.
MGIC Investment Corporation 20222023 Form 10-K | 106110
MGIC Investment Corporation and Subsidiaries
A roll-forward of AOCI for the years ended December 31, 2023, 2022, 2021, and 2020,2021, including amounts reclassified from AOCI, is included in table 10.3 below.
| | Roll-forward of Accumulated Other Comprehensive Income (Loss) | |
| Roll-forward of Accumulated Other Comprehensive Income (Loss) | |
Roll-forward of Accumulated Other Comprehensive Income (Loss) | | Table | Table | 10.3 | | | |
| (In thousands) | (In thousands) | | Net unrealized gains and losses on available-for-sale securities | | Net benefit plan assets and obligations recognized in shareholders' equity | | | Total AOCI |
| Balance, December 31, 2019, net of tax | | $ | 138,521 | | | $ | (65,813) | | | | $ | 72,708 | |
| Other comprehensive income (loss) before reclassifications | | 144,566 | | | (2,118) | | | | 142,448 | |
| Less: Amounts reclassified from AOCI | | 10,950 | | | (12,615) | | | | (1,665) | |
| (In thousands) | |
| (In thousands) | | | Net unrealized gains and losses on available-for-sale securities | | Net benefit plan assets and obligations recognized in shareholders' equity | | | | Total AOCI |
| Balance, December 31, 2020, net of tax | Balance, December 31, 2020, net of tax | | 272,137 | | | (55,316) | | | | 216,821 | |
| Other comprehensive income (loss) before reclassifications | Other comprehensive income (loss) before reclassifications | | (113,839) | | | 17,249 | | | | (96,590) | |
| Less: Amounts reclassified from AOCI | Less: Amounts reclassified from AOCI | | 8,260 | | | (7,726) | | | | 534 | |
| Balance, December 31, 2021, net of tax | Balance, December 31, 2021, net of tax | | 150,038 | | | (30,341) | | | | 119,697 | |
| Other comprehensive income (loss) before reclassifications | Other comprehensive income (loss) before reclassifications | | (566,324) | | | (55,906) | | | | (622,230) | |
| Less: Amounts reclassified from AOCI | Less: Amounts reclassified from AOCI | | (7,790) | | | (13,232) | | | | (21,022) | |
| Balance, December 31, 2022, net of tax | Balance, December 31, 2022, net of tax | | $ | (408,496) | | | $ | (73,015) | | | | $ | (481,511) | |
| Other comprehensive income (loss) before reclassifications | |
| Less: Amounts reclassified from AOCI | |
| Balance, December 31, 2023, net of tax | |
MGIC Investment Corporation 2022 Form 10-K | 107
MGIC Investment Corporation and Subsidiaries
| | | | | | | | |
NOTE 11 | | Note 11. Benefit Plans |
We have a non-contributory defined benefit pension plan, covering substantially all employees, as well as a supplemental executive retirement plan.plan, that covered eligible employees through December 31, 2022. Effective January 1, 2023, these plans arewere frozen (no future benefits will be accrued for participants due to employment and no new participants will be added). Participants in these plans arewere fully vested in their benefits as of December 31, 2022. We also offer both medical and dental benefits for retired domestic employees and their eligible spouses and dependents under a postretirement benefit plan. The following tables 11.1, 11.2, and 11.3 provide the components of aggregate annual net periodic benefit cost for each of the years ended December 31, 2023, 2022, 2021, and 20202021 and changes in the benefit obligation and the funded status of the pension, supplemental executive retirement and other postretirement benefit plans as recognized in the consolidated balance sheets as of December 31, 20222023 and 2021.2022.
| | Components of net periodic benefit cost | Components of net periodic benefit cost | Components of net periodic benefit cost |
| Table | Table | 11.1 | |
| | | | Pension and Supplemental Executive Retirement Plans | | Other Postretirement Benefits |
| | |
| | | | Pension and Supplemental Executive Retirement Plans | | Other Postretirement Benefits |
| (In thousands) | (In thousands) | | 12/31/2022 | | 12/31/2021 | | 12/31/2020 | | 12/31/2022 | | 12/31/2021 | | 12/31/2020 | (In thousands) | | 12/31/2023 | | 12/31/2022 | | 12/31/2021 | | 12/31/2023 | | 12/31/2022 | | 12/31/2021 |
| Company Service Cost | Company Service Cost | | $ | 7,153 | | | $ | 7,569 | | | $ | 7,342 | | | $ | 1,307 | | | $ | 1,508 | | | $ | 1,263 | |
| Interest Cost | Interest Cost | | 12,461 | | | 11,276 | | | 13,036 | | | 694 | | | 648 | | | 832 | |
| Expected Return on Assets | | (18,064) | | | (20,657) | | | (22,139) | | | (10,502) | | | (8,863) | | | (7,407) | |
| Expected Return on Plan Assets | |
| | Amortization of: | Amortization of: | | | | | | | | | | | | |
| Net Transition Obligation/(Asset) | | — | | | — | | | — | | | — | | | — | | | — | |
| Net Prior Service Cost/(Credit) | | (163) | | | (239) | | | (247) | | | 489 | | | 213 | | | 51 | |
| Net Losses/(Gains) | | 5,726 | | | 5,490 | | | 6,578 | | | (3,103) | | | (1,697) | | | (783) | |
| | Amortization of: | |
| | Amortization of: | | | | | | | | | |
| Net Transition Obligation (Asset) | |
| Prior Service Cost (Credit) | |
| Net Actuarial Losses (Gains) | |
| | Cost of Settlements and Curtailments | Cost of Settlements and Curtailments | | 13,801 | | | 6,012 | | | 10,369 | | | — | | | — | | | — | |
| Net Periodic Benefit Cost | | $ | 20,914 | | | $ | 9,451 | | | $ | 14,939 | | | $ | (11,115) | | | $ | (8,191) | | | $ | (6,044) | |
| | Cost of Settlements and Curtailments | |
| | Cost of Settlements and Curtailments | |
| Net Periodic Benefit Cost (Benefit) | |
| | | | | | | | | | | | | | | | | | | | | | | | | | | | | |
| Development of funded status |
| Table | 11.2 | | | | | | | | |
| | | Pension and Supplemental Executive Retirement Plans | | Other Postretirement Benefits |
| (In thousands) | | 12/31/2022 | | 12/31/2021 | | 12/31/2022 | | 12/31/2021 |
| Actuarial Value of Benefit Obligations | | | | | | | | |
| Measurement Date | | 12/31/2022 | | 12/31/2021 | | 12/31/2022 | | 12/31/2021 |
| Accumulated Benefit Obligation | | $ | 274,975 | | | $ | 390,747 | | | $ | 29,580 | | | $ | 25,635 | |
| | | | | | | | |
| Funded Status/Asset (Liability) on the Consolidated Balance Sheet | | | | | | | | |
| Benefit Obligation | | $ | (274,975) | | | $ | (391,698) | | | $ | (29,580) | | | $ | (25,635) | |
| Plan Assets at Fair Value | | 250,674 | | | 391,555 | | | 111,154 | | | 140,839 | |
| Funded Status - Overfunded/Asset | | N/A | | N/A | | $ | 81,574 | | | $ | 115,204 | |
| Funded Status - Underfunded/Liability | | (24,301) | | | (143) | | | N/A | | N/A |
| | | | | | | | | | | | | | | | | | | | | | | | | | | | | |
| Accumulated other comprehensive (income) loss |
| Table | 11.3 | | | | | | | | |
| | | Pension and Supplemental Executive Retirement Plans | | Other Postretirement Benefits |
| (In thousands) | | 12/31/2022 | | 12/31/2021 | | 12/31/2022 | | 12/31/2021 |
| Net Actuarial (Gain)/Loss | | $ | 89,711 | | | $ | 84,045 | | | $ | (13,781) | | | $ | (47,352) | |
| Net Prior Service Cost/(Credit) | | 3,245 | | | (747) | | | 13,249 | | | 2,461 | |
| Net Transition Obligation/(Asset) | | — | | | — | | | — | | | — | |
| Total at Year End | | $ | 92,956 | | | $ | 83,298 | | | $ | (532) | | | $ | (44,891) | |
MGIC Investment Corporation and Subsidiaries
| | | | | | | | | | | | | | | | | | | | | | | | | | | | | |
| Development of funded status |
| Table | 11.2 | | | | | | | | |
| | | Pension and Supplemental Executive Retirement Plans | | Other Postretirement Benefits |
| (In thousands) | | 12/31/2023 | | 12/31/2022 | | 12/31/2023 | | 12/31/2022 |
| Actuarial Value of Benefit Obligations | | | | | | | | |
| Measurement Date | | 12/31/2023 | | 12/31/2022 | | 12/31/2023 | | 12/31/2022 |
| Accumulated Benefit Obligation | | $ | 261,330 | | | $ | 274,975 | | | $ | 30,238 | | | $ | 29,580 | |
| | | | | | | | |
| Funded Status/Asset (Liability) on the Consolidated Balance Sheet | | | | | | | | |
| Benefit Obligation | | $ | (261,330) | | | $ | (274,975) | | | $ | (30,238) | | | $ | (29,580) | |
| Plan Assets at Fair Value | | 235,612 | | | 250,674 | | | 134,371 | | | 111,154 | |
| Funded Status - Overfunded/Asset | | N/A | | N/A | | $ | 104,133 | | | $ | 81,574 | |
| Funded Status - Underfunded/Liability | | (25,718) | | | (24,301) | | | N/A | | N/A |
| | | | | | | | | | | | | | | | | | | | | | | | | | | | | |
| Accumulated other comprehensive (income) loss |
| Table | 11.3 | | | | | | | | |
| | | Pension and Supplemental Executive Retirement Plans | | Other Postretirement Benefits |
| (In thousands) | | 12/31/2023 | | 12/31/2022 | | 12/31/2023 | | 12/31/2022 |
| Net Actuarial Losses (Gains) | | $ | 79,309 | | | $ | 89,711 | | | $ | (30,804) | | | $ | (13,781) | |
| Prior Service Cost (Credit) | | 2,900 | | | 3,245 | | | 11,041 | | | 13,249 | |
| Net Transition Obligation (Asset) | | — | | | — | | | — | | | — | |
| Total at Year End | | $ | 82,209 | | | $ | 92,956 | | | $ | (19,763) | | | $ | (532) | |
The amortization of gains and losses resulting from differences in actual experience from assumedexpected experience or changes in assumptions including discount rates is included as a component of Net Periodic Benefit Cost/(Income) for the year. The gain or loss in excess of a 10% corridor is amortized by the average remaining life expectancy for the pension and supplemental executive retirement plans and by the average remaining service period of participating employees expected to receive benefits under the other postretirement benefits plan.
MGIC Investment Corporation 2022 Form 10-K | 108
MGIC Investment Corporation and Subsidiaries
Table 11.4 shows the changes in the projected benefit obligation for the years ended December 31, 20222023 and 2021.2022.
| | Change in projected benefit / accumulated benefit | Change in projected benefit / accumulated benefit | Change in projected benefit / accumulated benefit |
| Table | Table | 11.4 | |
| | |
| | |
| | | | Pension and Supplemental Executive Retirement Plans | | Other Postretirement Benefits | | Pension and Supplemental Executive Retirement Plans | | Other Postretirement Benefits |
| (In thousands) | (In thousands) | | 12/31/2022 | | 12/31/2021 | | 12/31/2022 | | 12/31/2021 | (In thousands) | | 12/31/2023 | | 12/31/2022 | | 12/31/2023 | | 12/31/2022 |
| Benefit Obligation at Beginning of Year | Benefit Obligation at Beginning of Year | | $ | 391,698 | | | $ | 423,713 | | | $ | 25,635 | | | $ | 28,714 | |
| Company Service Cost | Company Service Cost | | 7,153 | | | 7,569 | | | 1,307 | | | 1,508 | |
| Interest Cost | Interest Cost | | 12,461 | | | 11,276 | | | 694 | | | 648 | |
| Plan Participants' Contributions | Plan Participants' Contributions | | — | | | — | | | 463 | | | 456 | |
| Net Actuarial (Gain)/Loss | | (83,240) | | | (10,018) | | | (8,123) | | | (3,574) | |
| Net Actuarial Losses (Gains) | |
| Benefit Payments from Fund | Benefit Payments from Fund | | (13,165) | | | (12,866) | | | (1,504) | | | (1,963) | |
| Benefit Payments Paid Directly by Company | | (114) | | | (362) | | | — | | | — | |
| Benefit and Settlement Payments Paid Directly by Company | |
| Plan Amendments | Plan Amendments | | 3,247 | | | 2 | | | 11,278 | | | — | |
| Curtailments | Curtailments | | (352) | | | — | | | — | | | — | |
Settlement Payments from Fund (1) | Settlement Payments from Fund (1) | | (42,713) | | | (27,616) | | | — | | | — | |
| Other Adjustment | Other Adjustment | | — | | | — | | | (170) | | | (154) | |
| Benefit Obligation at End of Year | Benefit Obligation at End of Year | | $ | 274,975 | | | $ | 391,698 | | | $ | 29,580 | | | $ | 25,635 | |
(1)Represents lump sum payments from our pension plan to eligible participants, who were former employees with vested benefits.
The change in the net actuarial gains forlosses (gains) on the benefit obligation from 2022 and 2021, reported above, for the pension and supplemental executive retirement plans and the other postretirement benefits plan wereto 2023 is primarily due to an increasechanges in the discount rate used to calculate the obligations.benefit obligation. When the discount rate decreases, the impact on the benefit obligation is an increase, resulting in an actuarial loss. When the discount rate increases, the impact on the benefit obligation is a decrease, resulting in an actuarial gain. The discount rate increaseddecreased to 5.20% at December 31, 2023 from 5.60% at December 31, 2022, compared to an increase to 5.60% at December 31, 2022 from 3.05% at December 31, 2021. See Table 11.7 for the actuarial assumptions used to calculate the benefit obligations of our plans for 20222023 and 2021.2022.
MGIC Investment Corporation 2023 Form 10-K | 112
MGIC Investment Corporation and Subsidiaries
Tables 11.5 and 11.6 shows the changes in the fair value of the net assets available for plan benefits and changes in other comprehensive income (loss) for the years ended December 31, 20222023 and 2021.2022.
| | Change in plan assets | Change in plan assets | Change in plan assets |
| Table | Table | 11.5 | |
| | | | Pension and Supplemental Executive Retirement Plans | | Other Postretirement Benefits |
| | |
| | | | Pension and Supplemental Executive Retirement Plans | | Other Postretirement Benefits |
| (In thousands) | (In thousands) | | 12/31/2022 | | 12/31/2021 | | 12/31/2022 | | 12/31/2021 | (In thousands) | | 12/31/2023 | | 12/31/2022 | | 12/31/2023 | | 12/31/2022 |
| Fair Value of Plan Assets at Beginning of Year | Fair Value of Plan Assets at Beginning of Year | | $ | 391,555 | | | $ | 411,245 | | | $ | 140,839 | | | $ | 119,024 | |
| Actual Return on Assets | | (91,303) | | | 13,992 | | | (28,088) | | | 23,773 | |
| Actual Return on Plan Assets | |
| Company Contributions | Company Contributions | | 6,414 | | | 7,162 | | | — | | | — | |
| Plan Participants' Contributions | Plan Participants' Contributions | | — | | | — | | | 463 | | | 456 | |
| Benefit Payments from Fund | Benefit Payments from Fund | | (13,165) | | | (12,866) | | | (1,504) | | | (1,963) | |
| Benefit Payments Paid Directly by Company | | (114) | | | (362) | | | — | | | — | |
| Benefit and Settlement Payments Paid Directly by Company | |
| Settlement Payments from Fund | Settlement Payments from Fund | | (42,713) | | | (27,616) | | | — | | | — | |
| Other Adjustment | Other Adjustment | | — | | | — | | | (556) | | | (451) | |
| Fair Value of Plan Assets at End of Year | Fair Value of Plan Assets at End of Year | | $ | 250,674 | | | $ | 391,555 | | | $ | 111,154 | | | $ | 140,839 | |
| | Change in accumulated other comprehensive income (loss) ("AOCI") | Change in accumulated other comprehensive income (loss) ("AOCI") | |
| Change in accumulated other comprehensive income (loss) ("AOCI") | |
| Change in accumulated other comprehensive income (loss) ("AOCI") | |
| Table | Table | 11.6 | |
| Table | |
| Table | |
| | |
| | |
| | | | Pension and Supplemental Executive Retirement Plans | | Other Postretirement Benefits | | Pension and Supplemental Executive Retirement Plans | | Other Postretirement Benefits |
| (In thousands) | (In thousands) | | 12/31/2022 | | 12/31/2021 | | 12/31/2022 | | 12/31/2021 | (In thousands) | | 12/31/2023 | | 12/31/2022 | | 12/31/2023 | | 12/31/2022 |
| AOCI in Prior Year | AOCI in Prior Year | | $ | 83,298 | | | $ | 97,911 | | | $ | (44,891) | | | $ | (27,892) | |
| Increase/(Decrease) in AOCI | | | | | | | | |
| Recognized during year - Prior Service (Cost)/Credit | | 745 | | | 239 | | | (489) | | | (213) | |
| Recognized during year - Net Actuarial (Losses)/Gains | | (20,109) | | | (11,502) | | | 3,103 | | | 1,697 | |
| Increase (Decrease) in AOCI | | Increase (Decrease) in AOCI | | | | | | | | |
| Recognized during year - Prior Service (Cost) Credit | |
| Recognized during year - Net Actuarial (Losses) Gains | |
| Occurring during year - Prior Service Cost | Occurring during year - Prior Service Cost | | 3,247 | | | 2 | | | 11,277 | | | — | |
| Occurring during year - Net Actuarial Losses/(Gains) | | 25,775 | | | (3,352) | | | 30,468 | | | (18,483) | |
| Occurring during year - Net Actuarial Losses (Gains) | |
| | AOCI in Current Year | AOCI in Current Year | | $ | 92,956 | | | $ | 83,298 | | | $ | (532) | | | $ | (44,891) | |
| | AOCI in Current Year | |
| | AOCI in Current Year | |
MGIC Investment Corporation 2022 Form 10-K | 109
MGIC Investment Corporation and Subsidiaries
The projected benefit obligations, net periodic benefit costs and accumulated postretirement benefit obligation for the plans were determined using the following weighted average assumptions.
| | Actuarial assumptions | Actuarial assumptions | Actuarial assumptions |
| Table | Table | 11.7 | |
| | | | Pension and Supplemental Executive Retirement Plans | | Other Postretirement Benefits |
| | | | 12/31/2022 | | 12/31/2021 | | 12/31/2022 | | 12/31/2021 |
| | | | Pension and Supplemental Executive Retirement Plans | | Other Postretirement Benefits |
| | | | | 12/31/2023 | | 12/31/2022 | | 12/31/2023 | | 12/31/2022 |
| Weighted-Average Assumptions Used to Determine | Weighted-Average Assumptions Used to Determine | |
| Benefit Obligations at year end | Benefit Obligations at year end | |
| Benefit Obligations at year end | |
| Benefit Obligations at year end | |
| 1. Discount Rate | |
| 1. Discount Rate | |
| 1. Discount Rate | 1. Discount Rate | | 5.60 | % | | 3.05 | % | | 5.60 | % | | 2.85 | % | | 5.20 | % | | 5.60 | % | | 5.20 | % | | 5.60 | % |
| 2. Rate of Compensation Increase | 2. Rate of Compensation Increase | | 3.00 | % | | 3.00 | % | | N/A | | N/A | 2. Rate of Compensation Increase | | N/A | | 3.00 | % | | N/A | | N/A |
| 3. Cash balance interest crediting rate | 3. Cash balance interest crediting rate | | 3.97 | % | | 2.80 | % | | N/A | | N/A | 3. Cash balance interest crediting rate | | 4.03 | % | | 3.97 | % | | N/A | | N/A |
| | Weighted-Average Assumptions Used to Determine | |
| Weighted-Average Assumptions Used to Determine | |
| Weighted-Average Assumptions Used to Determine | |
| Weighted-Average Assumptions Used to Determine | |
| Weighted-Average Assumptions Used to Determine | |
| Weighted-Average Assumptions Used to Determine | Weighted-Average Assumptions Used to Determine | | | | | | | | | | | | | | | | |
| Net Periodic Benefit Cost for Year | Net Periodic Benefit Cost for Year | | | | | | | | | Net Periodic Benefit Cost for Year | | | | | | | | |
| 1. Discount Rate | 1. Discount Rate | | 3.70 | % | | 2.80 | % | | 2.85 | % | | 2.35 | % | 1. Discount Rate | | 5.50 | % | | 3.70 | % | | 5.60 | % | | 2.85 | % |
| 2. Expected Long-term Return on Plan Assets | 2. Expected Long-term Return on Plan Assets | | 5.25 | % | | 5.25 | % | | 7.50 | % | | 7.50 | % | 2. Expected Long-term Return on Plan Assets | | 6.00 | % | | 5.25 | % | | 7.50 | % | | 7.50 | % |
| 3. Rate of Compensation Increase | 3. Rate of Compensation Increase | | 3.00 | % | | 3.00 | % | | N/A | | N/A | 3. Rate of Compensation Increase | | N/A | | 3.00 | % | | N/A | | N/A |
| | Assumed Health Care Cost Trend Rates at year end | Assumed Health Care Cost Trend Rates at year end | | | | | | | | |
| Assumed Health Care Cost Trend Rates at year end | |
| Assumed Health Care Cost Trend Rates at year end | |
| Assumed Health Care Cost Trend Rates at year end | |
| Assumed Health Care Cost Trend Rates at year end | |
| Assumed Health Care Cost Trend Rates at year end | | | | | | | | | |
| 1. Health Care Cost Trend Rate Assumed for Next Year | 1. Health Care Cost Trend Rate Assumed for Next Year | | N/A | | N/A | | 7.00 | % | | 6.50 | % | 1. Health Care Cost Trend Rate Assumed for Next Year | | N/A | | N/A | | 6.75 | % | | 7.00 | % |
| 2. Rate to Which the Cost Trend Rate is Assumed to Decline (Ultimate Trend Rate) | 2. Rate to Which the Cost Trend Rate is Assumed to Decline (Ultimate Trend Rate) | | N/A | | N/A | | 5.00 | % | | 5.00 | % | 2. Rate to Which the Cost Trend Rate is Assumed to Decline (Ultimate Trend Rate) | | N/A | | N/A | | 5.00 | % | | 5.00 | % |
| 3. Year That the Rate Reaches the Ultimate Trend Rate | 3. Year That the Rate Reaches the Ultimate Trend Rate | | N/A | | N/A | | 2031 | | 2028 | 3. Year That the Rate Reaches the Ultimate Trend Rate | | N/A | | N/A | | 2031 | | 2031 |
In selecting a discount rate, we performed a hypothetical cash flow bond matching exercise, matching our expected pension plan and postretirement medical plan cash flows, respectively, against a selected portfolio of high quality corporate bonds. The modeling was
MGIC Investment Corporation 2023 Form 10-K | 113
MGIC Investment Corporation and Subsidiaries
performed using a bond portfolio of noncallable bonds with at least $50 million outstanding. The average yield of these hypothetical bond portfolios was used as the benchmark for determining the discount rate. In selecting the expected long-term rate of return on assets, we considered the average rate of earnings expected on the classes of funds invested or to be invested to provide for the benefits of these plans. This included considering the trusts' targeted asset allocation for the year and the expected returns likely to be earned over the next 20 years.
The year-end asset allocations of the plans are shown in table 11.8 below.
| | Plan assets | Plan assets | Plan assets |
| Table | Table | 11.8 | |
| | | | Pension Plan | | Other Postretirement Benefits |
| | | | 12/31/2022 | | 12/31/2021 | | 12/31/2022 | | 12/31/2021 |
| | | | Pension Plan | | Other Postretirement Benefits |
| | | | | 12/31/2023 | | 12/31/2022 | | 12/31/2023 | | 12/31/2022 |
| Equity Securities | Equity Securities | | 20 | % | | 21 | % | | 100 | % | | 100 | % | Equity Securities | | 21 | % | | 20 | % | | 100 | % | | 100 | % |
| Debt Securities | Debt Securities | | 80 | % | | 79 | % | | — | % | | — | % | Debt Securities | | 79 | % | | 80 | % | | — | % | | — | % |
| Total | Total | | 100 | % | | 100 | % | | 100 | % | | 100 | % | Total | | 100 | % | | 100 | % | | 100 | % | | 100 | % |
The following describes the valuation methodologies used for pension plan and other postretirement benefits plan assets at fair value.
•Domestic and International Mutual Funds: Securities are priced at the net asset value ("NAV"), which is the closing price published by the mutual fund on the reporting date. These financial assets are categorized as Level 1 in the fair value hierarchy.
•U.S. Government Securities: See Note 6 - "Fair Value Measurements" for a discussion of the valuation methodologies for U.S. Treasury Securities and Obligations of U.S. Government Corporations and Agencies. •Non-Government Foreign Debt:Debt Securities: These financial assets are represented by corporate debt securities issued by entities domiciled outside of the United States. See Note 6 - "Fair Value Measurements" for a discussion of the valuation methodologies for Corporate Debt.
MGIC Investment Corporation 2022 Form 10-K | 110
MGIC Investment Corporation and Subsidiaries
•Pooled Equity Accounts: Pooled Equity Account assets are represented by the units held by the plan. The redemption value is determined based on the NAV of the underlying units. The NAV is derived from the aggregate fair value of the underlying investments less any liabilities as of the reporting date. These financial assets are categorized as Level 2 in the fair value hierarchy.
Tables 11.9a and 11.9b set forth by level, within the fair value hierarchy, theThe pension plan assets and related accrued investment income at fair value, by hierarchy level, as of December 31, 2023 and 2022, are shown in tables 11.9a and 2021.11.9b below. There were no securities that usedvalued using Level 3 inputs.
| Pension plan assets at fair value as of December 31, 2022 | | Pension plan assets at fair value as of December 31, 2023 | | Pension plan assets at fair value as of December 31, 2023 |
| Table | Table | 11.9a | |
| (In thousands) | |
| (In thousands) | |
| (In thousands) | (In thousands) | | Level 1 | | Level 2 | | Total | | Level 1 | | Level 2 | | Total |
| Domestic mutual funds | Domestic mutual funds | | $ | 67 | | | $ | — | | | $ | 67 | |
| U.S. government securities | U.S. government securities | | 13,328 | | | — | | | 13,328 | |
| Corporate debt securities | Corporate debt securities | |
| Corporate debt securities and other | Corporate debt securities and other | | — | | | 146,854 | | | 146,854 | |
| Corporate debt securities and other | |
| Corporate debt securities and other | |
| Non-government foreign debt securities | Non-government foreign debt securities | | — | | | 20,793 | | | 20,793 | |
| Municipal bonds | Municipal bonds | | — | | | 18,336 | | | 18,336 | |
| Pooled equity accounts | Pooled equity accounts | | — | | | 51,296 | | | 51,296 | |
| Total Assets at fair value | Total Assets at fair value | | $ | 13,395 | | | $ | 237,279 | | | $ | 250,674 | |
| | | | | | | | | | | | | | | | | | | | | | | |
| Pension plan assets at fair value as of December 31, 2021 |
| Table | 11.9b | | | | | | |
| (In thousands) | | Level 1 | | Level 2 | | Total |
| Domestic mutual funds | | $ | 4,071 | | | $ | — | | | $ | 4,071 | |
| U.S. government securities | | 32,947 | | | — | | | 32,947 | |
| Corporate debt Securities | | | | | | |
| Corporate debt securities and other | | — | | | 221,033 | | | 221,033 | |
| Non-government foreign debt securities | | — | | | 34,103 | | | 34,103 | |
| Municipal bonds | | — | | | 20,093 | | | 20,093 | |
| Pooled equity accounts | | — | | | 79,308 | | | 79,308 | |
| Total Assets at fair value | | $ | 37,018 | | | $ | 354,537 | | | $ | 391,555 | |
MGIC Investment Corporation 2023 Form 10-K | 114
MGIC Investment Corporation and Subsidiaries
| | | | | | | | | | | | | | | | | | | | | | | |
| Pension plan assets at fair value as of December 31, 2022 |
| Table | 11.9b | | | | | | |
| (In thousands) | | Level 1 | | Level 2 | | Total |
| Domestic mutual funds | | $ | 67 | | | $ | — | | | $ | 67 | |
| U.S. government securities | | 13,328 | | | — | | | 13,328 | |
| Corporate debt Securities | | | | | | |
| Corporate debt securities and other | | — | | | 146,854 | | | 146,854 | |
| Non-government foreign debt securities | | — | | | 20,793 | | | 20,793 | |
| Municipal bonds | | — | | | 18,336 | | | 18,336 | |
| Pooled equity accounts | | — | | | 51,296 | | | 51,296 | |
| Total Assets at fair value | | $ | 13,395 | | | $ | 237,279 | | | $ | 250,674 | |
The pension plan has implemented a strategy to reduce risk through the use of a targeted funded ratio. The liability driven component is key to the asset allocation. The liability driven component seeks to align the duration of the fixed income asset allocation with the expected duration of the plan liabilities or benefit payments. Overall asset allocation is dynamic and specifies target allocation weights and ranges based on the funded status.
An improvement in funded status results in the de-risking of the portfolio, allocating more funds to fixed income and less to equity. A decline in funded status would result in a higher allocation to equity. The maximum equity allocation is 40%.
MGIC Investment Corporation 2022 Form 10-K | 111
MGIC Investment Corporation and Subsidiaries
The equity investments use combinations of mutual funds, ETFs, and pooled equity account structures focused on the following strategies:
| | | | | | | | | | | | | | | | | |
| Strategy | | Objective | | Investment types |
| Return seeking growth | | Funded ratio improvement over the long term | | ● | Global quality growth |
| | ● | Global low volatility |
| Return seeking bridge | | Downside protection in the event of a declining equity market | | ● | Enduring asset |
| | ● | Durable company |
The fixed income objective is to preserve capital and to provide monthly cash flows for the payment of plan liabilities. Fixed income investments can include government, government agency, corporate, mortgage-backed, asset-backed, and municipal securities, and other classes of bonds. The duration of the fixed income portfolio has an objective of being within one year of the duration of the accumulated benefit obligation. The fixed income investments have an objective of a weighted average credit of A3/A-/A- by Moody’s, S&P, and Fitch, respectively.
Tables 11.10a and 11.10b set forth the other postretirement benefits plan assets at fair value as of December 31, 20222023 and 2021.2022. All are Level 1 assets.
| | | | | | | | | | | |
| Other postretirement benefits plan assets at fair value as of December 31, 2023 |
| Table | 11.10a | | |
| (In thousands) | | Level 1 |
| Domestic mutual funds | | $ | 109,575 | |
| International mutual funds | | 24,796 | |
| Total Assets at fair value | | $ | 134,371 | |
| | | | | | | | | | | |
| Other postretirement benefits plan assets at fair value as of December 31, 2022 |
| Table | 11.10a11.10b | | |
| (In thousands) | | Level 1 |
Domestic Mutual Fundsmutual funds | | $ | 89,584 | |
International Mutual Fundsmutual funds | | 21,570 | | 21,570 | |
| Total Assets at fair value | | $ | 111,154 | |
| | | | | | | | | | | |
Other postretirement benefits plan assets at fair value as of December 31, 2021 |
Table | 11.10b | | |
(In thousands) | | Level 1 |
Domestic Mutual Funds | | $ | 112,770 | |
International Mutual Funds | | 28,069 | |
Total Assets at fair value | | $ | 140,839 | |
Our postretirement plan portfolio is designed to achieve the following objectives over each market cycle and for at least 5 years:
è Total return should exceed growth in the Consumer Price Index by 5.75% annually
è Achieve competitive investment results
MGIC Investment Corporation 2023 Form 10-K | 115
MGIC Investment Corporation and Subsidiaries
The primary focus in developing asset allocation ranges for the portfolio is the assessment of the portfolio's investment objectives and the level of risk that is acceptable to obtain those objectives. To achieve these objectives the minimum and maximum allocation ranges for fixed income securities and equity securities are:
| | | | | | | | | | | |
| | Minimum | | Maximum |
| Equities (long only) | 70 | % | | 100 | % |
| Real estate | 0 | % | | 15 | % |
| Commodities | 0 | % | | 10 | % |
| Fixed income/Cash | 0 | % | | 10 | % |
Given the long term nature of this portfolio and the lack of any immediate need for significant cash flow, it is anticipated that the equity investments will consist of growth stocks and will typically be at the higher end of the allocation ranges above.
Investment in international mutual funds is limited to a maximum of 30% of the equity range. The allocation as of December 31, 20222023 included 2% that was primarily invested in equity securities of emerging market countries and another 17%16% was invested in securities of companies primarily based in Europe and the Pacific Basin.
For the year ended December 31, 2022,2023, we contributed $6.4$0.4 million to the pension and supplemental executive retirement plans.plans to fund distributions from the supplemental executive retirement plan. We do not expect to make a contribution to the pension plan in 20232024 of $25.0 million and distributions from the supplemental executive retirement plan will be funded as incurred. We did not make a contribution to the other postretirement benefits plan in 20222023 and we do not expect to make a contribution in 2023.2024.
Expected future benefit payments from the plans are shown in Table 11.1211.11 below.
| | Expected future benefit payments | Expected future benefit payments | Expected future benefit payments |
| Table | Table | 11.12 | |
| | | | Pension and Supplemental Executive Retirement Plans | | Other Postretirement Benefits |
| | |
| | | | Pension and Supplemental Executive Retirement Plans | | Other Postretirement Benefits |
| (In thousands) | (In thousands) | | 12/31/2022 | | 12/31/2022 | (In thousands) | | 12/31/2023 |
| | | Current + 1 | |
| | Current + 1 | |
| | Current + 1 | Current + 1 | | 23,966 | | | 2,211 | |
| Current + 2 | Current + 2 | | 23,309 | | | 2,476 | |
| Current + 3 | Current + 3 | | 23,104 | | | 2,780 | |
| Current + 4 | Current + 4 | | 23,363 | | | 2,886 | |
| Current + 5 | Current + 5 | | 23,194 | | | 2,929 | |
| Current + 6 - 10 | Current + 6 - 10 | | 102,588 | | | 16,102 | |
PROFIT SHARING AND 401(K)
We have a profit sharing and 401(k) savings plan for employees. At the discretion of the Board of Directors, we may make a contribution to the plan of up to 5% of each participant's eligible compensation. We provide a matching 401(k) savings contribution for employees of 100% up to the first 4% contributed. We recognized expenses related to these plans of $7.6 million in 2022 and $8.0 million in both 2021 and 2020. Effective January 1, 2023, we will provide a matching 401(k) savings contribution for employees of 200% up to the first 2% contributed and 100% of the next 2% contributed. We recognized expenses related to these plans of $9.5 million in 2023, $7.6 million in 2022, and $8.0 million in 2021.
MGIC Investment Corporation 20222023 Form 10-K | 112116
MGIC Investment Corporation and Subsidiaries
| | | | | | | | |
NOTE 12 | | Note 12. Income Taxes |
Net deferred tax assets (liabilities) as reported on the consolidated balance sheetsheets as of December 31, 20222023 and 20212022 are shown in table 12.1 below. At December 31, 2021 the deferred tax liability is included as a component of Other liabilities on the consolidated balance sheet.
| | Deferred tax assets and liabilities | Deferred tax assets and liabilities | Deferred tax assets and liabilities |
| Table | Table | 12.1 | |
| (In thousands) | (In thousands) | | 2022 | | 2021 |
| (In thousands) | |
| (In thousands) | | | 2023 | | 2022 |
| Total deferred tax assets | Total deferred tax assets | | $ | 144,819 | | | $ | 32,331 | |
| Total deferred tax liabilities | Total deferred tax liabilities | | (20,050) | | | (71,743) | |
| Net deferred tax asset (liability) | Net deferred tax asset (liability) | | $ | 124,769 | | | $ | (39,412) | |
Table 12.2 includes the components of the net deferred tax asset (liability) as of December 31, 20222023 and 2021.2022.
| | Deferred tax components | Deferred tax components | Deferred tax components |
| Table | Table | 12.2 | |
| (In thousands) | (In thousands) | | 2022 | | 2021 |
| (In thousands) | |
| (In thousands) | | | 2023 | | 2022 |
| Unearned premium reserves | Unearned premium reserves | | $ | 16,209 | | | $ | 19,116 | |
| Benefit plans | Benefit plans | | (9,444) | | | (21,360) | |
| Loss reserves | Loss reserves | | 1,785 | | | 4,034 | |
| Unrealized depreciation (appreciation) in investments | | 108,588 | | | (39,883) | |
| Unrealized losses on investments | |
| Deferred policy acquisition cost | Deferred policy acquisition cost | | (4,003) | | | (4,551) | |
| Deferred compensation | Deferred compensation | | 6,806 | | | 6,118 | |
| Research and experimental costs | Research and experimental costs | | 9,719 | | | — | |
| Other, net | Other, net | | (4,891) | | | (2,886) | |
| Net deferred tax asset (liability) | Net deferred tax asset (liability) | | $ | 124,769 | | | $ | (39,412) | |
We believe that all gross deferred tax assets at December 31, 20222023 and 20212022 are fully realizable and no valuation allowance has been established.
Table 12.3 summarizes the components of the provision for income taxes:
| | Provision for (benefit from) income taxes | Provision for (benefit from) income taxes | Provision for (benefit from) income taxes |
| Table | Table | 12.3 | |
| (In thousands) | |
| (In thousands) | |
| (In thousands) | (In thousands) | | 2022 | | 2021 | | 2020 | | 2023 | | 2022 | | 2021 |
| Current federal | Current federal | | $ | 228,259 | | | $ | 161,055 | | | $ | 85,574 | |
| Deferred federal | Deferred federal | | (5,235) | | | 4,392 | | | 28,244 | |
| Other | Other | | 1,661 | | | 1,347 | | | (648) | |
| Provision for income taxes | Provision for income taxes | | $ | 224,685 | | | $ | 166,794 | | | $ | 113,170 | |
Current federal income tax payments were $188.2 million, $236.5 million, and $155.3 million in 2023, 2022 and $79.6 million in 2022, 2021, and 2020, respectively. At December 31, 20222023 we owned $661.7$848.6 million of tax and loss bonds.
Table 12.4 reconciles the federal statutory income tax rate to our effective tax provision rate.
| | Effective tax rate reconciliation | Effective tax rate reconciliation | Effective tax rate reconciliation |
| Table | Table | 12.4 | |
| | |
| | |
| | | 2022 | | 2021 | | 2020 | 2023 | | 2022 | | 2021 |
| Federal statutory income tax rate | Federal statutory income tax rate | 21.0 | % | | 21.0 | % | | 21.0 | % | Federal statutory income tax rate | 21.0 | % | | 21.0 | % | | 21.0 | % |
| | Tax exempt municipal bond interest | Tax exempt municipal bond interest | (0.5) | % | | (0.6) | % | | (0.9) | % |
| | Tax exempt municipal bond interest | |
| | Tax exempt municipal bond interest | | (0.5) | % | | (0.5) | % | | (0.6) | % |
| Other, net | Other, net | 0.1 | % | | 0.4 | % | | 0.1 | % | Other, net | 0.5 | % | | 0.1 | % | | 0.4 | % |
| Effective tax rate | Effective tax rate | 20.6 | % | | 20.8 | % | | 20.2 | % | Effective tax rate | 21.0 | % | | 20.6 | % | | 20.8 | % |
We have not recorded any uncertain tax positions during 20222023 and 20212022 and have no unrecognized tax benefits at December 31, 20222023 and December 31, 2021.2022. We recognize interest accrued and penalties related to unrecognized tax benefits in income taxes. The statute of limitations related to the consolidated federal income tax return is closed for all years prior to 2019.2020.
MGIC Investment Corporation 20222023 Form 10-K | 113117
MGIC Investment Corporation and Subsidiaries
| | | | | | | | |
NOTE 13 | | Note 13. Shareholders' Equity |
CHANGE IN ACCOUNTING POLICY
As of January 1, 2021, we adopted the updated guidance for "Accounting for Convertible Instruments and Contracts in an Entity’s Own Equity”. The application of this guidance resulted in a $68.3 million cumulative effect adjustment to our 2021 beginning retained earnings and paid-in capital to reflect the 9% Debenture as if we had always accounted for the debt as a liability in its entirety.
SHARE REPURCHASE PROGRAMS
Repurchases may be made from time to time on the open market (including through 10b5-1 plans) or through privately negotiated transactions. In 2023, we repurchased approximately 21.7 million shares of our common stock at a weighted average cost per share of $15.71, which included commissions. We may repurchase up to an additional $273.7 million of our common stock through July 1, 2025 under a share repurchase program approved by our Board of Directors in 2023. In 2024, through February 16, we repurchased approximately 2.9 million shares of our common stock at a weighted average cost per share of $19.43, which included commissions.
In 2022, we repurchased approximately 27.8 million shares of our common stock at a weighted average cost per share of $13.89, which included commissions. We may repurchase up to an additional $114 million of our common stock through the end of 2023 under a share repurchase program approved by our Board of Directors in October 2021. In 2023, through February 17, we repurchased approximately 3.1 million shares of our common stock at a weighted average cost per share of $13.65, which included commissions.
In 2021, we repurchased approximately 19.0 million shares of our common stock at a weighted average cost per share of $15.30, which included commissions.
During 2020, we repurchased approximately 9.6 million shares of our common stock at a weighted average cost per share of $12.47, which included commissions.
CASH DIVIDENDS
In the first and second quarters of 2022, we paid quarterly cash dividends of $0.08 per share to shareholders which totaled $51.0 million. In the third and fourth quarters of 2022,2023, we paid quarterly cash dividends of $0.10 per share to shareholders which totaled $60.7$58.8 million. In the third and fourth quarters of 2023, we paid quarterly cash dividends of $0.115 per share which totaled $65.3 million. On January 24, 2023,23, 2024, the Board of Directors declared a quarterly cash dividend to holders of the company's common stock of $0.10$0.115 per share payable on March 2,5, 2023, to shareholders of record at the close of business on February 17, 2023.
15, 2024.
| | | | | | | | |
NOTE 14 | | Note 14. Statutory Information |
STATUTORY ACCOUNTING PRINCIPLES
The statutory financial statements of our insurance companies are presented on the basis of accounting principles prescribed, or practices permitted, by the Office of the Commissioner of Insurance of the State of Wisconsin (the "OCI"), which has adopted the National Association of Insurance Commissioners ("NAIC") Statements of Statutory Accounting Principles ("SSAP") as the basis of its statutory accounting principles.principles, except as described below. In converting from statutory to GAAP, typical adjustments include deferral of policy acquisition costs, the inclusion of net unrealized holding gains or losses in shareholders' equity relating to fixed income securities, and the inclusion of statutory non-admitted assets.
In addition to the typical adjustments from statutory to GAAP, mortgage insurance companies are required to maintain contingency loss reserves equal to 50% of premiums earned under SSAP and principles prescribed by the OCI. Such amounts cannot be withdrawn for a period of ten years except as permitted by insurance regulations. With regulatory approval, a mortgage guaranty insurance company may make early withdrawals from the contingency reserve when incurred losses exceed 35% of premiums earned in a calendar year. For the year ended 2022,2023, MGIC did not withdraw amounts from its contingency reserve. Changes in contingency loss reserves impact the statutory statement of operations. Contingency loss reserves are not reflected as liabilities under GAAP and changes in contingency loss reserves do not impact the GAAP consolidated statements of operations.
As a mortgage guaranty insurer, we are eligible for a tax deduction, subject to certain limitations, under Section 832(e) of the IRC for amounts required by state law or regulation to be set aside in statutory contingency reserves. The deduction is allowed only to the extent that we purchase tax and loss bonds (“T&L Bonds”) in an amount equal to the tax benefit derived from deducting any portion of our statutory contingency reserves. Under statutory accounting practices, purchases of T&L Bonds are accounted for as investments. Under GAAP, purchases of T&L Bonds are accounted for as a payment of current taxes.
The OCI recognizes only statutory accounting principles prescribed, or practices permitted, by the State of Wisconsin for determining and reporting the financial condition and results of operations of an insurance company. The OCI has adopted certain prescribed accounting practices that differ from those found in other states. Specifically, Wisconsin domiciled companies record changes in the contingency loss reserves through the income statement as a change in underwriting deduction. As a result, in periods in which MGIC is increasing contingency loss reserves, statutory net income is reduced.
MGIC Investment Corporation 20222023 Form 10-K | 114118
MGIC Investment Corporation and Subsidiaries
The statutory net income, policyholders’ surplus, and contingency reserve liability of our insurance subsidiaries, including MGIC, are shown in table 14.1.
| | Statutory financial information of insurance subsidiaries | Statutory financial information of insurance subsidiaries | Statutory financial information of insurance subsidiaries |
| Table | Table | 14.1 | |
| | As of and for the Years Ended December 31, |
| | As of and for the Years Ended December 31, | |
| | As of and for the Years Ended December 31, | |
| | As of and for the Years Ended December 31, | |
| (In thousands) | (In thousands) | | 2022 | | 2021 | | 2020 | (In thousands) | | 2023 | | 2022 | | 2021 |
| Statutory net income | Statutory net income | | $ | 440,944 | | | $ | 295,811 | | | $ | 65,201 | |
| Statutory policyholders' surplus | Statutory policyholders' surplus | | 924,977 | | | 1,220,714 | | | 1,339,509 | |
| Contingency reserve | Contingency reserve | | 4,669,724 | | | 4,126,604 | | | 3,585,864 | |
The decrease in statutory policyholders' surplus fromfor the years ended December 31, 2021 to2023 and December 31, 2022 is primarily due to dividend payments to MGIC Investment Corporation ("the parent companyholding company") (discussed below), offset by statutory net income.
For the years ended December 31, 2023, 2022, 2021, and 20202021 there were no contributions made to MGIC or distributions from other insurance subsidiaries to us. Dividends paid by MGIC are shown in table 14.2 below.
| | Surplus contributions and dividends of insurance subsidiaries | Surplus contributions and dividends of insurance subsidiaries | Surplus contributions and dividends of insurance subsidiaries |
| Table | Table | 14.2 | |
| | Years Ended December 31, |
| | Years Ended December 31, | |
| | Years Ended December 31, | |
| | Years Ended December 31, | |
| (In thousands) | (In thousands) | | 2022 | | 2021 | | 2020 | (In thousands) | | 2023 | | 2022 | | 2021 |
| Dividends paid by MGIC to the parent company (1) | | $ | 800,000 | | | 400,000 | | | 390,000 | |
Dividends paid by MGIC to the holding company (1) | |
Dividends paid by MGIC to the holding company (1) | |
Dividends paid by MGIC to the holding company (1) | |
|
(1) Dividends paid in cash and/or investment securities. Also, in 2021 MGIC distributed to the holding company, as a dividend, its investment in MGIC Credit Assurance Corporation at an amount of $8.9 million. In 2020, MGIC distributed to the holding company, as a dividend, its ownership in the 9% Debentures held at an amortized cost of $139.5 million.
STATUTORY CAPITAL REQUIREMENTS
The insurance laws of 16 jurisdictions, including Wisconsin, our domiciliary state, require a mortgage insurer to maintain a minimum amount of statutory capital relative to the RIF (or a similar measure) in order for the mortgage insurer to continue to write new business. We refer to these requirements as the “State Capital Requirements” and, together with the GSE Financial Requirements, the “Financial Requirements.” While they vary among jurisdictions, the most common State Capital Requirements allow for a maximum risk-to-capital ratio of 25 to 1. A risk-to-capital ratio will increase if (i) the percentage decrease in capital exceeds the percentage decrease in insured risk, or (ii) the percentage increase in capital is less than the percentage increase in insured risk. Wisconsin does not regulate capital by using a risk-to-capital measure but instead requires a minimum policyholder position ("MPP"). MGIC's “policyholder position” includes its net worth or surplus, and its contingency loss reserve.
At December 31, 2022,2023, MGIC’s risk-to-capital ratio was 10.2 to 1, below the maximum allowed by the jurisdictions with State Capital Requirements and its policyholder position was $3.5$3.6 billion above the required MPP of $2.1$2.2 billion. The calculation of our risk-to-capital ratio and MPP reflect credit for the risk ceded under our reinsurance transactions. It is possible that under the revised State Capital Requirements discussed below, MGIC will not be allowed full credit for the risk ceded to the reinsurers. If MGIC is not allowed an agreed level of credit under either the
State Capital Requirements or the financial requirements of the PMIERs, MGIC may terminate the reinsurance agreements, without penalty. At this time, we expect MGIC to continue to comply with the current State Capital Requirements; however, you should read the rest of these financial statement footnotes for information about matters that could negatively affect such compliance.
The NAIC previously announced plans to revise the State Capital Requirements that are provided for in itsestablished a Mortgage Guaranty Insurance Model Act. In December 2019, a working group of state regulators released an exposureWorking Group to determine and make recommendations to the NAIC’s Financial Condition Committee as to what, if any, changes to make to the solvency and other regulations relating to mortgage guaranty insurers. A draft of a revised Mortgage Guaranty Insurance Model Act and a risk-based capital framework to establish capital requirements for mortgage insurers, although certain items were not completely addressedwas adopted by the framework, includingFinancial Condition Committee in July 2023 and by the treatment of ceded riskExecutive Committee and Plenary NAIC in August 2023. The revised Model Act includes requirements relating to, among other things: (i) capital and minimum capital floors. In October 2022,requirements, and contingency reserves; (ii) restrictions on mortgage insurers’ investments in notes secured by mortgages; (iii) prudent underwriting standards and formal underwriting guidelines; (iv) the NAIC working group released aestablishment of formal, internal “Mortgage Guaranty Quality Control Programs” with respect to in-force business; and (v) reinsurance and prohibitions on captive reinsurance arrangements. It is uncertain when the revised exposure draftModel Act will be adopted in any jurisdiction. The provisions of the Mortgage Guaranty Insurance Model Act, that doesif adopted in their final form, are not includeexpected to have a material adverse effect on our business. It is unknown whether any changes will be made by state legislatures prior to adoption, and the capital requirements ofeffect changes, if any, will have on the existing Model Act.mortgage guaranty insurance market generally, or on our business.
DIVIDEND RESTRICTIONS
MGIC is subject to statutory regulations as to payment of dividends. The maximum amount of dividends that MGIC may pay in any twelve-month period without regulatory approval by the OCI is the lesser of adjusted statutory net income or 10% of statutory policyholders' surplus as of the preceding calendar year end. Adjusted statutory net income is defined for this purpose to be the greater of statutory net income, net of realized investment gains, for the calendar year preceding the date of the dividend or statutory net income, net of realized investment gains, for the three calendar years preceding the date of the dividend less dividends paid within the first two of the preceding three calendar years. The maximum dividend that could be paid is reduced by dividends paid in the twelve months preceding the dividend payment date. Before making any dividend payments in 2023,2024, we will notify the OCI to ensure it does not object.
MGIC Investment Corporation 20222023 Form 10-K | 115119
MGIC Investment Corporation and Subsidiaries
| | | | | | | | |
NOTE 15 | | Share-based Compensation Plans |
We have certain share-based compensation plans. Under the fair value method, compensation cost is measured at the grant date based on the fair value of the award and is recognized over the service period which generally corresponds to the vesting period. Awards under our plans generally vest over periods ranging from one to three years, although awards to our non-employee directors vest immediately.
We have an omnibus incentive plan that was adopted on April 23, 2020. When the 2020 plan was adopted, no further awards could be made under our previous 2015 plan. The purpose of the 2020 plan is to motivate and incentivize performance by, and to retain the services of, key employees and non-employee directors through receipt of equity-based and other incentive awards under the plan. Awards issued under the plan that are subsequently forfeited will not count against the limit on the maximum number of shares that may be issued under the plan. The 2020 plan provides for the award of stock options, stock appreciation rights, restricted stock and restricted stock units, as well as cash incentive awards. No awards may be granted after April 23, 2030 under the 2020 plan. The vesting provisions of options, restricted stock and restricted stock units are determined at the time of grant. At December 31, 2022, 6.92023, 5.1 million shares were available for future grant under the 2020 plan.
The compensation cost that has been charged against income for share-based plans was $31.5 million, $24.7 million, $17.1 million, and $13.8$17.1 million for the years ended December 31, 2023, 2022 2021 and 2020,2021, respectively. The related income tax benefit recognized for share-based plans was $2.9 million, $2.1 million, $1.8 million, and $1.7$1.8 million for the years ended December 31, 2023, 2022, 2021, and 2020,2021, respectively. Table 15.1 summarizes restricted stock or restricted stock unit (collectively called “restricted stock”) activity during 2022.2023.
| | Restricted stock | Restricted stock | Restricted stock |
| Table | Table | 15.1 | |
| | | Weighted Average Grant Date Fair Market Value | | Shares |
| Restricted stock outstanding at December 31, 2021 | $ | 12.88 | | | 4,146,088 | |
| | |
| | | Weighted Average Grant Date Fair Market Value | | Shares |
| Restricted stock outstanding at December 31, 2022 | |
Granted (1) | Granted (1) | 15.45 | | | 1,273,979 | |
| Vested | Vested | 12.35 | | | (1,549,098) | |
| Forfeited | Forfeited | 13.00 | | | (294,290) | |
| Restricted stock outstanding at December 31, 2022 | $ | 14.02 | | | 3,576,679 | |
| Restricted stock outstanding at December 31, 2023 | |
(1) Approximately 67% of the shares granted in 20222023 are subject to performance conditions under which the target number of shares granted may vest upfrom 0% to 200%.
At December 31, 2022,2023, the 3.63.2 million shares of restricted stock outstanding consisted of 2.82.4 million shares that are subject to performance conditions (“performance shares”), 0.70.6 million shares that are subject only to service conditions (“time vested shares”), and 0.10.2 million shares related to non-employee director shares. The weighted-average grant date fair value of restricted stock granted during 2022 and 2021 was $15.45 and 2020 was $12.83, and $13.62, respectively. The fair value of restricted stock granted is the closing price of the common stock on the New York Stock Exchange on the date of grant or previous trading day if the New York Stock Exchange is closed on the date of grant. The total fair value of
restricted stock vested during 2023, 2022 and 2021 and 2020 was $17.3 million, $23.3 million, $15.1 million, and $20.4$15.1 million, respectively.
As of December 31, 2022, there was $17.0 million of2023, the total unrecognized compensation cost related to non-vestedfor all of our outstanding share-based compensation agreements granted under the plans. Of this total, $12.3 million of unrecognized compensation costs relate to performance shares and $4.7 million relates to time vested shares.awards was $21.9 million. A portion of the unrecognized costs associated with the performanceoutstanding shares may or may not be recognized in future periods, depending upon whether or not the performance andand/or service conditions are met. The cost associated with the time vested sharesoutstanding share-based awards is expected to be recognized over a weighted-average period of 1.6 years.
| | | | | | | | |
NOTE 16 | |
MGIC Investment Corporation 2023 Form 10-K | 120
MGIC Investment Corporation and Subsidiaries
Note 16. Leases |
We lease data processing equipment and autosvehicles under operating leases that expire during the next four years. Generally, rental payments are fixed.
Table 16.1 shows minimum the future operating lease payments as of December 31, 2022.2023.
| | Minimum future operating lease payments | Minimum future operating lease payments | Minimum future operating lease payments |
| Table | Table | 16.1 | |
| (In thousands) | (In thousands) | | Amount |
| 2023 | | $ | 908 | |
| (In thousands) | |
| (In thousands) | | | Amount |
| 2024 | 2024 | | 831 | |
| 2025 | 2025 | | 667 | |
| 2026 | 2026 | | 152 | |
| 2027 and thereafter | | — | |
| 2027 | |
| 2028 and thereafter | |
| Total | Total | | $ | 2,558 | |
Total lease expense under operating leases was $1.6 million in 2023, $1.2 million in 2022, and $1.3 million in 2021, and $1.9 million in 2020.2021.
Note 17. Litigation and Contingencies
We operate in a highly regulated industry that is subject to the risk of litigation and regulatory proceedings, including related to our claims paying practices. From time to time, we are involved in MGIC Investment Corporation 2022 Form 10-K | 116
MGIC Investment Corporationdisputes and Subsidiaries
| | | | | | | | |
NOTE 17 | | Litigation and Contingencies |
Before paying an insurance claim, generally we reviewlegal proceedings in the loan and servicing files to determine the appropriatenessordinary course of the claim amount. When reviewing the files, we may determine that we have the right to rescind coverage or deny a claimbusiness. In our opinion, based on the loan (both referred to herein as “rescissions”). In addition,facts known at this time, the ultimate resolution of these ordinary course disputes and legal proceedings will not have a material adverse effect on our insurance policies generally provide that we can reduce a claim if the servicer did not comply with its obligations under our insurance policy (such reduction referred to as a "curtailment").
When the insured disputes our right to rescind coverage or curtail claims, we generally engage in discussions in an attempt to settle the dispute. If we are unable to reach a settlement, the outcome of a dispute ultimately may be determined by legal proceedings. Under ASC 450-20, until a loss associated with settlement discussions or legal proceedings becomes probable and can be reasonably estimated we consider our claim payment or rescission resolved for financial reporting purposes and do not accrue an estimated loss. When we determine that a loss is probable and can be reasonably estimated, we record our best estimate of our probable loss. In those cases, until settlement negotiations or legal proceedings are concluded (including the receipt of any necessary GSE approvals), it is possible that we will record an additional loss.
We have been named as a third-party defendant in a lawsuit that involves refunds of mortgage insurance premiums under the Homeowners Protection Act. We are monitoring litigation addressing similar issues in which we have not been named a defendant. We are unable to assess the potential impact of any such litigation at this time. In addition, from time to time, we are involved in other disputes and legal proceedings in the ordinary course of business. In our opinion, based on the facts known at this time, the ultimate resolution of these ordinary course disputes and legal proceedings will not have a material adverse effect on our financial position or results of operations.
MGIC Investment Corporation 20222023 Form 10-K | 117121
Report of Independent Registered Public Accounting Firm
To the Board of Directors and Shareholders of MGIC Investment Corporation
Opinions on the Financial Statements and Internal Control over Financial Reporting
We have audited the accompanying consolidated balance sheets of MGIC Investment Corporation and its subsidiaries (the “Company”) as of December 31, 20222023 and 2021,2022, and the related consolidated statements of operations, of comprehensive income, (loss), of shareholders' equity and of cash flows for each of the three years in the period ended December 31, 2022,2023, including the related notes and financial statement schedules listed in the index appearing under Item 15(a)(2) (collectively referred to as the “consolidated financial statements”). We also have audited the Company's internal control over financial reporting as of December 31, 2022,2023, based on criteria established in Internal Control - Integrated Framework (2013) issued by the Committee of Sponsoring Organizations of the Treadway Commission (COSO).
In our opinion, the consolidated financial statements referred to above present fairly, in all material respects, the financial position of the Company as of December 31, 20222023 and 2021,2022, and the results of its operations and its cash flows for each of the three years in the period ended December 31, 20222023 in conformity with accounting principles generally accepted in the United States of America. Also in our opinion, the Company maintained, in all material respects, effective internal control over financial reporting as of December 31, 2022,2023, based on criteria established in Internal Control - Integrated Framework (2013) issued by the COSO.
Basis for Opinions
The Company's management is responsible for these consolidated financial statements, for maintaining effective internal control over financial reporting, and for its assessment of the effectiveness of internal control over financial reporting, included in Management’s Report on Internal Control over Financial Reporting appearing under Item 9A. Our responsibility is to express opinions on the Company’s consolidated financial statements and on the Company's internal control over financial reporting based on our audits. We are a public accounting firm registered with the Public Company Accounting Oversight Board (United States) (PCAOB) and are required to be independent with respect to the Company in accordance with the U.S. federal securities laws and the applicable rules and regulations of the Securities and Exchange Commission and the PCAOB.
We conducted our audits in accordance with the standards of the PCAOB. Those standards require that we plan and perform the audits to obtain reasonable assurance about whether the consolidated financial statements are free of material misstatement, whether due to error or fraud, and whether effective internal control over financial reporting was maintained in all material respects.
Our audits of the consolidated financial statements included performing procedures to assess the risks of material misstatement of the consolidated financial statements, whether due to error or fraud, and performing procedures that respond to those risks. Such procedures included examining, on a test basis, evidence regarding the amounts and disclosures in the
consolidated financial statements. Our audits also included evaluating the accounting principles used and significant estimates made by management, as well as evaluating the overall presentation of the consolidated financial statements. Our audit of internal control over financial reporting included obtaining an understanding of internal control over financial reporting, assessing the risk that a material weakness exists, and testing and evaluating the design and operating effectiveness of internal control based on the assessed risk. Our audits also included performing such other procedures as we considered necessary in the circumstances. We believe that our audits provide a reasonable basis for our opinions.
Definition and Limitations of Internal Control over Financial Reporting
A company’s internal control over financial reporting is a process designed to provide reasonable assurance regarding the reliability of financial reporting and the preparation of financial statements for external purposes in accordance with generally accepted accounting principles. A company’s internal control over financial reporting includes those policies and procedures that (i) pertain to the maintenance of records that, in reasonable detail, accurately and fairly reflect the transactions and dispositions of the assets of the company; (ii) provide reasonable assurance that transactions are recorded as necessary to permit preparation of financial statements in accordance with generally accepted accounting principles, and that receipts and expenditures of the company are being made only in accordance with authorizations of management and directors of the company; and (iii) provide reasonable assurance regarding prevention or timely detection of unauthorized acquisition, use, or disposition of the company’s assets that could have a material effect on the financial statements.
Because of its inherent limitations, internal control over financial reporting may not prevent or detect misstatements. Also, projections of any evaluation of effectiveness to future periods are subject to the risk that controls may become inadequate because of changes in conditions, or that the degree of compliance with the policies or procedures may deteriorate.
Critical Audit Matters
The critical audit matter communicated below is a matter arising from the current period audit of the consolidated financial statements that was communicated or required to be communicated to the audit committee and that (i) relates to accounts or disclosures that are material to the consolidated financial statements and (ii) involved our especially challenging, subjective, or complex judgments. The
MGIC Investment Corporation 2023 Form 10-K | 122
communication of critical audit matters does not alter in any way our opinion on the consolidated financial statements, taken as a whole, and we are not, by communicating the critical audit matter below, providing a separate opinion on the critical audit matter or on the accounts or disclosures to which it relates.
Valuation of Loss Reserves – Primary Case Reserves
As described in Notes 3 and 8 to the consolidated financial statements, the Company establishes case reserves for estimated insurance losses when notices of delinquency on insured mortgage loans are received. As of December 31, 2022,2023, the Company’s recorded loss reserves were $558$505 million. A significant portion of total loss reserves relate to primary case reserves established for the Company’s primary insurance business. Case reserves are established by estimating the
MGIC Investment Corporation 2022 Form 10-K | 118
number of loans in the delinquency inventory that will result in a claim payment, which is referred to as the claim rate, and further estimating the amount of the claim payment, which is referred to as claim severity. The Company’s case reserve estimates are primarily established based upon historical experience, including rescissions of policies, curtailments of claims, and loan modification activity. The conditions that affect the claim rate and claim severity include the current and future state of the domestic economy, including unemployment and the current and future strength of local housing markets; exposure on insured loans; the amount of time between delinquency and claim filing; and curtailments and rescissions.
The principal considerations for our determination that performing procedures relating to the valuation of loss reserves – primary case reserves is a critical audit matter are (i) the significant judgment by management when developing the estimate of the primary case reserves; (ii) a high degree of auditor judgment, subjectivity, and effort in performing procedures and evaluating the audit evidence relating to the claim rate and claim severity significant assumptions; and (iii) the audit effort involved the use of professionals with specialized skill and knowledge.
Addressing the matter involved performing procedures and evaluating audit evidence in connection with forming our overall opinion on the consolidated financial statements. These procedures included testing the effectiveness of controls relating to the valuation of loss reserves, including controls over the development of significant assumptions related to the claim rate and claim severity. These procedures also included, among others, the involvement of professionals with specialized skill and knowledge to assist in developing an independent estimate of the primary case reserves and comparing this independent estimate to management’s recorded primary case reserves to evaluate the reasonableness of the recorded primary case reserves. Developing the independent estimate involved testing the completeness and accuracy of data provided by management and independently developing assumptions related to the claim rate and claim severity.
/s/ PricewaterhouseCoopers LLP
Milwaukee, Wisconsin
February 22, 202321, 2024
We have served as the Company’s auditor since 1985, which includes periods before the Company became subject to SEC reporting requirements.
MGIC Investment Corporation 20222023 Form 10-K | 119123
MGIC Investment Corporation and Subsidiaries
Item 9. Changes in and Disagreements with Accountants on Accounting and Financial Disclosure
None.
Item 9A. Controls and Procedures
MANAGEMENT'S CONCLUSION REGARDING THE EFFECTIVENESS OF DISCLOSURE CONTROLS
Our management, with the participation of our principal executive officer and principal financial officer, has evaluated our disclosure controls and procedures (as defined in Rule 13a-15(e) and 15d-15(e) under the Securities Exchange Act of 1934, as amended), as of the end of the period covered by this annual report. Based on such evaluation, our principal executive officer and principal financial officer concluded that such controls and procedures were effective as of the end of such period.
MANAGEMENT'S REPORT ON INTERNAL CONTROL OVER FINANCIAL REPORTING
Our management is responsible for establishing and maintaining adequate internal control over financial reporting (as defined in Exchange Act Rule 13a-15(f) and 15d-15(f)). Our internal control over financial reporting is designed to provide reasonable assurance regarding the reliability of financial reporting and the preparation of financial statements for external purposes in accordance with generally accepted accounting principles. Because of its inherent limitations, however, internal control over financial reporting may not prevent or detect misstatements. Also, projections of any evaluation of effectiveness to future periods are subject to the risk that controls may become inadequate because of changes in conditions, or that the degree of compliance with the policies or procedures may deteriorate.
Our management, with the participation of our principal executive officer and principal financial officer, has evaluated the effectiveness of our internal control over financial reporting using the framework in Internal Control – Integrated Framework (2013) issued by the Committee of Sponsoring Organizations of the Treadway Commission. Based on such evaluation, our management concluded that our internal control over financial reporting was effective as of December 31, 2022.2023.
PricewaterhouseCoopers LLP, an independent registered public accounting firm, has audited the consolidated financial statements and effectiveness of internal control over financial reporting as of December 31, 2022,2023, as stated in their report which appears herein.
CHANGES IN INTERNAL CONTROL DURING THE FOURTH QUARTER
There are no changes in our internal control over financial reporting (as defined in Rule 13a-15(f) and Rule 15d-15(f) under the Exchange Act) that occurred during the quarter ended December 31, 20222023 that have materially affected, or are reasonably likely to materially affect, our internal control over financial reporting.
Item 9B. Other Information
None.During the three months ended December 31, 2023, none of our officers or directors adopted, modified or terminated any contract, instruction or written plan for the purchase or sale of our securities that was intended to satisfy the affirmative defense conditions of Rule 10b5-1(c) or any “non-Rule 10b5-1 trading arrangement.”
Item 9C. Disclosure Regarding Foreign Jurisdictions that Prevent Inspections
Not Applicable.
MGIC Investment Corporation 20222023 Form 10-K | 120124
MGIC Investment Corporation and Subsidiaries
PART III
Item 10. Directors, Executive Officers and Corporate Governance
This information (other than on the executive officers) will be included in our Proxy Statement for the 20232024 Annual Meeting of Shareholders, and is hereby incorporated by reference, provided such Proxy Statement is filed within 120 days after December 31, 2022.2023. If not so filed, such information will be included in an amended Form 10-K filed within such 120 day period. The information on the executive officers appears at the end of Part I of this Form 10-K.
Our Insider Trading Policy limits the timing and types of transactions in our securities, as well as transactions in the securities of companies with which the Company does business and competitors of the Company (collectively referred to as "Company Securities"). The Policy applies to all directors and employees of the Company and its subsidiaries, and may be extended to apply to third-party contractors or consultants who have access to non-public information about the Company. Among other restrictions, the policy prohibits directors, executive officers, other officers and certain employees from engaging in short sales of Company securities, entering into hedging transactions referencing the Company’s equity securities, holding Company securities in a margin account, or pledging Company securities as collateral for a loan. All directors and officers (including executive officers), as well as certain other employees with access to material non-public information must also comply with pre-clearance procedures prior to any transaction in Company Securities. A copy of the Policy is attached as Exhibit 19 to this Form 10-K.
Our Code of Conduct and Ethics is available on our website (http://mtg.mgic.com) under the “Leadership & Governance; Documents” links. Written copies of our Code of Conduct and Ethics are available to any shareholder who submits a written request to our Secretary, addressed to: MGIC Investment Corporation, Secretary, P.O. Box 488, Milwaukee, WI 53201. We intend to disclose on our website any waivers and amendments to our Code of Conduct and Ethics that are required to be disclosed under Item 5.05 of Form 8-K.
Item 11. Executive Compensation
This information will be included in our Proxy Statement for the 20232024 Annual Meeting of Shareholders and is hereby incorporated by reference, provided such Proxy Statement is filed within 120 days after December 31, 2022.2023. If not so filed, such information will be included in an amended Form 10-K filed within such 120 day period.
Item 12. Security Ownership of Certain Beneficial Owners and Management and Related Stockholder Matters
This information, other than information regarding equity compensation plans required by Item 201(d) of Regulation S-K of the Securities and Exchange Commission which appears below, will be included in our Proxy Statement for the 20232024 Annual Meeting of Shareholders, and is hereby incorporated by reference, provided such Proxy Statement is filed within 120 days after December 31, 2022.2023. If not so filed, such information will be included in an amended Form 10-K filed within such 120 day period.
The table below sets forth certain information, as of December 31, 2022, about2023, the number of securities remaining available for future issuance under our equity compensation plans. No options, warrants or rights were outstanding at that date under any compensation plan or individual compensation arrangement with us. We have no compensation plan under which our equity securities may be issued that has not been approved by shareholders. Share units or phantom shares, which have no voting power and can be settled only in cash, are not considered to be equity securities for this purpose.
| | | | | | | | | | | | | | |
| | | | Equity compensation plans approved by security holders |
| (a) | | Number of Securities to be Issued Upon Exercise of Outstanding Options, Warrants and Rights (1) | | 3,571,6293,179,741 | |
| (b) | | Weighted Average Exercise Price of Outstanding Options, Warrants and Rights | | — | |
| (c) | | Number of Securities Remaining Available For Future Issuance Under Equity Compensation Plans (Excluding Securities Reflected in Row (a)) (2) | | 6,935,3995,118,300 | |
(1)Includes 1,237,367 restricted stock units (RSUs) granted under our 2015 Omnibus Incentive Plan (the “2015 Plan”) for which shares will be issued if certain criteria are met. Of the RSUs granted under the 2015 Plan, 1,130,159 are subject to performance conditions and the remaining RSUs are subject to service conditions. Also includes 2,334,262 RSUs granted under our 2020 Omnibus Incentive Plan for which shares will be issued in the future, provided the service conditions are met. Of the RSUs granted under the 2020 Plan, 1,700,4552,421,300 are subject to performance conditions, 526,977589,059 subject to service conditions, and the remainder are related to non-employee director restricted stock units.
(2)Reflects shares available for granting. All of these shares are available under our 2020 Plan.
MGIC Investment Corporation 2023 Form 10-K | 125
Item 13. Certain Relationships and Related Transactions, and Director Independence
To the extent applicable, this information will be included in our Proxy Statement for the 20232024 Annual Meeting of Shareholders, and is hereby incorporated by reference, provided such Proxy Statement is filed within 120 days after December 31, 2022.2023. If not so filed, such information will be included in an amended Form 10-K filed within such 120 day period.
MGIC Investment Corporation 2022 Form 10-K | 121
Item 14. Principal Accountant Fees and Services
This information will be included in our Proxy Statement for the 20232024 Annual Meeting of Shareholders, and is hereby incorporated by reference, provided such Proxy Statement is filed within 120 days after December 31, 2022.2023. If not so filed, such information will be included in an amended Form 10-K filed within such 120 day period.
MGIC Investment Corporation 20222023 Form 10-K | 122126
MGIC Investment Corporation and Subsidiaries
PART IV
Item 15. Exhibits and Financial Statement Schedules
(a)
| | | | | |
| 1 | Financial statements. The following financial statements are filed in Item 8 of this annual report: |
| | | | | |
| | Consolidated balance sheets at December 31, 20222023 and 20212022 |
| | Consolidated statements of operations for each of the three years in the period ended December 31, 20222023 |
| | Consolidated statements of comprehensive income for each of the three years in the period ended December 31, 20222023 |
| | Consolidated statements of shareholders’ equity for each of the three years in the period ended December 31, 20222023 |
| | Consolidated statements of cash flows for each of the three years in the period ended December 31, 20222023 |
| | Notes to consolidated financial statements |
| | Report of independent registered public accounting firm |
| | | | | |
| 2 | Financial statement schedules. The following financial statement schedules are filed as part of this Form 10-K and appear immediately following the signature page: |
| | | | | | | | |
| | Page |
| | Schedule I - Summary of investments, other than investments in related parties at December 31, 20222023 | |
| | Schedule II - Condensed financial information of Registrant | |
| Condensed balance sheets at December 31, 20222023 and 20212022 | |
| Condensed statements of operations for each of the three years in the period ended December 31, 20222023 | |
| Condensed statements of cash flows for each of the three years in the period ended December 31, 20222023 | |
| Supplementary notes to parent company financial statements | |
| | Schedule IV – Reinsurance for each of the three years in the period ended December 31, 20222023 | |
| | All other schedules are omitted since the required information is not present or is not present in amounts sufficient to require submission of the schedules, or because the information required is included in the consolidated financial statements and notes thereto. | |
| | | | | |
| 3 | Exhibits. The accompanying Index to Exhibits is incorporated by reference in answer to this portion of this Item and, except as otherwise indicated in the next sentence, the Exhibits listed in such Index are filed as part of this Form 10-K. Exhibit 32 is not filed as part of this Form 10-K but accompanies this Form 10-K. |
MGIC Investment Corporation 20222023 Form 10-K | 123127
INDEX TO EXHIBITS
The agreements included as exhibits to this report are included to provide information regarding their terms and are not intended to provide any other factual or disclosure information about the Company or any of its subsidiaries or the other parties to the agreements. The agreements may contain representations and warranties by each of the parties to the applicable agreement. These representations and warranties have been made solely for the benefit of the other parties to the applicable agreement and:
•should not in all instances be treated as categorical statements of fact, but rather as a way of allocating the risk to one of the parties if those statements provide to be inaccurate;
•have been qualified by disclosures that were made to the other party in connection with the negotiation of the applicable agreement, which disclosures are not necessarily reflected in the agreement;
•may apply standards of materiality in a way that is different from what may be viewed as material to you or other investors; and
•were made only as of the date of the applicable agreement or such other date or dates as may be specified in the agreement and are subject to more recent developments.
Accordingly, these representations and warranties may not describe the actual state of affairs as of the date they were made or at any other time. Additional information about the Company and its subsidiaries may be found elsewhere in this report and the Company’s other public filings, which are available without charge through the SEC’s website at http://www.sec.gov or on the Company's website. See Item 1 “Business – Website Address.”
| | | | | | | Incorporated by Reference | | | | | Incorporated by Reference |
Exhibit Number | Exhibit Number | | Description of Exhibit | | Form | | Exhibit(s) | | Filing Date | Exhibit Number | | Description of Exhibit | | Form | | Exhibit(s) | | Filing Date |
| 3.1 | 3.1 | | | | 10-Q | | 3.1 | | August 8, 2013 | 3.1 | | | | 10-Q | | 3.1 | | August 8, 2013 |
| 3.2 | 3.2 | | | | 8-K | | 3.2 | | January 27, 2023 | 3.2 | | | | 8-K | | 3.2 | | January 27, 2023 |
| 4.1 | 4.1 | | | | 10-Q | | 3.1 | | August 8, 2013 | 4.1 | | | | 10-Q | | 3.1 | | August 8, 2013 |
| 4.2 | 4.2 | | | | 8-K | | 3.2 | | January 27, 2023 | 4.2 | | | | 8-K | | 3.2 | | January 27, 2023 |
| | | | |
| 4.4 | 4.4 | | | | 8-K | | 4.1 | | October 19, 2000 |
| 4.6 | | | | 10-Q | | 4.6 | | May 12, 2008 |
| 4.4 | |
| 4.4 | | | | | 8-K | | 4.1 | | October 19, 2000 |
| 4.1 | 4.1 | | | | 8-K | | 4.10 | | August 12, 2020 | 4.1 | | | | 8-K | | 4.10 | | August 12, 2020 |
| | | | [We are a party to various other agreements with respect to our long-term debt. These agreements are not being filed pursuant to Reg. S-K Item 601(b) (4) (iii) (A). We hereby agree to furnish a copy of such agreements to the Commission upon its request.] | | | | | | | | | [We are a party to various other agreements with respect to our long-term debt. These agreements are not being filed pursuant to Reg. S-K Item 601(b) (4) (iii) (A). We hereby agree to furnish a copy of such agreements to the Commission upon its request.] | | |
| 10.2.4 | 10.2.4 | | | | 10-K | | 10.2.4 | | March 16, 2005 | 10.2.4 | | | | 10-K | | 10.2.4 | | March 16, 2005 |
| 10.2.5 | 10.2.5 | | | | 10-K | | 10.2.5 | | March 16, 2005 | 10.2.5 | | | | 10-K | | 10.2.5 | | March 16, 2005 |
| 10.2.24 | 10.2.24 | | | | 10-K | | 10.2.24 | | February 23, 2021 | 10.2.24 | | | | 10-K | | 10.2.24 | | February 21, 2024 |
| 10.2.25 | 10.2.25 | | | | 10-Q | | 10.2.25 | | May 5, 2021 | 10.2.25 | | | | 10-Q | | 10.2.25 | | May 5, 2021 |
| 10.2.26 | 10.2.26 | | | | 10-K | | 10.2.26 | | February 23, 2022 | 10.2.26 | | | | 10-K | | 10.2.26 | | February 23, 2022 |
| 10.2.27 | 10.2.27 | | | | 10Q | | 10.2.27 | | May 4, 2022 | 10.2.27 | | | | 10-K | | 10.2.27 | | February 21, 2024 |
| 10.2.28 | 10.2.28 | | | | 10K | | 10.2.28 | | February 22, 2023 | 10.2.28 | | | | 10K | | 10.2.28 | | February 21, 2024 |
| 10.2.29 | | | | 10K | | 10.2.29 | | February 22, 2023 |
| 10.3.1 | 10.3.1 | | | | 10-K | | 10.3.1 | | March 1, 2011 | 10.3.1 | | | | 10-K | | 10.3.1 | | March 1, 2011 |
| 10.3.3 | 10.3.3 | | | | DEF 14A | | App. A | | March 24, 2015 | 10.3.3 | | | | DEF 14A | | App. A | | March 24, 2015 |
| 10.3.4 | 10.3.4 | | | | DEF 14A | | App. C | | March 20, 2020 | 10.3.4 | | | | DEF 14A | | App. C | | March 20, 2020 |
| 10.6 | 10.6 | | | |
| 10.8 | 10.8 | | | |
| 10.8 | |
| 10.8 | |
| 10.11.5 | |
| 10.11.5 | |
| 10.11.5 | | | | | 10-Q | | 10.11.5 | | May 5, 2021 |
| |
| |
| |
| | | | | 10-K | | 19 | | February 21, 2024 |
| | | | | | |
MGIC Investment Corporation 20222023 Form 10-K | 124128
| | | | | | | Incorporated by Reference | | | | | Incorporated by Reference |
Exhibit Number | Exhibit Number | | Description of Exhibit | | Form | | Exhibit(s) | | Filing Date | Exhibit Number | | Description of Exhibit | | Form | | Exhibit(s) | | Filing Date |
| 10.11.5 | | | | 10-Q | | 10.11.5 | | May 5, 2021 |
| | | |
| | | | | | | | |
| 23 | 23 | | | | | | | | | 23 | | | | |
| | | | | | | | | | | | | | |
| | | | | | | | | | | | | | |
| | | | | | | | | | | | | | |
| | | | | | 10-K | | 97 | | February 21, 2024 |
| 99.1 | 99.1 | | | | 10-K | | 99.1 | | March 2, 2009 | 99.1 | | | | 10-K | | 99.1 | | March 2, 2009 |
| 99.2 | 99.2 | | | | 10-K | | 99.2 | | March 2, 2009 | 99.2 | | | | 10-K | | 99.2 | | March 2, 2009 |
| 99.7 | 99.7 | | | | 10-Q | | 99.7 | | May 10, 2012 | 99.7 | | | | 10-Q | | 99.7 | | May 10, 2012 |
| 99.19 | 99.19 | | | | 10-Q | | 99.19 | | November 7, 2014 | 99.19 | | | | 10-Q | | 99.19 | | November 7, 2014 |
| 99.25 | 99.25 | | | | 10-Q | | 99.25 | | May 7, 2015 | 99.25 | | | | 10-Q | | 99.25 | | May 7, 2015 |
| 99.26 | 99.26 | | | | 10-K | | 10.2.15 | | February 26, 2016 | 99.26 | | | | 10-K | | 10.2.15 | | February 26, 2016 |
| 99.27 | 99.27 | | | | 10-Q | | 99.27 | | May 5, 2017 | 99.27 | | | | 10-Q | | 99.27 | | May 5, 2017 |
| 99.28 | 99.28 | | | | 10-Q | | 99.28 | | May 7, 2020 | 99.28 | | | | 10-Q | | 99.28 | | May 7, 2020 |
| 99.29 | 99.29 | | | | 10-Q | | 99.29 | | May 7, 2020 | 99.29 | | | | 10-Q | | 99.29 | | May 7, 2020 |
| 101.INS | 101.INS | | XBRL Instance Document | |
| 101.SCH | 101.SCH | | XBRL Taxonomy Extension Schema Document | |
| 101.SCH | |
| 101.SCH | |
| 101.CAL | |
| 101.CAL | |
| 101.CAL | 101.CAL | | XBRL Taxonomy Extension Calculation Linkbase Document | |
| 101.DEF | 101.DEF | | XBRL Taxonomy Extension Definition Linkbase Document | |
| 101.DEF | |
| 101.DEF | |
| 101.LAB | |
| 101.LAB | |
| 101.LAB | 101.LAB | | XBRL Taxonomy Extension Label Linkbase Document | |
| 101.PRE | 101.PRE | | XBRL Taxonomy Extension Presentation Linkbase Document | |
| 101.PRE | |
| 101.PRE | |
| 104 | 104 | | Cover Page Interactive Data File (formatted as Inline XBRL and contained in Exhibit 101)
| |
| 104 | |
| 104 | |
| | | | | |
| * | Denotes a management contract or compensatory plan. |
| ** | Certain portions of this Exhibit are redacted and covered by a confidential treatment request that has been granted. Omitted portions have been filed separately with the Securities and Exchange Commission. |
| † | Filed herewith. |
| †† | Furnished herewith. |
MGIC Investment Corporation 20222023 Form 10-K | 125129
Item 16. Form 10-K Summary
Not applicable.
MGIC Investment Corporation 20222023 Form 10-K | 126130
SIGNATURES
Pursuant to the requirements of Section 13 or 15(d) of the Securities Exchange Act of 1934, the registrant has duly caused this report to be signed on its behalf by the undersigned, thereunto duly authorized, on February 22, 2023.21, 2024.
MGIC INVESTMENT CORPORATION
| | | | | |
| /s/ Timothy J. Mattke | |
| Timothy J. Mattke | |
| Chief Executive Officer and Director | |
Pursuant to the requirements of the Securities Exchange Act of 1934, this report has been signed below as of the date set forth above by the following persons on behalf of the registrant and in the capacities indicated.
| | | | | | | | |
/s/ Timothy J. Mattke
| | /s/ Jay C. Hartzell |
| Timothy J. Mattke | | Jay C. Hartzell, Director |
| Chief Executive Officer and Director | | |
| | | |
| | | /s/ Timothy A. Holt |
| /s/ Nathaniel H. Colson | | Timothy A. Holt, Director |
| Nathaniel H. Colson | | |
| Executive Vice President and | | |
| Chief Financial Officer | | /s/ Jodeen A. Kozlak |
| (Principal Financial Officer) | | Jodeen A. Kozlak, Director |
| | |
| | | |
| /s/ Julie K. Sperber | | /s/ Michael E. Lehman |
| Julie K. Sperber | | Michael E. Lehman, Director |
| Vice President, Controller and | | |
| Chief Accounting Officer | | |
| (Principal Accounting Officer) | | /s/ Teresita M. Lowman |
| | | Teresita M. Lowman |
| | | |
| /s/ Analisa M. Allen | | |
Analisa M. Allen, Director | | /s/ Gary A. Poliner |
| | Gary A. Poliner, Director |
| | |
/s/ Daniel A. Arrigoni | | |
Daniel A. Arrigoni, Director | | /s/ Sheryl L. Sculley |
| | | Sheryl L. Sculley, Director |
| | | |
| /s/ Daniel A. Arrigoni | | |
| Daniel A. Arrigoni, Director | | /s/ Michael L. Thompson |
| | Michael L. Thompson, Director |
| | |
| /s/ C. Edward Chaplin | | |
| C. Edward Chaplin, Director | | /s/ Mark M. Zandi |
| | Mark M. Zandi, Director |
| | |
| /s/ Curt S. Culver | | |
| Curt S. Culver, Director | | |
| | |
MGIC Investment Corporation 20222023 Form 10-K | 127131
MGIC INVESTMENT CORPORATION
| SCHEDULE I — Summary of investments - Other than investments in related parties - December 31, 2022
| (In thousands)
Type of Investment | | Amortized Cost | | Fair Value | | Amount at which shown in the balance sheet |
SCHEDULE I — Summary of investments - Other than investments in related parties - December 31, 2023
| | SCHEDULE I — Summary of investments - Other than investments in related parties - December 31, 2023
|
| (In thousands) | | (In thousands) | | Amortized Cost | | Fair Value | | Amount at which shown in the balance sheet |
| Fixed income: | Fixed income: | |
| Bonds: | Bonds: | |
| Bonds: | |
| Bonds: | |
| U.S. Treasury securities and obligations of U.S. government corporations and agencies | |
| U.S. Treasury securities and obligations of U.S. government corporations and agencies | |
| U.S. Treasury securities and obligations of U.S. government corporations and agencies | U.S. Treasury securities and obligations of U.S. government corporations and agencies | | $ | 145,581 | | | $ | 135,900 | | | $ | 135,900 | |
| Obligations of U.S. states and political subdivisions | Obligations of U.S. states and political subdivisions | | 2,400,261 | | | 2,149,054 | | | 2,149,054 | |
| Foreign governments | | 4,486 | | | 3,787 | | | 3,787 | |
| Foreign government debt | |
| Public utilities | Public utilities | | 267,319 | | | 266,895 | | | 266,895 | |
| ABS | ABS | | 126,723 | | | 120,687 | | | 120,687 | |
| CLOs | CLOs | | 337,656 | | | 329,832 | | | 329,832 | |
| Mortgage-backed | Mortgage-backed | | 481,528 | | | 435,224 | | | 435,224 | |
| All other corporate debt securities | All other corporate debt securities | | 2,149,156 | | | 1,954,247 | | | 1,954,247 | |
| Commercial paper | Commercial paper | | 14,075 | | | 14,072 | | | 14,072 | |
| Total fixed income | Total fixed income | | 5,926,785 | | | 5,409,698 | | | 5,409,698 | |
| | Equity securities: | Equity securities: | | | | | | |
| Equity securities: | |
| Equity securities: | | | |
| Common stocks: | Common stocks: | | | | | | | Common stocks: | | |
| Industrial, miscellaneous and all other | Industrial, miscellaneous and all other | | 15,924 | | | 14,140 | | | 14,140 | |
| Total equity securities | Total equity securities | | 15,924 | | | 14,140 | | | 14,140 | |
| | Total investments | Total investments | | $ | 5,942,709 | | | $ | 5,423,838 | | | $ | 5,423,838 | |
| Total investments | |
| Total investments | |
MGIC Investment Corporation 20222023 Form 10-K | 128132
MGIC INVESTMENT CORPORATION
| SCHEDULE II - Condensed Financial Information of Registrant Condensed Balance Sheets Parent Company Only | SCHEDULE II - Condensed Financial Information of Registrant Condensed Balance Sheets Parent Company Only | SCHEDULE II - Condensed Financial Information of Registrant
Condensed Balance Sheets
Parent Company Only |
| December 31, |
| | December 31, | | | | December 31, |
| (In thousands) | (In thousands) | | 2022 | | 2021 | (In thousands) | | 2023 | | 2022 |
| ASSETS | ASSETS | |
| Fixed income, available-for-sale, at fair value (amortized cost, 2022 – $419,751 ; 2021 – $550,324) | | $ | 407,509 | | | $ | 538,872 | |
| Fixed income, available-for-sale, at fair value (amortized cost, 2023 – $597,944 ; 2022 – $299,649) | |
| Fixed income, available-for-sale, at fair value (amortized cost, 2023 – $597,944 ; 2022 – $299,649) | |
| Fixed income, available-for-sale, at fair value (amortized cost, 2023 – $597,944 ; 2022 – $299,649) | |
| Short-term, fixed income, available-for-sale, at fair value (amortized cost, 2023 – $110,889 ; 2022 – $120,102) | |
| Total investment portfolio | |
| Cash and cash equivalents | Cash and cash equivalents | | 239,404 | | | 124,164 | |
| Investment in subsidiaries, at equity in net assets | Investment in subsidiaries, at equity in net assets | | 4,502,261 | | | 4,964,954 | |
| Accounts receivable - affiliates | Accounts receivable - affiliates | | 864 | | | 2,130 | |
| Income taxes - current and deferred | Income taxes - current and deferred | | 167,966 | | | 242,427 | |
| Accrued investment income | Accrued investment income | | 3,387 | | | 2,642 | |
| Total assets | Total assets | | $ | 5,321,391 | | | $ | 5,875,189 | |
| | LIABILITIES AND SHAREHOLDERS' EQUITY | |
| LIABILITIES AND SHAREHOLDERS' EQUITY | |
| LIABILITIES AND SHAREHOLDERS' EQUITY | LIABILITIES AND SHAREHOLDERS' EQUITY | | | | | | | | |
| Liabilities: | Liabilities: | | | | | Liabilities: | | | | |
| Senior notes | Senior notes | | $ | 641,724 | | | $ | 881,508 | |
| Convertible junior subordinated debentures | Convertible junior subordinated debentures | | 21,086 | | | 110,204 | |
| Accrued interest | Accrued interest | | 13,271 | | | 20,501 | |
| Other liabilities | Other liabilities | | 2,570 | | | 1,594 | |
| Total liabilities | Total liabilities | | 678,651 | | | 1,013,807 | |
| | Shareholders’ equity: | Shareholders’ equity: | | | | |
| Common stock (one dollar par value, shares authorized 1,000,000; shares issued 2022 - 371,353; 2021 - 371,353; shares outstanding 2022 - 293,433; 2021 - 320,336) | | 371,353 | | | 371,353 | |
| Shareholders’ equity: | |
| Shareholders’ equity: | | | | | |
| Common stock ($1.00 par value, shares authorized 1,000,000; shares issued 2023 - 371,353; 2022 - 371,353; shares outstanding 2023 - 272,494; 2022 - 293,433) | |
| Paid-in capital | Paid-in capital | | 1,798,842 | | | 1,794,906 | |
| Treasury stock at cost (shares 2022 - 77,920; 2021 - 51,017) | | (1,050,238) | | | (675,265) | |
| Treasury stock at cost (shares 2023 - 98,859; 2022 - 77,920) | |
| Accumulated other comprehensive income, net of tax | Accumulated other comprehensive income, net of tax | | (481,511) | | | 119,697 | |
| Retained earnings | Retained earnings | | 4,004,294 | | | 3,250,691 | |
| Total shareholders’ equity | Total shareholders’ equity | | 4,642,740 | | | 4,861,382 | |
| Total liabilities and shareholders’ equity | Total liabilities and shareholders’ equity | | $ | 5,321,391 | | | $ | 5,875,189 | |
See accompanying supplementary notes to Parent Company condensed financial statements.
MGIC Investment Corporation 20222023 Form 10-K | 129133
MGIC INVESTMENT CORPORATION
| SCHEDULE II - Condensed Financial Information of Registrant Condensed Statements of Operations Parent Company Only | SCHEDULE II - Condensed Financial Information of Registrant Condensed Statements of Operations Parent Company Only | SCHEDULE II - Condensed Financial Information of Registrant Condensed Statements of Operations Parent Company Only |
| Years Ended December 31, |
| | Years Ended December 31, | | | | Years Ended December 31, |
| (In thousands) | (In thousands) | | 2022 | | 2021 | | 2020 | (In thousands) | | 2023 | | 2022 | | 2021 |
| Revenues: | Revenues: | |
| Investment income, net of expenses | |
| Investment income, net of expenses | |
| Investment income, net of expenses | Investment income, net of expenses | | $ | 7,193 | | | $ | 3,850 | | | $ | 7,090 | |
| Net realized investment gains (losses) | Net realized investment gains (losses) | | (2,628) | | | 490 | | | 1,454 | |
| Total revenues | Total revenues | | 4,565 | | | 4,340 | | | 8,544 | |
| | Expenses: | |
| Expenses: | |
| Expenses: | Expenses: | | | | | | | | | | |
| Operating expenses | Operating expenses | | 1,575 | | | 1,644 | | | 719 | |
| Interest expense | Interest expense | | 47,601 | | | 68,359 | | | 65,472 | |
| Loss on debt extinguishment | Loss on debt extinguishment | | 38,870 | | | 36,914 | | | 35,033 | |
| Total expenses | Total expenses | | 88,046 | | | 106,917 | | | 101,224 | |
| Loss before tax | Loss before tax | | (83,481) | | | (102,577) | | | (92,680) | |
| (Benefit from) provision for income taxes | (Benefit from) provision for income taxes | | (17,851) | | | (21,240) | | | (18,431) | |
| Equity in net income of subsidiaries | Equity in net income of subsidiaries | | 930,979 | | | 716,320 | | | 520,342 | |
| Net income | Net income | | 865,349 | | | 634,983 | | | 446,093 | |
| Other comprehensive income (loss), net of tax | Other comprehensive income (loss), net of tax | | (601,208) | | | (97,124) | | | 144,113 | |
| Comprehensive income | Comprehensive income | | $ | 264,141 | | | $ | 537,859 | | | $ | 590,206 | |
See accompanying supplementary notes to Parent Company condensed financial statements.
MGIC Investment Corporation 20222023 Form 10-K | 130134
MGIC INVESTMENT CORPORATION
| SCHEDULE II - Condensed Financial Information of Registrant Condensed Statements of Cash Flows Parent Company Only | SCHEDULE II - Condensed Financial Information of Registrant Condensed Statements of Cash Flows Parent Company Only | SCHEDULE II - Condensed Financial Information of Registrant Condensed Statements of Cash Flows Parent Company Only |
| Years Ended December 31, |
| | Years Ended December 31, | | | | Years Ended December 31, |
| (In thousands) | (In thousands) | | 2022 | | 2021 | | 2020 | (In thousands) | | 2023 | | 2022 | | 2021 |
| Cash flows from operating activities: | Cash flows from operating activities: | |
| Net income | |
| Net income | |
| Net income | Net income | | $ | 865,349 | | | $ | 634,983 | | | $ | 446,093 | |
| Adjustments to reconcile net income to net cash provided by operating activities: | Adjustments to reconcile net income to net cash provided by operating activities: | | | | | | | Adjustments to reconcile net income to net cash provided by operating activities: | | | | |
| Equity in net income of subsidiaries | Equity in net income of subsidiaries | | (930,979) | | | (716,320) | | | (520,342) | |
| Dividends received from subsidiaries | Dividends received from subsidiaries | | 626,695 | | | 400,000 | | | 221,024 | |
| Deferred tax (benefit) expense | Deferred tax (benefit) expense | | 119,588 | | | (21,551) | | | (18,252) | |
| | Loss on debt extinguishment | |
| Loss on debt extinguishment | |
| Loss on debt extinguishment | Loss on debt extinguishment | | 38,870 | | | 36,914 | | | 35,033 | |
| Other | Other | | 33,619 | | | 29,799 | | | 19,088 | |
| Change in certain assets and liabilities: | Change in certain assets and liabilities: | | | | | | | Change in certain assets and liabilities: | | | | |
| Accounts receivable - affiliates | Accounts receivable - affiliates | | 1,266 | | | (680) | | | 972 | |
| Income taxes receivable | Income taxes receivable | | (43,123) | | | (306) | | | — | |
| Accrued investment income | Accrued investment income | | 931 | | | 1,118 | | | (1,262) | |
| Accrued interest | Accrued interest | | (7,230) | | | (2,503) | | | 5,076 | |
| Net cash provided by operating activities | Net cash provided by operating activities | | 704,986 | | | 361,454 | | | 187,430 | |
| Cash flows from investing activities: | Cash flows from investing activities: | | | | | | | Cash flows from investing activities: | | | | |
| | Purchases of investments | Purchases of investments | | (1,457) | | | (339,384) | | | (1,131,060) | |
| | Purchases of investments | |
| | Purchases of investments | |
| Proceeds from sales of investments | Proceeds from sales of investments | | 287,924 | | | 556,384 | | | 812,188 | |
| Net cash provided by (used in) investing activities | Net cash provided by (used in) investing activities | | 286,467 | | | 217,000 | | | (318,872) | |
| Cash flows from financing activities: | Cash flows from financing activities: | | | | | | | Cash flows from financing activities: | | | | |
| Proceeds from issuance of senior notes | | — | | | — | | | 640,250 | |
| Purchase of senior notes | | — | | | — | | | (179,735) | |
| | Payment of original issue discount - senior notes | | — | | | — | | | (2,969) | |
| Purchase of convertible junior subordinated debentures | | (89,118) | | | (98,610) | | | (36,392) | |
| Payment of original issue discount - convertible junior subordinated debentures | | — | | | — | | | (15,049) | |
| | Conversion/Purchase of convertible junior subordinated debentures | |
| | Conversion/Purchase of convertible junior subordinated debentures | |
| | Conversion/Purchase of convertible junior subordinated debentures | |
| | Redemption of 5.75% senior notes | |
| Redemption of 5.75% senior notes | |
| Redemption of 5.75% senior notes | Redemption of 5.75% senior notes | | (242,296) | | | — | | | — | |
| Cash portion of loss on debt extinguishment | Cash portion of loss on debt extinguishment | | (38,185) | | | (36,914) | | | (25,266) | |
| Repurchase of common stock | Repurchase of common stock | | (385,573) | | | (290,818) | | | (119,997) | |
| Dividends paid | Dividends paid | | (110,947) | | | (94,219) | | | (82,061) | |
| Payment of debt issuance costs | | — | | | — | | | (2,020) | |
| | Payment of withholding taxes related to share-based compensation net share settlement | |
| Payment of withholding taxes related to share-based compensation net share settlement | |
| Payment of withholding taxes related to share-based compensation net share settlement | Payment of withholding taxes related to share-based compensation net share settlement | | (10,094) | | | (6,729) | | | (8,940) | |
| Net cash provided by (used in) financing activities | Net cash provided by (used in) financing activities | | (876,213) | | | (527,290) | | | 167,821 | |
| Net increase (decrease) in cash and cash equivalents | Net increase (decrease) in cash and cash equivalents | | 115,240 | | | 51,164 | | | 36,379 | |
| Cash and cash equivalents at beginning of year | Cash and cash equivalents at beginning of year | | 124,164 | | | 73,000 | | | 36,621 | |
| Cash and cash equivalents at end of year | Cash and cash equivalents at end of year | | $ | 239,404 | | | $ | 124,164 | | | $ | 73,000 | |
See accompanying supplementary notes to Parent Company condensed financial statements.
MGIC Investment Corporation 20222023 Form 10-K | 131135
SCHEDULE II — CONDENSED FINANCIAL INFORMATION OF REGISTRANT
PARENT COMPANY ONLY
SUPPLEMENTARY NOTES
Note A
The accompanying Parent Company financial statements should be read in conjunction with the consolidated financial statements and notes to consolidated financial statements appearing this annual report.
Note B
Our insurance subsidiaries are subject to statutory regulations as to maintenance of policyholders’ surplus and payment of dividends. The maximum amount of dividends that the insurance subsidiaries may pay in any twelve-month period without regulatory approval by the OCI is the lesser of adjusted statutory net income or 10% of statutory policyholders’ surplus as of the preceding calendar year end. Adjusted statutory net income is defined for this purpose to be the greater of statutory net income, net of realized investment gains, for the calendar year preceding the date of the dividend or statutory net income, net of realized investment gains, for the three calendar years preceding the date of the dividend less dividends paid within the first two of the preceding three calendar years. The maximum dividend that could be paid is reduced by dividends paid in the twelve months preceding the dividend payment date. Before making any dividend payments in 2024, we will notify the OCI to ensure it does not object.
The payment of dividends from MGIC is the principal source of cash inflow for MGIC Investment Corporation, our holding company, other than investment income and raising capital in the public markets. The payment of dividends by our insurance subsidiaries is restricted by insurance regulation as discussed above. MGIC paid a total of $600 million, $800 million $400 million and $390$400 million in dividends in cash and fixed income securities to our holding company during 2023, 2022, 2021 and 2020,2021, respectively. No contributions were made to our insurance subsidiaries in 2023, 2022, 2021 or 2020.2021.
Note C
The senior notes and convertible junior subordinated debentures ("9% Debentures"),5.25% Senior Notes discussed in Note 7 – “Debt” to our consolidated financial statements, are obligations of MGIC Investment Corporation, our holding company, and not of its subsidiaries.
MGIC Investment Corporation 20222023 Form 10-K | 132136
MGIC INVESTMENT CORPORATION
| SCHEDULE IV — Reinsurance Mortgage Insurance Premiums Earned Years Ended December 31, 2022, 2021 and 2020 | SCHEDULE IV — Reinsurance Mortgage Insurance Premiums Earned Years Ended December 31, 2023, 2022 and 2021 | | SCHEDULE IV — Reinsurance Mortgage Insurance Premiums Earned Years Ended December 31, 2023, 2022 and 2021 |
| | (Dollars in thousands) | (Dollars in thousands) | | Gross Amount | | Ceded to Other Companies | | Assumed From Other Companies | | Net Amount | | Percentage of Amount Assumed to Net |
| (Dollars in thousands) | |
| (Dollars in thousands) | | | Gross Amount | | Ceded to Other Companies | | Assumed From Other Companies | | Net Amount | | Percentage of Amount Assumed to Net |
| Years ended December 31, | Years ended December 31, | |
| 2023 | |
| 2023 | |
| 2023 | | | $ | 1,142,412 | | | $ | 202,821 | | | $ | 12,960 | | | $ | 952,551 | | | 1.4 | % |
| 2022 | 2022 | | $ | 1,154,728 | | | $ | 156,373 | | | $ | 8,778 | | | $ | 1,007,133 | | | 0.9 | % | 2022 | | 1,154,728 | | | 156,373 | | 156,373 | | | 8,778 | | 8,778 | | | 1,007,133 | | 1,007,133 | | | 0.9 | | 0.9 | % |
| 2021 | 2021 | | 1,167,592 | | | 163,031 | | | 9,858 | | | 1,014,419 | | | 1.0 | % | 2021 | | 1,167,592 | | | 163,031 | | 163,031 | | | 9,858 | | 9,858 | | | 1,014,419 | | 1,014,419 | | | 1.0 | | 1.0 | % |
| 2020 | | 1,199,824 | | | 188,729 | | | 10,848 | | | 1,021,943 | | | 1.1 | % |
MGIC Investment Corporation 20222023 Form 10-K | 133137