UNITED STATES
SECURITIES AND EXCHANGE COMMISSION
Washington, D.C. 20549
FORM 10-K
☒ | |
ANNUAL REPORT PURSUANT TO SECTION 13 OR 15(d) OF THE SECURITIES EXCHANGE ACT OF 1934 |
For the fiscal year ended
December 31OR
☐ | |
TRANSITION REPORT PURSUANT TO SECTION 13 OR 15(d) OF THE SECURITIES EXCHANGE ACT OF 1934 |
For the transition period from ____________ to ____________.
Commission File Number: 0-19582
OLD DOMINION FREIGHT LINE, INC.
(Exact name of registrant as specified in its charter)

Virginia | 56-0751714 | |
(State or other jurisdiction of incorporation or organization) | (I.R.S. Employer Identification No.) |
500 Old Dominion Way Thomasville, North Carolina | 27360 | |
(Address of principal executive offices) | (Zip Code) |
(Address of principal executive offices)
(Registrant’s telephone number, including area code)
_______________________________________
Securities registered pursuant to Section 12(b) of the Act:
Title of each class | Trading Symbol(s) | Name of each exchange on which registered |
Common Stock ($0.10 par value) | ODFL | The Nasdaq Stock Market LLC |
Securities registered pursuant to Section 12(g) of the Act: None
Indicate by check mark if the registrant is a well-known seasoned issuer, as defined in Rule 405 of the Securities Act. Yes
Indicate by check mark if the registrant is not required to file reports pursuant to Section 13 or Section 15(d) of the Act. Yes
Indicate by check mark whether the registrant (1) has filed all reports required to be filed by Section 13 or 15(d) of the Securities Exchange Act of 1934 during the preceding 12 months (or for such shorter period that the registrant was required to file such reports), and (2) has been subject to such filing requirements for the past 90 days. Yes
Indicate by check mark whether the registrant has submitted electronically and posted on its corporate Website, if any, every Interactive Data File required to be submitted and posted pursuant to Rule 405 of Regulation S-T (§232.405 of this chapter) during the preceding 12 months (or for such shorter period that the registrant was required to submit and post such files). Yes
Indicate by check mark whether the registrant is a large accelerated filer, an accelerated filer, a non-accelerated filer, a smaller reporting company, or an emerging growth company. See the definitions of “large accelerated filer,” “accelerated filer,” “smaller reporting company,” and "emerging“emerging growth company"company” in Rule 12b-2 of the Exchange Act.
Large accelerated filer | ☒ | Accelerated filer | ☐ | Emerging growth company | ☐ | ||
Non-accelerated filer | ☐ | Smaller reporting company | ☐ | ||||
If an emerging growth company, indicate by check mark if the registrant has elected not to use the extended transition period for complying with any new or revised financial accounting standards provided pursuant to Section 13(a) of the Exchange Act.
Indicate by check mark whether the registrant has filed a report on and attestation to its management’s assessment of the effectiveness of its internal control over financial reporting under Section 404(b) of the Sarbanes-Oxley Act (15 U.S.C.7262(b)) by the registered public accounting firm that prepared or issued its audit report. ☒
If securities are registered pursuant to Section 12(b) of the Act, indicate by check mark whether the financial statements of the registrant included in the filing reflect the correction of an error to previously issued financial statements. ☐
Indicate by check mark whether any of those error corrections are restatements that required a recovery analysis of incentive-based compensation received by any of the registrant’s executive officers during the relevant recovery period pursuant to §240.10D-1(b). ☐
Indicate by check mark whether the registrant is a shell company (as defined in Rule 12b-2 of the Act). Yes
The aggregate market value of voting stock held by non-affiliates of the registrant as of June 30, 20172023 was $6,264,630,995,$35,352,739,253, based on the closing sales price as reported on the Nasdaq Global Select Market.
As of February 23, 2018,21, 2024, the registrant had 82,374,451108,837,146 outstanding shares of Common Stock ($0.10 par value).
DOCUMENTS INCORPORATED BY REFERENCE
Certain portions of the Company’s Proxy Statement for the 20182024 Annual Meeting of Shareholders are incorporated by reference into Part III of this report.
INDEX
1 | |||||
Item | 1 | ||||
Item 1A | 6 | ||||
Item 1B | 18 | ||||
Item | 18 | ||||
Item | 19 | ||||
Item 3 | 19 | ||||
Item 4 | |||||
19 | |||||
20 | |||||
Item 5 | 20 | ||||
Item 6 | 21 | ||||
Item 7 | 22 | ||||
Item 7A | 30 | ||||
Item 8 | |||||
Item 9 | 47 | ||||
Item 9A | 47 | ||||
Item 9B | |||||
49 | |||||
Item 9C | Disclosure Regarding Foreign Jurisdictions that Prevent Inspections | 49 | |||
49 | |||||
Item 10 | 49 | ||||
Item 11 | 49 | ||||
Item 12 | 49 | ||||
Item 13 | 49 | ||||
Item 14 | |||||
49 | ||||
50 | ||||
Item 15 | 50 | |||
Item 16 | ||||
50 | |||||
51 | |||||
55 | |||||
FORWARD-LOOKING INFORMATION
Forward-looking statements appear in this Annual Report, including but not limited to Item 7, “Management’s Discussion and Analysis of Financial Condition and Results of Operations,” and in other written and oral statements made by or on behalf of us. These forward-looking statements include, but are not limited to, statements relating to our goals, strategies, expectations, competitive environment, compliance with regulations, availability of resources, future events and future financial performance. Such forward-looking statements are made pursuant to the safe harbor provisions of the Private Securities Litigation Reform Act of 1995. These forward-looking statements typically can be identified by such words as “anticipate,” “estimate,” “forecast,” “project,” “intend,” “expect,” “believe,” “should,” “could,” “may,” or other similar words or expressions. We caution readers that such forward-looking statements involve risks and uncertainties that could cause actual events or results to differ materially from those expressed or implied herein, including, but not limited to, the risk factors detailed in this Annual Report.
Our forward-looking statements are based on our beliefs and assumptions using information available at the time the statements are made. We caution the reader not to place undue reliance on our forward-looking statements as (i) these statements are neither a prediction nor a guarantee of future events or circumstances and (ii) the assumptions, beliefs, expectations and projections about future events may differ materially from actual results. We undertake no obligation to publicly update any forward-looking statement to reflect developments occurring after the statement is made, except to the extent required by law.
PART I
ITEM 1. BUSINESS
Unless the context requires otherwise, references in this report to “Old Dominion,” the “Company,” “we,” “us” and “our” refer to Old Dominion Freight Line, Inc.
Overview
We are a leading,one of the largest North American less-than-truckload (“LTL”), union-free motor carrier providingcarriers. We provide regional, inter-regional and national LTL services which include ground and air expedited transportation and consumer household pickup and delivery ("P&D"), through a single integrated, union-free organization. Our service offerings, which include expedited transportation, are provided through an expansive network of service centers located throughout the continental United States. Through strategic alliances, we also provide LTL services throughout North America. In addition to our core LTL services, we offer a range of value-added services including container drayage, truckload brokerage and supply chain consulting and warehousing.consulting. More than 97%98% of our revenue has historically been derived from transporting LTL shipments for our customers, whose demand for our services is generally tied to industrial production and the overall health of the U.S. domestic economy.
We have increased our revenue and customer base over this five-year periodthe past ten years primarily through organic market share growth. Our infrastructure allows us to provide next-day and second-day service through each of our regions covering the continental United States. WeIn addition to numerous service center renovations, expansions, and existing service center relocations, we opened 102, 22 and 2236 new service centers over the past one, five and ten years, respectively, for a total of 228257 service centers at December 31, 2017.2023. We believe this expansionthese actions produced increased capacity within our service center network and providesprovide us with opportunities for future growth.
We believe the growth in demand for our services can be attributed to our ability to consistently provide a superior level of customer service at a fair price, which allows our customers to meet their supply chain needs. Our integrated structure allows us to offer our customers consistent, high-quality service from origin to destination, and we believe our operating structure and proprietary information systems enable us to efficiently manage our operating costs. Our services are complemented by our technological capabilities, which we believe provide the tools to improve the efficiency of our operations while also empowering our customers to manage their individual shipping needs.
We were founded in 1934 and incorporated in Virginia in 1950. Our principal executive offices are located at 500 Old Dominion Way, Thomasville, North Carolina 27360. Please refer to the Balance Sheets and Statements of Operations included in Item 8, “Financial Statements and Supplementary Data” in this report for information regarding our total assets, revenue from operations and net income.
Our Industry
Trucking companies provide transportation services to virtually every industry operating in the United States and generally offer higher levels of reliability and faster transit times than other surface transportation options. The trucking industry is comprised principally of two types of motor carriers: LTL and truckload. LTL freight carriers typically pick up multiple shipments from multiple customers on a single truck. The LTL freight is then routed through a network of service centers where the freight may be transferred to other trucks with similar destinations. LTL motor carriers generally require a more expansive network of local pickup and delivery
1
(“P&D&D”) service centers, as well as larger breakbulk, or hub, facilities. In contrast, truckload carriers generally dedicate an entire truck to one customer from origin to destination.
Significant capital is required to create and maintain a network of service centers and a fleet of tractors and trailers. The high fixed costs and capital spending requirements for LTL motor carriers make it difficult for new start-up or small operators to effectively compete with established carriers. In addition, successful LTL motor carriers generally employ, and regularly update, a high level of technology-based systems and processes that provide information to customers and help reduce operating costs.
In 2022, the American Trucking Associations, the truckingLTL industry accounted for 79.8% of the $847.6 billion total U.S. transportation revenue in 2016. The LTL sector had revenue of approximately $53.8 billion based on information reported in 2016 of $54.7 billion, which represented 6.5% of total U.S. transportation revenue.Transport Topics. The LTL industry is highly competitive on the basis of service and price and has consolidated significantly since the industry was deregulated in 1980. Based on 2016 revenue as reported in
Competition
The transportation and logistics industry is intensely competitive and highly fragmented. We compete with regional, inter-regional and national LTL carriers and, to a lesser extent, with truckload carriers, small package carriers, airfreight carriers and railroads. We also compete with, and provide transportation services to, third-party logistics providers that determine both the mode of transportation and the carrier. Some of our competitors may have a broader global network and a wider range of services than we do. Competition in our industry is based primarily on service, price, available capacity and business relationships. We believe we are able to gain market share by expanding our capacity and providing high-quality service at a fair price.
Throughout our organization, we continuously seek to improve customer service by, among other things, maximizing on-time performance and minimizing cargo claims. We believe our transit times are generally faster and more reliable than those of our principal national competitors, in part because of our more efficient service center network, use of team drivers and proprietary technology. In addition, we provide greater geographic coverage than most of our regional competitors. Our diversified mix and scope of regional, inter-regional and national LTL service, combined with our value-added service offerings, enables us to provide our customers with a single source to meet their shipping and logistics needs. We believe the combination of these factors provides us with a distinct advantage over most of our competitors.
We utilize flexible scheduling and train our employees to perform multiple tasks, which we believe allows us to achieve greater productivity and higher levels of customer service than our competitors. We believe our focus on employee communication, continued education, development and motivation strengthens the relationships and trust among our employees.
Service Center Operations
At December 31, 2017,2023, we operated 228257 service center locations, of which we owned 194233 and leased 34. Our network includes ten major breakbulk facilities located in Rialto, California; Atlanta, Georgia; Columbus, Ohio; Indianapolis, Indiana; Greensboro, North Carolina; Harrisburg, Pennsylvania; Memphis and Morristown, Tennessee; Dallas, Texas; and Salt Lake City, Utah, while using various other service centers for additional limited breakbulk activity in order to serve our next-day markets. Our service centers are strategically located throughout the country so that we can provide the highest quality service and minimize freight rehandling costs.
Although we have established primary responsibility for customer service at the local service center level, our customers may access information and initiate transactions through our centralized customer service department located at our corporate office or through other electronic gateways.digital channels. Our systems allow us to offer our customers access to information such as freight tracking, shipping documents, rate quotes, rate databases and account activity. These centralizedOur integrated systems and our customer service department provide our customers with a single point of contact to access information across all areas of our operations and for each of our service offerings.
Linehaul Transportation
Linehaul dispatchers control the movement of freight between service centers through integrated freight movement systems. We also utilize load-planning software to optimize efficiencies in our linehaul operations. Our management team monitors freight
2
movements, transit times, load factors and many other productivity measurements to help ensure that we maintain our high levels of service and efficiency.
We utilize scheduled routes and additional linehaul dispatches as necessary to meet our published transit times. In addition, we gain efficiency through the use of twin 28-foot trailers in our linehaul operations. The use of twin 28-foot trailers permits us to transport freight directly from its point of origin to destination with minimal unloading and reloading, which also reduces our exposure to potential cargo loss and damage expenses. We utilize long-combination vehicles, such as triple 28-foot trailers and combinations of 48-foot and 28-foot trailers, in states where permitted. Twin trailers and long-combination vehicles permit more freight to be transported behind a tractor than could otherwise be transported by one trailer.
Tractors, Trailers and Maintenance
At December 31, 2017,2023, we owned 8,31610,791 tractors. We generally use new tractors in linehaul operations for approximately three to five years and then transfer those tractors to P&D operations for the remainder of their useful lives. In many of our service centers, tractors perform P&D functions during the day and linehaul functions at night to maximize tractor utilization.
The table below reflects, as of December 31, 2017,2023, the average age of our tractors and trailers:
| Type of Equipment | Number of Units | Average Age (In years) | ||||
| Tractors | 8,316 | 4.0 | ||||
| Linehaul trailers | 23,100 | 6.5 | ||||
| P&D trailers | 9,790 | 8.1 | ||||
Type of Equipment |
| Number of |
|
| Average Age |
| ||
Tractors |
|
| 10,791 |
|
|
| 4.5 |
|
Linehaul trailers |
|
| 31,233 |
|
|
| 7.0 |
|
P&D trailers |
|
| 15,181 |
|
|
| 7.2 |
|
We develop certain specifications for tractors and trailers and then negotiate the production and purchase of this equipment with several manufacturers. These purchases are planned well in advance of anticipated delivery dates in order to accommodate manufacturers’ production schedules. We generally believe there is sufficient capacity among suppliers to help ensure an uninterrupted supply of equipment to support our operations.
The table below sets forth our capital expenditures for tractors and trailers for the years ended December 31, 2017, 20162023 and 2015.2022. For more information concerning our capital expenditures, see Item 7, “Management’s Discussion and Analysis of Financial Condition and Results of Operations – Liquidity and Capital Resources” in this report.
| Year Ended December 31, | ||||||||||||
| (In thousands) | 2017 | 2016 | 2015 | |||||||||
| Tractors | $ | 123,152 | $ | 114,166 | $ | 128,911 | ||||||
| Trailers | 37,424 | 94,040 | 114,209 | |||||||||
| Total | $ | 160,576 | $ | 208,206 | $ | 243,120 | ||||||
|
| Year Ended December 31, |
| |||||
In thousands |
| 2023 |
|
| 2022 |
| ||
Tractors |
| $ | 203,417 |
|
| $ | 148,719 |
|
Trailers |
|
| 181,534 |
|
|
| 216,697 |
|
Total |
| $ | 384,951 |
|
| $ | 365,416 |
|
At December 31, 2017,2023, we operated 3946 fleet maintenance centers at strategic service center locations throughout our network. These fleet maintenance centers are equipped to perform routine and preventive maintenance and repairs on our equipment.
We adhere to established maintenance policies and procedures to help ensure our fleet is properly maintained. Tractors are routed to appropriate maintenance facilities or authorized repair vendors generally at designated mileage intervals or every 90 days, whichever occurs first. Trailers are also generally scheduled for preventativepreventive maintenance every 90 days.
Customers
Revenue is generated primarily from customers throughout the United States and North America. In 2017,2023, our largest customer accounted for approximately 3.7%5.2% of our revenue and our largest 5, 10 and 20 customers accounted for 11.2%15.0%, 17.0%21.6% and 23.6%30.6% of our revenue, respectively. For each of the previous threeour last two fiscal years, more than 95% of our revenue was derived from services performed in the United States and less than 5% of our revenue was generated from services performed internationally. We believe the diversity of our customer base helps protect our business from adverse developments in a single geographic region and from the reduction or loss of business from a single customer.
3
We utilize an integrated freight-costing system to determine the price level at which a particular freight shipment of freight will be profitable. We can modify elements of this freight-costing model to simulate the actual conditions under which the freight will be moved. Many of our customers engage our services through the terms and provisions of our tariffs and through negotiated service contracts. We also compete for business by participating in bid solicitations. Customers generally solicit bids for relatively large numbers of shipments for a period of one to two years and typically choose to enter into contractual arrangements with a limited number of motor carriers based upon price and service.
Seasonality
Our tonnage levels and revenue mix are subject to seasonal trends common in our industry, although other factors, such as macroeconomic changes, could cause variation in these trends. Our revenue and operating margins in the first and fourth quarters are typically lower than those during the second and third quarters due to reduced shipments during the winter months. Harsh winter weather, orhurricanes, tornadoes, floods and other natural disasters such as hurricanes, tornadoes and floods, can also adversely impact our performance by reducing demand and increasing operating expenses. We believe seasonal trends will continue to impact our business.
Technology
Our technology is critical to the success and delivery of the premium service provided by our operations. We continually seek to upgrade and enhance our technological capabilities.capabilities, including our use of cloud-based technology. We also provide access to our systems through multiple secure gateways that offer our customers and employees maximum flexibility and immediate access to information. We employ vehicle safety systems, forward-facing cameras, on-board and hand-held computer systems, smart phones, freight handling systems and logistics technology to reduce costs and transit times.times, as well as to meet regulatory requirements. Our data systems are integrated at every level within our organization, which we believe is critical to our success. Our systems are protected through physical and software safeguards, as well as redundant systems, network security measures and backup systems.backups. We continue to focus on the development and enhancement of the technology used in our operations in order to improve the efficiency and effectiveness of our services.
Insurance
We carry a significant amount of insurance with third-party insurance carriers but we are exposed tothat provides various levels of protection for our risk exposure, including protection in the riskareas of loss on claims up to the limit for which we hold either a self-insured retention ("SIR") or deductible. At December 31, 2017, the amounts of our SIR and/or deductibles were as follows:
Diesel Fuel Availability and Cost
We depend heavily upon the availability and quality of diesel fuel, including alternative fuel types, to provide our transportation services. We maintain fuel storage and pumping facilities at certain service center locations as the primary source for fueling our fleet, and we utilize over-the-road fueling options at retail locations as necessary. We could be susceptible to regional and/or national fuel shortages, which could cause us to incur additional expense in order to obtain an adequate supply within our own fueling network or cause us to rely more heavily on higher-priced retail fuel.
We believe our operations and financial condition are susceptible to the same diesel fuel price increases or shortages as those of our competitors. We implemented ahave fuel surcharge programprograms that are designed to mitigate the financial statement impact of changes in August 1999, which has remained in effect since that time and is onethe price of many components that we use to determine the overall price for our transportation services.diesel fuel. Our fuel surcharges are generally indexed to fuel prices published by the U.S. Department of Energy (the “DOE���“DOE”) that reset each week.week and are one of many components that we use to determine the overall price for our transportation services.
4
Human Capital
Employee Profile
As of December 31, 2017,2023, we employed 19,183 individuals on a22,902 active full-time basis,employees, none of which were represented under a collective bargaining agreement. Our full-time employees work in the following roles:
Full-Time Employees | Number of | |||
Drivers | 11,364 | |||
Platform | 4,227 | |||
Fleet technicians | 673 | |||
Sales, administrative and other | 6,638 | |||
Total | 22,902 | |||
Employee Engagement and Benefits
Our Old Dominion Family of employees are a key factor in the success of our business. The unique OD Family culture encourages development and employee engagement, and motivates our employees to provide the superior customer service for which we are known. We believe this culture is part of what attracts employees and helps keep our turnover rates low. We also provide our employees with a comprehensive benefits package, including a plan that covers our eligible employees’ premium for health insurance, voluntary disability and life insurance coverages, a flexible paid time off policy, a 401(k) plan with a guaranteed employer match as well as a discretionary employer match opportunity, and various wellness programs designed to assist employees with establishing and living a healthy and balanced lifestyle.
Employee Development and Safety
As of December 31, 2017,2023, we employed 5,3115,911 linehaul drivers and 4,8765,453 P&D drivers on a full-time basis. We select our drivers primarily based upon safemany factors, including driving records and experience. Among other requirements, our drivers must pass a drug test, have a current U.S. Department of Transportation (“DOT”) physical and have a valid commercial driver’s license prior to employment. Once employed, drivers are required to obtain and maintain hazardous materials endorsements to their commercial driver’s licenses. Drivers, like all of our employees, are required to take pre-employment drug and alcohol tests and are randomly selected for periodic additional testing.
Since 1988, we have provided thea no-cost opportunity for qualified employees to become drivers through the “Old Dominion Driver Training Program.” There are currently 2,8923,569 active drivers who have successfully completed this training, which was approximately 28.4%31.4% of our driver workforce as of December 31, 2017.2023. We believe our driver training and qualification programs have been important factors in improving our safety record and retaining qualified drivers. In addition, weOver 22% of our drivers have experienced an annualachieved one million safe driving miles or more. The 10-year average turnover rate for our driver graduates ofis approximately 5.9%7.4%, which is below our Company-wide10-year average turnover rate for allour Company-wide drivers of approximately 8.0%10.1%.
Based on driving records, our drivers who maintain safe driving recordsare eligible to be rewarded with annual safety bonuses of up to $3,000 per driver. Our safety bonuses paid to drivers totaled $3.9$5.5 million, $3.7$5.3 million and $3.4$4.9 million in 2017, 20162023, 2022 and 2015,2021, respectively.
We also maintain a “Management Trainee Program,” "Sales Trainee Program," and “Supervisor Development Program” that offer opportunities for our employees to be considered and prepared for sales and management opportunities. These programs support our philosophy of promoting from within our high-quality workforce.
Governmental Regulation
We are regulated by the DOT and by various state and federal agencies. These regulatory authorities have broad powers over matters relating to authorized motor carrier operations, as well as motor carrier registration, driver hours of service, safety and fitness of transportation equipment and drivers, transportation of hazardous materials, certain mergers and acquisitions and periodic financial reporting. The trucking industry is also subject to regulatory and legislative changes from a variety of other governmental authorities, which address matters such as increasingly stringent environmental regulations, occupational safety and health regulations, limits on vehicle weight and size, ergonomics, port security, and driver hours of service.
5
In addition, we are subject to compliance with cargo-security and transportation regulations issued by the Transportation Security Administration ("TSA"(“TSA”) and Customs and Border Protection ("CBP"(“CBP”) within the U.S. Department of Homeland Security. Regulatory requirements, and changes in regulatory requirements or guidance, may affect our business or the economics of the industry by requiring changes in operating practices that could influence the demand for and increase the costs of providing transportation services.
Driver Hours of Service
The Federal Motor Carrier Safety Administration (the "FMCSA"“FMCSA”) issued revised rules governing hours of service for commercialprovide that a truck drivers (the "2011 Rules"), and mandated compliance by July 1, 2013. The 2011 Rules reduced thedriver may work no more than a maximum number of 60 hours a truck driver could work each week towithin seven consecutive days and 70 hours from the former 82-hour limit. The 2011 Rules maintained thewithin eight consecutive days. FMCSA rules further impose a maximum 11-hour dailywork period of 14 hours (no more than 11 hours of which may be driving limit, but requiredtime) after first coming on-duty following 10 consecutive hours of off-duty time. FMCSA rules also require that drivers take a 30-minute break prior to workingdriving beyond eight hours. The 2011 Rules also added restrictions to the “34-hour restart” provision to include two rest periods between 1 a.m. and 5 a.m., and limited the use of the restart to once every 168 hours. Compliance with the 2011 Rules on July 1, 2013 required us to make certain changes in our operating procedures. These changes increased our operating costs by limiting the productivity of our drivers.
Commercial Driver'sDriver’s License Drug and Alcohol Clearinghouse
We are registered as a final rule establishingmotor carrier with the Commercial Driver’s License Drug and Alcohol Clearinghouse, ("DAC"). The DAC is a database that will maintain records ofwhich requires us to check for drug and alcohol violations of commercial motor vehicle drivers. The DAC will require us to checkcurrent drivers at least annually and prospective employees for drug and alcohol violations, and all current driver employees must be checked at least annually. The intent of the clearinghouse isprior to ensure that drivers cannot conceal drug and alcohol violations by changing jobs or locations. Compliance with this rule, which provides for a three-year implementation period, is required by January 6, 2020.
Environmental Regulation
We are subject to various federal, state and local environmental laws and regulations that focus on, among other things: the disposal, emission and discharge of hazardous waste, hazardous materials, or other materials into the environment or their presence at our properties or in our vehicles; fuel storage tanks; transportation of certain materials; and the discharge or retention of storm water. Under specific environmental laws, we could also be held responsible for any costs relating to contamination at our past or present facilities and at third-party waste disposal sites, as well as costs associated with clean-up of accidents involving our vehicles. We do not believe that the cost of future compliance with current environmental laws or regulations will have a material adverse effect on our operations, financial condition, competitive position or capital expenditures for the remainder of 2018 or fiscal year 2019.
Available Information
Through our website, http://www.odfl.com, we make available, free of charge, our Annual Report on Form 10-K, Quarterly Reports on Form 10-Q, Current Reports on Form 8-K and any amendments to those reports filed or furnished pursuant to Section 13(a) or 15(d) of the Securities Exchange Act of 1934 (the "Exchange Act"“Exchange Act”), as soon as practicable after we electronically file the material with or furnish it to the U.S. Securities and Exchange Commission (the “SEC”). The public may read or copy any document we file with the SEC at the SEC’s website,
ITEM 1A. RISK FACTORS
An investment in our actual results to differ materially from those projected in any forward-looking statement. In addition to the factors discussed elsewhere in this report, we believe thecommon stock involves a variety of risks and uncertainties. The following aredescribes some of the importantmaterial risks and uncertainties that could materiallyadversely affect our business, financial condition, operating results or results of operations:
Risks Related to our employees will not unionize in the future, particularly if regulatory changes occur that facilitate unionization.
If we are unable to successfully execute our growth strategy, and develop, market and consistently deliver high-quality services that meet customer expectations, our business and future results of operations may suffer.
Our growth strategy includes increasing the volume of freight moving through our existing service center network primarily by increasing our market share and selectively expanding our capacity and broadeningin the scope of our service offerings.United States. In connection with our growth strategy, at various times, we have consistently expanded and upgraded our service centers,center network, purchased additional equipment and increased our sales and marketing efforts, and we expect to continue to do so. Our growth strategy exposes us to a number of risks, including the following:
6
We cannot ensure that we will overcome the risks associated with our growth strategy. If we fail to overcome those risks, we may not realize additionalprojected growth and related revenue or profits from our efforts, we may incur additional expenses and, as a result, our financial position and results of operations could be materially and adversely affected.
Changes in our relationships with significant customers, including the loss or reduction in business from one or more of them, could have an adverse impact on our business.
We may be unabledo not believe the loss of any one customer would materially impact our business and revenue growth due to successfully consummate and integrate acquisitions as partthe diversity of our growth strategy.
Insurance and claims expenses could significantly reduce our profitability.
We are exposed to a variety of claims, including but not limited to those related to cargo loss and damage, property damage, personal injury, workers’ compensation group health and group dental.healthcare. We have insurance coverage with third-party insurance carriers, but we assume a significant portion of the risk associated with these claims due to our SIRsself-insured retentions and deductibles. Our operating results could be adversely affected if any of the following were to occur: (i) the number or the severity of claims increases; (ii) we are required to accrue or pay additional amounts because claims prove to be more severe than our original assessment; or (iii) claims exceed our coverage amounts. If claims exceed our SIRself-insured retention or deductible levels, insurance companies exit the transportation insurance marketplace, or insurance market conditions change, insurers could raise premiums for excess coverage to cover their expenses and anticipated future losses. Coverage also may not be procured or be unavailable for certain claims. In addition, insurance companies generally require us to collateralize our SIRself-insured retention or deductible levels. If these collateralization requirements increase, our borrowing capacity could be adversely affected.
Reductions in the available supply or increases in the cost of equipment and parts may adversely impact our profitability and cash flows.
We have previously experienced difficulties in purchasing equipment and parts for repair due to decreased supply and increased costs, and may experience such difficulties in the future. Investment in new equipment is a significant part of our annual capital expenditures and we require an available supply of tractors, trailers, and other freight handling equipment from manufacturers to operate and grow our business. We may also be subject to shortages in raw materials that are required for the production of critical operating equipment and supplies, such as shortages in rubber or steel. Tractor and trailer manufacturers have previously experienced shortages of various component parts and supplies, forcing many manufacturers to reduce or suspend their production, which led to a lower supply of tractors, trailers, and other equipment, higher prices, and lengthened trade cycles. In addition, the availability and price of our equipment may also be adversely affected in the future by regulations on newly manufactured equipment and engines. These regulations, the limited equipment availability, and other supply chain factors have resulted and could continue to result in higher prices for new equipment and related maintenance parts, which could have a material adverse effect on our business, financial
7
condition, and results of operations, particularly our maintenance expense, depreciation expense, capital expenditures, mileage productivity, and driver retention.
Various economic factors such as inflationary pressures or downturns in the domestic economy could adversely impact our profitability and cash flows.
Inflationary pressures have been significant in the United States in recent years. Inflation impacts the cost to operate our business by putting upward pressure on wages, benefits, real estate, equipment, fuel, parts and repairs, insurance, and other general and miscellaneous expenses. If we are unable to sufficiently increase our customer rates to offset the increase in our costs, our profitability and cash flows could be materially affected.
In 2023, we experienced lower freight volumes due to continued softness in the domestic economy. Decreased demand for LTL freight services can negatively impact shipment volume and lower weight per shipment, which in turn can negatively impact freight density in our network. Reduced freight density in our network can have a deleveraging impact on fixed costs, including depreciation and other indirect costs as a percent of revenue, which can adversely impact our profitability and cash flows.
Higher costs for or limited availability of suitable real estate may adversely affect our business operations.
Our business model is dependent on the cost and availability of service centers in key strategic areas. We have experienced higher costs to purchase, lease and/or build or renovate service centers as a result of inflation, supply chain issues, increased raw material and labor costs, and reduce our future profitability.
Our growth may be limited by the availability and cost of third-party transportation used to supplement our workforce and equipment needs.
Our growth strategy depends upon our ability to maintain adequate capacity throughout our service center network to support the transportation service needs of our customers. In order to maintain adequate capacity to support our customers’ demand for our services we may, from time to time, utilize third-party transportation services to supplement the capacity of our workforce and fleet. If we are unable to find suitable third-party transportation service providers that meet our high service-delivery standards at a reasonable cost, when needed, our revenue growth and financial results may be adversely impacted.
We may be adversely impacted by fluctuations in the availability and price of diesel fuel.
Diesel fuel is a critical component of our operations and a significant operating expense for our business. Fluctuations in prices and availability of diesel fuel could have a material adverse effect on our operating results. In addition, rising healthcare costsDiesel fuel prices and fuel availability can be impacted by factors beyond our control, such as natural or man-made disasters; adverse weather conditions; political events; disruption or failure of technology or information systems; price and supply decisions by oil producing countries and cartels; effect of any international conflicts; armed conflict; terrorist activities; world supply and demand imbalances; changes in refining capacity; changes in governmental policy concerning fuel production, transportation, taxes or marketing; tariffs; sanctions; public and investor sentiment; and quotas or other changes to trade agreements. We maintain fuel storage and pumping facilities at many of our service center locations; however, we may be susceptible to fuel shortages at certain locations that could forcecause us to make further changesincur additional expense to ensure adequate supply on a timely basis and to prevent a disruption to our benefits program,service schedules. An interruption in the supply of diesel fuel could have a material adverse effect on our operating results.
We do not hedge against the risk of diesel fuel price increases. An increase in diesel fuel prices or diesel fuel taxes, or any change in federal or state regulations that results in such an increase, could have a material adverse effect on our operating results. We have fuel surcharge programs in place with a majority of our customers, which help offset the negative impact of the increased cost of diesel fuel and other petroleum-based products. However, we also incur fuel costs that cannot be recovered even with respect to customers with which we maintain fuel surcharge programs, such as those costs associated with empty miles. Because our fuel surcharge recovery lags behind changes in fuel prices, our fuel surcharge recovery may not capture the increased costs we pay for fuel, especially when prices are rising, leading to fluctuations in our levels of reimbursement. We regularly monitor the components of our pricing, including fuel surcharges, and address individual account profitability issues with our customers when necessary; however, there can be no assurance that fuel surcharges can be maintained indefinitely or will be sufficiently effective in offsetting increases in diesel fuel prices.
8
Our results of operations may be affected by seasonal factors, harsh weather conditions and disasters.
Our operations are subject to seasonal trends common in our industry. Our revenue and operating margins in the first and fourth quarters are typically lower than those during the second and third quarters due to reduced shipments, decreased fuel efficiency, increased cold-weather related maintenance costs of revenue equipment, and increased insurance and claims costs during the winter months. Harsh weather or natural disasters, including but not limited to hurricanes, tornadoes, floods, fires, earthquakes and storms, can also adversely impact our performance by disrupting freight shipments or routes, destroying our assets, disrupting fuel supplies, increasing fuel costs, increasing maintenance costs, reducing demand and negatively impacting the business or financial condition of our customers, any of which could negatively impactharm our ability to attract and retain employees.
We have significant ongoing cash requirements that could limit our growth and affect our profitability if we are unable to obtain sufficient capital.
Our business is highly capital intensive. WeAs further described in Part II, Item 7 of this Annual Report on Form 10-K, we generally finance our capital expenditures and planned growth with existing cash, cash flowflows from operations, issuance of debt (including pursuant to our note purchase and private shelf agreement) and through available borrowings under our existing senior unsecured credit agreement. We may require additional capital to finance long-term real estate purchase opportunities and acquisitions, which we may fund through additional debt or through equity offerings. If we are unable to generate sufficient cash from our operations or raise capital by accessing the debt and equity markets, we may be forced to limit our growth and operate our equipment for longer periods of time, which could have a material adverse effect on our operating results.
A decrease in the demand and increased costsvalue of newused equipment may adversely affectimpact our earningsresults of operations.
As we purchase new tractors and cash flow.
We may be adversely impacted by fluctuations inunable to successfully consummate and integrate acquisitions.
In the availabilityfuture, we may seek to acquire other LTL carriers as well as other complementary businesses. Exploration of potential acquisitions requires significant attention from our management team. In addition, we expect to compete for acquisition opportunities with other companies, some of which may have greater financial and priceother resources than we do. We cannot ensure that we will have sufficient cash to consummate an acquisition or otherwise be able to obtain financing under acceptable terms - or obtain financing at all - for an acquisition. If we are unable to access sufficient funding for potential acquisitions, we may not be able to complete transactions that we otherwise find advantageous.
Any acquisition will entail numerous risks, including:
9
In addition, we may have difficulty integrating any acquired business and its operations, services and personnel into our existing operations, and such actions could result in significant costs and couldintegration may require a substantialsignificant amount of time and effort by our management team. We cannot predictTo the outcome of litigationextent we do not successfully avoid or governmental proceedingsovercome the risks or inquiries to whichproblems resulting from any acquisitions we areundertake, there could be a party or whether we will be subject to future legal actions. As a result, the potential costs associated with legal actions against us could adversely affectmaterial adverse effect on our business, financial condition orand results of operations.
We are subject to various risks arising from our international business operations and relationships, which could adversely affect our business.
We arrange for transportation and logistics services to and from various international locations and are subject to both the risks of conducting international business and the requirements of the Foreign Corrupt Practices Act of 1977 (the "FCPA"“FCPA”). Failure to comply with the FCPA may result in legal claims against us. In addition, we face other risks associated with international operations and relationships, which may include restrictive trade policies, the renegotiation of international trade agreements, imposition of duties, taxes or government royalties imposed by foreign governments.
Anti-terrorism measures and terrorist events may disrupt our business.
Federal, state and municipal authorities have implemented and are subjectcontinuing to legislative, regulatory,implement various anti-terrorism measures, including checkpoints and legal developments involving taxes.
Risks Related to our Industry
We operate in a rapidly evolving and highly competitive industry, and our business will suffer if we are subjectunable to U.S. federaladequately address potential downward pricing pressures and state income, payroll, property, salesother factors that may adversely affect our operations and use,profitability.
Our industry, faced with requirements for faster deliveries and increased visibility into shipments, is rapidly evolving and increasingly competitive. Numerous competitive factors could impair our ability to maintain our current profitability. These factors include, but are not limited to, the following:
10
If we are unable to effectively compete with other LTL carriers, whether on the basis of price, service, brand recognition or otherwise, we may be unable to retain existing customers or attract new customers, either of which could have a material adverse effect on our business, financial condition and results of operations. Furthermore, continued merger and acquisition or other transaction activity in transportation and logistics could result in stronger or new competitors, which could have a material adverse effect on our business, financial condition and results of operations. We may not be able to compete successfully in an increasingly consolidated LTL industry and cannot predict with certainty how industry consolidation will affect our competitors or us.
Our customers’ and suppliers’ businesses may be impacted by various economic factors such as recessions, inflation, downturns in the economy, global uncertainty and instability, changes in U.S. social, political, and regulatory conditions and/or a disruption of financial markets, which may decrease demand for our services or increase our costs.
Adverse macroeconomic conditions, both in the U.S. and internationally, such as recent high inflation, continued high interest rates and slower economic growth has, and may continue to, negatively affect our customers’ business levels, the amount of transportation services they need, their ability to pay for our services and overall freight levels, any of which might impair our asset utilization. Additionally, uncertainty and instability in the global economy or widespread outbreak of an illness or any other communicable disease or public health crisis, as we saw with the COVID-19 pandemic, may lead to fewer goods being transported and could have a material adverse effect on our business, financial condition and results of operations. The U.S. government has taken certain other actions that have negatively impacted U.S. trade, including imposing tariffs on certain goods imported into the United States, and several foreign governments have imposed tariffs on certain goods imported from the United States. Any further changes in U.S. or international trade policy could trigger additional retaliatory actions by affected countries, resulting in “trade wars” and increased costs for goods transported globally, which may reduce customer demand for these products if the parties having to pay tariffs or address other anti-trade measures increase their prices, or in trading partners limiting their trade with countries that impose such measures. If these consequences are realized, the volume of global economic activity may be significantly reduced. Such a reduction could have a material adverse effect on our business, results of operations and financial condition, as well as the price of our common stock.
Customers adversely impacted by changes in U.S. trade policies or otherwise encountering adverse economic conditions, including as a result of current inflationary pressures, may be unable to obtain additional financing or financing under acceptable terms. These customers represent a greater potential for bad debt losses, which may require us to increase our reserve for bad debt. Economic conditions resulting in bankruptcies of a concentration of our customers could have a significant impact on our financial position, results of operations or liquidity in a particular year or quarter. Further, when adverse economic times arise, customers may select competitors that offer lower rates in an attempt to lower their costs, and we might be forced to lower our rates or lose freight volumes.
Our suppliers’ business levels also may be negatively affected by adverse economic conditions and changes in the political and regulatory environment, both in the U.S. and internationally, or financial constraints, which could lead to disruptions in the workforce, supply and availability of equipment, parts and services critical to our operations. A significant interruption in our normal supply chain could disrupt our operations, increase our costs and negatively impact our ability to serve our customers.
Risks Related to Labor Matters
If our employees were to unionize, our operating costs would increase and our ability to compete would be impaired.
None of our employees are currently represented under a collective bargaining agreement. However, from time to time there have been efforts to organize our employees at various service centers. Further, Congress or one or more states could approve legislation and/or the National Labor Relations Board could render decisions or implement rule changes that could significantly affect
11
our business and our relationship with our employees, including actions that could substantially liberalize the procedures for union organization. In addition, we can offer no assurance that the Department of Labor will not adopt new regulations or interpret existing regulations in a manner that would favor the agenda of unions, or that our employees will not unionize in the future, particularly if continued regulatory changes facilitate unionization.
The unionization of our employees could have a material adverse effect on our business, financial condition and cash flows.
Increases in employee compensation and benefit packages used to attract and retain qualified employees, including drivers and maintenance technicians,and addressing general labor market challenges could adversely affect our profitability, our ability to maintain or grow our fleet and our ability to maintain our customer relationships.
In recent years, there have been periods of intense competition for qualified employees, specifically drivers, in the transportation industry resulting from a shortage of drivers and general labor market challenges. The extent and duration of the impact of these challenges are subject to seasonal trends commonnumerous factors, including our stringent hiring standards, behavioral changes, prevailing wage rates and other benefits, health and other insurance costs, inflation, stability of overall economic environment, adoption of new or revised employment and labor laws and regulations or government programs, and changing workforce demographics. As the available pool of qualified drivers has been declining, we have faced, and may continue to face, difficulty maintaining or increasing our number of drivers. Similarly, in our industry. Our revenue and operating marginsrecent years, there has been a decrease in the firstoverall supply of skilled maintenance technicians, particularly new technicians with qualifications from technical programs and fourth quartersschools, which has made it more difficult, and may continue to make it more difficult, to attract and retain skilled technicians. The compensation and benefit packages we offer our drivers, technicians and other specialized employees are typically lower than those duringsubject to market conditions that have required and may in the secondfuture require further increases in wages and third quarters duebenefits. If we are unable to reduced shipments during the winter months. Harsh winter weatherattract and retain a sufficient number of qualified drivers and technicians, or natural disasters, such as hurricanes, tornadoesaddress general labor market challenges, we could be required to adjust our compensation and floods, can also adversely impactbenefits packages, amend our performance by reducing demandhiring standards, or operate with fewer trucks and reducing our ability to transport freight,face difficulty meeting customer demands, any of which could result in decreased revenueadversely affect our growth and increased operating expenses.
If we are unable to retain our key employees, or if we do not continue to effectively execute our succession plan, our financial condition,business, results of operations and liquidityfinancial position could be adversely affected.
Our success will continue to depend upon the experience and leadership of our key employees and executive officers. In that regard, the loss of the services of any of our key personnel could have a material adverse effect on our financial condition, results of operations and liquidity if we are unable to secure replacement personnel who have sufficient experience in our industry and in the management of our business. If we are unable to continue to develop and retain a core group of management personnel and execute succession planning strategies, or we encounter any unforeseen difficulties associated with the recent transition of members of our management team, our business could be negatively impacted in the future.
Risks Related to Cybersecurity and their affiliate family members beneficially own an aggregate of approximately 20% of the outstanding shares of our common stock. As long as the Congdon family controls a large portion of our voting stock, they may be able to significantly influence the election of the entire Board of Directors and the outcome of all matters involving a shareholder vote. The Congdon family’s interests may differ from the interests of other shareholders and the status of their ownership could change at their discretion.
Our information technology systems are subject to cyber and other risks, some of which are beyond our control, which could have a material adverse effect on our business, results of operations and financial position.
We are reliantrely heavily on the proper functioning and availability of our information systems for our operations as well as for providing a value-added serviceservices to our customers. Our information systems, including our accounting, communications and data processing systems, are integral to the efficient operation of our business. It is critical that the data processed by these systems remainremains confidential, as it often includes competitive customer information, confidential customer credit cardpayment and transaction data,information, employee records and key financial and operational results and statistics. Cyber incidents that impact the security, availability, reliability, speed, accuracyThe sophistication of efforts by hackers, foreign
12
governments, cyber-terrorists, and cyber-criminals, acting individually or in coordinated groups, to launch distributed denial of service attacks or other proper functioningcoordinated attacks that may cause service outages, gain inappropriate or block legitimate access to systems or information, or result in other business interruptions has continued to increase. The rapid evolution and increased adoption of these systems and measures, including outages, computer viruses, break-ins and similar disruptions, could have a significant impact onartificial intelligence technologies may also intensify our operations.cybersecurity risks. We utilize third-party service providers who have access to our systems and certain sensitive data, which exposes us to additional security risks. Althoughrisks, particularly given the complex and evolving laws and regulations regarding privacy and data protection. While we and our third-party service providers have experienced cyber-attacks and attempted breaches of our and their information technology systems and networks or similar events from time to time, no such incidents have been, individually or in the aggregate, material to us. Cyber incidents that impact the security, availability, reliability, speed, accuracy or other proper functioning of our systems, information and measures, including outages, computer viruses, break-ins and similar disruptions, could have a significant impact on our operations.
We have security processes, protocols and standards in place to protect our information systems, are protectedincluding through physical and software safeguards, as well as redundant systems, network security measures and backup systems,systems. Nevertheless, it is difficult to fully protect against the possibility of power loss, telecommunications failures, cyber attacks,cyber-attacks, and other cyber incidents in every potential circumstance that may arise. A significant cyber incident, including system failure, security breach, disruption by malware or ransomware, or other damage, could interrupt or delay our operations, damage our reputation and brand, cause a loss of customers, expose us to a risk of loss or litigation, result in regulatory scrutiny, investigations, actions, fines or penalties and/or cause us to incur significant time and expense to remedy such an event, any of which could have a material adverse impact on our results of operations and financial position.
If we do not adapt to new technologies implemented by our competitors in the LTL and transportation industry, our business could suffer.
The LTL and transportation industry may be impacted by rapid changes in technologies. Our competitors may implement new technology, including artificial intelligence applications, that could improve their service, price, available capacity or business relationships and increase their market share. If we do not appropriately adapt our operations to these new technologies, our business, financial condition, and results of operations may suffer.
Failure to keep pace with developments in technology, any disruption to our technology infrastructure, or failures of essential services upon which our technology platforms rely could cause us to incur costs or result in a loss of business, which may have a material adverse effect on our results of operations and financial condition.
We rely heavily on information technology systems. Our information technology systems are complex and require ongoing investments and enhancements to meet both internal requirements and the requirements of our customers. If we are unable to invest in and enhance or modernize our technology systems in a timely manner or at a reasonable cost, or if we are unable to train our employees to operate the new, enhanced or modernized systems, our results of operations and financial condition could be adversely affected. We also may not achieve the benefits that we anticipate from any new technology or new or modernized system, and a failure to do so could result in higher than anticipated costs or adversely affect our results of operations.
Our information technology systems also depend upon the Internet, third-party service providers, global communications providers, satellite-based communications systems, the electric utilities grid, electric utility providers and telecommunications providers. We have minimal control over the operation, quality, or maintenance of these services or whether vendors will improve their services or continue to provide services that are essential to our business. Disruptions due to transitional challenges in upgrading or enhancing our technology systems; failures in the services upon which our information technology platforms rely, including those that may arise from adverse weather conditions or natural calamities, such asincluding but not limited to storms, floods, hurricanes, earthquakes or tornadoes; illegal acts, including terrorist attacks; human error or systems modernization initiatives; and/or other disruptions, may adversely affect our business, which could increase our costs or result in a loss of customers that could have a material adverse effect on our results of operations and financial position.condition.
13
Any disruption in the operational and technical services provided to our reputation through unfavorable publicityus by third parties could adversely affect our financial condition.
We rely on third parties to provide us with operational and technical services, such as hosting of our cloud computing and storage needs. The services largely depend on the current environmentuninterrupted operation of instantaneous communicationdata centers and social media outlets, the quickability to protect computer equipment and broad disseminationinformation stored in these data centers against damage that may be caused by, among other things, natural disaster, fire, power loss, telecommunications or Internet failure, acts of terrorism, and other similar damaging events. If any of such services were to become inoperable for an extended period, we might be unable to fulfill our contractual commitments. Furthermore, these third parties may have access to information we maintain about our company, operations, customers, employees, vendors, or technology that are critical to or can significantly impact our business operations. Our ability to monitor such third parties’ security measures is limited. Any security incident involving such third parties could compromise the confidentiality, integrity, or availability of, or result in the theft of, our, our customers’, our employees’, or our vendors’ data and could negatively impact our operations. Security processes, protocols and standards that we implement and contractual provisions requiring security measures that we impose on such third parties may not be sufficient or effective at preventing such events. Unauthorized access to data and other confidential or proprietary information may be obtained through media sources could cause damaging information about us, whether accuratebreak-ins, network breaches by unauthorized parties, employee theft or not,misuse, or other misconduct. If any of the foregoing were to occur or to be broadly publicized. Unfavorable publicity about us or our employees could damageperceived to occur, our reputation may suffer, our competitive position may be diminished, we could face lawsuits, regulatory investigation, fines, and maypotential liability, and our financial results could be negatively impacted.
Risks Related to Legal and Regulatory Matters
The FMCSA’s CSA initiative could adversely impact our ability to hire qualified drivers, meet our growth projections and maintain our customer relationships, each of which could adversely impact our results of operations.
The FMCSA’s Compliance, Safety, Accountability initiative (“CSA”) is an enforcement and compliance program designed to monitor and improve commercial motor vehicle safety by measuring the safety record of both the motor carrier and the driver. These measurements are scored and used by the FMCSA to identify potential safety risks and to direct enforcement action.
Our CSA scores are dependent upon our safety and compliance experience, which could change at any time. In addition, the safety standards prescribed in CSA could change and our ability to maintain an acceptable score could be adversely impacted. Public disclosure of certain CSA scores was restricted through the enactment of the Fixing America’s Surface Transportation Act of 2015 (the “FAST Act”) on December 4, 2015; however, the FAST Act does not restrict public disclosure of all data collected by the FMCSA. The FMCSA is currently reviewing CSA methodology to address deficiencies identified by the National Academy of Sciences, including the possibility of weak or negative correlation between current safety improvement categories and vehicle crash risk. Nevertheless, if we receive unacceptable CSA scores, and this data is made available to the public, our relationships with our customers could be damaged, which could result in a reduction in demand for our services or the loss of customers thatbusiness.
The requirements of the CSA could also shrink the industry’s pool of drivers, as those with unfavorable scores could leave the industry. As a result, the costs to attract, train and retain qualified drivers could increase. In addition, a shortage of qualified drivers could increase driver turnover, decrease asset utilization, limit growth and adversely impact our results of operations.
We operate in a highly regulated industry, and increased costs of compliance with, or liability for violation of, existing or future regulations could have a negative impactmaterial adverse effect on our business.
We are regulated by the DOT and by various state and federal agencies. These regulatory authorities have broad powers over matters relating to authorized motor carrier operations, as well as motor carrier registration, driver hours of service, safety and fitness of transportation equipment and drivers, transportation of hazardous materials, certain mergers and acquisitions and periodic financial condition, resultsreporting. The trucking industry is also subject to regulatory and legislative changes from a variety of operationsother governmental authorities, which address matters such as increasingly stringent environmental regulations, occupational safety and liquidity. This unfavorable publicityhealth regulations, limits on vehicle weight and size, ergonomics, port security, and driver hours of service. We are also subject to the costs and potential adverse impact of compliance associated with FMCSA’s ELD regulations and guidance, including the operation of our fleet and safety management systems on the ELD hardware and software platform. In addition, we are subject to compliance with cargo-security and transportation regulations issued by the TSA and CBP within the U.S. Department of Homeland Security. Regulatory requirements and changes in regulatory requirements or guidance, together with the growing compliance risks presented by increased differences between applicable federal and state regulations, may affect our business or the economics of the industry by requiring changes in operating practices that could influence the demand for and increase the costs of providing transportation services.
14
We are subject to various environmental laws and regulations, and costs of compliance with, liabilities under, or violations of, existing or future environmental laws or regulations could adversely affect our business.
We are subject to various federal, state and local environmental laws and regulations that govern, among other things, the disposal, emission and discharge of hazardous waste, hazardous materials, or other materials into the environment, their presence at our properties or in our vehicles, fuel storage tanks, the transportation of certain materials and the discharge or retention of storm water. Under specific environmental laws, we could also requirebe held responsible for any costs relating to contamination at our past or present facilities and at third-party waste disposal sites, as well as costs associated with the needclean-up of accidents involving our vehicles. Environmental laws have become and may continue to allocate significant resources to the rebuilding of our reputation.
We may be adversely affected by legal, regulatory, or market responses to climate change concerns.
Increased concern over climate change and the potential impact of global warming has led to an increase in current and proposed regulation from federal, state and local governments related to our carbon footprint, including with respect to vehicle engine and facility emissions. This increase in regulation could result in increased direct costs, such as taxes, fees, fuel, or capital costs, or changes to our operations in order to comply. There is also a focus from regulators and our customers on sustainability matters. This focus may result in additional legislation or customer requirements, such as limits on vehicle weight and size or energy source. Costs and operational risks associated with future climate change concerns or environmental laws and regulations, sustainability requirements and related investor expectations could have a material adverse effect on our financial condition, results of operations, liquidity and cash flows.
The engines in our newer tractors are subject to emissions-control regulations that could substantially increase operating expenses and future regulations concerning emissions or fuel-efficiency may have a material adverse impact on our business.
In December 2022, the U.S. Environmental Protection Agency (“EPA”) finalized new stringent emission standards to reduce nitrogen oxides and establish new standards for greenhouse gas emissions from heavy-duty engines under the Clean Trucks Plan. In December 2021, the California Air Resources Board (“CARB”) adopted more stringent standards to reduce nitrogen oxide emissions from heavy-duty trucks. Future strengthening of EPA, CARB or other federal or state regulatory requirements regarding fuel-efficiency or engine emissions of tractors could also result in increases in the demandcost of capital equipment and valuemaintenance.
The CARB’s Advanced Clean Fleets (“ACF”) rule requires fleets to adopt an increasing percentage of zero emission trucks, complementing CARB’s Advanced Clean Trucks (“ACT”) rule. The ACF rule applies to high-priority fleets of 50 or more trucks, aiming to accelerate the transition to zero emission vehicles (“ZEVs”). The ACF rule offers the ZEV Milestones Option or the Model Year Schedule. We have elected the ZEV Milestones Option, which allows fleets to phase in ZEVs between 2025 and 2042, depending on the type of vehicle and its usage. Fleet owners choosing this option must continuously meet or exceed certain scheduled ZEV Fleet Milestone percentage requirements. The ZEV Milestones Option ultimately requires 100% ZEVs by 2035. While CARB’s ACF and ACT regulations may permit companies to seek exemptions or relief, there are no assurances that relief from either regulation will be obtained. At this point, there are virtually no ZEVs widely available that are suitable replacements for current technology used equipmentin LTL operations. In addition, there does not appear to be sufficient infrastructure in place to support an electric vehicle fleet operation throughout our current terminal network. If ZEVs are not available or not commercially viable for the LTL market, we may be required to modify or curtail our operations in California. During any transition to zero-emission trucks, due to the mandates on manufacturers limiting diesel engine sales, we may be forced to continue using older model diesel trucks that may require higher maintenance costs or be less reliable. The transition to utilizing ZEVs could have a material adverse effect on our financial condition, results of operations, liquidity and cash flows.
Expectations relating to ESG considerations and related reporting obligations expose us to potential liabilities, increased costs, reputational harm, and other adverse effects on our business.
Many governments, regulators, investors, employees, customers and other stakeholders are increasingly focused on ESG considerations relating to businesses, including climate change and greenhouse gas emissions, human and civil rights, and diversity, equity and inclusion. In addition, we may make statements about our goals and initiatives through our various non-financial reports, information provided on our website, press statements and other communications. Responding to these ESG considerations and implementation of these goals and initiatives involves risks and uncertainties, requires investments, and depends in part on third-party performance or data that is outside our control.
15
Healthcare and other mandated benefits-related coverage may increase our costs for employee benefits and reduce our future profitability.
To attract and retain employees, we maintain a competitive and comprehensive benefits plan for our employees and their dependents. We cannot predict the impact that any state or federal healthcare or mandated benefit legislation or regulation will have on our operations, but we expect costs associated with providing benefits under employee medical plans, paid sick and family leave programs and healthcare-related costs associated with workers’ compensation to continue to increase. Rising employee benefits and healthcare costs in the U.S. could result in significant long-term costs to us, which could have a material adverse effect on our operating results. In addition, rising employee benefits and health-related costs could force us to make further changes to our benefits program, which could negatively impact our ability to attract and retain employees.
We are subject to the risks of legal proceedings and claims, governmental inquiries, notices and investigations which could adversely affect our business.
The nature of our business exposes us to the potential for various legal proceedings and claims related to labor and employment, personal injury, property damage, cargo claims, safety and contract compliance, environmental liability and other matters. Accordingly, we are, and in the future may be, subject to legal proceedings and claims that have arisen in the ordinary course of our business, and may include collective and/or class action allegations. We have been, and in the future may again be, subject to potential governmental inquiries, notices or investigations, which also exposes us to the potential for various claims and legal proceedings. The parties in such actions may seek amounts from us that may not be covered in whole or in part by insurance. Defending ourselves against such actions could result in significant costs and could require a substantial amount of time and effort by our management team. We cannot predict the outcome of legal proceedings and claims, governmental inquiries, notices or investigations to which we are a party or whether we will be subject to future legal actions. As a result, the potential costs associated with any such matters could adversely affect our business, financial condition or results of operations.
We are subject to legislative, regulatory, and trailers aslegal developments involving taxes.
Taxes are a significant part of our normal replacement cycle each year, we rely onexpenses. We are subject to U.S. federal and state income, payroll, property, sales and use, fuel, and other types of taxes. Changes to tax laws and regulations or changes to the used equipment market to disposeinterpretation thereof, or the ambiguity of our older equipment. Oversupply intax laws and regulations, the transportation industry as well as adverse domestic and foreign economic conditions can negatively impact the demand for used equipment and, therefore, reduce the value we can obtain on our used equipment. If we are unable to sell our older equipment atsubjectivity of factual interpretations, higher tax rates, claims, audits, investigations or above our salvage value, the resulting losseslegal proceedings involving taxing authorities, could have a significant impactmaterial adverse effect on our results of operations.
Risks Related to Owning our Common Stock
The Congdon family controls a large portion of our outstanding common stock.
David S. Congdon, John R. Congdon, Jr. and their affiliate family members beneficially own an aggregate of approximately 12% of the future, your ownership in us could be diluted.
There can be no assurance of our ability to declare and pay cash dividends in future periods.
We intend to pay a quarterly cash dividend to holders of our common stock for the foreseeable future; however, dividend payments are subject to approval by our Board of Directors (the "Board"), and are restricted by applicable state law limitations on distributions to shareholders as well as certain covenants under our revolving credit facility.facility and our note purchase and private shelf agreement. As a result, future dividend payments are not guaranteed and will depend upon various factors such as our overall financial condition, available liquidity, anticipated cash needs, future prospects for earnings and cash flows, as well as other factors considered relevant by our Board of Directors.Board. In addition, any reduction or suspension in our dividend payments could adversely affect the price of our common stock.
The amount and frequency of our stock repurchases may fluctuate.
The amount, timing and execution of our stock repurchase program may fluctuate based on our strategic approach and our priorities for the use of cash. Other factors that may impact share repurchases include changes in stock price, profitability, capital structure, or cash flows. Our revolving credit facility and our note purchase and private shelf agreement also include provisions that may limit our ability to make payments for share repurchases. We may also use cash for investing in strategic assets or dividend payments, instead of share repurchases.
16
The market value of our common stock has been and may fluctuatein the future be volatile, and could be substantially affected by various factors.
The price of our common stock on the Nasdaq Global Select Market changes constantly. We expect that the market price of our common stock will continue to fluctuate due to a variety of factors, many of which are beyond our control. These factors include, among others:
Our common stock price may continue to fluctuate significantly in the future, and these fluctuations may be unrelated to our performance. General market price declines or market volatility in the future could adversely affect the price of our common stock, and the current market price of our common stock may not be indicative of future market prices.
Our articles of incorporation, our bylaws and Virginia law contain provisions that could discourage, delay or prevent a change in our control or our management.
Provisions of our articles of incorporation, bylaws and the laws of Virginia, the state in which we are incorporated, may discourage, delay or prevent a change in control of us or a change in management that shareholders may consider favorable. These provisions:
17
ITEM 1B. UNRESOLVED STAFF COMMENTS
None.
ITEM 1C. CYBERSECURITY
The Board, through its Risk Committee, oversees the Company’s risk identification, risk tolerance, and management practices for enterprise risks facing the Company, including, but not limited to, risks associated with technology and operations, such as cybersecurity and cyber incident analysis and assessment. Our cybersecurity policies, standards, processes and practices are fully integrated into our enterprise risk management (“ERM”) program and are based on recognized frameworks established by the National Institute of Standards and Technology and other applicable industry best practices. In general, we seek to address cybersecurity risks through a comprehensive, cross-functional approach that is focused on protecting our systems to support our business operations, preserving the confidentiality, security and availability of the information that we collect and store by identifying, preventing and mitigating cybersecurity threats and effectively assessing and, if and as needed, responding to any cybersecurity threats and/or incidents.
Risk Management and Strategy
Key elements of our cybersecurity program include the following:
Our Internal Audit Department, as part of its audit plan that is approved by the Audit Committee of the Board, conducts information technology audits as well as periodically engages third parties to perform cybersecurity attack and penetration assessments. We also use third parties to periodically benchmark and assess our cybersecurity readiness and to assess how any known vulnerabilities might impact our Company as well as the sufficiency of our response. The results generated from these activities are reported to management and are used to develop action plans to address any identified opportunities for risk mitigation and overall improvement. The Risk Committee of our Board is apprised by management of the results of the third-party analysis, any related action plans, and progress against those plans. Management, together with members of our OD Technology Department, brief the Board directly, or through their communications with the Risk Committee, on information security matters on at least a quarterly basis. After gathering and assessing information about our risk exposure, the Risk Committee reports the results of its review to the Board on a regular basis.
Please refer to “Risks Related to Cybersecurity and Technology Matters” under Item 1A, “Risk Factors” above for a discussion of the risks from cybersecurity threats and the potential impact to our strategy, results of operations and financial condition.
18
Governance
The Board and the Risk Committee each receive regular presentations and reports on cybersecurity risks, which address a wide range of topics including recent developments, evolving standards, vulnerability assessments, third-party and independent reviews, the threat environment, technological trends and information security considerations. The Board and the Risk Committee also receive prompt and timely information regarding any cybersecurity incident that meets established reporting thresholds, as well as ongoing updates regarding any such incident.
Our Director of Information Security has served in various roles in information technology and information security for over 30 years, and is a Certified Information Systems Security Professional (CISSP). He and other members of the OD Technology Department work collaboratively across the Company and have implemented programs designed to protect our information systems from cybersecurity threats and position our Company to promptly respond, in coordination with various members of our senior management team, to any cybersecurity incidents in accordance with our incident response and recovery plans. To facilitate the success of our cybersecurity risk management program, multidisciplinary teams throughout the Company are deployed to address cybersecurity threats and to respond to any cybersecurity incidents. Through ongoing communications and collaboration with these teams, including members of our senior management team, as appropriate, our Director of Information Security monitors the prevention, detection, mitigation and remediation of any cybersecurity threats and incidents in real time, and reports any such threats and incidents to the Risk Committee when appropriate.
ITEM 2. PROPERTIES
We own our principal executive office located in Thomasville, North Carolina, consistingand 233 of a two-story office buildingthe 257 service centers we operated as of approximately 168,000 square feet on 31.8 acres of land. At
We believe that all of our properties are in good repair and are capable of providing the level of service required by current business levels and customer demands. In addition, we believe we have sufficient capacity in our service center network to accommodate increased demand for our services.
ITEM 3. LEGAL PROCEEDINGS
We are involved in or addressing various legal proceedings and claims, governmental inquiries, notices and investigations that have arisen in the ordinary course of our business and have not been fully adjudicated, some of which may be covered in whole or in part by insurance. Certain of these matters include collective and/or class-action allegations. We do not believe that the resolution of any of these matters including the matter described below, will have a material adverse effect upon our financial position, results of operations or cash flows.
Consistent with SEC Regulation S-K Item 103, we have elected to disclose those environmental legal proceedings with a governmental authority if management reasonably believes that the United States Environmental Protection Agency issued a Finding and Notice of Violation (“NOV”) to us, alleging violations of the Truck and Bus Regulation and the Drayage Truck Regulation as promulgated by the California Air Resources Board. The NOV alleges, among other things, that we failed to (i) timely install diesel particulate filters on certain diesel-fueled vehicles that we owned and operated in California; and (ii) verify the installation of diesel particulate filters on certain diesel-fueled vehicles that we caused to be operated in California. We expect that this matter will result inproceedings may involve potential monetary sanctions of $1.0 million or more. Applying this threshold, there are no such unresolved proceedings to us that exceed $100,000; however, we do not believe it is reasonably possible that this matter would result in a loss that would have a material effect on our financial position, resultsdisclose as of operations or cash flows.
ITEM 4. MINE SAFETY DISCLOSURES
Not applicable.
19
PART II
ITEM 5. MARKET FOR REGISTRANT’S COMMON EQUITY, RELATED STOCKHOLDER MATTERS AND ISSUER PURCHASES OF EQUITY SECURITIES
Common Stock and Dividend Information
Our common stock is traded on the Nasdaq Global Select Market ("Nasdaq"(“Nasdaq”) under the symbol ODFL. At February 22, 2018,16, 2024, there were 59,949423,775 holders of our common stock, including 83
The following table provides information regarding our repurchases of our common stock during fiscal year 2016. We paid a quarterly dividend of $0.10 per share on our common stock during eachthe fourth quarter of 2017. On February 8, 2018, we announced that our Board2023:
|
| ISSUER PURCHASES OF EQUITY SECURITIES |
| |||||||||||||
|
| Total Number of Shares Purchased (1) |
|
| Average Price Paid per Share |
|
| Total Number of Shares Purchased as Part of Publicly Announced Programs |
|
| Approximate Dollar Value of Shares that May Yet Be Purchased Under the Programs |
| ||||
October 1-31, 2023 |
|
| 58,925 |
|
| $ | 400.08 |
|
|
| 58,296 |
|
| $ | 287,637,586 |
|
November 1-30, 2023 |
|
| 55,005 |
|
| $ | 392.18 |
|
|
| 54,376 |
|
| $ | 266,302,847 |
|
December 1-31, 2023 |
|
| 105,434 |
|
| $ | 389.92 |
|
|
| 104,805 |
|
| $ | 225,437,013 |
|
Total |
|
| 219,364 |
|
|
|
|
|
| 217,477 |
|
|
|
| ||
| 2017 | ||||||||||||||||
First Quarter | Second Quarter | Third Quarter | Fourth Quarter | |||||||||||||
| High | $ | 94.97 | $ | 96.46 | $ | 110.45 | $ | 134.07 | ||||||||
| Low | $ | 82.93 | $ | 80.56 | $ | 93.29 | $ | 106.20 | ||||||||
| Dividend | $ | 0.10 | $ | 0.10 | $ | 0.10 | $ | 0.10 | ||||||||
| 2016 | ||||||||||||||||
First Quarter | Second Quarter | Third Quarter | Fourth Quarter | |||||||||||||
| High | $ | 70.52 | $ | 72.45 | $ | 71.75 | $ | 91.69 | ||||||||
| Low | $ | 48.92 | $ | 56.74 | $ | 59.55 | $ | 68.21 | ||||||||
| Dividend | $ | — | $ | — | $ | — | $ | — | ||||||||
On May 23, 2016,July 28, 2021, we announced that our Board of Directors had approved a two-year stock repurchase program authorizing us to repurchase up to an aggregate of $250.0 million$2.0 billion of our outstanding common stock (the “2016“2021 Repurchase Program”). Under the 2016The 2021 Repurchase Program, which does not have an expiration date, began after the completion of our prior repurchase program in January 2022.
On July 26, 2023, we announced that our Board of Directors had approved a new stock repurchase program authorizing us to repurchase up to an aggregate of $3.0 billion of our outstanding common stock. The new repurchase program, which does not have an expiration date, will be effective upon the completion of our 2021 Repurchase Program. At December 31, 2023, our 2021 Repurchase Program had $225.4 million remaining authorized.
Under our repurchase programs, we may repurchase shares from time to time in open market purchases or through privately negotiated transactions. Shares of our common stock repurchased under our repurchase programprograms are canceled at the time of repurchase and are classified as authorized but unissued shares of our common stock. We did not repurchase any shares of our common stock during the fourth quarter of 2017. As of December 31, 2017, $192.0 million of our outstanding common stock remained available for repurchase under the 2016 Repurchase Program.
20
Performance Graph
The following graph compares the total shareholder cumulative returns, assuming the reinvestment of all dividends, of $100 invested on December 31, 2012,2018, in (i) our common stock, (ii) the S&P 500 Total Return Index, and (iii) the Nasdaq IndustrialDow Jones Transportation Index,Average, for the five-year period ended December 31, 2017.
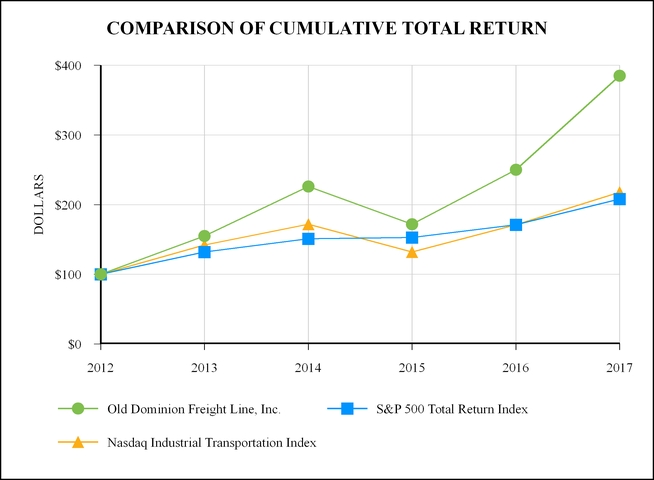

Cumulative Total Return
| 12/31/12 | 12/31/13 | 12/31/14 | 12/31/15 | 12/31/16 | 12/31/17 | |||||||||||||||||||
| Old Dominion Freight Line, Inc. | $ | 100 | $ | 155 | $ | 226 | $ | 172 | $ | 250 | $ | 385 | ||||||||||||
| S&P 500 Total Return Index | $ | 100 | $ | 132 | $ | 151 | $ | 153 | $ | 171 | $ | 208 | ||||||||||||
| Nasdaq Industrial Transportation Index | $ | 100 | $ | 142 | $ | 172 | $ | 132 | $ | 171 | $ | 218 | ||||||||||||
|
| 12/31/18 |
| 12/31/19 |
| 12/31/20 |
| 12/31/21 |
| 12/31/22 |
| 12/31/23 |
| ||||||
Old Dominion Freight Line, Inc. |
| $ | 100 |
| $ | 154 |
| $ | 239 |
| $ | 440 |
| $ | 350 |
| $ | 502 |
|
S&P 500 Total Return Index |
| $ | 100 |
| $ | 131 |
| $ | 156 |
| $ | 200 |
| $ | 164 |
| $ | 207 |
|
Dow Jones Transportation Average |
| $ | 100 |
| $ | 121 |
| $ | 141 |
| $ | 188 |
| $ | 155 |
| $ | 186 |
|
ITEM 6. SELECTED FINANCIAL DATA
| Year Ended December 31, | ||||||||||||||||||||
| (In thousands, except per share amounts) | 2017 | 2016 | 2015 | 2014 | 2013 | |||||||||||||||
| Operating Data: | ||||||||||||||||||||
| Revenue from operations | $ | 3,358,112 | $ | 2,991,517 | $ | 2,972,442 | $ | 2,787,897 | $ | 2,337,648 | ||||||||||
| Depreciation and amortization expense | 205,763 | 189,867 | 165,343 | 146,466 | 127,072 | |||||||||||||||
| Total operating expenses | 2,782,226 | 2,507,682 | 2,474,202 | 2,346,590 | 1,999,210 | |||||||||||||||
| Operating income | 575,886 | 483,835 | 498,240 | 441,307 | 338,438 | |||||||||||||||
Interest expense, net (1) | 1,414 | 4,274 | 5,001 | 6,502 | 9,473 | |||||||||||||||
| Provision for income taxes | 112,058 | 181,822 | 185,327 | 165,000 | 122,573 | |||||||||||||||
Net income (2) | 463,774 | 295,765 | 304,690 | 267,514 | 206,113 | |||||||||||||||
| Per Share Data: | ||||||||||||||||||||
| Basic earnings per share | $ | 5.63 | $ | 3.56 | $ | 3.57 | $ | 3.10 | $ | 2.39 | ||||||||||
| Diluted earnings per share | $ | 5.63 | $ | 3.56 | $ | 3.57 | $ | 3.10 | $ | 2.39 | ||||||||||
| Cash dividends per share | $ | 0.40 | $ | — | $ | — | $ | — | $ | — | ||||||||||
| Balance Sheet Data: | ||||||||||||||||||||
| Cash and cash equivalents | $ | 127,462 | $ | 10,171 | $ | 11,472 | $ | 34,787 | $ | 30,174 | ||||||||||
| Current assets | 584,653 | 382,622 | 381,730 | 403,772 | 309,730 | |||||||||||||||
| Total assets | 3,068,424 | 2,696,247 | 2,466,504 | 2,206,866 | 1,908,840 | |||||||||||||||
| Current liabilities | 351,049 | 288,636 | 285,402 | 255,638 | 232,122 | |||||||||||||||
Long-term debt (including current maturities) | 95,000 | 104,975 | 133,805 | 155,714 | 191,429 | |||||||||||||||
| Shareholders’ equity | 2,276,854 | 1,851,158 | 1,684,637 | 1,494,064 | 1,232,082 | |||||||||||||||
21
ITEM 7. MANAGEMENT’S DISCUSSION AND ANALYSIS OF FINANCIAL CONDITION AND RESULTS OF OPERATIONS
This Management’s Discussion and Analysis of Financial Condition and Results of Operations generally discusses our 2023 and 2022 results and year-to-year comparisons between 2023 and 2022. Discussions of our 2021 results and year-to-year comparisons between 2022 and 2021 that are not included in this Annual Report on Form 10-K can be found in “Management’s Discussion and Analysis of Financial Condition and Results of Operations” in Part II, Item 7 of our Annual Report on Form 10-K for the fiscal year ended December 31, 2022, which was filed with the Securities and Exchange Commission on February 22, 2023.
Overview
We are a leading,one of the largest North American less-than-truckload (“LTL”), union-free motor carrier providingcarriers. We provide regional, inter-regional and national LTL services which include ground and air expedited transportation and consumer household pickup and delivery, through a single integrated, union-free organization. Our service offerings, which include expedited transportation, are provided through an expansive network of service centers located throughout the continental United States. Through strategic alliances, we also provide LTL services throughout North America. In addition to our core LTL services, we offer a range of value-added services including container drayage, truckload brokerage and supply chain consulting and warehousing.consulting. More than 97%98% of our revenue has historically been derived from transporting LTL shipments for our customers, whose demand for our services is generally tied to industrial production and the overall health of the U.S. domestic economy.
In analyzing the components of our revenue, we monitor changes and trends in our LTL services usingvolumes and LTL revenue per hundredweight. While LTL revenue per hundredweight is a yield measurement, it is also a commonly-used indicator for general pricing trends in the followingLTL industry. This yield metric is not a true measure of price, however, as it can be influenced by many other factors, such as changes in fuel surcharges, weight per shipment and length of haul. As a result, changes in revenue per hundredweight do not necessarily indicate actual changes in underlying base rates. LTL revenue per hundredweight and the key metrics, which exclude certain transportation and logistics services where pricing is generally not determined by weight, commodity or distance:
22
Our primary revenue focus is to increase density, which is shipment and tonnage growth within our existing infrastructure. Increases in density allow us to maximize our asset utilization and labor productivity, which we measure over many different functional areas of our operations including linehaul load factor, pickup and delivery (“P&D”)&D stops per hour, P&D shipments per hour, platform pounds handled per hour and platform shipments per hour. In addition to our focus on density and operating efficiencies, it is critical for us to obtain an appropriate yield, which is measured as revenue per hundredweight, on the shipments we handle.handle to offset our cost inflation and support our ongoing investments in capacity and technology. We are committedregularly monitor the components of our pricing, including base freight rates, accessorial charges and fuel surcharges. The fuel surcharge is generally designed to a disciplinedoffset fluctuations in the cost of our petroleum-based products and is indexed to diesel fuel prices published by the U.S. Department of Energy, which reset each week. We believe our yield management process thatappropriately focuses on individual account profitability. We believe yield managementprofitability, and ongoing improvements in efficiency areoperating efficiencies, as key components inof our ability to produce profitable growth.
Our primary cost elements are direct wages and benefits associated with the movement of freight, operating supplies and expenses, which include diesel fuel, and depreciation of our equipment fleet and service center facilities. We gauge our overall
We continuallyregularly upgrade our technological capabilities to improve our customer service and lower our operating costs. Our technology provides our customers with visibility of their shipments throughout our network, increases the productivity of our workforce, and provides key metrics that we use to monitor and enhance our processes.
Results of Operations
The following table sets forth, for the years indicated, expenses and other items as a percentage of revenue from operations:
|
| 2023 |
|
| 2022 |
| ||
Revenue from operations |
|
| 100.0 | % |
|
| 100.0 | % |
Operating expenses: |
|
|
|
|
|
| ||
Salaries, wages and benefits |
|
| 44.8 |
|
|
| 43.4 |
|
Operating supplies and expenses |
|
| 12.2 |
|
|
| 13.6 |
|
General supplies and expenses |
|
| 2.8 |
|
|
| 2.6 |
|
Operating taxes and licenses |
|
| 2.5 |
|
|
| 2.3 |
|
Insurance and claims |
|
| 1.3 |
|
|
| 0.9 |
|
Communication and utilities |
|
| 0.7 |
|
|
| 0.6 |
|
Depreciation and amortization |
|
| 5.5 |
|
|
| 4.5 |
|
Purchased transportation |
|
| 2.1 |
|
|
| 2.5 |
|
Miscellaneous expenses, net |
|
| 0.1 |
|
|
| 0.2 |
|
Total operating expenses |
|
| 72.0 |
|
|
| 70.6 |
|
Operating income |
|
| 28.0 |
|
|
| 29.4 |
|
Interest (income) expense, net |
|
| (0.2 | ) |
|
| (0.1 | ) |
Other expense, net |
|
| 0.1 |
|
|
| 0.1 |
|
Income before income taxes |
|
| 28.1 |
|
|
| 29.4 |
|
Provision for income taxes |
|
| 7.0 |
|
|
| 7.4 |
|
Net income |
|
| 21.1 | % |
|
| 22.0 | % |
| 2017 | 2016 | 2015 | |||||||
| Revenue from operations | 100.0 | % | 100.0 | % | 100.0 | % | |||
| Operating expenses: | |||||||||
| Salaries, wages and benefits | 53.7 | 55.2 | 52.8 | ||||||
| Operating supplies and expenses | 11.4 | 10.8 | 11.9 | ||||||
| General supplies and expenses | 3.2 | 2.9 | 3.0 | ||||||
| Operating taxes and licenses | 3.0 | 3.1 | 3.1 | ||||||
| Insurance and claims | 1.2 | 1.3 | 1.3 | ||||||
| Communication and utilities | 0.8 | 0.9 | 0.9 | ||||||
| Depreciation and amortization | 6.2 | 6.3 | 5.6 | ||||||
| Purchased transportation | 2.5 | 2.5 | 3.9 | ||||||
| Building and office equipment rents | 0.2 | 0.3 | 0.3 | ||||||
| Miscellaneous expenses, net | 0.7 | 0.5 | 0.4 | ||||||
| Total operating expenses | 82.9 | 83.8 | 83.2 | ||||||
| Operating income | 17.1 | 16.2 | 16.8 | ||||||
Interest expense, net (1) | 0.1 | 0.1 | 0.2 | ||||||
| Other (income) expense, net | (0.1 | ) | 0.1 | 0.1 | |||||
| Income before income taxes | 17.1 | 16.0 | 16.5 | ||||||
| Provision for income taxes | 3.3 | 6.1 | 6.2 | ||||||
| Net income | 13.8 | % | 9.9 | % | 10.3 | % | |||
23
Key financial and operating metrics for 20172023 and 20162022 are presented below:
| 2017 | 2016 | Change | % Change | ||||||||||||
| Work days | 253 | 254 | (1 | ) | (0.4 | ) | |||||||||
Revenue (in thousands) | $ | 3,358,112 | $ | 2,991,517 | $ | 366,595 | 12.3 | ||||||||
| Operating ratio | 82.9 | % | 83.8 | % | |||||||||||
Net income (in thousands) | $ | 463,774 | $ | 295,765 | $ | 168,009 | 56.8 | ||||||||
| Diluted earnings per share | $ | 5.63 | $ | 3.56 | $ | 2.07 | 58.1 | ||||||||
LTL tons (in thousands) | 8,519 | 7,931 | 588 | 7.4 | |||||||||||
LTL shipments (in thousands) | 10,736 | 10,148 | 588 | 5.8 | |||||||||||
LTL weight per shipment (lbs.) | 1,587 | 1,563 | 24 | 1.5 | |||||||||||
| LTL revenue per hundredweight | $ | 19.39 | $ | 18.51 | $ | 0.88 | 4.8 | ||||||||
| LTL revenue per shipment | $ | 307.66 | $ | 289.36 | $ | 18.30 | 6.3 | ||||||||
| LTL revenue per intercity mile | $ | 5.46 | $ | 5.09 | $ | 0.37 | 7.3 | ||||||||
LTL intercity miles (in thousands) | 605,204 | 576,953 | 28,251 | 4.9 | |||||||||||
Average length of haul (miles) | 917 | 928 | (11 | ) | (1.2 | ) | |||||||||
|
| 2023 |
|
| 2022 |
|
| Change |
|
| % Change |
| ||||
Work days |
|
| 252 |
|
|
| 253 |
|
|
| (1 | ) |
|
| (0.4 | ) |
Revenue (in thousands) |
| $ | 5,866,152 |
|
| $ | 6,260,077 |
|
| $ | (393,925 | ) |
|
| (6.3 | ) |
Operating ratio |
|
| 72.0 | % |
|
| 70.6 | % |
|
|
|
|
|
| ||
Net income (in thousands) |
| $ | 1,239,502 |
|
| $ | 1,377,159 |
|
| $ | (137,657 | ) |
|
| (10.0 | ) |
Diluted earnings per share |
| $ | 11.26 |
|
| $ | 12.18 |
|
| $ | (0.92 | ) |
|
| (7.6 | ) |
LTL tons (in thousands) |
|
| 9,260 |
|
|
| 10,211 |
|
|
| (951 | ) |
|
| (9.3 | ) |
LTL tonnage per day |
|
| 36,745 |
|
|
| 40,359 |
|
|
| (3,614 | ) |
|
| (9.0 | ) |
LTL shipments (in thousands) |
|
| 12,176 |
|
|
| 12,989 |
|
|
| (813 | ) |
|
| (6.3 | ) |
LTL shipments per day |
|
| 48,317 |
|
|
| 51,341 |
|
|
| (3,024 | ) |
|
| (5.9 | ) |
LTL weight per shipment (lbs.) |
|
| 1,521 |
|
|
| 1,572 |
|
|
| (51 | ) |
|
| (3.2 | ) |
LTL revenue per hundredweight |
| $ | 31.31 |
|
| $ | 30.24 |
|
| $ | 1.07 |
|
|
| 3.5 |
|
LTL revenue per shipment |
| $ | 476.25 |
|
| $ | 475.45 |
|
| $ | 0.80 |
|
|
| 0.2 |
|
LTL revenue per intercity mile |
| $ | 8.38 |
|
| $ | 8.28 |
|
| $ | 0.10 |
|
|
| 1.2 |
|
LTL intercity miles (in thousands) |
|
| 691,632 |
|
|
| 746,028 |
|
|
| (54,396 | ) |
|
| (7.3 | ) |
Average length of haul (miles) |
|
| 925 |
|
|
| 934 |
|
|
| (9 | ) |
|
| (1.0 | ) |
Our financial results for 2023 reflect continued softness in the domestic economy that contributed to 2016 due to a $364.0 million increase in LTL revenue and a $2.6 million increase in non-LTL revenue. LTL revenue was higher in 2017 due to increases in both LTL tons and yield. The 7.4% increase in LTL tons during 2017 resulted from a 5.8% increase in LTL shipments and a 1.5% increase in LTL weight per shipment as compared to 2016. We believe our tonnage growth in 2017 was driven by a stronger economic environment and market share gains resulting from increased demand for the consistent levels of premium service that we provide to our customers.
Revenue
Revenue decreased $393.9 million, or 6.3%, in 2023 compared to 2022. This decrease resulted from a 9.0% decrease in LTL tonnage per day, which was primarily due to decreases in LTL shipments per day and LTL weight per shipment. This decrease in revenue was partially offset by a 3.5% increase in our LTL revenue per hundredweight reflects our continued focus on yield management which benefited from a favorable pricing environment.hundredweight. Our LTL revenue and yield were also positively impacted by an increase inper hundredweight includes the impact of lower fuel surcharges resulting from a decline in 2017 as compared to 2016.the average price of diesel fuel for the comparable periods. Excluding fuel surcharges, LTL revenue per hundredweight increased 2.9%8.3% in 20172023 as compared to 2016.
January 2024 Update
Revenue per day decreased 2.7% in January 2024 compared to the DOE's published diesel fuel prices that reset each week. Our fuel surcharges are designedsame month last year. LTL tons per day decreased 5.0%, due primarily to offset fluctuationsa 2.3% decrease in LTL shipments per day and a 2.8% decrease in LTL weight per shipment. LTL revenue per hundredweight increased 2.7% as compared to the cost of petroleum-based products and are one of the many components included in the overall negotiated price we charge for our services. As a percent ofsame month last year. LTL revenue per hundredweight, excluding fuel surcharges, increased to 11.1% in 2017 from 9.5% in 2016. This increase was due primarily to an increase in the average price per gallon for diesel fuel during 20176.7% as compared to 2016. We regularly monitor the components of our pricing, including base freight rates and fuel surcharges. We also address any individual account profitability issues with our customers as part of our effort to minimize the negative impact on our profitability that would likely result from a rapid and significant change in any of our operating expenses.
Operating Costs and Other Expenses
Salaries, wages, and benefits increased $150.4decreased $87.2 million, or 9.1%3.2%, in 20172023 as compared to 2022, due to a $122.3an $83.1 million increase in salaries and wages and a $28.1 million increase in benefit costs. The increasedecrease in the costs attributable to salaries and wages and a $4.1 million decrease in employee benefit costs. The decrease in salaries and wages was due primarily to the 3.0% increasedecreases in the average number of active full-time employees in 2017,during the year, as we balanced our workforce to align with our customers' shipping trends. Salaries and wages also decreased as a result of lower performance-based and discretionary bonus compensation. These decreases were partially offset by the annual wage increasesincrease provided to our employees inat the beginning of both September 20162022 and 2017 and higher performance-based compensation linked to our operating results. In addition, we paid a special bonus to all non-executive employees in December 2017 following passage of the Tax Act that totaled $9.8 million. Although our costs increased, our aggregate2023.
Our productive labor costs, which include wages for drivers, platform employees, and fleet technicians, increased as a percent of revenue to 23.6% in 2023 from to 22.9% in 2022. While our platform and P&D shipments per hour and P&D stops per hour improved during 2023 as compared to 2022, our linehaul laden load average declined due to the decreased to 28.3% for 2017 from 28.9% for 2016 andoperating density associated with the decrease in our LTL tons. Our other indirect salaries and wages as a percent of revenue decreased to 12.0% for 2017 from 12.2% for 2016.
24
The cost attributable to employee benefits decreased $4.1 million, or 6.7%0.6%, due primarilyin 2023 compared to an increase in our average number of full-time employees and higher wage rates, which led to higher payroll-related taxes and paid-time-off benefits.2022. Our employee benefit costs also increased for certain retirement benefit plans directly linked to the improvement in our net income and the share price of our common stock. Our group health costs and workers' compensation expenses decreased as a percent of salaries and wages which contributed to the overall improvement37.5% in total2023 from 36.2% in 2022. The increase in employee benefit costs as a percent of salaries and wages was primarily due to 33.2% for 2017an increase in our employee group health benefit costs that resulted from 34.2% for 2016.
Operating supplies and expenses increased $58.8decreased $134.6 million, or 18.2%15.8%, in 20172023 as compared to 20162022, due primarily to increaseddecreases in our costs offor diesel fuel.fuel used in our vehicles. The cost of diesel fuel, excluding fuel taxes, represents the largest component of operating supplies and expenses, and can vary based on both the average price per gallon and consumption. The increase in our diesel fuel costs, excluding fuel taxes, was due primarily to a 23.5% increase in ourOur average cost per gallon of diesel fuel during 2017.decreased 19.8% in 2023 as compared to 2022. In addition, our gallons consumed increased 4.3%decreased 8.5% in 20172023 as compared to 20162022 due primarily to a 4.5% increasedecrease in linehaul and P&Dour miles driven. We do not use diesel fuel hedging instruments, andinstruments; therefore, our costs are therefore subject to market price fluctuations.
Depreciation and amortization increased $15.9$48.4 million, or 8.4%17.5%, in 2023 as compared to 2022. The increases in depreciation and amortization costs were due primarily to the assets acquired as part of our 20162022 and 20172023 capital expenditure programs. These costs, however, were relatively consistent as a percent of revenue between the periods compared. We believe depreciation costs will continue to increase in future periods based on our 20182024 capital expenditure plan. While our investments in real estate, equipment, and technology can increase our short-term costs, in the short-term, we believe these investments are necessary to support our continued long-term growth and strategic initiatives.
Purchased transportation expense decreased $36.6 million, or 23.1%, in 2023 as compared to 2022. We primarily utilize purchased transportation services to support our LTL services to and from Canada as well as our truckload brokerage operations. We also periodically utilize purchased transportation for our domestic LTL service when we need to supplement the capacity of our workforce or fleet, which most frequently occurs during periods with significant growth. We used third-party transportation providers in our domestic linehaul network during the first half of 2022, but our utilization was normalized during the second half of 2022 when the capacity of our team was closely balanced with our volumes.
Our effective tax rate in 20172023 was 19.5%24.8% as compared to 38.1%25.2% in 2016. Our provision for income taxes in 2017 includes a $104.9 million income tax benefit resulting from the revaluation of our deferred tax liabilities in connection with the passage of the Tax Act in December 2017. In addition, our effective tax rates for 2017 and 2016 were favorably impacted by various tax credits.2022. Our effective tax rate generally exceeds the federal statutory rate due to the impact of state taxes and, to a lesser extent, certain other non-deductible items. We expect our effective tax rate to decrease for 2018 to approximately 26% - 27% as a result of the Tax Act. Our estimated tax rate could be impacted by future tax adjustments that may be necessary to comply with clarifying interpretations and guidance related to the Tax Act.
| 2016 | 2015 | Change | % Change | ||||||||||||
| Work days | 254 | 254 | — | — | |||||||||||
Revenue (in thousands) | $ | 2,991,517 | $ | 2,972,442 | $ | 19,075 | 0.6 | ||||||||
| Operating ratio | 83.8 | % | 83.2 | % | |||||||||||
Net income (in thousands) | $ | 295,765 | $ | 304,690 | $ | (8,925 | ) | (2.9 | ) | ||||||
| Diluted earnings per share | $ | 3.56 | $ | 3.57 | $ | (0.01 | ) | (0.3 | ) | ||||||
LTL tons (in thousands) | 7,931 | 7,938 | (7 | ) | (0.1 | ) | |||||||||
LTL shipments (in thousands) | 10,148 | 10,129 | 19 | 0.2 | |||||||||||
LTL weight per shipment (lbs.) | 1,563 | 1,567 | (4 | ) | (0.3 | ) | |||||||||
| LTL revenue per hundredweight | $ | 18.51 | $ | 18.23 | $ | 0.28 | 1.5 | ||||||||
| LTL revenue per shipment | $ | 289.36 | $ | 285.67 | $ | 3.69 | 1.3 | ||||||||
| LTL revenue per intercity mile | $ | 5.09 | $ | 5.11 | $ | (0.02 | ) | (0.4 | ) | ||||||
LTL intercity miles (in thousands) | 576,953 | 566,210 | 10,743 | 1.9 | |||||||||||
Average length of haul (miles) | 928 | 928 | — | — | |||||||||||
Liquidity and Capital Resources
A summary of our cash flows is presented below:
| (In thousands) | 2017 | 2016 | 2015 | |||||||||
| Cash and cash equivalents at beginning of year | $ | 10,171 | $ | 11,472 | $ | 34,787 | ||||||
| Cash flows provided by (used in): | ||||||||||||
| Operating activities | 536,294 | 565,583 | 553,880 | |||||||||
| Investing activities | (367,746 | ) | (407,400 | ) | (437,617 | ) | ||||||
| Financing activities | (51,257 | ) | (159,484 | ) | (139,578 | ) | ||||||
| Increase (decrease) in cash and cash equivalents | 117,291 | (1,301 | ) | (23,315 | ) | |||||||
| Cash and cash equivalents at end of year | $ | 127,462 | $ | 10,171 | $ | 11,472 | ||||||
(In thousands) |
| 2023 |
|
| 2022 |
| ||
Cash and cash equivalents at beginning of year |
| $ | 186,312 |
|
| $ | 462,564 |
|
Cash flows provided by (used in): |
|
|
|
|
|
| ||
Operating activities |
|
| 1,569,135 |
|
|
| 1,691,582 |
|
Investing activities |
|
| (659,820 | ) |
|
| (547,472 | ) |
Financing activities |
|
| (661,828 | ) |
|
| (1,420,362 | ) |
Increase (decrease) in cash and cash equivalents |
|
| 247,487 |
|
|
| (276,252 | ) |
Cash and cash equivalents at end of year |
| $ | 433,799 |
|
| $ | 186,312 |
|
The change in our cash flows provided by operating activities during 2017 was impacted by an increase in income before income taxes of $98.2 million and an increase in depreciation and amortization of $15.9 million. These increases were more than offset by an increase in income taxes paid of $76.0 million and other fluctuations in certain working capital accounts.
The changeschange in our cash flows used in investing activities for all periods wereduring 2023 as compared to 2022 was primarily due to the timing of equipment purchases under ourand maturities of short-term investments, which was partially offset by a net reduction in capital expenditure plans.expenditures. Changes in our capital expenditures are more fully described below in “Capital Expenditures.”
The changeschange in our cash flows used in financing activities during 2023 as compared to 2022 was primarily due to the $823.6 million decrease in funds used for all periods were due primarilyrepurchases of our common stock. This decrease in cash was partially offset by higher dividend payments to fluctuations in capital returned toour shareholders and fluctuations ina scheduled principal payment under our long-term debt which includes our senior unsecured revolving line of credit. Our financing arrangements are more fully described below under "Financing Agreements."agreement. Our return of capital to shareholders is more fully described below under "Stock“Stock Repurchase Program"Program” and "Dividends“Dividends to Shareholders,Shareholders.” Our long-term debt agreement is more fully described below under "Financing Arrangements." respectively.
25
We have threefour primary sources of available liquidity: cash and cash equivalents, cash flows from operations, our existing cash and cash equivalents, available borrowings under our senior unsecured revolvingthird amended and restated credit agreement which iswith Wells Fargo Bank, National Association serving as administrative agent for the lenders, dated March 22, 2023 (the “Credit Agreement”), and our Note Purchase and Private Shelf Agreement with PGIM, Inc. (“Prudential”) and certain affiliates and managed accounts of Prudential, as amended by the First Amendment dated March 22, 2023 (as amended, the “Note Agreement”). The Credit Agreement and the Note Agreement are described below.in more detail below under “Financing Arrangements.” We believe we also have sufficient access to debt and equity markets to provide other sources of liquidity, if needed.
Capital Expenditures
The table below sets forth our net capital expenditures for property and equipment, including those obtained through capital leases,noncash transactions, for the years ended December 31, 2017, 20162023 and 2015:
| Year Ended December 31, | ||||||||||||
| (In thousands) | 2017 | 2016 | 2015 | |||||||||
| Land and structures | $ | 179,150 | $ | 161,646 | $ | 153,460 | ||||||
| Tractors | 123,152 | 114,166 | 128,911 | |||||||||
| Trailers | 37,424 | 94,040 | 114,209 | |||||||||
| Technology | 19,329 | 18,428 | 32,044 | |||||||||
| Other equipment and assets | 23,070 | 29,661 | 36,987 | |||||||||
| Less: Proceeds from sales | (12,240 | ) | (10,541 | ) | (24,442 | ) | ||||||
| Total | $ | 369,885 | $ | 407,400 | $ | 441,169 | ||||||
|
| Year Ended December 31, |
| |||||
(In thousands) |
| 2023 |
|
| 2022 |
| ||
Land and structures |
| $ | 291,070 |
|
| $ | 299,529 |
|
Tractors |
|
| 203,417 |
|
|
| 148,719 |
|
Trailers |
|
| 181,534 |
|
|
| 216,697 |
|
Technology |
|
| 44,358 |
|
|
| 33,783 |
|
Other equipment and assets |
|
| 36,930 |
|
|
| 68,920 |
|
Less: Proceeds from sales |
|
| (48,637 | ) |
|
| (22,096 | ) |
Total |
| $ | 708,672 |
|
| $ | 745,552 |
|
Our capital expenditures variedvary based upon the projected increase in the number and size of our service center facilities necessary to support our plan for long-term growth, our planned tractor and trailer replacement cycle, and forecasted tonnage and shipment growth. Expenditures for land and structures can be dependent upon the availability of land in the geographic areas where we are looking to expand. We historically spend 10% to 15% of our revenue on capital expenditures each year. We expect to continue to maintain a high level of capital expenditures in order to support our long-term plan for market share growth.
We currently estimate capital expenditures will be approximately $510$750 million for the year ending December 31, 2018.2024. Approximately $200$350 million is allocated for the purchase of service center facilities, construction of new service center facilities or expansion of existing service center facilities, subject to the availability of suitable real estate and the timing of construction projects; approximately $265$325 million is allocated for the purchase of tractors and trailers; and approximately $45$75 million is allocated for investments in technology and other assets. We expect to fund these capital expenditures primarily through cash flows from operations, our existing cash and cash equivalents and, if needed, borrowings available under the use of our senior unsecured revolving credit facility.Credit Agreement or Note Agreement. We believe our current sources of liquidity will be sufficient to satisfy our expected capital expenditures.
Stock Repurchase Program
On May 23, 2016,July 28, 2021, we announced that our Board of Directors had approved a new two-year stock repurchase program authorizing us to repurchase up to an aggregate of $250.0 million$2.0 billion of our outstanding common stock (the “2016“2021 Repurchase Program”). Under the 2016The 2021 Repurchase Program, which does not have an expiration date, began after completion of our prior repurchase program in January 2022.
On July 26, 2023, we announced that our Board of Directors had approved a new stock repurchase program authorizing us to repurchase up to an aggregate of $3.0 billion of our outstanding common stock. The new repurchase program, which does not have an expiration date, will be effective upon the completion of our 2021 Repurchase Program. At December 31, 2023, our 2021 Repurchase Program had $225.4 million remaining authorized.
Under our repurchase programs, we may repurchase shares from time to time in open market purchases or through privately negotiated transactions. Shares of our common stock repurchased under our repurchase programprograms are canceled at the time of repurchase and are classified as authorized but unissued shares of our common stock.
Dividends to Shareholders
Our Board of Directors declared a quarterly cash dividend of $0.10$0.40 per share infor each quarter of fiscal year 2017. We did not declare or pay any dividends on our common stock during fiscal years 2016 or 2015.2023 and declared a cash dividend of $0.30 per share for each quarter of 2022.
26
On February 8, 2018,January 31, 2024, we announced that our Board of Directors had declared a cash dividend of $0.13$0.52 per share of our common stock. The dividend is payable on March 20, 20182024 to shareholders of record at the close of business on March 6, 2018.2024. Although we intend to pay a quarterly cash dividend on our common stock for the foreseeable future, the declaration and amount of any future dividend is subject to approval by our Board of Directors, and is restricted by applicable state law limitations on distributions to shareholders as well as certain covenants under our revolving credit facility.Credit Agreement and Note Agreement. We anticipate that any future quarterly cash dividends will be funded through cash flows from operations, our existing cash and cash equivalents, and, if needed, borrowings under our revolving credit facility.
On February 16, 2024, we announced that our Board of Directors approved a two-for-one split of our common stock for shareholders of record as of the close of business on the record date of March 13, 2024. The additional shares will be distributed by our transfer agent, Computershare Trust Company, N.A., on March 27, 2024.
Financing Agreements
Note Agreement
The Note Agreement, which is uncommitted and subject to Prudential’s sole discretion, provides for the issuance of senior note agreementpromissory notes with an aggregate principal amount of up to $350.0 million through March 22, 2026. On May 4, 2020, we issued $100.0 million aggregate principal amount of senior promissory notes (the “Series B Notes”). Borrowing availability under the Note Agreement is reduced by the outstanding amount of $95.0 millionthe existing Series B Notes, and all other senior promissory notes issued pursuant to the Note Agreement.
The Series B Notes bear interest at each of December 31, 20173.10% per annum and 2016.mature on May 4, 2027, unless prepaid. Our unsecured senior note agreement calls for two scheduled principal payments of $50.0 million and $45.0 million on January 3, 2018 and January 3, 2021, respectively. Interest rates on the January 3, 2018 and January 3, 2021 scheduled principal payments were 4.00% and 4.79%, respectively. The effective average interest rate on our outstanding senior note agreement was 4.37% at each of December 31, 2017 and 2016. The Company made the required $50.0 millionfirst principal payment of $20.0 million was paid on January 3, 2018.
Credit Agreement
The Credit Agreement originally providedprovides for a five-year, $250.0 million senior unsecured revolving line of credit and a $100.0$150.0 million accordion feature, which if fully exercised and approved, would expand the total borrowing capacity up to an aggregate of $350.0 million.
At our option, borrowings under the Credit Agreement bear interest at either: (i) LIBORthe Secured Overnight Financing Rate (SOFR) plus the Term SOFR Adjustment, as defined in the Credit Agreement, equal to 0.100%, plus an applicable margin (based on our ratio of net debt-to-total capitalization) that ranges from 1.0%1.000% to 1.50%1.375%; or (ii) a Base Rate, as defined in the Credit Agreement, plus an applicable margin
For periods covered under the Credit Agreement, the applicable margin on SOFR loans and letter of credit fees were 1.000% and commitment fees were 0.090%.
The Credit Agreement replaced our previous five-year, $250.0 million senior unsecured revolving credit agreement dated as of November 21, 2019 (the “Prior Credit Agreement”). For periods in 2023 and 2022 covered under the Prior Credit Agreement, the applicable margin on LIBOR loans and letter of credit fees were 1.0%was 1.000% and commitment fees were 0.125%0.100%.
The amounts outstanding and remainingavailable borrowing capacity under our revolving credit facilitiesthe Credit Agreement are presented below:
|
| December 31, |
| |||||
(In thousands) |
| 2023 |
|
| 2022 |
| ||
Facility limit |
| $ | 250,000 |
|
| $ | 250,000 |
|
Line of credit borrowings |
|
| — |
|
|
| — |
|
Outstanding letters of credit |
|
| (39,966 | ) |
|
| (38,653 | ) |
Available borrowing capacity |
| $ | 210,034 |
|
| $ | 211,347 |
|
27
| December 31, | ||||||||
| (In thousands) | 2017 | 2016 | ||||||
| Facility limit | $ | 300,000 | $ | 300,000 | ||||
| Line of credit borrowings | — | (9,975 | ) | |||||
| Outstanding letters of credit | (71,368 | ) | (74,611 | ) | ||||
| Available borrowing capacity | $ | 228,632 | $ | 215,414 | ||||
General Debt Provisions
The Credit Agreement interest rates are fixed on all of our debt instruments. Therefore, short-term exposure to fluctuations in interest rates related to our debt instruments is limited to our line of credit facility. We do not currently use interest rate derivative instruments to manage exposure to interest rate changes.
We do not anticipate a significant decline in business levels or financial performance that would cause us to violate any such covenants in the future, and we believe the combination of our existing Credit Agreement and Note Agreement along with our additional borrowing capacity will be sufficient to meet foreseeable seasonal and long-term capital needs.
The interest rate is fixed on the Series B Notes. Therefore, short-term exposure to fluctuations in interest rates is limited to our Credit Agreement. We do not currently use interest rate derivative instruments to manage exposure to interest rate changes.
Contractual Obligations
The following table summarizes our significant contractual obligations as of December 31, 2017:
|
| Payments due by period |
| |||||||||||||||||
Contractual Obligations (1) |
|
|
|
| Less than |
|
|
|
|
|
|
|
| More than |
| |||||
(In thousands) |
| Total |
|
| 1 year |
|
| 1-3 years |
|
| 3-5 years |
|
| 5 years |
| |||||
Series B Notes |
| $ | 84,564 |
|
| $ | 22,072 |
|
| $ | 42,281 |
|
| $ | 20,211 |
|
| $ | — |
|
Operating lease obligations (2) |
|
| 151,273 |
|
|
| 21,598 |
|
|
| 37,261 |
|
|
| 34,670 |
|
|
| 57,744 |
|
Purchase obligations and Other |
|
| 38,056 |
|
|
| 25,266 |
|
|
| 12,790 |
|
|
| — |
|
|
| — |
|
Total |
| $ | 273,893 |
|
| $ | 68,936 |
|
| $ | 92,332 |
|
| $ | 54,881 |
|
| $ | 57,744 |
|
| Payments due by period | ||||||||||||||||||||
Contractual Obligations (1) | Less than | More than | ||||||||||||||||||
| (In thousands) | Total | 1 year | 1-3 years | 3-5 years | 5 years | |||||||||||||||
| Senior Notes | $ | 101,501 | $ | 52,172 | $ | 4,311 | $ | 45,018 | $ | — | ||||||||||
| Operating lease obligations | 65,766 | 12,609 | 18,169 | 9,626 | 25,362 | |||||||||||||||
| Purchase obligations | 75,064 | 70,369 | 3,725 | 970 | — | |||||||||||||||
| Total | $ | 242,331 | $ | 135,150 | $ | 26,205 | $ | 55,614 | $ | 25,362 | ||||||||||
Critical Accounting Policies
In preparing our financial statements, we apply the following critical accounting policies that we believe affect our judgments and estimates of amounts recorded in certain assets, liabilities, revenue and expenses. These critical accounting policies, which are those that have, or are reasonably likely to have, a material impact on our financial condition or results of operations, are further described in Note 1 of the Notes to the Financial Statements included in Item 8 of this report.
Revenue Recognition
Our revenue based upon when ouris generated from providing transportation and related services have been completedto customers in accordance with the bill of lading (“BOL”) contract, our general tariff provisions orand contractual agreements withagreements. Generally, our customers. Generally, this occursperformance obligations begin when we receive a BOL from a customer and are satisfied when we complete the delivery of a shipment. For transportationshipment and related services. We recognize revenue for our performance obligations under our customer contracts over time, as our customers receive the benefits of our services in accordance with Accounting Standards Codification (“ASC”) Topic 606, Revenue from Contracts with Customers ("ASC Topic 606"). With respect to services not completed at the end of a reporting period, we use a percentage of completion method to allocate the appropriate revenue to each separate reporting period. Under this method, we develop a factor for each uncompleted shipment by dividing the actual number of days in transit at the end of a reporting period by that shipment’s standard delivery time schedule. This factor is applied to the total revenue for that shipment and revenue is allocated between reporting periods accordingly.
28
Property and Equipment
Property and equipment are recorded at cost and depreciated on a straight-line basis over their estimated economic lives. We use historical experience, certain assumptions and estimates in determining the economic life of each asset. When indicators of impairment exist, we review property and equipment for impairment due to changes in operational and market conditions, and we adjust the carrying value and economic life of any impaired asset as appropriate.
Estimated economic lives for structures are 7 to 30 years, revenue equipment is 4 to 15 years, other equipment is 2 to 20 years, and leasehold improvements are the lesser of the economic life of the leasehold improvement or the remaining life of the
Claims and Insurance Accruals
Claims and insurance accruals reflect the estimated cost of various claims, including those related to bodily injury/property damage (“BIPD”) and workers’ compensation. All related costs associated with BIPD claims are charged to insurance and claims expense, and all related costs associated with workers’ compensation claims are charged to employee benefits expense.
Insurers providing excess coverage above a company’s self-insured retention or deductible levels typically adjust their premiums to cover insured losses and for other market factors. As a result, we periodically evaluate our self-insured retention and deductible levels to determine the most cost-efficient balance between our exposure and excess coverage.
In establishing accruals for claims and expenses, we evaluate and monitor each claim individually, and we use factors such as historical claims development experience, known trends and third-party actuarial estimates to determine the appropriate reserves for potential liabilities. We believe the assumptions and methods used to estimate these liabilities are reasonable; however, any changes in the severity or number of reported claims, significant changes in medical costs and regulatory changes affecting the administration of our plans could significantly impact the determination of appropriate reserves in future periods. Our accrued liability for insurance, BIPD claims, and workers’ compensation claims totaled $127.0 million and $129.6 million at December 31, 2023 and 2022, respectively. Claims and insurance accruals are discussed further in Note 1 of the Notes to the Financial Statements included in Item 8 of this report.
Inflation
Most of our expenses are affected by inflation, which typically results in increased operating costs. In response to fluctuations in the cost of petroleum products, particularly diesel fuel, we generally include a fuel surcharge in our tariffs and contractual agreements. The fuel surcharge is designed to offset the cost of diesel fuel above a base price and fluctuates as diesel fuel prices change from the base, which is generally indexed to the DOE’s published fuel prices that reset each week. Volatility in the price of diesel fuel independent of inflation, has impacted our business, as described in this report. However, we do not believe inflation has had a material adverse effect on our results of operations for any of the past three years.
Related Party Transactions
Family Relationships
John R. Congdon, Jr. are related to one another and served in various management positions and/or on, a member of our Board of Directors, during 2017. Our employment agreements with Earl E. Congdon andis the cousin of David S. Congdon, are incorporated by reference as exhibits to this Annual Report on Form 10-K.Executive Chairman of our Board of Directors. We regularly disclose the amount of compensation that we pay to these individuals, as well as the compensation paid to any of their family members employed by us that from time to time may require disclosure, in the proxy statement for our Annual Meeting of Shareholders.
Audit Committee Approval
The Audit Committee of our Board of Directors reviewedreviews and approvedapproves all of the related person transactions described above in accordance with our Related Person Transactions Policy.
29
ITEM 7A. QUANTITATIVE AND QUALITATIVEQUALITATIVE DISCLOSURES ABOUT MARKET RISK
Market risk represents the risk of loss that may impact our financial position, results of operations and cash flows due to adverse changes in financial market prices and rates.
We are exposed to interest rate risk directly related to loans, if any, under our Credit Agreement, which have variable interest rates. A 100 basis point increase in the average interest rate on this agreement would have no material effect on our operating results.results at December 31, 2023 and 2022. We have established policies and procedures to manage exposure to market risks and use major institutions that we believe are creditworthy to minimize credit risk.
From time to time, we are exposed to interest rate risk on certain short-term investments. We maintained a short-term investment portfolio, principally composed of commercial paper, totaling $49.4 million at December 31, 2022. We held no short-term investments as of December 31, 2023. These fixed rate securities are subject to interest rate risk, as sharp increases in market interest rates could have an adverse impact on their fair value. Although the fair values of these instruments can fluctuate, we believe that the short-term, highly liquid nature of these debt securities, and our ability to hold these instruments to maturity, reduces our risk for potential material losses. A hypothetical 100 basis point change in market interest rates would have had an immaterial impact on the fair value of these investments at December 31, 2022 and no impact at December 31, 2023.
We are exposed to market risk for equityinvestments relating to certain assets held within the Company-owned life insurance contracts on certain current and former employees. The cash surrender value in life insurance contracts included on our Balance Sheets at December 31, 2023 and 2022 was $74.4 million and $63.5 million, respectively. The portion of underlying investments with exposure to market fluctuations was $56.2 million and $45.9 million at December 31, 2023 and 2022, respectively. To provide a meaningful assessment of the market risk for investments relating to Company-owned life insurance contracts, on certain employees. At December 31, 2017, the cash value for variable life insurance contracts was $50.9 million of the $53.1 million of aggregate cash values for all life insurance contracts included on our Balance Sheets. Variable life insurance contracts expose us to fluctuations in equity markets; however, we utilizeperformed a third-party to manage these assets and minimize that exposure. Asensitivity analysis using a 10% change in market value in those investments as of December 31, 2023 and 2022. A 10% change in market value would have hadcaused a $5.1$5.6 million and a $4.6 million impact on our pre-tax income in 2017.
We are also exposed to commodity price risk related to diesel fuel prices, and we manage our exposure to that risk primarily through the application of fuel surcharges to our customers.
For further discussion related to these risks, see Notes 1, 2 and 89 of the Notes to the Financial Statements included in Item 8, “Financial Statements and Supplementary Data” and Item 7, “Management’s Discussion and Analysis of Financial Condition and Results of Operations.”
30
ITEM 8. FINANCIAL STATEMENTSSTATEMENTS AND SUPPLEMENTARY DATA
OLD DOMINION FREIGHT LINE, INC.
BALANCE SHEETS
| December 31, | ||||||||
| (In thousands, except share and per share data) | 2017 | 2016 | ||||||
| ASSETS | ||||||||
| Current assets: | ||||||||
| Cash and cash equivalents | $ | 127,462 | $ | 10,171 | ||||
| Customer receivables, less allowances of $9,465 and $8,346, respectively | 394,169 | 320,087 | ||||||
| Other receivables | 21,612 | 14,402 | ||||||
| Prepaid expenses and other current assets | 41,410 | 37,962 | ||||||
| Total current assets | 584,653 | 382,622 | ||||||
| Property and equipment: | ||||||||
| Revenue equipment | 1,591,036 | 1,496,697 | ||||||
| Land and structures | 1,548,079 | 1,377,106 | ||||||
| Other fixed assets | 432,146 | 402,482 | ||||||
| Leasehold improvements | 8,668 | 8,699 | ||||||
| Total property and equipment | 3,579,929 | 3,284,984 | ||||||
| Less: Accumulated depreciation | (1,175,470 | ) | (1,043,582 | ) | ||||
| Net property and equipment | 2,404,459 | 2,241,402 | ||||||
| Goodwill | 19,463 | 19,463 | ||||||
| Other assets | 59,849 | 52,760 | ||||||
| Total assets | $ | 3,068,424 | $ | 2,696,247 | ||||
| LIABILITIES AND SHAREHOLDERS’ EQUITY | ||||||||
| Current liabilities: | ||||||||
| Accounts payable | $ | 73,729 | $ | 89,216 | ||||
| Compensation and benefits | 152,566 | 129,170 | ||||||
| Claims and insurance accruals | 49,949 | 47,417 | ||||||
| Other accrued liabilities | 24,805 | 22,833 | ||||||
| Current maturities of long-term debt | 50,000 | — | ||||||
| Total current liabilities | 351,049 | 288,636 | ||||||
| Long-term debt | 45,000 | 104,975 | ||||||
| Other non-current liabilities | 205,561 | 178,879 | ||||||
| Deferred income taxes | 189,960 | 272,599 | ||||||
| Total long-term liabilities | 440,521 | 556,453 | ||||||
| Total liabilities | 791,570 | 845,089 | ||||||
| Commitments and contingent liabilities | ||||||||
| Shareholders’ equity | ||||||||
| Common stock - $0.10 par value, 140,000,000 shares authorized, 82,375,945 and 82,416,657 shares outstanding at December 31, 2017 and 2016, respectively | 8,238 | 8,242 | ||||||
| Capital in excess of par value | 138,359 | 135,466 | ||||||
| Retained earnings | 2,130,257 | 1,707,450 | ||||||
| Total shareholders’ equity | 2,276,854 | 1,851,158 | ||||||
| Total liabilities and shareholders’ equity | $ | 3,068,424 | $ | 2,696,247 | ||||
|
| December 31, |
| |||||
(In thousands, except share and per share data) |
| 2023 |
|
| 2022 |
| ||
ASSETS |
|
|
|
|
|
| ||
Current assets: |
|
|
|
|
|
| ||
Cash and cash equivalents |
| $ | 433,799 |
|
| $ | 186,312 |
|
Short-term investments |
|
| — |
|
|
| 49,355 |
|
Customer receivables, less allowances of $10,405 and $10,689, respectively |
|
| 578,885 |
|
|
| 578,648 |
|
Income taxes receivable |
|
| 18,554 |
|
|
| 12,738 |
|
Other receivables |
|
| 17,884 |
|
|
| 13,743 |
|
Prepaid expenses and other current assets |
|
| 94,211 |
|
|
| 92,944 |
|
Total current assets |
|
| 1,143,333 |
|
|
| 933,740 |
|
Property and equipment: |
|
|
|
|
|
| ||
Revenue equipment |
|
| 2,590,770 |
|
|
| 2,501,995 |
|
Land and structures |
|
| 3,021,447 |
|
|
| 2,750,100 |
|
Other fixed assets |
|
| 623,164 |
|
|
| 550,442 |
|
Leasehold improvements |
|
| 14,436 |
|
|
| 13,516 |
|
Total property and equipment |
|
| 6,249,817 |
|
|
| 5,816,053 |
|
Less: Accumulated depreciation |
|
| (2,154,412 | ) |
|
| (2,128,985 | ) |
Net property and equipment |
|
| 4,095,405 |
|
|
| 3,687,068 |
|
Other assets |
|
| 273,655 |
|
|
| 217,802 |
|
Total assets |
| $ | 5,512,393 |
|
| $ | 4,838,610 |
|
|
|
|
|
|
| |||
LIABILITIES AND SHAREHOLDERS’ EQUITY |
|
|
|
|
|
| ||
Current liabilities: |
|
|
|
|
|
| ||
Accounts payable |
| $ | 112,774 |
|
| $ | 106,275 |
|
Compensation and benefits |
|
| 278,953 |
|
|
| 288,278 |
|
Claims and insurance accruals |
|
| 63,346 |
|
|
| 63,307 |
|
Other accrued liabilities |
|
| 69,585 |
|
|
| 51,933 |
|
Current maturities of long-term debt |
|
| 20,000 |
|
|
| 20,000 |
|
Total current liabilities |
|
| 544,658 |
|
|
| 529,793 |
|
Long-term debt |
|
| 59,977 |
|
|
| 79,963 |
|
Other non-current liabilities |
|
| 286,815 |
|
|
| 265,422 |
|
Deferred income taxes |
|
| 363,132 |
|
|
| 310,515 |
|
Total long-term liabilities |
|
| 709,924 |
|
|
| 655,900 |
|
Total liabilities |
|
| 1,254,582 |
|
|
| 1,185,693 |
|
Commitments and contingent liabilities |
|
|
|
|
|
| ||
Shareholders’ equity |
|
|
|
|
|
| ||
Common stock - $0.10 par value, 280,000,000 shares authorized, 108,965,466 and 110,222,819 shares outstanding at December 31, 2023 and December 31, 2022, respectively. |
|
| 10,897 |
|
|
| 11,022 |
|
Capital in excess of par value |
|
| 242,958 |
|
|
| 244,590 |
|
Retained earnings |
|
| 4,003,956 |
|
|
| 3,397,305 |
|
Total shareholders’ equity |
|
| 4,257,811 |
|
|
| 3,652,917 |
|
Total liabilities and shareholders’ equity |
| $ | 5,512,393 |
|
| $ | 4,838,610 |
|
The accompanying notes are an integral part of these financial statements.
31
OLD DOMINION FREIGHT LINE, INC.
STATEMENTS OF OPERATIONS
| Year Ended December 31, | ||||||||||||
| (In thousands, except share and per share data) | 2017 | 2016 | 2015 | |||||||||
| Revenue from operations | $ | 3,358,112 | $ | 2,991,517 | $ | 2,972,442 | ||||||
| Operating expenses: | ||||||||||||
| Salaries, wages and benefits | 1,802,440 | 1,652,055 | 1,569,791 | |||||||||
| Operating supplies and expenses | 381,798 | 322,997 | 353,889 | |||||||||
| General supplies and expenses | 107,733 | 86,626 | 89,308 | |||||||||
| Operating taxes and licenses | 99,778 | 92,426 | 93,292 | |||||||||
| Insurance and claims | 41,718 | 37,861 | 37,368 | |||||||||
| Communications and utilities | 27,754 | 27,904 | 26,913 | |||||||||
| Depreciation and amortization | 205,763 | 189,867 | 165,343 | |||||||||
| Purchased transportation | 84,747 | 74,051 | 116,300 | |||||||||
| Building and office equipment rents | 7,984 | 7,920 | 9,620 | |||||||||
| Miscellaneous expenses, net | 22,511 | 15,975 | 12,378 | |||||||||
| Total operating expenses | 2,782,226 | 2,507,682 | 2,474,202 | |||||||||
| Operating income | 575,886 | 483,835 | 498,240 | |||||||||
| Non-operating expense (income): | ||||||||||||
| Interest expense | 2,154 | 4,332 | 5,210 | |||||||||
| Interest income | (740 | ) | (58 | ) | (209 | ) | ||||||
| Other (income) expense, net | (1,360 | ) | 1,974 | 3,222 | ||||||||
| Total non-operating expense | 54 | 6,248 | 8,223 | |||||||||
| Income before income taxes | 575,832 | 477,587 | 490,017 | |||||||||
| Provision for income taxes | 112,058 | 181,822 | 185,327 | |||||||||
| Net income | $ | 463,774 | $ | 295,765 | $ | 304,690 | ||||||
| Earnings per share: | ||||||||||||
| Basic | $ | 5.63 | $ | 3.56 | $ | 3.57 | ||||||
| Diluted | $ | 5.63 | $ | 3.56 | $ | 3.57 | ||||||
| Weighted average shares outstanding: | ||||||||||||
| Basic | 82,308,417 | 83,112,012 | 85,378,480 | |||||||||
| Diluted | 82,407,068 | 83,153,659 | 85,378,480 | |||||||||
| Dividends declared per share | $ | 0.40 | — | — | ||||||||
|
| Year Ended December 31, |
| |||||||||
(In thousands, except share and per share data) |
| 2023 |
|
| 2022 |
|
| 2021 |
| |||
Revenue from operations |
| $ | 5,866,152 |
|
| $ | 6,260,077 |
|
| $ | 5,256,328 |
|
|
|
|
|
|
|
|
|
| ||||
Operating expenses: |
|
|
|
|
|
|
|
|
| |||
Salaries, wages and benefits |
|
| 2,629,676 |
|
|
| 2,716,835 |
|
|
| 2,467,985 |
|
Operating supplies and expenses |
|
| 718,326 |
|
|
| 852,955 |
|
|
| 567,615 |
|
General supplies and expenses |
|
| 162,416 |
|
|
| 159,998 |
|
|
| 136,059 |
|
Operating taxes and licenses |
|
| 145,642 |
|
|
| 141,239 |
|
|
| 133,452 |
|
Insurance and claims |
|
| 75,368 |
|
|
| 58,301 |
|
|
| 53,549 |
|
Communications and utilities |
|
| 43,269 |
|
|
| 40,584 |
|
|
| 34,149 |
|
Depreciation and amortization |
|
| 324,435 |
|
|
| 276,050 |
|
|
| 259,883 |
|
Purchased transportation |
|
| 121,516 |
|
|
| 158,111 |
|
|
| 185,785 |
|
Miscellaneous expenses, net |
|
| 4,831 |
|
|
| 15,372 |
|
|
| 26,249 |
|
Total operating expenses |
|
| 4,225,479 |
|
|
| 4,419,445 |
|
|
| 3,864,726 |
|
|
|
|
|
|
|
|
|
| ||||
Operating income |
|
| 1,640,673 |
|
|
| 1,840,632 |
|
|
| 1,391,602 |
|
|
|
|
|
|
|
|
|
| ||||
Non-operating (income) expense: |
|
|
|
|
|
|
|
|
| |||
Interest expense |
|
| 464 |
|
|
| 1,563 |
|
|
| 1,727 |
|
Interest income |
|
| (12,799 | ) |
|
| (4,884 | ) |
|
| (786 | ) |
Other expense, net |
|
| 5,232 |
|
|
| 2,604 |
|
|
| 2,238 |
|
Total non-operating (income) expense |
|
| (7,103 | ) |
|
| (717 | ) |
|
| 3,179 |
|
|
|
|
|
|
|
|
|
| ||||
Income before income taxes |
|
| 1,647,776 |
|
|
| 1,841,349 |
|
|
| 1,388,423 |
|
Provision for income taxes |
|
| 408,274 |
|
|
| 464,190 |
|
|
| 354,048 |
|
Net income |
| $ | 1,239,502 |
|
| $ | 1,377,159 |
|
| $ | 1,034,375 |
|
|
|
|
|
|
|
|
|
|
| |||
Earnings per share: |
|
|
|
|
|
|
|
|
| |||
Basic |
| $ | 11.33 |
|
| $ | 12.26 |
|
| $ | 8.94 |
|
Diluted |
| $ | 11.26 |
|
| $ | 12.18 |
|
| $ | 8.89 |
|
|
|
|
|
|
|
|
|
| ||||
Weighted average shares outstanding: |
|
|
|
|
|
|
|
|
| |||
Basic |
|
| 109,421,245 |
|
|
| 112,340,791 |
|
|
| 115,651,411 |
|
Diluted |
|
| 110,090,212 |
|
|
| 113,077,820 |
|
|
| 116,409,989 |
|
|
|
|
|
|
|
|
|
| ||||
Dividends declared per share |
| $ | 1.60 |
|
| $ | 1.20 |
|
| $ | 0.80 |
|
The accompanying notes are an integral part of these financial statements.
32
OLD DOMINION FREIGHT LINE, INC.
| Capital in | ||||||||||||||||||||
| Common Stock | Excess of | Retained | ||||||||||||||||||
| (In thousands) | Shares | Amount | Par Value | Earnings | Total | |||||||||||||||
| Balance as of December 31, 2014 | 86,094 | $ | 8,609 | $ | 134,401 | $ | 1,351,054 | $ | 1,494,064 | |||||||||||
| Net income | — | — | — | 304,690 | 304,690 | |||||||||||||||
| Share repurchases | (1,682 | ) | (168 | ) | — | (113,949 | ) | (114,117 | ) | |||||||||||
| Balance as of December 31, 2015 | 84,412 | $ | 8,441 | $ | 134,401 | $ | 1,541,795 | $ | 1,684,637 | |||||||||||
| Net income | — | — | — | 295,765 | 295,765 | |||||||||||||||
| Share repurchases | (2,063 | ) | (206 | ) | — | (130,110 | ) | (130,316 | ) | |||||||||||
| Share-based compensation and restricted share issuances, net of taxes | 68 | 7 | 1,065 | — | 1,072 | |||||||||||||||
| Balance as of December 31, 2016 | 82,417 | $ | 8,242 | $ | 135,466 | $ | 1,707,450 | $ | 1,851,158 | |||||||||||
| Net Income | — | — | — | 463,774 | 463,774 | |||||||||||||||
| Share repurchases | (92 | ) | (9 | ) | — | (8,004 | ) | (8,013 | ) | |||||||||||
| Cash dividends declared | — | — | — | (32,963 | ) | (32,963 | ) | |||||||||||||
| Share-based compensation and restricted share issuances, net of taxes | 51 | 5 | 2,893 | — | 2,898 | |||||||||||||||
| Balance as of December 31, 2017 | $ | 82,376 | $ | 8,238 | $ | 138,359 | $ | 2,130,257 | $ | 2,276,854 | ||||||||||
|
|
|
|
|
|
|
| Capital in |
|
|
|
|
|
|
| |||||
|
| Common Stock |
|
| Excess of |
|
| Retained |
|
|
|
| ||||||||
(In thousands, except per share data) |
| Shares |
|
| Amount |
|
| Par Value |
|
| Earnings |
|
| Total |
| |||||
Balance as of December 31, 2020 |
|
| 117,058 |
|
| $ | 11,706 |
|
| $ | 226,451 |
|
| $ | 3,088,131 |
|
| $ | 3,326,288 |
|
Net income |
|
| — |
|
|
| — |
|
|
| — |
|
|
| 1,034,375 |
|
|
| 1,034,375 |
|
Share repurchases, including settlements under accelerated |
|
| (2,083 | ) |
|
| (209 | ) |
|
| — |
|
|
| (536,256 | ) |
|
| (536,465 | ) |
Cash dividends declared ($0.80 per share) |
|
| — |
|
|
| — |
|
|
| — |
|
|
| (92,389 | ) |
|
| (92,389 | ) |
Forward contract for 2021 accelerated share repurchases |
|
| — |
|
|
| — |
|
|
| (62,500 | ) |
|
| — |
|
|
| (62,500 | ) |
Share-based compensation and share issuances, net of |
|
| 57 |
|
|
| 6 |
|
|
| 15,033 |
|
|
| — |
|
|
| 15,039 |
|
Taxes paid in exchange for shares withheld |
|
| (21 | ) |
|
| (2 | ) |
|
| (4,539 | ) |
|
| — |
|
|
| (4,541 | ) |
Balance as of December 31, 2021 |
|
| 115,011 |
|
|
| 11,501 |
|
|
| 174,445 |
|
|
| 3,493,861 |
|
|
| 3,679,807 |
|
Net income |
|
| — |
|
|
| — |
|
|
| — |
|
|
| 1,377,159 |
|
|
| 1,377,159 |
|
Share repurchases, including settlements under accelerated |
|
| (4,815 | ) |
|
| (482 | ) |
|
| 62,500 |
|
|
| (1,339,237 | ) |
|
| (1,277,219 | ) |
Cash dividends declared ($1.20 per share) |
|
| — |
|
|
| — |
|
|
| — |
|
|
| (134,478 | ) |
|
| (134,478 | ) |
Share-based compensation and share issuances, net of |
|
| 55 |
|
|
| 6 |
|
|
| 15,887 |
|
|
| — |
|
|
| 15,893 |
|
Taxes paid in exchange for shares withheld |
|
| (28 | ) |
|
| (3 | ) |
|
| (8,242 | ) |
|
| — |
|
|
| (8,245 | ) |
Balance as of December 31, 2022 |
|
| 110,223 |
|
|
| 11,022 |
|
|
| 244,590 |
|
|
| 3,397,305 |
|
|
| 3,652,917 |
|
Net income |
|
| — |
|
|
| — |
|
|
| — |
|
|
| 1,239,502 |
|
|
| 1,239,502 |
|
Share repurchases, including transaction costs |
|
| (1,314 | ) |
|
| (131 | ) |
|
| — |
|
|
| (457,768 | ) |
|
| (457,899 | ) |
Cash dividends declared ($1.60 per share) |
|
| — |
|
|
| — |
|
|
| — |
|
|
| (175,083 | ) |
|
| (175,083 | ) |
Share-based compensation and share issuances, net |
|
| 92 |
|
|
| 9 |
|
|
| 11,071 |
|
|
| — |
|
|
| 11,080 |
|
Taxes paid in exchange for shares withheld |
|
| (36 | ) |
|
| (3 | ) |
|
| (12,703 | ) |
|
| — |
|
|
| (12,706 | ) |
Balance as of December 31, 2023 |
|
| 108,965 |
|
| $ | 10,897 |
|
| $ | 242,958 |
|
| $ | 4,003,956 |
|
| $ | 4,257,811 |
|
The accompanying notes are an integral part of these financial statements.
33
OLD DOMINION FREIGHT LINE, INC.
STATEMENTS OF CASH FLOWS
| Year Ended December 31, | ||||||||||||
| (In thousands) | 2017 | 2016 | 2015 | |||||||||
| Cash flows from operating activities: | ||||||||||||
| Net income | $ | 463,774 | $ | 295,765 | $ | 304,690 | ||||||
| Adjustments to reconcile net income to net cash provided by operating activities: | ||||||||||||
| Depreciation and amortization | 205,763 | 189,867 | 165,343 | |||||||||
| Loss (gain) on sale of property and equipment | 1,274 | 168 | (3,592 | ) | ||||||||
| Deferred income taxes | (82,639 | ) | 34,808 | 43,642 | ||||||||
| Share-based compensation | 3,242 | 1,410 | — | |||||||||
| Changes in assets and liabilities: | ||||||||||||
| Customer and other receivables, net | (76,353 | ) | (11,176 | ) | (8,672 | ) | ||||||
| Prepaid expenses and other assets | (12,885 | ) | (21,227 | ) | (6,097 | ) | ||||||
| Accounts payable | (15,487 | ) | 22,442 | 21,460 | ||||||||
| Compensation, benefits and other accrued liabilities | 25,330 | 4,965 | 14,699 | |||||||||
| Claims and insurance accruals | 1,843 | 6,548 | 11,549 | |||||||||
| Income taxes, net | (4,939 | ) | 21,184 | 11,511 | ||||||||
| Other liabilities | 27,371 | 20,829 | (653 | ) | ||||||||
| Net cash provided by operating activities | 536,294 | 565,583 | 553,880 | |||||||||
| Cash flows from investing activities: | ||||||||||||
| Purchase of property and equipment | (382,125 | ) | (417,941 | ) | (462,059 | ) | ||||||
| Proceeds from sale of property and equipment | 12,240 | 10,541 | 24,442 | |||||||||
| Other investing activities, net | 2,139 | — | — | |||||||||
| Net cash used in investing activities | (367,746 | ) | (407,400 | ) | (437,617 | ) | ||||||
| Cash flows from financing activities: | ||||||||||||
| Principal payments under long-term debt agreements | — | (26,488 | ) | (37,778 | ) | |||||||
| Net (payments) proceeds on revolving line of credit | (9,975 | ) | (2,342 | ) | 12,317 | |||||||
| Dividends paid | (32,925 | ) | — | — | ||||||||
| Payments for share repurchases | (8,013 | ) | (130,316 | ) | (114,117 | ) | ||||||
| Other financing activities, net | (344 | ) | (338 | ) | — | |||||||
| Net cash used in financing activities | (51,257 | ) | (159,484 | ) | (139,578 | ) | ||||||
| Increase (decrease) in cash and cash equivalents | 117,291 | (1,301 | ) | (23,315 | ) | |||||||
| Cash and cash equivalents at beginning of year | 10,171 | 11,472 | 34,787 | |||||||||
| Cash and cash equivalents at end of year | $ | 127,462 | $ | 10,171 | $ | 11,472 | ||||||
| Income taxes paid | $ | 199,404 | $ | 123,395 | $ | 130,058 | ||||||
| Interest paid | $ | 5,442 | $ | 6,417 | $ | 8,414 | ||||||
| Capitalized interest | $ | 3,309 | $ | 2,262 | $ | 2,526 | ||||||
|
| Year Ended December 31, |
| |||||||||
(In thousands) |
| 2023 |
|
| 2022 |
|
| 2021 |
| |||
Cash flows from operating activities: |
|
|
|
|
|
|
|
|
| |||
Net income |
| $ | 1,239,502 |
|
| $ | 1,377,159 |
|
| $ | 1,034,375 |
|
Adjustments to reconcile net income to net cash provided by operating |
|
|
|
|
|
|
|
|
| |||
Depreciation and amortization |
|
| 324,449 |
|
|
| 276,066 |
|
|
| 259,899 |
|
Noncash lease expense |
|
| 18,665 |
|
|
| 16,658 |
|
|
| 14,890 |
|
Gain on disposal of property and equipment |
|
| (22,555 | ) |
|
| (3,425 | ) |
|
| (563 | ) |
Deferred income taxes |
|
| 53,341 |
|
|
| 62,008 |
|
|
| 30,165 |
|
Share-based compensation |
|
| 11,080 |
|
|
| 15,893 |
|
|
| 15,039 |
|
Changes in assets and liabilities: |
|
|
|
|
|
|
|
|
| |||
Customer and other receivables, net |
|
| (3,875 | ) |
|
| (13,009 | ) |
|
| (125,562 | ) |
Prepaid expenses and other assets |
|
| (38,189 | ) |
|
| (24,714 | ) |
|
| (38,387 | ) |
Accounts payable |
|
| 6,499 |
|
|
| 23,756 |
|
|
| 14,008 |
|
Compensation, benefits and other accrued liabilities |
|
| (1,422 | ) |
|
| (11,202 | ) |
|
| 32,437 |
|
Claims and insurance accruals |
|
| (2,249 | ) |
|
| 5,464 |
|
|
| 10,963 |
|
Income taxes, net |
|
| (5,816 | ) |
|
| 6,480 |
|
|
| (27,929 | ) |
Other liabilities |
|
| (10,295 | ) |
|
| (39,552 | ) |
|
| (6,729 | ) |
Net cash provided by operating activities |
|
| 1,569,135 |
|
|
| 1,691,582 |
|
|
| 1,212,606 |
|
|
|
|
|
|
|
|
|
| ||||
Cash flows from investing activities: |
|
|
|
|
|
|
|
|
| |||
Purchase of property and equipment |
|
| (757,309 | ) |
|
| (775,148 | ) |
|
| (550,077 | ) |
Proceeds from sale of property and equipment |
|
| 48,637 |
|
|
| 22,096 |
|
|
| 19,548 |
|
Purchase of short-term investments |
|
| — |
|
|
| (163,720 | ) |
|
| (359,389 | ) |
Proceeds from maturities of short-term investments |
|
| 48,852 |
|
|
| 369,300 |
|
|
| 435,130 |
|
Other investing activities, net |
|
| — |
|
|
| — |
|
|
| (500 | ) |
Net cash used in investing activities |
|
| (659,820 | ) |
|
| (547,472 | ) |
|
| (455,288 | ) |
|
|
|
|
|
|
|
|
| ||||
Cash flows from financing activities: |
|
|
|
|
|
|
|
|
| |||
Payments for share repurchases |
|
| (453,613 | ) |
|
| (1,277,219 | ) |
|
| (536,465 | ) |
Forward contract for accelerated share repurchases |
|
| — |
|
|
| — |
|
|
| (62,500 | ) |
Dividends paid |
|
| (175,089 | ) |
|
| (134,484 | ) |
|
| (92,366 | ) |
Principal payments under debt agreements |
|
| (20,000 | ) |
|
| — |
|
|
| — |
|
Other financing activities, net |
|
| (13,126 | ) |
|
| (8,659 | ) |
|
| (4,853 | ) |
Net cash used in financing activities |
|
| (661,828 | ) |
|
| (1,420,362 | ) |
|
| (696,184 | ) |
|
|
|
|
|
|
|
|
| ||||
Increase (decrease) in cash and cash equivalents |
|
| 247,487 |
|
|
| (276,252 | ) |
|
| 61,134 |
|
Cash and cash equivalents at beginning of year |
|
| 186,312 |
|
|
| 462,564 |
|
|
| 401,430 |
|
Cash and cash equivalents at end of year |
| $ | 433,799 |
|
| $ | 186,312 |
|
| $ | 462,564 |
|
|
|
|
|
|
|
|
|
| ||||
Income taxes paid |
| $ | 361,448 |
|
| $ | 396,510 |
|
| $ | 352,826 |
|
Interest paid |
| $ | 3,484 |
|
| $ | 3,953 |
|
| $ | 4,232 |
|
Capitalized interest |
| $ | 3,364 |
|
| $ | 3,260 |
|
| $ | 2,655 |
|
|
|
|
|
|
|
|
|
|
| |||
Supplemental disclosure of noncash investing and financing activities: |
|
|
|
|
|
|
|
|
| |||
Noncash purchases of property |
| $ | - |
|
| $ | - |
|
| $ | 16,034 |
|
The accompanying notes are an integral part of these financial statements.
34
OLD DOMINION FREIGHT LINE, INC.
NOTES TO THE FINANCIAL STATEMENTS
Note 1. Significant Accounting Policies
Business
We are a leading,one of the largest North American less-than-truckload (“LTL”), union-free motor carrier providingcarriers. We provide regional, inter-regional and national LTL services which include ground and air expedited transportation and consumer household pickup and delivery, through a single integrated, union-free organization. Our service offerings, which include expedited transportation, are provided through an expansive network of service centers located throughout the continental United States. Through strategic alliances, we also provide LTL services throughout North America. In addition to our core LTL services, we offer a range of value-added services including container drayage, truckload brokerage and supply chain consulting and warehousing.
We have one operating segment and no single customer exceeds 5%6% of our revenue. The composition of our revenue is summarized below:
|
| Year Ended December 31, |
| |||||||||
(In thousands) |
| 2023 |
|
| 2022 |
|
| 2021 |
| |||
LTL services |
| $ | 5,804,939 |
|
| $ | 6,177,055 |
|
| $ | 5,177,497 |
|
Other services |
|
| 61,213 |
|
|
| 83,022 |
|
|
| 78,831 |
|
Total revenue |
| $ | 5,866,152 |
|
| $ | 6,260,077 |
|
| $ | 5,256,328 |
|
| Year Ended December 31, | ||||||||||||
| (In thousands) | 2017 | 2016 | 2015 | |||||||||
| LTL services | $ | 3,303,611 | $ | 2,939,572 | $ | 2,893,683 | ||||||
| Other services | 54,501 | 51,945 | 78,759 | |||||||||
| Total revenue | $ | 3,358,112 | $ | 2,991,517 | $ | 2,972,442 | ||||||
Basis of Presentation
The preparation of financial statements in conformity with U.S. generally accepted accounting principles requires management to make estimates and assumptions that affect the amounts reported in the financial statements and accompanying notes. Actual results could differ from those estimates.
Certain amounts in prior years have been reclassified to conform prior years’ financial statements to the current presentation.
Unless the context requires otherwise, references in these Notes to “Old Dominion,” the “Company,” “we,” “us” and “our” refer to Old Dominion Freight Line, Inc.
Revenue and Expense Recognition
We recognize revenue based upon when our transportation and related services have been completed in accordance with the bill of lading (“BOL”) contract, our general tariff provisions orand contractual agreements with our customers. Generally, this occursour performance obligations begin when we receive a BOL from a customer and are satisfied when we complete the delivery of a shipment. For transportationshipment and related services. We recognize revenue for our performance obligations under our customer contracts over time, as our customers receive the benefits of our services in accordance with ASC Topic 606. With respect to services not completed at the end of a reporting period, we use a percentage of completion method to allocate the appropriate revenue to each separate reporting period. Under this method, we develop a factor for each uncompleted shipment by dividing the actual number of days in transit at the end of a reporting period by that shipment’s standard delivery time schedule. This factor is applied to the total revenue for that shipment and revenue is allocated between reporting periods accordingly.
Expenses are recognized when incurred.
Allowances for Uncollectible Accounts and Revenue Adjustments
We maintain an allowance for uncollectible accounts for estimated losses resulting from the inability of our customers to make required payments. We estimate this allowance by analyzing the aging of our customer receivables, our historical loss experience and other trends and factors affecting the credit risk of our customers.customers, including anticipated changes to future performance. Write-offs occur when we determine an account to be uncollectible and could differ from our allowance estimate as a result of factors such as changes in the overall economic environment or risks surrounding our customers. Additional allowances may be required if the financial condition of our customers were to deteriorate, resulting in an impairment of their ability to make payments. We periodically
35
OLD DOMINION FREIGHT LINE, INC.
NOTES TO THE FINANCIAL STATEMENTS (CONTINUED)
review the underlying assumptions in our estimate of the allowance for uncollectible accounts to ensure that the allowance reflects the most recent trends and factors.
We also maintain an allowance for estimated revenue adjustments resulting from future billing corrections, customer allowances, money-back service guarantees and other miscellaneous revenue adjustments. These revenue adjustments are
Credit Risk
Financial instruments that potentially subject us to concentrations of credit risk consist principally of customer receivables. We perform initial and ongoing credit evaluations of our customers to minimize credit risk. We generally do not require collateral but may require prepayment of our services under certain circumstances. Credit risk is generally diversified due to the large number of entities comprising our customer base and their dispersion across many different industries and geographic regions. When held, we generally expect our short-term investments will be diversified over various high-quality issuers. Such short-term investments may also subject us to concentrations of credit risk.
Cash and Cash Equivalents
We consider cash on hand and deposits in banks along with certificates of deposit and short-term marketable securities with original maturities of three months or less as cash and cash equivalents.
Short-term Investments
The Company’s investments in commercial paper with an original maturity of greater than three months have been classified and accounted for as trading securities, and are reported in “Short-term investments” on our Balance Sheets. These investments are measured at fair value each reporting period, with gains or losses recorded in “Non-operating (income) expense” on our Statements of Operations.
Property and Equipment
Property and equipment are stated at cost. Major additions and improvements are capitalized, while maintenance and repairs that do not improve or extend the lives of the respective assets are charged to expense as incurred. We capitalize the cost of tires mounted on purchased revenue equipment as a part of the total equipment cost. Subsequent replacement tires are expensed at the time those tires are placed in service. We assess the realizable value of our long-lived assets and evaluate such assets for impairment whenever events or changes in circumstances indicate the carrying amount of an asset may not be recoverable.
Depreciation of property and equipment is calculated using the straight-line method over the estimated useful lives of the related assets. The following table provides the estimated useful lives by asset type:
Structures | 7 to 30 years | |
Revenue equipment | 4 to 15 years | |
Other equipment | 2 to | |
Leasehold improvements | Lesser of economic life or life of lease |
Depreciation expense which includes the amortization of capital leases, was $205.6$324.0 million, $189.6$275.6 million and $164.8$259.5 million for 2017, 20162023, 2022 and 2015,2021, respectively.
Claims and Insurance Accruals
We carry a significant amount of insurance with third-party insurance carriers that provides various levels of protection for our risk exposure, including protection in connectionthe areas of property, casualty, cyber, management, and group health, with business combinationscoverage limits and retention and deductible levels that we believe are comprisedreasonable given historical claim activity and severity. We believe that our policy of goodwill. Goodwill is calculated as the excess cost over the fair value of assets acquired and is not subject to amortization. We review goodwill annuallymaintaining self-insured retentions or deductibles under these various insurance programs for impairment as a single reporting unit, unless circumstances dictate more frequent assessments, in accordance with Accounting Standards Update (“ASU”) 2011-08, Testing Goodwill for Impairment. ASU 2011-08 permits an initial assessment, commonly referred to as "step zero", of qualitative factors to determine whether it is more likely than not that the fair value of a reporting unit is less than its carrying amount and also provides a basis for determining whether it is necessary to perform the goodwill impairment test required by Accounting Standards Codification ("ASC") Topic 350.
36
OLD DOMINION FREIGHT LINE, INC.
NOTES TO THE FINANCIAL STATEMENTS (CONTINUED)
Claims and insurance accruals reflect the Company’s estimated cost of claims for cargo loss and damage, BIPD, workers'workers’ compensation, group health and group dental not covered by insurance.dental. These accruals include amounts for future claims development and claims incurred but not reported, which are primarily based on historical claims development experience. The related costscost for cargo loss and damage and BIPD areis charged to "Insurance“Insurance and claims"claims” on our Statements of Operations, while the related costs for workers'workers’ compensation, group health and group dental are charged to "Salaries,“Salaries, wages and benefits"benefits” on our Statements of Operations.
Our liability for claims and insurance totaled $127.6$153.8 million and $125.8$156.0 million at December 31, 20172023 and 2016,2022, respectively. The long-term portions of those reserves were $77.7$90.4 million and $78.4$92.7 million for 20172023 and 2016,2022, respectively, which were included in “Other non-current liabilities” on our Balance Sheets.
Share-Based Compensation
We have various share-based compensation plans for our employees and non-employee directors. Our share-based compensation includes awards of phantom stock, and restricted stock, and performance-based restricted stock units which are accounted for under ASC Topic 718,
Awards of restricted stock, modified phantom stock and performance-based restricted stock units are accounted for as equity under ASC Topic 718. Compensation cost for restricted stock awards is measured at the fair market value of our common stock on the grant date. We recognize compensation cost, net of estimated forfeitures, for restricted stock awards and modified phantom stock awards on a straight-line basis over the requisite service period of each award. Compensation cost for performance-based restricted stock unit awards is recognized using the accelerated attribution method over the requisite service period of each award. At the end of each reporting period, we reassess the probability of achieving performance targets and changes to our initial assessment are reflected in the reporting period in which the change in estimate occurs.
Advertising
The costs of advertising our services are expensed as incurred and are included in “General supplies and expenses” on our Statements of Operations. Advertising costs charged to expense totaled $27.3$34.6 million, $20.5$29.0 million and $22.9$28.1 million for 2017, 20162023, 2022 and 2015,2021, respectively.
Fair ValuesValue of Financial Instruments
Fair value is defined as the price that would be received to sell an asset or paid to transfer a liability in an orderly transaction between market participants at the measurement date. The carrying valueslevels of inputs used to measure fair value are:
• Level 1 — Quoted prices for identical instruments in active markets;
• Level 2 — Quoted prices for similar instruments in active markets; quoted prices for identical or similar instruments in markets that are not active; and model-derived valuations in which all significant inputs are observable in active markets; and
• Level 3 — Valuations based on inputs that are unobservable, generally utilizing pricing models or other valuation techniques that reflect management’s judgment and estimates.
Our short-term investments are measured at fair value on a recurring basis. Our long-term debt, including current maturities, are measured at fair value. Both of these instruments are further described in Note 9. Our other financial instrumentssecurities in current assets and current liabilities approximate their fair value due to the shortshort-term maturities of these instruments. The carrying value of our revolving credit facility approximates fair value due to the variable interest rates of the facility that correlate with current market rates. The carrying value of our total long-term debt, including current maturities, was $95.0 million and $105.0 million at December 31, 2017 and 2016, respectively. The estimated fair value of our total long-term debt, including current maturities, was $97.1 million and $108.3 million at December 31, 2017 and 2016, respectively. The fair value measurement of our senior notes was determined using a discounted cash flow analysis that factors in current market yields for comparable borrowing arrangements under our credit profile. Since this methodology is based upon market yields for comparable arrangements, the measurement is categorized as Level 2 under the three-level fair value hierarchy as established by the Financial Accounting Standards Board (the “FASB”).
37
OLD DOMINION FREIGHT LINE, INC.
NOTES TO THE FINANCIAL STATEMENTS (CONTINUED)
Stock Repurchase Program
On May 23, 2016,1, 2020, we announced that our Board of Directors had approved a new two-year stock repurchase program authorizing us to repurchase up to an aggregate of $250.0$700.0 million of our outstanding common stock (the “2016“2020 Repurchase Program”). Under the 2016The 2020 Repurchase Program became effective on May 29, 2020. On July 28, 2021, we announced that our Board of Directors had approved a stock repurchase program authorizing us to repurchase up to an aggregate of $2.0 billion of our outstanding common stock (the “2021 Repurchase Program”). The 2021 Repurchase Program, which does not have an expiration date, began after the completion of the 2020 Repurchase Program in January 2022. At December 31, 2023, we had $225.4 million remaining authorized under the 2021 Repurchase Program. On July 26, 2023, we announced that our Board of Directors had approved a new stock repurchase program authorizing us to repurchase up to an aggregate of $3.0 billion of our outstanding common stock. The new repurchase program, which does not have an expiration date, will be effective upon the completion of our 2021 Repurchase Program.
Under our repurchase programs, we may repurchase shares from time to time in open market purchases or through privately negotiated transactions. Shares of our common stock repurchased under our repurchase programs are canceled at the time of repurchase and are classified as authorized but unissued shares of our common stock. As
We entered into accelerated share repurchase agreements with a third-party financial institution on each of August 26, 2021 and February 24, 2022. The Company’s accelerated share repurchase agreements are each accounted for as a settled treasury stock purchase and a forward stock purchase contract. The par value of the initial shares received is recorded as a reduction to common stock, with the excess purchase price recorded as a reduction to retained earnings. The forward stock purchase contract is accounted for as a contract indexed to our own stock and is classified within capital in excess of par value on our Balance Sheets. The Company's accelerated share repurchase agreements are each settled with the final number of shares received based on the daily volume-weighted average share price of our common stock over the term of the agreement, less a negotiated discount. The table below summarizes our accelerated share repurchase activity for 2022 and 2021. There was no accelerated share repurchase activity for the year ended December 31, 2017, we had $192.0 million remaining authorized under the 2016 Repurchase Program.2023.
|
|
|
|
|
| Agreement |
|
|
|
|
|
|
|
|
|
| ||||
Agreement |
| Settlement |
| Amount |
|
| Initial Shares |
|
| Shares Received |
|
| Total Shares |
| ||||||
Date |
| Date |
| (In millions) |
|
| Received |
|
| at Settlement |
|
| Received |
| ||||||
February 2021 |
|
| August 2021 |
|
| $ | 275.0 |
|
|
| 960,330 |
|
|
| 140,716 |
|
|
| 1,101,046 |
|
August 2021 |
|
| January 2022 |
|
| $ | 250.0 |
|
|
| 655,365 |
|
|
| 123,410 |
|
|
| 778,775 |
|
February 2022 |
|
| April 2022 |
|
| $ | 400.0 |
|
|
| 1,018,157 |
|
|
| 372,809 |
|
|
| 1,390,966 |
|
Comprehensive Income
The Company has no components of other comprehensive income. Accordingly, net income equals comprehensive income for all periods presented in this report.
| Year Ended December 31, | ||||||||||||
| (In thousands) | 2017 | 2016 | 2015 | |||||||||
| Acquisition of property and equipment by capital lease | $ | — | $ | — | $ | 3,552 | ||||||
Note 2. Long-term Debt
Long-term debt, net of Certain Cash Receipts and Cash Payments" (Topic 230) to address how certain cash receipts and cash payments are presented and classified in the statement of cash flows. This ASU is intended to reduce diversity in practice in the classification of certain transactions on the statement of cash flows. The ASU is effective for public companies for fiscal years beginning after December 15, 2017, and early adoption is permitted. We early adopted the provisions of ASU 2016-15 as of January 1, 2017. The adoption resulted in proceeds from Company-owned life insurance policies being classified as cash flows from investing activities, rather than cash flows from operating activities on our Statements of Cash Flows. The adoption did not have a material impact on our financial position, results of operations or cash flows.
|
| December 31, |
| |||||
(In thousands) |
| 2023 |
|
| 2022 |
| ||
Senior notes |
| $ | 79,977 |
|
| $ | 99,963 |
|
Revolving credit facility |
|
| — |
|
|
| — |
|
Total long-term debt |
|
| 79,977 |
|
|
| 99,963 |
|
Less: Current maturities |
|
| (20,000 | ) |
|
| (20,000 | ) |
Total maturities due after one year |
| $ | 59,977 |
|
| $ | 79,963 |
|
38
OLD DOMINION FREIGHT LINE, INC.
NOTES TO THE FINANCIAL STATEMENTS (CONTINUED)
Note 2. Long-term Debt
| December 31, | ||||||||
| (In thousands) | 2017 | 2016 | ||||||
| Senior notes | $ | 95,000 | $ | 95,000 | ||||
| Revolving credit facility | — | 9,975 | ||||||
| Total long-term debt | 95,000 | 104,975 | ||||||
| Less: Current maturities | (50,000 | ) | — | |||||
| Total maturities due after one year | $ | 45,000 | $ | 104,975 | ||||
On December 15, 2015,May 4, 2020, we entered into a Note Purchase and Private Shelf Agreement with PGIM, Inc. (“Prudential”) and certain affiliates and managed accounts of Prudential (as subsequently amended on March 22, 2023, the “Note Agreement”). The Note Agreement, which is uncommitted and subject to Prudential’s sole discretion, provides for the issuance of senior promissory notes with an aggregate principal amount of up to $350.0 million through March 22, 2026. On May 4, 2020, we issued $100.0 million aggregate principal amount of senior promissory notes (the “Series B Notes”). Borrowing availability under the Note Agreement is reduced by the outstanding amount of the existing Series B Notes, and all other senior promissory notes issued pursuant to the Note Agreement.
The Series B Notes bear interest at 3.10% per annum and mature on May 4, 2027, unless prepaid. The first principal payment of $20.0 million was paid on May 4, 2023. The remaining $80.0 million will be paid in four equal annual installments of $20.0 million through May 4, 2027. The Series B Notes are senior unsecured obligations and rank pari passu with borrowings under our third amended and restated credit agreement, dated March 22, 2023, with Wells Fargo Bank, National Association ("Wells Fargo") serving as administrative agent for the lenders (the "Credit Agreement"“Credit Agreement”). or other senior promissory notes issued pursuant to the Note Agreement.
Credit Agreement
The Credit Agreement originally providedprovides for a five-year, $250.0$250.0 million senior unsecured revolving line of credit and a $100.0$150.0 million accordion feature, which if fully exercised and approved, would expand the total borrowing capacity up to an aggregate of $350.0 million.
At our option, borrowings under the Credit Agreement bear interest at either: (i) LIBORthe Secured Overnight Financing Rate (SOFR) plus the Term SOFR Adjustment, as defined in the Credit Agreement, equal to 0.100%, plus an applicable margin (based on our ratio of net debt-to-total capitalization) that ranges from 1.0%1.000% to 1.50%1.375%; or (ii) a Base Rate, as defined in the Credit Agreement, plus an applicable margin (based on our ratio of net debt-to-total capitalization) that ranges from 0.0%0.000% to 0.5%0.375%. Loans under the Sweep Program bear interest at LIBOR plusThe applicable margin rate.for each of the foregoing options is dependent upon our consolidated debt to consolidated total capitalization ratio. Letter of credit fees equal to the applicable margin for LIBORSOFR loans are charged quarterly in arrears on the daily average aggregate stated amount of all letters of credit outstanding during the quarter. Commitment fees ranging from 0.125%0.090% to 0.2%0.175% (based upon the ratio of net debt-to-total capitalization)our consolidated debt to total consolidated capitalization ratio) are charged quarterly in arrears on the aggregate unutilized portion of the Credit Agreement. Wells Fargo,
For periods covered under the Credit Agreement, the applicable margin on SOFR loans and letter of credit fees were 1.000% and commitment fees were 0.090%.
The Credit Agreement replaced our previous five-year, $250.0 million senior unsecured revolving credit agreement dated as administrative agent, also receives an annual fee for providing administrative services.
There were $71.4 $40.0million and $74.6$38.7 million of outstanding letters of credit at December 31, 20172023 and 2016,2022, respectively. Letter of credit fees remained at 1.0% during each of the years ended December 31, 2017 and 2016.
General Debt Provisions
The Credit Agreement includesand Note Agreement contain customary covenants, including financial covenants that require us to observe a maximum ratio of debt to total capital and a minimum fixed charge coverage ratio. The Credit Agreement and Note Agreement also include a provision limiting our ability to make restricted payments, including dividends and payments for share repurchases, unless, among other conditions, no defaults or events of default under the Credit Agreement are ongoing (or would be caused by such restricted payment). Our senior note agreement and Credit Agreement contain customary
| (In thousands) | Total | ||
| 2018 | $ | 50,000 | |
| 2019 | — | ||
| 2020 | — | ||
| 2021 | 45,000 | ||
| Thereafter | — | ||
| $ | 95,000 | ||
Note 3. Leases
We lease certain assets under operating leases, which primarily consistconsisted of real estate leases for 34 of our 228certain service center locations at December 31, 2017.and automotive leases for private passenger vehicles. Certain operating leases provide for renewal options, which can vary by lease and are typically offered at their fair rental value. We have not made any residual value guarantees related to our operating leases; therefore, we have no corresponding liability recorded on our Balance Sheets.
39
OLD DOMINION FREIGHT LINE, INC.
NOTES TO THE FINANCIAL STATEMENTS (CONTINUED)
The right-of-use assets and corresponding lease liabilities on our Balance Sheets represent payments over the lease term, which includes renewal options for certain real estate leases that we are likely to exercise. These renewal options begin in 2024 and continue through 2035, and range from one to ten years in length. Short-term leases, which have an initial term of 12 months or less, are not included in our right-of-use assets or corresponding lease liabilities.
Of our total operating lease liabilities, $15.6 million and $17.3 million are classified as current and are presented within “Other accrued liabilities,” and $104.8 million and $80.8 million are classified as non-current and are presented within “Other non-current liabilities” on our Balance Sheets as of December 31, 2023 and 2022, respectively. Our right-of-use assets totaled $116.4 million and $95.2 million and are presented within “Other assets,” which is classified as long-term, on our Balance Sheets as of December 31, 2023 and 2022, respectively.
Future minimum annual lease payments for assets under operating leases, as well as a reconciliation to our total lease liabilities as of
(In thousands) |
| Lease Payments |
| |
2024 |
| $ | 21,598 |
|
2025 |
|
| 18,926 |
|
2026 |
|
| 18,335 |
|
2027 |
|
| 17,747 |
|
2028 |
|
| 16,922 |
|
Thereafter |
|
| 57,745 |
|
Total lease payments |
| $ | 151,273 |
|
Less: imputed interest |
|
| (30,918 | ) |
Total lease liabilities |
| $ | 120,355 |
|
| (In thousands) | Total | |||
| 2018 | $ | 12,609 | ||
| 2019 | 10,262 | |||
| 2020 | 7,907 | |||
| 2021 | 5,610 | |||
| 2022 | 4,016 | |||
| Thereafter | 25,362 | |||
| $ | 65,766 | |||
The weighted average lease term for our operating leases was $14.1 million, $13.87.6 years and 8.1 years at December 31, 2023 and 2022, respectively. The discount rate used in the calculation of our right-of-use assets and corresponding lease liabilities was determined based on the stated rate within each contract when available, or our collateralized borrowing rate from lending institutions. The weighted average discount rate for our operating leases was 4.9% and 3.8% as of December 31, 2023 and 2022, respectively.
Cash paid for amounts included in the measurement of our lease liabilities was $22.6 million and $15.2$18.6 million for 2017, 2016the years ended December 31, 2023 and 2015,2022, respectively. Certain operating leases include rent escalation provisions, which we recognize as expense on a straight-line basis. We did not have any assetsLease expense is presented within “Operating supplies and expenses” or “General supplies and expenses,” depending on the nature of the use of the leased asset. Aggregate expense under capitaloperating leases at each ofwas $24.5 million, $20.0 million and $19.0 million for 2023, 2022 and 2021, respectively. During the years ended December 31, 20172023 and 2016.2022, we increased our right-of-use assets by $39.9 million and $11.6 million, respectively, in exchange for new operating lease liabilities.
Note 4. Income Taxes
The components of the provision for income taxes are as follows:
|
| Year Ended December 31, |
| |||||||||
(In thousands) |
| 2023 |
|
| 2022 |
|
| 2021 |
| |||
Current: |
|
|
|
|
|
|
|
|
| |||
Federal |
| $ | 288,030 |
|
| $ | 318,571 |
|
| $ | 253,084 |
|
State |
|
| 66,903 |
|
|
| 83,611 |
|
|
| 70,799 |
|
|
|
| 354,933 |
|
|
| 402,182 |
|
|
| 323,883 |
|
Deferred: |
|
|
|
|
|
|
|
|
| |||
Federal |
|
| 42,728 |
|
|
| 51,862 |
|
|
| 26,382 |
|
State |
|
| 10,613 |
|
|
| 10,146 |
|
|
| 3,783 |
|
|
|
| 53,341 |
|
|
| 62,008 |
|
|
| 30,165 |
|
Total provision for income taxes |
| $ | 408,274 |
|
| $ | 464,190 |
|
| $ | 354,048 |
|
40
OLD DOMINION FREIGHT LINE, INC.
NOTES TO THE FINANCIAL STATEMENTS (CONTINUED)
| Year Ended December 31, | ||||||||||||
| (In thousands) | 2017 | 2016 | 2015 | |||||||||
| Current: | ||||||||||||
| Federal | $ | 169,053 | $ | 126,903 | $ | 120,437 | ||||||
| State | 25,644 | 20,111 | 21,248 | |||||||||
| 194,697 | 147,014 | 141,685 | ||||||||||
| Deferred: | ||||||||||||
| Federal | (81,551 | ) | 29,354 | 38,549 | ||||||||
| State | (1,088 | ) | 5,454 | 5,093 | ||||||||
| (82,639 | ) | 34,808 | 43,642 | |||||||||
| Total provision for income taxes | $ | 112,058 | $ | 181,822 | $ | 185,327 | ||||||
The following is a reconciliation of income tax expense calculated using the U.S. statutory federal income tax rate with our income tax expense for
|
| Year Ended December 31, |
| |||||||||
(In thousands) |
| 2023 |
|
| 2022 |
|
| 2021 |
| |||
Tax provision at statutory rate |
| $ | 346,033 |
|
| $ | 386,683 |
|
| $ | 291,569 |
|
State income taxes, net of federal benefit |
|
| 66,055 |
|
|
| 75,906 |
|
|
| 60,036 |
|
Other, net |
|
| (3,814 | ) |
|
| 1,601 |
|
|
| 2,443 |
|
Total provision for income taxes |
| $ | 408,274 |
|
| $ | 464,190 |
|
| $ | 354,048 |
|
| Year Ended December 31, | ||||||||||||
| (In thousands) | 2017 | 2016 | 2015 | |||||||||
| Tax provision at statutory rate | $ | 201,541 | $ | 167,156 | $ | 171,506 | ||||||
| State income taxes, net of federal benefit | 20,277 | 16,711 | 17,097 | |||||||||
| Revaluation of deferred taxes in connection with the Tax Act | (104,864 | ) | — | — | ||||||||
| Other, net | (4,896 | ) | (2,045 | ) | (3,276 | ) | ||||||
| Total provision for income taxes | $ | 112,058 | $ | 181,822 | $ | 185,327 | ||||||
Deferred tax assets and liabilities, which are included in "Other assets"“Other assets” and "Deferred“Deferred income taxes"taxes” on our Balance Sheets, consist of the following:
|
| December 31, |
| |||||
(In thousands) |
| 2023 |
|
| 2022 |
| ||
Deferred tax assets: |
|
|
|
|
|
| ||
Claims and insurance reserves |
| $ | 29,776 |
|
| $ | 31,736 |
|
Accrued vacation |
|
| 19,849 |
|
|
| 20,330 |
|
Deferred compensation |
|
| 41,343 |
|
|
| 39,973 |
|
Other |
|
| 12,142 |
|
|
| 11,767 |
|
Total deferred tax assets |
|
| 103,110 |
|
|
| 103,806 |
|
|
|
|
|
|
|
| ||
Deferred tax liabilities: |
|
|
|
|
|
| ||
Depreciation and amortization |
|
| (460,703 | ) |
|
| (407,942 | ) |
Other |
|
| (4,997 | ) |
|
| (5,113 | ) |
Total deferred tax liabilities |
|
| (465,700 | ) |
|
| (413,055 | ) |
Net deferred tax liability |
| $ | (362,590 | ) |
| $ | (309,249 | ) |
| December 31, | ||||||||
| (In thousands) | 2017 | 2016 | ||||||
| Deferred tax assets: | ||||||||
| Claims and insurance reserves | $ | 29,008 | $ | 43,409 | ||||
| Accrued vacation | 17,832 | 24,227 | ||||||
| Deferred compensation | 29,220 | 40,742 | ||||||
| Other | 15,157 | 11,593 | ||||||
| Total deferred tax assets | 91,217 | 119,971 | ||||||
| Deferred tax liabilities: | ||||||||
| Depreciation and amortization | (266,730 | ) | (376,034 | ) | ||||
| Unrecognized revenue | (10,007 | ) | (11,465 | ) | ||||
| Other | (1,703 | ) | (2,334 | ) | ||||
| Total deferred tax liabilities | (278,440 | ) | (389,833 | ) | ||||
| Net deferred tax liability | $ | (187,223 | ) | $ | (269,862 | ) | ||
We are subject to U.S. federal income tax, as well as income tax of multiple state tax jurisdictions. We remain open to examination by the Internal Revenue Service for tax years 20122020 through 2017.2023. We also remain open to examination by various state tax jurisdictions for tax years 20122019 through 2017.
The Company'sCompany’s liability for unrecognized tax benefits was immaterial as of December 31, 20172023 and 2016.2022. Interest and penalties related to uncertain tax positions, which are immaterial, are recorded in our "Provision“Provision for income taxes"taxes” on our Statements of Operations. Changes in our liability for unrecognized tax benefits could affect our effective tax rate, if recognized, but we do not expect any material changes within the next twelve months.
Note 5. Related Party Transactions
John R. Congdon, Jr. are related to one another and served in various management positions and/or on, a member of our Board of Directors, during 2017. Our employment agreements with Earl E. Congdon andis the cousin of David S. Congdon, are incorporated by reference as exhibits to this Annual Report on Form 10-K.Executive Chairman of our Board of Directors. We regularly disclose the amount of compensation that we pay to these individuals, as well as the compensation paid to any of their family members employed by us that from time to time may require disclosure, in the proxy statement for our Annual Meeting of Shareholders.
Note 6. Employee Benefit Plans
Defined Contribution Plan
Full-time employees meeting certain serviceeligibility requirements are eligible to participateautomatically enrolled in our 401(k) employee retirement plan.plan, unless the employee elects not to defer any compensation. Employee contributions are limited to a percentage of the employee’s compensation, as defined in the plan. We match a percentage of our employees’ contributions up to certain maximum limits. In addition, we may also provide a discretionary matching contribution as specified in the plan. Our employer contributions, net of forfeitures, for 2017, 20162023, 2022 and 20152021 were $35.9$119.5 million, $28.9$135.2 million and $30.3$102.0 million, respectively.
41
OLD DOMINION FREIGHT LINE, INC.
NOTES TO THE FINANCIAL STATEMENTS (CONTINUED)
Deferred Compensation Plan
We maintain a nonqualified deferred compensation plan for the benefit of certain eligible employees, including those whose contributions to the 401(k) employee retirement plan are limited due to provisions of the Internal Revenue Code. Participating employees may elect to defer receipt of a percentage of their compensation, as defined in the plan, and the deferred amount is credited to each participant’s deferred compensation account. The plan is not funded, and the Company does not make a matching contribution to this plan. Although the plan is not funded, participants are allowed to select investment options for which their deferrals and future earnings are deemed to be invested. Participant accounts are adjusted to reflect participant deferrals and the performance of their deemed investments. The amounts owed to the participants totaled $61.5$101.4 million and $53.8$88.3 million at December 31, 20172023 and 2016,2022, respectively, of which $59.5$91.2 million and $51.0$83.2 million were included in "Other“Other non-current liabilities"liabilities” on our Balance Sheets as of December 31, 20172023 and 2016,2022, respectively.
Note 7. Earnings Per Share
Basic earnings per share is computed by dividing net income by the daily weighted average number of shares of our common stock outstanding for the period, excluding unvested restricted stock. Unvested restricted stock is included in common shares outstanding on our Balance Sheets.
Diluted earnings per share is computed using the treasury stock method andmethod. The denominator used in calculating diluted earnings per share includes the impact of shares of unvested restricted stock.
The following table provides a reconciliation of the number of shares of common sharesstock used in computing basic and diluted earnings per share:
|
| Year Ended December 31, |
| |||||||||
(In thousands) |
| 2023 |
|
| 2022 |
|
| 2021 |
| |||
Weighted average shares outstanding - basic |
|
| 109,421,245 |
|
|
| 112,340,791 |
|
|
| 115,651,411 |
|
Dilutive effect of share-based awards |
|
| 668,967 |
|
|
| 737,029 |
|
|
| 758,578 |
|
Weighted average shares outstanding - diluted |
|
| 110,090,212 |
|
|
| 113,077,820 |
|
|
| 116,409,989 |
|
| Year Ended December 31, | |||||||||
| (In thousands) | 2017 | 2016 | 2015 | ||||||
| Weighted average shares outstanding - basic | 82,308,417 | 83,112,012 | 85,378,480 | ||||||
| Dilutive effect of share-based awards | 98,651 | 41,647 | — | ||||||
| Weighted average shares outstanding - diluted | 82,407,068 | 83,153,659 | 85,378,480 | ||||||
Note 8. Share-Based Compensation
Stock Incentive Plan
On May 19, 2016, our shareholders approved the Old Dominion Freight Line, Inc. 2016 Stock Incentive Plan (the "Stock“Stock Incentive Plan"Plan”) previously approved by our Board of Directors. The Stock Incentive Plan, under which awards may be granted until May 18, 2026, or the Stock Incentive Plan’s earlier termination, serves as our primary equity incentive plan and provides for the grant of incentive stock options, nonqualified stock options, stock appreciation rights, restricted awards, performance awards, phantom stock awards and other stock-based awards or dividend equivalent awards to selected employees and non-employee directors. The maximum number of shares of common stock that we may issue or deliver pursuant to awards granted under the Stock Incentive Plan is 2,000,0003,000,000 shares.
Restricted Stock Awards
During 20172023, 2022 and 2016,2021, we granted restricted stock awards to selected employees and non-employee directors under the Stock Incentive Plan. The employee restricted stock awards vest in three equal annual installments on each anniversary of the grant date, and the non-employee director restricted stock awards generally vest in full on the first anniversary of the grant date. In both cases, the restricted stock awards are subject to accelerated vesting due to death, total disability, or change in control of the Company.
Subject to the foregoing, unvested restricted stock awards are generally forfeited upon termination of employment, unless otherwise approved by the Board of Directors or service.its Compensation Committee. The restricted stock awards accrue dividends while the award is unvested and only carry rights to receive the accrued dividends once vested.
42
OLD DOMINION FREIGHT LINE, INC.
NOTES TO THE FINANCIAL STATEMENTS (CONTINUED)
Compensation cost for restricted stock awards is measured at the grant date based on the fair market value per share of our common stock. Compensation cost is recognized on a straight-line basis over the requisite service period of each award and is presented in "Salaries, wages and benefits" for employees and “Miscellaneous expenses, net” for non-employee directors in the accompanying Statements of Operations.
The following table summarizes our restricted stock award activity for employees and non-employee directors:
|
| Shares |
|
| Weighted Average |
| ||
Unvested at January 1, 2023 |
|
| 77,725 |
|
| $ | 232.79 |
|
Granted |
|
| 37,730 |
|
|
| 359.53 |
|
Vested |
|
| (52,447 | ) |
|
| 222.91 |
|
Forfeited |
|
| (5,026 | ) |
|
| 322.90 |
|
Unvested at December 31, 2023 |
|
| 57,982 |
|
| $ | 317.23 |
|
| Shares | Weighted Average Grant Date Fair Value Per Share | ||||||
| Unvested At January 1, 2017 | 72,695 | $ | 63.94 | ||||
| Granted | 59,314 | $ | 90.16 | ||||
| Vested | (30,653 | ) | 63.94 | ||||
| Forfeited | (4,258 | ) | 72.66 | ||||
| Unvested at December 31, 2017 | 97,098 | $ | 79.58 | ||||
The weighted average grant date fair value per restricted stock award granted during fiscal years 20172023, 2022 and 20162021 was $90.16$359.53, $303.81 and $63.94,$213.55, respectively. We did not grant any restricted stock awards during fiscal year 2015. The total fair value of vested restricted stock awards for fiscal year 20172023, 2022 and 2021 was $2.7 million. No restricted stock awards vested during fiscal years 2016$18.1 million, $20.1 million and 2015.$15.6 million, respectively. At December 31, 2017,2023, the Company had $4.6$9.7 million of unrecognized stock-based compensation cost, net of estimated forfeitures, related to unvested restricted stock awards that willare expected to be recognized over a weighted average period of 1.81.7 years.
Performance-Based Restricted Stock Plan
During 2023, 2022 and 2021 we granted performance-based restricted stock units (“PBRSUs”) to selected employees under the Stock Incentive Plan. The PBRSUs are earned based on the achievement of Directors approved and we adoptedstated Company performance metrics over a one-year performance period. One-third of the Old Dominion Freight Line, Inc. 2012 Phantom Stock Plan, as amendedearned PBRSUs vest following the end of the one-year performance period if the performance metrics are satisfied, with an additional one-third of the PBRSUs vesting on January 29, 2015 (the "2012 Phantom Stock Plan"). Under the 2012 Phantom Stock Plan, 1,000,000 shares of phantom stock may be awarded, each of which represents a contractual right to receive an amount in cash equal to the fair market value of a share of our common stock on the settlement date, which is the earliest of the date of the participant's (i) termination of employment for any reason other than for cause, (ii) death or (iii) total disability. Each award vests in 20% increments on the anniversary of thenext two grant date provided that the participant (i) has been continuously employed by us since the grant date, (ii) has been continuously employed by us for ten years and (iii) has reached the age of 65. Vesting also occurs on the earliest of (i) aanniversaries. Earned PBRSUs are subject to accelerated vesting due to death, total disability, or change in control (ii) deathof the Company. Subject to the foregoing, unvested PBRSUs are generally forfeited if minimum threshold performance targets are not achieved or (iii) total disability. Awards are settled in cash after the required vesting period has been satisfied and upon termination of employment. Unvested shares are forfeited upon termination of employment, although our Board of Directors has authority to modify and/The unvested PBRSUs do not include voting rights or accelerate the vesting of awards.
Compensation cost for PBRSUs is the earlier of the eligible employee’s (i) termination from the Company after reaching 55 years of age, (ii) death or (iii) total disability. Awards are settled in cash after the required vesting period has been satisfied and upon termination of employment.
| Year Ended December 31, | ||||||||||||
| (In thousands) | 2017 | 2016 | 2015 | |||||||||
| Cash payments for settled shares | $ | 3,066 | $ | 2,442 | $ | 1,682 | ||||||
| Compensation expense (benefit) | 16,910 | 12,694 | (1,612 | ) | ||||||||
The following table summarizes our activity for PBRSUs for employees during 2023:
|
| Shares |
|
| Weighted Average |
| ||
Unvested at January 1, 2023 |
|
| 54,536 |
|
| $ | 231.03 |
|
Granted (a) |
|
| — |
|
|
| — |
|
Vested |
|
| (35,463 | ) |
|
| 228.24 |
|
Forfeited |
|
| (1,694 | ) |
|
| 263.43 |
|
Unvested at December 31, 2023 |
|
| 17,379 |
|
| $ | 254.93 |
|
(a) PBRSUs earned may range from zero to 200% of the award on that date.target award. PBRSUs granted for the 2023 performance period were not earned as the performance metrics were not met.
At December 31, 2023, the Company adopted, the Old Dominion Freight Line, Inc. Director Phantom Stock Plan, as amended on April 1, 2011, February 20, 2014, August 7, 2014 and February 25, 2016 (the “Director Phantom Stock Plan” and together with the Employee Phantom Plans, the “Phantom Plans”). Under the Director Phantom Stock Plan, each eligible non-employee director was granted an annual awardhad $0.6 million of phantom shares. Our Boardunrecognized stock-based compensation cost, net of Directors approved the initial grant under this plan at its May 2008 meeting and authorized the subsequent annual grantsestimated forfeitures, related to unvested PBRSUs that are expected to be made thereafter. For each vested phantom share, participants are entitled to an amount in cash equal to the fair market valuerecognized over a weighted average period of the award on the date that service as a director terminates for any reason. Our shareholders approved the Stock Incentive Plan at our 2016 Annual Meeting of Shareholders; therefore, no phantom shares were granted under the Director Phantom Stock Plan in 2016 or 2017.
43
OLD DOMINION FREIGHT LINE, INC.
NOTES TO THE FINANCIAL STATEMENTS (CONTINUED)
Phantom Stock Plan is provided below:
| Year Ended December 31, | ||||||||||||
| (In thousands) | 2017 | 2016 | 2015 | |||||||||
| Cash payments for settled shares | $ | 474 | $ | 278 | $ | — | ||||||
| Compensation expense (benefit) | 2,588 | 2,098 | (916 | ) | ||||||||
A summary of the changes in the number of outstanding phantom stock awards during the year ended December 31, 2017 for the Phantom Plans2023 is provided below. There were no phantom stock awards granted during 2023.
| Total |
|
| Weighted Average |
| ||
Balance of shares outstanding at January 1, 2023 |
| 612,520 |
|
| $ | 120.40 |
|
Settled |
| (24,881 | ) |
|
| 118.99 |
|
Forfeited |
| (28,441 | ) |
|
| 119.69 |
|
Balance of shares outstanding at December 31, 2023 |
| 559,198 |
|
| $ | 120.50 |
|
Of these outstanding awards, 360,481 and 333,5701,722 phantom shares wereremain unvested with a weighted average grant date fair value per share of $114.76. The outstanding phantom stock awards will be settled in shares of our common stock equal to the number of vested shares of phantom stock on the applicable settlement date. The shares of common stock will generally be distributed in twenty-four substantially equal monthly installments commencing on the first day of the sixth calendar month following such settlement date.
Note 9. Fair Value Measurements
Short-term investments
We held no short-term investments as of December 31, 2023. A summary of the fair value of our short-term investments as of December 31, 2022 is shown in the table below.
(In thousands) | December 31, 2022 |
|
| Level 1 |
|
| Level 2 |
|
| Level 3 |
| ||||
Commercial paper | $ | 49,355 |
|
| $ | — |
|
| $ | 49,355 |
|
| $ | — |
|
Total |
|
|
|
|
|
|
|
|
|
|
| ||||
|
|
|
|
|
|
|
|
|
|
|
| ||||
Our commercial paper is valued using broker quotes that utilize observable market inputs.
Long-term debt
The carrying value of our total long-term debt, including current maturities, was $80.0 million and $100.0 million at December 31, 20172023 and 2016,2022, respectively.
| Employee Phantom Plans | Director Phantom Stock Plan | Total | |||||||
| Balance of shares outstanding at December 31, 2016 | 517,693 | 68,162 | 585,855 | ||||||
| Granted | — | — | — | ||||||
| Settled | (21,506 | ) | — | (21,506 | ) | ||||
| Forfeited | (4,722 | ) | — | (4,722 | ) | ||||
| Balance of shares outstanding at December 31, 2017 | 491,465 | 68,162 | 559,627 | ||||||
| December 31, | ||||||||
| (In thousands) | 2017 | 2016 | ||||||
| Employee Phantom Plans | $ | 48,148 | $ | 33,116 | ||||
| Director Phantom Stock Plan | 8,436 | 5,848 | ||||||
| Total | $ | 56,584 | $ | 38,964 | ||||
Note 9.10. Commitments and Contingencies
We are involved in or addressing various legal proceedings and claims, governmental inquiries, notices and investigations that have arisen in the ordinary course of our business and have not been fully adjudicated, some of which may be covered in whole or in part by insurance. Certain of these matters include collective and/or class-action allegations. We do not believe that the resolution of any of these matters will have a material adverse effect upon our financial position, results of operations or cash flows.
Note 10. Quarterly Financial Information (Unaudited)
On February 16, 2024, we announced that our Board of Directors approved a two-for-one split of our unaudited quarterly financial informationcommon stock for
| Quarter | ||||||||||||||||||||
| (In thousands, except per share data) | First | Second | Third | Fourth | Total | |||||||||||||||
| 2017 | ||||||||||||||||||||
| Revenue | $ | 754,096 | $ | 839,912 | $ | 872,987 | $ | 891,117 | $ | 3,358,112 | ||||||||||
| Operating income | 108,122 | 160,432 | 163,875 | 143,457 | 575,886 | |||||||||||||||
Net income (1) | 65,792 | 98,418 | 102,314 | 197,250 | 463,774 | |||||||||||||||
| Earnings per share: | ||||||||||||||||||||
| Basic | 0.80 | 1.20 | 1.24 | 2.40 | 5.63 | |||||||||||||||
| Diluted | 0.80 | 1.19 | 1.24 | 2.39 | 5.63 | |||||||||||||||
| Cash dividends declared | 0.10 | 0.10 | 0.10 | 0.10 | 0.40 | |||||||||||||||
| 2016 | ||||||||||||||||||||
| Revenue | $ | 707,733 | $ | 755,435 | $ | 782,611 | $ | 745,738 | $ | 2,991,517 | ||||||||||
| Operating income | 99,548 | 133,436 | 137,404 | 113,447 | 483,835 | |||||||||||||||
| Net income | 60,285 | 81,388 | 85,581 | 68,511 | 295,765 | |||||||||||||||
| Earnings per share: | ||||||||||||||||||||
| Basic | 0.72 | 0.98 | 1.03 | 0.83 | 3.56 | |||||||||||||||
| Diluted | 0.72 | 0.98 | 1.03 | 0.83 | 3.56 | |||||||||||||||
| Cash dividends declared | — | — | — | — | — | |||||||||||||||
44
Report of Independent Registered Public Accounting Firm
To the Shareholders and the Board of Directors of Old Dominion Freight Line, Inc.
Opinion on the Financial Statements
We have audited the accompanying balance sheets of Old Dominion Freight Line, Inc. (the Company) as of December 31, 20172023 and 2016,2022, the related statements of operations, changes in shareholders' equity and cash flows for each of the three years in the period ended December 31, 2017,2023, and the related notes, andas well as the financial statement schedule listed in the Index at Item 15(a)(2) (collectively referred to as the “financial statements”). In our opinion, the financial statements present fairly, in all material respects, the financial position of the Company at December 31, 20172023 and 2016,2022, and the results of its operations and its cash flows for each of the three years in the period ended December 31, 2017,2023, in conformity with U.S. generally accepted accounting principles.
We also have audited, in accordance with the standards of the Public Company Accounting Oversight Board (United States) (PCAOB), the Company's internal control over financial reporting as of December 31, 2017,2023, based on criteria established in Internal Control-Integrated Framework issued by the Committee of Sponsoring Organizations of the Treadway Commission (2013 framework), and our report dated February 27, 201826, 2024 expressed an unqualified opinion thereon.
Basis for Opinion
These financial statements are the responsibility of the Company's management. Our responsibility is to express an opinion on the Company’s financial statements based on our audits. We are a public accounting firm registered with the PCAOB and are required to be independent with respect to the Company in accordance with the U.S. federal securities laws and the applicable rules and regulations of the Securities and Exchange Commission and the PCAOB.
We conducted our audits in accordance with the standards of the PCAOB. Those standards require that we plan and perform the audit to obtain reasonable assurance about whether the financial statements are free of material misstatement, whether due to error or fraud. Our audits included performing procedures to assess the risks of material misstatement of the financial statements, whether due to error or fraud, and performing procedures that respond to those risks. Such procedures included examining, on a test basis, evidence regarding the amounts and disclosures in the financial statements. Our audits also included evaluating the accounting principles used and significant estimates made by management, as well as evaluating the overall presentation of the financial statements. We believe that our audits provide a reasonable basis for our opinion.
Critical Audit Matter
The critical audit matter communicated below is a matter arising from the current period audit of the financial statements that was communicated or required to be communicated to the audit committee and that: (1) relates to accounts or disclosures that are material to the financial statements and (2) involved our especially challenging, subjective or complex judgments. The communication of the critical audit matter does not alter in any way our opinion on the financial statements, taken as a whole, and we are not, by communicating the critical audit matter below, providing a separate opinion on the critical audit matter or on the accounts or disclosures to which it relates.
Self-Insurance Reserves for Bodily Injury/Property Damage (“BIPD”) and Workers’ Compensation | |
Description of the Matter | The liability for claims and insurance totaled $153.8 million at December 31, 2023, and the majority of this amount represents the self-insurance reserves for BIPD and workers’ compensation claims. The long-term portion of this liability was $90.4 million, which was included in “Other non-current liabilities”, and the remainder was included in “Claims and insurance accruals” on the Company’s Balance Sheets. As described in Note 1 to the financial statements, claims and insurance accruals include the estimated cost of claims for BIPD and workers' compensation. These accruals include estimates for both future claims development on reported claims as well as claims incurred but not yet reported. The Company uses historical claims experience, known trends and third-party actuarial estimates to determine the liabilities for each of the BIPD and workers’ compensation reserves. These analyses are complex and require significant judgment as the models utilize multiple valuation methods and reflect subjective assumptions, including 1) the |
45
weighting of such methods, 2) the loss ratio, 3) the loss trend factor, and 4) the loss development factor, among other assumptions. | ||||
How We Addressed the Matter in Our Audit | We identified and tested internal controls over management’s review of the estimate for self-insurance reserves for BIPD and workers’ compensation claims, including controls over the completeness and accuracy of data inputs used in the Company’s third-party calculations, the assumptions and reserve calculations, as well as management’s evaluation of service organization controls and user controls over certain of the Company’s claims data that is managed by a third-party administrator. To test the self-insurance reserves for BIPD and workers’ compensation claims balances, our audit procedures included, among others, evaluating the methodologies used and the significant assumptions discussed above, as well as performing procedures with respect to underlying data and calculations used in the Company’s third-party analyses. We involved our actuarial specialists to assist in our evaluation of the appropriateness of the methods and assumptions used as well as to independently calculate ranges of reasonable reserve estimates developed based on independently selected assumptions and to compare such ranges to the Company’s recorded reserves. We tested claims data by comparing the data to supporting source documentation and payment information as well as performing trend analyses. |
/s/ Ernst & Young LLP
We have served as the Company’s auditor since 1994.
Raleigh, North Carolina
February 27, 2018
46
ITEM 9. CHANGES IN AND DISAGREEMENTS WITH ACCOUNTANTS ON ACCOUNTING AND FINANCIAL DISCLOSURE
None.
ITEM 9A. CONTROLS AND PROCEDURES
As of the end of the period covered by this report, our management has conducted an evaluation, with the participation of our Chief Executive Officer (“CEO”) and Chief Financial Officer (“CFO”), of the effectiveness of our disclosure controls and procedures in accordance with Rule 13a-15 under the Exchange Act. Based on this evaluation as of the end of the period covered by this report, our CEO and CFO concluded that, as of such date, our disclosure controls and procedures were effective to ensure that information required to be disclosed by us in the reports that we file or submit under the Exchange Act is (i) accumulated and communicated to our management, including our CEO and CFO, as appropriate to allow timely decisions regarding required disclosure, and (ii) recorded, processed, summarized and reported within the time periods specified in the SEC’s rules and forms.
Management is responsible for establishing and maintaining adequate internal control over financial reporting in accordance with Exchange Act Rule 13a-15(f). Management has conducted an evaluation, with the participation of our CEO and CFO, of the effectiveness of our internal control over financial reporting as of
December 31,A control system, no matter how well conceived and operated, can provide only reasonable, not absolute, assurance that the objectives of the control system are met. Further, in designing a control system, we must take into account the benefits of controls relative to their costs. Because of the inherent limitations in all control systems, no evaluation of controls can provide absolute assurance that all control issues and instances of fraud, if any, within the Company have been detected.
The effectiveness of our internal control over financial reporting as of
December 31,There were no changes in our internal control over financial reporting that occurred during the last quarter of the period covered by this report that have materially affected, or are reasonably likely to materially affect, our internal control over financial reporting.
47
Report of Independent Registered Public Accounting Firm
To the Shareholders and the Board of Directors of Old Dominion Freight Line, Inc.
Opinion on Internal Control over Financial Reporting
We have audited Old Dominion Freight Line, Inc.’s internal control over financial reporting as of December 31, 2017,2023, based on criteria established in Internal Control-IntegratedControl—Integrated Framework issued by the Committee of Sponsoring Organizations of the Treadway Commission (2013 framework) (the COSO criteria). In our opinion, Old Dominion Freight Line, Inc. (the Company) maintained, in all material respects, effective internal control over financial reporting as of December 31, 2017,2023, based on the COSO criteria.
We also have audited, in accordance with the standards of the Public Company Accounting Oversight Board (United States) (PCAOB), the balance sheets of the Company as of December 31, 20172023 and 2016,2022, the related statements of operations, changes in shareholders’ equity and cash flows for each of the three years in the period ended December 31, 2017,2023, and the related notes and the financial statement schedule listed in the Index at Item 15(a)(2), and our report dated February 27, 201826, 2024 expressed an unqualified opinion thereon.
Basis for Opinion
The Company’s management is responsible for maintaining effective internal control over financial reporting and for its assessment of the effectiveness of internal control over financial reporting included in the accompanying Management’s Annual Report on Internal Control over Financial Reporting. Our responsibility is to express an opinion on the Company’s internal control over financial reporting based on our audit. We are a public accounting firm registered with the PCAOB and are required to be independent with respect to the Company in accordance with the U.S. federal securities laws and the applicable rules and regulations of the Securities and Exchange Commission and the PCAOB.
We conducted our audit in accordance with the standards of the PCAOB. Those standards require that we plan and perform the audit to obtain reasonable assurance about whether effective internal control over financial reporting was maintained in all material respects.
Our audit included obtaining an understanding of internal control over financial reporting, assessing the risk that a material weakness exists, testing and evaluating the design and operating effectiveness of internal control based on the assessed risk, and performing such other procedures as we considered necessary in the circumstances. We believe that our audit provides a reasonable basis for our opinion.
Definition and Limitations of Internal Control Over Financial Reporting
A company’s internal control over financial reporting is a process designed to provide reasonable assurance regarding the reliability of financial reporting and the preparation of financial statements for external purposes in accordance with generally accepted accounting principles. A company’s internal control over financial reporting includes those policies and procedures that (1) pertain to the maintenance of records that, in reasonable detail, accurately and fairly reflect the transactions and dispositions of the assets of the company; (2) provide reasonable assurance that transactions are recorded as necessary to permit preparation of financial statements in accordance with generally accepted accounting principles, and that receipts and expenditures of the company are being made only in accordance with authorizations of management and directors of the company; and (3) provide reasonable assurance regarding prevention or timely detection of unauthorized acquisition, use, or disposition of the company’s assets that could have a material effect on the financial statements.
Because of its inherent limitations, internal control over financial reporting may not prevent or detect misstatements. Also, projections of any evaluation of effectiveness to future periods are subject to the risk that controls may become inadequate because of changes in conditions, or that the degree of compliance with the policies or procedures may deteriorate.
/s/ Ernst & Young LLP
Raleigh, North Carolina
February 27, 2018
48
ITEM 9B. OTHER INFORMATION
During the three months ended December 31, 2023, no member of the Board of Directors or Section 16 officer of the Company adopted or terminated a "Rule 10b5-1 trading arrangement" or "non-Rule 10b5-1 trading arrangement," as each term is defined in Item 408 (a) of Regulation S-K.
ITEM 9C. DISCLOSURE REGARDING FOREIGN JURISDICTIONS THAT PREVENT INSPECTIONS
Not applicable.
PART III
ITEM 10. DIRECTORS, EXECUTIVE OFFICERS AND CORPORATE GOVERNANCE
The information required by Item 10 of Form 10-K will appear in the Company’s proxy statement for its 20182024 Annual Meeting of Shareholders under the captions “Proposal 1 – Election of Directors,” “Executive Officers,” “Section 16(a) Beneficial Ownership Reporting Compliance,” “Corporate Governance – Attendance and Committees of the Board – Audit Committee,” and “Corporate Governance – Director Nominations,” "Corporate Governance - Insider Trading Policy" and "Delinquent Section 16(a) Reports" (to the extent reported therein), and the information therein is incorporated herein by reference.
We have adopted a “Code of Business Conduct” that applies to all of our directors and officers and other employees, including our principal executive officer, principal financial officer and principal accounting officer. Our Code of Business Conduct is publicly available and is posted on our website at http:https://www.odfl.com/Content/corpGovernance.faces.ir.odfl.com/governance-docs. To the extent permissible under applicable law, the rules of the SEC and Nasdaq listing standards, we intend to disclose on our website any amendment to our Code of Business Conduct, or any grant of a waiver from a provision of our Code of Business Conduct, that requires disclosure under applicable law, the rules of the SEC or Nasdaq listing standards.
ITEM 11. EXECUTIVE COMPENSATION
The information required by Item 11 of Form 10-K will appear in the Company’s proxy statement for its
ITEM 12. SECURITY OWNERSHIP OF CERTAIN BENEFICIAL OWNERS AND MANAGEMENT AND RELATED STOCKHOLDER MATTERS
The information required by Item 12 of Form 10-K will appear in the Company’s proxy statement for its
The information required by Item 13 of Form 10-K will appear in the Company’s proxy statement for the
ITEM 14. PRINCIPAL ACCOUNTING FEES AND SERVICES
The information required by Item 14 of Form 10-K will appear in the Company’s proxy statement for its
49
PART IV
ITEM 15. EXHIBITS, FINANCIAL STATEMENT SCHEDULES
(a)(1) Financial Statements.
The following financial statements of Old Dominion Freight Line, Inc. are included in Item 8:
Balance Sheets –
December 31,Statements of Operations – Years ended
December 31,Statements of Changes in Shareholders’ Equity – Years ended
December 31,Statements of Cash Flows – Years ended
December 31,Notes to the Financial Statements
Report of Independent Registered Public Accounting Firm (PCAOB ID: 42)
(a)(2) Financial Statement Schedules.
The Schedule II – Valuation and Qualifying Accounts schedule of Old Dominion Freight Line, Inc. is included below:
Schedule II
Old Dominion Freight Line, Inc.
Valuation and Qualifying Accounts
(In thousands) |
| Allowance for Uncollectible Accounts (1) |
| |||||||||||||
Year Ended December 31, |
| Balance at |
|
| Charged to |
|
| Deductions (2) |
|
| Balance at |
| ||||
2021 |
| $ | 4,095 |
|
| $ | 3,773 |
|
| $ | 1,829 |
|
| $ | 6,039 |
|
2022 |
| $ | 6,039 |
|
| $ | 2,128 |
|
| $ | 1,490 |
|
| $ | 6,677 |
|
2023 |
| $ | 6,677 |
|
| $ | 1,670 |
|
| $ | 2,239 |
|
| $ | 6,108 |
|
| (In thousands) | Allowance for Uncollectible Accounts(1) | |||||||||||||||
| Year Ended December 31, | Balance at Beginning of Period | Charged to Expense | Deductions(2) | Balance at End of Period | ||||||||||||
| 2015 | $ | 5,564 | $ | 1,511 | $ | 2,622 | $ | 4,453 | ||||||||
| 2016 | $ | 4,453 | $ | 1,427 | $ | 2,797 | $ | 3,083 | ||||||||
| 2017 | $ | 3,083 | $ | 2,555 | $ | 2,150 | $ | 3,488 | ||||||||
All other schedules for which provision is made in the applicable accounting regulations of the SEC are not required under the instructions thereto or are inapplicable and, therefore, have been omitted.
(a)(3) Exhibits Filed.
The exhibits listed in the accompanying Exhibit Index are filed as a part of this report.
(b) Exhibits.
See the Exhibit Index immediately preceding the signatures to this Annual Report on Form 10-K.
(c) Separate Financial Statements and Schedules.
None.
ITEM 16. FORM 10-K SUMMARY
None.
50
EXHIBIT INDEX
TO ANNUAL REPORT ON FORM 10-K
OLD DOMINION FREIGHT LINE, INC.
FOR YEAR ENDED
DECEMBER 31,Exhibit No. | Description | |
3.1.1 | ||
3.1.2 | ||
3.1.3 | ||
3.2 | ||
4.1 | ||
4.14 | ||
4.15 | ||
4.16 | ||
4.17 | ||
4.18 | ||
10.17.15* | ||
10.17.16* | ||
10.17.20* | ||
10.18.4* | ||
51
10.18.7* | ||
10.18.9* | ||
10.18.12* | ||
10.18.13* | ||
10.18(16)* | ||
10.19.1* | ||
10.19.3* | ||
10.19.4* | ||
10.19.6* | ||
10.19.7* | ||
10.19.8* | ||
10.19.9* | ||
10.19.10* |
10.19.11* | ||
10.19.12* | ||
10.19.13* | ||
10.19.14* | ||
52
10.19.15* | ||
10.19.16* | ||
10.20.1* | ||
10.20.2* | ||
10.20.3* | ||
10.20.4* | ||
10.20.5* | ||
10.21* | ||
10.21.1* | ||
10.23* | ||
10.23.2* | ||
10.23.4* | ||
10.23.5* | ||
23.1 | ||
31.1 | ||
31.2 | ||
32.1 | ||
32.2 | ||
97 | Old Dominion Freight Line, Inc. Clawback Policy (as updated October 18, 2023) | |
101 | The following financial information from our Annual Report on Form 10-K for the year ended December 31, |
53
2023, 2022 and |
104 | ||
The cover page from our Annual Report on Form 10-K for | ||
*Denotes an executive compensation plan or agreement
Our SEC file number reference for documents filed with the SEC pursuant to the Securities Exchange Act of 1934, as amended, is 0-19582.
54
SIGNATURES
Pursuant to the requirements of Section 13 or 15(d) of the Securities Exchange Act of 1934, the registrant has duly caused this report to be signed on its behalf by the undersigned, thereunto duly authorized.
OLD DOMINION FREIGHT LINE, INC. | |||||||||
Dated: | February | By: | /s/ | ||||||
Kevin M. Freeman | |||||||||
President and Chief Executive Officer (Principal Executive Officer) | |||||||||
Pursuant to the requirements of the Securities Exchange Act of 1934, this report has been signed below by the following persons on behalf of the registrant and in the capacities and on the dates indicated:
Name and Signature | Position | Date | ||||
/s/ | Executive Chairman of the Board of Directors | February | ||||
David S. Congdon | ||||||
/s/ SHERRY A. AAHOLM | Director | February 26, 2024 | ||||
Sherry A. Aaholm | ||||||
/s/ JOHN R. CONGDON, JR. | Director | February | ||||
John R. Congdon, Jr. | ||||||
/s/ | Director | February | ||||
Andrew S. Davis | ||||||
/s/ BRADLEY R. GABOSCH | Director | February | ||||
Bradley R. Gabosch | ||||||
/s/ | Director | February | ||||
Greg C. Gantt | ||||||
/s/ JOHN D. KASARDA | Director | February | ||||
John D. Kasarda | ||||||
/s/ WENDY T. STALLINGS | Director | February 26, 2024 | ||||
Wendy T. Stallings | ||||||
/s/ THOMAS A. STITH, III | Director | February 26, 2024 | ||||
Thomas A. Stith, III | ||||||
/s/ LEO H. SUGGS | Director | February | ||||
Leo H. Suggs | ||||||
/s/ | President and Chief Executive Officer | February | ||||
Kevin M. Freeman | (Principal Executive Officer) | |||||
/s/ ADAM N. SATTERFIELD | Executive Vice President | February | ||||
Adam N. Satterfield | ||||||
(Principal Financial Officer) | ||||||
/s/ KIMBERLY S. MAREADY | Vice President | February | ||||
Kimberly S. Maready | (Principal Accounting Officer) | |||||
55