UNITED STATES
SECURITIES AND EXCHANGE COMMISSION
Washington, D.C. 20549
FORM 10-K | | | | | |
| (Mark One) | |
| ☒ | ANNUAL REPORT PURSUANT TO SECTION 13 OR 15(d) OF THE SECURITIES EXCHANGE ACT OF 1934 |
For the fiscal year ended December 31, 20212023
or | | | | | |
| ☐ | TRANSITION REPORT PURSUANT TO SECTION 13 OR 15(d) OF THE SECURITIES EXCHANGE ACT OF 1934 |
For the transition period from to
Commission file number: 1-11884
ROYAL CARIBBEAN CRUISES LTD.
(Exact name of registrant as specified in its charter) | | | | | |
Republic of Liberia (State or other jurisdiction of incorporation or organization) | 98-0081645 (I.R.S. Employer Identification No.) |
1050 Caribbean Way, Miami, Florida 33132
(Address of principal executive offices) (zip code)
(305) 539-6000
(Registrant's telephone number, including area code)
Securities registered pursuant to Section 12(b) of the Act:
| | | | | | | | | | | | | | |
| Title of each class | | Trading Symbol(s) | | Name of each exchange on which registered |
| Common Stock, par value $.01 per share | | RCL | | New York Stock Exchange |
Securities registered pursuant to Section 12(g) of the Act: None
Indicate by check mark if the registrant is a well-known seasoned issuer, as defined in Rule 405 of the Securities Act. Yes ☒ No ☐
Indicate by check mark if the registrant is not required to file reports pursuant to Section 13 or Section 15(d) of the Act. Yes ☐ No ☒
Indicate by check mark whether the registrant (1) has filed all reports required to be filed by Section 13 or 15(d) of the Securities Exchange Act of 1934 during the preceding 12 months (or for such shorter period that the registrant was required to file such reports), and (2) has been subject to such filing requirements for the past 90 days. Yes ☒ No ☐
Indicate by check mark whether the registrant has submitted electronically every Interactive Data File required to be submitted pursuant to Rule 405 of Regulation S-T (§232.405 of this chapter) during the preceding 12 months (or for such shorter period that the registrant was required to submit such files). Yes ☒ No ☐
Indicate by check mark whether the registrant is a large accelerated filer, an accelerated filer, a non-accelerated filer, a smaller reporting company, or an emerging growth company. See the definitions of “large accelerated filer,” “accelerated filer,” “smaller reporting company,” and “emerging growth company” in Rule 12b-2 of the Exchange Act. | | | | | | | | | | | | | | | | | | | | |
Large accelerated filer ☒ | | Accelerated filer ☐ | | Non-accelerated filer ☐ | | Smaller reporting company ☐ |
Emerging growth company ☐ | | |
If an emerging growth company, indicate by check mark if the registrant has elected not to use the extended transition period for complying with any new or revised financial accounting standards provided pursuant to Section 13(a) of the Exchange Act. ☐
Indicate by check mark whether the registrant has filed a report on and attestation to its management’s assessment of the effectiveness of its internal control over financial reporting under Section 404(b) of the Sarbanes-Oxley Act (15 U.S.C. 7262(b)) by the registered public accounting firm that prepared or issued its audit report. Yes ☒ No ☐
If securities are registered pursuant to Section 12(b) of the Act, indicate by check mark whether the financial statements of the registrant included in the filing reflect the correction of an error to previously issued financial statements. ☐
Indicate by check mark whether any of those error corrections are restatements that required a recovery analysis of incentive-based compensation received by any of the registrant's executive officers during the relevant recovery period pursuant to §240.10D-1(b). ☐
Indicate by check mark whether the registrant is a shell company (as defined in Rule 12b-2 of the Act). Yes ☐ No ☒
The aggregate market value of the registrant's common stock at June 30, 20212023 (based upon the closing sale price of the common stock on the New York Stock Exchange on June 30, 2021)2023) held by those persons deemed by the registrant to be non-affiliates was approximately $21.7$24.4 billion. Shares of the registrant's common stock held by each executive officer and director and by each entity or person that, to the registrant's knowledge, owned 10% or more of the registrant's outstanding common stock as of June 30, 2021 have been excluded from this number in that these persons may be deemed affiliates of the registrant. This determination of possible affiliate status is not necessarily a conclusive determination for other purposes.
There were 255,002,771256,650,147 shares of common stock outstanding as of February 24, 2022.16, 2024.
DOCUMENTS INCORPORATED BY REFERENCE
Portions of the registrant's Definitive Proxy Statement relating to its 20222024 Annual Meeting of Shareholders are incorporated by reference in Part III, Items 10-14 of this Annual Report on Form 10-K as indicated herein.
ROYAL CARIBBEAN CRUISES LTD.
TABLE OF CONTENTS | | | | | | | | | | | | | | |
| | | | Page |
| | | | |
| Item 1. | | Business | | |
| | | | |
| | | | |
| | | | |
| | | | |
| | | | |
| | | | |
| | | | |
| | | | |
| | Reserved | | | | |
| | | | |
| | | | |
| | | | |
| | | | |
| | | | |
| | | | |
| | | | |
| | | | |
| | | | |
| | | | |
| | | | |
| | | | |
| | | | |
| | | | |
| | | | |
| | | | |
| | |
PART I
As used in this Annual Report on Form 10-K, the terms “Royal Caribbean,” "Royal Caribbean Group," the “Company,” “we,” “our” and “us” refer to Royal Caribbean Cruises Ltd. and, depending on the context, Royal Caribbean Cruises Ltd.’s consolidated subsidiaries and/or affiliates. The terms “Royal Caribbean International,” “Celebrity Cruises,” and “Silversea Cruises” refer to our wholly owned global cruise brands. Throughout this Annual Report on Form 10-K, we also refer to our partner brands in which we hold an ownership interest, including “TUI Cruises,” and “Hapag-Lloyd Cruises.” However, because these partner brands are unconsolidated investments, our operating results and other disclosures herein do not include these brands unless otherwise specified. In accordance with cruise vacation industry practice, the term “berths” is determined based on double occupancy per cabin even though many cabins can accommodate three or more passengers.
This Annual Report on Form 10-K also includes trademarks, trade names and service marks of other companies. Use or display by us of other parties’ trademarks, trade names or service marks is not intended to and does not imply a relationship with, or endorsement or sponsorship of us by, these other parties other than as described herein.
Item 1. Business.
General
We are one of the leading cruise companies in the world. We controlown and operate three global cruise brands: Royal Caribbean International, Celebrity Cruises and Silversea Cruises (collectively, our "Global Brands"). We also own a 50% joint venture interest in TUI Cruises GmbH ("TUIC"), thatwhich operates the German brands TUI Cruises and Hapag-Lloyd Cruises (collectively, our "Partner Brands"). We account for our investments in our Partner Brands under the equity method of accounting. Together, our Global Brands and our Partner Brands operatehave a combined totalfleet of 6165 ships in the cruise vacation industry with an aggregate capacity of approximately 140,855157,575 berths as of December 31, 2021.
2023. Our ships operate onoffer a selection of worldwide itineraries that call on approximatelymore than 1,000 destinations on all seven continents. In addition to our headquarters in Miami, Florida, we have offices and a network of international representatives around the world, which primarily focus on sales and market development.
We compete principally by operating valued brands that offer exceptional service provided by our crew and on the basis of innovation and quality of ships, variety of itineraries, choice of destinations and price. We believe that our commitment to build state-of-the-art ships and to invest in the maintenance and upgrade of our fleet to, among other things, incorporate many of our latest signature innovations, allows us to continue to attract new and loyal repeat guests.
Royal Caribbean was founded in 1968 as a partnership. Its corporate structure has evolved over the years and, the current parent corporation, Royal Caribbean Cruises Ltd., was incorporated on July 23, 1985 in the Republic of Liberia under the Business Corporation Act of Liberia.
COVID-19
Return to Healthy Sailing
We have restarted our global cruise operations in a phased manner, following our voluntary suspension of global cruise operations that commenced in March of 2020 in response to the COVID-19 pandemic. By the end of December 2021, we operated 50 of our Global and Partner Brand ships, representing over 85% of our capacity, and we have carried approximately 1.3 million guests since we resumed operations.
Our return to service efforts incorporate our enhanced health and safety protocols, and the requirements of regulatory agencies, which has resulted in reduced guest occupancy, modified itineraries and vaccination protocols. We experienced service disruptions and cancelled several sailings in the first quarter of 2022 due to the impact from the Omicron variant ("Omicron"). Service disruptions have abated as COVID-19 cases have declined. Despite the service disruptions and cancellations, we believe the overall trajectory of our return to service remains unchanged. We expect that by the end of the first quarter of 2022, 53 out of 62 ships, including Wonder of the Seas, which was delivered in January 2022, will have been brought back to service. Additionally, we expect that the rest of the fleet will return to operations before the summer season. See Part II. Item 7. Management's Discussion and Analysis - Critical Accounting Policies and Estimates and Recent Developments: COVID-19, and Note 1. General to our consolidated financial statements under Item 8. Financial Statements and Supplementary Data for further details on the impact of COVID-19 on our financial condition and results of operations.
Our Global Brands
Our Global Brands include Royal Caribbean International, Celebrity Cruises, and Silversea Cruises. We believe our Global Brands possess the versatility to enter multiple cruise market segments within the cruise vacation industry. Although each of our Global Brands has its own marketing style, as well as ships and crews of various sizes, the nature of the products sold and services delivered by our Global Brands share a common base (i.e., the sale and provision of cruise vacations). Our Global Brands also offer similar itineraries as well as similar cost and revenue components. The itineraries of our Global Brands are subject to the phased resumption of our operations and local restrictions. In addition, our Global Brands have historically sourced passengers from similar markets around the world and operated in similar economic environments with a significant degree of commercial overlap. As a result, we strategically manage our Global Brands as a single business with the ultimate objective of maximizing long-term shareholder value.
Royal Caribbean International
Royal Caribbean International is the world's largest cruise brand. The brand competes in both the contemporary family market and premium segments of the cruise vacation industry and appealsappealing to both families with children of all ages as well as bothand older and younger couples. Royal Caribbean International offers cruises and land destinations that generally feature a casual ambiance, as well as a variety of activities and entertainment venues. We believe that the quality of the Royal Caribbean
International brand allows it to achieve market coverage that is among the broadest of any of the major cruise brands in the cruise vacation industry. Royal Caribbean International’s strategy is to attract an array of vacationing guests by offering a wide variety of itineraries to destinations worldwide, including Alaska, Asia, Australia, the Bahamas, Bermuda, Canada, the Caribbean, Europe, the Panama Canal and New Zealand, with cruise lengths generally ranging from onetwo to 2518 nights. Royal Caribbean International offers multiple innovative options for onboard dining, entertainment and other onboard activities. Because of the brand’s ability to deliver extensive and innovative product offerings at an excellent value to consumers, we believe Royal Caribbean International is well positioned to attract new consumers to cruising and to continue to bring loyal repeat guests back for their next vacation.
Royal Caribbean International operates 2526 ships with an aggregate capacity of approximately 88,40094,100 berths. Additionally, as of December 31, 2021,2023, Royal Caribbean International had fivethree ships on order with an aggregate capacity of approximately 28,200 berths, which consisted of16,900 berths. The ships on order include two Oasis-classIcon-class ships, and the first three ships of a new generation, known as the Icon-class ships. The two Oasis-class ships include WonderStar of the Seas,and the third Icon-class ship, which wasare expected to be delivered in January of 2022,2025 and 2026, respectively, and our sixth Oasis-class ship, Utopia of the Seas, which is expected to be delivered in the second quarter of 2024. The Icon-class ships include Icon of the Seas, which is expected to be delivered in the third quarter of 2023, and the second and third Icon-class ships, which are expected to be delivered in the second quarters of 2025 and 2026, respectively.
The expected delivery dates for all of our ships on order are subject to change in the event of shipyard construction delays. See Part I. Item 1A. Risk Factors for further discussion on the impact of COVID-19 on shipyard operations.
Celebrity Cruises
Celebrity Cruises is positioned within the luxurypremium segment of the cruise vacation industry. Celebrity Cruises’ strategy is to target affluent consumers by delivering a destination-rich experience on upscale ships that offer, among other things, luxuriousexcellent food and drink, elevated hospitality, world-class spaces and accommodations, refined design-forward spaces, world-class service and culinary excellence.live entertainment. Celebrity Cruises offers a range of itineraries to destinations, including Alaska, Asia, Australia, Bermuda, Canada, the Caribbean, Europe, the Galapagos Islands, Hawaii, New Zealand, the Panama Canal and South America, with cruise lengths ranging from twothree to 18 nights.
Celebrity Cruises operates 1416 ships with an aggregate capacity of approximately 29,21535,715 berths. Additionally, as of December 31, 2021,2023, Celebrity Cruises had two shipsone Edge-class ship on order, Celebrity Xcel, with an aggregate capacity of approximately 6,500 berths. These ships include two Edge-class ships, Celebrity Beyond and Celebrity Ascent,3,250 berths, which areis expected to be delivered in the second quarter of 2022 and in the fourth quarter of 2023, respectively. In addition, we have an agreement in place with Chantiers de l’Atlantique to build an additional Edge-class ship with capacity of approximately 3,250 berths, estimated for delivery in 2025, which is contingent upon completion of certain conditions precedent and financing.2025.
Silversea Cruises
Silversea Cruise Holding Ltd. ("Silversea Cruises")Cruises is an ultra-luxury and expedition cruise line with smaller ships, high standards of accommodations, fine dining, personalized service and exotic itineraries. Silversea Cruises delivers distinctive destination experiences by visiting unique and remote destinations, including the Galapagos Islands, Antarctica and the Arctic with cruise itineraries generally ranging from five to 2524 nights.
Silversea Cruises operates ten11 ships, with an aggregate capacity of approximately 3,950 berths, including the brand's newest4,770 berths. As of December 31, 2023, Silversea Cruises had on order one Evolution-class ship, Silver DawnRay, which was delivered in the fourth quarter of 2021 and is expected to commence revenue generating voyages in the second quarter of 2022. Additionally, as of December 31, 2021, Silversea Cruises had two ships on order with an aggregate capacity of approximately 1,460 berths. The Evolution-class ships are730 berths, which is expected to be delivered in the second quarters of 2023 and 2024, respectively.2024.
Azamara
Effective March 19, 2021, we sold our wholly-owned brand, Azamara Cruises ("Azamara"), including its three-ship fleet and associated intellectual property, to Sycamore Partners for $201 million, before closing adjustments. The sale of Azamara does not represent a strategic shift that will have a major effect on our operations and financial results, as we continue to provide similar itineraries to and source passengers from the markets served by the Azamara business.
Our Partner Brands
Our Global Brands are complemented by our interest in TUIC, our 50%-owned joint venture that operates the German brands TUI Cruises and Hapag-Lloyd Cruises (collectively, our "Partner Brands").
TUIC is a joint venture owned 50% by us and 50% by TUI AG, a German tourism company, which is designed to serve the contemporary and premium segments of the German cruise market by offering products tailored for German
guests. All onboard activities, services, shore excursions and menu offerings are designed to suit the preferences of this target market.
TUI Cruises operates sevensix ships, with an aggregate capacity of approximately 17,70015,800 berths. Additionally, as of December 31, 2021,2023, TUI Cruises had three ships on order with an aggregate capacity of approximately 11,100 berths, thattwo of these ships are expected to be delivered in the second quarter of 2024, the fourth quarter of 2024 and the second quarter of 2026, respectively.third ship is expected to be delivered in 2026.
Hapag-Lloyd Cruises operates two luxury liners and three smaller expedition ships, with an aggregate capacity of approximately 1,590 berths. Hapag-Lloyd Cruises did not have any ships on order as of December 31, 2021. 2023.
Refer to Note 77.. Investments and Other Assets to our consolidated financial statements under Item 8. Financial Statements and Supplementary Data for further details.
Industry
The cruising industry has been considered a well-established vacation sector in the North American, European and Australian markets and a developing sector in several other emerging markets. As the industry proceeds with its resumption of operations, weWe believe that cruising will continue to be a popular vacation choice in the long-term due to its inherent value, extensive itineraries and variety of shipboard and shoreside activities.
The Company and other industry participants voluntarily suspended operations in March of 2020 and gradually resumed full operations starting in the second half of 2021 resulting in a limited numberthrough the first half of operated cruises in 2020 and 2021.2022. As a result, representativecomparative information ofregarding market penetration and other indicators areis not meaningful for 2020, 2021, and 2021.2022. For the five year period prior to 2020, industry data indicated that market penetration rates were still low and that a significant portion of cruise guests carried in those years were first-time cruisers. We believe this presents an opportunity for operational and financial recovery and long-term growth and a potential for the industry as it continues to resume operations.increased profitability.
The following table details industryIndustry market penetration rates for North America, Europe and Asia/Pacific for the five years prior to the impact of COVID-19 in 2020, computed(computed based on the number of annual cruise guests as a percentage of the total population:population) grew from 3.36% to 3.89% for North America, from 1.25% to 1.41% for Europe, and from 0.08% to 0.20% for Asia/Pacific during the five year period from 2015 through 2019. During 2023, industry market penetration rates were 3.55% for North America, 1.07% for Europe, and 0.04% for Asia/Pacific. The penetration rates in 2023 show the recovery and growth potential in the markets most served by the industry.
| | | | | | | | | | | | | | | | | | | | |
Year (1) | | North America(2)(3) | | Europe(2)(4) | | Asia/Pacific(2)(5) |
| 2015 | | 3.36% | | 1.25% | | 0.08% |
| 2016 | | 3.43% | | 1.23% | | 0.11% |
| 2017 | | 3.56% | | 1.28% | | 0.15% |
| 2018 | | 3.87% | | 1.38% | | 0.16% |
| 2019 | | 3.89% | | 1.41% | | 0.20% |
The following table details the growth in global weighted average berths and the percentage of North American, European and Asia/Pacific cruise guests for 2023, 2022 and for each of the five years from 2015 through 2019 (in thousands, except berth data):
| | | | | | | | | | | | | | | | | | | | | | | | | | | | | | | | | | | | | | | | | | | | |
| | Supply of Berths | | Industry Cruise Guests |
Year (1) | | Weighted-Average Global Supply(2) | | Royal Caribbean Group(3) | | Global (2) | | North American (2)(4) | | Europe(2)(5) | | Asia/Pacific (2)(6) | | Other (2) |
| 2015 | | 469,000 | | 112,700 | | 23,000 | | 52% | | 29% | | 14% | | 5% |
| 2016 | | 493,000 | | 123,270 | | 24,000 | | 51% | | 27% | | 19% | | 3% |
| 2017 | | 515,000 | | 124,070 | | 26,700 | | 48% | | 25% | | 20% | | 7% |
| 2018 | | 546,000 | | 135,520 | | 28,500 | | 49% | | 26% | | 20% | | 5% |
| 2019 | | 579,000 | | 141,570 | | 30,000 | | 47% | | 25% | | 24% | | 4% |
| 2022 | | 634,000 | | 150,005 | | 13,100 | | 65% | | 29% | | 2% | | 4% |
| 2023 | | 650,000 | | 157,575 | | 21,200 | | 63% | | 27% | | 6% | | 4% |
(1)Historically, we have reported annual comparable information for relevant comparisons to othercomparability across periods. The 2020 suspension of global cruise operations as a result of COVID-19 and the gradual resumption of full operations starting in the second half of 2021 through the first half of 2022 do not allow for a meaningful comparison to prior years' information and, as such, the 2020 and 2021 data has been excluded from this table.
(2)Source: Our estimates are based on a combination of data obtained from publicly available sources including the International Monetary Fund, United Nations, Department of Economic and Social Affairs, Cruise Lines International Association ("CLIA") and G.P. Wild. In addition, our estimates incorporate our own analysis utilizing the same publicly available cruise industry data as a base.
(3)Our estimates include the United States and Canada.
(4)Our estimates include European countries relevant to the industry (most notably: the Nordics, Germany, France, Italy, Spain and the United Kingdom).
(5)Our estimates include Southeast Asia (most notably: Singapore, Thailand and the Philippines), East Asia (most notably: China and Japan), South Asia (most notably: India) and Oceania (most notably: Australia and New Zealand) regions.
The global cruise fleet was served by a weighted average of approximately 579,000 berths during 2019 with approximately 354 ships at the end of 2019. As of December 31, 2021, there were approximately 78 ships on order with an estimated 183,000 berths that are expected to be placed in service in the global cruise market through 2027, not taking into account ships taken out of service or ordered during these periods. Cruise ships in the industry were taken out of service at an accelerated rate and new ship orders were deferred due to global cruise operation restrictions in 2020 and limited sailings in 2021 resulting from the COVID-19 pandemic. The global cruise industry carried approximately 30.0 million cruise guests in 2019 and approximately 28.5 million in 2018.
The following table details the growth in global weighted average berths and the global, North American, European and Asia/Pacific cruise guests for the five years prior to the impact of COVID-19 in 2020 (in thousands, except berth data): | | | | | | | | | | | | | | | | | | | | | | | | | | | | | | | | | | | | | | |
Year (1) | | Weighted-Average Supply of Berths Marketed Globally(2) | | Royal Caribbean Group Total Berths(3) | | Global Cruise Guests(2) | | North American Cruise Guests(2)(4) | | European Cruise Guests(2)(5) | | Asia/Pacific Cruise Guests(2)(6) |
| 2015 | | 469,000 | | 112,700 | | 23,000 | | 12,004 | | 6,587 | | 3,129 |
| 2016 | | 493,000 | | 123,270 | | 24,000 | | 12,274 | | 6,512 | | 4,466 |
| 2017 | | 515,000 | | 124,070 | | 26,700 | | 12,865 | | 6,779 | | 5,415 |
| 2018 | | 546,000 | | 135,520 | | 28,500 | | 14,062 | | 7,343 | | 5,685 |
| 2019 | | 579,000 | | 141,570 | | 30,000 | | 14,246 | | 7,554 | | 7,317 |
(1)Historically, we have reported annual comparable information for relevant comparisons to other periods. The 2020 suspension of global cruise operations as a result of COVID-19 and the gradual resumption of operations in 2021 do not allow for a meaningful comparison to prior years' information and as such the 2020 and 2021 data has been excluded from this table.
(2)Source: Our estimates of the number of global cruise guests and the weighted-average supply of berths marketed globally are based on a combination of data that we obtain from various publicly available cruise industry trade information sources. We use data obtained from Seatrade Insider, Cruise Industry News and company press releases to estimate weighted-average supply of berths and CLIA and G.P. Wild to estimate cruise guest information. For 2023, cruise guest information includes data through the third quarter of 2023. In addition, our estimates incorporate our own analysis utilizing the same publicly available cruise industry data as a base.
(3)Total berths include our berths related to our Global Brands and Partner Brands.Brands as of December 31, 2023.
(4)Our estimates include the United States and Canada.
(5)Our estimates include European countries relevant to the industry (most notably: the Nordics, Germany, France, Italy, Spain and the United Kingdom).
(6)Our estimates include Southeast Asia (most notably: Singapore, Thailand and the Philippines), East Asia (most notably: China and Japan), South Asia (most notably: India) and Oceania (most notably: Australia and New Zealand) regions.
North America
Industry The decrease in Asia/Pacific cruise guests have been primarily sourced from North America, which represented approximately 47% of global cruise guests in 2019. The compound annual growth rate in cruise guests sourced from this market was approximately 4% from 20152019 to 2019.
Europe
Industry cruise guests sourced from Europe represented approximately 25% of global cruise guests in 2019. The compound annual growth rate in cruise guests sourced from this market was approximately 3% from 2015 to 2019.
Asia/Pacific
Industry cruise guests sourced from2023 is partly driven by China remaining closed given its COVID-19 restrictions through the Asia/Pacific region represented approximately 24% of global cruise guests in 2019. The compound annual growth rate in cruise guests sourced from this market was approximately 24% from 2015 to 2019.
Competition
We compete with a number of cruise lines.lines as well as land-based vacation alternatives for consumers’ leisure time. These include resorts (including all-inclusive resorts), hotels, internet-based alternative lodging sites, theme parks, sports, nature and sightseeing destinations. Our principal cruise competitors are Carnival Corporation & plc, which owns, among other brands, Aida Cruises, Carnival Cruise Line, Costa Cruises, Cunard Line, Holland America Line, P&O Cruises, Princess Cruises and Seabourn; Disney Cruise Line; MSC Cruises; Norwegian Cruise Line Holdings Ltd, which owns Norwegian Cruise Line, Oceania Cruises, and Regent Seven Seas Cruises; and Virgin Voyages. Cruise lines also compete with other vacation alternatives such as land-based resort hotels, internet-based alternative lodging sites and sightseeing destinations for consumers’ leisure time. The COVID-19 pandemic-related restrictions and general economic conditions have significantly affected companies within the vacation market which may result in a changed competitive landscape as we continue to return to service.
Operating FocusStrategies
Our principal operating strategies remain consistent with our historical strategies, yet have been affected bymission is to deliver the impact that the COVID-19 pandemic has had, and continues to have, on our Company's operations.best vacation experiences responsibly. We continue to prioritize operating strategies that support the return of our full fleet into operations, the delivery of memorable vacation experiences to our guests, the healthy and safe return of global cruising for guests, crew and the communities visited, and the enhancement of our financial results and liquidity. We strive to execute these strategiesthis mission in a socially and environmentally responsible manner, working with our various business and community partners as we build toward a more sustainable cruise industry.
Our Company's operating focus isstrategies are as follows:
•deliver outstandingthe best vacation experiences responsibly;
•deliver a lifetime of vacations to our guests;customers;
•protect the health, safety and security of our guests and employees;
•support the healthy return of cruising globally along withdeepen our industry partners, including national and local governments and regulators, the communities in which we operate, other cruise companies, shipyards, our guests and trade partners;
•strengthen our consumer engagementcustomer relationships in order to enhance our revenues;increase frequency and repeat booking rates;
•focus on cost efficiency, adequate cash and liquidity, and manage ourstrong balance sheet, with the overall goals of sustaining our operations and being well positioned during our recovery, and, in the long-term, maximizing our return on invested capital and shareholder value;
•protect the environment and communities in which our vessels and organization operate;operate, with a focus on decarbonization;
•invest in our workforce in order to better serve our global guest base and grow our business, and promote gender equality, diversity and inclusion;
•increase the awareness and market penetration of our brands globally;
•strategically invest in our fleet through the upgrade and maintenance of existing ships and the transfer of key innovations, while prudently expanding our fleet with new state-of-the-art cruise ships;
•capitalize on the portability and flexibility of our ships by deploying them into those markets and itineraries that provide opportunities to optimize returns, while continuing our focus on existing key markets;
•provide extraordinary destination experiences and state-of-the-art port facilities to our guests;
•continue to deploy technology capabilities and advanced uses of data and analytics to deliver innovative customer experiences as well as to create operational efficiencies that enhance employee satisfaction;efficiencies; and
•maintain strong relationships with travel advisors, which continue to be the principal industry distribution channel, while enhancing our consumer outreach programs.and e-commerce programs
Safety, security and health policies
We are committed to protecting the health, safety and security of our guests, employees and others working on our behalf. Our efforts in these areas are managed by several departments within the Company that are responsible for maritime safety, global security, environmental stewardship and medical/public health activities; overseen byactivities. We also have a dedicated committee of our Board of Directors, the Safety,
Environment, Sustainability and Health Committee, which is responsible for reviewing and monitoring our overall strategies, policies and programs that impact the safety and health of our board of directorsguests and informed by a Maritime Advisory Board of experts. Refer to the Regulation - Safety and Security Regulations section below for further information.
Support the healthy return of cruising
We continue to work and collaborate with epidemiological and policy experts, health authorities and various governments around the globe to drive a healthy and safe return to cruising for guests, crew and the communities visited. We work in close partnership and communication with our contracted shipyards to work towards a safe and effective shipyard working environment in the midst of COVID-19. Refer to the Regulation - CDC COVID-19 Program for Cruise Ships Operating in U.S. Waters section below for further information.
We have established flexible cruise pricing and booking programs (e.g. Cruise with Confidence, Best Price Guarantee, COVID Protection Policy, and all-inclusive pricing) that present our guests with options and value as we continue our return to service. The travel advisor community has been a vital partner in our success, and we are committed to assist travel advisors during this challenging time with essential financial relief (e.g., the RCL CARES program).crew.
Consumer engagement
We place a strong focus on identifying the needsdelivering a lifetime of vacations and priceless memories for our guests by identifying and creating product features and innovations that our customers value. We are focused on the acquisitiontargeting and targeting ofacquiring high-value guests by better understanding consumer data and insights to create communication strategies that resonate with our target audiences.
We target customers at important consumer decision points throughout their vacation journey and identify underlying needs for which guests value and are willing to pay a premium. We rely onupon and continue to invest in various programs and technologies during the cruise-planning, cruising and after-cruise periods aimed at increasing ticket prices, onboard revenues and occupancy. We have and expect to strategically invest in onboard projectsexperiences on our ships that we believe drive marketability, profitability and improve the guest experience. In addition, we are focused on enhancing our vacation ecosystem by investing in a new travel platform, our loyalty programs and e-commerce capabilities.
Focus on cost efficiency, capital allocation, adequate cash and liquidity and managing ofimproving our balance sheet
We are focused on improving our cost structure to best position us during our recovery. We are leveraging our scale and shifting our resources behind our Royal Caribbean International, Celebrity Cruises and Silversea brands. We continue to focus on liquidity through cash flow optimization and additional financing sources while managing our balance sheet, with the goal of being well positioned during our recovery. Additionally, we agreed with certain of our lenders that we will not pay dividends or engage in stock repurchases until the end of the third quarter of 2022. In the event we declare a dividend or engage in share repurchases, we will need to repay the amounts deferred under our export credit facilities.
We are focused on maintaining a strong liquidity position and a balanced debt maturity profile, while making progress ontowards achieving lower leverage, lower interest expense, and an unsecured balance sheet, lowering interest expense,sheet. For example, during 2023, we amended our revolving credit facility with our key relationship banks to ensure adequate liquidity on a going-forward basis and reducing leverage.additionally, we repaid approximately $4.0 billion of debt. We believe these strategies together with our continued focus on increasing operating income and margin, as well as disciplined capital allocation, enhance our ability to achieve our overall goal of maximizing our return on invested capital and long-term shareholder value.
Protect the environment
We are focused on the environmental health of the marine environment and communities in which we operate
We are focused on the health of the environment and communities in which we operate. This includes reducing SEA the Future is our carbon footprint throughcommitment to sustain the planet, energize the communities we visit, and accelerate innovation to improve our planet. Key programs include our Destination Net Zero strategy our energy and carbon efficiencies included inSave the design of our new capacity, our ongoing energy management program on our existing fleet and the development of new technologies.Waves Program.
Destination Net Zero is our decarbonization strategy that focuses on how to achieveachieving net zero emissions by 2050 and assessing the feasibility of establishing Science-Based Targets. delivering a net zero capable ship by 2035. This strategy also includes reducing our carbon intensity by double digits by 2025, compared to 2019.
Destination Net Zero’s four-pronged approach includes the modernization ofincludes:
•Modernizing our global brands fleet through the introduction ofwith new energy-efficient and alternatively fueled vessels, continuedvessels;
•Continued investment in energy efficiency programs, developmentprograms;
•Development of alternative fuel and alternative power solutions,solutions; and optimized
•Optimized deployment and integration of strategic shore-based supply chains. We are in the early stages of developing
While we continue to refine our roadmap to achieve these goals. It is already clear that such aDestination Net Zero, we know our strategy will require new fuels and technologies that are not available today. ReferCollaboration is imperative to Item 1A. Risk Factors - “Our sustainability activities, including environmental, socialreaching our decarbonization goals. as such, we are partnering with governments, fuel suppliers, shipyards, and governance (ESG) matters, could result in reputational risks, increased coststechnology stakeholders to build and other risks” fortest a discussionsafe and reliable supply of alternative energy sources.
Another example of our commitment to sustaining our planet with key partners is our decades-long Save the risks associatedWaves program, which focuses on waste management techniques and technologies, along with reuse and recycling programs, to reduce the amount of waste produced on our environmental initiatives.
Ourships and divert the remaining waste from landfills. We also have a long-term partnership with the World Wildlife Fund focuses on greenhouse gas reduction strategies,to evaluate ship operations, sustainable sourcing of food supplies, waste management, sustainable destinations and guest education on ocean conservation issues, which supports onboard conservation efforts such as our reduced use of plastics. We are also committed to assessing and managing potential impacts related to our operations in the communities in which we operate.
We also believe in transparent reporting on our environmental and sustainability stewardship, as well as our social and governance efforts,efforts. Our SEA the Future commitment and have annually published a Sustainability Report since 2008. Thisannual sustainability report, the current versionboth of which isare accessible on our corporate website, highlightshighlight our commitment and progress made with regards to those environmental, social and socialgovernance aspects of our business that we believe are most significant to our organization and stakeholders. In addition to providing an overview on our sustainability efforts, the report complies withreferences the guidelines of the Global Reporting Initiative and is aligned with the Sustainable Accounting Standards Board.Boards Industry Standards for Cruise Lines. We continue to advance our reporting following the recommendations of the Task Force on Climate Related Financial Disclosures (TCFD). Our corporate website also providescontains the current version of our reports which provide information about our environmental performance goals and sustainability initiatives. The foregoing information contained on our website is not part of any of these reports and is not incorporated by reference herein or in any other report or document we file with the Securities and Exchange Commission. Refer to the Regulation - Environmental Regulations section below for further information.
Investing in our workforce and promoting equality, diversity and inclusion
We believe that our employees, both shipboard and shoreside, are a critical success factor for our business. We strive to identify, hire, develop, motivate and retain the best employees, who provide our guests with extraordinary vacations. Our ability to attract, engage, and retain key employees has been and will remain critical to our success. Our Talent and Compensation Committee of our Board of Directors oversees the Company's human capital management strategies, including initiatives for talent diversity, equity and inclusion, talent management, and corporate culture.
We focus on providing our employees with a competitive compensation structure, development opportunities, and other personal and professional growth opportunities in order to strengthen and support our human capital. We also select, develop and have strategies to retain high performing leaders to advance the enterprise now and in the future. To that end, we pay special attention to identifying high performing potential leaders and developing bench strength so these leaders can assume leadership roles throughout the organization.
We strive to maintain a work environment that reinforces collaboration, motivation and innovation, and believe that maintaining a strong employee-focused culture is beneficial to the growth and expansion of our business. We foster diversity and inclusion among our broad employee base. Refer to the Human Capital section below for further information.
Global awareness and market penetration
We increase brand awareness and market penetration of our cruise brands in various ways, including the use of communication strategies and marketing campaigns designed to emphasize the qualities of each brand, and to broaden the awareness of the brand, especially among target groups. Our marketing strategies include the use of travel advisors, traditional media, mobile and digital media as well as social media, influencers, our websites, and brand websites.sponsorships. Our brands also engage past and potential guests by collaborating with travel partners and through call centers, international offices and international representatives. In addition, our Global Brands target repeat guests with exclusive benefits offered through their respective loyalty programs.
We sell and market our Global Brands to guests outside of the United States and Canada through the combined efforts of internationally focused internal resources and a network of independent international representatives located throughout the world. While the majority of our guests for our Global Brands come from North America, we also sell and market our cruise brands to guests in countries outside of North America by tailoring itineraries and onboard product offerings to the cultural characteristics and preferences of our international guests. In addition, we explore opportunities that may arise to acquire or develop brands tailored to specific markets.
Prior to the impactDelivery of COVID-19 in 2020, passenger ticket revenues generated by sales originating in countries outside of the United States were approximately 35% of total passenger ticket revenues in 2019,state-of-the-art cruise ships, and 39% in 2018. International guests have grown from approximately 2.5 million in 2015 to approximately 2.6 million in 2019. Refer to Item 1A. Risk Factors - “Conducting business globally may result in increased costs and other risks” for a discussion of the risks associated with our international operations.
Fleetfleet upgrade and maintenance
We place a strong focus on innovation, which we seek to achieve by introducing new concepts on our new ships and continuously making improvements to our existing fleet, through modernization projectssuch as large-scale atriums, double hulls for increased safety, and key technological improvements. Several of these innovations have become signature elements ofadvanced steel structures. We are expanding our brands. For the Royal Caribbean International brand, we introduced the “Royal Promenade” (a boulevard with shopping, dininginnovation efforts to cover multiple fronts, including naval and entertainment venues) and interior balconies on the Oasis class ships and a two-level family suite on Symphony of the Seas. For the Celebrity Cruises brand, we enhanced many of the brand'sarchitectural design, guest facing features, through the introduction of the Solstice class ships. More recently, with the introduction of Celebrity Edge, we introduced the "Magic Carpet" (a cantilevered, floating platform that reaches a height of 13 stories above sea level and can serve as a dining venue, full bar and platform for live music) and newly designed staterooms with an "Infinite Veranda" where, with the touch of a button, the veranda becomes part of the entire living space.
As part of the newbuild and modernization programs, we also seek to bring innovations in the areas of safety, reliability and energy efficiency, to our fleet.sustainability, and safety.
We are committed to building state-of-the-art ships at a moderate growth rate and we believe our success in this area provides us with a competitive advantage. Our newer vessels traditionally generate higher revenue yield premiums and are more efficient and environmentally friendly to operate than older vessels.
In 2023, we introduced three new vessels to our fleet, including Royal Caribbean International’s new flagship – Icon of the Seas, Celebrity Cruises – Celebrity Ascent, and Silversea Cruises – Silver Nova. Each of these vessels represent the latest hardware for their respective brands and both Icon of the Seas and Silver Nova are the first vessels of a new class. For Royal Caribbean International, new features on Icon of the Seas include a dedicated family neighborhood called “Surfside”, a pool deck featuring the largest swimming pool and waterpark at sea, and the “Aquadome” showcasing the tallest waterfall at sea in an 82-foot-tall dome. For Celebrity Cruises, Celebrity Ascent represents an evolution of Celebrity Beyond and builds on the innovation that the Edge series of ships have brought to market. For Silversea, Silver Nova is amongst our most environmentally friendly and energy efficient ships to date.
As of December 31, 2021,2023, our Global Brands and Partner Brands have 128 ships on order. Refer to the Operationssection below for further information on our ships on order. As we further develop our Newbuild program, we continue to utilize each vessel as an opportunity to pilot new technology towards Destination Net Zero.
In addition, we regularly evaluate opportunities to order new ships, purchase existing ships or sell ships in our current fleet while ensuring that we remain focused on the returns we generate on invested capital and maintaining a high level of discipline on capital spending and operating leverage.
During 2021, we sold the Azamara brand, which included three vessels: Azamara Journey, Azamara Quest and Azamara Pursuit.
Markets and itineraries
In an effort to penetrate untapped markets, diversify our consumer base and respond to changing economic and geopolitical market conditions, we continue to seek opportunities to deploy ships to new, and stronger markets and itineraries throughout the world. The portability of our ships allows us to deploy our ships to meet demand within our existing and new cruise markets. We make deployment decisions generally 18 to 2832 months in advance, with the goal of optimizing the overall profitability of our portfolio. Additionally, the infrastructure investments we have made to create a flexible global sourcing model have made our brands relevant in a number of markets around the world, which allows us to be opportunistic and source the highest yielding guests for our itineraries.
Our ships offer a wide selection of itineraries that call on approximatelyover 1,000 destinations in over 120 countries, spanning across all seven continents. We are focused on maximizing long-term shareholder returns by operating in established markets while growing our presence in developing markets. New capacity has allowed usour brands to expand into new markets and itineraries. Our brands have expanded their mix of itineraries while strengthening our abilityin an effort to further penetrate the Asian and Australian markets. The acquisition of Silversea Cruises added more than 500 new destinations allowing us to expand and enhance our selection of exotic itineraries.
We have developed new and attractive itineraries that have allowed us to resume our operations on a staggered basis and in consideration of local restrictions. We are also responding quickly toaddress changes in market demand, as observed in our new bookings.demand.
Destination experiences and port facilities
In order to provide unique destination experiences to our guests, we have investedand continue to invest in our private land destinations. In 2018, we announcedOur Perfect Day Island Collection anrepresents our initiative to develop a series of private island destinations around the world.in
key markets. The first island in the collection, Perfect Day at CocoCay, opened in Spring 2019 and includes a wide range of attractions, such as a full water park, zip line course, freshwater pools, helium balloon ride, splash pads and a beach club. As a resultIn January 2024, we completed the expansion of the operational disruptions caused by the COVID-19 pandemic and in an effort to bolster our liquidity, we have delayed previously announced Perfect Day site openings and are reassessing their timing as well asat CocoCay with the timingdelivery of Hideaway Beach, an adults-only experience. Additionally, our Royal Beach Club offering portfolio.will offer an exclusive and branded experience at high volume ports. The first Royal Beach Club is expected to open in 2025 in Nassau, Bahamas. We are also reassessing our investment in other destinations.continue to evaluate opportunities to develop additional destinations across the globe.
In an effort to secure desirable berthing facilities for our ships, and to provide new or enhanced cruise destinations for our guests, we have actively assisted or invested in the development or enhancement of certain port facilities and infrastructure, including mixed-use commercial properties, located in strategic ports of call.call, and reduction of our environmental impacts. For instance, in March 2023 we closed a new homeportpartnership agreement with iCON Infrastructure Partners VI, L.P. ("iCON"). This partnership will own, develop, and manage cruise terminal facilities and infrastructure in key ports of approximately 170,000 square feet was completed at Port Miamicall, initially including several development projects in Miami, Florida in 2018. We expect that our new homeport cruise terminal in Galveston, Texas will be completed in 2022.Italy and Spain.
Generally, we collaborate with local, private or governmental entities by providing management and/or financial assistance and often enter into long-term port usage arrangements. Our participation in these efforts is most often accomplished via investments with the relevant government authority and/or various other strategic partnerships established to develop and/or operate the port facilities, by providing direct development and management expertise or in certain limited circumstances, by providing direct or indirect financial support. In exchange for our involvement, we generally secure preferential berthing rights for our ships.
Technological capabilities
Technology is a pervasive part of virtually every business process we use to support our strategic focusoperating strategies and provide a quality experience to our customers before, during and after their cruise. Technology also plays a critical role in the
measures and protocols that we have developed and willvacation. We continue to develop tools that enhance our commercial capabilities and support our goal of deepening our customer relationships. We are focused on enhancing our guests' digital experience and growing onboard revenue, by making it easier for our guests to mitigate COVID-19 onplan and maximize their next vacation through our cruise ships.websites and mobile applications. For example, through the deploymentwe recently enabled booking a cruise in our mobile applications, built a loyalty hub to provide easy to view status, benefits and ways to earn rewards and a video library to showcase our family of our innovative electronic safety drill ("Muster 2.0") program, we have added convenience, allowed for physical distancing, and improved our guests experience regarding the mandatory safety briefing. Additionally, through the in-app messaging technology we are enhancing guest check-in to support education, testing and screening information prior to embarkation, and to support onboard detection contingency scenarios and protocols, and most importantly promote the health and safety of guests and crew.brands.
We have continued to integrate digital capabilities into our operations and have increased our focus in bringing in data analytics and artificial intelligence into our processes. For example, we continueprocesses to develop tools to enhance our guests' digital experience and grow onboardprovide better insights for revenue by making it easier for our guests to plan and maximize their next vacation through our apps. Also, we have continued the deployment of our innovative guest journey solutions across our fleet from online check-in to port embarkation to onboard cruise experience. At the same time, we are investing in shipboard operational technology to facilitate casino play, hotel maintenance,management as well as in how to model our maintenance or operational actions. We have also partnered with SpaceX to launch Starlink, the optimization of marine maintenance.next generation in shipboard connectivity, unlocking an improved guest experience. In concert with our destination focus, our island technology solutions are now enabling our guests to remain connected with WiFi access, ordercharge food and beveragebeverages as well as take advantage of all the island based activities with the same ease as onboard our ships.
Investments in our core platforms, as well as the trade and direct distribution channels, are delivering the benefit of more modernized solutions with scalability and faster self-service response times while also deploying new features such as flight packages and additional promotional offer capabilities.
Cyber security and data privacy are an ongoing focus, and we have made and will continue to make investments to protect our customer data, intellectual property and global operations. Refer to Item 1A. Risk Factors - “We are exposed to cyber security attacks and data breaches and the risks and costs associated with protecting our systems and maintaining data integrity and security” for a discussion of the risks associated with cyber security.
Travel advisor support, and consumer outreach, and e-commerce
Travel advisors continue to be a significant sourcing channel of ticket salesrevenues for our ships. We believe in the value of this distribution channel and invest in maintaining strong relationships with our travel partners. To accomplish this goal, we seek to maintain competitive commission rates and incentive structures with the marketplace. We continuously work with travel advisors to sell upgrades and add-ons such as air and pre-cruise purchases to improve the retention and profitability of the channel. We provide brand dedicated sales representatives who serve as consultants to our travel partners. We also provide trained customer service representatives, call centers and online training tools.
At the onset of the COVID-19 pandemic, we launched the RCL CARES program which provided dedicated financial guidance as travel advisors navigated government relief benefits, including small business loans and the Paycheck Protection Program. As part of the RCL Cares program, we also launched our Pay it Forward program in February 2021, which made available interest free commercial loans for qualifying travel advisors to begin their recovery efforts.
In addition, weWe continue to operate our Consumer Outreach department, which provides consumers 24-hour access to our vacation planners and customer service agents in our call centers. In addition, we maintain andcenters, as well as invest in our websites, including mobile applications and mobile websites. We enable our guests to communicate and book with us through various channels such as phone, web, chat, text message, and/or email. Additionally, we continue to advance our e-commerce capabilities and the vacation shopping experience for our guests. In addition to offering a simplified booking experience, we leverage the
We also have an Onboard Cruise Sales department
mobile application for onboard experiences such as WiFi, beverages, shore excursions, and specialty dining – enabling guests to help guests book their next cruise vacations while onboard our ships.vacation end-to-end.
Guest Services
We offer to handle virtually all travel aspects related to guest reservations and transportation, including arrangingfacilitating guest pre- and post-hotel stay arrangements and air transportation.
Royal Caribbean International, Celebrity Cruises and Silversea Cruises offer recognition and status upgrades to their guests through their loyalty programs, Crown & Anchor Society, Captain’s Club, and Venetian Society, respectively, to encourage repeat business. Crown & Anchor Society has approximately 16.519.2 million members worldwide. Captain’s Club and Venetian Society have approximately 5.16.1 million members combined worldwide. Members are recognized through increasing membership status by accumulating cruise points or credits, depending on the brand, which may be redeemed on future sailings. Members are awarded points or credits in proportion to the number of cruise days and stateroom category. The loyalty programs provide tiers of membership benefits which entitle guests to upgraded experiences and recognition relative to the status achieved once the guests have accumulated the number of cruise points or credits specified for each tier. In addition, upon achieving a certain level of cruise points or credits, the Crown & Anchor Society and Captain’s Club members benefit from reciprocal membership benefits across all of ourbetween the loyalty programs. Examples of the benefits available under our loyalty programs include, but are not limited to, priority ship embarkation, priority waitlist for shore excursions, complimentary laundry service,
complimentary Internet, booklets with onboardinternet, digital discount offers,vouchers, upgraded bathroom amenities, privatereserved seating on the pool deck, ship tours and, in the case of our most loyal guests who have achieved the highest levels of cruise points or credits, complimentary cruise days.cruises. We regularly work to enhance each of our loyalty programs by adding new features and amenities in order to reward our repeat guests.
Operations
Cruise Ships and Itineraries
As of December 31, 2021,2023, our Global Brands and Partner Brands collectively operated 6164 ships with a selection of worldwide itineraries that call on approximatelymore than 1,000 destinations.destinations in over 120 countries.
The following table presents summary information concerning ships that we expect will be in our fleet in 20222024 under our Global Brands and Partner Brands.
. | | Ship | Ship | | Year Ship
Built | | Year Ship In Service or Delivered, if after 2021(1) | | Approximate
Berths | |
| Ship | |
| Ship | |
| Royal Caribbean International | Royal Caribbean International | | | | | | | |
| Royal Caribbean International | |
| Royal Caribbean International | |
| Utopia of the Seas | |
| Utopia of the Seas | |
| Utopia of the Seas | |
Icon of the Seas (1) | |
Icon of the Seas (1) | |
Icon of the Seas (1) | |
| Wonder of the Seas | |
| Wonder of the Seas | |
| Wonder of the Seas | Wonder of the Seas | | 2022 | | 2022 | | 5,700 | |
| Odyssey of the Seas | Odyssey of the Seas | | 2021 | | 2021 | | 4,200 | |
| Odyssey of the Seas | |
| Odyssey of the Seas | |
| Spectrum of the Seas | |
| Spectrum of the Seas | |
| Spectrum of the Seas | Spectrum of the Seas | | 2019 | | 2019 | | 4,150 | |
| Symphony of the Seas | Symphony of the Seas | | 2018 | | 2018 | | 5,500 | |
| Symphony of the Seas | |
| Symphony of the Seas | |
| Harmony of the Seas | |
| Harmony of the Seas | |
| Harmony of the Seas | Harmony of the Seas | | 2016 | | 2016 | | 5,500 | |
| Ovation of the Seas | Ovation of the Seas | | 2016 | | 2016 | | 4,150 | |
| Ovation of the Seas | |
| Ovation of the Seas | |
| Anthem of the Seas | |
| Anthem of the Seas | |
| Anthem of the Seas | Anthem of the Seas | | 2015 | | 2015 | | 4,150 | |
| Quantum of the Seas | Quantum of the Seas | | 2014 | | 2014 | | 4,150 | |
| Quantum of the Seas | |
| Quantum of the Seas | |
| Allure of the Seas | |
| Allure of the Seas | |
| Allure of the Seas | Allure of the Seas | | 2010 | | 2010 | | 5,500 | |
| Oasis of the Seas | Oasis of the Seas | | 2009 | | 2009 | | 5,600 | |
| Oasis of the Seas | |
| Oasis of the Seas | |
| Independence of the Seas | |
| Independence of the Seas | |
| Independence of the Seas | Independence of the Seas | | 2008 | | 2008 | | 3,850 | |
| Liberty of the Seas | Liberty of the Seas | | 2007 | | 2007 | | 3,800 | |
| Liberty of the Seas | |
| Liberty of the Seas | |
| Freedom of the Seas | |
| Freedom of the Seas | |
| Freedom of the Seas | Freedom of the Seas | | 2006 | | 2006 | | 3,950 | |
| Jewel of the Seas | Jewel of the Seas | | 2004 | | 2004 | | 2,200 | |
| Jewel of the Seas | |
| Jewel of the Seas | |
| Mariner of the Seas | |
| Mariner of the Seas | |
| Mariner of the Seas | Mariner of the Seas | | 2003 | | 2003 | | 3,350 | |
| Serenade of the Seas | Serenade of the Seas | | 2003 | | 2003 | | 2,150 | |
| Serenade of the Seas | |
| Serenade of the Seas | |
| Navigator of the Seas | Navigator of the Seas | | 2002 | | 2002 | | 3,400 | |
| Brilliance of the Seas | | 2002 | | 2002 | | 2,150 | |
| Adventure of the Seas | | 2001 | | 2001 | | 3,350 | |
| Radiance of the Seas | | 2001 | | 2001 | | 2,150 | |
| Explorer of the Seas | | 2000 | | 2000 | | 3,300 | |
| Voyager of the Seas | | 1999 | | 1999 | | 3,450 | |
| Vision of the Seas | | 1998 | | 1998 | | 2,050 | |
| Enchantment of the Seas | | 1997 | | 1997 | | 2,300 | |
| Rhapsody of the Seas | | 1997 | | 1997 | | 2,050 | |
| Grandeur of the Seas | | 1996 | | 1996 | | 2,000 | |
| Celebrity Cruises | | | | | |
| Celebrity Beyond | | 2022 | | 2022 | | 3,250 | |
| Celebrity Apex | | 2020 | | 2020 | | 2,900 | |
| Celebrity Flora | | 2019 | | 2019 | | 100 | |
| Celebrity Edge | | 2018 | | 2018 | | 2,900 | |
| Celebrity Reflection | | 2012 | | 2012 | | 3,050 | |
| Navigator of the Seas | |
| Navigator of the Seas | |
| | Ship | Ship | | Year Ship
Built | | Year Ship In Service or Delivered, if after 2021(1) | | Approximate
Berths | |
| Ship | |
| Ship | |
| Brilliance of the Seas | |
| Brilliance of the Seas | |
| Brilliance of the Seas | |
| Adventure of the Seas | |
| Adventure of the Seas | |
| Adventure of the Seas | |
| Radiance of the Seas | |
| Radiance of the Seas | |
| Radiance of the Seas | |
| Explorer of the Seas | |
| Explorer of the Seas | |
| Explorer of the Seas | |
| Voyager of the Seas | |
| Voyager of the Seas | |
| Voyager of the Seas | |
| Vision of the Seas | |
| Vision of the Seas | |
| Vision of the Seas | |
| Enchantment of the Seas | |
| Enchantment of the Seas | |
| Enchantment of the Seas | |
| Rhapsody of the Seas | |
| Rhapsody of the Seas | |
| Rhapsody of the Seas | |
| Grandeur of the Seas | |
| Grandeur of the Seas | |
| Grandeur of the Seas | |
| Celebrity Cruises | |
| Celebrity Cruises | |
| Celebrity Cruises | |
| Celebrity Ascent | |
| Celebrity Ascent | |
| Celebrity Ascent | |
| Celebrity Beyond | |
| Celebrity Beyond | |
| Celebrity Beyond | |
| Celebrity Apex | |
| Celebrity Apex | |
| Celebrity Apex | |
| Celebrity Flora | |
| Celebrity Flora | |
| Celebrity Flora | |
| Celebrity Edge | |
| Celebrity Edge | |
| Celebrity Edge | |
| Celebrity Reflection | |
| Celebrity Reflection | |
| Celebrity Reflection | |
| Celebrity Silhouette | |
| Celebrity Silhouette | |
| Celebrity Silhouette | Celebrity Silhouette | | 2011 | | 2011 | | 2,900 | |
| Celebrity Eclipse | Celebrity Eclipse | | 2010 | | 2010 | | 2,850 | |
| Celebrity Eclipse | |
| Celebrity Eclipse | |
| Celebrity Equinox | |
| Celebrity Equinox | |
| Celebrity Equinox | Celebrity Equinox | | 2009 | | 2009 | | 2,850 | |
| Celebrity Solstice | Celebrity Solstice | | 2008 | | 2008 | | 2,850 | |
| Celebrity Solstice | |
| Celebrity Solstice | |
| Celebrity Xploration | |
| Celebrity Xploration | |
| Celebrity Xploration | Celebrity Xploration | | 2007 | | 2016 | | 15 | |
| Celebrity Constellation | Celebrity Constellation | | 2002 | | 2002 | | 2,200 | |
| Celebrity Constellation | |
| Celebrity Constellation | |
| Celebrity Summit | |
| Celebrity Summit | |
| Celebrity Summit | Celebrity Summit | | 2001 | | 2001 | | 2,200 | |
| Celebrity Infinity | Celebrity Infinity | | 2001 | | 2001 | | 2,150 | |
| Celebrity Infinity | |
| Celebrity Infinity | |
| Celebrity Xpedition | |
| Celebrity Xpedition | |
| Celebrity Xpedition | Celebrity Xpedition | | 2001 | | 2004 | | 50 | |
| Celebrity Millennium | Celebrity Millennium | | 2000 | | 2000 | | 2,200 | |
| Celebrity Millennium | |
| Celebrity Millennium | |
| Silversea Cruises | Silversea Cruises | | |
Silver Dawn(3) | | 2021 | | 2022 | | 600 | |
| Silversea Cruises | |
| Silversea Cruises | |
| Silver Ray | |
| Silver Ray | |
| Silver Ray | |
| Silver Nova | |
| Silver Nova | |
| Silver Nova | |
| Silver Endeavour | |
| Silver Endeavour | |
| Silver Endeavour | |
| Silver Dawn | |
| Silver Dawn | |
| Silver Dawn | |
| Silver Origin | |
| Silver Origin | |
| Silver Origin | Silver Origin | | 2020 | | 2020 | | 100 | |
| Silver Moon | Silver Moon | | 2020 | | 2020 | | 600 | |
| Silver Moon | |
| Silver Moon | |
| Silver Muse | |
| Silver Muse | |
| Silver Muse | Silver Muse | | 2017 | | 2017 | | 600 | |
| Silver Spirit | Silver Spirit | | 2009 | | 2009 | | 600 | |
| Silver Spirit | |
| Silver Spirit | |
| Silver Whisper | |
| Silver Whisper | |
| Silver Whisper | Silver Whisper | | 2001 | | 2001 | | 400 | |
| Silver Shadow | Silver Shadow | | 2000 | | 2000 | | 400 | |
| Silver Shadow | |
| Silver Shadow | |
| Silver Wind | |
| Silver Wind | |
| Silver Wind | Silver Wind | | 1995 | | 1995 | | 250 | |
| Silver Cloud | Silver Cloud | | 1994 | | 1994 | | 250 | |
| Silver Explorer | | 1989 | | 2008 | | 150 | |
| Silver Cloud | |
| Silver Cloud | |
| TUI Cruises | TUI Cruises | | |
Mein Schiff 2(2) | | 2019 | | 2019 | | 2,900 | |
| TUI Cruises | |
| TUI Cruises | |
| Mein Schiff Relax | |
| Mein Schiff Relax | |
| Mein Schiff Relax | |
| Mein Schiff 7 | |
| Mein Schiff 7 | |
| Mein Schiff 7 | |
| Mein Schiff 2 | |
| Mein Schiff 2 | |
| Mein Schiff 2 | |
| Mein Schiff 1 | Mein Schiff 1 | | 2018 | | 2018 | | 2,900 | |
| Mein Schiff 6 | | 2017 | | 2017 | | 2,500 | |
| Mein Schiff 5 | | 2016 | | 2016 | | 2,500 | |
| Mein Schiff 4 | | 2015 | | 2015 | | 2,500 | |
| Mein Schiff 3 | | 2014 | | 2014 | | 2,500 | |
| Mein Schiff Herz | | 1997 | | 2011 | | 1,900 | |
| Hapag-Lloyd | | |
| Hanseatic Spirit | | 2021 | | 2021 | | 230 | |
| Hanseatic Inspiration | | 2019 | | 2019 | | 230 | |
| Hanseatic Nature | | 2019 | | 2019 | | 230 | |
| Europa 2 | | 2013 | | 2013 | | 500 | |
| Europa | | 1999 | | 1999 | | 400 | |
| | Total | | 149,805 | |
| Mein Schiff 1 | |
| Mein Schiff 1 | |
| | | | | | | | | | | | | | | | | | | | | | |
| Ship | | Year Ship
Built | | Year ship entered service / will enter service | | Approximate
Berths | | |
| Mein Schiff 6 | | 2017 | | 2017 | | 2,500 | | |
| Mein Schiff 5 | | 2016 | | 2016 | | 2,500 | | |
| Mein Schiff 4 | | 2015 | | 2015 | | 2,500 | | |
| Mein Schiff 3 | | 2014 | | 2014 | | 2,500 | | |
| Hapag-Lloyd | | | | | | | | |
| Hanseatic Spirit | | 2021 | | 2021 | | 230 | | |
| Hanseatic Inspiration | | 2019 | | 2019 | | 230 | | |
| Hanseatic Nature | | 2019 | | 2019 | | 230 | | |
| Europa 2 | | 2013 | | 2013 | | 500 | | |
| Europa | | 1999 | | 1999 | | 400 | | |
| | | | | | | | |
| Total | | 171,005 | | |
______________________________________________________________(1)The year a ship entered service refers toIcon of the yearSeas was delivered in which the ship2023 and commenced cruise revenue operations for the brand. If after 2021, the date reflects the year of expected delivery into the brand.in January 2024.
(2)TUI Cruises' newbuild entered service as Mein Schiff 2 in February 2019 and the existing Mein Schiff 2 was renamed Mein Schiff Herz.
(3)Silver Dawn was delivered in 2021 and is expected to commence cruise revenue operations in the second quarter of 2022
As of December 31, 2021,2023, our Global Brands and our Partner Brands have 12eight ships on order. Two ships on order are being built in Germany by Meyer Werft GmbH, four are being built in Finland by Meyer Turku shipyard, four are being built in France by Chantiers de l’Atlantique and two are being built in Italy by Fincantieri. AsThe table below sets forth, as of December 31, 2021,2023, the dates that the ships on order are expected to be delivered, and their approximate berths. The expected delivery dates for all of our ships on order are subject to change in the event ofdue to events such as shipyard construction delays and their approximate berths are as follows:or agreed upon scope changes which impact the delivery timelines. See Part I. Item 1A. Risk Factors for further discussion on shipyard operations.
| | | | | | | | | | | | | | | | | | | | | | | |
| Ship | | Shipyard | | Expected Delivery | | Approximate
Berths | | | |
| Royal Caribbean International — | | | | | | | | | |
| Oasis-class: | | | | | | | | | |
WonderUtopia of the Seas | | Chantiers de l’Atlantique | | 1st Quarter 2022 | | 5,700 | | | |
Unnamed | | Chantiers de l’Atlantique | | 2nd Quarter 2024 | | 5,700 | | | |
| Icon-class: | | | | | | | | | |
IconStar of the Seas | | Meyer Turku Oy | | 3rd2nd Quarter 20232025 | | 5,600 | | | |
| Unnamed | | Meyer Turku Oy | | 2nd Quarter 2025 | | 5,600 | | | |
Unnamed | | Meyer Turku Oy | | 2nd Quarter 2026 | | 5,600 | | | |
| Celebrity Cruises — | | | | | | | | | |
| Edge-class: | | | | | | | | | |
Celebrity BeyondXcel | | Chantiers de l’Atlantique | | 2nd4th Quarter 20222025 | | 3,250 | | | |
Celebrity Ascent | | Chantiers de l’Atlantique | | 4th Quarter 2023 | | 3,250 | | | |
| Silversea Cruises — | | | | | | | | | |
| Evolution-class: | | | | | | | | | |
Silver NovaRay | | Meyer Werft | | 2nd Quarter 2023 | | 730 | | | |
Unnamed | | Meyer Werft | | 2nd Quarter 2024 | | 730 | | | |
| TUI Cruises (50% joint venture) — | | | | | | | | | |
| Mein Schiff 7 | | Meyer Turku Oy | | 2nd Quarter 2024 | | 2,900 | | | |
UnnamedMein Schiff Relax | | Fincantieri | | 4th Quarter 2024 | | 4,100 | | | |
| Unnamed | | Fincantieri | | 2nd Quarter 2026 | | 4,100 | | | |
| Total Berths | | | | | | 47,26031,980 | | | |
| | | | | | | | | |
In addition, in February 2024, we haveentered into an agreement in place with Chantiers de l’Atlantique to build an additional Edge-classOasis class ship for delivery in 2025,2028, which is contingent upon completion of certain conditions precedent andincluding financing.
Seasonality
Our revenues have historically been seasonal based on the demand for cruises. Demand is typically strongest for cruises during the Northern Hemisphere’s summer months and holidays. In order to mitigate the impact of the winter weather in the Northern Hemisphere and to capitalize on the summer season in the Southern Hemisphere, our brands have focused on deployment in the Caribbean, Asia and Australia during that period.
Passengers and Capacity
Selected statistical information is shown in the following table (see Financial Presentation- Description of Certain Line Items and Selected Operational and Financial Metrics under Item 7. Management’s Discussion and Analysis of Financial Condition and Results of Operations, for definitions). Passengers Carried, Passenger Cruise Days, Available Passenger Cruise Days and Occupancy reflect the impact of our suspension of operations during parts of 2020 and 2021 due to the COVID-19 pandemic and the gradual resumption of full operations duringstarting the second half of 2021:2021 through the first half of 2022: | | | | | | | | | | | | | | | | | | | | | | | | | | | | | |
| Year Ended December 31, (3) |
| 2021(1)(3) | | 2020(2) | | 2019 (2) | | 2018 (2) | | 2017 |
| Passengers Carried | 1,030,403 | | 1,295,144 | | 6,553,865 | | 6,084,201 | | 5,768,496 |
| Passenger Cruise Days | 5,802,582 | | 8,697,893 | | 44,803,953 | | 41,853,052 | | 40,033,527 |
| Available Passenger Cruise Days (APCD) | 11,767,441 | | 8,539,903 | | 41,432,451 | | 38,425,304 | | 36,930,939 |
| Occupancy | 49.3% | | 101.9% | | 108.1% | | 108.9% | | 108.4% |
| | | | | | | | | | | | | | | | | | | | | | | | | | | | | |
| Year Ended December 31, |
| 2023 | | 2022 | | 2021 (1)(3) | | 2020 (2) | | 2019 (2) |
| Passengers Carried | 7,646,203 | | 5,536,335 | | 1,030,403 | | 1,295,144 | | 6,553,865 |
| Passenger Cruise Days | 49,549,127 | | 35,051,935 | | 5,802,582 | | 8,697,893 | | 44,803,953 |
| Available Passenger Cruise Days (APCD) | 46,916,259 | | 41,197,650 | | 11,767,441 | | 8,539,903 | | 41,432,451 |
| Occupancy | 105.6% | | 85.1% | | 49.3% | | 101.9% | | 108.1% |
(1) Due to the elimination of the Silversea Cruises three-month reporting lag in October of 2021, we include Silversea Cruises' metrics from October 1, 2020 through June 30, 2021 and October 1 through December 31, 2021 in the year ended December 31, 2021. The year ended December 31, 2021 does not include July, August, and September 2021 statistics as Silversea Cruises' results of operations for those months are included within Other (expense) income in our consolidated statements of comprehensive loss for the year ended December 31, 2021. Refer2021.Refer to Note 1.1. General to our consolidated financial statements under Item 8. Financial Statements and Supplementary Data for more information on the three-month reporting lag.
(2) Due to the three-month reporting lag effective through September 30, 2021, we include Silversea Cruises' metrics from October 1, 2019 through September 30, 2020 in the year ended December 31, 2020, and from October 1, 2018 through September 30, 2019 in the year ended December 31, 2019, and from August 1, 2018 through September 30, 2018 in the year ended December 31, 2018.2019.
(3) For the year ended December, 31, 2021, we include Azamara Cruises' metrics through March 19, 2021, the effective sale date of the brand. Refer to Note 1.1. General to our consolidated financial statements under Item 8. Financial Statements and Supplementary Data for more information on the sale of the Azamara Cruises brand. For the years ended December 31, 2020, and 2019, we include the full year of operations for Azamara Cruises.
Cruise Pricing
Our cruise ticket prices include accommodations and a wide variety of activities and amenities, including meals and entertainment. Prices vary depending on many factors including the destination, cruise length, stateroom category selected, and the time of year the cruise takes place. In response to COVID-19, we established flexible cruise pricing programs (i.e. Cruise with Confidence, Best Price Guaranteeplace, and all-inclusive pricing) that present our guests with options and value.the amenities bundled into the price.
Although we grant credit terms in select markets mainly outside of the United States, our payment terms generally require an upfront deposit to confirm a reservation, with the balance due prior to the sailing. Our cruises are generally available for sale at least one year in advance and often more than two years in advance of sailing. During the selling period of a cruise, we continually monitor and adjust our cruise ticket prices for available guest staterooms based on demand, with the objective of maximizing net yields.
As our business has grown globally, our sale arrangements with travel advisors may vary. For instance, although our direct business has historically grown at a rapid pace, sale arrangements through travel advisor charter and group sales are proportionately higher in the China market than in our other markets which are primarily through retail agency and direct sales.
We have developed and implemented enhancements to our reservations system that provide us and our travel partners with additional capabilities, making it easier to do business with us. For example, we offer air transportation to our guests through our air transportation program available in major cities around the world.
Passenger ticket revenues accounted for approximately 61%69%, 68%66% and 72%61% of total revenues in 2023, 2022 and 2021, 2020 and 2019, respectively.
Onboard Activities and Other Revenues
Our cruise brands offer modern fleets with a wide array of onboard services, amenities and activities which vary by brand and ship. While many onboard activities are included in the base price of a cruise, we realize additional revenues from, among other things, gaming, the sale of alcoholic and other beverages, Internetinternet and other telecommunication services, gift shop items, shore excursions, photography, spa/salon and fitness services, art auctions, retail shops and a wide variety of specialty restaurants and dining options. Many of these services are available for pre-booking prior to embarkation. These activities are offered either directly by us or by independent concessionaires from which we receive a percentage of their revenues. The all-inclusive pricing programs that we offer currently add some of these onboard activity and other services to the base price of the cruise.
In conjunction with our cruise vacations, we offer pre- and post-cruise hotel packages to our Royal Caribbean International, Celebrity Cruises and Silversea Cruises guests. We also offer cruise vacation protection coverage to guests in a number of markets, which provides guests with coverage for trip cancellation, medical protection and baggage protection. Onboard and other revenues accounted for approximately 39%31%, 32%34%, and 28%39% of total revenues in 2023, 2022, and 2021, 2020 and 2019, respectively.
Segment Reporting
We control and operate three cruise brands, Royal Caribbean International, Celebrity Cruises, and Silversea Cruises. In addition, we have a 50% joint venture interest in TUIC, our 50%-owned joint venture that operates the German brands TUI Cruises and Hapag-Lloyd Cruises. We believe our brands possess the versatility to enter multiple cruise market segments within the cruise vacation industry. Although each of our brands has its own marketing style as well as ships and crews of various sizes, the nature of the products sold and services delivered by our brands share a common base (i.e., the sale and provision of cruise vacations). Our brands also have similar itineraries as well as similar cost and revenue components. In addition, our brands sourceGlobal Brands have historically sourced passengers from similar markets around the world and operateoperated in similar economic environments with a significant degree of commercial overlap. As a result, our brands have been aggregated as a single reportable segment based on the similarity of their economic characteristics, types of consumers, regulatory environment, maintenance requirements, supporting systems and processes as well as products and services provided. Our President and Chief Executive Officer has been identified as the chief operating decision-maker and all significant operating decisions including the allocation of resources are based upon the analyses of the Company as one segment. (For financial information, see Item 8. Financial Statements and Supplementary Data.)
Human Capital
Our human capital strategy focuses on attracting, developing and retaining the best talent in the industry. Some key elements of these strategies include: assessing current and future talent needs; a diverse and inclusive workforce; robust opportunities for employee growth and development; support for health and well-being; and an active listening strategy to make sure voices are heard and continuous improvement occurs. We review our human capital metrics and our diversity equity and inclusion (DEI) program with the Talent and Compensation Committee of our Board of Directors on an annuala regular basis.
As of December 31, 2021,2023, our three global cruise brands Royal Caribbean International, Celebrity Cruises, and Silversea Cruises, employed approximately 85,00098,200 employees spanning across our shipboard fleet and shoreside locations. Our shoreside workforce, including private destinations, consisted of approximately 7,6009,500 full time and 100 part-time employees. Our shipboard workforce consisted of 77,000approximately, 88,700 employees, and as of December 31, 2021,2023, approximately 86%88% were covered by collective bargaining agreements.
The following table details the distribution of our workforce by employee type and region as of December 31, 2021:2023:
| | | | | | | | |
Employee Type(1) | U.S. Based Employees | International Employees |
| Shoreside Operations | 4,100 | 2,500 |
| Shipboard Employees | | 77,000 |
Private Destinations(2) | | 1,100 |
| | | | | | | | |
| Employee Type | U.S. Based Employees | International Employees |
Shoreside Operations(1) | 4,050 | 3,900 |
| Shipboard Employees | — | 88,700 |
Private Destinations (2) | — | 1,550 |
(1) Includes full time and part timepart-time employees.
(2) Private Destinations includes Coco Cay, Labadee and Galapagos based employees.
As a global operation, we take great pride in the broad diversity of our workforce and the value it brings to our company. Our shoreside workforce is gender diverse with 53%54% female representation. Our shipboard workforce is comprised of employees from 130 plusapproximately 135 countries. The majority of our shipboard workforce comes from the Philippines (28%(31%), Indonesia (16%(18%) and India (14%). Our shoreside workforce is primarily based out of the U.S. (62%(51%), Philippines (17%), U.K. (5%(26%), Mexico (5%(8%), and China (3%U.K. (5%).
The following table details the gender distribution of our workforce by employee location as of December 31, 2021:2023:
| | Employee Location | Employee Location | Male | Female | Employee Location | Male | Female |
| Shoreside - U.S. | Shoreside - U.S. | 42% | 58% | Shoreside - U.S. | 46% | 54% |
| Shoreside - International | Shoreside - International | 52% | 48% | Shoreside - International | 43% | 57% |
| Shipboard | Shipboard | 78% | 22% | Shipboard | 78% | 22% |
Our U.S. shoreside workforce is ethnically diverse with 54%approximately 57% comprised of non-White ethnic groups.
| | | | | |
| U.S. Shoreside Representation by Ethnicity | % of Total U.S. Shoreside Population |
| White | 46%39% |
| Hispanic | 38%43% |
| African American | 11%8% |
| Asian | 5%6% |
Others(1) | —%4% |
(1) OthersNo other individual category is greater than 0% but less than 1%.
We offer a variety of learning and development programs to our workforce, which includes a combination of instructor led (classroom and virtual) and web based (self-learning) courses. This includes additional tools to assist our employees with managing their career development within Royal Caribbean Group. In 2021,2023, our workforce invested approximately 620,0002.5 million hours in learning programs across a variety of areas ranging from Ethics, Compliance, Data Analysis, Business Software and Tools, Finance/Accounting, Professional development, Project Management, skills,Cyber Security, Leadership and Safety/Security.Security among others. In total, our workforce completed over 400,000approximately 2.9 million courses within our learning management systems. During 2021, we also coached over 500 leaders across our shipboard and shoreside populations (421 Shipboard; 110 Shoreside), as part of our plans for a healthy return to service.
During 2021, we focused on our global healthy return to sailing and on bringing our crew back on board our ships. As part of our healthy return to sailing, we determined to establish a highly vaccinated environment. We returned 37,000 crew from various countries and made vaccines available to all returning crew members through partnerships with various world governments. By the end of 2021, we operated 85% of our fleet's capacity, with 100% vaccinated crew back on board.
In the third quarter of 2021, we welcomed our shoreside employees back to our headquarters in Miami and other locations around the world. Employees returned to our offices with robust protocols that promote their health and safety. We continue to run our employee pulse surveys every quarterperiodically to understand and positively impact our employees’ experience. In 2021,2023, our shoreside employee engagement scores remained high and above most global industry benchmarks.
Trademarks
We own a number of registered trademarks related to the Royal Caribbean International, Celebrity Cruises and Silversea Cruises cruise brands. The registered trademarks include the name “Royal Caribbean International” and its crown and anchor logo, the name “Celebrity Cruises” and its “X” logo, the name “Silversea Cruises” and its logo, and the names of various cruise ships, ship venues and other marketing programs. We believe our largest brands' trademarks are widely recognized throughout the world and have considerable value. The duration of trademark registrations varies from country to country. However, trademarks are generally valid and may be renewed indefinitely as long as they are in use and/or their registrations are properly maintained.
Insurance
We maintain insurance on the hull and machinery of our ships, with insured values generally equal to the net book value of each ship. This coverage is maintained with reputable insurance underwriters from the British, Scandinavian, French, United States and other reputable international insurance markets.
We are members of four Protection and Indemnity ("P&I") clubs, which are part of a worldwide group of 1312 P&I clubs, known as the International Group of P&I Clubs (the “IG”). Liabilities, costs and expenses for illness and injury to crew and guest, injury, pollution and other third-party claims in connection with our cruise activities are covered by our P&I clubs, subject to the clubs’ rules and the limits of coverage determined by the IG. P&I coverage provided by the clubs is on a mutual basis and we are subject to additional premium calls in the event of a catastrophic loss incurred by any member of the 1312 P&I clubs, whereby the reinsurance limits purchased by the IG are exhausted. We are also subject to additional premium calls based on investment and underwriting shortfalls experienced by our own individual insurers.
We maintain war risk insurance for legal liability to crew, guests and other third parties as well as for loss or damage to our vessels arising from acts of war, including invasion, insurrection, terrorism, rebellion, piracy and hijacking. Our primary war risk coverage is provided by a Norwegian war risk insurance association and our excess war risk insurance is provided by our four P&I clubs. Consistent with most marine war risk policies, our coverage is subject to cancellation in
the event of a change in risk. In the event of a war between major powers, our primary policies terminate after thirty days’
notice and our excess policies terminate immediately. Our excess policies are also subject to cancellation after a notice period of seven days in the event of other changes in risk. These notice periods allow for premiums to be renegotiated based on changes in risk.
Insurance coverage for other exposures, such as shoreside property and casualty, passenger off-vessel, directors and officers and network security and privacy, are maintained with various global insurance companies.
We do not carry business interruption insurance for our ships based on our evaluation of the risks involved and protective measures already in place, as compared to the cost of insurance.
All insurance coverage is subject to certain limitations, exclusions and deductible levels. In addition, in certain circumstances, we either self-insure or co-insure a portion of these risks. Premiums charged by insurance carriers, including carriers in the maritime insurance industry, increase or decrease from time to time and tend to be cyclical in nature. These cycles are impacted both by our own loss experience and by losses incurred in direct and reinsurance markets. We historically have been able to obtain insurance coverage in amounts and at premiums we have deemed to be commercially acceptable. No assurance can be given that affordable and secure insurance markets will be available to us in the future, particularly for war risk insurance.
Trademarks
We own a number of registered trademarks related to the Royal Caribbean International, Celebrity Cruises and Silversea Cruises cruise brands. The registered trademarks include the name “Royal Caribbean International” and its crown and anchor logo, the name “Celebrity Cruises” and its “X” logo, the name “Silversea Cruises” and its logo, and the names of various cruise ships, ship venues and other marketing programs. We believe our largest brands' trademarks are widely recognized throughout the world and have considerable value. The duration of trademark registrations varies from country to country. However, trademarks are generally valid and may be renewed indefinitely as long as they are in use and/or their registrations are properly maintained.
Regulation
Our ships are regulated by various international, national, state and local laws, regulations and treaties in force in the jurisdictions in which they operate. In addition, our ships are registered in the Bahamas, Cyprus, Malta or in the case of our ships operating in the Galapagos Islands, Ecuador. Each ship is subject to regulations issued by its country of registry, including regulations issued pursuant to international treaties governing the safety of our ships, guests and crew as well as environmental protection. Each country of registry conducts periodic inspections to verify compliance with these regulations as discussed more fully below. Ships operating out of ports of call around the world are also subject to inspection by the maritime authorities of that country for compliance with international treaties and local regulations. Additionally, ships operating out of the United States ports are subject to inspection by the United States Coast Guard for compliance with international treaties and by the United States Public Health Service for sanitary and health conditions. Our ships are also subject to similar inspections pursuant to the laws and regulations of various other countries our ships visit.
We believe that we are in material compliance with all the regulations applicable to our ships and that we have all licenses necessary to conduct our business. Health, safety, security, environmental and financial responsibility issues are, and we believe will continue to be, an area of focus by the relevant government authorities in the United States and internationally. From time to time, various regulatory and legislative changes may be implemented that could impact our operations and subject us to increasing compliance costs in the future.
CDC COVID-19 Program for Cruise Ships Operating in U.S. Waters
Beginning in October 2020, our ships home porting or calling in U.S. ports operated under a Framework for Conditional Sailing Order (“CSO”) issued by the U.S. Centers for Disease Control and Prevention ("CDC") that permitted cruise ship passenger operations in U.S. waters subject to certain conditions and safety protocols. The CSO, which had been modified over time, expired on January 15, 2022. On February 9, 2022, the CDC published a COVID-19 program (the “Program”) for cruise vessels sailing in U.S. waters. Under the Program, persons traveling on cruise ships designated as “Highly Vaccinated” do not have to wear a mask in any areas onboard and are not subject to physical distancing protocols. Cruise lines may opt into the Program on a voluntary basis Cruise lines may also opt out at any time. We have voluntarily opted-in to the CDC’s Program beginning with sailings departing on or after February 25, 2022, and have designated all ships across our brands as “Highly Vaccinated” vessels. Going forward, the CDC may issue additional recommendations or requirements through technical instructions to the Program. We plan to continue to monitor and evaluate any further CDC guidance based on our assessment of then-current epidemiological conditions, and applicable health and safety protocols.
Safety and Security Regulations
Our ships are required to comply with international safety standards defined in the International Convention for Safety of Life at Sea (“SOLAS”), which, among other things, establish requirements for ship design, structural features, materials, construction, lifesaving equipment and safe management and operation of ships for guest and crew safety. The SOLAS standards are revised from time to time and incorporated in our ship design and operation, as applicable. The latest enhancements include the addition of the Polar Code which sets goal-based standards for ships operating in the polar region as well as damage stability requirements for new designs and operational measures for existing vessels. Compliance with these modified standards have not historically had a material effect on our operating costs. SOLAS incorporates the International Safety Management Code (“ISM Code”), which provides an international standard for the safe management and operation of ships and for pollution prevention. The ISM Code is mandatory for all vessels, including passenger vessel operators.
All of our operations and ships are regularly audited by various national authorities, and we are required to maintain the relevant certificates of compliance with the ISM Code.
Additionally, we are required to meet, and we fully comply with, the provisions outlined in the Standards of Training, Certification, and Watchkeeping for Seafarers (STCW). This convention sets the training and competency standards for all our crew who are responsible for operating the vessels or who have designated roles in ensuring the safety of our guests and crew during an emergency. Regulatory bodies routinely check that our crews’ training credentials are up-to-date and assess competency by observing safety and emergency drills. As amendments are made to STCW, we ensure that our crew training is updated accordingly.
Our ships are subject to various security requirements, including the International Ship and Port Facility Security Code (“ISPS Code”), which is part of SOLAS, and the U.S. Maritime Transportation Security Act of 2002 (“MTSA”), which applies to ships that operate in U.S. ports. In order to satisfy these security requirements, we implement security measures, conduct vessel security assessments, and develop security plans. The security plans for all of our ships have been submitted to and approved by the Recognized Security Organization on behalf of the ships' flag state and are in compliance with the ISPS Code and the MTSA.
The Cruise Vessel Security and Safety Act of 2010, which applies to passenger vessels which embark or include port stops within the United States, requires the implementation of certain safety design features as well as the establishment of practices for the reporting of and dealing with allegations of crime. The cruise industry supported this legislation and we believe that our internal standards are generally as strict or stricter than the law requires. Some provisions of the act call for regulations which have not been finalized. We do not expect the pending regulations willto have a material impact to our operations.
Environmental Regulations
We are subject to various international and national laws and regulations relating to environmental protection. Under such laws and regulations, we are generally prohibited from discharging materials other than food waste and treated effluents into the waterways. We have made, and will continue to make, capital and other expenditures to comply with environmental laws and regulations. From time to time, environmental and other regulators consider more stringent regulations, which may affect our operations and increase our compliance costs. We believe that the impact of ships on the global environment will continue to be an area of focus by the relevant authorities throughout the world and, accordingly, may subject us to increasing compliance costs in the future, including the items described below.
Our ships are subject to the International Maritime Organization’s (‘‘IMO’’) regulations under the International Convention for the Prevention of Pollution from Ships (the ‘‘MARPOL Regulations’’) and the International Convention for the Control and Management of Ships Ballast Water and Sediments (Ballast Water Management Convention), in addition to other regional and national regulations such as EU Directives and the US Vessel General Permit, which includes requirements designed to minimize pollution by oil, sewage, garbage, air emissions and the transfer of non-native/non-indigenous species. We have obtained the relevant international compliance certificates relating to oil, sewage, air pollution prevention and ballast water for all of our ships.
Emissions
The MARPOL Regulations imposed reduced global limitations on the sulfur content of emissions emitted by ships operating worldwide to 0.5% as of January 1, 2020, which was reduced from 3.5%. As we continue our gradual resumption of operations, we do2020. Compliance with this limitation has not expect for this increased limitationand is not expected to have a material impact to our results of operations, largely due to a number of mitigating steps we have taken over the last several years, includingyears. This includes equipping all of our new ships delivered during or aftersince 2014 with Advanced Emissions Purification ("AEP") systems covering all engines and actively developing and installing AEP systems on the majority of our remaining fleetfleet; resulting in 70% of our fleet being equipped with AEP systems. In addition, the majority of our ships on order are being delivered with Liquified Natural Gas ("LNG") technology that meet all sulfur requirements without the need for an AEP system. These efforts will provide us with additional operational and deployment flexibility.
The MARPOL Regulations also establish special Emission Control Areas ("ECAs") with additional stringent limitations on sulfur emissions in thesecertain geographical areas. There are four established ECAs and one additional ECA being established beginning in May of 2025 that restrict sulfur emissions: the Baltic Sea, the North Sea/English Channel, certain waters surrounding the North American coast, and the waters surrounding Puerto Rico and the U.S. Virgin Islands (the "Caribbean"US Caribbean ECA"). and the Mediterranean Sea ECA coming into force in May 2025. Ships operating in these sulfur ECAs have beenare required to
reduce their emissions sulfur content to 0.1%. This reduction has not had a significant impact on our results of operations to date due to the mitigating steps described above.
We continue to implement our AEP system strategy for both our ships on order and our existing fleet. As our new ships are delivered with AEP systems, or other mitigating technologies (Liquified Natural Gas ("LNG") fuels, fuel cells, etc.), and additional existing ships are retrofitted with AEP systems, they will provide us with additional operational and deployment flexibility.
Additionally, all new ships operating within the North American and U.S. Caribbean Sea ECA that began construction on or after January 1, 2016 and ships operating in the North and Baltic Sea shipsECA constructed on or after January 1, 2021 are required to meet more stringent nitrogen oxide emission limits. We comply with these rules for those relevant ships in service. As an added measure,In order to ensure deployment flexibility, all of our ships under construction are being built to comply with these nitrogen oxide emission rules. The rules haveCompliance with these MARPOL requirements has not had and areis not expected to have, a significantmaterial impact on our results of operations due to the mitigating steps described above.
The European Union (EU) and IMO implemented legislations that require ships to monitor and report their carbon emissions. These legislations contemplated the enactment of further obligations and restrictions focused on reducing carbon emissions from ships. In 2022, the EU proposed a series of carbon reforms under its Fit for 55 package designed to meet its 2030 emission goals of reducing its GHG emissions by 55% from 1990 levels. As part of this package, during 2023, the EU adopted and published the Emission Trading System (ETS) and the FuelEU Maritime regulation. The ETS program will impose requirements to purchase carbon emission allowances beginning in 2024 for 40% of our emissions
within Europe, growing to 70% in 2025, and to 100% in 2026. The impact of the EU ETS regulation is not expected to have a material impact on our 2024 results of operations. The impact of the regulation on future periods is uncertain as the costs of ETS allowances will depend on future markets as well as future deployments. Based on current deployment plans and current prices of ETS allowances, we do not expect the regulation to have a material impact on our 2025 and 2026 results of operations.
The FuelEU Maritime regulation will require ships to reduce GHG intensity in the fuels they consume by 2% as of 2025, and periodically reducing the intensity to 80% by 2050, compared to the 2020 average. All passenger ships will additionally be obligated to connect to shore power when at berth in a Trans-European Transport Network ("TEN-T") port by 2030 and all EU ports by 2035. When fully implemented, the FuelEU Maritime and the remaining Fit for 55 proposals could individually and collectively have a material adverse effect on our business and results of operations or costs.due to increased costs associated with compliance and modified itineraries in the affected regions.
In November of 2020,January 2023, the IMO approved amendments to the MARPOL convention that will require ships, beginning in 2023, to combinewent into effect combining a technical and an operational approachmeasure (Energy Efficiency Existing Ship Index ("EEXI") and Carbon Intensity Indicator ("CII")). These regulations aim to reduce theirinternational shipping carbon intensity in line with the ambition of the Initialinitial IMO GHG Strategy which aims to reduce carbon intensity of international shipping by 40% by 2030, as compared to 2008. While there is still work to be completed ahead of these amendments being implemented, the approved framework forCompliance with the EEXI amendment ishas not expected to havehad a material impact on our operations. However,The impact of CII is still uncertain as the IMO is expected to review the CII framework for CIIin 2026, which could have a negative impact onresult in requirements that could lead to changes to our itinerary flexibility for certainsome of our ships depending on the final operational measures needed to comply.
Effective July 1, 2015, Furthermore, the European Commission adopted legislation that requires cruise ship operatorsIMO in 2023 revised its initial GHG Strategy to include check points in 2030 and 2040 to seek reductions in absolute GHG emissions from international shipping by at least 20% and 70%, respectively, compared to 2008. The revised IMO strategy also considers various other measures, including a possible fuel standard and a global market-based measure, such as a fuel levy or carbon taxes, with ships visiting ports in the European Unionintent to monitorreduce greenhouse gas emissions even further. While the exact impact is uncertain at this time as the proposals have yet to be finalized, the global nature of the CII regulation and report on the ship’s annual carbon dioxide emissions starting in 2018. Additionally, in 2019,various other potential measures within the IMO's monitoring and reporting system (IMO data and collection system), which is applicable to all ship itineraries, entered into force. While compliance with these regulations did not materiallyrevised strategy could have a material impact on our costs or results of operations the legislations contemplate further obligations and restrictions which could ultimately result in additional costs or charges associated with carbon dioxide emissions.due to increased compliance costs.
Ballast Water
The IMO Ballast Water Management Convention, which came into effect in 2017, requires ships that carry and discharge ballast water to meet specific discharge standards by installing Ballast Water Treatment Systems by 2023.Systems. Compliance with this regulation has not had a material effect on our results of operations and we do not expect the continuing compliance with this regulation to have a material effect on our results of operations.
Refer to Item 1A. Risk Factors - "Environmental, labor,"Factors associated with climate change, including an increasing global regulatory focus, could adversely affect our business", and "Labor, health and safety, financial responsibility and other maritime regulations and measures could affect operations and increase operating costs" for further discussion of the risks associated with the regulations discussed above.
Consumer Financial Responsibility Regulations
We are required to obtain certificates from the United States Federal Maritime Commission relating to our ability to satisfy liability in cases of non-performance of obligations to guests, as well as casualty and personal injury. As a condition to obtaining the required certificates, we generally arrange through our insurers for the provision of surety for our ship-operating companies. The required amount of the surety bonds for non-performance of obligations to guests is currently $32.0$32 million per operator and is subject to additional consumer price index based adjustments.
We are also required by the United Kingdom, Norway, Finland, Iceland and the Baltics to establish our financial responsibility for any liability resulting from the non-performance of our obligations to guests from these jurisdictions. In the United Kingdom we are currently required by the Association of British Travel Agents to provide performance bonds totaling approximately £124 million.in varying amounts during the course of the year, up to £183 million during the peak season. Additionally, we wereare required by the Civil Aviation Authority to provide performance bonds totaling £18.5£25 million. TheWe maintain with the Norwegian Travel Guarantee Fund requires us to maintain performance bonds in varying amounts during the course of the year to cover our financial responsibility in Norway, Finland, Iceland and the Baltics.
Certain other jurisdictions also require that we establish financial responsibility to our guests resulting from the non-performance of our obligations; however, the related amounts do not have a material effect on our costs.
Taxation of the Company
The following is a summary of our principal taxes, exemptions and special regimes. In addition to or instead of income taxation, virtually all jurisdictions where our ships call impose some tax or fee, or both, based on guest headcount,
tonnage or some other measure. We also collect and remit value added tax (VAT) or sales tax in many jurisdictions where
we operate.
Our consolidated operations are primarily foreign corporations engaged in the owning and operating of passenger cruise ships in international transportation.
U.S. Income Taxation
The following is a discussion of the application of the U.S. federal and state income tax laws to us and is based on the current provisions of the U.S. Internal Revenue Code, Treasury Department regulations, administrative rulings, court decisions and the relevant state tax laws, regulations, rulings and court decisions of the states where we have business operations. All of the foregoing is subject to change, and any such change could affect the accuracy of this discussion.
Application of Section 883 of the Internal Revenue Code
Royal Caribbean Cruises Ltd., Celebrity Cruises, Inc. and Silversea Cruises Ltd. are engaged in a trade or business in the United States, and many of our ship-owning subsidiaries, depending upon the itineraries of their ships, receive income from sources within the United States. Silversea Cruises Ltd. and our United KingdomKingdom tonnage tax company companies are classified as disregarded entities, or divisions for U.S. federal income tax purposes that may earn U.S. source income. Under Section 883 of the Internal Revenue Code, certain foreign corporations may exclude from gross income (and effectively from branch profits tax as such earnings do not give rise to effectively connected earnings and profits) U.S. source income derived from or incidental to the international operation of a ship or ships, including income from the leasing of such ships.
A foreign corporation will qualify for the benefits of Section 883 if, in relevant part: (1) the foreign country in which the foreign corporation is organized grants an equivalent exemption to corporations organized in the United States; and (2) the stock of the corporation (or the direct or indirect corporate parent thereof) is “primarily and regularly traded on an established securities market” in the United States. In the opinion of our U.S. tax counsel, Faegre Drinker Biddle & Reath LLP, based on the representations and assumptions set forth in that opinion, Royal Caribbean Cruises Ltd., including Silversea Cruises Ltd., Celebrity Cruises Inc., and relevant ship-owning subsidiaries with U.S. source shipping income qualify for the benefits of Section 883 because Royal Caribbean Cruises Ltd. and each of those subsidiaries are incorporated in Liberia, which is a qualifying country, and our common stock is primarily and regularly traded on an established securities market in the United States (i.e., we are a “publicly traded” corporation). If, in the future, (1) Liberia no longer qualifies as an equivalent exemption jurisdiction, and we do not reincorporate in a jurisdiction that does qualify for the exemption, or (2) we fail to qualify as a publicly traded corporation, we and all of our ship-owning or operating subsidiaries that rely on Section 883 to exclude qualifying income from gross income would be subject to U.S. federal income tax on their U.S. source shipping income and income from activities incidental thereto.
We believe that most of our income and the income of our ship-owning subsidiaries, is derived from or incidental to the international operation of a ship or ships and, therefore, is exempt from taxation under Section 883.
Regulations under Section 883 list activities that are not considered by the Internal Revenue Service to be incidental to the international operation of ships including the sale of air and land transportation, shore excursions and pre- and post-cruise tours. Our income from these activities that is earned from sources within the United States will be subject to U.S. taxation.
Taxation in the Absence of an Exemption Under Section 883
If Royal Caribbean Cruises Ltd., the operator of our vessels, Celebrity Cruises Inc., or our ship-owning subsidiaries were to fail to meet the requirements of Section 883 of the Internal Revenue Code, or if the provision was repealed, then, as explained below, such companies would be subject to U.S. income taxation on a portion of their income derived from or incidental to the international operation of our ships.
Because Royal Caribbean Cruises Ltd. and Celebrity Cruises Inc. conduct a trade or business in the United States, Royal Caribbean Cruises Ltd., including Silversea Cruises Ltd., and Celebrity Cruises Inc. would be taxable at regular corporate rates on our separate company taxable income (i.e., without regard to the income of our ship-owning subsidiaries) on income which is effectively connected with our U.S. trade or business (generally only income from U.S. sources). In addition, if any of our earnings and profits effectively connected with our U.S. trade or business were withdrawn, or were deemed to have been withdrawn, from our U.S. trade or business, those withdrawn amounts would be subject to a “branch profits” tax at the rate of 30%. Royal Caribbean Cruises Ltd., which includes Silversea Cruises Ltd. for tax purposes, and Celebrity Cruises Inc. would also be potentially subject to tax on portions of certain interest paid by us at rates of up to 30%.
If Section 883 were not available to our ship-owning subsidiaries, each such subsidiary would be subject to a special 4% tax on its U.S. source gross transportation income, if any, each year because it does not have a fixed place of business in the United States and its income is derived from the leasing of a ship.
Other United States Taxation
Royal Caribbean Cruises Ltd., which includes Silversea Cruises Ltd., and Celebrity Cruises Inc. earn U.S. source income from activities not considered incidental to international shipping. The tax on such income is not material to our results of operation for all years presented.
State Taxation
Royal Caribbean Cruises Ltd., Celebrity Cruises Inc., and certain of our subsidiaries are subject to various U.S. state income taxes which are generally imposed on each state’s portion of the U.S. source income subject to federal income taxes. Additionally, the state of Alaska subjects an allocated portion of the total income of companies doing business in Alaska and certain other affiliated companies to Alaska corporate state income taxes and also imposes a 33% tax on adjusted gross income from onboard gambling activities conducted in Alaska waters. This did not have a material impact to our results of operations for all years presented.
United Kingdom Income Taxation
During the year ended December 31, 2021,2023, we operated 1714 ships under the United Kingdom tonnage tax regime (“U.K. tonnage tax”).
Companies subject to U.K. tonnage tax pay a corporate tax on a notional profit determined with reference to the net tonnage of qualifying vessels. The requirements for a company to qualify for the U.K. tonnage tax regime include being subject to U.K. corporate income tax, operating qualifying ships, which are strategically and commercially managed in the United Kingdom, and fulfilling a seafarer training requirement.
Relevant shipping profits include income from the operation of qualifying ships and from shipping related activities. Our U.K. income from non-shipping activities which do not qualify under the U.K. tonnage tax regime and which are not considered significant, remain subject to regular U.K. corporate income tax.
Other Taxation
We and certain of our subsidiaries are subject to value-added and other indirect taxes most of which are reclaimable, zero-rated or exempt.
The Organization for Economic Co-operation and Development (OECD) has issued Pillar Two model rules introducing a new global minimum tax of 15% with certain aspects of Pillar 2 effective January 1, 2024 and other aspects effective January 1, 2025. The UK and EU member countries have agreed to adopt these provisions and many countries have implemented these rules for 2024. Our parent company is incorporated in Liberia. Liberia has not announced plans to revise its local corporate income tax laws as part of the Pillar 2 proposal. The OECD model rules provide an exclusion for “International Shipping Income,” and certain ancillary income, for which certain of our earnings may be eligible.
The Pillar Two rules will become effective for a portion of our earnings in 2024 and 2025, but we believe the impact will be immaterial. These rules will apply to a majority of our earnings starting in 2026. We are continuing to evaluate the impact of these proposed and enacted legislative changes, which continue to evolve. We are evaluating mitigation strategies that we believe we can execute to minimize the impact of these provisions to an immaterial amount. Refer to Item 1A. Risk Factors - "A change in our tax status under the U.S. Internal Revenue Code, or other jurisdictions, may have adverse effects on our results of operations."
Website Access to Reports
We make available, free of charge, access to our Annual Reports, all quarterly and current reports and all amendments to those reports, as soon as reasonably practicable after such reports are electronically filed with or furnished to the Securities and Exchange Commission and through our website at www.rclinvestor.com. The information contained on our website is not a part of any of these reports and is not incorporated by reference herein.
Information About our Executive Officers
As of March 1, 2022,February 21, 2024, our executive officers are:
| | | | | | | | | | | |
| Name | Age | | Position |
| Jason T. Liberty | 4648 | | President and Chief Executive Officer |
| Naftali Holtz | 4446 | | Chief Financial Officer |
| Michael W. Bayley | 6365 | | President and Chief Executive Officer, Royal Caribbean International |
| Laura Hodges Bethge | Lisa Lutoff-Perlo48 | | 64 | President, and Chief Executive Officer, Celebrity Cruises |
Roberto Martinoli | 69 | | President and Chief Executive Officer, Silversea Cruises |
| Harri U. Kulovaara | 6971 | | Executive Vice President, Maritime |
Laura Hodges Bethge | 47 | | Executive Vice President, Shared Services Operations |
| R. Alexander Lake | 5052 | | Senior Vice President, Chief Legal Officer and Secretary |
Henry L. Pujol | 54 | | Senior Vice President, Chief Accounting Officer |
| | | |
Jason T. Liberty has served as President and Chief Executive Officer since January 2022. Mr. Liberty has held several roles since joining the Company in 2005. Most recently, Mr. Liberty served as Executive Vice President and Chief Financial Officer since 2017 and, prior to that, as Senior Vice President and Chief Financial Officer since 2013. Before his role as Chief Financial Officer, Mr. Liberty served as Senior Vice President, Strategy and Finance from 2012 through 2013; as Vice President of Corporate and Revenue Planning from 2010 through 2012; and as Vice President of Corporate and Strategic Planning from 2008 to 2010. Before joining Royal Caribbean, Mr. Liberty was a Senior Manager at the international public accounting firm of KPMG LLP. Mr. Liberty currently serves on the Board of Directors of WNS Holdings.
Naftali Holtz has served as Chief Financial Officer since January 2022. In his role as Chief Financial Officer, Mr. Holtz is responsible for overseeing the company’sCompany’s financial planning and analysis, supply chain, risk management, corporate strategy, treasury, corporate tax matters, investor relations, investments, internal audit, accounting and financial reporting. Prior to his role as Chief Financial Officer, Mr. Holtz served as senior vice presidentSenior Vice President of finance,Finance, responsible for financial planning and analysis, risk management and treasury. Mr. Holtz worked for Goldman Sachs as a managing directorManaging Director and headHead of lodgingLodging and leisure investment bankingLeisure Investment Banking before joining Royal Caribbean Groupthe Company in 2019. Mr. Holtz is also a veteran of the Israeli Air Force.
Michael W. Bayley has served as President and Chief Executive Officer of Royal Caribbean International since December 2014. Prior to this, he served as President and Chief Executive Officer of Celebrity Cruises since August 2012. Mr. Bayley has been employed by Royal Caribbean for over 40 years, having started as an Assistant Purser onboard one of the Company’s ships. He has served in a number of roles including as Executive Vice President, Operations from February 2012 until August 2012. Other positions Mr. Bayley has held include Executive Vice President, International from May 2010 until February 2012; Senior Vice President, International from December 2007 to May 2010; Senior Vice President, Hotel Operations for Royal Caribbean International; and Chairman and Managing Director of Island Cruises.
Lisa Lutoff-PerloLaura Hodges Bethge has served as President and Chief Executive Officer of Celebrity Cruises since December 2014May 2023. Ms. Hodges Bethge’s joined the Company in 2000 and she has been withsince held several leadership roles within various areas of the company since 1985. She also leads the Company’s Global Marine Organization. Ms. Lutoff-Perlo was thebusiness, including hotel and marine operations, sales, marketing, product innovation and investor relations. Most recently, she served as Executive Vice President of Shared Services Operations since February 2022, responsible for Royal Caribbean Group’s safety, security and environment, risk management and crew movement teams. Prior to that role, she served as Senior Vice President of Shared Services Operations from December 2020 to February 2022; Senior Vice President of Product Development for Royal Caribbean International from 2012February 2020 to 2014; Senior Vice President, Hotel Operations of Celebrity Cruises from 2007 to 2012;December 2020; and Vice President Onboard Revenue of Celebrity CruisesCustomer Experience from 2005April 2017 to 2007. Ms. Lutoff-Perlo held various senior positions in sales and marketing with Royal Caribbean International from 1985 to 2005. Ms. Lutoff-Perlo currently serves on the Board of Directors of AutoNation and is Vice Chair for United Way of Broward County.
Roberto Martinoli has served as President and Chief Executive Officer of Silversea Cruises since 2016. Before joining Silversea, Mr. Martinoli was the Chairman and Chief Executive Officer of Grandi Navi Veloci from 2010 to 2016, President and Chief Operating Officer of Norwegian Cruise Line from 2007 to 2010, Executive Vice President of Operations at Carnival Cruise Lines from 2000 to 2007 and Senior Vice President at Costa Crociere from 1997 to 2000.February 2020.
Harri U. Kulovaara has served as Executive Vice President, Maritime since January 2005. Mr. Kulovaara is responsible for fleet design and newbuild operations. Mr. Kulovaara also chairs our Maritime Safety Advisory Board. Mr. Kulovaara has been employed with Royal Caribbean since 1995 in a variety of positions, including Senior Vice President, Marine Operations, and Senior Vice President, Quality Assurance. Mr. Kulovaara is a naval architect and engineer.
Laura Hodges Bethge has served as Executive Vice President of Shared Services Operations since February 2022, where she is responsible for overseeing the Company’s safety, security and environment, risk management, supply chain, port operations, travel services, workplace solutions, and crew movement teams. She joined the Company in 2000 to lead the fleet accessibility program for Royal Caribbean and Celebrity Cruises, and she has since held several leadership roles within various areas of the business. Most recently, she served as Senior Vice President of Shared Services Operations from December 2020 to February 2022. Prior to that role, she served as Senior Vice President of Product Development for Royal Caribbean International from February 2020 to December 2020; Vice President of Customer Experience from April 2017 to February 2020; and Vice President of Market Development for China from October 2016 to April 2017.
R. Alexander Lake has served as Chief Legal Officer and Secretary of the Company since June 2021, in which role he has global responsibility for the Company's legal and compliance functions. Mr. Lake joined the Company from World Fuel Services Corporation, a global energy services company, where he spent over 17 years leading the legal, regulatory and compliance areas, serving most recently as Executive Vice President, Chief Legal Officer and Corporate Secretary from 2017 to 2021. Prior to World Fuel Services, Mr. Lake served as Assistant General Counsel at America Online Latin America, Inc. and practiced as a corporate lawyer in leading law firms in New York and Miami.
Henry L. Pujol has served as Senior Vice President, Chief Accounting Officer of the Company since May 2013. Mr. Pujol originally joined Royal Caribbean in 2004 as Assistant Controller and was promoted to Corporate Controller in May 2007. Before joining Royal Caribbean, Mr. Pujol was a Senior Manager at the international public accounting firm of KPMG LLP.
Item 1A. Risk Factors
The risk factors set forth below and elsewhere in this Annual Report on Form 10-K are important factors that could cause actual results to differ from expected or historical results. It is not possible to predict or identify all such risks. There may be additional risks that we consider not to be material, or which are not known, and any of these risks could affect our operations. The ordering of the risk factors set forth below is not intended to reflect a risk's potential likelihood or magnitude. See Item 7. Management’s Discussion and Analysis of Financial Condition and Results of Operations for a cautionary note regarding forward-looking statements.
COVID-19 and Financial Risks
The COVID-19 pandemic has had, and continues to have, a material adverse impact on our business, results of operations and liquidity. The global spread of COVID-19, the unprecedented responses by governments and other authorities to control and contain the disease, including related variants and challenges to global vaccination efforts, have caused significant disruptions, created new risks, and exacerbated existing risks to our business.
We have been, and continue to be, negatively impacted by the COVID-19 pandemic, including impacts that resulted or may result from actions taken in response to the outbreak and the occurrence and spread of related variants. Examples of these include, but are not limited to, cruising advisories and required or voluntary travel restrictions, that resulted in the temporary suspension of our Global Brands' operations, from which we have resumed limited operations; restrictions on the movement and gathering of people; social distancing measures; shelter-in-place/stay-at-home orders; and disruptions to businesses in our supply chain. In addition to the restrictions affecting our business, the extent, duration, and magnitude of the COVID-19 pandemic’s effect on the economy and consumer demand for cruising and travel is evolving and difficult to predict. As such, these impacts may persist for an extended period of time or even become more pronounced, even as we resume operations.
The COVID-19 pandemic also has elevated risks affecting significant parts of our business:
• Operations: While we have restarted our global cruise operations in a phased manner, following the March 2020 suspension of our global cruise operations, there is no assurance that our plan to resume operations will be successful. It is possible that future COVID-19 cases could occur onboard and, even if controlled and contained, it is uncertain whether we will need to suspend additional sailings and to what extent in such event. Onboard cases have resulted in illness among our guests and crew, incremental costs, guest refunds and negative publicity and media attention. In addition, we may face challenges in executing our return to service plans as a result of new and evolving operating protocols, including due to state laws regarding proof of vaccination requirements and related litigation, and possible changes in regulations in the countries in which we operate and plan to operate.
Uncertainties remain as to the specifics, timing and costs of administering and implementing our health and safety measures, some of which may be significant. These measures also may negatively impact guest satisfaction. Based on our assessment of these requirements and recommendations, the status of COVID-19 infection and/or vaccination rates in the U.S. or globally or for other reasons, we may determine it necessary to cancel or modify certain of our Global Brands’ cruise sailings. In addition, there is no guarantee that the vaccines will be effective. We believe the impact to our global bookings resulting from COVID-19 will continue to have a material negative impact on our results of operations and liquidity, which may be prolonged beyond containment of the disease and its variants.
Our previous suspension of sailings and our gradual resumption of operations has led to a significant decline in our revenues and cash inflows, which required us to take cost and capital expenditure containment actions. Consequently, we reduced and furloughed some of our workforce, with approximately 23% of our U.S. shoreside employee base being impacted in 2020. Our ships and our shipboard crew are gradually being notified about new assignments as operations resume over time. We may be challenged in rebuilding the rest of our workforce which could delay our phased resumption of operations. In addition, we have reduced our planned capital spending through 2022, which may negatively impact or delay our execution of planned growth strategies, particularly as it relates to investments in our ships, technology, and our expansion of land-based developments. We also have taken actions to monitor and mitigate changes in our supply chain, and port destination availability, which may strain relationships with our vendors and port partners.
If we are unable to satisfy the safety standards applicable to our sailings, our operations may be negatively impacted and we could be exposed to reputational and legal risks. Due to the unprecedented and uncertain nature of the COVID-19 pandemic and related regulatory landscape, it is difficult to predict the impact of further disruptions and their magnitude. In addition, we have never previously experienced a complete cessation of our cruising operations or a subsequent phased resumption of operations, and as a consequence, we are unable to predict the precise impact of such a cessation or phased resumption of operations on our brands and future prospects.
•Results of Operations: Our suspensions of sailings have materially impacted the results of our operations. We have incurred and will continue to incur significant costs as we accommodate passengers due to cancelled sailings. In addition, we have
incurred and will likely continue to incur significant overhead costs associated with the return to service of our fleet and enhanced COVID-19 related cleaning, testing, vaccination and other mitigation procedures. We may experience volatility in demand for cruising for an indeterminable length of time due to the uncertain nature of the COVID-19 pandemic and ongoing concerns about health and safety, and we cannot predict when we will return to pre-pandemic demand or fare pricing or if we will return to such levels in the foreseeable future. In turn, these negative impacts to our financial performance have resulted and may continue to result in impairments of our long-lived and intangible assets, which has influenced our decision making relating to early disposal, sale or retirement of assets. Following the resumption of operations, our Global Brands and our Partner Brands may be subject to the continued impact of the COVID-19 pandemic. Additionally, any future profitability will be impacted by increased debt service costs as a result of our liquidity actions.
•Liquidity: The suspension of our sailings and the reduction in demand for future cruising adversely impacted our liquidity, and we have continued to experience higher than historical levels of refunds of customer deposits, while cash inflows from new or existing bookings on future sailings are below pre-pandemic levels. As a result, we have taken actions to increase our liquidity through a combination of operating and capital expense reductions and increased financing activities. Refer to Note 8. Debt to our consolidated financial statements under Item 8. Financial Statements and Supplemental Data for further discussion of our 2021 financing activities.
We have agreed with certain of our lenders that we will not pay dividends or engage in stock repurchases until after the third quarter of 2022. Thereafter, in the event we declare a dividend or engage in stock repurchases we will need to repay the amounts deferred under our export credit facilities. On February 25, 2021, S&P Global further downgraded our senior unsecured rating from B+ to B, which had no financial impact, and downgraded our Senior Secured Notes which were partially repaid in August 2021, and Silversea Notes, which were fully repaid in June 2021 with the proceeds from the $650 million June Unsecured Notes, from BB to BB-. This downgrade had no impact on the terms of the notes. Our ability to raise additional financing, whether or not secured, could be limited if our credit rating is further downgraded, and/or if we fail to comply with applicable covenants governing our outstanding indebtedness, and/or if overall financial market conditions worsen. Additionally, due to the complexity of the pandemic’s impact to the economy and uncertainty of its duration, we cannot guarantee that assumptions used to project our liquidity needs will be correct, which may result in the need for additional financing and/or may result in the inability to satisfy covenants required by our current credit facilities. If we continue to raise additional funds through equity or convertible debt issuances, our shareholders could experience dilution of their ownership interest, and these equity or convertible debt securities could have rights, preferences, and privileges that are superior to that of holders of our ordinary shares. If we raise additional funds by issuing debt, we may be subject to additional limitations on our operations due to restrictive covenants, which may be more restrictive than the covenants in our existing debt agreements, and we may be required to further encumber our assets. Also, as a result of our additional debt issuances, we will require a significant amount of cash to service our debt and sustain operations. Our ability to generate cash depends on factors beyond our control and we may be unable to repay or repurchase debt at maturity. If adequate funds are not available on acceptable terms, or at all, we may be unable to fund our operations, or respond to competitive pressures, any of which could negatively affect our business. There is no guarantee that financing will be available in the future or that such financing will be available with similar terms or terms that are commercially acceptable to us. Further, if any government agrees to provide us with disaster relief assistance, or other assistance due to the impacts of the COVID-19 pandemic, and we determine it is beneficial to seek such government assistance, it may impose restrictions on share buybacks, dividends, prepayment of debt, executive compensation or other areas of our business until the aid is repaid or redeemed in full, which could significantly limit our corporate activities and adversely impact our business and operations. We cannot assure you that any such disaster relief would be available to us.
We may not be able to obtain sufficient financing or capital for our needs or may not be able to do so on terms that are acceptable or consistent with our expectations.
To fund our capital expenditures (including new ship orders), operations and scheduled debt payments, we have historically relied on a combination of cash flows provided by operations, drawdowns under available credit facilities, the incurrence of additional indebtedness and the sale of equity or debt securities in private or public securities markets. Any circumstance or event which leads to a decrease in consumer cruise spending, such as worsening global economic conditions or significant incidents impacting the cruise industry, such as the COVID-19 pandemic, negatively affects our operating cash flows. We had net cash outflows from operations for the twelve months ended December 31, 2021. As result of the COVID-19 pandemic and the resulting suspension of our operations, we have experienced credit rating downgrades, which may reduce our ability to incur secured indebtedness by reducing the amount of indebtedness that we are permitted to secure, and may negatively impact our access to, and cost of, debt financing.
Our ability to access additional funding as and when needed, our ability to timely refinance and/or replace our outstanding debt securities and credit facilities on acceptable terms and our cost of funding will depend upon numerous factors including, but not limited to, the strength of the financial markets, our recovery and financial performance, the recovery and performance of our industry in general and the size, scope and timing of our financial needs. In addition, even where financing commitments have been secured,
significant disruptions in the capital and credit markets could cause our banking and other counterparties to breach their contractual obligations to us or could cause the conditions to the availability of such funding not to be satisfied. This could include failures of banks or other financial service companies to fund required borrowings under our loan agreements or to pay us amounts that may become due or return collateral that is refundable under our derivative contracts for hedging of fuel prices, interest rates and foreign currencies or other agreements. If any of the foregoing occurs for a prolonged period of time it will have a long-term negative impact on our cash flows and our ability to meet our financial obligations.
Our substantial debt requires a significant amount of cash to service and could adversely affect our financial condition.
We have a substantial amount of debt and significant debt service obligations. As of December 31, 2021, we had total debt of $21.1 billion. Our substantial debt has required us to dedicate a large portion of our cash flow from operations to service debt and fund repayments on our debt, thereby reducing the availability of our cash flow to fund working capital, capital expenditures and other general corporate expenses.
Our ability to make future scheduled payments on our debt service obligations or refinance our debt depends on our future operating and financial performance and ability to generate cash. This will be affected by our ability to successfully implement our business strategy, as well as general economic, financial, competitive, regulatory and other factors beyond our control, such as the disruption caused by the COVID-19 pandemic. If we cannot generate sufficient cash to meet our debt service obligations or fund our other business needs, we may, among other things, need to refinance all or a portion of our debt, obtain additional financing, delay planned capital expenditures or sell assets. We cannot assure that we will be able to generate sufficient cash through any of the foregoing. If we are not able to refinance any of our debt, obtain additional financing or sell assets on commercially reasonable terms or at all, we may not be able to satisfy our obligations with respect to our debt.
Our substantial debt could also result in other negative consequences for us. For example, it could increase our vulnerability to adverse general economic or industry conditions; limit our flexibility in planning for, or reacting to, changes in our business or the industry in which we operate; place us at a competitive disadvantage compared to our competitors that have less debt; make us more vulnerable to downturns in our business, the economy or the industry in which we operate, including the current downturn related to COVID-19; limit our ability to raise additional debt or equity capital in the future to satisfy our requirements relating to working capital, capital expenditures, development projects, strategic initiatives or other purposes; restrict us from making strategic acquisitions, introducing new technologies or exploiting business opportunities; limit or restrict our ability to obtain and maintain performance bonds to cover our financial responsibility requirements in various jurisdictions for non-performance of guest travel, casualty and personal injury; make it difficult for us to satisfy our obligations with respect to our debt; and increase our exposure to the risk of increased interest rates as certain of our borrowings are (and may be in the future) at a variable rate of interest.
Despite our leverage, we may incur more debt, which could adversely affect our business.
We may incur substantial additional debt in the future. Except for the restrictions under the indentures governing our 10.875% and 11.5% senior secured notes due 2023 and 2025, respectively (the “Secured Notes”), and our 9.125% senior guaranteed notes due 2023 (the “Priority Guaranteed Notes”) and certain of our other debt instruments, including our unsecured bank and export credit facilities, we are not restricted under the terms of our debt instruments from incurring additional debt. Although the indentures governing the Secured Notes, the Unsecured Notes, and certain of our other debt instruments, including our unsecured bank and export credit facilities, contain restrictions on the incurrence of additional debt, these restrictions are subject to a number of significant qualifications and exceptions, and under certain circumstances the amount of debt that could be incurred in compliance with these restrictions could be substantial. In the event that we execute and borrow under the $700.0 million commitment available to draw on at any time prior to August 12, 2022 for a 364-day term loan facility, the credit agreement that would govern such term loan facility would impose substantially similar restrictions (including the related qualifications and exceptions) as are set forth in the indenture governing the Unsecured Notes. If new debt is added to our existing debt levels, the related risks that we now face would increase. As of December 31, 2021, we have commitments for approximately $10.0 billion of debt to finance the purchase of 9 ships on order by our Royal Caribbean International, Celebrity Cruises and Silversea Cruises brands, all of which are guaranteed by the export credit agencies in the countries in which the ships are being built. The ultimate size of each facility will depend on the final contract price (including change orders and owner’s supply) as well as fluctuations in the EUR/USD exchange rate.
We are subject to restrictive debt covenants that may limit our ability to finance our future operations and capital needs and to pursue business opportunities and activities. In addition, if we fail to comply with any of these restrictions, it could have a material adverse effect on us.
Certain of our debt instruments, including our indentures and our unsecured bank and export credit facilities, limit our flexibility in operating our business. For example, certain of our loan agreements and indentures restrict or limit our and our subsidiaries’ ability to, among other things, incur or guarantee additional indebtedness; pay dividends or distributions on, or redeem or repurchase capital stock and make other restricted payments; make investments; consummate certain asset sales; engage in certain transactions with affiliates; grant or assume certain liens; and consolidate, merge or transfer all or substantially all of our assets. In addition, both our
export credit facilities and our non-export credit facilities contain covenants that will, once our current waivers expire, require us, among other things, to maintain a specified minimum fixed charge coverage ratio and limit our net debt-to-capital ratio. In addition, our ECA facility amendments also require us to maintain minimum liquidity and a minimum stock holders' equity. Refer to Note 8. Debt to our consolidated financial statements under Item 8. Financial Statements and Supplemental Data for further discussion on our covenants and existing waivers.
All of these limitations are subject to significant exceptions and qualifications. Despite these exceptions and qualifications, we cannot assure you that the operating and financial restrictions and covenants in certain of our debt instruments will not adversely affect our ability to finance our future operations or capital needs or engage in other business activities that may be in our interest. Any future indebtedness may include similar or other restrictive terms. In addition, our ability to comply with these covenants and restrictions may be affected by events beyond our control. These include prevailing economic, financial and industry conditions. If we breach any of these covenants or restrictions, we could be in default under such indebtedness and certain of our other debt instruments, and the relevant debt holders or lenders could elect to declare the debt, together with accrued and unpaid interest and other fees, if any, immediately due and payable and proceed against any collateral securing that debt. If the debt under certain of our debt instruments that we enter into were to be accelerated, our liquid assets may be insufficient to repay in full such indebtedness. Borrowings under other debt instruments that contain cross-default provisions also may be accelerated or become payable on demand. In these circumstances, our assets may not be sufficient to repay in full that indebtedness and our other indebtedness then outstanding.
In addition, our ability to maintain our credit facilities may also be impacted by changes in our ownership base. More specifically, we may be required to prepay our non-ECA and ECA facilities if any person acquires ownership of more than 50% of our common stock or, subject to certain exceptions, during any 24-month period, a majority of our board of directors is no longer comprised of individuals who were members of our board of directors on the first day of such period. Our public debt securities also contain change of control provisions that would be triggered by a third-party acquisition of greater than 50% of our common stock coupled with a ratings downgrade, which would require us to offer to repurchase our public debt securities in the event of such change of control.
If we elect to settle conversions of our convertible notes in shares of our common stock or a combination of cash and shares of our common stock, conversions of our convertible notes will result in dilution for our existing shareholders.
We have an aggregate principal amount of $1.725 billion in convertible notes outstanding. If note holders elect to convert, the notes will be converted into our shares of common stock, cash, or a combination of common stock and cash, at our discretion. Prior to March 15 and August 15, 2023, our convertible notes issued June 2020 and October 2020, respectively, will be convertible at the option of holders during certain periods only upon satisfaction of certain conditions. Beyond those dates, the convertible notes will be convertible at any time until the close of business on the second scheduled trading day immediately preceding their maturity date. Conversions of our convertible notes in shares of our common stock or a combination of common stock and cash, will result in dilution to our shareholders.
We did not declare quarterly dividends on our common stock in 2021 and do not expect to pay dividends on our common stock for the foreseeable future.
No cash dividends were declared on our common stock during the year ended December 31, 2021. We expect that any income received from operations will be devoted to our future operations and recovery. We do not expect to pay cash dividends on our common stock for the foreseeable future due to our agreement with certain of our lenders not to pay dividends until the end of the third quarter of 2022. In addition, in the event we thereafter declare a dividend, we will need to repay our debt deferral. Payment of dividends would, in any case, depend upon our profitability at the time, cash available for those dividends, and other factors as our board of directors may consider relevant.
Increased regulatory oversight, and the phasing out of LIBOR may adversely affect the value of a portion of our indebtedness.
The publication of certain LIBOR settings ceased after December 31, 2021, and uncertainty regarding alternative reference rates remains as many market participants await a wider adoption of replacement products prior to the cessation of the remaining USD LIBOR tenors (currently scheduled for June 30, 2023). When LIBOR ceases to exist, the level of interest payments on the portion of our indebtedness that bears interest at variable rates might be affected if we, the agent, and/or the lenders holding a majority of the outstanding loans or commitments under such indebtedness fail to amend such indebtedness to implement a replacement rate. Regardless, such replacement rate will give due consideration to any evolving or then-existing conventions for similar credit facilities, which may result in different than expected interest payments.
Macroeconomic, Business, Market and Operational Risks
Adverse worldwide economic or other conditions could reduce the demand for cruises and passenger spending, adversely impacting our operating results, cash flows and financial condition including impairing the value of our goodwill, ships,
trademarks and other assets and potentially affecting other critical accounting estimates where the changeimpact may be material to our operating results.
In addition to health and safety concerns, demandDemand for cruises is affected by international, national, and local economic conditions. Weak or uncertain economic conditions may impact consumer confidence and pose a risk as vacationers postpone or reduce discretionary spending. This, in turn, may result in cruise booking slowdowns, decreased cruise prices and lower onboard revenues. Given the global nature of our business, we are exposed to many different economies, and our business could be hurtnegatively impacted by challenging conditions in any of our markets. Additionally, the continued impact of COVID-19 on the financial markets is uncertain andin which we cannot predict its effect on geopolitical eventsoperate, and/or international trade policies as countries attempt to mitigate the impact of the pandemic and as they re-open their economies or re-implement lockdown measures.related reactions by our competitors in such markets.
Our operating costs could increase due to market forces and economic or geopolitical factors beyond our control.
Our operating costs, including fuel, food, payroll and benefits, airfare, taxes, insurance, and security costs, can be and have been subject to increases due to market forces and economic or geopolitical conditions or other factors beyond our control, including the global inflationary pressures, that we are currently experiencing and thatwhich have increased our operating costs. In connection with the COVID-19 pandemic, we've incurred increased operating costs, including as a result of rerouting itineraries due to ports closing or not accepting passengers. Increases in these operating costs couldhave affected, and may continue to adversely affect, our future profitability.
Any further impairment of our goodwill, long-lived assets, equity investments and notes receivable could adversely affect our financial condition and operating results.
We evaluate goodwill for impairment on an annual basis, or more frequently when circumstances indicate that the carrying value of a reporting unit may not be recoverable. A challenging operating environment (such as is currently being experienced due to the impact of COVID-19), conditions affecting consumer demand or spending, the deterioration of general macroeconomic conditions, or other factors could result in a change to the future cash flows we expect to derive from our operations. Reductions of cash flows used in the valuation analyses may result in the recording of impairments, which could adversely affect our financial condition and operating results. Refer to Item 7. Management's Discussion and Analysis of Financial Condition and Results of Operations number for further comments on impairments.
Price increases for commercial airline services for our guests or major changes or reduction in commercial airline services and/or availability could adversely impact the demand for cruises and undermine our ability to provide reasonably priced vacation packages to our guests.
Many of our guests depend on scheduled commercial airline services to transport them to or from the ports where our cruises embark or disembark. Increases in the price of airfare would increase the overall price of the cruise vacation to our guests, which may adversely impact demand for our cruises. In addition, changes in the availability and/or regulations governing commercial airline services including those resulting from the COVID-19 pandemic, have adversely affected and could continue to adversely affect our guests’ ability to obtain air travel, as well as our ability to transfer our guests to or from our cruise ships, which could adversely affect our results of operations.
Terrorist attacks, war, and other hostilitiessimilar events could have a negativematerial adverse impact on our business and results of operations.
Events such asWe are susceptible to a wide range of adverse events, including terrorist attacks, war, (or war-like conditions), conflicts, (domestic or cross-border), civil unrest and other hostilities, includinghostilities. The occurrence of these events or an escalation in the frequency or severity of incidents,them, and the resulting political instability, travel restrictions and advisories and concerns over safety and security aspects of traveling or the fear of any of the foregoing, have had, and could have in the future, a significant adverse impact on demand and pricing in the travel and vacation industry. In view of our global operations, we are susceptible to a wide range of adverse events. These events could also result in additional security measures taken by local authorities which have, and may potentiallyin the future, impact access to ports and/or destinations. In addition, such events have led, and could lead, to disruptions, instability and volatility in global markets, supply chains and industries, increased operating costs, such as fuel and food, and disruptions affecting our newbuild construction and fleet modernization efforts, any of which could materially and adversely impact our business and results of operations. Further, such events could have the effect of heightening the other risks we have described in this report, any of which also could materially and adversely affect our business and results of operations.
Disease outbreaks and an increase in concern about the risk of illness could adversely impact our business and results of operations.operations, and may cause significant disruptions, create new risks, and exacerbate existing risks.
Disease outbreaks and increased concern related to illness when travellingtraveling to, from, and on our ships, could cause a dropdecrease in demand for cruises, guest cancellations, travel restrictions, an unavailability of ports and/or destinations, cruise cancellations, ship redeployments and an inability to source our crew, provisions or supplies from certain places. In addition, we may be subject to increased concernsconsumer perception that cruises are more susceptible than other vacation alternatives to the spread of infectious diseases such as COVID-19.diseases. For example, the unprecedented responses by governments and other authorities to control and contain the COVID-19 outbreak, including related variants, led to our voluntary suspension of our global cruise operations starting in March 2020. While we have resumed our global cruise operations, there is no assurance that our cruise operations will not be
interrupted. In response to disease outbreaks, our industry, including our passengers and crew, may be subject to enhanced health and safety requirements in the future which may be costly and take a significant amount of time to implement across our fleet. For example, local governments may establish their own set of rules for self-quarantines and/or require proof of individualsindividuals' health status or vaccination prior to or upon visiting. Based on our assessment of these requirements and recommendations, or for other reasons, we may determine it necessary to cancel or modify certain of our Global Brands’ cruise sailings. The impact of any of these factors could have a material adverse effect on our business and results of operations. In addition, the newany operating or health protocols we are developing and any other health protocolthat we may develop or that
may be required by law in the future in response to infectious diseases may be costly to develop and difficult to implement and may be less effective than we expected in reducing the risk of infection and spread of such disease on our cruise ships, all of which will negatively impact our operations and expose us to reputational and legal risks.
Incidents on ships, at port facilities, land destinations and/or affecting the cruise vacation industry in general, and the associated negative media coverage and publicity, have affected and could continue to affect our reputation and impact our sales and results of operations.
Cruise ships, private destinations, port facilities and shore excursions operated and/or offered by us and third parties may be susceptible to the risk of accidents, illnesses, mechanical failures, environmental incidents, inappropriate crew or passenger behavior, and other incidents which could bring into question safety, health, security and vacation satisfaction of our guests and negatively impact our sales, operations and reputation. Incidents involving cruise ships, and, in particular the safety, health and security of guests and crew and the media coverage thereof, including those related to the COVID-19 pandemic, have impacted and could continue to impact demand for our cruises and pricing in the industry. In particular, we cannot predict the impact on our financial performance and the public’s concern regarding the health and safety of travel, especially by cruise ship, and related decreases in demand for travel and cruising. Moreover, our ability to attract and retain guests and crew depends, in part, upon the perception and reputation of our company and our brands and the public’s concerns regarding the health and safety of travel generally, as well as regarding the cruising industry and our ships specifically. Our reputation and our business could also be damaged by continued or additional negative publicity regarding the cruise industry in general, including publicity regarding the spread of contagious disease, such as COVID-19, over-tourism in key ports and destinations and the potentially adverse environmental impacts of cruising. The considerable expansion in the use of social and digital media has compounded the potential scope and reach of any negative publicity. In addition, incidents involving cruise ships may result in additional costs to our business, increasing government or other regulatory oversight and, in certain cases, potential litigation.
Significant weather, climate events and/or natural disasters could adversely impact our business and results of operations.
Natural disasters (e.g., earthquakes, volcanos, wildfires), weather and/or climate events (including hurricanes and typhoons) could impact our source markets and operations resulting in travel restrictions, guest cancellations, an inability to source our crew or our provisions and supplies from certain places. We are often forcedmay be required to alter itineraries and occasionally cancel a cruise or a series of cruises or to redeploy our ships due to these types of events, which could have an adverse effect on our sales, operating costs and profitability in the current and future periods. Increases in the frequency, severity or duration of these types of events could exacerbate their impact and disrupt our operations or make certain destinations less desirable or unavailable impacting our revenues and profitability further. Any of the foregoing could have an adverse impact on our results of operations and on industry performance.
Our sustainability activities, including environmental, social and governance (ESG) matters, could result in reputational risks, increased costs and other risks.
Customers, investors, lenders, regulators and other industry stakeholders have placed increasing importance on corporate ESG practices and on the implications and social cost of their investments, which could cause us to incur additional costs and changes to our operations. If our ESG practices or disclosures do not meet investor or industry stakeholders' evolving expectations and standards, our customer and employee and supply chain vendor retention, our access to certain types of capital, including export credit financing, and our brands and reputation may be negatively impacted, which could affect our business operations and financial condition. We could also incur additional costs and require additional resources to monitor, report and comply with various ESG practices, which could increase our operating costs and affect our results of operations and financial condition.
In addition, from time to time, we communicate certain initiatives regarding climate change and other ESG matters. We could fail or be perceived to fail to achieve such initiatives, which may negatively affect our reputation. The future adoption of new technology or processes to achieve the initiatives could also result in the impairment of existing assets.
Our reliance on shipyards, their subcontractors and our suppliers to implement our newbuild and ship upgrade programs and to repair and maintain our ships exposes us to risks which could adversely impact our business.
We rely on shipyards, their subcontractors and our suppliers to effectively construct our new ships and to repair, maintain, and upgrade our existing ships on a timely basis and in a cost-effectivecost effective manner. There are a limited number of shipyards with
the capability and capacity to build, repair, maintain and/or upgrade our ships. As such, any disruptions affecting the newbuild or fleet modernizationshipyard supply chain will adversely impact our business as there are limited substitutes.
The COVID-19 pandemic has led toIn addition, suspensions and/or slowdowns of work at certain shipyards, which impactshave impacted and could continue to impact our ability to construct new ships when and as planned, our ability to timely and cost-effectively procure new capacity, and our ability to execute scheduled drydocks and/or fleet modernizations. The effects of the COVID-19 pandemic on the shipyards, their subcontractors, and our suppliers have resulted in delays in our previously scheduled ship deliveries. Variations from our plan could have a significant negative impact on our business operations and financial condition.
Building, repairing, maintaining and/or upgrading a ship is sophisticated work that involves significant risks. Material increases in commodity and raw material prices, and other cost pressures impacting the construction of a new ship, such as the cost or availability of labor and financing, could adversely impact the shipyard’s ability to build the ship on a cost-effective basis. We may be impacted if shipyards, their subcontractors, and/or our suppliers encounter "force majeure events", insolvencies or other financial difficulties, supply chain, technical or design problems when building or repairing a ship. If materialized, theseThese problems couldhave impacted and may in the future impact the timely delivery or cost of new ships or the ability of shipyards to repair and upgrade our fleet in accordance with our needs or expectations. In addition, delays, mechanical faults and/or unforeseen incidents may result in cancellation of cruises or delays of new ship orders or necessitate unscheduled drydocks. Such events could result in lost revenue, increased operating expenses, or both, and thus adversely affect our results of operations.
An increase in capacity worldwide or excess capacity in a particular market could adversely impact our cruise sales and/or pricing.
Although our ships can be redeployed, cruise sales and/or pricing may be impacted by the introduction of new ships into the marketplace, reductions in cruise capacity, overall market growth and deployment decisions of ourselves and our competitors. As of December 31, 2021,2023, a total of 7851 new ships with approximately 183,000110,000 berths were on order for delivery through 20272028 in the cruise industry, including 12eight ships currently scheduled to be delivered to us.our Global and Partner Brands. The further net growth in capacity from these new ships and future orders, without an increase in the cruise industry’s demand and/or share of the vacation market, could depress cruise prices and impede our ability to achieve yield improvement. Further, cruise prices and yield improvement could face additional pressure due to the pace at which we and other cruise line operators return to service.
In addition, to the extent that we or our competitors deploy ships to a particular itinerary/region and the resulting capacity in that region exceeds the demand, it may negatively affect our pricing and profitability. Any of the foregoing could have an adverse impact on our results of operations, cash flows and financial condition, including potentially impairing the value of our ships and other assets.
Unavailability of ports of call may adversely affect our results of operations.
We believe that port destinations are a major reason why guests choose to go on a particular cruise or on a cruise vacation. The availability of ports and destinations is affected by a number of factors, including industry demand and competition for key ports and destinations, existing capacity constraints, constraints related to the size of certain ships, security, financial limitations on port development, exclusivity arrangements that ports may have with our competitors, geopolitical developments, and local governmental regulations. In light of the COVID-19 pandemic, port availability could also be subjectregulations, environmental regulations, and governmental response to immediate change depending on local and/or onboard disease cases or other government restrictions as well as to limited availability during the resumption of operations.outbreaks. Higher fuel costs also may adversely impact the destinations on certain of our itineraries as they become too costly to include.
In addition, certain ports and destinations have faced a surge of both cruise and non-cruise tourism which, in certain cases, has fueled anti-tourism sentiments and related countermeasures to limit the volume of tourists allowed in these destinations. In certain destinations, countermeasures to limit the volume of tourists have been contemplated and/or put into effect, including proposed limits on cruise ships and cruise passengers. Potential restrictions in ports and destinations, such as Venice, Barcelona or Key West,passengers, which could limit the itinerary and destination options we can offer our passengers going forward.
Increased demand and competition for key ports of call or destinations, limitations on the availability or feasibility of use of specific ports of call and/or constraints on the availability of shore excursions and other service providers at such ports or destinations could adversely affect our operations and financial results.
We may lose business to competitors throughout the vacation market.
We operate in the vacation market and cruising is one of many alternatives for people choosing a vacation. We, therefore, risk losing business not only to other cruise lines, but also to other vacation operators, which provide other leisure options, including hotels, resorts (including all-inclusive resorts), internet-based alternative lodging sites, andtheme parks, sightseeing destinations, package holidays and tours.
We face significant competition from other cruise lines on the basis of cruise pricing, travel advisor preference and also in terms of the nature of ships, services and destinations that we offer to guests. Our principal competitors within the cruise vacation industry include Carnival Corporation & plc, which owns, among others, Aida Cruises, Carnival Cruise Line, Costa Cruises, Cunard Line, Holland America Line, P&O Cruises, Princess Cruises and Seabourn; Disney Cruise Line; MSC Cruises; and Norwegian Cruise Line Holdings Ltd, which owns Norwegian Cruise Line, Oceania Cruises and Regent Seven Seas Cruises. Our revenues are sensitive to the actions of other cruise lines in many areas including pricing, scheduling, capacity and promotions, which can have a substantial adverse impact not only on our revenues, but also on overall industry revenues.
In the event that we do not effectively market or differentiate our cruise brands from our competitors or otherwise compete effectively with other vacation alternatives and new or existing cruise companies, our results of operations and financial position could be adversely affected.
If we are unable to appropriately balancemanage our cost management and capital allocation strategies with our goal of satisfying guest expectations, it may adversely impact our business success.
Our goals areWe strive to provide high quality products and deliver high quality services. There can be no assurance that we can successfully balance these goals with our cost management and capital allocation strategies. Our business also requires us to make capital allocation decisions across a broad scope of investment options with varying return profiles and time horizons for value realization. These include significant capital investment decisions such as ordering new ships, upgrading our existing fleet, enhancing our technology and/or data capabilities and expanding our portfolio of land-based assets, based on expected market preferences, competition and projected demand. There can be no assurance that our strategies will be successful, which could adversely impact our business, financial condition and results of operations. For example, our ownership and operation ofInvestments in older tonnage, in particular, duringrun the business disruption caused by COVID-19, has resulted in impaired asset values due torisk of not meeting expected returns that we will not be able to recover.and diluting related asset values.
Our attempts to expand our businessexpansion into new markets and investments in new ventures and land-based destination projects may not be successful.
We opportunistically seek to grow our business through, among other things, expansion into new destinations or source markets and establishment of new ventures complementary to our current offerings. These attempts to expand our business increase the complexity of our business, require significant levels of investment and can strain our management, personnel, operations and systems. In addition, we have beenmay be unable to execute our attempts to expand our business as a result of the impacts of the COVID-19 pandemic, as described elsewhere herein.business. There can be no assurance that these business expansion efforts will develop as anticipated or that we will succeed, and if we do not, we may be unable to recover our investment, which could adversely impact our business, financial condition and results of operations.
Risks associated with our development and operation of key land-based destination projects may adversely impact our business or results of operations.
We have also invested, either directly or indirectly through joint ventures and partnerships, in a growing portfolio of key land-based projects including port and terminal facilities, private destinations and multi-brand destination projects. These investments can increase our exposure to certain key risks depending on the scope, location, and the ownership and management structure of these projects. These risks include susceptibility to weather events, exposure to local political/regulatory developments and policies, logistical challenges and human resource and labor risks and safety, environmental, and health risks, including challenges posed by the COVID-19 pandemic and its effects locally where we have these projects and relationships.risks.
Our reliance on travel advisors to sell and market our cruises exposes us to certain risks which could adversely impact our business.
We rely on travel advisors to generate bookings for our ships.global brands. Accordingly, we must maintain competitive commission rates and incentive structures. If we fail to offer competitive compensation packages or fail to maintain our relationships, these agencies may be incentivized to sell cruises offered by our competitors, which could adversely impact our operating results. Our reliance on third-party sellers is particularly pronounced in certain markets. In addition, the travel advisor community is sensitive to economic conditions that impact discretionary income of consumers. Significant disruptions such as those caused by the COVID-19 pandemic, or contractions in the industry could reduce the number of travel advisors available for us to market and sell our cruises, which could have an adverse impact on our financial condition and results of operations. Additionally, the strength of our recovery from suspended operations could be delayed if we are not aligned and partnered with key travel advisors.
Business activities that involve our co-investments with third parties may subject us to additional risks.
Partnerships, joint ventures and other business structures involving our co-investments with third parties generally include some form of shared control over the operations of the business and create additional risks, including the possibility that other investors in such ventures become bankrupt or otherwise lack the financial resources to meet their obligations or could have or develop business interests, policies or objectives that are inconsistent with ours. In addition to financial risks, our co-investment activities have also presented managerial and operational risks and expose us to reputational or legal concerns. These or other issues related to our co-investments with third parties could adversely impact our operations or liquidity. Due to the COVID-19 pandemic, Pullmantur S.A. filed for reorganization under the terms of the Spanish insolvency laws. The Company may be required to continue to provide funding for these affiliated entities and it is unclear when and to what extent these entities will fully resume operations and our ability to provide such funding will be limited by the level and terms of our outstanding indebtedness. Further, due to the arrangements we have in place with our partners in these ventures, we are limited in our ability to control the strategy of these ventures, if and when they resume operations, or their use of capital and other key factors to their results of operation, which could adversely affect our investments and impact our results of operations.
Past or pending business acquisitions or potential acquisitions that we may decide to pursue in the future carry inherent risks which could adversely impact our financial performance and condition.
The Company, from time to time, has engaged in acquisitions and may pursue acquisitions in the future, which are subject to, among other factors, the Company’s ability to identify attractive business opportunities and to negotiate favorable terms for such opportunities. Accordingly, the Company cannot make any assurances that potential acquisitions will be completed timely
or at all, or that if completed, we would realize the anticipated benefits of such acquisitions. Acquisitions also carry inherent risks such as, among others: (i) the potential delay or failure of our efforts to successfully integrate business processes and realizing expected synergies; (ii) difficulty in aligning procedures, controls and/or policies; and (iii) future unknown liabilities and costs that may be associated with an acquisition. In addition, acquisitions may adversely impact our liquidity and/or debt levels, and the recognized value of goodwill and other intangible assets can be negatively affected by unforeseen events and/or circumstances, which may result in an impairment charge. Any of the foregoing events could adversely impact our financial condition and results of operations.
We rely on supply chain vendors and third-party service providers who are integral to the operations of our businesses. These vendors and service providers are also affected by COVID-19 and may be unable or unwilling to deliver on their commitments or may act in ways that could harm our business.
We rely on supply chain vendors to deliver key products to the operations of our businesses around the world. Any event impacting a vendor’s ability to deliver goods of the expected quality at the location and time needed could negatively impact our ability to deliver our cruise experience. Events impacting our supply chain could be caused by factors beyond the control of our suppliers or us, including inclement weather, natural disasters, new laws and regulations, labor actions, increased demand, problems in production or distribution, cybersecurity events, and/or disruptions in third-party logistics or transportation systems, including those caused by the COVID-19 pandemic.systems. Any such interruptions to our supply chain could increase our costs and could limit the availability of products critical to our operations. In addition, increased regulation or stakeholder expectations regarding sourcing practices, or supplier conduct that does not meet such standards, could cause our operating costs to increase or result in publicity that negatively affects our reputation.
In order to achieve cost and operational efficiencies, we outsource to third-party vendors certain services that are integral to the operations of our global businesses, such as our onboard concessionaires, certain of our call center operations, guest port services, logistics distribution and operation of a large part of our information technology systems, all of which are also affected by the COVID-19 pandemic.systems. We are subject to the risk that certain decisions are subject to the control of our third-party service providers and that these decisions may adversely affect our activities. A failure to adequately monitor a third-party service provider’s compliance with a service level agreement or regulatory or legal requirements could result in significant economic and reputational harm to us. There is also a risk the confidentiality, privacy and/or security of data held by third parties or communicated over third-party networks or platforms could become compromised.
The potential unavailability of insurance coverage, an inability to obtain insurance coverage at commercially reasonable rates or our failure to have coverage in sufficient amounts to cover our incurred losses may adversely affect our financial condition or results of operations.
We seek to maintain appropriate insurance coverage at commercially reasonable rates. We normally obtain insurance based on the cost of an asset rather than replacement value, and we also elect to self-insure, co-insure, or use deductibles in certain circumstances for certain risks such as loss of use of a ship or other business interruption. The limits of insurance coverage we purchase are based on the availability of the coverage, evaluation of our risk profile and cost of coverage. We do not carry business interruption insurance and accordingly we have no insurance coverage for loss of revenues or earnings from our ships or other operations. Accordingly, we are not protected against all risks and cannot be certain that our coverage will be adequate for liabilities actually incurred which could result in an unexpected decrease in our revenue and results of operations in the event of an incident.
We are members of four Protection and Indemnity (“P&I”) clubs, which are part of a worldwide group of 1312 P&I clubs, known as the International Group of P&I Clubs (the “IG”). P&I coverage provided by the clubs is on a mutual basis, and we are subject to additional premium calls in the event of a catastrophic loss incurred by any member of the 1312 P&I clubs, whereby the reinsurance limits purchased by the IG are exhausted. We are also subject to additional premium calls based on investment and underwriting shortfalls experienced by our own individual insurers. Certain liabilities, costs, and expenses associated with COVID-19 cases identified on or traced to our vessels are eligible for insurance coverage under our participation in these P&I clubs.
We cannot be certain that insurance and reinsurance coverage will be available to us and at commercially reasonable rates in the future or at all or, if available, that it will be sufficient to cover potential claims. Additionally, if we or other insureds sustain significant losses, the result may be higher insurance premiums, cancellation of coverage, or the inability to obtain coverage. The COVID-19 pandemic, for example, depending on its duration and the associated insurance claims volumes, may potentially impact the insurance markets we rely on for coverage and could adversely impact both the coverage options available to us in the future as well as the premium costs we are required to pay for those coverages. Such events could adversely affect our financial condition or results of operations.
Disruptions in our shoreside or shipboard operations or our information systems may adversely affect our results of operations.
Our principal executive office and principal shoreside operations are located in Florida, and we have shoreside offices throughout the world. Actual or threatened natural disasters (e.g., hurricanes/typhoons, earthquakes, tornadoes, fires or floods), municipal lockdowns, curfews, quarantines, or similar events in these locations may have a material impact on our business continuity, reputation and results of operations. In addition, substantial or repeated information system failures, computer
viruses or cyber attacks impacting our shoreside or shipboard operations could adversely impact our business. We do not generally carry business interruption insurance for our shoreside or shipboard operations or our information systems. As such, any losses or damages incurred by us could have an adverse impact on our results of operations.
Provisions of our Articles of Incorporation, By-Laws and Liberian law could inhibit a change of control and may prevent efforts by our shareholders to change our management.
Certain provisions of our Articles of Incorporation and By-Laws and Liberian law may inhibit third parties from effectuating a change of control of the Company without approval from our board of directors which could result in the entrenchment of current management. These include provisions in our Articles of Incorporation that prevent third parties, other than A. Wilhelmsen AS and Cruise Associates and their permitted transferees, from acquiring beneficial ownership of more than 4.9% of our outstanding shares without the consent of our board of directors.
We may not be able to achieve our fiscal 2025 financial and climate-related performance goals.
In November 2022, we announced that we are targeting certain financial and climate-related performance goals for fiscal 2025. Our ability to achieve these goals is dependent on a number of factors, including the other risk factors described in this section. If we are not able to achieve these goals, the price of our common stock and reputation may be negatively affected.
Financial Risks
We may not be able to obtain sufficient financing or capital for our needs or may not be able to do so on terms that are acceptable or consistent with our expectations.
To fund our capital expenditures (including new ship orders), operations and scheduled debt payments, we have historically relied on a combination of cash flows provided by operations, drawdowns under available credit facilities, the incurrence of additional indebtedness and the sale of equity or debt securities in private or public securities markets.
Although we believe we can access sufficient liquidity to fund our operations, investments and obligations as expected, there can be no assurances to that effect. Our ability to access additional funding as and when needed, our ability to timely refinance and/or replace our outstanding debt securities and credit facilities on acceptable terms and our cost of funding will depend upon numerous factors including, but not limited to, the strength of the financial markets, global market conditions, including inflationary pressures, interest rate fluctuations, credit rating downgrades, our financial performance, the recovery and performance of our industry in general and the size, scope and timing of our financial needs. In addition, even where financing commitments have been secured, significant disruptions in the capital and credit markets could cause our banking and other counterparties to breach their contractual obligations to us or could cause the conditions to the availability of such funding not to be satisfied. This could include failures of banks or other financial service companies to fund required borrowings under our loan agreements or to pay us amounts that may become due or return collateral that is refundable under our interest rate derivative instruments or other agreements. If any of the foregoing occurs for a prolonged period of time it will have a long-term negative impact on our cash flows and our ability to meet our financial obligations.
Our substantial debt requires a significant amount of cash to service and could adversely affect our financial condition.
We have a substantial amount of debt and significant debt service obligations. As of December 31, 2023, we had total debt of $21.5 billion. Our substantial debt has required us to dedicate a large portion of our cash flow from operations to service debt and fund repayments on our debt, thereby reducing the availability of our cash flow to fund working capital, capital expenditures and other general corporate expenses.
Our ability to make future scheduled payments on our debt service obligations or refinance our debt depends on our future operating and financial performance and ability to generate cash. This will be affected by our ability to successfully implement our business strategy, as well as general economic, financial, competitive, regulatory and other factors beyond our control. If we cannot generate sufficient cash to meet our debt service obligations or fund our other business needs, we may, among other things, need to refinance all or a portion of our debt, obtain additional financing, delay planned capital expenditures or sell assets. We cannot assure that we will be able to generate sufficient cash through any of the foregoing. If we are not able to refinance any of our debt, obtain additional financing or sell assets on commercially reasonable terms or at all, we may not be able to satisfy our obligations with respect to our debt.
Our substantial debt could also result in other negative consequences for us. For example, it could increase our vulnerability to adverse general economic or industry conditions; limit our flexibility in planning for, or reacting to, changes in our business or the industry in which we operate; place us at a competitive disadvantage compared to our competitors that have less debt; make us more vulnerable to downturns in our business, the economy or the industry in which we operate; limit our ability to raise additional debt or equity capital in the future to satisfy our requirements relating to working capital, capital expenditures, development projects, strategic initiatives or other purposes; restrict us from making strategic acquisitions,
introducing new technologies or exploiting business opportunities; limit or restrict our ability to obtain and maintain performance bonds to cover our financial responsibility requirements in various jurisdictions for non-performance of guest travel, casualty and personal injury; make it difficult for us to satisfy our obligations with respect to our debt; and increase our exposure to the risk of increased interest rates as certain of our borrowings are (and may in the future be) at a variable rate of interest.
Despite our leverage, we may incur more debt. Although certain of our debt instruments, including our export credit facilities, contain restrictions on the incurrence of additional debt, these restrictions are subject to a number of significant qualifications and exceptions, and under certain circumstances the amount of debt that could be incurred in compliance with these restrictions could be substantial. If new debt is added to our existing debt levels, the related risks that we now face would increase. Additionally, there is no guarantee that financing will be available in the future or that such financing will be available with similar terms or terms that are commercially acceptable to us. As of December 31, 2023, we have commitments for approximately $5.5 billion of debt to finance the purchase of five ships on order by our Royal Caribbean International, Celebrity Cruises and Silversea Cruises brands, all of which are guaranteed by the export credit agencies in the countries in which the ships are being built. The ultimate size of each facility will depend on the final contract price (including change orders and owner’s supply) as well as fluctuations in the EUR/USD exchange rate. Refer to Note 8. Debt to our consolidated financial statements under Item 8. Financial Statements and Supplementary Data for further information regarding our "Secured Notes" and "Priority Guaranteed Notes".
We are subject to restrictive debt covenants that may limit our ability to finance our future operations and capital needs and to pursue business opportunities and activities. In addition, if we fail to comply with any of these restrictions, it could have a material adverse effect on us.
Certain of our debt instruments, including our indentures and our unsecured bank and export credit facilities, limit our flexibility in operating our business. For example, certain of our loan agreements and indentures restrict or limit our and our subsidiaries’ ability to, among other things, incur or guarantee additional indebtedness; pay dividends or distributions on, or redeem or repurchase capital stock and make other restricted payments; make investments; consummate certain asset sales; engage in certain transactions with affiliates; grant or assume certain liens; and consolidate, merge or transfer all or substantially all of our assets. In addition, both our export credit facilities and our non-export credit facilities contain covenants that require us, among other things, to maintain a minimum liquidity, a specified minimum fixed charge coverage ratio, and limit our net debt-to-capital ratio. In addition, our ECA facilities also require us to maintain a minimum stockholders' equity. Refer to Note 8. Debt to our consolidated financial statements under Item 8. Financial Statements and Supplementary Data for further discussion on our covenants and existing waivers.
All of these limitations are subject to significant exceptions and qualifications. Despite these exceptions and qualifications, we cannot assure you that the operating and financial restrictions and covenants in certain of our debt instruments will not adversely affect our ability to finance our future operations or capital needs or engage in other business activities that may be in our interest. Any future indebtedness may include similar or other restrictive terms and we may be required to further encumber our assets. In addition, our ability to comply with these covenants and restrictions may be affected by events beyond our control. These include prevailing economic, financial and industry conditions. If we breach any of these covenants or restrictions, we could be in default under such indebtedness and certain of our other debt instruments, and the relevant debt holders or lenders could elect to declare the debt, together with accrued and unpaid interest and other fees, if any, immediately due and payable and proceed against any collateral securing that debt. If the debt under certain of our debt instruments that we enter into were to be accelerated, our liquid assets may be insufficient to repay in full such indebtedness. Borrowings under other debt instruments that contain cross-default provisions also may be accelerated or become payable on demand. In these circumstances, our assets may not be sufficient to repay in full that indebtedness and our other indebtedness then outstanding.
In addition, our ability to maintain our credit facilities may also be impacted by changes in our ownership base. More specifically, we may be required to prepay our non-ECA and ECA facilities if any person acquires ownership of more than 50% of our common stock or, subject to certain exceptions, during any 24-month period, a majority of our board of directors is no longer comprised of individuals who were members of our board of directors on the first day of such period. Our debt securities also contain change of control provisions that would be triggered by a third-party acquisition of greater than 50% of our common stock coupled with a ratings downgrade, which would require us to offer to repurchase our debt securities in the event of such change of control.
If we elect to settle conversions of our convertible notes in shares of our common stock or a combination of cash and shares of our common stock, conversions of our convertible notes will result in dilution for our existing shareholders.
We have an aggregate principal amount of $1.2 billion in convertible notes outstanding. If note holders elect to convert, the notes will be converted into our shares of common stock, cash, or a combination of common stock and cash, at our
discretion. After May 15, 2025, our convertible notes issued in August 2022, will be convertible at the option of holders until the close of business on the second scheduled trading day immediately preceding their maturity date. Conversions of our convertible notes into shares of our common stock or a combination of common stock and cash, will result in dilution to our shareholders.
Our dividend policy may change without notice and any payment of dividends in the future is subject to the discretion of our Board of Directors.
We have not declared a dividend since the first quarter of 2020. Any future determination relating to our dividend policy will be made at the discretion of our Board of Directors and will depend on a number of factors, including our profitability at the time, cash available for those dividends, and other factors as our board of directors may consider relevant. In the event we declare a dividend, we will need to repay amounts deferred under the export credit facilities.
Compliance and Regulatory Risks
Changes in U.S. or other countries’ foreign travel policy have affected, and may continue to affect our results of operations.
Changes in U.S. and other countries' foreign policy have in the past and could in the future result in the imposition of travel restrictions or travel bans on U.S. persons to certain countries or result in the imposition of travel advisories, warnings, rules, regulations or legislation exposing us to penalties or claims of monetary damages. In addition, some countries have previously adopted restrictions against U.S. travelers, and we currently cannot predict when those restrictions will be eased.travelers. The timing and scope of these changes and regulations can be unpredictable, and they could cause us to cancel scheduled sailings, possibly on short notice, or could result in litigation against us. This, in turn, could decrease our revenue, increase our operating costs and otherwise impair our profitability.
Environmental, labor, health and safety, financial responsibilityFactors associated with climate change, including an increasing global regulatory focus, could adversely affect our business.
There is increasing global regulatory focus on climate change, greenhouse gas and other maritime regulationsemissions. These regulatory efforts, both internationally and measures couldin the U.S., are still developing, including the international alignment of such efforts, and we cannot yet determine what the final regulatory programs or their impact will be on our business. However, such climate change-related regulatory activity in the future may adversely affect operationsour business and financial results by requiring us to reduce our emissions, pay for our emissions, modify our itineraries and may increase our exposure, if any, to climate change-related litigation. Such activity may also impact us by increasing our operating costs, including fuel costs. For example, the European Union has proposed and enacted parts of a series of significant carbon reforms under its Fit for 55 package designed to meet its 2030 emission goals, which would require us, among other things, to increase the use of low carbon fuel onboard our vessels as well as connectivity to shore power. Part of the reforms that were enacted includes updates to the European Union Emission Trading System that imposes requirements on us to purchase carbon emission allowances for our qualified emissions beginning in 2024.
TheIn addition, the U.S. and various state and foreign government or regulatory agencies have enacted, or may enact, environmental regulations or policies, such as requiring the use of low sulfur fuels (e.g., IMO 2020)Sulfur Limit) or the incoming carbon intensity indicator regulation ("CII"), that have or could increase our direct cost to operate in certain markets, increase our cost of fuel, limit the supply of compliant fuel, cause us to incur significant expenses to purchase and/or develop new equipment and adversely impact the cruise vacation industry. While we have taken and expect to continue to take a number of actions to mitigate the potential impact of certain ofIf enacted, these regulations there can be no assurances that these efforts will be successful over the long term.
There is increasing global regulatory focusmay individually or collectively have a material adverse effect on climate change, greenhouse gas and other emissions. These regulatory efforts, both internationally and in the U.S., are still developing, and we cannot yet determine what the final regulatory programs or their impact will be. However, such climate change-related regulatory activity in the future may adversely affect our business and results of operations due to increased costs associated with compliance and modified itineraries in the affected regions.
There has also been growing environmental scrutiny of the environmental impact of the cruise vacation industry, and some environmental groups are advocating for more stringent regulation of ship emissions at berth and at sea. This negative publicity of the cruise industry and any related measures may lead to changes in consumer preferences, such as methods or frequency of travel, which could adversely impact our operations and financial results by requiringand subject us to reduce our emissions, purchase allowances or otherwise pay for our emissionsreputational impacts and maycosts.
Labor, health and safety, financial responsibility, maritime and other regulations and measures could affect operations and increase our exposure, if any, to climate change-related litigation. Such activity may also impact us by increasing our operating costs, including fuel costs.
In addition, weWe are subject to various international, national, state and local laws, regulations and treaties that govern, among other things, discharge from our ships, safety standards applicable to our ships, treatment of disabled persons, health and sanitary standards applicable to our guests, security standards on board our ships and at the ship/port interface areas, and financial responsibilities to our guests.guests, and our advertising and pricing practices. These issues are, and we believe will continue to be, an area of focus by the relevant authorities throughout the world. This couldworld, which may result in the enactment of more stringent regulation of cruise ships that could subjectregulations. In addition to potential damage to our reputation and brand, failure by us to increasingcomply with these various applicable laws and
regulations, as well as changes in laws and regulations or the manner in which they are interpreted or applied, may result in litigation, civil and criminal liability, damages, fines and penalties, increased cost of regulatory compliance costs in the future and may increasehave an adverse impact on our exposure, if any, to environmental-related litigation.
Some environmental groups also have generated negative publicity about the environmental impact of the cruise vacation industry and are advocating for more stringent regulation of ship emissions at berth and at sea. Growing environmental scrutiny of the cruise industry and any related measures could adversely impact our operationsbusiness and financial results and subject us to reputational impacts and costs.results.
A change in our tax status under the U.S. Internal Revenue Code, or other jurisdictions, may have adverse effects on our results of operations.
Royal Caribbean Cruises Ltd. and a number of our subsidiaries are foreign corporations that derive income from a U.S. trade or business and/or from sources within the U.S. In connection with the year end audit, each year, Faegre Drinker Biddle & Reath LLP, our U.S. tax counsel, delivers to us an opinion, based on certain representations and assumptions set forth in it, to the effect that this income, to the extent derived from or incidental to the international operation of a ship or ships, is excluded from gross income for U.S. federal income tax purposes pursuant to Section 883 of the Internal Revenue Code. We believe that most of our income (including that of our subsidiaries) is derived from or incidental to the international operation of ships.
Our ability to rely on Section 883 could be challenged or could change in the future. Provisions of the Internal Revenue Code, including Section 883, are subject to legislative change at any time. Moreover, changes could occur in the future with respect to the identity, residence or holdings of our direct or indirect shareholders, trading volume or trading frequency of our shares, or relevant foreign tax laws of Liberia or the Bahamas, such that they no longer qualify as equivalent exemption jurisdictions, that could affect our eligibility for the Section 883 exemption. Accordingly, there can be no assurance that we will continue to be exempt from U.S. income tax on U.S. source shipping income in the future. If we were not entitled to the benefit of Section 883, we and our subsidiaries would be subject to U.S. taxation on a portion of the income derived from or incidental to the international operation of our ships, which would reduce our net income.
Additionally, portions of our business are operated by companies that are within the United Kingdom tonnage tax regime. Further, some of our operations are conducted in jurisdictions where we rely on tax treaties to provide exemption from taxation. To the extent the United Kingdom tonnage tax laws change or we do not continue to meet the applicable qualification requirements or if tax treaties are changed or revoked, we may be required to pay higher income tax in these jurisdictions, adversely impacting our results of operations.
AsThe Organization for Economic Co-operation and Development (OECD) has issued Pillar Two model rules introducing a new global minimum tax of 15%, which may materially impact us starting in 2026. While we are currently pursuing mitigation strategies, there can be no guarantee they will be successful and the impact to our to our financial statements could be material. In addition, as budgetary constraints continue tomay adversely impact fiscal policy in the jurisdictions in which we operate, increaseswe may be subject to changes in incomeour existing tax regulations, tax auditstreatment or other tax reform, affecting our operations may be imposed.as well as increased tax audits.
We are not a U.S. corporation and, as a result, our shareholders may be subject to the uncertainties of a foreign legal system in protecting their interests.
Our corporate affairs are governed by our Articles of Incorporation and By-Laws and by the Business Corporation Act of Liberia. The provisions of the Business Corporation Act of Liberia resemble provisions of the corporation laws of a number of states in the U.S. However, there are very few judicial cases in Liberia interpreting the Business Corporation Act of Liberia.Act. While the Business Corporation Act of Liberia provides that it is to be applied and construed to make the laws of Liberia, with respect of the subject matter of the Business Corporation Act, of Liberia, uniformharmonious with the laws of the State of Delaware, and other states with substantially similar legislative provisions (and adopts their case law to the extent it is non-conflicting), there have been few Liberian court cases interpreting the Business Corporation Act of Liberia, and we cannot predict whether Liberian courts would reach the same conclusions as United StatesDelaware courts. We understand that legislation has been proposed but not yet adopted by the Liberian legislature which amends the provisions regarding the adoption of non-Liberian law to, among other things, provide for the adoption of the statutory and case law of Delaware and not also states with substantially similar legislative provisions, and potentially provide the courts of Liberia discretion in application of non-statutory corporation law of Delaware inIn cases when the laws of Liberia are silent.silent, the Business Corporation Act adopts, when applicable, the non-statutory corporation law of Delaware with substantially similar legislative provisions insofar as it does not conflict with any other provisions of the Business Corporation Act or decisions of the courts of Liberia, and provides that the courts of Liberia may apply such non-statutory corporation law in resolving any issues before such courts. We cannot predict to what extent or in what manner the courts of Liberia will apply the non-statutory corporation law of Delaware. The right of shareholders to bring a derivative action in Liberian courts may be more limited than in U.S. jurisdictions. There may also be practical difficulties for shareholders attempting to bring suit in Liberia, and Liberian courts may or may not recognize and enforce foreign judgments. Thus, our shareholders may have more difficulty challenging actions taken by management, directors or controlling shareholders than would shareholders of a corporation incorporated in a U.S. jurisdiction.
General Risk Factors
Conducting business globally may resultresults in increased costsregulatory, financial, and other risks.
We operate our business globally, which exposes us to a number of risks, including increased exposure to a wider range of regional and local economic conditions, volatile local political conditions, potential changes in duties and taxes, including changing and/or uncertain interpretations of existing tax laws and regulations, required compliance with additional laws and policies affecting cruising, vacation or maritime businesses or governing the operations of foreign-based companies, currency
fluctuations, interest rate movements, difficulties in operating under local business environments, port quality and availability in certain regions, U.S. and global anti-bribery laws and regulations, imposition of trade barriers and restrictions on repatriation of earnings.
Our future growth strategies increasingly depend on the growth and sustained profitability of international markets. Factors that will be critical to our success in these markets include our ability to continue to raise awareness of our products and our ability to adapt our offerings to best suit rapidly evolving consumer demands. This risk is further heightened by the COVID-19 pandemic, as authorities in many of these markets have implemented numerous measures to contain the spread and impact of COVID-19, such as travel bans and restrictions, shelter-in-place/stay-at-home orders, and other limitations on business activity, including business closures. In addition, these measures could change unpredictably and/or could be scaled up or down in response to evolving intensity or resurgence of COVID-19 and related variants in or around these markets. The execution of our planned growth strategies is
dependent on meeting the governmental and regulatory measures and policies in each of these markets. Our ability to realize our future growth strategy is highly dependent on our ability to satisfy country-specific policies and requirements, in order to return to service, as well as meet the needs of region-specific consumer preferences as services come back online.preferences. These factors may cause us to reevaluate some of our international business strategies.
Operating globally also exposes us to numerous and sometimes conflicting legal, regulatory and tax requirements. In many parts of the world, including countries in which we operate, practices in the local business communities might not conform to international business standards. These legal and regulatory requirements and standards may change in response to the COVID-19 pandemic, and there may be greater uncertainty as to the interpretation and enforcement of applicable laws and regulations, including those introduced in response to the COVID-19 pandemic. We cannot guarantee consistent interpretation, application, and enforcement of newly issued rules and regulations, put in place in response to the COVID-19 pandemic, which could place limits on our operations or increase our costs, as well as negatively impact our future growth strategies in our key growth markets. We must adhere to policies designed to promote legal and regulatory compliance as well as applicable laws and regulations. However, we might not be successful in ensuring that our employees, agents, representatives and other third parties with whom we associate properly adhere to applicable laws and regulations. In addition, we may be exposed to the risk of penalties and other liabilities if we fail to comply with all applicable legal and regulatory requirements introduced in response to the COVID-19 pandemic, which may be subject to frequent and rapid change.requirements. Failure by us, our employees or any of these third parties to adhere to our policies or applicable laws or regulations could result in penalties, sanctions, damage to our reputation and related costs, which in turn could negatively affect our results of operations and cash flows.
As a global operator, our business also may be impacted by changes in U.S. policy or priorities in areas such as trade, immigration (including any continuation of any of the immigration policies put in place by the U.S. government in response to the COVID-19 pandemic) and/or environmental or labor regulations, among others. Depending on the nature and scope of any such changes, they could impact our domestic and international business operations. Any such changes, and any international response to them, could potentially introduce new barriers to passenger or crew travel and/or cross border transactions, impact our guest experience and/or increase our operating costs.
If we are unable to address these risks adequately, our financial position and results of operations could be adversely affected, including impairing the value of our ships and other assets.
The terms of our existing debt financing gives, and any future preferred equity or debt financing may give, holders of any preferred securities or debt securities rights that are senior to rights of our common shareholders.
The holders of our existing debt have rights, preferences and privileges senior to those of holders of our common stock in the event of liquidation. If we incur additional debt or raise equity through the issuance of preferred stock or convertible securities, the terms of the debt or the preferred stock issued may give the holders rights, preferences and privileges senior to those of holders of our common stock, particularly in the event of liquidation. If we raise funds through the issuance of additional equity, the ownership percentage of our existing shareholders would be diluted.
Fluctuations in foreign currency exchange rates, fuel prices and interest rates could affect our financial results.
We are exposed to market risk attributable to changes in foreign currency exchange rates, fuel prices and interest rates. Significant changes in any of the foregoing could have a material impact on our financial results, net of the impact of our hedging activities and natural offsets. Our operating results have been and will continue to be impacted, often significantly, by changes in each of these factors.
A portion of our indebtedness bears interest at variable rates that are linked to changing market interest rates. As a result, an increase in market interest rates would increase our interest expense and our debt service obligations. As of December 31, 2021,2023, we had approximately $7.4$3.7 billion of indebtedness that bears interest at variable rates.rates, which is net of our interest rate swap agreements. This amount represented approximately 34.3%16.8% of our total indebtedness. As of December 31, 2021,2023, a hypothetical 1% increase in prevailing interest rates would increase our forecasted 20222023 interest expense by approximately $48.7$25.5 million.
Additionally, the value of our earnings in foreign currencies is adversely impacted by a strong U.S. dollar.
In addition, any significant increaseparticular, increases in fuel prices have and could continue to materially and adversely affect our business as fuel prices impact not only our fuel costs, but also some of our other expenses, such as crew travel, freight, and commodity prices. Mandatory fuel restrictions may also create uncertainty related to the price and availability of certain fuel types potentially impacting operating costs and the value of our related hedging instruments.
Any further impairment of our goodwill, intangible assets, long-lived assets, equity investments and notes receivable could adversely affect our financial condition and operating results.
We evaluate goodwill for impairment on an annual basis, or more frequently when circumstances indicate that the carrying value of a reporting unit may not be recoverable. We also evaluate other assets, including but not limited to intangible assets and long-lived assets on an annual basis, or more frequently when circumstances indicate the carrying value may not be recoverable. A challenging operating environment, conditions affecting consumer demand or spending, the deterioration of general macroeconomic conditions, expected ship deliveries, or other factors could result in a change to the future cash flows we expect to derive from our operations. Reductions of cash flows used in the valuation analyses may result in the recording of impairments, which could adversely affect our financial condition and operating results.
The loss of key personnel, our inability to recruit or retain qualified personnel, or disruptions among our shipboard personnel could adversely affect our results of operations.
Our success depends, in large part, on the skills and contributions of key executives and other employees and on our ability to recruit, develop and retain high quality personnel as well as having adequate succession plans and back-up operating plans for when critical executives are unable to serve. As demand for qualified personnel in the industry grows, we must continue to effectively recruit, train, motivate and retain our employees, both shoreside and on our ships, in order to effectively compete in our industry, maintain our current business and support our projected global growth.
We are experiencinghave in the past and may in the future experience difficulty in recruiting and retaining qualified personnel as a result of COVID-19, the reduction in our workforce during our suspension of cruise operations, general macroeconomic conditions and aprimarily due to competitive labor market. Our ability to rehire crew may be negatively impacted by increasing demands related to our health and safety protocols, including vaccine requirements, and by a reduced labor supply as previous crew may have obtained alternative employment during our suspension of cruise operations.markets. A prolonged shortage of qualified personnel and/or increased turnover could decreasemay inhibit our ability to operate our business in an optimal manner. The shortagemanner, and competitive labor market may result in increased costs if we need to hire temporary personnel, and/or increased wages and/or benefits in order to attract and retain employees, all of which may negatively impact our results of operations.
As of December 31, 2021,2023, approximately 86%88% of our shipboard employees were covered by collective bargaining agreements. A dispute under our collective bargaining agreements could result in a work stoppage of those employees covered by the agreements. We may not be able to satisfactorily renegotiate these collective bargaining agreements when they expire. In addition, existing collective bargaining agreements may not prevent a strike or work stoppage on our ships. We may also be subject to or affected by work stoppages unrelated to our business or collective bargaining agreements. Any such work stoppages or potential work stoppages could have a material adverse effect on our financial results, as could a loss of key employees, our inability to recruit or retain qualified personnel or disruptions among our personnel.
If we are unable to keep pace with developments, design, and implementation in technology including technology in response to the COVID-19 pandemic,, our operations or competitive position could become impaired.
Our business continues to demand the use of sophisticated technology and systems. These technologies and systems require significant investment and must be proven, refined, updated, upgraded and/or replaced with more advanced systems in order to continue to meet our customers’ demands and expectations.expectations as well as to process our information effectively. If we are unable to do so in a timely manner or within reasonable cost parameters, if there are any disruptions, delays or deficiencies in design or if we are unable to appropriately and timely train our employees to operate any of these new systems, our business could suffer. We also may not achieve the benefits that we anticipate from any new technology or system, which could result in higher than anticipated costs or impair our operating results.
In response to COVID-19, we have relied on technology to assist with mitigating the risk of COVID-19 for our passengers and crew. For example, we have deployed our patented eMuster technology across our fleet in an effort to minimize congregate settings onboard. Additionally, on certain vessels we have deployed our patented contact tracing technology in an effort to quickly identify close contacts of cases onboard. As this technology continues to develop we may be faced with technical constraints or development decisions. We may be unable to obtainprocure appropriate technology in a timely manner or at all or we may incur significant costs in doing so. A failure to adopt the appropriate technology, or a failure or obsolescence in the technology that we do adopt,have adopted, could adversely affect our results of operations.
We are exposed to cyber security attacks and data breaches and the risks and costs associated with protecting our systems and maintaining data integrity and security.
We are subject to cyber security attacks. These cyber attacks can vary in scope and intent from attacks with the objective of compromising our systems, networks, and communications for economic gain or with the objective of disrupting, disabling or otherwise compromising our maritime and/or shoreside operations. The attacks can encompass a wide range of methods and intent, including phishing attacks, generative artificial intelligence impersonation, illegitimate requests for payment, theft of intellectual property, theft of confidential or non-public information, installation of malware, installation of ransomware and theft of personal or business information. The frequency and sophistication of, and methods used to conduct, these attacks, have increased over time.
A successful cyber security attack may target us directly, or it may be the result of a third party’s inadequate care, or resulting from vulnerabilities in licensed software. In either scenario, the Company may suffer damage to its systems and data
that could interrupt our operations, adversely impact our brand reputation, and expose us to increased risks of governmental investigation, litigation, fines, and other liability, any of which could adversely affect our business. Furthermore, responding to such an attack and mitigating the risk of future attacks could result in additional operating and capital costs in technology, personnel, monitoring and other investments.
We are also subject to various risks associated with the collection, handling, storage, and transmission of sensitive information. In the regular course of business, we collect employee, customer, and other third-party data, including personally identifiable information and individual payment data, for various business purposes. Although we have policies and procedures in place to safeguard such sensitive information, this information has been and could be subject to cyber security attacks and the aforementioned
risks. In addition, we are subject to federal, state, and international laws relating to the collection, use, retention, security and transfer of personally identifiable information and individual payment data. Those laws include, among others, the European Union General Data Protection Regulation and regulations of the New York State Department of Financial Services and similar state agencies that impose additional cyber security requirements as a result of our provision of certain insurance products.requirements. Complying with these and other applicable laws has caused, and may cause, us to incur substantial costs or require us to change our business practices, and our failure to do so may expose us to substantial fines, penalties, restrictions, litigation, or other expenses and adversely affect our business. Further, any changes to laws or regulations, including new restrictions or requirements applicable to our business, or an increase in enforcement of existing laws and regulations, could expose us to additional costs and liability and could limit our use and disclosure of such information.
While we continue to evolve our cyber security practices in line with our business’ reliance on technology and the changing external threat landscape, and we invest time, effort and financial resources to secure our systems, networks and communications, our security measures cannot provide absolute assurance that we will be successful in preventing or defending from all cyber security attacks or incidents impacting our operation. There can be no assurance that any breach or incident will not have a material impact on our operations and financial results.
Any breach, theft, loss, or fraudulent use of guest, employee, third-party or company data, could adversely impact our reputation and brand and our ability to retain or attract new customers, and expose us to risks of data loss, business disruption, governmental investigation, litigation and other liability, any of which could adversely affect our business. Significant capital investments and other expenditures could be required to remedy the problem and prevent future breaches, including costs associated with additional security technologies, personnel, experts and credit monitoring services for those whose data has been breached. Further, if we or our vendors experience significant data security breaches or fail to detect and appropriately respond to significant data security breaches, we could be exposed to government enforcement actions and private litigation.
Litigation, enforcement actions, fines or penalties could adversely impact our financial condition or results of operations and/or damage our reputation.
Our business is subject to various U.S. and international laws and regulations that could lead to enforcement actions, fines, civil or criminal penalties or the assertion of litigation claims and damages. In addition, improper conduct by our employees, agents or joint venture partners could damage our reputation and/or lead to litigation or legal proceedings that could result in civil or criminal penalties, including substantial monetary fines. In certain circumstances it may not be economical to defend against such matters and/or our legal strategy may not ultimately result in us prevailing in a matter. Such events could lead to an adverse impact on our financial condition or results of operations. In addition, we have experienced, and may continue to experience, increases in litigation pertaining to the COVID-19 crisis, including potential claims for non-refundable cash deposits. We cannot predict the quantum or outcome of any such proceedings and the impact that they will have on our financial results, but any such impact may be material. While some of these claims are covered by insurance, we cannot be certain that all of them will be, which could have an adverse impact on our financial condition or results of operations.
Item 1B. Unresolved Staff Comments
None.
Item 1C. Cybersecurity
Securing the Company’s business information, intellectual property, customer and employee data and technology systems is essential for the continuity of our businesses, meeting applicable regulatory requirements and maintaining the trust of our various stakeholders. Cybersecurity is an important and integrated part of the Company’s enterprise risk management function that identifies, monitors and mitigates business, operational, financial and legal risks.
We have developed a cybersecurity program designed to protect and preserve the confidentiality, integrity and continued availability of all information we own or process against risks from cybersecurity threats. Using a risk-based prioritization approach, the cybersecurity team focuses on securing our high value assets, updating our cybersecurity detection and prevention capabilities to identify new threats, and maturing the compliance processes to protect the Company’s operations and data.
Risk Management and Strategy
We have implemented policies, programs and controls and invested in cybersecurity technologies that focus on assessing, monitoring, and managing our cybersecurity risks. These include, but are not limited to: maintaining comprehensive cybersecurity policies and practices; augmenting our organization with a global cybersecurity operation center that monitors cyber threats 24-hours a day on a year-round basis; new surveillance technologies to proactively identify threats and improve the Company’s cyber defense capabilities; implementing enterprise-wide cybersecurity training, anti-phishing and awareness programs for our employees and crew members; and conducting cyber simulations with various teams across the Company as well as with management to evaluate our response approach. We have also implemented comprehensive processes designed to identify and oversee risks from cybersecurity threats associated with our third-party service providers, which include security assessments on our suppliers and vendors and continuous monitoring of cyber threats. Our cybersecurity program is based on recognized best practices and standards for cybersecurity, such as the National Institute of Standards and Technology (“NIST”) Cybersecurity Framework. We conduct regular third-party assessments of our cyber risk management program.
We also conduct a periodic assessment of cybersecurity risk as part of broader enterprise risk management (ERM). This assessment includes an evaluation of the Company’s processes to identify and respond to cyber risks and the effectiveness of the Company’s lines of defense. Given the complexity and evolving nature of cybersecurity threats, we leverage both internal cyber analytics and external sources of threat intelligence (including assessors, consultants, and other third parties) to evaluate our cyber risks and to properly adjust our risk mitigation approach. We also maintain controls and procedures that are designed to evaluate cyber risks on an ongoing basis. These processes include prompt communication of certain cybersecurity incidents to the Company’s executives, internal committees and the Board as needed, so that any needed external reporting can be made by management and the Board in a timely manner.
Our policies require each of our employees to contribute to our data security efforts. We regularly educate our employees about the importance of handling and protecting customer and employee data, including through annual privacy and security training to enhance employee awareness of how to detect and respond to cybersecurity threats.
As of the date of this report, we are not aware of any risks from cybersecurity threats or incidents that have materially affected or are reasonably likely to materially affect the Company, including our business strategy, results of operations, or financial condition. For additional description of cybersecurity risks and potential related impacts on the Company, refer to Item 1A. Risk Factors - "We are exposed to cyber security attacks and data breaches and the risks and costs associated with protecting our systems and maintaining data integrity and security."
Governance
Our cybersecurity program is led by our Chief Information Officer (CIO) and the Chief Information Security Officer (CISO). They are supported by Information Security Officers who work closely with our operational teams. Our CIO and CISO have more than 35 years of collective experience in the cybersecurity field. The CISO reports to the CIO and is generally responsible for management of cybersecurity risk and the protection and defense of our networks and systems. The CISO has served in similar roles at three major public companies and is a recognized cybersecurity leader. He regularly engages with peer CISOs, cybersecurity experts and organizations, including the Cloud Security Alliance (CSA) and the NIST, to stay informed on the latest industry developments. The CISO regularly informs our internal Disclosure Committee, Chief Financial Officer, and our President and Chief Executive Officer of cybersecurity risks and incidents as per our internal cyber risk framework. This also helps ensure that the highest levels of management are kept abreast of our cybersecurity posture and potential risks.
Our Board, in coordination with the Audit Committee, is actively engaged in reviewing management's processes for assessing and managing cybersecurity risks. The Board reviews cybersecurity at least annually. The Audit Committee directly oversees the Company’s management of cybersecurity risks. On a quarterly basis or as needed, the Audit Committee receives updates from management (including the CIO and CISO) on cybersecurity risks resulting from risk assessments, progress of risk reduction initiatives, external auditor feedback, control maturity assessments, and relevant internal and industry cybersecurity incidents. In addition, the Chair of the Audit Committee regularly informs the Board of the outcome of the Audit Committee's reviews at scheduled Board meetings.
Item 2. Properties
Information about our cruise ships, including their size, may be found within the Operating Strategies - FleetDelivery of state-of-the-art cruise ships, and fleet upgrade and maintenance section and the Operations - Cruise Ships and Itineraries sectionssection in Item 1. Business. Information regarding our cruise ships under construction, estimated expenditures and financing may be found within the Future Capital Commitments and Funding Needs and Sources sections of Item 7. Management’s Discussion and Analysis of Financial Condition and Results of Operations.
Our principal executive office and principal shoreside operations are located in leased office buildings at the Port of Miami, Florida. We also lease a number of other offices in the U.S. and throughout Europe, Asia, Mexico, South America and Australia to administer our brand operations globally.
We believe that our facilities are adequate for our current needs and that we are capable of obtaining additional facilities as necessary.
We also operate two private destinations which we utilize as ports-of-call on certain itineraries: (i) an island we own in the Bahamas that we call CocoCay; and (ii) Labadee, a secluded peninsula that we lease on the north coast of Haiti.
Item 3. Legal Proceedings
As previously reported, 2 lawsuits werea lawsuit was filed against us in August 2019 in the U.S. District Court for the Southern District of Florida (the "Court") under Title III of the Cuban Liberty and Democratic Solidarity Act, also known as the Helms-Burton Act. The complaint filed by Havana Docks Corporation ("Havana Docks Action") alleges it holds an interest in the Havana Cruise Port Terminal, and the complaint filed by Javier Garcia-Bengochea (the "Port of Santiago Action") alleges that he holds an interest in the Port of Santiago, Cuba, both of which werewas expropriated by the Cuban government. The complaintscomplaint further allegealleges that we trafficked in those propertiesthe terminal by embarking and disembarking passengers at these facilities. The plaintiffs seek all available statutory remedies, including the value of the expropriated property, plus interest, treble damages, attorneys’ fees and costs. In the Havana Docks Action, we and
The Court entered final judgment in December 2022 in favor of the plaintiff have filed motions for summary judgment, which were heard by the Court in January 2022. The Havana Docks Action is scheduled for trial on May 23, 2022. The Court dismissed the Port of Santiago Action with prejudice on the basis thatand awarded damages and attorneys' fees to the plaintiff lacked standing, andin the plaintiff’s appealaggregate amount of approximately $112 million. We have appealed the dismissal is awaiting a decision byjudgment to the appellate court.United States Court of Appeals for the 11th Circuit. We believe we have meritorious defensesgrounds for and intend to vigorously pursue our appeal. During the claims alleged in bothfourth quarter of 2022, we recorded a charge of approximately $130.0 million to Other (expense) income within our consolidated statements of comprehensive income (loss) related to the Havana Docks Action, including post-judgment interest and the Port of Santiago Action,related legal defense costs and we intend to vigorously defend ourselves against them. The outcome of litigation is inherently unpredictable and subject to significant uncertainties, and there can be no assurances that the final outcome of either case will not be material.bonding fees.
WeIn addition, we are also routinely involved in claims typical within the travel and tourismcruise vacation industry. The majority of these claims are covered by insurance. We believe the outcome of such claims, net of expected insurance recoveries, will not have a material adverse impact on our financial condition or results of operations and cash flows.
Item 4. Mine Safety Disclosures
None.
PART II
Item 5. Market for Registrant's Common Equity, Related Stockholder Matters and Issuer Purchases of Equity Securities
Market Information
Our common stock is listed on the New York Stock Exchange ("NYSE") under the symbol "RCL."
Holders
As of February 24, 2022,16, 2024, there were approximately 1,2671,186 record holders of our common stock. Since certain of our shares are held by brokers and other institutions on behalf of shareholders, the foregoing number is not representative of the number of beneficial owners.
Dividends
Holders of our common stock have an equal right, pro rata based on number of shares held, to share in our profits in the form of dividends when and if declared by our board of directors out of funds legally available, subject to any rights of holders of preferred stock if any. Holders of our common stock have no rights to any sinking fund.
There are no exchange control restrictions on remittances of dividends on our common stock by reason of our incorporation in Liberia because (1) we are and intend to maintain our status as a nonresident Liberian entity under the Liberia Revenue Code of 2000 as amended and the regulations thereunder, and (2) our ship-owning subsidiaries are not now engaged, and are not in the future expected to engage, in any business in Liberia, including voyages exclusively within the territorial waters of the Republic of Liberia. Under current Liberian law, no Liberian taxes or withholding will be imposed on payments to holders of our securities other than to a holder that is a resident Liberian entity or a resident individual or an individual or entity subject to taxation in Liberia as a result of having a permanent establishment within the meaning of the Liberia Revenue Code of 2000 as amended in Liberia.
The declaration of dividends shall at all times be subject to the final determination of our board of directors that a dividend is prudent at that time in consideration of the needs of the business. In connection with securing various financial covenant waivers, we agreed with certain of our lenders not to pay dividends until the end of the third quarter of 2022. In addition, in the event we thereafter declare a dividend, we will need to repay the amounts deferred under our export credit facilities as part of the principal amortization deferrals agreed with them during 2020 and 2021. Accordingly, we have not declared a dividend since the first quarter of 2020. Refer to Note 10. Shareholders' Equity to our consolidated financial statements under Item 8. Financial Statements and SupplementalSupplementary Data for further information on dividends declared.
Share Repurchases
There were no repurchases of common stock during the year ended December 31, 2021.2023.
In connection with our debt covenant waivers, we agreed with certain of our lenders not to engage in stock repurchases until the end of the third quarter of 2022. In addition, in the event we engage in share repurchases,repurchase shares of our common stock, we will need to repay the amounts deferred under our export credit facilities as part of the principal amortization deferrals agreed with themour lenders during 2020 and 2021.
Performance Graph
The following graph compares the total return, assuming reinvestment of dividends, on an investment in the Company, based on performance of the Company's common stock, with the total return of the Standard & Poor's 500 Composite Stock Index ("S&P 500") and the Dow Jones United States Travel and Leisure Index for a five year period by measuring the changes in common stock prices from December 31, 20162018 to December 31, 2021.2023.
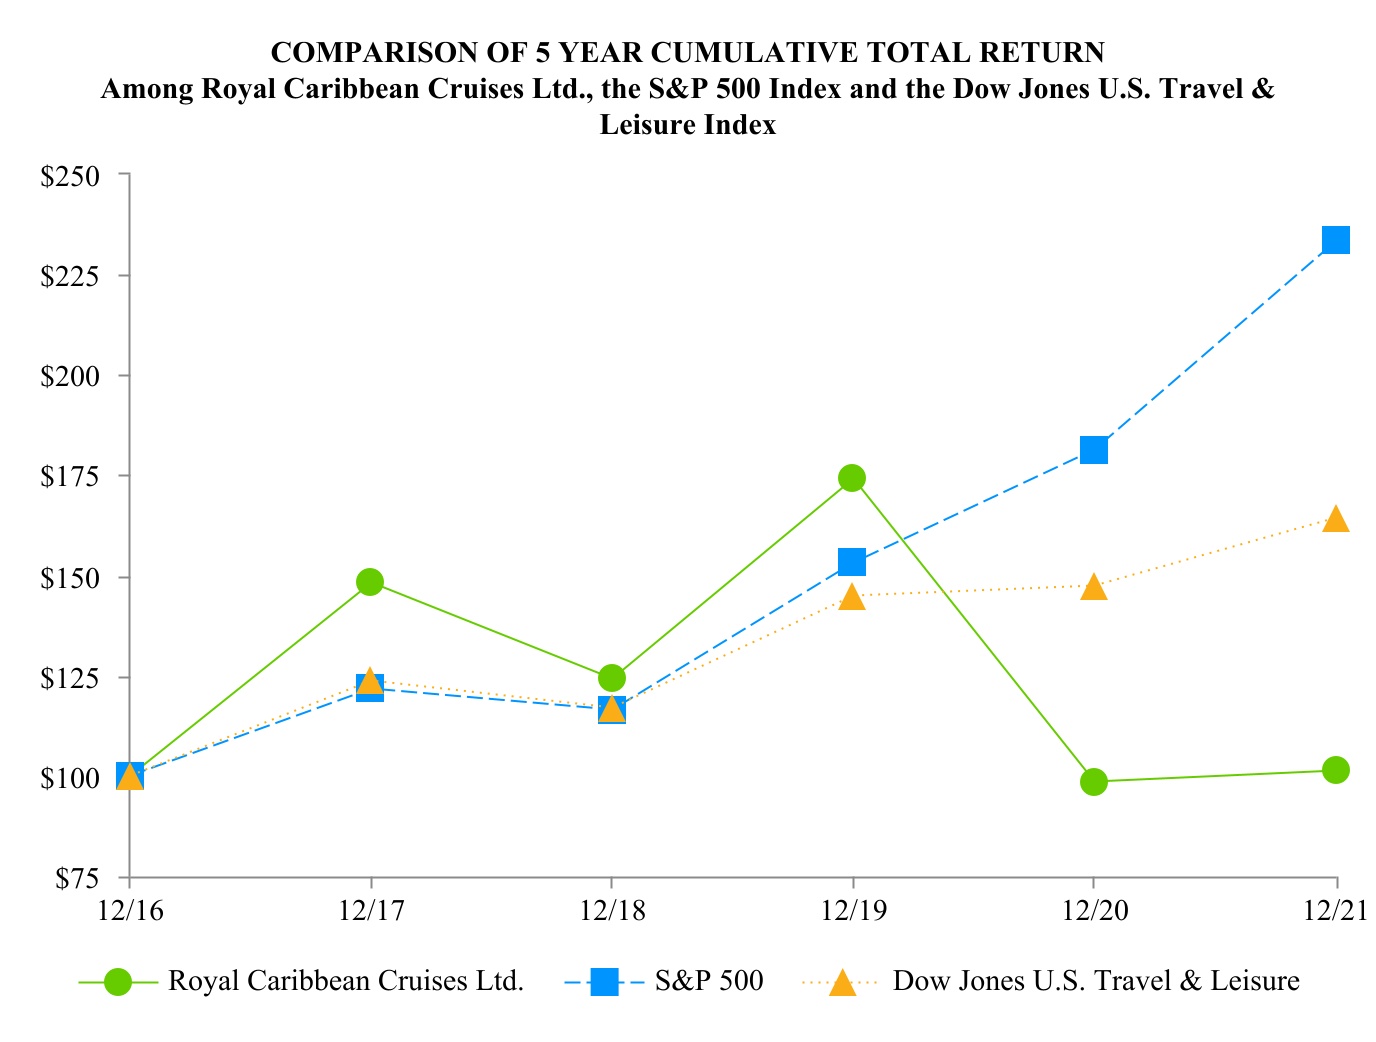
| | | | | | | | | | | | | | | | | | | | | | | | | | | | | | | | | | | |
| | 12/16 | 12/17 | | 12/18 | | 12/19 | | 12/20 | | 12/21 |
Royal Caribbean Cruises Ltd. | | 100.00 | 148.23 | | 124.30 | | 173.97 | | 98.48 | | 101.39 |
| S&P 500 | | 100.00 | 121.83 | | 116.49 | | 153.17 | | 181.35 | | 233.41 |
| Dow Jones U.S. Travel & Leisure | | 100.00 | 123.81 | | 116.89 | | 144.87 | | 147.40 | | 164.33 |

| | | | | | | | | | | | | | | | | | | | | | | | | | | | | | | | | | | |
| | 12/18 | 12/19 | | 12/20 | | 12/21 | | 12/22 | | 12/23 |
Royal Caribbean Cruises Ltd. | | 100.00 | 139.95 | | 79.22 | | 81.57 | | 52.43 | | 137.35 |
| S&P 500 | | 100.00 | 131.49 | | 155.68 | | 200.37 | | 164.08 | | 207.21 |
| Dow Jones U.S. Travel & Leisure | | 100.00 | 123.94 | | 126.10 | | 140.59 | | 112.10 | | 152.56 |
The stock performance graph assumes for comparison that the value of the Company's common stock and of each index was $100 on December 31, 20162018 and that all dividends were reinvested. Past performance is not necessarily an indicator of future results.
Item 6. Reserved
Not applicable.
Item 6. Reserved.
Not applicable.
Item 7. Management's Discussion and Analysis of Financial Condition and Results of Operations
Cautionary Note Concerning Forward-Looking Statements
The discussion under this caption “Management's Discussion and Analysis of Financial Condition and Results of Operations” and elsewhere in this document,Annual Report on Form 10-K, includes “forward-looking statements” within the meaning of the Private Securities Litigation Reform Act of 1995. All statements other than statements of historical fact, including statements regarding our expectations for future periods, business and industry prospects or future results of operations or financial position, made in this Annual Report on Form 10-K are forward-looking. Words such as “anticipate,” “believe,” “considering,” “could,” “driving,” “estimate,” “expect,” “goal,” “intend,” “may,” “plan,” “project,” “seek,” “should,” “will”, "would", and similar expressions are intended to further identify any of these forward-looking statements. Forward-looking statements reflect management's current expectations, but they are based on judgments and are inherently uncertain. Furthermore, they are subject to risks, uncertainties and other factors that could cause our actual results, performance or achievements to differ materially from the future results, performance or achievements expressed or implied in those forward-looking statements. Examples of these risks, uncertainties and other factors include, but are not limited to, those discussed in this Annual Report on Form 10-K and, in particular, the risks discussed under the caption Risk"Risk Factors” in Part I, Item 1A herein.
All forward-looking statements made in this Annual Report on Form 10-K speak only as of the date of this document.filing. Given these risks and uncertainties, readers are cautioned not to place undue reliance on such forward-looking statements. We undertake no obligation to publicly update or revise any forward-looking statements, whether as a result of new information, future events or otherwise.
Overview
The discussion and analysis of our financial condition and results of operations is organized to present the following:
•a review of our critical accounting policies and estimates and of our financial presentation, including discussion of certain operational and financial metrics we utilize to assist us in managing our business;
•a discussion of our results of operations for the year ended December 31, 20212023 compared to the same period in 2020;
•a discussion of our business outlook,2022; and
•a discussion of our liquidity and capital resources, including our future capital and contractual commitmentsmaterial cash requirements and potential funding sources.
Critical Accounting Policies and Estimates
Our consolidated financial statements are prepared in accordance with accounting principles generally accepted in the United States of America ("GAAP"). (Refer to Note 1. General and Note 2. Summary of Significant Accounting Policies to our consolidated financial statements under Item 8. Financial Statements and Supplementary Data). Certain of our accounting policies are deemed "critical," as they require management's highest degree of judgment, estimates and assumptions. We have discussed these accounting policies and estimates with the audit committee of our board of directors. We believe our most critical accounting policies and estimates are as follows:
Liquidity and COVID-19
The effects of COVID-19 have had and continue to have a material negative impact on our operations, financial results and liquidity. The full extent of the impact will be determined by the length of time COVID-19 influences our industry and our gradual return to service. Given the ongoing effects of COVID-19 on our operations and global bookings, we have identified the estimation of our future liquidity requirements as a critical accounting policy.
•Expected continued gradual resumption of cruise operations;
•Expected sustained increase in revenue per available passenger cruise day during our continued resumption of cruise operations;
•Expected lower than comparable historical occupancy levels during our continued resumption of cruise operations, increasing over time until we reach historical occupancy levels; and
•Expected spend during our continued resumption of cruise operations, including returning our crew members to our vessels and maintaining enhanced health and safety protocols.
The assumptions used to estimate our liquidity requirements are frequently and continuously evaluated because of the unprecedented environment that we are experiencing due to COVID-19. In addition, the magnitude, duration and speed of the global pandemic continues to be uncertain. As a result, we have made reasonable estimates and judgments of the impact of COVID-19 on our liquidity within our financial statements and there may be changes to those estimates in future periods.
We have taken and will continue to take actions to improve our liquidity, including:
•Reduction of capital expenditures;
•Reduction of operating expenses in 2020 and 2021 during the suspension of our global cruise operations (including furloughing staff and laying up vessels);
•Amending credit agreements to defer payments and covenant requirements, as well as extend maturity dates;
•Raising capital through debt and stock issuances; and
•Suspending dividend payments.
Ship Accounting
Ships represent our most significant assets and are stated at cost less accumulated depreciation and amortization. Depreciation of ships is generally computed net of a 10%-15% projected residual value, using the straight-line method over the estimated useful life of the asset, which is generally 30-35 years. The 30-35 year useful life and 10%-15% residual value is the weighted-average of all major components of a ship. Our useful life and residual value estimates take into consideration the impact of anticipated technological changes, environmental regulations, long-term cruise and vacation market conditions and historical useful lives of similarly-built ships. In addition, we take into consideration our estimates of the weighted-average useful lives of the ships' major component systems, such as hull, superstructure, main electric, engines and cabins. We employ a cost allocation methodology at the component level, in order to support the estimated weighted-average useful lives and residual values, as well as to determine the net cost basis of assets being replaced. Given the very large and complex nature of our ships, our accounting estimates related to ships and determinations of ship improvement costs to be capitalized require considerable judgment and are inherently uncertain. We do not have cost segregation studies performed to specifically componentize our ship systems. However, we estimate the costs, useful lives and residual values of component systems based principally on general and technical information known about major ship component systems and their lives, as well as our knowledge of the cruise vacation industry. We do not identify and track depreciation by ship component systems, but instead utilize these estimates to determine the net cost basis of assets replaced or refurbished. Improvement costs that we believe add value to our ships are capitalized as additions to the ship and depreciated over the shorter of the improvements' estimated useful lives or that
of the associated ship. The estimated cost and accumulated depreciation of replaced or refurbished ship components are written off and any resulting losses are recognized within Cruise operating expenses in our Consolidated Statements of Comprehensive Loss.
We periodically review estimated useful lives and residual values for ongoing reasonableness, considering long term views on our intended use of each class of ships and the planned level of improvements to maintain, enhance, and enhanceto comply with environmental regulations for vessels within those classes. In the event a factor is identified that may trigger a change in the estimated useful lives and residual values of our ships, a review of the estimate is completed.
We use the deferral method to account for drydocking costs. Under the deferral method, drydocking costs incurred are deferred and charged to expense on a straight-line basis over the period to the next scheduled drydock, which we estimate to be a period of thirty to sixty months based on the vessel's age as required by Class. Deferred drydock costs consist of the costs to drydock the vessel and other costs incurred in connection with the drydock which are necessary to maintain the vessel's Class certification. Class certification is necessary in order for our cruise ships to be flagged in a specific country, obtain liability insurance and legally operate as passenger cruise ships. The activities associated with those drydocking costs cannot be performed while the vessel is in service and, as such, are done during a drydock as a planned major maintenance activity. The significant deferred drydock costs consist of hauling and wharfage services provided by the drydock facility, hull inspection and related activities (e.g., scraping, pressure cleaning, bottom painting), maintenance to steering propulsion, thruster equipment and ballast tanks, port services such as tugs, pilotage and line handling, and freight associated with these items. We perform a detailed analysis of the various activities performed for each drydock and only defer those costs that are directly related to planned major maintenance activities necessary to maintain Class. The costs deferred are related to activities not otherwise routinely periodically performed to maintain a vessel's designed and intended operating capability. Repairs and maintenance activities are charged to expense as incurred.
We use judgment when estimating the period between drydocks, which can result in adjustments to the estimated amortization of drydock costs. If the vessel is disposed of before the next drydock, the remaining balance in deferred drydock is written-off to the gain or loss on disposal of vessel in the period in which the sale takes place. We also use judgment when identifying costs incurred during a drydock which are necessary to maintain the vessel's Class certification as compared to those costs attributable to repairs and maintenance which are expensed as incurred.
We believe we have made reasonable estimates for ship accounting purposes. However, should certain factors or circumstances cause us to revise our estimates of ship useful lives or projected residual values, depreciation expense could be materially higher or lower. If circumstances cause us to change our assumptions in making determinations as to whether ship
improvements should be capitalized, the amounts we expense each year as repairs and maintenance costs could increase, partially offset by a decrease in depreciation expense. If we had reduced our estimated average ship useful life by one year, depreciation expense for 20212023 would have increased by approximately $48.0$100 million. If our ships were estimated to have no residual value, depreciation expense for 20212023 would have increased by approximately $261.7$345 million. We have evaluated our estimated ship useful lives and projected residual values in light of our current environment and determined that there are no changes to these estimates based on our gradual return to service.
Business Combinations
On July 31, 2018, we acquired a 66.7% equity stake ("the 2018 acquisition") in Silversea Cruises, previously known as Silversea Cruises Holding Ltd., an ultra-luxury and expedition cruise line, from Heritage Cruise Holding Ltd. ("Heritage"), previously known as Silversea Cruises Group Ltd. The purchase price for the 2018 acquisition consisted of $1.02 billion in cash, net of assumed liabilities, and contingent consideration due to Heritage. The fair value of the contingent consideration at the time of the 2018 acquisition was $44.0 million. Changes to the fair value of the contingent consideration were recorded in our results of operations, if any, in the period of the change prior to its termination.
On July 9, 2020, we acquired the remaining 33.3% interest in Silversea Cruises that we did not already own (the "noncontrolling interest") from Heritage. As a result of the acquisition of the noncontrolling interest, Silversea Cruises is now a wholly owned cruise brand.estimates. Refer to Note 1. 6General . Property and Equipmentto our consolidated financial statements under Item 8. Financial Statements and Supplementary Data for further information regarding acquisition of Silversea Cruises' noncontrolling interest.
We account for business combinations in accordance with ASC 805, on our shipsBusiness Combinations., by applying the acquisition method of accounting. The acquisition method of accounting requires that we record the assets acquired and liabilities assumed, and the noncontrolling interest, if any, at their respective fair values at the acquisition date. Goodwill is recognized as the excess of the purchase price over the fair value of the net assets acquired. Significant estimates and assumptions are made by management to value such assets and liabilities based on third party valuations such as appraisals or internal valuations based on discounted cash flow analyses or other valuation techniques. Although we believe that those estimates and assumptions are
reasonable and appropriate, they are inherently uncertain and subject to change. If during the measurement period (not to exceed one year), additional information is obtained about facts and circumstances that existed as of the acquisition date related to the fair value of the assets acquired and liabilities assumed, we may adjust our estimates to account for subsequent adjustments to the provisional amounts recognized at the acquisition date, resulting in an offsetting adjustment to the goodwill associated with the business acquired. Our purchase price measurement period for the Silversea Cruises 2018 acquisition was closed during 2019.
Uncertain tax positions and tax-related valuation allowances are initially established in connection with a business combination as of the acquisition date. Additionally, any contingent consideration is estimated at fair value at the acquisition date. Liability-classified contingent consideration is remeasured each reporting period, with changes in fair value recognized in earnings until the contingent consideration is settled.
Valuation of Goodwill, Indefinite-Lived Intangible Assets and Long-Lived Assets
We review goodwill and indefinite-lived intangible assets for impairment at the reporting unit level annually or, when events or circumstances dictate, more frequently. The impairment review for goodwill consists of a qualitative assessment of whether it is more-likely than-not that a reporting unit's fair value is less than its carrying value, and if necessary, a goodwill impairment test. Factors to consider when performing the qualitative assessment include general economic conditions, limitations on accessing capital, changes in forecasted operating results, changes in fuel prices, and fluctuations in foreign exchange rates.
The goodwill impairment analysis consists of a comparison of the fair value of the reporting unit with its carrying value. We typically estimate the fair value of our reporting units using a discounted cash flow model, which may also include a combination of a market-based valuation approach. The estimation of fair value utilizing discounted expected future cash flows includes numerous uncertainties which require our significant judgment when making assumptions of expected revenues, operating costs, marketing, selling and administrative expenses, interest rates, ship additions and retirements as well as assumptions regarding the cruise vacation industry's competitive environment and general economic and business conditions, among other factors. The principal assumptions used in the discounted cash flow model for our 20212023 impairment assessments were:assessment consisted of:
•Forecasted net revenues primarily the timing of returning to normalized operations, occupancyper available passenger cruise day;
•Occupancy rates from existing and expected ship deliveries, and terminalvessels;
•Vessel operating expenses;
•Terminal growth rate; and
•Weighted average cost of capital (i.e., discount rate).
The discounted cash flow model uses the most current projected operating results for the upcoming fiscal year as a base. We discount the projected cash flows using rates specific to the reporting unit based on its weighted-average cost of capital.
If the fair value of the reporting unit exceeds its carrying value, no write-down of goodwill is required. As amended by ASU No. 2017-04, Intangibles - Goodwill and Other (Topic 350) – Simplifying the Test for Goodwill Impairment, ifIf the fair value of the reporting unit is less than the carrying value of its net assets, an impairment is recognized based on the amount by which the carrying value of a reporting unit exceeds its fair value, not to exceed the total amount of goodwill allocated to such reporting unit. Refer to Note 4. Goodwill to our consolidated financial statements under Item 8. Financial Statements and Supplementary Data for further information on goodwill.
The impairment review for indefinite-life intangible assets can be performed using a qualitative or quantitative impairment assessment. The quantitative assessment consists of a comparison of the fair value of the asset with its carrying value. We estimate the fair value of these assets using a discounted cash flow model and various valuation methods depending on the nature of the intangible asset, such as the relief-from-royalty method, for trademarks and trade names. The principal assumptions used in the discounted cash flow model for our 20212023 impairment assessments were:assessment consisted of:
•Forecasted net revenues primarily the timing of returning to normalized operations, occupancyper available passenger cruise day;
•Occupancy rates from existing and expected ship deliveries and terminalvessels ;
•Terminal growth rate;
•Royalty rate; and
•Weighted average cost of capital (i.e., discount rate).
If the carrying value exceeds its fair value, an impairment loss is recognized in an amount equal to that excess. If the fair value exceeds its carrying value, the indefinite-life intangible asset is not considered impaired. Other intangible assets assigned finite useful lives are amortized on a straight-line basis over their estimated useful lives. Refer to Note 5. Intangible Assets to
our consolidated financial statements under Item 8. Financial Statements and SupplementalSupplementary Data for further information on indefinite-life and finite-life intangible assets.
We review our ships and other long-lived assets, including right-of-use assets for impairment whenever events or changes in circumstances indicate, based on recent and projected cash flow performance and remaining useful lives, that the carrying value of these assets may not be fully recoverable. We evaluate asset impairment at the lowest level for which identifiable cash flows are largely independent of the cash flows of other assets and liabilities. The lowest level for which we maintain identifiable cash flows that are independent of the cash flows of other assets and liabilities is at the ship level for our ships. If estimated undiscounted future cash flows are less than the carrying value of an asset, an impairment charge is recognized to the extent its carrying value exceeds fair value. Refer to Note 6. Property and Equipment to our consolidated financial statements under Item 8. Financial Statements and SupplementalSupplementary Data for further information on determination of fair value for long-lived assets.
We estimate fair value based on quoted market prices in active markets, if available. If active markets are not available, we base fair value on independent appraisals, sales price negotiations and projected future cash flows discounted at a rate estimated by management to be commensurate with the business risk. Quoted market prices are often not available for individual reporting units and for indefinite-life intangible assets. Accordingly, we estimate the fair value of a reporting unit and an indefinite-life intangible asset using an expected present value technique.
As a result of our voluntary suspension of global cruise operations effective March 2020 in response to the COVID-19 outbreak and our gradual resumption of cruise operations during 2021, we performed interim impairment evaluations, in addition to our annual impairment reviews, of certain of our goodwill, indefinite-lived intangible assets and long-lived assets in connection with the preparation of our 2021 and 2020 quarterly and annual financial statements, as further discussed below.
Royal Caribbean International Reporting Unit
WeDuring the fourth quarter of 2023, we performed interim impairment evaluations of Royal Caribbean International’s goodwill in connection with the preparationa quantitative analysis as part of our quarterly financial statements for the periods ended March 31, 2020 and June 30, 2020 due to the significant impact that COVID-19 had on our projected cash flows and triggering events identified in those quarters.The fair valueannual impairment review of the Royal Caribbean International reporting unit as of March 31, 2020 was determined using a probability-weighted discounted cash flow model and for June 30, 2020 we used a probability-weighted discounted cash flow model in combination with a market-based valuation approach. As a result of the tests, we determined that the fair value of the Royal Caribbean International reporting unit exceeded its carrying value by approximately 30% and 8% as of March 31, 2020 and June 30, 2020, respectively, resulting in no impairment to the Royal Caribbean International goodwill in those periods. We did not perform an interim impairment evaluation of Royal Caribbean International's goodwill subsequent to the quarter ended June 30, 2020 during 2020 or 2021, as no triggering events were identified.
During the fourth quarters of 2021 and 2020, we performed our annual impairment review of goodwill for Royal Caribbean International's reporting unit. We did not perform qualitative assessments but instead proceeded directly to the goodwill impairment tests. As of November 30, 2021,2023, the fair value of the Royal Caribbean International reporting unit was determined using a discounted cash flow model in combination with a market-based valuation approach. As a result of the test, we determined the fair value of the Royal Caribbean International reporting unit exceeded its carrying value by more than 100% as of November 30, 2020,2023, resulting in no impairment to Royal Caribbean International's goodwill.
During the fourth quarter of 2022, we usedperformed a probability-weightedqualitative assessment of the Royal Caribbean International reporting unit. Based on our qualitative assessment, we concluded that it was more-likely-than-not that the estimated fair value of the reporting unit exceeded its carrying value and thus, we did not proceed to the goodwill impairment test.
As of December 31, 2023 and 2022, the carrying amount of goodwill attributable to our Royal Caribbean reporting unit was $296.4 million.
We did not perform interim impairment evaluations of Royal Caribbean International's goodwill during 2023 and 2022, as no triggering events were identified.
Silversea Cruises Reporting Unit
During the fourth quarters of 2023 and 2022, we performed a quantitative analysis as part of our annual impairment review of the Silversea Cruises reporting unit. As of November 30, 2023, and November 30, 2022, the fair value of the Silversea Cruises reporting unit was determined using a probability weighted discounted cash flow model in combination with a market-based valuation approach. As a result of the tests, we determined the fair value of the Royal Caribbean International reporting unit exceeded its carrying value by approximately 38% and 14% as of November 30, 2021 and 2020, respectively, resulting in no impairment to Royal Caribbean International's goodwill. The carrying value of goodwill attributable to our Royal Caribbean reporting unit was $296.5 million and $296.6 million as of December 31, 2021 and 2020, respectively.
Silversea Cruises Reporting Unit
We performed interim impairment evaluations of Silversea Cruises’ goodwill and trade name in connection with the preparation of our financial statements for the quarter ended March 31, 2020. As a result of these analyses, we determined that the carrying value of the Silversea Cruises reporting unit exceeded its fair value. Similarly, we determined that the carrying value of Silversea Cruises’ trade name exceeded its fair value. Accordingly, upon the completion of the impairment tests, we recognized impairment charges of $576.2 million and $30.8 million for goodwill and the trade name, respectively, during the quarter ended March 31, 2020. We estimated the fair value of the Silversea Cruises reporting unit using a probability-weighted discounted cash flow model in combination with a market-based valuation approach. We did not perform an interim impairment evaluation of Silversea Cruises's goodwill or trade names subsequent to the quarter ended March 31, 2020 during 2020 or 2021, as no triggering events were identified.
During the fourth quarters of 2021 and 2020, we performed our annual impairment review of Silversea Cruises goodwill. We did not perform qualitative assessments but instead proceeded directly to the goodwill impairment tests. As of November 30, 2021, the fair value of the Silversea Cruises reporting unit was determined using a discounted cash flow model in combination with a market-based valuation approach. As of November 30, 2020, we used a probability-weighted discounted cash flow model in combination with a market-based valuation approach. As a result of the tests, we determined the fair value
of the Silversea Cruises reporting unit exceeded its carrying value by approximately 35%63% and 12%26% as of November 30, 20212023 and 2020,2022, respectively, resulting in no impairment to Silversea Cruises' goodwill. The carrying value of goodwill attributable to our Silversea Cruises reporting unit was $508.6$509 million as of December 31, 20212023 and December 31, 2020.2022.
During the fourth quarters of 20212023 and 2020,2022, we performed our annual impairment reviews of the Silversea Cruises trade name. As a result of the quantitative tests, we determined that the fair value of the Silversea Cruises' trade name exceeded its carrying value by approximately 19%62% and 3%25%, as of November 30, 20212023 and November 30, 2020,2022, respectively, resulting in no impairment to Silversea Cruises' trade name.
As of December 31, 20212023 and 2020,2022, the carrying value of indefinite-life intangible assets was $321.5$321 million, which primarily relates to the Silversea Cruises trade name.
Long-lived Assets
Events surrounding the COVID-19 pandemic negatively impacted the expected undiscounted cash flows of certain of our long-lived assets. We evaluated these assets during the years ended 2021 and 2020 pursuant to our long-lived asset impairment test which resulted in no impairment charges for the year ended December 31, 2021 and $464.2 million of impairment charges during the year ended December 31, 2020 to write down certain ships operated by our Global Brands to their estimated fair values. The amount also includes impairment charges for ships that our Global Brands disposed of during 2020 as well as the three Azamara ships.
We also recordeddid not perform interim impairment chargesevaluations of $171.3 millionSilversea Cruises' goodwill or trade names during the year ended December 31, 2020 for the three ships that we chartered to Pullmantur Holdings prior to the filing of the Pullmantur reorganization. During the quarter ended September 30, 2020, we sold the ships to third parties for amounts approximating their carrying values and no further impairment was recorded. Refer to Note 6. Property and Equipment2023 and Note 7. Other Assets to our consolidated financial statements under Item 8. Financial Statements and Supplemental Data for further information regarding impairment of the ships and Pullmantur's reorganization.
During the years ended December 31, 2021 and 2020, we also determined that certain construction in progress projects would be reduced in scope or would2022, as no longer be completed due to the impact COVID-19 has had on our operations. This led to impairment charges of construction in progress assets of $51.6 million and $91.5 million during 2021 and 2020, respectively, as reported in Property and equipment, net.
In addition, during the year ended December 31, 2020, we identified that the undiscounted cash flows for certain right-of-use assetstriggering events were less than their carrying values due to the negative impact of COVID-19. We evaluated these assets pursuant to our long-lived asset impairment test, resulting in an impairment charge of $65.9 million to write down these assets to their estimated fair values during the year ended December 31, 2020. For the year ended December 31, 2021, there was no resulting impairment to right-of-use assets.
The combined impairment charge of $55.2 million for the year ended December 31, 2021, related to construction in progress and other long-lived assets, and $1.5 billion for the year ended December 31, 2020, primarily related to our goodwill, trademarks and trade names, vessels, construction in progress, and right-of-use assets, are reported within Impairment and credit losses within our consolidated statements of comprehensive (loss) income. These impairment assessments and the resulting charges were determined based on management’s current estimates and projections using information through the time of the issuance of these financial statements. The adverse impact that COVID-19 will continue to have on our business, operating results, cash flows and overall financial condition is uncertain and may result in changes to the assumptions used in the impairment tests discussed above, which may result in additional impairments of our goodwill, indefinite-lived intangible assets and long-lived assets in the future. Refer to Risk Factors in Part 1, Item 1A. for further discussion on risks related to the COVID-19 pandemic.identified.
Derivative Instruments
We enter into various forward, swap and option contracts to manage our interest rate exposure and to limit our exposure to fluctuations in foreign currency exchange rates and fuel prices. These instruments are recorded on the balance sheet at their fair
value and the vast majority are designated as hedges. We also use non-derivative financial instruments designated as hedges of our net investment in our foreign operations and investments. Although some of our derivative financial instruments do not qualify for hedge accounting or are not accounted for under hedge accounting, we do not hold or issue derivative financial instruments for trading or other speculative purposes. We account for derivative financial instruments in accordance with authoritative guidance. Refer to Note 2. Summary of Significant Accounting Policies and Note 16. Fair Value Measurements and Derivative Instruments to our consolidated financial statements under Item 8. Financial Statements and Supplementary
Data for more information on related authoritative guidance, the Company's hedging programs and derivative financial instruments.
On a regular basis, we enter into foreign currency forward contracts, interest rate swaps, fuel swaps and options with third-party institutions in over-the-counter markets. We estimate the fair value of our foreign currency forward contracts and interest rate swaps using expected future cash flows based on the instruments' contract terms and published forward prices for foreign currency exchange and interest rates. We value floors which are embedded within our interest rate swaps using standard option pricing models with inputs based on the options’ contract terms, such as exercise price and maturity, and readily available market data, such as forward interest rates and interest rate volatility. We apply present value techniques to convert the expected future cash flows to the current fair value of the instruments.
We estimate the fair value of our fuel swaps using expected future cash flows based on the swaps' contract terms and forward prices. We derive forward prices from published forward fuel curves which in turn are based on actual market transactions and published price quotes for similar assets. We apply present value techniques to convert the expected future cash flows to the current fair value of the instruments. We also corroborate our fair value estimates using valuations provided by our counterparties.
We adjust the valuation of our derivative financial instruments to incorporate credit risk.
We believe it is unlikely that materially different estimates for the fair value of our foreign currency forward contracts, interest rate swaps, fuel swaps and options would be derived from other appropriate valuation models using similar assumptions, inputs or conditions suggested by actual historical experience.
The prior suspension of our cruise operations due to the COVID-19 pandemic and our gradual resumption of cruise operations has resulted in reductions to our forecasted fuel purchases. During the year ended December 31, 2021, we discontinued cash flow hedge accounting on 0.2 million metric tons of our fuel swap agreements maturing in 2021 and 2022, which resulted in the reclassification of a net $0.7 million loss from Accumulated other comprehensive loss to Other income (expense). During the year ended December 31, 2020, we discontinued cash flow hedge accounting on 0.6 million metric tons of our fuel swap agreements maturing in 2020 and 2021, which resulted in the reclassification of a net $104.4 million loss from Accumulated other comprehensive loss to Other income (expense). Changes in the fair value of fuel swaps for which cash flow hedge accounting was discontinued are currently recognized in Other income (expense) each reporting period through the maturity dates of the fuel swaps.
Future suspension of our operations or modifications to our itineraries may affect our expected forecasted fuel purchases which could result in further discontinuance of fuel swap cash flow hedge accounting and the reclassification of deferred gains or losses from Accumulated other comprehensive loss into earnings. Refer to Risk Factors in Part 1, Item 1A. for further discussion on risks related to the COVID-19 pandemic.
Contingencies—Litigation
On an ongoing basis, we assess the potential liabilities related to any lawsuits or claims brought against us. While it is typically difficult to determine the timing and ultimate outcome of such actions, we use our best judgment to determine if it is probable that we will incur an expense related to the settlement or final adjudication of such matters and whether a reasonable estimation of such probable loss, if any, can be made. In assessing probable losses, we take into consideration estimates of the amount of insurance recoveries, if any, which are recorded as assets when recoverability is probable. We accrue a liability when we believe a loss is probable and the amount of loss can be reasonably estimated. Due to the inherent uncertainties related to the eventual outcome of litigation and potential insurance recoveries, it is possible that certain matters may be resolved for amounts materially different from any provisions or disclosures that we have previously made.
Seasonality
Our revenues are seasonal based on demand for cruises. Demand ishas historically been strongest for cruises during the Northern Hemisphere's summer months and holidays. In order to mitigate the impact of the winter weather in the Northern Hemisphere and to capitalize on the summer season in the Southern Hemisphere, our brands have historically focused on deployment to the Caribbean, Asia and Australia during that period.
Financial Presentation
Description of Certain Line Items
Revenues
Our revenues are comprised of the following:
•Passenger ticket revenues, which consist of revenue recognized from the sale of passenger tickets and the sale of air transportation to and from our ships; and
•Onboard and other revenues, which consist primarily of revenues from the sale of goods and/or services onboard our ships not included in passenger ticket prices, casino operations, cancellation fees, sales of vacation protection insurance, pre- and post-cruise tours and fees for operating certain port facilities. Onboard and other revenues also include revenues we receive from independent third party concessionaires that pay us a percentage of their
revenues in exchange for the right to provide selected goods and/or services onboard our ships, as well as revenues received for our bareboat charter, procurement and management related services we perform on behalf of our unconsolidated affiliates.
Cruise Operating Expenses
Our cruise operating expenses are comprised of the following:
•Commissions, transportation and other expenses, which consist of those costs directly associated with passenger ticket revenues, including travel advisor commissions, air and other transportation expenses, port costs that vary with passenger head counts and related credit card fees;
•Onboard and other expenses, which consist of the direct costs associated with onboard and other revenues, including the costs of products sold onboard our ships, vacation protection insurance premiums, costs associated with pre- and post-cruise tours and related credit card fees, as well as the minimal costs associated with concession revenues, as the costs are mostly incurred by third-party concessionaires and costs incurred for the procurement and management related services we perform on behalf of our unconsolidated affiliates;
•Payroll and related expenses, which consist of costs for shipboard personnel (costs associated with our shoreside personnel are included in Marketing, selling and administrative expenses);
•Food expenses, which include food costs for both guests and crew;
•Fuel expenses, which include fuel and related delivery, storage and emission consumable costs and the financial impact of fuel swap agreements; and
•Other operating expenses, which consist primarily of operating costs such as repairs and maintenance, port costs that do not vary with passenger head counts, vessel related insurance, entertainment and gains and/or losses related to the sale of our ships, if any.
We do not allocate payroll and related expenses, food expenses, fuel expenses or other operating expenses to the expense categories attributable to passenger ticket revenues or onboard and other revenues since they are incurred to provide the total cruise vacation experience.
Selected Operational and Financial Metrics
We utilize a variety of operational and financial metrics which are defined below to evaluate our performance and financial condition. As discussed in more detail herein, certain of these metrics are non-GAAP financial measures. These non-GAAP financial measures are provided along with the related GAAP financial measures as we believe they provide useful information to investors as a supplement to our consolidated financial statements, which are prepared and presented in accordance with GAAP. The presentation of non-GAAP financial information is not intended to be considered in isolation or as a substitute for, or superior to, the financial information prepared and presented in accordance with GAAP.
Adjusted EBITDA is a non-GAAP measure that represents EBITDA (as defined below) excluding certain items that we believe adjusting for is meaningful when assessing our profitability on a comparative basis. For the periods presented, these items included (i) Other expense, which includes the loss contingency in connection with the ongoing Havana Docks litigation recorded in other expenses in 2022; (ii) gain on sale of controlling interest; (iii) impairment and credit losses; (iv) restructuring charges and other initiative expense; (v) equity investment impairment and recovery of losses; (vi) Pullmantur reorganization settlement; (vii) net insurance recoveries or costs related to the collapse of the drydock structure at the Grand Bahama Shipyard involving Oasis of the Seas; and (viii) the net gain recognized in 2021 in relation to the sale of the Azamara brand; A reconciliation of Net Income (Loss) attributable to Royal Caribbean Cruises Ltd. to Adjusted EBITDA is provided below under Results of Operations.
Adjusted Earnings (Loss) per Share ("Adjusted EPS") is a non-GAAP measure thatrepresents Adjusted Net Income (Loss) Income attributable to Royal Caribbean Cruises Ltd. (as defined below) divided by weighted average shares outstanding or by diluted weighted average shares outstanding, as applicable. We believe that this non-GAAP measure is meaningful when assessing our performance on a comparative basis.
Adjusted Net Income (Loss) Income attributable to Royal Caribbean Cruises Ltd. is a non-GAAP measure that represents net income (loss) income less net income attributable to noncontrolling interest, excluding certain items that we believe adjusting for is meaningful when assessing our
performance on a comparative basis. For the periods presented, these items included (i) loss on the extinguishment of debt; (ii) gain on sale of controlling interest; (iii) tax on the sale of PortMiami noncontrolling interest; (iv)
Silver Whisper deferred tax liability release; (v) impairment and credit losses; (vi) the amortization of non-cash debt discount on our convertible notes; (iii) the estimated cash refund expected to be paid to Pullmantur guestsSilversea Cruises intangible assets resulting from the Silversea Cruises acquisition in 2018; (vii) restructuring charges and other expenses incurred as part of the Pullmantur S.A. reorganization; (iv)initiative expenses; (viii) equity investments impairment and credit losses recognized as a resultrecovery of losses; (ix) loss contingency recorded in 2022 in connection with the impactongoing Havana Docks litigation inclusive of COVID-19; (v) equity investment asset impairments; (vi)related legal fees and costs; (x) convertible debt amortization of debt discount; (xi) the 2021 Pullmantur reorganization settlement; (xii) net insurance recoveries related to the collapse of the drydock structure at the Grand Bahama Shipyard involving Oasis of the Seas or for 2019, incidental costs, net of insurance recoveries, related to drydock structure incidents Grand Bahama Shipyard; (vii) restructuring charges incurred in relation to the reduction in our U.S. workforce and other initiative expenses, and the reorganization of our international sales and marketing structure in 2019; (viii) the change in the fair value in the Silversea Cruises contingent consideration, the amortization of the Silversea Cruises intangible assets resulting from our acquisition of a 66.7% interest in Silversea Cruises in 2018, and transaction and integration costs related to the 2018 Silversea Cruises acquisition; (ix) the noncontrolling interest adjustment to exclude the impact of the contractual accretion requirements associated with the put option held by Heritage Cruise Holding Ltd. (previously known as Silversea Cruises Group Ltd.) noncontrolling interest in Silversea Cruises, which noncontrolling interest we acquired on July 9, 2020; (x) incident; (xiii) the net gain recognized in the first quarter of 2021 in relation to the sale of the Azamara brand; (xi) currency translation losses recognized during the second quarter of 2020, in connection with the ships classified as assets held-for-sale that were previously chartered to Pullmantur; and (xii)(xiv) the net loss recognized in the fourth quarter of 2021 related to the elimination of the three-month reporting lag for Silversea Cruises. A reconciliation of Net Income (Loss) attributable to Royal Caribbean Cruises Ltd. to Adjusted Net Income (Loss) attributable to Royal Caribbean Cruises Ltd. is provided below under Results of Operations.
Available Passenger Cruise Days ("APCD") is our measurement of capacity and represents double occupancy per cabin multiplied by the number of cruise days for the period, which excludes canceled cruise days and cabins not available for sale. We use this measure to perform capacity and rate analysis to identify our main non-capacity drivers that cause our cruise revenue and expenses to vary.
EBITDA is a non-GAAP measure that represents of Net Income (Loss) attributable to Royal Caribbean Cruises Ltd. excluding (i) interest income; (ii) interest expense, net of interest capitalized; (iii) depreciation and amortization expenses; and (iv) income tax benefit or expense. We believe that this non-GAAP measure is meaningful when assessing our operating performance on a comparative basis. A reconciliation of Net Income (Loss) attributable to Royal Caribbean Cruises Ltd. to EBITDA is provided below under Results of Operations.
Gross Cruise Costs represent the sum of total cruise operating expenses plus marketing, selling and administrative expenses.
CarbonIntensity is our measurement of carbon dioxide emissions per gross tonne nautical mile (well-to-wake).
Net Cruise Costs and Net Cruise Costs excluding Fuel are non-GAAP measures that represent Gross Cruise Costs excluding commissions, transportation and other expenses, onboard and other expenses and, in the case of Net Cruise Costs excluding Fuel, fuel expenses (each of which is described above under the Description of Certain Line Items heading). In measuring our ability to control costs in a manner that positively impacts net income, we believe changes in Net Cruise Costs and Net Cruise Costs Excluding Fuel to be the most relevant indicators of our cost performance. For the 2023 period presented, Net Cruise Costs and Net Cruise Costs Excluding Fuel excludes (i) gain on sale of controlling interest; (ii) impairment and credit losses; and (iii) restructuring and other initiative expenses. A reconciliation of Gross Cruise Costs to Net Cruise Costs and Net Cruise Costs Excluding Fuel is provided below under Results of Operations.
Gross Margin Yield represent Gross Margin per APCD.
Adjusted Gross Margin represent Gross Margin, adjusted for payroll and related, food, fuel, other operating, and depreciation and amortization expenses. Gross Margin is calculated pursuant to GAAP as total revenues less total cruise operating expenses, and depreciation and amortization.
Net Yields represent Adjusted Gross Margin per APCD. We utilize Adjusted Gross Margin and Net Yields to manage our business on a day-to-day basis as we believe that they are the most relevant measures of our pricing performance because they reflect the cruise revenues earned by us net of our most significant variable costs, which are commissions, transportation and other expenses, and onboard and other expenses.
Invested Capital represents the most recent five-quarter average of total debt (i.e., Current portion of long-term debt plus Long-term debt) plus the most recent five-quarter average of Total shareholders' equity. We use this measure to calculate ROIC (as defined below).
Adjusted Operating Income (Loss) is a non-GAAP measure that represents operating income (loss) including income (loss) from equity investments and income taxes but excluding certain items that we believe adjusting for is meaningful when assessing our operating performance on a comparative basis. We use this non-GAAP measure to calculate ROIC (as defined below).
Return on Invested Capital ("ROIC") represents Adjusted Operating Income (Loss) divided by Invested Capital. We believe ROIC is a meaningful measure because it quantifies how efficiently we generated operating income relative to the capital we have invested in the business. ROIC is also used as a key metric in our long-term incentive compensation program for our executive officers.
Occupancy ("Load factor"), in accordance with cruise vacation industry practice, occupancy is calculated by dividing Passenger Cruise Days (as defined below) by APCD. A percentage in excess of 100% indicates that three or more passengers occupied some cabins.
Passenger Cruise Days represent the number of passengers carried for the period multiplied by the number of days of their respective cruises.
Although discussed in prior periods, we do not disclose or reconcile in this report our Gross Yields,The use of certain non-GAAP measures, such as Net Yields, Gross Cruise Costs, Net Cruise Costs and Net Cruise Costs Excluding Fuel, as defined in our Annual Report on Form 10-K for the year ended December 31, 2019. Historically, we have utilized these financial metricsallows us to measure relevant rate comparisons to other periods. However, our 2020 and 2021 reduction inperform capacity and revenues and the shift in the nature of our running costs, duerate analysis to separate the impact of known capacity changes from other less predictable changes which affect our business. We believe these non-GAAP measures provide expanded insight to measure revenue and cost performance in addition to the COVID-19 pandemic on our operations, do not allowstandard GAAP based financial measures. There are no specific rules or regulations for a meaningful analysis and comparison of these metricsdetermining non-GAAP measures, and as such, these metrics have been excluded from this report.
Recent Developments: COVID-19
Returnthey may not be comparable to Healthy Sailingother companies within the industry.
We have restarted our global cruise operations innot provided a phased manner, following our voluntary suspensionquantitative reconciliation of global cruise operations that commenced in March of 2020 in responseprojected non-GAAP financial measures to the COVID-19 outbreak. Our returnmost comparable GAAP financial measures because preparation of meaningful U.S. GAAP projections would require unreasonable effort. Due to service efforts incorporate our enhanced healthsignificant uncertainty, we are unable to predict, without unreasonable effort, the future movement of foreign exchange rates, fuel prices and safety protocols, and the requirements of regulatory agencies, which has resulted in reduced guest occupancy, modified itineraries and vaccination protocols.
By the end of December 2021, we operated 50interest rates inclusive of our Globalrelated hedging programs. In addition, we are unable to determine the future impact of non-core business related gains and Partner Brand ships, representing over 85% of worldwide capacity, and carried approximately 1.3 million guests since we resumed operations.
Uncertainties remain as to the specifics, timing and costs of administering and implementing our health and safety measures, some oflosses which may result from strategic initiatives. These items are uncertain and could be significant. Based on our assessment of these requirements and recommendations, the status of COVID-19 infection, and its variants, and/or vaccination rates in the U.S. or globally or for other reasons, we may determine it necessarymaterial to cancel or modify certain of our Global Brands’ cruise sailings. We believe the impact to our global bookings resulting from COVID-19 will continue to have a material negative impact on our results of operations in accordance with U.S GAAP. Due to this uncertainty, we do not believe that reconciling information for such projected figures would be meaningful.
Executive Overview
2023 performance was exceptionally strong and liquidity, which may be prolonged beyond containmentsignificantly exceeded our expectations.
We took delivery of three new ships (Silver Nova, Celebrity Ascent and Icon of the diseaseSeas), expanded Perfect Day at CocoCay’s capacity with the launch of Hideaway Beach, and its variants. See Part I. Item 1.successfully returned to normalized load factors of 105.6%, with peak summer sailings reaching load factors of 110%. We achieved strong financial performance, including EBITDA of $4.5 billion in 2023, record Adjusted EBITDA per APCD and record ROIC. In addition, 2023 delivered record Net Yields and Adjusted EBITDA, and we made significant progress in repairing our balance sheet, repaying approximately $4.0 billion of debt.
Our 2023 Net Income attributable to Royal Caribbean Cruises Ltd. was $1.7 billion, or $6.31 per diluted share, compared to Net Income attributable to Royal Caribbean Cruises Ltd. of $1.9 billion, or $8.95 per diluted share in 2019, the most recent year of normalized operations. Adjusted Net Income attributable to Royal Caribbean Cruises Ltd. for 2023 was $1.8 billion, or $6.77 per diluted share, compared to Adjusted Net Income attributable to Royal Caribbean Cruises Ltd. of $2.0 billion, or $9.54 per diluted share in 2019. 2023 Adjusted EBITDA was $4.5 billion, compared to Adjusted EBITDA of $3.6 billion in 2019.
Total revenues in 2023 were $13.9 billion, exceeding the previous record of $11.0 billion in 2019 driven by strong ticket revenue and onboard revenue performance, inclusive of capacity growth. As a result of this, Gross Margin Yields increased 13.2% as-reported, and Net Yields increased 13.5% in Constant-Currency, both compared to 2019. The strength in revenue and improved cash flow, combined with our margin expansion efforts allowed us to accelerate debt repayment, improving our debt maturity profile.
Cruise operating expenses increased from $6.1 billion in 2019 to $7.8 billion in 2023. Gross Cruise Costs per APCD increased 10.9% as-reported and 11.3% in Constant Currency, compared to 2019. Net Cruise Costs, excluding Fuel, per APCD increased 7.5% as-reported and 7.9% in Constant Currency, compared to 2019. Our disciplined cost control helped mitigate the effects of inflation. For 2023, Net Cruise Costs included $2.31 per APCD of structural costs which were not present in 2019, including increased costs associated with Perfect Day at CocoCay, our Galveston terminal, and roll-out of Starlink internet onboard our fleet.
In 2024, we expect our capacity to increase by 8.5% compared to 2023, with the addition of Business - RegulationSilver Ray for an update on the U.S. Centers for Disease Control and Prevention's ("CDC") Framework for Conditional Sailing Order.
Continued fleet ramp-up
We experienced service disruptions and cancelled several sailings in the first quarter of 2022 due to the impact from the Omicron variant ("Omicron"). Service disruptions have abated as COVID-19 cases have declined. Despite these service disruptions and cancellations, the overall trajectory of our return to service remains unchanged. We expect that by the end of the first quarter of 2022, 53 out of 62 of our Global and Partner Brand ships, including WonderUtopia of the Seas and a full year of operations for Silver Nova, Celebrity Ascent, and Icon of the Seas (which was deliveredbegan revenue sailings in January 2024). Utopia of the Seas will be the first Oasis class ship focused on short Caribbean itineraries, and we also return to China for the first time since 2019 with Spectrum of the Seas. In addition, we will continue the construction of the first Royal Beach Club at Paradise Island, Bahamas, set to open in 2025. Our new ships, optimized deployment, continued load factor growth and enhanced onboard offerings are expected to drive growth in Net Yields and Total Revenues. During 2024, we are expected to have 20 ships in drydock, due to our growing fleet combined with the timing of restarting our entire fleet, and we plan to continue investing in newbuilds and retrofitting our existing fleet with technology to help reach our long-term goals to reduce carbon intensity.
January 2022, will have been brought back to service. Additionally, we expect that the rest of the fleet will return to operations before the summer season.
We expect load factors in the first quarter of 2022 to be lower than initially anticipated due to the Omicron impact on bookings and cancellations, particularly on January sailings. As such, we anticipate load factors on core itineraries of approximately 60% during the first quarter of 2022, with sequential monthly improvement, and approximately 7.7 million APCDs for the first quarter of 2022. Core itineraries exclude sailings during the early ramp-up period of up to four weeks and exclude new itineraries implemented during the COVID period. Additionally, we expect total cash flow from ships in operation in the first quarter to be positive.
Update on Bookings
We experienced a softening in booking volumes and an increase in near-term cancellations as a result of the significant short-term disruptions experienced by the travel industry due to Omicron. The disruptions intensified during the holiday season and in early January with the spread of the variant.
Load factors for sailings in the first half of 2022 are expected to remain below historical levels, consistent with our return to service schedule, which includes the Omicron impact. Load factors for sailings in the second half of 2022 continue to be booked within historical ranges, at higher prices with and without FCCs. We have observed cancellations subside and bookings improve to pre-Omicron levels, and we have adjusted our sales and marketing efforts in anticipation of a delayed and extended WAVE period.
As of December 31, 2021, we had approximately $3.2 billion in customer deposits. Approximately 32% of the customer deposit balance as of December 31, 2021 is related to FCCs compared to 35% of the customer deposit balance as of September 30, 2021, a positive trend indicating new demand.
Update on Recent Liquidity Actions and Ongoing Uses of Cash
As of December 31, 2021, we had liquidity of approximately $3.5 billion in the form of cash and cash equivalents of $2.7 billion, $0.1 billion of undrawn revolving credit facility capacity, and a $0.7 billion commitment for a 364-day term loan facility available to draw on at any time prior to August 12, 2022. Our revolving credit facilities were mostly utilized through a combination of amounts drawn and letters of credit issued under the facilities as of December 31, 2021. We temporarily applied the net proceeds of the $1.0 billion January 2022 Unsecured Notes to repay borrowings under our revolving credit facilities, bringing our undrawn revolving credit facility capacity to $1.1 billion as of the date of the issuance of this report, from $0.1 billion as of December 31, 2021. We continue to prioritize and bolster liquidity while taking steps to improve our balance sheet and reduce our interest costs to be well positioned for recovery.
Reduced Operating Expenses
We took significant actions in early 2020 to reduce operating expenses during the suspension of our global cruise operations. In particular, we:
•significantly reduced ship operating expenses, including crew payroll, food, fuel, insurance and port charges;
•further reduced operating expenses as the Company’s ships were transitioned into various levels of layup with several ships in the fleet transitioning into cold layup;
•significantly reduced marketing and selling expenses;
•reduced and furloughed our workforce, with approximately 23% of our US shoreside employee base being impacted in 2020; and
•suspended travel for shoreside employees and instituted a hiring freeze across the organization.
During our ramp up of operations, we have incurred and will continue to incur incremental spend related to bringing ships back to operating status, returning crew members to ships and implementing enhanced health and safety protocols. We also collected and will continue to collect deposits related to those sailings and for future cruises. We take into account a number of variables in determining when to bring ships back into service, including deployment opportunities, commercial potential, cost of operations and cash flow.
Capital Expenditures
COVID-19 has impacted shipyard operations, which have delayed and may continue to result in delays of our previously contracted ship deliveries. As of December 31, 2021, we anticipate that overall full year capital expenditures, based on our
existing ships on order, will be approximately $3.1 billion for 2022. This amount does not include any ships on order by our Partner Brands. We took delivery of Wonder of the Seas during the first quarter of 2022 and expect delivery of Celebrity Beyond during the second quarter of 2022. For 2023, we have three ship deliveries scheduled: Icon of the Seas, Celebrity Ascent and Silver Nova.
Debt Maturities, New Financings and Other Liquidity Actions
During the year ended December 31, 2021, we continued to take actions to further improve our liquidity position and manage cash flow. In particular, we:
• extended the maturity date or termination date, as applicable, of certain of the advances and commitments held by consenting lenders under our $1.0 billion unsecured term loan due April 2022 and our $1.55 billion unsecured revolving credit facility due October 2022, each by 18 months to October 2023 and April 2024, respectively;
•extended the period during which we may draw upon our binding commitment for a $700.0 million 364-day term loan facility by one year, which is now available for draw at any time prior to August 12, 2022;
•issued $1.50 billion of 5.5% senior unsecured notes due in 2028 for net proceeds of approximately $1.48 billion, which were used to repay principal payments on debt maturing or required to be paid in 2021 and 2022, with the remaining for general corporate purposes;
•issued $650.0 million of 4.25% senior unsecured notes due in 2026 for net proceeds of approximately $640.6 million, which were used to fully repay the Silversea Notes, in the amount of $619.8 million, and to pay the related call premiums, accrued interest and fees;
•issued $1.0 billion of 5.50% senior notes due in 2026 for net proceeds of approximately $986.0 million, which were used to replenish our capital as a result of the redemption of a portion of the 11.50% senior secured notes due 2025 in the amount of $928.0 million, and to pay the related premiums and accrued interest;
•amended the credit agreements for the unsecured financings of our first and second Evolution-class ships, increasing their maximum loan amounts by €175.6 million in the aggregate (or approximately $199.7 million based on the exchange rate at December 31, 2021), to finance ship design modifications that incorporate innovative sustainability features and additional premium cabins;
•issued 16.9 million shares of common stock for approximately $1.5 billion;
•amended $4.9 billion of our non-export-credit facilities and certain of our credit card processing agreements to extend the waiver of the financial covenants through and including the third quarter of 2022 and to implement modified covenants for the period starting fourth quarter of 2022 and extending through and including the fourth quarter of 2023;
•amended $6.3 billion of our export-credit facilities to extend the waiver of the financial covenants through and including the fourth quarter of 2022 and defer $1.15 billion of principal payments due between April 2021 and April 2022; and
•amended $7.3 billion of outstanding export-credit financing plus committed export-credit facilities to modify financial covenant levels for 2023 and 2024, following the waiver period through and including the fourth quarter of 2022.
Refer to Note 8. Debt, Note 10. Shareholders' Equity, andNote 17. Commitments and Contingencies, to our consolidated financial statements under Item 8. Financial Statements and Supplemental Data for further information on these financing transactions and our debt covenants.
Expected debt maturities for 2022 are $2.2 billion. We continue to identify and evaluate further actions to enhance our liquidity and support our recovery. These include and are not limited to further reductions in capital expenditures, operating expenses and administrative costs and additional financings and refinancings.
Executive Overview
While 2021 proved to be another challenging year for our company and industry, it also marked our successful return to service. Starting in June, we began our return to cruising with 50 ships back in service by year end, representing more than 85% of our capacity. We delivered safe and memorable experiences to approximately 1.3 million guests at record guest satisfaction scores.
The out-of-service period in the first half of the year, the costs of returning our ships and crew to operations, the revamping of sales and marketing and the costs to execute on health protocols all had a significant impact on our financial results. Although we generated a fraction of normal revenue levels in 2021, total revenue per passenger cruise day in the fourth quarter was up 10% compared to record 2019 levels. The increase was driven by strong onboard revenue performance seen across every revenue stream.
Since resuming operations, our focus has been on the safety and well-being of our guests and crew. As Delta and Omicron variants started to spread, they created short-term operational challenges as well as an increase in cancellations. However, our health and safety protocols, including our crew and guest vaccination requirements, proved to be successful as only 0.19% of our guests tested positive for COVID-19. As infection rates decline and localities lift COVID-19 protocols, we will continue to work closely with health authorities to maintain protocols that promote the health and safety of our guests, crew, and communities we visit. As part of this commitment, we have opted-in to the CDC’s new voluntary program in the “Highly Vaccinated Ship” category for health and safety protocols.
During 2021, we remained focused on managing costs, improving our balance sheet and preserving liquidity. We ended the year with approximately $3.5 billion in liquidity, which includes cash and cash equivalents, undrawn revolving credit facility capacity, and a $0.7 billion commitment for a loan facility. We re-established access to unsecured debt markets and successfully refinanced $2.3 billion of secured or guaranteed high coupon debt, in some instances reducing the coupon by up to 600 basis points. Given the current environment and anticipated inflationary pressures, we continue to take numerous actions to reshape our cost structure, with a goal of further improving upon our leading pre-COVID margins.
New hardware is a key pillar to supporting our recovery and a driver of quality demand and financial performance. This past year we successfully took delivery of Celebrity Apex, Odyssey of the Seas and Silver Dawn, all poised to significantly contribute to our yield growth, profitability, and cash generation. Additionally, we look forward to welcoming two new ships in 2022, Wonder of the Seas and Celebrity Beyond. We expect to return the full fleet before the summer season of 2022 and load factors to reach pre-COVID levels in the third quarter. Although Omicron has caused service disruptions, several cancelled sailings and a likely delay in our return to profitability by a few months, we currently expect to be generating net income in the second half of 2022.
As we focus on setting the foundation for a strong recovery and long-term profitable growth, we remain driven to innovate our product and maintain a strong competitive advantage. We finished the year stronger than we started and continue to manage the challenges related to Omicron, as well as search for further operational opportunities on our journey back to financial health.
Results of Operations
In addition to the items discussed above under "Executive Overview," significant items for 20212023 include:
•Our Net LossIncome attributable to Royal Caribbean Cruises Ltd. and Adjusted Net LossIncome attributable to Royal Caribbean Cruises Ltd. for the year ended December 31, 20212023 was $(5.3)$1.7 billion and $(4.8)$1.8 billion, or $(20.89)$6.31 and $(19.19)$6.77 per share on a diluted basis, respectively, as compared to Net Loss attributable to Royal Caribbean Cruises Ltd. and Adjusted Net Loss attributable to Royal Caribbean Cruises Ltd. of $(5.8)$(2.2) billion and $(3.9)$(1.9) billion, or $(27.05)$(8.45) and $(18.31)$(7.50) per share on a diluted basis, respectively, for the year ended December 31, 2020.2022.
•Total revenues excluding the effect of changes in foreign currency rates, decreasedincreased by $686.1 million$5.1 billion for the year ended December 31, 20212023 as compared to the same period in 2020 resulting from a 52.6% decrease2022. The increase was primarily driven by our full operations at higher occupancy, capacity, and ticket prices in occupancy in 2021 while we gradually returned to service 2023,compared to 2020 whenpartial to full operations during the majorityfirst half and second half of our fleet was operational up through our global suspension in March of 2020.
•The effect of changes in foreign currency exchange rates related to our passenger ticket2022, respectively, at lower occupancy and onboard and other revenue transactions, denominated in currencies other than the United States dollar, resulted in an increase in total revenues of $9.5 million for the year ended December 31, 2021 compared to the same period in 2020.capacity rates.
•Total cruise operating expenses excluding the effect of changes in foreign currency rate, decreasedincreased by $114.9 million$1.2 billion for the year ended December 31, 20212023 compared to the same period in 2020, which2022. The increase reflects the decreaseour operations in 2023 at higher capacity and occupancy, mentioned above.
•The effect of changes in foreign currency exchange rates related to our cruise operating expenses, denominated in currencies other than the United States dollar, resulted in an increase in total operating expenses of $7.3 million for the year ended December 31, 2021 compared to the same period in 2020.2022.
•DuringIn February 2023, we issued $700 million aggregate principal amount of 7.25% senior guaranteed notes due January 2030 ("7.25% Priority Guaranteed Notes"). Upon closing, we terminated our commitment for the year ended December 31, 2021 and 2020, as a result of ongoing impact of$700 million 364-day term loan facility. In addition, the COVID-19 pandemic on our operations and cash flows, we recorded total impairment and credit losses of $82.0remaining $350 million and $1.6 billion, respectively, related to long-lived assets and credit losses related to our notes receivable, net of recoveries, in 2021, and to goodwill, trademarks and trade names, long-lived assets, including right-of-use assets, and credit losses related to our notes receivable in 2020.backstop committed financing was also terminated upon closing,
•Effective October 1, 2021,March 31, 2023, we eliminatedclosed on the Silversea Cruises three-month reporting lag to be consistentpreviously announced partnership with the fiscal calendariCON. As part of the Company.transaction, we sold 80% of PortMiami for $209 million and retained a 20% minority interest. The effectpartnership will own, develop, and manage cruise terminal facilities and infrastructure in key ports of this change was an increasecall, initially including several development projects in Italy, Spain, and the U.S. Virgin Islands. Refer to net loss of $62.6 million, or a $0.25 per share loss on a basicNote 7. Investments and diluted basis, and this amount is reported within Other (expense) incomeAssets in our consolidated statements of comprehensive income (loss) for the year ended December 31, 2021. Refer to Note 1. General to our consolidated financial statements under Item 8. Financial Statements and Supplementary Data for further information on the elimination of the Silversea Cruises reporting lag.transaction.
•DuringIn June 2023, our 4.25% Convertible Senior Notes with an outstanding balance of $350 million were settled using a combination of $338 million in cash, and the year ended December 31, 2021,issuance of approximately 374,000 shares of common stock. The issuance of equity increased additional paid in capital by an immaterial amount.
•In June 2023, we executed took delivery of Silver Nova, and amended various financing arrangements.in November 2023, we took delivery of Celebrity Ascent, and Icon of the Seas. Refer to Note 8. Debtand Note 10. Shareholders' Equity, to our consolidated financial statements under Item 8. Financial Statements and SupplementalSupplementary Data for further information on the financing of the ships. Silver Nova, Celebrity Ascent, and Icon of the Seas entered service in the third and fourth quarters of 2023, and the first quarter of 2024, respectively.
•In November 2023, we settled $225 million of our 2.875% Convertible Senior Notes. The notes were settled using a combination of $225 million in cash and the issuance of approximately 147,000 shares of common stock. The issuance of equity increased additional paid in capital by an immaterial amount.
•During the year ended December 31, 2023, we executed and amended various financing arrangements on our two unsecured revolving credit facilities. Following these refinancings, our aggregate revolving credit commitments are $3.5 billion, with $1.7 billion scheduled to mature in October 2026, and $1.7 billion scheduled to mature in October 2028, and $97 million scheduled to mature in April 2025.
•During the year ended December 31, 2023, we fully repaid the $1.4 billion outstanding balance on our 11.50% secured senior notes due in June 2025.
For further information regarding the debt transactions discussed above, refer to Note 8. Debt to our consolidated financial statements under Item 8. Financial Statements and Supplementary Datafor further information on our 20212023 financing activity.activity
We reported Net Income (Loss) Income attributable to Royal Caribbean Cruises Ltd., Adjusted Net Income (Loss) Income attributable to Royal Caribbean Cruises Ltd., Earnings (Loss) Earnings per Share and Adjusted Earnings (Loss) Earnings per Share as shown in the following table (in thousands,millions, except per share data):
| | | | | | | | | | | | | | | | | |
| Year Ended December 31, |
| 2021 | | 2020 | | 2019 |
| Net (Loss) Income attributable to Royal Caribbean Cruises Ltd. | $ | (5,260,499) | | | $ | (5,797,462) | | | $ | 1,878,887 | |
| Adjusted Net (Loss) Income attributable to Royal Caribbean Cruises Ltd. | (4,832,889) | | | (3,924,579) | | | 2,002,847 | |
| Net Adjustments to Net (Loss) Income attributable to Royal Caribbean Cruises Ltd. | $ | 427,610 | | | $ | 1,872,883 | | | $ | 123,960 | |
| Adjustments to Net (Loss) Income attributable to Royal Caribbean Cruises Ltd.: | | | | | |
| Loss on extinguishment of debt (1) | $ | 138,759 | | | $ | 41,109 | | | $ | 6,326 | |
| Convertible debt amortization of debt discount (2) | 104,291 | | | 46,546 | | | — | |
| Pullmantur reorganization settlement (3) | 10,242 | | | 21,637 | | | — | |
| Impairment and credit losses (4) | 82,001 | | | 1,566,380 | | | — | |
| Equity investment impairment (5) | 31,344 | | | 39,735 | | | — | |
Oasis of the Seas incident, Grand Bahama's drydock write-off and other incidental expenses (6) | (6,584) | | | (1,938) | | | 35,239 | |
| Restructuring charges and other initiatives expense (7) | 1,831 | | | 51,853 | | | 13,707 | |
| Change in the fair value of contingent consideration and amortization of Silversea Cruises intangible assets related to Silversea Cruises acquisition (8) | 6,493 | | | (33,814) | | | 30,675 | |
| Noncontrolling interest adjustment (9) | — | | | 72,331 | | | 35,965 | |
| Net gain related to the sale of Azamara brand (10) | (3,371) | | | — | | | — | |
| Currency translation adjustment losses (11) | — | | | 69,044 | | | — | |
| Net Loss related to the elimination of the Silversea reporting lag (12) | 62,604 | | | — | | | — | |
| Transaction and integration costs related to the Silversea Cruises acquisition (8) | — | | | — | | | 2,048 | |
| Net Adjustments to Net (Loss) Income attributable to Royal Caribbean Cruises Ltd. | $ | 427,610 | | | $ | 1,872,883 | | | $ | 123,960 | |
| | | | | |
| Basic: | | | | | |
| (Loss) Earnings per Share | $ | (20.89) | | | $ | (27.05) | | | $ | 8.97 | |
| Adjusted (Loss) Earnings per Share | $ | (19.19) | | | $ | (18.31) | | | $ | 9.56 | |
| | | | | |
| Diluted: | | | | | |
| (Loss) Earnings per Share | $ | (20.89) | | | $ | (27.05) | | | $ | 8.95 | |
| Adjusted (Loss) Earnings per Share | $ | (19.19) | | | $ | (18.31) | | | $ | 9.54 | |
| | | | | |
| Weighted-Average Shares Outstanding: | | | | | |
| Basic | 251,812 | | | 214,335 | | | 209,405 | |
| Diluted | 251,812 | | | 214,335 | | | 209,930 | |
| | | | | | | | | | | | | | | | | |
| Year Ended December 31, |
| 2023 | | 2022 | | 2021 |
| Net Income (Loss) attributable to Royal Caribbean Cruises Ltd. | $ | 1,697 | | | $ | (2,156) | | | $ | (5,260) | |
| Loss on extinguishment of debt | 121 | | | 94 | | | 139 | |
| Gain on sale of controlling interest (1) | (3) | | | — | | | — | |
| PortMiami tax on sale of noncontrolling interest (2) | 7 | | | — | | | — | |
| Silver Whisper deferred tax liability release (3) | (26) | | | — | | | — | |
| Impairment and credit losses (4) | 8 | | | 1 | | | 82 | |
| Amortization of Silversea Cruises intangible assets resulting from the Silversea Cruises acquisition (5) | 6 | | | 6 | | | 6 | |
| Restructuring charges and other initiatives expense | 5 | | | 12 | | | 2 | |
| Equity investment impairment and recovery of losses (6) | 12 | | | — | | | 31 | |
| Litigation loss contingency (7) | — | | | 130 | | | — | |
| Convertible debt amortization of debt discount (8) | — | | | — | | | 104 | |
| Pullmantur reorganization settlement (9) | — | | | — | | | 10 | |
| Oasis of the Seas incident (10) | — | | | — | | | (7) | |
| Net gain related to the sale of Azamara brand (11) | — | | | — | | | (3) | |
| Net loss related to the elimination of the Silversea Cruises reporting lag (12) | — | | | — | | | 63 | |
| Adjusted Net Income (Loss) attributable to Royal Caribbean Cruises Ltd. | $ | 1,827 | | | $ | (1,913) | | | $ | (4,833) | |
| | | | | |
| Basic: | | | | | |
| Earnings (Loss) per Share | $ | 6.63 | | | $ | (8.45) | | | $ | (20.89) | |
| Adjusted Earnings (Loss) per Share | $ | 7.14 | | | $ | (7.50) | | | $ | (19.19) | |
| | | | | |
| Diluted: | | | | | |
| Earnings (Loss) per Share (13) | $ | 6.31 | | | $ | (8.45) | | | $ | (20.89) | |
| Adjusted Earnings (Loss) per Share (13) | $ | 6.77 | | | $ | (7.50) | | | $ | (19.19) | |
| | | | | |
| Weighted-Average Shares Outstanding: | | | | | |
| Basic | 256 | | | 255 | | | 252 | |
| Diluted | 283 | | | 255 | | | 252 | |
(1)In 2021, represents the net lossRepresents gain on sale of controlling interest in cruise terminal facilities in Italy. These amounts are included in Other operating within our consolidated statements of comprehensive income (loss).
(2) Represents tax on the partial repaymentPortMiami sale of noncontrolling interest. These amounts are included in Other (expense) income in our consolidated statements of comprehensive income (loss).
(3) Represents the release of the 11.50% senior secureddeferred tax liability subsequent to the execution of the bargain purchase option for the Silver Whisper. These amounts are included in Other(expense) income within our consolidated statements of comprehensive income (loss).
(4) Represents asset impairments and credit loss recoveries for notes due 2025,receivables for which credit losses were previously recorded. These amounts are included in Other operating within our consolidated statements of comprehensive income (loss). Additionally, for 2023 includes an $11 million impairment related to ceasing the use of certain real estate assets in our shoreside operations. This amount is included in Marketing, selling and administrative expenses within our consolidated statements of comprehensive income (loss). For 2022 and 2021, amounts represents asset impairment and credit losses as a result of the impact of COVID-19, net gain onof the full repaymentrecovery of credit losses previously recognized
(5) Represents the amortization of the Silversea Notes and the loss on the partial repayment of the $1.55 billion unsecured revolving credit facility. In 2020, represents the loss on the extinguishment of the $2.2 billion Senior Secured Term Loan. In 2019, represents the loss on the extinguishment of the $700 million 364-day loan related toCruises intangible assets resulting from the 2018 Silversea Cruises acquisitionacquisition.
(6) For 2023, represents equity method impairments of $13 million and recognition of deferred currency translation adjustment losses of $4 million. These amounts are included in Equity investment income (loss) and Other (expense) income within our consolidated statements of comprehensive income (loss), respectively. Additionally, 2023, includes a $4 million recovery of losses from one of our equity method investees recognized during the remaining balancesecond quarter of 2023. For 2021, amount represents equity investment asset impairment, primarily for our investments in TUI Cruises GmbH as a result of the unsecured term loan originally incurredimpact of COVID-19. These amount is included in 2010 to purchase AllureEquity investment income (loss) within our consolidated statements of the Seascomprehensive income (loss).
(2)(7) Represents the 2022 loss contingency recorded in connection with the ongoing Havana Docks litigation inclusive of post-judgment interest and related legal fees and costs. This amount is included in Other (expense) income within our consolidated statements of comprehensive income (loss).
(8) Represents the amortization of non-cash debt discount on our convertible notes.
For further information regarding the adoption of ASU 2020-06 as of January 1, 2022, which impacts the accounting of the non-cash debt discount on convertible notes, refer to Note 2
41
(3)(9) Represents estimated cash refunds expected to be paid to Pullmantur guests and other expenses incurred as part of the Pullmantur S.A. reorganization.
(4) In 2021 and 2020, represents asset impairment and credit losses as a result of the impact of COVID-19. In 2021, amounts are net of the recovery of credit losses recognized in 2020.
(5) Represents equity investment asset impairment, primarily for our investments in TUI Cruises GmbH, in 2021 and Grand Bahama Shipyard in 2020, as a result of the impact of COVID-19.
(6) In 2021 and 2020, amounts(10) Amounts include net insurance recoveries related to the collapse of the drydock structure at the Grand Bahama Shipyard involving Oasis of the Seas.
(11) Represents the net gain recognized in 2021 in relation to the sale of the Azamara brand.
(12) Represents the net loss related to the elimination of the Silversea Cruises reporting lag.
(13) For 2023, diluted EPS and adjusted EPS includes the add-back of dilutive interest expense related to our convertible notes of $88 million.
| | | | | | | | | |
| Year Ended December 31, |
| 2019 | | | | |
| Net Income attributable to Royal Caribbean Cruises Ltd. | $ | 1,879 | | | | | |
| Oasis of the Seas incident, Grand Bahama's drydock write-off and other incidental expenses (1) | 35 | | | | | |
| Loss on extinguishment of debt | 6 | | | | | |
| Change in the fair value of contingent consideration and amortization of Silversea Cruises intangible assets related to Silversea Cruises acquisition (2) | 31 | | | | | |
| Restructuring charges and other initiatives expense (3) | 14 | | | | | |
| Transaction and integration costs related to the Silversea Cruises acquisition (2) | 2 | | | | | |
| Noncontrolling interest adjustment (4) | 36 | | | | | |
| | | | | |
| | | | | |
| | | | | |
| Adjusted Net Income attributable to Royal Caribbean Cruises Ltd. | $ | 2,003 | | | | | |
| | | | | |
| Basic: | | | | | |
| Earnings per Share | $ | 8.97 | | | | | |
| Adjusted Earnings per Share | $ | 9.56 | | | | | |
| | | | | |
| Diluted: | | | | | |
| Earnings per Share | $ | 8.95 | | | | | |
| Adjusted Earnings per Share | $ | 9.54 | | | | | |
| | | | | |
| Weighted-Average Shares Outstanding: | | | | | |
| Basic | 209 | | | | | |
| Diluted | 210 | | | | | |
(1) In 2019, amountAmount includes incidental costs, net of insurance recoveries of $14.5$14 million related to the collapse of the drydock structure at the Grand Bahama Shipyard involving Oasis of the Seas, which were reported primarily within Other operating expenses expenses in our consolidated statements of comprehensive income (loss) income for the year ended December 31, 2019; and $20.7$21 million regarding the Grand Bahama incident involving one of its drydocks, included in Equityour equity investment income (loss) within our consolidated statements of comprehensive income (loss) for the year ended December 31, 2019.
(7) (2)Represents primarilythe change in the fair value of the contingent consideration and the amortization of the Silversea Cruises intangible assets resulting from the 2018 Silversea Cruises acquisition.
(3)Represents restructuring charges incurred in relation to the reduction in our U.S. workforce and other initiatives expenses in 2020 and 2021. Refer to Note 18. Restructuring Charges to our consolidated financial statements under item 8. Financial Statements and Supplementary Data for further information on the restructuring activities. In 2019, represents primarily the reorganization of our international sales and marketing structure.structure and other initiatives expenses.
(8) Related to the 2018 Silversea Cruises acquisition. Refer to Note 1(4). General to our consolidated financial statements under Item 8. Financial Statements and Supplementary Data for information on the Silversea Cruises acquisition.
(9) Adjustment made to exclude the impact of the contractual accretion requirements associated with the put option held by Heritage Cruise Holding Ltd.'s (previously known as Silversea Cruises Group Ltd.)'s noncontrolling interest, which noncontrolling interest we acquired on July 9, 2020.
(10) Represents the net gain recognized in the first quarter of 2021 in relation to the sale of the Azamara brand.
(11) Represents currency translation losses recognized in connection with the ships sold in 2020 that were previously chartered to Pullmantur. Refer to Note 7. Other Assets to our consolidated financial statements under Item 1. Financial Statements and Supplementary Data for further information.
(12) Represents the net loss related to the elimination of the Silversea Cruises reporting lag.
The following table presents operating results as a percentage of total revenues for the last three years:
| | Year Ended December 31, |
| 2021 | | 2020 | | 2019 |
| Year Ended December 31, | | | Year Ended December 31, |
| 2023 | | | 2023 | | 2022 | | 2021 |
| Passenger ticket revenues | Passenger ticket revenues | 61.4 | % | | 68.1 | % | | 71.7 | % | Passenger ticket revenues | 68.8 | % | | 65.5 | % | | 61.4 | % |
| Onboard and other revenues | Onboard and other revenues | 38.6 | % | | 31.9 | % | | 28.3 | % | Onboard and other revenues | 31.2 | % | | 34.5 | % | | 38.6 | % |
| Total revenues | Total revenues | 100.0 | % | | 100.0 | % | | 100.0 | % | Total revenues | 100.0 | % | | 100.0 | % | | 100.0 | % |
| Cruise operating expenses: | Cruise operating expenses: | | | | | |
| Commissions, transportation and other | |
| Commissions, transportation and other | |
| Commissions, transportation and other | Commissions, transportation and other | 13.5 | % | | 15.6 | % | | 15.1 | % | 14.4 | % | | 15.4 | % | | 13.6 | % |
| Onboard and other | Onboard and other | 7.6 | % | | 7.1 | % | | 5.8 | % | Onboard and other | 5.8 | % | | 6.8 | % | | 7.6 | % |
| Payroll and related | Payroll and related | 54.7 | % | | 35.7 | % | | 9.9 | % | Payroll and related | 8.6 | % | | 14.6 | % | | 54.7 | % |
| Food | Food | 10.7 | % | | 7.3 | % | | 5.3 | % | Food | 5.9 | % | | 7.4 | % | | 10.7 | % |
| Fuel | Fuel | 25.1 | % | | 16.8 | % | | 6.4 | % | Fuel | 8.3 | % | | 12.1 | % | | 25.1 | % |
| Other operating | Other operating | 61.7 | % | | 42.7 | % | | 12.8 | % | Other operating | 12.9 | % | | 18.6 | % | | 67.0 | % |
| Total cruise operating expenses | Total cruise operating expenses | 173.5 | % | | 125.2 | % | | 55.4 | % | Total cruise operating expenses | 55.9 | % | | 74.8 | % | | 178.8 | % |
| Marketing, selling and administrative expenses | Marketing, selling and administrative expenses | 89.4 | % | | 54.3 | % | | 14.2 | % | Marketing, selling and administrative expenses | 12.9 | % | | 17.9 | % | | 89.4 | % |
| Depreciation and amortization expenses | Depreciation and amortization expenses | 84.4 | % | | 57.9 | % | | 11.4 | % | Depreciation and amortization expenses | 10.5 | % | | 15.9 | % | | 84.4 | % |
| Impairment and credit losses | 5.4 | % | | 70.9 | % | | — | % |
| Operating (Loss) Income | (252.6) | % | | (208.3) | % | | 19.0 | % |
| Operating Income (Loss) | | Operating Income (Loss) | 20.7 | % | | (8.7) | % | | (252.6) | % |
| Other income (expense): | Other income (expense): | | | | | |
| Interest income | Interest income | 1.1 | % | | 1.0 | % | | 0.2 | % |
| Interest income | |
| Interest income | | 0.3 | % | | 0.4 | % | | 1.1 | % |
| Interest expense, net of interest capitalized | Interest expense, net of interest capitalized | (84.3) | % | | (38.2) | % | | (3.7) | % | Interest expense, net of interest capitalized | (10.1) | % | | (15.4) | % | | (84.3) | % |
| Equity investment (loss) income | (8.8) | % | | (9.7) | % | | 2.1 | % |
| Other income (expense) | 1.3 | % | | (6.2) | % | | (0.2) | % |
| (90.7) | % | | (53.1) | % | | (1.6) | % |
| Net (Loss) Income | (343.3) | % | | (261.5) | % | | 17.4 | % |
| Equity investment income (loss) | | Equity investment income (loss) | 1.4 | % | | 0.6 | % | | (8.8) | % |
| Other (expense) income | | Other (expense) income | (0.1) | % | | (1.3) | % | | 1.3 | % |
| (8.4) | | | (8.4) | % | | (15.7) | % | | (90.7) | % |
| Net Income (Loss) | | Net Income (Loss) | 12.3 | % | | (24.4) | % | | (343.3) | % |
| Less: Net Income attributable to noncontrolling interest | Less: Net Income attributable to noncontrolling interest | — | % | | 1.0 | % | | 0.3 | % | Less: Net Income attributable to noncontrolling interest | 0.1 | % | | — | % | | — | % |
| Net (Loss) Income attributable to Royal Caribbean Cruises Ltd. | (343.3) | % | | (262.5) | % | | 17.2 | % |
| Net Income (Loss) attributable to Royal Caribbean Cruises Ltd. | | Net Income (Loss) attributable to Royal Caribbean Cruises Ltd. | 12.2 | % | | (24.4) | % | | (343.3) | % |
Selected statistical information is shown in the following table:
| | Year Ended December 31, |
| 2021(1)(3) | | 2020(2) | | 2019 (2) |
| Year Ended December 31, | | | Year Ended December 31, |
| 2023 | | | 2023 | | 2022 | | 2021(1)(2) |
| Passengers Carried | Passengers Carried | 1,030,403 | | | 1,295,144 | | | 6,553,865 | |
| Passenger Cruise Days | Passenger Cruise Days | 5,802,582 | | | 8,697,893 | | | 44,803,953 | |
| APCD | APCD | 11,767,441 | | | 8,539,903 | | | 41,432,451 | |
| Occupancy | Occupancy | 49.3 | % | | 101.9 | % | | 108.1 | % | Occupancy | 105.6 | % | | 85.1 | % | | 49.3 | % |
(1) Due to the elimination of the Silversea Cruises three-month reporting lag in October of 2021, we include Silversea Cruises' metrics from October 1, 2020 through June 30, 2021 and October 1 through December 31, 2021 in the year ended December 31, 2021. The year ended December 31, 2021 does not include July, August, and September 2021 statistics as Silversea Cruises' results of operations for those months are included within Other (expense) income in our consolidated statements of comprehensive loss for the year ended December 31, 2021. Refer to Note 1. General to our consolidated financial statements under Item 8.8. Financial Statements and Supplementary Data for more information on the three-month reporting lag.
(2) Due to the three-month reporting lag effective through September 30, 2021, we include Silversea Cruises' metrics from October 1, 2019 through September 30, 2020 in the year ended December 31, 2020 and from October 1, 2018 through September 30, 2019 in the year ended December 31, 2019.
(3) For the year ended December, 31, 2021, we include Azamara Cruises' metrics through March 19, 2021, the effective sale date of the brand. Refer to Note 1. General to our consolidated financial statements under Item 8.8. Financial Statements and Supplementary Data for more information on the sale of the Azamara Cruises brand.
EBITDA and Adjusted EBITDA were calculated as follows (in millions):
| | | | | | | | | | | | | | | | | | | | |
| | Year Ended December 31, |
| | 2023 | | 2022 | | 2021 |
| | | | | | |
| Net Income (Loss) attributable to Royal Caribbean Cruises Ltd. | | $ | 1,697 | | | $ | (2,156) | | | $ | (5,260) | |
| Interest income | | (36) | | | (36) | | | (17) | |
| Interest expense, net of interest capitalized | | 1,402 | | | 1,364 | | | 1,292 | |
| Depreciation and amortization expenses | | 1,455 | | | 1,407 | | | 1,293 | |
| Income tax expense (benefit) (1) | | 6 | | | 4 | | | (47) | |
| EBITDA | | 4,524 | | | 583 | | | (2,739) | |
| | | | | | |
| Other expense (2) | | 2 | | | 115 | | | 27 | |
| Gain on sale of controlling interest (3) | | (3) | | | — | | | — | |
| Impairment and credit losses (4) | | 8 | | | 1 | | | 82 | |
| Restructuring charges and other initiatives expense | | 5 | | | 12 | | | 2 | |
| Equity investment impairment and recovery of losses (5) | | 8 | | | — | | | 31 | |
| Pullmantur reorganization settlement (6) | | — | | | — | | | 5 | |
| Oasis of the Seas incident (7) | | — | | | — | | | (7) | |
| Net gain related to the sale of Azamara brand | | — | | | — | | | (3) | |
| Adjusted EBITDA | | $ | 4,544 | | | $ | 711 | | | $ | (2,602) | |
(1) These amounts are included in Other (expense) income within our consolidated statements of comprehensive income (loss).
(2) Represents net non-operating expense. For 2022, primarily represents our loss contingency recorded in connection with the ongoing Havana Docks litigation inclusive of related legal fees and costs. For 2021 primarily relates to changes in the fair value of fuel swaps for which cash flow hedge accounting was discontinued. The Company’s operationsamount excludes income tax expense (benefit), included in the EBITDA calculation above.
(3) Represents gain on sale of controlling interest in cruise terminal facilities in Italy. These amounts are still impacted by COVID-19included in Other operating within our consolidated statements of comprehensive income (loss).
(4) Represents asset impairments and itscredit loss recoveries for notes receivables for which credit losses were previously recorded. These amounts are included in Other operating within our consolidated statements of comprehensive income (loss). Additionally, for 2023 includes an $11 million impairment related variants. The adverseto ceasing the use of certain real estate assets in our shoreside operations. This amount is included in Marketing, selling and administrative expenses within our consolidated statements of comprehensive income (loss). For 2022 and 2021, amounts represents asset impairment and credit losses as a result of the impact of COVID-19, net of the COVID-19 pandemic onrecovery of credit losses previously recognized.
(5) For 2023, represents equity method impairments of $13 million recognized during the third quarter of 2023, and a $4 million recovery of losses from one of our revenues,equity method investees recognized during the second quarter of 2023. For 2021, amount represents equity investment asset impairment, primarily for our investments in TUI Cruises GmbH, as a result of the impact of COVID-19. These amounts are included in Equity investment income (loss) within our consolidated resultsstatements of operations,comprehensive income (loss).
(6) Represents estimated cash flows and financial condition has been and will continuerefunds expected to be materialpaid to Pullmantur guests and other expenses incurred as part of the Pullmantur S.A. reorganization..
(7) Represents net insurance recoveries related to the collapse of the drydock structure at the Grand Bahama Shipyard involving Oasis of the Seas.
Gross Margin Yields and Net Yields were calculated by dividing Gross Margin and Adjusted Gross Margin by APCD as follows (in millions, except APCD and Yields):
| | | | | | | | | | | | | | | | | |
| Year Ended December 31, |
| 2023 | | 2022 | | 2021 |
| Total revenues | $ | 13,900 | | | $ | 8,840 | | | $ | 1,532 | |
| Less: | | | | | |
| Cruise operating expenses | 7,775 | | | 6,616 | | | 2,739 | |
| Depreciation and amortization expenses | 1,455 | | | 1,407 | | | 1,293 | |
| Gross Margin | 4,670 | | | 817 | | | (2,500) | |
| Add: | | | | | |
| Payroll and related | 1,197 | | | 1,288 | | | 838 | |
| Food | 819 | | | 653 | | | 164 | |
| Fuel | 1,150 | | | 1,073 | | | 385 | |
| Other operating | 1,799 | | | 1,648 | | | 1,027 | |
| Depreciation and amortization expenses | 1,455 | | | 1,407 | | | 1,293 | |
| Adjusted Gross Margin | $ | 11,090 | | | $ | 6,886 | | | $ | 1,207 | |
| | | | | |
| APCD | 46,916,259 | | | 41,197,650 | | | 11,767,441 | |
| Gross Margin Yields | $ | 99.54 | | | $ | 19.83 | | | $ | (212.45) | |
| Net Yields | $ | 236.38 | | | $ | 167.15 | | | $ | 102.57 | |
| | | | | | | | | | | | | | | | | |
| Year Ended December 31, |
| 2023 | | 2023 On a Constant Currency Basis | | 2019 |
| Total revenues | $ | 13,900 | | | $ | — | | | $ | 10,951 | |
| Less: | | | | | |
| Cruise operating expenses | 7,775 | | | — | | | 6,063 | |
| Depreciation and amortization expenses | 1,455 | | | — | | | 1,246 | |
| Gross Margin | 4,670 | | | 4,699 | | | 3,642 | |
| Add: | | | | | |
| Payroll and related | 1,197 | | | — | | | 1,079 | |
| Food | 819 | | | — | | | 584 | |
| Fuel | 1,150 | | | — | | | 698 | |
| Other operating | 1,799 | | | — | | | 1,406 | |
| Depreciation and amortization expenses | 1,455 | | | — | | | 1,246 | |
| Adjusted Gross Margin | $ | 11,090 | | | $ | 11,123 | | | $ | 8,655 | |
| | | | | |
| APCD | 46,916,259 | | | 46,916,259 | | | 41,432,451 | |
| Gross Margin Yields | $ | 99.54 | | | $ | 100.16 | | | $ | 87.90 | |
| Net Yields | $ | 236.38 | | | $ | 237.08 | | | $ | 208.89 | |
Gross Cruise Costs, Net Cruise Costs and Net Cruise Costs excluding Fuel were calculated as follows (in millions, except APCD and costs per APCD):
| | | | | | | | | | | | | | | | | |
| Year Ended December 31, |
| 2023 | | 2022 | | 2021 |
| Total cruise operating expenses | $ | 7,775 | | | $ | 6,616 | | | $ | 2,739 | |
| Marketing, selling and administrative expenses | 1,792 | | | 1,583 | | | 1,370 | |
| Gross Cruise Costs | 9,567 | | | 8,199 | | | 4,109 | |
| Less: | | | | | |
| Commissions, transportation and other | 2,001 | | | 1,357 | | | 208 | |
| Onboard and other | 809 | | | 597 | | | 117 | |
| Net Cruise Costs including other costs | 6,757 | | | 6,245 | | | 3,784 | |
| Less: | | | | | |
| Gain on sale of controlling interests (1) | (3) | | | — | | | — | |
| Impairment and credit losses (2) | 8 | | | 1 | | | 82 | |
| Restructuring charges and other initiatives expense (3) | 5 | | | 12 | | | 2 | |
| Net Cruise Costs | 6,747 | | | 6,232 | | | 3,700 | |
| Less: | | | | | |
| Fuel | 1,150 | | | 1,073 | | | 385 | |
| Net Cruise Costs excluding Fuel | $ | 5,597 | | | $ | 5,159 | | | $ | 3,315 | |
| | | | | |
| APCD | 46,916,259 | | | 41,197,650 | | | 11,767,441 | |
| Gross Cruise Costs per APCD | $ | 203.92 | | | $ | 199.02 | | | $ | 349.18 | |
| Net Cruise Costs per APCD | $ | 143.81 | | | $ | 151.27 | | | $ | 314.43 | |
| Net Cruise Costs excluding Fuel per APCD | $ | 119.30 | | | $ | 125.23 | | | $ | 281.71 | |
(1) Represents gain on sale of controlling interest in 2022. We expectcruise terminal facilities in Italy. These amounts are included in Other operating within our consolidated statements of comprehensive income (loss).
(2) Represents asset impairments and credit loss recoveries for notes receivables for which credit losses were previously recorded. These amounts are included in Other operating within our consolidated statements of comprehensive income (loss). Additionally, for 2023 includes an $11 million impairment related to incur a net loss on both a U.S. GAAPceasing the use of certain real estate assets in our shoreside operations. This amount is included in Marketing, selling and adjusted basis for the first quarter and the first halfadministrative expenses within our consolidated statements of comprehensive income (loss). For 2022 and 2021, amounts represents asset impairment and credit losses as a return to profitabilityresult of the impact of COVID-19, net of the recovery of credit losses previously recognized.
(3) These amounts are included in the second halfMarketing, selling and administrative expenses within our consolidated statements of 2022. See comprehensive income (loss).
Recent Developments: COVID-19 – Continued Fleet Ramp-Up
43
Gross Cruise Costs, Net Cruise Costs and Net Cruise Costs excluding Fuel were calculated as follows (in millions, except APCD and costs per APCD):
| | | | | | | | | | | | | | | | | |
| Year Ended December 31, |
| 2023 | | 2023 On a Constant Currency Basis | | 2019 |
| Total cruise operating expenses | $ | 7,775 | | | $ | — | | | $ | 6,063 | |
| Marketing, selling and administrative expenses | 1,792 | | | — | | | 1,559 | |
| Gross Cruise Costs | 9,567 | | | 9,602 | | | 7,622 | |
| Less: | | | | | |
| Commissions, transportation and other | 2,001 | | | — | | | 1,656 | |
| Onboard and other | 809 | | | — | | | 640 | |
| Net Cruise Costs including other costs | 6,757 | | | | | 5,326 | |
| Less: | | | | | |
| Gain on sale of controlling interests (1) | (3) | | | — | | | — | |
| Impairment and credit losses (2) | 8 | | | — | | | — | |
| Restructuring charges and other initiatives expense (3) | 5 | | | — | | | 14 | |
| Integration costs related to Silversea Cruises acquisition (3) | — | | | — | | | 1 | |
| Transaction costs related to Silversea Cruises acquisition (3) | — | | | — | | | 1 | |
| Incidental costs related to the Oasis of the Seas incident included within other operating expenses | — | | | — | | | 15 | |
| Net Cruise Costs | 6,747 | | | 6,769 | | | 5,295 | |
| Less: | | | | | |
| Fuel | 1,150 | | | — | | | 698 | |
| Net Cruise Costs excluding Fuel | $ | 5,597 | | | $ | 5,619 | | | $ | 4,597 | |
| | | | | |
| APCD | 46,916,259 | | | 46,916,259 | | | 41,432,451 | |
| Gross Cruise Costs per APCD | $ | 203.92 | | | $ | 204.66 | | | $ | 183.96 | |
| Net Cruise Costs per APCD | $ | 143.81 | | | $ | 144.28 | | | $ | 127.80 | |
| Net Cruise Costs excluding Fuel per APCD | $ | 119.30 | | | $ | 119.77 | | | $ | 110.95 | |
(1) Represents gain on sale of controlling interest in cruise terminal facilities in Italy. These amounts are included in and Update on BookingsOther operating within our consolidated statements of comprehensive income (loss).
(2) Represents asset impairments and credit loss recoveries for further indications onnotes receivables for which credit losses were previously recorded. These amounts are included in Other operating within our resumptionconsolidated statements of operationscomprehensive income (loss). Additionally, for 2023 includes an $11 million impairment related to ceasing the use of certain real estate assets in our shoreside operations. This amount is included in Marketing, selling and the booking environment.administrative expenses within our consolidated statements of comprehensive income (loss).
(3) These amounts are included in Marketing, selling and administrative expenses within our consolidated statements of comprehensive income (loss).
Year Ended December 31, 20212023 Compared to Year Ended December 31, 20202022
In this section, references to 20212023 refer to the year ended December 31, 20212023 and references to 20202022 refer to the year ended December 31, 2020.2022.
Revenues
Total revenues for 2021 decreased $0.7increased $5.1 billion, or 30.6%57.2%, to $1.5 billion from $2.2$13.9 billion in 2020.2023 from $8.8 billion in 2022.
Passenger ticket revenues comprised 61.4%68.8% of our 20212023 total revenues. Passenger ticket revenues decreasedincreased by $0.6$3.8 billion, or 37.4%65.2% to $9.6 billion in 2023 from 2020. $5.8 billion in 2022. The decreaseincrease was primarily driven by a 20.5% higher occupancy, 13.9% increase in Passengercapacity, and higher ticket reflects a 52.6% decreaseprices in occupancy for2023, compared to the same period in 2021 during which we gradually returned to service compared to occupancy during 2020 when we operated the majority of our fleet, up through our global suspension in March of 2020.
The decrease to Passenger ticket revenues was slightly offset by the $5.0 million favorable effect of changes in foreign currency exchange rates related to our revenues in currencies other than the United States dollar.2022.
The remaining 38.6%31.2% of 2021 total revenues was comprised of Onboard and other revenues, which decreased $0.1increased $1.3 billion, or 16.1%. This decrease42.2% to $4.3 billion in 2023 from $3.0 billion in 2022. The increase was primarily due the increased occupancy and capacity noted above in 2023 compared to the 52.6% decreasesame period in occupancy noted above and a decrease2022.
The increase in cancellation fees in 2021. These decreases more than offset a strong onboard revenue per passenger cruise day performance duringrevenues reflect our gradual resumption offull operations in 2021 as well as2023 at higher occupancy, capacity, and prices, compared to a partial return to operations during the favorable effectfirst half of changes2022, full operations in foreign currency exchange rates relatedthe second half of 2022 at lower occupancy and capacity rates. Occupancy in 2023 was 105.6% compared to our Onboard and other revenues denominated85.1% in currencies other than the United States dollar of $4.5 million.2022.
Onboard and other revenues included concession revenues of $72.0$472 million in 20212023 and $76.0$332 million in 2020.2022.
Cruise Operating Expenses
Total Cruise operating expenses for 2021 decreased $0.1increased by $1.2 billion, or 3.9%17.5%, to $2.7$7.8 billion in 20212023 from $2.8$6.6 billion in 2020.2022. The decreaseincrease was primarily due to to:
•a $137.1$644 million decreaseincrease in Commissions, transportation and other expensesexpenses; and
•a $40.3$212 million decreaseincrease in Onboard and otherexpenses;
•a $166 million increase in Food Costs;
•a $151 million increase in Other operating expenses due to the decreaseexpenses; and
•a $77 million increase in revenues and occupancy noted above.Fuel expense.
The decreaseincrease inCruise operating expenses was partially noted above reflects full operations in 2023, including additional capacity and higher occupancy compared to the same period in 2022, offset by an increase ona decrease of $91 million in Payroll and relatedexpenses of $49.8 million due to additional costs incurred during our return to service during 2021, and the unfavorable effect of changes in foreign currency exchange rates related to our expense transactions denominated2022, which did not recur in currencies other than the United States dollar of $7.3 million.2023.
Marketing, Selling and Administrative Expenses
Marketing, selling and administrative expenses for 2021 increased $170.5$209 million, or 14.2%13.2% to $1.4 billion from $1.2$1.8 billion in 2020. The increase is due to the ramp up of our global sales and marketing efforts in the second half of 2021 as we commenced our resumption of operations.
Depreciation and Amortization Expenses
Depreciation and amortization expenses for 2021 increased $13.6 million, or 1.1%, to $1.3 billion. The increase was primarily due to the addition of Odyssey of the Seas to our fleet in the first quarter of 2021, a full year of depreciation in 2021 for Celebrity Apex, Silver Moon and Silver Origin which were added to our fleet during 2020, and to a lesser extent, the addition of Silver Dawn to our fleet in the fourth quarter of 2021. The increases in depreciation in 2021 were partially offset by lower depreciation resulting2023 from vessel disposals and asset impairments during 2020 and 2021.
Impairment and Credit Losses
For the year ended December 31, 2021 and 2020, as a result of the ongoing impact of the COVID-19 pandemic on our operations and cash flows, we recorded total impairment and credit losses of $82.0 million and $1.6 billion respectively,
in 2022, driven by an increase in payroll and benefits expense primarily related to constructiondriven by an increase in progress, other long-lived assetsheadcount and credit loss allowanceshigher stock price year over year related to our notes receivable in 2021, and to our goodwill, trademarks and trade names, vessels, construction in progress, right-of-use assets and credit loss allowances related to our notes receivable in 2020.performance share awards.
Other Income (Expense)
Interest expense, net of interest capitalizedEquity investment income (loss) , increased $447.5$143 million, or 53.0%250.9%, to $1.3 billion in 2021 from $844.2$200 million in 2020.2023 from $57 million in 2022. The increase in income was primarily due to new debt issuances in 2021 and 2020, a higher average balance on our revolver debt and a loss on extinguishmentan increase of debt of $138.8 million.
Equity investment (loss) improved by $77.8 million, or 36.5%, to a loss of $135.5 million in 2021income from a loss of $213.3 million in 2020 mainly due to decreased losses reported by our equity investments as a result of their return to operations during 2021 and receipt of local government grants byTUI Cruises, one of our equity investments.investments, in 2023 compared to 2022.
Other incomeexpense was $20.3$8 million in 20212023 compared to Otherother expense of $137.1$119 million in 2020.2022. The $111 million improvement is mainly driven by the loss contingency of $157.4$130 million includes an increaserecorded in income of $110.6 million related to2022 in connection with the change in the fair value of fuel swap derivative instruments that are not designated under hedge accounting, a one-time $14.4 million tax benefit recognized in 2021, and a $13.8 million decrease in foreign exchange losses from the remeasurement of monetary assets and liabilities denominated in foreign currency compared to 2020. Additionally in 2020, we recognized a deferred currency translation adjustment loss of $69.0 million related to the Pullmantur brand as we no longer have significant involvement in Pullmantur's operations,ongoing Havana Docks litigation, which did not recur in 2021, and a $20.0 million expense representing the cash refund expected to be paid to Pullmantur guests as part of the brand's reorganization, compared to a $5.0 million expense in 2021. The 2021 increases in income were partially offset by a $62.6 million loss recognized in 2021 resulting from the elimination of the Silversea Cruises three-month reporting lag effective October 1, 2021.2023.
Other Comprehensive Income (Loss)
Other comprehensive incomeloss in 20212023 was $28.5$30 million compared to $58.4Other comprehensive income of $67 million in 2020.2022. The decrease of $29.9$97 million in 2021 was primarily due a Loss on cash flow derivative hedges in 2023 of 27 million compared to a decrease in Gain on cash flow derivative hedges of $8 million in 20212022, and a decrease of $34.0 million. Gain on cash flow derivative hedges decreased$43 million in 2021 primarily due to the reclassification of fuel swap gains from Accumulated Other Comprehensive Loss into the Consolidated Statement of Comprehensive (Loss) Incomechange in 2021,defined benefit plans in 2023 compared to the reclassification of fuel swap losses during 2020. This decrease was partially offset by a net increase in the fair value of our cash flow derivative hedges, mostly driven by increases in the fair value of our fuel and interest rate swaps in 2021.
Year Ended December 31, 2020 Compared to Year Ended December 31, 2019
Future Application of Accounting Standards
Refer to Note. 2 Summary of Significant Accounting Policies to our consolidated financial statements under Item 8. Financial Statements and Supplementary Data for further information on Recent Accounting Pronouncements.
Liquidity and Capital Resources
Sources and Uses of Cash
Net cash (used in)provided by operating activities decreasedincreased by $1.9$4.0 billion to cash usedprovided of $1.9$4.5 billion for the year ended December 31, 2021,2023, compared to cash usedprovided of $3.7$0.5 billion for the same period in 2020. Our gradual resumption of operations in 2021 generated increased guest ticket collections, resulting in an increase of customer deposits of $1.4 billion for the twelve months ended December 31, 2021, compared to a decrease of customer deposits of $1.6 billion during the same period in 2020, during our suspension of global operations.2022. The increase was primarily attributable to higher occupancy and bookings in customer deposits was offset by increased expenses for our vessels that resumed cruise operations in 2021, including start up costs.
Net cash (used in) operating activities was $3.7 billionin 2020 compared to Net cash provided of $3.7 billion in 2019reflecting a change of $7.4 billion in 2020. The 2020 disruptions to our business led to a decrease in collections from our guests as well as an increase of refunds to guests for cancelled sailings during the year ended December 31, 20202023 compared to the same period in 2019.2022.
Net cash used in investing activities decreased $33.8 millionincreased by$0.9 billion to cash used of $2.1$3.9 billion for the year ended December 31, 2021,2023, compared to cash used of $2.2$3.0 billion for the same period in 2020.2022. The decrease in cash used in investing activitiesincrease was primarily attributable to ana increase in proceeds from the salecapital expenditures of property and equipment and other assets of $148.2 million in 2021$1.2 billion during 2023, compared to 2020,the same period in 2022 due to the increased cost associated with taking delivery of Silver Nova, Celebrity Ascent and Icon of the Seas in 2023, compared to the delivery of Wonder of the Seas,Celebrity Beyond, and Silver Endeavour during the same period in 2022. The increase was partially offset by a decrease in cash paid on settlement of derivative financial instruments of $87.1$270 million partially offset by an increase in capital expenditures of $264.6 million mostly dueduring 2022 compared to our purchase of Terminal A at PortMiami in 2021.2023.
Net cash used in investing activities decreased $0.9 billion to cash used $2.2 billion in 2020 compared to cash used $3.1 billion in 2019. The decrease in investing activities was primarily attributable to a decrease in capital expenditures of $1.1 billion.
Net cash(used in) provided by financing activities was $3.0$(2) billion in 2021for the year ended December 31, 2023, compared to cash provided of $9.3$1.7 billion for the same period in 2020.2022. The decreasechange of $6.3$3.7 billion was primarily attributable to higherdecrease of debt proceeds and issuance of commercial paper notes of $15.8$2.1 billion during the twelve months ended December 31, 2020,in 2023 compared to the same period in 2021, offset by higher2022, and an increase in repayment of debt and commercial paper repayments of $9.0$1.8 billion during the twelve months ended December 31, 2020,in 2023 compared to the same period in 2021. Additionally, dividends paid of $326.4 million during the twelve months ended December 31, 2020, compared to none during the same period in 2021.
Net cash provided by financing activities was $9.3 billion in 2020 compared to Net cash used of $0.7 billion in 2019.2022. The change was primarily attributable to an increase in debt proceeds of $10.0 billion in 2020 compared to the same period in 2019, and $1.4 billion in proceeds from common stock issuances in 2020. These proceeds were partially offset by net repaymentsproceeds received of commercial paper$209 million for the sale of $1.1 billionnoncontrolling interest of PortMiami during the twelve months ended December 31, 2020 compared to net borrowings of commercial paper of $0.6 billion during the same period in 2019.
Future Capital Commitments
Capital Expenditures
Our future capital commitments consist primarily of new ship orders. As of December 31, 2021,2023, we have twoone Oasis-class ships,ship, and threetwo ships of a new generation, known as our Icon-class, on order for our Royal Caribbean International brand with an aggregate capacity of approximately 28,20016,900 berths. As of December 31, 2021,2023, we have twoone Edge-class shipsship on order for our Celebrity Cruises brand, with an aggregatea capacity of approximately 6,5003,250 berths. Additionally, as of December 31, 2021,2023, we have two shipsone Evolution-class ship on order for our Silversea Cruises brand with an aggregate capacity of approximately 1,460730 berths. Refer to Item 1. Business-Operations for further information on our ships on order. We have committed financing arrangements in place covering 80% of the cost of the ship for the ninefive ships on order for our Global Brands, almost all of which include sovereign financing guarantees. Additionally,During the year ended December 31, 2023 we have an agreement in place with Chantiers de l’Atlantique to build an additionalreceived commitments for the unsecured financing of the fifth Edge-class ship, estimated for delivery in 2025, which is contingent upon completion of conditions precedent and financing.2025.
As of December 31, 2021,2023, the aggregate cost of our ships on order, not includingexcluding any ships on order by our Partner Brands, was approximately $12.4$7.9 billion, of which we had deposited $800.2 million as of such date.$698 million. Approximately 59.0%43.5% of the aggregate cost was exposed to fluctuations in the Euro exchange rate at December 31, 2021.2023. Refer to Note 16. Fair Value
Measurements and Derivative Instruments and Note 17. Commitments and Contingencies to our consolidated financial statements under Item 8. Financial Statements and Supplementary Data.
Decreased demand for cruising as a result of concerns regarding the COVID-19 pandemic had, and is expected to continue to have, a material impact on our cash flows, liquidity and financial position. In order to preserve liquidity throughout the COVID-19 pandemic, we deferred a significant portion of our planned 2020, 2021 and 2022 capital expenditures. As of December 31, 2021,2023, we anticipate overall full year capital expenditures, based on our existing ships on order, will be approximately $3.1$3.3 billion for 2022. These amounts do2024. This amount does not include any ships on order by our Partner Brands.
Material Cash Requirements
As of December 31, 2021,2023, our material cash requirements were as follows (in thousands)millions):
| | | | | | | | | | | | | | | | | | | | | | | | | | | | | |
| | Payments due by period |
| | | | Less than | | 1-3 | | 3-5 | | More than |
| | Total | | 1 year | | years | | years | | 5 years |
| Operating Activities: | | | | | | | | | |
Operating lease obligations(1) | $ | 1,272,527 | | | $ | 101,445 | | | $ | 190,048 | | | $ | 154,809 | | | $ | 826,225 | |
Interest on long-term debt(2) | 3,554,212 | | | 938,258 | | | 1,286,576 | | | 688,131 | | | 641,247 | |
Other(3) | 534,484 | | | 154,552 | | | 162,401 | | | 63,498 | | | 154,033 | |
| Investing Activities: | | | | | | | | | |
Ship purchase obligations(4) | 9,955,868 | | | 2,306,087 | | | 4,920,554 | | | 2,729,227 | | | — | |
| Financing Activities: | | | | | | | | | |
Debt obligations(5) | 20,618,065 | | | 2,191,620 | | | 9,345,412 | | | 4,781,668 | | | 4,299,365 | |
Finance lease obligations(6) | 472,275 | | | 51,511 | | | 57,497 | | | 44,896 | | | 318,371 | |
Other(7) | 17,374 | | | 8,414 | | | 8,960 | | | — | | | — | |
| Total | $ | 36,424,805 | | | $ | 5,751,887 | | | $ | 15,971,448 | | | $ | 8,462,229 | | | $ | 6,239,241 | |
| | | | | | | | | | | | | | | | | | | | | | | | | | | | | | | | | | | | | | | | | |
| | Payments due by period |
| | 2024 | | 2025 | | 2026 | | 2027 | | 2028 | | Thereafter | | Total |
| Operating Activities: | | | | | | | | | | | | | |
Interest on debt(1) | $ | 1,222 | | | $ | 1,141 | | | $ | 1,004 | | | $ | 834 | | | $ | 512 | | | $ | 1,104 | | | $ | 5,817 | |
Other(2) | 157 | | | 149 | | | 173 | | | 141 | | | 116 | | | 925 | | | 1,661 | |
| Investing Activities: | | | | | | | | | | | | | |
Ship purchase obligations(3) | 1,967 | | | 2,211 | | | 1,303 | | | — | | | — | | | — | | | 5,481 | |
| Total | $ | 3,346 | | | $ | 3,501 | | | $ | 2,480 | | | $ | 975 | | | $ | 628 | | | $ | 2,029 | | | $ | 12,959 | |
(1) We are obligated under noncancelable operating leases primarily for preferred berthing arrangements, real estate and shipboard equipment. Amounts represent contractual obligations with initial terms in excess of one year.
(2) Long-term debt obligations mature at various dates through fiscal year 20332037 and bear interest at fixed and variable rates. Interest on variable-rate debt is calculated based on forecasted debt balances, including the impact of interest rate swap agreements, using the applicable rate at December 31, 2021.2023. Debt denominated in other currencies is calculated based on the applicable exchange rate at December 31, 2021.2023.
(3)(2) Amounts primarily represent future commitments with remaining terms in excess of one year to pay for our usage of certain port facilities, marine consumables, services and maintenance contracts.
(4)(3) Amounts are based on contractual installment and delivery dates for our ships on order. Included in these figures are $7.9$4.5 billion in final contractual installments, which have committed financing. COVID-19 has impacted shipyard operations which have and may result in delaysfinancing covering 80% of the cost of the ships on order for our previously contracted ship deliveries.Global Brands, all of which include sovereign financing guarantees. Amounts do not include potential obligations which remain subject to cancellation at our sole discretion or any agreements entered for ships on order that remain contingent upon completion of conditions precedent.
(5)Refer to Note 8. Debt denominated in other currencies is calculated based on the applicable exchange rate at December 31, 2021. In addition, debt obligations presented above are net of debt issuance costs of $363.5 million as of December 31, 2021.
(6) Amounts represent finance lease obligations with initial terms in excess of one year.
(7) Amounts represent fees payable to sovereign guarantors in connection with certain of our export credit debt facilitiesconsolidated financial statements under Item 8. Financial Statements and facility fees on our revolving credit facilities.Supplementary Data for maturities related to debt.
Please referRefer to Note 9. Leases to our consolidated financial statements under Item 8. Financial Statements and Supplementary Data for maturities related to lease liabilities.
Refer to Funding Needs and Sources below for discussion on the planned funding of the above material contractual obligations.
As a normal part of our business, depending on market conditions, pricing and our overall growth strategy, we continuously consider opportunities to enter into contracts for the building of additional ships. We may also consider the sale of ships or the purchase of existing ships. We continuously consider potential acquisitions and strategic alliances. If any of these
were to occur, they would be financed through the incurrence of additional indebtedness, the issuance of additional shares of equity securities or through cash flows from operations.
Off-Balance Sheet Arrangements
TUI Cruises has entered into various ship construction and credit agreements that include certain restrictions on each of our and TUI AG's ability to reduce our current ownership interest in TUI Cruises below 37.55% through May 2033.
Some of the contracts that we enter into include indemnification provisions that obligate us to make payments to the counterparty if certain events occur. These contingencies generally relate to changes in taxes, increased lender capital costs and other similar costs. The indemnification clauses are often standard contractual terms and are entered into in the normal course of business. There are no stated or notional amounts included in the indemnification clauses and we are not able to estimate the maximum potential amount of future payments, if any, under these indemnification clauses. We have not been required to make any payments under such indemnification clauses in the past and, under current circumstances, we do not believe an indemnification obligation is probable..
In June of 2021, we exercisedRefer to Note 3. Revenue to our optionconsolidated financial statements under our operating lease with SMBC LeasingItem 8. Financial Statements and Finance, Inc (the "Lessor") to purchase Terminal A at PortMiami in July 2021 for the pre-agreed purchase price of $220.0 million. Upon purchase of the terminal lease in July 2021, the underlying asset was recorded as a leasehold improvement withinSupplementary Data Property and equipment, net. Our July 2021 purchase of the Port of Miami terminal eliminated the residual value guarantee and a requirement under the lease to post $181.1 million of cash collateral on or before July 18, 2021.
Certain of our surety agreements with third party providers for the benefit of certain agencies and associations that provide travel related bonds, allow the sureties to request collateral. We also have agreements with our credit card processors relatingprocessor agreements for export credit agency guarantees.
Refer to customer deposits received by us Note 7. Investments and Other Assets to our consolidated financial statements under Item 8. Financial Statements and Supplementary Data for future voyages. These agreements allow the credit card processorsownership restrictions related to require us, under certain circumstances, including breach of the financial covenants, the existence of other material adverse changes, excessive chargebacks, and other triggering events, to maintain a reserve that can be satisfied by posting collateral. As of December 31, 2021, we have posted letters of credit as collateral with our sureties and credit card processors under our revolving credit facilities in the amount of $193.3 million.TUI Cruises.
Executed amendments are in place Refer to Note 17. Commitments and Contingencies to our consolidated financial statements under Item 8. Financial Statements and Supplementary Data for the majority of our credit card processors, waiving reserve requirements tied to breach of our financial covenants through at least September 30, 2022, with modified covenants thereafter, and as such, we do not anticipate any incremental collateral requirements for the processors covered by these waivers in the next 12 months. We have a reserve with a processor where the agreement was amended in the first quarter of 2021, such that proceeds are held in reserve until the sailing takes place or the funds are refunded to the customer. The maximum projected exposure with the processor, including amounts currently withheld and reported in Trade and other receivables, is approximately $285.0 million. The amount and timing are dependent on future factors that are uncertain, such as the pace of resumption of our cruise operations, the volume of future deposits and whether we transfer our business to other processors. If we require additional waivers on the credit card processing agreements and are not able to obtain them, this could lead to the termination of these agreements or the trigger of reserve requirements.agreements.
As of December 31, 2021,2023, other than the items described above, we are not party to any other off-balance sheet arrangements, including guarantee contracts, retained or contingent interest, certain derivative instruments and variable interest entities, that either have, or are reasonably likely to have, a current or future material effect on our financial position.
Funding Needs and Sources
Historically,We have significant contractual obligations of which our debt service obligations and the capital expenditures associated with our ship purchases represent our largest funding needs. As of December 31, 2023, we had approximately $6.0 billion of committed financing for our ships on order. As of December 31, 2023, our obligations due through December 31, 2024 primarily consisted of $1.7 billion related to debt maturities, $1.2 billion related to interest on debt and $2.0 billion related to progress payments on our ship orders and, based on expected delivery date, the final installments payable due upon the delivery of Utopia of the Seas, and Silver Ray. We have historically relied on a combination of cash flows provided by operations, draw-downs under our available credit facilities, the incurrence of additional debt and/or the refinancing of our existing debt and the issuance of additional shares of equity securities to fund our obligations. The impact of COVID-19 resulted in our voluntary suspension of global cruise operations from March 2020 up to our gradual resumption of operations primarily in 2021. The suspension of operations strained our sources of cash flow and liquidity, causing us to take actions resulting in reductions in our operating expenses, reductions in our capital expenses and new financings and other liquidity actions.
The Company continues to identify and evaluate further actions to improve its liquidity. These include, and are not limited to further reductions in capital expenditures, operating expenses and administrative costs and additional financings. See further discussion on these liquidity actions at Recent Developments - COVID-19.
We have significant contractual obligations of which our debt service obligations and the capital expenditures associated with our ship purchases represent our largest funding needs. As of December 31, 2021, we had approximately $10.0 billion of committed financing for our ships on order.
As of December 31, 2021, we had $5.8 billion in contractual obligations due through December 31, 2022, of which approximately $2.2 billion relates to debt maturities, $0.9 billion relates to interest on debt and $2.3 billion relates to progress payments on our ship orders and the final installments payable due upon the delivery of Wonder of the Seas and Celebrity Beyond.
As of December 31, 2021,2023, we had liquidity of $3.5$3.1 billion, including $0.1cash and cash equivalents of $0.5 billion, and $2.6 billion of undrawn revolving credit facility capacity, $2.7 billion in cash and cash equivalents, and a $0.7 billion commitment for a 364-day term loan facility available to draw at any time prior to August 12, 2022. As of December 31, 2021, our revolving credit facilities were mostly utilized through a combination of amounts drawn and letters of credit issued under the facilities. We temporarily applied the net proceeds of the $1.0 billion January 2022 Unsecured Notes to repay borrowings under our revolving credit facilities, bringing our undrawn revolving credit facility capacity to $1.1 billion as of the date of the issuance of this report, from $0.1 billion as of December 31, 2021.
capacity. We have agreed with certain of our lenders not to pay dividends or engage in stock repurchases. Thereafter, in the eventrepurchases unless we declare a dividend or engage in stock repurchases we will need to repay the amountsremaining principal payments that were deferred under our export credit facilities.facilities in 2020 and 2021. Refer to Note 8. Debt and Note 10. Shareholders' Equity to our consolidated financial statements under Item 8. Financial Statements and Supplementary Data for further information.
If any person acquires ownership of more than 50% of our common stock or, subject to certain exceptions, during any 24-month period, a majority of our board of directors is no longer comprised of individuals who were members of our board of directors on the first day of such period, we may be obligated to prepay indebtedness outstanding under our credit facilities, which we may be unable to replace on similar terms. Our public debt securities also contain change of control provisions that would be triggered by a third-party acquisition of greater than 50% of our common stock coupled with a ratings downgrade. If this were to occur, it would have an adverse impact on our liquidity and operations.
Based on our assumptions and estimates and our financial condition, we believe that the liquidity resulting from the actions mentioned above will bewe have sufficient financial resources to fund our liquidity requirements overobligations for at least the next twelve months.months from the issuance of these financial statements. However, there is no assurance that our assumptions and estimates are accurate due to possible unknown variables related to this unprecedented suspension of our operations and, as such, there is inherent uncertainty in our ability to predict future liquidity requirements. Refer to Note 1. General, Management’s Plan and Liquidity, to our consolidated financial statements under Item 1. Financial Statements for further information.
Beyond the next 12 months, in June of 2023, approximately $3.2 billion of long-term debt will need to be refinanced in order to maintain the Company's liquidity position.
In February 2022, we entered into certain agreements with Morgan Stanley & Co., LLC (“MS”) where MS agrees to provide backstop committed financing to refinance, repurchase and/or repay in whole or in part our existing and outstanding 10.875% Senior Secured Notes due 2023, 9.125% Priority Guaranteed Notes due 2023, and 4.25% Convertible Notes due 2023. Pursuant to the agreements, we may, at our sole option, issue and sell to MS (subject to the satisfaction of certain conditions) five-year senior unsecured notes with gross proceeds of up to $3.15 billion at any time between April 1, 2023 and June 29, 2023, to refinance the aforementioned notes.
Debt Covenants
Both ourOur export credit facilities and our non-export credit facilities, and certain of our credit card processing agreements contain covenants that require us, among other things, to maintain a fixed charge coverage ratio, of at least 1.25x and limit our net debt-to-capital ratio, to no more than 62.5%,and maintain a minimum liquidity, and under certain facilities, to maintain a minimum level of shareholders' equity. The fixed charge coverage ratio is calculated by dividing net cash from operations for the past four quarters by the sum of dividend payments plus scheduled principal debt payments in excess of any new financings for the past four quarters. Our minimum net worthstockholders' equity and maximum net debt-to-capital calculations exclude the impact of Accumulated other comprehensive losson Total shareholders’ equity.
During 2020, we amended all of our export credit facilities, all of our non-export credit facilities and certain of our credit card processing agreements which contain financial covenants to extend the financial covenant waiver through and including the fourth quarter of 2021. During the first quarter of 2021, we amended $4.9 billion of our non-export credit facilities and $6.3 billion of our export credit facilities, and certain credit card processing agreements, to extend the waiver of our financial covenants through and including at least the third quarter of 2022, and subsequently in the third quarter of 2021, we entered into a letter agreement to extend the waiver period for our export credit facilities to the end of the fourth quarter of 2022. During the fourth quarter of 2021, we amended $7.3 billion of outstanding export-credit facilites plus committed export-credit facilities to
modify financial covenant levels for 2023 and 2024, following the waiver period through and including the fourth quarter of 2022.
In addition, pursuant to the amendments for the non-export credit facilities, we have modified the manner in which such covenants are calculated, temporarily in certain cases and permanently in others, as well as the levels at which our net debt to capitalization covenant will be tested during the period commencing immediately following the end of the waiver period and continuing through the end of 2023.
The amendments impose a monthly-tested minimum liquidity covenant of $350.0 million, which in the case of the non-export credit facilities terminates at the end of the waiver period and in the case of the export credit facilities terminates either in July 2025, or when we pay off all deferred amounts, whichever is earlier. In addition, the amendments to the non-export credit facilities place restrictions on paying cash dividends and effectuating share repurchases through the end of the third quarter of 2022, while the export credit facility amendments require us to prepay any deferred amounts if we elect to issue dividends or complete share repurchases. As of December 31, 2021,2023, we were in compliance with the applicable minimum liquidity covenantour financial covenants and we estimate that we will be in compliance for at least the next twelve months.
Any further covenant waivers may lead to increased costs, increased interest rates, additional restrictive covenants and other available lender protections as may be agreed with our lenders. There can be no assurance that we would be able to obtain additional waivers in a timely manner, or on acceptable terms. If we require additional waivers and are not able to obtain them or repay the debt facilities, this would lead to an event of default and potential acceleration of amounts due under all of our outstanding debt and derivative contracts.
Dividends
DuringThe declaration of dividends shall at all times be subject to the first quarter of 2020 we declared a cash dividend on our common stock of $0.78 per share which was paid in the second quarter of 2020.
During the second quarter of 2020, we agreed with certainfinal determination of our lenders not to pay dividends or engageboard of directors that a dividend is prudent at that time in common stock repurchases for so long as our debt covenant waivers are in effect.consideration of the needs of the business. In addition, in the event we declare a dividend or engage in share repurchases, we will need to repay the amounts deferred under our export credit facilities. Accordingly, we didhave not declaredeclared a dividend during the seventh consecutive quarters ending December 31, 2021. Pursuant to amendments made to these agreements duringsince the first quarter of 2021, the restrictions on paying cash dividends and effectuating share repurchases were extended through and including the third quarter of 2022.2020.
Item 7A. Quantitative and Qualitative Disclosures About Market Risk
Financial Instruments and Other
General
We are exposed to market risk attributable to changes in interest rates, foreign currency exchange rates and fuel prices. We try to mitigate these risks through a combination of our normal operating and financing activities and through the use of derivative financial instruments pursuant to our hedging practices and policies. The financial impact of these hedging instruments is primarily offset by corresponding changes in the underlying exposures being hedged. We achieve this by closely matching the amount, term and conditions of the derivative instrument with the underlying risk being hedged. Although certain of our derivative financial instruments do not qualify or are not accounted for under hedge accounting, our objective is not to hold or issue derivative financial instruments for trading or other speculative purposes. Refer to Note 16. Fair Value Measurements and Derivative Instruments to our consolidated financial statements under Item 8. Financial Statements and Supplementary Data.
Interest Rate Risk
Our exposure to market risk for changes in interest rates relates to our long-term debt obligations including future interest payments. At December 31, 2021,2023, approximately 65.7%83% of our long-term debt was effectively fixed as compared to 64.5%75.0% as of December 31, 2020.2022. We use interest rate swap agreements to modify our exposure to interest rate movements and to manage our interest expense.
Market risk associated with our long-term fixed rate debt is the potential increase in fair value resulting from a decrease in interest rates. We use interest rate swap agreements that effectively convert a portion of our fixed-rate debt to a floating-rate basis to manage this risk. At December 31, 2021, we maintained interest rate swap agreements on the following fixed-rate debt instruments:
| | | | | | | | | | | | | | | | | |
| Debt Instrument | Swap Notional as of December 31, 2021 (In thousands) | Maturity | Debt Fixed Rate | Swap Floating Rate: LIBOR plus | All-in Swap Floating Rate as of December 31, 2021 |
| Unsecured senior notes | 650,000 | | November 2022 | 5.25% | 3.63% | 3.79% |
| $ | 650,000 | | | | | |
These interest rate swap agreements are accounted for as fair value hedges.
The estimated fair value of our long-term fixed-rate debt at December 31, 20212023 was $13.7$15.9 billion, using quoted market prices, where available, or using the present value of expected future cash flows which incorporates risk profile. The fair value of our fixed to floating interest rate swap agreements was estimated to be an asset of $7.7 million as of December 31, 2021, based on the present value of expected future cash flows. A hypothetical one percentage point decrease in interest rates at December 31, 20212023 would increase the fair value of our hedged and unhedged long-term fixed-rate debt by approximately $105.3 million and would increase the fair value of our fixed to floating interest rate swap agreements by approximately $5.0 million.$2.1 billion.
Market risk associated with our long-term floating-rate debt is the potential increase in interest expense from an increase in interest rates. We use interest rate swap agreements that effectively convert a portion of our floating-rate debt to a fixed-rate basis to manage this risk. A hypothetical one percentage point increase in interest rates would increase our forecasted 20222024 interest expense by approximately $48.7$25.5 million, assuming no change in foreign currency exchange rates.
At December 31, 2021,2023, we maintained interest rate swap agreements on the following floating-rate debt instruments: | | | | | | | | | | | | | | | | | |
| Debt Instrument | Swap Notional as of December 31, 2021 (In thousands) | Maturity | Debt Floating Rate | All-in Swap Fixed Rate |
Celebrity Reflection term loan | $ | 163,625 | | October 2024 | LIBOR plus | 0.40% | 2.85% |
Quantum of the Seas term loan | 306,250 | | October 2026 | LIBOR plus | 1.30% | 3.74% |
Anthem of the Seas term loan | 332,292 | | April 2027 | LIBOR plus | 1.30% | 3.86% |
Ovation of the Seas term loan | 449,583 | | April 2028 | LIBOR plus | 1.00% | 3.16% |
Harmony of the Seas term loan (1) | 427,142 | | May 2028 | EURIBOR plus | 1.15% | 2.26% |
Odyssey of the Seas term loan(2) | 421,667 | | October 2032 | LIBOR plus | 0.96% | 3.21% |
Odyssey of the Seas term loan (2) | 191,667 | | October 2032 | LIBOR plus | 0.96% | 2.84% |
| $ | 2,292,226 | | | | | |
| | | | | | | | | | | | | | | | | |
| Debt Instrument | Swap Notional as of December 31, 2023 (In millions) | Maturity | Debt Floating Rate (3) | All-in Fixed Rate |
Celebrity Reflection term loan | $ | 55 | | October 2024 | Term SOFR | 0.40% | 2.88% |
Quantum of the Seas term loan | 184 | | October 2026 | Term SOFR | 1.30% | 3.78% |
Anthem of the Seas term loan | 211 | | April 2027 | Term SOFR | 1.30% | 3.9% |
Ovation of the Seas term loan | 311 | | April 2028 | Term SOFR | 1.00% | 3.2% |
Harmony of the Seas term loan (1) | 287 | | May 2028 | EURIBOR plus | 1.15% | 2.26% |
Odyssey of the Seas term loan(2) | 345 | | October 2032 | Term SOFR | 0.96% | 3.28% |
Odyssey of the Seas term loan (2) | 173 | | October 2032 | Term SOFR | 0.96% | 2.91% |
| $ | 1,566 | | | | | |
(1) Interest rate swap agreements hedging the Euro-denominated term loan for Harmony of the Seas include EURIBOR zero-floors matching the hedged debt EURIBOR zero-floor. Amount presented is based on the exchange rate as of December 31, 2021.2023.
(2) Interest rate swap agreements hedging the term loan of Odyssey of the Seas include Term SOFR zero-floors, Term SOFR with no floors, and Overnight SOFR.
(3) During the year ended December 31, 2023, we completed our transition from LIBOR zero-floors matching the debt LIBOR zero-floor. The effective datesto Term SOFR rates for substantially all of the $421.7 million and $191.7 million interestour Interest rate swap agreements are October 2020 and October 2022, respectively. The unsecured term loan for the financing of Odyssey of the Seas was drawn on March 2021.agreements.
These interest rate swap agreements are accounted for as cash flow hedges.
The fair value of our floating to fixed interest rate swap agreements was estimated to be a liabilityan asset of $70.7$87 million as of December 31, 20212023 based on the present value of expected future cash flows. These interest rate swap agreements are accounted for as cash flow hedges.
Foreign Currency Exchange Rate Risk
Our primary exposure to foreign currency exchange rate risk relates to our ship construction contracts denominated in Euros, our foreign currency denominated debt and our international business operations. On a regular basis, we enter into foreign currency forward contracts and, from time to time, we utilize cross-currency swap agreements and collar options to manage portions of the exposure to movements in foreign currency exchange rates.
The estimated fair value, as of December 31, 2021,2023, of our Euro-denominated forward contracts associated with our ship construction contracts was a liabilityan asset of $122.5$51 million, based on the present value of expected future cash flows. As of December 31, 2021,2023, the aggregate cost of our ships on order, not including ships on order by our Partner Brands, was approximately $12.4$7.9 billion, of which we had deposited $800.2$698 million as of such date. Approximately 59.0%43.5% and 52.3% of the aggregate cost of the ships under construction was exposed to fluctuations in the Euro exchange rate at December 31, 20212023 and 2020,2022, respectively. A hypothetical 10% strengthening of the Euro as of December 31, 2021,2023, assuming no changes in comparative interest rates, would result in a $730.4$346 million increase in the United States dollar cost of the foreign currency denominated ship construction contracts exposed to fluctuations in the Euro exchange rate. Our foreign currency forward contract agreements are accounted for as cash flow or net investment hedges depending on the designation of the related hedge.
Our international business operations subject us to foreign currency exchange risk. We transact business in many different foreign currencies and maintain investments in foreign operations which may expose us to financial market risk resulting from fluctuations in foreign currency exchange rates. Movements in foreign currency exchange rates may affect the value of our earnings in foreign currencies and cash flows. We manage most of this exposure on a consolidated basis, which allows us to take advantage of any natural offsets. Therefore, weakness in one particular currency might be offset by strengths in other currencies over time. The extent to which one currency is effective as a natural offset of another currency fluctuates over time. In addition, some foreign currency exposures have little to no mitigating natural offsets available.
We consider our investments in our foreign operations to be denominated in relatively stable currencies and of a long-term nature. As of December 31, 2021, we maintained a foreign currency forward contract and designated it as a hedge of a portion of our net investment in TUI Cruises of €245.0 million, or approximately $278.6 million based on the exchange rate at December 31, 2021. This forward currency contract matures in April 2022.
We also address the exposure of our investments in foreign operations by denominating a portion of our debt in our subsidiaries' and investments' functional currencies and designating it as a hedge of these subsidiaries and investments. We had designated debt as a hedge of our net investments primarily in TUI Cruises of approximately €97.0€648 million, or approximately $110.3$716 million, through December 31, 2021.2023. As of December 31, 2020,2022, we had designated debt as a hedge of our net investments primarily in TUI Cruises of approximately €215.0€433.0 million, or approximately $263.0$462 million.
We have included net gains of approximately $47.7$41 million and $22.1$64 million of foreign-currency transaction remeasurement and changes in the fair value of derivatives in the foreign currency translation adjustment component of Accumulated other comprehensive loss at December 31, 20212023 and 2020,2022, respectively.
On a regular basis, we enter into foreign currency forward contracts and, from time to time, we utilize cross-currency swap agreements and collar options to minimize the volatility resulting from the remeasurement of net monetary assets and liabilities denominated in a currency other than our functional currency or the functional currencies of our foreign subsidiaries. During 2021,2023, we maintained an average of approximately $483.2 million$1.3 billion of these foreign currency forward contracts. These instruments are not designated as hedging instruments. For the years ended December 31, 2021, 20202023, 2022 and 20192021 changes in the fair value of the foreign currency forward contracts resulted in gainsgain (losses) of approximately $(30.9)$19 million, $(19.0)$(102) million and $1.4$(31) million, respectively, which offset gains (losses) arising from the remeasurement of monetary assets and liabilities denominated in foreign currencies in those same years of $24.3$(43) million, $(1.5)$93 million and $0.4$24 million, respectively. These changes were recognized in earnings within Other (expense) income (expense) in our consolidated statements of comprehensive income (loss).
Fuel Price Risk
Our exposure to market risk for changes in fuel prices relates primarily to the consumption of fuel on our ships. Fuel cost, net of the financial impact of fuel swap agreements, as a percentage of our total revenues, was approximately 8.3% in 2023, 12.1% in 2022 and 25.1% in 2021, 16.8% in 2020 and 6.4% in 2019.2021. We use fuel swap agreements to mitigate the financial impact of fluctuations in fuel prices.
As of December 31, 2021,2023, we had fuel swap agreements to pay fixed prices for fuel with an aggregate notional amount of approximately $527.3$899 million, maturing through 2023.2026. These fuel swap agreements are generally accounted for as cash flow hedges. The fuel swap agreements designated as hedges of projected fuel purchases represented 54%61% of our projected 20222024 fuel requirements and 15% of our projected 2023 fuel
requirements. The prior suspension of our cruise operations due to the COVID-19 pandemic and our gradual resumption of cruise operations has resulted in reductions to our forecasted fuel purchases. As of December 31, 2021, the Company had outstanding fuel swaps of 231,900 metric tons, maturing in 2022, that do not hedge forecasted fuel consumption. Of these swaps, 115,950 metric tons relate to fuel swap agreements with discontinued hedge accounting, in which we effectively pay fixed prices for our fuel purchases and receive floating prices from the counterparty. The remaining 115,950 tons relate to fuel swap agreements that were not designated as hedges since inception, in which we effectively pay floating prices for our fuel purchases and receive fixed prices from the counterparty. The estimated fair value of our fuel swap agreements at December 31, 20212023 was estimated to be an asseta liability of $40.3$48 million. We estimate that a hypothetical 10% increase in our weighted-average fuel price from that experienced during the year ended December 31, 20212023 would increase our forecasted 20222024 fuel cost by approximately $50.0$58 million, net of the impact of fuel swap agreements.
Item 8. Financial Statements and Supplementary Data
Our Consolidated Financial Statements are included beginning on page F-1 of this report.
Item 9. Changes In and Disagreements With Accountants on Accounting and Financial Disclosure
None.
Item 9A. Controls and Procedures
Evaluation of Disclosure Controls and Procedures
Our management, with the participation of our President and Chief Executive Officer and Chief Financial Officer, conducted an evaluation of the effectiveness of our disclosure controls and procedures, as such term is defined in Exchange Act Rule 13a-15(e), as of the end of the period covered by this report.Annual Report on Form 10-K. Based upon such evaluation, our President and Chief Executive Officer and Chief Financial Officer concluded that those controls and procedures are effective to provide reasonable assurance that information required to be disclosed by us in the reports that we file or submit under the Exchange Act is accumulated and communicated to management, including our President and Chief Executive Officer and our Chief Financial Officer, as appropriate, to allow timely decisions regarding required disclosure and are effective to provide reasonable assurance that such information is recorded, processed, summarized and reported within the time periods specified by the rules and forms of the Securities and Exchange Commission's (the "SEC") rules and forms..
Management's Report on Internal Control Over Financial Reporting
Our management is responsible for establishing and maintaining adequate internal control over financial reporting, as such term is defined in Exchange Act Rule 13a-15(f). Our management, with the participation of our President and Chief Executive Officer and our Chief Financial Officer, conducted an evaluation of the effectiveness of our internal control over financial reporting based on the Internal Control-Integrated Framework (2013) issued by the Committee of Sponsoring Organizations of the Treadway Commission. Based on this evaluation, management concluded that our internal control over financial reporting was effective as of December 31, 2021.2023.
The effectiveness of our internal control over financial reporting as of December 31, 20212023 has been audited by PricewaterhouseCoopers LLP, the independent registered public accounting firm that audited our consolidated financial statements included in this Annual Report on Form 10-K, as stated in its report, which is included herein on page F-2.
Changes in Internal Control Over Financial Reporting
There were no changes in our internal control over financial reporting identified in connection with the evaluation required by Exchange Act Rule 13a-15(d) during the quarter ended December 31, 20212023 that have materially affected, or are reasonably likely to materially affect, our internal control over financial reporting.
Inherent Limitations on Effectiveness of Controls
It should be noted that any system of controls, however well designed and operated, can provide only reasonable, and not absolute, assurance that the objectives of the system will be met. In addition, the design of any control system is based in part upon certain assumptions about the likelihood of future events. Because of these and other inherent limitations of control systems, there is only reasonable assurance that our controls will succeed in achieving their goals under all potential future conditions.
Item 9B. Other Information
None.During the quarter ended December 31, 2023, none of our directors or executive officers adopted or terminated any contract, instruction or written plan for the purchase or sale of our securities that was intended to satisfy the affirmative defense conditions of Rule 10b5-1(c) or any “non-Rule 10b5-1 trading arrangement” (as such term is defined in Item 408 of Regulation S-K).
Item 9C. Disclosure Regarding Foreign Jurisdictions that Prevent Inspections
Not applicable.
PART III
Items 10, 11, 12, 13 and 14. Directors, Executive Officers and Corporate Governance; Executive Compensation; Security Ownership of Certain Beneficial Owners and Management and Related Stockholder Matters; Certain Relationships and Related Transactions;Transactions, and Director IndependenceIndependence; and Principal Accountant Fees and Services.
Except for information concerning executive officers (called for by Item 401(b) of Regulation S-K), which is included in Part I of this Annual Report on Form 10-K, the information required by Items 10, 11, 12, 13 and 14 is incorporated herein by reference to certain sections of the Royal Caribbean Cruises Ltd. Definitive Proxy Statement relating to our 20222024 Annual Meeting of Shareholders (the "Proxy Statement") to be filed with the Securities and Exchange Commission no later than 120 days after the close of the fiscal year. Please refer to the following sections in the Proxy Statement for more information: "Corporate Governance"; "Proposal 1—Election of Directors"; "Certain Relationships and Related Person Transactions"; "Delinquent Section 16(a) Reports"; "Executive Compensation"; "Security Ownership of Certain Beneficial Owners and Management"; and "Proposal 3—Ratification of Principal Independent Registered Public Accounting Firm." Copies of the Proxy Statement will become available when filed through our Investor Relations website at www.rclcorporate.com (please see "Financial Reports" under "Financial Information"); by contacting our Investor Relations department at 1050 Caribbean Way, Miami, Florida 33132—telephone (305) 982-2625; or by visiting the SEC's website at www.sec.gov.
We have adopted a Code of Business Conduct and Ethics that applies to all of our employees, including our executive officers, and our directors. A copy of the Code of Business Conduct and Ethics is posted in the corporate governance section of our website at www.rclcorporate.com and is available in print, without charge, to shareholders upon written request to our Corporate Secretary at Royal Caribbean Cruises, Ltd., 1050 Caribbean Way, Miami, Florida 33132. Any amendments to the code or any waivers from any provisions of the code granted to executive officers or directors will be promptly disclosed to investors by posting on our website at www.rclcorporate.com. None of the websites referenced in this Annual Report on Form 10-K or the information contained therein is incorporated herein by reference.
PART IV
Item 15. Exhibits and Financial Statement Schedules
(a)(1) Financial Statements
Our Consolidated Financial Statements have been prepared in accordance with Item 8. Financial Statements and Supplementary Data and are included beginning on page F-1 of this report.
(1)Financial Statement Schedules
None.
(1)Exhibits
| | | | | | | | | | | | | | | | | | | | | | | | | | |
| | | | Incorporated By Reference |
| Exhibit Number | | | | Form | | Exhibit | | Filing Date/ Period End Date |
| 3.1 | | | | S-3 | | 3.1 | | 3/23/2009 |
| 3.2 | | | | 8-K | | 3.1 | | 2/11/2022 |
| 4.1 | | Indenture dated as of July 15, 1994, by and between the Company, as issuer, and The Bank of New York Trust Company, N.A., successor to NationsBank of Georgia, National Association, as Trustee | | 20-F | | 2.4 | | 12/31/1994 |
| 4.2 | | Sixth Supplemental Indenture dated as of October 14, 1997, to the Indenture, dated as of July 15, 1994, by and between the Company, as issuer, and The Bank of New York Trust Company, N.A., as Trustee | | 20-F | | 2.11 | | 12/31/1997 |
| 4.3 | | Eighth Supplemental Indenture dated as of March 16, 1998, to the Indenture, dated as of July 15, 1994, by and between the Company, as issuer, and The Bank of New York Trust Company, N.A., as Trustee | | 20-F | | 2.13 | | 12/31/1997 |
| 4.4 | | | | S-3 | | 4.1 | | 7/31/2006 |
| 4.5 | | | | 8-K | | 4.1 | | 11/7/2012 |
| 4.6 | | | | 8-K | | 4.1 | | 11/28/2017 |
| 4.7 | | | | 10-K | | 4.10 | | 12/31/2020 |
| 4.8 | | Indenture, dated May 19, 2020, among the Company, the guarantors named therein, and The Bank of New York Mellon Trust Company, N.A., as trustee, principal paying agent, transfer agent, registrar and security agent. | | 8-K | | 4.1 | | 5/19/2020 |
| 4.9 | | Indenture, dated June 9, 2020, among the Company, RCI Holdings LLC, a limited liability company formed and existing under the laws of Liberia and a direct wholly-owned subsidiary of the Company and The Bank of New York Mellon Trust Company, N.A., as trustee, principal paying agent, transfer agent, registrar and security agent. | | 8-K | | 4.1 | | 6/9/2020 |
| 4.10 | | | | 8-K | | 4.2 | | 6/9/2020 |
| 4.11 | | | | 8-K | | 4.1 | | 10/16/2020 |
| 4.12 | | | | 8-K | | 4.1 | | 3/30/2021 |
| | | | | | | | | | | | | | | | | | | | | | | | | | |
| | | | Incorporated By Reference |
| Exhibit Number | | | | Form | | Exhibit | | Filing Date/ Period End Date |
| 3.1 | | | | S-3 | | 3.1 | | 3/23/2009 |
| 3.2 | | | | 8-K | | 3.1 | | 2/11/2022 |
| 4.1 | | | | | | | | |
| 4.2 | | | | | | | | |
| 10.1 | | Amended and Restated Registration Rights Agreement dated as of July 30, 1997, by and among the Company, A. Wilhelmsen AS., Cruise Associates, Monument Capital Corporation, Archinav Holdings, Ltd. and Overseas Cruiseship, Inc. | | 20-F | | 2.20 | | 12/31/1997 |
| 10.2 | | Hull No. B34 Credit Agreement, dated as of January 30, 2015, as novated, amended and restated on the Actual Delivery Date pursuant to a novation agreement dated January 30, 2015 (as amended),between Royal Caribbean Cruises Ltd., Citibank N.A., London Branch, Citibank Europe plc, UK Branch, and the banks and financial institutions as lender parties thereto | | 10-Q | | 10.1 | | 3/31/2018 |
| 10.3 | | | | 8-K | | 10.1 | | 11/19/2015 |
| 10.4 | | | | 10-Q | | 10.7 | | 6/30/2018 |
| 10.5 | | | | 10-Q | | 10.8 | | 6/30/2018 |
| 10.6 | | | | 8-K | | 10.2 | | 11/19/2015 |
| 10.7 | | | | 10-Q | | 10.9 | | 6/30/2018 |
| 10.8 | | | | 10-Q | | 10.10 | | 6/30/2018 |
| | | | | | | | | | | | | | | | | | | | | | | | | | |
| | | | Incorporated By Reference |
| Exhibit Number | | | | Form | | Exhibit | | Filing Date/ Period End Date |
| 10.9 | | Novation Agreement, dated as of June 22, 2016, by and between Azairemia Finance Ltd., Royal Caribbean Cruises Ltd., Citibank Europe Plc, UK Branch, Citicorp Trustee Company Limited, Citibank N.A., London Branch, HSBC France, Sumitomo Mitsui Banking Corporation Europe Limited, Paris Branch and the banks and financial institutions as lender parties thereto | | 8-K | | 10.2 | | 6/28/2016 |
| 10.10 | | First Supplemental Agreement, dated as of October 5, 2018, relating to Hull No. K34 and the Novation Agreement, dated as of June 22, 2016, by and between Azairemia Finance Ltd., Royal Caribbean Cruises Ltd., Citibank Europe Plc, UK Branch, Citicorp Trustee Company Limited, Citibank N.A., London Branch, HSBC France, Sumitomo Mitsui Banking Corporation Europe Limited, Paris Branch, and the banks and financial institutions as lender parties thereto | | 10-K | | 10.20 | | 12/31/2018 |
| 10.11 | | Novation Agreement, dated as of July 24, 2017, between Hibisyeu Finance Ltd., Royal Caribbean Cruises Ltd., Citibank Europe Plc, UK Branch, Citicorp Trustee Company Limited, Citibank N.A., London Branch, HSBC France, Sumitomo Mitsui Banking Corporation Europe Limited, Paris Branch and the banks and financial institutions as lender parties thereto | | 8-K | | 10.1 | | 7/28/2017 |
| 10.12 | | Novation Agreement, dated as of July 24, 2017, between Hoediscus Finance Ltd., Royal Caribbean Cruises Ltd., Citibank Europe Plc, UK Branch, Citicorp Trustee Company Limited, Citibank N.A., London Branch, HSBC France, Sumitomo Mitsui Banking Corporation Europe Limited, Paris Branch and the banks and financial institutions as lender parties thereto | | 8-K | | 10.2 | | 7/28/2017 |
| 10.13 | | Novation Agreement, dated as of July 24, 2017, between Houatorris Finance Ltd., Royal Caribbean Cruises Ltd., Citibank Europe Plc, UK Branch, Citicorp Trustee Company Limited, Citibank N.A., London Branch, HSBC France, Sumitomo Mitsui Banking Corporation Europe Limited, Paris Branch and the banks and financial institutions as lender parties thereto | | 8-K | | 10.3 | | 7/28/2017 |
| 10.14 | | Novation Agreement, dated as of December 13, 2019, between Palmeraie Finance Limited, Royal Caribbean Cruises Ltd., Citibank Europe Plc, UK Branch, Citicorp Trustee Company Limited, Citibank N.A., London Branch HSBC France, Banco Santander S.A., Banco Bilbao Vizcaya Argentaria S.A., Paris Branch, BNP Paribas SA, Sumitomo Mitsui Banking Corporation Europe Limited, Paris Branch, Société Générale, Unicredit Bank AG and the banks and financial institutions as lender parties thereto | | 8-K | | 10.1 | | 12/18/2019 |
| 10.15 | | | | 8-K | | 10.1 | | 10/17/2017 |
| 10.16 | | | | 8-K | | 10.2 | | 10/17/2017 |
| 10.17 | | | | 10-Q | | 10.11 | | 6/30/2018 |
| | | | | | | | | | | | | | | | | | | | | | | | | | |
| | | | Incorporated By Reference |
| Exhibit Number | | | | Form | | Exhibit | | Filing Date/ Period End Date |
| 10.18 | | | | 10-Q | | 10.12 | | 6/30/2018 |
| 10.19 | | Icon 3 Hull No. 1402 Credit Agreement, dated as of December 18, 2019, between Royal Caribbean Cruises Ltd., as the Borrower, KfW IPEX-Bank GmbH, as Facility Agent CIRR Agent, Documentation Agent, Hermes Agent, Initial Mandated Lead Arranger and Sole Bookrunner, and the Lenders and Residual Risk Guarantors from time to time party thereto | | 8-K | | 10.1 | | 12/20/2019 |
| 10.20 | | | | 8-K | | 10.1 | | 3/23/2020 |
| 10.21 | | | | 8-K | | 10.2 | | 4/10/2020 |
| 10.22 | | Second Supplemental Agreement to a Credit Agreement in respect of the financing of acquisition of m.v. Celebrity Apex (ex hull no. K34), dated as of April 29, 2020, between Royal Caribbean Cruises Ltd., Citibank N.A., London Bank, as global coordinator, Sumitomo Mitsui Banking Corporation Europe Limited, Paris Branch as ECA agent, Citibank Europe PLC, UK Branch as facility agent, the mandated lead arrangers and the other lenders party thereto | | 8-K | | 10.2 | | 5/4/2020 |
| 10.23 | | | | 8-K | | 10.3 | | 5/4/2020 |
| 10.24 | | First Supplemental Agreement relating to Hull No. L34 at Chantiers de l’Atlantique (previously known as STX France S.A.), dated as of March 12, 2020, by and among Houatorris Finance Limited, Chantiers de L’Atlantique, the Company, Citibank Europe PLC, UK Branch as facility agent, Citicorp Trustee Company Limited as security trustee, Citibank N.A., London branch, HSBC France, Sumitomo Mitsui Banking Corporation Europe Limited, Paris Branch and the banks and financial institutions party thereto | | 10-Q | | 10.4 | | 5/21/2020 |
| 10.25 | | First Supplemental Agreement relating to Hull No. M34 at Chantiers de l’Atlantique (previously known as STX France S.A.), dated as of March 12, 2020, by and among Hoediscus Finance Limited, Chantiers de L’Atlantique as seller, the Company as buyer, Citibank Europe PLC, UK Branch as facility agent, Citicorp Trustee Company Limited as security trustee, Citibank N.A., London branch as global coordinator, HSBC France as French coordinating bank, Sumitomo Mitsui Banking Corporation Europe Limited, Paris Branch as ECA agent and the banks and financial institutions listed thereto | | 10-Q | | 10.5 | | 5/21/2020 |
| | | | | | | | | | | | | | | | | | | | | | | | | | |
| | | | Incorporated By Reference |
| Exhibit Number | | | | Form | | Exhibit | | Filing Date/ Period End Date |
| 4.13 | | | | 8-K | | 4.1 | | 6/24/2021 |
| 4.14 | | | | 8-K | | 4.1 | | 8/19/2021 |
| 4.15 | | | | 8-K | | 4.1 | | 1/7/2022 |
| 10.1 | | Amended and Restated Registration Rights Agreement dated as of July 30, 1997, by and among the Company, A. Wilhelmsen AS., Cruise Associates, Monument Capital Corporation, Archinav Holdings, Ltd. and Overseas Cruiseship, Inc. | | 20-F | | 2.20 | | 12/31/1997 |
| 10.2 | | | | 8-K | | 10.1 | | 12/7/2017 |
| 10.3 | | | | 8-K | | 10.1 | | 4/10/2019 |
| 10.4 | | | | 10-K | | 10.7 | | 12/31/2015 |
| 10.5 | | | | 10-Q | | 10.4 | | 6/30/2018 |
| 10.6 | | | | 10-K | | 10.8 | | 12/31/2015 |
| 10.7 | | | | 10-Q | | 10.5 | | 6/30/2018 |
| 10.8 | | | | 10-Q | | 10.1 | | 3/31/2016 |
| 10.9 | | | | 10-Q | | 10.6 | | 6/30/2018 |
| 10.10 | | Amendment and Restatement Agreement, dated as of January 15, 2016, in respect of a Facility Agreement dated, as of July 9, 2013, by and between the Company, the Lenders from time to time party thereto, Société Générale, as Facility Agent and Mandated Lead Arranger, BNP Paribas, as Documentation Bank and Mandated Lead Arranger, and HSBC France, as Mandated Lead Arranger | | 10-K | | 10.10 | | 12/31/2015 |
| | | | | | | | | | | | | | | | | | | | | | | | | | |
| | | | Incorporated By Reference |
| Exhibit Number | | | | Form | | Exhibit | | Filing Date/ Period End Date |
| 10.26 | | First Supplemental Agreement relating to Hull No. C34 at Chantiers de l’Atlantique (previously known as STX France S.A.), dated as of March 12, 2020, by and among Hibisyeu Finance Limited as borrower, Chantiers de L’Atlantique as seller, the Company as buyer, Citibank Europe PLC, UK Branch as facility agent, Citicorp Trustee Company Limited as security trustee, Citibank N.A., London branch as global coordinator, HSBC France as French coordinating bank, Sumitomo Mitsui Banking Corporation Europe Limited, Paris Branch as ECA agent and the banks and financial institutions listed thereto | | 10-Q | | 10.6 | | 5/21/2020 |
| 10.27 | | | | 8-K | | 10.6 | | 8/3/2020 |
| 10.28 | | | | 8-K | | 10.7 | | 8/3/2020 |
| 10.29 | | | | 10-Q | | 10.15 | | 8/10/2020 |
| 10.30 | | | | 10-Q | | 10.16 | | 8/10/2020 |
| 10.31 | | Supplemental Agreement in relation to certain amendments in connection with the Silversea negative covenants and the exercise of the Buyer's Stretch Option in respect of Edge 3 (ex. hull no. L34), dated August 29, 2020, among the Company, Hoediscus Finance Limited, Citibank Europe Plc, UK Branch, Citibank N.A., London Branch, Citicorp Trustee Company Limited, HSBC France and Sumitomo Mitsui Banking Corporation Europe Limited, Paris Branch | | 10-Q | | 10.10 | | 11/4/2020 |
| 10.32 | | Supplemental Agreement in relation to certain amendments in connection with the Silversea negative covenants and the exercise of the Buyer's Stretch Option in respect of Edge 4 (ex. hull no. M34), dated August 29, 2020, by and among the Company, Hoediscus Finance Limited, Citibank Europe Plc, UK Branch, Citibank N.A., London Branch, Citicorp Trustee Company Limited, HSBC France and Sumitomo Mitsui Banking Corporation Europe Limited, Paris Branch | | 10-Q | | 10.11 | | 11/4/2020 |
| 10.33 | | | | 10-Q | | 10.12 | | 11/4/2020 |
| 10.34 | | | | 10-Q | | 10.13 | | 11/4/2020 |
| | | | | | | | | | | | | | | | | | | | | | | | | | |
| | | | Incorporated By Reference |
| Exhibit Number | | | | Form | | Exhibit | | Filing Date/ Period End Date |
| 10.11 | | Amendment and Restatement Agreement, dated as of August 15, 2019, in respect of a Facility Agreement dated, as of July 9, 2013, by and between the Company, the Lenders from time to time party thereto, Société Générale, as Facility Agent and Mandated Lead Arranger, BNP Paribas, as Documentation Bank and Mandated Lead Arranger, and HSBC France, as Mandated Lead Arranger | | 10-Q | | 10.1 | | 10/30/2019 |
| 10.12 | | Hull No. B34 Credit Agreement, dated as of January 30, 2015, as novated, amended and restated on the Actual Delivery Date pursuant to a novation agreement dated January 30, 2015 (as amended),between Royal Caribbean Cruises Ltd., Citibank N.A., London Branch, Citibank Europe plc, UK Branch, and the banks and financial institutions as lender parties thereto | | 10-Q | | 10.1 | | 3/31/2018 |
| 10.13 | | | | 8-K | | 10.1 | | 11/19/2015 |
| 10.14 | | | | 10-Q | | 10.7 | | 6/30/2018 |
| 10.15 | | | | 10-Q | | 10.8 | | 6/30/2018 |
| 10.16 | | | | 8-K | | 10.2 | | 11/19/2015 |
| 10.17 | | | | 10-Q | | 10.9 | | 6/30/2018 |
| 10.18 | | | | 10-Q | | 10.10 | | 6/30/2018 |
| 10.19 | | Hull No. J34 Credit Agreement, dated as of June 22, 2016, as novated, amended and restated on the Actual Delivery Date pursuant to a novation agreement dated June 22, 2016 (as amended), between Royal Caribbean Cruises Ltd., Citibank N.A., London Branch, Citibank Europe plc, UK Branch, and the banks and financial institutions as lender parties thereto | | 10-K | | 10.18 | | 12/31/2018 |
| 10.20 | | Novation Agreement, dated as of June 22, 2016, by and between Azairemia Finance Ltd., Royal Caribbean Cruises Ltd., Citibank Europe Plc, UK Branch, Citicorp Trustee Company Limited, Citibank N.A., London Branch, HSBC France, Sumitomo Mitsui Banking Corporation Europe Limited, Paris Branch and the banks and financial institutions as lender parties thereto | | 8-K | | 10.2 | | 6/28/2016 |
| 10.21 | | First Supplemental Agreement, dated as of October 5, 2018, relating to Hull No. K34 and the Novation Agreement, dated as of June 22, 2016, by and between Azairemia Finance Ltd., Royal Caribbean Cruises Ltd., Citibank Europe Plc, UK Branch, Citicorp Trustee Company Limited, Citibank N.A., London Branch, HSBC France, Sumitomo Mitsui Banking Corporation Europe Limited, Paris Branch, and the banks and financial institutions as lender parties thereto | | 10-K | | 10.20 | | 12/31/2018 |
| 10.22 | | Novation Agreement, dated as of July 24, 2017, between Hibisyeu Finance Ltd., Royal Caribbean Cruises Ltd., Citibank Europe Plc, UK Branch, Citicorp Trustee Company Limited, Citibank N.A., London Branch, HSBC France, Sumitomo Mitsui Banking Corporation Europe Limited, Paris Branch and the banks and financial institutions as lender parties thereto | | 8-K | | 10.1 | | 7/28/2017 |
| | | | | | | | | | | | | | | | | | | | | | | | | | |
| | | | Incorporated By Reference |
| Exhibit Number | | | | Form | | Exhibit | | Filing Date/ Period End Date |
| 10.35 | | | | 10-K | | 10.69 | | 12/31/2020 |
| 10.36 | | | | 10-K | | 10.72 | | 12/31/2020 |
| 10.37 | | Supplemental Agreement relating to a secured credit facility agreement for Hull No. L34 at Chantiers l’Atlantique S.A., dated November 13, 2020, between Hoediscus Finance Limited, Royal Caribbean Cruises Ltd., Citibank Europe PLC, UK Branch, Citicorp Trustee Company Limited, Citibank N.A., London Branch, HSBC France, SMBC Bank International PLC, the mandated lead arrangers and the banks and financial institutions party thereto | | 10-K | | 10.73 | | 12/31/2020 |
| 10.38 | | Supplemental Agreement relating to a secured credit facility for hull no. M34, dated November 13, 2020, between Houatorris Finance Limited, Royal Caribbean Cruises Ltd., Citibank Europe PLC, UK Branch, Citicorp Trustee Company Limited, Citibank N.A., London Branch, HSBC France, SMBC Bank International PLC, the mandated lead arrangers and the banks and financial institutions party thereto | | 10-K | | 10.74 | | 12/31/2020 |
| 10.39 | | Supplemental Agreement relating to Hull No. C34 at Chantiers de l’Atlantique, dated November 13, 2020, between Hibisyeu Finance Limited, Royal Caribbean Cruises Ltd., Citibank Europe PLC, UK Branch, Citicorp Trustee Company Limited, Citibank N.A., London Branch, HSBC France, SMBC Bank International PLC, the banks and financial institutions party thereto and the mandated lead arrangers | | 10-K | | 10.75 | | 12/31/2020 |
| 10.40 | | Supplemental Agreement relating to Hull No. A35 at Chantiers de l’Atlantique, dated November 13, 2020, between Palmeraie Finance Limited, Royal Caribbean Cruises Ltd., Citibank Europe PLC, UK Branch, Citicorp Trustee Company Limited, Citibank N.A., London Branch, HSBC France, the mandated lead arrangers and the banks and financial institutions party thereo | | 10-K | | 10.76 | | 12/31/2020 |
| 10.41 | | | | 10-K | | 10.80 | | 12/31/2020 |
| 10.42 | | | | 10-K | | 10.83 | | 12/31/2020 |
| 10.43 | | | | 8-K | | 10.4 | | 2/18/2021 |
| | | | | | | | | | | | | | | | | | | | | | | | | | |
| | | | Incorporated By Reference |
| Exhibit Number | | | | Form | | Exhibit | | Filing Date/ Period End Date |
| 10.23 | | Novation Agreement, dated as of July 24, 2017, between Hoediscus Finance Ltd., Royal Caribbean Cruises Ltd., Citibank Europe Plc, UK Branch, Citicorp Trustee Company Limited, Citibank N.A., London Branch, HSBC France, Sumitomo Mitsui Banking Corporation Europe Limited, Paris Branch and the banks and financial institutions as lender parties thereto | | 8-K | | 10.2 | | 7/28/2017 |
| 10.24 | | Novation Agreement, dated as of July 24, 2017, between Houatorris Finance Ltd., Royal Caribbean Cruises Ltd., Citibank Europe Plc, UK Branch, Citicorp Trustee Company Limited, Citibank N.A., London Branch, HSBC France, Sumitomo Mitsui Banking Corporation Europe Limited, Paris Branch and the banks and financial institutions as lender parties thereto | | 8-K | | 10.3 | | 7/28/2017 |
| 10.25 | | Novation Agreement, dated as of December 13, 2019, between Palmeraie Finance Limited, Royal Caribbean Cruises Ltd., Citibank Europe Plc, UK Branch, Citicorp Trustee Company Limited, Citibank N.A., London Branch HSBC France, Banco Santander S.A., Banco Bilbao Vizcaya Argentaria S.A., Paris Branch, BNP Paribas SA, Sumitomo Mitsui Banking Corporation Europe Limited, Paris Branch, Société Générale, Unicredit Bank AG and the banks and financial institutions as lender parties thereto | | 8-K | | 10.1 | | 12/18/2019 |
| 10.26 | | | | 8-K | | 10.1 | | 10/17/2017 |
| 10.27 | | | | 10-Q | | 10.11 | | 6/30/2018 |
| 10.28 | | | | 8-K | | 10.2 | | 10/17/2017 |
| 10.29 | | | | 10-Q | | 10.12 | | 6/30/2018 |
| 10.30 | | Icon 3 Hull No. 1402 Credit Agreement, dated as of December 18, 2019, between Royal Caribbean Cruises Ltd., as the Borrower, KfW IPEX-Bank GmbH, as Facility Agent CIRR Agent, Documentation Agent, Hermes Agent, Initial Mandated Lead Arranger and Sole Bookrunner, and the Lenders and Residual Risk Guarantors from time to time party thereto | | 8-K | | 10.1 | | 12/20/2019 |
| 10.31 | | Loan Agreement, dated as of June 29, 2018, among Royal Caribbean Cruises Ltd., as the Borrower, the Lenders from time to time party thereto, and JP Morgan Chase Bank, N.A. as Administrative Agent and Bank of America, N.A., Citigroup Global Markets Limited, Goldman Sachs Bank USA and Morgan Stanley Senior Funding,Inc. as Co-Syndication Agents | | 8-K | | 10.1 | | 7/5/2018 |
| 10.32 | | Loan Agreement, dated as of April 5, 2019, among Royal Caribbean Cruises Ltd., as the Borrower, the Lenders from time to time party thereto, Bank of America, N.A. as Administrative Agent and Banco Bilbao Vizcaya Argentaria, S.A. New York Branch, Sumitomo Mitsui Banking Corporation, The Bank of Nova Scotia, Wells Fargo Bank, National Association and DNB Markets Inc. as Co-Syndication Agents | | 8-K | | 10.2 | | 4/10/2019 |
| 10.33 | | | | 8-K | | 10.1 | | 6/18/2018 |
| | | | | | | | | | | | | | | | | | | | | | | | | | |
| | | | Incorporated By Reference |
| Exhibit Number | | | | Form | | Exhibit | | Filing Date/ Period End Date |
| 10.44 | | | | 8-K | | 10.5 | | 2/18/2021 |
| 10.45 | | | | 8-K | | 10.6 | | 2/18/2021 |
| 10.46 | | | | 8-K | | 10.5 | | 2/23/2021 |
| 10.47 | | | | 8-K | | 10.7 | | 2/23/2021 |
| 10.48 | | | | 8-K | | 10.12 | | 2/23/2021 |
| 10.49 | | | | 8-K | | 10.15 | | 2/23/2021 |
| 10.50 | | | | 8-K | | 10.1 | | 3/16/2021 |
| 10.51 | | | | 8-K | | 10.1 | | 3/19/2021 |
| 10.52 | | | | 8-K | | 10.2 | | 3/19/2021 |
| | | | | | | | | | | | | | | | | | | | | | | | | | |
| | | | Incorporated By Reference |
| Exhibit Number | | | | Form | | Exhibit | | Filing Date/ Period End Date |
| 10.34 | | | | 8-K | | 10.1 | | 3/23/2020 |
| 10.35 | | Sixth Amendment to a Credit Agreement, dated as of June 8, 2011 (as amended and restated from time to time) “Anthem of the Seas” – ex Hull No. S-698, dated April 8, 2020, between Royal Caribbean Cruises Ltd., the lenders party thereto, KfW IPEX-Bank GmbH, as Hermes agent, facility agent, initial mandated lead arrangers and the mandated lead arrangers | | 8-K | | 10.1 | | 4/10/2020 |
| 10.36 | | | | 8-K | | 10.2 | | 4/10/2020 |
| 10.37 | | | | 8-K | | 10.1 | | 4/24/2020 |
| 10.38 | | Second Supplemental Agreement to a Credit Agreement in respect of the financing of acquisition of m.v. Celebrity Edge (ex hull no. J34), dated as of April 28, 2020, between Royal Caribbean Cruises Ltd., Citibank N.A., London Branch as global coordinator, Sumitomo Mitsui Banking Corporation Europe Limited, Paris Branch as ECA agent, Citibank Europe PLC, UK branch as facility agent, the mandated lead arrangers and the other lenders party thereto | | 8-K | | 10.1 | | 5/4/2020 |
| 10.39 | | Second Supplemental Agreement to a Credit Agreement in respect of the financing of acquisition of m.v. Celebrity Apex (ex hull no. K34), dated as of April 29, 2020, between Royal Caribbean Cruises Ltd., Citibank N.A., London Bank, as global coordinator, Sumitomo Mitsui Banking Corporation Europe Limited, Paris Branch as ECA agent, Citibank Europe PLC, UK Branch as facility agent, the mandated lead arrangers and the other lenders party thereto | | 8-K | | 10.2 | | 5/4/2020 |
| 10.40 | | | | 8-K | | 10.3 | | 5/4/2020 |
| 10.41 | | | | 8-K | | 10.2 | | 5/11/2020 |
| 10.42 | | | | 8-K | | 10.4 | | 5/11/2020 |
| 10.43 | | | | 8-K | | 10.5 | | 5/11/2020 |
| | | | | | | | | | | | | | | | | | | | | | | | | | |
| | | | Incorporated By Reference |
| Exhibit Number | | | | Form | | Exhibit | | Filing Date/ Period End Date |
| 10.53 | | | | 8-K | | 10.3 | | 3/19/2021 |
| 10.54 | | Third Supplemental Agreement relating to a secured credit facility agreement for Hull No. A35 at Chantiers l’Atlantique S.A., dated July 6, 2021, between Palmeraie Finance Limited, Royal Caribbean Cruises Ltd., Citibank Europe PLC, UK Branch, Citicorp Trustee Company Limited, Citibank N.A., London Branch, HSBC Continental Europe, SMBC Bank International PLC, the mandated lead arrangers and the banks and financial institutions party thereto. | | 10-Q | | 10.1 | | 9/30/2021 |
| 10.55 | | Fourth Supplemental Agreement relating to a secured credit facility agreement for Hull No. L34 at Chantiers l’Atlantique S.A., dated July 12, 2021, between Hoediscus Finance Limited, Royal Caribbean Cruises Ltd., Citibank Europe PLC, UK Branch, Citicorp Trustee Company Limited, Citibank N.A., London Branch, HSBC Continental Europe, SMBC Bank International PLC, the mandated lead arrangers and the banks and financial institutions party thereto | | 10-Q | | 10.2 | | 9/30/2021 |
| 10.56 | | Fourth Supplemental Agreement relating to a secured credit facility for Hull No. M34 at Chantiers l’Atlantique S.A., dated July 12, 2021, between Houatorris Finance Limited, Royal Caribbean Cruises Ltd., Citibank Europe PLC, UK Branch, Citicorp Trustee Company Limited, Citibank N.A., London Branch, HSBC Continental Europe, SMBC Bank International PLC, the mandated lead arrangers and the banks and financial institutions party thereto | | 10-Q | | 10.3 | | 9/30/2021 |
| 10.57 | | Fourth Supplemental Agreement relating to Hull No. C34 at Chantiers de l’Atlantique, dated July 12, 2021, between Hibisyeu Finance Limited, Royal Caribbean Cruises Ltd., Citibank Europe PLC, UK Branch, Citicorp Trustee Company Limited, Citibank N.A., London Branch, HSBC Continental Europe, SMBC Bank International PLC, the mandated lead arrangers and the banks and financial institutions party thereto | | 10-Q | | 10.4 | | 9/30/2021 |
| 10.58 | | | | 8-K | | 10.1 | | 12/28/2021 |
| 10.59 | | | | 8-K | | 10.5 | | 12/28/2021 |
| 10.60 | | | | 8-K | | 10.13 | | 12/28/2021 |
| 10.61 | | | | 8-K | | 10.14 | | 12/28/2021 |
| | | | | | | | | | | | | | | | | | | | | | | | | | |
| | | | Incorporated By Reference |
| Exhibit Number | | | | Form | | Exhibit | | Filing Date/ Period End Date |
| 10.44 | | First Supplemental Agreement relating to Hull No. L34 at Chantiers de l’Atlantique (previously known as STX France S.A.), dated as of March 12, 2020, by and among Houatorris Finance Limited, Chantiers de L’Atlantique, the Company, Citibank Europe PLC, UK Branch as facility agent, Citicorp Trustee Company Limited as security trustee, Citibank N.A., London branch, HSBC France, Sumitomo Mitsui Banking Corporation Europe Limited, Paris Branch and the banks and financial institutions party thereto | | 10-Q | | 10.4 | | 5/21/2020 |
| 10.45 | | First Supplemental Agreement relating to Hull No. M34 at Chantiers de l’Atlantique (previously known as STX France S.A.), dated as of March 12, 2020, by and among Hoediscus Finance Limited, Chantiers de L’Atlantique as seller, the Company as buyer, Citibank Europe PLC, UK Branch as facility agent, Citicorp Trustee Company Limited as security trustee, Citibank N.A., London branch as global coordinator, HSBC France as French coordinating bank, Sumitomo Mitsui Banking Corporation Europe Limited, Paris Branch as ECA agent and the banks and financial institutions listed thereto | | 10-Q | | 10.5 | | 5/21/2020 |
| 10.46 | | First Supplemental Agreement relating to Hull No. C34 at Chantiers de l’Atlantique (previously known as STX France S.A.), dated as of March 12, 2020, by and among Hibisyeu Finance Limited as borrower, Chantiers de L’Atlantique as seller, the Company as buyer, Citibank Europe PLC, UK Branch as facility agent, Citicorp Trustee Company Limited as security trustee, Citibank N.A., London branch as global coordinator, HSBC France as French coordinating bank, Sumitomo Mitsui Banking Corporation Europe Limited, Paris Branch as ECA agent and the banks and financial institutions listed thereto | | 10-Q | | 10.6 | | 5/21/2020 |
| 10.47 | | | | 8-K | | 10.2 | | 8/3/2020 |
| 10.48 | | | | 8-K | | 10.4 | | 8/3/2020 |
| 10.49 | | | | 8-K | | 10.5 | | 8/3/2020 |
| 10.50 | | | | 8-K | | 10.6 | | 8/3/2020 |
| 10.51 | | | | 8-K | | 10.7 | | 8/3/2020 |
| 10.52 | | | | 8-K | | 10.8 | | 8/3/2020 |
| 10.53 | | | | 10-Q | | 10.15 | | 8/10/2020 |
| 10.54 | | | | 10-Q | | 10.16 | | 8/10/2020 |
| | | | | | | | | | | | | | | | | | | | | | | | | | |
| | | | Incorporated By Reference |
| Exhibit Number | | | | Form | | Exhibit | | Filing Date/ Period End Date |
| 10.62 | | | | 8-K | | 10.15 | | 12/28/2021 |
| 10.63 | | | | 8-K | | 10.17 | | 12/28/2021 |
| 10.64 | | | | 8-K | | 10.19 | | 12/28/2021 |
| 10.65 | | Amendment Agreement in connection with the Credit Agreement in respect of Hull A35 at Chantiers de L’Atlantique S.A., dated as of December 22, 2021, between Royal Caribbean Cruises Ltd., Palmeraie Finance Limited, the lenders party thereto, Citibank Europe PLC UK Branch, Citicorp Trustee Company Limited, Citibank N.A. London Branch, HSBC Continental Europe, and the mandated lead arrangers party thereto | | 8-K | | 10.20 | | 12/28/2021 |
| 10.66 | | Amendment Agreement in connection with the Credit Agreement in respect of Hull C34 at Chantiers de L’Atlantique S.A., dated as of December 22, 2021, between Royal Caribbean Cruises Ltd., Hibisyeu Finance Limited, the lenders party thereto, Citibank Europe PLC UK Branch, Citicorp Trustee Company Limited, Citibank N.A. London Branch, HSBC Continental Europe, SMBC Bank International PLC, and the other banks and financial institutions listed therein | | 8-K | | 10.21 | | 12/28/2021 |
| 10.67 | | Amendment Agreement in connection with the Credit Agreement in respect of Hull L34 at Chantiers de L’Atlantique S.A., dated as of December 22, 2021, between Royal Caribbean Cruises Ltd., Hoediscus Finance Limited, the lenders party thereto, Citibank Europe PLC UK Branch, Citicorp Trustee Company Limited, Citibank N.A. London Branch, HSBC Continental Europe, SMBC Bank International PLC, and the other banks and financial institutions listed therein | | 8-K | | 10.22 | | 12/28/2021 |
| 10.68 | | Amendment Agreement in connection with the Credit Agreement in respect of Hull M34 at Chantiers de L’Atlantique S.A., dated as of December 22, 2021, between Royal Caribbean Cruises Ltd., Houatorris Finance Limited, the lenders party thereto, Citibank Europe PLC UK Branch, Citicorp Trustee Company Limited, Citibank N.A. London Branch, HSBC Continental Europe, SMBC Bank International PLC, and the other banks and financial institutions listed therein | | 8-K | | 10.23 | | 12/28/2021 |
| 10.69 | | Hull C34 Credit Agreement, dated as of July 24, 2017, as novated, amended and restated on the Actual Delivery Date pursuant to a Novation Agreement, dated as of July 24, 2017, by and between Royal Caribbean Cruises Ltd., Citibank N.A., Sumitomo Mitsui Banking Corporation Limited (Paris Branch), Citibank Europe plc (UK Branch), and the banks and financial institutions as lender parties thereto | | 10-K | | 10.142 | | 12/31/2021 |
| 10.70 | | Hull L34 Credit Agreement, dated as of July 24, 2017, as novated, amended and restated on the Actual Delivery Date pursuant to a Novation Agreement, dated as of July 24, 2017, by and between Royal Caribbean Cruises Ltd., Citibank N.A., SMBC Bank International plc, Citibank Europe plc, and the banks and financial institutions as lender parties thereto | | 10-Q | | 10.1 | | 3/31/2022 |
| | | | | | | | | | | | | | | | | | | | | | | | | | |
| | | | Incorporated By Reference |
| Exhibit Number | | | | Form | | Exhibit | | Filing Date/ Period End Date |
| 10.55 | | | | 10-Q | | 10.17 | | 8/10/2020 |
| 10.56 | | | | 10-Q | | 10.9 | | 11/4/2020 |
| 10.57 | | Supplemental Agreement in relation to certain amendments in connection with the Silversea negative covenants and the exercise of the Buyer's Stretch Option in respect of Edge 3 (ex. hull no. L34), dated August 29, 2020, among the Company, Hoediscus Finance Limited, Citibank Europe Plc, UK Branch, Citibank N.A., London Branch, Citicorp Trustee Company Limited, HSBC France and Sumitomo Mitsui Banking Corporation Europe Limited, Paris Branch
| | 10-Q | | 10.10 | | 11/4/2020 |
| 10.58 | | Supplemental Agreement in relation to certain amendments in connection with the Silversea negative covenants and the exercise of the Buyer's Stretch Option in respect of Edge 4 (ex. hull no. M34), dated August 29, 2020, by and among the Company, Hoediscus Finance Limited, Citibank Europe Plc, UK Branch, Citibank N.A., London Branch, Citicorp Trustee Company Limited, HSBC France and Sumitomo Mitsui Banking Corporation Europe Limited, Paris Branch | | 10-Q | | 10.11 | | 11/4/2020 |
| 10.59 | | | | 10-Q | | 10.12 | | 11/4/2020 |
| 10.60 | | | | 10-Q | | 10.13 | | 11/4/2020 |
| 10.61 | | | | 8-K | | 1.1 | | 12/4/2020 |
| 10.62 | | | | 10-K | | 10.68 | | 12/31/2020 |
| 10.63 | | | | 10-K | | 10.69 | | 12/31/2020 |
| 10.64 | | | | 10-K | | 10.70 | | 12/31/2020 |
| 10.65 | | | | 10-K | | 10.71 | | 12/31/2020 |
| | | | | | | | | | | | | | | | | | | | | | | | | | |
| | | | Incorporated By Reference |
| Exhibit Number | | | | Form | | Exhibit | | Filing Date/ Period End Date |
| 10.71 | | | | 10-Q | | 10.1 | | 6/30/2022 |
| 10.72 | | | | 10-Q | | 10.2 | | 6/30/2022 |
| 10.73 | | | | 10-Q | | 10.9 | | 6/30/2022 |
| 10.74 | | | | 10-Q | | 10.10 | | 6/30/2022 |
| 10.75 | | Amendment Agreement in connection with the Credit Agreement in respect of Hull M34 at Chantiers de L’Atlantique S.A., dated as of July 21, 2022, between Royal Caribbean Cruises Ltd., Houatorris Finance Limited, the lenders party thereto, Citibank Europe PLC UK Branch, Citicorp Trustee Company Limited, Citibank N.A. London Branch, HSBC Continental Europe, SMBC Bank International PLC, and the other banks and financial institutions listed therein. | | 10-Q | | 10.11 | | 6/30/2022 |
| 10.76 | | | | 10-Q | | 10.12 | | 6/30/2022 |
| 10.77 | | | | 10-Q | | 10.13 | | 6/30/2022 |
| 10.78 | | | | 10-Q | | 10.14 | | 6/30/2022 |
| 10.79 | | | | 10-Q | | 10.15 | | 6/30/2022 |
| | | | | | | | | | | | | | | | | | | | | | | | | | |
| | | | Incorporated By Reference |
| Exhibit Number | | | | Form | | Exhibit | | Filing Date/ Period End Date |
| 10.66 | | | | 10-K | | 10.72 | | 12/31/2020 |
| 10.67 | | Supplemental Agreement relating to a secured credit facility agreement for Hull No. L34 at Chantiers l’Atlantique S.A., dated November 13, 2020, between Hoediscus Finance Limited, Royal Caribbean Cruises Ltd., Citibank Europe PLC, UK Branch, Citicorp Trustee Company Limited, Citibank N.A., London Branch, HSBC France, SMBC Bank International PLC, the mandated lead arrangers and the banks and financial institutions party thereto | | 10-K | | 10.73 | | 12/31/2020 |
| 10.68 | | Supplemental Agreement relating to a secured credit facility for hull no. M34, dated November 13, 2020, between Houatorris Finance Limited, Royal Caribbean Cruises Ltd., Citibank Europe PLC, UK Branch, Citicorp Trustee Company Limited, Citibank N.A., London Branch, HSBC France, SMBC Bank International PLC, the mandated lead arrangers and the banks and financial institutions party thereto | | 10-K | | 10.74 | | 12/31/2020 |
| 10.69 | | Supplemental Agreement relating to Hull No. C34 at Chantiers de l’Atlantique, dated November 13, 2020, between Hibisyeu Finance Limited, Royal Caribbean Cruises Ltd., Citibank Europe PLC, UK Branch, Citicorp Trustee Company Limited, Citibank N.A., London Branch, HSBC France, SMBC Bank International PLC, the banks and financial institutions party thereto and the mandated lead arrangers | | 10-K | | 10.75 | | 12/31/2020 |
| 10.70 | | Supplemental Agreement relating to Hull No. A35 at Chantiers de l’Atlantique, dated November 13, 2020, between Palmeraie Finance Limited, Royal Caribbean Cruises Ltd., Citibank Europe PLC, UK Branch, Citicorp Trustee Company Limited, Citibank N.A., London Branch, HSBC France, the mandated lead arrangers and the banks and financial institutions party thereo | | 10-K | | 10.76 | | 12/31/2020 |
| 10.71 | | | | 10-K | | 10.77 | | 12/31/2020 |
| 10.72 | | | | 10-K | | 10.78 | | 12/31/2020 |
| 10.73 | | | | 10-K | | 10.79 | | 12/31/2020 |
| 10.74 | | | | 10-K | | 10.80 | | 12/31/2020 |
| 10.75 | | | | 10-K | | 10.81 | | 12/31/2020 |
| 10.76 | | | | 10-K | | 10.82 | | 12/31/2020 |
| | | | | | | | | | | | | | | | | | | | | | | | | | |
| | | | Incorporated By Reference |
| Exhibit Number | | | | Form | | Exhibit | | Filing Date/ Period End Date |
| 10.80 | | | | 10-Q | | 10.16 | | 6/30/2022 |
| 10.81 | | Amendment Agreement in connection with the Credit Agreement in respect of Hull A35 at Chantiers de L’Atlantique S.A., dated as of July 21, 2022, between Royal Caribbean Cruises Ltd., Palmeraie Finance Limited, the lenders party thereto, Citibank Europe PLC UK Branch, Citicorp Trustee Company Limited, Citibank N.A. London Branch, HSBC Continental Europe, and the mandated lead arrangers party thereto. | | 10-Q | | 10.17 | | 6/30/2022 |
| 10.82 | | | | 10-Q | | 10.21 | | 6/30/2022 |
| 10.83 | | | | 10-Q | | 10.27 | | 6/30/2022 |
| 10.84 | | | | 10-Q | | 10.1 | | 9/30/2022 |
| 10.85 | | | | 10-Q | | 10.2 | | 9/30/2022 |
| 10.86 | | | | 10-K | | 10.72 | | 12/31/2022 |
| 10.87 | | | | 10-K | | 10.73 | | 12/31/2022 |
| 10.88 | | | | 10-Q | | 10.1 | | 6/30/2023 |
| 10.89 | | | | 10-Q | | 10.2 | | 6/30/2023 |
| 10.90 | | | | 10-Q | | 10.3 | | 6/30/2023 |
| | | | | | | | | | | | | | | | | | | | | | | | | | |
| | | | Incorporated By Reference |
| Exhibit Number | | | | Form | | Exhibit | | Filing Date/ Period End Date |
| 10.77 | | | | 10-K | | 10.83 | | 12/31/2020 |
| 10.78 | | | | 10-K | | 10.84 | | 12/31/2020 |
| 10.79 | | | | 10-K | | 10.85 | | 12/31/2020 |
| 10.80 | | | | 10-K | | 10.86 | | 12/31/2020 |
| 10.81 | | | | 10-K | | 10.87 | | 12/31/2020 |
| 10.82 | | | | 10-K | | 10.88 | | 12/31/2020 |
| 10.83 | | | | 8-K | | 10.2 | | 2/18/2021 |
| 10.84 | | | | 8-K | | 10.3 | | 2/18/2021 |
| 10.85 | | | | 8-K | | 10.4 | | 2/18/2021 |
| 10.86 | | | | 8-K | | 10.5 | | 2/18/2021 |
| 10.87 | | | | 8-K | | 10.6 | | 2/18/2021 |
| 10.88 | | | | 8-K | | 10.1 | | 2/23/2021 |
| | | | | | | | | | | | | | | | | | | | | | | | | | |
| | | | Incorporated By Reference |
| Exhibit Number | | | | Form | | Exhibit | | Filing Date/ Period End Date |
| 10.91 | | | | 10-Q | | 10.4 | | 6/30/2023 |
| 10.92 | | Amendment Agreement in connection with the Credit Agreement in respect of Celebrity Apex (ex hull no. K34), dated as of June 30, 2023, between the Company, Citibank N.A., London Bank, as global coordinator, SMBC Bank International plc as ECA agent, Citibank Europe plc, UK Branch as facility agent, the banks and financial institutions listed therein as mandated lead arrangers and the banks and financial institutions listed therein as lenders. | | 10-Q | | 10.5 | | 6/30/2023 |
| 10.93 | | Amendment Agreement in connection with the Credit Agreement in respect of “Wonder of the Seas” (ex Hull C34), dated as of June 30, 2023, between the Company, Citibank N.A., London Bank, as global coordinator, SMBC Bank International plc as ECA agent, Citibank Europe plc, UK Branch as facility agent, the banks and financial institutions listed therein as mandated lead arrangers and the banks and financial institutions listed therein as lenders. | | 10-Q | | 10.6 | | 6/30/2023 |
| 10.94 | | | | 10-Q | | 10.7 | | 6/30/2023 |
| 10.95 | | | | 10-Q | | 10.8 | | 6/30/2023 |
| 10.96 | | | | 8-K | | 10.1 | | 10/11/2023 |
| 10.97 | | | | 8-K | | 10.2 | | 10/11/2023 |
| 10.98 | | | | 10-Q | | 10.1 | | 9/30/2023 |
| 10.99 | | | | 10-Q | | 10.2 | | 9/30/2023 |
| | | | | | | | | | | | | | | | | | | | | | | | | | |
| | | | Incorporated By Reference |
| Exhibit Number | | | | Form | | Exhibit | | Filing Date/ Period End Date |
| 10.89 | | | | 8-K | | 10.2 | | 2/23/2021 |
| 10.90 | | | | 8-K | | 10.3 | | 2/23/2021 |
| 10.91 | | | | 8-K | | 10.4 | | 2/23/2021 |
| 10.92 | | | | 8-K | | 10.5 | | 2/23/2021 |
| 10.93 | | | | 8-K | | 10.6 | | 2/23/2021 |
| 10.94 | | | | 8-K | | 10.7 | | 2/23/2021 |
| 10.95 | | | | 8-K | | 10.8 | | 2/23/2021 |
| 10.96 | | | | 8-K | | 10.9 | | 2/23/2021 |
| 10.97 | | | | 8-K | | 10.10 | | 2/23/2021 |
| 10.98 | | | | 8-K | | 10.11 | | 2/23/2021 |
| 10.99 | | | | 8-K | | 10.12 | | 2/23/2021 |
| | | | | | | | | | | | | | | | | | | | | | | | | | |
| | | | Incorporated By Reference |
| Exhibit Number | | | | Form | | Exhibit | | Filing Date/ Period End Date |
| 10.100 | | | | | | | | |
| 10.101 | | | | 10-K | | 10.17 | | 12/31/2016 |
| 10.102 | | | | 8-K | | 10.1 | | 6/3/2022 |
| 10.103 | | | | 10-Q | | 10.1 | | 3/31/2023 |
| 10.104 | | | | 10-Q | | 10.2 | | 3/31/2023 |
| 10.105 | | | | 10-Q | | 10.3 | | 3/31/2023 |
| 10.106 | | | | 10-Q | | 10.4 | | 3/31/2023 |
| 10.107 | | | | 10-Q | | 10.5 | | 3/31/2023 |
| 10.108 | | | | 10-Q | | 10.6 | | 3/31/2023 |
| 10.109 | | | | 10-Q | | 10.2 | | 6/30/2013 |
| 10.110 | | | | 10-Q | | 10.3 | | 6/30/2015 |
| 10.111 | | | | 10-K | | 10.33 | | 12/31/2014 |
| 10.112 | | | | 10-K | | 10.26 | | 2/25/2013 |
| 10.113 | | | | 10-K | | 10.33 | | 12/31/2014 |
| 10.114 | | | | 10-Q | | 10.4 | | 6/30/2015 |
| 10.115 | | | | 8-K | | 10.3 | | 12/8/2005 |
| 10.116 | | | | 10-K | | 10.31 | | 12/31/2006 |
| 10.117 | | | | 10-K | | 10.31 | | 12/31/2007 |
| 10.118 | | | | 10-Q | | 10.1 | | 9/30/2008 |
| 10.119 | | | | 10-K | | 10.38 | | 12/31/2008 |
| 21.1 | | | | | | | | |
| 23.1 | | | | | | | | |
| 23.2 | | | | | | | | |
| 24.1 | | | | | | | | |
| 31.1 | | | | | | | | |
| 31.2 | | | | | | | | |
| | | | | | | | | | | | | | | | | | | | | | | | | | |
| | | | Incorporated By Reference |
| Exhibit Number | | | | Form | | Exhibit | | Filing Date/ Period End Date |
| 10.100 | | | | 8-K | | 10.13 | | 2/23/2021 |
| 10.101 | | | | 8-K | | 10.14 | | 2/23/2021 |
| 10.102 | | | | 8-K | | 10.15 | | 2/23/2021 |
| 10.103 | | | | 8-K | | 10.1 | | 3/16/2021 |
| 10.104 | | | | 8-K | | 10.1 | | 3/19/2021 |
| 10.105 | | | | 8-K | | 10.2 | | 3/19/2021 |
| 10.106 | | | | 8-K | | 10.3 | | 3/19/2021 |
| 10.107 | | | | 8-K | | 10.1 | | 4/1/2021 |
| 10.108 | | | | 8-K | | 10.2 | | 4/1/2021 |
| 10.109 | | | | 8-K | | 10.3 | | 4/1/2021 |
| 10.110 | | | | 8-K | | 10.4 | | 4/1/2021 |
| | | | | | | | | | | | | | | | | | | | | | | | | | |
| | | | Incorporated By Reference |
| Exhibit Number | | | | Form | | Exhibit | | Filing Date/ Period End Date |
| 10.111 | | Third Supplemental Agreement relating to a secured credit facility agreement for Hull No. A35 at Chantiers l’Atlantique S.A., dated July 6, 2021, between Palmeraie Finance Limited, Royal Caribbean Cruises Ltd., Citibank Europe PLC, UK Branch, Citicorp Trustee Company Limited, Citibank N.A., London Branch, HSBC Continental Europe, SMBC Bank International PLC, the mandated lead arrangers and the banks and financial institutions party thereto. | | 10-Q | | 10.1 | | 9/30/2021 |
| 10.112 | | Fourth Supplemental Agreement relating to a secured credit facility agreement for Hull No. L34 at Chantiers l’Atlantique S.A., dated July 12, 2021, between Hoediscus Finance Limited, Royal Caribbean Cruises Ltd., Citibank Europe PLC, UK Branch, Citicorp Trustee Company Limited, Citibank N.A., London Branch, HSBC Continental Europe, SMBC Bank International PLC, the mandated lead arrangers and the banks and financial institutions party thereto | | 10-Q | | 10.2 | | 9/30/2021 |
| 10.113 | | Fourth Supplemental Agreement relating to a secured credit facility for Hull No. M34 at Chantiers l’Atlantique S.A., dated July 12, 2021, between Houatorris Finance Limited, Royal Caribbean Cruises Ltd., Citibank Europe PLC, UK Branch, Citicorp Trustee Company Limited, Citibank N.A., London Branch, HSBC Continental Europe, SMBC Bank International PLC, the mandated lead arrangers and the banks and financial institutions party thereto | | 10-Q | | 10.3 | | 9/30/2021 |
| 10.114 | | Fourth Supplemental Agreement relating to Hull No. C34 at Chantiers de l’Atlantique, dated July 12, 2021, between Hibisyeu Finance Limited, Royal Caribbean Cruises Ltd., Citibank Europe PLC, UK Branch, Citicorp Trustee Company Limited, Citibank N.A., London Branch, HSBC Continental Europe, SMBC Bank International PLC, the mandated lead arrangers and the banks and financial institutions party thereto | | 10-Q | | 10.4 | | 9/30/2021 |
| 10.115 | | | | 10-Q | | 10.5 | | 9/30/2021 |
| 10.116 | | | | 10-Q | | 10.6 | | 9/30/2021 |
| 10.117 | | | | 8-K | | 10.1 | | 12/28/2021 |
| 10.118 | | | | 8-K | | 10.2 | | 12/28/2021 |
| 10.119 | | | | 8-K | | 10.3 | | 12/28/2021 |
| 10.120 | | | | 8-K | | 10.4 | | 12/28/2021 |
| | | | | | | | | | | | | | | | | | | | | | | | | | |
| | | | Incorporated By Reference |
| Exhibit Number | | | | Form | | Exhibit | | Filing Date/ Period End Date |
| 10.121 | | | | 8-K | | 10.5 | | 12/28/2021 |
| 10.122 | | | | 8-K | | 10.6 | | 12/28/2021 |
| 10.123 | | | | 8-K | | 10.7 | | 12/28/2021 |
| 10.124 | | | | 8-K | | 10.8 | | 12/28/2021 |
| 10.125 | | | | 8-K | | 10.9 | | 12/28/2021 |
| 10.126 | | | | 8-K | | 10.10 | | 12/28/2021 |
| 10.127 | | | | 8-K | | 10.11 | | 12/28/2021 |
| 10.128 | | | | 8-K | | 10.12 | | 12/28/2021 |
| 10.129 | | | | 8-K | | 10.13 | | 12/28/2021 |
| 10.130 | | | | 8-K | | 10.14 | | 12/28/2021 |
| 10.131 | | | | 8-K | | 10.15 | | 12/28/2021 |
| 10.132 | | | | 8-K | | 10.16 | | 12/28/2021 |
| 10.133 | | | | 8-K | | 10.17 | | 12/28/2021 |
| | | | | | | | | | | | | | | | | | | | | | | | | | |
| | | | Incorporated By Reference |
| Exhibit Number | | | | Form | | Exhibit | | Filing Date/ Period End Date |
| 10.134 | | | | 8-K | | 10.18 | | 12/28/2021 |
| 10.135 | | | | 8-K | | 10.19 | | 12/28/2021 |
| 10.136 | | Amendment Agreement in connection with the Credit Agreement in respect of Hull A35 at Chantiers de L’Atlantique S.A., dated as of December 22, 2021, between Royal Caribbean Cruises Ltd., Palmeraie Finance Limited, the lenders party thereto, Citibank Europe PLC UK Branch, Citicorp Trustee Company Limited, Citibank N.A. London Branch, HSBC Continental Europe, and the mandated lead arrangers party thereto | | 8-K | | 10.20 | | 12/28/2021 |
| 10.137 | | Amendment Agreement in connection with the Credit Agreement in respect of Hull C34 at Chantiers de L’Atlantique S.A., dated as of December 22, 2021, between Royal Caribbean Cruises Ltd., Hibisyeu Finance Limited, the lenders party thereto, Citibank Europe PLC UK Branch, Citicorp Trustee Company Limited, Citibank N.A. London Branch, HSBC Continental Europe, SMBC Bank International PLC, and the other banks and financial institutions listed therein | | 8-K | | 10.21 | | 12/28/2021 |
| 10.138 | | Amendment Agreement in connection with the Credit Agreement in respect of Hull L34 at Chantiers de L’Atlantique S.A., dated as of December 22, 2021, between Royal Caribbean Cruises Ltd., Hoediscus Finance Limited, the lenders party thereto, Citibank Europe PLC UK Branch, Citicorp Trustee Company Limited, Citibank N.A. London Branch, HSBC Continental Europe, SMBC Bank International PLC, and the other banks and financial institutions listed therein | | 8-K | | 10.22 | | 12/28/2021 |
| 10.139 | | Amendment Agreement in connection with the Credit Agreement in respect of Hull M34 at Chantiers de L’Atlantique S.A., dated as of December 22, 2021, between Royal Caribbean Cruises Ltd., Houatorris Finance Limited, the lenders party thereto, Citibank Europe PLC UK Branch, Citicorp Trustee Company Limited, Citibank N.A. London Branch, HSBC Continental Europe, SMBC Bank International PLC, and the other banks and financial institutions listed therein | | 8-K | | 10.23 | | 12/28/2021 |
| 10.140 | | | | 8-K | | 10.24 | | 12/28/2021 |
| 10.141 | | | | 8-K | | 10.25 | | 12/28/2021 |
| 10.142 | | Hull C34 Credit Agreement, dated as of July 24, 2017, as novated, amended and restated on the Actual Delivery Date pursuant to a Novation Agreement, dated as of July 24, 2017, by and between Royal Caribbean Cruises Ltd., Citibank N.A., Sumitomo Mitsui Banking Corporation Limited (Paris Branch), Citibank Europe plc (UK Branch), and the banks and financial institutions as lender parties thereto* | | | | | | |
| 10.143 | | | | 10-K | | 10.17 | | 12/31/2016 |
| 10.144 | | | | 10-Q | | 10.3 | | 9/30/2008 |
| | | | | | | | | | | | | | | | | | | | | | | | | | |
| | | | Incorporated By Reference |
| Exhibit Number | | | | Form | | Exhibit | | Filing Date/ Period End Date |
| 10.145 | | | | 10-Q | | 10.4 | | 9/30/2008 |
| 10.146 | | | | 10-K | | 10.23 | | 12/31/2013 |
| 10.147 | | | | 10-Q | | 10.7 | | 9/30/2017 |
| 10.148 | | | | 10-K | | 10.31 | | 12/31/2010 |
| 10.149 | | | | 10-K | | 10.27 | | 12/31/2014 |
| 10.150 | | | | 10-K | | 10.26 | | 12/31/2015 |
| 10.151 | | | | 10-K | | 10.22 | | 12/31/2012 |
| 10.152 | | | | 10-Q | | 10.2 | | 6/30/2013 |
| 10.153 | | | | 10-Q | | 10.3 | | 6/30/2015 |
| 10.154 | | | | 10-K | | 10.33 | | 12/31/2014 |
| 10.155 | | | | 10-K | | 10.31 | | 12/31/2016 |
| 10.156 | | | | 10-K | | 10.26 | | 2/25/2013 |
| 10.157 | | | | 10-K | | 10.33 | | 12/31/2014 |
| 10.158 | | | | 10-Q | | 10.4 | | 6/30/2015 |
| 10.159 | | | | 8-K | | 10.3 | | 12/8/2005 |
| 10.160 | | | | 10-K | | 10.31 | | 12/31/2006 |
| 10.161 | | | | 10-K | | 10.31 | | 12/31/2007 |
| 10.162 | | | | 10-Q | | 10.1 | | 9/30/2008 |
| 10.163 | | | | 10-K | | 10.38 | | 12/31/2008 |
| 10.164 | | | | 10-K | | 10.35 | | 12/31/2013 |
| 18.1 | | | | | | | | |
| 21.1 | | | | | | | | |
| 23.1 | | | | | | | | |
| 23.2 | | | | | | | | |
| 24.1 | | | | | | | | |
| 31.1 | | | | | | | | |
| 31.2 | | | | | | | | |
| 32.1 | | | | | | | | |
Table of Contents | | | | | | | | | | | | | | | | | | | | | | | | | | |
| | | | Incorporated By Reference |
| Exhibit Number | | | | Form | | Exhibit | | Filing Date/ Period End Date |
| 32.1 | | | | | | | | |
| 97.1 | | | | | | | | |
* Filed herewith
** Furnished herewith
† Management contract or compensatory plan or arrangement.
Interactive Data File | | | | | | | | |
| 101 | The following financial statements from Royal Caribbean Cruises Ltd.'s Annual Report on Form 10-K for the year ended December 31, 20212023 formatted in iXBRL (Inline eXtensible Business Reporting Language) are as follows: |
| (i) | the Consolidated Statements of Comprehensive Income (Loss) for the years ended December 31, 2021, 20202023, 2022 and 2019;2021; |
| (ii) | the Consolidated Balance Sheets at December 31, 20212023, and 2020;2022; |
| (iii) | the Consolidated Statements of Cash Flows for the years ended December 31, 2021, 20202023, 2022 and 2019;2021; |
| (iv) | the Consolidated Statements of Shareholders' Equity for the years ended December 31, 2021, 20202023, 2022 and 2019;2021; and |
| (v) | the Notes to the Consolidated Financial Statements, tagged in summary and detail. |
| 104 | | Cover Page Interactive Data File, formatted in iXBRL and contained in Exhibit 101 |
Item 16. Form 10-K Summary
None.
SIGNATURES
Pursuant to the requirements of the Securities Exchange Act of 1934, the registrant has duly caused this report to be signed on its behalf by the undersigned, thereunto duly authorized. | | | | | |
ROYAL CARIBBEAN CRUISES LTD. (Registrant) |
| By: | /s/ NAFTALI HOLTZ |
| Naftali Holtz Chief Financial Officer (Principal Financial Officer and duly authorized signatory) |
March 1, 2022February 21, 2024
Pursuant to the requirements of the Securities Exchange Act of 1934, this report has been signed below by the following persons on behalf of the registrant and in the capacities indicated on March 1, 2022.February 21, 2024. | | |
| /s/ JASON T. LIBERTY |
Jason T. Liberty Director and Chief Executive Officer (Principal Executive Officer) |
|
| /s/ NAFTALI HOLTZ |
Naftali Holtz Chief Financial Officer (Principal Financial Officer) |
|
| /s/ HENRY L. PUJOL |
Henry L. Pujol Senior Vice President, Chief Accounting Officer (Principal Accounting Officer) |
|
/s/ RICHARD D. FAIN* |
Richard D. Fain Chairman of the Board |
|
| * |
John F. Brock Director |
|
| * |
Stephen R. Howe Jr. Director |
|
| * |
William L. Kimsey Director |
| * |
Michael O. Leavitt Director |
| * |
Maritza G. Montiel Director |
|
| * |
Ann S. Moore Director |
|
| * |
Eyal M. Ofer Director |
|
|
* |
William K. Reilly
Director
|
|
| * |
Vagn O. Sørensen Director |
|
| * |
Donald Thompson Director |
|
| * |
Arne Alexander Wilhelmsen Director |
|
| * |
|
Amy C. McPherson Director |
|
| * |
|
Michael O. LeavittRebecca Yeung
Director |
| *
| | | | | |
| *By: | /s/ NAFTALI HOLTZ |
| Naftali Holtz, as Attorney-in-Fact |
ROYAL CARIBBEAN CRUISES LTD.
INDEX TO CONSOLIDATED FINANCIAL STATEMENTS
Report of Independent Registered Public Accounting Firm
To the Board of Directors and Shareholders of Royal Caribbean Cruises Ltd.
Opinions on the Financial Statements and Internal Control over Financial Reporting
We have audited the accompanying consolidated balance sheets of Royal Caribbean Cruises Ltd. and its subsidiaries (the “Company”) as of December 31, 20212023 and 2020,2022, and the related consolidated statements of comprehensive income (loss) income,, shareholders’ equity and cash flows for each of the three years in the period ended December 31, 2021,2023, including the related notes (collectively referred to as the “consolidated financial statements”). We also have audited the Company's internal control over financial reporting as of December 31, 2021,2023, based on criteria established in Internal Control - Integrated Framework (2013) issued by the Committee of Sponsoring Organizations of the Treadway Commission (COSO).
In our opinion, the consolidated financial statements referred to above present fairly, in all material respects, the financial position of the Company as of December 31, 20212023 and 2020,2022, and the results of its operations and its cash flows for each of the three years in the period ended December 31, 20212023 in conformity with accounting principles generally accepted in the United States of America. Also in our opinion, the Company maintained, in all material respects, effective internal control over financial reporting as of December 31, 2021,2023, based on criteria established in Internal Control - Integrated Framework (2013)issued by the COSO.
ChangeChanges in Accounting PrinciplePrinciples
As discussed in NoteNotes 2 and 1 to the consolidated financial statements, effective January 1, 2022, the Company changed the manner in which it accounts for convertible notes and effective October 1, 2021, the Company changed the manner in which it accounts for the consolidation of Silversea Cruises.
Basis for Opinions
The Company's management is responsible for these consolidated financial statements, for maintaining effective internal control over financial reporting, and for its assessment of the effectiveness of internal control over financial reporting, included in Management’s Report on Internal Control overOver Financial Reporting appearing under Item 9A. Our responsibility is to express opinions on the Company’s consolidated financial statements and on the Company's internal control over financial reporting based on our audits. We are a public accounting firm registered with the Public Company Accounting Oversight Board (United States) (PCAOB) and are required to be independent with respect to the Company in accordance with the U.S. federal securities laws and the applicable rules and regulations of the Securities and Exchange Commission and the PCAOB.
We conducted our audits in accordance with the standards of the PCAOB. Those standards require that we plan and perform the audits to obtain reasonable assurance about whether the consolidated financial statements are free of material misstatement, whether due to error or fraud, and whether effective internal control over financial reporting was maintained in all material respects.
Our audits of the consolidated financial statements included performing procedures to assess the risks of material misstatement of the consolidated financial statements, whether due to error or fraud, and performing procedures that respond to those risks. Such procedures included examining, on a test basis, evidence regarding the amounts and disclosures in the consolidated financial statements. Our audits also included evaluating the accounting principles used and significant estimates made by management, as well as evaluating the overall presentation of the consolidated financial statements. Our audit of internal control over financial reporting included obtaining an understanding of internal control over financial reporting, assessing the risk that a material weakness exists, and testing and evaluating the design and operating effectiveness of internal control based on the assessed risk. Our audits also included performing such other procedures as we considered necessary in the circumstances. We believe that our audits provide a reasonable basis for our opinions.
Emphasis of Matter
As discussed in Note 1 to the consolidated financial statements, the ongoing effects of the COVID-19 pandemic have had, and will continue to have, a material negative impact on the Company’s results of operations and liquidity. Management’s evaluation of the events and conditions and management’s plans to mitigate these matters are also described in Note 1.
Definition and Limitations of Internal Control over Financial Reporting
A company’s internal control over financial reporting is a process designed to provide reasonable assurance regarding the reliability of financial reporting and the preparation of financial statements for external purposes in accordance with generally accepted accounting principles. A company’s internal control over financial reporting includes those policies and procedures that (i) pertain to the maintenance of records that, in reasonable detail, accurately and fairly reflect the transactions and dispositions of the assets of the company; (ii) provide reasonable assurance that transactions are recorded as necessary to permit preparation of financial statements in accordance with generally accepted accounting principles, and that receipts and expenditures of the company are being made only in accordance with authorizations of management and directors of the company; and (iii) provide reasonable assurance regarding prevention or timely detection of unauthorized acquisition, use, or disposition of the company’s assets that could have a material effect on the financial statements.
Because of its inherent limitations, internal control over financial reporting may not prevent or detect misstatements. Also, projections of any evaluation of effectiveness to future periods are subject to the risk that controls may become inadequate because of changes in conditions, or that the degree of compliance with the policies or procedures may deteriorate.
Critical Audit Matters
The critical audit mattersmatter communicated below are mattersis a matter arising from the current period audit of the consolidated financial statements that werewas communicated or required to be communicated to the audit committee and that (i) relaterelates to accounts or disclosures that are material to the consolidated financial statements and (ii) involved our especially challenging, subjective, or complex judgments. The communication of critical audit matters does not alter in any way our opinion on the consolidated financial statements, taken as a whole, and we are not, by communicating the critical audit mattersmatter below, providing a separate opinionsopinion on the critical audit mattersmatter or on the accounts or disclosures to which they relate.
Liquidity - Impact of COVID-19
As described in Note 1 to the consolidated financial statements, the Company restarted its global cruise operations in a phased manner, following a voluntary suspension of global cruise operations that commenced in March 2020 in response to the COVID-19 outbreak. Management believes the impact to their global bookings resulting from COVID-19 will continue to have a material negative impact on the Company’s results of operations and liquidity. Management has implemented a number of measures to mitigate the financial and operational impacts of COVID-19, including reduction of capital expenditures and operating expenses, the issuance of debt and shares of their common stock, the amendment of credit agreements to defer payments, the waiver and/or modification of covenant requirements and the suspension of dividend payments, with the addition of pursuing refinancing opportunities to reduce interest expense and extend maturities. The principal assumptions used in management’s estimate of future liquidity requirements consisted of (i) the expected continued gradual resumption of cruise operations; (ii) the expected sustained increase in revenue per available passenger cruise day during the continued resumption of cruise operations; (iii) the expected lower than comparable historical occupancy levels during the continued resumption of cruise operations, increasing over time until the Company reaches historical occupancy levels; and (iv) the expected spend during the Company’s resumption of cruise operations, including returning crew members to their vessels and maintaining enhanced health and safety protocols. Based on these assumptions regarding the impact of COVID-19 and the Company’s resumption of operations, as well as the Company’s present financial condition, management believes they have sufficient financial resources to fund their obligations for at least the next twelve months from the issuance of the financial statements.
The principal considerations for our determination that performing procedures relating to the impact of COVID-19 on the Company’s liquidity is a critical audit matter are the significant judgment by management when developing the estimate of future liquidity requirements; this in turn led to a high degree of auditor judgment, subjectivity, and effort in performing procedures and evaluating management’s estimate of future liquidity requirements and assumptions related to (i) the expected continued gradual resumption of cruise operations; (ii) the expected sustained increase in revenue per available passenger cruise day during the continued resumption of cruise operations; (iii) the expected lower than comparable historical occupancy levels during the continued resumption of cruise operations, increasing over time until the Company reaches historical occupancy levels; and (iv) the expected spend during the Company’s resumption of cruise operations, including returning crew members to their vessels and maintaining enhanced health and safety protocols.
Addressing the matter involved performing procedures and evaluating audit evidence in connection with forming our overall opinion on the consolidated financial statements. These procedures included testing the effectiveness of
controls relating to management’s estimate of future liquidity requirements. These procedures also included, among others, (i) testing management’s process for estimating future liquidity requirements for the twelve months after the date the financial statements are issued; (ii) testing the completeness and accuracy of underlying data used in the estimate; (iii) evaluating the reasonableness of the significant assumptions used by management related to the expected continued gradual resumption of cruise operations, the expected sustained increase in revenue per available passenger cruise day during the continued resumption of cruise operations, the expected lower than comparable historical occupancy levels during the continued resumption of cruise operations, increasing over time until the Company reaches historical occupancy levels, and the expected spend during the Company’s resumption of cruise operations, including returning crew members to their vessels and maintaining enhanced health and safety protocols; and (iv) evaluating management’s estimate of future liquidity requirements and their disclosure in the consolidated financial statements regarding having sufficient liquidity to satisfy the Company’s obligations for at least the next twelve months from the issuance of the financial statements. Evaluating management’s assumptions related to the expected continued gradual resumption of cruise operations, the expected sustained increase in revenue per available passenger cruise day during the continued resumption of cruise operations, the expected lower than comparable historical occupancy levels during the continued resumption of cruise operations, increasing over time until the Company reaches historical occupancy levels, and the expected spend during the Company’s resumption of cruise operations, including returning crew members to their vessels and maintaining enhanced health and safety protocols, involved evaluating whether the assumptions used by management were reasonable considering (i) the current and past performance of the Company; (ii) the consistency with external market and industry data; and (iii) whether these assumptions were consistent with evidence obtained in other areas of the audit.it relates.
Impairment Assessments – Silversea Cruises Reporting Unit Goodwill and Trade Name
As described in Notes 2, 4 and 5 to the consolidated financial statements, as of December 31, 20212023 the Company’s consolidated goodwill balance was $809 million and the goodwill associated with the Silversea Cruises reporting unit was $509 million. The Company’s consolidated indefinite-life intangible assets balance was $321 million and the goodwill and trade name associated withwhich primarily relates to the Silversea Cruises reporting unit and trade name was $509 million and $319 million, respectively.name. Management reviews goodwill and indefinite-life intangible assets for impairment at the reporting unit level and asset level, respectively, annually or, when events or circumstances dictate, more frequently. The quantitative impairment analysisassessment consists of a comparison of the fair value of the reporting unit or asset with its carrying value. Fair value is estimated by management using a probability weighted discounted cash flow model in combination with a market-based valuation approach for reporting units and a relief-from-royalty method for trade names. Management’s principal assumptions for the Silversea Cruises reporting unit and trade name were theimpairment assessments consisted of forecasted net revenues primarily the timing of returning to normalized operations,per available passenger cruise day, occupancy rates from existing and expected ship deliveries,vessels, vessel operating expenses, terminal growth rate, royalty rate, and weighted average cost of capital (i.e., discount rate).
The principal considerations for our determination that performing procedures relating to the impairment assessments of the Silversea Cruises reporting unit goodwill and trade name is a critical audit matter are (i) the significant judgment by management when developing the fair value estimates;estimates of the Silversea Cruises reporting unit and trade name; (ii) a high degree of auditor judgment, subjectivity and effortin performing procedures and evaluating management’s significant assumptions related to the timing of returning to normalized operations,forecasted revenues per available passenger cruise day, occupancy rates from existing and expected ship deliveries,vessels, terminal growth rates, and discount rates for the goodwill and trade name impairment assessments, vessel operating expenses for the goodwill impairment assessment and the royalty rate for the trade name impairment assessment; and (iii) the audit effort involved the use of professionalswith specialized skill and knowledge.
Addressing the matter involved performing procedures and evaluating audit evidence in connection with forming our overall opinion on the consolidated financial statements. These procedures included testing the effectiveness of controls relating to management’s goodwill and trade name impairment assessments, including controls over the valuation of the Silversea Cruises reporting unit and trade name. These procedures also included, among others, (i) testing management’s process for developing the fair value estimates; (ii) evaluating the appropriateness of the probability weighted discounted future cash flow model market-based valuation approach, and relief-from-royalty method;method used by management; (iii) testing the completeness and accuracy of underlying data used in the fair value estimates;probability weighted discounted cash flow model and relief-from-royalty method; and (iv) evaluating the reasonableness of the significant assumptions used by management related to the timing of returning to normalized operations,forecasted revenues per available passenger cruise day, occupancy rates from existing and expected ship deliveries,vessels, terminal growth rates, and discount rates for the goodwill and trade name impairment assessments, vessel operating expenses for the goodwill impairment assessment, and the royalty rate for the trade name impairment assessment. Evaluating management’s assumptions related to the timing of returning to normalized operations,forecasted revenues per available passenger cruise day, occupancy rates from existing vessels, vessel operating expenses and expected ship deliveries, and terminal growth ratesrates involved evaluating whether the assumptions used by management were reasonable considering (i) the current and past performance of the reporting unit and the Silversea Cruises brand; (ii) the consistency with external market and industry data; and (iii) whether these assumptions were consistent with evidence obtained in other areas of the audit. Professionals with specialized skill and knowledge were used to assist in the evaluation ofevaluating (i) the Company’sappropriateness of the probability weighted discounted cash flow
model market-based valuation approach and relief-from-royalty method and (ii) the reasonableness of the discount rate and royalty rate assumptions.
/s/ PricewaterhouseCoopers LLP
Hallandale Beach,Miami, Florida
March 1, 2022February 21, 2024
We have served as the Company’s auditor since at least 1989, which includes periods before the Company became subject to SEC reporting requirements. We have not been able to determine the specific year we began serving as auditor of the Company.
ROYAL CARIBBEAN CRUISES LTD.
CONSOLIDATED STATEMENTS OF COMPREHENSIVE INCOME (LOSS) INCOME
(in thousands,millions, except per share data)
| | Year Ended December 31, |
| 2021 | | 2020 | | 2019 |
| Year Ended December 31, | | | Year Ended December 31, |
| 2023 | | | 2023 | | 2022 | | 2021 |
| Passenger ticket revenues | Passenger ticket revenues | $ | 941,175 | | | $ | 1,504,569 | | | $ | 7,857,057 | |
| Onboard and other revenues | Onboard and other revenues | 590,958 | | | 704,236 | | | 3,093,604 | |
| Total revenues | Total revenues | 1,532,133 | | | 2,208,805 | | | 10,950,661 | |
| Cruise operating expenses: | Cruise operating expenses: | | | | | |
| Commissions, transportation and other | |
| Commissions, transportation and other | |
| Commissions, transportation and other | Commissions, transportation and other | 207,562 | | | 344,625 | | | 1,656,297 | |
| Onboard and other | Onboard and other | 116,946 | | | 157,213 | | | 639,782 | |
| Payroll and related | Payroll and related | 838,088 | | | 788,273 | | | 1,079,121 | |
| Food | Food | 164,389 | | | 161,750 | | | 583,905 | |
| Fuel | Fuel | 385,322 | | | 371,015 | | | 697,962 | |
| Other operating | Other operating | 945,205 | | | 942,232 | | | 1,405,698 | |
| Total cruise operating expenses | Total cruise operating expenses | 2,657,512 | | | 2,765,108 | | | 6,062,765 | |
| Marketing, selling and administrative expenses | Marketing, selling and administrative expenses | 1,370,076 | | | 1,199,620 | | | 1,559,253 | |
| Depreciation and amortization expenses | Depreciation and amortization expenses | 1,292,878 | | | 1,279,254 | | | 1,245,942 | |
| Impairment and credit losses | 82,001 | | | 1,566,380 | | | — | |
| Operating (Loss) Income | (3,870,334) | | | (4,601,557) | | | 2,082,701 | |
| Operating Income (Loss) | |
| Other income (expense): | Other income (expense): | | | | | |
| Interest income | Interest income | 16,773 | | | 21,036 | | | 26,945 | |
| Interest income | |
| Interest income | |
| Interest expense, net of interest capitalized | Interest expense, net of interest capitalized | (1,291,753) | | | (844,238) | | | (408,513) | |
| Equity investment (loss) income | (135,469) | | | (213,286) | | | 230,980 | |
Other income (expense) (1) | 20,284 | | | (137,085) | | | (24,513) | |
| (1,390,165) | | | (1,173,573) | | | (175,101) | |
| Net (Loss) Income | (5,260,499) | | | (5,775,130) | | | 1,907,600 | |
| Equity investment income (loss) | |
Other (expense) income (1) | |
| (1,174) | |
| Net Income (Loss) | |
| Less: Net Income attributable to noncontrolling interest | Less: Net Income attributable to noncontrolling interest | — | | | 22,332 | | | 28,713 | |
| Net (Loss) Income attributable to Royal Caribbean Cruises Ltd. | $ | (5,260,499) | | | $ | (5,797,462) | | | $ | 1,878,887 | |
| (Loss) Earnings per Share: | |
| Net Income (Loss) attributable to Royal Caribbean Cruises Ltd. | |
| Earnings (Loss) per Share: | |
| Basic | |
| Basic | |
| Basic | Basic | $ | (20.89) | | | $ | (27.05) | | | $ | 8.97 | |
| Diluted | Diluted | $ | (20.89) | | | $ | (27.05) | | | $ | 8.95 | |
| Comprehensive (Loss) Income | | | | | |
| Net (Loss) Income | $ | (5,260,499) | | | $ | (5,775,130) | | | $ | 1,907,600 | |
| Comprehensive Income (Loss) | |
| Net Income (Loss) | |
| Net Income (Loss) | |
| Net Income (Loss) | |
| Other comprehensive income (loss): | Other comprehensive income (loss): | |
| Foreign currency translation adjustments | Foreign currency translation adjustments | 15,703 | | | 40,346 | | | 869 | |
| Foreign currency translation adjustments | |
| Foreign currency translation adjustments | |
| Change in defined benefit plans | Change in defined benefit plans | 8,707 | | | (19,984) | | | (19,535) | |
| Gain (loss) on cash flow derivative hedges | 4,046 | | | 38,010 | | | (151,313) | |
| Total other comprehensive income (loss) | 28,456 | | | 58,372 | | | (169,979) | |
| Comprehensive (Loss) Income | $ | (5,232,043) | | | $ | (5,716,758) | | | $ | 1,737,621 | |
| (Loss) Gain on cash flow derivative hedges | |
| Total other comprehensive (loss) income | |
| Comprehensive Income (Loss) | |
| Less: Comprehensive Income attributable to noncontrolling interest | Less: Comprehensive Income attributable to noncontrolling interest | — | | | 22,332 | | | 28,713 | |
| Comprehensive (Loss) Income attributable to Royal Caribbean Cruises Ltd. | $ | (5,232,043) | | | $ | (5,739,090) | | | $ | 1,708,908 | |
| Comprehensive Income (Loss) attributable to Royal Caribbean Cruises Ltd. | |
____________________________________________________________
(1) Including a $62.6 million net loss related to the 2021 elimination of the Silversea Cruises reporting lag.lag for the year ended December 31, 2021.
F-6The accompanying notes are an integral part of these consolidated financial statements.
F-4
ROYAL CARIBBEAN CRUISES LTD.
CONSOLIDATED BALANCE SHEETS
(in millions, except share data)
| | | | | | | | | | | |
| As of December 31, |
| 2023 | | 2022 |
| Assets | | | |
| Current assets | | | |
| Cash and cash equivalents | $ | 497 | | | $ | 1,935 | |
| Trade and other receivables, net of allowances of $6.6 and $11.6 at December 31, 2023 and December 31, 2022, respectively | 405 | | | 531 | |
| Inventories | 248 | | | 224 | |
| Prepaid expenses and other assets | 617 | | | 456 | |
| Derivative financial instruments | 25 | | | 59 | |
| Total current assets | 1,792 | | | 3,205 | |
| Property and equipment, net | 30,114 | | | 27,546 | |
| Operating lease right-of-use assets | 611 | | | 538 | |
| Goodwill | 809 | | | 809 | |
| Other assets, net of allowances of $42.7 and $71.6 at December 31, 2023 and December 31, 2022, respectively | 1,805 | | | 1,678 | |
| Total assets | $ | 35,131 | | | $ | 33,776 | |
| Liabilities and shareholders' equity | | | |
| Current liabilities | | | |
| Current portion of long-term debt | $ | 1,720 | | | $ | 2,088 | |
| Current portion of operating lease liabilities | 65 | | | 80 | |
| Accounts payable | 792 | | | 647 | |
| Accrued expenses and other liabilities | 1,478 | | | 1,459 | |
| Derivative financial instruments | 35 | | | 131 | |
| Customer deposits | 5,311 | | | 4,168 | |
| Total current liabilities | 9,401 | | | 8,573 | |
| Long-term debt | 19,732 | | | 21,303 | |
| Long-term operating lease liabilities | 613 | | | 523 | |
| Other long-term liabilities | 486 | | | 508 | |
| Total liabilities | 30,232 | | | 30,907 | |
| Commitments and Contingencies (Note 17) | | | |
| Shareholders' equity | | | |
| Preferred stock ($0.01 par value; 20,000,000 shares authorized; none outstanding) | — | | | — | |
| Common stock ($0.01 par value; 500,000,000 shares authorized; 284,672,386 and 283,257,102 shares issued, December 31, 2023 and December 31, 2022, respectively) | 3 | | | 3 | |
| Paid-in capital | 7,474 | | | 7,285 | |
| Accumulated deficit | (10) | | | (1,707) | |
| Accumulated other comprehensive loss | (674) | | | (644) | |
| Treasury stock (28,248,125 and 28,018,385 common shares at cost, December 31, 2023 and December 31, 2022, respectively) | (2,069) | | | (2,068) | |
| Total shareholders’ equity attributable to Royal Caribbean Cruises Ltd | 4,724 | | | 2,869 | |
| Noncontrolling Interest | 175 | | | — | |
| Total shareholders' equity | 4,899 | | | 2,869 | |
| Total liabilities and shareholders’ equity | $ | 35,131 | | | $ | 33,776 | |
| | | | | | | | | | | |
| As of December 31, |
| 2021 | | 2020 |
| (in thousands, except share data) |
| Assets | | | |
| Current assets | | | |
| Cash and cash equivalents | $ | 2,701,770 | | | $ | 3,684,474 | |
| Trade and other receivables, net of allowances of $13,411 and $3,867 at December 31, 2021 and December 31, 2020, respectively | 408,067 | | | 284,149 | |
| Inventories | 150,224 | | | 118,703 | |
| Prepaid expenses and other assets | 286,026 | | | 154,339 | |
| Derivative financial instruments | 54,184 | | | 70,082 | |
| Total current assets | 3,600,271 | | | 4,311,747 | |
| Property and equipment, net | 25,907,949 | | | 25,246,595 | |
| Operating lease right-of-use assets | 542,128 | | | 599,985 | |
| Goodwill | 809,383 | | | 809,480 | |
| Other assets, net of allowances of $86,781 and $81,580 at December 31, 2021 and December 31, 2020, respectively | 1,398,624 | | | 1,497,380 | |
| Total assets | $ | 32,258,355 | | | $ | 32,465,187 | |
| Liabilities and shareholders' equity | | | |
| Current liabilities | | | |
| Current portion of long-term debt | $ | 2,243,131 | | | $ | 961,768 | |
| Commercial paper | — | | | 409,319 | |
| Current portion of operating lease liabilities | 68,922 | | | 102,677 | |
| Accounts payable | 545,978 | | | 353,422 | |
| Accrued interest | 251,974 | | | 252,668 | |
| Accrued expenses and other liabilities | 887,575 | | | 615,750 | |
| Derivative financial instruments | 127,236 | | | 56,685 | |
| Customer deposits | 3,160,867 | | | 1,784,832 | |
| Total current liabilities | 7,285,683 | | | 4,537,121 | |
| Long-term debt | 18,847,209 | | | 17,957,956 | |
| Long-term operating lease liabilities | 534,726 | | | 563,876 | |
| Other long-term liabilities | 505,181 | | | 645,565 | |
| Total liabilities | 27,172,799 | | | 23,704,518 | |
| Commitments and Contingencies (Note 17) | 0 | | 0 |
| Shareholders' equity | | | |
| Preferred stock ($0.01 par value; 20,000,000 shares authorized; none outstanding) | — | | | — | |
| Common stock ($0.01 par value; 500,000,000 shares authorized; 282,703,246 and 265,198,371 shares issued, December 31, 2021 and December 31, 2020, respectively) | 2,827 | | | 2,652 | |
| Paid-in capital | 7,557,297 | | | 5,998,574 | |
| Retained earnings | 302,276 | | | 5,562,775 | |
| Accumulated other comprehensive loss | (710,885) | | | (739,341) | |
| Treasury stock (27,882,987 and 27,799,775 common shares at cost, December 31, 2021 and December 31, 2020, respectively) | (2,065,959) | | | (2,063,991) | |
| Total shareholders' equity | 5,085,556 | | | 8,760,669 | |
| Total liabilities and shareholders’ equity | $ | 32,258,355 | | | $ | 32,465,187 | |
The accompanying notes are an integral part of these consolidated financial statements.
F-5
ROYAL CARIBBEAN CRUISES LTD.
CONSOLIDATED STATEMENTS OF CASH FLOWS
| | | | | | | | | | | | | | | | | |
| Year Ended December 31, |
| 2023 | | 2022 | | 2021 |
| (in millions) |
| Operating Activities | | | | | |
| Net Income (Loss) | $ | 1,704 | | | $ | (2,156) | | | $ | (5,260) | |
| Adjustments: | | | | | |
| Depreciation and amortization | 1,455 | | | 1,407 | | | 1,293 | |
| Net deferred income tax benefit | (8) | | | (22) | | | (43) | |
| (Gain) Loss on derivative instruments not designated as hedges | (19) | | | 100 | | | (1) | |
| Share-based compensation expense | 126 | | | 36 | | | 64 | |
| Equity investment (income) loss | (200) | | | (57) | | | 135 | |
| Amortization of debt issuance costs, discounts and premiums | 109 | | | 163 | | | 249 | |
| Loss on extinguishment of debt | 121 | | | 94 | | | 139 | |
| Changes in operating assets and liabilities: | | | | | |
| Decrease (increase) in trade and other receivables, net | 99 | | | (234) | | | (182) | |
| Increase in inventories | (24) | | | (74) | | | (35) | |
| Increase in prepaid expenses and other assets | (184) | | | (153) | | | (152) | |
| Increase in accounts payable | 124 | | | 75 | | | 189 | |
| Increase in accrued expenses and other liabilities | 13 | | | 352 | | | 233 | |
| Increase in customer deposits | 1,143 | | | 1,007 | | | 1,427 | |
| Other, net | 18 | | | (57) | | | 66 | |
| Net cash provided by (used in) operating activities | 4,477 | | | 481 | | | (1,878) | |
| Investing Activities | | | | | |
| Purchases of property and equipment | (3,897) | | | (2,710) | | | (2,230) | |
| Cash received on settlement of derivative financial instruments | 35 | | | 53 | | | 44 | |
| Cash paid on settlement of derivative financial instruments | (86) | | | (356) | | | (74) | |
| Investments in and loans to unconsolidated affiliates | (31) | | | — | | | (70) | |
| Cash received on loans to unconsolidated affiliates | 40 | | | 19 | | | 31 | |
| Proceeds from the sale of property and equipment and other assets | 13 | | | — | | | 176 | |
| Other, net | 3 | | | 7 | | | (22) | |
| Net cash used in investing activities | (3,923) | | | (2,987) | | | (2,145) | |
| |
| Financing Activities | | | | | |
| Debt proceeds | 7,641 | | | 9,787 | | | 4,468 | |
| Debt issuance costs | (194) | | | (252) | | | (202) | |
| Repayments of debt | (9,566) | | | (7,729) | | | (2,297) | |
| Premium on repayment of debt | (80) | | | (49) | | | (135) | |
| Repayments of commercial paper notes | — | | | — | | | (415) | |
| Proceeds from common stock issuances | — | | | — | | | 1,622 | |
| Proceeds from sale of noncontrolling interest | 209 | | | — | | | — | |
| Other, net | (3) | | | (16) | | | — | |
| Net cash (used in) provided by financing activities | (1,993) | | | 1,741 | | | 3,041 | |
The accompanying notes are an integral part of these consolidated financial statements.
F-6
ROYAL CARIBBEAN CRUISES LTD.
CONSOLIDATED STATEMENTS OF CASH FLOWS - CONTINUED
| | | | | | | | | | | | | | | | | |
| Year Ended December 31, |
| 2023 | | 2022 | | 2021 |
| (in millions) |
| Effect of exchange rate changes on cash | 1 | | | (2) | | | — | |
| Net decrease in cash and cash equivalents | (1,438) | | | (767) | | | (982) | |
| Cash and cash equivalents at beginning of year | 1,935 | | | 2,702 | | | 3,684 | |
| Cash and cash equivalents at end of year | $ | 497 | | | $ | 1,935 | | | $ | 2,702 | |
| Supplemental Disclosures | | | | | |
| Cash paid during the year for: | | | | | |
| Interest, net of amount capitalized | $ | 1,442 | | | $ | 960 | | | $ | 834 | |
| Non-Cash Investing Activities | | | | | |
| Notes receivable issued upon sale of property and equipment and other assets | $ | — | | | $ | — | | | $ | 16 | |
| Purchases of property and equipment included in accounts payable and accrued expenses and other liabilities | $ | 50 | | | $ | 34 | | | $ | 14 | |
| Acquisition of property and equipment from assumed debt | $ | — | | | $ | 277 | | | $ | — | |
| Non-Cash Financing Activities | | | | | |
| Debt related to acquisition of property and equipment | $ | — | | | $ | 277 | | | $ | — | |
The accompanying notes are an integral part of these consolidated financial statements.
F-7
| | | | | | | | | | | | | | | | | | | | | | | |
| Year Ended December 31, | | |
| 2021 | | 2020 | | 2019 | | |
| (in thousands) | | |
| Operating Activities | | | | | | | |
| Net (Loss) Income | $ | (5,260,499) | | | $ | (5,775,130) | | | $ | 1,907,600 | | | |
| Adjustments: | | | | | | | |
| Depreciation and amortization | 1,292,878 | | | 1,279,254 | | | 1,245,942 | | | |
| Impairment and credit losses | 82,001 | | | 1,566,380 | | | — | | | |
| Net deferred income tax (benefit) expense | (42,979) | | | (8,791) | | | 7,745 | | | |
| (Gain) loss on derivative instruments not designated as hedges | (1,492) | | | 49,316 | | | (1,431) | | | |
| Share-based compensation expense | 63,638 | | | 39,779 | | | 75,930 | | | |
| Equity investment loss (income) | 135,469 | | | 213,286 | | | (230,980) | | | |
| Amortization of debt issuance costs | 125,116 | | | 89,442 | | | 31,991 | | | |
| Amortization of debt discounts and premiums | 123,439 | | | 66,776 | | | 31,616 | | | |
| Loss on extinguishment of debt | 138,759 | | | 41,109 | | | 6,326 | | | |
| Currency translation adjustment losses | — | | | 69,044 | | | — | | | |
| Change in fair value of contingent consideration | — | | | (45,126) | | | 18,400 | | | |
| Changes in operating assets and liabilities: | | | | | | | |
| (Increase) decrease in trade and other receivables, net | (181,707) | | | 121,055 | | | (9,898) | | | |
| (Increase) decrease in inventories | (34,527) | | | 27,077 | | | (8,533) | | | |
| (Increase) decrease in prepaid expenses and other assets | (152,071) | | | 295,876 | | | 15,669 | | | |
| Increase (decrease) in accounts payable | 188,518 | | | (133,815) | | | 75,281 | | | |
| (Decrease) increase in accrued interest | (694) | | | 182,578 | | | (4,460) | | | |
| Increase (decrease) in accrued expenses and other liabilities | 235,446 | | | (180,479) | | | 96,490 | | | |
| Increase (decrease) in customer deposits | 1,426,647 | | | (1,643,560) | | | 280,139 | | | |
| Dividends received from unconsolidated affiliates | — | | | 2,215 | | | 150,177 | | | |
| Other, net | (15,757) | | | 12,061 | | | 28,362 | | | |
| Net cash (used in) provided by operating activities | (1,877,815) | | | (3,731,653) | | | 3,716,366 | | | |
| Investing Activities | | | | | | | |
| Purchases of property and equipment | (2,229,704) | | | (1,965,131) | | | (3,024,663) | | | |
| Cash received on settlement of derivative financial instruments | 44,492 | | | 15,874 | | | 7,621 | | | |
| Cash paid on settlement of derivative financial instruments | (74,249) | | | (161,335) | | | (68,836) | | | |
| Investments in and loans to unconsolidated affiliates | (70,228) | | | (100,609) | | | (25,569) | | | |
| Cash received on loans to unconsolidated affiliates | 31,334 | | | 21,086 | | | 32,870 | | | |
| Proceeds from the sale of property and equipment and other assets | 176,039 | | | 27,796 | | | — | | | |
| Other, net | (22,423) | | | (16,247) | | | (12,829) | | | |
| Net cash used in investing activities | (2,144,739) | | | (2,178,566) | | | (3,091,406) | | | |
| | | | | | | |
| | | | | | | |
CONSOLIDATED STATEMENTS OF SHAREHOLDERS' EQUITY | | | | | | | | | | | | | | | | | | | | | | | | | | | | | | | | | | | | | | | | | |
| Common Stock | | Paid-in Capital | | Retained Earnings (Accumulated Deficit) | | Accumulated Other Comprehensive Income (Loss) | | Treasury Stock | | Noncontrolling Interest | | Total Shareholders' Equity |
| (in millions) |
| Balances at January 1, 2021 | $ | 3 | | | $ | 5,999 | | | $ | 5,563 | | | $ | (740) | | | $ | (2,064) | | | $ | — | | | $ | 8,761 | |
| Activity related to employee stock plans | — | | | 63 | | | — | | | — | | | — | | | — | | | 63 | |
| Common stock issuance | — | | | 1,496 | | | — | | | — | | | — | | | — | | | 1,496 | |
| Changes related to cash flow derivative hedges | — | | | — | | | — | | | 4 | | | — | | | — | | | 4 | |
| Change in defined benefit plans | — | | | — | | | — | | | 9 | | | — | | | — | | | 9 | |
| Foreign currency translation adjustments | — | | | — | | | — | | | 16 | | | — | | | — | | | 16 | |
| Purchases of treasury stock | — | | | — | | | — | | | — | | | (2) | | | — | | | (2) | |
| Net Loss attributable to Royal Caribbean Cruises Ltd. | — | | | — | | | (5,260) | | | — | | | — | | | — | | | (5,260) | |
| Balances at December 31, 2021 | $ | 3 | | | $ | 7,558 | | | $ | 303 | | | $ | (711) | | | $ | (2,066) | | | $ | — | | | $ | 5,087 | |
| Activity related to employee stock plans | — | | | 35 | | | — | | | — | | | — | | | — | | | 35 | |
| Cumulative effect of adoption of Accounting Standards Update 2020-06 | — | | | (308) | | | 146 | | | — | | | — | | | — | | | (162) | |
| Changes related to cash flow derivative hedges | — | | | — | | | — | | | 8 | | | — | | | — | | | 8 | |
| Change in defined benefit plans | — | | | — | | | — | | | 49 | | | — | | | — | | | 49 | |
| Foreign currency translation adjustments | — | | | — | | | — | | | 10 | | | — | | | — | | | 10 | |
| Purchases of treasury stock | — | | | — | | | — | | | — | | | (2) | | | — | | | (2) | |
| Net Loss attributable to Royal Caribbean Cruises Ltd. | — | | | — | | | (2,156) | | | — | | | — | | | — | | | (2,156) | |
| Balances at December 31, 2022 | $ | 3 | | | $ | 7,285 | | | $ | (1,707) | | | $ | (644) | | | $ | (2,068) | | | $ | — | | | $ | 2,869 | |
| Activity related to employee stock plans | — | | | 130 | | | — | | | — | | | — | | | — | | | 130 | |
| Convertible notes settlements | — | | | 13 | | | — | | | — | | | — | | | — | | | 13 | |
| Changes related to cash flow derivative hedges | — | | | — | | | — | | | (27) | | | — | | | — | | | (27) | |
| Change in defined benefit plans | — | | | — | | | — | | | 6 | | | — | | | — | | | 6 | |
| Foreign currency translation adjustments | — | | | — | | | — | | | (9) | | | — | | | — | | | (9) | |
| Purchases of treasury stock | — | | | — | | | — | | | — | | | (1) | | | — | | | (1) | |
| Sale of noncontrolling interests | — | | | 46 | | | — | | | — | | | — | | | 174 | | | 220 | |
| Net Income attributable to Noncontrolling interests | — | | | — | | | — | | | — | | | — | | | 7 | | | 7 | |
| Dividends from noncontrolling interests | — | | | — | | | — | | | — | | | — | | | (6) | | | (6) | |
| Net Income attributable to Royal Caribbean Cruises Ltd. | — | | | — | | | 1,697 | | | — | | | — | | | — | | | 1,697 | |
| Balances at December 31, 2023 | $ | 3 | | | $ | 7,474 | | | $ | (10) | | | $ | (674) | | | $ | (2,069) | | | $ | 175 | | | $ | 4,899 | |
The accompanying notes are an integral part of these consolidated financial statements.
F-8
ROYAL CARIBBEAN CRUISES LTD.
CONSOLIDATED STATEMENTS OF CASH FLOWS
| | | | | | | | | | | | | | | | | | | | | | | |
| Year Ended December 31, | | |
| 2021 | | 2020 | | 2019 | | |
| (in thousands) | | |
| Financing Activities | | | | | | | |
| Debt proceeds | 4,467,789 | | | 13,547,189 | | | 3,525,564 | | | |
| Debt issuance costs | (201,698) | | | (374,715) | | | (50,348) | | | |
| Repayments of debt | (2,296,990) | | | (3,845,133) | | | (4,060,244) | | | |
| Premium on repayment of debt | (135,372) | | | — | | | — | | | |
| Proceeds from issuance of commercial paper notes | — | | | 6,765,816 | | | 26,240,540 | | | |
| Repayments of commercial paper notes | (414,570) | | | (7,837,635) | | | (25,613,111) | | | |
| Purchase of treasury stock | — | | | — | | | (99,582) | | | |
| Dividends paid | — | | | (326,421) | | | (602,674) | | | |
| Proceeds from common stock issuances | 1,621,860 | | | 1,431,375 | | | — | | | |
| Other, net | (442) | | | (10,688) | | | (10,516) | | | |
| Net cash provided by (used in) financing activities | 3,040,577 | | | 9,349,788 | | | (670,371) | | | |
| Effect of exchange rate changes on cash | (727) | | | 1,167 | | | 1,297 | | | |
| Net (decrease) increase in cash and cash equivalents | (982,704) | | | 3,440,736 | | | (44,114) | | | |
| Cash and cash equivalents at beginning of year | 3,684,474 | | | 243,738 | | | 287,852 | | | |
| Cash and cash equivalents at end of year | $ | 2,701,770 | | | $ | 3,684,474 | | | $ | 243,738 | | | |
| Supplemental Disclosures | | | | | | | |
| Cash paid during the year for: | | | | | | | |
| Interest, net of amount capitalized | $ | 834,245 | | | $ | 418,164 | | | $ | 246,312 | | | |
| Non-Cash Investing Activities | | | | | | | |
| Notes receivable issued upon sale of property and equipment and other assets | $ | 16,000 | | | $ | 53,419 | | | $ | — | | | |
| Purchases of property and equipment included in accounts payable and accrued expenses and other liabilities | $ | 14,097 | | | $ | 16,189 | | | $ | 86,155 | | | |
| Non-Cash Financing Activities | | | | | | | |
| Purchase of Silversea Cruises non-controlling interest | $ | — | | | $ | 592,313 | | | $ | — | | | |
| Termination of Silversea Cruises contingent consideration obligation | $ | — | | | $ | 16,564 | | | $ | — | | | |
| Common stock issuances pending cash settlement and included in trade receivables | $ | — | | | $ | 121,352 | | | $ | — | | | |
The accompanying notes are an integral part of these consolidated financial statements.
F-9
ROYAL CARIBBEAN CRUISES LTD.
CONSOLIDATED STATEMENTS OF CASH FLOWS - CONTINUED
ROYAL CARIBBEAN CRUISES LTD.
CONSOLIDATED STATEMENTS OF SHAREHOLDERS' EQUITY | | | | | | | | | | | | | | | | | | | | | | | | | | | | | | | | | | | |
| Common Stock | | Paid-in Capital | | Retained Earnings | | Accumulated Other Comprehensive Income (Loss) | | Treasury Stock | | Total Shareholders' Equity |
| (in thousands, except per share data) |
| Balances at January 1, 2019 | $ | 2,358 | | | $ | 3,420,900 | | | $ | 10,263,282 | | | $ | (627,734) | | | $ | (1,953,345) | | | $ | 11,105,461 | |
| Activity related to employee stock plans | 7 | | | 73,059 | | | — | | | — | | | (5,164) | | | 67,902 | |
| Common stock dividends, $2.96 per share | — | | | — | | | (618,843) | | | — | | | — | | | (618,843) | |
| Changes related to cash flow derivative hedges | — | | | — | | | — | | | (151,313) | | | — | | | (151,313) | |
| Change in defined benefit plans | — | | | — | | | — | | | (19,535) | | | — | | | (19,535) | |
| Foreign currency translation adjustments | — | | | — | | | — | | | 869 | | | — | | | 869 | |
| Purchases of treasury stock | — | | | — | | | — | | | — | | | (99,582) | | | (99,582) | |
| Net Income attributable to Royal Caribbean Cruises Ltd. | — | | | — | | | 1,878,887 | | | — | | | — | | | 1,878,887 | |
| Balances at December 31, 2019 | 2,365 | | | 3,493,959 | | | 11,523,326 | | | (797,713) | | | (2,058,091) | | | 12,163,846 | |
| Activity related to employee stock plans | 9 | | | 29,750 | | | — | | | — | | | — | | | 29,759 | |
| Common stock issuance | 226 | | | 1,552,500 | | | | | | | | | 1,552,726 | |
| Equity component of convertible notes, net of issuance costs | — | | | 307,640 | | | — | | | — | | | — | | | 307,640 | |
| Acquisition of Silversea non-controlling interest | 52 | | | 608,825 | | | — | | | — | | | — | | | 608,877 | |
| Common stock dividends, $0.78 per share | — | | | — | | | (163,089) | | | — | | | — | | | (163,089) | |
| Changes related to cash flow derivative hedges | — | | | — | | | — | | | 38,010 | | | — | | | 38,010 | |
| Change in defined benefit plans | — | | | — | | | — | | | (19,984) | | | — | | | (19,984) | |
| Foreign currency translation adjustments | — | | | — | | | — | | | 40,346 | | | — | | | 40,346 | |
| Purchases of treasury stock | — | | | 5,900 | | | — | | | — | | | (5,900) | | | — | |
| Net Income attributable to Royal Caribbean Cruises Ltd. | — | | | — | | | (5,797,462) | | | — | | | — | | | (5,797,462) | |
| Balances at December 31, 2020 | 2,652 | | | 5,998,574 | | | 5,562,775 | | | (739,341) | | | (2,063,991) | | | 8,760,669 | |
| Activity related to employee stock plans | 5 | | | 62,991 | | | — | | | — | | | — | | | 62,996 | |
| Common stock issuance | 170 | | | 1,495,732 | | | — | | | — | | | — | | | 1,495,902 | |
| Changes related to cash flow derivative hedges | — | | | — | | | — | | | 4,046 | | | — | | | 4,046 | |
| Change in defined benefit plans | — | | | — | | | — | | | 8,707 | | | — | | | 8,707 | |
| Foreign currency translation adjustments | — | | | — | | | | | 15,703 | | | — | | | 15,703 | |
| Purchases of treasury stock | — | | | — | | | — | | | — | | | (1,968) | | | (1,968) | |
| Net Loss attributable to Royal Caribbean Cruises Ltd. | — | | | — | | | (5,260,499) | | | — | | | — | | | (5,260,499) | |
| Balances at December 31, 2021 | $ | 2,827 | | | $ | 7,557,297 | | | $ | 302,276 | | | $ | (710,885) | | | $ | (2,065,959) | | | $ | 5,085,556 | |
The accompanying notes are an integral part of these consolidated financial statements.
F-10
ROYAL CARIBBEAN CRUISES LTD.
NOTES TO THE CONSOLIDATED FINANCIAL STATEMENTS
Note 1. General
Description of Business
We are a global cruise company. We own and operate 3three global cruise brands: Royal Caribbean International, Celebrity Cruises and Silversea Cruises (collectively, our "Global Brands"). We also own a 50% joint venture interest in TUI Cruises GmbH ("TUIC"), which operates the German brands TUI Cruises and Hapag-Lloyd Cruises (collectively, our "Partner Brands"). We account for our investments in our Partner Brands under the equity method of accounting. Together, our Global Brands and our Partner Brands operated a combined 61fleet of 64 ships as of December 31, 2021.2023. Our ships offer a selection of worldwide itineraries that call on more than 1,000 destinations in over 120 countries on all 7seven continents.
Management's Plan and Liquidity
We have restarted our global cruise operations in a phased manner, following our voluntary suspension of global cruise operations that commenced in March of 2020 in response to the COVID-19 pandemic. Our return to service efforts incorporate our enhanced health and safety protocols, and the requirements of regulatory agencies, which has resulted in reduced guest occupancy, modified itineraries and vaccination protocols.
By the end of December 2021, we operated 50 of our Global and Partner Brand ships, representing over 85% of our fleet's capacity, and carried approximately 1.3 million guests since we resumed operations. We expect to operate approximately 95% of our planned capacity in the first quarter of 2022. Additionally, we expect that the rest of the fleet will return to operations before the summer season.
Uncertainties remain as to the specifics, timing and costs of administering and implementing our health and safety measures, some of which may be significant. Based on our assessment of these requirements and recommendations, the status of COVID-19 infection, and its related variants, and/or vaccination rates in the U.S. or globally or for other reasons, we may determine it necessary to cancel or modify certain of our Global Brands’ cruise sailings. We believe the impact to our global bookings resulting from COVID-19 will continue to have a material negative impact on our results of operations and liquidity, which may be prolonged beyond containment of the disease and its variants.
Significant events affecting travel, including COVID-19 and our gradual resumption of cruise operations, typically have an impact on the booking pattern for cruise vacations, with the full extent of the impact generally determined by the length of time the event influences travel decisions. The estimation of our future liquidity requirements include numerous assumptions that are subject to various risks and uncertainties. The principal assumptions used to estimate our future liquidity requirements consist of:
•Expected continued gradual resumption of cruise operations;
•Expected sustained increase in revenue per available passenger cruise day during our continued resumption of cruise operations;
•Expected lower than comparable historical occupancy levels during our continued resumption of cruise operations, increasing over time until we reach historical occupancy levels; and
•Expected spend during our continued resumption of cruise operations, including returning our crew members to our vessels and maintaining enhanced health and safety protocols.
There can be no assurance that our assumptions and estimates are accurate due to possible variables, including, but not limited to, the uncertainties associated with regulatory requirements and recommendations, subsequent changes to and/or enforceability of those requirements and recommendations, our ability to meet the requirements and recommendations, and whether efforts by countries to contain the disease and its variants will further restrict our ability to resume operations. We have implemented a number of proactive measures to mitigate the financial and operational impacts of COVID-19, including reduction of capital expenditures and operating expenses, the issuance of debt and shares of our common stock, the amendment of credit agreements to defer payments, the waiver and/or modification of covenant requirements and the suspension of
The accompanying notes are an integral part of these consolidated financial statements.
F-11
dividend payments. Additionally, we expect to continue to pursue refinancing opportunities to reduce interest expense and extend maturities.
As of December 31, 2021, we had liquidity of $3.5 billion, including $0.1 billion of undrawn revolving credit facility capacity, $2.7 billion in cash and cash equivalents and a $0.7 billion commitment for a 364-day term loan facility. Our revolving credit facilities were mostly utilized through a combination of amounts drawn and letters of credit issued under the facilities as of December 31, 2021. We temporarily applied the net proceeds of the $1.0 billion January 2022 Unsecured Notes to repay borrowings under our revolving credit facilities, bringing our undrawn revolving credit facility capacity to $1.1 billion as of the date of the issuance of this report, from $0.1 billion as of December 31, 2021.
During the fourth quarter of 2021, we amended $7.3 billion of outstanding export-credit financing plus committed export-credit facilities to modify financial covenant levels for 2023 and 2024, following the waiver period through and including the fourth quarter of 2022. Refer to Note 8. Debt for further discussion on the $1.0 billion senior notes issued in January of 2022, our 2021 financing activities, and for further information regarding the amendments made to our debt facilities and credit card processing agreements, including related covenants. As of December 31, 2021, we were in compliance with our financial covenants.
Based on our assumptions regarding the impact of COVID-19 and our resumption of operations, as well as our present financial condition, we believe that we have sufficient financial resources to fund our obligations for at least the next twelve months from the issuance of these financial statements.
Beyond the next 12 months, in June of 2023, approximately $3.2 billion of long- term debt will need to be refinanced in order to maintain the Company's liquidity position.
In February 2022, we entered into certain agreements with Morgan Stanley & Co., LLC (“MS”) where MS agrees to provide backstop committed financing to refinance, repurchase and/or repay in whole or in part our existing and outstanding 10.875% Senior Secured Notes due 2023, 9.125% Priority Guaranteed Notes due 2023, and 4.25% Convertible Notes due 2023. Pursuant to the agreements, we may, at our sole option, issue and sell to MS (subject to the satisfaction of certain conditions) five-year senior unsecured notes with gross proceeds of up to $3.15 billion at any time between April 1, 2023 and June 29, 2023, to refinance the aforementioned notes.
If the Company is unable to maintain the required minimum level of liquidity or negotiate its minimum liquidity requirements, it could have a significant adverse effect on the Company’s business, financial condition and operating results.
Basis for Preparation of Consolidated Financial Statements
The consolidated financial statements are prepared in accordance with accounting principles generally accepted in the United States of America ("GAAP"). Estimates are required for the preparation of financial statements in accordance with these principles. Actual results could differ from these estimates. Refer to Note 2. Summary of Significant Accounting Policies for a discussion of our significant accounting policies. The Company has changed its presentation from thousands to millions and, as a result, any necessary rounding adjustments have been made to prior period disclosed amounts.
All significant intercompany accounts and transactions are eliminated in consolidation. We consolidate entities over which we have control, usually evidenced by a direct ownership interest of greater than 50%, and variable interest entities where we are determined to be the primary beneficiary. Refer to Note 77.. Investments and Other Assets for further information regarding our variable interest entities. For affiliates we do not control but over which we have significant influence on financial and operating policies, usually evidenced by a direct ownership interest from 20% to 50%, the investment is accounted for using the equity method.
Effective March 19, 2021, we sold our wholly-owned brand, Azamara Cruises ("Azamara"), including its 3-shipthree-ship fleet and associated intellectual property, to Sycamore Partners for $201 million, before closing adjustments. The March 2021 sale of Azamara doesdid not represent a strategic shift that will have a major effect on our operations and financial results, as we continue to provide similar itineraries to and source passengers from the markets served by the Azamara business. Therefore, the sale of Azamara did not meet the criteria for discontinued operations reporting. Effective March 19, 2021, we no longer consolidate Azamara's balance sheet nor recognize its results of operations in our consolidated financial statements. We recognized an immaterial gain on the sale during the quarter ended March 31, 2021 and have agreed to provide certain transition services to Azamara for a period of time for a fee.
On July 9, 2020, we acquired the remaining 33.3% interest in Silversea Cruises that we did not already own from Heritage Cruise Holding Ltd. As a result of the acquisition of the noncontrolling interest, Silversea Cruises is now a wholly owned cruise brand. As consideration for the noncontrolling interest, we issued to Heritage 5.2 million shares of common stock, par value
The accompanying notes are an integral part of these consolidated financial statements.
F-12
ROYAL CARIBBEAN CRUISES LTD.
NOTES TO THE CONSOLIDATED FINANCIAL STATEMENTS (Continued)
$0.01 per share, of Royal Caribbean Cruises Ltd. Pursuant to the agreement governing the acquisition, among other things, the parties terminated any existing obligation to issue Heritage any contingent consideration, at fair value, in connection with our acquisition of a 66.7% interest in Silversea Cruises on July 31, 2018. The share purchase did not result in a change of control. The purchase was accounted for as an equity transaction and no gain or loss was recognized in earnings.2021.
Prior to October 1, 2021, we consolidated the operating results of Silversea Cruises on a three-month reporting lag to allow for more timely preparation of our consolidated financial statements. Effective October 1, 2021, we eliminated the three-month reporting lag to reflect Silversea Cruises' financial position, results of operations and cash flows concurrently and consistently with the fiscal calendar of the Company ("elimination of the Silversea reporting lag"). The elimination of the Silversea reporting lag represents a change in accounting principle, which we believe to be preferable, because it provides more current information to the users of our financial statements. A change in accounting principle requires retrospective application, if material. The impact of the elimination of the reporting lag was immaterial to prior periods and is immaterial for our fiscal year ended December 31, 2021. As a result, we have accounted for this change in accounting principle in our consolidated results for the year ended December 31, 2021. Accordingly, the results of Silversea Cruises from October 1, 2020 to December 31, 2021 are included in our consolidated statement of comprehensive loss for the year ended December 31, 2021. To effect the change, we have reflected the third quarter 2021 operating results for Silversea Cruises, which were a net loss of $62.6 million within Other (expense) income (expense) in our consolidated statement of comprehensive loss for the year ended December 31, 2021.
Note 2. Summary of Significant Accounting Policies
Revenues and Expenses
Deposits received on sales of passenger cruises are initially recorded as customer deposit liabilities on our balance sheet. Customer deposits are subsequently recognized as passenger ticket revenues, together with revenues from onboard and other goods and services and all associated cruise operating expenses of a voyage. For further information on revenue recognition, refer to Note 3. Revenue.
ROYAL CARIBBEAN CRUISES LTD.
NOTES TO THE CONSOLIDATED FINANCIAL STATEMENTS (Continued)
Cash and Cash Equivalents
Cash and cash equivalents include cash and marketable securities with original maturities of less than 90 days.
Inventories
Inventories consist of provisions, supplies and fuel carried at the lower of cost (weighted-average) or net realizable value.
Property and Equipment
Property and equipment are stated at cost less accumulated depreciation and amortization. We capitalize interest as part of the cost of acquiring certain assets. Improvement costs that we believe add value to our ships are capitalized as additions to the ship, the useful lives of the improvements are estimated and depreciated over the shorter of the improvements' estimated useful lives or that of the associated ship, and the replaced assets are disposed of on a net cost basis. In addition, we capitalize interest on borrowings during the active construction period of capital projects. Capitalized interest is added to the cost of the assets and depreciated over the estimated useful lives of the assets. The estimated cost and accumulated depreciation of replaced or refurbished ship components are written off and any resulting losses are recognized in Cruise operating expenses. Liquidated damages received from shipyards as a result of the late delivery of a new ship are recorded as reductions to the cost basis of the ship.
Depreciation of property and equipment is computed using the straight-line method over the estimated useful life of the asset. The useful lives of our ships are generally 30-35 years, net of a 10%-15% projected residual value. The 30-35-year useful life and 10%-15% residual value are based on the weighted-average of all major components of a ship. Our useful life and residual value estimates take into consideration the impact of anticipated technological changes, environmental regulations, long-term cruise and vacation market conditions and historical useful lives of similarly-built ships. In addition, we take into consideration our estimates of the weighted-average useful lives of the ships' major component systems, such as hull, superstructure, main electric, engines and cabins. We employ a cost allocation methodology at the component level, in order to support the estimated weighted-average useful lives and residual values, as well as to determine the net cost basis of assets being replaced. Given the very large and complex nature of our ships, our accounting estimates related to ships and determinations of ship improvement costs to be capitalized require considerable judgment and are inherently uncertain. Depreciation for assets under finance leases is computed using the shorter of the lease term or related asset life, unless the asset is a finance lease due to title transferring or a purchase option that is reasonably certain of being exercised, in which case the asset is depreciated over the related asset life.
Depreciation of property and equipment is computed utilizing the following useful lives:
ROYAL CARIBBEAN CRUISES LTD.
NOTES TO THE CONSOLIDATED FINANCIAL STATEMENTS (Continued)
| | | | | |
| Years |
| Ships | generally, 30-35 |
| Ship improvements | 3-25 |
| Buildings and improvements | 10-40 |
| Computer hardware and software | 3-10 |
| Transportation equipment and other | 3-30 |
| Leasehold improvements | Shorter of remaining lease term or useful life 3-30 |
We periodically review estimated useful lives and residual values for ongoing reasonableness, considering long term views on our intended use of each class of ships and the planned level of improvements to maintain and enhance vessels within those classes. In the event a factor is identified that may trigger a change in the estimated useful lives and residual values of our ships, a review of the estimate is completed.
We review long-lived assets, including right-of-use assets for impairment whenever events or changes in circumstances indicate, based on estimated undiscounted future cash flows, that the carrying value of these assets may not be fully recoverable. For purposes of recognition and measurement of an impairment loss, long-lived assets are grouped with other assets and liabilities at the lowest level for which identifiable cash flows are largely independent of the cash flows of other assets and liabilities. The lowest level for which we maintain identifiable cash flows that are independent of the cash flows of other assets and liabilities is at the ship level for our ships. If estimated future cash flows are less than the carrying value of an asset, an impairment charge is recognized to the extent its carrying value exceeds fair value. Refer to Note 6. Property and Equipment for further information on determination of fair value for long-lived assets.
We use the deferral method to account for drydocking costs. Under the deferral method, drydocking costs incurred are deferred and charged to expense on a straight-line basis over the period to the next scheduled drydock, which we estimate to be
ROYAL CARIBBEAN CRUISES LTD.
NOTES TO THE CONSOLIDATED FINANCIAL STATEMENTS (Continued)
a period of thirty to sixty months based on the vessel's age as required by Class. Deferred drydock costs consist of the costs to drydock the vessel and other costs incurred in connection with the drydock which are necessary to maintain the vessel's Class certification. Class certification is necessary in order for our cruise ships to be flagged in a specific country, obtain liability insurance and legally operate as passenger cruise ships. The activities associated with those drydocking costs cannot be performed while the vessel is in service and, as such, are done during a drydock as a planned major maintenance activity. The significant deferred drydock costs consist of hauling and wharfage services provided by the drydock facility, hull inspection and related activities (e.g., scraping, pressure cleaning, bottom painting), maintenance to steering propulsion, thruster equipment and ballast tanks, port services such as tugs, pilotage and line handling, and freight associated with these items. We perform a detailed analysis of the various activities performed for each drydock and only defer those costs that are directly related to planned major maintenance activities necessary to maintain Class. The costs deferred are related to activities not otherwise routinely periodically performed to maintain a vessel's designed and intended operating capability. Repairs and maintenance activities are charged to expense as incurred.
Goodwill
Goodwill represents the excess of cost over the fair value of net tangible and identifiable intangible assets acquired. We review goodwill for impairment at the reporting unit level annually or, when events or circumstances dictate, more frequently. The impairment review for goodwill consists ofWe may first perform a qualitative assessment ofto determine whether it is more-likely-than-notmore likely than not that a reporting unit is impaired. When assessing goodwill for impairment, our decision to perform a qualitative assessment for an individual reporting unit is influenced by a number of factors, including the carrying value of the reporting unit's goodwill, the significance of the excess of the reporting unit's estimated fair value is less than itsover carrying value at the last quantitative assessment date, macroeconomic conditions, market conditions and if necessary,our operating performance.
If we do not perform a goodwill impairment test. Factors to consider when performing the qualitative assessment, include general economic conditions, limitations on accessing capital, changes in forecasted operating results, changes in fuel prices and fluctuations in foreign exchange rates. If the qualitative assessment demonstratesor if we determine that it is more-likely-than-notnot more likely than not that the estimated fair value of the reporting unit exceeds its carrying value, it is not necessary to performamount, we calculate the goodwill impairment test. We may elect to bypass the qualitative assessment and proceed directly to step one, for any reporting unit, in any period. On a periodic basis, we elect to bypass the qualitative assessment and proceed to step one to corroborate the results of recent years' qualitative assessments. We can resume the qualitative assessment for any reporting unit in any subsequent period.
The goodwill impairment analysis consists of a comparison of theestimated fair value of the reporting unit with its carrying value. We typically estimate the fair value of our reporting units using a discounted cash flow model,an income approach, which may also include a combination of a market-based valuation approach. The estimation of fair value utilizing a probability weighted discounted expected future cash flows includesflow model including numerous uncertainties which require our significant judgment when making assumptions of expected revenues, operating costs, marketing, selling and administrative expenses, interest rates, ship additions and retirements as well as
ROYAL CARIBBEAN CRUISES LTD.
NOTES TO THE CONSOLIDATED FINANCIAL STATEMENTS (Continued)
assumptions regarding the cruise vacation industry's competitive environment and general economic and business conditions, among other factors.conditions. The principal assumptions used in the probability weighted discounted cash flow model for our 20212023 impairment assessments were:assessment consisted of: (i) forecasted net revenues primarily the timing of returning to normalized operations,per available passenger cruise day, (ii) occupancy rates from existing and expected ship deliveries, andvessels, (iii) vessel operating expenses, (iv) terminal growth rate;rate, and (ii)(v) weighted average cost of capital (i.e., discount rate). The probability weighted discounted cash flow model uses the most current projected operating results for the upcoming fiscal year as a base. We discount the probability weighted projected cash flows using rates specific to the reporting unit based on its weighted-average cost of capital. If the fair value of the reporting unit exceeds its carrying value, no write-down of goodwill is required. If the fair value of the reporting unit is less than the carrying value of its net assets, an impairment is recognized based on the amount by which the carrying value of a reporting unit exceeds its fair value, not to exceed the total amount of goodwill allocated to such reporting unit.
Intangible Assets
In connection with our acquisitions, we have acquired certain intangible assets to which value has been assigned based on our estimates. Intangible assets that are deemed to have an indefinite life are not amortized, but are subject to an annual impairment test, or when events or circumstances dictate, more frequently. The impairment review for indefinite-life intangible assets can be performed using a qualitative or quantitative impairment assessment. The quantitative assessment consists of a comparison of the fair value of the asset with its carrying value. We estimate the fair value of these assets using a probability weighted discounted cash flow model and various valuation methods depending on the nature of the intangible asset, such as the relief-from-royalty method for trademarks and trade names. The principal assumptions used in the probability weighted discounted cash flowsflow model for our 20212023 impairment assessments were:assessment consisted of: (i) forecasted net revenues primarily the timing of returning to normalized operations,per available passenger cruise day, (ii) occupancy rates from existing and expected ship deliveries, andvessels, (iii) terminal growth rate; (ii)(iv) royalty rate; and (iii)(v) weighted average cost of capital (i.e., discount rate). If the carrying value exceeds its fair value, an impairment loss is recognized in an amount equal to that excess. If the fair value exceeds its carrying value, the indefinite-life intangible asset is not considered impaired.
Other intangible assets assigned finite useful lives are amortized on a straight-line basis over their estimated useful lives.
Contingencies — Litigation
On an ongoing basis, we assess the potential liabilities related to any lawsuits or claims brought against us. While it is typically difficult to determine the timing and ultimate outcome of such actions, we use our best judgment to determine if it is
ROYAL CARIBBEAN CRUISES LTD.
NOTES TO THE CONSOLIDATED FINANCIAL STATEMENTS (Continued)
probable that we will incur an expense related to the settlement or final adjudication of such matters and whether a reasonable estimation of such probable loss, if any, can be made. In assessing probable losses, we take into consideration estimates of the amount of insurance recoveries, if any, which are recorded as assets when recoverability is probable. We accrue a liability, including legal costs, when we believe a loss is probable and the amount of loss can be reasonably estimated. Due to the inherent uncertainties related to the eventual outcome of litigation and potential insurance recoveries, it is possible that certain matters may be resolved for amounts materially different from any provisions or disclosures that we have previously made.
Advertising Costs
Advertising costs are expensed as incurred except those costs which result in tangible assets, such as brochures, which are treated as prepaid expenses and charged to expense as consumed. Advertising costs consist of media and online advertising as well as brochure, production and direct mail costs.
Media advertising was $303.2$379 million, $138.1$380 million and $309.4$303 million, and brochure, production and direct mail costs were $88.9$127 million, $69.1$129 million and $156.0$89 million for the years ended December 31, 2021, 20202023, 2022 and 2019,2021, respectively.
Derivative Instruments
We enter into various forward, swap and option contracts to manage our interest rate exposure and to limit our exposure to fluctuations in foreign currency exchange rates and fuel prices. These instruments are recorded on the balance sheet at their fair value and the vast majority are designated as hedges. We also use non-derivative financial instruments designated as hedges of our net investment in our foreign operations and investments. Although certain of our derivative financial instruments do not qualify or are not accounted for under hedge accounting, our objective is not to hold or issue derivative financial instruments for trading or other speculative purposes.
At inception of the hedge relationship, a derivative instrument that hedges the exposure to changes in the fair value of a firm commitment or a recognized asset or liability is designated as a fair value hedge. A derivative instrument that hedges a forecasted transaction or the variability of cash flows related to a recognized asset or liability is designated as a cash flow hedge.
ROYAL CARIBBEAN CRUISES LTD.
NOTES TO THE CONSOLIDATED FINANCIAL STATEMENTS (Continued)
Changes in the fair value of derivatives that are designated as fair value hedges are offset against changes in the fair value of the underlying hedged assets, liabilities or firm commitments. Gains and losses on derivatives that are designated as cash flow hedges are recorded as a component of Accumulated other comprehensive loss until the underlying hedged transactions are recognized in earnings. The foreign currency transaction gain or loss of our non-derivative financial instruments and the changes in the fair value of derivatives designated as hedges of our net investment in foreign operations and investments are recognized as a component of Accumulated other comprehensive loss along with the associated foreign currency translation adjustment of the foreign operation or investment. In certain hedges of our net investment in foreign operations and investments, we exclude forward points from the assessment of hedge effectiveness and we amortize the related amounts directly into earnings.
On an ongoing basis, we assess whether derivatives used in hedging transactions are "highly effective" in offsetting changes in the fair value or cash flow of hedged items. For our net investment hedges, we use the dollar offset method to measure effectiveness. For all other hedging programs, we use the long-haul method to assess hedge effectiveness using regression analysis for each hedge relationship. The methodology for assessing hedge effectiveness is applied on a consistent basis for each one of our hedging programs (i.e., interest rate, foreign currency ship construction, foreign currency net investment and fuel). For our regression analyses, we use an observation period of up to three years, utilizing market data relevant to the hedge horizon of each hedge relationship. High effectiveness is achieved when a statistically valid relationship reflects a high degree of offset and correlation between the changes in the fair values of the derivative instrument and the hedged item. If it is determined that a derivative is not highly effective as a hedge or hedge accounting is discontinued, any change in fair value of the derivative since the last date at which it was determined to be effective is recognized in earnings.
Cash flows from derivative instruments that are designated as fair value or cash flow hedges are classified in the same category as the cash flows from the underlying hedged items.items in our consolidated statements of cash flows. In the event that hedge accounting is discontinued, cash flows subsequent to the date of discontinuance are classified within investing activities. Cash flows from derivative instruments not designated as hedging instruments are classified as investing activities.
We consider the classification of the underlying hedged item’s cash flows in determining the classification for the designated derivative instrument’s cash flows in our consolidated statements of cash flows. We classify derivative instrument cash flows from hedges of benchmark interest rate or hedges of fuel expense as operating activities due to the nature of the
ROYAL CARIBBEAN CRUISES LTD.
NOTES TO THE CONSOLIDATED FINANCIAL STATEMENTS (Continued)
hedged item. Likewise, we classify derivative instrument cash flows from hedges of foreign currency risk on our newbuild ship payments as investing activities.
Foreign Currency Translations and Transactions
We translate assets and liabilities of our foreign subsidiaries whose functional currency is the local currency, at exchange rates in effect at the balance sheet date. We translate revenues and expenses at weighted-average exchange rates for the period. Equity is translated at historical rates and the resulting foreign currency translation adjustments are included as a component of Accumulated other comprehensive loss, which is reflected as a separate component of Shareholders' equity. Exchange gains or losses arising from the remeasurement of monetary assets and liabilities denominated in a currency other than the functional currency of the entity involved are immediately included in our earnings, except for certain liabilities that have been designated to act as a hedge of a net investment in a foreign operation or investment. Exchange gains (losses) were $24.3 million, $(1.5) million and $0.4 million for the years ended December 31, 2021, 2020 and 2019, respectively, and were recorded within Other income (expense). The majority of our transactions are settled in United States dollars. Gains or losses resulting from transactions denominated in other currencies are recognized in income at each balance sheet date.
Concentrations of Credit Risk
We monitor our credit risk associated with financial and other institutions with which we conduct significant business and, to minimize these risks, we select counterparties with credit risks acceptable to us and we seek to limit our exposure to an individual counterparty. Credit risk, including but not limited to counterparty nonperformance under derivative instruments, our credit facilities and new ship progress payment guarantees, is not considered significant, as we primarily conduct business with large, well-established financial institutions, insurance companies and export credit agencies, many of which we have long-term relationships with and which have credit risks acceptable to us or where the credit risk is spread out among a large number of counterparties. As of December 31, 2021 and December 31, 2020, we had counterparty credit risk exposure under our derivative instruments of $1.9 million and $26.9 million respectively, which was limited to the cost of replacing the contracts in the event of non-performance by the counterparties to the contracts, the majority of which are currently our lending banks. We do not anticipate nonperformance by any of our significant counterparties. In addition, we have established guidelines we follow regarding credit ratings and instrument maturities to maintain safety and liquidity. We do not normally require collateral or other security to support credit relationships; however, in certain circumstances this option is available to us.
ROYAL CARIBBEAN CRUISES LTD.
NOTES TO THE CONSOLIDATED FINANCIAL STATEMENTS (Continued)
Earnings (Loss) Earnings Per Share
Basic (loss) earningsEarnings (Loss) per share is computed by dividing Net Income (Loss) Income attributable to Royal Caribbean Cruises Ltd. by the weighted-average number of shares of common stock outstanding during each period. Diluted (loss) earningsEarnings (Loss) per share incorporates the incremental shares issuable upon the assumed exercise of stock options and conversion of potentially dilutive securities. Effective January 1, 2022, we use the if-converted method to calculate the impact of our convertible notes that may be settled in cash or shares. To the extent dilutive, shares related to our convertible notes are assumed to be converted into common stock at the beginning of the reporting period, and we add back the interest expense to the numerator. If we have a net loss for the period, all potentially dilutive securities will be considered antidilutive, resulting in the same basic and diluted net loss per share amounts for those periods.
Stock-Based Employee Compensation
We measure and recognize compensation expense at the estimated fair value of employee stock awards. Compensation expense for awards and the related tax effects are recognized as they vest. We use the estimated amount of expected forfeitures to calculate compensation costs for all outstanding awards.
Segment Reporting
As of December 31, 2021, we controlled and operated 3 global cruise brands: Royal Caribbean International, Celebrity Cruises and Silversea Cruises. We also own a 50% joint venture interest in TUIC, that operates the German brands TUI Cruises and Hapag-Lloyd Cruises. We believe our brands possess the versatility to enter multiple cruise market segments within the cruise vacation industry. Although each of these brands has its own marketing style as well as ships and crews of various sizes, the nature of the products sold and services delivered by these brands share a common base (i.e., the sale and provision of cruise vacations). Our brands also have similar itineraries as well as similar cost and revenue components. In addition, our brands source passengers from similar markets around the world and operate in similar economic environments with a significant degree of commercial overlap. As a result, our brands have been aggregated as a single reportable segment based on the similarity of their economic characteristics, types of consumers, regulatory environment, maintenance requirements, supporting systems and processes as well as products and services provided. Our Chief Executive Officer has been identified as the chief operating decision-maker and all significant operating decisions including the allocation of resources are based upon the analyses of the Company as 1one segment. Refer to Note 3
. Revenue for passenger ticket revenue information by geographic area.Table of ContentsRecentROYAL CARIBBEAN CRUISES LTD.
NOTES TO THE CONSOLIDATED FINANCIAL STATEMENTS (Continued)
Adoption of Accounting Pronouncements
In March 2020, the FASBFinancial Accounting Standards Board ("FASB") issued ASUAccounting Standards Update ("ASU") No. 2020-04, Reference Rate Reform (Topic 848), which provides optional expedients and exceptions to the current guidance on contract modifications and hedging relationships to ease the financial reporting burdens of the expected market transition from LIBOR and other interbank offered rates to alternative reference rates. Subsequently, in January 2021, the FASB issued ASU No. 2021-01, Reference Rate Reform (Topic 848), which presents amendments to clarify that certain optional expedients and exceptions in Topic 848 for contract modifications and hedge accounting apply to derivatives that are affected by the discounting transition. The guidance in both ASUs was effective upon issuance and mayissuance. In December 2022, the FASB deferred the date for which this guidance can be applied prospectively to contract modifications made and hedging relationships entered into or evaluated on or beforefrom December 31, 2022.2022 to December 31, 2024. We are currently evaluating the impact ofadopted the new guidance onduring 2022. The adoption of this guidance did not have a material impact to our consolidated financial statements. The impact, if any, will be dependentstatements based on the terms of any future contract modifications related to a change in reference rate.rate from LIBOR to Term SOFR, with the transition being completed during the year ended December 31, 2023.
In August 2020, the FASB issued ASU No. 2020-06, Debt—Debt with Conversion and Other Options (Subtopic 470-20) and Derivatives and Hedging - Contracts in Entity’s Own Equity (Subtopic 815-40) ("ASU 2020-06"), which simplifies the accounting for convertible instruments. The guidance removes certain accounting models which separate the embedded conversion features from the host contract for convertible instruments, requiring bifurcation only if the convertible debt feature qualifies as a derivative under Accounting Standards Codification ("ASC") 815, Derivatives and Hedging ("ASC 815815") or for convertible debt issued at a substantial premium. The ASU removes certain settlement conditions required for equity contracts to qualify for the derivative scope exception, permitting more contracts to qualify for it. In addition, the guidance eliminates the treasury stock method to calculate diluted earnings per share for convertible instruments and requires the use of the if-converted method. The ASU is effective for annual reporting periods beginning after December 15, 2021, including interim reporting periods within those annual periods, with early adoption permitted no earlier thanguidance also decreases interest expense due to the fiscal year beginning after December 15, 2020. We plan to adoptreversal of the new guidance onremaining non-cash convertible debt discount. On January 1, 2022 we adopted this pronouncement using the modified retrospective approach and expect to recordrecognize our convertible notes as single liability instruments given they do not qualify as derivatives under ASC 815, nor were they issued at a cumulative effectsubstantial premium. Accordingly, as of adoption of approximately $146January 1, 2022, we recorded a $162 million to retained earnings. The adoption will also result in a reduction to additional paid in capital of $308 million, and an increase to debt, by $162 million primarily as a result of the reversal of the remaining non-cash convertible debt discount.discount, as well as a reduction of $308 million to additional paid in capital, which resulted in a cumulative effect on adoption of approximately $146 million to increase retained earnings.
In September 2022, the FASB issued ASU No. 2022-04, Liabilities-Supplier Finance Programs (Subtopic 405-50) - Disclosure of Supplier Finance Program Obligations. This ASU requires that a buyer in a supplier finance program disclose sufficient information about the program to allow a user of financial statements to understand the program’s nature, activity during the period, changes from period to period, and potential magnitude. This ASU is expected to improve financial reporting by requiring new disclosures about the programs, thereby allowing financial statement users to better consider the effect of the programs on an entity’s working capital, liquidity, and cash flows. We adopted ASU No. 2022-04 effective January 1, 2023. The adoption did not have a material impact to our consolidated financial statements and related disclosures.
Recent Accounting Pronouncements
In August 2023, the FASB issued ASU No. 2023-05, Business Combinations - Joint Venture Formations (Subtopic 805-60): Recognition and Initial Measurement. This ASU provides guidance requiring a joint venture to initially measure all contributions received upon its formation at fair value. The guidance will also result inis intended to provide users of joint venture financial statements with more decision-useful information. This ASU is effective for joint venture entities with a decrease in interest expenseformation date on or after January 1, 2025 on a prospective basis. Early adoption is permitted, and will require usjoint ventures formed prior to use the more dilutive "if-converted" method when calculatingadoption date may elect to apply the dilutivenew guidance retrospectively back to their original formation date. We are currently evaluating the impact of the new guidance on our convertible debt instrumentsconsolidated financial statements.
In November 2023, the FASB issued ASU No. 2023-07, Segment Reporting (Topic 280): Improvements to Reportable Segment Disclosures. This ASU requires enhanced disclosures about significant segment expenses and other segment items and requires companies to disclose all annual disclosures about segments in interim periods. This ASU also requires public entities with a single reportable segment to provide all the disclosures required by the amendments in this ASU and all existing segment disclosures in Topic 280. The amendments in this ASU are intended to improve financial reporting by requiring disclosure of incremental segment information on earnings per share.an annual and interim basis for all public entities to enable investors to develop more decision-useful financial analyses. The amendments in this ASU are effective for fiscal years beginning after December 15, 2023, and interim periods within fiscal years beginning after December 15, 2024. Early adoption is permitted and the amendments should be applied retrospectively to all periods presented. We are currently evaluating the impact of the new guidance on our consolidated financial statements and related disclosures.
ROYAL CARIBBEAN CRUISES LTD.
NOTES TO THE CONSOLIDATED FINANCIAL STATEMENTS (Continued)
primarily through standardization and disaggregation of rate reconciliation categories and income taxes paid by jurisdiction. This ASU is effective for annual periods beginning after December 15, 2024 on a prospective basis. Early adoption and retrospective application is permitted. We are currently evaluating the impact of the new guidance on our consolidated financial statements and related disclosures.
Reclassifications
For the year ended December 31, 2023, we no longer separately present Impairments and Credit losses in our consolidated statements of comprehensive income (loss). As a result, amounts presented in prior periods were reclassified to Other Operating to conform to the current year presentation.
For the year ended December 31, 2023, we no longer separately present Accrued interest in our consolidated balance sheets. As a result, amounts presented in prior periods were reclassified to Accrued expenses and other liabilities to conform to the current year presentation.
For the year ended December 31, 2023, we no longer separately present Amortization of debt discounts and premiums;Increase (decrease) in accrued interest; and Impairments and Credit losses in our cash flows from Operating Activities within our consolidated statements of cash flows. As a result, amounts presented in prior periods were reclassified to Amortization of debt issuance costs, discounts and premiums;Increase in accrued expenses and other liabilities; and Other, net, respectively,within Operating Activities to conform to the current year presentation.
Note 3. Revenue
Revenue Recognition
Revenues are measured based on consideration specified in our contracts with customers and are recognized as the related performance obligations are satisfied.
The majority of our revenues are derived from passenger cruise contracts which are reported within Passenger ticket revenues in our consolidated statements of comprehensive income (loss). Our performance obligation under these contracts is to provide a cruise vacation in exchange for the ticket price. We receive payment before we satisfy this performance obligation and recognize revenue over the duration of each cruise, which generally rangeranges from onetwo to 2524 nights.
Passenger ticket revenues include charges to our guests for port costs that vary with passenger head counts. These types of port costs, along with port costs that do not vary by passenger head counts, are included in our operating expenses. The amounts of port costs charged to our guests and included within Passenger ticket revenues on a gross basis were $104.8$896 million,$125.0 $639 million and $666.8$105 million for the years ended December 31, 2021, 20202023, 2022 and 2019,2021, respectively.
Our total revenues also include Onboard and other revenues, which consist primarily of revenues from the sale of goods and services onboard our ships that are not included in passenger ticket prices. We receive payment before or concurrently with the transfer of these goods and services to cruise passengers during a cruise and recognize revenue at the time of transfer over the duration of the related cruise.
As a practical expedient, we have omitted disclosures on our remaining performance obligations as the duration of our contracts with customers is less than a year.
ROYAL CARIBBEAN CRUISES LTD.
NOTES TO THE CONSOLIDATED FINANCIAL STATEMENTS (Continued)
Disaggregated Revenues
The following table disaggregates our total revenues by geographic regions where we provide cruise itineraries (in thousands)millions): | | | | | | | | | | | | | | | | | |
| Year Ended December 31, |
| 2021 | | 2020 | | 2019 |
| Revenues by itinerary | | | | | |
| North America(1) | $ | 1,039,783 | | | $ | 1,342,429 | | | $ | 6,392,354 | |
| Asia/Pacific(2) | 128,348 | | | 411,865 | | | 1,529,898 | |
| Europe(3) | 180,256 | | | 18,604 | | | 1,942,057 | |
| Other regions | 77,985 | | | 241,590 | | | 567,904 | |
| Total revenues by itinerary | 1,426,372 | | | 2,014,488 | | | 10,432,213 | |
| Other revenues(4) | 105,761 | | | 194,317 | | | 518,448 | |
| Total revenues | $ | 1,532,133 | | | $ | 2,208,805 | | | $ | 10,950,661 | |
| | | | | | | | | | | | | | | | | |
| Year Ended December 31, |
| 2023 | | 2022 | | 2021 |
| Revenues by itinerary | | | | | |
| North America(1) | $ | 8,707 | | | $ | 5,716 | | | $ | 1,040 | |
| Asia/Pacific | 993 | | | 372 | | | 128 | |
| Europe | 2,685 | | | 1,754 | | | 180 | |
| Other Regions(2) | 847 | | | 540 | | | 78 | |
| Total revenues by itinerary | 13,232 | | | 8,382 | | | 1,426 | |
| Other revenues(3) | 668 | | | 458 | | | 106 | |
| Total revenues | $ | 13,900 | | | $ | 8,840 | | | $ | 1,532 | |
(1)Includes the United States, Canada, Mexico and the Caribbean.
(2)Includes Southeast Asia (e.g., Singapore, Thailandseasonality impacted itineraries primarily in South and the Philippines), East Asia (e.g., China and Japan), South Asia (e.g., India and Pakistan) and Oceania (e.g., Australia and Fiji Islands) regions.Latin American countries.
(3)Includes European countries (e.g., the Nordics, Germany, France, Italy, Spain and the United Kingdom).
(4)Includes revenues primarily related to cancellation fees, vacation protection insurance, andcasino operations, pre- and post-cruise tours and fees for operating certain port facilities. Amounts also include revenues related to our bareboat charter, procurement and management related services we perform on behalf of our unconsolidated affiliates. Refer to Note 77.. Investments and Other Assets for more information on our unconsolidated affiliates.
Passenger ticket revenues are attributed to geographic areas based on where the reservation originates. For the years ended December 31, 2021, 20202023, 2022 and 2019,2021, our guests were sourced from the following areas:
ROYAL CARIBBEAN CRUISES LTD.
NOTES TO THE CONSOLIDATED FINANCIAL STATEMENTS (Continued)
| | Year Ended December 31, |
| 2021 | | 2020 | | 2019 |
| Year Ended December 31, | | | Year Ended December 31, |
| 2023 | | | 2023 | | 2022 | | 2021 |
| Passenger ticket revenues: | Passenger ticket revenues: | | | | | |
| United States | United States | 76 | % | | 67 | % | | 65 | % |
| | United States | |
| United States | | 74 | % | | 75 | % | | 76 | % |
| All other countries (1) | All other countries (1) | 24 | % | | 33 | % | | 35 | % | All other countries (1) | 26 | % | | 25 | % | | 24 | % |
(1)No other individual country's revenue exceeded 10% for the years ended December 31, 2021, 20202023, 2022 and 2019.2021.
Customer Deposits and Contract Liabilities
Our payment terms generally require an upfront deposit to confirm a reservation, with the balance due prior to the cruise. Deposits received on sales of passenger cruises are initially recorded as Customer deposits in our consolidated balance sheets and subsequently recognized as passenger ticket revenues or onboard revenues during the duration of the cruise. Additionally, refunds payable to guests who have elected cash refunds for cancelled sailings are recorded in Accounts Payable. ASC 606, Revenues from Contracts with Customers, defines a “contract liability” as an entity’s obligation to transfer goods or services to a customer for which the entity has received consideration from the customer. We do not consider customer deposits to be a contract liability until the customer no longer retains the unilateral right, resulting from the passage of time, to cancel such customer's reservation and receive a full refund.
The reduction in demand for cruising due to the COVID-19 pandemic resulted in lower than historical levels of advance bookings and the associated customer deposits received. At the same time, we experienced significant cancellations as a result of the COVID-19 pandemic, which led to issuance of refunds to customers, while the remainder have been rebooked on future cruises or received credits in lieu of cash refunds.
As of December 31, 2021, refunds due to customers mostly as a result of cancelling their sailings were $38.8 million compared to $95.8 million as of December 31, 2020 and are included within Accounts payable in our consolidated balance sheets. Customer deposits also include deposits related to cancelled cruises prior to the election of a cash refund by guests. Due to the uncertainty related to the timing and pace of our return for cruising, we are unable to estimate the amount of the December 31, 2021 customer deposits that will be recognized in earnings compared to amounts that will be refunded to customers or issued as a credit for future travel through the end of 2022. Customer deposits presented in our consolidated balance sheets include contract liabilities of $814.3 million$2.6 billion and $124.8 million$1.8 billion as of December 31, 20212023 and December 31, 2020,2022, respectively.
We haveDuring the COVID-19 pandemic we provided flexibility to guests with bookings on sailings that were cancelled due to COVID-19 by allowing guests to receive future cruise credits (“FCC”) or elect to receive refunds in cash.. As of December 31, 2021,2023, our customer deposit balance includes approximately $600.0$371 million of unredeemed FCCs. AsOur FCCs are not refundable and do not have expiration dates. Based upon our analysis of historical redemption experience, we believe a portion of our FCCs are not probable of being used in future periods. Based on our current estimates, we recognized an immaterial amount of FCC breakage revenue during the year ended December 31, 2021,2023. We will continue to monitor changes in redemption behavior and estimate and record revenue associated with breakage when the expiration datelikelihood of the FCCs was extended until April 2022 for sailings departing on or before December 2022. Given the uncertainty of travel demand caused by COVID-19 and lack of comparable historical experience of FCC redemptions, we are unable to estimate the number of FCCs that may expire unused in future periods and get recognized as breakage. We will update our breakage analysis as future information is received. customer exercising their remaining rights becomes remote.
Contract Receivables and Contract Assets
Although we generally require full payment from our customers prior to their cruise, we grant credit terms to a relatively small portion of our revenue sourced in select markets outside of the United States. As a result, we have outstanding receivables
ROYAL CARIBBEAN CRUISES LTD.
NOTES TO THE CONSOLIDATED FINANCIAL STATEMENTS (Continued)
from passenger cruise contracts in those markets. We also have receivables from credit card merchants for cruise ticket purchases and goods and services sold to guests during cruises that are collected before, during or shortly after the cruise voyage. In addition, we have receivables due from concessionaires onboard our vessels. These receivables are included within Trade and other receivables, net in our consolidated balance sheets.
Our credit card processors agreements require us, under certain circumstances, to maintain a reserve that can be satisfied by posting collateral. As of December 31, 2023, none of our credit card processors required us to maintain a reserve.
We have contract assets that are conditional rights to consideration for satisfying the construction services performance obligations under a service concession arrangement. As of December 31, 20212023 and 2020,2022, our contract assets were $52.9$167 million and $53.7$168 million, respectively, and were included within Other assets in our consolidated balance sheets. Given the short duration of our cruises and our collection terms, we do not have any other significant contract assets.
Assets Recognized from the Costs to Obtain a Contract with a Customer
Prepaid travel advisor commissions and prepaid credit and debit card fees are an incremental cost of obtaining contracts with customers that we recognize as an asset and include within Prepaid expenses and other assets in our consolidated balance sheets. Prepaid travel advisor commissions and prepaid credit and debit card fees were $257 million and $178 million as of December 31, 2023 and 2022, respectively. Our prepaid travel advisor commissions and prepaid credit and debit card fees are recognized at the time of revenue recognition or at the time of voyage cancellation, and are reported primarily within Commissions, transportation and other in our consolidated statements of comprehensive income (loss).
Note 4. Goodwill
As of November 30, 2023, we performed our annual goodwill impairment review and determined there was no impairment of goodwill for the Silversea Cruises and Royal Caribbean International reporting units.
The principal assumptions used in the discounted cash flow analyses that support our Silversea Cruises and Royal Caribbean International reporting unit goodwill impairment assessment consisted of:
•Forecasted revenues per available passenger cruise day;
•Occupancy rates from existing vessels;
•Vessel operating expenses;
•Terminal growth rate; and
•Weighted average cost of capital (i.e., discount rate)
In respect to the Silversea Cruises reporting unit, we determined the fair value of the Silversea Cruises reporting unit exceeded its carrying value by approximately 63%, as of November 30, 2023. We did not perform interim impairment evaluations during the quarters ended March 31, 2023, June 30, 2023, and September 30, 2023 as no triggering events were identified. We used a probability weighted discounted cash flow model in combination with a market-based valuation approach for the Silversea reporting unit. This requires the use of assumptions (described above) that are subject to risk and uncertainties.
In respect to the Royal Caribbean Reporting unit, we determined the fair value of the Royal Caribbean International reporting unit exceeded its carrying value by more than 100% as of November 30, 2023. We did not perform interim impairment evaluations during the quarters ended March 31, 2023, June 30, 2023, and September 30, 2023 as no triggering events were identified. This requires the use of assumptions (described above) that are subject to risk and uncertainties.
The carrying value of goodwill attributable to our Royal Caribbean International, Celebrity Cruises, and Silversea Cruises reporting units during the years ended December 31, 2023 and 2022 were as follows (in millions):
| | | | | | | | | | | | | | | | | | | | | | | |
| Royal Caribbean International | | Celebrity Cruises | | Silversea Cruises | | Total |
| | | | | | | |
| | | | | | | |
| Balance at December 31, 2022 | $ | 296 | | | $ | 4 | | | $ | 509 | | | $ | 809 | |
| Balance at December 31, 2023 | $ | 296 | | | $ | 4 | | | $ | 509 | | | $ | 809 | |
ROYAL CARIBBEAN CRUISES LTD.
NOTES TO THE CONSOLIDATED FINANCIAL STATEMENTS (Continued)
commissions were $75.4 million and $1.1 million as of December 31, 2021 and 2020, respectively. Our prepaid travel advisor commissions at December 31, 2020 were expensed and reported primarily within Other operating in our consolidated statements of comprehensive income (loss) during the year ended December 31, 2021.
Note 4. Goodwill
The impact of COVID-19 on our operating plans and projected cash flows resulted in the completion of interimAccumulated impairment assessments in respect of certain reporting units as of March 31, 2020 and June 30, 2020, in addition to our annual goodwill impairment assessments performed as of November 30, 2020, and November 30, 2021. Refer to Note 1. General for further information regarding COVID-19 and its impactlosses to the Company.
In respect to the Royal Caribbean International reporting unit, we determined that the fair value of the Royal Caribbean International reporting unit exceeded its carrying value as of March 31, 2020 and June 30, 2020 by approximately 30% and 8%, respectively, resulting in no impairment to the Royal Caribbean International goodwill in those periods. We did not perform an interim impairment evaluation of Royal Caribbean International's goodwill during the quarter ended September 30, 2020 as no triggering events were identified. As of November 30, 2020, we performed our annual goodwill impairment review and determined the fair value of the Royal Caribbean International reporting unit exceeded its carrying value by approximately 14%. We did not perform interim impairment evaluations during the quarters ended March 31, 2021, June 30, 2021, and September 30, 2021 as no triggering events were identified.
In respect to the Silversea Cruises reporting unit, we determined the carrying value of the reporting unit exceeded its fair value as of March 31, 2020. Accordingly, we recognized a goodwill impairment charge of $576.2 million for the quarter ended March 31, 2020. We did not perform interim impairment evaluations of Silversea Cruises' reporting unit during the quarters ended June 30, 2020 and September 30, 2020 as no triggering events were identified. As of November 30, 2020, we performed our annual goodwill impairment review and determined the fair value of the Silversea Cruises reporting unit exceeded its carrying value by approximately 12%. We did not perform interim impairment evaluations during the quarters ended March 31, 2021, June 30, 2021, and September 30, 2021 as no triggering events were identified.
As of November 30, 2021, we performed our annual goodwill impairment reviews and determined no incremental impairment losses existed at the date of this annual assessment. We determined the fair value of the Royal Caribbean International and Silversea Cruises reporting units exceeded their carrying values by approximately 38% and 35%, respectively, at the date of this annual assessment.
The gradual resumption of cruise operations, as further discussed in Note 1. General, and possibility of further delays or suspensions create uncertainty in forecasting operating cash flows. The fair value of the Royal Caribbean International reporting unit as of March 31, 2020 was determined using a probability-weighted discounted cash flow model. For the June 30, 2020 and November 30, 2020 assessments, we used a probability-weighted discounted cash flow model in combination with a market-based valuation approach. For the Silversea reporting unit, a probability-weighted discounted cash flow model in combination with a market-based valuation approach was used for all periods assessed in 2020. As of November 30, 2021, a discounted cash flow model was used in combination with a market-based valuation approach for both reporting units. This requires the use of assumptions that are subject to risk and uncertainties. The principal assumptions used in the discounted cash flow analyses that support our Royal Caribbean International and Silversea Cruises reporting unit impairment assessments consisted of:
•Forecasted net revenues, primarily the timing of returning to normalized operations, occupancy rates from existing and expected ship deliveries, and terminal growth rate; and
•Weighted average cost of capital (i.e., discount rate).
The adverse impact COVID-19 will continue to have on our business, operating results, cash flows and overall financial condition is uncertain and may result in changes to the assumptions used in the impairment tests discussed above, which may result in impairments to these assets in the future.
The carrying value of goodwill attributable to our Royal Caribbean International, Celebrity Cruises and Silversea Cruises reporting units and the changes in such balances during the years endedwere $576 million as of December 31, 20212023 and 2020 were as follows (in thousands):
ROYAL CARIBBEAN CRUISES LTD.
NOTES TO THE CONSOLIDATED FINANCIAL STATEMENTS (Continued)
| | | | | | | | | | | | | | | | | | | | | | | |
| Royal Caribbean International | | Celebrity Cruises | | Silversea Cruises (1) | | Total |
| Balance at December 31, 2019 | $ | 299,226 | | | $ | 1,632 | | | $ | 1,084,786 | | | $ | 1,385,644 | |
| Impairment charge | — | | | — | | | (576,208) | | | (576,208) | |
| Transfer of goodwill attributable to the 2019 purchase of photo operations onboard our ships (2) | (2,694) | | | 2,694 | | | — | | | — | |
| Foreign currency translation adjustment | 44 | | | — | | | — | | | 44 | |
| Balance at December 31, 2020 | 296,576 | | | 4,326 | | | 508,578 | | | 809,480 | |
| | | | | | | |
| Foreign currency translation adjustment | (97) | | | — | | | — | | | (97) | |
| Balance at December 31, 2021 | $ | 296,479 | | | $ | 4,326 | | | $ | 508,578 | | | $ | 809,383 | |
(1)In 2018, we acquired a 66.7% equity stake in Silversea Cruises. Our controlling interest purchase price allocation was final during 2019. In 2020, we acquired the remaining 33.3% minority interest, making Silversea Cruises a wholly owned brand. Refer to Note 1. General for further information.
(2)In 2019, we purchased the photo operations onboard our ships from our former concessionaire. The acquisition was accounted for as a business purchase combination using the purchase method of accounting which requires the use of fair value measurements. The business combination, including purchase transaction and assets acquired, was immaterial to our consolidated financial statements.December 31, 2022.
Note 5. Intangible Assets
Intangible assets consist of finite and indefinite lifeindefinite-life assets and are reported within Other assets in our consolidated balance sheets.
The impact of COVID-19 on our operating plans and projected cash flows resulted in the completion of an interim impairment assessment for the Silversea Cruises trade name as of March 31, 2020, in addition to our annual indefinite-lived intangible asset impairment assessments performed as of November 30, 2020 and November 30, 2021. Refer to Note 1. General for further information regarding COVID-19 and its impact to the Company.
As a result of our evaluation, we determined the carrying value of the Silversea Cruises trade name exceeded its fair value as of March 31, 2020. Accordingly, we recognized an impairment charge of $30.8 million for the quarter ended March 31, 2020. We did not perform interim impairment evaluations of Silversea Cruises' trade name during the quarters ended June 30, 2020 and September 30, 2020, as no triggering events were identified. As of November 30, 2020, we performed our annual trade name impairment review and determined the fair value of the Silversea Cruise trade name exceeded its carrying value by approximately 3%. We did not perform interim impairment evaluations of Silversea Cruises' trade name during the quarters ended March 31, 2021, June 30, 2021, and September 30, 2021 as no triggering events were identified.
As of November 30, 2021,2023, we performed our annual trade name impairment review and determined no incremental impairment losses existed at the date of this annual assessment.assessment for this indefinite-life intangible asset. We determined the fair value of the Silversea Cruises trade name exceeded its carrying value by approximately 19%62% at the date of this annual assessment. The adverse impact COVID-19 will continue to have on our business, operating results, cash flowsWe did not perform interim impairment evaluations during the quarters ended March 31, 2023, June 30, 2023, and overall financial condition is uncertain and may result in changes to the assumptions used in the impairment tests discussed above. In addition, delays in achieving occupancy levels at historical levels or changes to our planned ship deliveries could adversely impact our expected occupancy rates and may result in additional impairment charges of the Silversea Cruises trade name in the future.September 30, 2023 as no triggering events were identified.
The gradual resumption of cruise operations, as further discussed in Note 1. General, and possibility of further delays or suspensions create uncertainty in forecasting operating cash flows. The determination of our trade name fair values using a probability weighted discounted cash flow model and various valuation methods depending on the nature of the intangible asset, such as the relief-from-royalty method, requirerequires the use of assumptions that are subject to risk and uncertainties. The principal assumptions used in the discounted cash flow analyses that support the Silversea Cruises trade name impairment assessmentsassessment consisted of:
•Forecasted net revenues primarily the timing of returning to normalized operations, occupancyper available passenger cruise day;
•Occupancy rates from existing and expected ship deliveries, and terminalvessels;
•Terminal growth rate;
•Royalty rate; and
•Weighted average cost of capital (i.e., discount rate).
The following is a summary of our intangible assets as of December 31, 2023 (in millions, except weighted average amortization period):
| | | | | | | | | | | | | | | | | | | | | | | | | | | | | | | | |
| | As of December 31, 2023 |
| | Remaining Weighted Average Amortization Period (Years) | | Gross Carrying Value | | Accumulated Amortization | | Accumulated Impairment Losses | | Net Carrying Value |
| Finite-life intangible assets: | | | | | | | | | | |
| Customer relationships | | 9.6 | | $ | 97 | | | $ | 35 | | | $ | — | | | $ | 62 | |
| Galapagos operating license | | 20.6 | | 48 | | | 13 | | | — | | | 35 | |
| Total finite-life intangible assets | | | | 145 | | | 48 | | | — | | | 97 | |
Indefinite-life intangible assets (1) | | | | 352 | | | — | | | 31 | | | 321 | |
| Total intangible assets, net | | | | $ | 497 | | | $ | 48 | | | $ | 31 | | | $ | 418 | |
(1) Primarily relates to the Silversea Cruises trade name representing approximately $318.7 million.
The following is a summary of our intangible assets as of December 31, 2022 (in millions, except weighted average amortization period):
ROYAL CARIBBEAN CRUISES LTD.
NOTES TO THE CONSOLIDATED FINANCIAL STATEMENTS (Continued)
•Royalty rate; and
•Weighted average cost of capital (i.e., discount rate).
The following is a summary of our intangible assets as of December 31, 2021 (in thousands, except weighted average amortization period), with Silversea Cruises' trade name representing approximately $318.7 million of the indefinite-lived intangible asset balance: | | As of December 31, 2021 |
| Remaining Weighted Average Amortization Period (Years) | | Gross Carrying Value | | Accumulated Amortization | | Accumulated Impairment Losses | | Net Carrying Value |
| | As of December 31, 2022 | | | | As of December 31, 2022 |
| | Remaining Weighted Average Amortization Period (Years) | | | | Remaining Weighted Average Amortization Period (Years) | | Gross Carrying Value | | Accumulated Amortization | | Accumulated Impairment Losses | Net Carrying Value |
| Finite-life intangible assets: | Finite-life intangible assets: | | | | | | | | | | |
| Customer relationships | Customer relationships | | 11.6 | | $ | 97,400 | | | $ | 22,186 | | | $ | — | | | $ | 75,214 | |
| Customer relationships | |
| Customer relationships | |
| Galapagos operating license | Galapagos operating license | | 22.6 | | 47,669 | | | 9,802 | | | — | | | 37,867 | |
| Other finite-life intangible assets | | 0 | | 11,560 | | | 11,560 | | | — | | | — | |
| Total finite-life intangible assets | Total finite-life intangible assets | | 156,629 | | | 43,548 | | | — | | | 113,081 | |
Indefinite-life intangible assets (1) | Indefinite-life intangible assets (1) | | 352,275 | | | — | | | 30,800 | | | 321,475 | |
| Total intangible assets, net | Total intangible assets, net | | $ | 508,904 | | | $ | 43,548 | | | $ | 30,800 | | | $ | 434,556 | |
|
(1) Primarily relates to the Silversea Cruises trade name.name representing approximately $319 million.
The following is a summary of our intangible assets as of December 31, 2020 (in thousands, except weighted average amortization period): | | | | | | | | | | | | | | | | | | | | | | | | | | | | | | | | |
| | As of December 31, 2020 | |
| | Remaining Weighted Average Amortization Period (Years) | | Gross Carrying Value | | Accumulated Amortization | | Accumulated Impairment Losses | Net Carrying Value | |
| Finite-life intangible assets: | | | | | | | | | | |
| Customer relationships | | 12.8 | | $ | 97,400 | | | $ | 14,069 | | | $ | — | | $ | 83,331 | | |
| Galapagos operating license | | 23.8 | | 47,669 | | | 7,621 | | | — | | 40,048 | | |
| Other finite-life intangible assets | | 0 | | 11,560 | | | 11,560 | | | — | | — | | |
| Total finite-life intangible assets | | | | 156,629 | | | 33,250 | | | — | | 123,379 | | |
Indefinite-life intangible assets (1) | | | | 352,275 | | | — | | | 30,800 | | 321,475 | | |
| Total intangible assets, net | | | | $ | 508,904 | | | $ | 33,250 | | | $ | 30,800 | | $ | 444,854 | | |
(1) Primarily relates to the Silversea Cruises trade name.
The estimated future amortization for finite-life intangible assets for each of the next five years is as follows (in thousands): | | | | | | | | |
| Year | | |
| 2022 | | $ | 8,179 | |
| 2023 | | $ | 8,179 | |
| 2024 | | $ | 8,179 | |
| 2025 | | $ | 8,179 | |
| 2026 | | $ | 8,179 | |
ROYAL CARIBBEAN CRUISES LTD.
NOTES TO THE CONSOLIDATED FINANCIAL STATEMENTS (Continued)$8 million.
Note 6. Property and Equipment
Property and equipment consists of the following (in thousands)millions):
| | | | | | | | | | | |
| As of December 31, |
| 2021 | | 2020 |
| Ships | $ | 31,357,703 | | | $ | 29,872,655 | |
| Ship improvements | 2,152,457 | | | 2,108,922 | |
| Ships under construction | 1,180,486 | | | 1,078,243 | |
| Land, buildings and improvements, including leasehold improvements and port facilities | 746,785 | | | 524,849 | |
| Computer hardware and software, transportation equipment and other | 1,650,249 | | | 1,678,903 | |
| Total property and equipment | 37,087,680 | | | 35,263,572 | |
Less—accumulated depreciation and amortization(1) | (11,179,731) | | | (10,016,977) | |
| $ | 25,907,949 | | | $ | 25,246,595 | |
(1)Amount includes accumulated depreciation and amortization for assets in service. | | | | | | | | | | | |
| As of December 31, |
| 2023 | | 2022 |
| Ships | $ | 36,255 | | | $ | 34,344 | |
| Ship improvements | 2,259 | | | 2,367 | |
| Ships under construction | 3,052 | | | 1,061 | |
| Land, buildings and improvements, including leasehold improvements and port facilities | 763 | | | 772 | |
| Computer hardware and software, transportation equipment and other | 1,595 | | | 1,531 | |
| Total property and equipment | 43,924 | | | 40,075 | |
| Less—accumulated depreciation and amortization | (13,810) | | | (12,529) | |
| $ | 30,114 | | | $ | 27,546 | |
Ships under construction include progress payments for the construction of new ships as well as planning, design, capitalized interest and other associated costs. We capitalized interest costs of $58.8$99 million, $59.1$64 million, and $56.5$59 million for the years ended December 31, 2021, 20202023, 2022 and 2019,2021, respectively.
During 2021,In June 2023, we took delivery of Odyssey of the SeasSilver Nova. , Silver Dawn and,with our joint venture partnerTUIC,In November 2023, we took delivery ofCelebrity Ascent Hanseatic Spirit.and The November 2021 delivery and related financing forIcon of the Silver DawnSeas. was reported inIn our consolidated financial statements asstatement of andcash flows for the year ended December 31, 2021, as a result2023, the acceptance of the eliminationships and satisfaction of our obligations under the Silversea Cruises three month reporting lag. shipbuilding contract were classified as outflows and constructive disbursements within Investing Activities while the amounts novated and effectively advanced from our lenders under our previously committed financing arrangements were classified as inflows and constructive receipts within Financing Activities.
In January ofand April 2022, we took delivery of Wonder of the Seas.Seas and Celebrity Beyond, respectively. In July 2022, we purchased the Silver Endeavour for our Silversea Cruises brand for $277 million, including transaction fees. The ship entered service during the fourth quarter of 2022. Refer to Note 8. Debt for further information on the financings for Odyssey of the Seas and Wonder of the Seas and to Note 9. Leases on the financing for Silver Dawn.
During the first quarter 2020, we determined that the lease for Silver Explorer, operated by Silversea Cruises and previously classified as a finance lease, was an operating lease based on modification of the terms of the lease. Accordingly, Silver Explorer is included within Operating lease right-of use assets, Current portion of operating lease liabilities, and Long term lease liabilities in our consolidated balance sheets. Refer to Note 9. Leases for further information.ship financings.
Long-lived Assets impairments
We review our long-lived assets for impairment whenever events or circumstances indicate potential impairment losses exist. The impact of COVID-19 on our expected future operating cash flows, as well as decisions to dispose of certain vessels, resulted in the identification of impairment triggers for certain vessels in 2020. Refer to Note 1. General for further information regarding COVID-19 and its impact to the Company.
We estimated the recoverability of certain vessels using undiscounted cash flow analyses at interim dates throughout 2020 and at December 31, 2020. A number of vessels were found to have net carrying values in excess of their estimated undiscounted future cash flows and, as such, were subject to fair value assessments. Fair value was determined based on our intended use of the identified vessels and, as such, we used a combination of discounted cash flows, replacement cost, scrap and residual value techniques to estimate fair value. Differences between the estimated fair values and the net carrying values were recorded as an impairment charge within the period the loss was identified. Consequently, we recorded $635.5 million of impairment losses during the year ended 2020. Included in this 2020 amount are $171.3 million impairment losses recorded for the 3 ships that we chartered to Pullmantur Holdings, prior to its filing for reorganization. Refer to Note 7. Other Assets for further information regarding Pullmantur's reorganization. During the quarter ended September 30, 2020, we sold the ships previously chartered to Pullmantur Holdings to third parties for amounts approximating their carrying values and no further impairment was recorded. Also included in the $635.5 million impairment loss for the yearyears ended December 31, 2020, is a $166.8 million impairment charge for the 3 Azamara ships included in the sale of the Azamara brand, effective March 19, 2021. There2023 and 2022, there were no vesselmaterial impairment charges for the year ended December 31, 2021.
The suspension of operations, as discussed in Note 1.recognized. Any impairment charges recognized on GeneralLong-lived Assets, and the possibility of further suspensions create uncertainty in forecasting undiscounted cash flows, which are used to determine if a vessel is at risk of impairment and in estimating the fair value of our ships. Our principal assumptions used in our undiscounted cash flows consisted of:operations are generally reported within Other operating in our consolidated statements of comprehensive income (loss).
ROYAL CARIBBEAN CRUISES LTD.
NOTES TO THE CONSOLIDATED FINANCIAL STATEMENTS (Continued)
•The timing of our return to service, changes in market conditions and port or other restrictions;
•Forecasted net revenues, primarily the timing of returning to normalized operations, and occupancy rates; and
•Intended use of the vessel for the remaining useful life.
The adverse impact COVID-19 will continue to have on our business, operating results, cash flows and overall financial condition is uncertain and may result in changes to the assumptions used in the impairment tests discussed above, which may result in additional impairments to these assets in the future.
During the years ended December 31, 2021 and 2020, we also determined that certain construction in progress projects would be reduced in scope or would no longer be completed as a result of our capital cost containment measures in response to the COVID-19 impact on our liquidity. We recorded property and equipment impairment charges of $55.2 million and $91.5 million, during the years ended December 31, 2021 and December 31, 2020, respectively, which primarily related to construction in progress assets.
These impairment charges were reported within Impairment and Credit Losses in our consolidated statements of comprehensive (loss) income.
Note 7. Investments and Other Assets
A Variable Interest Entity ("VIE") is an entity in which the equity investors have not provided enough equity to finance the entity's activities or the equity investors (1) cannot directly or indirectly make decisions about the entity's activities through their voting rights or similar rights; (2) do not have the obligation to absorb the expected losses of the entity; (3) do not have the right to receive the expected residual returns of the entity; or (4) have voting rights that are not proportionate to their economic interests and the entity's activities involve or are conducted on behalf of an investor with a disproportionately small voting interest. We hold equity interests in ventures related to our cruise operations. We account for the majority of these investments as either an equity method investment or a controlled subsidiary.
Effective March 31, 2023, we closed on the partnership agreement with iCON Infrastructure Partners VI, L.P. ("iCON"). This partnership will own, develop, and manage cruise terminal facilities and infrastructure in key ports of call, initially including several development projects in Italy and Spain. As part of the transaction with iCON we also agreed to sell 80% of the entity which owns our terminal at PortMiami. Refer below to equity method investments and controlled subsidiaries for further information on the transaction. In addition, the partnership will pursue additional port infrastructure developments, including future plans to own, develop, and manage an infrastructure project in the U.S. Virgin Islands.
Unconsolidated investments ("equity method investments")
We have determined that TUI Cruises GmbH ("TUIC"), our 50%-owned joint venture, which operates the brands TUI Cruises and Hapag-Lloyd Cruises, is a VIE. We have determined that we are not the primary beneficiary of TUIC. We believe that the power to direct the activities that most significantly impact TUIC’s economic performance areis shared between ourselves and TUI AG, our joint venture partner. All the significant operating and financial decisions of TUIC require the consent of both parties, which we believe creates shared power over TUIC. Accordingly, we do not consolidate this entity and account for this investment under the equity method of accounting.
On June 30, 2020, TUIC acquired Hapag-Lloyd Cruises, a luxury and expedition brand for German-speaking guests, from TUI AG for approximately €1.2 billion, or approximately $1.3 billion as of the purchase date. Hapag-Lloyd Cruises operates 2 luxury liners and 2 smaller expedition ships. We and TUI AG each made an equity contribution of €75.0 million, or approximately $84.2 million to TUIC to fund a portion of the purchase price, the remainder of which was financed by third-party financing.
As of December 31, 2021,2023, the net book value of our investment in TUIC was $444.4$657 million, primarily consisting of $322.4$566 million in equity and a loan of €103.0€71 million, or approximately $117.2$79 million, based on the exchange rate at December 31, 2021.2023. As of December 31, 2020,2022, the net book value of our investment in TUIC was $538.4$466 million, primarily consisting of $387.5$361 million in equity and a loan of €118.9€87 million, or approximately $145.5$93 million, based on the exchange rate at December 31, 2020.2022. The loan, which was made in connection with the sale of Splendour of the Seas in April 2016, accrues interest at a rate of 6.25% per annum and is payable over 10 years. This loan is 50% guaranteed by TUI AG and is secured by a first priority mortgage on the ship. The majority of these amounts were included within Other assets in our consolidated balance sheets. During the quarter ended March 31, 2021, we and TUI AG each contributed €59.5 million, or approximately $69.9 million based on the exchange rate at March 31, 2021, of additional equity through a combination of cash contributions and conversion of existing receivables. In June 2021, Hapag-Lloyd Cruises received delivery of the Hanseatic Spirit, a 230 berth luxury expedition cruise vessel.
TUIC has various ship construction and financing agreements which include certain restrictions on each of our and TUI AG’s ability to reduce our current ownership interest in TUIC below 37.55% through May 2033. Our investment amount and outstanding term loan are substantially our maximum exposure to loss in connection with our investment in TUIC.
We have determined that Pullmantur Holdings, in which we have a 49% noncontrolling interest and Springwater Capital LLC has a 51% interest, is a VIE for which we are not the primary beneficiary as we do not have the power to direct the activities that most significantly impact the entity's economic performance. In 2020, Pullmantur Holdings and certain of its
ROYAL CARIBBEAN CRUISES LTD.
NOTES TO THE CONSOLIDATED FINANCIAL STATEMENTS (Continued)
subsidiaries filed for reorganization under the terms of the Spanish insolvency laws due to the negative impact of the COVID-19 pandemic on the companies, and on July 15, 2021, Pullmantur Holdings and certain of its subsidiaries filed for liquidation. We suspended the equity method of accounting for Pullmantur Holdings during the second quarter of 2020 as we do not intend to fund the entity's future losses and lost our ability to exert significant influence over the entity's activities as a result of the reorganization and liquidation process.
In connection with the reorganization, we terminated the agreements chartering 3 of our ships to Pullmantur Holdings and sold the ships to third parties during the quarter ended September 30, 2020 for amounts approximating their carrying values. Refer to Note 6. Property and Equipment for further discussion on the impact of the ships' sale on our consolidated financial statements. In addition, we recognized a loss of $69.0 million within Other expense in our consolidated statements of comprehensive (loss) income, during the quarter ended June 30, 2020 representing deferred currency translation adjustment losses, net of hedging, as we no longer had significant involvement in the Pullmantur operation.
During the quarter ended June 30, 2020, we entered into an agreement with Springwater Capital LLC to settle the guarantees previously issued by them and for costs that we incurred as a result of Pullmantur S.A.'s reorganization. As part of this settlement, we agreed to provide Pullmantur guests the option to apply their paid deposits toward a Royal Caribbean International or Celebrity Cruises sailing, or request a cash refund. The estimated total cash refunds expected to be paid to Pullmantur guests and other expenses incurred as part of the liquidation were approximately $10.2 million and $21.6 million for the years ended December 31, 2021 and 2020, respectively. These amounts were recorded in Other operating and in Other expense in our consolidated statements of comprehensive (loss) income for the years ended December 31, 2021 and 2020.
We have determined that Grand Bahama Shipyard Ltd. ("Grand Bahama"), a ship repair and maintenance facility in which we have a 40% noncontrolling interest, is a VIE. This facility serves cruise and cargo ships, oil and gas tankers and offshore units. We utilize this facility, among other ship repair facilities, for our regularly scheduled drydocks and certain emergency repairs as may be required. During the years ended December 31, 2021 and 2020, we made payments of $9.3 million and $0.2 million, respectively, to Grand Bahama for ship repair and maintenance services. We have determined that we are not the primary beneficiary of this facility, as we do not have the power to direct the activities that most significantly impact the facility's economic performance. Accordingly, we do not consolidate this entity.
GivenDuring the impactsecond half of 2023, we formed a 50%-owned joint venture with the other 40% shareholder of Grand Bahama to operate Floating Docks S. DE RL. (“Floating Docks”). Floating Docks will construct two floating drydocks, with delivery dates expected in 2025 and 2026, that will be leased to Grand Bahama and allow it to service the entire range of cruise ships in operation and under construction, as well as much of the COVID-19 pandemic toworld’s commercial shipping fleet. We and our business, we evaluated whether our equity method investments were other than temporarily impaired. Duringjoint venture partner have each guaranteed 50% of certain installment payments payable by Floating Docks under the quarter ended March 31, 2020, we performed an impairment evaluation on our investment in Grand Bahama. As a result of the evaluation, we did not deem our investment balance to be recoverabledrydock and recorded an impairment charge of $30.1 million. The impairment assessment and the resulting charge on our equity method investment in Grand Bahama were determined based on management’s estimates and projections. Werelated construction contracts, which are currently recognizing our share of net accumulated equity method losses against the carrying value of our loans receivable from Grand Bahama, for which there were no impairments during 2021.
For further informationcontingent on the measurements usedachievement of certain construction milestones, bringing our total payment guarantees to estimate the fair value of our equity investments, refer to Note 16. Fair Value Measurements and Derivative Instruments.
As$46 million as of December 31, 2021, we had exposure2023. Our investment in Floating Docks, including loans, is immaterial to credit loss in Grand Bahama consistingour consolidated financial statements as of a $11.1 million loan. Our loan to Grand Bahama matures March of 2026 and bears interest at LIBOR plus 3.5% to 3.75%, capped at 5.75%. Interest payable on the loan is due on a semi-annual basis. During the year ended December 31, 2021, we received principal and interest payments of $8.9 million related to a term loan that had fully matured. We did not receive any principal and interest payments during the year ended December 31, 2020. The remaining loan balance is included within Other assets in our consolidated balance sheets.
We monitor credit risk associated with the loan through our participation on Grand Bahama’s board of directors along with our review of Grand Bahama’s financial statements and projected cash flows. Effective April 1, 2020, we placed the loan in non-accrual status based on our review of Grand Bahama's projected cash flows which have been adversely affected by impacts to their operations caused by the 2019 crane accident related to Oasis of the Seas, Hurricane Dorian and most recently, COVID-19. During the year ended December 31, 2021, no credit losses were recorded related to the fully matured loan, nor the outstanding loan.
The following tables set forth information regarding our investments accounted for under the equity method of accounting, including the entities discussed above, (in thousands):2023.
ROYAL CARIBBEAN CRUISES LTD.
NOTES TO THE CONSOLIDATED FINANCIAL STATEMENTS (Continued)
| | | | | | | | | | | | | | | | | | | | |
| | Year ended December 31, |
| | 2021 | | 2020 | | 2019 |
| Share of equity (loss) income from investments | | $ | (135,469) | | | $ | (213,286) | | | $ | 230,980 | |
Dividends received (1) | | $ | — | | | $ | 2,215 | | | $ | 150,177 | |
(1) ForAs part of the year ended December 31, 2019, TUI Cruises paid us dividends totaling €170.0 million, or approximately $190.3 million, basedtransaction with iCON, we sold our controlling interest in two Italian entities for an immaterial amount of net proceeds and recognized an immaterial gain on the exchange rates atsale. At closing, we have determined that the timepartnership and both Italian entities are VIE's. These entities in Italy represent development projects to own, develop, and manage cruise terminal facilities in key ports of call. We have determined that we are not the transactions. There were noprimary beneficiary for either of these entities as we do not have the power to direct the activities that most significantly impact the economic performance. Accordingly, we do not consolidate these entities.
The following tables set forth information regarding our investments accounted for under the equity method of accounting, including the entities discussed above (in millions):
| | | | | | | | | | | | | | | | | | | | |
| | Year ended December 31, |
| | 2023 | | 2022 | | 2021 |
| Share of equity income (loss) from investments | | $ | 200 | | | $ | 57 | | | $ | (135) | |
Dividends received (1) | | $ | 11 | | | $ | 1 | | | $ | — | |
(1) Represents dividends received from TUI Cruises for the years ended December 31, 2021 and 2020, respectively. The amounts included in the table above are net of tax withholdings.
| | | | | | | | | | | | | | |
| | As of December 31, |
| | 2021 | | 2020 |
| Total notes receivable due from equity investments | | $ | 130,587 | | | $ | 164,596 | |
Less-current portion (1) | | 21,508 | | | 29,501 | |
Long-term portion (2) | | $ | 109,079 | | | $ | 135,095 | |
| | | | | | | | | | | | | | |
| | As of December 31, |
| | 2023 | | 2022 |
| Total notes receivable due from equity investments | | $ | 105 | | | $ | 101 | |
Less-current portion (1) | | 19 | | | 18 | |
Long-term portion (2) | | $ | 86 | | | $ | 83 | |
(1) Included within Trade and other receivables, net in our consolidated balance sheets.
(2) Included within Other assets in our consolidated balance sheets.
We also provide ship management services to TUI Cruises GmbH and provided management services to Pullmantur Holdings (which filed for reorganization, and liquidation in Spain in 2020). Additionally, we bareboat chartered to Pullmantur Holdings the vessels previously operated by its brands, which were retained by us following the sale of our 51% interest in Pullmantur Holdings. These bareboat charters were terminated when Pullmantur Holdings filed for reorganization in Spain. We recorded the following as it relates to these services in our operating results within our consolidated statements of comprehensive income (loss) (in thousands):
| | | | | | | | | | | | | | | | | | | | | | |
| | Year ended December 31, | | |
| | 2021 | | 2020 | | 2019 | | |
| | | | | | | | |
| | | | | | | | |
| | | | | | | | |
| | | | | | | | |
| | | | | | | | |
| | | | | | | | |
| | | | | | | | |
| | | | | | | | |
| Revenues | | $ | 24,568 | | | $ | 21,372 | | | $ | 47,242 | | | |
| Expenses | | $ | 6,275 | | | $ | 4,986 | | | $ | 4,304 | | | |
Summarized financial information for our affiliates accounted for under the equity method of accounting was as follows (in thousands):
| | | | | | | | | | | | | | |
| | As of December 31, |
| | 2021 | | 2020 |
| Current assets | | $ | 736,263 | | | $ | 488,329 | |
| Non-current assets | | 5,241,302 | | | 5,456,061 | |
| Total assets | | $ | 5,977,565 | | | $ | 5,944,390 | |
| | | | |
| Current liabilities | | $ | 1,225,032 | | | $ | 1,106,700 | |
| Non- current liabilities | | 3,860,646 | | | 3,771,992 | |
| Total liabilities | | $ | 5,085,678 | | | $ | 4,878,692 | |
| | | | |
| | | | |
| | | | |
| | | | | | | | | | | | | | | | | | | | |
| | Year ended December 31, |
| | 2021 | | 2020 | | 2019 |
| Total revenues | | $ | 679,137 | | | $ | 619,795 | | | $ | 2,354,744 | |
| Total expenses | | (897,308) | | | (939,481) | | | (1,875,952) | |
| Net (loss) income | | $ | (218,171) | | | $ | (319,686) | | | $ | 478,792 | |
ROYAL CARIBBEAN CRUISES LTD.
NOTES TO THE CONSOLIDATED FINANCIAL STATEMENTS (Continued)
Summarized financial information for our affiliates accounted for under the equity method of accounting was as follows (in millions):
| | | | | | | | | | | | | | |
| | As of December 31, |
| | 2023 | | 2022 |
| Current assets | | $ | 528 | | | $ | 658 | |
| Non-current assets | | 5,264 | | | 4,838 | |
| Total assets | | $ | 5,792 | | | $ | 5,496 | |
| | | | |
| Current liabilities | | $ | 1,464 | | | $ | 1,145 | |
| Non- current liabilities | | 2,907 | | | 3,381 | |
| Total liabilities | | $ | 4,371 | | | $ | 4,526 | |
| | | | |
| | | | |
| | | | |
| | | | | | | | | | | | | | | | | | | | |
| | Year ended December 31, |
| | 2023 | | 2022 | | 2021 |
| Total revenues | | $ | 2,328 | | | $ | 1,539 | | | $ | 679 | |
| Total expenses | | (1,857) | | | (1,416) | | | (897) | |
| Net income (loss) | | $ | 471 | | | $ | 123 | | | $ | (218) | |
Consolidated investments ("controlled subsidiaries")
As part of the transaction with iCON, we sold an 80% interest in the entity which owns our terminal at PortMiami for $208.9 million and retained a 20% minority interest, effective March 31, 2023. We also sold a noncontrolling interest in another entity which is developing a port project in Spain for an immaterial amount. We have determined that both of these entities are VIEs, and we are the primary beneficiary as we have the power to direct the activities that most significantly impact the facility’s economic performance. Accordingly, we will continue to consolidate both entities. The cash consideration received for the sale of the PortMiami terminal company, net of transaction costs, was allocated between paid in capital and noncontrolling interest using the net book value of our investment in the PortMiami terminal, as presented in the statement of shareholders' equity.
Other Assets
Credit Losses
We reviewed our notes receivablereceivables for credit losses in connection with the preparation of our financial statements.statements for the year ended December 31, 2023. In evaluating the credit loss allowance, management considered factors such as historical loss experience, the types of loans and the amount of loans in the loan portfolio, adverse situations that may affect the borrower’s ability to repay, the estimated value of any underlying collateral, peer group information and prevailing economic conditions. Based on these credit loss estimation factors, during the year ended December 31, 2021, we recorded a loss provision of $43.8 million. The 2021 loss provision was primarily related to a note receivable of approximately $24.3 million due from an investment previously reported under the equity-method of accounting, which we subsequently determined was no longer recoverable and wrote the amount off from our credit loss allowance. The 2021 credit loss provision also includes $12.6 million of other receivable balances primarily related to loans due from travel advisors. Our credit loss allowance beginning balance as of January 1, 2021December 31, 2023, primarily relates to credit losses recognized during 2020 on notes receivable for the previous sale of ourcertain property and equipment of $81.6 million.$43 million which were originated in 2015 and 2020.
The following table summarizes our credit loss allowance related to receivables for the year ended December 31, 2021 (in thousands)millions):
| | | | | | | | | | | | |
| | Credit Loss Allowance | | |
Balance at January 1, 20212022 | | $ | 85,447100 | | | | | |
Loss provision for receivablesCredit loss (recovery), net | | 43,822(10) | | | | | |
| Write-offs | | $(7) | | (29,077) | | | | |
Balance at December 31, 20212022 | | 83 | | | | | |
| Credit loss (recovery), net | | (12) | | | | | |
| Write-offs | | (22) | | | | | |
| Balance at December 31, 2023 | | $ | 100,19249 | | | | | |
ROYAL CARIBBEAN CRUISES LTD.
NOTES TO THE CONSOLIDATED FINANCIAL STATEMENTS (Continued)
Note 8. Debt
Debt consists of the following (in thousands)millions): | | As of December 31, |
| Interest Rate(1) | | Maturities Through | | 2021 | | 2020 |
| | | | | | As of December 31, | | | | | | | | As of December 31, |
| | Interest Rate(1) | | | | Interest Rate(1) | | Maturities Through | | 2023 | | 2022 |
| Fixed rate debt: | Fixed rate debt: | | | | | | | | |
| Unsecured senior notes | |
| Unsecured senior notes | |
| Unsecured senior notes | Unsecured senior notes | | 3.70% - 9.13% | | 2022 - 2028 | | $ | 5,604,498 | | | $ | 2,464,994 | |
| Secured senior notes | Secured senior notes | | 10.88% - 11.50% | | 2023 - 2025 | | 2,354,037 | | | 3,895,166 | |
| Unsecured term loans | Unsecured term loans | | 2.53% - 5.41% | | 2028 - 2032 | | 2,860,567 | | | 3,210,161 | |
| Convertible notes | Convertible notes | | 2.88% - 4.25% | | 2023 | | 1,558,780 | | | 1,454,488 | |
| Total fixed rate debt | Total fixed rate debt | | 12,377,882 | | | 11,024,809 | |
| Variable rate debt: | |
Unsecured revolving credit facilities(2) | | 1.51% -1.91% | | 2022 - 2024 | | 2,899,342 | | | 3,289,000 | |
| Unsecured UK Commercial paper | | 2021 | | — | | | 409,319 | |
| USD unsecured term loan | | 0.71% - 3.17% | | 2022 - 2033 | | 5,018,740 | | | 4,002,249 | |
| Euro unsecured term loan | | 1.74% -2.25% | | 2022 - 2028 | | 685,633 | | | 705,064 | |
Variable rate debt(2): | |
Unsecured revolving credit facilities(3) | |
Unsecured revolving credit facilities(3) | |
Unsecured revolving credit facilities(3) | |
| USD unsecured term loans | |
| Euro unsecured term loans | |
| Total variable rate debt | Total variable rate debt | | 8,603,715 | | | 8,405,632 | |
| Finance lease liabilities | Finance lease liabilities | | 472,275 | | | 213,365 | |
Total debt (3) | | 21,453,872 | | | 19,643,806 | |
Total debt (4) | |
| Less: unamortized debt issuance costs | Less: unamortized debt issuance costs | | (363,532) | | | (314,763) | |
| Total debt, net of unamortized debt issuance costs | Total debt, net of unamortized debt issuance costs | | 21,090,340 | | | 19,329,043 | |
| Less—current portion including commercial paper | | (2,243,131) | | | (1,371,087) | |
| Less—current portion | |
| Long-term portion | Long-term portion | | $ | 18,847,209 | | | $ | 17,957,956 | |
(1)Interest rates based on outstanding loan balance as of December 31, 20212023, and for variable rate debt, includes either LIBOREURIBOR or EURIBOR Term SOFR plus the applicable margin.
(2)Includes $1.9 billion facility and $1.3 billion facility,During the vast majorityyear ended December 31, 2023, we completed our transition from LIBOR to Term SOFR rates for all of which is due in 2024. Our $1.9 billion facility accruesour variable rate facilities, with such transition having taken effect at the interest reset date for each such facility.
(3)Advances under our unsecured revolving credit facilities accrue interest at LIBORTerm SOFR plus a maximum0.10% credit adjustment spread plus an interest rate margin of 1.30%, which interest rate was 1.51%,primarily at 1.80%. Based on applicable Term SOFR rates, as of December 31, 2021 and is subject to2023, the maximum interest rate under the unsecured credit facilities was 7.50%. We also pay a facility fee primarily at 0.20% of 0.20%. Our $1.3 billion facility accrues interest at LIBOR plus a maximum interest rate margin of 1.70%, which interest was 1.91% as of December 31, 2021 and is subject to a facility fee of a maximum of 0.30%.the total commitments under such facility.
(3)(4)At December 31, 20212023 and 2020,2022, the weighted average interest rate for total debt was 5.47%6.06% and 6.02%6.23%, respectively.
Unsecured Revolving Credit Facilities
In March 2021,January 2023, we amended and extended the majority of our $1.55 billiontwo unsecured revolving credit facility duefacilities. The amendment extended the maturities of $2.3 billion of the $3.0 billion aggregate revolving capacity by one year to April 2025, with the remainder maturing in April 2024. In October 2022 and our $1.0 billion2023, we refinanced both unsecured revolving credit facilities as well as the $502 million unsecured term loan due April 2022. These amendments, among other things, extend the maturity date or termination date of certain of the advances and commitments, as applicable, under the facilities held by consenting lenders by 18 months and increase the interest rate margin and/or the facility fee, as applicable, with respectscheduled to advances and commitments held by such lenders. Consenting lenders also received a prepayment and commitment reduction equal to 20% of their respective outstanding advances and commitments. Following these amendments, thefully mature in October 2024, bringing our aggregate revolving credit capacity of the revolving credit facility is approximately $1.3 billion, with approximately $0.2 billion terminating in October 2022 and approximately $1.1 billion terminating in April 2024 and the aggregate principal balance of the term loan is approximately $0.9 billion, with approximately $0.3 billion maturing in April 2022 and approximately $0.6 billion maturing in October 2023.
to $3.5 billion. As of December 31, 2021,2023, $1.7 billion of the commitments are scheduled to mature in October 2026, $1.7 billion of the commitments are scheduled to mature in October 2028, and the remaining $97 million of commitments are scheduled to mature in April 2025. As of December 31, 2023, we had undrawn capacity of $2.6 billion under our aggregateunsecured revolving borrowing capacity was $3.2 billion and was mostly utilized throughcredit facilities.
Convertible Notes
In June 2023, our remaining $350 million of the 4.25% Convertible Senior Notes matured. The notes were settled using a combination of amounts drawn$338 million in cash, and lettersthe issuance of credit issued under the facilities. Certainapproximately 374,000 shares of our surety agreements with third party providers for the benefitcommon stock. The issuance of certain agencies and associations that provide travel related bonds, allow the sureties to request collateral. We also have agreements with our credit card processors relating to customer deposits receivedequity increased additional paid in capital by us for future voyages. These agreements allow the credit card processors to require us, under certain circumstances, to maintain a reserve that can bean immaterial amount.
ROYAL CARIBBEAN CRUISES LTD.
NOTES TO THE CONSOLIDATED FINANCIAL STATEMENTS (Continued)
satisfiedIn November 2023, our remaining $225 million of the 2.875% Convertible Senior Notes matured. The notes were settled using a combination of $225 million in cash and the issuance of approximately 147,000 shares of common stock. The issuance of equity increased additional paid in capital by posting collateral. As of December 31, 2021,an immaterial amount.
2023 Debt financing transactions
In February 2023, we have posted letters of credit as collateral with our sureties and credit card processors under our revolving credit facilities in theissued $700 million aggregate principal amount of $193.3 million.
Executed amendments are in place7.25% senior guaranteed notes due January 2030 ("7.25% Priority Guaranteed Notes"). Upon closing, we terminated our commitment for the majority$700 million 364-day term loan facility. In addition, the remaining $350 million backstop committed financing was also terminated upon closing, which resulted in an immaterial loss on extinguishment of our credit card processors, waiving reserve requirements tied to breach of our financial covenants through at least September 30, 2022, with modified covenants thereafter, and as such, we do not anticipate any incremental collateral requirements for the processors covered by these waivers in the next 12 months. We have a reserve with a processor where the agreement was amended in the first quarter of 2021, such that proceeds are held in reserve until the sailing takes place or the funds are refunded to the customer. The maximum projected cash exposure with the processor, including amounts currently held and reported in Trade and other receivables, is approximately $285.0 million. The amount and timing are dependent on future factors that are uncertain, such as the pace of resumption of cruise operations, volume of future deposits and whether we transfer our business to other processors. If we require additional waivers on the credit card processing agreements and are not able to obtain them, this could lead to the termination of these agreements or the trigger of reserve requirements.debt.
In March 2021,June 2023, we took delivery of Odyssey of the SeasSilver Nova. To finance the purchase,delivery, we borrowed $994.1a total of $503 million under a previouslythe committed financing agreement, resulting in an unsecured term loan which is 95% guaranteed by Euler Hermes Aktiengesellschaft (“Hermes”), the official export credit agency of Germany.Hermes. The unsecured loan amortizes semi-annually over 12 years and bears interest at a fixed rate of 4.21% per annum.
During 2023, we repaid the remaining $1.4 billion of our 11.50% secured senior notes due June 2025, which resulted in a total loss on extinguishment of debt of $105 million that was recognized within Interest expense, net of interest capitalized within our consolidated statements of comprehensive income (loss) for the year ended December 31, 2023.
In October 2023, in connection with the revolving credit facilities refinancing described above, we paid the remaining $502 million of the $0.6 billion unsecured term loan due October 2023 which was previously amended in September 2022 to extend the maturity date of advances under the facilities held by consenting lenders by 12 months to October 2024. The payment resulted in an immaterial loss on extinguishment of debt recognized within Interest expense, net of interest capitalized within our consolidated statements of comprehensive income (loss) for the year ended December 31, 2023.
In November 2023, we took delivery of Celebrity Ascent. To finance the delivery, we borrowed a total of $844 million under the committed financing agreement, resulting in an unsecured term loan which is 100% guaranteed by Bpifrance Assurance Export. The unsecured loan amortizes semi-annually over 12 years. The majority of the loan bears interest at a fixed rate of 3.18% per annum and a portion of the loan bears interest at a floating rate equal to LIBORTerm SOFR plus a margin of 0.96%1.45%. Prior toBased on applicable Term SOFR rates, as of December 31, 2023, the unsecured term loan weighted average interest rate was 3.33%.
In November 2023, we took delivery duringof Icon of the first quarterSeas. To finance the delivery, we borrowed a total of 2021, we amended the credit agreement to (i) increase the maximum loan amount$1.8 billion under the facility to make available to uscommitted financing agreement, resulting in an unsecured term loan which is primarily guaranteed 100% by Finnvera plc and the remaining smaller portion guaranteed 95% by Euler Hermes. The unsecured loan amortizes semi-annually over 12 years. The majority of the loan bears interest at a maximum amountfixed rate of 3.56% per annum and a portion of the loan bears interest at a floating rate equal to Term SOFR plus a margin of 1.53% - 1.58%. Based on applicable Term SOFR rates, as of December 31, 2023, the US dollar equivalent of 80% of the vessel purchase price plus 100% of the premium payable to Hermes and (ii) defer the payment of all principal payments due between April 2021 and April unsecured term loan weighted average interest rate was 4.76%.
2022 which amounts will be repayable semi-annually over a five year period starting in April 2022.Debt financing transactions
In March 2021,January 2022, we issued $1.50$1.0 billion of senior unsecured notes that mature in 2028, for net proceeds of $1.48 billion. Interest on the senior notes accrues at 5.5% per annum and is payable semi-annually. We used the proceeds from the notes to repay principal payments on debt maturing or required to be paid in 2021 and(the "January 2022 and the remaining for general corporate purposes.
In March 2021, we extended our binding commitment from Morgan Stanley Senior Funding Inc. for a $700.0 million term loan facility by one year. The commitment was initially obtained in August 2020, and as amended, we may draw on the facility at any time prior to August 12, 2022. Once drawn, the loan will bear interest at LIBOR plus 3.75% and will mature 364 days from funding. In addition, the facility, once drawn, will be guaranteed by RCI Holdings, LLC, our wholly owned subsidiary that owns the equity interests in subsidiaries that own 7 of our vessels. We have the ability to increase the capacity of the facility by an additional $300.0 million from time to time subject to the receipt of additional or increased commitments and the issuance of guarantees from additional subsidiaries.
In June 2021, we issued $650.0 million of senior unsecured notesUnsecured Notes") due in 2026 (the "June Unsecured Notes")2027 for net proceeds of approximately $640.6$990 million. Interest accrues on the June Unsecured Notes at a fixed rate of 4.25%5.375% per annum and is payable semi-annually in arrears. We fully repaid the Silversea Cruises 7.25% senior secured notes due in 2025 (the "Silversea Notes"), in the amount of $619.8 million, with a portion of theThe proceeds from the JuneJanuary 2022 Unsecured Notes. We also funded call premiums,Notes were used to repay principal payments on debt maturing in 2022 (including to pay fees and expenses in connection with the redemption of the Silversea Notes with proceeds from the June Unsecured Notes.
Additionally, during the second quarter of 2021, we repaid in full a $130 million term loan.
In August 2021, we issued $1.0 billion of senior notes due in 2026 (the "August Unsecured Notes") for net proceeds of approximately $986.0 million. Interest accrues on the August Unsecured Notes at a fixed rate of 5.50% per annum and is payable semi-annually in arrears. We used the proceeds of the August Unsecured Notes to replenish our capital as a result of the redemption of a portion of the 11.50% senior secured notes due 2025, in the amount of $928.0 million plus accrued interest and premiums. The repayment of the 11.50% senior secured notes due 2025 resulted in a total loss on the extinguishment of debt of $141.9 million, which was recognized within Interest expense, net of interest capitalized within our consolidated statements of comprehensive loss for the year ended December 31, 2021.such repayments).
In January 2022, we took delivery of Wonder of the Seas. To finance the delivery, we borrowed a total of $1.3 billion under a credit agreement novated to us upon delivery of the ship in July of 2017,January 2022, resulting in an unsecured term loan which is 100% guaranteed by Bpifrance Assurance Export ("BpiFAE"), the official export credit agency ("ECA") of France. The unsecured loan amortizes semi-annually over 12 years and bears interest at a fixed rate of 3.18%. per annum.
In JanuaryApril 2022, we issued $1.0took delivery of Celebrity Beyond. To finance the delivery, we borrowed a total of €0.7 billion of senior notes (the "January 2022 Unsecured Notes") due in 2027 for net proceeds ofor approximately $990.0 million. Interest accrues$0.8 billion and $0.7 billion based on the Januaryexchange rate at December 31, 2023 and 2022, Unsecured Notesrespectively, under a credit agreement novated to us upon delivery of the ship in April 2022, resulting in an unsecured term loan which is 100% guaranteed by BpiFAE. The unsecured loan amortizes semi-annually over 12 years and bears interest at a fixed rate of 5.375%1.28% per annum andannum.
In July 2022, we purchased Silver Endeavour for our Silversea Cruises brand. To finance the purchase, we assumed $277 million of debt, which is payable semi-annually in arrears. The proceeds from95% guaranteed by Euler Hermes Aktiengesellschaft (“Hermes”), the January 2022 Unsecured Notes will be used to repay principal payments on debt maturing in 2022. Pending such debt maturities, we have temporarily applied the proceeds to repay borrowings under ourofficial export credit
ROYAL CARIBBEAN CRUISES LTD.
NOTES TO THE CONSOLIDATED FINANCIAL STATEMENTS (Continued)
revolving credit facilities, bringingagency of Germany. The loan amortizes semi-annually over 13 years starting in July 2024 and bears interest at a floating rate equal to Term SOFR plus a margin of 1.25%. The loan will mature in July 2037.
In August 2022, we issued $1.15 billion of convertible senior notes which accrue interest at 6.00% and mature in August 2025. Upon conversion election, we may deliver shares of our undrawn revolving credit facility capacity to $1.1 billion ascommon stock, cash, or a combination of common stock and cash, at our election. The initial conversion rate per $1,000 principal amount of the dateconvertible notes is 19.9577 shares of our common stock, which is equivalent to an initial conversion price of approximately $50.11 per share, subject to adjustment in certain circumstances. Prior to May 15, 2025, the convertible notes will be convertible at the option of holders during certain periods, and only under certain circumstances set forth in the indenture.
On or after May 15, 2025, the convertible notes will be convertible at any time until the close of business on the second scheduled trading day immediately preceding their maturity date. We received gross proceeds from the offering of $1.15 billion, which we used to repurchase $800 million aggregate principal amount of our 4.25% convertible senior notes due June 15, 2023 and $350 million aggregate principal amount of our 2.875% convertible senior notes due November 15, 2023 (which were settled in November 2023 as described above) in privately negotiated transactions. The $1.15 billion repayment resulted in a total loss on the extinguishment of debt of $12.8 million, which was recognized within Interest expense, net of interest capitalized within our consolidated statements of comprehensive loss for the year ended December 31, 2022.
In August 2022, we issued $1.25 billion of senior unsecured notes which accrue interest at 11.625% that mature in August 2027. The net proceeds of the issuanceoffering of this report from $0.1$1.23 billion aswere used to repay debt that matured in 2022, including the $650 million 5.25% unsecured senior notes due November 2022, which resulted in an immaterial loss on extinguishment of December 31, 2021.debt.
In FebruaryOctober 2022, we entered into certain agreementsissued $1.0 billion aggregate principal amount of 9.250% senior guaranteed notes due 2029 (the "9.25% Priority Guaranteed Notes") and $1.0 billion aggregate principal amount of 8.250% senior secured notes due 2029 (the "8.25% Secured Notes" and together with Morgan Stanley & Co., LLC (“MS”) where MS agrees to provide backstop committed financing to refinance, repurchase and/or repay in whole or in part our existing and outstanding 10.875% Seniorthe 11.5% Secured Notes, due 2023, the "Secured Notes"), both callable in April 2025. We used the combined net proceeds, of the respective offerings, together with cash on hand, to fund the redemption, including call premiums, fees and expenses, of our outstanding 9.125% Priority Guaranteed Notes senior priority guaranteed notes due 2023 and 10.875% senior secured notes due 2023, which resulted in a total loss on extinguishment of debt of $77 million, which was recognized within 4.25%Interest expense, net of interest capitalized Convertible Notes due 2023. Pursuant towithin our consolidated statements of comprehensive loss for the agreements, we may, at our sole option, issue and sell to MS (subject to the satisfaction of certain conditions) five-year senior unsecured notes with gross proceeds of up to $3.15 billion at any time between April 1, 2023 and June 29, 2023, to refinance the aforementioned notes.
During 2020, we amended all of our export credit facilities, all of our non-export credit facilities and certain of our credit card processing agreements which contain financial covenants to extend the financial covenant waiver through and including the fourth quarter of 2021. During the first quarter of 2021, we amended $4.9 billion of our non-export credit facilities and certain of our credit card processing agreements to extend the waiver of the financial covenants through and including the third quarter of 2022 or, if earlier, that date falling after January 1, 2022 on which we elect to comply with the modified covenants. Pursuant to the amendments, we have modified the manner in which such covenants are calculated (temporarily in certain cases and permanently in others) as well as the levels at which our net debt to capitalization covenant will be tested during the period commencing immediately following the end of the waiver period and continuing through the end of 2023. As ofyear ended December 31, 2021, the monthly-tested minimum liquidity covenant was $350 million for the duration of the waiver period. As of the date of these financial statements, we were in compliance with the applicable minimum liquidity covenant. Pursuant to these amendments, the restrictions on paying cash dividends and effectuating share repurchases were extended through and including the third quarter of 2022.
During the first quarter of 2021, we also amended $6.3 billion of our exportExport credit facilities to extend the waiver of the financial covenants through and including at least the end of the third quarter of 2022, and during the third quarter of 2021, we entered into a letter agreement to extend the waiver period to the end of the fourth quarter of 2022. During the fourth quarter of 2021, we amended $7.3 billion of outstanding export-credit financing plus committed export-credit facilities to modify financial covenant levels for 2023 and 2024, following the waiver period through and including the fourth quarter of 2022. These amendments deferred $1.15 billion of principal payments due between April 2021 and April 2022. The deferred amounts will be repayable semi-annually over a five-year period starting in April 2022. Pursuant to these amendments, we have agreed to implement the same liquidity covenant that applies in our non-export credit facilities. The amendments also provide for mandatory prepayment of the deferred amounts upon the taking of certain actions. Subject to a number of carve outs, these include, but are not limited to, issuance of dividends, completion of share repurchases, issuances of debt other than for crisis and recovery purposes, the making of loans and the sale of assets other than at arm’s length
In the fourth quarter of 2020 and the first quarter of 2021, we entered into amendments to our outstanding and committed export-credit facilities to provide for the issuance ofagency guarantees in satisfaction of existing obligations under these facilities. Following issuance (which, in the case of the undrawn facilities, will occur once the debt is drawn), the guarantees will be released under certain circumstances as other debt is repaid or refinanced on an unsecured and unguaranteed basis. In connection with and following the issuance of the guarantees, the guarantor subsidiaries are restricted from issuing additional guarantees in favor of lenders (other than those lenders who are party to the ECA facilities), and certain of the guarantor subsidiaries are restricted from incurring additional debt. In addition, the ECA facilities will benefit from guarantees to be issued by intermediary parent companies of subsidiaries that take delivery of any new vessels subject to export-credit backed financing.
Except for the term loans we incurred to acquire Celebrity Floraand Silver Moon,, all of our unsecured ship financing term loans are guaranteed by the export credit agency in the respective country in which the ship is constructed. For the majority of the loans as of December 31, 2021,2023, we pay to the applicable export credit agency, depending on the financing agreement, an upfront fee of 2.35% to 5.48% of the maximum loan amount in consideration for these guarantees. We amortize the fees that are paid upfront over the life of the loan. We classify these fees within Amortization of debt issuance costs, discounts and premiums in our consolidated statements of cash flows. Prior to the loan being drawn, we present these fees within Other assets in our consolidated balance sheets. Once the loan is drawn, such fees are classified as a discount to the related loan, or contra-liability account, within Current portion of long-term debtor or long-termdebt.
In March 2020, we increased the capacity of our $1.7 billion and $1.2 billion unsecuredDebt covenants
Our revolving credit facilities, due in 2024the majority of our term loans, and 2022, by $200 millioncertain of our credit card processing agreements, contain covenants that require us, among other things, to maintain a fixed charge coverage ratio, limit our net debt-to-capital ratio, maintain minimum liquidity, and $400 million, respectively, utilizing their respective accordion features.under certain facilities, to maintain a minimum stockholders' equity. As of December 31, 2020,2023, our aggregate revolving borrowing capacity was $3.5 billioncredit facility amendments require us to prepay outstanding deferred amounts of $910 million, if we elect to pay dividends or complete share repurchases. As of December 31, 2023, we were in compliance with our debt covenants and was fully utilized through a combination of amounts drawn and letters of credit issued under the facilities. Certain of our surety agreements with third party providerswe estimate we will be in compliance for the benefitnext twelve months.
The net carrying value of certainthe 6.00% convertible notes was as follows:
| | | | | | | | | | | | |
| (in millions) | As of December 31, 2023 | | As of December 31, 2022 | |
| Principal | $ | 1,150 | | | $ | 1,725 | | |
| Less: Unamortized debt issuance costs | 13 | | | 24 | | |
| $ | 1,137 | | | $ | 1,701 | | |
ROYAL CARIBBEAN CRUISES LTD.
NOTES TO THE CONSOLIDATED FINANCIAL STATEMENTS (Continued)
agencies and associations that provide travel related bonds allow the surety to request collateral in the form of cash or letters of credit. As of December 31, 2020, we posted collateral in the amount of approximately $91 million.
In March 2020, we took delivery of Celebrity Apex. To finance the purchase, we borrowed $722.2 million under a previously committed unsecured term loan which is 100% guaranteed by BpiFrance Assurance Export, the official export credit agency of France. The loan amortizes semi-annually over 12 years and bears interest at a fixed rate of 3.23% per annum. In the second quarter of 2020 and the first quarter of 2021, we amended the agreement to defer the payment of all principal payments due between April 2020 and March 2022. The deferred amounts will be repayable starting in 2022 over a five year period.
In March 2020, we borrowed $2.2 billion pursuant to a 364-day senior secured term loan agreement. In May 2020, this secured term loan was increased by an additional $150 million through the exercise of the accordion feature. The increased secured term loan balance was repaid with proceeds from the $3.32 billion Secured Notes (as described below) issued in May 2020. This secured term loan would have matured 364 days after funding and could have been extended at our option for an additional 364 days subject to customary conditions, including the payment of a 1.00% extension fee. Interest accrued at LIBOR plus a margin of 2.25% which would have increased to 2.50% and 2.75% at 180 days and 365 days, respectively, after funding. We would have also been required to pay a duration fee in an amount equal to 0.25% of the aggregate loan principal amount every 60 days. Additionally, 2 of our board members each purchased a participation interest equal to $100 million. The repayment of this secured term loan in May 2020 resulted in a total loss on the extinguishment of debt of $41.1 million, which was recognized within Interest expense, net of interest capitalized within our consolidated statements of comprehensive income (loss).
In May 2020, we issued $3.32 billion of senior secured notes (the "Secured Notes") for net proceeds of approximately $3.2 billion. We repaid the $2.35 billion, 364-day senior secured term loan in its entirety with a portion of the proceeds of the Secured Notes. $1.0 billion of the notes accrue interest at 10.875% and mature in June of 2023 (the "2023 Secured Notes"). The remaining $2.32 billion of the Secured Notes accrue interest at 11.5% and mature in June of 2025 (the "2025 Secured Notes"). The Secured Notes are fully and unconditionally guaranteed by Celebrity Cruises Holdings Inc., Celebrity Cruises Inc., and certain of our wholly-owned vessel-owning subsidiaries. $1.66 billion of the obligations under the Secured Notes and the related guarantees are secured by first priority security interests in the collateral (which generally includes certain of our material intellectual property, a pledge of 100% of the equity interests of certain of our vessel-owning subsidiaries, the collateral account established pursuant to the indenture governing the Secured Notes (the "Secured Notes Indenture"), mortgages on the 28 vessels owned by such subsidiaries, and an assignment of insurance and earnings in respect of such vessels, subject to permitted liens and certain exclusions and release provisions), subject to certain adjustments after the date of issuance based on our debt rating as of the date of issuance and our lien basket amount in certain of our credit facilities. Prior to March 1, 2023, we may, at our option, redeem some or all of the 2023 Secured Notes at 100% of the principal amount thereof plus accrued and unpaid interest plus the applicable “make-whole premium” described in the Secured Notes Indenture. On or after March 1, 2023, we may, at our option, redeem some or all of the 2023 Secured Notes at a redemption price equal to 100% of the principal amount of the 2023 Secured Notes to be redeemed plus accrued and unpaid interest, if any, to, but excluding, the redemption date. Prior to June 1, 2022, we may, at our option, redeem some or all of the 2025 Secured Notes at 100% of the principal amount plus accrued and unpaid interest plus the applicable “make-whole premium” described in the Secured Notes Indenture. On or after June 1, 2022, we may, at our option, redeem some or all of the 2025 Secured Notes at the applicable redemption prices set forth in the Secured Notes Indenture. In addition, on or prior to June 1, 2022, we may, at our option, redeem up to 40% of the 2025 Secured Notes with the proceeds from certain equity offerings at the redemption price listed in the Secured Notes Indenture. In addition, we may redeem all, but not part, of the Secured Notes upon the occurrence of specified tax events set forth in the Secured Notes Indenture.
In June 2020, we issued $1.0 billion of senior unsecured notes which accrue interest at 9.125% and mature in June of 2023. The notes are fully and unconditionally guaranteed by RCI Holdings LLC, which owns 100% of the equity interests in certain of our wholly-owned vessel-owning subsidiaries.
In June 2020, RCL Cruises Ltd., our subsidiary that operates and manages our business in the United Kingdom, established a commercial paper facility for the purpose of issuing short-term, unsecured Sterling-denominated notes that are eligible for purchase under the Joint HM Treasury and Bank of England’s COVID Corporate Financing Facility commercial paper program in an aggregate principal amount up to £300.0 million. The maturities of the commercial paper notes can vary by note, but cannot exceed 364 days from the date of issuance. As of December 31, 2020, we had £300.0 million, or approximately $409.9 million, based on the exchange rate at December 31, 2020, of commercial paper notes outstanding under this program. During the first quarter of 2021, we repaid in full the £300.0 million notes issued under the Joint HM Treasury and Bank of England’s COVID Corporate Financing Facility.
In June 2020, we issued $1.15 billion of convertible notes which accrue interest at 4.25% and mature in June of 2023. If note holders elect to convert, the notes will be converted into our shares of common stock, cash, or a combination of common stock and
ROYAL CARIBBEAN CRUISES LTD.
NOTES TO THE CONSOLIDATED FINANCIAL STATEMENTS (Continued)
cash, at our discretion. The initial conversion rate per $1,000 principal amount of the convertible notes is 13.8672 shares of our common stock, which is equivalent to an initial conversion price of approximately $72.11 per share, subject to adjustment in certain circumstances. Prior to March 15, 2023, the convertible notes will be convertible at the option of holders during certain periods, and only under the following conditions:
•during any calendar quarter after September 30, 2020, if the last reported sale price per share of our common stock for at least 20 trading days (whether or not consecutive) during the period of 30 consecutive trading days ending on the last trading day of the immediately preceding calendar quarter is greater than or equal to 130% of the conversion price on each applicable trading day;
•the trading price per $1,000 principal amount of notes is less than 98% of the product of the last reported sale price per share of our common stock and the conversation rate for 10 consecutive trading days (in which case the notes are convertible at any time during the 5 business day period following the 10 consecutive trading day period);
•if we call the notes for a tax redemption; or
•upon the occurrence of specified corporate events.
On or after March 15, 2023, the convertible notes will be convertible at any time until the close of business on the second scheduled trading day immediately preceding their maturity date.
Holders of the convertible notes may require us, upon the occurrence of certain events that constitute a fundamental change under the indenture, to offer to repurchase the convertible notes at a repurchase price equal to 100% of the principal amount thereof, plus accrued and unpaid interest.
We allocated $907.9 million of the convertible notes' proceeds, net of debt issue costs, to Long-term debt and $209.0 million to Paid-in-capital on our Consolidated Balance Sheet. We recognized the equity component by ascribing the difference between the proceeds and the fair value of the convertible notes' debt component to Paid-in-capital and the corresponding debt discount will be amortized to interest expense over the term of the convertible notes using the straight-line method, which approximates the effective interest method. The fair value of the convertible notes' debt component was determined utilizing a present value calculation. Debt issuance costs on the convertible notes were allocated to the debt and equity components in proportion to the allocation of proceeds to those components. We incurred total debt issue costs of $33.1 million on the issuance of the debt and allocated $6.2 million to Paid-in-capital. Debt issuance costs attributable to debt will be amortized to interest expense over the term of the convertible notes.
In October 2020, we issued $575 million of senior convertible notes which accrue interest at 2.875% and mature in November of 2023. If note holders elect to convert, the notes will be converted into our shares of common stock, cash, or a combination of common stock and cash, at our discretion. The initial conversion rate per $1,000 principal amount of the convertible notes is 12.1212 shares of our common stock, which is equivalent to an initial conversion price of approximately $82.50 per share, subject to adjustment in certain circumstances. Prior to August 15, 2023, the convertible notes will be convertible at the option of holders during certain periods, and only under the following conditions:
•during any calendar quarter after December 31, 2020, if the last reported sale price per share of our common stock for at least 20 trading days (whether or not consecutive) during the period of 30 consecutive trading days ending on the last trading day of the immediately preceding calendar quarter is greater than or equal to 130% of the conversion price on each applicable trading day;
•the trading price per $1,000 principal amount of notes is less than 98% of the product of the last reported sale price per share of our common stock and the conversation rate for 10 consecutive trading days (in which case the notes are convertible at any time during the 5 business day period following the 10 consecutive trading day period);
•if we call the notes for a tax redemption; or
•upon the occurrence of specified corporate events.
On or after August 15, 2023, the convertible notes will be convertible at any time until the close of business on the second scheduled trading day immediately preceding their maturity date.
Holders of the convertible notes may require us, upon the occurrence of certain events that constitute a fundamental change under the indenture, to offer to repurchase the convertible notes at a repurchase price equal to 100% of the principal amount thereof, plus accrued and unpaid interest.
ROYAL CARIBBEAN CRUISES LTD.
NOTES TO THE CONSOLIDATED FINANCIAL STATEMENTS (Continued)
We allocated $463.0 million of the convertible notes' proceeds, net of debt issue costs, to Long-term debt and $101.9 million to Paid-in-capital on our Consolidated Balance Sheet. We recognized the equity component by ascribing the difference between the proceeds and the fair value of the convertible notes' debt component to Paid-in-capital and the corresponding debt discount will be amortized to interest expense over the term of the convertible notes using the straight-line method, which approximates the effective interest method. The fair value of the convertible notes' debt component was determined utilizing a present value calculation. Debt issuance costs on the convertible notes were allocated to the debt and equity components in proportion to the allocation of proceeds to those components. We incurred total debt issue costs of $10.1 million on the issuance of the debt and allocated $1.8 million to Paid-in-capital. Debt issuance costs attributable to debt will be amortized to interest expense over the term of the convertible notes.
The net carrying value of the liability component of the convertible notes was as follows:
| | | | | | | | | | | | |
| (in thousands) | As of December 31, 2021 | | As of December 31,2020 | |
| Principal | $ | 1,725,000 | | | 1,725,000 | | |
| Less: Unamortized debt discount and transaction costs | 188,764 | | | 312,117 | | |
| $ | 1,536,236 | | | $ | 1,412,883 | | |
The interest expense recognized related to the 6.00% convertible notes was as follows:
| | | | | | | | | | | | |
| (in thousands) | As of December 31, 2021 | | As of December 31, 2020 | |
| Contractual interest expense | $ | 65,406 | | | 30,832 | | |
| Amortization of debt discount and transaction costs | 118,566 | | | 52,518 | | |
| $ | 183,972 | | | $ | 83,350 | | |
In October 2020, we took delivery of Silver Moon. To finance the purchase, Silversea Cruise Holding Ltd., our wholly owned subsidiary, borrowed $300 million under a previously committed unsecured term loan facility, guaranteed by us, to pay a portion of the ship's contract price. The loan is due and payable at maturity in June 2028, provided however, that each lender may elect to cause us to repay the outstanding amount of any advances held by such lender on June 2026 upon 90 days advance notice. The loan amortizes semi-annually starting six months after funding, with 1/24th of the outstanding principal payable every six months and the balance payable upon maturity. Interest on the loan currently accrues at LIBOR plus 2.00%.
During 2020, we amended certain export-credit backed ship debt facilities to benefit from a 12-month debt amortization deferral (the "Debt Deferral"). Under the Debt Deferral, deferred debt amortization of approximately $0.9 billion will be paid over a period of 4 years after the 12-month deferral period. The Debt Deferral was offered by certain export credit agencies as a result of the current impact to cruise-line borrowers as a result of COVID-19. During the first quarter of 2021, we further amended our export-credit backed ship debt facilities and deferred an additional $0.8 billion of principal payments due under these export facilities between April 2021 and March 2022. The new amounts being deferred are scheduled to be repaid over a five year period starting in April 2022.
Under certain of our agreements, the contractual interest rate, facility fee and/or export credit agency fee vary with our debt rating. On February 25, 2021, S&P Global downgraded our senior unsecured rating from B+ to B, which had no financial impact, and downgraded our 10.875% senior secured notes due 2023 and our 11.50% senior secured notes due 2025 (collectively, "the "Secured Notes") and our Silversea Notes which were fully repaid in June 2021 with proceeds from the $650 million June Unsecured Notes, from BB to BB-. This downgrade had no impact on the terms of the notes. | | | | | | | | | | | | |
| (in millions) | As of December 31, 2023 | | As of December 31, 2022 | |
| Contractual interest expense | $ | 69 | | | $ | 76 | | |
| Amortization of debt issuance costs | 8 | | | 16 | | |
| $ | 77 | | | $ | 92 | | |
Following is a schedule of annual maturities on our total debt net of debt issuance costs and including finance leases, as of December 31, 20212023 for each of the next five years (in thousands)millions):
Table of Contents | | | | | |
| Year | As of December 31, 2023 (1) |
| 2024 | $ | 1,722 | |
| 2025 | 2,650 | |
| 2026 | 3,406 | |
| 2027 | 3,763 | |
| 2028 | 3,489 | |
| Thereafter | 6,965 | |
| $ | 21,995 | |
ROYAL CARIBBEAN CRUISES LTD.
NOTES TO THE CONSOLIDATED FINANCIAL STATEMENTS (Continued)
| | | | | |
| Year | |
| 2022 | $ | 2,243,131 | |
| 2023 | 5,376,305 | |
| 2024 | 4,026,746 | |
| 2025 | 2,293,638 | |
| 2026 | 2,533,027 | |
| Thereafter | 4,617,493 | |
| $ | 21,090,340 | |
Note 9. Leases
Operating leases
Our operating leases primarily relate to preferred berthing arrangements, real estate, and shipboard equipment andwhich are included within Operating lease right-of-use assets,assets and Long-term operating lease liabilities, with the current portion of the liability included within Current portion of operating lease liabilities in our consolidated balance sheetsheets as of December 31, 2021.2023 and 2022. Leases with an initial term of 12 months or less are not recorded on the consolidated balance sheet. We recognize lease expense for these leases on a straight-line basis over the lease term. Our operating leases include Silver Explorer, operated by Silversea Cruises. Theincluded the operating lease for Silver Explorer which expired in the fourth quarter of 2023 and the ship was returned to the lessor.
In November 2023 we executed a modification to our preferred berthing agreement with Miami-Dade County ("County") to extend the expiration from 2027 to 2042, inclusive of development plans for the County to finance the construction of a new and improved cruise Terminal G at PortMiami. The total aggregate amount of the operating lease liabilities recorded for this berthing agreements was $167 million and $79 million as of December 31, 2023 and December 31, 2022, respectively. In addition, there will expirebe future remeasurements as the County completes several construction milestones throughout the term of the extended lease. The most significant of which will be for Terminal G, which will include a remeasurement of the operating lease in 2023.2027 or later, when the County satisfies substantial completion, as the minimum lease payments will increase to approximately $55 million per year, with expected 3% annual increases thereafter.
For some of our real estate leases and berthing agreements, we do have the option to extend our current lease term. For those lease agreements with renewal options, the renewal periods for real estate leases primarily range from one to 10 years and the renewal periods for berthing agreements primarily range from one year to 20 years. Generally, we do not include renewal options as a component of our present value calculation for berthing agreements. However, for certain real estate leases, we include them.
In June of 2021, we exercised our option under our operating lease with SMBC Leasing and Finance, Inc (the "Lessor") to purchase Terminal A at PortMiami in July 2021 for the pre-agreed purchase price of $220.0 million. Upon purchase of the terminal lease in July 2021, the underlying asset was recorded as a leasehold improvement within Property and equipment, net. Our July 2021 purchase of the Port of Miami terminal eliminated the residual value guarantee and a requirement under the lease to post $181.1 million of cash collateral.
Additionally, we remeasured the ground lease related to the Terminal A lease based on a reassessed lease term resulting from our purchase option exercise. We determined that the ground lease should remain as an operating lease with adjustments to the operating lease liability and the related right-of-use asset in our Consolidated Balance Sheet.
As most of our leases do not provide an implicit rate, we use our incremental borrowing rate in determining the present value of lease payments. We estimate our incremental borrowing rates based on LIBORTerm SOFR and U.S. Treasury note rates corresponding to lease terms increased by the Company’s credit risk spread and reduced by the estimated impact of collateral. In addition, we have lease agreements with lease and non-lease components, which are generally accounted for separately. However, for berthing agreements, we account for the lease and non-lease components as a single lease component.
ROYAL CARIBBEAN CRUISES LTD.
NOTES TO THE CONSOLIDATED FINANCIAL STATEMENTS (Continued)
Finance leases
Our finance leases primarily relate to buildings and surrounding land located at our Miami headquarters, and our lease for Silver Dawn. Finance leases are included within Property, and Equipment, net, and Long-term debt with the current portion of the liability included within Current portion of long-term debt in 2016 when we sold our 51% interestconsolidated balance sheets as of December 31, 2023 and 2022.
The Company's master lease agreement (“Master Lease”) with Miami-Dade County related to the buildings and surrounding land located at our Miami headquarters is classified as a finance lease in accordance with ASC 842, Leases. The Master Lease includes two five-year options to extend the Pullmantur brand to Pullmantur Holdings, and continuing through the quarter ended June 30, 2020, we bareboat chartered to Pullmantur Holdings the vessels operated by the Pullmantur brand. On June 22, 2020, Pullmantur S.A., a subsidiary of Pullmantur Holdings, filed for reorganization in Spain, at which time we terminated these bareboat charters. See Note 7. Other Assets for further discussion of Pullmantur Holdings. We accounted for the bareboat charters of these vessels as operating leases forlease which we wereare reasonably certain to exercise. In November 2023 we executed a modification to the lessor.Master Lease agreement to extend its expiration from 2076 to 2077 after coming to an agreement with Miami-Dade County on the financing plans to finalize the development of the buildings and land. The modification of the Master Lease did not change the classification of the lease. The total aggregate amount of the finance lease liabilities recorded for this Master Lease was $104 million and $56 million as of December 31, 2023 and December 31, 2022, respectively. The development of the new campus buildings are expected to be completed in 2026, and the lease components will be recorded within our consolidated financial statements upon commencement.
Finance Leases
Silversea Cruises operates the Silver Dawn under a finance lease. We received delivery of the Silver Dawn in November of 2021 under a sale-leaseback agreement with a bargain purchase option at the end of the 15 year lease term. Due to the bargain purchase option at the end of the lease term in 2036 whereby Silversea Cruises is reasonably certain of obtaining ownership of the ship, Silver Dawn is accounted for as a finance lease. The lease includes other purchase options beginning in year three, none of which are reasonably certain of being exercised at this time. The total aggregate amount of finance lease liabilities recorded for this ship was $246 million and $265 million as of December 31, 2023 and December 31, 2022, respectively. The lease payments on the Silver Dawn are subject to adjustments based on the Term SOFR rate.
Supplemental balance sheet information for leases was as follows (in millions):
| | | | | | | | | | | |
| As of December 31, 2023 | | As of December 31, 2022 |
| Lease assets: | | | |
| Finance lease right-of-use assets, net: | | | |
| Property and equipment, gross | $ | 520 | | | $ | 669 | |
| Accumulated depreciation | (69) | | | (124) | |
| Property and equipment, net | 451 | | | 545 | |
| Operating lease right-of-use assets | 611 | | | 538 | |
| Total lease assets | $ | 1,062 | | | $ | 1,083 | |
| Lease liabilities: | | | |
| Finance lease liabilities: | | | |
| Current portion of debt | $ | 26 | | | $ | 34 | |
| Long-term debt | 343 | | | 317 | |
| Total finance lease liabilities | 369 | | | 351 | |
| Operating lease liabilities: | | | |
| Current portion of operating lease liabilities | 65 | | | 80 | |
| Long-term operating lease liabilities | 613 | | | 523 | |
| Total operating lease liabilities | 678 | | | 603 | |
| Total lease liabilities | $ | 1,047 | | | $ | 954 | |
The components of lease costs were as follows (in millions):
ROYAL CARIBBEAN CRUISES LTD.
NOTES TO THE CONSOLIDATED FINANCIAL STATEMENTS (Continued)
| | | | | | | | | | | | | | | | | | | | | | | |
| Consolidated Statement of Comprehensive Income (Loss) Classification | | Year Ended December 31, 2023 | | Year Ended December 31, 2022 | | Year Ended December 31, 2021 |
| Lease costs: | | | | | | | |
| Operating lease costs | Commission, transportation and other | | $ | 183 | | | $ | 127 | | | $ | 19 | |
| Operating lease costs | Other operating expenses | | 22 | | | 22 | | | 23 | |
| Operating lease costs | Marketing, selling and administrative expenses | | 21 | | | 19 | | | 18 | |
| Finance lease costs: | | | | | | | |
| Amortization of right-of-use-assets | Depreciation and amortization expenses | | 22 | | | 24 | | | 17 | |
| Interest on lease liabilities | Interest expense, net of interest capitalized | | 30 | | | 22 | | | 3 | |
| Total lease costs | | | $ | 278 | | | $ | 214 | | | $ | 80 | |
The carrying amountIn addition, certain of our berthing agreements include variable lease costs based on the ship is reportednumber of passengers berthed. During the twelve months ended December 31, 2023 and December 31, 2022, we had $85 million and $66 million of variable lease costs recorded within PropertyCommission, transportation and Equipment, netother in our Consolidated Balance Sheet asconsolidated statement of December 31, 2021. The ship has a useful life and residual value of 30 years and 15%comprehensive income (loss), respectively. The total aggregate amount of financeThese variable lease liabilities recorded for this shipcosts are $283.7 million and are reflected in Current portion of long-term debt and Long-term debt in our Consolidated Balance Sheet as of December 31, 2021.included within the balances presented above.
Silversea Cruises operates Silver Whisper under a finance lease. In May 2021,The weighted average of the financeremaining lease for the Silver Whisper expiring in 2022 was amended to extend its expiration by 12 monthsterms and will now expire in 2023, subject to an option to purchase the ship. Additionally, certain scheduled payments have been deferred andweighted average discount rates are reflected in Long-term debt in our Consolidated Balance Sheet as of December 31, 2021. The total aggregate amount of finance lease liabilities recorded for this ship was $24.1 million and $31.5 million at December 31, 2021 and December 31, 2020, respectively. The lease payments on the Silver Whisper are subject to adjustments based on the LIBOR rate.follows:
| | | | | | | | | | | |
| As of December 31, 2023 | | As of December 31, 2022 |
| Weighted average of the remaining lease term | | | |
| Operating leases | 19.43 | | 17.69 |
| Finance leases | 23.92 | | 19.26 |
| Weighted average discount rate | | | |
| Operating leases | 7.53 | % | | 6.92 | % |
| Finance leases | 5.83 | % | | 6.43 | % |
Supplemental balance sheetcash flow information forrelated to leases wasis as follows (in thousands)millions):
| | | | | | | | |
| As of December 31, 2021 | As of December 31, 2020 |
| Lease assets: | | |
| Finance lease right-of-use assets, net: | | |
| Property and equipment, gross | $ | 737,444 | | $ | 364,910 | |
| Accumulated depreciation | (94,729) | | (71,288) | |
| Property and equipment, net | 642,715 | | 293,622 | |
| Operating lease right-of-use assets | 542,128 | | 599,985 | |
| Total lease assets | $ | 1,184,843 | | $ | 893,607 | |
| Lease liabilities: | | |
| Finance lease liabilities: | | |
| Current portion of debt | $ | 51,470 | | $ | 51,856 | |
| Long-term debt | 420,805 | | 161,509 | |
| Total finance lease liabilities | 472,275 | | 213,365 | |
| Operating lease liabilities: | | |
| Current portion of operating lease liabilities | 68,922 | | 102,677 | |
| Long-term operating lease liabilities | 534,726 | | 563,876 | |
| Total operating lease liabilities | 603,648 | | 666,553 | |
| Total lease liabilities | $ | 1,075,923 | | $ | 879,918 | |
0The components of lease expense were as follows (in thousands): | | | | | | | | | | | | | | | | | |
| Year Ended December 31, 2023 | | Year Ended December 31, 2022 | | Year Ended December 31, 2021 |
| Cash paid for amounts included in the measurement of lease liabilities: | | | | | |
| Operating cash flows from operating leases | $ | 178 | | | $ | 127 | | | $ | 43 | |
| Operating cash flows from finance leases | 30 | | | 22 | | | 3 | |
| Financing cash flows from finance leases | $ | 31 | | | $ | 48 | | | $ | 24 | |
ROYAL CARIBBEAN CRUISES LTD.
NOTES TO THE CONSOLIDATED FINANCIAL STATEMENTS (Continued)
| | | | | | | | | | | | | | |
| Consolidated Statement of Comprehensive Income (Loss) Classification | Year ended December 31, 2021 | Year ended December 31, 2020 | Year ended December 31, 2019 |
| Lease costs: | | | | |
| Operating lease costs | Commission, transportation and other | $ | 18,860 | | $ | 38,349 | | $ | 76,226 | |
| Operating lease costs | Other operating expenses | 23,261 | | 30,955 | | 27,868 | |
| Operating lease costs | Marketing, selling and administrative expenses | 18,027 | | 21,971 | | 18,837 | |
| Finance lease costs: | | | | |
| Amortization of right-of-use-assets | Depreciation and amortization expenses | 16,814 | | 6,901 | | 22,044 | |
| Interest on lease liabilities | Interest expense, net of interest capitalized | 2,593 | | 4,429 | | 8,355 | |
| Total lease costs | | $ | 79,555 | | $ | 102,605 | | $ | 153,330 | |
In addition, certain of our berth agreements include variable lease costs based on the number of passengers berthed. During the twelve months ended December 31, 2021, we had no variable lease costs recorded within Commission, transportation and other in our consolidated statement of comprehensive income (loss).
Weighted average of the remaining lease terms and weighted average discount rates are as follows: | | | | | | | | |
| As of December 31, 2021 | As of December 31, 2020 |
| Weighted average of the remaining lease term | | |
| Operating leases | 18.18 | 7.8 |
| Finance leases | 23.96 | 41.2 |
| Weighted average discount rate | | |
| Operating leases | 6.52 | % | 4.59 | % |
| Finance leases | 5.54 | % | 6.89 | % |
Supplemental cash flow information related to leases is as follows (in thousands): | | | | | | | | | | | |
| Year ended December 31, 2021 | Year ended December 31, 2020 | Year ended December 31, 2019 |
| Cash paid for amounts included in the measurement of lease liabilities: | | | |
| Operating cash flows from operating leases | $ | 42,759 | | $ | 89,179 | | $ | 125,307 | |
| Operating cash flows from finance leases | $ | 2,593 | | $ | 4,429 | | $ | 8,355 | |
| Financing cash flows from finance leases | $ | 23,522 | | $ | 19,778 | | $ | 32,090 | |
| | | |
| | | |
| | | |
| | | |
ROYAL CARIBBEAN CRUISES LTD.
NOTES TO THE CONSOLIDATED FINANCIAL STATEMENTS (Continued)
As of December 31, 2021,2023, maturities related to lease liabilities were as follows (in thousands)millions): | | | | | | | | |
| Years | Operating Leases | Finance Leases |
| 2022 | $ | 101,445 | | $ | 72,076 | |
| 2023 | 104,585 | | 52,340 | |
| 2024 | 85,463 | | 43,497 | |
| 2025 | 80,182 | | 43,089 | |
| 2026 | 74,626 | | 37,900 | |
| Thereafter | 826,226 | | 632,709 | |
| Total lease payments | 1,272,527 | | 881,611 | |
| Less: Interest | (668,879) | | (409,336) | |
| Present value of lease liabilities | $ | 603,648 | | $ | 472,275 | |
Operating lease payments do not include any costs related to options to extend lease terms as none are reasonably certain of being exercised.
Right-of-use assets impairments
During the year ended December 31, 2020, we identified that the undiscounted cash flows for certain right-of-use assets were less than their carrying values due to the negative impact of COVID-19. We evaluated these assets pursuant to our long-lived asset impairment test, resulting in an impairment charge of $65.9 million to write down these assets to their estimated fair values during the year ended December 31, 2020. For the year ended December 31, 2021, there were no impairments to right-of-use assets. | | | | | | | | | | | |
| Years | Operating Leases | | Finance Leases |
| 2024 | $ | 113 | | | $ | 47 | |
| 2025 | 106 | | | 45 | |
| 2026 | 96 | | | 39 | |
| 2027 | 76 | | | 38 | |
| 2028 | 69 | | | 37 | |
| Thereafter | 1,030 | | | 683 | |
| Total lease payments | 1,490 | | | 889 | |
| Less: Interest | (812) | | | (520) | |
| Present value of lease liabilities | $ | 678 | | | $ | 369 | |
Note 10. Shareholders' Equity
On January 1, 2022, we adopted ASU 2020-06 using the modified retrospective approach to recognize our convertible notes as single liability instruments. As a result of the adoption of this pronouncement, the cumulative effect to Shareholders' equity was a reduction of $162 million. For further information regarding the entry recorded and the adoption of ASU 2020-06, refer to Note 2. Summary of Significant Accounting Policies.
Common Stock Issued
During March 2021, we issued 16.9 million shares of common stock, par value $0.01 per share, at a price of $91.00 per share. We received net proceeds of $1.5 billion from the sale of our common stock, after deducting the estimated offering expenses payable by us.
During October 2020, we issued 9.6 million shares of common stock, par value $0.01 per share, at a price of $60.00 per share. Dividends
We received net proceeds of $557.4 million fromdid not declare any dividends during the sale of our common stock, after deducting the underwriters’ discount and the estimated offering expenses payable by us.
During December 2020, we issued 13.0 million shares of common stock, par value $0.01 per share, at an average price of $76.65 per share. We received net proceeds of $994.6 million after deducting the underwriters’ discount and the estimated offering expenses payable by us. Of the total proceeds, $868.6 million was received as ofyears ended December 31, 20202023, December 31, 2022, and the remainder was received in January ofDecember 31, 2021.
Dividends Declared
During the first quarter of 2020 we declared a cash dividend on our common stock of $0.78 per share which was paid in the second quarter of 2020. During the first quarter of 2020, we also paid a cash dividend on our common stock of $0.78 per share, which was declared during the fourth quarter of 2019.
During the second quarter of 2020, we agreed with We were previously restricted under certain of our lenders notcredit facilities from paying dividends while waivers to pay dividends or engage in common stock repurchases for so long as our debt covenant waivers arethe financial covenants within such facilities were in effect. In addition,While the waivers have now expired, in the event we declare a dividend, or engage in share repurchases, we will need to repay the principal amounts deferred under our export credit facilities. Accordingly,
Noncontrolling Interests
Effective March 31, 2023, we did not declareclosed the partnership with iCON. We sold 80% of the entity which owns our terminal at PortMiami for $208.9 million and retained a dividend from the second quarter20% minority interest. The cash consideration received, net of 2020. Pursuant to amendments made to these agreements during the first quarter of 2021, the restrictions on paying cash dividendstransaction costs, was allocated between paid-in capital and effectuating share repurchases were extended through and including the third quarter of 2022.
Common Stock Repurchase Program
ROYAL CARIBBEAN CRUISES LTD.
NOTES TO THE CONSOLIDATED FINANCIAL STATEMENTS (Continued)
During the quarter ended on June 30, 2020, the 24-month common stock repurchase program authorized by our board of directors on May 9, 2018 had expired. In connection with our debt covenant waivers, we agreed with our lenders not to engage in stock repurchases for so long as our debt covenant waivers are in effect. Effectivenoncontrolling interest in the first quarteraccompanying consolidated statement of 2021,shareholders' equity for the agreement with our lendersyear ended December 31, 2023. Refer to suspend stock repurchases is extended throughNote 7. Investments and Other Assets for further information on the third quarter of 2022.transaction.
Note 11. Stock-Based Employee Compensation
We currently have awards outstanding under 1one stock-based compensation plan, our 2008 Equity Plan, which provides for awards to our officers, directors and key employees. The 2008 Equity Plan, as amended, provides for the issuance of up to 14,000,00010,083,570 shares of our common stock pursuant to grants of (i) incentive and non-qualified stock options, (ii) stock appreciation rights, (iii) stock awards (including time-based and/or performance-based stock awards) and (iv) restricted stock units (including time-based and performance-based restricted stock units). During any calendar year, no one individual (other than non-employee members of our board of directors) may be granted awards of more than 500,000 shares and no non-employee member of our board of directors may be granted awards with a value, in excessmeasured as of $500,000 at the grant date. Options and restricteddate, which together with cash compensation paid to such director for such calendar year, would exceed $750,000. Restricted stock units outstanding as of December 31, 2021,2023, generally vest in equal installments overthree or four years from the date of grant. In addition, performance shares and performance share units generally vest in three years. With certain limited exceptions, awards are
ROYAL CARIBBEAN CRUISES LTD.
NOTES TO THE CONSOLIDATED FINANCIAL STATEMENTS (Continued)
forfeited if the recipient ceases to be an employee before the shares vest.
Prior to 2012, our officers received a combination of We have not issued stock options since 2016, and restrictedall stock units. Beginning in 2012, ouroptions have been exercised as of December 31, 2021. As a result, no Stock option expense has been recognized for the years ended December 31, 2023, 2022 and 2021.
Our officers instead receive their long-term incentive awards through a combination of performance share units and restricted stock units. Each performance share unit award is expressed as a target number of performance share units based upon the fair market value of our common stock on the date the award is issued. The actual number of shares underlying each award (not to exceed 200% of the target number of performance share units) will be determined based upon the Company's achievement of a specified performance target range. In 2021,2023, we issued a target number of 296,798314,197 performance share units, which will vest approximately three years following the award issue date. The performance payout of these grants will be based on return on the Company's invested capital ("ROIC"), earnings per share ("EPS"), EBITDA per APCD, and leverageCarbon Intensity Reduction for the year ended December 31, 2023, to December 31, 2025, as may be adjusted by the Talent and Compensation Committee of our board of directors in early 20242026 for events that are outside of management's control.
Beginning in 2016, ourOur senior officers meeting certain minimum age and service criteria receive their long-term incentive awards through a combination of restricted stock awards and restricted stock units. The restricted stock awards are subject to both performance and time-based vesting criteria while the restricted stock units are subject only to time-based vesting criteria. Each restricted stock award is issued in an amount equal to 200% of the target number of shares underlying the award based upon the fair market value of our common stock on the date the award is issued. Declared dividends accrue (but do not get paid) on the restricted stock awards during the vesting period, with the accrued amounts to be paid out following vesting only on the number of shares underlying the award which actually vest based on satisfaction of the performance criteria. The actual number of shares that vest (not to exceed 200% of the shares) will be determined based upon the Company's achievement of a specified performance target range.
In 2021,2023, we issued 350,996354,822 restricted stock awards, representing 200%300% of the target number of shares underlying the award, all of which are considered issued and outstanding from the date of issuance, however;issuance; however, grantees will only retain those shares earned as the result of the Company achieving the performance goals during the measurement period. The performance payout of the 20212023 awards will be based on the Company's ROIC, EPS, EBITDA per APCD, and leverageCarbon Intensity Reduction for the year ended December 31, 2023,2024, as may be adjusted by the Talent and Compensation Committee of our board of directors in early 20242025 for events that are outside of management's control.
On January 24, 2018, the Company issued a one-time bonus award for all non-officer employees. These awards vested, in equal installments, over the 3 years following the award issue date. For shoreside eligible employees, awards were issued as equity-settled restricted stock units. As of December 31, 2020, these awards have fully vested.
We also provide an Employee Stock Purchase Plan ("ESPP") to facilitate the purchase by employees of up to 2,800,000 shares of common stock in the aggregate. Offerings to employees are made on a quarterly basis. Subject to certain limitations, the purchase price for each share of common stock is equal to 85% of the average of the market prices of the common stock as reported on the New York Stock Exchange on the first business day of the purchase period and the last business day of each month of the purchase period. During the years ended December 31, 2023, 2022 and 2021, 2020151,989, 171,279 and 2019, 136,480 184,936 and 91,586 shares of our common stock were purchased under the ESPP at a weighted-average price of $71.23, $44.01 and $70.95, $48.08 and $98.20, respectively.
ROYAL CARIBBEAN CRUISES LTD.
NOTES TO THE CONSOLIDATED FINANCIAL STATEMENTS (Continued)
Total compensation expense recognized for employee stock-based compensation for the years ended December 31, 2021, 20202023, 2022 and 20192021 was as follows (in thousands)millions):
| | | | | | | | | | | | | | | | | |
| Employee Stock-Based Compensation |
| Classification of expense | 2021 | | 2020 | | 2019 |
| Marketing, selling and administrative expenses | $ | 63,638 | | | $ | 39,780 | | | $ | 75,930 | |
| | | | | |
| Total compensation expense | $ | 63,638 | | | $ | 39,780 | | | $ | 75,930 | |
The fair value of each stock option grant is estimated on the date of grant using the Black-Scholes option pricing model. The estimated fair value of stock options, less estimated forfeitures, is amortized over the vesting period using the graded-vesting method. We did not issue any stock options during the years ended December 31, 2021, 2020 and 2019. | | | | | | | | | | | | | | | | | |
| Employee Stock-Based Compensation |
| Classification of expense | 2023 | | 2022 | | 2021 |
| Marketing, selling and administrative expenses | $ | 126 | | | $ | 36 | | | $ | 64 | |
| Total compensation expense | $ | 126 | | | $ | 36 | | | $ | 64 | |
Stock option activity and information about stock options outstanding are summarized in the following table: | | | | | | | | | | | | | | | | | | | | | | | |
| Stock Option Activity | Number of
Options | | Weighted-
Average
Exercise
Price | | Weighted-
Average
Remaining
Contractual
Term | | Aggregate Intrinsic Value(1) |
| | | | | (years) | | (in thousands) |
| Outstanding at January 1, 2021 | 49,647 | | | $ | 46.18 | | | 0.11 | | $ | 1,355 | |
| Granted | — | | | — | | | — | | | — | |
| Exercised | (49,647) | | | $ | 46.18 | | | — | | | — | |
| Canceled | — | | | $ | — | | | — | | | — | |
| Outstanding at December 31, 2021 | — | | | $ | — | | | — | | | $ | — | |
| Vested at December 31, 2021 | — | | | $ | — | | | — | | | $ | — | |
| Options Exercisable at December 31, 2021 | — | | | $ | — | | | — | | | $ | — | |
(1)The intrinsic value represents the amount by which the fair value of stock exceeds the option exercise price.
The total intrinsic value of stock options exercised during the years ended December 31, 2021, 2020 and 2019 was $1.3 million, $1.5 million and $8.1 million, respectively. As of December 31, 2021, there was no unrecognized compensation cost, net of estimated forfeitures, related to stock options granted under our stock incentive plan. Additionally, there were no stock options outstanding as of December 31, 2021.
Restricted stock units are converted into shares of common stock upon vesting or, if applicable, are settled on a 1-for-oneone-for-one basis. The cost of these awards is determined using the fair value of our common stock on the date of the grant, and compensation expense is recognized over the vesting period. Restricted stock activity is summarized in the following table: | | | | | | | | | | | |
| Restricted Stock Units Activity | Number of
Awards | | Weighted-
Average
Grant Date
Fair Value |
| Non-vested share units as of January 1, 2021 | 972,592 | | | $ | 91.26 | |
| Granted | 568,107 | | | $ | 85.08 | |
| Vested | (448,469) | | | $ | 90.90 | |
| Canceled | (97,192) | | | $ | 89.73 | |
| Non-vested share units as of December 31, 2021 | 995,038 | | | $ | 88.19 | |
The weighted-average estimated fair value of restricted stock units granted during the years ended December 31, 2020 and 2019 was $78.51 and $112.13, respectively. The total fair value of shares released on the vesting of restricted stock units during the years ended December 31, 2021, 2020 and 2019 was $36.1 million, $31.2 million, and $30.8 million, respectively. As of December 31, 2021, we had $42.3 million of total unrecognized compensation expense, net of estimated forfeitures, related to restricted stock unit grants, which will be recognized over the weighted-average period of 1.16 years.
ROYAL CARIBBEAN CRUISES LTD.
NOTES TO THE CONSOLIDATED FINANCIAL STATEMENTS (Continued)
| | | | | | | | | | | |
| Restricted Stock Units Activity | Number of
Awards | | Weighted-
Average
Grant Date
Fair Value |
| Non-vested share units as of January 1, 2023 | 983,073 | | | $ | 80.58 | |
| Granted | 622,754 | | | 75.26 | |
| Vested | (441,418) | | | 83.04 | |
| Canceled | (57,651) | | | 78.49 | |
| Non-vested share units as of December 31, 2023 | 1,106,758 | | | $ | 76.72 | |
The weighted-average estimated fair value of restricted stock units granted during the years ended December 31, 2022 and 2021 was $72.21 and $85.08, respectively. The total fair value of shares released on the vesting of restricted stock units during the years ended December 31, 2023, 2022 and 2021 was $33 million, $30 million, and $36 million, respectively. As of December 31, 2023, we had $38 million of total unrecognized compensation expense, net of estimated forfeitures, related to restricted stock unit grants, which will be recognized over the weighted-average period of 0.91 years.
Performance share units are converted into shares of common stock upon vesting on a 1-for-oneone-for-one basis. We estimate the fair value of each performance share when the grant is authorized and the related service period has commenced. We remeasure the fair value of our performance shares in each subsequent reporting period until the grant date has occurred, which is the date when the performance conditions are satisfied. We recognize compensation cost over the vesting period based on the probability of the service and performance conditions being achieved adjusted for each subsequent fair value measurement until the grant date. If the specified service and performance conditions are not met, compensation expense will not be recognized and any previously recognized compensation expense will be reversed. Performance share units activity is summarized in the following table:
| | Performance Share Units Activity | Performance Share Units Activity | Number of
Awards | | Weighted-
Average
Grant Date
Fair Value | Performance Share Units Activity | Number of
Awards | | Weighted-
Average
Grant Date
Fair Value |
| Non-vested share units as of January 1, 2021 | 267,722 | | | $ | 109.34 | |
| Non-vested share units as of January 1, 2023 | |
| Granted | Granted | 296,798 | | | $ | 84.83 | |
| Vested | Vested | (66,377) | | | $ | 123.49 | |
| Canceled | Canceled | (31,791) | | | $ | 98.78 | |
| Non-vested share units as of December 31, 2021 | 466,352 | | | $ | 92.45 | |
| Non-vested share units as of December 31, 2023 | |
The weighted-average estimated fair value of performance share units granted during the years ended December 31, 20202022 and 20192021 was $95.81$79.80 and $87.39$84.83, respectively. The total fair value of shares released on the vesting of performance share units during the years ended December 31, 2023, 2022 and 2021 2020 and 2019 was $5.6$7 million, $24.6$5 million and $23.0$6 million, respectively. As of December 31, 2021,2023, we had $14.8$34 million of total unrecognized compensation expense, net of estimated forfeitures, related to performance share unit grants, which will be recognized over the weighted-average period of 1.51 year.1.31 years.
The shares underlying our restricted stock awards to age and service eligible senior officers are issued as of the grant date in an amount equal to 200% of the target number of shares. Following the vesting date, the restrictions will lift with respect to the number of shares for which the performance criteria was met and any excess shares will be canceled. Dividends will accrue on the issued restricted shares during the vesting period, but will not be paid to the recipient until the awards vest and the final number of shares underlying the award is determined, at which point, the dividends will be paid in cash only on the earned shares. We estimate the fair value of each restricted stock award when the grant is authorized and the related service period has commenced. We remeasure the fair value of these restricted stock awards in each subsequent reporting period until the grant date has occurred, which is the date when the performance conditions are satisfied. We recognize compensation cost over the vesting period based on the probability of the service and performance conditions being achieved adjusted for each subsequent fair value measurement until the grant date. If the specified service and performance conditions are not met, compensation expense will not be recognized, any previously recognized compensation expense will be reversed, and any unearned shares will be returned to the Company. Restricted stock awards activity is summarized in the following table:
| | | | | | | | | | | |
| Restricted Stock Awards Activity | Number of
Awards | | Weighted-
Average
Grant Date
Fair Value |
| Non-vested share units as of January 1, 2021 | 575,432 | | | $ | 116.83 | |
| Granted | 350,996 | | | $ | 84.83 | |
| Vested | (60,011) | | | $ | 129.23 | |
| Canceled | (69,205) | | | $ | 123.33 | |
| Non-vested share units as of December 31, 2021 | 797,212 | | | $ | 101.25 | |
ROYAL CARIBBEAN CRUISES LTD.
NOTES TO THE CONSOLIDATED FINANCIAL STATEMENTS (Continued)
| | | | | | | | | | | |
| Restricted Stock Awards Activity | Number of
Awards | | Weighted-
Average
Grant Date
Fair Value |
| Non-vested share units as of January 1, 2023 | 773,966 | | | $ | 92.28 | |
| Granted | 354,822 | | | 74.59 | |
| Vested | (47,611) | | | 110.21 | |
| Canceled | (213,313) | | | 110.21 | |
| Non-vested share units as of December 31, 2023 | 867,864 | | | $ | 79.65 | |
The weighted-average estimated fair value of restricted stock awards granted during the years ended December 31, 20202022 and 20192021 was $110.21$79.80 and $118.08,$84.83, respectively. As of December 31, 2021,2023, we had $3.3$3 million of total unrecognized compensation expense, net of estimated forfeitures, related to restricted stock award grants, which will be recognized over the weighted-average period of 1.361.17 years.
ROYAL CARIBBEAN CRUISES LTD.
NOTES TO THE CONSOLIDATED FINANCIAL STATEMENTS (Continued)
Note 12. Earnings (Loss) Earnings Per Share
A reconciliation between basic and diluted earningsEarnings (Loss) per share is as follows (in thousands,millions, except per share data): | | | | | | | | | | | | | | | | | |
| Year Ended December 31, |
| 2021 | | 2020 | | 2019 |
| Net (Loss) Income attributable to Royal Caribbean Cruises Ltd. for basic and diluted (loss) earnings per share | $ | (5,260,499) | | | $ | (5,797,462) | | | $ | 1,878,887 | |
| Weighted-average common shares outstanding | 251,812 | | | 214,335 | | | 209,405 | |
| Dilutive effect of stock-based awards | — | | | — | | | 525 | |
| Diluted weighted-average shares outstanding | 251,812 | | | 214,335 | | | 209,930 | |
| Basic (loss) earnings per share | $ | (20.89) | | | $ | (27.05) | | | $ | 8.97 | |
| Diluted (loss) earnings per share | $ | (20.89) | | | $ | (27.05) | | | $ | 8.95 | |
| | | | | | | | | | | | | | | | | |
| Year Ended December 31, |
| 2023 | | 2022 | | 2021 |
| Net Income (loss) attributable to Royal Caribbean Cruises Ltd. for basic and diluted loss per share | $ | 1,697 | | | $ | (2,156) | | | $ | (5,260) | |
| Add convertible notes interest | 88 | | | — | | | — | |
| Net Income (Loss) attributable to Royal Caribbean Cruises Ltd. for diluted earnings (loss) per share | 1,785 | | | (2,156) | | | (5,260) | |
| Weighted-average common shares outstanding | 256 | | | 255 | | | 252 | |
| Dilutive effect of stock-based awards | 1 | | | — | | | — | |
| Diluted effect of convertible notes | 26 | | | — | | | — | |
| Diluted weighted-average shares outstanding | 283 | | | 255 | | | 252 | |
| Basic earnings (loss) per share | $ | 6.63 | | | $ | (8.45) | | | $ | (20.89) | |
| Diluted earnings (loss) per share | $ | 6.31 | | | $ | (8.45) | | | $ | (20.89) | |
Effective January 1, 2022, we use the if-converted method to calculate the dilutive impact of our convertible notes that may be settled in cash or shares. In 2021, the dilutive impact was determined using the treasury stock method. There were approximatelyno antidilutive shares for year ended December 31, 2023, compared to 31,027,815 and 504,250 and 282,118 antidilutive shares from our stock-based awards and convertible notes for the years ended December 31, 2022 and 2021, and 2020, respectively. There were no antidilutive shares for the year ended December 31, 2019.
While the criteria for conversion of our convertible notes has not been met, the shares that would be issued upon conversion of the notes would be antidilutive for the year ended December 31, 2021.
Note 13. Retirement Plan
We maintain a defined contribution plan covering shoreside employees. Effective January 1, 2016, we commenced annual, non-elective contributions to the plan on behalf of all eligible participants equal to 3% of participants' eligible earnings. Additional annual contributions to the plan are discretionary and are based on fixed percentages of participants' salaries and years of service, not to exceed certain maximums. Contribution expenses were $17.9$21 million, $18.4$20 million and $21.2$18 million for the years ended December 31, 2021, 20202023, 2022 and 2019,2021, respectively.
Note 14. Income Taxes
We are subject to corporate income taxes in countries where we have operations or subsidiaries. We and the majority of our ship-operating and vessel-owning subsidiaries are currently exempt from U.S. corporate income tax on U.S. source income from the international operation of ships pursuant to Section 883 of the Internal Revenue Code. Regulations under Section 883 have limited the activities that are considered the international operation of a ship or incidental thereto. Accordingly, our provision for U.S. federal and state income taxes includes taxes on certain activities not considered incidental to the international operation of our ships.
ROYAL CARIBBEAN CRUISES LTD.
NOTES TO THE CONSOLIDATED FINANCIAL STATEMENTS (Continued)
Additionally, one of our ship-operating subsidiaries is subject to tax under the tonnage tax regime of the United Kingdom. Under this regime, income from qualifying activities is subject to corporate income tax, but the tax is computed by reference to the tonnage of the ship or ships registered under the relevant provisions of the tax regimes (the "relevant shipping profits"), which replaces the regular taxable income base. Income from activities not considered qualifying activities, which we do not consider significant, remains subject to United-Kingdom corporate income tax.
For the year ended December 31, 2021,2023, we had an income tax benefitexpense of approximately $45.2$6 million primarily driven by income tax from our non-US operations and items not qualifying under Section 883. For the yearyears ended December 31, 20202022 and 2021 we had an income tax expense of approximately $4 million and an income tax benefit of approximately $15.0$45 million, and for year ended December 31, 2019 income tax expense was $32.6 million,respectively for items not qualifying under Section 883, tonnage tax and income taxes for the remainder of our subsidiaries. Income taxes are recorded within Other (expense) income (expense). In addition, all interest expense and penalties related to income tax liabilities are classified as income tax expense within Other (expense) income (expense).
For a majority of our subsidiaries, we do not expect to incur income taxes on future distributions of undistributed earnings. Accordingly, no deferred income taxes have been provided for the distribution of these earnings. Where we do expect to incur income taxes on future distributions of undistributed earnings, we have provided for deferred taxes, which we do not consider significant to our operations.
As of December 31, 2021,2023, the Company had deferred tax assets for U.S. and foreign net operating losses (“NOLs”) of approximately $56.4$57 million. We have provided a valuation allowance for approximately $20.8$19 million of these NOLs. $11.6NOLs, of which $8 million of the NOLs deferred tax assets relate to NOLs which are subject to expireexpiration between 20222024 and 2033.
ROYAL CARIBBEAN CRUISES LTD.
NOTES TO THE CONSOLIDATED FINANCIAL STATEMENTS (Continued)
2042.Our deferred tax assets and deferred tax liabilities and corresponding valuation allowances related to our operations were not material as of December 31, 20212023 and 2020.2022.
We regularly review deferred tax assets for recoverability based on our history of earnings, expectations of future earnings, and tax planning strategies. Realization of deferred tax assets ultimately depends on the existence of sufficient taxable income to support the amount of deferred taxes. A valuation allowance is recorded in those circumstances in which we conclude it is not more-likely-than-not we will recover the deferred tax assets prior to their expiration.
Note 15. Changes in Accumulated Other Comprehensive (Loss) Income (Loss)
The following table presents the changes in accumulated other comprehensive loss by component for the years ended December 31, 2023, 2022 and 2021 2020 and 2019 (in thousands):
| | | | | | | | | | | | | | | | | | | | | | | | | | |
| | Changes related to cash flow derivative hedges | | Changes in defined
benefit plans | | Foreign currency translation adjustments | | Accumulated other comprehensive (loss) income |
| | | | | | | | |
| Accumulated comprehensive loss at January 1, 2019 | | $ | (537,216) | | | $ | (26,023) | | | $ | (64,495) | | | $ | (627,734) | |
| Other comprehensive income (loss) before reclassifications | | (146,108) | | | (20,314) | | | 869 | | | (165,553) | |
| Amounts reclassified from accumulated other comprehensive loss | | (5,205) | | | 779 | | | — | | | (4,426) | |
| Net current-period other comprehensive income (loss) | | (151,313) | | | (19,535) | | | 869 | | | (169,979) | |
| | | | | | | | |
| Accumulated comprehensive loss at January 1, 2020 | | (688,529) | | | (45,558) | | | (63,626) | | | (797,713) | |
| Other comprehensive income (loss) before reclassifications | | (41,109) | | | (22,051) | | | (28,698) | | | (91,858) | |
| Amounts reclassified from accumulated other comprehensive loss | | 79,119 | | | 2,067 | | | 69,044 | | | 150,230 | |
| Net current-period other comprehensive (loss) income | | 38,010 | | | (19,984) | | | 40,346 | | | 58,372 | |
| | | | | | | | |
| Accumulated comprehensive loss at January 1, 2021 | | (650,519) | | | (65,542) | | | (23,280) | | | (739,341) | |
| Other comprehensive (loss) income before reclassifications | | (16,667) | | | 4,790 | | | 15,703 | | | 3,826 | |
| Amounts reclassified from accumulated other comprehensive loss | | 20,713 | | | 3,917 | | | — | | | 24,630 | |
| Net current-period other comprehensive (loss) income | | 4,046 | | | 8,707 | | | 15,703 | | | 28,456 | |
| | | | | | | | |
| Accumulated comprehensive loss at December 31, 2021 | | $ | (646,473) | | | $ | (56,835) | | | $ | (7,577) | | | $ | (710,885) | |
The following table presents reclassifications out of accumulated other comprehensive loss for the years ended December 31, 2021, 2020 and 2019 (in thousands)millions):
ROYAL CARIBBEAN CRUISES LTD.
NOTES TO THE CONSOLIDATED FINANCIAL STATEMENTS (Continued)
| | | | | | | | | | | | | | | | | | | | | | | | | | |
| | Amount of Gain (Loss) Reclassified from Accumulated Other Comprehensive Loss into (Loss) Income |
| Details about Accumulated Other Comprehensive Loss Components | | Year Ended December 31, 2021 | | Year Ended December 31, 2020 | | Year Ended December 31, 2019 | | Affected Line Item in Statements of Comprehensive Income (Loss) |
| Gain (loss) on cash flow derivative hedges: | | | | | | | | |
| | | | | | | | |
| | | | | | | | |
| Interest rate swaps | | (43,185) | | | (25,267) | | | (4,289) | | | Interest expense, net of interest capitalized |
| Foreign currency forward contracts | | (15,359) | | | (14,679) | | | (14,063) | | | Depreciation and amortization expenses |
| Foreign currency forward contracts | | (2,797) | | | (7,315) | | | (5,080) | | | Other income (expense) |
| | | | | | | | |
| | | | | | | | |
| | | | | | | | |
| Fuel swaps | | (409) | | | 3,549 | | | (1,292) | | | Other income (expense) |
| Fuel swaps | | 41,037 | | | (35,407) | | | 29,929 | | | Fuel |
| | (20,713) | | | (79,119) | | | 5,205 | | | |
| Amortization of defined benefit plans: | | | | | | | | |
| Actuarial loss | | (3,917) | | | (2,067) | | | (779) | | | Payroll and related |
| | | | | | | | |
| | (3,917) | | | (2,067) | | | (779) | | | |
| Release of foreign cumulative translation due to sale or liquidation of businesses: | | | | | | | | |
| Foreign cumulative translation | | — | | | (69,044) | | | — | | | Other operating |
| Total reclassifications for the period | | $ | (24,630) | | | $ | (150,230) | | | $ | 4,426 | | | |
| | | | | | | | | | | | | | | | | | | | | | | | | | |
| | Changes related to cash flow derivative hedges | | Changes in defined
benefit plans | | Foreign currency translation adjustments | | Accumulated other comprehensive (loss) income |
| | | | | | | | |
| Accumulated comprehensive loss at January 1, 2021 | | $ | (651) | | | $ | (66) | | | $ | (23) | | | $ | (740) | |
| Other comprehensive (loss) income before reclassifications | | (17) | | | 5 | | | 16 | | | 4 | |
| Amounts reclassified from accumulated other comprehensive loss | | 21 | | | 4 | | | — | | | 25 | |
| Net current-period other comprehensive income | | 4 | | | 9 | | | 16 | | | 29 | |
| | | | | | | | |
| Accumulated comprehensive loss at January 1, 2022 | | (647) | | | (57) | | | (7) | | | (711) | |
| Other comprehensive income before reclassifications | | 171 | | | 46 | | | 10 | | | 227 | |
| Amounts reclassified from accumulated other comprehensive loss | | (163) | | | 3 | | | — | | | (160) | |
| Net current-period other comprehensive income | | 8 | | | 49 | | | 10 | | | 67 | |
| | | | | | | | |
| Accumulated comprehensive loss at January 1, 2023 | | (639) | | | (8) | | | 3 | | | (644) | |
| Other comprehensive income (loss) before reclassifications | | 3 | | | 6 | | | (9) | | | — | |
| Amounts reclassified from accumulated other comprehensive loss | | (30) | | | — | | | — | | | (30) | |
| Net current-period other comprehensive (loss) income | | (27) | | | 6 | | | (9) | | | (30) | |
| | | | | | | | |
| Accumulated comprehensive loss at December 31, 2023 | | $ | (666) | | | $ | (2) | | | $ | (6) | | | $ | (674) | |
The following table presents reclassifications out of accumulated other comprehensive loss for the years ended December 31, 2023, 2022 and 2021 (in millions):
| | | | | | | | | | | | | | | | | | | | | | | | | | |
| | Amount of Gain (Loss) Reclassified from Accumulated Other Comprehensive Loss into (Loss) Income |
| Details about Accumulated Other Comprehensive Loss Components | | Year Ended December 31, 2023 | | Year Ended December 31, 2022 | | Year Ended December 31, 2021 | | Affected Line Item in Statements of Comprehensive Income (Loss) |
| Gain (loss) on cash flow derivative hedges: | | | | | | | | |
| Interest rate swaps | | $ | 49 | | | $ | (12) | | | $ | (44) | | | Interest expense, net of interest capitalized |
| Foreign currency forward contracts | | (18) | | | (17) | | | (15) | | | Depreciation and amortization expenses |
| Foreign currency forward contracts | | (10) | | | (3) | | | (3) | | | Other (expense) income |
| Fuel swaps | | — | | | — | | | — | | | Other (expense) income |
| Fuel swaps | | 9 | | | 195 | | | 41 | | | Fuel |
| | 30 | | | 163 | | | (21) | | | |
| Amortization of defined benefit plans: | | | | | | | | |
| Actuarial loss | | — | | | (3) | | | (4) | | | Payroll and related |
| | | | | | | | |
| | | | | | | | |
| | | | | | | | |
| Total reclassifications for the period | | $ | 30 | | | $ | 160 | | | $ | (25) | | | |
During the year ended December 31, 2020, a $69.0 million net loss was recorded within Other expense in our consolidated statements of comprehensive (loss) income, consisting of a $92.6 million loss resulting from the recognition of a currency translation adjustment, partially offset by the recognition of a deferred $23.6 million foreign exchange gain related to the Pullmantur net investment hedge. In connection with the Pullmantur reorganization in 2020, we no longer have significant involvement in the Pullmantur operations and these amounts previously deferred in Accumulated othercomprehensive loss were recognized in earnings.
ROYAL CARIBBEAN CRUISES LTD.
NOTES TO THE CONSOLIDATED FINANCIAL STATEMENTS (Continued)
Note 16. Fair Value Measurements and Derivative Instruments
Fair Value Measurements
The estimated fair value of our financial instruments that are not measured at fair value, categorized based upon the fair value hierarchy, are as follows (in thousands)millions): | | | | | | | | | | | | | | | | | | | | | | | | | | | | | | | | | | | | | | | | | | | | | | | | | | | | | | | | | | | |
| Fair Value Measurements at December 31, 2021 | | Fair Value Measurements at December 31, 2020 |
| Description | Total Carrying Amount | | Total Fair Value | | Level 1(1) | | Level��2(2) | | Level 3(3) | | Total Carrying Amount | | Total Fair Value | | Level 1(1) | | Level 2(2) | | Level 3(3) |
| Assets: | | | | | | | | | | | | | | | | | | | |
| Cash and cash equivalents(4) | $ | 2,701,770 | | | $ | 2,701,770 | | | $ | 2,701,770 | | | — | | | — | | | $ | 3,684,474 | | | $ | 3,684,474 | | | $ | 3,684,474 | | | — | | | — | |
| Total Assets | $ | 2,701,770 | | | $ | 2,701,770 | | | $ | 2,701,770 | | | $ | — | | | $ | — | | | $ | 3,684,474 | | | $ | 3,684,474 | | | $ | 3,684,474 | | | $ | — | | | $ | — | |
| Liabilities: | | | | | | | | | | | | | | | | | | | |
| Long-term debt (including current portion of long-term debt)(5) | $ | 20,618,065 | | | $ | 22,376,480 | | | — | | | $ | 22,376,480 | | | — | | | $ | 18,706,359 | | | $ | 20,981,040 | | | — | | | $ | 20,981,040 | | | — | |
| Total Liabilities | $ | 20,618,065 | | | $ | 22,376,480 | | | $ | — | | | $ | 22,376,480 | | | $ | — | | | $ | 18,706,359 | | | $ | 20,981,040 | | | $ | — | | | $ | 20,981,040 | | | $ | — | |
| | | | | | | | | | | | | | | | | | | | | | | | | | | | | | | | | | | | | | | | | | | | | | | | | | | | | | | | | | | |
| Fair Value Measurements at December 31, 2023 | | Fair Value Measurements at December 31, 2022 |
| Description | Total Carrying Amount | | Total Fair Value | | Level 1(1) | | Level 2(2) | | Level 3(3) | | Total Carrying Amount | | Total Fair Value | | Level 1(1) | | Level 2(2) | | Level 3(3) |
| Assets: | | | | | | | | | | | | | | | | | | | |
| Cash and cash equivalents(4) | $ | 497 | | | $ | 497 | | | $ | 497 | | | $ | — | | | $ | — | | | $ | 1,935 | | | $ | 1,935 | | | $ | 1,935 | | | $ | — | | | $ | — | |
| Total Assets | $ | 497 | | | $ | 497 | | | $ | 497 | | | $ | — | | | $ | — | | | $ | 1,935 | | | $ | 1,935 | | | $ | 1,935 | | | $ | — | | | $ | — | |
| Liabilities: | | | | | | | | | | | | | | | | | | | |
| Long-term debt (including current portion of long-term debt)(5) | $ | 21,083 | | | $ | 23,700 | | | $ | — | | | $ | 23,700 | | | $ | — | | | $ | 23,040 | | | $ | 22,856 | | | $ | — | | | $ | 22,856 | | | $ | — | |
| Total Liabilities | $ | 21,083 | | | $ | 23,700 | | | $ | — | | | $ | 23,700 | | | $ | — | | | $ | 23,040 | | | $ | 22,856 | | | $ | — | | | $ | 22,856 | | | $ | — | |
(1)Inputs based on quoted prices (unadjusted) in active markets for identical assets or liabilities that we have the ability to access. Valuation of these items does not entail a significant amount of judgment.
(2)Inputs other than quoted prices included within Level 1 that are observable for the liability, either directly or indirectly. For unsecured revolving credit facilities and unsecured term loans, fair value is determined utilizing the income valuation approach. This valuation model takes into account the contract terms of our debt such as the debt maturity and the interest rate on the debt. The valuation model also takes into account the creditworthiness of the Company. We valued our senior notes and convertible notes using a quoted market price, which is considered a Level 2 input as it is observable in the market; however, these instruments have a limited trading volume and as such this fair value estimate is not necessarily indicative of the value at which the instruments could be retired or transferred.
(3)Inputs that are unobservable. The Company did not use any Level 3 inputs as of December 31, 20212023 and 2020.2022.
(4)Consists of cash and marketable securities with original maturities of less than 90 days.
(5)Consists of unsecured revolving credit facilities, senior notes, term loans and convertible notes. These amounts do not include our finance lease obligations or commercial paper.obligations.
Other Financial Instruments
The carrying amounts of accounts receivable, accounts payable, accrued interest, and accrued expenses and commercial paper approximate fair value as of December 31, 20212023 and 2020.2022.
Assets and liabilities that are recorded at fair value have been categorized based upon the fair value hierarchy. The following table presents information about the Company's financial instruments recorded at fair value on a recurring basis (in thousands)millions):
| | Fair Value Measurements at December 31, 2021 | | Fair Value Measurements at December 31, 2020 |
| Fair Value Measurements at December 31, 2023 | | | Fair Value Measurements at December 31, 2023 | | Fair Value Measurements at December 31, 2022 |
| Description | Description | Total Fair Value | | Level 1(1) | | Level 2(2) | | Level 3(3) | | Total Fair Value | | Level 1(1) | | Level 2(2) | | Level 3(3) | Description | Total Fair Value | | Level 1(1) | | Level 2(2) | | Level 3(3) | | Total Fair Value | | Level 1(1) | | Level 2(2) | | Level 3(3) |
| Assets: | Assets: | | | | | | | | | | | | | | | |
Derivative financial instruments(4) | Derivative financial instruments(4) | $ | 69,808 | | | $ | — | | | $ | 69,808 | | | $ | — | | | $ | 108,539 | | | $ | — | | | $ | 108,539 | | | $ | — | |
Derivative financial instruments(4) | |
Derivative financial instruments(4) | |
| | Total Assets | Total Assets | $ | 69,808 | | | $ | — | | | $ | 69,808 | | | $ | — | | | $ | 108,539 | | | $ | — | | | $ | 108,539 | | | $ | — | |
| Total Assets | |
| Total Assets | |
| Liabilities: | Liabilities: | | | | | | | | | | | | | | | |
Derivative financial instruments(5) | $ | 200,541 | | | $ | — | | | $ | 200,541 | | | $ | — | | | $ | 259,705 | | | $ | — | | | $ | 259,705 | | | $ | — | |
Derivative financial instruments(4) | |
Derivative financial instruments(4) | |
Derivative financial instruments(4) | |
| Total Liabilities | Total Liabilities | $ | 200,541 | | | $ | — | | | $ | 200,541 | | | $ | — | | | $ | 259,705 | | | $ | — | | | $ | 259,705 | | | $ | — | |
ROYAL CARIBBEAN CRUISES LTD.
NOTES TO THE CONSOLIDATED FINANCIAL STATEMENTS (Continued)
(1)Inputs based on quoted prices (unadjusted) in active markets for identical assets or liabilities that we have the ability to access. Valuation of these items does not entail a significant amount of judgment. No Level 1 inputs were used in fair value measurements of other financial instruments as of December 31, 2023 and 2022.
(2)Inputs other than quoted prices included within Level 1 that are observable for the asset or liability, either directly or indirectly. For foreign currency forward contracts, interest rate swaps and fuel swaps, fair value is derived using valuation models that utilize the income valuation approach. These valuation models take into account the contract terms, such as maturity as well as other inputs, such as foreign exchange rates and curves, fuel types, fuel curves and interest rate yield curves. Derivative instrument fair values take into account the creditworthiness of the counterparty and the Company.
(3)Inputs that are unobservable. No Level 3 inputs were used in fair value measurements of Otherother financial instruments as of December 31, 20212023 and December 31, 20202022
(4)Consists of foreign currency forward contracts, interest rate swaps and fuel swaps. Refer to the "Fair Value of Derivative Instruments" table for breakdown by instrument type.
(5)Consists of foreign currency forward contracts, interest rate swaps and fuel swaps. Refer to the "Fair Value of Derivative Instruments" table for breakdown by instrument type.
The reported fair values are based on a variety of factors and assumptions. Accordingly, the fair values may not represent actual values of the financial instruments that could have been realized as of December 31, 20212023 or 2020,2022, or that will be realized in the future, and do not include expenses that could be incurred in an actual sale or settlement.
Nonfinancial Instruments Recorded at Fair Value on a Nonrecurring Basis
The following tables presents information about the Company’s nonfinancialNonfinancial instruments recordedinclude items such as goodwill, indefinite-lived intangible assets, long-lived assets, right-of-use assets and equity method investments that are measured at fair value on a nonrecurring basis (in thousands):
| | | | | | | | | | | | | | |
| Fair Value Measurements at December 31, 2021 |
Description | Total Carrying Amount | Total Fair Value | Level 3 | Total Impairment for the year ended December 31, 2021 (1) |
Long-lived assets | — | | — | | — | | 55,213 | |
| | | | |
Total | — | | — | | — | | 55,213 | |
(1) Amount is primarily composed of construction in progress assets that were impaired during the year ended 2021 due to a reduction in scope or the decision to not complete the projects. The impairments were calculated based on orderly liquidation values. The fair value of these assets was estimated as of the date the assets were last impaired.
| | | | | | | | | | | | | | |
| Fair Value Measurement at December 31, 2020 |
| Description | Total Carrying Amount | Total Fair Value | Level 3 | Total Impairment for the year ended December 31, 2020 |
| Silversea Goodwill(1) | 508,578 | | 508,578 | | 508,578 | | 576,208 | |
| Indefinite-life intangible asset(2) | 318,700 | | 318,700 | | 318,700 | | 30,800 | |
| Long-lived assets(3) | 577,193 | | 577,193 | | 577,193 | | 727,063 | |
| Right-of-use assets(4) | 67,265 | | 67,265 | | 67,265 | | 65,909 | |
| Equity-method investments(5) | — | | — | | — | | 39,735 | |
| Total | 1,471,736 | | 1,471,736 | | 1,471,736 | | 1,439,715 | |
ROYAL CARIBBEAN CRUISES LTD.
NOTES TO THE CONSOLIDATED FINANCIAL STATEMENTS (Continued)
(1) We estimated the fair value of the Silversea Cruises reporting unit using a probability-weighted discounted cash flow model in combination with a market-based valuation approach. The principal assumptions used in the discounted cash flow model were (i) forecasted net revenues, primarily the timing of returning to normalized operations, occupancy rates from existingwhen events and expected ship deliveries, and terminal growth rate; and (ii) weighted average cost of capital (i.e., discount rate). The probability-weighted discounted cash flow model used our most current projected operating results for the upcoming fiscal year as a base. To that base we added future years’ cash flows through 2030 assuming multiple revenue and expense scenarios that reflect the impact of different global economic environments for this period on the Silversea Cruises' reporting unit. We assigned a probability to each revenue and expense scenario. We discounted the projected cash flows using rates specific to the Silversea Cruises' reporting unit based on its weighted-average cost of capital, which was determined to be 12.75%. The fair value of Silversea Cruises’ goodwill was estimated as of March 31, 2020, the date the asset was last impaired.
(2) Amount represents the Silversea Cruises trade name which makes up the majority of our indefinite-life intangible assets, totaling $321.5 million. We estimated the fair value of the Silversea Cruises trade name using a discounted cash flow model and the relief-from-royalty method and used a discount rate of 13.25%. Significant inputs in performing the fair value assessment for the trade name were (i) forecasted net revenues, primarily the timing of returning to normalized operations, occupancy rates from existing and expected ship deliveries, including options, and terminal growth rate; (ii) the royalty rate of '3.0%; and (iii) weighted average cost of capital (i.e., discount rate). The fair value of the Silversea Cruises trade name was estimated as of March 31, 2020, the date the asset was last impaired.
(3) Impairments primarily relate to certain vessels during 2020. In addition, certain construction in progress projects generated impairments during 2020. For the vessels impaired during the quarter ended March 31, 2020, we estimated the fair value of two of our vessels using a blended indication from the income and cost approaches and the fair value of the remaining vessels was estimated primarily based on their orderly liquidation values. For the vessels impaired during the quarter ended June 30, 2020, we estimated the fair value of the vessels using a modified market approach based oncircumstances indicate the carrying values and orderly liquidation values of the vessels. For the vessels impaired during the quarter ended December 31, 2020, we estimated thevalue is not recoverable. There were no material nonfinancial instruments recorded at fair value of the three Azamara vessels using a market approach. A significant input in performing the fair value assessments for these vessels was management's expected use of the vessels, which takes into consideration forecasted operating results. During the quarter ended September 30, 2020 and quarter ended December 31, 2020, construction in progress assets were impaired due to a reduction in scope or the decision to not complete the projects. The impairment was calculated based on orderly liquidation values. The fair value of these assets was estimated as of the date the asset was last impaired.
(4) Impairments to our right-of-use assets relate to certain of our berthing arrangements and a ship operating lease. We estimated the fair value of the berthing arrangements using estimated projected discounted cash flows and the fair value of the ship operating lease was estimated using a market approach. The fair value of the berthing arrangements was estimated as of March 31, 2020, the date these assets were last impaired. A significant input in performing the fair value assessments for these assets was our expected passenger headcount. The fair value of the ship operating lease was estimated as of December 31, 2020, the date this asset was last impaired,2023 and significant inputs in performing the fair value assessment using the market approach for this asset were the expected rate of return and remaining lease payments.
(5) We estimated the fair value of our other than temporarily impaired equity-method investments using a discounted cash flow model. A significant input in performing the fair value assessments for these assets was forecasted operating results for these investments. The fair value of these equity-method investments was estimated as of MarchDecember 31, 2020, the date these assets were last impaired. For further information on our equity method investments, refer to Note 7. Other Assets.
Master Netting Agreements
We have master International Swaps and Derivatives Association (“ISDA”) agreements in place with our derivative instrument counterparties. These ISDA agreements generally provide for final close out netting with our counterparties for all positions in the case of default or termination of the ISDA agreement. We have determined that our ISDA agreements provide us with rights of setoff on the fair value of derivative instruments in a gain position and those in a loss position with the same counterparty. We have elected not to offset such derivative instrument fair values in our consolidated balance sheets.
See Credit Related Contingent Features for further discussion on contingent collateral requirements for our derivative instruments.
ROYAL CARIBBEAN CRUISES LTD.
NOTES TO THE CONSOLIDATED FINANCIAL STATEMENTS (Continued)
The following table presents information about the Company’s offsetting of financial assets under master netting agreements with derivative counterparties (in thousands):
| | | | | | | | | | | | | | | | | | | | | | | | | | | | | | | | | | | | | | | | | | | | | | | | | | |
| | Gross Amounts not Offset in the Consolidated Balance Sheet that are Subject to Master Netting Agreements |
| | As of December 31, 2021 | | As of December 31, 2020 |
| | Gross Amount of Derivative Assets Presented in the Consolidated Balance Sheet | | Gross Amount of Eligible Offsetting
Recognized
Derivative Liabilities | | Cash Collateral
Received | | Net Amount of
Derivative Assets | | Gross Amount of Derivative Assets Presented in the Consolidated Balance Sheet | | Gross Amount of Eligible Offsetting
Recognized
Derivative Liabilities | | Cash Collateral
Received | | Net Amount of
Derivative Assets |
| | | | | | | | | | | | | | | | |
| Derivatives subject to master netting agreements | | $ | 69,808 | | | $ | (67,995) | | | $ | — | | | $ | 1,813 | | | $ | 108,539 | | | $ | (80,743) | | | $ | — | | | $ | 27,796 | |
| | | | | | | | | | | | | | | | |
| Total | | $ | 69,808 | | | $ | (67,995) | | | $ | — | | | $ | 1,813 | | | $ | 108,539 | | | $ | (80,743) | | | $ | — | | | $ | 27,796 | |
The following table presents information about the Company’s offsetting of financialand liabilities under master netting agreements with derivative counterparties (in thousands)millions):
| | | Gross Amounts not Offset in the Consolidated Balance Sheet that are Subject to Master Netting Agreements | | | | Gross Amounts not Offset in the Consolidated Balance Sheet that are Subject to Master Netting Agreements |
| | As of December 31, 2023 | | | | As of December 31, 2023 | | As of December 31, 2022 |
| | Gross Amount of Derivative Assets Presented in the Consolidated Balance Sheet | | | | Gross Amount of Derivative Assets Presented in the Consolidated Balance Sheet | | Gross Amount of Eligible Offsetting
Recognized
Derivative Liabilities | | Cash Collateral
Received | | Net Amount of
Derivative Assets | | Gross Amount of Derivative Assets Presented in the Consolidated Balance Sheet | | Gross Amount of Eligible Offsetting
Recognized
Derivative Liabilities | | Cash Collateral
Received | | Net Amount of
Derivative Assets |
| Derivatives subject to master netting agreements | |
| Total | |
| | Gross Amounts not Offset in the Consolidated Balance Sheet that are Subject to Master Netting Agreements |
| As of December 31, 2021 | | As of December 31, 2020 |
| Gross Amount of Derivative Liabilities Presented in the Consolidated Balance Sheet | | Gross Amount of Eligible Offsetting
Recognized
Derivative Assets | | Cash Collateral
Pledged | | Net Amount of
Derivative Liabilities | | Gross Amount of Derivative Liabilities Presented in the Consolidated Balance Sheet | | Gross Amount of Eligible Offsetting
Recognized
Derivative Assets | | Cash Collateral
Pledged | | Net Amount of
Derivative Liabilities |
| | | Gross Amount of Derivative Liabilities Presented in the Consolidated Balance Sheet | |
| | Gross Amount of Derivative Liabilities Presented in the Consolidated Balance Sheet | |
| | Gross Amount of Derivative Liabilities Presented in the Consolidated Balance Sheet | | | Gross Amount of Eligible Offsetting
Recognized
Derivative Assets | | Cash Collateral
Pledged | | Net Amount of
Derivative Liabilities | | Gross Amount of Derivative Liabilities Presented in the Consolidated Balance Sheet | | Gross Amount of Eligible Offsetting
Recognized
Derivative Assets | | Cash Collateral
Pledged | | Net Amount of
Derivative Liabilities |
| Derivatives subject to master netting agreements | Derivatives subject to master netting agreements | | $ | (200,541) | | | $ | 67,995 | | | $ | 44,411 | | | $ | (88,135) | | | $ | (259,705) | | | $ | 80,743 | | | $ | 57,273 | | | $ | (121,689) | |
| | Total | Total | | $ | (200,541) | | | $ | 67,995 | | | $ | 44,411 | | | $ | (88,135) | | | $ | (259,705) | | | $ | 80,743 | | | $ | 57,273 | | | $ | (121,689) | |
Concentrations of Credit Risk
We monitor our credit risk associated with financial and other institutions with which we conduct significant business, and to minimize these risks, we select counterparties with credit risks acceptable to us and we seek to limit our exposure to an individual counterparty. Credit risk, including, but not limited to, counterparty nonperformance under derivative instruments, our credit facilities and new ship progress payment guarantees, is not considered significant, as we primarily conduct business with large, well-established financial institutions, insurance companies and export credit agencies many of which we have long-term relationships with and which have credit risks acceptable to us or where the credit risk is spread out among a large number of counterparties. As of December 31, 2021,2023 and December 31, 2022, we had counterparty credit risk exposure under our derivative instruments of $1.9$125 million and $103 million, respectively, which was limited to the cost of replacing the contracts in the event of non-performance by the counterparties to the contracts, the majority of which are currently our lending banks. We do not anticipate nonperformance by any of our significant counterparties. In addition, we have established guidelines we follow regarding credit ratings and instrument maturities to maintain safety and liquidity. We do not normally require collateral or other security to support credit relationships; however, in certain circumstances this option is available to us.
Derivative Instruments
We are exposed to market risk attributable to changes in interest rates, foreign currency exchange rates and fuel prices. We try to mitigate these risks through a combination of our normal operating and financing activities and through the use of derivative financial instruments pursuant to our hedging practices and policies. The financial impact of these hedging instruments is primarily offset by corresponding changes in the underlying exposures being hedged. We achieve this by closely matching the notional amount, term and conditions of the derivative instrument with the underlying risk being hedged. Although certain of our derivative
ROYAL CARIBBEAN CRUISES LTD.
NOTES TO THE CONSOLIDATED FINANCIAL STATEMENTS (Continued)
financial instruments do not qualify or are not accounted for under hedge accounting, our objective is not to hold or issue derivative financial instruments for trading or other speculative purposes.
We enter into various forward, swap and option contracts to manage our interest rate exposure and to limit our exposure to fluctuations in foreign currency exchange rates and fuel prices. These instruments are recorded on the balance sheet at their fair value and the vast majority are designated as hedges. We also use non-derivative financial instruments designated as hedges of our net investment in our foreign operations and investments.
ROYAL CARIBBEAN CRUISES LTD.
NOTES TO THE CONSOLIDATED FINANCIAL STATEMENTS (Continued)
At inception of the hedge relationship, a derivative instrument that hedges the exposure to changes in the fair value of a firm commitment or a recognized asset or liability is designated as a fair value hedge. A derivative instrument that hedges a forecasted transaction or the variability of cash flows related to a recognized asset or liability is designated as a cash flow hedge.
Changes in the fair value of derivatives that are designated as fair value hedges are offset against changes in the fair value of the underlying hedged assets, liabilities or firm commitments. Gains and losses on derivatives that are designated as cash flow hedges are recorded as a component of Accumulated other comprehensive lossincome (loss) until the underlying hedged transactions are recognized in earnings. The foreign currency transaction gain or loss of our non-derivative financial instruments and the changes in the fair value of derivatives designated as hedges of our net investment in foreign operations and investments are recognized as a component of Accumulated other comprehensive lossincome (loss) along with the associated foreign currency translation adjustment of the foreign operation or investment. In certain hedges of our net investment in foreign operations and investments, we exclude forward points from the assessment of hedge effectiveness and we amortize the related amounts directly into earnings.
On an ongoing basis, we assess whether derivatives used in hedging transactions are "highly effective" in offsetting changes in the fair value or cash flow of hedged items. For our net investment hedges, we use the dollar offset method to measure effectiveness. For all other hedging programs, we use the long-haul method to assess hedge effectiveness using regression analysis for each hedge relationship. The methodology for assessing hedge effectiveness is applied on a consistent basis for each one of our hedging programs (i.e., interest rate, foreign currency ship construction, foreign currency net investment and fuel). For our regression analyses, we use an observation period of up to three years, utilizing market data relevant to the hedge horizon of each hedge relationship. High effectiveness is achieved when a statistically valid relationship reflects a high degree of offset and correlation between the changes in the fair values of the derivative instrument and the hedged item. If it is determined that a derivative is not highly effective as a hedge or hedge accounting is discontinued, any change in fair value of the derivative since the last date at which it was determined to be highly effective is recognized in earnings.
Cash flows from derivative instruments that are designated as fair value or cash flow hedges are classified in the same category as the cash flows from the underlying hedged items. In the event that hedge accounting is discontinued, cash flows subsequent to the date of discontinuance are classified within investing activities. Cash flows from derivative instruments not designated as hedging instruments are classified as investing activities.
We consider the classification of the underlying hedged item’s cash flows in determining the classification for the designated derivative instrument’s cash flows. We classify derivative instrument cash flows from hedges of benchmark interest rate or hedges of fuel expense as operating activities due to the nature of the hedged item. Likewise, we classify derivative instrument cash flows from hedges of foreign currency risk on our newbuild ship payments as investing activities.
Interest Rate Risk
Our exposure to market risk for changes in interest rates primarily relates to our debt obligations including future interest payments. At December 31, 20212023 and 2020,2022, approximately 65.7%83.2% and 64.5%75.0%, respectively, of our debt was effectively fixed.fixed-rate debt, which is net of our interest rate swap agreements. We use interest rate swap agreements to modify our exposure to interest rate movements and to manage our interest expense.
Market risk associated with our fixed ratefixed-rate debt is the potential increase in fair value resulting from a decrease in interest rates. We useAt December 31, 2023, there were no interest rate swap agreements that effectively convert a portion of ourfor fixed-rate debt to a floating-rate basis to manage this risk. At December 31, 2021, we maintained interest rate swap agreements on the following fixed-rate debt instruments:
| | | | | | | | | | | | | | | | | |
| Debt Instrument | Swap Notional as of December 31, 2021 (In thousands) | Maturity | Debt Fixed Rate | Swap Floating Rate: LIBOR plus | All-in Swap Floating Rate as of December 31, 2021 |
| Unsecured senior notes | 650,000 | | November 2022 | 5.25% | 3.63% | 3.79% |
| $ | 650,000 | | | | | |
ROYAL CARIBBEAN CRUISES LTD.
NOTES TO THE CONSOLIDATED FINANCIAL STATEMENTS (Continued)
These interest rate swap agreements are accounted for as fair value hedges.
Market risk associated with our long-term floating rate debt is the potential increase in interest expense from an increase in interest rates. We use interest rate swap agreements that effectively convert a portion of our floating-rate debt to a fixed-rate basis to manage this risk.the risk of increasing interest rates. At December 31, 2021,2023, we maintained interest rate swap agreements on the following floating-rate debt instruments: | | | | | | | | | | | | | | | | | |
| Debt Instrument | Swap Notional as of December 31, 2021 (In thousands) | Maturity | Debt Floating Rate | All-in Swap Fixed Rate |
Celebrity Reflection term loan | $ | 163,625 | | October 2024 | LIBOR plus | 0.40% | 2.85% |
Quantum of the Seas term loan | 306,250 | | October 2026 | LIBOR plus | 1.30% | 3.74% |
Anthem of the Seas term loan | 332,292 | | April 2027 | LIBOR plus | 1.30% | 3.86% |
Ovation of the Seas term loan | 449,583 | | April 2028 | LIBOR plus | 1.00% | 3.16% |
Harmony of the Seas term loan (1) | 427,142 | | May 2028 | EURIBOR plus | 1.15% | 2.26% |
Odyssey of the Seas term loan(2) | 421,667 | | October 2032 | LIBOR plus | 0.96% | 3.21% |
Odyssey of the Seas term loan(2) | 191,667 | | October 2032 | LIBOR plus | 0.96% | 2.84% |
| $ | 2,292,226 | | | | | |
| | | | | | | | | | | | | | | | | | | | | | | | | | | | | |
| Debt Instrument | | Swap Notional as of December 31, 2023 (In millions) | | Maturity | | Debt Floating Rate (3) | | All-in Fixed Rate |
Celebrity Reflection term loan | | $ | 55 | | | October 2024 | | Term SOFR | 0.40% | | 2.88% |
Quantum of the Seas term loan | | 184 | | | October 2026 | | Term SOFR | 1.30% | | 3.78% |
Anthem of the Seas term loan | | 211 | | | April 2027 | | Term SOFR | 1.30% | | 3.9% |
Ovation of the Seas term loan | | 311 | | | April 2028 | | Term SOFR | 1.00% | | 3.20% |
Harmony of the Seas term loan (1) | | 287 | | | May 2028 | | EURIBOR plus | 1.15% | | 2.26% |
Odyssey of the Seas term loan(2) | | 345 | | | October 2032 | | Term SOFR | 0.96% | | 3.28% |
Odyssey of the Seas term loan(2) | | 173 | | | October 2032 | | Term SOFR | 0.96% | | 2.91% |
| | $ | 1,566 | | | | | | | | |
(1) Interest rate swap agreements hedging the Euro-denominated term loan for Harmony of the Seas include EURIBOR zero-floors matching the hedged debt EURIBOR zero-floor. Amount presented is based on the exchange rate as of December 31, 2021.2023.
(2) Interest rate swap agreements hedging the term loan of Odyssey of the Seas include Term SOFR zero-floors, Term SOFR with no floors, and Overnight SOFR.
(3) During the year ended December 31, 2023, we completed our transition from LIBOR zero-floors matching the debt LIBOR zero-floor. The effective datesto Term SOFR rates for all of the $421.7 million and $191.7 million interestour Interest rate swap agreements are October 2020 and October 2022, respectively. The unsecured term loan for the financing of Odyssey of the Seas was drawn on March 2021.agreements.
These interest rate swap agreements are accounted for as cash flow hedges.hedges
The notional amount of interest rate swap agreements related to outstanding debt and our current unfunded financing arrangements as of December 31, 20212023 and 20202022 was $2.9$1.6 billion and $3.4$1.9 billion, respectively.
Foreign Currency Exchange Rate Risk
Derivative Instruments
Our primary exposure to foreign currency exchange rate risk relates to our ship construction contracts denominated in Euros, our foreign currency denominated debt and our international business operations. We enter into foreign currency forward contracts to manage portions of the exposure to movements in foreign currency exchange rates. As of December 31, 2021,2023, the aggregate cost of our ships on order was $12.4$8 billion, of which we had deposited $800.2$698 million as of such date. These amounts do not include any ships placed on order that are contingent upon completion of conditions precedent and/or financing any ships on order by our Partner Brands. Refer to Note 17. Commitments and Contingencies, for further information on our ships on order. At December 31, 20212023 and 2020,2022, approximately 59.0%43.5% and 66.3%52.3%, respectively, of the aggregate cost of the ships under construction was exposed to fluctuations in the Euro exchange rate. Our foreign currency forward contract agreements are accounted for as cash flow or net investment hedges depending on the designation of the related hedge.
On a regular basis, we enter into foreign currency forward contracts and, from time to time, we utilize cross-currency swap agreements and collar options to minimize the volatility resulting from the remeasurement of net monetary assets and liabilities denominated in a currency other than our functional currency or the functional currencies of our foreign subsidiaries. During the year ended December 31, 2021, we maintained an2023 and 2022 the average notional amount of approximately $483.2 million of these foreign currency forward contracts.contracts was approximately $1.3 billion and $1.1 billion, respectively.. These instruments are not designated as hedging instruments. For the years ended December 31, 2021, 20202023, 2022 and 2019,2021, changes in the fair value of the foreign currency forward contracts resulted in gainsgain (losses) of $(30.9)$19 million, $(19.0)$(102) million and $1.4$(31) million, respectively, which offset (losses) gains (losses) arising from the remeasurement of monetary assets and liabilities denominated in foreign currencies in those same years of $24.3$(43) million, $(1.5)$93 million and $0.4$24 million, respectively. These amounts were recognized in earnings within Other (expense) income (expense) in our consolidated statements of comprehensive income (loss).
We consider our investments in ourThe notional amount of outstanding foreign operationsexchange contracts, excluding the forward contracts entered into to be denominated in relatively stable currencies and of a long-term nature. Asminimize remeasurement volatility, as of December 31, 2021, we maintained a foreign currency forward contract2023 and designated it as a hedge of a portion of our2022 was $2.9 billion.
ROYAL CARIBBEAN CRUISES LTD.
NOTES TO THE CONSOLIDATED FINANCIAL STATEMENTS (Continued)
net investments in TUI Cruises of €245.0 million, or approximately $278.6 million based on the exchange rate at December 31, 2021. This forward currency contract matures in April 2022.
The notional amount of outstanding foreign exchange contracts, excluding the forward contracts entered into to minimize remeasurement volatility, as of December 31, 2021 and 2020 was $3.4 billion and $3.1 billion, respectively.
Non-Derivative Instruments
We alsoconsider our investments in our foreign operations to be denominated in relatively stable currencies and to be of a long-term nature. We address the exposure of our investments in foreign operations by denominating a portion of our debt in our subsidiaries' and investments' functional currencies and designating it as a hedge of these subsidiaries and investments. We had designated debt as a hedge of our net investments primarily in TUI Cruises of €97.0€648 million, or approximately $110.3$716 million, as of December 31, 2021.2023. As of December 31, 2020,2022, we had designated debt as a hedge of our net investments primarily in TUI Cruises of €215.0€433 million, or approximately $263.0$462 million.
Fuel Price Risk
Our exposure to market risk for changes in fuel prices relates primarily to the consumption of fuel on our ships. We use fuel swap agreements to mitigate the financial impact of fluctuations in fuel prices.
Our fuel swap agreements are generally accounted for as cash flow hedges. In the case that our hedged forecasted fuel consumption is not probable of occurring, hedge accounting will be discontinued and the related accumulated other comprehensive gain or loss will be reclassified to Other (expense) income (expense) immediately. For hedged forecasted fuel consumption that remains possible of occurring, hedge accounting will be discontinued and the related accumulated other comprehensive gain or loss will remain in accumulated other comprehensive gain or loss until the underlying hedged transactions are recognized in earnings or the related hedged forecasted fuel consumption is deemed probable of not occurring.
The prior suspension of our cruise operations due to the COVID-19 pandemic and our gradual resumption of cruise operations has resulted in reductions to our forecasted fuel purchases. During the year ended December 31, 2021, we discontinued cash flow hedge accounting on 0.2 million metric tons of our fuel swap agreements maturing in 2021 and 2022, which resulted in the reclassification of a net $0.7 million loss from Accumulated other comprehensive loss to Other income (expense). During the year ended December 31, 2020, we discontinued cash flow hedge accounting on 0.6 million metric tons of our fuel swap agreements maturing in 2020 and 2021, which resulted in the reclassification of a net $104.4 million loss from Accumulated other comprehensive loss to Other income (expense). Changes in the fair value of fuel swaps for which cash flow hedge accounting was discontinued are currently recognized in Other (expense) income (expense) for each reporting period through the maturity dates of the fuel swaps.
Future suspension of our operations or modifications to our itineraries may affect our expected forecasted fuel purchases which could result in further discontinuance of fuel swap During the year ended December 31, 2023, we discontinued cash flow hedge accounting andon certain fuel swap agreements, which resulted in immaterial gain. During the reclassificationyear ended December 31, 2022, we did not discontinue cash flow hedge accounting on any of deferred gains or losses from Accumulated other comprehensive loss into earnings. Refer to Risk Factors in Part 1, Item 1A. for further discussion on risks related to the COVID-19 pandemic.our fuel swap agreements.
At December 31, 2021,2023, we have hedged the variability in future cash flows for certain forecasted fuel transactions occurring through 2023.2024 and 2026. As of December 31, 20212023 and December 31, 2020,2022, we had the following outstanding fuel swap agreementsagreements:
| | | | | | | | | | | |
| Fuel Swap Agreements |
| As of December 31, 2021 | | As of December 31, 2020 |
| (metric tons) |
| Designated as hedges: | | | |
| 2022 | 821,850 | | | 389,650 | |
| 2023 | 249,050 | | | 82,400 | |
| | | |
| | | |
| | | |
| | | | | | | | | | | |
| Fuel Swap Agreements |
| As of December 31, 2023 | | As of December 31, 2022 |
| (metric tons) |
| Designated as hedges: | | | |
| 2024 | 1,054,501 | | | 825,651 | |
| 2025 | 685,400 | | | — | |
| 2026 | 44,200 | | | — | |
| | | |
| | | |
ROYAL CARIBBEAN CRUISES LTD.
NOTES TO THE CONSOLIDATED FINANCIAL STATEMENTS (Continued) | | | | | | | | | | | |
| Fuel Swap Agreements |
| As of December 31, 2023 | | As of December 31, 2022 |
| (% hedged) |
| Designated hedges as a % of projected fuel purchases: | | | |
| 2024 | 61 | % | | 50 | % |
| 2025 | 39 | % | | — | % |
| 2026 | 3 | % | | — | % |
| | | |
| | | |
| | | | | | | | | | | |
| Fuel Swap Agreements |
| As of December 31, 2021 | | As of December 31, 2020 |
| (% hedged) |
| Designated hedges as a % of projected fuel purchases: | | | |
| 2022 | 54 | % | | 23 | % |
| 2023 | 15 | % | | 5 | % |
| | | |
| | | |
| | | |
| | | | | | | | | | | |
| Fuel Swap Agreements |
| As of December 31, 2021 | | As of December 31, 2020 |
| (metric tons) |
| Not designated as hedges: | | | |
2022(1) | 231,900 | | | 14,650 | |
| | | |
| | | |
| | | |
| | | |
(1)As of December 31, 2021, 115,950 metric tons relate to fuel swap agreements with discontinued hedge accounting, in which we effectively pay fixed prices for our fuel purchases and receive floating prices from the counterparty. The remaining 115,950 tons relate to fuel swap agreements that were not designated as hedges since inception, in which we effectively pay floating prices for our fuel purchases and receive fixed prices from the counterparty.
At December 31, 20212023, there was $23.8$21 million of estimated unrealized net gainloss associated with our cash flow hedges pertaining to fuel swap agreements that is expected to be reclassified to earnings from Accumulated other comprehensive lossincome (loss) within the next twelve months when compared to $13.1$8 million of estimated unrealized net loss at December 31, 2020.2022. Reclassification is expected to occur as the result of fuel consumption associated with our hedged forecasted fuel purchases.
ROYAL CARIBBEAN CRUISES LTD.
NOTES TO THE CONSOLIDATED FINANCIAL STATEMENTS (Continued)
The fair value and line item caption of derivative instruments recorded within our consolidated balance sheets were as follows (in thousands)millions):
| | Fair Value of Derivative Instruments | | | Fair Value of Derivative Instruments |
| Asset Derivatives | | | Asset Derivatives | | Liability Derivatives |
| Balance Sheet
Location | | | Balance Sheet
Location | | As of December 31, 2023 | | As of December 31, 2022 | | Balance Sheet
Location | | As of December 31, 2023 | | As of December 31, 2022 |
| | Fair Value | | | | Fair Value | | Fair Value | | | Fair Value | | Fair Value |
Derivatives designated as hedging instruments under ASC 815-20(1) | |
| Interest rate swaps | |
| Interest rate swaps | |
| Interest rate swaps | |
| Interest rate swaps | |
| Foreign currency forward contracts | |
| Foreign currency forward contracts | |
| Fuel swaps | |
| Fuel swaps | |
| Total derivatives designated as hedging instruments under ASC 815-20 | |
| | | Fair Value of Derivative Instruments |
| | Asset Derivatives | | Liability Derivatives |
| | Balance Sheet
Location | | As of December 31, 2021 | | As of December 31, 2020 | | Balance Sheet
Location | | As of December 31, 2021 | | As of December 31, 2020 |
| | Fair Value | | Fair Value | | Fair Value | | Fair Value |
Derivatives designated as hedging instruments under ASC 815-20(1) | | | | | | | | | | | |
| Interest rate swaps | Other assets | | $ | — | | | $ | 17,271 | | | Other long-term liabilities | | $ | 62,080 | | | $ | 144,653 | |
| Interest rate swaps | Derivative financial instruments | | 6,478 | | | 261 | | | Derivative Financial Instruments | | — | | | — | |
| Foreign currency forward contracts | Derivative financial instruments | | 7,357 | | | 63,894 | | | Derivative financial instruments | | 116,027 | | | 13,294 | |
| Foreign currency forward contracts | Other assets | | 2,070 | | | 20,836 | | | Other long-term liabilities | | 8,813 | | | 7,306 | |
| | Fuel swaps | Derivative financial instruments | | 31,919 | | | 5,093 | | | Derivative financial instruments | | 7,944 | | | 25,203 | |
| Fuel swaps | Other assets | | 13,452 | | | 350 | | | Other long-term liabilities | | 1,202 | | | 50,117 | |
| Total derivatives designated as hedging instruments under ASC 815-20 | | 61,276 | | | 107,705 | | | 196,066 | | | 240,573 | |
| Derivatives not designated as hedging instruments under ASC 815-20 | | | | | | | | |
| Foreign currency forward contracts | Derivative financial Instruments | | — | | | — | | | Derivative financial instruments | | — | | | 160 | |
| Foreign currency forward contracts | Other assets | | — | | | — | | | Other long-term liabilities | | — | | | — | |
| Fuel swaps | Derivative financial instruments | | 8,430 | | | 834 | | | Derivative financial instruments | | 3,264 | | | 18,028 | |
| Fuel swaps | Other assets | | 102 | | | — | | | Other long-term liabilities | | 1,211 | | | 944 | |
| Total derivatives not designated as hedging instruments under ASC 815-20 | | 8,532 | | | 834 | | | 4,475 | | | 19,132 | |
| Total derivatives | | $ | 69,808 | | | $ | 108,539 | | | $ | 200,541 | | | $ | 259,705 | |
(1)Accounting Standard CodificationSubtopic 815-20 "“Derivatives and Hedging."Hedging-General
ROYAL CARIBBEAN CRUISES LTD.
NOTES TO THE CONSOLIDATED FINANCIAL STATEMENTS (Continued)
The location and amount of gain or (loss) recognized in income on fair value and cash flow hedging relationships were as follows (in thousands)
| | | | | | | | | | | | | | | | | | | | | | | | | | | | | | | | | | | | | | | | | | | | | | | | | | | | | | | | | | | | |
| | | | | | Year Ended December 31, 2021 | | | | Year Ended December 31, 2020 |
| | | | Fuel Expense | | Depreciation and Amortization Expenses | | Interest Income (Expense) | | Other Income (Expense) | | | | Fuel Expense | | Depreciation and Amortization Expenses | | Interest Income (Expense) | | Other Income (Expense) |
| Total amounts of income and expense line items presented in the statement of financial performance in which the effects of fair value or cash flow hedges are recorded | | | $385,322 | | $1,292,878 | | $(1,274,980) | | $20,284 | | | | $371,015 | | $1,279,254 | | $(823,202) | | $(137,085) |
| The effects of fair value and cash flow hedging: | | | | | | | | | | | | | | | | | | | |
| Gain or (loss) on fair value hedging relationships in Subtopic 815-20 | | | | | | | | | | | | | | | | | | | |
| | Interest contracts | | | | | | | | | | | | | | | | | | | |
| | | Hedged items | | | n/a | | n/a | | $11,083 | | — | | | | n/a | | n/a | | $(18,813) | | $— |
| | | Derivatives designated as hedging instruments | | | n/a | | n/a | | $(1,349) | | — | | | | n/a | | n/a | | $23,819 | | $— |
| Gain or (loss) on cash flow hedging relationships in Subtopic 815-20 | | | | | | | | | | | | | | | | | | | |
| | Interest contracts | | | | | | | | | | | | | | | | | | | |
| | | Amount of gain or (loss) reclassified from accumulated other comprehensive loss into income | | | n/a | | n/a | | $(43,185) | | n/a | | | | n/a | | n/a | | $(25,267) | | n/a |
| | | | | | | | | | | | | | | | | | | | | | |
| | Commodity contracts | | | | | | | | | | | | | | | | | | | |
| | | Amount of gain or (loss) reclassified from accumulated other comprehensive loss into income | | | $41,037 | | n/a | | n/a | | $(409) | | | | $(35,407) | | n/a | | n/a | | $3,549 |
| | | | | | | | | | | | | | | | | | | | | | |
| | Foreign exchange contracts | | | | | | | | | | | | | | | | | | | |
| | | Amount of gain or (loss) reclassified from accumulated other comprehensive loss into income | | | n/a | | $(15,359) | | n/a | | $(2,797) | | | | n/a | | $(14,679) | | n/a | | $(7,315) |
| | | | | | | | | | | | | | | | | | | | | | |
| | | | | | | | | | | | | | | | | | | | | | | | | | | | | | | | |
| | | | Year Ended December 31, 2019 |
| | Fuel Expense | | Depreciation and Amortization Expenses | | Interest Income (Expense) | | Other Income (Expense) |
| Total amounts of income and expense line items presented in the statement of financial performance in which the effects of fair value or cash flow hedges are recorded | $697,962 | | $1,245,942 | | $(381,568) | | $(24,513) |
| The effects of fair value and cash flow hedging: | | | | | | | |
| Gain or (loss) on fair value hedging relationships in Subtopic 815-20 | | | | | | | |
| | Interest contracts | | | | | | | |
| | | Hedged items | n/a | | n/a | | $(23,464) | | $— |
| | | Derivatives designated as hedging instruments | n/a | | n/a | | $16,607 | | $— |
| Gain or (loss) on cash flow hedging relationships in Subtopic 815-20 | | | | | | | |
| | Interest contracts | | | | | | | |
| | | Amount of gain or (loss) reclassified from accumulated other comprehensive loss into income | n/a | | n/a | | $(4,289) | | n/a |
| | | | | | | | | | |
| | Commodity contracts | | | | | | | |
| | | Amount of gain or (loss) reclassified from accumulated other comprehensive loss into income | $29,929 | | n/a | | n/a | | $(1,292) |
| | | | | | | | | | |
| | Foreign exchange contracts | | | | | | | |
| | | Amount of gain or (loss) reclassified from accumulated other comprehensive loss into income | n/a | | $(14,063) | | n/a | | $(5,080) |
| | | | | | | | | | |
ROYAL CARIBBEAN CRUISES LTD.
NOTES TO THE CONSOLIDATED FINANCIAL STATEMENTS (Continued)
The carrying value and line item caption of non-derivative instruments designated as hedging instruments recorded within our consolidated balance sheets were as follows (in thousands)millions):
| | Carrying Value |
| | | | Carrying Value | | | | | | Carrying Value |
Non-derivative instrument designated as
hedging instrument under ASC 815-20 | Non-derivative instrument designated as
hedging instrument under ASC 815-20 | | Balance Sheet Location | | As of December 31, 2021 | | As of December 31, 2020 | Non-derivative instrument designated as
hedging instrument under ASC 815-20 | | Balance Sheet Location | | As of December 31, 2023 | | As of December 31, 2022 |
| Foreign currency debt | Foreign currency debt | | Current portion of long-term debt | | $ | 75,518 | | | $ | 43,696 | |
| Foreign currency debt | Foreign currency debt | | Long-term debt | | 34,795 | | | 219,335 | |
| $ | 110,313 | | | $ | 263,031 | |
| | | | $ | |
The effect of derivative instruments qualifying and designated as hedging instruments and the related hedged items in fair value hedges on the consolidated statements of comprehensive income (loss) was as follows (in thousands)millions):
| | | | | | | | | | | | | | | | | | | | | | | | | | | | | | | | | | | | | | | | | | | | |
| | Location of Gain (Loss) Recognized in Income on Derivative and Hedged Item | | Amount of Gain (Loss) Recognized in Income on Derivative | | Amount of Gain (Loss) Recognized in Income on Hedged Item |
| Derivatives and related Hedged Items under ASC 815-20 Fair Value Hedging Relationships | | Year Ended December 31, 2021 | | Year Ended December 31, 2020 | | Year Ended December 31, 2019 | | Year Ended December 31, 2021 | | Year Ended December 31, 2020 | | Year Ended December 31, 2019 |
| Interest rate swaps | | Interest expense (income), net of interest capitalized | | $ | (1,349) | | | $ | 23,819 | | | $ | 16,607 | | | $ | 11,083 | | | $ | (18,813) | | | $ | (23,464) | |
| | | | | | | | | | | | | | |
| | | | | | | | | | | | | | |
| | | | $ | (1,349) | | | $ | 23,819 | | | $ | 16,607 | | | $ | 11,083 | | | $ | (18,813) | | | $ | (23,464) | |
The fair value and line item caption of derivative instruments recorded within our consolidated balance sheets for the cumulative basis adjustment for fair value hedges were as follows (in thousands):
| | | | | | | | | | | | | | | | | | | | | | | | | | |
| Line Item in the Statement of Financial Position Where the Hedged Item is Included | | Carrying Amount of the Hedged Liabilities | | Cumulative amount of Fair Value Hedging Adjustment Included in the Carrying Amount of the Hedged Liabilities |
| As of December 31, 2021 | | As of December 31, 2020 | | As of December 31, 2021 | | As of December 31, 2020 |
| Current portion of long-term debt and Long-term debt | | $ | 655,502 | | | $ | 700,331 | | | $ | 6,428 | | | $ | 17,512 | |
| | $ | 655,502 | | | $ | 700,331 | | | $ | 6,428 | | | $ | 17,512 | |
The effect of derivative instruments qualifying and designated as cash flow hedging instruments on the consolidated financial statements was as follows (in thousands):
| | | | | | | | | | | | | | | | | | | | | | | | | | | | | | | | | | | | | | | | | | | | | | | | | | |
| | Amount of Gain (Loss) Recognized in Accumulated Other Comprehensive Income (Loss) on Derivative | | Location of Gain (Loss) Reclassified from Accumulated Other Comprehensive Loss into Income | | Amount of Gain (Loss) Reclassified from Accumulated Other Comprehensive Income into Income | | | | |
| Derivatives under ASC 815-20 Cash Flow Hedging Relationships | | Year Ended December 31, 2021 | | Year Ended December 31, 2020 | | Year Ended December 31, 2019 | | | Year Ended December 31, 2021 | | Year Ended December 31, 2020 | | Year Ended December 31, 2019 | | | | | |
| | | | | | | | | | | | | | | | | | | | |
| | | | | | | | | | | | | | | | | | | | |
| Interest rate swaps | | $ | 45,572 | | | $ | (112,960) | | | $ | (72,732) | | | Interest expense | | $ | (43,185) | | | $ | (25,267) | | | $ | (4,289) | | | | | | | |
| Foreign currency forward contracts | | (203,129) | | | 130,426 | | | (148,881) | | | Depreciation and amortization expenses | | (15,359) | | | (14,679) | | | (14,063) | | | | | | | |
| Foreign currency forward contracts | | — | | | — | | | — | | | Other income (expense) | | (2,797) | | | (7,315) | | | (5,080) | | | | | | | |
| | | | | | | | | | | | | | | | | | | | |
| | | | | | | | | | | | | | | | | | | | |
| | | | | | | | | | | | | | | | | | | | |
| Fuel swaps | | — | | | — | | | — | | | Other income (expense) | | (409) | | | 3,549 | | | (1,292) | | | | | | | |
| Fuel swaps | | 140,890 | | | (58,575) | | | 75,505 | | | Fuel | | 41,037 | | | (35,407) | | | 29,929 | | | | | | | |
| | $ | (16,667) | | | $ | (41,109) | | | $ | (146,108) | | | | | $ | (20,713) | | | $ | (79,119) | | | $ | 5,205 | | | | | | | |
| | | | | | | | | | | | | | | | | | | | | | | | | | | | | | | | | | | | | | | | | | | | |
| | Location of Gain (Loss) Recognized in Income on Derivative and Hedged Item | | Amount of Gain (Loss) Recognized in Income on Derivative | | Amount of Gain (Loss) Recognized in Income on Hedged Item |
| Derivatives and related Hedged Items under ASC 815-20 Fair Value Hedging Relationships | | Year Ended December 31, 2023 | | Year Ended December 31, 2022 | | Year Ended December 31, 2021 | | Year Ended December 31, 2023 | | Year Ended December 31, 2022 | | Year Ended December 31, 2021 |
| Interest rate swaps | | Interest expense, net of interest capitalized | | $ | — | | | $ | (4) | | | $ | (1) | | | $ | — | | | $ | 5 | | | $ | 11 | |
| | | | $ | — | | | $ | (4) | | | $ | (1) | | | $ | — | | | $ | 5 | | | $ | 11 | |
ROYAL CARIBBEAN CRUISES LTD.
NOTES TO THE CONSOLIDATED FINANCIAL STATEMENTS (Continued)
The table below represents amounts excluded from the assessmenteffect of effectiveness for our net investmentderivative instruments qualifying and designated as cash flow hedging instruments for whichon the difference between changes in fair value and periodic amortization is recorded in accumulated other comprehensive income (loss)consolidated financial statements was as follows (in thousands)millions):
| | | | | | | | |
Gain (Loss) Recognized in Income (Net Investment Excluded Components) | | Year Ended December 31, 2021 |
Net inception fair value at January 1, 2021 | | $ | (1,916) | |
Amount of gain recognized in income on derivatives for the year ended December 31, 2021 | | 5,810 | |
Amount of loss remaining to be amortized in accumulated other comprehensive loss as of December 31, 2021 | | (4,448) | |
Fair value at December 31, 2021 | | $ | (554) | |
| | | | | | | | | | | | | | | | | | | | |
| | Amount of Gain (Loss) Recognized in Accumulated Other Comprehensive Income (Loss) on Derivative |
| Derivatives under ASC 815-20 Cash Flow Hedging Relationships | | Year Ended December 31, 2023 | | Year Ended December 31, 2022 | | Year Ended December 31, 2021 |
| Interest rate swaps | | $ | 11 | | | $ | 165 | | | $ | 46 | |
| Foreign currency forward contracts | | 24 | | | (145) | | | (204) | |
| Fuel swaps | | (32) | | | 151 | | | 141 | |
| | $ | 3 | | | $ | 171 | | | $ | (17) | |
The effect of non-derivative instruments qualifying and designated as net investment hedging instruments on the consolidated financial statements was as follows (in thousands)millions):
| | Amount of Gain (Loss)
Recognized in Other Comprehensive Income (Loss) | | |
| | Amount of Gain (Loss)
Recognized in Other Comprehensive Income (Loss) | | | | Amount of Gain (Loss)
Recognized in Other Comprehensive Income (Loss) |
Non-derivative instruments under ASC 815-20
Net Investment Hedging Relationships | Non-derivative instruments under ASC 815-20
Net Investment Hedging Relationships | | Year Ended December 31, 2021 | | Year Ended December 31, 2020 | | Year Ended December 31, 2019 | | | Non-derivative instruments under ASC 815-20
Net Investment Hedging Relationships | | Year Ended December 31, 2023 | | Year Ended December 31, 2022 | | Year Ended December 31, 2021 |
| Foreign Currency Debt | Foreign Currency Debt | | $ | 7,837 | | | $ | (28,062) | | | $ | 6,111 | | | |
| $ | 7,837 | | | $ | (28,062) | | | $ | 6,111 | | | |
| | $ | |
The effect of derivatives not designated as hedging instruments on the consolidated financial statements was as follows (in thousands)millions): | | | | | | | | | | | | | | | | | | | | | | | | | | |
| | | | Amount of Gain (Loss) Recognized
in Income on Derivative |
Derivatives Not Designated as Hedging
Instruments under ASC 815-20 | | Location of Gain (Loss)
Recognized in Income
on Derivative | | Year Ended December 31, 2021 | | Year Ended December 31, 2020 | | Year Ended December 31, 2019 |
| Foreign currency forward contracts | | Other income (expense) | | $ | (30,903) | | | $ | (18,961) | | | $ | 1,356 | |
| Fuel swaps | | Fuel | | — | | | — | | | (37) | |
| Fuel swaps | | Other income (expense) | | 33,720 | | | (102,740) | | | 112 | |
| | | | $ | 2,817 | | | $ | (121,701) | | | $ | 1,431 | |
| | | | | | | | | | | | | | | | | | | | | | | | | | |
| | | | Amount of Gain (Loss) Recognized
in Income on Derivative |
Derivatives Not Designated as Hedging
Instruments under ASC 815-20 | | Location of Gain (Loss)
Recognized in Income
on Derivative | | Year Ended December 31, 2023 | | Year Ended December 31, 2022 | | Year Ended December 31, 2021 |
| Foreign currency forward contracts | | Other (expense) income | | $ | 19 | | | $ | (102) | | | $ | (31) | |
| Fuel swaps | | Other (expense) income | | 1 | | | — | | | 34 | |
| | | | $ | 20 | | | $ | (102) | | | $ | 3 | |
Credit Related Contingent Features
Our current interest rate derivative instruments require us to post collateral if our Standard & Poor’s and Moody’s credit ratings fall below specified levels. Specifically, under most of our agreements, if on the fifth anniversary of executing a derivative instrument, or on any succeeding fifth-year anniversary, our credit ratings for our senior unsecured debt is rated below BBB- by Standard & Poor’s and Baa3 by Moody’s, then the counterparty will periodically have the right to demand that we post collateral in an amount equal to the difference between (i) the net market value of all derivative transactions with such counterparty that have reached their fifth year anniversary, to the extent negative, and (ii) the applicable minimum call amount.
The amount of collateral required to be posted will change as, and to the extent, our net liability position increases or decreases by more than the applicable minimum call amount. If our credit rating for our senior unsecured debt is subsequently equal to or above BBB- by Standard & Poor’s or Baa3 by Moody’s, then any collateral posted at such time will be released to us and we will no longer be required to post collateral unless we meet the collateral trigger requirement, generally, at the next fifth-year anniversary.
As of December 31, 2021,2023, our senior unsecured debt credit rating was BBB- by Standard & Poor's and B2B1 by Moody's. As of December 31, 2021, 62023, five of our ship debt interest rate derivative hedges had reached their fifth-year anniversary; however, the net market value for these derivative hedges were in a term of at least five years requiring usnet asset position, and accordingly, we were not required to post any collateral as of $44.4 million to satisfy our obligations under our interest rate derivative agreements, taking into account collateral waivers issued by certain banks. We expect that we will not need to provide additional collateral under these agreements in the next twelve months.such date.
ROYAL CARIBBEAN CRUISES LTD.
NOTES TO THE CONSOLIDATED FINANCIAL STATEMENTS (Continued)
Note 17. Commitments and Contingencies
Ship Purchase Obligations
Our future capital commitments consist primarily of new ship orders. As of December 31, 2021,2023, we had 2one Oasis-class shipsship and 3two ships of a new generation, known as our Icon-class, on order for our Royal Caribbean International brand with an aggregate capacity of approximately 28,20016,900 berths. As of December 31, 2021,2023, we had 2one Edge-class shipsship on order for our Celebrity brand with an aggregate capacity of approximately 6,5003,250 berths. Additionally, as of December 31, 2021,2023, we had 2 shipsone Evolution-class ship on order with an aggregate capacity of approximately 1,460730 berths for our Silversea Cruises brand. The following provides further information on recent developments with respect to our ship orders.
In December 2023, we entered into a credit agreement for the unsecured financing of Celebrity Xcel, the fifth Edge-class ship for approximately 80% of the ship’s contract price and our building contract with Chantiers de l'Atlantique became effective. Bpifrance Assurance Export, the official French export credit agency, has agreed to guarantee to the lenders 100% of the financing. The maximum loan amount under the facility is not to exceed the United States dollar equivalent of €850 million, or approximately $939 million based on the exchange rate at December 31, 2023. The loan will amortize semi-annually and will mature 12 years following delivery of the ship. Interest on the loan will accrue either at a floating rate equal to Term SOFR + 1.45%. Celebrity Xcel will have a capacity of approximately 3,250 berths.
In September 2019, Silversea Cruises entered into 2a credit agreements,agreement, guaranteed by us, for the unsecured financing of Silver Ray, the first and second Evolution-class shipsship for an amount of up to 80% of eachthe ship's contract price through facilities to be guaranteed 95% by Euler Hermes, the official export credit agency of Germany. The maximum loan amount under eachthe facility is not to exceed the United States dollar equivalent of €351.6€359 million in the case of the first Evolution-class ship and €359.0 million in the case of the second Evolution-class ship, or approximately $399.9$397 million, and $408.3 million, respectively, based on the exchange rate at December 31, 2021. Each2023. The loan, once funded, will amortize semi-annually and will mature 12 years following the delivery of eachthe ship. At our election, which has to be consistent across all tranches, interest on eachthe loan will accrue either (1) at a fixed rate of 4.14% and 4.18%, respectively (inclusive of the applicable margin) or (2) at a floating rate equal to LIBORTerm SOFR plus 0.79% and 0.83%, respectively. The first and second Evolution-class ships1.26%. Silver Ray will each have a capacity of approximately 730 berths. In September 2021, we amended the credit agreement for the second Evolution-class ship to increase their maximum loan amounts by €176 million on an aggregate basis, or approximately $194 million based on the exchange rate at December 31, 2023. At our election, which has to be consistent across all tranches, interest on the incremental portion of the loan will accrue either (1) at a fixed rate of 4.38% (inclusive of the applicable margin) or (2) at a floating rate equal to Term SOFR plus 1.46%. In October 2023, we amended the credit agreement for Silver Ray, to increase the maximum loan amount by €30 million or $34 million based on the exchange rate at December 31, 2023 At our election, which has to be consistent across all tranches, interest on the incremental portion will accrue either (1) at a fixed rate of 6.80% (inclusive of the applicable margin) or (2) at a floating rate equal to Term SOFR plus 1.40%.
In December 2019, we entered into a credit agreement for the unsecured financing ofUtopia of the Seas, the sixth Oasis-class ship for up to 80% of the ship’s contract price through a facility to be guaranteed 100% by BpiFrance Assurance Export, the official export credit agency of France. Under the financing arrangement, we have the right, but not the obligation, to satisfy the obligations to be incurred upon delivery and acceptance of the ship under the shipbuilding contract by assuming, at delivery and acceptance, the debt indirectly incurred by the shipbuilder during the construction of the ship. The maximum loan amount under the facility is not to exceed the United States dollar equivalent of €1.3 billion, or approximately $1.5$1.4 billion based on the exchange rate at December 31, 2021.2023. The loan will amortize semi-annually and will mature 12 years following delivery of the ship. Interest on the loan will accrue at a fixed rate of 3.00% (inclusive of margin). The sixth Oasis-class shipUtopia of the Seas will have a capacity of approximately 5,700 berths.
In December 2019, we entered into a credit agreement for the unsecured financing of the third Icon-class ship for up to 80% of the ship’s contract price. Finnvera plc, the official export credit agency of Finland, has agreed to guarantee 95% of the substantial majority of the financing, with a smaller portion of the financing to be 95% guaranteed by Euler Hermes, the official German export credit agency.Hermes. The maximum loan amount under the facility is not to exceed the United States dollar equivalent of €1.4 billion, or approximately $1.6$1.5 billion based on the exchange rate at December 31, 2021.2023. The loan, once funded, will amortize semi-annually and will mature 12 years following the delivery of the ship. Approximately 60% of the loan will accrue interest at a fixed rate of 3.29%. The balance of the loan will accrue interest at a floating rate of LIBORTerm SOFR plus 0.85%1.28%. The third Icon-class ship will have a capacity of approximately 5,600 berthsberths.
During 2017, we entered into credit agreementsagreement for the unsecured financing of Star of the 2Seas, the second Icon-class shipsship for up to 80% of each ship’sthe contract price. For each ship, the official Finnish export credit agency, Finnvera plc, has agreed to guarantee 100% of a substantial majority of the financing to the lenders, with a smaller portion of the financing to be 95% guaranteed by Euler Hermes, the official German export credit agency.Hermes. The maximum loan amount under eachthe facility is not to exceed €1.4 billion, or approximately $1.6$1.5 billion, based on the exchange rate at December 31, 2021.2023. Interest on approximately 75% of eachthe loan will accrue at a fixed rate of 3.56% and 3.76% for the first and the second Icon-class ships, respectively,, and the balance will accrue interest at a floating rate ranging from LIBOR plus 1.10% to 1.15% and LIBOR plus 1.15% to 1.20% for the first and the second Icon-class ships, respectively. Each loan will amortize semi-annually and will mature 12 years following delivery of each ship. The first and second Icon-class ships will each have a capacity of approximately 5,600 berths.
During 2017, we entered into credit agreements for the unsecured financing of the third and fourth Edge-class ships and the fifth Oasis-class ship for up to 80% of each ship’s contract price through facilities to be guaranteed 100% by Bpifrance Assurance Export, the official export credit agency of France. Under these financing arrangements, we have the right, but not the obligation, to satisfy the obligations to be incurred upon delivery and acceptance of each ship under the shipbuilding contract by assuming, at delivery and acceptance, the debt indirectly incurred by the shipbuilder during the construction of each ship. The maximum loan amount under each facility is not to exceed €684.2 million in the case of the third Edge-class ship and the United States dollar equivalent of €714.6 million and €1.1 billion in the case of the fourth Edge-class ship and fifth Oasis-class ship, or approximately $812.7 million and $1.3 billion, respectively, based on the exchange rate at December 31, 2021. The loans will amortize semi-annually and will mature 12 years following delivery of each ship. Interest on the loans will
ROYAL CARIBBEAN CRUISES LTD.
NOTES TO THE CONSOLIDATED FINANCIAL STATEMENTS (Continued)
accrue at a fixed rate of 1.28% for the third Edge-class ship and at a fixed rate of 3.18% for both, the fourth Edge-class ship and the fifth Oasis-class ship. The third and fourth Edge-class ships, each of which will have a capacity of approximately 3,250 berths. The fifth Oasis-class ship will have a capacity of approximately 5,700 berths.
Our future capital commitments consist primarily of new ship orders. COVID-19 has impacted shipyard operations which have and may continue to result in delays of our previously contracted ship deliveries. As of December 31, 2021, the dates that ships on order by our Global and Partner Brands are expected to be delivered, subject to change in the event of construction delays, and their approximate berths are as follows:
| | | | | | | | | | | | | | | | | | | | |
Ship | | Shipyard | | Expected to be delivered | | Approximate
Berths |
Royal Caribbean International — | | | | | | |
Oasis-class: | | | | | | |
Wonder of the Seas | | Chantiers de l’Atlantique | | 1st Quarter 2022 | | 5,700 |
Unnamed | | Chantiers de l’Atlantique | | 2nd Quarter 2024 | | 5,700 |
Icon-class: | | | | | | |
Icon of the Seas | | Meyer Turku Oy | | 3rd Quarter 2023 | | 5,600 |
Unnamed | | Meyer Turku Oy | | 2nd Quarter 2025 | | 5,600 |
Unnamed | | Meyer Turku Oy | | 2nd Quarter 2026 | | 5,600 |
Celebrity Cruises — | | | | | | |
Edge-class: | | | | | | |
Celebrity Beyond | | Chantiers de l’Atlantique | | 2nd Quarter 2022 | | 3,250 |
Celebrity Ascent | | Chantiers de l’Atlantique | | 4th Quarter 2023 | | 3,250 |
Silversea Cruises — | | | | | | |
Evolution-class: | | | | | | |
Silver Nova | | Meyer Werft | | 2nd Quarter 2023 | | 730 |
Unnamed | | Meyer Werft | | 2nd Quarter 2024 | | 730 |
TUI Cruises (50% joint venture) — | | | | | | |
Mein Schiff 7 | | Meyer Turku Oy | | 2nd Quarter 2024 | | 2,900 |
Unnamed | | Fincantieri | | 4th Quarter 2024 | | 4,100 |
Unnamed | | Fincantieri | | 2nd Quarter 2026 | | 4,100 |
Total Berths | | | | | | 47,260 |
We took delivery of Wonder of the Seas in January of 2022. In addition, as of December 31, 2021, we have an agreement in place with Chantiers de l’Atlantique to build an additional Edge-class ship for delivery in 2025, which is contingent upon completion of conditions precedent and financing.
In September 2021, we amended the credit agreements for the first and second Evolution-class ships to increase their maximum loan amounts by €175.6 million on an aggregate basis, or approximately $199.7 million based on the exchange rate at December 31, 2021. The increase in the loan amounts will finance ship design modifications that incorporate innovative sustainability features and additional premium cabins, increasing the capacity for each ship to 730 berths. At our election, interest on incremental portion of each loan will accrue either (1) at a fixed rate of 4.34% and 4.38%, respectively (inclusive of the applicable margin) or (2) at a floating rate equal to LIBOR plus 0.99% and 1.03%, respectively.
As of December 31, 2021, the aggregate cost of our ships on order, presented in the above table, not including any ships on order by our Partner Brands, was approximately $12.4 billion, of which we had deposited $800.2 million as of such date. Approximately 59.0% of the aggregate cost was exposed to fluctuations in the Euro exchange rate at December 31, 2021. Refer to Note 16. Fair Value Measurements and Derivative Instruments for further information.
ROYAL CARIBBEAN CRUISES LTD.
NOTES TO THE CONSOLIDATED FINANCIAL STATEMENTS (Continued)
ranging from Term SOFR plus 1.58% to 1.63%. The loan will amortize semi-annually and will mature 12 years following delivery of the ship. Star of the Seas will have a capacity of approximately 5,600 berths.
Our future capital commitments consist primarily of new ship orders. As of December 31, 2023, our Global Brands and our Partner Brands have eight ships on order.The table below sets forth, as of December 31, 2023, the dates that the ships on order are expected to be delivered, and their approximate berths. The expected delivery dates for all of our ships on order are subject to change due to events such as shipyard construction delays or agreed upon scope changes which impact the delivery timelines.
| | | | | | | | | | | | | | | | | | | | |
| Ship | | Shipyard | | Expected to be delivered | | Approximate
Berths |
| Royal Caribbean International — | | | | | | |
| Oasis-class: | | | | | | |
| Utopia of the Seas | | Chantiers de l’Atlantique | | 2nd Quarter 2024 | | 5,700 |
| Icon-class: | | | | | | |
| Star of the Seas | | Meyer Turku Oy | | 2nd Quarter 2025 | | 5,600 |
| Unnamed | | Meyer Turku Oy | | 2nd Quarter 2026 | | 5,600 |
| Celebrity Cruises — | | | | | | |
| Edge-class: | | | | | | |
| Celebrity Xcel | | Chantiers de l’Atlantique | | 4th Quarter 2025 | | 3,250 |
| Silversea Cruises — | | | | | | |
| Evolution-class: | | | | | | |
| Silver Ray | | Meyer Werft | | 2nd Quarter 2024 | | 730 |
| TUI Cruises (50% joint venture) — | | | | | | |
| Mein Schiff 7 | | Meyer Turku Oy | | 2nd Quarter 2024 | | 2,900 |
| Mein Schiff Relax | | Fincantieri | | 4th Quarter 2024 | | 4,100 |
| Unnamed | | Fincantieri | | 2nd Quarter 2026 | | 4,100 |
| Total Berths | | | | | | 31,980 |
In addition, in February 2024, we entered into an agreement with Chantiers de l’Atlantique to build an additional Oasis class ship for delivery in 2028, which is contingent upon completion of certain conditions precedent including financing.
As of December 31, 2023, the aggregate cost of our ships on order, presented in the above table, not including any ships on order by our Partner Brands, was approximately $7.9 billion, of which we had deposited $698 million. Approximately 43.5% of the aggregate cost was exposed to fluctuations in the Euro exchange rate at December 31, 2023. Refer to Note 16. Fair Value Measurements and Derivative Instruments for further information.
Litigation
As previously reported, 2 lawsuits werea lawsuit was filed against us in August 2019 in the U.S. District Court for the Southern District of Florida (the "Court") under Title III of the Cuban Liberty and Democratic Solidarity Act, also known as the Helms-Burton Act. The complaint filed by Havana Docks Corporation ("Havana Docks Action") alleges it holds an interest in the Havana Cruise Port Terminal, and the complaint filed by Javier Garcia-Bengochea (the "Port of Santiago Action") alleges that he holds an interest in the Port of Santiago, Cuba, both of which werewas expropriated by the Cuban government. The complaintscomplaint further allegealleges that we trafficked in those propertiesthe terminal by embarking and disembarking passengers at these facilities. The plaintiffs seek all available statutory remedies, including the value of the expropriated property, plus interest, treble damages, attorneys’ fees and costs.In the Havana Docks Action, we and
The Court entered final judgment in December 2022 in favor of the plaintiff have filed motions for summary judgment, which were heard by the Court in January 2022. The Havana Docks Action is scheduled for trial on May 23, 2022. The Court dismissed the Port of Santiago Action with prejudice on the basis thatand awarded damages and attorneys' fees to the plaintiff lacked standing, andin the plaintiff’s appealaggregate amount of approximately $112 million. We have appealed the dismissal is awaiting a decision byjudgment to the appellate court. United States Court of Appeals for the 11th Circuit. We believe we have meritorious defensesgrounds for and intend to vigorously pursue our appeal. During the claims alleged in bothfourth quarter of 2022, we recorded a charge of approximately $130 million to Other (expense) income within our consolidated statements of comprehensive income (loss) related to the Havana Docks Action, including post-judgment interest and the Port of Santiago Action,related legal defense costs and we intend to vigorously defend ourselves against them. The outcome of litigation is inherently unpredictable and subject to significant uncertainties, and there can be no assurances that the final outcome of either case will not be material.bonding fees.
ROYAL CARIBBEAN CRUISES LTD.
NOTES TO THE CONSOLIDATED FINANCIAL STATEMENTS (Continued)
In addition, we are routinely involved in claims typical within the travel and tourismcruise vacation industry. The majority of these claims are covered by insurance. We believe the outcome of such claims, net of expected insurance recoveries, will not have a material adverse impact on our financial condition or results of operations and cash flows.
Other
Some of the contracts that we enter into include indemnification provisions that obligate us to make payments to the counterparty if certain events occur. These contingencies generally relate to changes in taxes, increased lender capital costs and other similar costs. The indemnification clauses are often standard contractual terms and are entered into in the normal course of business. There are no stated or notional amounts included in the indemnification clauses and we are not able to estimate the maximum potential amount of future payments, if any, under these indemnification clauses. We have not been required to make any payments under such indemnification clauses in the past and, under current circumstances, we do not believe an indemnification in any material amount is probable.
If any person acquires ownership of more than 50% of our common stock or, subject to certain exceptions, during any 24-month period, a majority of our board of directors is no longer comprised of individuals who were members of our board of directors on the first day of such period, we may be obligated to prepay indebtedness outstanding under our credit facilities, which we may be unable to replace on similar terms. Our public debt securities also contain change of control provisions that would be triggered by a third-party acquisition of greater than 50% of our common stock coupled with a ratings downgrade. If this were to occur, it would have an adverse impact on our liquidity and operations.
At December 31, 2021,2023, we have future commitments to pay for our usage of certain port facilities, marine consumables, services and maintenance contracts as follows (in thousands)millions):
| | | | | |
| Year | |
| 2022 | $ | 154,552 | |
| 2023 | 86,532 | |
| 2024 | 75,868 | |
| 2025 | 33,981 | |
| 2026 | 29,518 | |
| Thereafter | 154,033 | |
| $ | 534,484 | |
| | | | | |
| Year | |
| 2024 | $ | 157 | |
| 2025 | 149 | |
| 2026 | 173 | |
| 2027 | 141 | |
| 2028 | 116 | |
| Thereafter | 925 | |
| $ | 1,661 | |
ROYAL CARIBBEAN CRUISES LTD.
NOTES TO THE CONSOLIDATED FINANCIAL STATEMENTS (Continued)
Note 18. Restructuring Charges
In April 2020, we reduced our US shoreside workforce by approximately 23% through permanent layoffs. We incurred severance costs of $28.0 million during the year ended December 31, 2020.
The following table summarizes our restructuring costs during the twelve months ended December 31, 2021 as it relates to the April 2020 reduction in our workforce (in thousands):
| | | | | | | | | | | | | | | | | |
| Beginning Balance January 1, 2021 | Accruals | Payments | Ending Balance December 31, 2021 | Cumulative Charges Incurred |
| Termination benefits | $ | 4,257 | | $ | 682 | | $ | 4,626 | | $ | 313 | | $ | 28,635 | |
| Total | $ | 4,257 | | $ | 682 | | $ | 4,626 | | $ | 313 | | $ | 28,635 | |