UNITED STATES
SECURITIES AND EXCHANGE COMMISSION
Washington, D.C. 20549
Form 10-K
|
| |
| x | ANNUAL REPORT PURSUANT TO SECTION 13 OR 15(d) OF THE SECURITIES EXCHANGE ACT OF 1934 |
| | For the fiscal year ended December 31, 20122013 |
OR
|
| |
| o | TRANSITION REPORT PURSUANT TO SECTION 13 OR 15(d) OF THE SECURITIES EXCHANGE ACT OF 1934 |
| | For the transition period from to |
Commission File No. 1-11442
CHART INDUSTRIES, INC.
(Exact Name of Registrant as Specified in its Charter)
|
| | |
| Delaware | | 34-1712937 |
(State or Other Jurisdiction of Incorporation or Organization) | | (IRS Employer Identification No.) |
|
| | |
| One Infinity Corporate Centre Drive, | | |
| Suite 300, Garfield Heights, Ohio | | 44125-5370 |
| (Address of Principal Executive Offices) | | (Zip Code) |
Registrant’s telephone number, including area code:
(440) 753-1490
Securities registered pursuant to Section 12(b) of the Act:
|
| | |
| Title of Each Class | | Name of Each Exchange on Which Registered |
| Common Stock, par value $0.01 | | The NASDAQ Stock Market LLC |
Securities registered pursuant to Section 12(g) of the Act:
None
Indicate by check mark if the registrant is a well-known seasoned issuer, as defined in Rule 405 of the Securities Act. Yes x No o
Indicate by check mark if the registrant is not required to file reports pursuant to Section 13 or Section 15(d) of the Act. Yes o No x
Indicate by check mark whether the registrant: (1) has filed all reports required to be filed by Section 13 or 15(d) of the Securities Exchange Act of 1934 during the preceding 12 months (or for such shorter period that the registrant was required to file such reports), and (2) has been subject to such filing requirements for the past 90 days. Yes x No o
Indicate by check mark whether the registrant has submitted electronically and posted on its corporate Web site, if any, every Interactive Data File required to submitted and posted pursuant to Rule 405 of Regulation S-T (§232.405 of this chapter) during the preceding 12 months (or for such shorter period that the registrant was required to submit and post such files). Yes x No o
Indicate by check mark if disclosure of delinquent filers pursuant to Item 405 of Regulation S-K (§229.405) is not contained herein, and will not be contained, to the best of registrant’s knowledge, in definitive proxy or information statements incorporated by reference in Part III of this Form 10-K or any amendment to this Form 10-K. x
Indicate by check mark whether the registrant is a large accelerated filer, an accelerated filer, a non-accelerated filer or a smaller reporting company. See definitions of “large accelerated filer,” “accelerated filer” and “smaller reporting company” in Rule 12b-2 of the Exchange Act. (Check one):
|
| | | | | | |
| Large accelerated filer | | x | | Accelerated filer | | o |
| Non-accelerated filer | | o (Do not check if a smaller reporting company) | | Smaller reporting company | | o |
Indicate by check mark whether the registrant is a shell company (as defined in Rule 12b-2 of the Act). Yes ¨ No x
The aggregate market value of the voting common equity held by non-affiliates computed by reference to the price of $68.7694.09 per share at which the common equity was last sold, as of the last business day of the registrant’s most recently completed second fiscal quarter, was $2,029,029,8322,821,977,295.
As of February 15,17, 20132014, there were 30,074,09430,401,573 outstanding shares of the Company’s common stock, par value $0.01 per share.
Documents Incorporated by Reference
Portions of the following document are incorporated by reference into Part III of this Annual Report on Form 10-K: the definitive Proxy Statement to be used in connection with the Registrant’s Annual Meeting of Stockholders to be held on May 23, 201322, 2014 (the “20132014 Proxy Statement”).
Except as otherwise stated, the information contained in this Annual Report on Form 10-K is as of December 31, 20122013.
CHART INDUSTRIES, INC.
TABLE OF CONTENTS
PART I
THE COMPANY
Overview
Chart Industries, Inc., a Delaware corporation incorporated in 1992 (the “Company,” “Chart” or “we” and as used herein refers to Chart Industries, Inc. and our consolidated subsidiaries, unless the context indicates otherwise), is a leading independent global manufacturer of highly engineered equipment used inthroughout the global liquid gas supply chain for the production, storage and end-use of hydrocarbon and industrial gases, based on our sales and the estimated sales of our competitors. We supply engineered equipment used throughout the global liquid gas supply chain. The largest portion of end-use applications for our products is energy-related, accounting for approximately 54%53% of sales and 56%52% of orders in 20122013, and 77%73% of backlog at December 31, 20122013. We are a leading manufacturer of standardOur equipment and engineered equipmentsystems are primarily used for low-temperature and cryogenic applications. We have developed an expertise in cryogenic systems and equipment, which operate at low temperatures sometimes approaching absolute zero (0 kelvin; -273° Centigrade; -459° Fahrenheit). The majority of ourOur products includinginclude vacuum insulated containment vessels, heat exchangers, cold boxes and other cryogenic components, are used throughout the liquid gas supply chain for the purification, liquefaction, distribution, storage and end-use of hydrocarbon and industrial gases.components.
Our primary customers are large, multinational producers and distributors of hydrocarbon and industrial gases and their suppliers. We sell our products and services to more than 2,000 customers worldwide. We have developed long-standing relationships with leading companies in the gas production, gas distribution, gas processing, liquefied natural gas or LNG, chemical and industrial gas industries, including Air Products, Praxair, Airgas, Air Liquide, The Linde Group or Linde, JGC Corporation or JGC, Bechtel Corporation, ExxonMobil, British Petroleum or BP, ConocoPhillips, Saudi Aramco,PetroChina, The Shaw Group, CB&I Lummus, Uhde, CTCI Corporation or CTCI, Toyo, Samsung, Technip, Daelim, Thomas Russell, Black & Veatch, Chemtex, Enterprise, Exterran,UOP, Shell, Kryopak/Salof and Energy World Corporation or EWC, some of whom have been purchasing our products for over 20 years.
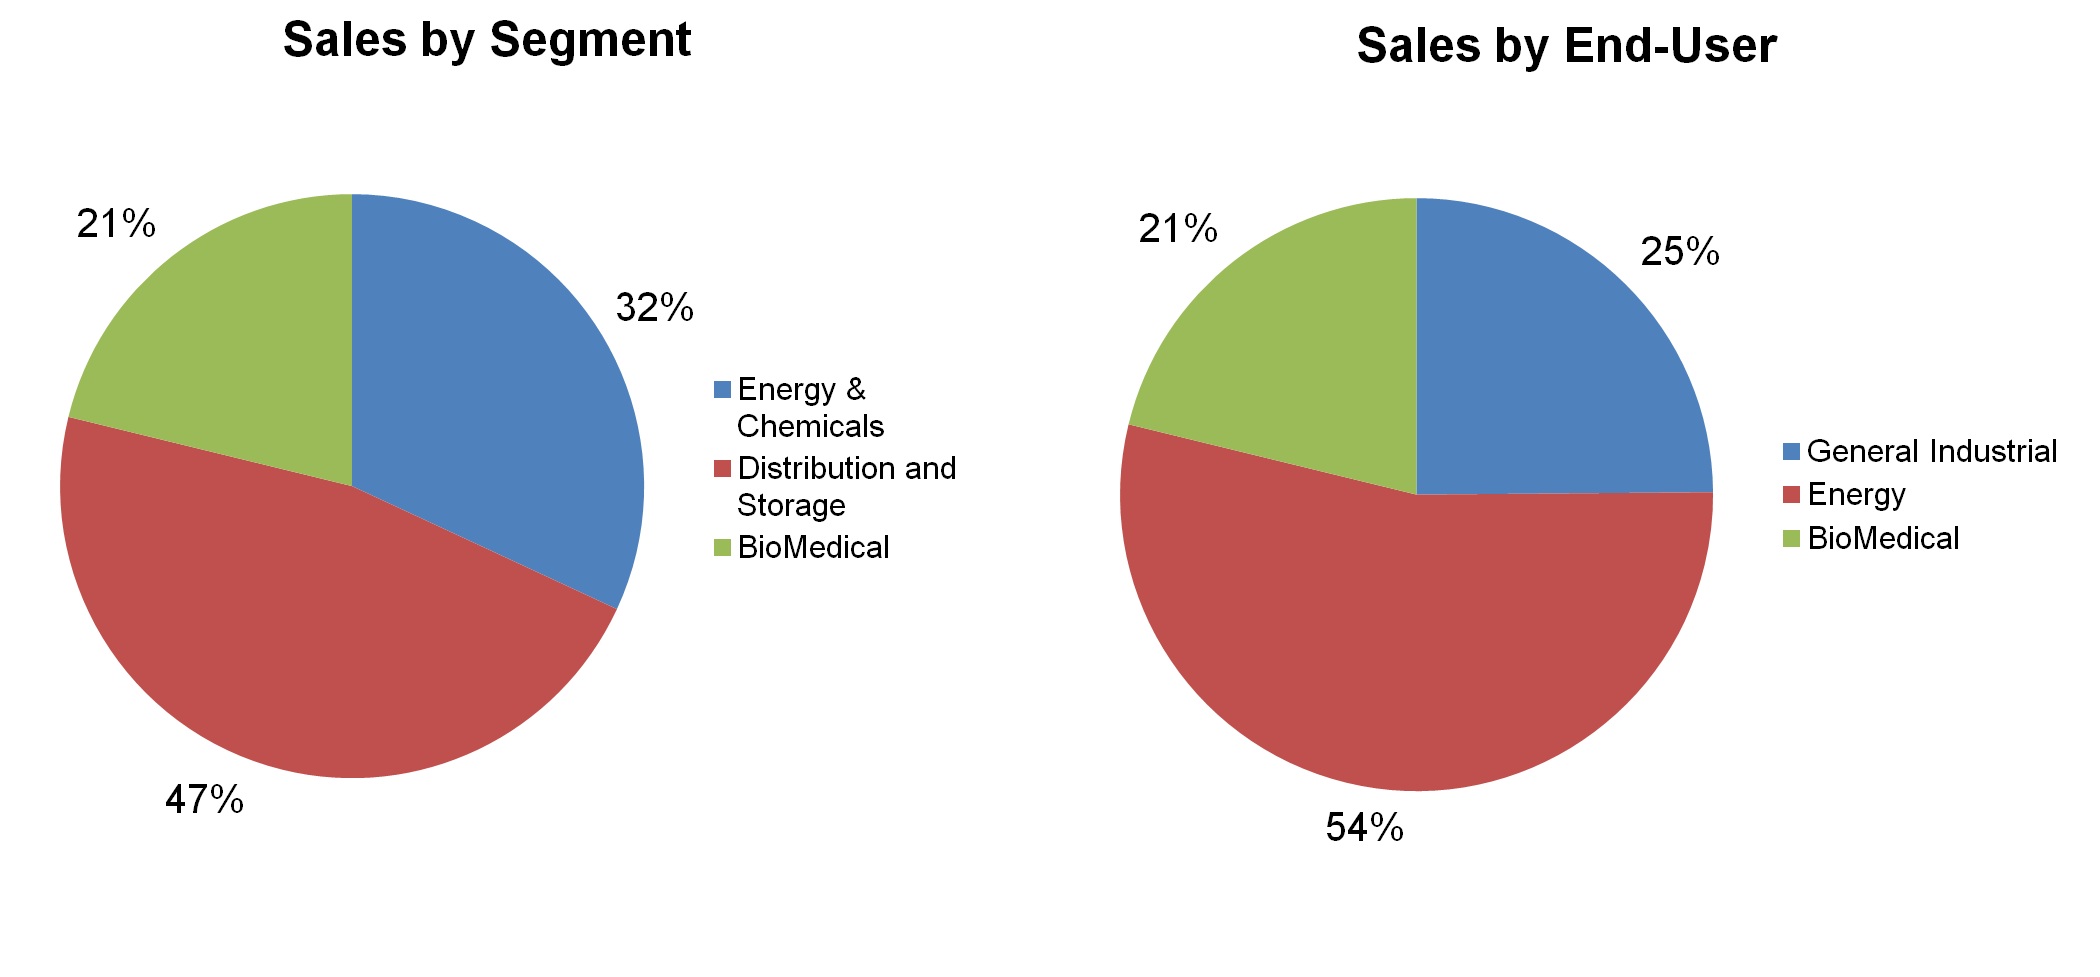
We have attained this position by capitalizing on our low-cost global manufacturing footprint, technical expertise and know-how, broad product offering and reputation for quality, and by focusing on attractive, growing markets. We have an established sales and customer support presence across the globe and low cost manufacturing operations in the United States, Central Europe and China. For the years ended December 31, 2013, 2012 2011 and 20102011, we generated sales of $1,014.21,177.4 million, $794.61,014.2 million, and $555.5794.6 million, respectively.
The following charts show the proportion of our revenues generated by each operating segment as well as our estimate of the proportion of revenue generated by end-user for the year ended December 31, 20122013:
Segments and Products
We operate in three operating segments: (i) Energy & Chemicals or E&C, (ii) Distribution and& Storage or D&S, and (iii) BioMedical. While each segment manufactures and markets different cryogenic and gas processing equipment and systems to distinct end-users, they all share a reliance on our heat transfer, low temperature storage and gas processing know-how and expertise. The E&C and D&S segments manufacture products used primarily in energy-related and general industrial applications, such as the separation, liquefaction, distribution and storage of hydrocarbon and industrial gases. Through our BioMedical segment, we supply cryogenic and other equipment used in the storage and distribution of biological materials and oxygen, used primarily in the medical, biological research and animal breeding industries. Further information about these segments is located in Note K19 of the notes to the Company’s consolidated financial statements included in Item 8 of this Annual Report on Form 10-K.
Energy and& Chemicals Segment
Our principal products within the E&C segment, which accounted for 32%27% of sales for the year ended December 31, 20122013, are focused on engineered equipment and systems for the energy and chemicals markets, primarily heat exchangers, Core-in-Kettle® units, cold boxes, and process systems andincluding LNG vacuum insulated pipe.liquefiers. These products are used by major natural gas, petrochemical processing and industrial gas companies in the production of their products. Our products in the E&C segment include the following:
Heat Exchangers and Core-in-Kettles®
We are a leading designer and manufacturer of cryogenic brazed aluminum and air cooled heat exchangers. Brazed aluminum heat exchangers accounted for 14.4%, 11.6%14.4% and 11.3%11.6% of consolidated sales for the years ended December 31, 20122013, 20112012 and 20102011, respectively. Using technology pioneered by us, our brazed aluminum heat exchangers are incorporated into assemblies and cold boxes to facilitate the progressive cooling and liquefaction of air or hydrocarbon mixtures for the subsequent recovery or purification of component gases. In hydrocarbon processing industries, our brazed aluminum heat exchangers allow producers to obtain purified hydrocarbon by-products, such as methane, ethane, propane and ethylene, which are commercially marketable for various industrial or residential uses. In the industrial gas market, our brazed aluminum heat exchangers are used to produce high purity atmospheric gases, such as oxygen, nitrogen and argon, which have diverse industrial applications.
Our air cooled heat exchangers are used in multiple markets to cool fluids to allow for further processing or to provide condensing of fluids, including hydrocarbon, petrochemical, natural gas processing, and power generation. Our compact Core-in-Kettle® heat exchangers are designed to replace shell-and-tube exchangers, offering significantly more heat transfer surface per unit volume and greatly improving the efficiency of chillers, vaporizers, reboilers and condensers in hydrocarbon applications including ethylene, propylene and LNG. Brazed aluminum and air cooled heat exchangers are engineered to the customer’s requirements and range in price from $20,000 to $3.0 million or more depending on the scope and complexity of the project.
Our heat exchanger demand is primarily driven by activity in the LNG and natural gas segments of the hydrocarbon processing market, as well as the global industrial gas market. Other key global drivers involve developing Gas to Liquids, or GTL, clean coal processes including Coal to Liquids, or CTL, and Integrated Gasification and Combined Cycle, or IGCC, power projects. In the future, management believes that continuing efforts by petroleum producing countries to better utilize stranded natural gas and previously flared gases, as well as efforts to broaden their industrial base, and the developing clean coal initiatives globally, present a promising source of demand for our heat exchangers and cold box systems. In addition, demand for heat exchangers and cold boxes in developed countries is expected to continue as firms upgrade their facilities for greater efficiency and regulatory compliance. We believe demand for our heat exchangers has also increased as a result of the natural gas being extracted from the U.S. shale fields.
Our principal competitors for brazed aluminum heat exchangers are Linde, Sumitomo, Kobeinclude several European and Fives,Asian manufacturers, and we face competition from a variety of competitors for air cooled heat exchangers. Management believes we are the only producer of large brazed aluminum heat exchangers in the United States and that we are a leader in the global cryogenic heat exchanger industry. Major customers for our heat exchangers include large companies in the industrial gas industry include Air Liquide, Air Products, Praxair, Hangyang, Kaifeng Air Separation and Sichuan Air Separation. In the hydrocarbon processing industry, major customers andindustries, as well as engineering, procurement and construction (EPC) contractors include BP, Black & Veatch, ExxonMobil, Saudi Aramco, ConocoPhillips, JGC, Bechtel, Chemtex, Kryopak/Salof, Kellogg Brown Root or KBR, Technip, CB&I Lummus, Thomas Russell, Enterprise, Exterran, Toyo, The Shaw Group, Samsung and Shell.(“EPC”) contractors.
Cold Boxes
We are a leading designer and fabricator of cold boxes. Cold boxes are highly engineered systems used to significantly reduce the temperature of gas mixtures to the point where component gases liquefy and can be separated and purified for further use in multiple industrial, scientific and commercial applications. In the hydrocarbon processing industry, our cold box
systems are used in natural gas processing and in the petrochemical industry. In the industrial gas industry, cold box systems are used to separate air into its major atmospheric components, including nitrogen, oxygen and argon, where the gases are used in a diverse range of applications such as metal production and heat treating, enhanced oil and gas production, coal gasification, chemical and oil refining, the quick-freezing of food, wastewater treatment and industrial welding. The construction of a cold box system generally consists of one or more brazed aluminum heat exchangers and other equipment packaged in a “box” consisting of a structural metal frame encasing a complex system of piping, valves and instrumentation. Cold boxes, which are designed and fabricated to order, sell in the price range of $1.0 million to $20.0 million, with the majority of cold boxes priced between $1.0 million and $5.0 million.
We have a number of competitors for fabrication of cold boxes, including Linde, Air Products, Praxair, Air Liquidea number of leading companies in the industrial gas and hydrocarbon processing industries and many smaller fabrication-only facilities around the world. Principal customers for our cold boxes include CB&I Lummus, BP, Black & Veatch, Chemtex, Bechtel, Saudi Aramco, Jacobs, Chevron, ConocoPhillips, Marathon, JGC, Kryopak/Salof, Shell, Technip, Toyo, The Shaw Group, Samsung and KBR.
Process Systems
We are a leader in the design and manufacturing of highly engineered hydrocarbon process systems specifically for those markets requiring cryogenic processing technology. These “Concept-to-Reality” process systems incorporate many of Chart’s core products, including brazed aluminum heat exchangers, Core-in-Kettles®, cold boxes, vessels, pipe work and air cooled heat exchangers. These systems are used for global LNG projects, including potential projects in the United States and China for both domestic LNG production for diesel displacement and in the conversion of LNG import terminals to dual purpose import/export terminals, and also for use in global nitrogen rejection units (NRU)(“NRU”) and propane dehydrogenation (PDH)(“PDH”). These systems, which are custom engineered and manufactured to order, typically sell in the price range of $5.0 million to over $100.0 million, depending on the scope and complexity of the project, with the majority of the systems priced between $5.0 million and $25.0 million.
Our principal industry segments include natural gas processing, LNG, nitrogen rejection,NRUs, ammonia purification, propane dehydrogenation or PDH, HYCO/hydrogen recovery, and Ryan-Holmes CO2 bulk removal technology for enhanced oil recovery and CO2 sequestration.
We have a number of competitors for our process systems including Linde, Air Products,leading industrial gas companies and other smaller engineering, procurement and construction, or EPC, firms to whom we also act as a supplier of equipment including heat exchangers and cold boxes. Principal customers and end-users for our process systems include EWC, CB&I Lummus, Fluor, ExxonMobil, JGC, The Shaw Group, CTCI, Samsung, Uhde and KBR.
Distribution and Storage Segment
Through our D&S segment, which accounted for 47%50% of our sales for the year ended December 31, 20122013, we are a leading supplier of cryogenic equipment to the global bulk and packaged industrial gas industry as well as for energy-related applications.applications including the distribution and storage of LNG. Demand for the products supplied by this segment is driven primarily by the significant installed base of users of cryogenic liquids as well as new applications and distribution technologies for cryogenic liquids. Our products span the entire spectrum of industrial gas demand from small customers requiring cryogenic packaged gases to large users requiring custom engineered cryogenic storage systems. Our products in the D&S segment include the following:
Cryogenic Bulk Storage Systems
We are a leading supplier of cryogenic bulk storage systems (stationary tanks, trailers, and ISO tanks) of various sizes ranging from 500 gallons to 250,000265,000 gallons. Cryogenic bulk storage systems accounted for 15.1%14.9%, 19.3%15.1% and 18.5%19.3% of consolidated sales for the years ended December 31, 20122013, 20112012 and 20102011, respectively. Using sophisticated vacuum insulation systems placed between inner and outer vessels, these bulk storage systems are able to store and transport liquefied industrial gases and hydrocarbon gases at temperatures from -100°0° Fahrenheit to temperatures nearing absolute zero. End useEnd-use customers for our cryogenic storage equipment include industrial gas producers and distributors, chemical producers, manufacturers of electrical components, health care organizations, food processors and businesses in the oil and natural gas industries. Prices for our cryogenic bulk storage systems range from $10,000 to $1.0 million. Global industrial gas producers and distributors including Air Products, Air Liquide, Linde, Airgas, Praxair and Messer, are significant customers for our cryogenic bulk storage systems. OnOur competitors tend to be regionally focused while Chart is able to supply a broad range of systems on a worldwide basis, we compete primarily with Taylor-Wharton International or Taylor-Wharton and CVA/INOX
in this product area. In Europe and Asia, webasis. We also compete with several suppliers owned by the global industrial gas producers as well as independent regional suppliers such as VRV, Aritas and Sanctum.producers.
Cryogenic Packaged Gas Systems
We are a leading supplier of cryogenic packaged gas systems of various sizes ranging from 160 liters to 3,000 liters. Cryogenic packaged gas systems accounted for 14.2%13.0%, 17.9%14.2% and 17.6%17.9% of consolidated sales for the years ended December 31, 20122013, 20112012 and 20102011, respectively. Cryogenic liquid cylinders are used extensively in the packaged gas industry to allow smaller quantities of liquid to be easily delivered to the customers of industrial gas distributors on a full-for-empty or fill-on-site basis. Principal customers for our liquid cylinders are the same global industrial gas producers and the North
American industrial gas distributors who purchase our cryogenic bulk storage systems. We competeOur competitors tend to be regionally focused while Chart is able to supply a broad range of systems on a worldwide basis primarily with Taylor-Wharton and Beijing Tenhai Industrial Cylinders in this product area.basis. We have developed two technologies in the packaged gas product area: ORCA™ Micro-BulkMicroBulk systems and Tri-fectaTrifecta® Laser Gas assist systems. ORCA™ Micro-BulkMicroBulk systems bring the ease of use and distribution economics of bulk gas supply to customers formerly supplied by high pressure or cryogenic liquid cylinders. The ORCA™ Micro-BulkMicroBulk system is the leader in this growing product line. The Tri-fectaTrifecta® Laser Gas assist system was developed to meet the “assist gas” performance requirements for new high powered lasers being used in the metal fabrication industry.
Cryogenic Systems and Components
Our line of cryogenic components, including VIP,Vacuum Insulated Pipe ("VIP"), engineered bulk gas installations, specialty liquid nitrogen, or LN2, end-use equipment and cryogenic flow meters are recognized in the market for their reliability, quality and performance. These products are sold to industrial gas producers, as well as to a diverse group of distributors, resellers and end users.end-users. We compete with a number of suppliers of cryogenic systems and components, including Acme Cryogenics, Vacuum Barrier Corporation and others. Additionally, incomponents. In 2010 we completed the acquisition of Cryotech which is a manufacturer of LN2 dosing systems for food and beverage packaging applications located in San Jose, California. Cryotech expands our expertise in LN2 end useend-use applications and distributes its products globally.
LNG Applications
We supply cryogenic solutions for the storage, distribution, vaporization, and application of LNG. LNG applications accounted for 16.4%, 10.6% and 4.5% of consolidated sales for the years ended December 31, 2013, 2012 and 2011, respectively. LNG may be utilized as a primary source of heat or power at industrial or residential complexes located away from a natural gas pipeline. LNG may also be used for peak shaving or as a backup supply at remote locations. We refer to our LNG distribution products as a “Virtual Pipeline” as the natural gas pipeline is replaced with cryogenic distribution to deliver the gas to the end user. We supply cryogenic trailers, bulk storage tanks, tap-offloading facilities, and vaporization equipment specially configured for LNG into Virtual Pipeline applications. LNG may also be used as a fuel to power on-road vehicles, or ships.off-road vehicles, drill rigs, ships and rail locomotives. LNG vehicle fueling applications consist of LNG and liquid/compressed natural gas refueling systems for centrally fueled fleets of vehicles, trucks,heavy-duty truck and ships powered by natural gas, such as fleets operated by metropolitan transportation authorities, refuse haulers and heavy-duty truckbus fleets. We sell LNG applications around the world from all D&S facilities to numerous end users, energy companies, and gas distributors. Competition for LNG applications is based primarily on product design, customer support and service, dependability and price. Our competitors tend to be regionally focused or product specific while Chart is able to supply a broad range of solutions required by LNG applications.
Beverage Liquid CO2 Systems
This product line consists primarily of vacuum insulated, bulk liquid CO2 containers used for beverage carbonation in restaurants, convenience stores and cinemas, in sizes ranging from 100 pounds to 7501,000 pounds of liquid CO2 storage. We also manufacture and market non-insulated, bulk fountain syrup containers for side-by-side installation with our CO2 systems. Our beverage systems are sold to national restaurant chains, soft drink companies and CO2 distributors. Our primary competitors for bulk liquid CO2 beverage delivery systems are Taylor-Wharton and other producers of cryogenic systems and high-pressure gaseous CO2 cylinders.
Cryogenic Services
We operate locations in the United States and Europe providing installation, service, repair and maintenance of cryogenic products including storage tanks, liquid cylinders, cryogenic trailers, cryogenic railcars, cryogenic pumps, cryogenic flow meters and VIP. In 2010, we opened a comprehensive service facility in McCarran, Nevada that allows us to provide a full range of repair services for equipment located west of the Rocky Mountains.
BioMedical Segment
The BioMedical segment, which accounted for 21%23% of our sales for the year ended December 31, 20122013, consists of various product lines built around our core competencies in cryogenics and pressure swing adsorption, but with a focus on the respiratory and biological users of the liquids and gases instead of the large producers and distributors of cryogenic liquids. Our products in the BioMedical segment include the following:
Respiratory Products
Medical respiratory products accounted for 14.8%14.9%, 17.4%14.2% and 17.2%17.4% of consolidated sales for the years ended December 31, 20122013, 20112012 and 20102011, respectively. Our respiratory oxygen product line is comprised of a range of medical respiratory products, including liquid oxygen systems and ambulatory oxygen systems, both of which are used primarily for the in-home supplemental oxygen treatment of patients with chronic obstructive pulmonary diseases, such as bronchitis,
emphysema and asthma. We further expanded our respiratory product offering in 2010 and 2012 by acquiring SeQual Technologies, Inc. and AirSep Corporation, respectively, which design, manufacture, and service stationary, transportable, and portable oxygen concentrators.
Individuals for whom supplemental oxygen is prescribed generally receive an oxygen system from a home healthcare provider, medical equipment dealer, or gas supplier. The provider or physician usually selects which type of oxygen system that is providedto provide to its customers: liquid oxygen systems, transportable oxygen concentrators, portable oxygen concentrators, stationary concentrators or high-pressure oxygen cylinders. Physicians generally believe that increased patient ambulation offers greater long-term therapeutic benefits which can be provided by liquid oxygen and transportable and portable oxygen concentrators.
We believe that competition for our respiratory productproducts is based primarily upon product quality, performance, reliability, ease-of-use and price, and we focus our marketing strategies on these considerations. Furthermore, competition also includes the impact of other modalities in the broader respiratory industry.
Cold Storage Systems
This product line consists of vacuum insulated containment vessels for the storage of biological materials. The primary applications for this product line include medical laboratories, biotech/pharmaceutical, research facilities, blood and tissue banks, veterinary laboratories, large-scale repositories and artificial insemination, particularly in the beef and dairy industry.
The significant competitors for biological storage systems include a fewnumber of large companies worldwide, such as Taylor-Wharton, Air Liquide and Ind-Burma Petroleum Company, or IBP.worldwide. These products are sold through multiple channels of distribution specifically applicable to each industry sector. The distribution channels range from highly specialized cryogenic storage systems providers to general supply and catalogue distribution operations to breeding service providers. Historically, competitionCompetition in this field has beenis focused on design, reliability and price. Alternatives to vacuum insulated containment vessels include mechanical, electrically powered refrigeration.
Commercial Oxygen Generation Systems
This product line includes self-contained generators, standard generators, and packaged systems for industrial and medical oxygen generating systems. These generators produce oxygen from compressed air and provide an efficient and cost-effective alternative to the procurement of oxygen from third party cylinder or liquid suppliers. Applications include mining operations, industrial plants, ozone generation, hospital medical oxygen, and wastewater sites, among other commercial applications. The primary competitors include OGSI, Onsite Gas, OxymatManagement expects demand for this product line to increase over the long-term with competition focused on design, reliability and Novair.price.
Domestic and Foreign Operations
Financial and other information regarding domestic and foreign operations is located in Note K19 of the notes to the Company's consolidated financial statements included in Item 8 of this Annual Report on Form 10-K. Additional information regarding risks attendant to foreign operations is set forth in Item 7A of this Annual Report on Form 10-K under the caption “Quantitative and Qualitative Disclosures About Market Risk” and Item 7 under the caption “Management’s Discussion and Analysis of Financial Condition and Results of Operations.”
Engineering and Product Development
Our engineering and product development activities are focused primarily on developing new and improved solutions and equipment for the users of cryogenic liquids and hydrocarbon and industrial gases. Our engineering, technical and marketing employees actively assist customers in specifying their needs and in determining appropriate products to meet those needs.
Portions of our engineering expenditures typically are charged to customers, either as separate items or as components of product cost.
Competition
We believe we can compete effectively around the world and that we are a leading competitor in the industries we serve. Competition is based primarily on performance and the ability to provide the design, engineering and manufacturing capabilities required in a timely and cost-efficient manner. Contracts are usually awarded on a competitive bid basis. Quality, technical expertise and timeliness of delivery are the principal competitive factors within the industry. Price and terms of sale are also important competitive factors. Because independent third-party prepared market share data is not available, it is difficult to know for certain our exact position in our markets, although we believe we rank among the leaders in each of the markets we serve. We base our statements about industry and market positions on our reviews of annual reports and published investor presentations of our competitors and augment this data with information received by marketing consultants conducting
competition interviews and our sales force and field contacts. For information concerning competition within a specific segment of the Company's business, see descriptions provided under segment captions herein.in this Annual Report on Form 10-K.
Marketing
We market our products and services throughout the world primarily through direct sales personnel and independent sales representatives and distributors. The technical and custom design nature of our products requires a professional, highly trained sales force. While each salesperson and sales representative is expected to develop a highly specialized knowledge of one product or group of products within one of our segments, each salesperson and certain sales representatives are able to sell many products from different segments to a single customer. We use independent sales representatives and distributors to market our products and services in certain foreign countries and in certain North American markets.regions. These independent sales representatives supplement our direct sales force in dealing with language and cultural matters. Our domestic and foreign independent sales representatives earn commissions on sales, which vary by product type.
Backlog
The dollar amount of our backlog as of December 31, 2013, 2012 2011 and 20102011 was $617.4728.8 million, $489.1617.4 million and $236.4489.1 million, respectively. Approximately 10%8.6% of the December 31, 20122013 backlog is expected to be filled beyond 20132014. Backlog is comprised of the portion of firm signed purchase orders or other written contractual commitments received from customers that we have not recognized as revenue under the percentage of completion method or based upon shipment. Backlog can be significantly affected by the timing of orders for large products, particularly in the E&C segment, and the amount of backlog at December 31, 20122013 described above is not necessarily indicative of future backlog levels or the rate at which backlog will be recognized as sales. Orders included in our backlog may include customary cancellation provisions under which the customer could cancel all or part of the order, potentially subject to the payment of certain costs and/or penalties. For further information about our backlog, including backlog by segment, see Item 7.7, “Management’s Discussion and Analysis of Financial Condition and Results of Operations.”
Customers
We sell our products primarily to gas producers, distributors and end-users across the industrial gas, hydrocarbon and chemical processing and biomedical industries in countries throughout the world. Sales to our top ten customers accounted for 38%37%, 36%38% and 38%36% of consolidated sales in 2013, 2012 2011 and 20102011, respectively. No single customer exceeded 10% of consolidated sales in 20122013. Our sales to particular customers fluctuate from period to period, but the global producers and distributors of hydrocarbon and industrial gases and their suppliers tend to be a consistently large source of revenue for us. Our supply contracts are generally contracts for “requirements” only. While our customers may be obligated to purchase a certain percentage of their supplies from us, there are generally no minimum requirements. Also, many of our contracts may be canceled on as little as one month’s notice. To minimize credit risk from trade receivables, we review the financial condition of potential customers in relation to established credit requirements before sales credit is extended and monitor the financial condition of customers to help ensure timely collections and to minimize losses. In addition, for certain domestic and foreign customers, particularly in the E&C segment, we require advance payments, letters of credit and other such guarantees of payment. Certain customers also require us to issue letters of credit or performance bonds, particularly in instances where advance payments are involved, as a condition of placing the order. We believe our relationships with our customers are generally good.
Intellectual Property
Although we have a number of patents, trademarks and licenses related to our business, no one of them or related group of them is considered by us to be of such importance that its expiration or termination would have a material adverse effect on
our business. In general, we depend upon technological capabilities, manufacturing quality control and application of know-how, rather than patents or other proprietary rights, in the conduct of our business.
Raw Materials and Suppliers
We manufacture most of the products we sell. The raw materials used in manufacturing include aluminum products (including sheets, bars, plate and piping), stainless steel products (including sheets, plates, heads and piping), palladium oxide, carbon steel products (including sheets, plates and heads), valves and gauges and fabricated metal components. Most raw materials are available from multiple sources of supply. We believe our relationships with our raw material suppliers and other vendors are generally good. Raw material prices were fairly stable during 2012,2013, and we expect them to remain stable during 2013.2014. Subject to certain risks related to our suppliers as discussed under Item 1A. “Risk Factors,” we foresee no acute shortages of any raw materials that would have a material adverse effect on our operations.
Employees
As of January 31, 20132014, we had 4,8425,086 employees, including 2,0182,826 domestic employees and 2,8242,260 international employees. These employees consisted of 2,1392,280 salaried, 433473 bargaining unit hourly and 2,2702,333 non-bargaining unit hourly.
We are a party to one collective bargaining agreement with the International Association of Machinists and Aerospace Workers ("IAM") covering 433473 employees at our La Crosse, Wisconsin heat exchanger facility. On October 31, 2012,Effective February 3, 2013, we entered into a new five-year agreement with the IAM which replaced the previous agreement that had an expiration date of February 2, 2013. The five-year term will extend from February 3, 2013 toexpires on February 3, 2018.
Environmental Matters
Our operations have historically included and currently include the handling and use of hazardous and other regulated substances, such as various cleaning fluids used to remove grease from metal, that are subject to federal, state and local environmental laws and regulations. These regulations impose limitations on the discharge of pollutants into the soil, air and water, and establish standards for their handling, management, use, storage and disposal. We monitor and review our procedures and policies for compliance with environmental laws and regulations. Our management is familiar with these regulations and supports an ongoing program to maintain our adherence to required standards.
We are involved with environmental compliance, investigation, monitoring and remediation activities at certain of our owned or formerly owned manufacturing facilities and at one owned facility that is leased to a third party. We believe that we are currently in substantial compliance with all known environmental regulations. We accrue for certain environmental remediation-related activities for which commitments or remediation plans have been developed or for which costs can be reasonably estimated. These estimates are determined based upon currently available facts regarding each facility. Actual costs incurred may vary from these estimates due to the inherent uncertainties involved. Future expenditures relating to these environmental remediation efforts are expected to be made over the next 14 years as ongoing costs of remediation programs. We do not believe that these regulatory requirements have had a material effect upon our capital expenditures, earnings or competitive position. We are not anticipating any material capital expenditures in 20132014 that are directly related to regulatory compliance matters. Although we believe we have adequately provided for the cost of all known environmental conditions, additional contamination, the outcome of disputed matters or changes in regulatory posture could result in more costly remediation measures than budgeted, or those we believe are adequate or required by existing law. We believe that any additional liability in excess of amounts accrued which may result from the resolution of such matters will not have a material adverse effect on our financial position, liquidity, cash flows or results of operations.
Available Information
Additional information about the Company is available at www.chartindustries.com. On the Investor Relations page of the website, the public may obtain free copies of the Company’s Annual Report on Form 10-K, Quarterly Reports on Form 10-Q, Current Reports on Form 8-K and any amendments to those reports filed or furnished pursuant to Section 13(a) or 15(d) of the Securities Exchange Act of 1934 as soon as reasonably practicable following the time that they are filed with, or furnished to, the Securities and Exchange Commission (SEC)(“SEC”). Additionally, the Company has posted its Code of Ethical Business Conduct and Officer Code of Ethics on its website, which are also available free of charge to any shareholder interested in obtaining a copy. This Form 10-K and reports filed with the SEC are also accessible through the SEC’s website at www.sec.gov. References to our website or the SEC’s website do not constitute incorporation by reference of the information contained on such websites, and such information is not part of this Form 10-K.
Investing in our common stock involves risk. You should carefully consider the risks described below as well as the other information contained in this Annual Report on Form 10-K in evaluating your investment in us. If any of the following risks actually occur, our business, financial condition, operating results or cash flows could be harmed materially. Additional risks, uncertainties and other factors that are not currently known to us or that we believe are not currently material may also adversely affect our business, financial condition, operating results or cash flows. In any of these cases, you may lose all or part of your investment in us.
Risks Related to Our Business
The markets we serve are subject to cyclical demand and vulnerable to economic downturn, which could harm our business and make it difficult to project long-term performance.
Demand for our products depends in large part upon the level of capital and maintenance expenditures by many of our customers and end users,end-users, in particular those customers in the global hydrocarbon and industrial gas markets. These customers’ expenditures historically have been cyclical in nature and vulnerable to economic downturns. Decreased capital and maintenance spending by these customers could have a material adverse effect on the demand for our products and our business, financial condition and results of operations. In addition, this historically cyclical demand limits our ability to make accurate long-term predictions about the performance of our company. Even if demand improves, it is difficult to predict whether any improvement represents a long-term improving trend or the extent or timing of improvement. There can be no assurance that historically improving cycles are representative of actual future demand.
While we experienced growth in demand from 2003 until mid-2008 in the global hydrocarbon and industrial gas markets, we experienced a significant decline in orders from mid-2008 until mid-2009. Since that time there has been improvement in orders for our businesses, particularly throughout 2011 and early 2012, and more recently in 2013, but we cannot predict whether business performance may be better or worse in the future.
The loss of, or significant reduction or delay in, purchases by our largest customers could reduce our sales and profitability.
A small number of customers has accounted for a substantial portion of our historical net sales. For example, sales to our top ten customers accounted for 38%37%, 36%38% and 38%36% of consolidated sales in 2013, 2012 2011 and 20102011, respectively. We expect that a limited number of customers will continue to represent a substantial portion of our sales for the foreseeable future. While our sales to particular customers fluctuate from period to period, the global producers and distributors of hydrocarbon and industrial gases and their suppliers tend to be a consistently large source of our sales.
The loss of any of our major customers or a decrease or delay in orders or anticipated spending by such customers could materially reduce our sales and profitability. For example, a delay in the anticipated timing of LNG infrastructure build out or respiratory therapy demand recovery could materially reduce the demand for our products. Our largest customers could also engage in business combinations, which could increase their size, reduce their demand for our products as they recognize synergies or rationalize assets and increase or decrease the portion of our total sales concentration to any single customer.
Decreases in energy prices may decrease demand for some of our products and cause downward pressure on the prices we charge, which could harm our business, financial condition and results of operations.
A significant amount of our sales are to customers in the energy production and supply industry. We estimate that 54%53% of our sales for the year ended December 31, 20122013 were generated by end-users in the energy industry. Accordingly, demand for a significant portion of our products depends upon the level of capital expenditures by companies in the oil and gas industry, which depends, in part, on energy prices. While some applications for our products could see greater demand if prices for natural gas remain relatively low compared to oil prices, a sustained decline in energy prices generally and a resultant downturn in energy production activities could negatively affect the capital expenditures of our customers. Any significant decline in the capital expenditures of our customers, whether due to a decrease in the market price of energy or otherwise, may decrease demand for our products and cause downward pressure on the prices we charge. Accordingly, if there is a downturn in the energy production and supply industry, our business, financial condition and results of operations could be adversely affected.
Federal, state and local legislative and regulatory initiatives relating to hydraulic fracturing and the potential for related regulatory action or litigation could result in increased costs and additional operating restrictions or delays for our customers, which could negatively impact our business, financial condition and results of operations.
We supply equipment to companies that process, transport and utilize natural gas, many of which benefit from increased natural gas production resulting from hydraulic fracturing in the oil and natural gas industry. As a result, increased regulation
of hydraulic fracturing may adversely impact our business, financial condition and results of operations. If additional levels of
regulation are implemented with respect to hydraulic fracturing, it may make it more difficult to complete natural gas wells in shale formations and discourage exploration of new wells. This could increase our customers' costs of compliance and doing business or otherwise adversely affect the hydraulic fracturing services they perform, which may negatively impact natural gas production and demand for our equipment used in the natural gas industry.
In addition, heightened political, regulatory and public scrutiny of hydraulic fracturing practices could potentially expose our customers to increased legal and regulatory proceedings, which could negatively impact natural gas production and demand for our equipment used in the natural gas industry. Any such developments could have a material adverse effect on our business, financial condition and results of operations, whether directly or indirectly.
We may be unable to compete successfully in the highly competitive markets in which we operate.
Although many of our products serve niche markets, a number of our direct and indirect competitors in these markets are major corporations, some of which have substantially greater technical, financial and marketing resources than Chart, and other competitors enter these markets from time to time. Any increase in competition may cause us to lose market share or compel us to reduce prices to remain competitive, which could result in reduced sales and earnings. We compete with several suppliers owned by global industrial gas producers or large industrial companies and many smaller fabrication-only facilities around the world. Increased competition with these companies could prevent the institution of price increases or could require price reductions or increased spending on research and development, and marketing and sales, any of which could materially reduce our sales, profitability or both. Moreover, during an industry downturn, competition in some of the product lines we serve increases as a result of over-capacity, which may result in downward pricing pressure. Further, customers who typically outsource their need for cryogenic systems to us may use their excess capacity to produce such systems themselves. We also compete in the sale of a limited number of products with certain of our major customers. If we are unable to compete successfully, our results of operations, cash flows and financial condition could be negatively affected.
Governmental energy policies could change, or expected changes could fail to materialize, which could adversely affect our business or prospects.
Energy policy can develop rapidly in the markets we serve, including the United States. Within the last few years, significant developments have taken place, primarily in international markets that we serve with respect to energy policy and related regulations. We anticipate that energy policy will continue to be an important regulatory priority globally as well as on a national, state and local level. As energy policy continues to evolve, the existing rules and incentives that impact the energy-related segments of our business may change. It is difficult, if not impossible, to predict whether changes in energy policy might occur in the future and the timing of potential changes and their impact on our business. The elimination or reduction of favorable policies for our energy-related business, or the failure to adopt expected policies that would benefit our business, could negatively impact our sales and profitability. For example, China’s 12th Five-Year Plan promotes the use of natural gas by mandating an increase of gas as a percentage of energy consumption from less thatthan 4% to over 8%. Our business prospects in China could be harmed if China changed this policy or the mandate is not otherwise achieved.
We may be unable to compete successfully in the highly competitive markets in which we operate.
Although many of our products serve niche markets, a number of our direct and indirect competitors in these markets are major corporations, some of which have substantially greater technical, financial and marketing resources than Chart, and other competitors enter these markets from time to time. Any increase in competition may cause us to lose market share or compel us to reduce prices to remain competitive, which could result in reduced sales and earnings. Companies, or their divisions, that operate in our industry include Air Products, Kobe, Linde, Fives, Sumitomo, CVA and Taylor-Wharton. Additionally, we compete with several suppliers owned by global industrial gas producers and many smaller fabrication-only facilities around the world. Increased competition with these companies could prevent the institution of price increases or could require price reductions or increased spending on research and development, and marketing and sales, any of which could materially reduce our sales, profitability or both. Moreover, during an industry downturn, competition in some of the product lines we serve increases as a result of over-capacity, which may result in downward pricing pressure. Further, customers who typically outsource their need for cryogenic systems to us may use their excess capacity to produce such systems themselves. We also compete in the sale of a limited number of products with certain of our major customers. If we are unable to compete successfully manage our resultsplanned operational expansions, it may place a significant strain on our management and administrative resources and lead to increased costs and reduced profitability.
We expect to continue to expand our operations, particularly in China and the United States, in markets where we perceive the opportunity for profitable expansion. Our ability to operate our business successfully and implement our strategies depends, in part, on our ability to allocate our resources optimally in each of our facilities in order to maintain efficient operations cash flowsas we expand. Ineffective management of our growth could cause manufacturing inefficiencies, increase our operating costs, place significant strain on our management and financial conditionadministrative resources and prevent us from implementing our business plan.
For example, we have invested or plan to invest approximately $60 to $90 million in new capital expenditures in 2014 related to the expected growth of selective parts of each of the E&C, D&S and BioMedical segments. If we fail to implement these projects in a timely and effective manner, we may lose the opportunity to obtain some new customer orders. Even if we effectively implement these projects, the orders needed to support the capital expenditure may not be obtained, may be delayed, or may be less than expected, which may result in sales or profitability at lower levels than anticipated. For example, while we invested in the expansion of our E&C segment in past years, we experienced delay in some of the orders initially anticipated to support the cold box portion of that expansion, which resulted in the underutilization of some of our capacity. In addition, potential cost overruns, delays or unanticipated problems in any capital expansion could be negatively affected.make the expansions more costly than originally predicted or cause us to miss windows of opportunity.
Downturns in economic and financial conditions have had and may have in the future a negative effect on our business, financial condition and results of operations.
Demand for our products depends in large part upon the level of capital and maintenance expenditures by many of our customers and end users. While general economic conditions improved throughout 2011 and early 2012 and continue to improve in many parts of the world, there has been continued economic weakness in Europe and aend-users. A downturn in economic conditions there or elsewherein markets in which we operate may reduce the willingness or ability of our customers and prospective customers to commit funds to purchase our products and services, and may reduce their ability to pay for our products and services after purchase. Economic conditions that could impact our business include, but are not limited to, recessionary conditions, slow or negative economic growth rates, the impact of state and sovereign debt defaults or the impact of U.S. budgetary pressures. Similarly, our suppliers may not be able to supply us with needed raw materials or components on a timely basis, may increase prices or go out of business, which could result in our inability to meet customer demand, or fulfill our contractual obligations or could affect our gross margins. See “We depend on the availability of certain key suppliers; if we experience difficulty with a supplier, we may have difficulty finding alternative sources of supply” below. We cannot predict the timing or duration of negative market conditions. If the economy or markets in which we operate deteriorate or financial markets weaken, our business, financial condition and results of operations could be adversely impacted.
Our exposure to fixed-price contracts, including exposure to fixed pricing on long-term customer contracts, could negatively impact our financial results.
A substantial portion of our sales has historically been derived from fixed-price contracts for large system projects, which may involve long-term fixed price commitments to customers and which are sometimes difficult to execute. We have experienced difficulties in executing large contracts of this kind in the past, including cost overruns, storm damage, supplier failures and customer disputes.
To the extent that any of our fixed-price contracts are delayed, our subcontractors fail to perform, contract counterparties successfully assert claims against us, the original cost estimates in these or other contracts prove to be inaccurate or the contracts do not permit us to pass increased costs on to our customers, profitability from a particular contract may decrease or project losses may be incurred, which, in turn, could decrease our sales and overall profitability. The uncertainties associated with our fixed-price contracts make it more difficult to predict our future results and exacerbate the risk that our results will not match expectations, which has happened in the past.
If we are unable to successfully manage our planned operational expansions, it may place a significant strain on our management and administrative resources and lead to increased costs and reduced profitability.
We expect to continue to expand our operations, particularly in China and the United States, in markets where we perceive the opportunity for profitable expansion. Our ability to operate our business successfully and implement our strategies depends, in part, on our ability to allocate our resources optimally in each of our facilities in order to maintain efficient operations as we expand. Ineffective management of our growth could cause manufacturing inefficiencies, increase our operating costs, place significant strain on our management and administrative resources and prevent us from implementing our business plan.
For example, we have invested or plan to invest approximately $70 to $80 million in new capital expenditures in 2013 related to the expected growth of selective parts of each of the E&C, D&S and BioMedical segments. If we fail to implement these projects in a timely and effective manner, we may lose the opportunity to obtain some new customer orders. Even if we effectively implement these projects, the orders needed to support the capital expenditure may not be obtained, may be delayed, or may be less than expected, which may result in sales or profitability at lower levels than anticipated. For example, while we invested in the expansion of our E&C segment in recent years, we experienced delay in some of the orders initially anticipated to support the cold box portion of that expansion, which resulted in the underutilization of some of our capacity. In addition, potential cost overruns, delays or unanticipated problems in any capital expansion could make the expansions more costly than originally predicted or cause us to miss windows of opportunity.
We depend on the availability of certain key suppliers; if we experience difficulty with a supplier, we may have difficulty finding alternative sources of supply.
The cost, quality and availability of raw materials and certain specialty metals used to manufacture our products are critical to our success. The materials and components we use to manufacture our products are sometimes custom made and may be available only from a few suppliers, and the lead times required to obtain these materials and components can often be significant. We rely on sole suppliers or a limited number of suppliers for some of these materials, including special grades of aluminum used in our brazed aluminum heat exchangers. While we have not historically encountered problems with availability, this does not mean that we will continue to have timely access to adequate supplies of essential materials and components in the future or that supplies of these materials and components will be available on satisfactory terms when needed. If our vendors for these materials and components are unable to meet our requirements, fail to make shipments in a timely manner or ship defective materials or components, we could experience a shortage or delay in supply or fail to meet our contractual requirements, which would adversely affect our results of operations and negatively impact our cash flow and profitability.
Our backlog is subject to modification or termination of orders, which could negatively impact our sales.
Our backlog is comprised of the portion of firm signed purchase orders or other written contractual commitments received from customers that we have not recognized as sales. The dollar amount of backlog as of December 31, 20122013 was $617.4728.8 million. Our backlog can be significantly affected by the timing of orders for large products,projects, particularly in our E&C segment, and the amount of our backlog at December 31, 20122013 is not necessarily indicative of future backlog levels or the rate at which backlog will be recognized as sales. Although historically the amount of modifications and terminations of our orders has not been material compared to our total contract volume and is partially offset by cancellation penalties, customers can, and sometimes do, terminate or modify these orders. We cannot predict whether cancellations will accelerate or diminish in the future. Cancellations of purchase orders or reductions of product quantities in existing contracts could substantially and
materially reduce our backlog and, consequently, our future sales. Our failure to replace canceled or reduced backlog could negatively impact our sales and results of operations.
Health care reform or other changes in government and other third-party payor reimbursement levels and practices could negatively impact our sales and profitability.
Acquisitions by our BioMedical segment have significantly increased the size and impact on our financial results of our respiratory products business. Many of our BioMedical segment’s customers are reimbursed for products and services by third-party payors, such as government programs, including Medicare and Medicaid, private insurance plans and managed care programs in the U.S, and by similar programs and entities in the other countries in which we operate or sell our equipment. In the United States, the Centers for Medicare & Medicaid Services (CMS), the agency responsible for administering the Medicare program, implemented a number of payment rules that reduced Medicare payments for oxygen and oxygen equipment, including a competitive bidding program effective January 1, 2011. Under the competitive bidding program, CMS selected contract suppliers that agreed to receive as payment the “single payment amount” calculated by CMS in certain geographic regions. If third-party payors deny coverage, make the reimbursement process or documentation requirements more uncertain or reduce levels of reimbursement, it could negatively affect our sales and profitability.
In March 2010, health care reform legislation known as the Affordable Care Act was adopted in the United States. The new law includes provisions that, among other things, reduce and/or limit Medicare reimbursement, require all individuals to have health insurance (with limited exceptions) and impose new and/or increased taxes. In addition, the Affordable Care Act requires CMS to nationalize the competitive bidding process or adjust the prices in non-competitive bidding areas to match competitive bidding prices. The Affordable Care Act could impact the demand for our products or the prices at which we sell our products. The impact of this law and these proposals could have a material adverse effect on our business, results of operations and/or financial condition.
As a global business, we are exposed to economic, political and other risks in different countries which could materially reduce our sales, profitability or cash flows, or materially increase our liabilities.
Since we manufacture and sell our products worldwide, our business is subject to risks associated with doing business internationally. In 2012, 2011 and 2010, 56%, 58% and 57%, respectively, of our sales were made in international markets. Our future results could be harmed by a variety of factors, including:
changes in foreign currency exchange rates;
exchange controls and currency restrictions;
changes in a specific country’s or region’s political, social or economic conditions, particularly in emerging markets;
civil unrest, turmoil or outbreak of disease in any of the countries in which we operate or sell our products;
tariffs, other trade protection measures and import or export licensing requirements;
potentially negative consequences from changes in U.S. and international tax laws;
difficulty in staffing and managing geographically widespread operations;
differing labor regulations;
requirements relating to withholding taxes on remittances and other payments by subsidiaries;
different regulatory regimes controlling the protection of our intellectual property;
restrictions on our ability to own or operate subsidiaries, make investments or acquire new businesses in these jurisdictions;
restrictions on our ability to repatriate dividends from our foreign subsidiaries;
difficulty in collecting international accounts receivable;
difficulty in enforcement of contractual obligations under non-U.S. law;
transportation delays or interruptions;
changes in regulatory requirements; and
the burden of complying with multiple and potentially conflicting laws.
For example, the continuing European sovereign debt crisis has negatively affected economic conditions in Europe and globally. If the European sovereign debt crisis continues or deepens, economic conditions in Europe may further deteriorate. In that case, our business in Europe and elsewhere, as well as the businesses of our customers and suppliers, may be adversely affected.
Our international operations and sales also expose us to different local political and business risks and challenges. For example, we are faced with potential difficulties in staffing and managing local operations and we have to design local solutions to manage credit and legal risks of local customers and distributors, which may not be effective. In addition, because some of our international sales are to suppliers that perform work for foreign governments, we are subject to the political risks associated with foreign government projects. For example, certain foreign governments may require suppliers for a project to obtain products solely from local manufacturers or may prohibit the use of products manufactured in certain countries.
International growth and expansion into emerging markets, such as China, Central and Eastern Europe, India, the Middle East and Latin America, may cause us difficulty due to greater regulatory barriers than in the United States, the necessity of adapting to new regulatory systems, problems related to entering new markets with different economic, social and political systems and conditions, and significant competition from the primary participants in these markets, some of which may have substantially greater resources than us. For example, unstable political conditions or civil unrest, including political instability in North Africa and the Middle East, could negatively impact our order levels and sales in a region or our ability to collect receivables from customers or operate or execute projects in a region.
Our international operations and transactions also depend upon favorable trade relations between the United States and those foreign countries in which our customers and suppliers have operations. A protectionist trade environment in either the United States or those foreign countries in which we do business or sell products, such as a change in the current tariff structures, export compliance, government subsidies or other trade policies, may adversely affect our ability to sell our products or do business in foreign markets. Our overall success as a global business depends, in part, upon our ability to succeed in differing economic, social and political conditions. We may not succeed in developing and implementing policies and strategies to counter the foregoing factors effectively in each location where we do business and the foregoing factors may cause a reduction in our sales, profitability or cash flows, or cause an increase in our liabilities.
We may fail to successfully acquire or integrate companies that provide complementary products or technologies.
A component of our business strategy is the acquisition of businesses that complement our existing products and services. Such a strategy involves the potential risks inherent in assessing the value, strengths, weaknesses, contingent or other liabilities and potential profitability of acquisition candidates and in integrating the operations of acquired companies. In addition, any acquisitions of businesses with foreign operations or sales may increase our exposure to risks inherent in doing business outside the United States.
From time to time, we may have acquisition discussions with potential target companies both domestically and internationally. If a large acquisition opportunity arises and we proceed, a substantial portion of our cash and surplus borrowing capacity could be used for the acquisition or we may seek additional debt or equity financing. For example, in August 2012 we used a substantial portion of our available cash to acquire AirSep Corporation.
Potential acquisition opportunities become available to us from time to time, and we engage periodically in discussions or negotiations relating to potential acquisitions, including acquisitions that may be material in size or scope to our business. Any acquisition may or may not occur and, if an acquisition does occur, it may not be successful in enhancing our business for one or more of the following reasons:
Any business acquired may not be integrated successfully and may not prove profitable;
The price we pay for any business acquired may overstate the value of that business or otherwise be too high;
Liabilities we take on through the acquisition may prove to be higher than we expected;
We may fail to achieve acquisition synergies; or
The focus on the integration of operations of acquired entities may divert management’s attention from the day-to-day operation of our businesses.
Inherent in any future acquisition is the risk of transitioning company cultures and facilities. The failure to efficiently and effectively achieve such transitions could increase our costs and decrease our profitability.
If we lose our senior managementHealth care reform or other key employees,changes in government and other third-party payor reimbursement levels and practices could negatively impact our business may be adversely affected.sales and profitability.
Our ability to successfully operateAcquisitions by our BioMedical segment have significantly increased the size and growimpact on our business and implementfinancial results of our strategies is largely dependent on the efforts, abilitiesrespiratory products business. Many of our BioMedical segment’s customers are reimbursed for products and services of our senior management and other key employees. Our future success will also depend on, among other factors, our ability to attract and retain qualified personnel,by third-party payors, such as engineersgovernment programs, including Medicare and Medicaid, private insurance plans and managed care programs in the U.S, and by similar programs and entities in the other skilled labor, either through direct hiringcountries in which we operate or sell our equipment. In the acquisitionUnited States, the Centers for Medicare & Medicaid Services (“CMS”), the agency responsible for administering the Medicare program, implemented a number of other businesses employing such professionals. Our products, manypayment rules that reduced Medicare payments for oxygen and oxygen equipment, including a competitive bidding program effective January 1, 2011. Under the competitive bidding program, CMS selected contract suppliers that agreed to receive as payment the “single payment amount” calculated by CMS in certain geographic regions. In addition, CMS has increased the level of audit activity involving the sales practices of intermediaries in the health care field, some of which are highly engineered, represent specialized applicationscustomers of cryogenic low temperatureours for respiratory products we sell. If third-party payors deny coverage, make the reimbursement process or gas processing technologiesdocumentation requirements more burdensome or uncertain, or reduce levels of reimbursement, it could negatively affect our sales and know-how,profitability.
In March 2010, the Affordable Care Act was adopted in the United States. The law includes provisions that, among other things, reduce and/or limit Medicare reimbursement, require all individuals to have health insurance (with limited exceptions) and manyimpose new and/or increased taxes. In addition, the Affordable Care Act requires CMS to nationalize the competitive bidding process or adjust the prices in non-competitive bidding areas to match competitive bidding prices. There remains a significant amount of uncertainty regarding the implementation of the marketsAffordable Care Act, and the potential impact of such policies on the demand for our products or the prices at which we serve represent niche markets for these specialized applications. Accordingly,sell our products. Any such negative impact in demand or product prices associated with the Affordable Care Act could have a material adverse effect on our business, results of operations and/or financial condition.
As a global business, we rely heavilyare exposed to economic, political and other risks in different countries which could materially reduce our sales, profitability or cash flows, or materially increase our liabilities.
Since we manufacture and sell our products worldwide, our business is subject to risks associated with doing business internationally. In 2013, 2012 and 2011, 59%, 56% and 58%, respectively, of our sales were made in international markets. Our future results could be harmed by a variety of factors, including:
changes in foreign currency exchange rates;
exchange controls and currency restrictions;
changes in a specific country’s or region’s political, social or economic conditions, particularly in emerging markets;
civil unrest, turmoil or outbreak of disease in any of the countries in which we operate or sell our products;
tariffs, other trade protection measures and import or export licensing requirements;
potentially negative consequences from changes in U.S. and international tax laws;
difficulty in staffing and managing geographically widespread operations;
differing labor regulations;
requirements relating to withholding taxes on engineers, salespersons, business unit leaders, senior managementremittances and other key employees who have experiencepayments by subsidiaries;
different regulatory regimes controlling the protection of our intellectual property;
restrictions on our ability to own or operate subsidiaries, make investments or acquire new businesses in these specialized applicationsjurisdictions;
restrictions on our ability to repatriate dividends from our foreign subsidiaries;
difficulty in collecting international accounts receivable;
difficulty in enforcement of contractual obligations under non-U.S. law;
transportation delays or interruptions;
changes in regulatory requirements; and
the burden of complying with multiple and potentially conflicting laws.
Our international operations and sales also expose us to different local political and business risks and challenges. For example, we are knowledgeable aboutfaced with potential difficulties in staffing and managing local operations and we have to design local solutions to manage credit and legal risks of local customers and distributors, which may not be effective. In addition, because some of our international sales are to suppliers that perform work for foreign governments, we are subject to the political risks associated with foreign government projects. For example, certain foreign governments may require suppliers for a project to obtain products solely from local manufacturers or may prohibit the use of products manufactured in certain countries.
International growth and expansion into markets such as China, Central and Eastern Europe, India, the Middle East and Latin America, may cause us difficulty due to greater regulatory barriers than in the United States, the necessity of adapting to new regulatory systems, problems related to entering new markets with different economic, social and political systems and conditions, and significant competition from the primary participants in these niche markets, some of which may have substantially greater resources than us. For example, unstable political conditions or civil unrest, including political instability in North Africa, the Middle East or elsewhere, could negatively impact our order levels and sales in a region or our ability to collect receivables from customers or operate or execute projects in a region.
Our international operations and transactions also depend upon favorable trade relations between the United States and those foreign countries in which our customers and suppliers have operations. A protectionist trade environment in either the United States or those foreign countries in which we do business or sell products, such as a change in the current tariff structures, export compliance, government subsidies or other trade policies, may adversely affect our ability to sell our products or do business in foreign markets. Our overall success as a global business depends, in part, upon our ability to succeed in differing economic, social and political conditions. We may not succeed in developing and implementing policies and strategies to counter the foregoing factors effectively in each location where we do business and the foregoing factors may cause a reduction in our company. Additionally, we may modifysales, profitability or cash flows, or cause an increase in our management structure from time to time or substantially reduce our overall workforce as we did in certain sectors of our business during the recent economic downturn, which may create marketing, operational and other business risks. The loss of the services of these senior managers or other key employees or the failure to attract or retain other qualified personnel could reduce the competitiveness of our business or otherwise impair our business prospects.liabilities.
Due to the nature of our business and products, we may be liable for damages based on product liability and warranty claims.
Due to the high pressures and low temperatures at which many of our products are used, the inherent risks associated with concentrated industrial and hydrocarbon gases, and the fact that some of our products are relied upon by our customers or end users in their facilities or operations, or are manufactured for relatively broad industrial, transportation or consumer use, we face an inherent risk of exposure to claims in the event that the failure, use or misuse of our products results, or is alleged to result, in death, bodily injury, property damage or economic loss. We believe that we meet or exceed existing professional specification standards recognized or required in the industries in which we operate. We are subject to claims from time to time, some of which are substantial, and we may be subject to claims in the future. For example, we and some of our subsidiaries have been subject to assertions that failure of our subsidiaries' equipment has caused substantial property damage and economic loss at facilities owned by customers or third parties, including a natural gas processing plant fire where the performance of our subsidiary's equipment is being investigated, a lawsuit against us and our subsidiaries is pending, and end user losses are alleged to be more than $75approximately $105 million, including investigation and repair costs and business interruption losses,
responsibility for which we and our subsidiaries vigorously dispute. See Item 3. "Legal“Legal Proceedings,"” for further details. Although we currently maintain product liability coverage, which we believe is adequate for existing product liability claims and for the continued operation of our business, such insurance may become difficult to obtain or be unobtainable in the future on terms acceptable to us, it includes customary exclusions and conditions, it may not cover certain specialized applications, such as aerospace-related applications, and it generally does not cover warranty claims. A successful product liability claim or series of claims against us, including one or more consumer claims purporting to constitute class actions or claims resulting from extraordinary loss events, in excess of or outside our insurance coverage, or a significant warranty claim or series of claims against us, could materially decrease our liquidity, impair our financial condition and adversely affect our results of operations.
Our warranty reserves may not adequately cover our warranty obligations and increased or unexpected product warranty claims could adversely impact our financial condition and results of operations.
We provide product warranties with varying terms and durations for the majority of our products and we establish reserves for the estimated liability associated with our product warranties. Our warranty reserves are based on historical trends as well as our understanding of specifically identified warranty issues. The amounts estimated could differ materially from actual warranty costs that may ultimately be realized. An increase in the rate of warranty claims or the occurrence of unexpected warranty claims could have a material adverse effect on our financial condition or results of operations.
If we lose our senior management or other key employees, our business may be adversely affected.
Our ability to successfully operate and grow our business and implement our strategies is largely dependent on the efforts, abilities and services of our senior management and other key employees. Our future success will also depend on, among other factors, our ability to attract and retain qualified personnel, such as engineers and other skilled labor, either through direct hiring or the acquisition of other businesses employing such professionals. Our products, many of which are highly engineered, represent specialized applications of cryogenic low temperature or gas processing technologies and know-how, and many of the markets we serve represent niche markets for these specialized applications. Accordingly, we rely heavily on engineers, salespersons, business unit leaders, senior management and other key employees who have experience in these specialized applications and are knowledgeable about these niche markets, our products, and our company. Additionally, we may modify our management structure from time to time or substantially reduce our overall workforce as we did in certain sectors of our business during the recent economic downturn, which may create marketing, operational and other business risks. The loss of the services of these senior managers or other key employees or the failure to attract or retain other qualified personnel could reduce the competitiveness of our business or otherwise impair our business prospects.
Fluctuations in exchange and interest rates may affect our operating results and impact our financial condition.
Fluctuations in the value of the U.S. dollar may increase or decrease our sales or earnings. Because our consolidated financial results are reported in U.S. dollars, if we generate sales or earnings in other currencies, the translation of those results into U.S. dollars can result in a significant increase or decrease in the amount of those sales or earnings. We also bid for certain foreign projects in U.S. dollars or euros. If the U.S. dollar or euro strengthens relative to the value of the local currency, we may be less competitive on those projects. In addition, our debt service requirements are primarily in U.S. dollars and a portion of our cash flow is generated in euros or other foreign currencies. Significant changes in the value of the foreign currencies relative to the U.S. dollar could impair our cash flow and financial condition.
In addition, fluctuations in currencies relative to the U.S. dollar may make it more difficult to perform period-to-period comparisons of our reported results of operations. For purposes of accounting, the assets and liabilities of our foreign operations, where the local currency is the functional currency, are translated using period-end exchange rates, and the revenues and expenses of our foreign operations are translated using average exchange rates during each period. For example, we have material euro-denominated net monetary assets and liabilities. If the European sovereign debt crisis leads toeconomic circumstances result in a significant devaluation of the euro, the value of our euro-denominated net monetary assets and liabilities would be correspondingly reduced when translated into U.S. dollars for inclusion in our financial statements. Similarly, the re-introduction of certain individual country currencies or the complete dissolution of the euro, could adversely affect the value of our euro-denominated net monetary assets and liabilities. In either case, our business, results of operations, financial condition and liquidity could be materially adversely affected.
In addition to currency translation risks, we incur currency transaction risk whenever we or one of our subsidiaries enters into either a purchase or a sales transaction using a currency other than the functional currency of the transacting entity. Given the volatility of exchange rates, we may not be able to effectively manage our currency and/or translation risks. Volatility in currency exchange rates may decrease our sales and profitability and impair our financial condition. We have purchased and
may continue to purchase foreign currency forward buy and sell contracts to manage the risk of adverse currency fluctuations and if the contracts are inconsistent with currency trends we could experience exposure related to foreign currency fluctuations.
We are also exposed to general interest rate risk. If interest rates increase, our interest expense could increase significantly, affecting earnings and reducing cash flow available for working capital, capital expenditures, acquisitions, and other purposes. In addition, changes by any rating agency to our outlook or credit ratings could increase our cost of borrowing.
We are subject to potential insolvency or financial distress of third parties.
We are exposed to the risk that third parties to various arrangements who owe us money or goods and services, or who purchase goods and services from us, will not be able to perform their obligations or continue to place orders due to insolvency or financial distress. If third parties fail to perform their obligations under arrangements with us, we may be forced to replace the underlying commitment at current or above market prices or on other terms that are less favorable to us or we may have to write off receivables in the case of customer failures to pay. If this happens, whether as a result of the insolvency or financial distress of a third party or otherwise, we may incur losses, or our results of operations, financial position or liquidity could otherwise be adversely affected.
Some of our products are subject to regulation by the U.S. Food and Drug Administration and other governmental authorities.
Some of our products are subject to regulation by the U.S. Food and Drug Administration and other national, supranational, federal and state governmental authorities. It can be costly and time consuming to obtain regulatory approvals to market a medical device, such as those sold by our BioMedical segment. Approvals might not be granted for new devices on a timely basis, if at all. Regulations are subject to change as a result of legislative, administrative or judicial action, which may further increase our costs or reduce sales. Our failure to maintain approvals or obtain approval for new products could adversely affect our business, results of operations, financial condition and cash flows.
In addition, we are subject to regulations covering manufacturing practices, product labeling, advertising and adverse-event reporting that apply after we have obtained approval to sell a product. Many of our facilities' procedures and those of our suppliers are subject to ongoing oversight, including periodic inspection by governmental authorities. Compliance with production, safety, quality control and quality assurance regulations is costly and time-consuming, and while we seek to be in full compliance, noncompliance could arise from time to time. If we fail to comply, our operations, financial condition and cash flows could be adversely affected, including through the imposition of fines, costly remediation or plant shutdowns, suspension or delay in product approval, product seizure or recall, or withdrawal of product approval as a result of noncompliance.
Fluctuations in the prices and availability of raw materials could negatively impact our financial results.
The pricing and availability of raw materials for use in our businesses can be volatile due to numerous factors beyond our control, including general, domestic and international economic conditions, labor costs, production levels, competition, consumer demand, import duties and tariffs and currency exchange rates. This volatility can significantly affect the availability and cost of raw materials for us, and may, therefore, increase the short-term or long-term costs of raw materials.
The commodity metals we use, including aluminum and stainless steel, have experienced significant fluctuations in price in recent years. On average, over half of our cost of sales for many of our product lines has historically been represented by the cost of commodities metals. We have generally been able to recover the cost increases through price increases to our customers; however, during periods of rising prices of raw materials, we may not always be able to pass increases on to our customers. Conversely, when raw material prices decline, customer demands for lower prices could result in lower sale prices and, to the extent we have existing inventory, lower margins. As a result, fluctuations in raw material prices could result in lower sales and profitability.
If we are unable to effectively control our costs while maintaining our customer relationships and core resources, our business, results of operations and financial condition could be adversely affected.
It is critical for us to appropriately align our cost structure with prevailing market conditions, to minimize the effect of economic fluctuation on our operations, and in particular, to continue to maintain our customer relationships, core resources and manufacturing capacity while protecting profitability and cash flow. If we are unable to align our cost structure in response to prevailing economic conditions on a timely basis, or if implementation or failure to implement any cost structure adjustments
has an adverse impact on our business or prospects, then our financial condition, results of operations and cash flows may be negatively affected.
Failure to protect our intellectual property and know-how could reduce or eliminate any competitive advantage and reduce our sales and profitability, and the cost of protecting our intellectual property may be significant.
We rely on a combination of internal procedures, nondisclosure agreements, intellectual property rights assignment agreements, as well as licenses, patents, trademarks and copyright law to protect our intellectual property and know-how. Our intellectual property rights may not be successfully asserted in the future or may be invalidated, circumvented or challenged. For example, we frequently explore and evaluate potential relationships and projects with other parties, which often require that we provide the potential partner with confidential technical information. While confidentiality agreements are typically put in place, there is a risk the potential partner could violate the confidentiality agreement and use our technical information for its own benefit or the benefit of others or compromise the confidentiality. In addition, the laws of certain foreign countries in which our products may be sold or manufactured do not protect our intellectual property rights to the same extent as the laws of the United States. For example, we are increasing our manufacturing capabilities and sales in China, where laws may not protect our intellectual property rights to the same extent as in the United States. In addition, certain provisions of the Leahy-Smith America Invents Act went into effect on March 16, 2013. The Leahy-Smith America Invents Act transitioned the United States from a “first-to-invent” to a “first-to-file” patent system. This change means that between two identical, pending patent applications, the first inventor no longer receives priority on the patent to the invention. As a result, the Leahy-Smith America Invents Act may require us to incur significant additional expense and effort to protect our intellectual property. Failure or inability to protect our proprietary information could result in a decrease in our sales or profitability.
We have obtained and applied for some U.S. and foreign trademark and patent registrations and will continue to evaluate the registration of additional trademarks and patents, as appropriate. We cannot guarantee that any of our pending applications will be approved. Moreover, even if the applications are approved, third parties may seek to oppose or otherwise challenge them. A failure to obtain registrations in the United States or elsewhere could limit our ability to protect our trademarks and technologies and could impede our business. Further, the protection of our intellectual property may require expensive investment in protracted litigation and the investment of substantial management time and there is no assurance we ultimately would prevail or that a successful outcome would lead to an economic benefit that is greater than the investment in the litigation. The patents in our patent portfolio are scheduled to expire between 2014 and 2033.
In addition, we may be unable to prevent third parties from using our intellectual property rights and know-how without our authorization or from independently developing intellectual property that is the same as or similar to ours, particularly in those countries where the laws do not protect our intellectual property rights as fully as in the United States. We compete in a number of industries (for example, heat exchangers and cryogenic storage) that are small or specialized, which makes it easier for a competitor to monitor our activities and increases the risk that ideas will be stolen. The unauthorized use of our know-how by third parties could reduce or eliminate any competitive advantage we have developed, cause us to lose sales or otherwise harm our business or increase our expenses as we attempt to enforce our rights.
We carry goodwill and indefinite-lived intangible assets on our balance sheet, which are subject to impairment testing and could subject us to significant charges to earnings in the future if impairment occurs.
As of December 31, 20122013, we had goodwill and indefinite-lived intangible assets of $446.7446.8 million, which represented approximately 33.6%30.6% of our total assets. The value of these assets may increase in the future if we complete acquisitions as part of our overall business strategy. Goodwill and indefinite-lived intangible assets are not amortized, but are tested for impairment annually on October 1 or more often if events or changes in circumstances indicate a potential impairment may exist. Factors that could indicate that our goodwill or indefinite-lived intangible assets are impaired include a decline in stock price and market capitalization, lower than projected operating results and cash flows, and slower growth rates in our industry. Our stock price historically has fluctuated significantly in response to market and other factors. For example, it declined significantly from mid-2008 to early 2009 and then increased sharply beginning in late 2010 and early 2011.through late 2013, when it again declined significantly. Declines in our stock price in the future could increase the risk of goodwill impairment if the price of our stock does not recover. Impairment testing incorporates our estimates of future operating results and cash flows, estimates of allocations of certain assets and cash flows among reporting segments, estimates of future growth rates and our judgment regarding the applicable discount rates to use to discount those estimated operating results and cash flows. If we determine that an impairment exists, it may result in a significant non-cash charge to earnings and lower stockholders’ equity.
We may be required to make material expenditures in order to comply with environmental, health and safety laws and climate change regulations, or incur additional liabilities under these laws and regulations.
We are subject to numerous environmental, health and safety laws and regulations that impose various environmental controls on us or otherwise relate to environmental protection and various health and safety matters, including the discharge of pollutants in the air and water, the handling, use, treatment, storage and clean-up of solid and hazardous materials and wastes, the investigation and remediation of soil and groundwater affected by hazardous substances and the requirement to obtain and maintain permits and licenses. These laws and regulations often impose strict, retroactive and joint and several liability for the
costs of, and damages resulting from, cleaning up our, or our predecessors’, past or present facilities and third party disposal sites. Compliance with these laws generally increases the costs of transportation and storage of raw materials and finished products, as well as the costs of storing and disposing waste, and could decrease our liquidity and profitability and increase our liabilities. Health and safety and other laws in the jurisdictions in which we operate impose various requirements on us including state licensing requirements that may benefit our customers. If we are found to have violated any of these laws, we may become subject to corrective action orders and fines or penalties, and incur substantial costs, including substantial remediation costs and commercial liability to our customers. Further, we also could be subject to future liability resulting from conditions that are currently unknown to us that could be discovered in the future.
We are currently remediating or developing work plans for remediation of environmental conditions involving certain current or former facilities. For example, the discovery of contamination arising from historical industrial operations at our Clarksville, Arkansas property, which is currently being leased to a third party business, has exposed us, and in the future may continue to expose us, to remediation obligations. We have also been subject to environmental liabilities for other sites where we formerly operated or at locations where we or our predecessors did or are alleged to have operated. To date, our environmental remediation expenditures and costs for otherwise complying with environmental laws and regulations have not been material, but the uncertainties associated with the investigation and remediation of contamination and the fact that such laws or regulations change frequently makes predicting the cost or impact of such laws and regulations on our future operations uncertain. Stricter environmental, safety and health laws, regulations or enforcement policies could result in substantial costs and liabilities to us and could subject us to more rigorous scrutiny. Consequently, compliance with these laws could result in significant expenditures as well as other costs and liabilities that could decrease our liquidity and profitability and increase our liabilities.
There is a growing political and scientific belief that emissions of greenhouse gases alter the composition of the global atmosphere in ways that are affecting the global climate. Various stakeholders, including legislators and regulators, stockholders and non-governmental organizations, as well as companies in many business sectors, are considering ways to reduce greenhouse gas emissions. New regulations could result in product standard requirements for the Company’s global businesses but because any impact is dependent on the design of the mandate or standard, the Company is unable to predict its significance at this time. Furthermore, the potential physical impacts of theorized climate change on the Company’s customers, and therefore on the Company’s operations, are speculative and highly uncertain, and would be particular to the circumstances developing in various geographical regions. These may include changes in weather patterns (including drought and rainfall levels), water availability, storm patterns and intensities, and temperature levels. These potential physical effects may adversely impact the cost, production, sales and financial performance of the Company’s operations.
FailureIncreased IT security threats and more sophisticated and targeted computer crime could pose a risk to protect our intellectual propertysystems, networks, products, solutions and know-how could reduce or eliminate any competitive advantageservices.
Increased global IT security threats and reducemore sophisticated and targeted computer crime pose a risk to the security of our salessystems and profitability,networks and the cost of protecting our intellectual property may be significant.
We rely on a combination of internal procedures, nondisclosure agreements, intellectual property rights assignment agreements, as well as licenses, patents, trademarksconfidentiality, availability and copyright law to protect our intellectual property and know-how. Our intellectual property rights may not be successfully asserted in the future or may be invalidated, circumvented or challenged. For example, we frequently explore and evaluate potential relationships and projects with other parties, which often require that we provide the potential partner with confidential technical information. While confidentiality agreements are typically put in place, there is a risk the potential partner could violate the confidentiality agreement and use our technical information for its own benefit or the benefit of others or compromise the confidentiality. In addition, the laws of certain foreign countries in which our products may be sold or manufactured do not protect our intellectual property rights to the same extent as the laws of the United States. For example, we are increasing our manufacturing capabilities and sales in China, where laws may not protect our intellectual property rights to the same extent as in the United States. In addition, certain provisions of the Leahy-Smith America Invents Act will go into effect on March 16, 2013. The Leahy-Smith America Invents Act will shift the United States from a "first-to-invent" to a "first-to-file" patent system. This change means that between two identical, pending patent applications, the first inventor will no longer receive priority on the patent to the invention. As a result, the Leahy-Smith America Invents Act may require us to incur significant additional expense and effort to protect our intellectual property. Failure or inability to protect our proprietary information could result in a decrease in our sales or profitability.
We have obtained and applied for some U.S. and foreign trademark and patent registrations and will continue to evaluate the registration of additional trademarks and patents, as appropriate. We cannot guarantee that anyintegrity of our pending applications will be approved. Moreover, even if the applications are approved, third parties may seekdata. While we attempt to oppose or otherwise challenge them. A failure to obtain registrations in the United States or elsewhere could limit our ability to protect our trademarks and technologies and could impede our business. Further, the protection of our intellectual property may require expensive investment in protracted litigation and the investment of substantial management time and there is no assurance we ultimately would prevail or that a successful outcome would lead to an economic benefit that is greater than the investment in the litigation. The patents in our patent portfolio are scheduled to expire between 2013 and 2032.
In addition, we may be unable to prevent third parties from using our intellectual property rights and know-how without our authorization or from independently developing intellectual property that is the same as or similar to ours, particularly in those countries where the laws do not protect our intellectual property rights as fully as in the United States. We compete inmitigate these risks by employing a number of industries (for example, heat exchangersmeasures, including employee training, comprehensive monitoring of our networks and cryogenic storage) that are small or specialized, which makes it easier for a competitorsystems, and maintenance of backup and protective systems, our systems, networks, products, solutions and services remain potentially vulnerable to monitor our activitiesadvanced persistent threats. Depending on their nature and increasesscope, such threats could potentially lead to the risk that ideas will be stolen. The unauthorizedcompromising of confidential information, improper use of our know-how by third partiessystems and networks, manipulation and destruction of data, defective products, production downtimes and operational disruptions, which in turn could reduce or eliminate any competitive advantage we have developed, cause us to lose sales or otherwise harmadversely affect our business or increase our expenses as we attempt to enforce our rights.reputation, competitiveness and results of operations.
We may be subject to claims that our products or processes infringe the intellectual property rights of others, which may cause us to pay unexpected litigation costs or damages, modify our products or processes or prevent us from selling our products.
Although it is our intention to avoid infringing or otherwise violating the intellectual property rights of others, third parties may nevertheless claim (and in the past have claimed) that our processes and products infringe their intellectual property and other rights. For example, our BioMedical business manufactures products for relatively broad consumer use, is actively marketing these products in multiple jurisdictions internationally and risks infringing technologies that may be protected in one or more of these international jurisdictions as the scope of our international marketing efforts expands. Our strategies of capitalizing on growing international demand as well as developing new innovative products across multiple business lines present similar infringement claim risks both internationally and in the United States as we expand the scope of our product offerings and markets. We compete with other companies for contracts in some small or specialized industries, which increases the risk that the other companies will develop overlapping technologies leading to an increased possibility that infringement claims will arise. Whether or not these claims have merit, we may be subject to costly and time-consuming legal proceedings, and this could divert our management’s attention from operating our businesses. In order to resolve such
proceedings, we may need to obtain licenses from these third parties or substantially re-engineer or rename our products in order to avoid infringement. In addition, we might not be able to obtain the necessary licenses on acceptable terms, or at all, or be able to re-engineer or rename our products successfully.
Increased IT security threats and more sophisticated and targeted computer crime could pose a risk to our systems, networks, products, solutions and services.
Increased global IT security threats and more sophisticated and targeted computer crime pose a risk to the security of our systems and networks and the confidentiality, availability and integrity of our data. While we attempt to mitigate these risks by employing a number of measures, including employee training, comprehensive monitoring of our networks and systems, and
maintenance of backup and protective systems, our systems, networks, products, solutions and services remain potentially vulnerable to advanced persistent threats. Depending on their nature and scope, such threats could potentially lead to the compromising of confidential information, improper use of our systems and networks, manipulation and destruction of data, defective products, production downtimes and operational disruptions, which in turn could adversely affect our reputation, competitiveness and results of operations.
Increases in labor costs, potential labor disputes and work stoppage could materially decrease our sales and profitability.
Our financial performance is affected by the availability of qualified personnel and the cost of labor. As of January 31, 2013, we had 4,842 employees, including 2,139 salaried, 433 bargaining unit hourly and 2,270 non-bargaining unit hourly employees. Employees represented by a union are subject to one collective bargaining agreement in the United States that expires in February 2018. We have experienced one work stoppage in 2007. Although we entered into a new labor agreement with our unionized employees at this facility in February 2013, if we are unable to enter into new, satisfactory labor agreements with our unionized employees when necessary in the future or other labor controversies or union organizing efforts arise, we could experience a significant disruption to our operations, lose business or experience an increase in our operating expenses, which could reduce our profit margins. Furthermore, increased U.S. federal regulation or significant modifications to existing labor regulations, could potentially increase our labor costs.
Additional liabilities related to taxes could adversely impact our financial results, financial condition and cash flow.
We are subject to tax and related obligations in the jurisdictions in which we operate or do business, including state, local, federal and foreign taxes. The taxing rules of the various jurisdictions in which we operate or do business often are complex and subject to varying interpretations. Tax authorities may challenge tax positions that we take or historically have taken, and may assess taxes where we have not made tax filings or may audit the tax filings we have made and assess additional taxes, as they have done from time to time in the past. Some of these assessments may be substantial, and also may involve the imposition of substantial penalties and interest. In addition, governments could impose new taxes on us in the future. The U.S. Internal Revenue Service is currently auditing our 2011 federal tax return and has informed us of plans to audit our 2012 federal tax return. The payment of substantial additional taxes, penalties or interest resulting from tax assessments, or the imposition of any new taxes, could materially and adversely impact our results of operations, financial condition and cash flow.
If we are unable to continue our technological innovation and successful introduction of new commercial products, our profitability could be adversely affected.
The industries we serve, including the energy, industrial gas and biomedical industries, experience ongoing technological change and product improvement. Manufacturers periodically introduce new generations of products or require new technological capacity to develop customized products or respond to industry developments or needs. Our future growth will depend on our ability to gauge the direction of the commercial and technological progress in our markets, as well as our ability to acquire new product technologies or fund and successfully develop, manufacture and market products in this constantly changing environment. We must continue to identify, develop, manufacture and market innovative products on a timely basis to replace existing products in order to maintain our profit margins and competitive position. We may not be successful in acquiring and developing new products or technologies and any of our new products may not be accepted by our customers. If we fail to keep pace with evolving technological innovations in the markets we serve, our profitability may decrease.
Increases in labor costs, potential labor disputes and work stoppage could materially decrease our sales and profitability.
Our financial performance is affected by the availability of qualified personnel and the cost of labor. As of January 31, 2014, we had 5,086 employees, including 2,280 salaried, 473 bargaining unit hourly and 2,333 non-bargaining unit hourly employees. Employees represented by a union are subject to one collective bargaining agreement in the United States that expires in February 2018. We have experienced one work stoppage in 2007. Although we entered into a new labor agreement with our unionized employees at this facility effective February 3, 2013, if we are unable to enter into new, satisfactory labor agreements with our unionized employees when necessary in the future or other labor controversies or union organizing efforts arise, we could experience a significant disruption to our operations, lose business or experience an increase in our operating expenses, which could reduce our profit margins. Furthermore, increased U.S. federal regulation or significant modifications to existing labor regulations, could potentially increase our labor costs.
Increased government regulation could adversely affect our financial results, financial condition and cash flow.
The Dodd-Frank Wall Street Reform and Consumer Protection Act (the “Dodd-Frank Act”) institutes a wide range of reforms, some of which may impact us. Among other things, the Dodd-Frank Act contains significant corporate governance and executive compensation-related provisions that authorize or require the SEC to adopt additional rules and regulations in these areas. The impact of these provisions on our business is uncertain. The Dodd-Frank Act also provides for statutory and regulatory requirements for derivative transactions, including foreign exchange and interest rate hedging transactions. Certain transactions will be required to be cleared on exchanges, and cash collateral will be required for those transactions. While the Dodd-Frank Act provides for a potential exception from these clearing and cash collateral requirements for commercial end-users, the exception may be subject to additional rule making and interpretation by regulatory authorities. We enter into foreign exchange contracts, interest rate swaps and forward contracts from time to time to manage our foreign currency exchange risk, interest rate risk, and exposure to commodity price risk. If, in the future, we are required to provide cash collateral for our hedging transactions, it could reduce our ability to execute strategic hedges. In addition, the contractual counterparties in hedging arrangements will be required to comply with the Dodd-Frank Act’s new requirements, which could ultimately result in increased costs of these arrangements.
Our pension plan is currently underfunded and we contribute to a multi-employer plan for collective bargaining U.S. employees, which is also underfunded.
Certain U.S. hourly and salaried employees are covered by our defined benefit pension plan. The plan has been frozen since February 2006. As of December 31, 20122013, the projected benefit obligation under our pension plan was approximately $57.350.7 million and the value of the assets of the plan was approximately $37.943.0 million, resulting in our pension plan being underfunded by approximately $19.37.7 million. We are also a participant in a multiemployer plan which is underfunded. Among other risks associated with multi-employer plans, contributions and unfunded obligations of the multi-employer plan are shared by the plan participants and we may inherit unfunded obligations if other plan participants withdraw from the plan or cease to participate. Additionally, if we elect to stop participating in the multi-employer plan, we may be required to pay amounts related to withdrawal liabilities associated with the underfunded status of the plan. If the performance of the assets in our pension plan or the multiemployer plan does not meet expectations or if other actuarial assumptions are modified, our required pension contributions for future years could be higher than we expect, which may negatively impact our results of operations, cash flows and financial condition.
Increased government regulationWe operate in many different jurisdictions and we could be adversely affect our financial results, financial conditionaffected by violations of the U.S. Foreign Corrupt Practices Act and cash flow.similar worldwide anti-corruption laws.
The Dodd-Frank Wall Street ReformU.S. Foreign Corrupt Practices Act ("FCPA") and Consumer Protection Act (the “Dodd-Frank Act”) institutes a wide rangesimilar worldwide anti-corruption laws generally prohibit companies and their intermediaries from making improper payments to non-U.S. officials for the purpose of reforms,obtaining or retaining business. Our internal policies mandate compliance with these anti-corruption laws. We operate in many parts of the world that have experienced governmental corruption to some degree, and in certain circumstances, strict compliance with anti-corruption laws may conflict with local customs and practices. Despite our training and compliance programs, we cannot assure you that our internal control policies and procedures always will protect us from reckless or criminal acts committed by our employees or agents. Our continued expansion outside the U.S., including in developing countries, could increase the risk of which may impact us. Among other things,such violations in the Dodd-Frank Act contains significant corporate governance and
executive compensation-related provisions that authorize or require the SEC to adopt additional rules and regulations in these areas. The impactfuture. Violations of these provisionslaws, or allegations of such violations, could disrupt our business and result in a material adverse effect on our business is uncertain. The Dodd-Frank Act also provides for new statutory and regulatory requirements for derivative transactions, including foreign exchange and interest rate hedging transactions. Certain transactions will be required to be cleared on exchanges, and cash collateral will be required for those transactions. While the Dodd-Frank Act provides for a potential exception from these clearing and cash collateral requirements for commercial end-users, the exception is subject to future rule making and interpretation by regulatory authorities. We enter into foreign exchange contracts, interest rate swaps and forward contracts from time to time to manage our foreign currency exchange risk, interest rate risk, and exposure to commodity price risk. If, in the future, we are required to provide cash collateral for our hedging transactions, it could reduce our ability to execute strategic hedges. In addition, the contractual counterparties in hedging arrangements will be required to comply with the Dodd-Frank Act’s new requirements, which could ultimately result in increased costsresults of these arrangements.operations or financial condition.
Our operations could be impacted by the effects of severe weather, which could be more severe than the damage and impact that our Louisiana operations encountered from hurricanes in 2005 and 2008.prior years.
Some of our operations, including our operations in New Iberia, Louisiana and Houston, Texas, are located in geographic regions and physical locations that are susceptible to physical damage and longer-term economic disruption from hurricanes or other severe weather. We also could make significant future capital expenditures in hurricane-susceptible or other severe weather locations from time to time. These weather events can disrupt our operations, result in damage to our properties and negatively affect the local economy in which these facilities operate. In September 2008, for example, our New Iberia, Louisiana facility was forced to close as a result of heavy rainfall, evacuations, strong winds and power outages resulting from Hurricane Gustav. Two weeks after Hurricane Gustav, winds and flooding from Hurricane Ike damaged our New Iberia, Louisiana, Houston, Texas and The Woodlands, Texas operations and offices, and those facilities were also closed for a period of time. In 2005, our New Iberia operations encountered damage and were disrupted from the storm surge and flooding caused by Hurricane Rita. Future hurricanes or other severe weather may cause production or delivery delays as a result of the physical damage to the facilities, the unavailability of employees and temporary workers, the shortage of or delay in receiving certain raw materials or manufacturing supplies and the diminished availability or delay of transportation for customer shipments, any of which may have an adverse affecteffect on our sales and profitability. Additionally, the potential physical impact of theorized climate change could include more frequent and intense storms, which would heighten the risk to our operations in areas that are susceptible to hurricanes and other severe weather. Although we maintain insurance subject to certain deductibles, which may cover some of our losses, that insurance may become unavailable or prove to be inadequate.
We operate in many different jurisdictions and we could be adversely affected by violations of the U.S. Foreign Corrupt Practices Act and similar worldwide anti-corruption laws.
The U.S. Foreign Corrupt Practices Act (FCPA) and similar worldwide anti-corruption laws generally prohibit companies and their intermediaries from making improper payments to non-U.S. officials for the purpose of obtaining or retaining business. Our internal policies mandate compliance with these anti-corruption laws. We operate in many parts of the world that have experienced governmental corruption to some degree, and in certain circumstances, strict compliance with anti-corruption laws may conflict with local customs and practices. Despite our training and compliance programs, we cannot assure you that our internal control policies and procedures always will protect us from reckless or criminal acts committed by our employees or agents. Our continued expansion outside the U.S., including in developing countries, could increase the risk of such violations in the future. Violations of these laws, or allegations of such violations, could disrupt our business and result in a material adverse effect on our results of operations or financial condition.
We are subject to regulations governing the export of our products.
Due to our significant foreign sales, our export activities are subject to regulation, including the U.S. Treasury Department’s Office of Foreign Assets Control’s regulations. While we believe we are in compliance with these regulations and maintain programs intended to achieve compliance, we may currently or may in the future be in violation of these regulations. Any violations may subject us to government scrutiny, investigation and civil and criminal penalties and may limit our ability to export our products.
As a provider of products to the U.S. government, we are subject to federal rules, regulations, audits and investigations, the violation or failure of which could adversely affect our business.
We sell certain of our products to the U.S. government and, therefore, we must comply with and are affected by laws and regulations governing purchases by the U.S. government. Government contract laws and regulations affect how we do business with our government customers and, in some instances, impose added costs on our business. For example, a violation of
specific laws and regulations could result in the imposition of fines and penalties or the termination of our contracts or
debarment from bidding on contracts. In some instances, these laws and regulations impose terms or rights that are more favorable to the government than those typically available to commercial parties in negotiated transactions.
Risks Related to Our Leverage
Our leverage and future debt service obligations could adversely affect our financial condition, limit our ability to raise additional capital to fund our operations, limit our ability to react to changes in the economy or our industry, impact the way we operate our business, expose us to interest rate risk to the extent of our variable rate debt and prevent us from fulfilling our debt service obligations.
We are leveraged and have future debt service obligations. Our financial performance could be affected by our leverage. As of December 31, 20122013, our total indebtedness was $255.8 million.$321.7 million. In addition, at that date, under the revolving portion or our senior secured credit facility we had $28.224.8 million of letters of credit and bank guarantees outstanding and borrowing capacity of approximately $271.8275.2 million. Through separate facilities, our foreign subsidiaries had $4.7$6.1 million in bank guarantees outstanding at December 31, 20122013. While we had $141.5137.3 million in cash at December 31, 20122013, which we believe mitigates the risk related to our leverage, there is no assurance that we will continue to be profitable in the future or that we will not use our available cash in ways other than those that reduce our leverage or mitigate the risk related to our leverage. We may also incur additional indebtedness in the future. Our level of indebtedness could have important negative consequences, to us and you, including:
we may have difficulty generating sufficient cash flow to pay interest and satisfy our debt obligations;
we may have difficulty obtaining financing in the future for working capital, capital expenditures, acquisitions or other purposes;
we will need to use a substantial portion of our available cash flow to pay interest and principal on our debt, which will reduce the amount of money available to finance our operations and other business activities;
some of our debt, including our borrowings under our senior secured credit facility hashave variable rates of interest, which exposes us to the risk of increased interest rates;
our debt level increases our vulnerability to general economic downturns and adverse industry conditions;
our debt level could limit our flexibility in planning for, or reacting to, changes in our business and in our industry in general;
our debt and the amount we must pay to service our debt obligations could place us at a competitive disadvantage compared to our competitors that have less debt;
our customers may react adversely to our debt level and seek or develop alternative suppliers; and
our failure to comply with the financial and other restrictive covenants in our debt instruments which, among other things, require us to maintain specified financial ratios and limit our ability to incur debt and sell assets, could result in an event of default that, if not cured or waived, could have a material adverse effect on our business or prospects.
Our business may not generate sufficient cash flow from operations and future borrowings may not be available to us under our senior secured credit facility or otherwise in an amount sufficient to permit us to pay the principal and interest on our indebtedness or fund our other liquidity needs. In addition, a portion of our indebtedness bears interest at variable rates. If market interest rates increase, debt service on our variable-rate debt will rise, which would adversely affect our cash flow. We may be unable to refinance any of our debt, including our senior secured credit facility or our 2.00% Convertible Senior Subordinated Notes due 2018, on commercially reasonable terms. See Item 7. “Management’s Discussion and Analysis of Financial Condition and Results of Operations — Liquidity and Capital Resources.”
If our cash flows and capital resources are insufficient to fund our debt service obligations, we may be forced to sell assets, seek additional capital or seek to restructure or refinance our indebtedness. These alternative measures may not be successful and may not permit us to meet our scheduled debt service obligations. Our senior secured credit facility restricts our ability to use the proceeds from asset sales. We may be unable to consummate those asset sales to raise capital or sell assets at prices that we believe are fair and proceeds that we do receive may be inadequate to meet any debt service obligations then due.
We may still be able to incur substantially more debt. This could further exacerbate the risks that we face.
We may be able to incur substantial additional indebtedness in the future. The terms of our debt instruments do not fully prohibit us from doing so. The revolving credit portion of our senior secured credit facility provides commitments of up to $300.0 million, approximately $271.8275.2 million of which would have been available for future borrowings (after giving effect to letters of credit and bank guarantees outstanding) as of December 31, 20122013. See Item 7. “Management’s Discussion and Analysis of Financial Condition and Results of Operations — Liquidity and Capital Resources — Debt Instruments and
Related Covenants.” We may also further increase the size of our senior secured credit facility which includes an expansion
option permitting us to add up to an aggregate of $150.0 million in additional borrowings, subject to certain conditions, or we could refinance with higher borrowing limits. If new debt is added to our current debt levels, the related risks that we now face could intensify.
The senior secured credit facility contains a number of restrictive covenants which limit our ability to finance future operations or capital needs or engage in other business activities that may be in our interest.
The senior secured credit facility imposes, and the terms of any future indebtedness may impose, operating and other restrictions on us and our subsidiaries. Such restrictions affect or will affect, and in many respects limit or prohibit, among other things, our ability and the ability of our subsidiaries to:
incur additional indebtedness;
create liens;
pay dividends and make other distributions in respect of our capital stock;
redeem or buy back our capital stock;
make certain investments or certain other restricted payments;
sell or transfer certain kinds of assets;
enter into certain types of transactions with affiliates; and
effect mergers or consolidations.
The senior secured credit facility also requires us to achieve certain financial and operating results and maintain compliance with specified financial ratios. Our ability to comply with these ratios may be affected by events beyond our control.
The restrictions contained in the senior secured credit facility could:
limit our ability to plan for or react to market or economic conditions or meet capital needs or otherwise restrict our activities or business plans; and
adversely affect our ability to finance our operations, acquisitions, investments or strategic alliances or other capital needs or to engage in other business activities that would be in our interest.
A breach of any of these covenants or our inability to comply with the required financial ratios could result in a default under our senior secured credit facility. If an event of default occurs under our senior secured credit facility, which includes an event of default under the indenture governing our 2.00% Convertible Senior Subordinated Notes due 2018, the lenders could elect to:
declare all borrowings outstanding, together with accrued and unpaid interest, to be immediately due and payable;
require us to apply all of our available cash to repay the borrowings; or
prevent us from making debt service payments on the convertible notes;
any of which could result in an event of default under our convertible notes. The lenders will also have the right in these circumstances to terminate any commitments they have to provide further financing.
If we were unable to repay or otherwise refinance these borrowings when due, our lenders could sell the collateral securing the senior secured credit facility, which constitutes substantially all of our and our domestic wholly-owned subsidiaries’ assets.
Our 2.00% Convertible Senior Subordinated Notes due 2018 have certain fundamental change and conditional conversion features which, if triggered, may adversely affect our financial condition.
If a fundamental change occurs under our 2.00% Convertible Senior Subordinated Notes due 2018, the holders thereofof the convertible notes may require us to purchase for cash any or all of the convertible notes. However, there can be no assurance that we will have sufficient funds at the time of the fundamental change to purchase all of the convertible notes delivered for purchase, and we may not be able to arrange necessary financing on acceptable terms, if at all. Likewise, if one of the conversion contingencies of our convertible notes is triggered, holders of convertible notes will be entitled to convert the convertible notes at any time during specified periods. For example, as a result of attaining specified market price triggers, the notes were convertible in each of the last three quarters of 2013, although no notes have been converted to date. If one or more holders elect to convert their convertible notes, we would be required to settle any converted principal through the payment of cash, which could adversely affect our liquidity.
We are subject to counterparty risk with respect to the convertible note hedge and capped call transactions associated with our 2.00% Convertible Senior Subordinated Notes due 2018.
The option counterparties for our convertible note hedging arrangements are financial institutions, and we will be subject to the risk that any or all of them might default under the convertible note hedge and capped call transactions. Our exposure to the credit risk of the option counterparties is not secured by any collateral. Recent global economic conditions have resulted in the actual or perceived failure or financial difficulties of many financial institutions. If an option counterparty becomes subject to insolvency proceedings, we will become an unsecured creditor in those proceedings with a claim equal to our exposure at that time under the convertible note hedge and capped call transactions with that option counterparty. Our exposure will depend on many factors but, generally, the increase in our exposure will be correlated to the increase in the market price and in the volatility of our common stock. In addition, upon a default by an option counterparty, we may suffer adverse tax consequences and more dilution than we currently anticipate with respect to our common stock. We can provide no assurances as to the financial stability or viability of the option counterparties.
We are a holding company and we may depend upon cash from our subsidiaries to service our debt. If we do not receive cash from our subsidiaries, we may be unable to meet our obligations.
We are a holding company and all of our operations are conducted through our subsidiaries. Accordingly, we may be dependent upon the earnings and cash flows from our subsidiaries to provide the funds necessary to meet our debt service obligations. If we could not have access to the cash flows of our subsidiaries, we may be unable to pay the principal or interest on our debt. In addition, certain of our subsidiaries are holding companies that rely on subsidiaries of their own as a source of funds to meet any obligations that might arise.
Generally, the ability of a subsidiary to make cash available to its parent is affected by its own operating results and is subject to applicable laws and contractual restrictions contained in its debt instruments and other agreements. Moreover, there may be restrictions on payments by our subsidiaries to us under applicable laws, including laws that require companies to maintain minimum amounts of capital, to make payments to shareholders only from profits and restrictions on our ability to repatriate dividends from our foreign subsidiaries. As a result, although our subsidiaries may have cash, we may be unable to obtain that cash to satisfy our obligations and make payments to our stockholders, if any.
Risks Related to the Trading Market for Our Common Stock
Provisions in our amended and restated certificate of incorporation and amended and restated bylaws and other agreements and in Delaware law may discourage a takeover attempt.
Provisions contained in our amended and restated certificate of incorporation and amended and restated bylaws and Delaware law could make it more difficult for a third party to acquire us. Provisions of our amended and restated certificate of incorporation and amended and restated bylaws and Delaware law impose various procedural and other requirements, which could make it more difficult for stockholders to effect certain corporate actions. For example, our amended and restated certificate of incorporation authorizes our board of directors to determine the rights, preferences, privileges and restrictions of unissued series of preferred stock, without any vote or action by our stockholders. Therefore, our board of directors can authorize and issue shares of preferred stock with voting or conversion rights that could adversely affect the voting or other rights of holders of our common stock. These rights may have the effect of delaying or deterring a change of control of our company. These provisions could limit the price that certain investors might be willing to pay in the future for shares of our common stock.
In addition, the terms of our 2.00% Convertible Senior Subordinated Notes may require us to purchase these convertible notes for cash in the event of a takeover of our Company. The indenture governing the convertible senior notes also prohibits us from engaging in certain mergers or acquisition unless, among other things, the surviving entity assumes our obligations under the convertible notes. These and other provisions applicable to the convertible notes may have the effect of increasing the cost of acquiring us or otherwise discourage a third party from acquiring us.
The issuance of common stock upon conversion of our 2.00% Convertible Senior Subordinated Notes due 2018 could cause dilution to the interests of our existing stockholders.
As of December 31, 20122013, we had $250.0 million aggregate principal amount of convertible notes outstanding. Prior to the close of business on the business day immediately preceding May 1, 2018, the convertible notes will be convertible only upon satisfaction of certain conditions. As a result of attaining specified market price triggers, the notes were convertible in each of the last three quarters of 2013, although no notes have been converted to date. Holders may convert their convertible notes at their option at any time after May 1, 2018. We will settle conversions of convertible notes by paying cash up to the aggregate principal amount of the convertible notes to be converted and paying or delivering, as the case may be, cash, shares of our common stock, or a combination of cash and shares of our common stock, at our election, in respect of the remainder, if any, of our conversion obligation in excess of
any, of our conversion obligation in excess of the aggregate principal amount of the notes being converted. The number of shares issued could be significant and such an issuance could cause significant dilution to the interests of the existing stockholders.
Our common stock has experienced, and may continue to experience, price volatility.
Our common stock has at times experienced substantial price volatility as a result of many factors, including the general volatility of stock market prices and volumes, changes in securities analysts’ estimates of our financial performance, variations between our actual and anticipated financial results, fluctuations in order or backlog levels, changes in accounting policies or procedures as have been required by the Financial Accounting Standards Board or other regulatory agencies, or uncertainty about current global economic conditions. For these reasons, among others, the price of our stock may continue to fluctuate.
| |
| Item 1B. | Unresolved Staff Comments |
Not applicable.
We occupy 40 principal44 facilities totaling approximately 3.43.7 million square feet, with the majority devoted to manufacturing, assembly and storage. Of these manufacturing facilities, approximately 2.42.6 million square feet are owned and 1.01.1 million square feet are occupied under operating leases. We lease approximately 32,800 square feet for our corporate office in Garfield Heights, Ohio. Our major owned facilities in the United States are subject to mortgages securing our senior secured credit facility.
The following table sets forthsummarizes certain information about significant facilities occupied by us as of January 31, 20132014:
|
| | | | | | | | | |
| Location | | Segment | | Approximate Square Feet
Footage | | Ownership | | Use |
La Crosse, WisconsinGarfield Heights, Ohio | | Energy & ChemicalsCorporate | | 170,000 |
| | Owned | | Manufacturing/Office |
New Iberia, Louisiana | | Energy & Chemicals | | 108,700 |
| | Leased | | Manufacturing |
The Woodlands, Texas | | Energy & Chemicals | | 29,00032,800 |
| | Leased | | Office |
Tulsa, OklahomaLuxembourg, Luxembourg | | Energy & ChemicalsCorporate | | 58,500 |
| | Owned | | Manufacturing/Office |
Tulsa, Oklahoma | | Energy & Chemicals | | 140,0001,900 |
| | Leased | | Manufacturing/Office |
Tulsa, Oklahoma | | Energy & Chemicals | | 68,000 |
| | Leased | | Manufacturing/Office |
Wolverhampton, United Kingdom | | Energy & Chemicals | | 1,600 |
| | Leased | | Office |
Burnsville, Minnesota | | Distribution & Storage | | 5,600 |
| | Leased | | Service |
Changzhou, China | | Distribution & Storage | | 212,800 |
| | Leased | | Manufacturing/Office |
Decin, Czech Republic | | Distribution & Storage | | 638,000 |
| | Owned | | Manufacturing/Office |
Goch, Germany | | Distribution & Storage | | 258,000 |
| | Owned | | Manufacturing/Office |
Houston, Texas | | Distribution & Storage | | 26,500 |
| | Owned | | Service |
McCarran, Nevada | | Distribution & Storage | | 42,300 |
| | Owned | | Service |
New Prague, Minnesota | | Distribution & Storage | | 31,000 |
| | Leased | | Office |
Owatonna, Minnesota | | Distribution & Storage | | 141,000 |
| | Leased | | Manufacturing / Office |
Plaistow, New Hampshire | | Distribution & Storage | | 2,600 |
| | Leased | | Office |
San Jose, California | | Distribution & Storage | | 20,800 |
| | Leased | | Manufacturing/Office |
Solingen, Germany | | Distribution & Storage | | 13,400 |
| | Leased | | Manufacturing/Office/Service/Warehouse |
Canton, Georgia | | Distribution & Storage/BioMedical | | 154,000 |
| | Owned | | Manufacturing/Office |
Canton, Georgia | | Distribution & Storage/BioMedical | | 20,800 |
| | Leased | | Office |
New Prague, Minnesota | | Distribution & Storage/BioMedical | | 254,000 |
| | Owned | | Manufacturing/Service |
Changzhou, China | | Distribution & Storage/Energy & Chemicals | | 410,000 |
| | Owned | | Manufacturing/Office |
| Aichi, Japan | | BioMedical | | 8,900 |
| | Leased | | Service |
| Amherst, New York | | BioMedical | | 50,300148,400 |
| | Leased/Owned | | Manufacturing/Office |
Amherst, New York | | BioMedical | | 32,000 |
| | Leased | | Warehouse |
Amherst, New York | | BioMedical | | 56,100 |
| | Owned | | Manufacturing |
Canton, Georgia | | BioMedical | | 66,500 |
| | Owned | | Manufacturing/Warehouse/Office |
| Chengdu, China | | BioMedical | | 176,000 |
| | Owned | | Manufacturing/Office |
| Denver, Colorado | | BioMedical | | 23,800 |
| | Leased | | Office/Warehouse |
| Lidcombe, Australia | | BioMedical | | 2,400 |
| | Leased | | Office/Warehouse |
| Padova, Italy | | BioMedical | | 11,800 |
| | Leased | | Service |
| San Diego, California | | BioMedical | | 24,500 |
| | Leased | | Manufacturing/Office |
| Tokyo, Japan | | BioMedical | | 1,600 |
| | Leased | | Office |
Tokyo, Japan | | BioMedical | | 8,900 |
| | Leased | | Service |
| Toulouse, France (1) | | BioMedical | | 9,000 |
| | Leased | | Service |
| Troy, New York | | BioMedical | | 12,000 |
| | Leased | | Manufacturing/Office |
| Wokingham, United Kingdom | | BioMedical | | 7,200 |
| | Leased | | Office/Warehouse/Service |
| Wuppertal, Germany | | BioMedical | | 104,900 |
| | Leased | | Office/Warehouse/Service |
Garfield Heights, OhioBurnsville, Minnesota | | CorporateDistribution & Storage | | 32,8005,600 |
| | Leased | | Office |
Luxembourg, LuxembourgDecin, Czech Republic | | CorporateDistribution & Storage | | 1,900628,000 |
| | Owned | | Manufacturing/Office |
| Goch, Germany | | Distribution & Storage | | 258,000 |
| | Owned | | Manufacturing/Office |
| Houston, Texas | | Distribution & Storage | | 26,500 |
| | Owned | | Service |
| Kuala Lumpur, Malaysia | | Distribution & Storage | | 300 |
| | Leased | | Marketing & Sales/Office |
| McCarran, Nevada | | Distribution & Storage | | 42,300 |
| | Owned | | Service |
| Mumbai, India | | Distribution & Storage | | 100 |
| | Leased | | Office |
Clarksville, Arkansas (2)Nanjing, China | | Discontinued operationDistribution & Storage | | 110,00039,700 |
| | Leased/Owned | | Manufacturing/Office |
| Owatonna, Minnesota | | Distribution & Storage | | 141,000 |
| | Leased | | Manufacturing/Office |
| Plaistow, New Hampshire | | Distribution & Storage | | 2,600 |
| | Leased | | Office |
| San Jose, California | | Distribution & Storage | | 20,800 |
| | Leased | | Manufacturing/Office |
| Solingen, Germany | | Distribution & Storage | | 13,400 |
| | Leased | | Manufacturing/Office/Service/Warehouse |
| Canton, Georgia | | Distribution & Storage/BioMedical | | 241,300 |
| | Leased/Owned | | Manufacturing/Office/Service |
| New Prague, Minnesota | | Distribution & Storage/BioMedical | | 396,000 |
| | Leased/Owned | | Manufacturing/Office/Service |
| Changzhou, China | | Distribution & Storage/Energy & Chemicals | | 632,100 |
| | Leased/Owned | | Manufacturing/Office |
| La Crosse, Wisconsin | | Energy & Chemicals | | 296,000 |
| | Leased/Owned | | Manufacturing/Office |
| New Iberia, Louisiana | | Energy & Chemicals | | 108,700 |
| | Leased | | Manufacturing |
| The Woodlands, Texas | | Energy & Chemicals | | 33,400 |
| | Leased | | Office |
| Tulsa, Oklahoma | | Energy & Chemicals | | 266,500 |
| | Leased/Owned | | Manufacturing/Office |
| Wolverhampton, United Kingdom | | Energy & Chemicals | | 1,600 |
| | Leased | | Office |
_______________
| |
(1) | This facility is designated for closure as of January 31, 2013. |
| |
(2) | This facility is leased from the Company with a purchase option by the customer that owns certain assets of the former Greenville Tube LLC business.closure. |
In addition, we own a 110,000 square foot facility in Clarksville, Arkansas that is leased from the Company with a purchase option.
Regulatory Environment
We are subject to federal, state and local regulations relating to the discharge of materials into the environment, production and handling of hazardous and regulated materials and our products and the conduct and condition of our production facilities. We do not believe that these regulatory requirements have had a material effect upon our capital expenditures, earnings or competitive position. We are not anticipating any material capital expenditures in 20132014 that are directly related to regulatory compliance matters. We are also not aware of any pending or potential regulatory changes that would have a material adverse impact on our business.
In November 2012, Chart Energy & Chemicals, Inc. (“CEC”), a subsidiary of the Company, filed a declaratory judgment action in the United States District Court for the Western District of Oklahoma (the “Federal Court”) seeking a judgment that certain claims for damages alleged by Enogex Holdings LLC, Enogex Gathering & Processing, LLC and affiliated companies with respect to a December 2010 fire at the Enogex natural gas processing plant in Cox City, Oklahoma were barred based on multiple defenses, including Oklahoma's statute of repose. This action was precipitated by the receipt of a letter from Enogex alleging that CEC was responsible for damages in excess of $75 million with respect to the fire as a result of the alleged failure of CEC's equipment that was a component of the unit involved in the fire. Subsequent to the filing of CEC's declaratory judgment action, in December 2012, Enogex filed suit in the District Court of Tulsa County, State of Oklahoma (the “State Court”) against the Company, CEC and its predecessors, a former employee of a predecessor of CEC, as well as other entities and an individual not affiliated with the Company, formalizing the allegations and claims contained in the November demand letter. Each party has filed a motionone or more motions to dismiss the other's lawsuitlawsuit. Enogex's motion to dismiss initially was denied by the Federal Court in February 2013, but Enogex moved for rehearing on its motion to dismiss, which the Federal Court granted on May 17, 2013 based on a lack of jurisdictional diversity. The Company's and it is likely that oneCEC's motions to dismiss were denied by the State Court on April 10, 2013. Accordingly, litigation continues in the State Court, and Enogex has asserted damages of the existing actions will ultimatelyapproximately $105 million, including investigation and repair costs and business interruption losses, some of which may be dismissed or stayed given the commonality of facts underlying each lawsuit.offset by Enogex's saved costs and mitigation efforts. The Company does notcontinues to believe that the allegations against the Company, CEC orand their affiliates in Enogex's complaint havelack merit. The Company in any event believes that it, CEC and their affiliates have strong factual and legal defenses to Enogex's claims and intends to vigorously assert such defenses. Accordingly, anan accrual related to any damages that may result from the lawsuit has not been recorded because a potential loss is not currently probable. Furthermore, the Company believes that its existing product liability insurance is adequate for potential losses associated with these claims. While the Company cannot predict with certainty the ultimate result of these proceedings, the Company does not believe that the final outcome of these proceedings will have a material adverse affecteffect on the Company's financial position, results of operations, or cash flows.
We are occasionally subject to various legal actions related to performance under contracts, product liability, environmental liability, taxes, employment, intellectual property and other matters, several of which actions claim substantial damages, in the ordinary course of our business. Based on the Company’s historical experience in litigating these claims, as well as the Company’s current assessment of the underlying merits of the claims and applicable insurance, if any, we currently believe the resolution of these legal claims will not have a material adverse effect on our financial position, liquidity, cash flows or results of operations. Future developments may, however, result in resolution of these legal claims in a way that could have a material adverse effect. See Item 1A. “Risk Factors.”
Item 4. Mine Safety Disclosures
Not applicable.
| |
| Item 4A. | Executive Officers of the Registrant* |
The name, age and positions of each Executive Officer of the Company as of February 1, 20132014 are as follows:
|
| | | | |
| Name | | Age | | Position |
| Samuel F. Thomas | | 6162 | | Chairman, Chief Executive Officer and President |
| Michael F. Biehl | | 5758 | | Executive Vice President, Chief Financial Officer and Treasurer |
| Matthew J. Klaben | | 4344 | | Vice President, General Counsel and Secretary |
| Kenneth J. Webster | | 5051 | | Vice President, Chief Accounting Officer and Controller |
* Included pursuant to Instruction 3 to Item 401(b) of Regulation S-K.
Samuel F. Thomas has served as Chairman of our Board of Directors since March 2007 and has served as our Chief Executive Officer and President and as a member of our Board of Directors since October 2003. Prior to joining our company,Company, Mr. Thomas was Executive Vice President of Global Consumables at ESAB Holdings Ltd., a provider of welding consumables and equipment. In addition to his most recent position at ESAB, Mr. Thomas was responsible for ESAB North America during
his employment at ESAB Holdings Ltd. Prior to joining ESAB in February 1999, Mr. Thomas was Vice President of Friction Products for Federal Mogul, Inc. Prior to its acquisition by Federal Mogul in 1998, Mr. Thomas was employed by T&N plc from 1976 to 1998, where he served from 1991 as chief executive of several global operating divisions, including industrial sealing, camshafts and friction products.
Michael F. Biehl has been our Executive Vice President since April 2006, served as our Chief Accounting Officer from October 2002 until March 2006, and has been our Chief Financial Officer since July 2001. Until December 16, 2008, Mr. Biehl was also Chart’s Treasurer and assumed that role again effective August 23, 2010. Prior to joining us, Mr. Biehl served as Vice President, Finance and Treasurer at the former Oglebay Norton Company, an industrial minerals mining, processing and transportation company. Prior to joining Oglebay Norton in 1992, Mr. Biehl worked in the audit practice of Ernst & Young LLP in Cleveland, Ohio from 1978 to 1992.
Matthew J. Klaben is our Vice President, General Counsel and Secretary. Prior to joining us in March 2006, Mr. Klaben was a partner at the law firm of Calfee, Halter & Griswold LLP in Cleveland, Ohio from January 2005 until March 2006, and an associate from April 1998 until December 2004. Before that, Mr. Klaben was an associate at the law firm of Jones Day in Cleveland, Ohio from September 1995 until April 1998.
Kenneth J. Webster is our Vice President, Chief Accounting Officer and Controller and has served in that capacity since May 27, 2010. Prior to that, Mr. Webster was Chief Accounting Officer and Controller since March 1, 2008. Mr. Webster joined the Company in July 2006 as the Company’s Director of Internal Audit. Prior to joining Chart, Mr. Webster served as Assistant Corporate Controller for International Steel Group, an integrated steel manufacturer, from March 2004 to April 2005, at which time International Steel Group was acquired by Mittal Steel USA, Inc. Following the acquisition, Mr. Webster continued to serve in his capacity as Assistant Corporate Controller for Mittal Steel USA, Inc. until July 2006. Before that, Mr. Webster served in various accounting and finance positions with Bethlehem Steel.
PART II
| |
| Item 5. | Market for Registrant’s Common Equity, Related Stockholder Matters and Issuer Purchases of Equity Securities |
The Company’s common stock is traded on the NASDAQ Global Select Market under the symbol “GTLS.” Prior to 2008, the common stock traded on the NASDAQ Global Market. The high and low sales prices for the shares of common stock for the periods indicated are set forth in the table below:
| | | | High and Low Sales Price | High and Low Sales Price |
| | 2012 | | 2011 | 2013 | | 2012 |
| | High | | Low | | High | | Low | High | | Low | | High | | Low |
| First quarter | $ | 76.36 |
| | $ | 55.00 |
| | $ | 55.39 |
| | $ | 34.11 |
| $ | 83.69 |
| | $ | 61.87 |
| | $ | 76.36 |
| | $ | 55.00 |
|
| Second quarter | 79.29 |
| | 59.29 |
| | 55.76 |
| | 42.00 |
| 99.18 |
| | 73.20 |
| | 79.29 |
| | 59.29 |
|
| Third quarter | 76.85 |
| | 59.00 |
| | 62.15 |
| | 37.67 |
| 125.64 |
| | 93.97 |
| | 76.85 |
| | 59.00 |
|
| Fourth quarter | 75.37 |
| | 55.89 |
| | 63.74 |
| | 35.75 |
| 130.85 |
| | 85.07 |
| | 75.37 |
| | 55.89 |
|
| Year | 79.29 |
| | 55.00 |
| | 63.74 |
| | 34.11 |
| 130.85 |
| | 61.87 |
| | 79.29 |
| | 55.00 |
|
As of February 1, 20132014, there were 138167 holders of record of our common stock. Since many holders hold shares in “street name,” we believe that there are a significantly larger number of beneficial owners of our common stock than the number of record holders.
We do not currently intend to pay any cash dividends on our common stock, and instead intend to retain earnings, if any, for future operations, potential acquisitions and debt reduction. The amounts available to us to pay cash dividends are restricted by our senior secured credit facility. Any decision to declare and pay dividends in the future will be made at the discretion of our board of directors and will depend on, among other things, our results of operations, financial condition, cash requirements, contractual restrictions and other factors that our board of directors may deem relevant.
Cumulative Total Return Comparison
Set forth below is a line graph comparing the cumulative total return of a hypothetical investment in the shares of common stock of Chart Industries, Inc. with the cumulative return of a hypothetical investment in each of the S&P SmallCap 600 Index, the 2012 Peer Group Index, and our new Peer Group Index based on the respective market prices of each such investment on the dates shown below, assuming an initial investment of $100 on December 31, 20072008, including reinvestment of dividends, if any.

| | | | | | | | | | | | | | | December 31, |
| | 12/31/2007 | | 12/31/2008 | | 12/31/2009 | | 12/31/2010 | | 12/31/2011 | | 12/31/2012 | 2008 | | 2009 | | 2010 | | 2011 | | 2012 | | 2013 |
| Chart Industries, Inc. | $ | 100.00 |
| | $ | 34.40 |
| | $ | 53.46 |
| | $ | 109.32 |
| | $ | 174.98 |
| | $ | 215.83 |
| $ | 100.00 |
| | $ | 155.41 |
| | $ | 317.78 |
| | $ | 508.65 |
| | $ | 627.38 |
| | $ | 899.69 |
|
| S&P SmallCap 600 Index | 100.00 |
| | 68.93 |
| | 86.55 |
| | 109.32 |
| | 110.43 |
| | 128.46 |
| 100.00 |
| | 125.57 |
| | 158.60 |
| | 160.22 |
| | 186.37 |
| | 263.37 |
|
| Peer Group Index | 100.00 |
| | 60.92 |
| | 83.85 |
| | 116.16 |
| | 124.58 |
| | 140.71 |
| |
| 2012 Peer Group Index | | 100.00 |
| | 130.13 |
| | 171.24 |
| | 181.94 |
| | 221.74 |
| | 314.84 |
|
| 2013 Peer Group Index | | 100.00 |
| | 134.04 |
| | 185.66 |
| | 182.28 |
| | 233.60 |
| | 298.65 |
|
The Company selects the peer companies that comprise the Peer Group Index solely on the basis of objective criteria. These criteria result in an index composed of oil field equipment/service and other comparable industrial companies. TheWe modified our Peer Group Index members arethis year since the prior Peer Group Index (“2012 Peer Group”) included four companies that were acquired during 2013. The updated Peer Group Index (“2013 Peer Group”) includes the following companies from the 2012 Peer Group: Dresser-Rand Group Inc., Idex Corp., Graco Inc., Powell Industries Inc., Colfax Corp., Barnes Group Inc., Enpro Industries Inc., and Esco Technologies Inc., as well as the following additional companies which have similar industrial manufacturing profiles or serve similar industries as the Company: Acuity Brands, Inc., Circor International, Inc., Ensco plc, and Nordson Corporation.
The 2012 Peer Group was comprised of Dresser-Rand Group Inc., Gardner Denver Inc., Idex Corp., Graco Inc., Lufkin Industries Inc., Powell Industries Inc., Robbins & Meyers Inc., Colfax Corp., Barnes Group Inc., Enpro Industries Inc., Esco Technologies Inc., and Kaydon Corp. In accordance with SEC rules, both the 2012 Peer Group isand the 2013 Peer Group are represented in the above graph.
Purchases of Equity Securities by the Issuer and Affiliated Purchasers
During the fourth quarter of 20122013, 113176 shares of common stock were surrendered to us by participants under our share-based compensation plans to satisfy tax withholding obligations relating to the vesting or payment of equity awards for an aggregate purchase price of approximately $8,326.$22,000. The total number of shares repurchased represents the net shares issued to satisfy tax withholding. All such repurchased shares were subsequently retired during the three months ended December 31, 20122013.
|
| | | | | | | | | | | | | | |
| | | Issuer Purchases of Equity Securities |
| Period | | Total Number of Shares Purchased | | Average Price Paid Per Share | | Total Number of Shares Purchased As Part of Publicly Announced Plans or Programs | | Approximate Dollar Value of Shares that May Yet Be Purchased Under the Plans or Programs |
| October 1 — 31, 2012 | | 113 |
| | $ | 73.68 |
| | — |
| | $ | — |
|
| November 1 — 30, 2012 | | — |
| | — |
| | — |
| | — |
|
| December 1 — 31, 2012 | | — |
| | — |
| | — |
| | — |
|
| Total | | 113 |
| | $ | 73.68 |
| | — |
| | $ | — |
|
|
| | | | | | | | | | | | | | |
| | | Issuer Purchases of Equity Securities |
| Period | | Total Number of Shares Purchased | | Average Price Paid Per Share | | Total Number of Shares Purchased As Part of Publicly Announced Plans or Programs | | Approximate Dollar Value of Shares that May Yet Be Purchased Under the Plans or Programs |
| October 1 — 31, 2013 | | 176 |
| | $ | 125.07 |
| | — |
| | $ | — |
|
| November 1 — 30, 2013 | | — |
| | — |
| | — |
| | — |
|
| December 1 — 31, 2013 | | — |
| | — |
| | — |
| | — |
|
| Total | | 176 |
| | $ | 125.07 |
| | — |
| | $ | — |
|
| |
| Item 6. | Selected Financial Data |
The following table sets forth selected historical consolidated financial information as of the dates and for each of the periods indicated. The Company selected historical financial consolidated data as of and for the years ended December 31, 2013, 2012 2011 and 20102011 are derived from our audited financial statements for such periods incorporated by reference into Item 8 of this Annual Report on Form 10-K, which have been audited by Ernst & Young LLP. The Company selected historical financial consolidated data as of and for the years ended December 31, 20092010 and 20082009 are derived from our audited financial statements for such periods, which have been audited by Ernst & Young LLP, and which are not included in this Annual Report on Form 10-K.
You should read the following table together with Item 7. “Management’s Discussion and Analysis of Financial Condition and Results of Operations” and our consolidated financial statements and related notes, included elsewhere in this Annual Report on Form 10-K (all dollar amounts, except per share data, in thousands):
| | | | Year Ended December 31, | Year Ended December 31, |
| | 2012 | | 2011 | | 2010 | | 2009 | | 2008 | 2013 | | 2012 | | 2011 | | 2010 | | 2009 |
| Statement of Income Data: | | | | | | | | | | | | | | | | | | |
| Sales | $ | 1,014,152 |
| | $ | 794,585 |
| | $ | 555,455 |
| | $ | 597,458 |
| | $ | 753,086 |
| $ | 1,177,438 |
| | $ | 1,014,152 |
| | $ | 794,585 |
| | $ | 555,455 |
| | $ | 597,458 |
|
| Cost of sales | 708,989 |
| | 549,139 |
| | 390,156 |
| | 395,577 |
| | 513,698 |
| 825,715 |
| | 708,989 |
| | 549,139 |
| | 390,156 |
| | 395,577 |
|
| Gross profit | 305,163 |
| | 245,446 |
| | 165,299 |
| | 201,881 |
| | 239,388 |
| 351,723 |
| | 305,163 |
| | 245,446 |
| | 165,299 |
| | 201,881 |
|
| Operating expenses (1) (2) (3) | 183,350 |
| | 155,452 |
| | 117,795 |
| | 107,547 |
| | 106,035 |
| |
Operating expenses (1) (2) | | 215,726 |
| | 183,350 |
| | 155,452 |
| | 117,795 |
| | 107,547 |
|
Operating income (4) | 121,813 |
| | 89,994 |
| | 47,504 |
| | 94,334 |
| | 133,353 |
| 135,997 |
| | 121,813 |
| | 89,994 |
| | 47,504 |
| | 94,334 |
|
Interest expense, net (including deferred financing costs amortization) (5)(3) | 17,209 |
| | 27,754 |
| | 19,259 |
| | 17,433 |
| | 19,810 |
| 17,581 |
| | 17,209 |
| | 27,754 |
| | 19,259 |
| | 17,433 |
|
| Other expense (income) (6) | 1,498 |
| | (734 | ) | | (253 | ) | | (7,641 | ) | | 3,948 |
| |
Other (income) expense (4) | | (242 | ) | | 1,498 |
| | (734 | ) | | (253 | ) | | (7,641 | ) |
| Other expense, net | 18,707 |
| | 27,020 |
| | 19,006 |
| | 9,792 |
| | 23,758 |
| 17,339 |
| | 18,707 |
| | 27,020 |
| | 19,006 |
| | 9,792 |
|
| Income before income taxes | 103,106 |
| | 62,974 |
| | 28,498 |
| | 84,542 |
| | 109,595 |
| 118,658 |
| | 103,106 |
| | 62,974 |
| | 28,498 |
| | 84,542 |
|
| Income tax expense, net | 30,782 |
| | 18,730 |
| | 7,993 |
| | 23,386 |
| | 30,489 |
| 31,296 |
| | 30,782 |
| | 18,730 |
| | 7,993 |
| | 23,386 |
|
| Net income | 72,324 |
| | 44,244 |
| | 20,505 |
| | 61,156 |
| | 79,106 |
| 87,362 |
| | 72,324 |
| | 44,244 |
| | 20,505 |
| | 61,156 |
|
| Noncontrolling interest, net of taxes | 1,029 |
| | 168 |
| | 345 |
| | 145 |
| | 182 |
| |
| Noncontrolling interests, net of taxes | | 4,186 |
| | 1,029 |
| | 168 |
| | 345 |
| | 145 |
|
| Net income attributable to Chart Industries, Inc. | $ | 71,295 |
| | $ | 44,076 |
| | $ | 20,160 |
| | $ | 61,011 |
| | $ | 78,924 |
| $ | 83,176 |
| | $ | 71,295 |
| | $ | 44,076 |
| | $ | 20,160 |
| | $ | 61,011 |
|
| Earnings Per Share Data: | | | | | | | | | | | | | | | | | | |
| Basic earnings per share | $ | 2.39 |
| | $ | 1.51 |
| | $ | 0.71 |
| | $ | 2.14 |
| | $ | 2.78 |
| $ | 2.75 |
| | $ | 2.39 |
| | $ | 1.51 |
| | $ | 0.71 |
| | $ | 2.14 |
|
| Diluted earnings per share | $ | 2.36 |
| | $ | 1.47 |
| | $ | 0.69 |
| | $ | 2.11 |
| | $ | 2.72 |
| $ | 2.60 |
| | $ | 2.36 |
| | $ | 1.47 |
| | $ | 0.69 |
| | $ | 2.11 |
|
| Weighted-average shares — basic | 29,786 |
| | 29,165 |
| | 28,534 |
| | 28,457 |
| | 28,354 |
| 30,209 |
| | 29,786 |
| | 29,165 |
| | 28,534 |
| | 28,457 |
|
| Weighted-average shares — diluted | 30,194 |
| | 29,913 |
| | 29,255 |
| | 28,981 |
| | 29,008 |
| 31,931 |
| | 30,194 |
| | 29,913 |
| | 29,255 |
| | 28,981 |
|
| Cash Flow Data: | | | | | | | | | | | | | | | | | | |
| Cash provided by operating activities | $ | 87,641 |
| | $ | 81,658 |
| | $ | 38,574 |
| | $ | 86,926 |
| | $ | 97,812 |
| $ | 59,663 |
| | $ | 87,641 |
| | $ | 81,658 |
| | $ | 38,574 |
| | $ | 86,926 |
|
| Cash used in investing activities | (224,347 | ) | | (59,672 | ) | | (64,215 | ) | | (802 | ) | | (65,676 | ) | (74,981 | ) | | (224,347 | ) | | (59,672 | ) | | (64,215 | ) | | (802 | ) |
| Cash provided by (used in) financing activities | 17,441 |
| | 67,711 |
| | (19,302 | ) | | 776 |
| | (4,061 | ) | 8,107 |
| | 17,441 |
| | 67,711 |
| | (19,302 | ) | | 776 |
|
| Other Financial Data: | | | | | | | | | | | | | | | | | | |
Depreciation and amortization (7)(5) | $ | 33,726 |
| | $ | 32,298 |
| | $ | 26,640 |
| | $ | 23,028 |
| | $ | 23,170 |
| $ | 41,695 |
| | $ | 33,726 |
| | $ | 32,298 |
| | $ | 26,640 |
| | $ | 23,028 |
|
| | | | As of December 31, | As of December 31, |
| | 2012 | | 2011 | | 2010 | | 2009 | | 2008 | 2013 | | 2012 | | 2011 | | 2010 | | 2009 |
| Balance Sheet Data: | | | | | | | | | | | | | | | | | | |
| Cash and cash equivalents | $ | 141,498 |
| | $ | 256,861 |
| | $ | 165,112 |
| | $ | 211,168 |
| | $ | 154,429 |
| $ | 137,345 |
| | $ | 141,498 |
| | $ | 256,861 |
| | $ | 165,112 |
| | $ | 211,168 |
|
Working capital (8)(6) | 144,901 |
| | 86,533 |
| | 76,301 |
| | 59,299 |
| | 60,360 |
| 213,261 |
| | 144,901 |
| | 86,533 |
| | 76,301 |
| | 59,299 |
|
| Goodwill | 398,941 |
| | 288,770 |
| | 275,252 |
| | 264,532 |
| | 261,509 |
| 398,905 |
| | 398,941 |
| | 288,770 |
| | 275,252 |
| | 264,532 |
|
| Identifiable intangible assets, net | 189,463 |
| | 140,553 |
| | 145,500 |
| | 123,773 |
| | 129,542 |
| 172,142 |
| | 189,463 |
| | 140,553 |
| | 145,500 |
| | 123,773 |
|
| Total assets | 1,327,841 |
| | 1,174,475 |
| | 954,839 |
| | 926,503 |
| | 909,427 |
| 1,461,630 |
| | 1,327,841 |
| | 1,174,475 |
| | 954,839 |
| | 926,503 |
|
| Long-term debt | 252,021 |
| | 223,224 |
| | 218,425 |
| | 243,175 |
| | 243,175 |
| 64,688 |
| | 252,021 |
| | 223,224 |
| | 218,425 |
| | 243,175 |
|
| Total debt | 255,771 |
| | 234,482 |
| | 224,925 |
| | 243,175 |
| | 243,175 |
| 265,155 |
| | 255,771 |
| | 234,482 |
| | 224,925 |
| | 243,175 |
|
| Chart Industries, Inc. shareholders’ equity | 696,478 |
| | 611,039 |
| | 499,164 |
| | 475,561 |
| | 403,960 |
| 754,785 |
| | 696,478 |
| | 611,039 |
| | 499,164 |
| | 475,561 |
|
_______________
| |
(1) | Operating expenses include selling, general and administrative expenses, amortization expense, impairment of intangibles and loss on disposal of assets. Amortization expense related to intangible assets for the years ended December 31, 2013, 2012, 2011, 2010, and 2009 andwas 2008$19.2 million was, $14.8 million, $13.4 million, $11.0$11.0 million, and $10.7 million and $11.0 million, respectively. |
| |
(2) | Includes reversal of contingent liabilities on insolvent former subsidiary of $6.5 million for the year ended December 31, 2008. |
| |
(3) | Includes $3.1 million impairment of in-process research and development intangibles for the year ended December 31, 2012. Also includes a $4.6 million reduction of expense associated with writing down acquisition related contingent consideration to fair value for the year ended December 31, 2012. |
| |
(4) | Includes $4.9 million of unusual costs for customer settlements and facility shutdown costs for the year ended December 31, 2008. |
| |
(5)(3) | Includes $3.0 million for the write-off of the remaining deferred financing fees and $5.0 million for the early redemption premium related to the 9-1/8% Senior Subordinated Notes that were redeemed in October 2011 for the year ended December 31, 2011. |
| |
(6)(4) | Includes gains on acquisition of business of $1.1 million associated with the acquisition of Covidien Japan Inc.’s liquid oxygen therapy business in April 2010 (Covidien Japan Acquisition) for year ended December 31, 2010 and $7.0 million associated with the Covidien Acquisition for the year ended December 31, 2009. |
| |
(7)(5) | Includes financing costs amortization for the years ended December 31, 2013, 2012, 2011, 2010, and 2009 andof 2008$1.3 million of, $1.5 million, $4.4 million, $3.1$3.1 million,, and $1.6 million, and $1.9 million, respectively. For the year ended December 31, 2011, financing costs amortization includes $3.0 million to write-off remaining deferred financing fees related to the redemption of the 9-1/8% Senior Subordinated Notes. |
| |
(8)(6) | Working capital is defined as current assets excluding cash and cash equivalents minus current liabilities excluding short-term debt and current portion of long-term debt. |
| |
| Item 7. | Management’s Discussion and Analysis of Financial Condition and Results of Operations |
You should read the following discussion of our results of operations and financial condition in conjunction with the “Selected Financial Data” section and our consolidated financial statements and related notes appearing elsewhere in this Annual Report on Form 10-K. This discussion contains forward-looking statements. Actual results may differ materially from those discussed below. See “Forward-Looking Statements” at the end of this discussion and Item 1A. “Risk Factors” for a discussion of the uncertainties, risks and assumptions associated with this discussion.
Overview
We are a leading independent global manufacturer of highly engineered equipment used in the production, storage and end-use of hydrocarbon and industrial gases. The largest portion of end-use applications for our products is energy-related. We are a leading manufacturer of standard and engineered equipment primarily used for low-temperature and cryogenic applications. We have developed an expertise in medical respiratory equipment and cryogenic systems equipment, which operate at low temperatures sometimes approaching absolute zero (0 kelvin; -273° Centigrade; -459° Fahrenheit). The majority of our products, including vacuum insulated containment vessels, heat exchangers, cold boxes, other cryogenic components, and respiratory and therapy products, are used throughout the liquid gas supply chain for the purification, liquefaction, distribution, storage and end-use of hydrocarbon and industrial gases.
StrongLNG and petrochemical opportunities as well as the acquisition of AirSep Corporation (“AirSep”) increased sales during the year ended December 31, 2013. Positive developments in LNG liquefaction capacity, the build-out of LNG fueling infrastructure, and demand for LNG equipment used in natural gas productionoilfield and LNGtransportation applications led to recordrobust orders and salesfor the year. Meanwhile, our BioMedical segment respiratory business has continued to experience weakness in 2012. Ordersthe European market in addition to the continued impact of Medicare competitive bidding in the United States. Total orders across all segments for the year ended December 31, 20122013 were $1,124.51,270.6 million compared to $1,031.71,124.5 million for the year ended December 31, 20112012, representing an increase of $92.8146.1 million, or 9.0%13.0%. Our D&S business saw strong LNG storage and transportation related orders, especially in China. Meanwhile, our BioMedical respiratory business has continued to experience weakness in Europe due to macroeconomic concerns and the impact of the phase-in of Medicare competitive bidding and Medicare audits in the United States. As a result of strong order levels, particularly in our D&S segment, backlog as of December 31, 20122013 was $617.4728.8 million as compared to $489.1617.4 million as of December 31, 20112012, representing an increase of $128.3111.4 million, or 26.2%18.0%.
Sales for 20122013 were $1,014.21,177.4 million compared to sales of $794.61,014.2 million for 20112012, reflecting an increase of $219.6163.2 million, or 27.6%16.1%. The sales increase reflected growingcontinued demand for energyLNG equipment, higher revenue recognized under percentage of completion due towhich drove improved volume in the production ramp up of several large LNG projects in our E&CD&S business segment, and the effect of the acquisitionsacquisition of AirSep Corporation (AirSep) in August 2012 which added sales of $40.3 million, and GOFA Gocher Fahrzeugbau GmbH (GOFA) in August 2011,our BioMedical segment, which incrementally added sales of $11.4$71.0 million. Gross profit for the year ended December 31, 20122013 was$351.7 million, or 29.9% of sales, as compared to $305.2 million, or 30.1% of sales, as compared to $245.4 million, or 30.9% of sales, for the year ended December 31, 20112012. Higher volume inacross our D&S segment and the E&C and D&S segmentseffect of the AirSep acquisition drove the gross profit increase. The decrease in the gross profit percentage was mainly the result of lower volume and unfavorable productproject mix in the BioMedical respiratory business with lower priced oxygen concentrators representing a much larger share of the mix due to the AirSep acquisition.E&C segment. Operating income for the year ended December 31, 20122013 was $121.8136.0 million compared to $90.0121.8 million for the year ended December 31, 20112012.
Operating Results
The following table sets forth the percentage relationship that each line item in our consolidated statements of income represents to sales for the years ended December 31, 2013, 2012 2011 and 20102011:
| | | | 2012 | | 2011 | | 2010 | 2013 | | 2012 | | 2011 |
| Sales | 100.0 | % | | 100.0 | % | | 100.0 | % | 100.0 | % | | 100.0 | % | | 100.0 | % |
| Cost of sales | 69.9 |
| | 69.1 |
| | 70.2 |
| 70.1 |
| | 69.9 |
| | 69.1 |
|
| Gross profit | 30.1 |
| | 30.9 |
| | 29.8 |
| 29.9 |
| | 30.1 |
| | 30.9 |
|
| Selling, general and administrative expense (1) | 16.3 |
| | 17.7 |
| | 18.9 |
| 16.7 |
| | 16.3 |
| | 17.7 |
|
| Amortization expense | 1.5 |
| | 1.7 |
| | 2.0 |
| 1.6 |
| | 1.5 |
| | 1.7 |
|
| Impairment of intangible assets | 0.3 |
| | — |
| | — |
| — |
| | 0.3 |
| | — |
|
| Loss on disposal of assets | — |
| | 0.2 |
| | 0.3 |
| — |
| | — |
| | 0.2 |
|
| Operating income | 12.0 |
| | 11.3 |
| | 8.6 |
| 11.6 |
| | 12.0 |
| | 11.3 |
|
Interest expense, net | 1.5 |
| | 2.9 |
| | 2.9 |
| 1.4 |
| | 1.5 |
| | 2.9 |
|
| Amortization of deferred financing costs | 0.2 |
| | 0.6 |
| | 0.6 |
| 0.1 |
| | 0.2 |
| | 0.6 |
|
| Foreign currency loss (gain) | 0.1 |
| | (0.1 | ) | | 0.2 |
| — |
| | 0.1 |
| | (0.1 | ) |
| Gain on acquisition of business (2) | — |
| | — |
| | 0.2 |
| |
| Income tax expense, net | 3.0 |
| | 2.4 |
| | 1.4 |
| 2.7 |
| | 3.0 |
| | 2.4 |
|
| Net income | 7.1 |
| | 5.6 |
| | 3.7 |
| 7.4 |
| | 7.1 |
| | 5.6 |
|
| Noncontrolling interest, net of taxes | 0.1 |
| | — |
| | 0.1 |
| |
| Noncontrolling interests, net of taxes | | 0.4 |
| | 0.1 |
| | — |
|
| Net income attributable to Chart Industries, Inc. | 7.0 |
| | 5.5 |
| | 3.6 |
| 7.1 |
| | 7.0 |
| | 5.5 |
|
_______________
| |
(1) | Includes share-based compensation expense of $7.510.0 million, $5.47.5 million and $4.95.4 million, representing 0.7%0.8%, 0.7% and 0.9%0.7% of sales, for the years ended December 31, 2013, 2012 2011 and 20102011, respectively. |
| |
(2) | Represents gain on acquisitionIncludes $9.9 million, $9.1 million and $3.6 million of businessnon-cash interest accretion expense related to the carrying amount of $1.1 million associated with the Covidien Japan Acquisition duringConvertible Notes, representing 0.8%, 0.9% and 0.5% of sales, for the yearyears ended December 31, 2010.2013, 2012 and 2011, respectively. |
Segment Information
Certain consolidated results for our operating segments are presented below (all dollar amounts in thousands). Further detailed information regarding our operating segments is presented in Note K19 of the consolidated financial statements included elsewhere in this report. | | | | Year Ended December 31, | Year Ended December 31, |
| | 2012 | | 2011 | | 2010 | 2013 | | 2012 | | 2011 |
| Sales | | | | | | | | | | |
| Energy & Chemicals | $ | 323,676 |
| | $ | 205,033 |
| | $ | 137,801 |
| $ | 318,510 |
| | $ | 323,676 |
| | $ | 205,033 |
|
| Distribution and Storage | 475,576 |
| | 390,332 |
| | 269,293 |
| |
| Distribution & Storage | | 592,616 |
| | 475,576 |
| | 390,332 |
|
| BioMedical | 214,900 |
| | 199,220 |
| | 148,361 |
| 266,312 |
| | 214,900 |
| | 199,220 |
|
| Consolidated | $ | 1,014,152 |
| | $ | 794,585 |
| | $ | 555,455 |
| $ | 1,177,438 |
| | $ | 1,014,152 |
| | $ | 794,585 |
|
| Gross Profit | | | | | | | | | | |
| Energy & Chemicals | $ | 98,679 |
| | $ | 58,977 |
| | $ | 31,005 |
| $ | 89,125 |
| | $ | 98,679 |
| | $ | 58,977 |
|
| Distribution and Storage | 137,044 |
| | 109,306 |
| | 77,194 |
| |
| Distribution & Storage | | 168,505 |
| | 137,044 |
| | 109,306 |
|
| BioMedical | 69,440 |
| | 77,163 |
| | 57,100 |
| 94,093 |
| | 69,440 |
| | 77,163 |
|
| Consolidated | $ | 305,163 |
| | $ | 245,446 |
| | $ | 165,299 |
| $ | 351,723 |
| | $ | 305,163 |
| | $ | 245,446 |
|
| Gross Profit Margin | | | | | | | | | | |
| Energy & Chemicals | 30.5 | % | | 28.8 | % | | 22.5 | % | 28.0 | % | | 30.5 | % | | 28.8 | % |
| Distribution and Storage | 28.8 | % | | 28.0 | % | | 28.7 | % | |
| Distribution & Storage | | 28.4 | % | | 28.8 | % | | 28.0 | % |
| BioMedical | 32.3 | % | | 38.7 | % | | 38.5 | % | 35.3 | % | | 32.3 | % | | 38.7 | % |
| Consolidated | 30.1 | % | | 30.9 | % | | 29.8 | % | 29.9 | % | | 30.1 | % | | 30.9 | % |
| SG&A | | | | | | | | | | |
| Energy & Chemicals | $ | 30,434 |
| | $ | 27,915 |
| | $ | 21,184 |
| $ | 26,358 |
| | $ | 30,434 |
| | $ | 27,915 |
|
| Distribution & Storage | 53,111 |
| | 42,587 |
| | 30,303 |
| 69,807 |
| | 53,111 |
| | 42,587 |
|
| BioMedical | 35,571 |
| | 35,212 |
| | 22,781 |
| 50,058 |
| | 35,571 |
| | 35,212 |
|
| Corporate | 46,372 |
| | 34,821 |
| | 30,705 |
| 50,273 |
| | 46,372 |
| | 34,821 |
|
| Consolidated | $ | 165,488 |
| | $ | 140,535 |
| | $ | 104,973 |
| $ | 196,496 |
| | $ | 165,488 |
| | $ | 140,535 |
|
| SG&A % of Sales | | | | | | | | | | |
| Energy & Chemicals | 9.4 | % | | 13.6 | % | | 15.4 | % | 8.3 | % | | 9.4 | % | | 13.6 | % |
| Distribution and Storage | 11.2 | % | | 10.9 | % | | 11.3 | % | |
| Distribution & Storage | | 11.8 | % | | 11.2 | % | | 10.9 | % |
| BioMedical | 16.6 | % | | 17.7 | % | | 15.4 | % | 18.8 | % | | 16.6 | % | | 17.7 | % |
| Consolidated | 16.3 | % | | 17.7 | % | | 18.9 | % | 16.7 | % | | 16.3 | % | | 17.7 | % |
| Operating Income (Loss) | | | | | | | | | | |
| Energy & Chemicals | $ | 64,931 |
| | $ | 27,489 |
| | $ | 6,121 |
| $ | 59,671 |
| | $ | 64,931 |
| | $ | 27,489 |
|
| Distribution & Storage | 79,175 |
| | 61,415 |
| | 41,934 |
| 93,560 |
| | 79,175 |
| | 61,415 |
|
| BioMedical | 24,079 |
| | 35,911 |
| | 30,698 |
| 33,039 |
| | 24,079 |
| | 35,911 |
|
| Corporate | (46,372 | ) | | (34,821 | ) | | (31,249 | ) | (50,273 | ) | | (46,372 | ) | | (34,821 | ) |
| Consolidated | $ | 121,813 |
| | $ | 89,994 |
| | $ | 47,504 |
| $ | 135,997 |
| | $ | 121,813 |
| | $ | 89,994 |
|
| Operating Margin | | | | | | | | | | |
| Energy & Chemicals | 20.1 | % | | 13.4 | % | | 4.4 | % | 18.7 | % | | 20.1 | % | | 13.4 | % |
| Distribution & Storage | 16.6 | % | | 15.7 | % | | 15.6 | % | 15.8 | % | | 16.6 | % | | 15.7 | % |
| BioMedical | 11.2 | % | | 18.0 | % | | 20.7 | % | 12.4 | % | | 11.2 | % | | 18.0 | % |
| Consolidated | 12.0 | % | | 11.3 | % | | 8.6 | % | 11.6 | % | | 12.0 | % | | 11.3 | % |
Results of Operations for the Year Ended December 31, 2013 Compared to the Year Ended December 31, 2012
Sales
Sales for 2013 of $1,177.4 millionincreased by$163.2 million, or 16.1% over sales of $1,014.2 million in 2012. Improved volume in the D&S business segment as well as the impact from the AirSep acquisition in the BioMedical segment drove the overall sales increase. E&C segment sales for 2013 decreased by$5.2 million, or 1.6%. This decrease in E&C segment sales was primarily due to customer schedule changes that negatively impacted the timing of progress toward completion of large base-load LNG projects, as well as a decrease in air cooled heat exchanger sales due to continued weakness in the gas compression market partially offset by improved volume in our brazed aluminum heat exchanger product line. D&S segment sales for 2013 increased by$117.0 million, or 24.6%. The increase was mainly attributable to higher volume of sales related to LNG applications including fixed and mobile fuel stations and on-vehicle fuel tanks, especially in China. BioMedical segment sales for 2013 increased by$51.4 million, or 23.9%. Incremental sales related to the AirSep acquisition added $71.0 million to BioMedical segment sales during the period. Excluding incremental AirSep sales, BioMedical segment sales finished $19.6 million below the prior year sales mainly due to lower respiratory sales resulting from continued weakness in the European market, the impact of Medicare competitive bidding in the United States.
Gross Profit and Margin
Gross profit for 2013 was $351.7 million, or 29.9% of sales compared to $305.2 million, or 30.1% of sales for 2012, reflecting an increase of $46.5 million while the margin decreased slightly by 0.2 percentage points. In 2013, E&C segment gross profit decreased by $9.6 million, and the related margin decreased2.5 percentage points. The decrease in gross profit and the related margin percentage for the E&C segment was primarily in process systems due to large base-load LNG projects being completed at overall lower margins partially offset by improved gross profit and margin performance in our brazed aluminum heat exchanger product line. D&S segment gross profit increased by $31.5 million in 2013 and the related margin decreased slightly by 0.4 percentage points. The increase in gross profit was mainly due to higher volume in LNG applications from our China operations. BioMedical segment gross profit increased by$24.6 million and its related margin increased by3.0 percentage points in 2013. The increase in gross profit was primarily due to higher volume contributed by AirSep, partially offset by $2.6 million to amortize the remaining portion of the write-up of AirSep's inventory to fair value. The increase in the related margin percentage was mainly attributable to improved product mix and lower acquisition-related costs related to AirSep which impacted 2012 gross margin.
Selling, General and Administrative (“SG&A”) Expenses
SG&A expenses for 2013 of $196.5 million increased by $31.0 million to 16.7% of sales, compared to $165.5 million, or 16.3% of sales in 2012. In 2013, E&C segment SG&A expenses decreased by$4.1 million mainly due to lower employee-related costs and lower expenses related to marketing and professional services. D&S segment SG&A expenses increased by$16.7 million in 2013 mainly due to increases in employee-related costs and sales commissions to support the growing LNG business, especially in China. In 2013, SG&A expenses for the BioMedical segment increased by$14.5 million mainly due to the AirSep acquisition, which incrementally added $11.7 million in SG&A expenses during the period, including $2.7 million in management retention expenses and severance costs. Additionally, 2012 included a favorable acquisition-related contingent consideration fair value adjustment of $4.6 million that reduced SG&A expense. Corporate SG&A expenses for 2013increased by$3.9 million primarily due to higher share-based compensation expense.
Amortization Expense
Amortization expense for 2013 was $19.2 million, or 1.6% of sales, compared to $14.8 million, or 1.5% of sales, for 2012. The AirSep acquisition incrementally added $4.6 million of amortization expense related to intangible assets during the period.
Impairment of Intangible Assets
During the year ended December 31, 2012, the Company recorded an impairment charge of $3.1 million to reduce the carrying value of in-process research and development ("IPR&D") indefinite-lived intangible assets to fair value, which was zero. The write-off of the fair value of the IPR&D indefinite-lived intangible assets was primarily caused by higher forecasted costs and project delays.
Operating Income
As a result of the foregoing, operating income for 2013 increased by $14.2 million to $136.0 million from $121.8 million in 2012.
Interest Expense, Net and Financing Costs Amortization
For the year ended December 31, 2013, net interest expense was $16.3 million compared to $15.7 million for the year ended December 31, 2012. Interest expense for the year ended December 31, 2013 included $5.0 million of 2.0% cash interest and $9.9 million of non-cash interest accretion expense related to the carrying value of the Company's 2.0% Convertible Senior Subordinated Notes due 2018 (the “Convertible Notes”). Financing costs amortization was $1.3 million and $1.5 million for the years ended December 31, 2013 and 2012, respectively.
Foreign Currency (Gain) Loss
Foreign currency gains were $0.2 million for the year ended December 31, 2013 while foreign currency losses were $1.5 million for the year ended December 31, 2012. The $1.7 million change is primarily attributable to exchange rate volatility, especially with respect to the euro, and settlements and mark-to market adjustments related to foreign currency forward contracts.
Income Tax Expense
Income tax expense of $31.3 million and $30.8 million for the years ended December 31, 2013 and 2012, respectively, represents taxes on both U.S. and foreign earnings at a combined effective income tax rate of 26.4% and 29.9%, respectively. The decrease in the effective tax rate for the year ended December 31, 2013 compared to the prior year period is primarily due to an increase in the mix of income earned by certain of the Company's foreign entities which are taxed at lower rates than the U.S. federal statutory rate and the positive effect of the 2012 U.S. Research and Experimentation credits recognized in 2013.
Net Income
As a result of the foregoing, net income for 2013 increased by $11.9 million to $83.2 million from $71.3 million in 2012 representing an increase of 16.7%.
Results of Operations for the Year Ended December 31, 2012 Compared to the Year Ended December 31, 2011
Sales
Sales for 2012 of $1,014.2$1,014.2 millionincreased by$219.6 $219.6 million,, or 27.6% over sales of $794.6$794.6 million in 2011. The primary drivers of the increase in sales were improved volume in the E&C and D&S business segments as well as the impact from acquisitions. E&C segment sales for 2012 increased by$118.6 $118.6 million,, or 57.9%. The increase was primarily due to improved volume across brazed aluminum heat exchanger and process systems product lines which included revenue
recognized under percentage of completion for several large LNG projects which ramped up production during the year. D&S segment sales for 2012 increased by$85.2 $85.2 million,, or 21.8%. The increase in sales was largely due to improved volume, particularly in LNG applications including mobile equipment and bulk storage tanks, especially in China. Incremental sales related to D&S acquisitions added $11.4 million, which is included in the overall increase in D&S segment sales. BioMedical segment sales for 2012 increased by$15.7 $15.7 million,, or 7.9%. The AirSep acquisition contributed $40.3 million to sales, while the existing BioMedical business finished $24.6 million below 2011 performance with lower volume in respiratory sales dueattributed to continued macroeconomic concerns in Europe and the phase-in of Medicare competitive bidding in the U.S.
Gross Profit and Margin
Gross profit for 2012 was $305.2$305.2 million,, or 30.1% of sales compared to $245.4$245.4 million,, or 30.9% of sales for 2011, reflecting an increase of $59.8$59.8 million while the margin decreased by 0.8 percentage points. In 2012, E&C segment gross profit increased by $39.7$39.7 million,, and the related margin increased1.7 percentage points. The increase in gross profit was primarily due to higher production throughput and improved pricing. D&S segment gross profit increased by $27.7$27.7 million in 2012 and the related margin increased by 0.8 percentage points. The increase in gross profit and related margin was mainly due to higher volume, and improved capacity utilization and lower material costs, partially offset by product mix and shift in sales to more competitive regions, such as China. BioMedical segment gross profit decreased by$7.7 $7.7 million and its related margin decreased by6.4 percentage points in 2012.2012. The decrease in gross profit and margin percentage was primarily due to lower volume and unfavorable product mix due to increased stationary oxygen concentrator product sales.
Selling, General and Administrative (SG&A)SG&A Expenses
SG&A expenses for 2012 of $165.5$165.5 millionincreased by$25.0 $25.0 million,, or 16.3% of sales, compared to $140.5$140.5 million in 2011, yet improved as a percentage of sales by 1.4 percentage points from 17.7% in 2011. In 2012, E&C segment SG&A expenses increased by$2.5 $2.5 million which was primarily attributable to higher employee-related costs and fees for professional services to support growth, yet it was an improvement of 4.2 percentage points as a percentage of sales. D&S segment SG&A expenses increased by$10.5 $10.5 million in 2012. Increased employee-related costs due to LNG growth, higher marketing and sales commission expense, fees for professional services, and a full year from the acquisition of GOFA acquisitionGocher Fahrzeugbau GmbH contributed to the increase. In 2012, SG&A expenses for the BioMedical segment increased by$0.4 million. $0.4 million. AirSep, acquired in August 2012, contributed $6.3 million in SG&A expense during the period. This was offset by a $4.6 million acquisition-related contingent consideration fair value adjustment that reduced SG&A expenses during the second quarter ofin 2012 and lower employee-related costs and outside services as a result of scaling down operations due to macroeconomic concerns. Corporate SG&A expenses for 2012increased by$11.6 $11.6 million primarily due to higher employee-related costs, share-based compensation expense, expenditures for information systems, and fees for professional services to support organic and inorganic growth.
Amortization Expense
Amortization expense for 2012 was $14.8$14.8 million,, or 1.5% of sales, compared to $13.4$13.4 million,, or 1.7% of sales, for 2011.2011. The AirSep acquisition added $2.3 million of amortization expense during the period.2012.
Impairment of Intangible Assets/Losses on Disposal of Assets
During the year ended December 31, 2012,, the Company recorded an impairment charge of $3.1 million to reduce the carrying value of in-process research and development (IPR&D)IPR&D indefinite-lived intangible assets to fair value, which was zero as of the end of the second quarter 2012.zero. The write-off of the fair value of the IPR&D indefinite-lived intangible assets was primarily caused by higher forecasted costs and project delays.
A loss on disposal of assets of $1.5$1.5 million was recorded for the year ended December 31, 2011 mainly as a result of the disposal of the remaining assets at the BioMedical Plainfield, Indiana facility as part of the final closure of the facility in May 2011. Production was transferred to the new Canton, Georgia BioMedical facility during the year ended December 31, 2011.2011.
Operating Income
As a result of the foregoing, operating income for 2012 increased by $31.8$31.8 million to $121.8$121.8 million from $90.0$90.0 million in 2011 and improved as a percentage of sales by 0.7 percentage points to 12.0%.
Interest Expense, Net and Financing Costs Amortization
For the year ended December 31, 2012, net interest expense was $15.7 million compared to $23.4 million for the year ended December 31, 2011. Interest expense for the year ended December 31, 2012, net interest expense was $15.7 million compared to $23.4 million for the year ended December 31, 2011. Interest expense for the year ended December 31, 2012 included $5.0 million of contractual 2.00%2.0% coupon interest and $9.1$9.1 million of non-cash interest accretion expense related to the carrying value of the Company's 2.00% Convertible Senior Subordinated Notes due 2018 (Convertible Notes).Notes. The $7.7$7.7 million decrease in interest expense was primarily attributable to the $5.0 million call premium paid in conjunction with the early redemption of the Company's 9-1/8% Senior Subordinated Notes (Subordinated Notes)(“Subordinated Notes”) in October 2011 and additional interest expense as both the Convertible Notes
and Subordinated Notes were outstanding for approximately two months during 2011. Financing costs amortization was $1.5$1.5 million and $4.4$4.4 million for years ended December 31, 2012 and 2011,, respectively. The decrease of $2.9$2.9 million was primarily attributable to the $3.0$3.0 million write off of the remaining deferred financing fees related to the Subordinated Notes, which were redeemed in October 2011. Further information regarding the Company’s debt is disclosed in "Liquidity and Capital Resources" below and in Note C to the Company’s consolidated financial statements included in Item 8 of this Annual Report on Form 10-K.
Foreign Currency (Gain) Loss (Gain)
For the years ended December 31, 2012 and 2011,, foreign currency losses were $1.5$1.5 million and foreign currency gains were $0.7$0.7 million,, respectively. The $2.2$2.2 million change is primarily attributable to increased volatility in foreign exchange rates, particularly the euro, impacting transactions denominated in foreign currencies and mark to market adjustments on the Company's foreign currency forward contracts during the year ended December 31, 2012.2012.
Income Tax Expense
Income tax expense of $30.8$30.8 million and $18.7$18.7 million for the years ended December 31, 2012 and 2011,, respectively, represents taxes on both U.S. and foreign earnings at a combined effective income tax rate of 29.9% and 29.7%, respectively. The increase in the effective tax rate for the year ended December 31, 2012 compared to the prior year period iswas primarily due to a decrease in the mix of income earned by certain of the Company's foreign entities which are taxed at lower rates than the U.S. federal statutory rate.
Net Income
As a result of the foregoing, net income for 2012 increased by $27.2 million to $71.3 million from $44.1 million in 2011 representing an increase of 61.8%.
Results of Operations for the Year Ended December 31, 2011 Compared to the Year Ended December 31, 2010
Sales
Sales for 2011 were $794.6 million compared to $555.5 million for 2010, reflecting an increase of $239.1 million, or 43.1%. E&C segment sales for 2011 increased by $67.2 million, or 48.8%. The primary driver of the increase in sales was improved volume across all product lines, particularly in process systems. Pricing also improved in brazed aluminum heat exchangers and process systems as large NGL and LNG projects returned. D&S segment sales for 2011 increased by $121.0 million, or 44.9%. During 2011, bulk storage system sales and packaged gas and beverage liquid CO2 system sales increased $50.6 million and $44.3 million, respectively. LNG related opportunities continued to accelerate as LNG infrastructure investments were made. The acquisitions of GOFA in August 2011 and Cryotech in August 2010 also contributed $18.6 million to the increase in D&S segment sales. Sales were also positively impacted by favorable currency translation as a result of the strengthening of the euro during 2011. BioMedical segment sales for 2011 increased by $50.8 million, or 34.3%. Medical respiratory product sales increased $42.4 million largely due to our acquisition of SeQual in December 2010, which added $35.1 million in sales during 2011. Biological storage systems sales increased $8.4 million primarily as a result of increased global demand from the breeder market and increased spending on research.
Gross Profit and Margin
Gross profit for 2011 was $245.4 million, or 30.9% of sales compared to $165.3 million, or 29.8% of sales for 2010 reflecting an increase of $80.1 million. E&C segment gross profit for 2011 increased $28.0 million, and the related margin increased 6.3 percentage points. The increase in gross profit was primarily due to increased volume and improved utilization as a result of higher order levels particularly in brazed aluminum heat exchangers and process systems. D&S segment gross profit increased $32.1 million in 2011 while the related margin decreased slightly. The D&S segment gross profit increase was largely attributable to increased sales volume which was partially offset by a shift in sales to more competitive regions and product segments as well as higher costs associated with facility expansions. BioMedical segment gross profit for 2011 increased $20.1 million and its related margin increased 0.2 percentage points in 2011 primarily due to higher sales volume in both medical respiratory and biological storage systems sales driven by the SeQual acquisition and improved demand.
Selling, General and Administrative Expenses
SG&A expenses for 2011 were $140.5 million, or 17.7% of sales compared to $105.0 million, or 18.9% of sales for 2010. E&C segment SG&A expenses for 2011 increased by $6.7 million which was primarily the result of higher variable compensation and sales commission expense as a result of increased sales volume and also for costs related to infrastructure build-out and ramp up for future growth. D&S segment SG&A expenses for 2011 increased by $12.3 million which was primarily attributable to the acquisition of GOFA in August 2011 and Cryotech in 2010. Higher marketing and sales commission expense due to improving business conditions as well as targeting new growth opportunities also contributed to the
increase. SG&A expenses for the BioMedical segment increased by $12.4 million during 2011 primarily due to increased employee and integration costs as a result of the SeQual acquisition in December 2010. Corporate SG&A expenses for 2011 increased by $4.1 million which was primarily driven by higher share-based compensation costs, employee related costs and consulting fees related to our Enterprise Resource Planning (ERP) system implementation.
Amortization Expense
Amortization expense for 2011 was $13.4 million, or 1.7% of sales, compared to $11.0 million, or 2.0% of sales, for 2010. Amortization expense increased as a result of amortization of intangible assets acquired as part of the SeQual and GOFA acquisitions completed in December 2010 and August 2011, respectively.
Asset Impairment/Losses on Disposal of Assets
In 2011, the Company recorded $1.5 million of expense due to asset disposals; $1.2 million was related to disposal of the remaining assets of the BioMedical Plainfield, Indiana facility which was closed in May 2011. For the year ended December 31, 2010, loss on disposal of assets was $1.8 million. This wrote down to fair value the land and building in Denver, Colorado, the land in Plaistow, New Hampshire and certain leasehold improvements in the Plainfield, Indiana facility.
Operating Income
As a result of the foregoing, operating income for 2011 increased by $42.5 million to $90.0 million from $47.5 million in 2010 and improved as a percentage of sales by 2.7 percentage points to 11.3%.
Gain on Acquisition of Business
For the year ended December 31, 2010, the Company recognized a $1.1 million gain as a result of the Covidien Japan Acquisition. The purchase price was allocated to the assets acquired and liabilities assumed based on estimates of fair value at the date of acquisition. The estimates of fair value exceeded the cash paid and, accordingly, resulted in a gain on acquisition of business.
Interest Expense, Net and Financing Costs Amortization
For 2011, net interest expense was $23.4 million compared to $16.2 million for 2010. The $7.2 million increase was primarily attributable to the $5.0 million call premium paid in conjunction with the early redemption of the 9-1/8% Senior Subordinated Notes (Subordinated Notes) in October 2011. Non-cash accretion expense of $3.6 million related to the issuance in August 2011 of the Convertible Notes is included in the total interest expense for 2011. Also contributing to the increase was the fact that the Subordinated Notes and the Convertible Notes were both outstanding for 2-1/2 months during 2011 resulting in an additional $3.1 million of interest expense. These increases were partially offset by lower average debt outstanding on the term loan portion of our prior senior secured credit facility (Prior Credit Facility) as a result of required quarterly principal payments. Amortization of deferred financing costs increased by $1.3 million compared to 2010. In October 2011, the remaining deferred financing fees of $3.0 million related to the Subordinated Notes were written off. In 2010, $1.7 million of deferred financing fees related to the former senior credit facility, which was refinanced in May 2010, were written off.
Foreign Currency Loss (Gain)
For the years ended December 31, 2011 and 2010, foreign currency gains of $0.7 million and losses of $0.9 million, respectively, were recognized by the Company. The gains were primarily attributable to gains on foreign currency contracts as the euro weakened against the U.S. dollar during 2011. The losses in 2010 were the result of increased volatility in foreign exchange rates impacting transactions denominated in foreign currencies and the marked to market losses on the Company’s foreign currency forward contracts.
Income Tax Expense
Income tax expense for 2011 was $18.7 million and the effective tax rate was 29.7% compared to income tax expense for 2010 of $8.0 million and an effective tax rate of 28.0%. The increase in the effective tax rate in 2011 was largely due to an increase in federal income tax expense primarily as a result of higher domestic earnings.
Net Income
As a result of the foregoing, net income for 2011 was2012 increased by $27.2 million to $71.3 million from $44.1 million compared to net income of $20.2 million for 2010,in 2011 representing an increase of 118.6%61.8%.
Orders and Backlog
We consider orders to be those for which we have received a firm signed purchase order or other written contractual commitment from the customer. Backlog is comprised of the portion of firm signed purchase orders or other written
contractual commitments received from customers that we have not recognized as revenue upon shipment or under the percentage of completion method. Backlog can be significantly affected by the timing of orders for large projects, particularly in the E&C segment, and is not necessarily indicative of future backlog levels or the rate at which backlog will be recognized as sales. Orders included in our backlog may include customary cancellation provisions under which the customer could cancel part or all of the order, potentially subject to the payment of certain costs and/or penalties. Our backlog as of December 31, 2013, 2012 2011 and 20102011 was $617.4728.8 million, $489.1617.4 million and $236.4489.1 million, respectively.
The table below sets forth orders and backlog by segment for the periods indicated (dollar amounts in thousands):
| | | | Year Ended December 31, | Year Ended December 31, |
| | 2012 | | 2011 | | 2010 | 2013 | | 2012 | | 2011 |
| Orders | | | | | | | | | | |
| Energy & Chemicals | $ | 384,835 |
| | $ | 392,112 |
| | $ | 165,827 |
| $ | 294,921 |
| | $ | 384,835 |
| | $ | 392,112 |
|
| Distribution & Storage | 531,227 |
| | 435,954 |
| | 287,819 |
| 719,589 |
| | 531,227 |
| | 435,954 |
|
| BioMedical | 208,439 |
| | 203,635 |
| | 150,864 |
| 256,073 |
| | 208,439 |
| | 203,635 |
|
| Total | $ | 1,124,501 |
| | $ | 1,031,701 |
| | $ | 604,510 |
| $ | 1,270,583 |
| | $ | 1,124,501 |
| | $ | 1,031,701 |
|
| Backlog | | | | | | | | | | |
| Energy & Chemicals | $ | 365,470 |
| | $ | 303,490 |
| | $ | 115,972 |
| $ | 342,466 |
| | $ | 365,470 |
| | $ | 303,490 |
|
| Distribution & Storage | 228,204 |
| | 169,246 |
| | 108,665 |
| 363,480 |
| | 228,204 |
| | 169,246 |
|
| BioMedical | 23,760 |
| | 16,332 |
| | 11,779 |
| 22,890 |
| | 23,760 |
| | 16,332 |
|
| Total | $ | 617,434 |
| | $ | 489,068 |
| | $ | 236,416 |
| $ | 728,836 |
| | $ | 617,434 |
| | $ | 489,068 |
|
Orders for 20122013 were a record $1,124.51,270.6 million compared to $1,031.71,124.5 million for 20112012, representing an increase of $92.8146.1 million, or 9.0%13.0%. E&C segment orders were $384.8294.9 million in 20122013, a decrease of $7.389.9 million compared to 20112012, which. Significant E&C segment orders for 2013 included several LNG liquefiers and ethylene plant orders. Orders in 2012 included orders in excess of $150.0$150 million for two large LNG baseload projectsproject awards in Australia during the first quarter of 2012 while 2011 included orders in excess of $130.0 million for two large natural gas-related projects.Australia. Order flow in the E&C segment is historically volatile due to project size and it is not unusual to see order intake change significantly quarter to quarter.year over year. D&S segment orders for 20122013 were a record $531.2719.6 million compared to $436.0531.2 million for 20112012, an increase of $95.2188.4 million, or 21.9%35.5%. D&S segment order increases were driven by strong demand for LNG-related equipment including LNG fuel stations and vehicle tanks. Significant D&S segment awards included orders in excess of $95 million for two orders from PetroChina for LNG mobile and fixed fuel stations. Orders for the BioMedical segment for 2013 were $256.1 million compared to orders of $208.4 million for 2012. Excluding orders incrementally added by the AirSep acquisition in the amount of $68.3 million, BioMedical segment orders were down year over year due to continued weakness in the European market, the impact of Medicare competitive bidding in the U.S.
Orders for 2012 were $1,124.5 million compared to $1,031.7 million for 2011, representing an increase of $92.8 million, or 9.0%. E&C segment orders were $384.8 million in 2012, a decrease of $7.3 million compared to 2011. E&C segment orders for 2012 included orders in excess of $150.0 million for two large LNG base-load projects in Australia, while 2011 included orders in excess of $130.0 million for two large natural gas-related projects. D&S segment orders for 2012 were $531.2 million compared to $436.0 million for 2011, an increase of $95.2 million, or 21.9%. D&S segment order trends, especially in LNG, were strong in China which partially offset shortfalls in Europe. Orders for the BioMedical segment for 2012 were $208.4$208.4 million compared to orders of $203.6$203.6 million for the year ended December 31, 2011.2011. Excluding orders associated with the AirSep acquisition of $41.4 million, BioMedical segment orders were down year over year, largely due to continued weakness in Europe and the Medicare competitive bidding process in the United States.
Orders for 2011 were $1,031.7 million compared to $604.5 million for 2010, representing an increase of $427.2 million, or 70.7%. E&C segment orders were $392.1 million in 2011, an increase of $226.3 million compared to 2010. Orders in the E&C segment experienced increases across all product lines including process systems, brazed aluminum heat exchangers, and air cooled heat exchangers due to improving global economic conditions and the return of large scale LNG project work. D&S segment orders for 2011 were $436.0 million compared to $287.8 million for 2010, an increase of $148.1 million, or 51.5%. Bulk storage system and packaged gas system orders for the year were $277.3 million and $158.7 million, respectively, representing an increase of 56.4% in bulk storage systems and 43.5% in packaged gas system orders. D&S segment orders increased as LNG related growth opportunities continued to trend upward. Orders for the BioMedical segment for 2011 were $203.6 million compared to orders of $150.9 million for the year ended December 31, 2010. Medical respiratory orders increased $43.8 million primarily as a result of the SeQual acquisition in December 2010. Biological storage system orders also increased $8.9 million due to improved global demand.
Liquidity and Capital Resources
Debt Instruments and Related Covenants
Convertible Notes: The outstanding aggregate principal amount of the Company's Convertible Notes is $250.0 million.$250.0 million. The Convertible Notes bear interest at a fixed rate of 2.00%2.0% per year, payable semiannually in arrears on February 1 and August 1 of each year, and will mature on August 1, 2018. The effective interest rate at issuance, under generally accepted accounting principles, was 7.9%. Upon conversion, holders of the Convertible Notes will receive cash up to the principal amount of the Convertible Notes, and it is Chart’sthe Company's intention to settle any excess conversion value in shares of Chart’sthe Company's common stock. However, Chartthe Company may elect to settle, at its discretion, any such excess value in cash, shares of Chart’sthe Company's common stock or a combination of cash and shares. The initial conversion price of approximately $69.03 per share represents a conversion premium of 30% over the last reported sale price of Chart’sthe Company's common stock on July 28, 2011, the date of the Convertible Notes offering, which was $53.10 per share. The Convertible Notes are currently eligible for conversion at the option of the holder from January 1, 2014 until March 31, 2014. There have been no conversions as of the date of this filing. In the event that holders of Convertible Notes elect to convert, the Company expects to fund any cash settlement of any such conversion from working capital and borrowings under the Senior Credit Facility (as described below).
Senior Credit Facility: On April 25, 2012, theThe Company entered into an amended and restated credit facility on April 25, 2012, which replaced the prior senior secured credit facility (Prior(“Prior Credit Facility)Facility”) with a five-year $375.0 million senior secured credit facility (Senior(“Senior Credit Facility)Facility”), which consistsconsisted of a $75.0 million term loan (the Term Loan)“Term Loan”) and a $300.0 million revolving credit facility (the Revolving“Revolving Credit Facility)Facility”), and the maturity date was extended two years until April 25, 2017. The Company recorded $1.4 million in deferred financing costs related to the Senior Credit Facility which are being amortized over the five-year term of the loan. In accordance with loan modification accounting guidance, the Company recorded a $0.2 million charge to write off a portion of the remaining deferred financing fees associated with the Prior Credit Facility. The Senior Credit Facility also includes an expansion option permitting the Company to add up to an aggregate $150.0 million in term loans or revolving credit commitments from its existing and potential new lenders. Loans under the Senior Credit Facility bear interest, at the applicable Borrower's election, at either LIBOR or the greatest of (a) the JPMorgan prime rate in effect on such day, (b) the Federal Funds Effective Rate in effect on such day plus 1/2 of 1% or (c) the Adjusted LIBOR Rate (as defined in the Senior Credit Facility) for a one month interest period on such day (or if such day is not a business day, the immediately preceding business day) plus 1%, plus a margin that varies with the Company's net debt to EBITDA ratio. Under the terms of the Senior Credit Facility, 5% of the $75.0 million Term Loan is payable annually in quarterly installments over the first three years, 10% is payable annually in quarterly installments over the final two years, and the remaining balance is due on April 25, 2017. Significant financial covenants for the Senior Credit Facility include a maximum net debt to EBITDA ratio of 3.25 and a minimum interest coverage to EBITDA ratio of 3.0, which are the same limits that applied under the Prior Credit Facility. At December 31, 2012,2013, there was $72.2were $68.4 million in borrowings outstanding under the Term Loan and $28.2$24.8 million in letters of credit issued. Although there were no outstanding borrowings underand bank guarantees supported by the Revolving Credit Facility. Availability under the Senior Credit Facility was $275.2 million at December 31, 2012, the Company had borrowed against this facility to fund working capital needs during the year as a result of BioMedical's acquisition of AirSep, and incurred additional interest on interim amounts outstanding. At December 31, 2012, availability under the Revolving Credit Facility was $271.8 million2013. The Company was in compliance with all covenants, including its financial covenants, at December 31, 2012.2013.
Foreign Facilities – China: Chart Cryogenic Engineering Systems (Changzhou) Co., Ltd. (CCESC)Company Limited (“CCESC”), a wholly-owned subsidiary of the Company, maintained three separate banking facilities (the Foreign Facilities) which included a bonding/guarantee facility, a revolving line of credit, and an overdraft facility with 30.0 million, 60.0 million, and 10.0 million Chinese yuan in borrowing capacity, respectively. On November 11, 2012, the facilities matured and the outstanding principal and interest due of 30.0 million and 1.1 million Chinese yuan, respectively, were paid in full by CCESC.
As of December 31, 2012, Chart Cryogenic Distribution Equipment (Changzhou) Company Limited (“CCDEC”), a joint venture of the Company, maintain joint banking facilities (the “China D&S Facilities”) which include a revolving line with 30.0 million Chinese yuan (equivalent to $4.9 million) in borrowing capacity, a bonding/guarantee facility with up to 50.0 million Chinese yuan (equivalent to $8.2 million) in borrowing capacity, and an overdraft facility with 10.0 million Chinese yuan (equivalent to $1.6 million) in borrowing capacity. Any drawings made by CCESC hasand CCDEC under the China D&S Facilities are guaranteed by the Company.
CCDEC also maintains a facility with Bank of China with capacity of up to 20.0 million Chinese yuan (equivalent to $3.3 million). At December 31, 2013, there was 20.0 million Chinese yuan (equivalent to $3.3 million) outstanding under this facility, bearing interest at 6.6%. The facility matures on March 19, 2014.
At December 31, 2013, CCESC and CCDEC had 8.0 million Chinese yuan (equivalent to $1.3 million) and 5.6 million Chinese yuan (equivalent to $0.80.9 million) in bank guarantees, respectively.
Foreign Facilities – Ferox: Chart Ferox, a.s. (“Ferox”), or Ferox, oura wholly-owned subsidiary that operates inof the Czech Republic,Company, maintains two secured revolving credit facilities with capacity of up to 175.0 million Czech korunas.koruna (equivalent to $8.8 million). Both of the facilities allow Ferox to request issuance of bank guarantees and letters of credit. Neither of the facilities allows revolving credit borrowings, including overdraft protection. Under both facilities, Ferox must pay letter of credit and guarantee fees equal to 0.70% p.a. on the face amount of each guarantee or letter of credit. Ferox’s land, buildings and accounts receivable secure the credit facilities. At December 31, 20122013, there were $2.6 million of bank guarantees of 77.1 million Czech koruna (equivalent to $3.9 million) supported by suchthe Ferox credit facilities.
Our debt and related covenants are further described in Note C7 to our consolidated financial statements included elsewhere in this report.
Sources and Uses of Cash
Our foreign subsidiaries held cash of approximately $115.5$97.1 million and $96.5$115.5 million at December 31, 20122013 and 2011December 31, 2012, respectively, to meet their liquidity needs. No material restrictions exist in accessing cash held by our foreign subsidiaries and we expect to meet our U.S. funding needs without repatriating non-U.S. cash and incurring incremental U.S. taxes. Cash equivalents are invested in money market funds that invest in high quality, short-term instruments, such as U.S. government obligations, certificates of deposit, repurchase obligations and commercial paper issued by corporations that have been highly rated by at least one nationally recognized rating organization. We believe that our existing cash and cash equivalents, funds available under our debt facilities and cash provided by operations will be sufficient to finance our normal working capital needs, acquisition obligations, and investments in properties, facilities and equipment for the foreseeable future.
Years Ended December 31, 20122013 and 20112012
Our cash and cash equivalents totaled $141.5137.3 million as of December 31, 20122013, a decrease of $115.44.2 million from the balance at December 31, 20112012 mainly due to the acquisition of AirSep.. Cash provided by operating activities for the year ended December 31, 20122013 was $87.659.7 million compared to cash provided by operating activities of $81.787.6 million for the year ended December 31, 20112012. The increasedecrease of $5.927.9 million was primarily due to an increase in accounts receivable largely driven by the E&C and D&S segments, partially offset by an increase in net income.
Cash used in investing activities for the years ended December 31, 2013 and 2012 was $75.0 million and $224.3 million, respectively. The year ended December 31, 2012 included an investment of $182.5 million for the AirSep acquisition, whereas in 2013 we used $3.0 million in cash (net) to fund the acquisition of 80% of the shares of Nanjing Xinye Electric Engineering Co., Ltd. Capital expenditures for 2013 were $72.6 million compared with $43.7 million for 2012. Major capital expenditures for the year ended December 31, 2013 included capacity expansion projects in D&S and E&C in response to continued growth in the energy industry.
Cash provided by financing activities for the year ended December 31, 2013 was $8.1 million compared to $17.4 million for the year ended December 31, 2012. During the year ended December 31, 2013, the Company made $3.7 million in scheduled quarterly principal payments on the term loan portion of the Senior Credit Facility. Additionally, the Company borrowed $214.6 million and repaid $211.4 million from its Revolving Credit Facility and foreign facilities primarily to fund working capital needs. Excess tax benefits from share-based compensation were $6.7 million. The Company received $5.3 million in proceeds for stock option exercises which were offset by $2.0 million for the purchase of common stock which was surrendered to cover tax withholding elections. Finally, the company paid a $1.4 million distribution to one of its noncontrolling interests.
Years Ended December 31, 2012 and 2011
Our cash and cash equivalents totaled $141.5 million as of December 31, 2012, a decrease of $115.4 million from the balance at December 31, 2011 mainly due to the acquisition of AirSep. Cash provided by operating activities for the year ended December 31, 2012 was $87.6 million compared to cash provided by operating activities of $81.7 million for the year ended December 31, 2011. The increase of $5.9 million was primarily the result of an increase in net income primarily due to an increase in operating income in the E&C segment mainly offset by a decrease in billings in excess of contract revenue due to progress made on several large E&C system orders in backlog during 2012.
Cash used in investing activities for the years ended December 31, 2012 and 2011 was $224.3$224.3 million and $59.7$59.7 million,, respectively. In August 2012, the Company used $182.5 million in cash to fund the AirSep acquisition as compared to $37.7$37.7 million used for acquisitions during the year ended December 31, 2011.2011. Capital expenditures for 2012 were $43.7$43.7 million compared with $22.4$22.4 million for 2011.2011. Major capital expenditures for the year ended December 31, 2012 included capacity expansion projects in D&S and E&C in response to strong order intake and expected future growth. Also during the year ended December 31, 2012,, the Company received $2.1$2.1 million in proceeds, which approximated the carrying amount, for the sale of assets previously held for sale.
Cash provided by financing activities for the year ended December 31, 2012 was $17.4$17.4 million compared to $67.7$67.7 million for the year ended December 31, 2011.2011. The Company received $21.4$21.4 million in proceeds from its Term Loan offset by $4.4$4.4 million in scheduled quarterly principal payments on the term loan portions of both the Prior Credit Facility and Senior Credit Facility. The Company also borrowed and repaid $73.0$73.0 million from its Revolving Credit Facility and used $4.8 million to repay a foreign facility. In addition, the Company had a $9.0$9.0 million tax benefit from the exercise of stock options and received $3.5$3.5 million in proceeds for stock option exercises which were offset by $4.5$4.5 million for common stock repurchases to cover tax withholding elections during the year ended December 31, 2012.2012. Other uses of cash during 2012 included $1.4$1.4 million in payments for financing fees and a $1.3$1.3 million contingent consideration payment related to the 2010 acquisition of Cryotech.
Years Ended December 31, 2011 and 2010
Our cash and cash equivalents totaled $256.9 million as of December 31, 2011, an increase of $91.7 million from the balance at December 31, 2010. Cash provided by operating activities for the year ended December 31, 2011 was $81.7 million compared to cash provided of $38.6 million for the year ended December 31, 2010. The increase of $43.1 million was driven by increased net income of $44.2 million and increases in customer advances and billings in excess of contract revenue due to improved LNG related orders in both the E&C and D&S segments. These increases were partially offset by an increase in funds required for working capital in order to meet the improved backlog.
Cash used by investing activities for the years ended December 31, 2011 and 2010 was $59.7 million and $64.2 million, respectively. Capital expenditures for 2011 were $22.4 million compared with $16.9 million for 2010. The 2011 capital expenditures were primarily for continued automation, process improvements and expansions at our existing facilities particularly in New Iberia, Louisiana and Changzhou, China and the continuing implementation of the new ERP system company-wide. We used $36.1 million, net of cash acquired, to acquire GOFA in August 2011 and $1.6 million of cash was used to acquire Clever Fellows Innovation Consortium, Inc. in April 2011. The 2010 capital expenditures were primarily for the completion of the new industrial gas equipment repair center in McCarran, Nevada, a new BioMedical manufacturing facility in Canton, Georgia and implementation of a new ERP system for the Company. During 2010, $43.8 million was used for three acquisitions: Covidien’s Japanese liquid oxygen therapy business, substantially all of the assets of Cryotech International, Inc., and SeQual Technologies, Inc. The final deferred purchase payments for the 2009 acquisition of Golden Phoenix of $4.1 million were paid in 2010. In 2010, we received $1.0 million in proceeds from the sale of certain operating equipment at the BioMedical segment’s Plainfield, Indiana facility.International.
For the year ended December 31, 2011, cash provided by financing activities was $67.7 million compared to cash used of $19.3 million for the year ended December 31, 2010. In October 2011, $168.1 million was used to redeem the Subordinated Notes including a $5.0 million early redemption call premium. We received $242.7 million in proceeds, net of financing costs of $7.3 million, upon issuance of the Convertible Notes in August 2011. In addition, $66.5 million was paid for convertible note hedge and capped call transactions, and $48.8 million in proceeds were received from the related sale of warrants in connection with the issuance of the Convertible Notes. Quarterly principal payments totaling $6.5 million were made on the term loan portion of the Senior Credit Facility and $4.8 million in proceeds from borrowings was received by one of the Company's subsidiaries in China during the year ended December 31, 2011. During 2010, principal debt payments of $18.3 million were made of which $15.0 million was a voluntary payment on the term loan portion of the Prior Credit Facility as part of a refinancing. Financing costs of $2.9 million related to that refinancing were also paid during 2010. The exercise of stock options provided $7.0 million and $1.1 million in 2011 and 2010, respectively. Tax benefits associated with the exercise of stock options provided $7.9 million in 2011 versus $0.8 million in 2010.41
Cash Requirements
The Company does not anticipate any unusual cash requirements for working capital needs for the year ending December 31, 20132014. Management anticipates the Company will be able to satisfy cash requirements for its ongoing business for the foreseeable future with cash generated by operations, existing cash balances and if necessary,available borrowings under our credit facilities. We expect capital expenditures for 20132014 to be in the range of $70.060.0 to $80.090.0 million primarily for expansionsthe continued expansion of the brazed aluminum heat exchanger facility in La Crosse, Wisconsin and capital expansion and improvement projects across our D&S segment. In addition, the large tank manufacturing facilityCompany expects to use approximately $13.0 million during the next six months to expand its business lines and production capabilities for E&C segment products in New Prague, Minnesota.Wuxi, China in connection with a previously announced acquisition.
In 20132014, the Company is forecasting to use approximately $6.86.7 million for scheduled interest payments under the Senior Credit Facility and Convertible Notes. We are also required to make quarterly principal payments of $0.9 million in 2014 under the Senior Credit Facility. In addition, we are forecasting to use approximately $21.023.0 to $25.027.0 million of cash to pay U.S. and foreign income taxes, and approximately $0.61.7 million of cash to fund our defined benefit pension plans under ERISA funding requirements.requirements, and approximately $1.2 million for dividend payments to a noncontrolling interest.
Contractual Obligations
Our known contractual obligations as of December 31, 20122013 and cash requirements resulting from those obligations are as follows (all dollar amounts in thousands):
| | | | Payments Due by Period | Payments Due by Period |
| | Total | | 2013 | | 2014-2015 | | 2016-2017 | | 2018 and
Thereafter | Total | | Less Than 1 Year | | 1 – 3 Years | | 3 – 5 Years | | More Than 5 Years |
| | | | | | | | | | | | | | | | | | | |
Long-term debt | $ | 322,188 |
| | $ | 3,750 |
| | $ | 10,313 |
| | $ | 58,125 |
| | $ | 250,000 |
| $ | 321,718 |
| | $ | 7,030 |
| | $ | 14,063 |
| | $ | 300,625 |
| | $ | — |
|
Interest on long-term debt (1)(2) | 37,452 |
| | 6,839 |
| | 13,612 |
| | 12,001 |
| | 5,000 |
| 29,876 |
| | 6,656 |
| | 12,912 |
| | 10,308 |
| | — |
|
| Operating leases | 31,109 |
| | 7,195 |
| | 9,274 |
| | 5,571 |
| | 9,069 |
| 38,416 |
| | 10,195 |
| | 11,711 |
| | 7,327 |
| | 9,183 |
|
Purchase obligations (2)(3) | 8,787 |
| | 8,787 |
| | — |
| | — |
| | — |
| 4,475 |
| | 4,475 |
| | — |
| | — |
| | — |
|
Pension obligations (3)(4) | 8,635 |
| | 635 |
| | 3,600 |
| | 4,400 |
| | — |
| 9,129 |
| | 1,729 |
| | 3,100 |
| | 4,300 |
| | — |
|
| Total contractual cash obligations | $ | 408,171 |
| | $ | 27,206 |
| | $ | 36,799 |
| | $ | 80,097 |
| | $ | 264,069 |
| $ | 403,614 |
| | $ | 30,085 |
| | $ | 41,786 |
| | $ | 322,560 |
| | $ | 9,183 |
|
_______________
| |
(1) | The $250,000 principal balance of the Convertible Notes will mature on August 1, 2018, yet the carrying amount of the Convertible Notes is treated as current for financial statement reporting purposes. |
| |
(2) | The interest payments in the above table were estimated based upon our existing debt structure at December 31, 20122013, which included the Senior Credit Facility and Convertible Notes, less scheduled debt payments each year, and the interest rates in effect at December 31, 20122013. |
| |
(2)(3) | Purchase obligations represent orders for metals to be consumed in the normal course of business. |
| |
(3)(4) | The planned funding of the pension obligations wasis based upon actuarial and management estimates taking into consideration the current status of the plans.plan. |
Not included in the table above are unrecognized tax benefits of $3.30.9 million at December 31, 20122013 and a contingent consideration arrangement from a prior acquisition with a maximum potential payout of $3.0 million.
Our commercial commitments as of December 31, 20122013, which include standby letters of credit and bank guarantees, represent potential cash requirements resulting from contingent events that require performance by us or our subsidiaries pursuant to funding commitments, and are as follows (all dollar amounts in thousands): | | | | Total | | Expiring in 2013 | | Expiring in 2014 and beyond | Total | | Expiring in 2014 | | Expiring in 2015 and beyond |
| | | |
| Standby letters of credit | $ | 14,663 |
| | $ | 7,480 |
| | $ | 7,183 |
| $ | 15,535 |
| | $ | 5,402 |
| | $ | 10,133 |
|
| Bank guarantees | 18,234 |
| | 9,954 |
| | 8,280 |
| 15,329 |
| | 11,137 |
| | 4,192 |
|
| Total commercial commitments | $ | 32,897 |
| | $ | 17,434 |
| | $ | 15,463 |
| $ | 30,864 |
| | $ | 16,539 |
| | $ | 14,325 |
|
Off-Balance Sheet Arrangements
We do not have any off-balance sheet arrangements.
Contingencies
We are involved with environmental compliance, investigation, monitoring and remediation activities at certain of our operating facilities or formerly owned manufacturing facilities, and accrue for these activities when commitments or remediation plans have been developed and when costs are probable and can be reasonably estimated. Historical annual cash expenditures for these activities have been charged against the related environmental reserves. Future expenditures relating to these environmental remediation efforts are expected to be made over the next 14 years as ongoing costs of remediation programs. Management believes that any additional liability in excess of amounts accrued, which may result from the resolution of such matters should not have a material adverse effect on our financial position, liquidity, cash flows or results of operations.
We are occasionally subject to various legal claims related to performance under contracts, product liability, taxes, employment matters, environmental matters, intellectual property and other matters, several of which claims assert substantial damages, in the ordinary course of our business. Based on our historical experience in litigating these claims, as well as our current assessment of the underlying merits of the claims and applicable insurance, if any, we believe the resolution of these legal claims will not have a material adverse effect on our financial position, liquidity, cash flows or results of operations. Future developments may, however, result in resolution of these legal claims in a way that could have a material adverse effect. See Item 1A. “Risk Factors” and Item 3. “Legal Proceedings” for further information.
Foreign Operations
During 20122013, we had operations in Australia, Asia and Europe, which accounted for approximately 29.9%34.4% of consolidated sales and 34.7%35.2% of total assets at December 31, 20122013. Functional currencies used by these operations include the Chinese yuan, the euro, Japanese yen, and the British pound. We are exposed to foreign currency exchange risk as a result of transactions by these subsidiaries in currencies other than their functional currencies, and from transactions by our domestic operations in currencies other than the U.S. dollar. The majority of these functional currencies and the other currencies in which we record transactions are fairly stable. The use of these currencies, combined with the use of foreign currency forward purchase and sale contracts, has enabled us to be sheltered from significant gains or losses resulting from foreign currency transactions. This situation could change if these currencies experience significant fluctuations or the volume of forward contracts changes.
Application of Critical Accounting Policies
Our consolidated financial statements have been prepared in accordance with U.S. generally accepted accounting principles and are based on the selection and application of significant accounting policies, which require management to make estimates and assumptions about future events that affect the amounts reported in the financial statements and accompanying notes. Actual results could differ materially from those estimates. Management believes the following are the more critical judgmental areas in the application of its accounting policies that affect its financial position and results of operation.
Allowances for Doubtful Accounts.Accounts Receivable, Net of Allowances. We evaluate the collectibility of accounts receivable based on a combination of factors. In circumstances where we are aware of a specific customer’s inability to meet its financial obligations (e.g., bankruptcy filings, substantial downgrading of credit scores), a specific reserve is recorded to reduce the receivable to the amount we believe will be collected. We also record allowances for doubtful accounts based on the length of time the receivables are past due and historical experience. If circumstances change (e.g., higher than expected defaults or an unexpected material adverse change in a customer’s ability to meet its financial obligations), our estimates of the collectibility of amounts due could be changed by a material amount.
Inventory Valuation Reserves. We determine inventory valuation reserves based on a combination of factors. In circumstances where we are aware When collection of a specific problem inamount due is deemed remote, the valuation of a certain item, a specific reserveaccount is recorded to reducewritten off against the item to its net realizable value. We also recognize reserves based on the actual usage in recent history and projected usage in the near-term. If circumstances change (e.g., lower than expected or higher than expected usage), estimates of the net realizable value could be changed by a material amount.
Long-Lived Assets. We monitor our long-lived assets (property, plant and equipment and finite-lived intangible assets) for impairment indicators on an ongoing basis. If impairment indicators exist, we perform the required analysis and record impairment charges in accordance with accounting guidance. In conducting our analysis, we compare the undiscounted cash flows expected to be generated from the long-lived assets to the related net book values. If the undiscounted cash flows exceed the net book value, the long-lived assets are not impaired. If the net book value exceeds the undiscounted cash flows, an impairment loss is measured and recognized. An impairment loss is measured as the difference between the net book value and the fair value of the long-lived assets. Fair value is estimated based upon either discounted cash flow analyses or estimated salvage values. Cash flows are estimated using internal forecasts as well as assumptions related to discount rates. Changes in economic or operating conditions impacting these estimates and assumptions could result in the impairment of long-lived assets.allowance.
Goodwill and Indefinite-Lived Intangible Assets. We evaluate goodwill and indefinite-lived intangible assets for impairment on an annual basis, as of October 1 or whenever events or changes in circumstances indicate that an evaluation should be completed. The reporting units are the same as our operating segments, which are also our reportable segments: Energy & Chemicals, Distribution & Storage, and BioMedical. We first evaluate relevant events and circumstances, such as macroeconomic conditions and the Company'sour overall financial performance to determine whether it is more likely than not that the fair value of a reporting unit is less than its carrying amount, including goodwill. We then evaluate how significant each of the identified factors could be to the fair value or carrying amount of a reporting unit and weigh these factors in totality in forming a conclusion whether it is more likely than not that the fair value of a reporting unit is less than its carrying amount.
If we determine that it is not more likely than not that the fair value of a reporting unit is less than its carrying amount, the first and second steps of the goodwill impairment test are not necessary. Otherwise, we would perform the first step of the two-step goodwill impairment test. As of October 1, 2012 and based on our
Alternatively, we may also bypass such a qualitative assessment we determined that it was not more likely than not thatand proceed directly to the goodwill test utilizing a two-step approach. We estimate the fair value is less thanof our reporting units by using income and market approaches to develop fair value
estimates, which are weighted equally to arrive at a fair value estimate for each reporting unit. With respect to the carrying amountincome approach, a model has been developed to estimate the fair value of each reporting unitunit. This fair value model incorporates estimates of future cash flows, estimates of allocations of certain assets and therefore,cash flows among reporting units, estimates of future growth rates and management’s judgment regarding the two-step goodwill impairment test was not necessary.applicable discount rates to use to discount those estimated cash flows. With respect to the market approach, a guideline company method is used selecting companies with similar assets or businesses to estimate fair value of each reporting unit. Changes to these judgments and estimates could result in a significantly different estimate of the fair value of the reporting units, which could result in a different assessment of the recoverability of goodwill.
With respect to indefinite-lived intangible assets, the Companywe first evaluatesevaluate relevant events and circumstances to determine whether it is more likely than not that the fair value of an indefinite-lived intangible asset is less than its carrying amount. If, in weighing all relevant events and circumstances in totality, the Company determineswe determine that it is not more likely than not that an indefinite-lived intangible asset is impaired, no further action is necessary. Otherwise, the Companywe would determine the fair value of indefinite-lived intangible assets and perform a quantitative impairment assessment by comparing anthe indefinite-lived intangible asset's fair value to its carrying amount in accordance with Accounting Standards Codification (ASC)(“ASC”) Subtopic 350-30. AsWe may bypass such a qualitative assessment and proceed directly to the quantitative assessment. We estimate the fair value of our indefinite-lived assets using the relief-from-royalty method within the income approach. Under this method, fair value is estimated by discounting the royalty savings as well as any tax benefits related to ownership to a present value.
We elected to bypass the qualitative assessments for both goodwill and indefinite-lived intangible assets and performed the impairment tests using quantitative assessments as of October 1, 20122013, and based on. With respect to goodwill, the Company's qualitative assessment,estimated fair values substantially exceeded the Company determined that itcarrying amounts for all reporting units. Therefore, there was not more likely than not thatno goodwill impairment in 2013. Furthermore, the fair valuevalues of each indefinite-lived intangible asset was less thanexceeded its carrying amount, therefore,amount. Therefore, there was no further action was necessary.impairment of indefinite-lived intangible assets in 2013.
Prior to the qualitative assessment, the CompanyWe recorded an impairment loss of $3.1$3.1 million during the second quarter of 2012 resulting in the elimination of in-process research & development (IPR&D)IPR&D indefinite-lived intangible assets related to a prior BioMedical segment acquisition. Higher forecasted costs and project delays represented impairment indicators requiring the Companyus to re-evaluate the fair value of the IPR&D indefinite-lived intangible assets. The CompanyWe conducted an impairment test based on the multi-period excess earnings valuation method which determines fair value based on the present value of the prospective net cash flow attributable to the intangible asset. The CompanyWe determined that the fair value of the IPR&D indefinite-lived intangible assets was zero and impaired the intangible assets by a value equal to their carrying amount.
Pensions. We sponsor one defined benefit pension plan which has been frozen since February 2006. The funded status is measured as the difference between the fair value of the plan assets and the projected benefit obligation. The Company recognizesWe recognize the change in the funded status of the plan in the year in which the change occurs through accumulated other comprehensive income. Our funding policy is to contribute at least the minimum funding amounts required by law. We have chosen policies according to accounting guidance that allow the use of a calculated value of plan assets (which is further described below), which generally reduces the volatility of pension expense (income) from changes in pension liability discount rates and the performance of the pension plans’ assets.
A significant element in determining our pension expense in accordance with accounting guidance is the expected return on plan assets. We have assumed that the expected long-term rate of return on plan assets as of December 31, 20122013 and 2011 will be2012 was 7.75%7.25%. and 7.75%, respectively. The expected return assumptions were developed using a simplean averaging formula based upon the plans’ investment guidelines, mix of asset classes, historical returns of equities and bonds, and expected future returns. We believe our assumptions for expected future returns are reasonable. However, we cannot guarantee that we will achieve these returns in the future. The assumed long-term rate of return on assets is applied to the market value of plan assets. This produces the expected return on plan assets that reduces pension expense. The difference between this expected return and the actual return on plan assets is deferred. The net deferral of past asset gains or losses affects the calculated value of plan assets and, ultimately, future net periodic pension expense.
At the end of each year, we determine the rate to be used to discount plan liabilities. The discount rate reflects the current rate at which the pension liabilities could be effectively settled at the end of the year. In estimating this rate, we look to rates of return on high quality, fixed-income investments that receive one of the two highest ratings given by a recognized rating agency and the expected timing of benefit payments under the plan. At December 31, 20122013, we determined this rate to be 3.75%4.75% as compared to 4.5%3.75% in 20112012. Changes in discount rates over the past three years have not materially affected pension expense (income), and the net effect of changes in the discount rate, as well as the net effect of other changes in actuarial assumptions and experience, have been deferred and amortized over the expected future service of participants.
At December 31, 20122013, our consolidated net pension liability recognized was $19.37.7 million, an increasea decrease of $3.411.6 million from December 31, 20112012. This increasedecrease in liability was largely due to a lowerhigher discount rate used on the interest cost for the
projected benefit obligation as a result of lowerhigher interest rates. Employer contributions to the plan ofwere $1.70.6 million were offset byand benefit payments ofwere $1.71.8 million. in fiscal 2013. For the years ended December 31, 2013, 2012 2011 and 20102011, we recognized approximately $0.50.8 million, $0.20.5 million, and $0.40.2 million of net periodic pension expense, respectively. See Note G15 to our financial statements included elsewhere in this report for further information.
Environmental Remediation Obligations. Our obligations for known environmental problems at our current and former manufacturing facilities have been recognized on an undiscounted basis on estimates of the cost of investigation and
remediation at each site. Management along with our consultants reviews our environmental remediation sites quarterly to determine if additional cost adjustments or disclosures are required. The characteristics of environmental remediation obligations, where information concerning the nature and extent of clean-up activities is not immediately available and changes in regulatory requirements frequently occur, result in a significant risk of increase to the obligations as they mature. Expected future expenditures are not discounted to present value and potential insurance recoveries are not recognized until realized.
Product Warranty Costs. The Company providesWe provide product warranties with varying terms and durations for the majority of itsour products. We estimate product warranty costs and accrue for these costs as products are sold. The warranty reserve includes both a general reserve component, calculated based upon historical experience over the warranty period for each product and a specific reserve component for any specifically identified warranty issues. Due to the uncertainty and potential volatility of these warranty estimates, changes in assumptions including expected warranty claims and costs to satisfy those claims or specifically identified issues could materially affect net income.
Revenue Recognition — Long-Term Contracts. We recognize revenue and gross profit as work on certain long-term contracts progresses using the percentage of completion method of accounting, which relies on estimates of total expected contract revenues and costs. We follow this method since reasonably dependable estimates of the revenue and costs applicable to various stages of a contract can be made. Since the financial reporting of these contracts depends on estimates, which are assessed continually during the term of the contract, recognized revenues and profit are subject to revisions as the contract progresses toward completion. Revisions in profit estimates are reflected in the period in which the facts that give rise to the revision become known. Accordingly, favorable changes in estimates result in additional profit recognition, and unfavorable changes will result in the reversal of previously recognized revenue and profits. When estimates indicate a loss is expected to be incurred under a contract, cost of sales is charged with a provision for such loss. As work progresses under a loss contract, revenue and cost of sales continue to be recognized in equal amounts, and the excess of costs over revenues is charged to the contract loss reserve. Change orders resulting in additional revenue and profit are recognized upon approval by the customer based on the percentage that incurred costs to date bear to total estimated costs at completion. Pre-contract costs relate primarily to salaries and benefits incurred to support the selling effort and, accordingly, are expensed as incurred. Certain contracts include incentive-fee arrangements clearly defined in the agreement and are not recognized until earned. We use the percentage of completion method of accounting primarily in the E&C segment.
Share-based Employee Compensation. Share-based compensation expense is calculated based on the estimated fair value of our stock options, restricted stock awards, performance stock units and leveraged restricted stock units. Fair value of stock options is calculated using the Black-Scholes pricing model. Fair value of restricted stock awards is based on the Company'sour market price on the date of grant. Fair value of performance stock units is valued based on our market price on the date of grant and pre-determined performance condition targets as determined by the Compensation Committee of the Board of Directors and vest at the end of three years.Directors. Fair value of leveraged restricted stock units is based on market conditions and calculated using a Monte Carlo simulation model. The grant dategrant-date fair value calculation requires the use of variables such as exercise term of the option, future volatility, dividend yield and risk-free interest rate. Share-based compensation expense is generally recognized over the vesting period of the share-based award after consideration of the estimated forfeiture rates.
Recently Adopted Accounting StandardsStandard
Effective October 1, 2012,2013, the Company early adopted the new guidance issued by the Financial Accounting Standards Board (FASB)(“FASB”) regarding qualitative impairment assessments of indefinite-lived intangible assets. The guidance permits an entity to first assess qualitative factors to determine whether it is more likely than not that the fair value of an indefinite-lived intangible asset is less than its carrying amount as a basis for determining whether further impairment testing is necessary. If an entity determines that it is not more likely than not that the fair value of an indefinite-lived intangible asset is less than its carrying amount, no further action is necessary. Otherwise, the entity is required to determine the fair value of indefinite-lived intangible assets and perform a quantitative impairment assessment in accordance with Subtopic 350-30. The adoption of this guidance did not have a material impact of the Company’s financial position, results of operations or cash flows.
Effective 2012, the Company adopted the new guidance issued by the FASB regarding the presentation of comprehensive income. This guidance revises the manner in which entities presentaccumulated other comprehensive income in their financial statements. The new guidance removesdisclosures. Specifically, the presentation options in Topic 220 andstandard requires entities to report componentsadditional disclosures when reporting amounts reclassified out of comprehensive income in either (1) a continuous statement of comprehensive income or (2) two separate but consecutive statements. The amendments do not change the items that must be reported inaccumulated other comprehensive income. The adoption of this guidance did not have a material impact on the consolidated financial statements of the Company's financial position, results of operations or cash flows.
Effective 2012, the Company adopted the new guidance issued by the FASB regarding fair value disclosures. This guidance aims to align the principles for fair value measurements and the related disclosure requirements in accordance with U.S. Generally Accepted Accounting Principles (GAAP) and International Financial Reporting Standards (IFRS). This Accounting Standard Update (ASU) mainly contains clarifications such as the specification that the "highest and best use"
valuation concept for fair value measurements is relevant only when measuring the fair value of nonfinancial assets and is not relevant when measuring the fair value of financial assets or of liabilities. The ASU also requires new disclosures under U.S. GAAP such as quantitative information about the unobservable inputs used in a fair value measurement that is categorized within Level 3 of the fair value hierarchy. The adoption of this guidance did not have a material impact of the Company's financial position, results of operations or cash flows.Company.
Forward-Looking Statements
The Company is making this statement in order to satisfy the “safe harbor” provisions contained in the Private Securities Litigation Reform Act of 1995. This Annual Report on Form 10-K includes “forward-looking statements.” These forward-looking statements include statements relating to our business. In some cases, forward-looking statements may be identified by terminology such as “may,” “should,” “expects,” “anticipates,” “believes,” “projects,” “forecasts,” “continue” or the negative of such terms or comparable terminology. Forward-looking statements contained herein (including future cash contractual obligations, liquidity, cash flow, orders, results of operations, projected revenues, from new acquisitions, and trends, among other matters) or in other statements made by us are made based on management’s expectations and beliefs concerning future events impacting us and are subject to uncertainties and factors relating to our operations and business environment, all of which are difficult to predict and many of which are beyond our control, that could cause our actual results to differ materially from those matters expressed or implied by forward-looking statements. We believe that the following factors, among others (including those described under Item 1A. “Risk Factors”), could affect our future performance and the liquidity and value of our securities and cause our actual results to differ materially from those expressed or implied by forward-looking statements made by us or on our behalf:
the cyclicality of the markets which we serve and the vulnerability of those markets to economic downturns;
the loss of, or a significant reduction or delay in purchases by, our largest customers;
the fluctuations in energy prices;
the potential for negative developments in the natural gas industry related to hydraulic fracturing;
competition in our markets;
governmental energy policies could change, or expected changes could fail to materialize;
competition in our markets;ability to successfully manage our planned operational expansions;
economic downturns and deteriorating financial conditions;
our ability to manage our fixed-price contract exposure;
our ability to successfully manage our planned operational expansions;
our reliance on the availability of key supplies and services;
degradation of our backlog as a result of modification or termination of orders;
our ability to successfully acquire or integrate companies that provide complementary products or technologies;
changes in government health care regulations and reimbursement policies;
general economic, political, business and market risks associated with our global operations including instability in North Africa and the Middle East;
our ability to successfully acquire or integrate companies that provide complementary products or technologies, including the successful integration of the AirSep acquisition;
the loss of key employees;operations;
litigation and disputes involving us, including the extent of product liability, warranty, contract, employment, intellectual property and environmental claims asserted against us;
our warranty reserves may not adequately cover our warranty obligations;
the loss of key employees;
fluctuations in foreign currency exchange rates and interest rates;
financial distress of third parties;
United States Food and Drug Administration and comparable foreign regulation of our products;
the pricing and availability of raw materials;
our ability to control our costs while maintaining customer relationships and core business resources;
our ability to protect our intellectual property and know-how;
the impairment of our goodwill or other intangible assets;
the cost of compliance with environmental, health and safety laws and responding to potential liabilities under these laws;
technological security threats and our ability to protect our intellectual property and know-how;reliance on information systems;
claims that our products or processes infringe intellectual property rights of others;
technological security threats and our reliance on information systems;
labor costs and disputes and the deterioration of our relations with our employees;
additional liabilities related to taxes;
our ability to continue our technical innovation in our product lines;
labor costs and disputes and the deterioration of our relations with our employees;
increased government regulation;
the underfunded status of our pension plans;plan;
increased government regulation;the risk of potential violations of the Foreign Corrupt Practices Act;
disruptions in our operations due to severe weather;
potential violations of the Foreign Corrupt Practices Act;
regulations governing the export of our products and other regulations applicable to us as a supplier of products to the U.S. government;
risks associated with our indebtedness, leverage, debt service and liquidity;
potential dilution to existing holders of our common stock as a result of the conversion of our convertible debt;Convertible Notes, and the need to utilize our cash balances and/or credit facility to fund any cash settlement related to such conversions;
fluctuations in the price of our stock; and
other factors described herein.
There may be other factors that may cause our actual results to differ materially from the forward-looking statements.
All forward-looking statements attributable to us or persons acting on our behalf apply only as of the date of this Annual Report and are expressly qualified in their entirety by the cautionary statements included in this Annual Report. We undertake no obligation to update or revise forward-looking statements which may be made to reflect events or circumstances that arise after the filing date of this document or to reflect the occurrence of unanticipated events.
| |
| Item 7A. | Quantitative and Qualitative Disclosures About Market Risk |
In the normal course of business, the Company's operations are exposed to fluctuations in foreign currency values and interest rates that can affect the cost of operating and financing. Accordingly, the Company addresses a portion of these risks through a program of risk management.
Interest Rate Risk: The Company's primary interest rate risk exposure results from the Senior Credit Facility’s various floating rate pricing mechanisms. If interest rates were to increase 200 basis points (2 percent) from December 31, 20122013 rates, and assuming no changes in debt from the December 31, 20122013 levels, our additional annual expense would be approximately $1.4 million on a pre-tax basis.
Foreign Currency Exchange Rate Risk: The Company has assets, liabilities and cash flows in foreign currencies creating exposure to foreign currency exchange fluctuations in the normal course of business. Chart’s primary exchange rate exposures are with the euro, the British pound,Japanese yen, the Czech koruna, the Japanese yen,Australian dollar, the Norwegian krone, the Canadian dollar and the Chinese yuan. Monthly measurement, evaluationrevaluation and forward exchange rate contracts are employed as methods to reduce this risk. The Company enters into foreign exchange forward contracts to hedge anticipated and firmly committed foreign currency transactions. Chart does not use derivative financial instruments for speculative or trading purposes. The terms of the contracts are generally one year or less. At December 31, 20122013, a hypothetical 10% weakening of the U.S. dollar would not materially affect the Company’s financial statements.
Market Price Sensitive Instruments
In connection with the issuance of the Convertible Notes, the Company entered into privately-negotiated convertible note hedge and capped call transactions with affiliates of certain of the underwriters (the Option Counterparties)“Option Counterparties”). The convertible note hedge and capped call transactions relate to, collectively, 3.6 million shares, which represents the number of shares of the Company’s common stock underlying the Convertible Notes, subject to anti-dilution adjustments substantially similar to those applicable to the Convertible Notes. These convertible note hedge and capped call transactions are expected to reduce the potential dilution with respect to the Company’s common stock upon conversion of the Convertible Notes and/or reduce the Company’s exposure to potential cash or stock payments that may be required upon conversion of the Convertible Notes, except, in the case of the capped call transactions, to the extent that the market price per share of the Company’s common stock exceeds the cap price of the capped call transactions.
The Company also entered into separate warrant transactions with the Option Counterparties initially relating to the number of shares of the Company’s common stock underlying the convertible note hedge transactions, subject to customary anti-dilution adjustments. The warrant transactions will have a dilutive effect with respect to the Company’s common stock to the extent that the price per share of the Company's common stock exceeds the strike price of the warrants unless the Company elects, subject to certain conditions, to settle the warrants in cash. The cap price of the capped call transactions and the strike price of the warrant transactions was initially $84.96 per share. Further information is located in Note C7 to the Company’s consolidated financial statements included in Item 8 of this Annual Report on Form 10-K.
Covenant Compliance
We believe that our Senior Credit Facility is a material agreement, that the covenants are material terms of the agreement and that information about the covenants is material to an investor’s understanding of our financial condition and liquidity. The breach of covenants in the Senior Credit Facility that are tied to ratios based on Adjusted EBITDA, as defined below, could result in a default under the Senior Credit Facility and the lenders could elect to declare all amounts borrowed due and payable. Additionally, under the Senior Credit Facility, our ability to engage in activities such as incurring additional indebtedness, making investments and paying dividends is also tied to ratios based on Adjusted EBITDA.
Covenant levels and pro forma ratios for the four quarters ended December 31, 20122013 are as follows:
|
| | | |
| | Covenant Level | | Four Quarters Ended
December 31, 20122013
Ratio |
Senior Credit Facility (1) (2) | | | |
| Minimum Adjusted EBITDA* to cash interest ratio | 3.00x | | 27.26x30.14x |
| Maximum funded indebtedness to Adjusted EBITDA* ratio | 3.25x | | 1.12x1.06x |
_______________
_______________
| |
(1) | Failure to satisfy these ratio requirements would constitute a default under the Senior Credit Facility. If lenders under the Senior Credit Facility failed to waive any such default, repayment obligations under the Senior Credit Facility could be accelerated, which would also constitute a default under the indenture for the Convertible Notes. |
| |
(2) | The ratio is calculated giving pro forma effect to our acquisition of AirSep and Term Loan principal payments during 2012.2013. |
| |
| * | Adjusted EBITDA as used herein is defined as net income before interest expense, provision for income taxes, depreciation and amortization and further adjusted to exclude non-recurring items, non-cash items and other adjustments permitted in calculating covenants contained in the related Senior Credit Facility. |
| |
| Item 8. | Financial Statements and Supplementary Data |
Our Financial Statements and the accompanying Notes that are filed as part of this Annual Report are listed under Item 15. “Exhibits and Financial Statement Schedules” and are set forth beginning on page F-1 immediately following the signature page of this Form 10-K and are incorporated into this Item 8 by reference.
| |
| Item 9. | Changes in and Disagreements With Accountants on Accounting and Financial Disclosure |
None.
| |
| Item 9A. | Controls and Procedures |
Evaluation of Disclosure Controls and Procedures
As of December 31, 20122013, an evaluation was performed, under the supervision and with the participation of the Company’s management including the Company’s Chief Executive Officer and Chief Financial Officer, of the effectiveness of the design and operation of the Company’s disclosure controls and procedures pursuant to Rule 13a-15 under the Securities and Exchange Act of 1934, as amended (the Exchange Act). Based upon that evaluation, such officers concluded that the Company’s disclosure controls and procedures are effective to ensure that information required to be disclosed by the Company in the reports it files or submits under the Exchange Act (1) is recorded, processed, summarized and reported, within the time periods specified in the Securities and Exchange Commission’s rules and forms and (2) is accumulated and communicated to the Company’s management including the Chief Executive Officer and Chief Financial Officer, as appropriate to allow for timely decisions regarding required disclosure.
Management’s Report on Internal Control Over Financial Reporting
Management’s Report on Internal Control Over Financial Reporting is set forth on page F-1 of this Annual Report on Form 10-K and incorporated herein by reference.
The effectiveness of the Company’s internal control over financial reporting as of December 31, 20122013 has been audited by Ernst & Young LLP, an independent registered public accounting firm, as stated in its report which is set forth in Item 8. “Financial Statements and Supplementary Data,” on page F-3 under the caption “Report of Independent Registered Public Accounting Firm” and incorporated herein by reference.
Changes in Internal Control over Financial Reporting
There were no changes in the Company’s internal control over financial reporting that occurred during the Company’s most recent fiscal quarter that have materially affected, or are reasonably likely to materially affect, the Company’s internal control over financial reporting.
The Company did not include an evaluation of the internal control over financial reporting of AirSep Corporation, which constituted $246.8 million and $181.5 million of total and net assets, respectively, as of December 31, 2012, and$40.3 million and $3.9 millionof revenues and net loss, respectively, for the year then ended.
| |
| Item 9B. | Other Information |
Not applicable.
PART III
| |
| Item 10. | Directors, Executive Officers and Corporate Governance |
Information required by this item as to the Directors of the Company appearing under the caption “Election of Directors” in the Company’s 20132014 Proxy Statement is incorporated herein by reference. Information required by this item as to the Executive Officers of the Company is included as Item 4A of this Annual Report on Form 10-K as permitted by Instruction 3 to Item 401(b) of Regulation S-K. Information required by Item 405 is set forth in the 20132014 Proxy Statement under the heading “Section 16(a) Beneficial Ownership Reporting Compliance” which information is incorporated herein by reference. Information required by Items 406 and 407(c)(3), (d)(4) and (d)(5) of Regulation S-K is set forth in the 20132014 Proxy Statement under the headings “Information Regarding Meetings and Committees of the Board of Directors,” “Code of Ethical Business Conduct and Officer Code of Ethics” and “Stockholder Communications with the Board,” which information is incorporated herein by reference.
The Charters of the Audit Committee, Compensation Committee and Nominations and Corporate Governance Committee and the Corporate Governance Guidelines, Officer Code of Ethics and Code of Ethical Business Conduct are available on the Company’s website at www.chartindustries.com and in print to any stockholder who requests a copy. Requests for copies should be directed to Secretary, Chart Industries, Inc., One Infinity Corporate Centre Drive, Suite 300, Garfield Heights, Ohio 44125. The Company intends to disclose any amendments to the Code of Ethical Business Conduct or Officer Code of Ethics, and any waiver of the Code of Ethical Business Conduct or Officer Code of Ethics granted to any Director or Executive Officer of the Company, on the Company’s website.
| |
| Item 11. | Executive Compensation |
The information required by Item 402 of Regulation S-K is set forth in the 20132014 Proxy Statement under the heading “Executive and Director Compensation,” which information is incorporated herein by reference. The information required by Items 407(e)(4) and 407(e)(5) of Regulation S-K is set forth in the 20132014 Proxy Statement under the headings “Compensation Committee Interlocks and Insider Participation” and “Compensation Committee Report,” respectively, which information is incorporated herein by reference.
| |
| Item 12. | Security Ownership of Certain Beneficial Owners and Management and Related Stockholder Matters |
The information required by this item is set forth in the 20132014 Proxy Statement under the headings “Security Ownership of Certain Beneficial Owners” and “Equity Compensation Plan Information,” which information is incorporated herein by reference.
| |
| Item 13. | Certain Relationships and Related Transactions, and Director Independence |
The information required by this item is set forth in the 20132014 Proxy Statement under the headings “Related Party Transactions” and “Director Independence,” which information is incorporated herein by reference.
| |
| Item 14. | Principal Accounting Fees and Services |
The information required by this item is set forth in the 20132014 Proxy Statement under the heading “Principal Accounting Fees and Services,” which information is incorporated herein by reference.
PART IV
| |
| Item 15. | Exhibits and Financial Statement Schedules |
(a) The following documents are filed as part of this 20122013 Annual Report on Form 10-K:
1. Financial Statements. The following consolidated financial statements of the Company and its subsidiaries and the reports of the Company’s independent registered public accounting firm are incorporated by reference in Item 8:
Management’s Report on Internal Control over Financial Reporting
Reports of Independent Registered Public Accounting Firm
Consolidated Balance Sheets at December 31, 20122013 and 20112012
Consolidated Statements of Income for the years endedYears Ended December 31, 2013, 2012 2011 and 20102011
Consolidated Statements of Comprehensive Income for the years endedYears Ended December 31, 2013, 2012 2011 and 2010
Consolidated Statements of Equity for the years ended December 31, 2012, 2011 and 2010
Consolidated Statements of Cash Flows for the years endedYears Ended December 31, 2013, 2012 2011 and 20102011
Consolidated Statements of Equity for the Years Ended December 31, 2013, 2012 and 2011
Notes to Consolidated Financial Statements
2. Financial Statement Schedules. The following additional information should be read in conjunction with the consolidated financial statements:
Schedule II Valuation and Qualifying Accounts for the years endedYears Ended December 31, 2013, 2012 2011 and 20102011
All other financial statement schedules have been omitted since they are either not required, not applicable, or the information is otherwise included.
3. Exhibits. See the Index to Exhibits at page E-1 of this Annual Report on Form 10-K.
SIGNATURES
Pursuant to the requirements of Section 13 or 15(d) of the Securities Exchange Act of 1934, the Registrant has duly caused this report to be signed on its behalf by the undersigned, thereunto duly authorized.
|
| | |
CHART INDUSTRIES, INC. |
| | | |
| By: | | /S/ SAMUEL F. THOMAS |
| | | Samuel F. Thomas Chairman, Chief Executive Officer and President |
Date: February 28, 201325, 2014
Pursuant to the requirements of the Securities Exchange Act of 1934, this report has been signed below by the following persons on behalf of the Registrant and in the capacities and on the dates indicated.
|
| | |
| Signature and Title | | |
| | | |
/S/ SAMUEL F. THOMAS | | Chairman, Chief Executive Officer, President and a Director |
| Samuel F. Thomas | |
| | | |
/S/ MICHAEL F. BIEHL | | Executive Vice President, Chief Financial Officer and Treasurer (Principal Financial Officer) |
| Michael F. Biehl | |
| | | |
/S/ KENNETH J. WEBSTER | | Vice President, Chief Accounting Officer and Controller (Principal Accounting Officer) |
| Kenneth J. Webster | |
| | | |
/S/ W. DOUGLAS BROWN | | Director |
| W. Douglas Brown | |
| | | |
/S/ RICHARD E. GOODRICH | | Director |
| Richard E. Goodrich | |
| | | |
/S/ STEVEN W. KRABLIN | | Director |
| Steven W. Krablin | |
| | | |
/S/ MICHAEL W. PRESS | | Director |
| Michael W. Press | |
| | | |
/S/ JAMES M. TIDWELL | | Director |
James M. Tidwell | |
| | |
/S/ THOMAS L. WILLIAMS
| | Director |
| Thomas L. Williams | |
Date: February 28, 201325, 2014
INDEX TO FINANCIAL STATEMENTS
|
| | |
| Audited Consolidated Financial Statements: | | |
| | | |
| | |
| | | |
| | |
| | | |
| | |
| | | |
| | |
| | | |
| | F-6 |
| | |
| | F-7 |
| | | |
| | |
| | |
| | |
| | | |
| | |
MANAGEMENT’S REPORT ON INTERNAL CONTROL OVER
FINANCIAL REPORTING
Management of Chart Industries, Inc. and its subsidiaries (the Company) are“Company”) is responsible for establishing and maintaining adequate internal control over financial reporting. The Company’s internal control over financial reporting is a process designed under the supervision of the Company’s principal executive and financial officers to provide reasonable assurance regarding the reliability of financial reporting and the preparation of the Company’s financial statements for external reporting purposes in accordance with U.S. generally accepted accounting principles.
The Company’s internal control over financial reporting includes policies and procedures that:
Pertain to the maintenance of records that, in reasonable detail, accurately and fairly reflect transactions and dispositions of assets of the Company;
Provide reasonable assurance that transactions are recorded as necessary to permit preparation of financial statements in accordance with U.S. generally accepted accounting principles, and that receipts and expenditures of the Company are being made only in accordance with authorizations of management and the directors of the Company; and
Provide reasonable assurance regarding prevention or timely detection of unauthorized acquisition, use or disposition of the Company’s assets that could have a material effect on the Company’s financial statements.
Because of its inherent limitations, internal control over financial reporting may not prevent or detect misstatements. Also, projections of any evaluation of effectiveness to future periods are subject to the risk that controls may become inadequate because of changes in conditions, or that the degree of compliance with the policies and procedures may deteriorate.
Management has assessed the effectiveness of its internal control over financial reporting as of December 31, 20122013 based on the framework established in Internal Control — Integrated Framework issued by the Committee of Sponsoring Organizations of the Treadway Commission (COSO)(1992 Framework) (“COSO”). Management did not include an evaluation of the internal control over financial reporting of AirSep Corporation, which constituted $246.8 million and $181.5 million of total and net assets, respectively, as of December 31, 2012, and$40.3 million and $3.9 millionof revenues and net loss, respectively, for the year then ended.
Based on this assessment, management has determined that the Company’s internal control over financial reporting is effective as of December 31, 20122013.
The effectiveness of the Company’s internal control over financial reporting as of December 31, 20122013 has been audited by Ernst & Young LLP, an independent registered public accounting firm, as stated in their report appearing below, which expresses an unqualified opinion on the effectiveness of the Company’s internal control over financial reporting as of December 31, 20122013.
|
| | |
/S/ SAMUEL F. THOMAS | | /S/ MICHAEL F. BIEHL |
| Samuel F. Thomas | | Michael F. Biehl |
| Chairman, Chief Executive Officer and President | | Executive Vice President, Chief Financial Officer and Treasurer |
REPORT OF INDEPENDENT REGISTERED PUBLIC ACCOUNTING FIRM
To the Board of Directors and Shareholders of Chart Industries, Inc. and Subsidiaries
We have audited the accompanying consolidated balance sheets of Chart Industries, Inc. and Subsidiaries as of December 31, 20122013 and 2011,2012, and the related consolidated statements of income, comprehensive income, equity and cash flows for each of the three years in the period ended December 31, 2012.2013. Our audits also included the financial statement schedule listed in the index at Item 15(a) 2. These financial statements and schedule are the responsibility of the Company's management. Our responsibility is to express an opinion on these financial statements and schedule based on our audits.
We conducted our audits in accordance with the standards of the Public Company Accounting Oversight Board (United States). Those standards require that we plan and perform the audit to obtain reasonable assurance about whether the financial statements are free of material misstatement. An audit includes examining, on a test basis, evidence supporting the amounts and disclosures in the financial statements. An audit also includes assessing the accounting principles used and significant estimates made by management, as well as evaluating the overall financial statement presentation. We believe that our audits provide a reasonable basis for our opinion.
In our opinion, the financial statements referred to above present fairly, in all material respects, the consolidated financial position of Chart Industries, Inc. and Subsidiaries at December 31, 20122013 and 2011,2012, and the consolidated results of their operations and their cash flows for each of the three years in the period ended December 31, 2012,2013, in conformity with U.S. generally accepted accounting principles. Also, in our opinion, the related financial statement schedule, when considered in relation to the basic financial statements taken as a whole, presents fairly in all material respects the information set forth therein.
We also have audited, in accordance with the standards of the Public Company Accounting Oversight Board (United States), Chart Industries, Inc. and Subsidiaries' internal control over financial reporting as of December 31, 2012,2013, based on criteria established in Internal Control-Integrated Framework issued by the Committee of Sponsoring Organizations of the Treadway Commission (1992 Framework) and our report dated February 28, 201325, 2014 expressed an unqualified opinion thereon.
Cleveland, Ohio
February 28, 201325, 2014
REPORT OF INDEPENDENT REGISTERED PUBLIC ACCOUNTING FIRM
To the Board of Directors and Shareholders of Chart Industries, Inc. and Subsidiaries
We have audited Chart Industries, Inc. and Subsidiaries' internal control over financial reporting as of December 31, 20122013, based on criteria established in Internal Control - Integrated Framework issued by the Committee of Sponsoring Organizations of the Treadway Commission (1992 Framework) (the COSO criteria). Chart Industries, Inc. and Subsidiaries' management is responsible for maintaining effective internal control over financial reporting, and for its assessment of the effectiveness of internal control over financial reporting included in the accompanying Management's Report on Internal Control Over Financial Reporting. Our responsibility is to express an opinion on the company's internal control over financial reporting based on our audit.
We conducted our audit in accordance with the standards of the Public Company Accounting Oversight Board (United States). Those standards require that we plan and perform the audit to obtain reasonable assurance about whether effective internal control over financial reporting was maintained in all material respects. Our audit included obtaining an understanding of internal control over financial reporting, assessing the risk that a material weakness exists, testing and evaluating the design and operating effectiveness of internal control based on the assessed risk, and performing such other procedures as we considered necessary in the circumstances. We believe that our audit provides a reasonable basis for our opinion.
A company's internal control over financial reporting is a process designed to provide reasonable assurance regarding the reliability of financial reporting and the preparation of financial statements for external purposes in accordance with generally accepted accounting principles. A company's internal control over financial reporting includes those policies and procedures that (1) pertain to the maintenance of records that, in reasonable detail, accurately and fairly reflect the transactions and dispositions of the assets of the company; (2) provide reasonable assurance that transactions are recorded as necessary to permit preparation of financial statements in accordance with generally accepted accounting principles, and that receipts and expenditures of the company are being made only in accordance with authorizations of management and directors of the company; and (3) provide reasonable assurance regarding prevention or timely detection of unauthorized acquisition, use, or disposition of the company's assets that could have a material effect on the financial statements.
Because of its inherent limitations, internal control over financial reporting may not prevent or detect misstatements. Also, projections of any evaluation of effectiveness to future periods are subject to the risk that controls may become inadequate because of changes in conditions, or that the degree of compliance with the policies or procedures may deteriorate.
As indicated in the accompanying Management's Report on Internal Control Over Financial Reporting, management's assessment of and conclusion on the effectiveness of internal control over financial reporting did not include the internal controls of AirSep Corporation, which is included in the December 31, 2012 consolidated financial statements of Chart Industries, Inc. and Subsidiaries and constituted $246.8 million and $181.5 million of total and net assets, respectively, as of December 31, 2012, and$40.3 million and $3.9 millionof revenues and net loss, respectively, for the year then ended. Our audit of internal control over financial reporting ofChart Industries, Inc. and Subsidiaries also did not include an evaluation of the internal control over financial reporting of AirSep Corporation.
In our opinion, Chart Industries, Inc. and Subsidiaries maintained, in all material respects, effective internal control over financial reporting as of December 31, 2012,2013, based on the COSO criteria.
We also have audited, in accordance with the standards of the Public Company Accounting Oversight Board (United States), the consolidated balance sheets of Chart Industries, Inc. and Subsidiaries as of December 31, 20122013 and 2011,2012, and the related consolidated statements of income, comprehensive income, equity and cash flows for each of the three years in the period ended December 31, 20122013, and our report dated February 28, 201325, 2014 expressed an unqualified opinion thereon.
Cleveland, Ohio
February 28, 201325, 2014
CHART INDUSTRIES, INC. AND SUBSIDIARIES
CONSOLIDATED BALANCE SHEETS
| | | | December 31, | December 31, |
| | 2012 | | 2011 | 2013 | | 2012 |
| | (Dollars in thousands, except per share amounts) | (Dollars in thousands, except per share amounts) |
| ASSETS | | | | | | |
| Current Assets | | | | | | |
| Cash and cash equivalents | $ | 141,498 |
| | $ | 256,861 |
| $ | 137,345 |
| | $ | 141,498 |
|
| Accounts receivable, net | 150,296 |
| | 131,904 |
| |
| Accounts receivable, less allowances of $5,654 and $4,080 | | 224,114 |
| | 150,296 |
|
| Inventories, net | 196,501 |
| | 149,822 |
| 213,004 |
| | 196,501 |
|
| Unbilled contract revenue | 25,302 |
| | 25,247 |
| 31,976 |
| | 25,302 |
|
| Prepaid expenses | 11,560 |
| | 7,088 |
| 12,257 |
| | 11,560 |
|
| Deferred income taxes | 15,282 |
| | 14,004 |
| 14,675 |
| | 15,282 |
|
| Other current assets | 15,985 |
| | 12,703 |
| 16,072 |
| | 15,985 |
|
| Total Current Assets | 556,424 |
| | 597,629 |
| 649,443 |
| | 556,424 |
|
| Property, plant and equipment, net | 169,776 |
| | 137,301 |
| 224,205 |
| | 169,776 |
|
| Goodwill | 398,941 |
| | 288,770 |
| 398,905 |
| | 398,941 |
|
| Identifiable intangible assets, net | 189,463 |
| | 140,553 |
| 172,142 |
| | 189,463 |
|
| Other assets | 13,237 |
| | 10,222 |
| 16,935 |
| | 13,237 |
|
| TOTAL ASSETS | $ | 1,327,841 |
| | $ | 1,174,475 |
| $ | 1,461,630 |
| | $ | 1,327,841 |
|
| LIABILITIES AND EQUITY | | | | | | |
| Current Liabilities | | | | | | |
| Accounts payable | $ | 100,528 |
| | $ | 84,297 |
| $ | 101,805 |
| | $ | 100,528 |
|
| Customer advances and billings in excess of contract revenue | 89,081 |
| | 102,996 |
| 102,048 |
| | 89,081 |
|
| Accrued salaries, wages and benefits | 30,815 |
| | 29,108 |
| 39,961 |
| | 30,815 |
|
| Current portion of warranty reserve | 19,131 |
| | 13,181 |
| 19,567 |
| | 19,131 |
|
| Short-term debt | — |
| | 4,758 |
| 3,280 |
| | — |
|
| Current convertible notes | | 193,437 |
| | — |
|
| Current portion of long-term debt | 3,750 |
| | 6,500 |
| 3,750 |
| | 3,750 |
|
| Other current liabilities | 30,470 |
| | 24,653 |
| 35,456 |
| | 30,470 |
|
| Total Current Liabilities | 273,775 |
| | 265,493 |
| 499,304 |
| | 273,775 |
|
| Long-term debt | 252,021 |
| | 223,224 |
| 64,688 |
| | 252,021 |
|
| Long-term deferred tax liabilities | 46,285 |
| | 43,945 |
| 47,716 |
| | 46,285 |
|
| Long-term portion of warranty reserve | 25,355 |
| | — |
| 14,260 |
| | 25,355 |
|
| Accrued pension liabilities | 19,327 |
| | 15,905 |
| 7,719 |
| | 19,327 |
|
| Other long-term liabilities | 11,295 |
| | 12,357 |
| 9,360 |
| | 11,295 |
|
| Total Liabilities | | 643,047 |
| | 628,058 |
|
| | | | | |
| Convertible notes conversion feature | | 56,563 |
| | — |
|
| Equity | | | | | | |
| Common stock, par value $.01 per share — 150,000,000 shares authorized, as of December 31, 2012 and 2011, respectively, 30,041,584 and 29,612,684 shares issued and outstanding at December 31, 2012 and 2011, respectively | 300 |
| | 296 |
| |
| Common stock, par value $.01 per share — 150,000,000 shares authorized, as of December 31, 2013 and 2012, respectively; 30,378,502 and 30,041,584 shares issued and outstanding at December 31, 2013 and 2012, respectively | | 304 |
| | 300 |
|
| Additional paid-in capital | 348,526 |
| | 333,034 |
| 311,972 |
| | 348,526 |
|
| Retained earnings | 346,011 |
| | 274,716 |
| 429,187 |
| | 346,011 |
|
| Accumulated other comprehensive income | 1,641 |
| | 2,993 |
| 13,322 |
| | 1,641 |
|
| Total Chart Industries, Inc. Shareholders’ Equity | 696,478 |
| | 611,039 |
| 754,785 |
| | 696,478 |
|
| Noncontrolling interest | 3,305 |
| | 2,512 |
| |
| Noncontrolling interests | | 7,235 |
| | 3,305 |
|
| Total Equity | 699,783 |
| | 613,551 |
| 762,020 |
| | 699,783 |
|
| TOTAL LIABILITIES AND EQUITY | $ | 1,327,841 |
| | $ | 1,174,475 |
| $ | 1,461,630 |
| | $ | 1,327,841 |
|
The accompanying notes are an integral part of these consolidated financial statements.
CHART INDUSTRIES, INC. AND SUBSIDIARIES
CONSOLIDATED STATEMENTS OF INCOME
| | | | Year Ended December 31, | Year Ended December 31, |
| | 2012 | | 2011 | | 2010 | 2013 | | 2012 | | 2011 |
| | (Dollars and shares in thousands, except per share amounts) | (Dollars and shares in thousands, except per share amounts) |
| Sales | $ | 1,014,152 |
| | $ | 794,585 |
| | $ | 555,455 |
| $ | 1,177,438 |
| | $ | 1,014,152 |
| | $ | 794,585 |
|
| Cost of sales | 708,989 |
| | 549,139 |
| | 390,156 |
| 825,715 |
| | 708,989 |
| | 549,139 |
|
| Gross profit | 305,163 |
| | 245,446 |
| | 165,299 |
| 351,723 |
| | 305,163 |
| | 245,446 |
|
| Selling, general and administrative expenses | 165,488 |
| | 140,535 |
| | 104,973 |
| 196,496 |
| | 165,488 |
| | 140,535 |
|
| Amortization expense | 14,792 |
| | 13,376 |
| | 11,049 |
| 19,230 |
| | 14,792 |
| | 13,376 |
|
| Impairment of intangible assets | 3,070 |
| | — |
| | — |
| — |
| | 3,070 |
| | — |
|
| Loss on disposal of assets | — |
| | 1,541 |
| | 1,773 |
| — |
| | — |
| | 1,541 |
|
| Operating expenses | 183,350 |
| | 155,452 |
| | 117,795 |
| 215,726 |
| | 183,350 |
| | 155,452 |
|
| Operating income | 121,813 |
| | 89,994 |
| | 47,504 |
| 135,997 |
| | 121,813 |
| | 89,994 |
|
| Other expense (income): | | | | | | |
| Other expenses (income): | | | | | | |
| Interest expense, net | 15,679 |
| | 23,371 |
| | 16,196 |
| 16,275 |
| | 15,679 |
| | 23,371 |
|
| Amortization of deferred financing costs | 1,530 |
| | 4,383 |
| | 3,063 |
| |
| Foreign currency loss (gain) | 1,498 |
| | (734 | ) | | 871 |
| |
| Gain on acquisition of business | — |
| | — |
| | (1,124 | ) | |
| Other expense, net | 18,707 |
| | 27,020 |
| | 19,006 |
| |
| Financing costs amortization | | 1,306 |
| | 1,530 |
| | 4,383 |
|
| Foreign currency (gain) loss | | (242 | ) | | 1,498 |
| | (734 | ) |
| Other expenses, net | | 17,339 |
| | 18,707 |
| | 27,020 |
|
| Income before income taxes | 103,106 |
| | 62,974 |
| | 28,498 |
| 118,658 |
| | 103,106 |
| | 62,974 |
|
| Income tax expense (benefit): | | | | | | | | | | |
| Current | 35,300 |
| | 21,221 |
| | 17,338 |
| 32,903 |
| | 35,300 |
| | 21,221 |
|
| Deferred | (4,518 | ) | | (2,491 | ) | | (9,345 | ) | (1,607 | ) | | (4,518 | ) | | (2,491 | ) |
| Income tax expense, net | 30,782 |
| | 18,730 |
| | 7,993 |
| 31,296 |
| | 30,782 |
| | 18,730 |
|
| Net income | 72,324 |
| | 44,244 |
| | 20,505 |
| 87,362 |
| | 72,324 |
| | 44,244 |
|
| Noncontrolling interest, net of taxes | 1,029 |
| | 168 |
| | 345 |
| |
| Noncontrolling interests, net of taxes | | 4,186 |
| | 1,029 |
| | 168 |
|
| Net income attributable to Chart Industries, Inc. | $ | 71,295 |
| | $ | 44,076 |
| | $ | 20,160 |
| $ | 83,176 |
| | $ | 71,295 |
| | $ | 44,076 |
|
| Net income attributable to Chart Industries, Inc. per common share: | | | | | | | | | | |
| Basic | $ | 2.39 |
| | $ | 1.51 |
| | $ | 0.71 |
| $ | 2.75 |
| | $ | 2.39 |
| | $ | 1.51 |
|
| Diluted | $ | 2.36 |
| | $ | 1.47 |
| | $ | 0.69 |
| $ | 2.60 |
| | $ | 2.36 |
| | $ | 1.47 |
|
| Weighted-average number of common shares outstanding: | | | | | | | | | | |
| Basic | 29,786 |
| | 29,165 |
| | 28,534 |
| 30,209 |
| | 29,786 |
| | 29,165 |
|
| Diluted | 30,194 |
| | 29,913 |
| | 29,255 |
| 31,931 |
| | 30,194 |
| | 29,913 |
|
The accompanying notes are an integral part of these consolidated financial statements.
CHART INDUSTRIES, INC. AND SUBSIDIARIES
CONSOLIDATED STATEMENTS OF COMPREHENSIVE INCOME
| | | | Year Ended December 31, | Year Ended December 31, |
| | 2012 | | 2011 | | 2010 | 2013 | | 2012 | | 2011 |
| | (Dollars in thousands) | (Dollars in thousands) |
| Net income | $ | 72,324 |
| | $ | 44,244 |
| | $ | 20,505 |
| $ | 87,362 |
| | $ | 72,324 |
| | $ | 44,244 |
|
| Other comprehensive income (loss): | | | | | | | | | | |
| Foreign currency translation adjustments | 1,575 |
| | (2,169 | ) | | (2,573 | ) | 4,362 |
| | 1,575 |
| | (2,169 | ) |
| Defined benefit pension plan: | | | | | | | | | | |
| Actuarial loss on remeasurement | (5,597 | ) | | (7,513 | ) | | (1,280 | ) | |
| Less: amortization of prior service cost included in net periodic pension cost | 974 |
| | 365 |
| | 270 |
| |
| Actuarial gain (loss) on remeasurement | | 10,380 |
| | (5,597 | ) | | (7,513 | ) |
| Amortization of prior service cost included in net periodic pension cost | | 1,348 |
| | 974 |
| | 365 |
|
| Defined benefit pension plan | (4,623 | ) | | (7,148 | ) | | (1,010 | ) | 11,728 |
| | (4,623 | ) | | (7,148 | ) |
| Other comprehensive loss, before tax | (3,048 | ) | | (9,317 | ) | | (3,583 | ) | |
| Income tax benefit related to defined benefit pension plan | 1,699 |
| | 2,633 |
| | 470 |
| |
| Other comprehensive loss, net of taxes | (1,349 | ) | | (6,684 | ) | | (3,113 | ) | |
| Other comprehensive income (loss), before tax | | 16,090 |
| | (3,048 | ) | | (9,317 | ) |
| Income tax (expense) benefit related to defined benefit pension plan | | (4,265 | ) | | 1,699 |
| | 2,633 |
|
| Other comprehensive income (loss), net of taxes | | 11,825 |
| | (1,349 | ) | | (6,684 | ) |
| Comprehensive income | 70,975 |
| | 37,560 |
| | 17,392 |
| 99,187 |
| | 70,975 |
| | 37,560 |
|
| Less: comprehensive income attributable to noncontrolling interest, net of taxes | (1,032 | ) | | (302 | ) | | (525 | ) | |
| Less: comprehensive income attributable to noncontrolling interests, net of taxes | | (4,330 | ) | | (1,032 | ) | | (302 | ) |
| Comprehensive income attributable to Chart Industries, Inc. | $ | 69,943 |
| | $ | 37,258 |
| | $ | 16,867 |
| $ | 94,857 |
| | $ | 69,943 |
| | $ | 37,258 |
|
The accompanying notes are an integral part of these consolidated financial statements.
CHART INDUSTRIES, INC. AND SUBSIDIARIES
CONSOLIDATED STATEMENTS OF EQUITYCASH FLOWS
|
| | | | | | | | | | | | | | | | | | | | | | | | | | |
| | Common Stock | | Additional Paid-in Capital | | | | Accumulated Other Comprehensive
Income (Loss) | | Non-controlling Interest | | |
| | Shares Outstanding | | Amount | | | Retained Earnings | | | | Total Equity |
| | (Dollars and shares in thousands) |
| Balance at January 1, 2010 | 28,482 |
| | $ | 285 |
| | $ | 251,692 |
| | $ | 210,480 |
| | $ | 13,104 |
| | $ | 1,685 |
| | $ | 477,246 |
|
| Net income | — |
| | — |
| | — |
| | 20,160 |
| | — |
| | 345 |
| | 20,505 |
|
| Other comprehensive (loss) income | — |
| | — |
| | — |
| | — |
| | (3,293 | ) | | 180 |
| | (3,113 | ) |
| Share-based compensation expense | — |
| | — |
| | 4,933 |
| | — |
| | — |
| | — |
| | 4,933 |
|
| Common stock issued from share-based compensation plans | 350 |
| | 1 |
| | 1,062 |
| | — |
| | — |
| | — |
| | 1,063 |
|
| Tax benefit from exercise of stock options | — |
| | — |
| | 796 |
| | — |
| | — |
| | — |
| | 796 |
|
| Other | — |
| | 2 |
| | (58 | ) | | — |
| | — |
| | — |
| | (56 | ) |
| Balance at December 31, 2010 | 28,832 |
| | 288 |
| | 258,425 |
| | 230,640 |
| | 9,811 |
| | 2,210 |
| | 501,374 |
|
| Net income | — |
| | — |
| | — |
| | 44,076 |
| | — |
| | 168 |
| | 44,244 |
|
| Other comprehensive (loss) income | — |
| | — |
| | — |
| | — |
| | (6,818 | ) | | 134 |
| | (6,684 | ) |
| Equity component of convertible notes issuance, net of deferred financing fees and deferred taxes | — |
| | — |
| | 48,521 |
| | — |
| | — |
| | — |
| | 48,521 |
|
| Proceeds from issuance of warrants | — |
| | — |
| | 48,848 |
| | — |
| | — |
| | — |
| | 48,848 |
|
| Purchase of call options net of deferred taxes | — |
| | — |
| | (41,993 | ) | | — |
| | — |
| | — |
| | (41,993 | ) |
| Share-based compensation expense | — |
| | — |
| | 5,433 |
| | — |
| | — |
| | — |
| | 5,433 |
|
| Common stock issued from share-based compensation plans | 814 |
| | 8 |
| | 7,019 |
| | — |
| | — |
| | — |
| | 7,027 |
|
| Tax benefit from exercise of stock options | — |
| | — |
| | 7,879 |
| | — |
| | — |
| | — |
| | 7,879 |
|
| Common stock repurchases | (33 | ) | | — |
| | (1,099 | ) | | — |
| | — |
| | — |
| | (1,099 | ) |
| Other | — |
| | — |
| | 1 |
| | — |
| | — |
| | — |
| | 1 |
|
| Balance at December 31, 2011 | 29,613 |
| | 296 |
| | 333,034 |
| | 274,716 |
| | 2,993 |
| | 2,512 |
| | 613,551 |
|
| Net income | — |
| | — |
| | — |
| | 71,295 |
| | — |
| | 1,029 |
| | 72,324 |
|
| Other comprehensive (loss) income | — |
| | — |
| | — |
| | — |
| | (1,352 | ) | | 3 |
| | (1,349 | ) |
| Share-based compensation expense | — |
| | — |
| | 7,461 |
| | — |
| | — |
| | — |
| | 7,461 |
|
| Common stock issued from share-based compensation plans | 499 |
| | 5 |
| | 3,515 |
| | — |
| | — |
| | — |
| | 3,520 |
|
| Tax benefit from exercise of stock options | — |
| | — |
| | 8,972 |
| | — |
| | — |
| | — |
| | 8,972 |
|
| Common stock repurchases | (70 | ) | | (1 | ) | | (4,484 | ) | | — |
| | — |
| | — |
| | (4,485 | ) |
| Other | — |
| | — |
| | 28 |
| | — |
| | — |
| | (239 | ) | | (211 | ) |
| Balance at December 31, 2012 | 30,042 |
| | $ | 300 |
| | $ | 348,526 |
| | $ | 346,011 |
| | $ | 1,641 |
| | $ | 3,305 |
| | $ | 699,783 |
|
|
| | | | | | | | | | | |
| | Year Ended December 31, |
| | 2013 | | 2012 | | 2011 |
| | (Dollars in thousands) |
| OPERATING ACTIVITIES | | | | | |
| Net income | $ | 87,362 |
| | $ | 72,324 |
| | $ | 44,244 |
|
| Adjustments to reconcile net income to net cash provided by operating activities: | | | | | |
| Depreciation and amortization | 40,389 |
| | 32,196 |
| | 27,915 |
|
| Interest accretion of convertible notes discount | 9,854 |
| | 9,109 |
| | 3,589 |
|
| Financing costs amortization | 1,306 |
| | 1,530 |
| | 4,383 |
|
| Call premium related to redemption of long-term debt | — |
| | — |
| | 4,964 |
|
| Employee share-based compensation expense | 9,989 |
| | 7,461 |
| | 5,433 |
|
| Loss on disposal of assets | — |
| | — |
| | 1,541 |
|
| Impairment of intangible assets | — |
| | 3,070 |
| | — |
|
| Unrealized foreign currency transaction (gain) loss | (3,388 | ) | | 96 |
| | (180 | ) |
| Deferred income tax benefit | (1,607 | ) | | (4,518 | ) | | (2,491 | ) |
| Reversal of contingent consideration liability | — |
| | (4,620 | ) | | — |
|
| Other non-cash operating activities | 4,514 |
| | 6,165 |
| | (536 | ) |
| Changes in assets and liabilities, net of acquisitions: | | | | | |
| Accounts receivable | (69,287 | ) | | 3,422 |
| | (34,359 | ) |
| Inventory | (12,679 | ) | | (15,777 | ) | | (31,628 | ) |
| Unbilled contract revenues and other current assets | (10,875 | ) | | (7,465 | ) | | (10,479 | ) |
| Accounts payable and other liabilities | (5,259 | ) | | 2,936 |
| | 18,129 |
|
| Deferred income taxes | (793 | ) | | 663 |
| | 138 |
|
| Customer advances and billings in excess of contract revenue | 10,137 |
| | (18,951 | ) | | 50,995 |
|
| Net Cash Provided By Operating Activities | 59,663 |
| | 87,641 |
| | 81,658 |
|
| INVESTING ACTIVITIES | | | | | |
| Capital expenditures | (72,585 | ) | | (43,685 | ) | | (22,380 | ) |
| Proceeds from sale of assets | 569 |
| | 2,073 |
| | — |
|
| Acquisition of businesses, net of cash acquired | (2,965 | ) | | (182,450 | ) | | (37,680 | ) |
| Other investing activities | — |
| | (285 | ) | | 388 |
|
| Net Cash Used In Investing Activities | (74,981 | ) | | (224,347 | ) | | (59,672 | ) |
| FINANCING ACTIVITIES | | | | | |
| Proceeds from long-term debt | — |
| | 21,375 |
| | — |
|
| Borrowings on revolving credit facilities | 214,623 |
| | 73,012 |
| | 4,758 |
|
| Repayments on revolving credit facilities | (211,403 | ) | | (77,770 | ) | | — |
|
| Principal payments on long-term debt | (3,750 | ) | | (4,438 | ) | | (6,500 | ) |
| Payment of deferred financing costs | — |
| | (1,445 | ) | | (7,277 | ) |
| Retirement of long-term debt, including call premium | — |
| | — |
| | (168,139 | ) |
| Proceeds from issuance of convertible notes | — |
| | — |
| | 250,000 |
|
| Proceeds from issuance of warrants | — |
| | — |
| | 48,848 |
|
| Payment for call options related to convertible notes | — |
| | — |
| | (66,486 | ) |
| Payment of contingent consideration | — |
| | (1,300 | ) | | (1,300 | ) |
| Proceeds from exercise of stock options | 5,335 |
| | 3,519 |
| | 7,027 |
|
| Tax benefit from exercise of stock options | 6,673 |
| | 8,972 |
| | 7,879 |
|
| Common stock repurchases | (2,002 | ) | | (4,484 | ) | | (1,099 | ) |
| Dividend distribution to noncontrolling interest | (1,369 | ) | | — |
| | — |
|
| Net Cash Provided By Financing Activities | 8,107 |
| | 17,441 |
| | 67,711 |
|
| Effect of exchange rate changes on cash | 3,058 |
| | 3,902 |
| | 2,052 |
|
| Net (decrease) increase in cash and cash equivalents | (4,153 | ) | | (115,363 | ) | | 91,749 |
|
| Cash and cash equivalents at beginning of period | 141,498 |
| | 256,861 |
| | 165,112 |
|
| CASH AND CASH EQUIVALENTS AT END OF PERIOD | $ | 137,345 |
| | $ | 141,498 |
| | $ | 256,861 |
|
The accompanying notes are an integral part of these consolidated financial statements.
CHART INDUSTRIES, INC. AND SUBSIDIARIES
CONSOLIDATED STATEMENTS OF CASH FLOWSEQUITY
|
| | | | | | | | | | | |
| | Year Ended December 31, |
| | 2012 | | 2011 | | 2010 |
| | (Dollars in thousands) |
| OPERATING ACTIVITIES | | | | | |
| Net income | $ | 72,324 |
| | $ | 44,244 |
| | $ | 20,505 |
|
| Adjustments to reconcile net income to net cash provided by operating activities: | | | | | |
| Depreciation and amortization | 32,196 |
| | 27,915 |
| | 23,577 |
|
| Interest accretion of convertible notes discount | 9,109 |
| | 3,589 |
| | — |
|
| Financing costs amortization | 1,530 |
| | 4,383 |
| | 3,063 |
|
| Call premium related to redemption of long-term debt | — |
| | 4,964 |
| | — |
|
| Employee share-based compensation expense | 7,461 |
| | 5,433 |
| | 4,933 |
|
| Loss on disposal of assets | — |
| | 1,541 |
| | 1,773 |
|
| Impairment of intangible assets | 3,070 |
| | — |
| | — |
|
| Gain on acquisition of business | — |
| | — |
| | (1,124 | ) |
| Unrealized foreign currency transaction loss (gain) | 96 |
| | (180 | ) | | (341 | ) |
| Deferred income tax benefit | (4,518 | ) | | (2,491 | ) | | (9,345 | ) |
| Reversal of contingent consideration liability | (4,620 | ) | | — |
| | — |
|
| Other non-cash operating activities | 6,165 |
| | (536 | ) | | 3,236 |
|
| Changes in assets and liabilities, net of acquisitions: | | | | | |
| Accounts receivable | 3,422 |
| | (34,359 | ) | | (1,447 | ) |
| Inventory | (15,777 | ) | | (31,628 | ) | | (13,717 | ) |
| Unbilled contract revenues and other current assets | (7,465 | ) | | (10,479 | ) | | (2,554 | ) |
| Accounts payable and other current liabilities | 2,936 |
| | 18,129 |
| | 10,550 |
|
| Deferred income taxes | 663 |
| | 138 |
| | (337 | ) |
| Customer advances and billings in excess of contract revenue | (18,951 | ) | | 50,995 |
| | (198 | ) |
| Net Cash Provided By Operating Activities | 87,641 |
| | 81,658 |
| | 38,574 |
|
| INVESTING ACTIVITIES | | | | | |
| Capital expenditures | (43,685 | ) | | (22,380 | ) | | (16,939 | ) |
| Proceeds from sale of assets | 2,073 |
| | — |
| | 989 |
|
| Acquisition of businesses, net of cash acquired | (182,450 | ) | | (37,680 | ) | | (47,865 | ) |
| Other investing activities | (285 | ) | | 388 |
| | (400 | ) |
| Net Cash Used In Investing Activities | (224,347 | ) | | (59,672 | ) | | (64,215 | ) |
| FINANCING ACTIVITIES | | | | | |
| Proceeds from long-term debt | 21,375 |
| | — |
| | — |
|
| Borrowings on revolving credit facilities | 73,012 |
| | 4,758 |
| | — |
|
| Repayments on revolving credit facilities | (77,770 | ) | | — |
| | — |
|
| Principal payments on long-term debt | (4,438 | ) | | (6,500 | ) | | (18,250 | ) |
| Payment of deferred financing costs | (1,445 | ) | | (7,277 | ) | | (2,857 | ) |
| Retirement of long-term debt, including call premium | — |
| | (168,139 | ) | | — |
|
| Proceeds from issuance of convertible notes | — |
| | 250,000 |
| | — |
|
| Proceeds from issuance of warrants | — |
| | 48,848 |
| | — |
|
| Payment for call options related to convertible notes | — |
| | (66,486 | ) | | — |
|
| Payment of contingent consideration | (1,300 | ) | | (1,300 | ) | | — |
|
| Proceeds from exercise of stock options | 3,519 |
| | 7,027 |
| | 1,063 |
|
| Tax benefit from exercise of stock options | 8,972 |
| | 7,879 |
| | 796 |
|
| Common stock repurchases | (4,484 | ) | | (1,099 | ) | | (54 | ) |
| Net Cash Provided By (Used In) Financing Activities | 17,441 |
| | 67,711 |
| | (19,302 | ) |
| Effect of exchange rate changes on cash | 3,902 |
| | 2,052 |
| | (1,113 | ) |
| Net (decrease) increase in cash and cash equivalents | (115,363 | ) | | 91,749 |
| | (46,056 | ) |
| Cash and cash equivalents at beginning of period | 256,861 |
| | 165,112 |
| | 211,168 |
|
| CASH AND CASH EQUIVALENTS AT END OF PERIOD | $ | 141,498 |
| | $ | 256,861 |
| | $ | 165,112 |
|
|
| | | | | | | | | | | | | | | | | | | | | | | | | | |
| | Common Stock | | Additional Paid-in Capital | | | | Accumulated Other Comprehensive
Income (Loss) | | Non-controlling Interests | | |
| | Shares Outstanding | | Amount | | | Retained Earnings | | | | Total Equity |
| | (Dollars and shares in thousands) |
| Balance at January 1, 2011 | 28,832 |
| | $ | 288 |
| | $ | 258,425 |
| | $ | 230,640 |
| | $ | 9,811 |
| | $ | 2,210 |
| | $ | 501,374 |
|
| Net income | — |
| | — |
| | — |
| | 44,076 |
| | — |
| | 168 |
| | 44,244 |
|
| Other comprehensive (loss) income | — |
| | — |
| | — |
| | — |
| | (6,818 | ) | | 134 |
| | (6,684 | ) |
| Equity component of convertible notes issuance, net of deferred financing fees and deferred taxes | — |
| | — |
| | 48,521 |
| | — |
| | — |
| | — |
| | 48,521 |
|
| Proceeds from issuance of warrants | — |
| | — |
| | 48,848 |
| | — |
| | — |
| | — |
| | 48,848 |
|
| Purchase of call options net of deferred taxes | — |
| | — |
| | (41,993 | ) | | — |
| | — |
| | — |
| | (41,993 | ) |
| Share-based compensation expense | — |
| | — |
| | 5,433 |
| | — |
| | — |
| | — |
| | 5,433 |
|
| Common stock issued from share-based compensation plans | 814 |
| | 8 |
| | 7,019 |
| | — |
| | — |
| | — |
| | 7,027 |
|
| Tax benefit from exercise of stock options | — |
| | — |
| | 7,879 |
| | — |
| | — |
| | — |
| | 7,879 |
|
| Common stock repurchases | (33 | ) | | — |
| | (1,099 | ) | | — |
| | — |
| | — |
| | (1,099 | ) |
| Other | — |
| | — |
| | 1 |
| | — |
| | — |
| | — |
| | 1 |
|
| Balance at December 31, 2011 | 29,613 |
| | 296 |
| | 333,034 |
| | 274,716 |
| | 2,993 |
| | 2,512 |
| | 613,551 |
|
| Net income | — |
| | — |
| | — |
| | 71,295 |
| | — |
| | 1,029 |
| | 72,324 |
|
| Other comprehensive (loss) income | — |
| | — |
| | — |
| | — |
| | (1,352 | ) | | 3 |
| | (1,349 | ) |
| Share-based compensation expense | — |
| | — |
| | 7,461 |
| | — |
| | — |
| | — |
| | 7,461 |
|
| Common stock issued from share-based compensation plans | 499 |
| | 5 |
| | 3,515 |
| | — |
| | — |
| | — |
| | 3,520 |
|
| Tax benefit from exercise of stock options | — |
| | — |
| | 8,972 |
| | — |
| | — |
| | — |
| | 8,972 |
|
| Common stock repurchases | (70 | ) | | (1 | ) | | (4,484 | ) | | — |
| | — |
| | — |
| | (4,485 | ) |
| Other | — |
| | — |
| | 28 |
| | — |
| | — |
| | (239 | ) | | (211 | ) |
| Balance at December 31, 2012 | 30,042 |
| | 300 |
| | 348,526 |
| | 346,011 |
| | 1,641 |
| | 3,305 |
| | 699,783 |
|
| Net income | — |
| | — |
| | — |
| | 83,176 |
| | — |
| | 4,186 |
| | 87,362 |
|
| Other comprehensive income (loss) | — |
| | — |
| | — |
| | — |
| | 11,681 |
| | 144 |
| | 11,825 |
|
| Share-based compensation expense | — |
| | — |
| | 9,989 |
| | — |
| | — |
| | — |
| | 9,989 |
|
| Common stock issued from share-based compensation plans | 367 |
| | 4 |
| | 5,335 |
| | — |
| | — |
| | — |
| | 5,339 |
|
| Tax benefit from exercise of stock options | — |
| | — |
| | 6,673 |
| | — |
| | — |
| | — |
| | 6,673 |
|
| Common stock repurchases | (30 | ) | | — |
| | (2,002 | ) | | — |
| | — |
| | — |
| | (2,002 | ) |
| Convertible notes conversion feature | — |
| | — |
| | (56,563 | ) | | — |
| | — |
| | — |
| | (56,563 | ) |
| Acquisition of business, noncontrolling interest | — |
| | — |
| | — |
| | — |
| | — |
| | 969 |
| | 969 |
|
| Dividend distribution to noncontrolling interest | — |
| | — |
| | — |
| | — |
| | — |
| | (1,369 | ) | | (1,369 | ) |
| Other | — |
| | — |
| | 14 |
| | — |
| | — |
| | — |
| | 14 |
|
| Balance at December 31, 2013 | 30,379 |
| | $ | 304 |
| | $ | 311,972 |
| | $ | 429,187 |
| | $ | 13,322 |
| | $ | 7,235 |
| | $ | 762,020 |
|
The accompanying notes are an integral part of these consolidated financial statements.
CHART INDUSTRIES, INC. AND SUBSIDIARIES
NOTES TO CONSOLIDATED FINANCIAL STATEMENTS
(Dollars and shares in thousands, except per share amounts)
NOTE A1 — Nature of Operations and SummaryPrinciples of Significant Accounting PoliciesConsolidation
Nature of Operations: Chart Industries, Inc. and its consolidated subsidiaries (herein referred to as the Company)“Company,” “Chart” or “we”), is a leading global manufacturer of standard and custom-engineered products and systems serving a wide variety of low-temperature and cryogenic applications. The Company has developed an expertise in medical respiratory equipment and cryogenic systems and equipment, which operate at low temperatures sometimes approaching absolute zero. The majority of the Company’s products, including vacuum insulated containment vessels, heat exchangers, cold boxes and other cryogenic components, are used throughout the liquid-gas supply chain for the purification, liquefaction, distribution, storage and end-use of industrial gases and hydrocarbons. The Company has domestic operations located across the United States, including the principal executive offices located in Ohio, and an international presence in Asia, Australia and Europe.
Principles of Consolidation: The consolidated financial statements include the accounts of the Company and its subsidiaries. Intercompany accounts and transactions are eliminated in consolidation. Investments in affiliates where the Company’s ownership is between 20 percent and 50 percent, or where the Company does not have control but has the ability to exercise significant influence over operations or financial policy, are accounted for under the equity method.
NOTE 2 — Significant Accounting Policies
Use of Estimates: The preparation of financial statements in conformity with U.S. generally accepted accounting principles requires management to make estimates and assumptions that affect the reported amounts of assets and liabilities and the disclosure of contingent assets and liabilities at the date of the financial statements. They may also affect the reported amounts of revenues and expenses during the reporting period. Actual results could differ from those estimates and assumption.
Reclassifications: Certain reclassifications have been made to the 2011 consolidated balance sheet, 2011 consolidated statement of equity and the 2011 and 2010 consolidated statements of cash flows in order to conform to the 2012 presentation.assumptions.
Cash and Cash Equivalents: The Company considers all investments with an initial maturity of three months or less when purchased to be cash equivalents.
ConcentrationsAccounts Receivable, Net of Credit Risks: The Company sells its products to gas producers, distributors and end-users across the industrial gas, hydrocarbon, chemical processing and medical industries in countries all over the world. Approximately 56%, 58% and 57% of sales were to foreign countries in 2012, 2011 and 2010, respectively. No single customer exceeded ten percent of consolidated sales in 2012, 2011 and 2010. Sales to the Company’s top ten customers accounted for 38%, 36% and 38% of consolidated sales in 2012, 2011 and 2010, respectively. The Company’s sales to particular customers fluctuate from period to period, but the large gas producer and distributor customers of the Company tend to be a consistently large source of revenue for the Company. To minimize credit risk from trade receivables, the Company reviews the financial condition of potential customers in relation to established credit requirements before sales credit is extended and monitors the financial condition of customers to help ensure timely collections and to minimize losses. Additionally, for certain domestic and foreign customers, particularly in the Energy and Chemicals (E&C) segment, the Company requires advance payments, letters of credit and other such guarantees of payment. Certain customers also require the Company to issue letters of credit or performance bonds, particularly in instances where advance payments are involved, as a condition of placing the order.
The Company is also subject to concentrations of credit risk with respect to its cash and cash equivalents and forward foreign currency exchange contracts. To minimize credit risk from these financial instruments, the Company enters into arrangements with major banks and other quality financial institutions and invests only in high-quality instruments. The Company does not expect any counterparties to fail to meet their obligations in this area.
Allowance for Doubtful Accounts:Allowances: The Company evaluates the collectibility of accounts receivable based on a combination of factors. In circumstances where the Company is aware of a specific customer’s inability to meet its financial obligations (e.g., bankruptcy filings, or substantial downgrading of credit scores), a specific reserve is recorded to reduce the receivable to the amount the Company believes will be collected. The Company also records allowances for doubtful accounts based on the length of time the receivables are past due and historical experience. If circumstances change (e.g., higher than expected defaults or an unexpected material adverse change in a customer’s ability to meet its financial obligations), ourthe Company's estimates of the collectibility of amounts due could be changed by a material amount. The allowance for doubtful accounts balance at December 31, 2012 and 2011 was $4,080 and $2,360, respectively.When collection of a specific amount due is deemed remote, the account is written off against the allowance.
CHART INDUSTRIES, INC. AND SUBSIDIARIES
NOTES TO CONSOLIDATED FINANCIAL STATEMENTS—(Continued)
(Dollars and shares in thousands, except per share amounts)
Inventories: Inventories are stated at the lower of cost or market with cost being determined by the first-in, first-out (FIFO)(“FIFO”) method. The components of inventory are as follows:
|
| | | | | | | |
| | December 31, |
| | 2012 | | 2011 |
| Raw materials and supplies | $ | 85,726 |
| | $ | 64,832 |
|
| Work in process | 40,945 |
| | 36,045 |
|
| Finished goods | 69,830 |
| | 48,945 |
|
| Total inventories, net | $ | 196,501 |
| | $ | 149,822 |
|
The Company determines inventory valuation reserves based on a combination of factors. In circumstances where the Company is aware of a specific problem in the valuation of a certain item, a specific reserve is recorded to reduce the item to its net realizable value. The Company also recognizes reserves based on the actual usage in recent history and projected usage in the near-term. If circumstances change (e.g., lower-than-expected or higher-than-expected usage), estimates of the net realizable value could be changed by a material amount. The allowance for excess and obsolete inventory balance at December 31, 2012 and 2011 was $4,078 and $3,191, respectively.
Property, Plant and Equipment: Capital expenditures for property, plant and equipment are recorded at cost. Expenditures for maintenance and repairs are charged to expense as incurred, whereas major improvements are capitalized. The cost of applicable assets is depreciated over their estimated useful lives. Depreciation is computed using the straight-line method for financial reporting purposes and accelerated methods for income tax purposes. Depreciation expense was
$17,404, $14,539Long-lived Assets: and $12,528 for the years ended December 31, 2012, 2011 and 2010, respectively. The following table summarizes the components of property, plant and equipment:
|
| | | | | | | | | | |
| | | | | December 31, |
| Classification | | Estimated Useful Life | | 2012 | | 2011 |
| Land and buildings | | 20-35 years | | $ | 107,410 |
| | $ | 96,984 |
|
| Machinery and equipment | | 3-12 years | | 96,362 |
| | 79,173 |
|
| Computer equipment, furniture and fixtures | | 3-7 years | | 20,238 |
| | 16,043 |
|
| Construction in process | | | | 25,070 |
| | 8,175 |
|
| | | | | 249,080 |
| | 200,375 |
|
| Less: accumulated depreciation | | | | (79,304 | ) | | (63,074 | ) |
| Total property, plant and equipment, net | | | | $ | 169,776 |
| | $ | 137,301 |
|
The Company monitors its property, plant and equipment, and finite-lived intangible assets for impairment indicators on an ongoing basis. If impairment indicators exist, the Company performs the required analysis and records impairment charges. In conducting its analysis, the Company compares the undiscounted cash flows expected to be generated from the long-lived assets to the related net book values. If the undiscounted cash flows exceed the net book value, the long-lived assets are considered not to be impaired. If the net book value exceeds the undiscounted cash flows, an impairment loss is measured and recognized. An impairment loss is measured as the difference between the net book value and the fair value of the long-lived assets. Fair value is estimated based upon either discounted cash flow analyses or estimated salvage values. Cash flows are estimated using internal forecasts as well as assumptions related to discount rates. Changes in
CHART INDUSTRIES, INC. AND SUBSIDIARIES
NOTES TO CONSOLIDATED FINANCIAL STATEMENTS—(Continued)
(Dollars and shares in thousands, except per share amounts)
economic or operating conditions impacting these estimates and assumptions could result in the impairment of long-lived assets. The Company amortizes intangible assets that have finite lives over their estimated useful lives.
Goodwill and Indefinite-Lived Intangible Assets: Goodwill is recognized as the excess cost of an acquired entity over the net amount assigned to assets acquired and liabilities assumed. The Company does not amortize goodwill or indefinite-lived intangible assets, but reviews them for impairment annually as of October 1 or whenever events or changes in circumstances indicate that an evaluation should be completed. The Company amortizes intangible assets that have finite lives over their estimated useful lives.
With respect to goodwill, the Company assessesmay assess qualitative factors to determine whether it is more likely than not that the fair value of a reporting unit is less than its carrying amount as a basis for determining whether it is necessary to perform the two-step goodwill impairment test. The reporting units are the same as our operating segments, which are also the reportable segments: Energy & Chemicals, Distribution & Storage, and BioMedical. TheAlternatively, the Company may also bypass such a qualitative assessment and proceed directly to the goodwill test utilizing a two-step approach. Under the qualitative assessment, the Company first evaluates relevant events and circumstances, such as macroeconomic conditions and the Company's overall financial performance to determine whether it is
CHART INDUSTRIES, INC. AND SUBSIDIARIES
NOTES TO CONSOLIDATED FINANCIAL STATEMENTS—(Continued)
(Dollars and shares in thousands, except per share amounts)
more likely than not that the fair value of a reporting unit is less than its carrying amount, including goodwill. The Company then evaluates how significant each of the identified factors could be to the fair value or carrying amount of a reporting unit and weighs these factors in totality in forming a conclusion whether it is more likely than not that the fair value of a reporting unit is less than its carrying amount. If the Company determines that it is not more likely than not that the fair value of a reporting unit is less than its carrying amount, the first and second steps of the goodwill impairment test are not necessary. Otherwise, the Company would perform the first step of the two-step goodwill impairment test. As of October 1, 2012 and based on our qualitative assessment, we determined that it was not more likely than not that the fair value is less thanIf the carrying amount of eachthe reporting unit and, therefore,goodwill exceeds its fair value, further analysis is performed to measure the two-step goodwillamount of impairment test was not necessary.loss, if any.
The following table represents the changes in goodwill:
|
| | | | | | | |
| | December 31, |
| | 2012 | | 2011 |
| Beginning balance | $ | 288,770 |
| | $ | 275,252 |
|
| Foreign currency translation adjustments and other | 408 |
| | (1,067 | ) |
| Goodwill acquired during the year | 109,763 |
| | 14,585 |
|
| Ending balance | $ | 398,941 |
| | $ | 288,770 |
|
Similar to the qualitative goodwill impairment testing screen, the Company may first evaluatesevaluate relevant events and circumstances to determine whether it is more likely than not that the fair value of an indefinite-lived intangible asset is less than its carrying amount. Alternatively, the Company also may bypass such a qualitative assessment and proceed directly to the quantitative assessment. If, in weighing all relevant events and circumstances in totality, the Company determines that it is not more likely than not that an indefinite-lived intangible asset is impaired, no further action is necessary. Otherwise, the Company would determine the fair value of indefinite-lived intangible assets and perform a quantitative impairment assessment by comparing anthe indefinite-lived asset's fair value to its carrying amount. AsIf the carrying amount of October 1, 2012,an indefinite-lived intangible asset exceeds its fair value, an impairment loss will be recognized in an amount equal to the excess.
The Company estimates the fair value of its reporting units by using income and based onmarket approaches to develop fair value estimates, which are weighted equally to arrive at a fair value estimate for each reporting unit. With respect to the Company's qualitative assessment, the Company determined that it was not more likely than not thatincome approach, a model has been developed to estimate the fair value of each indefinite-lived intangible asset was less than its carrying amount, therefore, no further action was necessary.
Priorreporting unit. This fair value model incorporates estimates of future cash flows, estimates of allocations of certain assets and cash flows among reporting units, estimates of future growth rates and management’s judgment regarding the applicable discount rates to use to discount those estimated cash flows. With respect to the qualitative assessment, the Company recorded an impairment lossmarket approach, a guideline company method is used selecting companies with similar assets or businesses to estimate fair value of $3,070 during the second quartereach reporting unit. Changes to these judgments and estimates could result in a significantly different estimate of 2012 resulting in the elimination of in-process research & development (IPR&D) indefinite-lived intangible assets related to a prior BioMedical segment acquisition. Higher forecasted costs and project delays represented impairment indicators requiring the Company to re-evaluate the fair value of the IPR&D indefinite-lived intangible assets.reporting units, which could result in a different assessment of the recoverability of goodwill. The Company conducted an impairment test based on the multi-period excess earnings valuation method which determines fair value based on the present value of the prospective net cash flow attributable to the intangible asset (Level 3 in the fair value hierarchy). The Company determined thatestimates the fair value of its indefinite-lived assets using the IPR&D indefinite-lived intangible assets was zero and impairedrelief-from-royalty method within the intangible assets by a value equal to their carrying amount.
The following table displays the gross carrying amount and accumulated amortization for finite-lived intangible assets and indefinite-lived intangible assets (exclusive of goodwill):
|
| | | | | | | | | | | | | | | | | |
| Weighted-average Estimated Useful Life | | December 31, 2012 | | December 31, 2011 |
| | | Gross Carrying Amount | | Accumulated Amortization | | Gross Carrying Amount | | Accumulated Amortization |
| Finite-lived intangible assets: | | | | | | | | | |
| Unpatented technology | 9.0 years | | $ | 45,078 |
| | $ | (11,286 | ) | | $ | 18,113 |
| | $ | (9,024 | ) |
| Patents | 10.0 years | | 9,880 |
| | (6,664 | ) | | 9,080 |
| | (5,434 | ) |
| Product names | 14.0 years | | 9,068 |
| | (2,712 | ) | | 5,638 |
| | (1,818 | ) |
| Customer relations | 13.0 years | | 158,005 |
| | (59,668 | ) | | 130,488 |
| | (48,840 | ) |
| Total finite-lived intangible assets | 12.1 years | | $ | 222,031 |
| | $ | (80,330 | ) | | $ | 163,319 |
| | $ | (65,116 | ) |
| Indefinite-lived intangible assets: | | | | | | | | | |
| Trademarks and trade names | | | $ | 47,762 |
| | | | $ | 39,280 |
| | |
| In-process research and development | | | — |
| | | | 3,070 |
| | |
| Total indefinite-lived intangible assets | | | $ | 47,762 |
| | | | $ | 42,350 |
| | |
CHART INDUSTRIES, INC. AND SUBSIDIARIES
NOTES TO CONSOLIDATED FINANCIAL STATEMENTS—(Continued)
(Dollars and shares in thousands, except per share amounts)
Information regarding intangible assets acquired during 2012 is presented below:
|
| | | | | |
| | Year Ended December 31, 2012 |
| | Weighted-average Estimated Useful Life | | Amount |
| Unpatented technology | 20.0 years | | $ | 26,900 |
|
| Product names | 2.5 years | | 3,400 |
|
| Customer relations | 9.0 years | | 28,100 |
|
| Total finite-lived intangible assets acquired | 13.7 years | | 58,400 |
|
| Indefinite-lived trademarks and trade names | | | 8,600 |
|
| Total intangible assets acquired | | | $ | 67,000 |
|
Amortization expense for intangible assets subject to amortization was $14,792, $13,376 and $11,049 for the years ended December 31, 2012, 2011 and 2010, respectively. The Company estimates amortization expense to be recognized during the next five years as follows: |
| | | |
| For the Year Ending December 31, | |
| 2013 | $ | 19,000 |
|
| 2014 | 17,500 |
|
| 2015 | 15,900 |
|
| 2016 | 14,000 |
|
| 2017 | 13,100 |
|
Financial Instruments: The fair values of cash equivalents, accounts receivable, accounts payable and short term bank debt approximate their carrying amount because of the short maturity of these instruments.
Derivative Instruments: The Company utilizes certain derivative financial instruments to enhance its ability to manage foreign currency risk that exists as part of ongoing business operations. Derivative instruments are entered into for periods consistent with related underlying exposures and do not constitute positions independent of those exposures. The Company does not enter into contracts for speculative purposes, nor is it a party to any leveraged derivative instrument.
The Company is exposed to foreign currency exchange risk as a result of transactions in currencies other than the functional currency of certain subsidiaries. The Company utilizes foreign currency forward purchase and sale contracts to manage the volatility associated with foreign currency purchases and certain intercompany transactions in the normal course of business. Contracts typically have maturities of less than one year. Principal currencies include the euro, the British pound, the Czech koruna, the Japanese yen, and the Chinese yuan. The Company’s foreign currency forward contracts do not qualify as hedges as defined by accounting guidance. Foreign currency forward contracts are measured atincome approach. Under this method, fair value which is based on valuations providedestimated by discounting the transaction counterparties, and recorded on the consolidated balance sheetsroyalty savings as other current liabilities or assets. Changes in their fair value are recorded in the consolidated statements of incomewell as foreign currency gains or losses. The Company's foreign currency forward contracts are not exchange traded instruments and, accordingly, are classified as being valued using Level 2 inputs as defined in Note E. The changes in fair value generated net losses of $780 and $630 for the years ended December 2012, and 2010, respectively, andany tax benefits related to ownership to a net gain of $1,233 for the year ended December 31, 2011.
CHART INDUSTRIES, INC. AND SUBSIDIARIES
NOTES TO CONSOLIDATED FINANCIAL STATEMENTS—(Continued)
(Dollars and shares in thousands, except per share amounts)
Product Warranties: The Company provides product warranties with varying terms and durations for the majority of its products. The Company calculates its warranty reserve by considering historical warranty experience and specifically identified warranty issues. The Company records warranty expense in cost of sales. Product warranty claims not expected to occur within one year are recorded in long-term portion of warranty reserve in the consolidated balance sheets. Actual experience could differ from the amounts estimated requiring adjustments to the liability in future periods. The changes in the Company’s consolidated warranty reserve are as follows (see Note D for further details on the 2012 acquired warranty reserves):
|
| | | | | | | | | | | |
| | Year Ended December 31, |
| | 2012 | | 2011 | | 2010 |
| Beginning balance | $ | 13,181 |
| | $ | 12,101 |
| | $ | 8,764 |
|
| Warranty expense | 12,494 |
| | 7,420 |
| | 5,893 |
|
| Warranty usage | (18,222 | ) | | (8,085 | ) | | (3,827 | ) |
| Acquired warranty reserves | 37,033 |
| | 1,745 |
| | 1,271 |
|
| Ending balance | $ | 44,486 |
| | $ | 13,181 |
| | $ | 12,101 |
|
Convertible Debt: The Company determined that the embedded conversion feature within the Company's 2.0% Convertible Senior Subordinated Notes (Convertible Notes)due 2018 (the “Convertible Notes”) was clearly and closely related to the Company’s common stock and therefore exempt from separate accounting treatment. Convertible Notes exempt from derivative accounting are recognized by bifurcating the principal balance into a liability component and an equity component where the fair value of the liability component is estimated by calculating the present value of its cash flows discounted at an interest rate that the Company would have received for similar debt instruments that have no conversion rights (the “straight-debt rate”), and the equity component is the residual amount, net of tax, which creates a discount on the Convertible Notes. The Company recognizes non-cash interest accretion expense related to the carrying amount of the Convertible Notes which is accreted back to its principal amount over the expected life of the debt, which is also the stated life of the debt.
Accumulated Other Comprehensive Income: Financial Instruments:The componentsfair values of accumulatedcash equivalents, accounts receivable, accounts payable and short-term bank debt approximate their carrying amount because of the short maturity of these instruments.
CHART INDUSTRIES, INC. AND SUBSIDIARIES
NOTES TO CONSOLIDATED FINANCIAL STATEMENTS—(Continued)
(Dollars and shares in thousands, except per share amounts)
To minimize credit risk from trade receivables, the Company reviews the financial condition of potential customers in relation to established credit requirements before sales credit is extended and monitors the financial condition of customers to help ensure timely collections and to minimize losses. Additionally, for certain domestic and foreign customers, particularly in the Energy & Chemicals segment, the Company requires advance payments, letters of credit and other comprehensivesuch guarantees of payment. Certain customers also require the Company to issue letters of credit or performance bonds, particularly in instances where advance payments are involved, as a condition of placing the order.
Derivative Financial Instruments: The Company utilizes certain derivative financial instruments to enhance its ability to manage foreign currency risk that exists as part of ongoing business operations. Derivative instruments are entered into for periods consistent with related underlying exposures and do not constitute positions independent of those exposures. The Company does not enter into contracts for speculative purposes, nor is it a party to any leveraged derivative instrument. The Company is exposed to foreign currency exchange risk as a result of transactions in currencies other than the functional currency of certain subsidiaries. The Company utilizes foreign currency forward purchase and sale contracts to manage the volatility associated with foreign currency purchases and certain intercompany transactions in the normal course of business. Contracts typically have maturities of less than one year. Principal currencies include the U.S. dollar, the euro, the Japanese yen, the Czech koruna, the Australian dollar, the Norwegian krone, the Canadian dollar and the Chinese yuan. The Company’s foreign currency forward contracts do not qualify as hedges as defined by accounting guidance. Foreign currency forward contracts are measured at fair value and recorded on the consolidated balance sheets as other current liabilities or assets. Changes in their fair value are recorded in the consolidated statements of income as foreign currency gains or losses. The Company's foreign currency forward contracts are not exchange traded instruments and, accordingly, the valuation is performed using Level 2 inputs as follows:defined in Note 11. Gains or losses on settled or expired contracts are recorded in the consolidated statements of income as foreign currency gains or losses.
|
| | | | | | | |
| | Year Ended December 31, |
| | 2012 | | 2011 |
| Foreign currency translation adjustments | $ | 14,207 |
| | $ | 12,635 |
|
| Pension liability adjustments, net of taxes | (12,566 | ) | | (9,642 | ) |
| Accumulated other comprehensive income | $ | 1,641 |
| | $ | 2,993 |
|
Revenue Recognition: For the majority of the Company’s products, revenue is recognized when products are shipped, title has transferred and collection is reasonably assured. For these products, there is also persuasive evidence of an arrangement and the selling price to the buyer is fixed or determinable. For brazed aluminum heat exchangers, cold boxes, liquefied natural gas fueling stations, and engineered tanks and commercial oxygen generation systems, the Company primarily uses the percentage of completion method of accounting. Earned revenue is based on the percentage of incurred costs to date compared to total estimated costs at completion after giving effect to the most current estimates. Earned revenue on contracts in process for the years ended December 31, 2012, 2011 and 2010, totaled $218,318, $219,315 and $240,239, respectively. Timing of amounts billed on contracts varies from contract to contract and could cause significant variation in working capital needs. Amounts billed on percentageThe Company reports sales net of completion contracts in process for the years December 31, 2012, 2011 and 2010 totaled $237,119, $265,686 and $239,600, respectively.
tax assessed by qualifying governmental authorities. The cumulative impact of revisions in total cost estimates during the progress of work is reflected in the period in which these changes become known. Earned revenue reflects the original contract price adjusted for agreed upon claims and change orders, if any. Losses expected to be incurred on contracts in process, after consideration of estimated minimum recoveries from claims and change orders, are charged to operations as soon as such losses are known. Pre-contract costs relate primarily to salaries and benefits incurred to support the selling effort and are expensed as incurred. Change orders resulting in additional revenue and profit are recognized upon approval by the customer based on the percentage of incurred costs to date compared to total estimated costs at completion. Certain contracts include incentive-fee arrangements. The incentive fees in
CHART INDUSTRIES, INC. AND SUBSIDIARIES
NOTES TO CONSOLIDATED FINANCIAL STATEMENTS—(Continued)
(Dollars and shares in thousands, except per share amounts)
such contracts can be based on a variety of factors, but the most common are the achievement of target completion dates, target costs, and/or other performance criteria. Incentive-fee revenue is not recognized until it is earned.
The Company reports sales net of tax assessed by qualifying governmental authorities.
Cost of Sales: Manufacturing expenses associated with sales are included in cost of sales. Cost of sales includes all materials, direct and indirect labor, inbound freight, purchasing and receiving, inspection, internal transfers and distribution and warehousing of inventory. In addition, shop supplies, facility maintenance costs, manufacturing engineering, project management and depreciation expense for assets used in the manufacturing process are included in cost of sales on the consolidated statements of income.
Selling, General and Administrative Expenses (SG&A):(“SG&A”) Expenses: SG&A includesexpenses include selling, marketing, customer service, product management, design engineering, and other administrative expenses not directly supporting the manufacturing process as well as depreciation and amortization expense associated with non-manufacturing assets. In addition, SG&A includesexpenses
CHART INDUSTRIES, INC. AND SUBSIDIARIES
NOTES TO CONSOLIDATED FINANCIAL STATEMENTS—(Continued)
(Dollars and shares in thousands, except per share amounts)
include corporate operating expenses for executive management, accounting, tax, treasury, human resources, information technology, legal, internal audit, risk management and share-based compensation expense.
Shipping and Handling Costs: Amounts billed to customers for shipping are classified as sales, and the related costs are classified as cost of sales on the consolidated statements of income. Shipping revenue of $10,11112,213, $8,59510,111 and $6,5378,595 for the years ended December 31, 2013, 2012 2011 and 20102011, respectively, are included in sales. Shipping costs of $13,34415,927, $11,44313,344, and $8,48811,443 for the years ended December 31, 2013, 2012 2011 and 20102011, respectively, are included in cost of sales.
Advertising Costs: The Company incurred advertising costs of $4,8284,515, $4,5484,828 and $3,2684,548 for the years ended December 31, 2013, 2012 2011 and 20102011, respectively. Such costs are expensed as incurred and included in SG&A expenses on the consolidated statements of income.
Research and Development Costs: The Company incurred research and development costs of $14,39814,941, $11,25314,398 and $5,96911,253 for the years ended December 31, 2013, 2012 2011 and 20102011, respectively. Such costs are expensed as incurred and included in SG&A expenses on the consolidated statements of income.
Foreign Currency Translation: The functional currency for the majority of the Company’s foreign operations is the applicable local currency. The translation from the applicable foreign currencies to U.S. dollars is performed for asset and liability accounts using exchange rates in effect at the balance sheet date and for revenue and expense accounts using a weighted-average exchange rate during the period. The resulting translation adjustments are recorded as a component of other comprehensive income (loss) in the consolidated statements of comprehensive income. Gains or losses resulting from foreign currency transactions are charged to operations as incurred.
Income Taxes: The Company and its U.S. subsidiaries file a consolidated federal income tax return. Deferred income taxes are provided for temporary differences between financial reporting and the consolidated tax return in accordance with the liability method. A valuation allowance is provided against net deferred tax assets when conditions indicate that it is more likely than not that the benefit related to such assets will not be realized.
The Company utilizes a two-step approach for the recognition and measurement of uncertain tax positions. The first step is to evaluate the tax position and determine whether it is more likely than not that the position will be sustained upon examination by tax authorities. The second step is to measure the tax benefit as the largest amount that is more likely than not of being realized upon settlement.
Interest and penalties related to income taxes are accounted for as income tax expense on the consolidated statements of income.
Share-based Compensation: The Company measures share-based compensation expense for all share-based payments to employees and directors, including grants of employee stock options, atrestricted stock awards, performance stock units, and leveraged restricted stock units based on the grant-date fair value net of estimated forfeitures. Fair value of stock options is calculated using the Black-Scholes pricing model. Fair value of restricted stock awards is based on the Company's market price on the date of grant. Fair value of performance stock units is based on the Company's market price on the date of grant and pre-determined performance condition targets as determined by the Compensation for share-based awardsCommittee of the Board of Directors. Fair value of leveraged restricted stock units is based on market conditions and calculated using a Monte Carlo simulation model. The grant-date fair value calculation requires the use of variables such as exercise term of the option, future volatility, dividend yield and risk-free interest rate. Share-based compensation expense is recognized on a ratable basis over the requisite service period, which is generally the vesting period. The total cost of a share-based payment award is reduced by estimated forfeitures expected to occur over the vesting period which generally is equivalent to the required service period of the award.
During the year, the Company may repurchase shares of common stock from equity plan participants to satisfy tax withholding obligations relating to the vesting or payment of equity awards. All such repurchased shares are subsequently retired during the period in which they occur. See Note H for further discussions regarding stock options and other share-based awards.
CHART INDUSTRIES, INC. AND SUBSIDIARIES
NOTES TO CONSOLIDATED FINANCIAL STATEMENTS—(Continued)
(Dollars and shares in thousands, except per share amounts)
Earnings Per Share: The following table presents calculations of income per share of common stock:
|
| | | | | | | | | | | |
| | Year Ended December 31, |
| | 2012 | | 2011 | | 2010 |
| Net income attributable to Chart Industries, Inc. | $ | 71,295 |
| | $ | 44,076 |
| | $ | 20,160 |
|
| Net income attributable to Chart Industries, Inc. per common share: | | | | | |
| Basic | $ | 2.39 |
| | $ | 1.51 |
| | $ | 0.71 |
|
| Diluted | $ | 2.36 |
| | $ | 1.47 |
| | $ | 0.69 |
|
| Weighted average number of common shares outstanding — basic | 29,786 |
| | 29,165 |
| | 28,534 |
|
| Incremental shares issuable upon assumed conversion and exercise of stock options | 408 |
| | 748 |
| | 721 |
|
| Weighted average number of common shares outstanding shares — diluted | 30,194 |
| | 29,913 |
| | 29,255 |
|
As of December 31, 2012, certain common shares that may be issuable upon the vesting of share-based awards and potential settlements under convertible note hedge and capped call transactions used to offset the dilutive effect of the Convertible Notes were not included in the computation of diluted earnings per share as they were anti-dilutive. There wereRecently Adopted Accounting Pronouncement: 109, 107 and 362 anti-dilutive shares for the years ended December 31, 2012, 2011 and 2010, respectively.
New Accounting Pronouncement
In July 2012,February 2013, the Financial Accounting Standards Board (FASB)(“FASB”) issued Accounting Standards Update (ASU) 2012-02, "Testing Indefinite-Lived Intangible Assets for Impairment."(“ASU”) 2013-02, “Comprehensive Income – Reporting of Amounts Reclassified Out of Accumulated Other Comprehensive Income.” The amendments in the ASU allow an entityrequire entities to first assess qualitative factors to determine whether it is more likely than not that the fair valueprovide additional disclosures about reclassifications out of an indefinite-lived intangible asset is less than its carrying amount as a basis for determining whether further impairment testing is necessary. If an entity determines that it is not more likely than not that the fair valueaccumulated other comprehensive income. The adoption of an indefinite-lived intangible asset is less than its carrying amount, no further action is necessary. Otherwise, the entity is required to determine the fair value of indefinite-lived intangible assets and perform a quantitative impairment assessment in accordance with Subtopic 350-30. Early adoption is permitted, including for annual and interim impairment tests performed as of a date before September 15, 2012. The Company early adopted the newthis guidance and its adoption did not have a material impact on the financial statements of the Company’s financial position, results of operations or cash flows.Company.
CHART INDUSTRIES, INC. AND SUBSIDIARIES
NOTES TO CONSOLIDATED FINANCIAL STATEMENTS—(Continued)
(Dollars and shares in thousands, except per share amounts)
NOTE B3 — Balance Sheet Components
The following table summarizes the components of other current assets, other assets, other current liabilities and other long-term liabilities on the Company’s consolidated balance sheets as of December 31, 2012 and 2011:sheets:
|
| | | | | | | |
| | December 31, |
| | 2013 | | 2012 |
| Other current assets: | | | |
| Deposits | $ | 255 |
| | $ | 244 |
|
| Assets held for sale | 650 |
| | 650 |
|
| Other receivables | 15,167 |
| | 15,091 |
|
| Other current assets | $ | 16,072 |
| | $ | 15,985 |
|
| Other assets: | | | |
| Deferred financing costs | $ | 5,240 |
| | $ | 6,546 |
|
| Cash value of life insurance | 1,691 |
| | 1,488 |
|
| Other | 10,004 |
| | 5,203 |
|
| Other assets | $ | 16,935 |
| | $ | 13,237 |
|
| Other current liabilities: | | | |
| Accrued interest | $ | 2,120 |
| | $ | 2,170 |
|
| Accrued other taxes | 3,318 |
| | 2,556 |
|
| Accrued income taxes | 4,470 |
| | 2,244 |
|
| Accrued rebates | 8,048 |
| | 7,242 |
|
| Accrued employee separation and plant closure costs | 1,175 |
| | 1,102 |
|
| Accrued other | 16,325 |
| | 15,156 |
|
| Other current liabilities | $ | 35,456 |
| | $ | 30,470 |
|
| Other long-term liabilities: | | | |
| Accrued environmental | $ | 3,871 |
| | $ | 4,586 |
|
Accrued contingent consideration (1) | 1,518 |
| | 1,898 |
|
| Accrued contingencies and other | 3,971 |
| | 4,811 |
|
| Other long-term liabilities | $ | 9,360 |
| | $ | 11,295 |
|
|
| | | | | | | |
| | December 31, |
| | 2012 | | 2011 |
| Other current assets: | | | |
| Deposits | $ | 244 |
| | $ | 338 |
|
| Assets held for sale | 650 |
| | 2,824 |
|
| Income taxes receivable | — |
| | 3,063 |
|
| Other receivables | 15,091 |
| | 6,478 |
|
| Other current assets | $ | 15,985 |
| | $ | 12,703 |
|
| Other assets: | | | |
| Deferred financing costs | $ | 6,546 |
| | $ | 6,631 |
|
| Cash value of life insurance | 1,488 |
| | 1,426 |
|
| Other | 5,203 |
| | 2,165 |
|
| Other assets | $ | 13,237 |
| | $ | 10,222 |
|
| Other current liabilities: | | | |
| Accrued interest | $ | 2,170 |
| | $ | 2,099 |
|
| Accrued other taxes | 2,556 |
| | 2,005 |
|
| Accrued income taxes | 2,244 |
| | — |
|
| Accrued rebates | 7,242 |
| | 7,969 |
|
| Accrued employee separation and plant closure costs | 1,102 |
| | 1,113 |
|
| Accrued other | 15,156 |
| | 11,467 |
|
| Other current liabilities | $ | 30,470 |
| | $ | 24,653 |
|
| Other long-term liabilities: | | | |
| Accrued environmental | $ | 4,586 |
| | $ | 4,745 |
|
| Accrued contingent consideration (1) | 1,898 |
| | 6,150 |
|
| Accrued contingencies and other | 4,811 |
| | 1,462 |
|
| Other long-term liabilities | $ | 11,295 |
| | $ | 12,357 |
|
| |
(1) | Represents the long-term portion of accrued contingent consideration. |
CHART INDUSTRIES, INC. AND SUBSIDIARIES
NOTES TO CONSOLIDATED FINANCIAL STATEMENTS—(Continued)
(Dollars and shares in thousands, except per share amounts)
NOTE C4 — Inventories
The following table summarizes the components of inventory:
|
| | | | | | | |
| | December 31, |
| | 2013 | | 2012 |
| Raw materials and supplies | $ | 93,014 |
| | $ | 85,726 |
|
| Work in process | 42,996 |
| | 40,945 |
|
| Finished goods | 76,994 |
| | 69,830 |
|
| Total inventories, net | $ | 213,004 |
| | $ | 196,501 |
|
The allowance for excess and obsolete inventory balance at December 31, 2013 and 2012 was 6,556 and 4,078, respectively.
NOTE 5 — Property, Plant and Equipment
The following table summarizes the components of property, plant and equipment:
|
| | | | | | | | | | |
| | | | | December 31, |
| Classification | | Estimated Useful Life | | 2013 | | 2012 |
| Land and buildings | | 20-35 years | | $ | 139,962 |
| | $ | 107,410 |
|
| Machinery and equipment | | 3-12 years | | 124,023 |
| | 96,362 |
|
| Computer equipment, furniture and fixtures | | 3-7 years | | 24,659 |
| | 20,238 |
|
| Construction in process | | | | 37,249 |
| | 25,070 |
|
| Total property, plant and equipment, gross | | | | 325,893 |
| | 249,080 |
|
| Less: Accumulated depreciation | | | | (101,688 | ) | | (79,304 | ) |
| Total property, plant and equipment, net | | | | $ | 224,205 |
| | $ | 169,776 |
|
Depreciation expense was $21,159, $17,404 and $14,539 for the years ended December 31, 2013, 2012 and 2011, respectively.
NOTE 6 — Goodwill and Intangible Assets
The Company performed the impairment tests using quantitative assessments as of October 1, 2013. With respect to goodwill, the estimated fair values substantially exceeded the carrying amounts for all reporting units. Therefore, there was no goodwill impairment in 2013. Furthermore, the fair values of each indefinite-lived intangible asset exceeded its carrying amount. Therefore, there was no impairment of indefinite-lived intangible assets in 2013.
Goodwill
The following table represents the changes in goodwill:
|
| | | | | | | |
| | December 31, |
| | 2013 | | 2012 |
| Beginning balance | $ | 398,941 |
| | $ | 288,770 |
|
| Foreign currency translation adjustments and other | (344 | ) | | 408 |
|
| Goodwill acquired during the year | 308 |
| | 109,763 |
|
| Ending balance | $ | 398,905 |
| | $ | 398,941 |
|
Intangible Assets
The Company recorded an impairment loss of $3,070 during 2012 resulting in the elimination of in-process research & development ("IPR&D") indefinite-lived intangible assets related to a prior BioMedical segment acquisition. Higher forecasted costs and project delays represented impairment indicators requiring the Company to re-evaluate the fair value of the IPR&D indefinite-lived intangible assets. The Company conducted an impairment test based on the multi-period excess earnings
CHART INDUSTRIES, INC. AND SUBSIDIARIES
NOTES TO CONSOLIDATED FINANCIAL STATEMENTS—(Continued)
(Dollars and shares in thousands, except per share amounts)
valuation method which determines fair value based on the present value of the prospective net cash flow attributable to the intangible asset (Level 3 in the fair value hierarchy). The Company determined that the fair value of the IPR&D indefinite-lived intangible assets was zero and impaired the intangible assets by a value equal to their carrying amount.
The following table displays the gross carrying amount and accumulated amortization for finite-lived intangible assets and indefinite-lived intangible assets (exclusive of goodwill)(1):
|
| | | | | | | | | | | | | | | | | |
| Weighted-average Estimated Useful Life | | December 31, 2013 | | December 31, 2012 |
| | | Gross Carrying Amount | | Accumulated Amortization | | Gross Carrying Amount | | Accumulated Amortization |
| Finite-lived intangible assets: | | | | | | | | | |
| Unpatented technology | 16.0 years | | $ | 43,133 |
| | $ | (11,776 | ) | | $ | 45,078 |
| | $ | (11,286 | ) |
| Patents | 11.0 years | | 7,904 |
| | (5,397 | ) | | 9,880 |
| | (6,664 | ) |
| Product names | 9.0 years | | 9,244 |
| | (4,525 | ) | | 9,068 |
| | (2,712 | ) |
| Customer relations | 13.0 years | | 159,143 |
| | (73,460 | ) | | 158,005 |
| | (59,668 | ) |
| Total finite-lived intangible assets | 13.6 years | | $ | 219,424 |
| | $ | (95,158 | ) | | $ | 222,031 |
| | $ | (80,330 | ) |
| Indefinite-lived intangible assets: | | | | | | | | | |
| Trademarks and trade names | | | $ | 47,876 |
| | | | $ | 47,762 |
| | |
_______________
| |
(1) | Amounts include the impact of foreign currency translation. Fully amortized amounts are written off. |
Amortization expense for intangible assets subject to amortization was $19,230, $14,792 and $13,376 for the years ended December 31, 2013, 2012 and 2011, respectively. The Company estimates amortization expense to be recognized during the next five years as follows:
|
| | | |
| For the Year Ending December 31, | |
| 2014 | $ | 17,800 |
|
| 2015 | 16,200 |
|
| 2016 | 14,300 |
|
| 2017 | 13,400 |
|
| 2018 | 12,700 |
|
CHART INDUSTRIES, INC. AND SUBSIDIARIES
NOTES TO CONSOLIDATED FINANCIAL STATEMENTS—(Continued)
(Dollars and shares in thousands, except per share amounts)
NOTE 7 — Debt and Credit Arrangements
Summary of Outstanding Borrowings
The following table shows the components of the Company’s borrowings:
|
| | | | | | | |
| | December 31, |
| | 2013 | | 2012 |
| Convertible notes, due August 2018, effective interest rate of 7.9% | $ | 193,437 |
| | $ | 183,583 |
|
| Term loan, due April 2017, average interest rate of 2.54% | 68,438 |
| | 72,188 |
|
| Foreign facilities | 3,280 |
| | — |
|
| Total debt | 265,155 |
| | 255,771 |
|
Less: current maturities (1) | (200,467 | ) | | (3,750 | ) |
| Long-term debt | $ | 64,688 |
| | $ | 252,021 |
|
|
| | | | | | | |
| | December 31, |
| | 2012 | | 2011 |
| Convertible notes, due August 2018, effective interest rate of 7.9% | $ | 183,583 |
| | $ | 174,474 |
|
| Term loan, due April 2017, average interest rate of 2.46% | 72,188 |
| | 55,250 |
|
| Foreign facilities | — |
| | 4,758 |
|
| Total debt | 255,771 |
| | 234,482 |
|
| Less: current maturities | (3,750 | ) | | (11,258 | ) |
| Long-term debt | $ | 252,021 |
| | $ | 223,224 |
|
| |
(1) | Current maturities includes $193,437 current convertible notes at December 31, 2013. |
Convertible Notes
The outstanding aggregate principal amount of the Company's Convertible Notes is $250,000. The Convertible Notes bear interest at a fixed rate of 2.00%2.0% per year, payable semiannually in arrears on February 1 and August 1 of each year, and will mature on August 1, 2018. The effective interest rate at issuance was 7.9%.
The Convertible Notes are senior subordinated unsecured obligations of the Company and are not guaranteed by any of the Company's subsidiaries. The Convertible Notes are subordinated in right of payment to the Company's existing and future senior indebtedness, including indebtedness under the Company's existing credit agreement, and rank equally in right of payment with any future senior subordinated debt. The Convertible Notes rank senior in right of payment to the Company's future subordinated debt.
Prior to May 1, 2018, the Convertible Notes will be convertible at the option of the holders thereof only under the following circumstances: (1) during any fiscal quarter commencing after September 30, 2011 (and only during such fiscal quarter), if the last reported sale price of the Company’s common stock for at least 20 trading days (whether or not consecutive) during the period of 30 consecutive trading days ending on the last trading day of the immediately preceding fiscal quarter is greater than or equal to 130% of the applicable conversion price (currently approximately $69.03) for the Convertible Notes on each applicable trading day); (2) during the five business day period after any five consecutive trading day period (the “Measurement Period”) in which, as determined following a request by a holder of Convertible Notes as provided in the bond indenture (the “Indenture”), the trading price per $1,000 principal amount of Convertible Notes for each trading day of such Measurement Period was less than 97% of the product of the last reported sale price of the Company’s common stock and the applicable conversion rate for the Convertible Notes on each such trading day; or (3) upon the occurrence of specified corporate events pursuant to the terms of the Indenture. On or after May 1, 2018, until the close of business on the second scheduled trading day immediately preceding the maturity date of the Convertible Notes, holders of the Convertible Notes may convert their Convertible Notes at any time, regardless of the foregoing circumstances. Upon conversion, the Company will pay cash up to the aggregate principal amount of the Convertible Notes to be converted and pay or deliver, as the case may be, cash, shares of the Company’s common stock or a combination of cash and shares of the Company’s common stock, at the Company’s election, in respect of the remainder, if any, of the Company’s conversion obligation in excess of the aggregate principal amount of the Convertible Notes being converted. It is the Company’s intention to settle any excess conversion value in shares of the Company’s common stock.
The conversion rate on the Convertible Notes will be subject to adjustment upon the occurrence of certain events, but will not be adjusted for any accrued and unpaid interest. In addition, following the occurrence of a make-whole fundamental change, the Company will, in certain circumstances, increase the conversion rate for a holder that converts its Convertible Notes in connection with such make-whole fundamental change. The Company may not redeem the Convertible Notes prior to maturity. If the Company undergoes a fundamental change, subject to certain conditions, holders may require the Company to purchase the Convertible Notes in whole or in part for cash at a fundamental change purchase price equal to 100% of the principal amount of the Convertible Notes to be purchased, plus accrued and unpaid interest, if any, to, but excluding, the fundamental change purchase date. For purposes of calculating earnings per share, if the Company's market price exceeds the applicable conversion price, shares contingently issuable under the Convertible Notes will have a dilutive effect with respect to the Company’s common stock. At December 31, 2012, the Convertible Notes were not subject to conversion.
CHART INDUSTRIES, INC. AND SUBSIDIARIES
NOTES TO CONSOLIDATED FINANCIAL STATEMENTS—(Continued)
(Dollars and shares in thousands, except per share amounts)
In connection with the issuance of the Convertible Notes, the Company entered into privately-negotiated convertible note hedge and capped call transactions with affiliates of certain of the underwriters (the “Option Counterparties”). The convertible note hedge and capped call transactions relate to, collectively, 3,622 shares, which represents the number of shares of the Company’s common stock underlying the Convertible Notes, subject to anti-dilution adjustments substantially similar to those applicable to the Convertible Notes. These convertible note hedge and capped call transactions are expected to reduce the potential dilution with respect to the Company’s common stock upon conversion of the Convertible Notes and/or reduce the Company’s exposure to potential cash or stock payments that may be required upon conversion of the Convertible Notes, except, in the case of the capped call transactions, to the extent that the market price per share of the Company’s common stock exceeds the cap price of the capped call transactions. The Company also entered into separate warrant transactions with the Option Counterparties initially relating to the number of shares of the Company’s common stock underlying the convertible note hedge transactions, subject to customary anti-dilution adjustments. The warrant transactions will have a dilutive effect with respect to the Company’s common stock to the extent that the price per share of the Company common stock exceeds the strike price of the warrants unless the Company elects, subject to certain conditions, to settle the warrants in cash. These warrants were exercisable as of the issuance date of the Convertible Notes. The cap price of the capped call transactions and the strike price of the warrant transactions was initially $84.96 per share. Proceeds received from the issuance of the warrants totaled approximately $48,848 and were recorded as an addition to additional paid-in-capital. The net cost of the convertible note hedge and capped call transactions, taking into account the proceeds from the issuance of the warrants, was approximately $17,638.
In accordance with ASCAccounting Standards Codification (“ASC”) 815, contracts are initially classified as equity if (1) the contract requires physical settlement or net-share settlement, or (2) the contract gives the entity a choice of net-cash settlement in its own shares (physical settlement or net-share settlement). The Company concluded that the settlement terms of the convertible note hedge, capped call and warrant transactions permit net-share settlement. As such, the convertible note hedge, capped call and warrant transactions were recorded in equity.
At theUpon issuance of the Convertible Notes, the Company bifurcated the $250,000 principal balance of the Convertible Notes into a liability component of $170,885, which was recorded as long-term debt, and an equity component of $79,115, which was
CHART INDUSTRIES, INC. AND SUBSIDIARIES
NOTES TO CONSOLIDATED FINANCIAL STATEMENTS—(Continued)
(Dollars and shares in thousands, except per share amounts)
recorded as additional paid-in-capital. The liability component was recognized at the present value of its associated cash flows using a 7.9% straight-debt rate which representsrepresented the Company’s interest rate for similar debt instruments at that time without a conversion feature and is being accreted to interest expense over the term of the Convertible Notes. At December 31, 2013 and 2012, the unamortized debt discount of the Convertible Notes was $56,563 and $66,417, respectively.
For the years ended December 31, 2013, 2012 and 2011,, interest expense for the Convertible Notes was $14,854, $14,109 and $5,672,$5,672, respectively, which included $5,0009,854 and $2,083 of contractual 2.00% coupon interest, respectively, and, $9,109 and $3,589$3,589 of non-cash interest accretion expense related to the carrying amount of the Convertible Notes, respectively, and $5,000, $5,000 and $2,083 of 2.0% cash interest, respectively. In accordance with ASC 470-20, which requires issuers to separately account for the liability and equity components of convertible debt instruments that may be settled in cash upon conversion, the Company allocated debt issuance costs to the liability and equity components in proportion to their allocated value. Debt issuance costs were $7,277, with $2,303 recorded as a reduction in additional paid-in-capital. This balance of $4,974 is being amortized over the term of the Convertible Notes. For the years ended December 31, 2013, 2012 and 2011,, total expense associated with the amortization of debt issuance costs was $711$711, $711 and $296,$296, respectively.
The following table represents certain information regardingPrior to May 1, 2018, the Convertible Notes:
|
| | | | | | | |
| | December 31, |
| | 2012 | | 2011 |
| Principal balance of liability component | $ | 250,000 |
| | $ | 250,000 |
|
| Unamortized discount | (66,417 | ) | | (75,526 | ) |
| Carrying amount of liability component | $ | 183,583 |
| | $ | 174,474 |
|
| Carrying amount of equity component | $ | 79,115 |
| | $ | 79,115 |
|
Senior Credit Facility
On April 25, 2012,Notes will be convertible at the Company entered into an amended and restated Senior Credit Facility which replacedoption of the prior senior secured credit facility (Prior Credit Facility) with aholders thereof only under the following circumstances: (1) during any fiscal quarter commencing after September 30, 2011 (and only during such fiscal quarter), if the last reported sale price of the Company’s common stock for at least 20 trading days (whether or not consecutive) during the period of 30 consecutive trading days ending on the last trading day of the immediately preceding fiscal quarter is greater than or equal to five130%-year of the applicable conversion price (currently $375,00069.03) for the Convertible Notes on each applicable trading day; (2) during the five business day period after any five consecutive trading day period (the “Measurement Period”) in which, as determined following a request by a holder of Convertible Notes as provided in the bond indenture (the “Indenture”), the trading price per $1,000 senior secured credit facility (Senior Credit Facility), which consistsprincipal amount of aConvertible Notes for each trading day of such Measurement Period was less than $75,00097% term loan (Term Loan)of the product of the last reported sale price of the Company’s common stock and a $300,000 revolving credit facility (Revolving Credit Facility), andthe applicable conversion rate for the Convertible Notes on each such trading day; or (3) upon the occurrence of specified corporate events pursuant to the terms of the Indenture. On or after May 1, 2018, until the close of business on the second scheduled trading day immediately preceding the maturity date was extended two years until April 25, 2017. The Revolving Credit Facility includesof the Convertible Notes, holders of the Convertible Notes may convert their Convertible Notes at any time, regardless of the foregoing circumstances. Upon conversion, the Company will pay cash up to the aggregate principal amount of the Convertible Notes to be converted and pay or deliver, as the case may be, cash, shares of the Company’s common stock or a combination of cash and shares of the Company’s common stock, at the Company’s election, in respect of the remainder, if any, of the Company’s conversion obligation in excess of the aggregate principal amount of the Convertible Notes being converted. It is the Company’s intention to settle any excess conversion value in shares of the Company’s common stock. Since the Company's closing common stock price of $25,00095.64 at the end of the period exceeded the conversion price of $69.03, the if-converted value exceeded the principal amount of the Convertible Notes by approximately $96,371 at December 31, 2013. As described above, the convertible note hedge and capped call transactions are expected to reduce the potential dilution with respect to the Company’s common stock upon conversion of the Convertible Notes.
The conversion rate on the Convertible Notes will be subject to adjustment upon the occurrence of certain events, but will not be adjusted for any accrued and unpaid interest. In addition, following the occurrence of a make-whole fundamental change, the Company will, in certain circumstances, increase the conversion rate for a holder that converts its Convertible Notes in connection with such make-whole fundamental change. The Company may not redeem the Convertible Notes prior to maturity. If the Company undergoes a fundamental change, subject to certain conditions, holders may require the Company to purchase the Convertible Notes in whole or in part for cash at a fundamental change purchase price equal to 100% of the principal amount of the Convertible Notes to be purchased, plus accrued and unpaid interest, if any, to, but excluding, the fundamental change purchase date. For purposes of calculating earnings per share, if the market price of the Company's common stock exceeds the applicable conversion price, as was the case at December 31, 2013, shares contingently issuable under the Convertible Notes will have a dilutive effect with respect to the Company’s common stock.
As of January 1, 2014, the Convertible Notes were again convertible at the option of the shareholders. This conversion right, which will remain available until March 31, 2014, was triggered since the closing price of the Company's common stock was greater than or equal to $89.74 (130% of the conversion price of the Convertible Notes) for at least 20 trading days during the last 30 consecutive trading days ending on December 31, 2013. Since the Company would be required to pay cash and issue stock to holders if they elect to convert their Convertible Notes during the first fiscal quarter of 2014, the $193,437 long-term liability component of the Convertible Notes was classified as a current liability in the consolidated balance sheet at December 31, 2013. In addition, a portion of the equity component of the Convertible Notes, calculated as the difference between the $250,000 principal amount of the Convertible Notes and the $193,437 liability component of the Convertible
CHART INDUSTRIES, INC. AND SUBSIDIARIES
NOTES TO CONSOLIDATED FINANCIAL STATEMENTS—(Continued)
(Dollars and shares in thousands, except per share amounts)
Notes, was considered redeemable and, as such, $56,563 was classified as temporary equity in the consolidated balance sheet at December 31, 2013. In the event that holders of Convertible Notes elect to convert, the Company expects to fund any resultant cash settlement from either working capital, borrowings under its credit facility, or both. The Company will reassess the convertibility of the Convertible Notes and the related balance sheet classification on a quarterly basis. There have been no conversions as of the date of this filing.
Senior Credit Facility
The Company entered into an amended and restated Senior Credit Facility on April 25, 2012, which replaced the prior senior secured credit facility (“Prior Credit Facility”) with a five-year $375,000 senior secured credit facility (“Senior Credit Facility”), which consisted of a $75,000 term loan (“Term Loan”) and a $300,000 revolving credit facility (“Revolving Credit Facility”), and the maturity date was extended two years until April 25, 2017. The Revolving Credit Facility includes a $25,000sub-limit for the issuance of swingline loans and a $100,000 sub-limit to be used for letters of credit. There is a foreign currency limit of $50,000 under the Revolving Credit Facility which could be used for foreign currency denominated letters of credit and borrowings in a foreign currency, in each case in currencies agreed upon with the lenders. In addition, the facility permits borrowings up to $50,000 under the Revolving Credit Facility made by the Company's wholly-owned subsidiary, Chart Industries Luxembourg S.à r.l.
The Company recorded $1,445 in deferred financing costs related to the Senior Credit Facility which are being amortized over the five-year term of the loan. In accordanceFor the years ended December 31, 2013 and 2012, financing costs amortization associated with loan modification accounting guidance, the Company recorded a $232 charge to write off a portion of the remaining deferredSenior Credit Facility was $595 and $587, respectively, while financing feescosts amortization associated with the Prior Credit Facility.Facility was $1,178 for the year ended December 31, 2011. The Senior Credit Facility also includes an expansion option permitting the Company to add up to an aggregate of $150,000 in term loans or revolving credit commitments from its existing and potential new lenders.
Loans under the Senior Credit Facility bear interest, at the applicable Borrower's election, at either LIBOR or the greatest of (a) the JPMorgan prime rate in effect on such day, (b) the Federal Funds Effective Rate in effect on such day plus 1/2 of 1% or (c) the Adjusted LIBOR Rate (as defined in the Senior Credit Facility) for a one month interest period on such day (or if such day is not a business day, the immediately preceding business day) plus 1%, plus a margin that varies with the Company's net debt to EBITDA ratio. In addition, the Company is required to pay a commitment fee of between 0.25% and 0.40% of the unused Revolver balance and a letter of credit participation fee equal to the daily aggregate letter of credit exposure at the rate per annum equal to the Applicable Margin for Eurocurrency Revolving Facility Borrowings (ranging from 1.5% to 3.0%, depending on the leverage ratio calculated at each fiscal quarter end). A fronting fee must be paid on each letter of credit that is issued equal to 0.125% per annum of the stated dollar amount of the letter of credit. Under the terms of the Senior Credit Facility, 5% of the $75,000 Term Loan is payable annually in quarterly installments over the first three years,, 10% is payable annually in quarterly installments over the final two years,, and the remaining balance is due on April 25, 2017.
The Senior Credit Facility contains a number of customary covenants, including but not limited to restrictions on the Company's ability to incur additional indebtedness, create liens or other encumbrances, sell assets, enter into sale and lease-back transactions, make certain payments, investments, loans, advances or guarantees, make acquisitions and engage in mergers or consolidations, pay dividends or distributions, and make capital expenditures. Significant financial covenants for the Senior Credit Facility include a maximum net debt to EBITDA ratio of 3.25 and a minimum interest coverage to EBITDA ratio of 3.0,, which are the same limits that applied under the Prior Credit Facility. At December 31, 20122013, the Company was in compliance with all covenants.
At December 31, 20122013, there was $72,18868,438 outstanding under the Term Loan and $28,19924,761 in letters of credit issued. Although there were no borrowings outstanding under the Revolving Credit Facility at December 31, 2012,2013, the Company had borrowed against this facility to fund working capital needs during the year, and incurred additional interest on interim amounts outstanding. At December 31, 20122013, availability under the Revolving Credit Facility was $271,801275,239. The obligations under the Senior Credit Facility are guaranteed by the Company and substantially all of its U.S. subsidiaries and secured by substantially all of the assets of the Company and its U.S. subsidiaries and 65% of the capital stock of the Company’s material non-U.S. subsidiaries (as defined by the Senior Credit Facility) that are owned by U.S. subsidiaries.
Foreign Facilities – China
Chart Cryogenic Engineering Systems (Changzhou) Co., Ltd. (CCESC)Company Limited (“CCESC”), a wholly-owned subsidiary of the Company, maintained three separate banking facilities (Foreign Facilities) which included a bonding/guarantee facility, a revolving line of credit, and an overdraft facility with 30,000, 60,000, and 10,000 Chinese yuan (in thousands) in borrowing capacity, respectively. The Foreign Facilities were guaranteed by the Company. On November 11, 2012, the facilities matured and the outstanding principal and interest due of 30,000 and 1,110 Chinese yuan (in thousands), respectively, were paid in full by CCESC.
As of December 31, 2012, Chart Cryogenic Distribution Equipment (Changzhou) Company Limited (“CCDEC”), a joint venture of the Company, and CCESC hasmaintain joint banking facilities (the “China D&S Facilities”) which include a revolving line with $1,295 and $844 in bank guarantees, respectively.
Foreign Facilities – Ferox
Chart Ferox, a.s. (Ferox), a wholly-owned subsidiary of the Company, maintains secured credit facilities with capacity of up to 175,000 thousand Czech koruna. Ferox maintains two separate facilities. Both of the facilities allow Ferox to request issuance of bank guarantees and letters of credit. None of the facilities allow revolving credit borrowings, including overdraft protection. Under this first facility Ferox must pay letter of credit and guarantee fees equal to: (i) 0.70% p.a. on the face amount of each guarantee or letter of credit for maturities of up to 1 year, (ii) 0.80% p.a. for maturities between 1 and 3 years,30.0 million
CHART INDUSTRIES, INC. AND SUBSIDIARIES
NOTES TO CONSOLIDATED FINANCIAL STATEMENTS—(Continued)
(Dollars and shares in thousands, except per share amounts)
and (iii)Chinese yuan (equivalent to $4,921) in borrowing capacity, a bonding/guarantee facility with up to 1.20%50.0 million p.a. for maturities between 3Chinese yuan (equivalent to $8,201) in borrowing capacity, and 5 years.an overdraft facility with 10.0 million Chinese yuan (equivalent to $1,640) in borrowing capacity. Any drawings made by CCESC and CCDEC under the China D&S Facilities are guaranteed by the Company.
CCDEC also maintains a facility with Bank of China with capacity of up to 20.0 million Chinese yuan (equivalent to $3,280). At December 31, 2013, there was 20.0 million Chinese yuan (equivalent to $3,280) outstanding under this facility, bearing interest at 6.6%. The facility matures on March 19, 2014.
At December 31, 2013, CCESC and CCDEC had 8.0 million Chinese yuan (equivalent to $1,306) and 5.6 million Chinese yuan (equivalent to $921) in bank guarantees, respectively.
Foreign Facilities – Ferox
Chart Ferox, a.s. (“Ferox”), a wholly-owned subsidiary of the Company, maintains two secured credit facilities with capacity of up to 175.0 million Czech koruna (equivalent to $8,799). Both of the facilities allow Ferox to request issuance of bank guarantees and letters of credit. Neither of the facilities allows revolving credit borrowings, including overdraft protection. Under the second facilityboth facilities, Ferox must pay letter of credit and guarantee fees equal to 0.70% p.a. on the face amount of each guarantee or letter of credit. Ferox is not required to pay a commitment fee to the lender under the second facility. Ferox’s land, buildings and accounts receivable secure the credit facilities. At December 31, 20122013, there were bank guarantees of 77.1 million Czech koruna (equivalent to $2,5593,876) supported by the Ferox credit facilities.
Scheduled Annual Maturities
The scheduled annual maturities of long-term debt at December 31, 20122013, are as follows:
| | | Year | Amount | Amount |
| 2013 | $ | 3,750 |
| |
| 2014 | 3,750 |
| $ | 7,030 |
|
| 2015 | 6,563 |
| 6,563 |
|
| 2016 | 7,500 |
| 7,500 |
|
| 2017 | 50,625 |
| 50,625 |
|
| Thereafter | 250,000 |
| |
| | $ | 322,188 |
| |
| Less: Convertible notes unamortized discount | (66,417 | ) | |
| | $ | 255,771 |
| |
| 2018 | | 250,000 |
|
| Total | | $ | 321,718 |
|
Cash paid for interest during the years ended December 31, 2013, 2012 2011 and 20102011 was $6,6047,233, $16,6086,604 and $16,77416,608, respectively.
Fair Value Disclosures
The fair value of the Company’s term loan portionsportion of both the Company’s Senior Credit Facility and the Prior Credit Facility was estimated based on the present value of the underlying cash flows discounted using market interest rates. Under this method, the fair value of the Company’s Term Loan approximated its carrying amount as of December 31, 2012,2013 and the fair value of the term loan portion of the Prior Credit Facility approximated its carrying amount as of December 31, 20112012. The Company’s Term Loan and term loan portion of the Prior Credit Facility werewas valued using observable inputs and, accordingly, are classified as being valuedthe valuation is performed using Level 2 inputs as defined in Note E.11.
The fair value of the Convertible Notes exceededwas valued at approximately 154% of its par value byas of December 31, 2013 and approximately 124% of its par value as of December 31, 2012 and approximately 108% as of December 31, 20112012. The Convertible Notes are actively quoted instruments and, accordingly, are classified as being valuedthe valuation is performed using Level 1 inputs as defined in Note E.11.
CHART INDUSTRIES, INC. AND SUBSIDIARIES
NOTES TO CONSOLIDATED FINANCIAL STATEMENTS—(Continued)
(Dollars and shares in thousands, except per share amounts)
NOTE 8 — Financial Instruments and Derivative Financial Instruments
Concentrations of Credit Risks: The Company sells its products to gas producers, distributors and end-users across the industrial gas, hydrocarbon, chemical processing and medical industries in countries all over the world. Approximately 59%, 56% and 58% of sales were to foreign countries in 2013, 2012 and 2011, respectively. No single customer exceeded ten percent of consolidated sales in 2013, 2012 and 2011. Sales to the Company’s top ten customers accounted for 37%, 38% and 36% of consolidated sales in 2013, 2012 and 2011, respectively. The Company’s sales to particular customers fluctuate from period to period, but the large industrial gas producer and distributor customers of the Company tend to be a consistently large source of revenue for the Company.
The Company is also subject to concentrations of credit risk with respect to its cash and cash equivalents and forward foreign currency exchange contracts. To minimize credit risk from these financial instruments, the Company enters into arrangements with major banks and other quality financial institutions and invests only in high-quality instruments. The Company does not expect any counterparties to fail to meet their obligations in this area.
The changes in fair value with respect to the Company's foreign currency forward contracts generated net losses of $2,940 and $780 for the years ended December 31, 2013 and 2012 and a net gain of $1,233 for the year ended December 31, 2011.
NOTE D9 — Product Warranties
The changes in the Company’s consolidated warranty reserve are as follows:
|
| | | | | | | | | | | |
| | Year Ended December 31, |
| | 2013 | | 2012 | | 2011 |
| Beginning balance | $ | 44,486 |
| | $ | 13,181 |
| | $ | 12,101 |
|
| Warranty expense | 17,486 |
| | 12,494 |
| | 7,420 |
|
| Warranty usage | (28,359 | ) | | (18,222 | ) | | (8,085 | ) |
| Acquired warranty reserves | 214 |
| | 37,033 |
| | 1,745 |
|
| Ending balance | $ | 33,827 |
| | $ | 44,486 |
| | $ | 13,181 |
|
NOTE 10 — Business Combinations
2012Xinye Acquisition
On June 8, 2013, Chart Asia Investment Company Limited (“Chart Asia”), a wholly-owned subsidiary of the Company, acquired 80% of the shares of Nanjing Xinye Electric Engineering Co., Ltd. (“Xinye”) for an aggregate cash purchase price of 18.3 million Chinese yuan (equivalent to $2,965), net of cash acquired. The remaining 20% will be retained by one of the original shareholders. The fair value of the net assets acquired and goodwill at the date of acquisition was 16.4 million Chinese yuan and 1.9 million Chinese yuan, respectively. Xinye, located in Nanjing, Jiangsu Province, China, designs, manufactures and sells control systems and dispensers for the liquefied natural gas, compressed natural gas, and industrial gas markets. It also engages in the design and production of integrated circuit card systems and remote monitoring systems for natural gas mobile equipment. Xinye provides the Company localized dispensing and control technology and increases its penetration into the high growth natural gas markets in the Asian region. Xinye's results are included in the Company's Distribution & Storage business segment.
AirSep Acquisition
On August 30, 2012, the Company acquired 100% of the equity interests of AirSep Corporation (AirSep)(“AirSep”) for an aggregate cash purchase price of $182,450 (including approximately $2,800 in acquisition-related tax benefits acquired and $10,000 of debt which was retired upon completion of the acquisition). AirSep, located in Amherst, New York, designs, manufactures, sells and services stationary, transportable orand portable oxygen concentrators and self-contained generators, standard generators, and packaged systems for industrial and medical oxygen generating systems. AirSep's results are included in the Company’s BioMedical segment.
The fair value of the net assets acquired and goodwill at the date of acquisition werewas $72,687 and $109,763, respectively. The allocation of the purchase price is based on the fair value of assets acquired and liabilities assumed, and the related income tax impact of the acquisition adjustments. The acquisition was made and goodwill was established due to the benefits that will be derived from the expansion of the Company's BioMedical segment oxygen concentrator business in the U.S., Europe and Asia and growth potential for the commercial oxygen generation systems business.
CHART INDUSTRIES, INC. AND SUBSIDIARIES
NOTES TO CONSOLIDATED FINANCIAL STATEMENTS—(Continued)
(Dollars and shares in thousands, except per share amounts)
be derived from the expansion of the oxygen concentrator business in the U.S., Europe and Asia, and the growth potential for the Company's commercial oxygen generation systems business.
The following table summarizes the estimated fair values of the assets acquired and liabilities assumed in the AirSep acquisition on August 30, 2012. The Company is in the process of finalizing certain analyses; thus, these provisional measurements are subject to change:2012:
|
| | | |
| Net assets acquired: | |
| Accounts receivable, net | $ | 24,280 |
|
| Inventories, net | 34,553 |
|
| Prepaid expenses | 615 |
|
| Other current assets | 3,837 |
|
| Property, plant and equipment | 5,342 |
|
| Other assets | 976 |
|
| Accounts payable | (13,728 | ) |
| Customer advances and billings in excess of contract revenue | (4,782 | ) |
| Accrued salaries, wages and benefits | (1,837 | ) |
| Other current liabilities | (254 | ) |
| Current portion of warranty reserve | (10,562 | ) |
| Long-term portion of warranty reserve | (26,471 | ) |
| Net tangible assets acquired | 11,969 |
|
| Deferred income tax assets | 9,262 |
|
| Goodwill | 109,763 |
|
| Identifiable intangible assets | 67,000 |
|
| Long-term deferred tax liability | (15,544 | ) |
| Net assets acquired | $ | 182,450 |
|
AirSep provides warranties on certain of its products, generally for periods of five years or less. The warranty reserve is calculated considering historical warranty experience (general portion of the reserve) and specifically identified warranty issues (specific portion of the reserve). To calculate the required general reserve, actual warranty claims are used to calculate an average experience rate to be applied against sales. This experience rate is used to record an estimated accrual at the time of the sale. The accrual is reviewed and adjusted periodically to reflect current information including costs to repair or replace the units. The Company reviews other factors to determine if there are any specific factors which could change the reserve. AirSep has experienced a significant number of warranty claims in one of its product lines. To calculate the specific reserve associated with this product line, the Company isolated the specific units which were being returned with identified warranty issues at significantly higher rates than normal. The entire population of these units was excluded from the general reserve and is considered in a specific reserve. The specific reserve considers the identified population, identified less units already returned, to estimate potential units that will be returned. Management then estimated the expected number of additional product returns based on historical returns experience for this product line. ExpectedThese expected future returns were multiplied by the estimated cost to replace the unit to establish a specific warranty reserve. This analysis is in process and, therefore, the reserve is subject to change.
The Company continues to analyze the data as of the acquisition date relative to AirSep's historical warranty experience for this specific warranty issue and as such is keeping the measurement period open.
AirSep's identifiable intangible assets mainly include customer relationships and technology and are also comprised of product names, trademarks and trade names.
Incremental sales and operating income related to the AirSep acquisition were $71,043 and $3,195, respectively, in the year ended December 31, 2013, the latter of which included $2,638 in cost of goods sold to amortize the remaining portion of the write-up of inventory to fair value, $4,570 of intangible asset amortization expense and $2,726 in management retention expenses and severance costs.
For the period August 31, 2012 through December 31, 2012, AirSep added $40,317$40,317 to sales. For the same period, the acquisition of AirSep also reduced operating income by $4,026$4,026 which included $3,270$3,270 recorded in cost of goods sold to amortize a portion of the write-up of inventory to fair value, $2,285$2,285 of intangible asset amortization expense and $1,111$1,111 in management retention expenses. For the year ended December 31, 2012, the Company recognized $1,164$1,164 of AirSep acquisition related
CHART INDUSTRIES, INC. AND SUBSIDIARIES
NOTES TO CONSOLIDATED FINANCIAL STATEMENTS—(Continued)
(Dollars and shares in thousands, except per share amounts)
costs, respectively, that were expensed in the current year. These costs are included in the consolidated statements of income in selling, general and administrative expenses.
CHART INDUSTRIES, INC. AND SUBSIDIARIES
NOTES TO CONSOLIDATED FINANCIAL STATEMENTS—(Continued)
(Dollars and shares in thousands, except per share amounts)
2011 Acquisitions
In August 2011, the Company completed the acquisition of GOFA Gocher Fahrzeugbau GmbH and related companies (GOFA)(“GOFA”) for a total purchase price of €26,261, net of cash acquired, including a final working capital adjustment of €947. The fair value of the net assets acquired and goodwill at the date of acquisition werewas $28,372 and $11,438, respectively. GOFA, located in Goch, Germany, designs, manufactures, sells and services cryogenic and noncryogenic mobile equipment. GOFA's results are included in the Company’s Distribution & Storage segment.
In April 2011, the Company completed the acquisition of Clever Fellows Innovation Consortium, Inc. (CFIC)(“CFIC”) for a total potential purchase price of $5,000 in cash, of which $2,000 has been paid. The remaining portion of the potential total purchase price represents contingent consideration to be paid over three years based on the attainment of certain revenue targets. The fair value of the net assets acquired and goodwill at the date of acquisition werewas $732 and $2,938, respectively. CFIC is located in Troy, New York and develops and manufactures thermoacoustic technology products for cryogenic, heat transfer and related applications. CFIC’s results are included in the Company’s BioMedical segment.
2010 Acquisitions
In December 2010, the Company completed the acquisition of SeQual Technologies, Inc. (SeQual) for a total potential purchase price of $60,000 in cash, of which $38,312 was paid after working capital adjustments. The majority of the remaining potential total purchase price represents contingent consideration to be paid over two years which began in 2012 based on the achievement of certain gross profit targets. The fair value of the net assets acquired and goodwill at the date of acquisition were $36,202 and $7,210, respectively. SeQual is located in San Diego, California and develops, manufactures and markets products for numerous applications utilizing pressure swing adsorption technology for air separation with its primary focus on medical oxygen concentrators. SeQual’s results are included in the Company’s BioMedical segment.
In August 2010, the Company completed the acquisition of Cryotech International, Inc. (Cryotech) for a potential total purchase price of $6,653 in cash, of which $4,053 was paid at closing. The remaining portion of the potential total purchase price represented contingent consideration which was paid in 2011 and 2012 based on the achievement of certain revenue targets. The fair value of the net assets acquired and goodwill at the date of acquisition were $1,626 and $4,227, respectively. Cryotech is located in San Jose, California and designs, manufactures, sells, and services cryogenic injectors, vacuum insulated piping systems, and manifolds, and also repairs liquid cylinders. Cryotech’s results are included in the Company’s Distribution & Storage segment.
In April 2010, Chart Japan Co., Ltd. completed the acquisition of Covidien Japan Inc.’s liquid oxygen therapy business for $1,008 in cash. The fair value of the assets acquired at closing was $2,132 which exceeded the cash paid and, accordingly, resulted in a gain on acquisition of business of $1,124 during the second quarter of 2010.
Pro-forma information related to these acquisitions has not been presented because the impact on the Company’s consolidated results of operations is not material.
Contingent Consideration
The estimated fair value of total contingent consideration relating to acquisitions ina prior yearsacquisition was valued using a discounted cash flow approach, which includes assumptions for the probabilities of achieving gross sales or gross profit targets and the discount rate applied to the projected payments. The majority of the decrease in fair value during 2012 was caused by an adjustment to a contingent consideration obligation related to a prior BioMedical segment acquisition;valuation is performed using Level 3 inputs as a result of higher forecasted costs and project delays of certain BioMedical projects as noted in the Goodwill and Intangible Assets paragraphdefined in Note A, the Company determined that the acquired business would no longer meet the forecasted gross profit target required to satisfy its contingent consideration obligation. Therefore, the contingent consideration obligation was adjusted to zero.11. Changes in fair value of contingent consideration are recorded as selling, general and administrative expenses in the consolidated statements of income.
Potential payments may be paid between January 1, 2014 and March 31, 2016 based on the attainment of certain revenue targets. Based on achieving gross salescertain revenue targets, the remaining maximum potential payout related to a prior BioMedical acquisitiontotal contingent consideration is $3,000.
CHART INDUSTRIES, INC. AND SUBSIDIARIES
NOTES TO CONSOLIDATED FINANCIAL STATEMENTS—(Continued)
(Dollars and shares in thousands, except per share amounts)
The changes in the Company's contingent consideration liabilities are summarized below:
| | | | Distribution & Storage | | BioMedical | | Total | Distribution & Storage | | BioMedical | | Total |
| Balance at January 1, 2011 | $ | — |
| | $ | 5,100 |
| | $ | 5,100 |
| |
| Fair value of contingent consideration at inception | 1,800 |
| | 1,650 |
| | 3,450 |
| |
| Increase (decrease) in contingent consideration liabilities | 341 |
| | (524 | ) | | (183 | ) | |
| Payment | (1,300 | ) | | — |
| | (1,300 | ) | |
| Balance at December 31, 2011 | 841 |
| | 6,226 |
| | 7,067 |
| |
| Balance at January 1, 2012 | | $ | 841 |
| | $ | 6,226 |
| | $ | 7,067 |
|
| Increase (decrease) in contingent consideration liabilities | 459 |
| | (4,236 | ) | | (3,777 | ) | 459 |
| | (4,236 | ) | | (3,777 | ) |
| Payment | (1,300 | ) | | — |
| | (1,300 | ) | (1,300 | ) | | — |
| | (1,300 | ) |
| Balance at December 31, 2012 | $ | — |
| | $ | 1,990 |
| | $ | 1,990 |
| — |
| | 1,990 |
| | 1,990 |
|
| Increase in contingent consideration liabilities | | — |
| | 299 |
| | 299 |
|
| Balance at December 31, 2013 | | $ | — |
| | $ | 2,289 |
| | $ | 2,289 |
|
NOTE E11 — Fair Value Measurements
The Company measures its financial assets and liabilities at fair value on a recurring basis in three levels of input. Theusing a three-tier fair value hierarchy, which prioritizes the inputs used in the valuation methodologies, is:methodologies. The three levels of inputs used to measure fair value are as follows:
Level 1 — Valuations based on quoted prices for identical assets and liabilities in active markets.
Level 2 — Valuations based on observable inputs other than quoted prices included in Level 1, such as quoted prices for similar assets and liabilities in active markets, quoted prices for identical or similar assets and liabilities in markets that are not active, or other inputs that are observable or can be corroborated by observable market data.
Level 3 — Valuations based on unobservable inputs reflecting our own assumptions, consistent with reasonably available assumptions made by other market participants. These valuations require significant judgment.
CHART INDUSTRIES, INC. AND SUBSIDIARIES
NOTES TO CONSOLIDATED FINANCIAL STATEMENTS—(Continued)
(Dollars and shares in thousands, except per share amounts)
Financial assets and liabilities measured at fair value on a recurring basis and presented in the Company's consolidated balance sheets are as follows:
| | | | December 31, 2012 | December 31, 2013 |
| | Total | | Level 2 | | Level 3 | Total | | Level 2 | | Level 3 |
| Foreign currency forward contracts | $ | 31 |
| | $ | 31 |
| | $ | — |
| $ | 13 |
| | $ | 13 |
| | $ | — |
|
| Total financial assets | $ | 31 |
| | $ | 31 |
| | $ | — |
| $ | 13 |
| | $ | 13 |
| | $ | — |
|
| | | | | | | | | | | |
| Foreign currency forward contracts | $ | 433 |
| | $ | 433 |
| | $ | — |
| $ | 394 |
| | $ | 394 |
| | $ | — |
|
| Contingent consideration liabilities | 1,990 |
| | — |
| | 1,990 |
| 2,289 |
| | — |
| | 2,289 |
|
| Total financial liabilities | $ | 2,423 |
| | $ | 433 |
| | $ | 1,990 |
| $ | 2,683 |
| | $ | 394 |
| | $ | 2,289 |
|
| | | | December 31, 2011 | December 31, 2012 |
| | Total | | Level 2 | | Level 3 | Total | | Level 2 | | Level 3 |
| Foreign currency forward contracts | $ | 489 |
| | $ | 489 |
| | $ | — |
| $ | 31 |
| | $ | 31 |
| | $ | — |
|
| Total financial assets | $ | 489 |
| | $ | 489 |
| | $ | — |
| $ | 31 |
| | $ | 31 |
| | $ | — |
|
| | | | | | | | | | | |
| Foreign currency forward contracts | $ | 202 |
| | $ | 202 |
| | $ | — |
| $ | 433 |
| | $ | 433 |
| | $ | — |
|
| Contingent consideration liabilities | 7,067 |
| | — |
| | 7,067 |
| 1,990 |
| | — |
| | 1,990 |
|
| Total financial liabilities | $ | 7,269 |
| | $ | 202 |
| | $ | 7,067 |
| $ | 2,423 |
| | $ | 433 |
| | $ | 1,990 |
|
Refer to Note A8 for further information regarding foreign currency forward contracts and refer to Note D10 for further information regarding contingent consideration liabilities.
NOTE 12 — Accumulated Other Comprehensive Income
The components of accumulated other comprehensive income are as follows:
|
| | | | | | | | | | | |
| | December 31, 2013 |
| | Foreign currency translation adjustments | | Pension liability adjustments, net of taxes | | Accumulated other comprehensive income |
| Beginning Balance | $ | 14,207 |
| | $ | (12,566 | ) | | $ | 1,641 |
|
| Other comprehensive income before reclassifications, net of taxes of $3,769 | 4,218 |
| | 6,611 |
| | 10,829 |
|
Amounts reclassified from accumulated other comprehensive income, net of taxes of $496 (1) | — |
| | 852 |
| | 852 |
|
| Net current-period other comprehensive income, net of taxes | 4,218 |
| | 7,463 |
| | 11,681 |
|
| Ending Balance | $ | 18,425 |
| | $ | (5,103 | ) | | $ | 13,322 |
|
CHART INDUSTRIES, INC. AND SUBSIDIARIES
NOTES TO CONSOLIDATED FINANCIAL STATEMENTS—(Continued)
(Dollars and shares in thousands, except per share amounts)
|
| | | | | | | | | | | |
| | December 31, 2012 |
| | Foreign currency translation adjustments | | Pension liability adjustments, net of taxes | | Accumulated other comprehensive income |
| Beginning Balance | $ | 12,635 |
| | $ | (9,642 | ) | | $ | 2,993 |
|
| Other comprehensive income (loss) before reclassifications, net of a tax benefit of $1,698 | 1,572 |
| | (3,899 | ) | | (2,327 | ) |
Amounts reclassified from accumulated other comprehensive income (1) | — |
| | 975 |
| | 975 |
|
| Net current-period other comprehensive income (loss), net of taxes | 1,572 |
| | (2,924 | ) | | (1,352 | ) |
| Ending Balance | $ | 14,207 |
| | $ | (12,566 | ) | | $ | 1,641 |
|
| |
(1) | Amounts reclassified from accumulated other comprehensive income were expensed and included in cost of sales ($530 and $411 for the years ended December 31, 2013 and 2012, respectively) and selling, general and administrative expenses ($818 and $564 for the years ended December 31, 2013 and 2012, respectively) in the consolidated statements of income. |
NOTE 13 — Earnings Per Share
The following table presents calculations of net income per share of common stock:
|
| | | | | | | | | | | |
| | Year Ended December 31, |
| | 2013 | | 2012 | | 2011 |
| Net income attributable to Chart Industries, Inc. | $ | 83,176 |
| | $ | 71,295 |
| | $ | 44,076 |
|
| Net income attributable to Chart Industries, Inc. per common share: | | | | | |
| Basic | $ | 2.75 |
| | $ | 2.39 |
| | $ | 1.51 |
|
| Diluted | $ | 2.60 |
| | $ | 2.36 |
| | $ | 1.47 |
|
| Weighted average number of common shares outstanding — basic | 30,209 |
| | 29,786 |
| | 29,165 |
|
| Incremental shares issuable upon assumed conversion and exercise of share-based awards | 411 |
| | 408 |
| | 748 |
|
| Incremental shares issuable due to dilutive effect of the Convertible Notes | 974 |
| | — |
| | — |
|
| Incremental shares issuable due to dilutive effect of warrants | 337 |
| | — |
| | — |
|
| Weighted average number of common shares outstanding — diluted | 31,931 |
| | 30,194 |
| | 29,913 |
|
Diluted earnings per share does not reflect the following potential common shares as the effect would be anti-dilutive:
|
| | | | | | | | |
| | Year Ended December 31, |
| | 2013 | | 2012 | | 2011 |
| Share-based awards | 1 |
| | 109 |
| | 107 |
|
Convertible note hedge and capped call transactions (1) | 948 |
| | — |
| | — |
|
| Warrants | — |
| | 3,368 |
| | 3,368 |
|
| |
(1) | The convertible note hedge and capped call transactions offset any dilution upon actual conversion of the Convertible Notes up to a common stock price of $84.96. See Note 7 for further information. |
CHART INDUSTRIES, INC. AND SUBSIDIARIES
NOTES TO CONSOLIDATED FINANCIAL STATEMENTS—(Continued)
(Dollars and shares in thousands, except per share amounts)
NOTE F14 — Income Taxes
Income Before Income Taxes
Income before income taxes consists of the following:
| | | | For the Year Ended December 31, | For the Year Ended December 31, |
| | 2012 | | 2011 | | 2010 | 2013 | | 2012 | | 2011 |
| United States | $ | 79,812 |
| | $ | 42,429 |
| | $ | 18,415 |
| $ | 67,355 |
| | $ | 79,812 |
| | $ | 42,429 |
|
| Foreign | 23,294 |
| | 20,545 |
| | 10,083 |
| 51,303 |
| | 23,294 |
| | 20,545 |
|
| Income before income taxes | $ | 103,106 |
| | $ | 62,974 |
| | $ | 28,498 |
| $ | 118,658 |
| | $ | 103,106 |
| | $ | 62,974 |
|
Provision
Significant components of the provision for income taxes are as follows:
| | | | Year Ended December 31, | Year Ended December 31, |
| | 2012 | | 2011 | | 2010 | 2013 | | 2012 | | 2011 |
| Current: | | | | | | | | | | |
| Federal | $ | 28,076 |
| | $ | 14,369 |
| | $ | 12,673 |
| $ | 19,421 |
| | $ | 28,076 |
| | $ | 14,369 |
|
| State and local | 1,768 |
| | 876 |
| | 900 |
| 1,618 |
| | 1,768 |
| | 876 |
|
| Foreign | 5,456 |
| | 5,976 |
| | 3,765 |
| 11,864 |
| | 5,456 |
| | 5,976 |
|
| Total current | 35,300 |
| | 21,221 |
| | 17,338 |
| 32,903 |
| | 35,300 |
| | 21,221 |
|
| Deferred: | | | | | | | | | | |
| Federal | (3,477 | ) | | (962 | ) | | (8,603 | ) | 21 |
| | (3,477 | ) | | (962 | ) |
| State and local | (684 | ) | | (66 | ) | | 77 |
| (364 | ) | | (684 | ) | | (66 | ) |
| Foreign | (357 | ) | | (1,463 | ) | | (819 | ) | (1,264 | ) | | (357 | ) | | (1,463 | ) |
| Total deferred | (4,518 | ) | | (2,491 | ) | | (9,345 | ) | (1,607 | ) | | (4,518 | ) | | (2,491 | ) |
| Total provision | $ | 30,782 |
| | $ | 18,730 |
| | $ | 7,993 |
| $ | 31,296 |
| | $ | 30,782 |
| | $ | 18,730 |
|
Effective Tax Rate Reconciliation
The reconciliation of income taxes computed at the U.S. federal statutory tax rate to income tax expense is as follows:
| | | | Year Ended December 31, | Year Ended December 31, |
| | 2012 | | 2011 | | 2010 | 2013 | | 2012 | | 2011 |
| Income tax expense at U.S. federal statutory rate | $ | 36,087 |
| | $ | 22,041 |
| | $ | 9,974 |
| $ | 41,530 |
| | $ | 36,087 |
| | $ | 22,041 |
|
| State income taxes, net of federal tax benefit | 711 |
| | 810 |
| | 976 |
| 757 |
| | 711 |
| | 810 |
|
| Foreign income, net of credit on foreign taxes | 48 |
| | 137 |
| | 176 |
| 501 |
| | 48 |
| | 137 |
|
| Effective tax rate differential of earnings outside of U.S. | (4,983 | ) | | (1,901 | ) | | (1,221 | ) | (8,257 | ) | | (4,983 | ) | | (1,901 | ) |
| Foreign investment tax credit | (406 | ) | | (777 | ) | | (305 | ) | — |
| | (406 | ) | | (777 | ) |
| Non-taxable gain on acquisition of business | — |
| | — |
| | (394 | ) | |
| Research & experimentation credits | | (2,105 | ) | | — |
| | (350 | ) |
| Non-deductible (taxable) items | 2,885 |
| | 74 |
| | (144 | ) | 865 |
| | 2,885 |
| | 424 |
|
| (Income) provision for tax contingencies | (394 | ) | | (28 | ) | | 2 |
| |
| Change in uncertain tax positions | | (347 | ) | | (394 | ) | | (28 | ) |
| Domestic production activities deduction | (2,490 | ) | | (1,626 | ) | | (1,071 | ) | (2,237 | ) | | (2,490 | ) | | (1,626 | ) |
| Other differences | (676 | ) | | — |
| | — |
| |
| Other items | | 589 |
| | (676 | ) | | — |
|
| Income tax expense | $ | 30,782 |
| | $ | 18,730 |
| | $ | 7,993 |
| $ | 31,296 |
| | $ | 30,782 |
| | $ | 18,730 |
|
CHART INDUSTRIES, INC. AND SUBSIDIARIES
NOTES TO CONSOLIDATED FINANCIAL STATEMENTS—(Continued)
(Dollars and shares in thousands, except per share amounts)
Deferred Taxes
Deferred income taxes reflect the net tax effect of temporary differences between the carrying amounts of assets and liabilities for financial reporting purposes and the amounts used for income tax purposes. Significant components of the Company’s deferred tax assets and liabilities are as follows:
|
| | | | | | | |
| | December 31, |
| | 2012 | | 2011 |
| Deferred tax assets: | | | |
| Accruals and reserves | $ | 27,625 |
| | $ | 14,036 |
|
| Pensions | 7,019 |
| | 5,562 |
|
| Inventory | 2,775 |
| | 1,630 |
|
| Share-based compensation | 5,220 |
| | 4,539 |
|
| Tax credit carryforwards | 2,662 |
| | 1,070 |
|
| Foreign net operating loss carryforwards | 1,440 |
| | 1,405 |
|
| State net operating loss carryforward | 1,517 |
| | 1,442 |
|
| Other — net | 1,331 |
| | 1,138 |
|
| Total deferred tax assets before valuation allowance | 49,589 |
| | 30,822 |
|
| Valuation allowance | (1,766 | ) | | (1,869 | ) |
| Total deferred tax assets, net of valuation allowance | $ | 47,823 |
| | $ | 28,953 |
|
| Deferred tax liabilities: | | | |
| Property, plant and equipment | $ | 15,705 |
| | $ | 16,392 |
|
| Intangibles | 59,396 |
| | 38,888 |
|
| Convertible notes | 3,071 |
| | 3,613 |
|
| Total deferred tax liabilities | $ | 78,172 |
| | $ | 58,893 |
|
| Net deferred tax liabilities | $ | 30,349 |
| | $ | 29,940 |
|
Tax Credit Carryforwards: At December 31, 2012, the Company had a gross deferred tax asset for tax credit carryforwards of $2,662. These credit carryforwards are subject to expiration beginning in 2015. |
| | | | | | | |
| | December 31, |
| | 2013 | | 2012 |
| Deferred tax assets: | | | |
| Accruals and reserves | $ | 25,478 |
| | $ | 27,625 |
|
| Pensions | 2,536 |
| | 7,019 |
|
| Inventory | 4,350 |
| | 2,775 |
|
| Share-based compensation | 6,107 |
| | 5,220 |
|
| Tax credit carryforwards | — |
| | 2,662 |
|
| Foreign net operating loss carryforwards | 594 |
| | 1,440 |
|
| State net operating loss carryforward | 1,610 |
| | 1,517 |
|
| Other — net | 844 |
| | 1,331 |
|
| Total deferred tax assets before valuation allowance | 41,519 |
| | 49,589 |
|
| Valuation allowance | (1,250 | ) | | (1,766 | ) |
| Total deferred tax assets, net of valuation allowance | $ | 40,269 |
| | $ | 47,823 |
|
| Deferred tax liabilities: | | | |
| Property, plant and equipment | $ | 17,248 |
| | $ | 15,705 |
|
| Intangibles | 53,314 |
| | 59,396 |
|
| Convertible notes | 2,623 |
| | 3,071 |
|
| Total deferred tax liabilities | $ | 73,185 |
| | $ | 78,172 |
|
| Net deferred tax liabilities | $ | 32,916 |
| | $ | 30,349 |
|
| The net deferred tax liability is classified as follows: | | | |
| Deferred income taxes | $ | (14,675 | ) | | $ | (15,282 | ) |
| Other assets | (125 | ) | | (654 | ) |
Long-term deferred tax liabilities
| 47,716 |
| | 46,285 |
|
| Net deferred tax liabilities | $ | 32,916 |
| | $ | 30,349 |
|
Federal, State and Local Net Operating Loss Carryforwards: As a result of the SeQual acquisition, the Company has $23,14919,552 of state net operating losses. California tax law will limit the use of these state net operating losses. The remaining state net operating losses expire between 20132014 and 2030.2031. In addition, the Company has state net operating losses in various other states which begin to expire in 2027.2017. The gross deferred tax asset for the state net operating losses of $1,5171,610 is partially offset by a valuation allowance of $426740.
Foreign Net Operating Loss Carryforwards: As of December 31, 20122013, cumulative foreign operating losses of $6,1882,010 generated by the Company were available to reduce future taxable income. Approximately $3,908451 of these operating losses expire between 20142016 and 2017.2021. The remaining $2,2801,559 can be carried forward indefinitely. The gross deferred tax asset for the foreign operating losses of $1,440594 is partially offset by a valuation allowance of $1,194511.
Other Tax Information
The Company has not provided for income taxes on approximately $120,347159,962 of foreign subsidiaries' undistributed earnings as of December 31, 20122013, since the earnings retained have been reinvested indefinitely by the subsidiaries. It is not practicable to estimate the additional income taxes and applicable foreign withholding taxes that would be payable on the remittance of such undistributed earnings.
Cash paid for income taxes during the years ended December 31, 2013, 2012 2011 and 20102011 was $19,19324,977, $17,13019,193 and $15,26617,130, respectively.
CHART INDUSTRIES, INC. AND SUBSIDIARIES
NOTES TO CONSOLIDATED FINANCIAL STATEMENTS—(Continued)
(Dollars and shares in thousands, except per share amounts)
Unrecognized Income Tax Benefits
The reconciliation of beginning to ending unrecognized tax benefits is as follows:
| | | | Year Ended December 31, | Year Ended December 31, |
| | 2012 | | 2011 | | 2010 | 2013 | | 2012 | | 2011 |
| Unrecognized tax benefits at beginning of the year | $ | 2,440 |
| | $ | 2,468 |
| | $ | 1,470 |
| $ | 3,339 |
| | $ | 2,440 |
| | $ | 2,468 |
|
| Additions for tax positions of prior years | 1,921 |
| | 128 |
| | 2,170 |
| 299 |
| | 1,921 |
| | 128 |
|
| Reductions for tax positions of prior years | — |
| | (22 | ) | | (22 | ) | (1,921 | ) | | — |
| | (22 | ) |
| Reductions for settlements | (905 | ) | | — |
| | — |
| — |
| | (905 | ) | | — |
|
| Lapse of statutes of limitation | (117 | ) | | (134 | ) | | (1,150 | ) | (776 | ) | | (117 | ) | | (134 | ) |
| Unrecognized tax benefits at end of the year | $ | 3,339 |
| | $ | 2,440 |
| | $ | 2,468 |
| $ | 941 |
| | $ | 3,339 |
| | $ | 2,440 |
|
Included in the balance of unrecognized tax benefits at December 31, 20122013 and 20112012 were $851410 and $1,265851, respectively, of income tax benefits which, if ultimately recognized, would impact the Company’s annual effective tax rate.
The Company had accrued approximately $10693 and $77106 for the payment of interest and penalties at December 31, 20122013 and 2011,2012, respectively. The Company recorded a net benefit of $8 for interest expense in the year ended December 31, 2013 due to the filing of an amended tax return which offset the accrual of interest expense related to existing uncertain tax positions. The Company accrued approximately $42, $42 and $50$42 for theboth years ended December 31, 2012, 2011, and 2010 respectively,2011 in additional interest associated with uncertain tax positions.
The Company is subject to income taxes in the U.S. federal jurisdiction, and various state and foreign jurisdictions. Tax regulations within each jurisdiction are subject to the interpretation of the related tax laws and regulations and require significant judgment to apply. With few exceptions, the Company is no longer subject to U.S. federal, state and local or non-U.S. income tax examinations by tax authorities for years prior to 2009.
Due to the potential resolution of the federal examination and the expiration of various statutes of limitation, it is reasonably possible the Company's unrecognized tax benefits at December 31, 20122013 may decrease within the next twelve months by approximately $77722.
NOTE G15 — Employee Benefit Plans
Defined Benefit Plan
The Company has a defined benefit pension plan which is frozen, that covers certain U.S. hourly and salary employees. The defined benefit plan provides benefits based primarily on the participants’ years of service and compensation.
The following table sets forth the components of net periodic pension expense are as follows:
| | | | Year Ended December 31, | Year Ended December 31, |
| | 2012 | | 2011 | | 2010 | 2013 | | 2012 | | 2011 |
| Interest cost | $ | 2,206 |
| | $ | 2,409 |
| | $ | 2,447 |
| $ | 2,112 |
| | $ | 2,206 |
| | $ | 2,409 |
|
| Expected return on plan assets | (2,648 | ) | | (2,575 | ) | | (2,353 | ) | (2,705 | ) | | (2,648 | ) | | (2,575 | ) |
| Amortization of net loss | 974 |
| | 365 |
| | 269 |
| 1,348 |
| | 974 |
| | 365 |
|
| Total net periodic pension expense | $ | 532 |
| | $ | 199 |
| | $ | 363 |
| $ | 755 |
| | $ | 532 |
| | $ | 199 |
|
CHART INDUSTRIES, INC. AND SUBSIDIARIES
NOTES TO CONSOLIDATED FINANCIAL STATEMENTS—(Continued)
(Dollars and shares in thousands, except per share amounts)
The following table sets forth changes in the projected benefit obligation and plan assets, the funded status of the plans and the amounts recognized in the consolidated balance sheets:sheets are as follows:
| | | | December 31, | December 31, |
| | 2012 | | 2011 | 2013 | | 2012 |
| Change in projected benefit obligation: | | | | | | |
| Projected benefit obligation at beginning of year | $ | 49,925 |
| | $ | 44,693 |
| $ | 57,268 |
| | $ | 49,925 |
|
| Interest cost | 2,206 |
| | 2,409 |
| 2,112 |
| | 2,206 |
|
| Benefits paid | (1,710 | ) | | (1,641 | ) | (1,813 | ) | | (1,710 | ) |
| Actuarial losses | 6,847 |
| | 4,464 |
| |
| Actuarial (gains) losses | | (6,883 | ) | | 6,847 |
|
| Projected benefit obligation at year end | $ | 57,268 |
| | $ | 49,925 |
| $ | 50,684 |
| | $ | 57,268 |
|
| Change in plan assets: | | | | | | |
| Fair value of plan assets at beginning of year | $ | 34,020 |
| | $ | 33,210 |
| $ | 37,941 |
| | $ | 34,020 |
|
| Actual return (loss) | 3,899 |
| | (473 | ) | 6,202 |
| | 3,899 |
|
| Employer contributions | 1,732 |
| | 2,924 |
| 635 |
| | 1,732 |
|
| Benefits paid | (1,710 | ) | | (1,641 | ) | (1,813 | ) | | (1,710 | ) |
| Fair value of plan assets at year end | $ | 37,941 |
| | $ | 34,020 |
| $ | 42,965 |
| | $ | 37,941 |
|
| Funded status (Accrued pension liabilities) | $ | (19,327 | ) | | $ | (15,905 | ) | $ | (7,719 | ) | | $ | (19,327 | ) |
| | | | | | | |
| Unrecognized actuarial loss recognized in other comprehensive income | $ | 19,978 |
| | $ | 15,355 |
| |
| Unrecognized actuarial loss recognized in accumulated other comprehensive income | | $ | 8,250 |
| | $ | 19,978 |
|
The estimated net loss for the defined benefit pension plan that will be amortized from accumulated other comprehensive income into net periodic benefit cost over the next fiscal year is $1,348320.
The actuarial assumptions used in determining pension plan information are as follows:
| | | | December 31, | December 31, |
| | 2012 | | 2011 | | 2010 | 2013 | | 2012 | | 2011 |
| Assumptions used to determine benefit obligation at year end: | | | | | | | | | | |
| Discount rate | 3.75 | % | | 4.50 | % | | 5.50 | % | 4.75 | % | | 3.75 | % | | 4.50 | % |
| Assumptions used to determine net periodic benefit cost: | | | | | | | | | | |
| Discount rate | 4.50 | % | | 5.50 | % | | 6.00 | % | 3.75 | % | | 4.50 | % | | 5.50 | % |
| Expected long-term weighted-average rate of return on plan assets | 7.75 | % | | 7.75 | % | | 7.75 | % | 7.25 | % | | 7.75 | % | | 7.75 | % |
The discount rate reflects the current rate at which the pension liabilities could be effectively settled at year end. In estimating this rate, the Company looks to rates of return on high quality, fixed-income investments that receive one of the two highest ratings given by a recognized rating agency and the expected timing of benefit payments under the plan.
The expected return assumptions were developed using a simplean averaging formula based upon the plans’ investment guidelines, mix of asset classes, historical returns of equities and bonds, and expected future returns. The Company employs a total return investment approach whereby a mix of equities and fixed income investments are used to maximize the long-term return of plan assets for a prudent level of risk. Risk tolerance is established through careful consideration of short and long-term plan liabilities, plan funded status and corporate financial condition. The investment portfolio contains a diversified blend of equity and fixed-income investments. Furthermore, equity investments are diversified across U.S. and non-U.S. stocks, as well as growth, value, and small and large capitalizations. Investment risk is measured and monitored on an ongoing basis through quarterly investment portfolio reviews, annual liability measurements and periodic asset/liability studies.
CHART INDUSTRIES, INC. AND SUBSIDIARIES
NOTES TO CONSOLIDATED FINANCIAL STATEMENTS—(Continued)
(Dollars and shares in thousands, except per share amounts)
The target asset allocations and fair values by asset category at December 31 are as follows:
|
| | | | | | | | | | | | | | | | | | | | | | |
| | | | Fair Value |
| | | | Total | | Level 2 | | Level 3 |
| Asset category: | Target | | 2013 | | 2012 | | 2013 | | 2012 | | 2013 |
| Equity | 55 | % | | $ | 26,668 |
| | $ | 21,265 |
| | $ | 26,668 |
| | $ | 21,265 |
| | $ | — |
|
| Fixed income funds | 43 | % | | 12,527 |
| | 16,650 |
| | 12,527 |
| | 16,650 |
| | — |
|
| Cash and cash equivalents | 2 | % | | — |
| | 26 |
| | — |
| | 26 |
| | — |
|
| Other investments | — | % | | 3,770 |
| | — |
| | 1,609 |
| | — |
| | 2,161 |
|
| Total | 100 | % | | $ | 42,965 |
| | $ | 37,941 |
| | $ | 40,804 |
| | $ | 37,941 |
| | $ | 2,161 |
|
The plan assets are primarily invested in pooled separate accounts. The fair values of participation units held in pooled separate accounts are based on their net asset values, as reported by the managers of the pooled separate accounts as supported by the unit prices of actual purchase and sale transactions occurring as of or closenear to the financial statement date. Therefore, the Company’sThese plan assets are valued using Level 2 inputs. The target asset allocations and fair values byinputs as defined in Note 11. Certain plan assets in the other investments asset category at December 31 are invested in a general investment fund where the fair value is derived from the liquidation value based on an actuarial formula as follows:defined under terms of the investment contract. These plan assets were valued using unobservable inputs and, accordingly, the valuation was performed using Level 3 inputs as defined in Note 11.
The following table represents changes in the fair value of plan assets categorized as Level 3 from the preceding table:
|
| | | | | | | | | | |
| | | | Fair Value |
| Assets: | Target | | 2012 | | 2011 |
| Pooled separate accounts - Equity | 55 | % | | $ | 21,265 |
| | $ | 19,109 |
|
| Pooled separate accounts - Fixed income funds | 43 | % | | 16,650 |
| | 14,909 |
|
| Pooled separate accounts - Cash and cash equivalents | 2 | % | | 26 |
| | 2 |
|
| Total | 100 | % | | $ | 37,941 |
| | $ | 34,020 |
|
|
| | | |
| | December 31, 2013 |
| Balance at beginning of year | $ | — |
|
| Return on plan assets | 30 |
|
| Purchases, sales and settlements, net | (1,925 | ) |
| Transfers, net | 4,056 |
|
| Balance at end of year | $ | 2,161 |
|
The Company’s funding policy is to contribute at least the minimum funding amounts required by law. Based upon current actuarial estimates, the Company expects to contribute $6351,729 to its defined benefit pension plan in 2013.2014. The following benefit payments are expected to be paid by the plan in each of the next five years and in the aggregate for the subsequent five years:
| | | 2013 | $ | 1,900 |
| |
| 2014 | 2,000 |
| $ | 2,000 |
|
| 2015 | 2,100 |
| 2,100 |
|
| 2016 | 2,200 |
| 2,200 |
|
| 2017 | 2,400 |
| 2,400 |
|
| 2018 | | 2,600 |
|
| In aggregate during five years thereafter | 14,400 |
| 15,000 |
|
Multi-Employer Plan
The Company contributes to a multi-employer plan for certain collective bargaining U.S. employees. The risks of participating in this multi-employer plan are different from a single employer plan in the following aspects:
| |
| (a) | Assets contributed to the multi-employer by one employer may be used to provide benefits to employees of other participating employers. |
| |
| (b) | If a participating employer ceases contributing to the plan, the unfunded obligations of the plan may be inherited by the remaining participating employers. |
| |
| (c) | If the Company chooses to stop participating in the multi-employer plan, the Company may be required to pay those plans an amount based on the underfunded status of the plan, referred to as a withdrawal liability. |
CHART INDUSTRIES, INC. AND SUBSIDIARIES
NOTES TO CONSOLIDATED FINANCIAL STATEMENTS—(Continued)
(Dollars and shares in thousands, except per share amounts)
The Company has assessed and determined that the multi-employer plan to which it contributes is not significant to the Company's financial statements. The Company does not expect to incur a withdrawal liability or expect to significantly increase its contribution over the remainder of the current contract period which ends in February 2018. The Company made contributions to the bargaining unit supported multi-employer pension plan resulting in expense of $760908, $518760 and $391518 for the years ended December 31, 2013, 2012 2011 and 20102011, respectively.
Defined Contribution Savings Plan
The Company has a defined contribution savings plan that covers most of its U.S. employees. Company contributions to the plan are based on employee contributions, and a Company match and discretionary contributions. Expenses under the plan totaled $8,0119,814, $6,2418,011 and $4,9496,241 for the years ended December 31, 2013, 2012 2011 and 20102011, respectively.
Voluntary Deferred Income Plan
The Company provides additional retirement plan benefits to certain members of management under the Amended and Restated Chart Industries, Inc. Voluntary Deferred Income Plan; this is an unfunded plan. The Company recorded $507276 and $507 of expense associated with this plan for the yearyears ended December 31, 2012.2013 and 2012, respectively.
CHART INDUSTRIES, INC. AND SUBSIDIARIES
NOTES TO CONSOLIDATED FINANCIAL STATEMENTS—(Continued)
(Dollars and shares in thousands, except per share amounts)
NOTE H16 — Share-based Compensation
Under the Amended and Restated 2005 Stock Incentive Plan (Stock(“Stock Incentive Plan)Plan”) which became effective in October 2005, the Company could grant stock options, stock appreciation rights (SARs)(“SARs”), restricted stock units (RSUs)(“RSUs”), stock awards and performance based stock awards to employees and directors. The Stock Incentive Plan had reserved 3,421 shares of the Company's common stock for issuance. As of December 31, 20122013, 351139 options were outstanding under the Stock Incentive Plan. The Company no longer grants stock options or awards under this plan.
Under the Amended and Restated 2009 Omnibus Equity Plan (Omnibus(“Omnibus Equity Plan)Plan”) which was originally approved by the shareholders in May 2009 and reapproved by shareholders in May 2012 as amended and restated, the Company may grant stock options, SARs, RSUs, restricted stock, performance shares, leveraged restricted shares, and common shares to employees and directors. The maximum number of shares available for grant is 3,350, which may be treasury shares or unissued shares. As of December 31, 20122013, 398371 options, 13297 restricted stock awards, 6886 performance stock units, and 1840 leveraged restricted share units were outstanding under the Omnibus Equity Plan.
The Company recognized share-based compensation expense of $7,4619,989, $5,4337,461 and $4,9335,433 for the years ended December 31, 2013, 2012 2011 and 20102011, respectively. This expense is included in selling, general and administrative expenses in the consolidated statements of income. The Company also recognized related tax benefits of $8,9726,673, $7,8798,972 and $7967,879 for the years ended December 31, 2013, 2012 2011 and 20102011, respectively. As of December 31, 20122013, total share-based compensation of $7,5789,146 is expected to be recognized over the remaining weighted-average period of approximately 2.11.9 years assuming performance units are earned at their maximum payout potential.
Stock Options
The Company uses a Black-Scholes option pricing model to estimate the fair value of stock options. The expected volatility and expected term of the options are based on historical information. The risk free rate is based on the U.S. Treasury yield in effect at the time of the grant. Weighted-average grant dategrant-date fair values of stock options and the assumptions used in estimating the fair values are as follows:
| | | | 2012 | | 2011 | | 2010 | Year Ended December 31, |
| Weighted-average grant date fair value per share | $ | 35.69 |
| | $ | 24.33 |
| | $ | 12.03 |
| |
| | | 2013 | | 2012 | | 2011 |
| Weighted-average grant-date fair value per share | | $ | 41.52 |
| | $ | 35.69 |
| | $ | 24.33 |
|
| Expected term (years) | 6.25 |
| | 6.25 |
| | 6.25 |
| 6.25 |
| | 6.25 |
| | 6.25 |
|
| Risk-free interest rate | 1.15 | % | | 2.43 | % | | 2.46 | % | 1.00 | % | | 1.15 | % | | 2.43 | % |
| Expected volatility | 70.71 | % | | 72.47 | % | | 77.84 | % | 66.80 | % | | 70.71 | % | | 72.47 | % |
CHART INDUSTRIES, INC. AND SUBSIDIARIES
NOTES TO CONSOLIDATED FINANCIAL STATEMENTS—(Continued)
(Dollars and shares in thousands, except per share amounts)
Under the terms of the Omnibus Equity Plan, and the Stock Incentive Plan, stock options generally have either a 4 or 5 year graded vesting period, an exercise price equal to the fair market value of a share of common stock on the date of grant, and a contractual term of 10 years. The following table summarizes the Company’s stock option activity:
| | | | December 31, 2012 | December 31, 2013 |
| | Number of Shares | | Weighted-average Exercise Price | | Aggregate Intrinsic Value | | Weighted- average Remaining Contractual Term | Number of Shares | | Weighted-average Exercise Price | | Aggregate Intrinsic Value | | Weighted- average Remaining Contractual Term |
| Outstanding at beginning of year | 978 |
| | $ | 16.69 |
| | | | 749 |
| | $ | 24.21 |
| | | | |
| Granted | 103 |
| | 56.06 |
| | | | 82 |
| | 68.21 |
| | | |
| Exercised | (316 | ) | | 11.13 |
| | | | (315 | ) | | 16.97 |
| | | |
| Forfeited | (16 | ) | | 31.25 |
| | | | | (6 | ) | | 43.17 |
| | | | |
| Outstanding at end of year | 749 |
| | $ | 24.21 |
| | $ | 31,816 |
| | 6.2 years | 510 |
| | $ | 35.54 |
| | $ | 30,676 |
| | 6.5 years |
| Vested and expected to vest at end of year | | 504 |
| | $ | 35.27 |
| | $ | 30,446 |
| | 6.5 years |
| Exercisable at end of year | 441 |
| | $ | 16.36 |
| | $ | 22,188 |
| | 5.0 years | 236 |
| | $ | 21.61 |
| | $ | 17,460 |
| | 5.1 years |
As of December 31, 20122013, total unrecognized compensation cost related to stock options expected to be recognized over the weighted-average period of approximately 2.62.3 years is $2,4322,222.
CHART INDUSTRIES, INC. AND SUBSIDIARIES
NOTES TO CONSOLIDATED FINANCIAL STATEMENTS—(Continued)
(Dollars and shares in thousands, except per share amounts)
The total intrinsic value of options exercised during the years ended December 31, 2013, 2012 2011 and 20102011 was $18,31021,199, $28,78418,310 and $3,32728,784, respectively. The total fair value of stock options vested during the years ended December 31, 2013, 2012 2011 and 20102011 was $2,2162,673, $1,9572,216 and $1,7551,957, respectively.
Restricted Stock and Restricted Stock Units
Restricted stock and restricted stock unit awards generally vest ratably over a three-year period and are valued based on the Company's market price on the date of grant. Restricted stock awards are recognized on a straight-line basis over the vesting period. The following table summarizes the Company’s unvested restricted stock and restricted stock unit awards activity:
| | | | December 31, 2012 | December 31, 2013 |
| | Number of Shares | | Weighted-Average Grant-Date Fair Value | Number of Shares | | Weighted-Average Grant-Date Fair Value |
| Unvested at beginning of year | 171 |
| | $ | 23.53 |
| 132 |
| | $ | 36.60 |
|
| Granted | 44 |
| | 60.80 |
| 49 |
| | 69.72 |
|
| Forfeited | (7 | ) | | 35.06 |
| (2 | ) | | 56.06 |
|
| Vested | (76 | ) | | 21.89 |
| (82 | ) | | 26.61 |
|
| Unvested at end of year | 132 |
| | $ | 36.60 |
| 97 |
| | $ | 61.48 |
|
As of December 31, 20122013, total unrecognized compensation cost related to unvested restricted stock and restricted stock unit awards expected to be recognized over the weighted-average period of approximately 2.21.8 years is $1,6252,529.
The weighted-average grant-date fair value of restricted stock and restricted stock unit awards granted during the years ended December 31, 2013, 2012 and 2011 was $69.72, $60.80 and $36.75, respectively. The total fair value of restricted stock and restricted stock unit awards that vested during the years ended December 31, 2013, 2012 and 2011 was $5,782, $4,654 and $2,755, respectively.
CHART INDUSTRIES, INC. AND SUBSIDIARIES
NOTES TO CONSOLIDATED FINANCIAL STATEMENTS—(Continued)
(Dollars and shares in thousands, except per share amounts)
Performance Units
Performance unit awards granted in 2012 and 2011 are earned over a three-year period beginning on January 1, 2012 and 2011, respectively.period. Based on the attainment of pre-determined performance condition targets as determined by the Compensation Committee of the Board of Directors, units earned may be in the range of between 0% and 200% for 2012 and 2013 awards and 0% and to 150% for 2011 awards. The probability of any units being earned is evaluated each reporting period, and the fair value of the awards which are valued based on the market price on the date of grant, is adjusted accordingly. The following table summarizes the Company’s performance unit awards activity:
| | | | December 31, 2012 | December 31, 2013 |
| | Number of Shares | | Weighted-Average Grant-Date Fair Value | Number of Shares | | Weighted-Average Grant-Date Fair Value |
| Unvested at beginning of year | 187 |
| | $ | 18.70 |
| 68 |
| | $ | 41.07 |
|
| Granted | 15 |
| | 55.93 |
| 19 |
| | 68.21 |
|
| Forfeited | (6 | ) | | 21.56 |
| (1 | ) | | 36.45 |
|
| Vested | (128 | ) | | 11.02 |
| |
| Unvested at end of year | 68 |
| | $ | 41.07 |
| 86 |
| | $ | 46.94 |
|
As of December 31, 20122013, total unrecognized compensation cost related to performance unit awards expected to be recognized over the weighted-average period of approximately 1.61.7 years is $2,4602,597 assuming performance units are earned at their maximum payout potential.
CHART INDUSTRIES, INC. AND SUBSIDIARIES
NOTES TO CONSOLIDATED FINANCIAL STATEMENTS—(Continued)
(DollarsThe weighted-average grant-date fair value of performance unit awards granted during the years ended December 31, 2013, 2012 and shares in thousands, except per share amounts)2011 was $68.21, $55.93 and $36.45, respectively. The total fair value of performance unit awards that vested during the year ended December 31, 2012 was $9,386.
Leveraged Restricted Share Units
Leveraged restricted share unit awards granted in 2012 vest based solely on the attainment of pre-determined market condition targets as determined by the Compensation Committee of the Board of Directors over a three-year performance period beginning on January 1, 2012.period. Units earned may be in the range of between 50% and 150%. The Company valued the leverage restricted share unit awards based on market conditions using a Monte Carlo Simulation model that was performed by an outside valuation firm.model. The following table summarizes the Company’s leveraged restricted share unit awards activity:
| | | | December 31, 2012 | December 31, 2013 |
| | Number of Shares | | Weighted-average Grant-Date Fair Value | Number of Shares | | Weighted-average Grant-Date Fair Value |
| Unvested at beginning of year | — |
| | $ | — |
| 18 |
| | $ | 67.05 |
|
| Granted | 18 |
| | 67.05 |
| 22 |
| | 80.34 |
|
| Unvested at end of year | 18 |
| | $ | 67.05 |
| 40 |
| | $ | 74.36 |
|
As of December 31, 20122013, total unrecognized compensation cost related to leveraged restricted share awards expected to be recognized over the weighted-average period of approximately 2.01.7 years is $1,0611,798, assuming units are earned at their maximum payout potential..
The weighted-average grant-date fair value of leveraged restricted share awards granted during the years ended December 31, 2013 and 2012 was $80.34 and $67.05, respectively.
Directors' Stock Grants
In 2013, 2012 2011 and 20102011, the Company granted the non-employee directors stock awards covering 54, 85 and 188 shares of common stock, respectively, thatwhich had fair market values of $368393, $360368 and $330360, respectively. These stock awards were fully vested on the date of grant.
CHART INDUSTRIES, INC. AND SUBSIDIARIES
NOTES TO CONSOLIDATED FINANCIAL STATEMENTS—(Continued)
(Dollars and shares in thousands, except per share amounts)
NOTE I17 — Lease Commitments
The Company incurred $9,98010,581, $8,8179,980, and $8,4818,817 of rental expense under operating leases for the years ended December 31, 2013, 2012 2011 and 20102011, respectively. Certain leases contain rent escalation clauses and lease concessions that require additional rental payments in the later years of the term. Rent expense for these types of leases is recognized on a straight-line basis over the minimum lease term. In addition, the Company has the right, but no obligation, to renew certain leases for various renewal terms.
The following table summarizes the future minimum lease payments for non-cancelable operating leases as of December 31, 20122013:
| | | 2013 | $ | 7,195 |
| |
| 2014 | 5,248 |
| $ | 10,195 |
|
| 2015 | 4,026 |
| 6,700 |
|
| 2016 | 3,056 |
| 5,011 |
|
| 2017 | 2,515 |
| 4,181 |
|
| 2018 | | 3,146 |
|
| Thereafter | 9,069 |
| 9,183 |
|
| Total future minimum lease payments | $ | 31,109 |
| $ | 38,416 |
|
NOTE J18 — Contingencies
Environmental
The Company is subject to federal, state and local environmental laws and regulations concerning, among other matters, waste water effluents, air emissions and handling and disposal of hazardous materials such as cleaning fluids. The Company is involved with environmental compliance, investigation, monitoring and remediation activities at certain of its owned and formerly owned manufacturing facilities and at one owned facility that is leased to a third party, and, except for these continuing remediation efforts, believes it is currently in substantial compliance with all known environmental regulations. At December 31, 20122013 and 20112012, the Company had undiscounted accrued environmental reserves of $4,5863,871 and $4,7454,586, respectively, recorded in other long-term liabilities. The Company accrues for certain environmental remediation-related
CHART INDUSTRIES, INC. AND SUBSIDIARIES
NOTES TO CONSOLIDATED FINANCIAL STATEMENTS—(Continued)
(Dollars and shares in thousands, except per share amounts)
activities for which commitments or remediation plans have been developed and for which costs can be reasonably estimated. These estimates are determined based upon currently available facts and circumstances regarding each facility. Actual costs incurred may vary from these estimates due to the inherent uncertainties involved. Future expenditures relating to these environmental remediation efforts are expected to be made over the next 14 years as ongoing costs of remediation programs.
Although the Company believes it has adequately provided for the cost of all known environmental conditions, the applicable regulatory agencies could insist upon different and more costly remediation than those the Company believes are adequate or required by existing law or third parties may seek to impose environmental liabilities on the Company. The Company believes that any additional liability in excess of amounts accrued which may result from the resolution of such matters will not have a material adverse effect on the Company’s financial position, liquidity, cash flows or results of operations.
Legal Proceedings
In November 2012, Chart Energy & Chemicals, Inc. (CEC)(“CEC”), a subsidiary of the Company, filed a declaratory judgment action in the United States District Court for the Western District of Oklahoma (the “Federal Court”) seeking a judgment that certain claims for damages alleged by Enogex Holdings LLC, Enogex Gathering & Processing, LLC and affiliated companies with respect to a December 2010 fire at the Enogex natural gas processing plant in Cox City, Oklahoma were barred based on multiple defenses, including Oklahoma's statute of repose. This action was precipitated by the receipt of a letter from Enogex alleging that CEC was responsible for damages in excess of $75,000 with respect to the fire as a result of the alleged failure of CEC's equipment that was a component of the unit involved in the fire. Subsequent to the filing of CEC's declaratory judgment action, in December 2012, Enogex filed suit in the District Court of Tulsa County, State of Oklahoma (the “State Court”) against the Company, CEC and its predecessors, a former employee of a predecessor of CEC, as well as other entities and an individual not affiliated with the Company, formalizing the allegations and claims contained in the November demand letter. Each party has filed a motionone or more motions to dismiss the other's lawsuitlawsuit. Enogex's motion to dismiss initially was denied by the Federal Court in February 2013, but Enogex moved for rehearing on its motion to dismiss, which the Federal Court granted on
CHART INDUSTRIES, INC. AND SUBSIDIARIES
NOTES TO CONSOLIDATED FINANCIAL STATEMENTS—(Continued)
(Dollars and it is likely that oneshares in thousands, except per share amounts)
May 17, 2013 based on a lack of jurisdictional diversity. The Company's and CEC's motions to dismiss were denied by the existing actions will ultimatelyState Court on April 10, 2013. Accordingly, litigation continues in the State Court, and Enogex has asserted damages of approximately $105,000, including investigation and repair costs and business interruption losses, some of which may be dismissed or stayed given the commonality of facts underlying each lawsuit.offset by Enogex's saved costs and mitigation efforts. The Company does notcontinues to believe that the allegations against the Company, CEC orand their affiliates in Enogex's complaint havelack merit. The Company in any event believes that it, CEC and their affiliates have strong factual and legal defenses to Enogex's claims and intends to vigorously assert such defenses. Accordingly, an accrual related to any damages that may result from the lawsuit has not been recorded because a potential loss is not currently probable. Furthermore, the Company believes that its existing product liability insurance is adequate for potential losses associated with these claims. While the Company cannot predict with certainty the ultimate result of these proceedings, the Company does not believe that the final outcome of these proceedings will have a material adverse affecteffect on the Company's financial position, results of operations, or cash flows.
The Company is occasionally subject to various legal actions related to performance under contracts, product liability, taxes, employment matters, environmental matters, intellectual property and other matters incidental to the normal course of its business. Based on the Company’s historical experience in litigating these actions, as well as the Company’s current assessment of the underlying merits of the actions and applicable insurance, if any, management believes that the final resolution of these matters will not have a material adverse affecteffect on the Company’s financial position, liquidity, cash flows or results of operations. Future developments may, however, result in resolution of these legal claims in a way that could have a material adverse effect.
NOTE K19 — Segment and Geographic Information
The structure of the Company’s internal organization is divided into the following reportable segments, which are also the Company's operating segments: Energy and& Chemicals (E&C)(“E&C”), Distribution and& Storage (D&S)(“D&S”) and BioMedical. The Company’s reportable segments are business units that are each managed separately because they manufacture, offer and distribute distinct products with different production processes and sales and marketing approaches. The E&C segment sells brazed aluminum and air-cooled heat exchangers and cold boxes to natural gas, petrochemical processing and industrial gas companies who use them for the liquefaction and separation of natural and industrial gases. The D&S segment sells cryogenic bulk storage systems, cryogenic packaged gas systems, cryogenic systems and components, beverage liquid CO2 systems, cryogenic flow meter systems and cryogenic services to various companies for the storage and transportation of both industrial and natural gases. The BioMedical segment sells medical respiratory products, biological storage systems and other oxygen products. Due to the nature of the products that each segment sells, there are no intersegment sales. Corporate includes operating expenses for executive management, accounting, tax, treasury, development, human resources, information technology, investor relations, legal, internal audit, risk management and share-based compensation expenses that are not allocated to the reporting segments.
CHART INDUSTRIES, INC. AND SUBSIDIARIES
NOTES TO CONSOLIDATED FINANCIAL STATEMENTS—(Continued)
(Dollars and shares in thousands, except per share amounts)
The Company evaluates performance and allocates resources based on operating income or loss from continuing operations before interest expense, net, amortization of deferred financing costs, foreign currency gain (loss), income taxes and noncontrolling interest.interests. The accounting policies of the reportable segments are the same as those described in Note A.2.
Segment Financial Information
| | | | Year Ended December 31, 2012 | Year Ended December 31, 2013 |
| | Energy and Chemicals | | Distribution and Storage | | BioMedical | | Corporate | | Total | Energy & Chemicals | | Distribution & Storage | | BioMedical | | Corporate | | Total |
| Sales from external customers | $ | 323,676 |
| | $ | 475,576 |
| | $ | 214,900 |
| | $ | — |
| | $ | 1,014,152 |
| |
| Sales to external customers | | $ | 318,510 |
| | $ | 592,616 |
| | $ | 266,312 |
| | $ | — |
| | $ | 1,177,438 |
|
| Depreciation and amortization expense | 7,877 |
| | 12,599 |
| | 10,204 |
| | 1,516 |
| | 32,196 |
| 8,564 |
| | 15,237 |
| | 14,618 |
| | 1,970 |
| | 40,389 |
|
| Operating income (loss) | 64,931 |
| | 79,175 |
| | 24,079 |
| | (46,372 | ) | | 121,813 |
| 59,671 |
| | 93,560 |
| | 33,039 |
| | (50,273 | ) | | 135,997 |
|
| Total assets (1) | 203,044 |
| | 607,252 |
| | 447,792 |
| | 69,753 |
| | 1,327,841 |
| 277,760 |
| | 676,484 |
| | 431,763 |
| | 75,623 |
| | 1,461,630 |
|
| Capital expenditures | 9,519 |
| | 30,048 |
| | 2,717 |
| | 1,401 |
| | 43,685 |
| 34,194 |
| | 32,039 |
| | 3,370 |
| | 2,982 |
| | 72,585 |
|
CHART INDUSTRIES, INC. AND SUBSIDIARIES
NOTES TO CONSOLIDATED FINANCIAL STATEMENTS—(Continued)
(Dollars and shares in thousands, except per share amounts)
|
| | | | | | | | | | | | | | | | | | | |
| | Year Ended December 31, 2012 |
| | Energy &
Chemicals | | Distribution &
Storage | | BioMedical | | Corporate | | Total |
| Sales to external customers | $ | 323,676 |
| | $ | 475,576 |
| | $ | 214,900 |
| | $ | — |
| | $ | 1,014,152 |
|
| Depreciation and amortization expense | 7,877 |
| | 12,599 |
| | 10,204 |
| | 1,516 |
| | 32,196 |
|
| Operating income (loss) | 64,931 |
| | 79,175 |
| | 24,079 |
| | (46,372 | ) | | 121,813 |
|
Total assets (1) | 203,044 |
| | 607,252 |
| | 447,792 |
| | 69,753 |
| | 1,327,841 |
|
| Capital expenditures | 9,519 |
| | 30,048 |
| | 2,717 |
| | 1,401 |
| | 43,685 |
|
|
| | | | | | | | | | | | | | | | | | | |
| | Year Ended December 31, 2011 |
| | Energy &
Chemicals | | Distribution &
Storage | | BioMedical | | Corporate | | Total |
| Sales to external customers | $ | 205,033 |
| | $ | 390,332 |
| | $ | 199,220 |
| | $ | — |
| | $ | 794,585 |
|
| Depreciation and amortization expense | 7,417 |
| | 11,767 |
| | 7,588 |
| | 1,143 |
| | 27,915 |
|
| Operating income (loss) | 27,489 |
| | 61,415 |
| | 35,911 |
| | (34,821 | ) | | 89,994 |
|
Total assets (1) | 203,067 |
| | 556,688 |
| | 226,729 |
| | 187,991 |
| | 1,174,475 |
|
| Capital expenditures | 5,228 |
| | 7,808 |
| | 6,692 |
| | 2,652 |
| | 22,380 |
|
|
| | | | | | | | | | | | | | | | | | | |
| | Year Ended December 31, 2011 |
| | Energy and Chemicals | | Distribution and Storage | | BioMedical | | Corporate | | Total |
| Sales from external customers | $ | 205,033 |
| | $ | 390,332 |
| | $ | 199,220 |
| | $ | — |
| | $ | 794,585 |
|
| Depreciation and amortization expense | 7,417 |
| | 11,767 |
| | 7,588 |
| | 1,143 |
| | 27,915 |
|
| Operating income (loss) | 27,489 |
| | 61,415 |
| | 35,911 |
| | (34,821 | ) | | 89,994 |
|
| Total assets (1) | 203,067 |
| | 556,688 |
| | 226,729 |
| | 187,991 |
| | 1,174,475 |
|
| Capital expenditures | 5,228 |
| | 7,808 |
| | 6,692 |
| | 2,652 |
| | 22,380 |
|
|
| | | | | | | | | | | | | | | | | | | |
| | Year Ended December 31, 2010 |
| | Energy and Chemicals | | Distribution and Storage | | BioMedical | | Corporate | | Total |
| Sales from external customers | $ | 137,801 |
| | $ | 269,293 |
| | $ | 148,361 |
| | $ | — |
| | $ | 555,455 |
|
| Depreciation and amortization expense | 7,338 |
| | 10,474 |
| | 5,197 |
| | 568 |
| | 23,577 |
|
| Operating income (loss) | 6,121 |
| | 41,934 |
| | 30,698 |
| | (31,249 | ) | | 47,504 |
|
| Total assets (1) | 188,407 |
| | 513,215 |
| | 227,138 |
| | 26,079 |
| | 954,839 |
|
| Capital expenditures | 973 |
| | 8,563 |
| | 4,594 |
| | 2,809 |
| | 16,939 |
|
_______________
| |
(1) | Corporate assets consist primarily of cash, cash equivalents and deferred income taxes. |
The following table represents the changes in goodwill by segment:
| | | | Energy and Chemicals | | Distribution & Storage | | BioMedical | | Total | Energy & Chemicals | | Distribution & Storage | | BioMedical | | Total |
| Balance at January 1, 2011 | $ | 83,215 |
| | $ | 148,010 |
| | $ | 44,027 |
| | $ | 275,252 |
| |
| Foreign currency translation adjustments and other | — |
| | (1,067 | ) | | — |
| | (1,067 | ) | |
| Goodwill acquired during the year | — |
| | 11,438 |
| | 3,147 |
| | 14,585 |
| |
| Balance at December 31, 2011 | 83,215 |
| | 158,381 |
| | 47,174 |
| | 288,770 |
| |
| Balance at January 1, 2012 | | $ | 83,215 |
| | $ | 158,381 |
| | $ | 47,174 |
| | $ | 288,770 |
|
| Foreign currency translation adjustments and other | — |
| | 408 |
| | — |
| | 408 |
| — |
| | 408 |
| | — |
| | 408 |
|
| Goodwill acquired during the year | — |
| | — |
| | 109,763 |
| | 109,763 |
| — |
| | — |
| | 109,763 |
| | 109,763 |
|
| Balance at December 31, 2012 | $ | 83,215 |
| | $ | 158,789 |
| | $ | 156,937 |
| | $ | 398,941 |
| 83,215 |
| | 158,789 |
| | 156,937 |
| | 398,941 |
|
| Foreign currency translation adjustments and other | | — |
| | 957 |
| | (1,301 | ) | | (344 | ) |
| Goodwill acquired during the year | | — |
| | 308 |
| | — |
| | 308 |
|
| Balance at December 31, 2013 | | $ | 83,215 |
| | $ | 160,054 |
| | $ | 155,636 |
| | $ | 398,905 |
|
CHART INDUSTRIES, INC. AND SUBSIDIARIES
NOTES TO CONSOLIDATED FINANCIAL STATEMENTS—(Continued)
(Dollars and shares in thousands, except per share amounts)
A reconciliation of the total of the reportable segments’ operating income to consolidated income before income taxes is presented below:
|
| | | | | | | | | | | |
| | Year Ended December 31, |
| | 2012 | | 2011 | | 2010 |
| Operating income | $ | 121,813 |
| | $ | 89,994 |
| | $ | 47,504 |
|
| Other expense (income): | | | | | |
| Interest expense, net | 15,679 |
| | 23,371 |
| | 16,196 |
|
| Amortization of deferred financing costs | 1,530 |
| | 4,383 |
| | 3,063 |
|
| Foreign currency loss (gain) | 1,498 |
| | (734 | ) | | 871 |
|
| Gain on acquisition of business | — |
| | — |
| | (1,124 | ) |
| Income before income taxes | $ | 103,106 |
| | $ | 62,974 |
| | $ | 28,498 |
|
Product Sales Information
| | | | Year Ended December 31, | Year Ended December 31, |
| | 2012 | | 2011 | | 2010 | 2013 | | 2012 | | 2011 |
| Energy and Chemicals Segment | | | | | | |
| Energy & Chemicals | | | | | | |
| Heat exchangers – Brazed aluminum | $ | 146,110 |
| | $ | 92,013 |
| | $ | 62,597 |
| $ | 170,104 |
| | $ | 146,110 |
| | $ | 92,013 |
|
| Heat exchangers – Air cooled | 69,977 |
| | 66,962 |
| | 50,716 |
| 54,275 |
| | 69,977 |
| | 66,962 |
|
| Cold boxes | 107,589 |
| | 46,058 |
| | 24,488 |
| 94,131 |
| | 107,589 |
| | 46,058 |
|
| | $ | 323,676 |
| | $ | 205,033 |
| | $ | 137,801 |
| |
| Distribution and Storage Segment | | | | | | |
| Energy & Chemicals Total | | 318,510 |
| | 323,676 |
| | 205,033 |
|
| Distribution & Storage | | | | | | |
| Cryogenic bulk storage systems | $ | 153,372 |
| | $ | 153,518 |
| | $ | 102,876 |
| 175,123 |
| | 153,372 |
| | 153,518 |
|
Cryogenic packaged gas systems and beverage liquid CO2 systems | 143,548 |
| | 142,262 |
| | 97,976 |
| 152,922 |
| | 143,548 |
| | 142,262 |
|
| LNG applications | 107,231 |
| | 35,678 |
| | 20,184 |
| 193,032 |
| | 107,231 |
| | 35,678 |
|
| Cryogenic systems, components and services | 71,425 |
| | 58,874 |
| | 48,257 |
| 71,539 |
| | 71,425 |
| | 58,874 |
|
| | $ | 475,576 |
| | $ | 390,332 |
| | $ | 269,293 |
| |
| BioMedical Segment | | | | | | |
| Distribution & Storage Total | | 592,616 |
| | 475,576 |
| | 390,332 |
|
| BioMedical | | | | | | |
| Medical respiratory products | $ | 150,451 |
| | $ | 138,411 |
| | $ | 95,666 |
| 175,233 |
| | 143,878 |
| | 138,411 |
|
| Biological storage systems | 64,449 |
| | 60,809 |
| | 52,695 |
| 61,493 |
| | 64,449 |
| | 60,809 |
|
| | 214,900 |
| | 199,220 |
| | 148,361 |
| |
| Total Sales | $ | 1,014,152 |
| | $ | 794,585 |
| | $ | 555,455 |
| |
| On-site oxygen generation systems | | 29,586 |
| | 6,573 |
| | — |
|
| BioMedical Total | | 266,312 |
| | 214,900 |
| | 199,220 |
|
| Total | | $ | 1,177,438 |
| | $ | 1,014,152 |
| | $ | 794,585 |
|
Geographic Information
Net sales by geographic area are reported by the destination of sales, which is reflective of how the Company operates it segments.sales. Net property, plant and equipment by geographic area are reported by country of origin.domicile.
| | | | Sales for the Year Ended December 31, | | Property, plant and equipment, net as of December 31, | Sales for the Year Ended December 31, |
| | 2012 | | 2011 | | 2010 | | 2012 | | 2011 | 2013 | | 2012 | | 2011 |
| United States | $ | 710,891 |
| | $ | 503,011 |
| | $ | 391,691 |
| | $ | 98,425 |
| | $ | 75,848 |
| $ | 479,067 |
| | $ | 438,294 |
| | $ | 334,517 |
|
| Czech Republic | 70,660 |
| | 87,285 |
| | 72,486 |
| | 21,559 |
| | 21,805 |
| |
| China | 126,161 |
| | 71,752 |
| | 45,203 |
| | 34,158 |
| | 23,410 |
| 231,143 |
| | 149,010 |
| | 92,142 |
|
| Germany | 93,973 |
| | 122,001 |
| | — |
| | 14,402 |
| | 14,672 |
| |
| Other Non-U.S. Countries | 12,467 |
| | 10,536 |
| | 46,075 |
| | 1,232 |
| | 1,566 |
| |
| Rest of World | | 467,228 |
| | 426,848 |
| | 367,926 |
|
| Total | $ | 1,014,152 |
| | $ | 794,585 |
| | $ | 555,455 |
| | $ | 169,776 |
| | $ | 137,301 |
| $ | 1,177,438 |
| | $ | 1,014,152 |
| | $ | 794,585 |
|
|
| | | | | | | | | | | |
| | Property, plant and equipment, net as of December 31, |
| | 2013 | | 2012 | | 2011 |
| United States | $ | 146,610 |
| | $ | 98,425 |
| | $ | 75,848 |
|
| Czech Republic | 23,623 |
| | 21,559 |
| | 21,805 |
|
| China | 38,569 |
| | 34,158 |
| | 23,410 |
|
| Germany | 14,618 |
| | 14,402 |
| | 14,672 |
|
| Other foreign countries | 785 |
| | 1,232 |
| | 1,566 |
|
| Total | $ | 224,205 |
| | $ | 169,776 |
| | $ | 137,301 |
|
CHART INDUSTRIES, INC. AND SUBSIDIARIES
NOTES TO CONSOLIDATED FINANCIAL STATEMENTS—(Continued)
(Dollars and shares in thousands, except per share amounts)
Note LNOTE 20 — Quarterly Data (Unaudited)
Selected quarterly data for the years ended December 31, 20122013 and 20112012 are as follows:
| | | | Year Ended December 31, 2012 | Year Ended December 31, 2013 |
| | First Quarter | | Second Quarter | | Third Quarter | | Fourth Quarter | | Total | First Quarter | | Second Quarter | | Third Quarter | | Fourth Quarter | | Total |
| Sales (1) | $ | 216,106 |
| | $ | 239,939 |
| | $ | 254,249 |
| | $ | 303,858 |
| | $ | 1,014,152 |
| $ | 273,648 |
| | $ | 298,266 |
| | $ | 301,757 |
| | $ | 303,767 |
| | $ | 1,177,438 |
|
| Gross profit | 67,557 |
| | 74,129 |
| | 78,012 |
| | 85,465 |
| | 305,163 |
| 79,450 |
| | 89,806 |
| | 88,645 |
| | 93,822 |
| | 351,723 |
|
| Operating income | 23,861 |
| | 33,083 |
| | 32,032 |
| | 32,837 |
| | 121,813 |
| 27,351 |
| | 32,979 |
| | 35,886 |
| | 39,781 |
| | 135,997 |
|
| Net income | 14,152 |
| | 18,136 |
| | 18,885 |
| | 21,151 |
| | 72,324 |
| 16,108 |
| | 20,603 |
| | 24,847 |
| | 25,804 |
| | 87,362 |
|
| Net income attributable to Chart Industries, Inc. | 14,083 |
| | 17,936 |
| | 18,516 |
| | 20,760 |
| | 71,295 |
| 15,535 |
| | 20,000 |
| | 24,445 |
| | 23,196 |
| | 83,176 |
|
| Net income attributable to Chart Industries, Inc. per share—basic | $ | 0.48 |
| | $ | 0.60 |
| | $ | 0.62 |
| | $ | 0.69 |
| | $ | 2.39 |
| $ | 0.52 |
| | $ | 0.66 |
| | $ | 0.81 |
| | $ | 0.76 |
| | $ | 2.75 |
|
| Net income attributable to Chart Industries, Inc. per share—diluted | $ | 0.47 |
| | $ | 0.59 |
| | $ | 0.61 |
| | $ | 0.69 |
| | $ | 2.36 |
| $ | 0.51 |
| | $ | 0.64 |
| | $ | 0.74 |
| | $ | 0.71 |
| | $ | 2.60 |
|
|
| | | | | | | | | | | | | | | | | | | |
| | Year Ended December 31, 2012 |
| | First Quarter | | Second Quarter | | Third Quarter | | Fourth Quarter | | Total |
Sales (2) | $ | 216,106 |
| | $ | 239,939 |
| | $ | 254,249 |
| | $ | 303,858 |
| | $ | 1,014,152 |
|
| Gross profit | 67,557 |
| | 74,129 |
| | 78,012 |
| | 85,465 |
| | 305,163 |
|
| Operating income | 23,861 |
| | 33,083 |
| | 32,032 |
| | 32,837 |
| | 121,813 |
|
| Net income | 14,152 |
| | 18,136 |
| | 18,885 |
| | 21,151 |
| | 72,324 |
|
| Net income attributable to Chart Industries, Inc. | 14,083 |
| | 17,936 |
| | 18,516 |
| | 20,760 |
| | 71,295 |
|
| Net income attributable to Chart Industries, Inc. per share—basic | $ | 0.48 |
| | $ | 0.60 |
| | $ | 0.62 |
| | $ | 0.69 |
| | $ | 2.39 |
|
| Net income attributable to Chart Industries, Inc. per share—diluted | $ | 0.47 |
| | $ | 0.59 |
| | $ | 0.61 |
| | $ | 0.69 |
| | $ | 2.36 |
|
_______________
| |
(1) | During the first and second quarters of 2013, AirSep added sales of $27,014 and $29,855, respectively. During the third quarter of 2013, incremental sales related to AirSep were $14,174. |
| |
(2) | During the fourth quarter of 2012, AirSep added sales of $31,679. |
|
| | | | | | | | | | | | | | | | | | | |
| | Year Ended December 31, 2011 |
| | First Quarter | | Second Quarter | | Third Quarter | | Fourth Quarter | | Total |
| Sales | $ | 162,941 |
| | $ | 200,698 |
| | $ | 211,311 |
| | $ | 219,635 |
| | $ | 794,585 |
|
| Gross profit | 52,486 |
| | 62,330 |
| | 66,631 |
| | 63,999 |
| | 245,446 |
|
| Operating income | 14,307 |
| | 21,489 |
| | 29,043 |
| | 25,155 |
| | 89,994 |
|
| Net income | 7,403 |
| | 11,020 |
| | 17,505 |
| | 8,316 |
| | 44,244 |
|
| Net income attributable to Chart Industries, Inc. | 7,530 |
| | 10,591 |
| | 17,540 |
| | 8,415 |
| | 44,076 |
|
| Net income attributable to Chart Industries, Inc. per share—basic | $ | 0.26 |
| | $ | 0.36 |
| | $ | 0.60 |
| | $ | 0.29 |
| | $ | 1.51 |
|
| Net income attributable to Chart Industries, Inc. per share—diluted | $ | 0.25 |
| | $ | 0.35 |
| | $ | 0.59 |
| | $ | 0.28 |
| | $ | 1.47 |
|
CHART INDUSTRIES, INC. AND SUBSIDIARIES
SCHEDULE II – VALUATION AND QUALIFYING ACCOUNTS
(Dollars in thousands)
| | | | | | Additions | | | | | | | | | Additions | | | | | | |
| | Balance at beginning of period | | Charged to costs and expenses | | Charged to other accounts | | Deductions | | Translations | | Balance at end of period | Balance at beginning of period | | Charged to costs and expenses | | Charged to other accounts | | Deductions | | Translations | | Balance at end of period |
| Year Ended December 31, 2013: | | | | | | | | | | | | |
| Allowance for doubtful accounts | | $ | 4,080 |
| | $ | 2,447 |
| | $ | 199 |
| (1) | | $ | (1,149 | ) | (2) | | $ | 77 |
| | $ | 5,654 |
|
| Allowance for obsolete and excess inventory | | 4,078 |
| | 2,010 |
| | 675 |
| (1) | | (313 | ) | (3) | | 106 |
| | 6,556 |
|
| Deferred tax assets valuation allowance | | 1,766 |
| | 339 |
| | — |
| | (879 | ) | (4) | | 24 |
| | 1,250 |
|
| Year Ended December 31, 2012: | | | | | | | | | | | | | | | | | | | | | | |
| Allowance for doubtful accounts | $ | 2,360 |
| | $ | 3,067 |
| | $ | 930 |
| (1) | | $ | (2,289 | ) | (2) | | $ | 12 |
| | $ | 4,080 |
| $ | 2,360 |
| | $ | 3,067 |
| | $ | 930 |
| (1) | | $ | (2,289 | ) | (2) | | $ | 12 |
| | $ | 4,080 |
|
| Allowance for obsolete and excess inventory | 3,191 |
| | 2,507 |
| | 1,085 |
| (1) | | (2,732 | ) | (3) | | 27 |
| | 4,078 |
| 3,191 |
| | 2,507 |
| | 1,085 |
| (1) | | (2,732 | ) | (3) | | 27 |
| | 4,078 |
|
| Deferred tax assets valuation allowance | | 1,869 |
| | 1,251 |
| | — |
| | (1,362 | ) | (4) | | 8 |
| | 1,766 |
|
| Year Ended December 31, 2011: | | | | | | | | | | | | | | | | | | | | | | |
| Allowance for doubtful accounts | $ | 3,008 |
| | $ | 4,205 |
| | $ | 52 |
| (1) | | $ | (4,919 | ) | (2) | | $ | 14 |
| | $ | 2,360 |
| $ | 3,008 |
| | $ | 4,205 |
| | $ | 52 |
| (1) | | $ | (4,919 | ) | (2) | | $ | 14 |
| | $ | 2,360 |
|
| Allowance for obsolete and excess inventory | 3,181 |
| | 3,331 |
| | — |
| | (3,398 | ) | (3) | | 77 |
| | 3,191 |
| 3,181 |
| | 3,331 |
| | — |
| | (3,398 | ) | (3) | | 77 |
| | 3,191 |
|
| Year Ended December 31, 2010: | | | | | | | | | | | | |
| Allowance for doubtful accounts | $ | 1,727 |
| | $ | 3,326 |
| | $ | 489 |
| (1) | | $ | (2,552 | ) | (2) | | $ | 18 |
| | $ | 3,008 |
| |
| Allowance for obsolete and excess inventory | 4,184 |
| | 1,800 |
| | 201 |
| (1) | | (2,965 | ) | (3) | | (39 | ) | | 3,181 |
| |
| Deferred tax assets valuation allowance | | 758 |
| | 1,111 |
| | — |
| | — |
| | — |
| | 1,869 |
|
_______________
| |
(1) | Reserves at date of acquisition of subsidiary or subsidiaries. |
| |
(2) | Reversal of amounts previously recorded as bad debt and uncollectible accounts written off. |
| |
(3) | Inventory items written off against the allowance. |
| |
(4) | Deductions to the deferred tax assets valuation allowance relate to decreased deferred tax assets and the release of the valuation allowance. |
INDEX TO EXHIBITS
|
| | |
| | | |
| Exhibit No. | | Description |
2.1 | | Agreement and Plan of Merger, dated as of August 2, 2005 by and among Chart Industries, Inc., certain of its stockholders, First Reserve Fund X, L.P. and CI Acquisition, Inc. (incorporated by reference to Exhibit 2.1 to the Registrant’s Registration Statement on Form S-1 (File No. 333-133254)). |
| | |
| 3.1 | | Amended and Restated Certificate of Incorporation (incorporated by reference to Exhibit 3.1 to Amendment No. 5 to the Registrant’s Registration Statement on Form S-1 (File No. 333-133254)). |
| | |
| 3.2 | | Amended and Restated By-Laws, as amended (incorporated by reference to Exhibit 3.1 to the Registrant’s current report on Form 8-K, filed with the SEC on December 19, 2008 (File No. 001-11442)). |
| | |
| 4.1 | | Form of Certificate (incorporated by reference to Exhibit 4.1 to Amendment No. 4 to the Registrant’s Registration Statement on Form S-1 (File No. 333-133254)). |
| | | |
| 4.2 | | Indenture, dated August 3, 2011 by and between Chart Industries, Inc. and Wells Fargo Bank, National Association (incorporated by reference to Exhibit 4.1 to the Registrant’s Current Report on Form 8-K filed with the SEC on August 5, 2011 (File No. 001-11442)). |
| | | |
| 4.3 | | Supplemental Indenture, dated August 3, 2011 by and between Chart Industries, Inc,Inc. and Wells Fargo Bank, National Association (incorporated by reference to Exhibit 4.2 to the Registrant’s Current Report on Form 8-K filed with the SEC on August 5, 2011(File No. 001-11442)). |
| | | |
| 4.4 | | Form of 2.00% Convertible Senior Subordinated Notes due 2018 (incorporated by reference to Exhibit 4.3 to the Registrant’s Current Report on Form 8-K filed with the SEC on August 5, 2011 (File No. 001-11442)). |
| | | |
| 10.1 | | Form of Amended and Restated Management Stockholders Agreement (incorporated by reference to Exhibit 10.10 to Amendment No. 3 to the Registrant’s Registration Statement on Form S-1 (File No. 333-133254)). |
| | |
| 10.2 | | Amended and Restated Chart Industries, Inc. 2005 Stock Incentive Plan (incorporated by reference to Exhibit 10.3 to the Registrant’s Annual Report on Form 10-K for the year ended December 31, 2008 (File No. 001-11442)).* |
| | |
| 10.2.1 | | Form of Nonqualified Stock Option Agreement (2005 and 2006 grants) under the Amended and Restated Chart Industries, Inc. 2005 Stock Incentive Plan (incorporated by reference to Exhibit 10.17 to the Registrant’s Registration Statement on Form S-1 (File No. 333-133254)).* |
| |
10.2.2 | | Form of Restricted Stock Unit Agreement (for non-employee directors) under the Amended and Restated Chart Industries, Inc. 2005 Stock Incentive Plan (incorporated by reference to Exhibit 10.22 to Amendment No. 4 to the Registrant’s Registration Statement on Form S-1 (File No. 333-133254)).* |
| | |
10.2.310.2.2 | | Form of 2009 Performance Unit Agreement under the Amended and Restated Chart Industries, Inc. 2005 Stock Incentive Plan (incorporated by reference to Exhibit 10.3.5 to the Registrant’s Annual Report on Form 10-K for the year ended December 31, 2008 (File No. 001-11442)).* |
| | |
10.2.410.2.3 | | Form of Nonqualified Stock Option Agreement (2007 and 2008 grants) under the Amended and Restated Chart Industries, Inc. 2005 Stock Incentive Plan (incorporated by reference to Exhibit 10.2 to the Registrant’s current report on Form 8-K, filed with the SEC on August 7, 2007 (File No. 001-11442)).* |
| | |
10.2.510.2.4 | | Form of Nonqualified Stock Option Agreement (2009 grants) under the Amended and Restated Chart Industries, Inc. 2005 Stock Incentive Plan (incorporated by reference to Exhibit 10.3.7 to the Registrant’s Annual Report on Form 10-K for the year ended December 31, 2008 (File No. 001-11442)).* |
| | | |
10.2.610.2.5 | | Forms of Stock Award Agreement and Deferral Election Form (for non-employee directors) (2008 grants) under the Amended and Restated Chart Industries, Inc. 2005 Stock Incentive Plan (incorporated by reference to Exhibit 10.4.6 to the Registrant’s Annual Report on Form 10-K for the year ended December 31, 2007 (File No. 001-11442)).* |
| | |
10.2.710.2.6 | | Forms of Stock Award Agreement and Deferral Election Form (for non-employee directors) (2009 grants) under the Amended and Restated Chart Industries, Inc. 2005 Stock Incentive Plan (incorporated by reference to Exhibit 10.1 to the Registrant’s Quarterly Report on Form 10-Q for the quarter ended September 30, 2008 (File No. 001-11442)).* |
| | |
| 10.3 | | Chart Industries, Inc. Amended and Restated 2009 Omnibus Equity Plan (incorporated by reference to Appendix A to the Registrant’s definitive proxy statement filed with the Securities and Exchange Commission on April 10, 2012 (File No. 001-11442)).* |
|
| | |
| 10.3.1 | | Amendment No. 1 to the Chart Industries, Inc. Amended and Restated 2009 Omnibus Equity Plan (incorporated by reference to Exhibit 10.1 to the Registrant’s Quarterly Report on Form 10-Q for the quarter ended September 30, 2012 (File No. 001-11442)).* |
| | |
| 10.3.2 | | Form of Nonqualified Stock Option Agreement (2010 grants) under the Chart Industries, Inc. 2009 Omnibus Equity Plan (incorporated by reference to Exhibit 10.4.1 to the Registrant’s Annual Report on Form 10-K for the year ended December 31, 2009 (File No. 001-11442)).* |
| | |
|
| | |
| 10.3.3 | | Form of Restricted Stock Agreement (2010 grants) under the Chart Industries, Inc. 2009 Omnibus Equity Plan (incorporated by reference to Exhibit 10.4.2 to the Registrant’s Annual Report on Form 10-K for the year ended December 31, 2009 (File No. 001-11442)).* |
| | |
| 10.3.4 | | Forms of Stock Award Agreement and Deferral Election Form (for eligible directors) under the Chart Industries, Inc. 2009 Omnibus Equity Plan (incorporated by reference to Exhibit 10.4.3 to the Registrant’s Annual Report on Form 10-K for the year ended December 31, 2009 (File No. 001-11442)).* |
| | |
| 10.3.5 | | Form of Nonqualified Stock Option Agreement (2011 grants) under the Chart Industries, Inc. 2009 Omnibus Equity Plan (incorporated by reference to Exhibit 10.3.4 to the Registrant’s Annual Report on Form 10-K for the year ended December 31, 2010 (File No. 001-11442)).* |
| | | |
| 10.3.6 | | Form of Restricted Stock Agreement (2011 grants) under the Chart Industries, Inc. 2009 Omnibus Equity Plan (incorporated by reference to Exhibit 10.3.5 to the Registrant’s Annual Report on Form 10-K for the year ended December 31, 2010 (File No. 001-11442)).* |
| | |
| 10.3.7 | | Form of Performance Unit Agreement (2011 grants) under the Chart Industries, Inc. 2009 Omnibus Equity Plan (incorporated by reference to Exhibit 10.3.6 to the Registrant’s Annual Report on Form 10-K for the year ended December 31, 2010 (File No. 001-11442)).* |
| | | |
| 10.3.8 | | Form of Leveraged Restricted Share Unit Agreement (2012 and 2013 grants) under the Chart Industries, Inc. Amended and Restated 2009 Omnibus Equity Plan (incorporated by reference to Exhibit 10.5 to the Registrant’s Current Report on Form 8-K filed with the SEC on January 5, 2012 (File No. 001-11442)).* |
| | | |
10.3.9
| | Form of Nonqualified Stock Option Agreement (2012 grants) under the Chart Industries, Inc. 2009 Omnibus Equity Plan (incorporated by reference to Exhibit 10.3.8 to the Registrant’s Annual Report on Form 10-K for the year ended December 31, 2011 (File No. 001-11442)).*
|
| | | |
| 10.3.10 | | Form of Performance Unit Agreement (2012 grants) under the Chart Industries, Inc. 2009 Omnibus Equity Plan (incorporated by reference to Exhibit 10.3.9 to the Registrant’s Annual Report on Form 10-K for the year ended December 31, 2011 (File No. 001-11442)).* |
| | | |
| 10.3.11 | | Form of Nonqualified Stock Option Agreement (2013 grants) under the Chart Industries, Inc. Amended and Restated 2009 Omnibus Equity Plan.Plan (incorporated by reference to Exhibit 10.3.11 to the Registrant’s Annual Report on Form 10-K for the year ended December 31, 2012 (File No. 001-11442)).* (x) |
| | | |
| 10.3.12 | | Form of Performance Unit Agreement (2013 grants) under the Chart Industries, Inc. Amended and Restated 2009 Omnibus Equity Plan (incorporated by reference to Exhibit 10.3.12 to the Registrant’s Annual Report on Form 10-K for the year ended December 31, 2012 (File No. 001-11442)).* |
| | |
| 10.3.13 | | Form of Nonqualified Stock Option Agreement (2014 grants) under the Chart Industries, Inc. Amended and Restated 2009 Omnibus Equity Plan.* (x) |
| | |
| 10.3.14 | | Form of Performance Unit Agreement (2014 grants) under the Chart Industries, Inc. Amended and Restated 2009 Omnibus Equity Plan.* (x) |
| | |
| 10.3.15 | | Form of Leveraged Restricted Share Unit Agreement (2014 grants) under the Chart Industries, Inc. Amended and Restated 2009 Omnibus Equity Plan.* (x) |
| | |
| 10.4 | | Amended and Restated Chart Industries, Inc. Voluntary Deferred Income Plan (incorporated by reference to Exhibit 10.1 to the Registrant’s current report on Form 8-K, filed with the SEC on June 28, 2010 (File No. 001-11442)).* |
| | |
| 10.5 | | Chart Industries, Inc. 2009 Incentive Compensation Plan (incorporated by reference to Appendix B to the Registrant’s definitive proxy statement filed with the Securities and Exchange Commission on April 7, 2009 (File No. 001-11442)).* |
| | |
| 10.6 | | Amended and Restated Credit Agreement, dated April 25, 2012, among Chart Industries, Inc., Chart Industries Luxembourg S.à r.l., the lenders from time to time party thereto, and JPMorgan Chase Bank, N.A. as Administrative Agent (incorporated by reference to Exhibit 10.1 to the Registrant’s amended Current Report on Form 8-K, filed with the SEC on April 26, 2012 (File No. 001-11442)). |
| | | |
| 10.7 | | Amended and Restated Guarantee and Collateral Agreement, dated April 25, 2012, among Chart Industries, Inc., certain subsidiaries of Chart Industries, Inc., and JPMorgan Chase Bank, N.A., as Administrative Agent (incorporated by reference to Exhibit 10.2 to the Registrant’s Current Report on Form 8-K, filed with the SEC on April 26, 2012 (File No. 001-11442)). |
| | |
| 10.8 | | Employment Agreement, dated February 26, 2008, by and between Registrant and Samuel F. Thomas (incorporated by reference to Exhibit 10.1 to the Registrant’s Quarterly Report on Form 10-Q for the quarter ended March 31, 2008 (File No. 001-11442)).* |
| | |
|
| | |
| 10.8.1 | | Amendment No. 1, effective January 1, 2009, to the Employment Agreement dated February 26, 2008 by and between Registrant and Samuel F. Thomas (incorporated by reference to Exhibit 10.9.1 to the Registrant’s Annual Report on Form 10-K for the year ended December 31, 2008 (File No. 001-11442)).* |
| | |
|
| | |
| 10.8.2 | | Amendment No. 2, effective January 1, 2010, to the Employment Agreement dated February 26, 2008 by and between Registrant and Samuel F. Thomas (incorporated by reference to Exhibit 10.1 to the Registrant’s Quarterly Report on Form 10-Q for the quarter ended March 31, 2010 (File No. 001-11442)).* |
| | | |
| 10.8.3 | | Amendment No. 3, dated January 1, 2012, to the Employment Agreement dated February 26, 2008 by and between Chart Industries, Inc. and Samuel F. Thomas (incorporated by reference to Exhibit 10.1 to the Registrant’s Current Report on Form 8-K filed with the SEC on January 5, 2012 (File No. 001-11442)). * |
| 10.8.4 | | Amendment No. 4, dated January 1, 2013, to the Employment Agreement dated February 26, 2008 by and between Chart Industries, Inc. and Samuel F. Thomas (incorporated by reference to Exhibit 10.1 to the Registrant’s Current Report on Form 8-K filed with the SEC on January 4, 2013 (File No. 001-11442)). * |
| | |
| 10.8.5 | | Amendment No. 5, dated January 1, 2014, to the Employment Agreement dated February 26, 2008 by and between Chart Industries, Inc. and Samuel F. Thomas (incorporated by reference to Exhibit 10.1 to the Registrant’s Current Report on Form 8-K filed with the SEC on January 6, 2014 (File No. 001-11442)). * |
| | |
| 10.9 | | Employment Agreement, dated February 26, 2008, by and between Registrant and Michael F. Biehl (incorporated by reference to Exhibit 10.2 to the Registrant’s Quarterly Report on Form 10-Q for the quarter ended March 31, 2008 (File No. 001-11442)).* |
| | |
| 10.9.1 | | Amendment No. 1, effective January 1, 2009, to the Employment Agreement dated February 26, 2008 by and between Registrant and Michael F. Biehl (incorporated by reference to Exhibit 10.10.1 to the Registrant’s Annual Report on Form 10-K for the year ended December 31, 2008 (File No. 001-11442)).* |
| | |
| 10.9.2 | | Amendment No. 2, dated January 1, 2012, to the Employment Agreement dated February 26, 2008 by and between Chart Industries, Inc. and Michael F. Biehl (incorporated by reference to Exhibit 10.2 to the Registrant’s Current Report on Form 8-K filed with the SEC on January 5, 2012 (File No. 001-11442)).* |
| 10.9.3 | | Amendment No. 3, dated January 1, 2013, to the Employment Agreement dated February 26, 2008 by and between Chart Industries, Inc. and Michael F. Biehl (incorporated by reference to Exhibit 10.2 to the Registrant’s Current Report on Form 8-K filed with the SEC on January 4, 2013 (File No. 001-11442)).* |
| | | |
| 10.9.4 | | Amendment No. 4, dated January 1, 2014, to the Employment Agreement dated February 26, 2008 by and between Chart Industries, Inc. and Michael F. Biehl (incorporated by reference to Exhibit 10.2 to the Registrant’s Current Report on Form 8-K filed with the SEC on January 6, 2014 (File No. 001-11442)).* |
| |
| 10.10 | | Employment Agreement, dated February 26, 2008, by and between Registrant and Matthew J. Klaben (incorporated by reference to Exhibit 10.3 to the Registrant’s Quarterly Report on Form 10-Q for the quarter ended March 31, 2008 (File No. 001-11442)).* |
| | |
| 10.10.1 | | Amendment No. 1, effective January 1, 2009, to the Employment Agreement dated February 26, 2008 by and between Registrant and Matthew J. Klaben (incorporated by reference to Exhibit 10.11.1 to the Registrant’s Annual Report on Form 10-K for the year ended December 31, 2008 (File No. 001-11442)).* |
| | |
| 10.10.2 | | Amendment No. 2, dated January 1, 2012, to the Employment Agreement dated February 26, 2008 by and between Chart Industries, Inc. and Matthew J. Klaben (incorporated by reference to Exhibit 10.3 to the Registrant’s Current Report on Form 8-K filed with the SEC on January 5, 2012 (File No. 001-11442)).* |
| 10.10.3 | | Amendment No. 3, dated January 1, 2013, to the Employment Agreement dated February 26, 2008 by and between Chart Industries, Inc. and Matthew J. Klaben (incorporated by reference to Exhibit 10.3 to the Registrant’s Current Report on Form 8-K filed with the SEC on January 4, 2013 (File No. 001-11442)).* |
| | | |
| 10.10.4 | | Amendment No. 4, dated January 1, 2014, to the Employment Agreement dated February 26, 2008 by and between Chart Industries, Inc. and Matthew J. Klaben (incorporated by reference to Exhibit 10.3 to the Registrant’s Current Report on Form 8-K filed with the SEC on January 6, 2014 (File No. 001-11442)).* |
| |
| 10.11 | | Employment Agreement, dated February 26, 2008, by and between Registrant and Kenneth J. Webster (incorporated by reference to Exhibit 10.5 to the Registrant’s Quarterly Report on Form 10-Q for the quarter ended March 31, 2008 (File No. 001-11442)).* |
| | |
| 10.11.1 | | Amendment No. 1, effective January 1, 2009, to the Employment Agreement dated February 26, 2008 by and between Registrant and Kenneth J. Webster (incorporated by reference to Exhibit 10.13.1 to the Registrant’s Annual Report on Form 10-K for the year ended December 31, 2008 (File No. 001-11442)).* |
| | | |
| 10.11.2 | | Amendment No. 2, effective January 1, 2010, to the Employment Agreement dated February 26, 2008 by and between Registrant and Kenneth J. Webster (incorporated by reference to Exhibit 10.4 to the Registrant’s Quarterly Report on Form 10-Q for the quarter ended June 30, 2010 (File No. 001-11442)).* |
| | |
|
| | |
| 10.11.3 | | Amendment No. 3, dated January 1, 2012, to the Employment Agreement dated February 26, 2008 by and between Chart Industries, Inc. and Kenneth J. Webster (incorporated by reference to Exhibit 10.4 to the Registrant’s Current Report on Form 8-K filed with the SEC on January 5, 2012 (File No. 001-11442)).* |
| | |
| 10.11.4 | | Amendment No. 4, dated January 1, 2013, to the Employment Agreement dated February 26, 2008 by and between Chart Industries, Inc. and Kenneth J. Webster (incorporated by reference to Exhibit 10.4 to the Registrant’s Current Report on Form 8-K filed with the SEC on January 4, 2013 (File No. 001-11442)).* |
| | | |
| 10.11.5 | | Amendment No. 5, dated January 1, 2014, to the Employment Agreement dated February 26, 2008 by and between Chart Industries, Inc. and Kenneth J. Webster (incorporated by reference to Exhibit 10.4 to the Registrant’s Current Report on Form 8-K filed with the SEC on January 6, 2014 (File No. 001-11442)).* |
| |
| 10.12 | | Form of Indemnification Agreement (incorporated by reference to Exhibit 10.20 to the Registrant’s Registration Statement on Form S-1 (File No. 333-133254)). |
| | |
| 10.13 | | IAM Agreement 2010-2013,2013-2018, effective February 6, 2010,3, 2013, by and between Chart Energy & Chemicals, Inc. and Local Lodge 2191 of District Lodge 66 of the International Association of Machinists and Aerospace Workers, AFL-CIO (incorporated by reference to Exhibit 10.510.14 to the Registrant’s QuarterlyAnnual Report on Form 10-Q10-K for the quarteryear ended MarchDecember 31, 20102013 (File No. 001-11442)). |
|
| | |
10.14 | | IAM Agreement 2013-2018, effective February 3, 2013, by and between Chart Energy & Chemicals, Inc. and Local Lodge 2191 of District Lodge 66 of the International Association of Machinists and Aerospace Workers, AFL-CIO. (x) |
| | |
10.1510.14 | | Base Call Option Transaction Confirmation, dated as of July 28, 2011, by and between Chart Industries, Inc. and JPMorgan Chase Bank, National Association, London Branch (incorporated by reference to Exhibit 10.1 to the Registrant’s Current Report on Form 8-K filed with the SEC on August 3, 2011(File No. 001-11442)). |
| | |
10.15.110.14.1 | | Base Call Option Transaction Confirmation, dated as of July 28, 2011, by and between Chart Industries, Inc. and Morgan Stanley & Co. International plc (incorporated by reference to Exhibit 10.2 to the Registrant’s Current Report on Form 8-K filed with the SEC on August 3, 2011(File No. 001-11442)). |
| | |
10.15.210.14.2 | | Base Warrants Transaction Confirmation, dated as of July 28, 2011, by and between Chart Industries, Inc. and JPMorgan Chase Bank, National Association, London Branch (incorporated by reference to Exhibit 10.3 to the Registrant’s Current Report on Form 8-K filed with the SEC on August 3, 2011 (File No. 001-11442)). |
| | |
10.15.310.14.3 | | Base Warrants Transaction Confirmation, dated as of July 28, 2011, by and between Chart Industries, Inc. and Morgan Stanley & Co. International plc (incorporated by reference to Exhibit 10.4 to the Registrant’s Current Report on Form 8-K filed with the SEC on August 3, 2011(File No. 001-11442)). |
| | |
10.15.410.14.4 | | Base Capped Call Option Transaction Confirmation, dated as of July 28, 2011, by and between Chart Industries, Inc. and JPMorgan Chase Bank, National Association, London Branch (incorporated by reference to Exhibit 10.5 to the Registrant’s Current Report on Form 8-K filed with the SEC on August 3, 2011(File No. 001-11442)). |
| | |
10.15.510.14.5 | | Base Capped Call Option Transaction Confirmation, dated as of July 28, 2011, by and between Chart Industries, Inc. and Morgan Stanley & Co. International plc (incorporated by reference to Exhibit 10.6 to the Registrant’s Current Report on Form 8-K filed with the SEC on August 3, 2011(File No. 001-11442)). |
| | | |
10.1610.15 | | Agreement and Plan of Merger, dated as of July 23, 2012 by and among Chart Inc., Bison Corp., AirSep Corporation, Joseph L. Priest, as Representative, for purposes of Section 4.10 only, Joseph L. Priest and Ravinder K. Bansal, and for purposes of Section 9.14 only, Chart Industries, Inc. (incorporated by reference to Exhibit 2.1 to the Registrant's Current Report on 8-K filed with the SEC on July 23, 2012 (File No. 001-11442)).
|
| | | |
10.16.110.15.1 | | Amendment No. 1 to Agreement and Plan of Merger, dated as of August 30, 2012 by and among Chart Inc., Bison Corp., AirSep Corporation, Joseph L. Priest, as Representative, for purposes of Section 4.10 only, Joseph L. Priest and Ravinder K. Bansal, and for purposes of Section 9.14 only, Chart Industries, Inc. (incorporated by reference to Exhibit 2.2 to the Registrant’s Quarterly Report on Form 10-Q for the quarter ended September 30, 2012 (File No. 001-11442)).
|
| | |
| 21.1 | | List of Subsidiaries. (x) |
| | |
| 23.1 | | Consent of Independent Registered Public Accounting Firm. (x) |
| | |
| 31.1 | | Rule 13a-14(a) Certification of the Company’s Chief Financial Officer. (x) |
| | |
| 31.2 | | Rule 13a-14(a) Certification of the Company’s Chief Executive Officer. (x) |
| | |
| 32.1 | | Section 1350 Certification of the Company’s Chief Financial Officer. (xx) |
| | |
| 32.2 | | Section 1350 Certification of the Company’s Chief Executive Officer. (xx) |
| | |
| 101.INS | | XBRL Instance Document (xxx) |
| 101.SCH | | XBRL Taxonomy Extension Schema Document (xxx) |
| 101.CAL | | XBRL Taxonomy Extension Calculation Linkbase Document (xxx) |
|
| | |
| 101.DEF | | XBRL Taxonomy Extension Definition Linkbase Document (xxx) |
| 101.LAB | | XBRL Taxonomy Extension Label Linkbase Document (xxx) |
| 101.PRE | | XBRL Taxonomy Extension Presentation Linkbase Document (xxx) |
_______________
| |
| (xxx) | In accordance with Rule 406T of Regulation S-T, the XBRL related information in Exhibit 101 to this Form 10-K shall not be deemed to be “filed” for purposes of Section 18 of the Securities Exchange Act of 1934, or otherwise subject to the liability of that section, and shall not be part of any registration statement or other document filed under the Securities Act of 1933 or Securities Exchange Act of 1934, except as shall be expressly set forth by specific reference in such filing. |
| |
| * | Management contract or compensatory plan or arrangement. |