Washington, D.C. 20549
ENBRIDGE INC.
200, 425 - 1st Street S.W.
Indicate by check mark whether the registrant is a large accelerated filer, an accelerated filer, a non-accelerated filer, or a smaller reporting company, or an emerging growth company. See the definitions of “large accelerated filer,” “accelerated filer”, “smaller reporting company”company,” and "emerging growth company" in Rule 12b-2 of the Exchange Act. (Check one):
The aggregate market value of the registrant’s common shares held by non-affiliates computed by reference to the price at which the common equity was last sold on June 30, 2017,2023, was approximately US$65,416,118,124.75.1 billion.
The terms "we", "our", "us" and "Enbridge" as used in this report refer collectively to Enbridge Inc. and its subsidiaries unless the context suggests otherwise. These terms are used for convenience only and are not intended as a precise description of any separate legal entity within Enbridge.
Unless otherwise specified, all dollar amounts are expressed in Canadian dollars, all references to “dollars”, “$”"dollars" or “C$”"$" are to Canadian dollars and all references to “US$”"US$" are to United StatesUS dollars. All amounts are provided on a before taxbefore-tax basis, unless otherwise stated.
under construction, including estimated completion dates and expected capital expenditures, include the following: the availability and price of labor and construction materials; the stability of our supply chain; the effects of inflation and foreign exchange rates on labor and material costs; the effects of interest rates on borrowing costs; the impact of weather and customer, government, court and regulatory approvals on construction and in-service schedules and cost recovery regimes.
Our forward-looking statements are subject to risks and uncertainties pertaining to the impactsuccessful execution of our strategic priorities; operating performance; legislative and regulatory parameters; litigation; acquisitions (including the Merger Transaction, operating performance, regulatory parameters,Acquisitions), dispositions and other transactions and the realization of anticipated benefits therefrom; operational dependence on third parties; dividend policy,policy; project approval and support,support; renewals of rights-of-way, weather,rights-of-way; weather; economic and competitive conditions,conditions; public opinion,opinion; changes in tax laws and tax rates,
ITEM 1. BUSINESS
EXPRESS-PLATTE SYSTEM
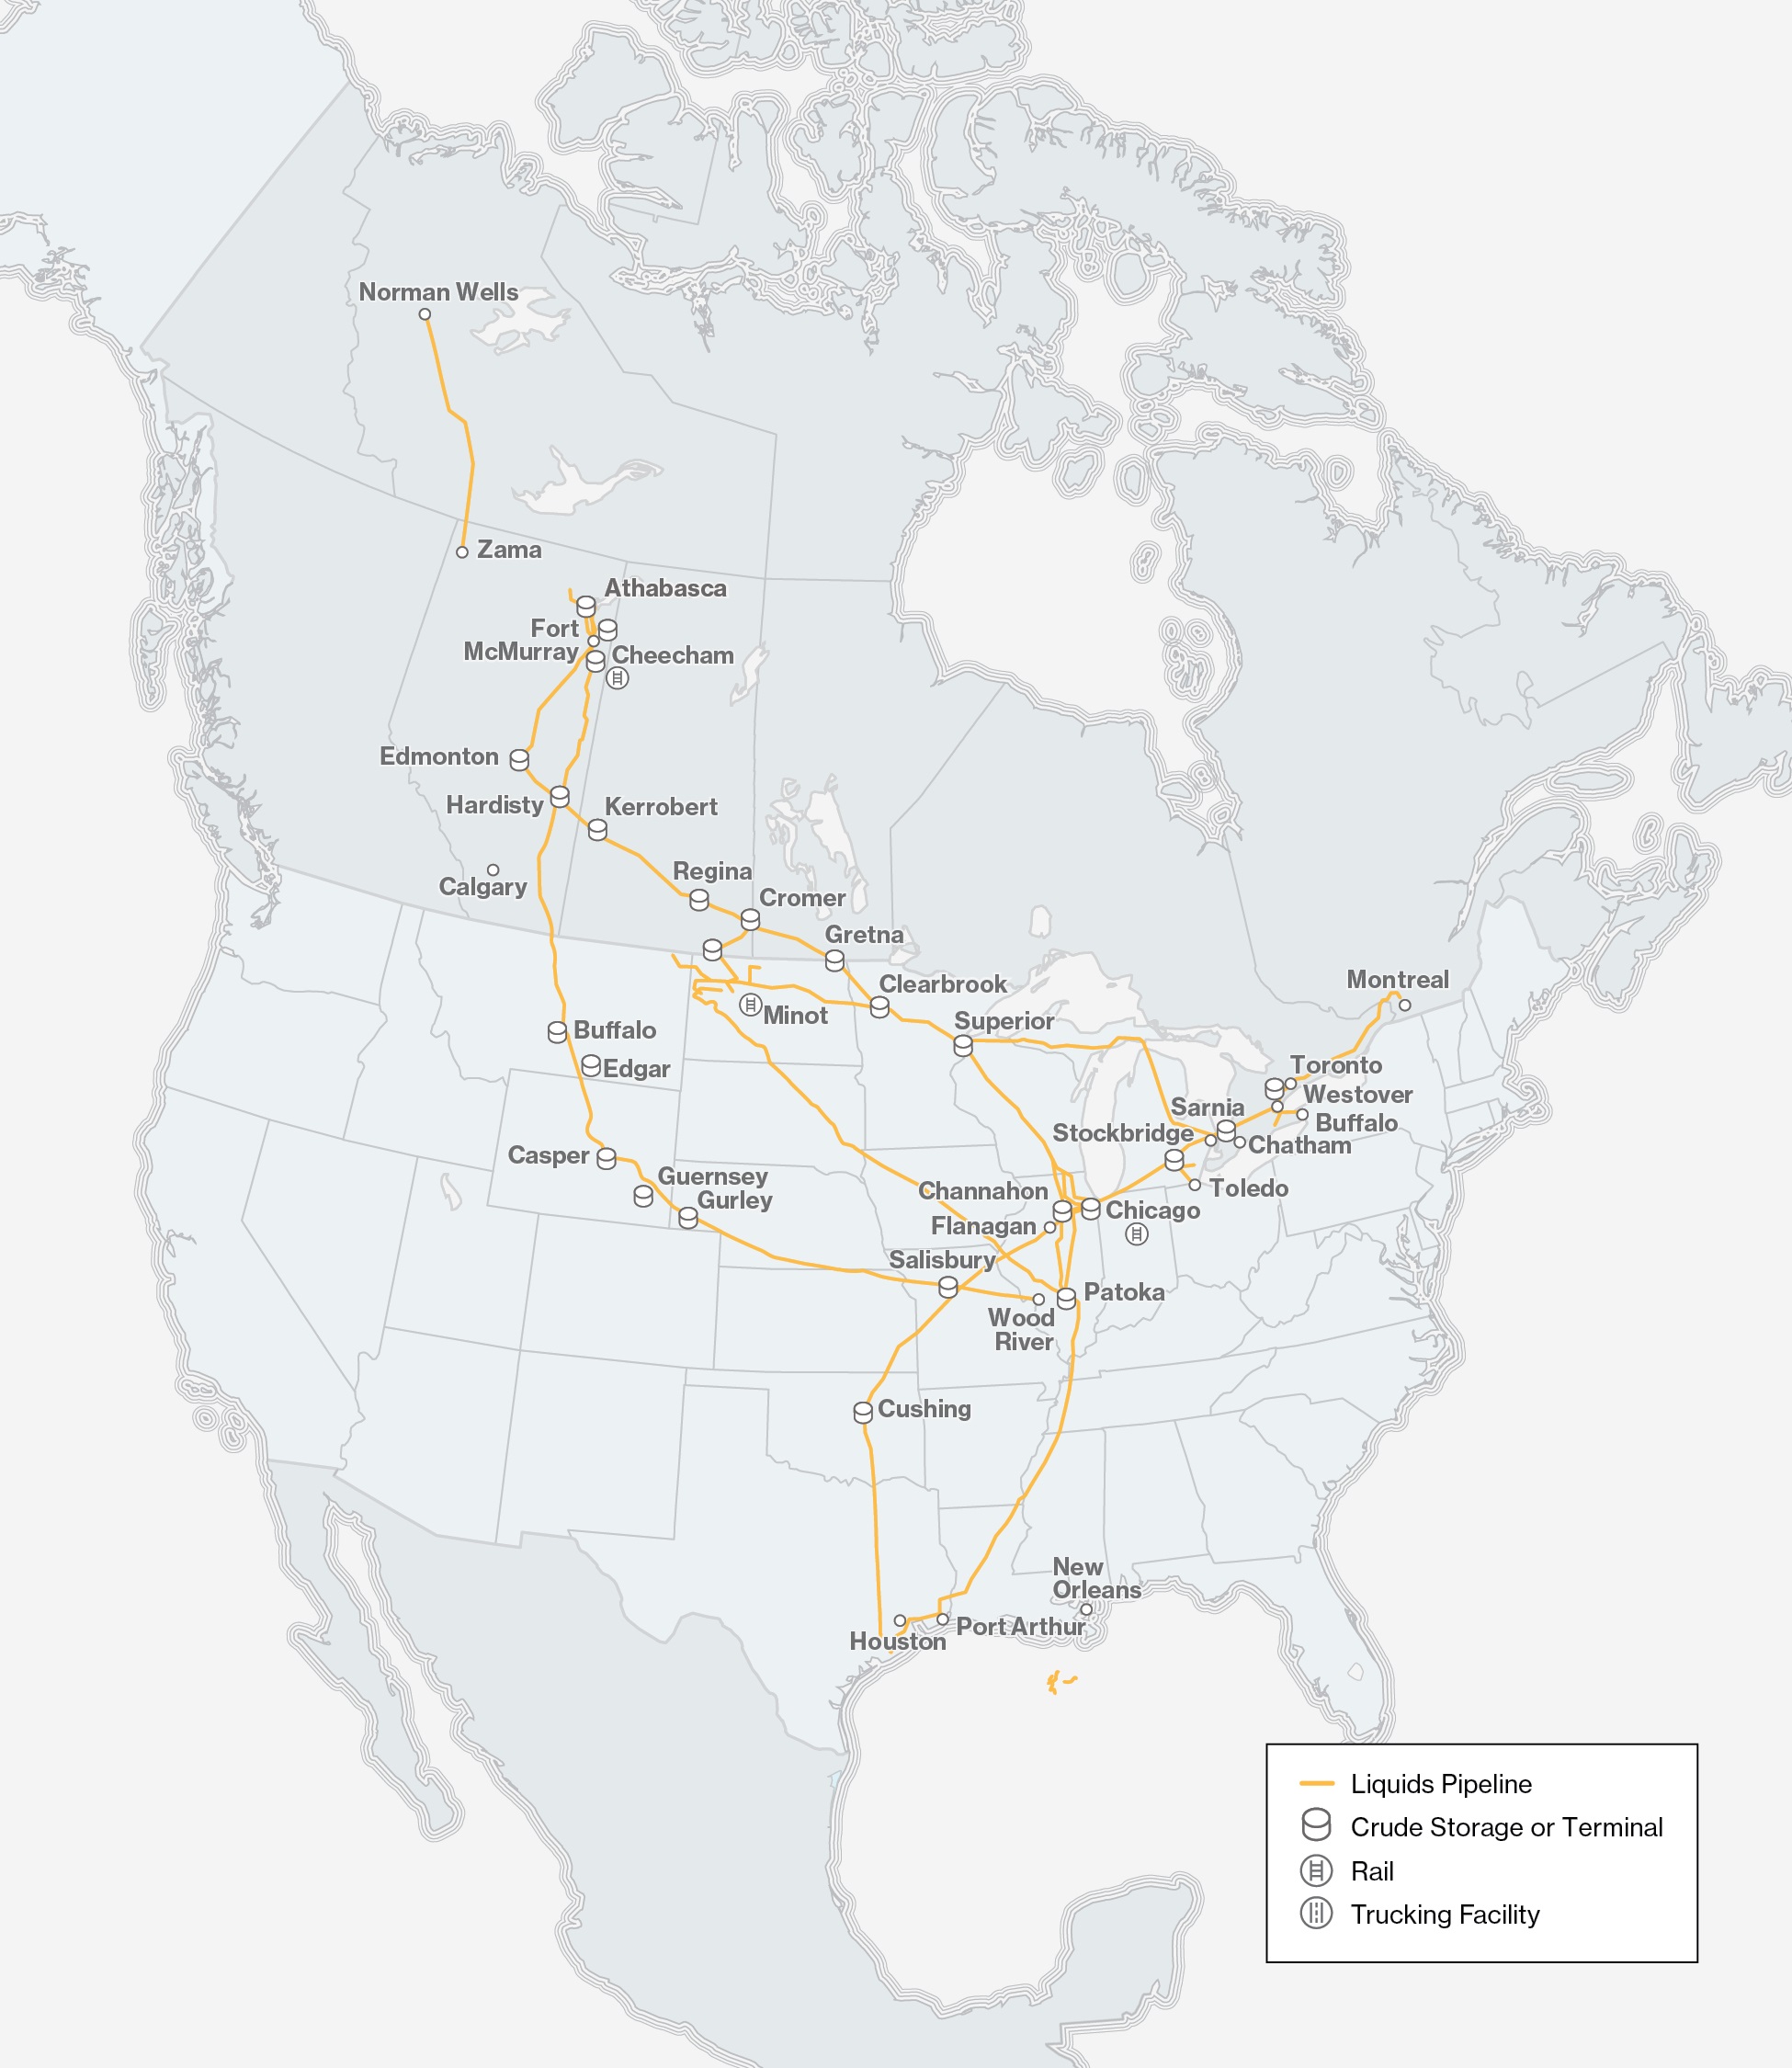
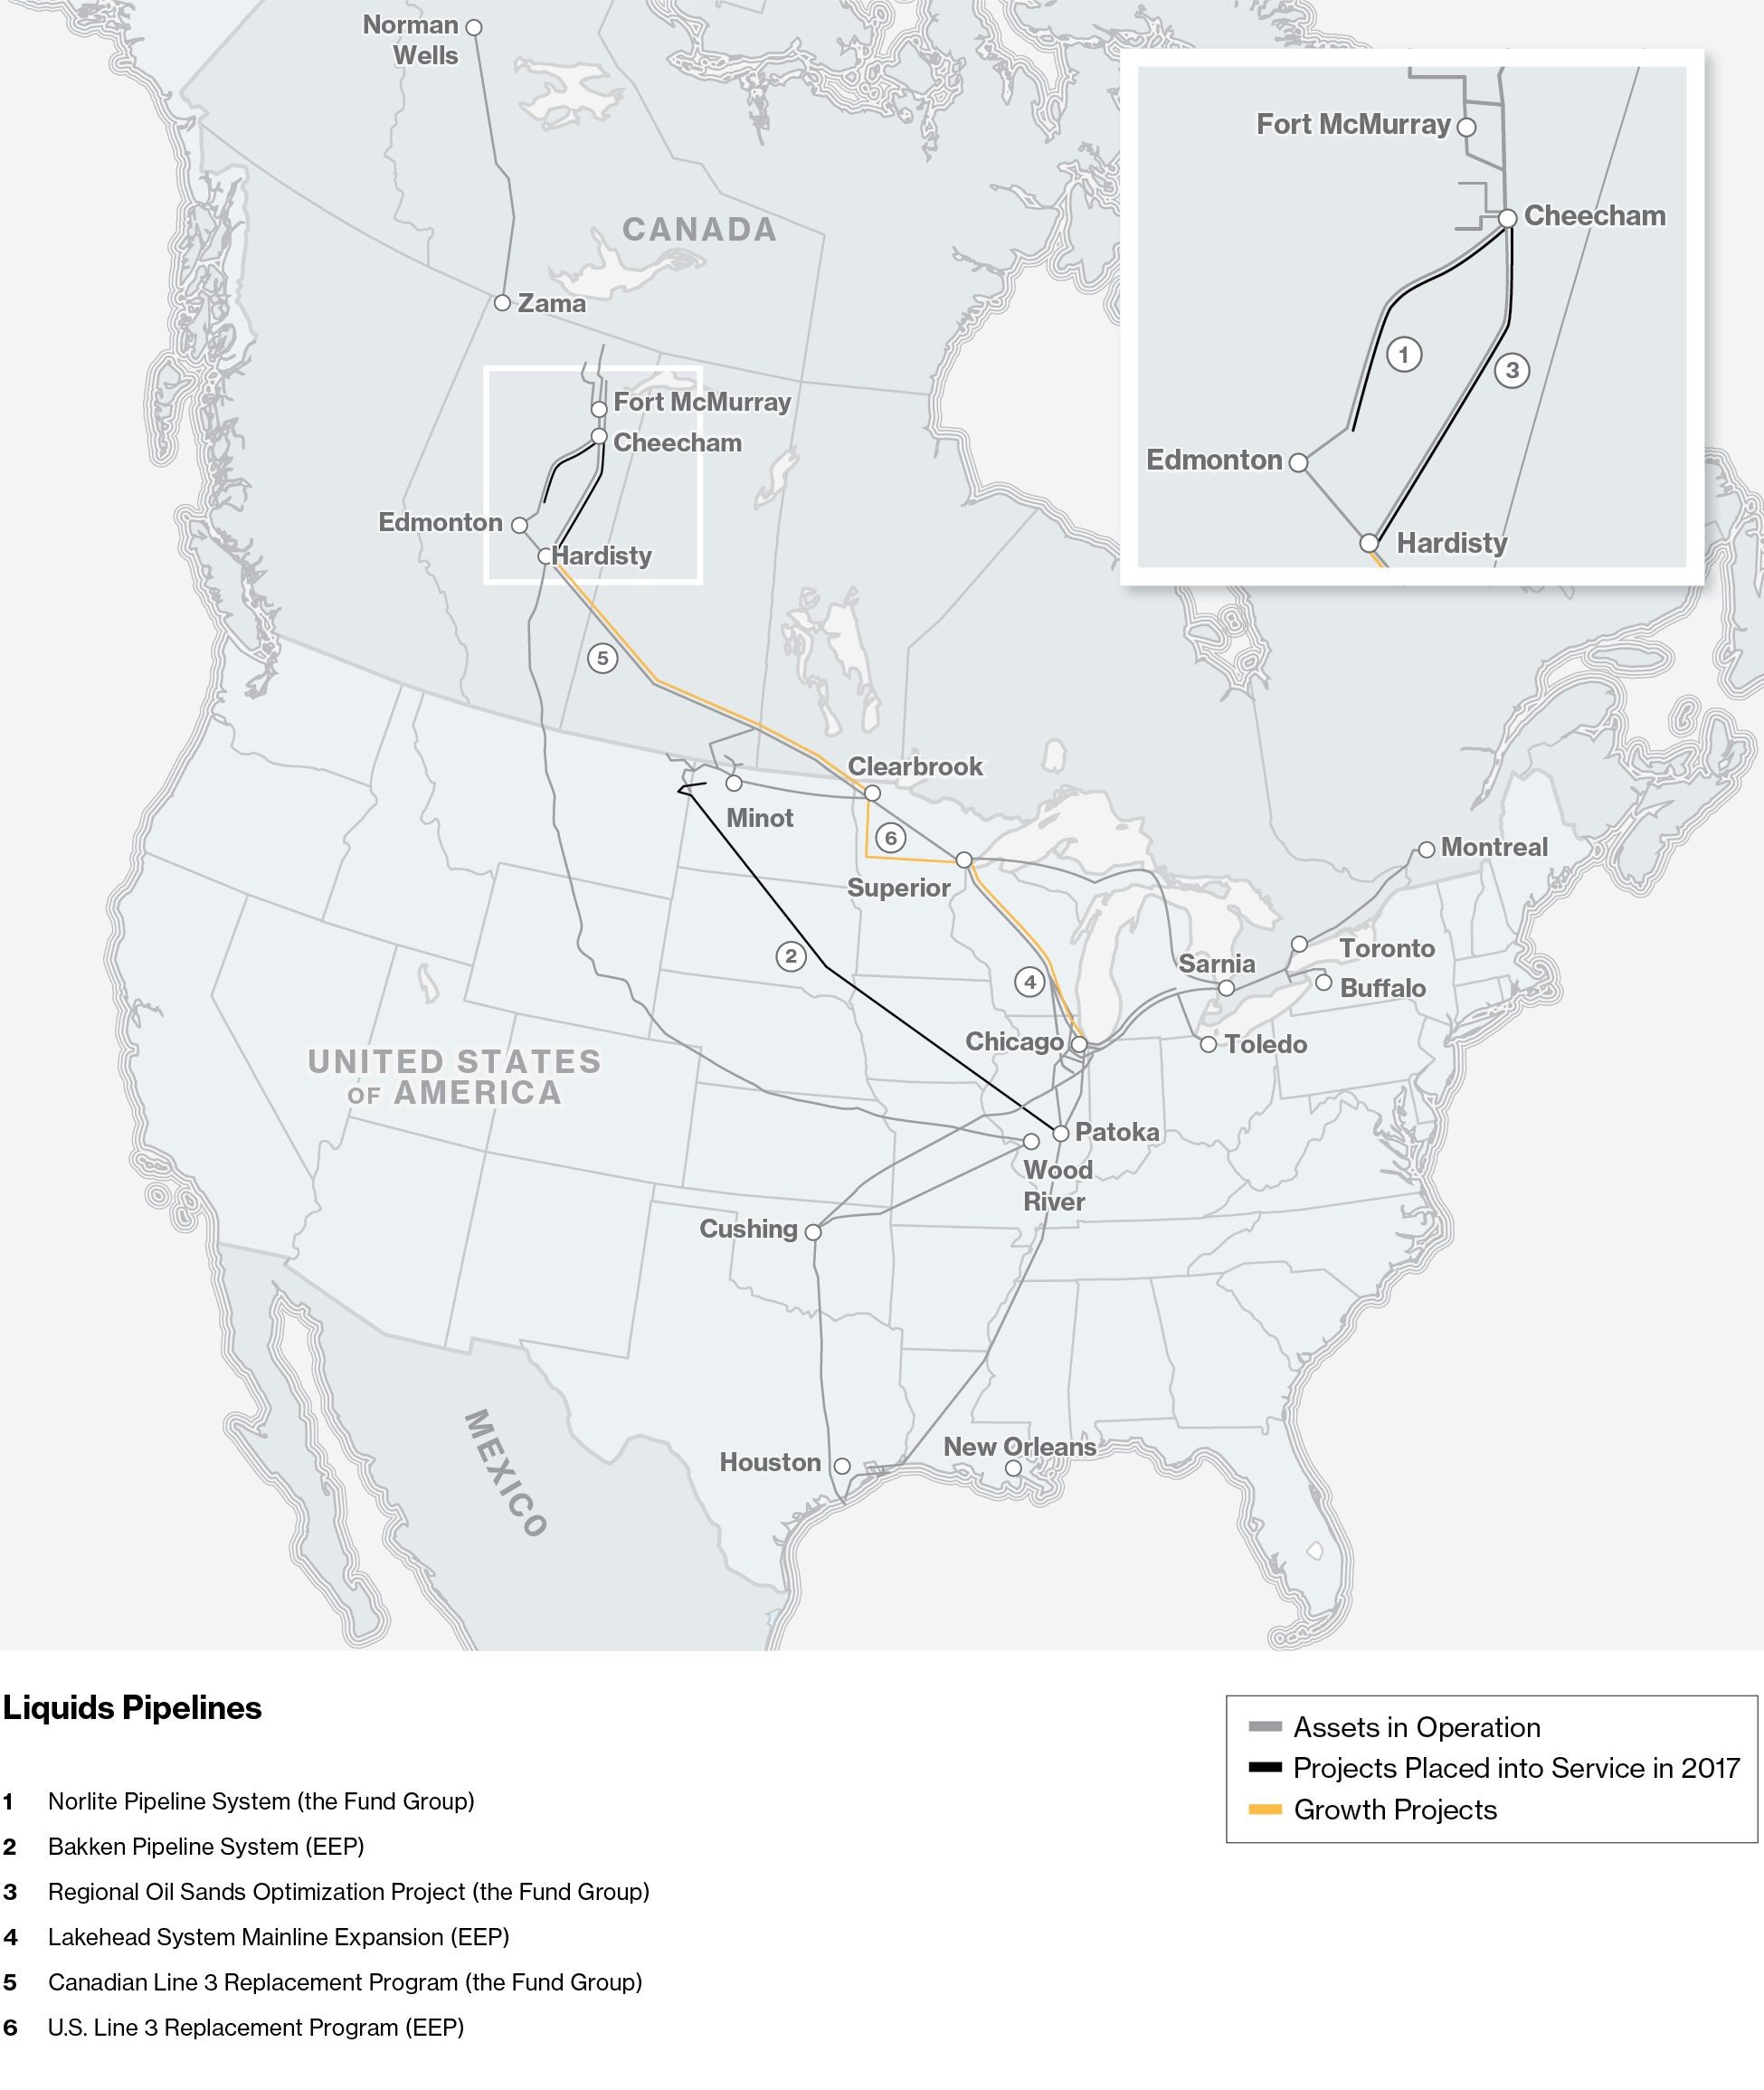
The Express-Platte system is comprisedSystem consists of both the Express pipelinePipeline and the Platte pipeline,Pipeline, and crude oil storage of approximately 5.6 million barrels. It is an approximate 2,736-kilometer (1,700-mile)2,736 kilometer (1,700 mile) long crude oil transportation system, which begins inat Hardisty, Alberta, and terminates inat Wood River, Illinois. The 310 kbpd Express pipelinePipeline carries crude oil to United StatesUS refining markets in the RockiesRocky Mountains area, including Montana, Wyoming, Colorado and Utah. The 145 to 164 kbpd Platte pipeline,Pipeline, which interconnects with the Express pipeline inPipeline at Casper, Wyoming, transports crude oil predominantly from the Bakken shale and western Canada to refineries in the Midwest. The Express pipelinePipeline capacity is typically committed under long-term take-or-pay contracts with shippers. A small portion of the Express pipelinePipeline capacity and all of the Platte pipelinePipeline capacity is used by uncommitted shippers who pay only for the pipeline capacity they actually use in a given month.
BAKKEN SYSTEM
OurThe Bakken assets consistSystem consists of the North Dakota System and the Bakken Pipeline System. The North Dakota System is a joint operation that includes a Canadian entity and a United States entity. The United States portion ofservices the Bakken Basin in North Dakota Systemand is comprised of a crude oil gathering and interstate pipeline transportation system servicing the Williston Basin in North Dakota and Montana, which includes the Bakken and Three Forks formation.system. The gathering pipelines collect crude oil from nearly 80 different receipt facilities located throughout western North Dakota and eastern Montana, withsystem provides delivery to Clearbrook, Minnesota for service on the Lakehead system or a variety of interconnecting pipeline and rail export facilities.pipelines. The United States interstate portion of the system extendshas both US and Canadian components that extend from Berthold, North Dakota to the International Boundary near North Portal, North Dakota, and connects to the Canadian entity at the border to bring the crude oil into Cromer, Manitoba.
Tariffs on the United StatesUS portion of the North Dakota System are governedregulated by FERC and include a local tariff.the FERC. The Canadian portion is categorized as a Group 2 pipeline, and as such, its tolls are regulated by the NEBCER on a complaint basis. Tolls are based on long-term take-or-pay agreements with anchor shippers.
In February 2017, we closed a transaction to acquire a 49% equityWe have an effective 27.6% interest in the holding company that owns 75% of the Bakken Pipeline System, from an affiliate of Energy Transfer Partners, L.P. and Sunoco Logistics Partners, L.P. The Bakken Pipeline Systemwhich connects the prolific Bakken formationBasin in North Dakota to markets in eastern PADD II and the United StatesUS Gulf Coast, providing customers with access to premium markets at a competitive cost.Coast. The Bakken Pipeline System consists of the Dakota Access
Pipeline from the Bakken area in North Dakota to Patoka, Illinois, and the Energy Transfer Crude Oil Pipeline projects. The Dakota Access Pipeline consists of 1,886-kilometers (1,172-miles) of 30-inch pipe from the Bakken/Three Forks production area in North DakotaPatoka, Illinois to Patoka, Illinois. InitialNederland, Texas. Current capacity is in excess of 470,000 bpdapproximately 750 kbpd of crude oil with the potential to be expanded to 570,000 bpd. The Energy Transfer Crude Oil Pipeline consists of 100-kilometers (62-miles) of new 30-inch diameter pipe, 1,104-kilometers (686-miles) of converted 30-inch diameter pipe, and 64-kilometers (40-miles) of converted 24-inch diameter pipe from Patoka, Illinois to Nederland, Texas.through additional pumping horsepower. The Bakken Pipeline System is anchored by long-term throughput commitments from a number of producers.
FEEDER PIPELINES AND OTHER
Feeder Pipelines and Other includes a number of liquids storage assets and pipeline systems in Canada and the United States.US.
Key assets included in Feeder Pipelines and Other are the Hardisty Contract Terminal and Hardisty Storage Caverns located near Hardisty, Alberta, a key crude oil pipeline hub in western Canada and the Southern Access Extension (SAX) pipelinePipeline which originates out ofin Flanagan, Illinois and delivers to Patoka, Illinois. On July 1, 2014, Marathon executedIllinois. We have an agreement with Enbridge to become an owner (35%)effective 65% interest in the 300 kbpd SAX forming the Illinois Extension Pipeline Company (IEPC). Enbridge has 65% ownership in IEPC. SAX was placed into service December 2015 with thepipeline. The majority of itsthe SAX Pipeline's capacity is commercially secured under long-term take-or-pay contracts with shippers.shippers.
Feeder Pipelines and Other also includes Patoka Storage, the Toledo pipelinesystem and the NWNorman Wells (NW) System. Patoka Storage is comprised of 4four storage tanks with 480,000480 thousand barrels of shell capacity located in Patoka, Illinois. The 180 kbpd Toledo pipeline system connects with the Lakehead System and delivers to Ohio and Michigan. The majority of Toledo pipeline’s capacity is commercially secured under long-term take-or-pay contracts with shippers. The45 kbpd NW System transports crude oil from Norman Wells in the Northwest Territories to Zama, Alberta. NW SystemAlberta and has a cost of servicecost-of-service rate structure based on established terms with shippers.
Feeder Pipelines and Other includes contributions from assets which were divested during 2017 and the fourth quarter of 2016, including investments in Olympic Pipeline Company (Olympic), Eddystone Rail and the South Prairie Region assets.
On October 19, 2017, we sold all assets related to our Eddystone rail facility to our partner Canopy in exchange for their 25% share of the joint venture valued at $5 million. These assets primarily included the unit-train unloading facility and related local pipeline infrastructure near Philadelphia, Pennsylvania that delivered Bakken and other light sweet crude oil to Philadelphia area refineries.
On July 31, 2017, we completed the sale of our 85% interest in Olympic, the largest refined products pipeline in the State of Washington, to an unrelated party for $0.2 billion.
On December 1, 2016, EIPLP completed the sale of the South Prairie Region assets to an unrelated party for cash proceeds of $1.08 billion. The South Prairie Region assets transport crude oil and NGL from producing fields and facilities in southeastern Saskatchewan and southwestern Manitoba to Cromer, Manitoba where products enter the mainline system to be transported to the United States or eastern Canada.
COMPETITION
Competition may result in a reduction in demand for our services, fewer project opportunitiesliquids pipelines network comes primarily from infrastructure or assumption of risklogistics alternatives (rail, trucking) that resultstransport liquid hydrocarbons from production basins in weaker or more volatile financial performance than expected.which we operate to markets in Canada, the US and internationally. Competition amongfrom existing and proposed pipelines, such as the Trans Mountain Pipeline expansion, is based primarily on access to supply, end use markets, the cost of transportation, access to supply,contract structure and the quality and reliability of service, contract carrier alternatives and proximity to markets.
Other competing carriers available to ship western Canadian liquid hydrocarbons to markets in Canada, the United States and internationally represent competition to our liquids pipelines network. Competition
also arises from proposed pipelines that seek to access markets currently served by our liquids pipelines, such as proposed projects to the Gulf Coast and from proposed projects enhancing infrastructure in the Alberta regional oil sands market. The Mid-Continent and Bakken systems also face competition from existing competing pipelines, proposed future pipelines and existing and alternative gathering facilities. Competition for storage facilities in the United States includes large integrated oil companies and other midstream energy partnerships.service. Additionally, volatile crude price differentials and insufficient pipeline capacity on either our or other competitorcompetitors' pipelines can make transportation of crude oil by rail competitive, particularly to markets not currently servicedserved by pipelines.
We believe that our liquids pipelines systems will continue to provide competitive and attractive options to producers in the Western Canadian Sedimentary Basin (WCSB) and, North Dakota, and the Permian Basin, due to our market access, competitive tolls and flexibility through our multiple delivery and storage points. Our current complement of growth projects to expand market access and to enhance capacity on our pipeline system combined with our commitment to project execution is expected to further provide shippers reliable and long-term competitive solutions for oil transportation. Our existing right-of-way for the mainline system also provides a competitive advantage as it can be difficult and costly to obtain rights of way for new pipelines traversing new areas. We also employ long-term agreements with shippers, which also mitigatemitigates competition risk by ensuring consistent supply to our liquids pipelines network. We have a proven track record of successfully executing projects to meet the needs of our customers.
SUPPLY AND DEMAND
We have an established and successful history of being the largest transporter of crude oil to the United States,US, the world’s largest market. While United States’market for crude oil. We expect US demand for Canadian crude oil production will support the use of our infrastructure for the foreseeable future, North American and global crude oil supply andfuture.
Under most base case forecasts, demand fundamentals are shifting, and we have a role to play in this transition by developing long-term transportation options that enable the efficient flow of crude oil from supply regions to end-user markets.
The downturn in crude oil prices which began in 2014 has impacted our liquids pipelines’ customers, who responded by reducing their exploration and development spending for 2016 and 2017 in higher cost basins. However, the international market for crude oil has continued to see an increase in production from the North American shale oil producing basins and increased production from specificOrganization of Petroleum Exporting Countries (OPEC). The West Texas Intermediate (WTI) crude price has been strengthening from US$30 per barrel at the beginning of 2016 as the market has fought to re-balance supply and demand. Prices began to recover in response to cuts in OPEC and non-OPEC production and have continued to recover through 2017. The WTI crude prices averaged US$51 per barrel for 2017 and ended the year above US$60 per barrel.
Notwithstanding the current price environment, our mainline system has thus far continued to be highly utilized and in fact, mainline throughput as measured at the Canada/United States border at Gretna, Manitoba saw record throughput of 2.7 million bpd in December 2017. The mainline system continues to be subject to apportionment of heavy crude oil, as nominated volumes currently exceed capacity on portions of the system. The impact of a low crude oil price environment on the financial performance of our liquids pipelines business is expected to be relatively modest givengrow into the commercial arrangements which underpin many of the pipelines that make up our liquids system and provide a significant measure of protection against volume fluctuations. In addition, our mainline system is well positioned to continue to provide safe and efficient transportation which will enable western Canadian and Bakken production to reach attractive markets in the United States and eastern Canada at a competitive cost relative to other alternatives. The fundamentals of oil sands production and low crude oil prices have caused some sponsors to reconsider the timing of their upstream oil sands development projects. However, recently updated forecasts continue to reflect long-term supply growth from the WCSB, although the projected pace of growth is slower than previous forecasts as companies continue to assess the viability of certain capital investments in the current price environment and with the ongoing uncertainty related to timing and completion of competing pipeline systems.
Over the long term, global energy consumption is expected to continue to grow, with the growth in crude oil demandnext decade, primarily driven by emerging economies in regions outside theOrganization for Economic Cooperation and Development (OECD), mainlysuch as India and China. While OECD countries, including Canada, the United States and western European nations, will experience populationIn North America, demand growth the emphasis placed on energy efficiency, conservation and a shift to lower carbonfor transportation fuels such as natural gas and renewables, is expected to reducemoderate over time due to vehicle fuel efficiency improvement and increasing sales of electric vehicles.
Due to the accelerated developments of offshore production in both Brazil and Guyana and continued growth from Canada and the US, it is expected that Organization of Petroleum Exporting Countries (OPEC) will try to manage prices with continued quota constraints, delaying its growth from its supply. However, production in some OPEC countries, like Iran and Venezuela, has the potential to increase from current levels. In the US, growth will likely be driven by the Permian Basin, a large and cost competitive light crude oil demand overresource base. In addition, heavy crude oil growth is expected from the long term. Accordingly, there is a strategic opportunity for North American producers to grow production to displace foreign importsWCSB as additional egress availability will likely support expansion of existing projects and participatesome potential new greenfield facilities.
Our Mainline System was effectively fully utilized in 2023 delivering 3.2 mmbpd. Refinery demand in the growingupper Midwest PADD II market has been strong. On the US Gulf Coast, lower supply of heavy crude from Latin America and the Middle East is driving increased demand for Canadian heavy crude. Many of the refineries connected to the Mainline System are complex and competitive in the global demand outside North America.context.
In termsThe anticipated combination of supply, long-term global crude oil production is expected to continue to grow through 2035, withdemand growth in supply primarily contributed by North America, Brazil and OPEC. The expected growth in North America is largely driven by production from the oil sands and the continued development of tight oil plays including the Permian, Bakken and Eagle Ford formations. Growth in supply from OPEC is primarily a result of a shift in OPEC’s strategy from ‘balancing supply’ to ‘competing for market share’ in Asia and Europe. However, political uncertainty in certain oil producing countries, including Venezuela, Libya, Nigeria and Iraq, increases risk in those regions’ supply growth forecasts and makes North America one of the most secure supply sources of crude oil. As witnessed throughout 2016 and 2017, North American supply growth can be influenced by macro-economic factors that drive down the global crude prices. Over the longer term, North American production from tight oil plays, including the Bakken, is expected to grow as technology continues to improve well productivity and efficiencies. The WCSB, in Canada, is viewed as one of the world’s largest and most secure supply sources of crude oil. However, the pace of growth in North America and level of investment in the WCSB could be tempered in future years by a number of factors including a sustained period of low crude oil prices and corresponding production decisions by OPEC, increasing environmental regulation, and prolonged approval processes for new pipelines with access to tide-water for export.
In recent years, the combination of relatively flatnon-OECD nations, domestic demand growing supplycontraction over time, and long-lead time to build pipeline infrastructure led to a fundamental change in the North American crude oil landscape. The inability to move increasing inland supply to tide-water markets resulted in a divergence between WTI and world pricing, resulting in lower netbacks for North American producers than could otherwise be achieved if selling into global markets. The impact of price differentials has been even more pronounced for western Canadian producers as insufficient pipeline infrastructure resulted in a further discounting of Alberta crude against WTI. With a number of market access initiatives completed by the industry in recent years, including those introduced by us, the crude oil price differentials significantly narrowed in 2015, and resulted in higher netbacks for producers. The capacity from these initiatives was for the most part exhausted by the end of 2017 fromcontinued production growth in the Oil SandsPermian Basin and has resulted in crude differentials widening once more. Canadian pipeline export capacity is expectedWCSB highlights the importance of our strategic asset footprint and reinforces the need for additional export-oriented infrastructure. We believe that we are well positioned to remain essentially full, resulting in incremental production utilizing non-pipeline transportation services until such time as pipeline capacity is made available. As the supply in North America continues to grow, the growth and flexibility of pipeline infrastructure will need to keep pace with the sensitive demand and supply balance. Over the longer term, we believe pipelines will continue to be the most cost-effective means of transportation in markets where the differential between North American and global oil prices remain narrow. Utilization of rail to transport crude is expected to be substantially limited to those markets not readily accessible by pipelines.
Our role in helping to address themeet these evolving supply and demand fundamentals through expansion of system capacity for incremental access to the US Gulf Coast, and alleviating price discounts for producersthrough further development of our EIEC in Corpus Christi, the largest crude oil export facility in North America.
Opposition to fossil fuel development in conjunction with evolving consumer preferences and new technology could underpin energy transition scenarios impacting long-term supply costs to refiners is to provide expanded pipeline capacity and sustainable connectivity to alternative markets. As discussed in Part II. Item 7. Management's Discussion and Analysisdemand of Financial Condition and Results of Operations - Growth Projects - Commercially Secured Projects, in 2017, wecrude oil. We continue to executeclosely monitor the evolution of all of these factors to be able to pro-actively adapt our growth projects plan in furtherance of this objective.business to help meet our customers’ and society’s energy needs.
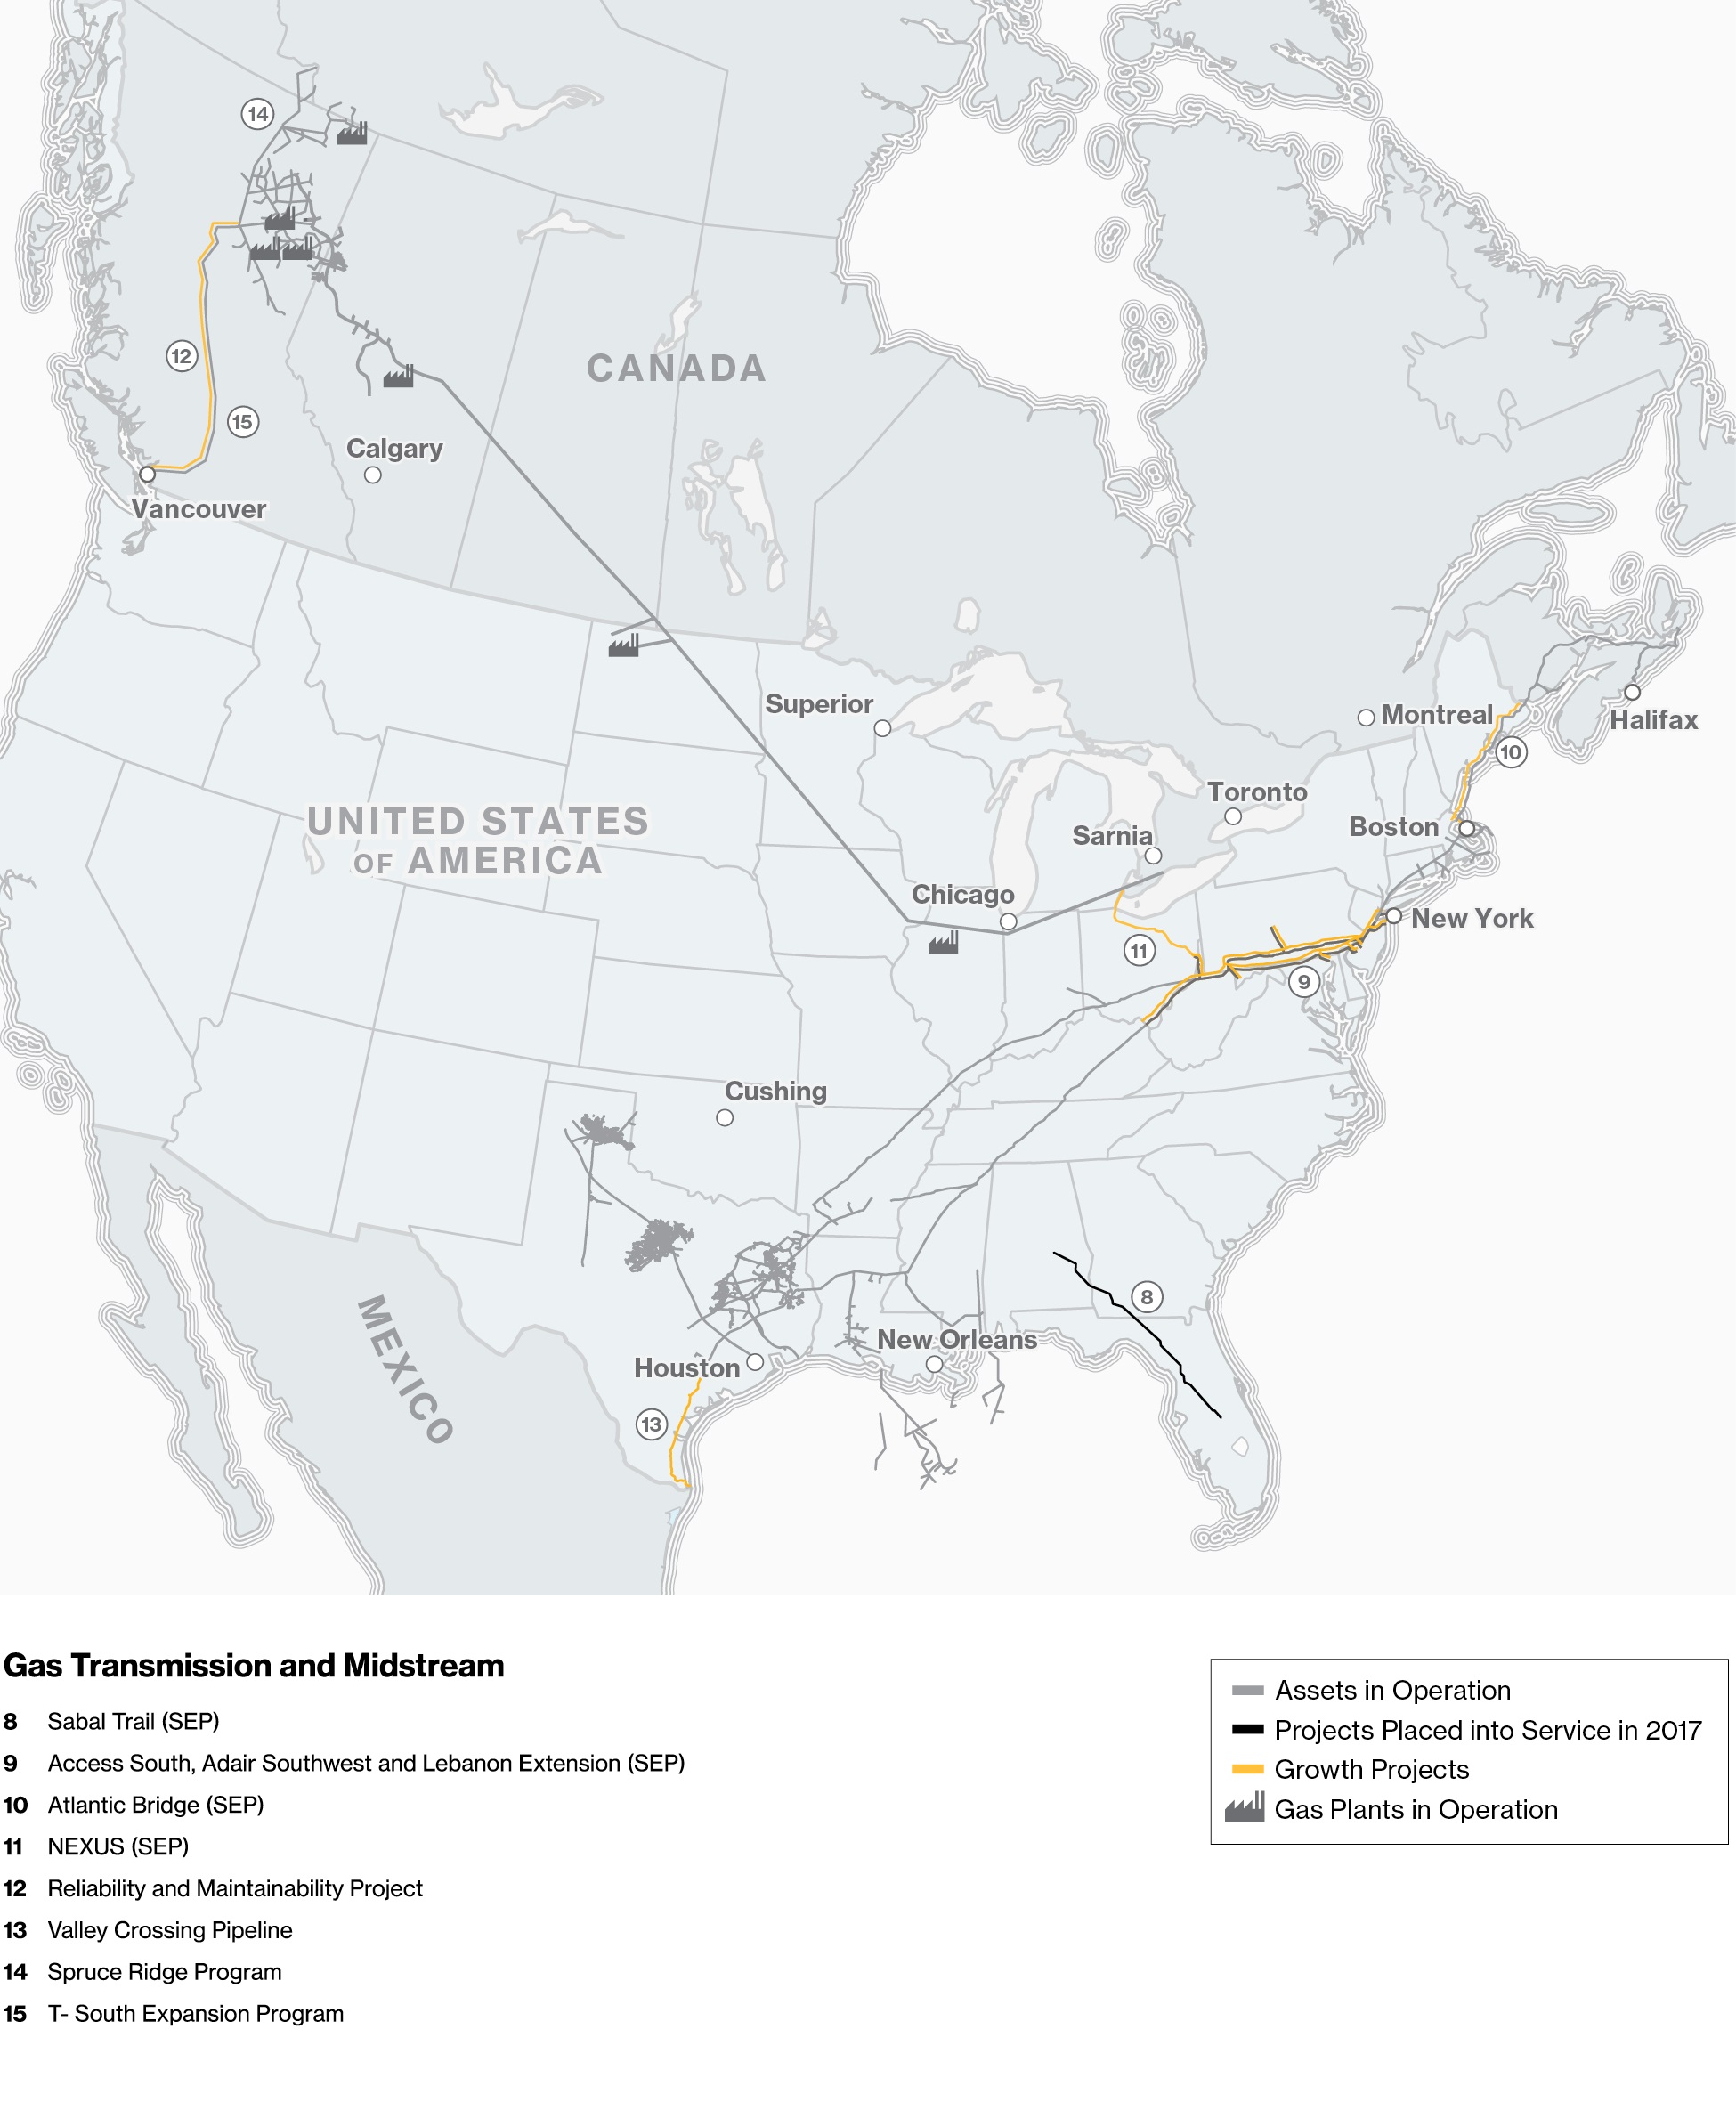
GAS TRANSMISSION &AND MIDSTREAM
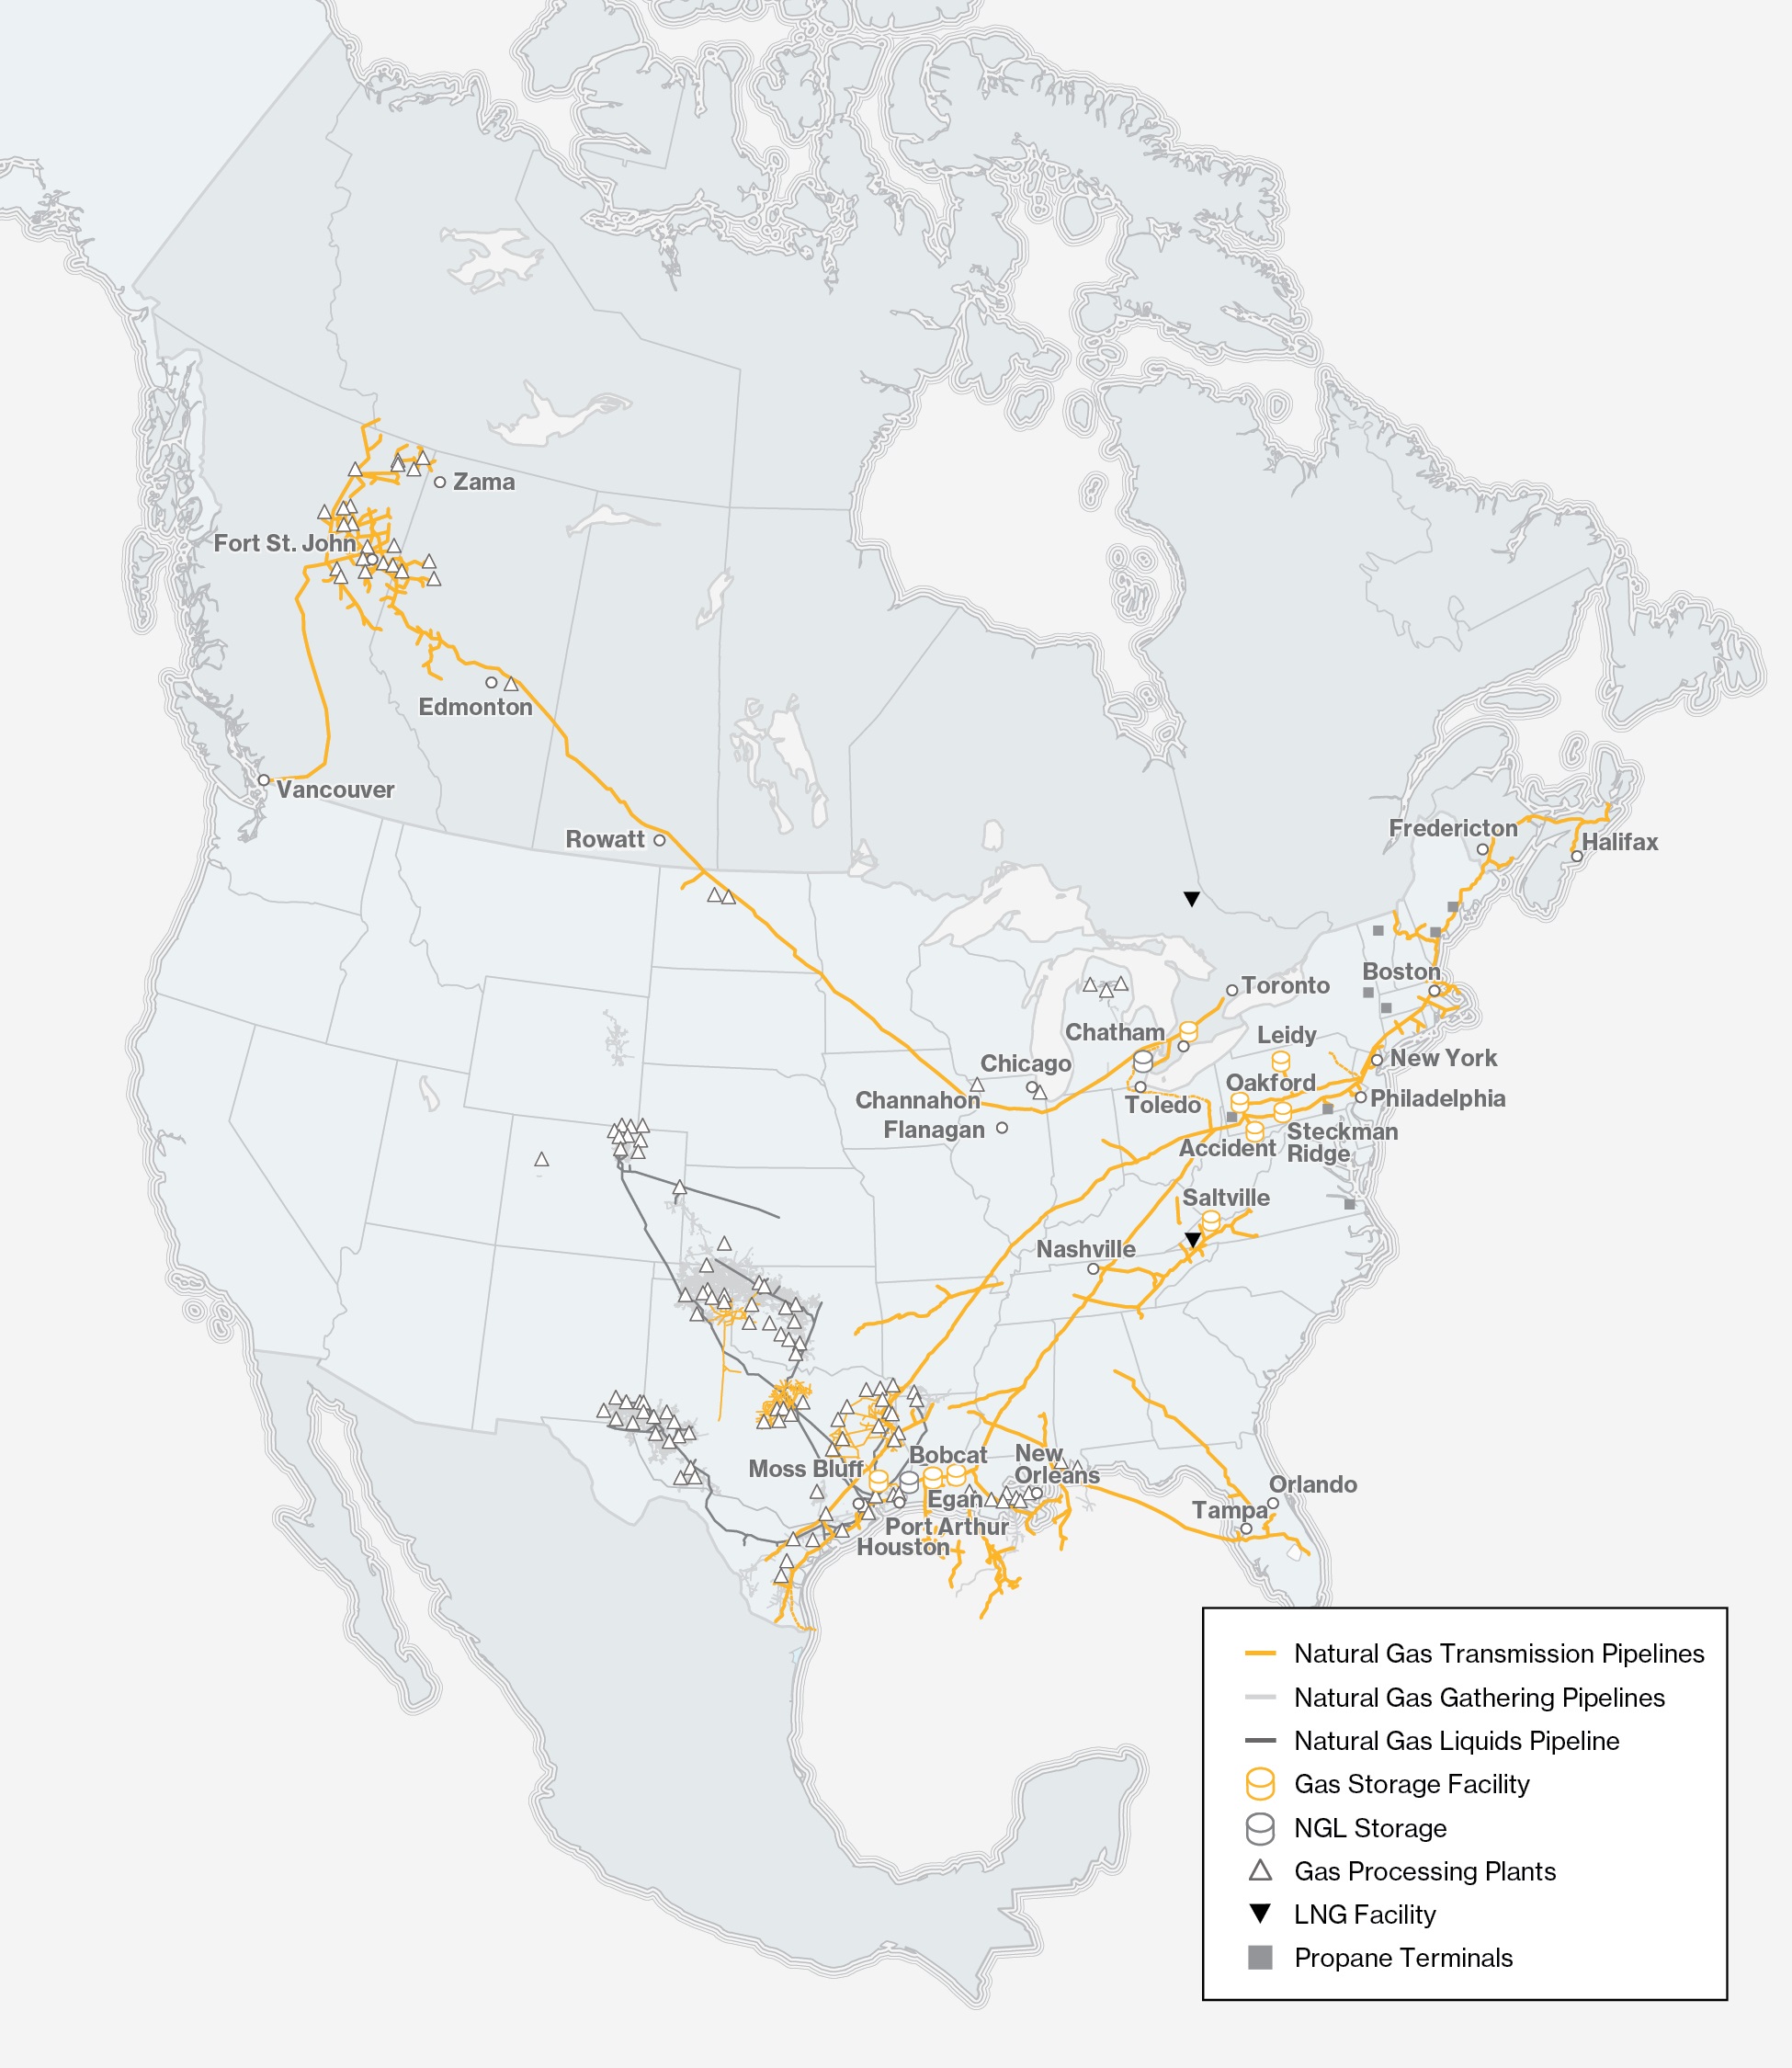
Gas Transmission and Midstream (formerly referred to as Gas Pipelines and Processing) consists of our investments in natural gas pipelines and gathering and processing facilities in Canada and the United States,US, including US Gas Transmission, Canadian Gas Transmission, and Midstream, Alliance Pipeline, US Midstream and other assets.
US GAS TRANSMISSION
The majority of assets that comprise US Gas Transmission were acquired through the Merger Transaction and consist of natural gas transmission and storage assets that are held primarily through Spectra Energy Partners, LP (SEP). US Gas Transmission includes indirect ownership interests in Texas Eastern Transmission, LP (Texas Eastern), Algonquin M&N U.S.Gas Transmission, LLC (Algonquin), Maritimes & Northeast (M&N) (US and Canada), East Tennessee Natural Gas, LLC (East Tennessee), Gulfstream Natural Gas System, L.L.C. (Gulfstream), Sabal Trail Transmission, LLC (Sabal Trail), NEXUS Gas Transmission, LLC (NEXUS), Valley Crossing Pipeline, LLC (Valley Crossing), Southeast Supply Header, LLC (SESH), Vector Pipeline L.P. (Vector) and certain other gas pipeline and storage assets. The US Gas Transmission business primarily provides transmission and storage of natural gas through interstate pipeline systems for customers in various regions of the northeastern, southern and midwestern northeastern and southern United States.US.
As a result of the Merger Transaction, Enbridge held a 75% equity interest in SEP, a natural gas and crude oil infrastructure master limited partnership. As a result of us converting all of our incentive distribution rights (IDRs) and general partner economic interests in SEP into 172.5 million newly issued SEP common units, we now hold a 83% equity interest in SEP. Refer to Part II. Item 7. Management's Discussion and Analysis of Financial Conditions and Results of Operations - United States Sponsored Vehicle Strategy. SEP owns 100% of Texas Eastern Transmission, L.P. (Texas Eastern), 92% of Algonquin Gas Transmission, L.L.C. (Algonquin), 100% of East Tennessee Natural Gas, L.L.C. (East Tennessee), 100% of Saltville Gas Storage Company L.L.C. (Saltville), 100% of Ozark Gas Gathering, L.L.C. and Ozark Gas Transmission, L.L.C., 100% of Big Sandy Pipeline, L.L.C., 100% of Market Hub Partners Holding, 100% of Bobcat Gas Storage, 78% of Maritimes & Northeast Pipeline, L.L.C. (M&N U.S.), 50% of Southeast Supply Header, L.L.C., 50% of Steckman Ridge, L.P., 50% of Gulfstream Natural Gas System, L.L.C. (Gulfstream) and 50% of Sabal Trail Transmission, LLC (Sabal Trail).
The Texas Eastern interstate natural gas transmission system extends approximately 2,735-kilometers (1,700-miles) from producing fieldssupply and demand centers in the Gulf Coast region of Texas and Louisiana to supply and demand centers in Ohio, Pennsylvania, New Jersey and New York. Texas Eastern's onshore system consistshas a peak day capacity of 12.0 billion cubic feet per day (bcf/d) of natural gas on approximately 14,597-kilometers (9,070-miles)13,765 kilometers (8,553 miles) of pipeline and associated compressor stations. Texas Eastern is also connected to fourfive affiliated storage facilities that are partially or wholly-owned by other entities within the US Gas Transmission business.business, including the Tres Palacios storage facility that we acquired on April 3, 2023.
The Algonquin interstate natural gas transmission system connects with Texas Eastern’s facilities in New Jersey and extends approximately 402-kilometers (250-miles) through New Jersey, New York, Connecticut, Rhode Island and Massachusetts where it connects to M&N U.S.US. The system consistshas a peak day capacity of 3.1 bcf/d of natural gas on approximately 1,835-kilometers (1,140-miles)1,820 kilometers (1,131 miles) of pipeline with associated compressor stations.
M&N U.S. is anUS has a peak day capacity of 0.8 bcf/d of natural gas on approximately 563-kilometer (350-mile)552 kilometers (343 miles) of mainline interstate natural gas transmission system, including associated compressor stations, which extends from northeastern Massachusetts to the border of Canada near Baileyville, Maine. M&N U.S. is connectedCanada has a peak day capacity of 0.5 bcf/d on approximately 885 kilometers (550 miles) of interprovincial natural gas transmission mainline system that extends from Goldboro, Nova Scotia to the Canadian portion of the Maritimes & Northeast Pipeline system,US border near Baileyville, Maine. We have a 78% interest in M&N Canada (see Gas TransmissionUS and Midstream - Canadian Gas Transmission and Midstream).M&N Canada.
East Tennessee’s interstate natural gas transmission system has a peak day capacity of 1.9 bcf/d of natural gas, crosses Texas Eastern’s system at two locations in Tennessee and consists of two mainline systems totaling approximately 2,414-kilometers (1,500-miles)2,449 kilometers (1,522 miles) of pipeline in Tennessee, Georgia, North Carolina and Virginia, with associated compressor stations. East Tennessee has a Liquefied Natural Gas (LNG)LNG storage facility in Tennessee and also connects to the Saltville storage facilities in Virginia.
Valley Crossing is an approximately 285 kilometer (177 mile) intrastate natural gas transmission system, with associated compressor stations. The pipeline infrastructure is located in Texas and provides market access of up to 2.6 bcf/d of design capacity to the Comisión Federal de Electricidad, Mexico’s state-owned utility.
Vector is an approximately 560 kilometer (348 mile) pipeline travelling between Joliet, Illinois in the Chicago area and Ontario. Vector can deliver 1.7 bcf/d of natural gas, of which 455 million cubic feet per day (mmcf/d) is leased to NEXUS. We have a 60% interest in Vector.
Gulfstream is an approximately 1,199-kilometer (745-mile)1,199 kilometer (745 mile) interstate natural gas transmission system with associated compressor stations, operated jointly by SEP and The Williams Companies, Inc.stations. Gulfstream transportshas a peak day capacity of 1.4 bcf/d of natural gas from Mississippi, Alabama, Louisiana and Texas, crossing the Gulf of Mexico to markets in central and southern Florida. Gulfstream is accounted for under the equity method of accounting.We have a 50% interest in Gulfstream.
Sabal Trail is an approximately 832 kilometer (517 mile) interstate pipeline that provides firm natural gas transportation to Florida Power & Light Company for its power generation needs and will deliver to Duke Energy Florida's natural gas plant currently under construction
in Florida.transportation. Facilities include a new 829-kilometer (515-mile) pipeline, laterals and various compressor stations. The pipeline infrastructure is located in Alabama, Georgia and Florida, and adds approximately 1.1 billion cubic feet per1.0 bcf/d of capacity enabling the access of onshore gas supplies. We have a 50% interest in Sabal Trail.
NEXUS is an approximately 414 kilometer (257 mile) interstate natural gas transmission system with associated compressor stations. NEXUS transports natural gas from our Texas Eastern system in Ohio to our Vector interstate pipeline in Michigan, with peak day (bcf/d)capacity of new capacity1.4 bcf/d. Through its interconnect with Vector, NEXUS provides a connection to access onshoreDawn Hub, the largest integrated underground storage facility in Canada and one of the largest in North America, located in southwestern Ontario adjacent to the Greater Toronto Area. We have a 50% interest in NEXUS.
SESH is an approximately 462 kilometer (287 mile) interstate natural gas transmission system with associated compressor stations. SESH extends from the Perryville Hub in northeastern Louisiana where the shale gas supplies once approved future expansions are completed. Sabal Trailproduction of eastern Texas, northern Louisiana and Arkansas, along with conventional production, is accounted for under the equity methodreached from six major interconnections. SESH extends to Alabama, interconnecting with 14 major north-south pipelines and three high-deliverability storage facilities and has a peak day capacity of accounting.
We also hold a 60% ownership interest in Vector, which is a 560-kilometer (348-mile) pipeline that transports 1.31.1 bcf/d of natural gas from Joliet, Illinoisgas. We have a 50% interest in the Chicago area to parts of Indiana, Michigan and Ontario.SESH.
Transmission and storage services are generally provided under firm agreements where customers reserve capacity in pipelines and storage facilities. The vast majority of these agreements provide for fixed reservation charges that are paid monthly regardless of the actual volumes transported on the pipelines, or injected or withdrawn from our storage facilities, plus a small variable component that is based on volumes transported, injected or withdrawn, which is intended to recover variable costs.
Interruptible transmission and storage services are also available where customers can use capacity if it exists at the time of the request.request and are generally at a higher toll than long-term contracted rates. Interruptible revenues depend on the amount of volumes transported or stored and the associated rates for this service. Storage operations also provide a variety of other value-added services including natural gas parking, loaning and balancing services to meet customers’ needs.
CANADIAN GAS TRANSMISSION AND MIDSTREAM
Canadian Gas Transmission is comprised of Westcoast Energy Inc.’s (Westcoast) British Columbia (BC) Pipeline, Alliance Pipeline and Midstream consistsother minor midstream gas gathering pipelines. It also includes the Aitken Creek Gas Storage facility, located in BC, Canada, which we acquired on November 1, 2023.
BC Pipeline provides natural gas transmission services, transporting processed natural gas from facilities located primarily in northeastern BC to markets in BC and the US Pacific Northwest. It has a peak day capacity of 3.6 bcf/d of natural gas pipelines, processing plants and gathering systems, located primarily in Western Canada. Upon completion of the Merger Transaction, Canadian Gas Transmission and Midstream now includes the Western Canada Transmission & Processing businesses, which is comprised of British Columbia Pipeline & Field Services, M&N Canada and certain other midstream gas pipelines, gathering, processing and storage assets.
British Columbia Pipeline and British Columbia Field Services provide fee-based natural gas transmission and gas gathering and processing services. British Columbia Pipeline hason approximately 2,816-kilometers (1,750-miles)2,950 kilometers (1,833 miles) of transmission pipeline in British ColumbiaBC and Alberta, as well as associated mainline compressor stations. The British Columbia Field Services business includes eight gas processing plants located in British Columbia, associated field compressor stations and approximately 2,253-kilometers (1,400-miles) of gathering pipelines.BC Pipeline is regulated by the CER under cost-of-service regulation.
M&N CanadaAlliance Pipeline is an approximately 885-kilometer (550-mile) interprovincial3,000 kilometer (1,864 mile) integrated, high-pressure natural gas transmission mainline system which extendspipeline with approximately 860 kilometers (534 miles) of lateral pipelines and related infrastructure. It transports liquids-rich natural gas from Goldboro, Nova Scotianortheast BC, northwest Alberta and the Bakken area in North Dakota to the United States border near Baileyville, Maine. M&N Canada is connectedAlliance Chicago gas exchange hub downstream of the Aux Sable Liquid Products LP NGL extraction and fractionation plant at Channahon, Illinois. The system has a peak day capacity of 1.8 bcf/d of natural gas. We have a 50% interest in Alliance Pipeline.
On December 13, 2023, we announced that Enbridge has entered into a definitive agreement to M&N U.S. - refer to Gas Transmission and Midstream - US Gas Transmission.
Canadian Gas Transmission and Midstream also includes the wholly-owned Tupper Main and Tupper West gas plants (the Tupper Plants) located within the Montney shale play in northeastern British Columbia,sell our 71%50.0% interest in the Cabin Gas Plant located 60-kilometers (37-miles) northeastAlliance Pipeline and our interest in Aux Sable (including 42.7% interest in Aux Sable Midstream LLC and Aux Sable Liquid Products L.P., and 50% interest in Aux Sable Canada LP) to Pembina Pipeline Corporation for $3.1 billion, including approximately $0.3 billion of Fort Nelson, British Columbianon-recourse debt, subject to customary closing adjustments. Closing is expected to occur in the Horn River Basin, as well as interests infirst half of 2024, subject to the Pipestonereceipt of regulatory approvals and Sexsmith gathering systems. We are the operatorsatisfaction of the Tupper Plants and the Cabin Gas Plant. We have almost 100% interest in Pipestone and varying interests (55% to 100%) in Sexsmith and its related sour gas gathering, compression and NGL handling facilities, located in the Peace River Arch region of northwest Alberta. The primary producer and operator of Pipestone holds a nominal 0.01% interest.customary closing conditions.
The majority of transportation services provided by Canadian Gas Transmission and Midstream are under firm agreements, which provide for fixed reservation charges that are paid monthly regardless of actual volumes transported on the pipeline, plus a small variable component that is based on volumes transported to recover variable costs. WeCanadian Gas Transmission also provideprovides interruptible transmission services where customers can use capacity if it is available at the time of request. Payments under these services are based on volumes transported.
ALLIANCE PIPELINE
We have a 50% interest in the Alliance Pipeline, a 3,000-kilometer (1,864-mile) integrated, high-pressure natural gas transmission pipeline and approximately 860-kilometers (534-miles) of lateral pipelines and related infrastructure. Alliance Pipeline transports liquids-rich natural gas from northeast British Columbia, northwest Alberta and the Bakken area in North Dakota to the Alliance Chicago gas exchange hub downstream of the Aux Sable NGL extraction and fractionation plant at Channahon, Illinois. The majority of transportation services provided by Alliance pipeline are under firm agreements, which provide for fixed reservation charges that are paid monthly regardless of actual volumes transported on the pipeline. Alliance pipeline also provides interruptible transmission services where customers can use capacity if it is available at the time of request.
US MIDSTREAM
US Midstream consists of our Midcoast assets, including the Anadarko, East Texas, North Texas and Texas Express NGL systems. These assets include natural gas and NGL gathering and transportation pipeline systems, natural gas processing and treating facilities, condensate stabilizers and an NGL fractionation facility. Midcoast also has rail and liquids marketing operations. During 2017, we acquired all of the noncontrolling interests in these assets. For further information, refer to Part II. Item 7. Management’s Discussion and Analysis of Financial Condition and Results of Operations - United States Sponsored Vehicle Strategy - Acquisition of Midcoast Assets and Privatization of Midcoast Energy Partners, L.P.
US Midstream also includes oura 42.7% interest in each of Aux Sable Liquid Products LP and Aux Sable Midstream LLC, and a 50% interest in Aux Sable Canada LP (together,(collectively, Aux Sable). Aux Sable Liquid Products LP owns and operates ana NGL extraction and fractionation plant at Channahon, Illinois, outside Chicago, near the terminus of Alliance Pipeline. Aux Sable also owns facilities upstream ofconnected to Alliance Pipeline that facilitate deliveriesdelivery of liquids-rich natural gas volumes into the pipeline for further processing at the Aux Sable plant. These facilities include the Palermo Conditioning Plant and the Prairie Rose Pipeline in the Bakken area of North Dakota, owned and operated by Aux Sable Midstream US;US, and Aux Sable Canada’s interests in the Montney area of British Columbia,BC, comprising the Septimus Pipeline and the Septimus and Wilder Gas Plants.Pipeline. Aux Sable Canada also owns a facility which processes refinery/upgrader offgas in Fort Saskatchewan, Alberta.
As of August 17, 2022, US Midstream also includes a 50% investment13.2% effective economic interest in DCP Midstream, LLC (DCP Midstream), whichLP (DCP). Prior to August 17, 2022, we had a 28.3% effective economic interest in DCP. DCP is accounted for as an equity investment.a joint venture, with a diversified portfolio of assets, engaged in the business of gathering, compressing, treating, processing, transporting, storing and selling natural gas; producing, fractionating, transporting, storing and selling NGL; and recovering and selling condensate. DCP Midstream gathers, compresses, treats, processes, transports, storesowns and sells natural gas. It also produces, fractionates, transports, storesoperates more than 36 plants and sells NGLs, recovers and sells condensate, and trades and marketsapproximately 86,905 kilometers (54,000 miles) of natural gas and NGLs.NGL pipelines, with operations in nine states across major producing regions.
OTHER
Other consists primarily of our offshore assets. Enbridge Offshore Pipelines is comprised of 11 active12 natural gas gathering and FERC regulated transmission pipelines and two activefive oil pipelines, including the Heidelberg Oil Pipeline that was placed in service in January 2016.pipelines. These pipelines are located in four major corridors in the Gulf of Mexico, extending to deepwater developments, and include almost 2,100-kilometers (1,300-miles)2,200 kilometers (1,365 miles) of underwater pipe and onshore facilities with total capacity of approximately 6.56.6 bcf/d.
In 2023, Enbridge acquired a 10% equity investment in Divert Inc., a RNG infrastructure company, which provides Enbridge with an option to invest up to $1.3 billion (US$1.0 billion) in food waste to RNG projects across the US.
On January 2, 2024, through a wholly-owned US subsidiary, we acquired the first six Morrow Renewables operating landfill gas-to-RNG production facilities located in Texas and Arkansas. The acquired assets align with and advance our low-carbon strategy.
COMPETITION
Our natural gas transmission and storage businesses compete with similar facilities that serve our supply and market areas in the transmission and storage of natural gas. The flow pattern of natural gas is changing across North America due to emerging supply sources and evolving demand centers, which creates a highly competitive market to secure new growth opportunities. The principal elements of competition are location, rates, terms of service, flexibility and reliability of service.
The natural gas transported in our business competes with other forms of energy available to our customers and end-users, including electricity, coal, propane, fuel oils, nuclear and renewable energy. Factors that influence the demand for natural gas include price changes, the availability of natural gas and other
forms of energy, levels of business activity, long-term economic conditions, conservation, legislation, governmental regulations, the ability to convert to alternative fuels, weather and other factors.
Competition in our business exists in all of the markets we serve. Competitors predominantly include interstateinterstate/interprovincial and intrastateintrastate/intraprovincial pipelines or their affiliates and other midstream businesses that transport, gather, treat, process and market natural gas or NGLs.NGL. Because pipelines are generally the most efficient mode of transportation for natural gas over land, the most significant competitors of our natural gas pipelines are other pipeline companies. Pipelines typically compete with each other based on location, capacity, reputation, price and reliability.
SUPPLY AND DEMAND
Our gas transmission assets make up one of the largest natural gas transportation networks in North America, driving connectivity between prolific supply basins and major demand centers within the continent. Our systems have been integral to the transition in supply and demand markets over the last decade, and we expect to continue to play a part as the energy landscape evolves.
Natural gas production in the Appalachian and Permian Basins has grown dramatically in the past decade. Today, these regions produce more than 53 bcf/d of natural gas on a combined basis. Improved technology and increased shale gas drilling have increased the supply of low-cost natural gas. As well, there has been, and continues to be, a corresponding increase in demand for our natural gas infrastructure in North America. Through a series of expansions and reversals on our core systems, combined with the execution of greenfield projects and strategic acquisitions, we have been able to meet the needs of both producers and consumers. Our US Gas Transmission systems were initially designed to transport natural gas from the Gulf Coast to the supply-constrained northeast markets. Our asset base now has the capability to transport diverse bi-directional supply to the northeast, southeast, Midwest, Gulf Coast and LNG markets on a fully subscribed and highly utilized basis.
The northeast market continues its role as a predominantly supply constrained region with steady demand. The bi-directional capabilities offered by our US Gas Transmission system allow us to deliver in an efficient manner to our regional customers. The region has seen an increase in natural gas supply due to the development of the Marcellus and Utica shales in the Appalachia region.
The southeast market is linked to multiple, highly liquid supply pools that include the Marcellus and Utica shale developments, offering consistent supply and stable pricing to a growing population of end-use customers across our multiple systems under long-term, utility-like arrangements.
With connectivity to Appalachian and western Canadian supply through our systems, the Midwest market has access to two of the lowest cost gas producing regions on the continent. As demand in the region is expected to remain stable over the next decade, maintaining this link will remain important. Flexibility in supply for this market is especially critical to maintaining liquidity and price stability as natural gas continues to replace coal-fired generation.
Gulf Coast demand growth is being driven by an increase in the volume of LNG exports, an ongoing wave of gas-intensive petrochemical facilities and additional pipeline exports to Mexico. Demand in these markets in the region is anticipated to grow by approximately 20 bcf/d through 2040. The Gulf Coast market has been the beneficiary of low-cost capacity on our assets as the relationship between supply and market centers has shifted. Such cost-effective capacity is difficult to access or replicate, offering existing shippers and transporters stability of capacity and utilization. Tide-water market access and proximity to Mexico continue to make this region a platform of global trade as pipeline and LNG exports continue their growth trajectory. In 2023, the US exported over 11.9 bcf/d of natural gas to LNG markets, primarily from the Gulf Coast region.
Western Canada is also a source of low-cost supply seeking access to premium markets in North America and globally. One of the few vital links to demand centers in the Pacific Northwest is our own systems in the region, which are highly utilized. The continental supply profile has shifted to natural gas shale plays such as the Montney and Duvernay within western Canada. These plays will fulfill an integral role as Canada enters the global market as an LNG exporter. Western Canada's production is forecasted to increase from 18 bcf/d in 2023 to 22 bcf/d by 2040. This growth will support an additional 4 bcf/d of LNG exports. These supply shifts have shaped our growth strategies and affect the nature of the projects anticipated in the capital expenditures discussed below in Part II. Item 7. Management’s Discussion and Analysis of Financial Condition and Results of Operations - Growth Projects - Commercially Secured Projects.
Global energy demand is expected to increase approximately 30 percent21% by 2040,2050, according to the recently released International Energy Agency,Agency’s Stated Policy Scenario, driven primarily by economic growth in non-OECD countries. NaturalAccording to the Stated Policy Scenario, natural gas will play an important role in meeting this energy demand, asand gas consumption is anticipated to grow by nearly 50 percentapproximately 11% during this period as one of the world’s fastest growingmost significant energy sources, second onlysources. North American exports are expected to renewables. Globally, most natural gasplay a significant part in meeting global demand, will stem fromunderscoring the ability of our assets to remain highly utilized by shippers, and highlighting the need for greater power generation capacity, as natural gas is a cleaner alternative to coal, which currently has the largest market share for power generation.
Within North America, United States natural gas demand growth is expected to be driven by the next wave of gas-intensive petrochemical facilities which are now starting to enter service, along with power generation, an increase in the volume of LNG exports and additional pipeline exports to Mexico. Within Canada, natural gas demand growth is expected to be largely tied to oil sands development and growth in gas-fired power generation. Canadian gas demand growth will be accelerated with implementation of proposed government regulations to replace coal fired power, designed to meet emissions targets.
North American supply from tight formations continues to create a demand and supply imbalance for natural gas and some NGL products. North American gas supply continues to be significantly impacted by development in the northeastern United States, primarily the prolific Marcellus and Utica shales in Appalachia. The abundance of supply from these shale plays continues to alter natural gas flow patterns inincremental transportation solutions across North America, as this region has largely displaced flowswell as for the further build-out of export facilities to meet international demand.
The long-term effects on global gas markets of the ongoing conflict in Ukraine remain uncertain. In 2022, Europe saw a sharp rise in natural gas prices due to a decrease in supply from Russia. Global LNG markets responded, and LNG cargoes were redirected from the Gulf CoastAsian market to Europe which allowed Europe to meet peak demand during what turned out to be a mild winter. Natural gas storage volumes have been strong entering the 2023-2024 winter season in Europe, and WCSB that historically supplied eastern markets. Similar pressures are alsomild winter temperatures have thus far helped to moderate prices. The outlook for gas prices remains somewhat volatile but is generally anticipated to see a gradual normalization.
Europe continues to seek lower-carbon gas supplies and has accelerated plans to develop hydrogen as an alternative to natural gas. The global hydrogen market is still relatively immature, but with incentives being feltput in place such as those in the Midwest United States and southern markets.
BeyondUS Inflation Reduction Act, hydrogen production at large scale is becoming increasingly commercialized, which has led to a growing Appalachian production,export market. Given its proximity to low-cost natural gas supply growth has been largely tied to crude oilsupplies and NGL production. Insuitable geologic storage for carbon dioxide, the Permian Basin, for example, rapid expansion of crude oil drilling activity has increased associated gas supplies from the region by approximately 2.0 bcf/d over the past two years and growth is forecasted to continue for the next decade. Similarly, WCSB natural gas production growth has been primarily attributable to production of NGLs, which provide strong producer netbacks. However, growing local demand from gas-fired power generation and continued oil sands development should stabilize WCSB natural gas economics, even as regional exports face steeper competition in Eastern Canada and the Midwest United States.
The continued increase in North American gas production and the resulting surplus supply has limited gas price advances, which remained largely within range throughout 2017. In response to low prices, producers have introduced new technologies and more efficient drilling and completion techniques to maximize production and improve break-even economics on new wells. While domestic gas demand and growing North American gas exports provide support for future prices, abundant low cost supplies are likely to continue to limit high prices through the next decade.
Growth in global demand for natural gas will necessitate growing LNG trade to facilitate the movement of gas supply from producing regions to consuming regions. North America and the USGC in particular are positioned to benefit from this trend as low-cost tight gas production from the Permian, Eagle Ford and Appalachia continues to enable growing LNG exports. The United States exported approximately 3.0 bcf/
d of natural gas from the United StatesUS Gulf Coast at the end of 2017 with export capacity of approximately 9.0 bcf/d scheduled to be in service by 2020. While the short term outlook for LNG fundamentals points to a continued global oversupply, as the market absorbs the large volumes of new supply coming online, forecasts indicate demand will exceed projected LNG supply in the early 2020s as growing markets seek to diversify supply sources. In addition to LNG export facilities under construction, the United States remains well positioned to serve this next round of global trade expansion. Canada is well positioned to provide LNGbe a leading export facilities, althoughhub to supply blue hydrogen to international markets. Given these facilities are not likely to be in service in the near term.
NGL production growth is increasingly linked torapidly changing global fundamentals, and coupled with growing associated gas volumes related to the development of tight oil plays such as the Permian. NGLs that can be extracted from liquids-rich gas streams include ethane, propane, butane and natural gasoline, which are used in a variety of industrial, commercial and other applications. Robust gas production has created regional supply imbalancesappetite for some NGL products and weakened the economics of NGL extraction, although these imbalances modestly improved over 2017 as crude prices have rebounded and NGL export capacity has expanded. Over the longer term, the growth in NGL demand is expected to be robust, driven largely by incremental ethane demand and exports. Ethane is the key feedstock to the United States Gulf Coast petrochemical industry, which is among the world’s lowest-cost ethylene producing regions and is currently undergoing significant expansion. As this new infrastructure is completed, ethane prices and resulting extraction margins are expected to improve, reducing the amount of ethane retained in the gas stream.
In addition to ethane, the outlook for abundant propane supplies has prompted the development and expansion of export facilities forliquefied petroleum gas. Over a few short years, the United States has become the world’s largest liquefied petroleum gas exporter, which has helped to reduce the inventory overhang and provide support for propane prices.
In Canada, the WCSB is well situated to capitalize on the evolving NGL fundamentals over the longer term as the Montney and Duvernay shale plays contain significant liquids-rich resources at highly competitive extraction costs. In response to growing regional NGL supply, several propane export solutions are being developed to move WCSB NGLs from Western Canada to global markets.
Longer term, NGL fundamentals indicate a positive outlook for demand growth and would be further supported with a continued recovery in crude oil prices.Consequently, the crude-to-gas price ratio is expected to remain well above energy conversion value levels and continue to be supportive of NGL extraction over the longer term.
In response to these evolving natural gas and NGL fundamentals,lower-carbon hydrogen, we believe we are well positioned to provide value-added solutions to producers.shippers and meet both regional and international demand.
Opposition to natural gas development, including new pipeline projects, has been increasing in recent years. This may challenge continued growth of the North American gas market and the ability to efficiently connect supply and demand. We are responding to the need for regional infrastructure with additional investmentinvestments in Canadian and United StatesUS gas pipelinetransportation facilities. Progress on the development and midstream facilities.construction of our commercially secured growth projects is discussed in Part II. Item 7. Management’s Discussion and Analysis of Financial Condition and Results of Operations - Growth Projects - Commercially Secured Projects.
RNG is seen as a sustainable and more environmentally friendly alternative to traditional natural gas, derived from organic waste sources such as agricultural residues, food waste, and other organic waste material. The production process most commonly involves the anaerobic digestion of these organic materials, resulting in the generation of biogas composed primarily of methane. Unlike conventional natural gas, RNG is considered carbon-neutral or even carbon-negative, as the carbon dioxide that is ultimately released during combustion is offset by the carbon captured during the organic matter's growth. This closed-loop cycle can contribute to mitigating GHG emissions and help to address climate change concerns. RNG can be seamlessly integrated into existing natural gas infrastructure, offering a versatile energy source for heating, transportation, and electricity generation. As societies increasingly prioritize sustainability, RNG has the potential to play an important role in the transition towards a cleaner and more resilient energy future. We believe that RNG is poised for growth as the global focus on sustainable energy solutions intensifies. Global RNG consumption is expected to increase with a 11% compound annual growth rate until 2050, according to the recently released International Energy Agency’s Stated Policy Scenario.
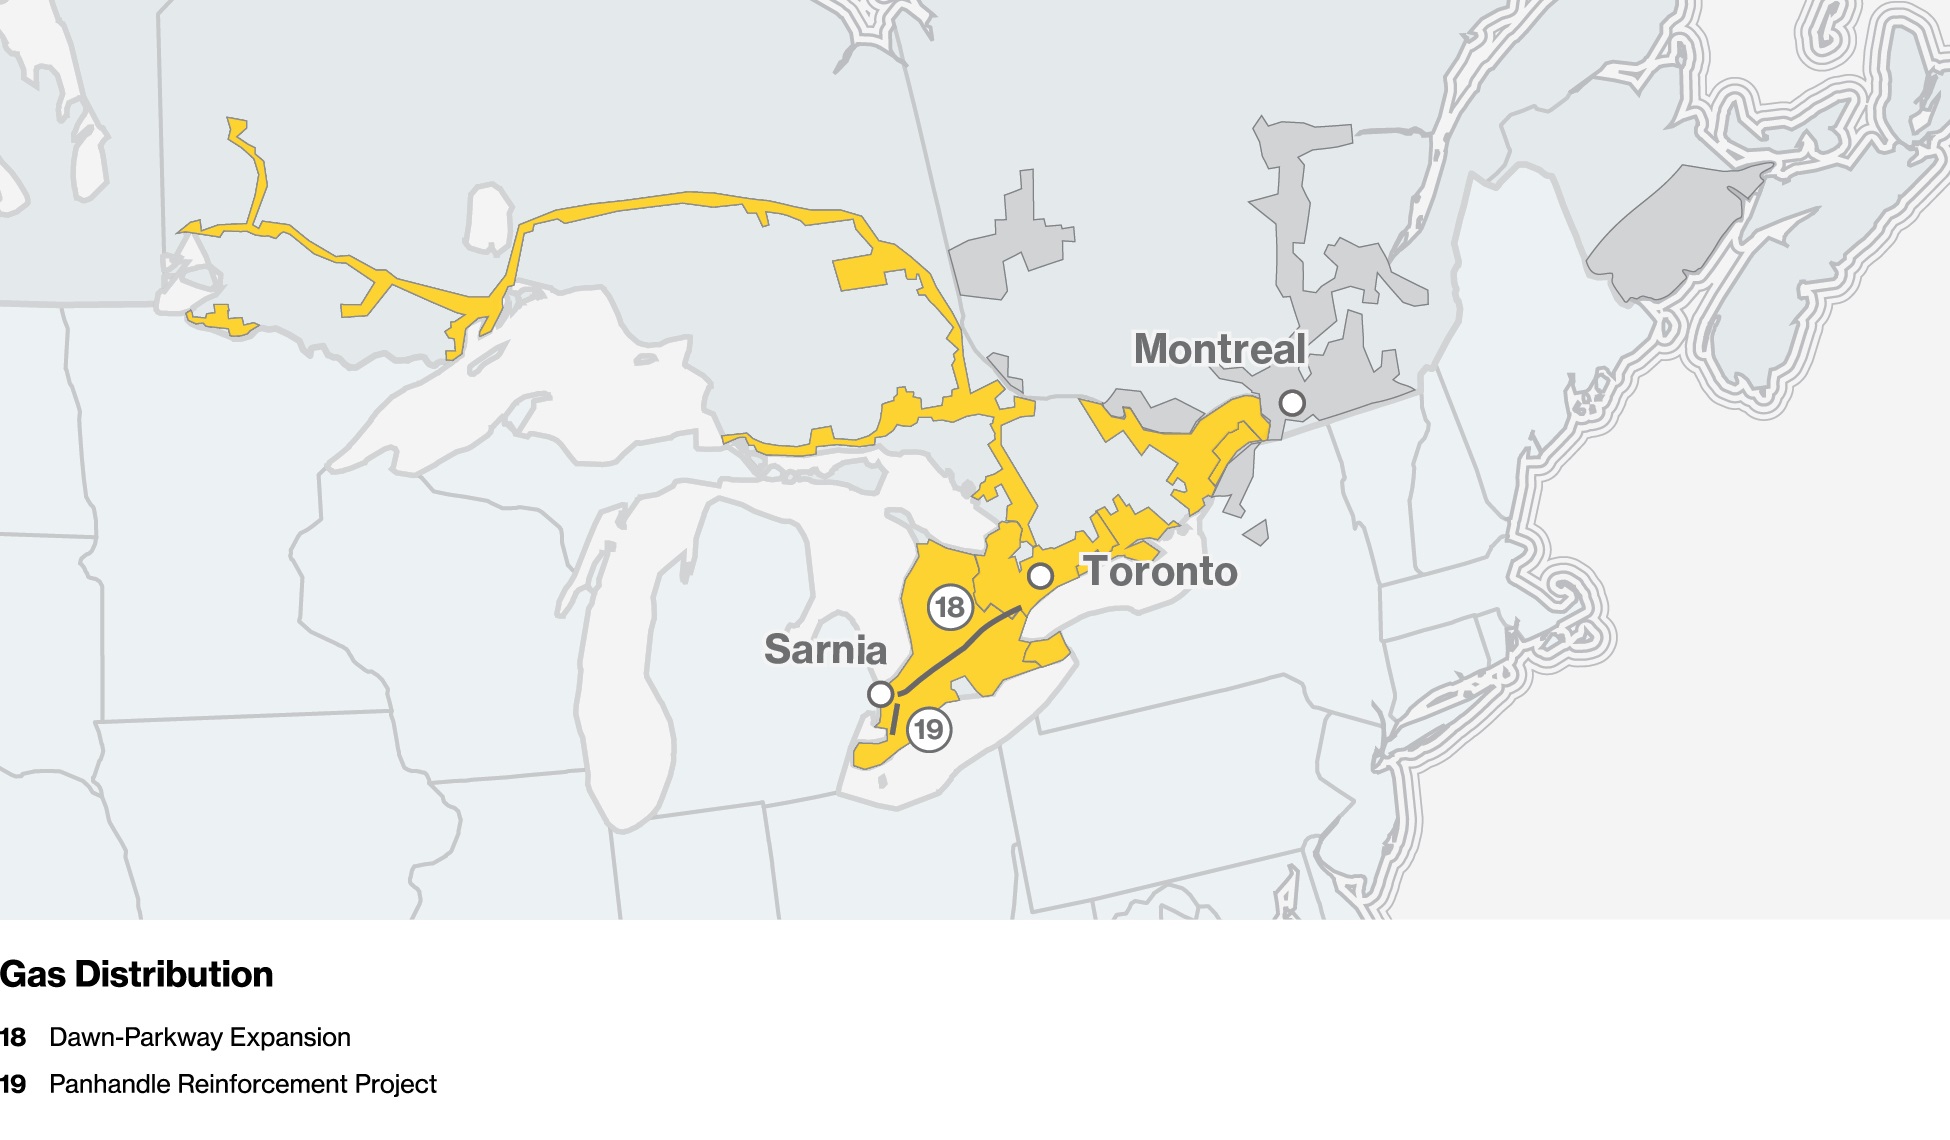
GAS DISTRIBUTION AND STORAGE
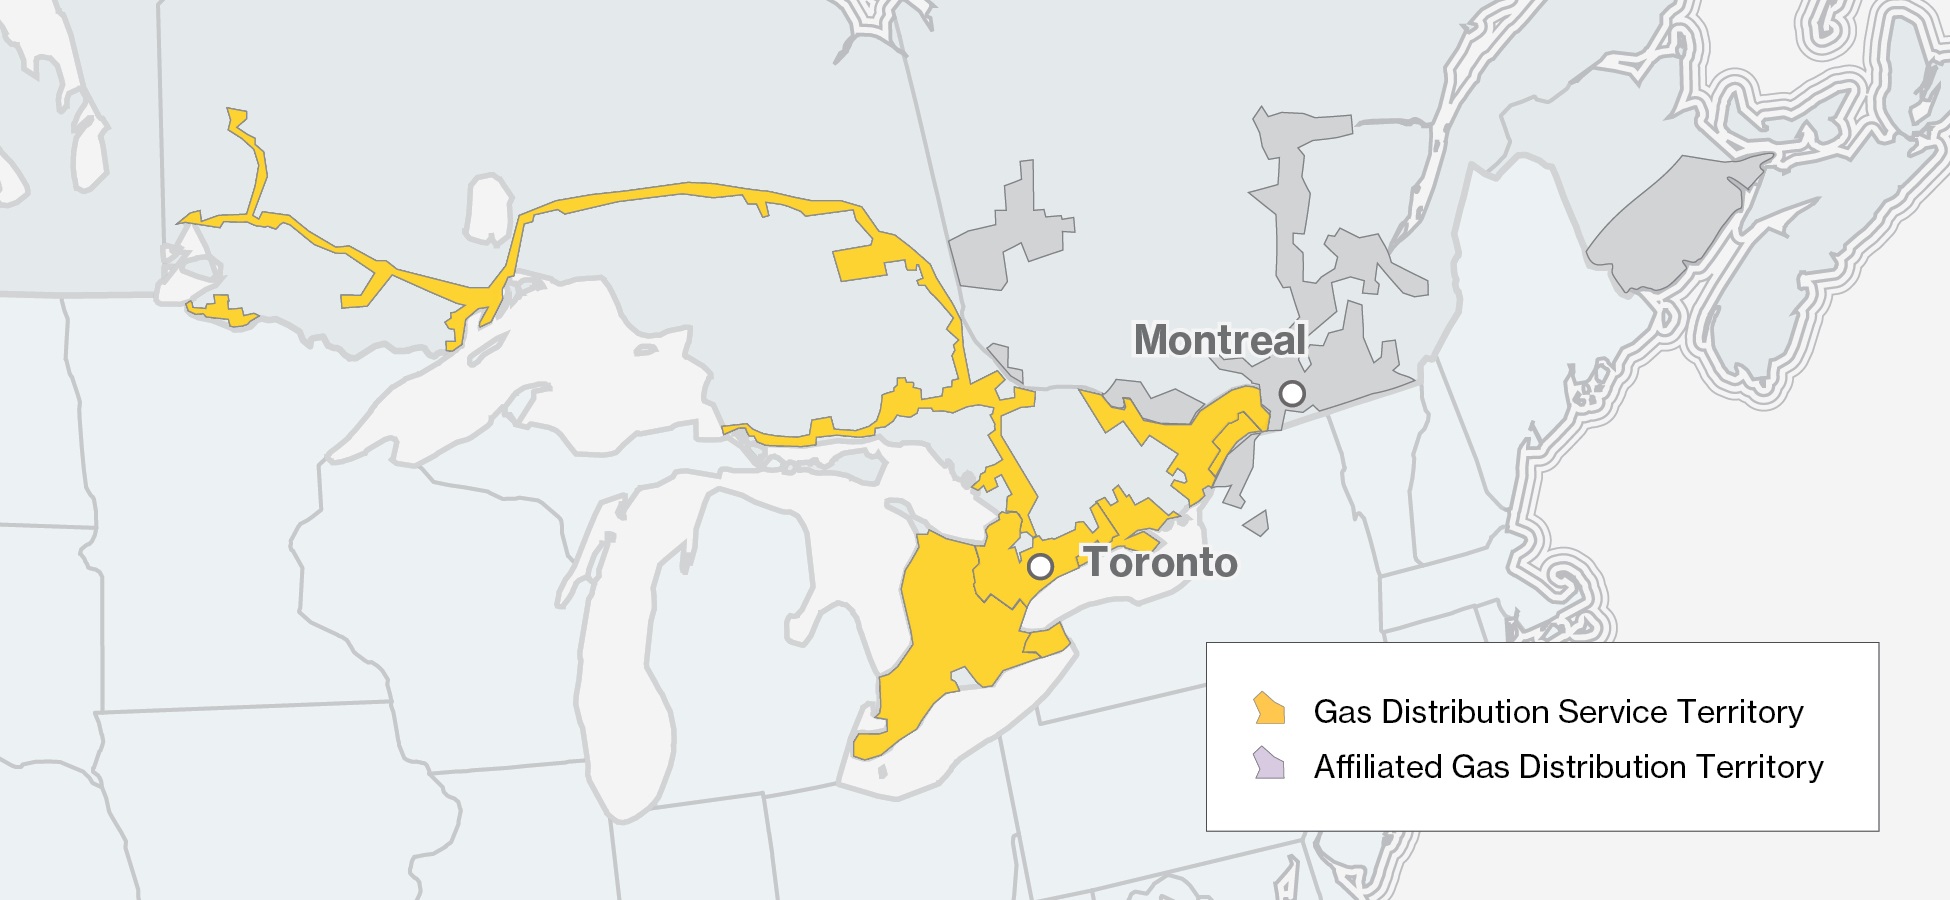
Gas Distribution and Storage consists of our natural gas utility operations, the core of which areis Enbridge Gas Distribution Inc. (EGD) and Union Gas Limited (Union(Enbridge Gas), which serveserves residential, commercial and industrial customers primarily located throughout Ontario. This business segment also includes natural gas distribution activities in Quebec and New Brunswick and our investment in Noverco Inc (Noverco).Québec.
On November 2, 2017, EGD and Union Gas filed an application with the Ontario Energy Board (OEB) to amalgamate the two utilities. If approved as filed, the application will provide a 10 year framework for the utilities to identify and leverage best practices and implement integrated solutions. A decision is expected in the second half of 2018.
ENBRIDGE GAS DISTRIBUTION
EGDEnbridge Gas is a rate‑regulatedrate-regulated natural gas distribution utility serving approximately 2.2 millionwith storage and transmission services. Enbridge Gas' distribution system, supported by storage and compression assets, carries natural gas from the point of local supply to customers and serves residential, commercial and industrial customers in its franchise areas of central and easternacross Ontario. In addition, EGD currently serves areas in northern New York State through St. Lawrence Gas Company Inc. (St. Lawrence Gas). In August 2017, EGD entered into an agreement to sell the issued and outstanding shares of St. Lawrence Gas. The transaction is expected to close in 2018, subject to regulatory approval and certain pre-closing conditions.
EGD also owns and operates regulated and unregulated natural gas storage facilities in Ontario. The utility business is conducted under statutes and municipal bylaws which grant the right to operate in the areas served. The utility operations of EGD and St. Lawrence Gas are regulated by the OEB and by the New York State Public Service Commission, respectively.
As at December 31, 2017, EGD owned and operated a network of approximately 39,000-kilometers (24,233-miles) of mains for the transportation and distribution of natural gas, as well as the service pipes to transfer natural gas from mains to meters on customers' premises.
There are fourthree principal interrelated aspects of the natural gas distribution business in which EGDEnbridge Gas is directly involved: Distribution, Service, Gas Supply, Transportation and Storage.
Distribution Service
EGD'sEnbridge Gas’ principal source of revenue arises from distribution of natural gas to customers. The services provided to residential, small commercial and industrial heating customers are primarily on a general service basis, (withoutwithout a specific fixed term or fixed price contract).contract. The services provided to larger commercial and industrial customers are usually on an annual contract basis under firm or interruptible service contracts. Under a firm contract, Enbridge Gas is obligated to deliver natural gas to the customer up to a maximum daily volume. The service provided under an interruptible contract is similar to that of a firm contract, except that it allows for service interruption at Enbridge Gas’ option primarily to meet seasonal or peak demands. The Ontario Energy Board (OEB) approves rates for both contract and general services. The distribution system consists of approximately 151,000 kilometers (93,827 miles) of pipelines that carry natural gas from the point of local supply to customers.
Gas Supply
Customers have a choice with respect to natural gas supply. Customers may purchase and deliver their own natural gas to points upstream of the distribution system or directly into Enbridge Gas’ distribution system, or, alternatively, they may choose a system supply option, whereby customers purchase natural gas from Enbridge Gas’ supply portfolio. To acquire the necessary volume of natural gas to serve its customers, EGDEnbridge Gas maintains a diversified natural gas supply portfolio. EGD's systemportfolio, acquiring supplies on a delivered basis in Ontario, as well as acquiring supply from multiple supply basins across North America.
Transportation
Enbridge Gas contracts for firm transportation service, primarily with TransCanada Pipelines Limited (TransCanada), Vector and NEXUS, to meet its annual natural gas supply requirements. The transportation service contracts have pricing structures responsive to supply and demand conditions in the North American natural gas market. The prices in these contracts may be indexed to Alberta, Chicago or New York based prices.
Transportation
EGD relies on its long-term contractsare not directly linked with Union Gas, an affiliated company under common control, for transportationany particular source of natural gas supply. Separating transportation contracts from natural gas supply allows Enbridge Gas flexibility in obtaining its own natural gas supply and accommodating the requests of its direct purchase customers for assignment of TransCanada capacity. Enbridge Gas forecasts the natural gas supply needs of its customers, including the associated transportation and storage requirements.
In addition to contracting for transportation service, Enbridge Gas offers firm and interruptible transportation services on its own Dawn-Parkway pipeline system. Enbridge Gas’ transmission system consists of approximately 3,800 kilometers (2,361 miles) of high pressure pipeline and five mainline compressor stations and has an effective peak daily demand capacity of 7.6 bcf/d. Enbridge Gas’ transmission system also links an extensive network of underground storage pools at the Tecumseh Gas Storage facility and Dawn Hub (Dawn), the largest integrated underground storage facility(collectively, Dawn) to major Canadian and US markets, and forms an important link in moving natural gas from western Canada and oneUS supply basins to central Canadian and northeastern US markets.
As the supply of the largest in North America, located in south-western Ontario, to EGD’s major market in the Greater Toronto Area. These contracts effectively provide EGD with access to United States sourced natural gas at Dawn. These contracts also provide transportation for natural gas receivedin areas close to Ontario has continued to grow, there has been increased demand to access these diverse supplies at Dawn via Vector as well as naturaland transport them along the Dawn-Parkway pipeline system to markets in Ontario, eastern Canada and the northeastern US. Enbridge Gas delivered 2,218 bcf of gas stored at EGD’sthrough its distribution and Union’s storage poolstransmission system in 2023. A substantial amount of Enbridge Gas’ transportation revenue is generated by fixed annual demand charges, with the Sarnia, Ontario area toaverage length of a long-term contract being approximately 17 years and the market area.longest remaining contract term being 17 years.
Storage
EGD’sEnbridge Gas’ business is highly seasonal as daily market demand for natural gas fluctuates with changes in weather, with peak consumption occurring in the winter months. Utilization of storage facilities permits EGDEnbridge Gas to take delivery of natural gas on favorable terms during off‑peakoff-peak summer periods for subsequent use during the winter heating season. This practice permits EGDEnbridge Gas to minimize the annual cost of transportation of natural gas from its supply basins, assists in reducing its overall cost of natural gas supply and adds a measure of security in the event of any short-term interruption of transportation of natural gas to EGD'sEnbridge Gas’ franchise area.areas.
Enbridge Gas’ storage facilities arefacility at Dawn is located in south-westernsouthwestern Ontario, near Dawn, and havehas a total working capacity of approximately 10.5 billion cubic feet (Bcf).284 bcf in 33 underground facilities located in depleted gas fields. Dawn is the largest integrated underground storage facility in Canada and one of the largest in North America. Approximately 8.5 Bcf180 bcf of the total working capacity is available to EGDEnbridge Gas for utility operations. EGDEnbridge Gas also has a storage contractcontracts with Union Gasthird parties for 2.0 Bcf21 bcf of storage capacity.
UNION GAS
Union Gas is a rate‑regulated natural gas distribution utility now serving approximately 1.5 million residential, commercial and industrial customers in its franchise areas of northern, southwestern and eastern Ontario.
Union Gas' regulated and unregulated storage and transmission business offers storage and transmission services to customers at Dawn. ItDawn offers customers an important link in the movement of natural gas from western CanadaCanadian and United StatesUS supply basins to markets in central Canada and the northeastern United States. The utility business is conducted under statutes and municipal by‑laws which grant the right to operate in the areas served. The utility operations of Union Gas are regulated by the OEB.
As at December 31, 2017, Union Gas owned and operated a network of approximately 66,000-kilometers (41,010-miles) of mains for the transportation and distribution of natural gas, as well as the service pipes to transfer natural gas from mains to meters on customers' premises.
Similar to EGD, there are four principal interrelated aspects of the natural gas distribution business in which Union Gas is directly involved: Distribution Service, Gas Supply, Transportation and Storage.
Distribution Service
Similar to EGD, Union Gas’ principal source of revenue arises from distribution of natural gas to customers. The services provided to residential, small commercial and industrial heating customers are primarily on a general service basis (without a specific fixed term or fixed price contract). The services provided to larger commercial and industrial customers underpinned by firm or interruptible service contracts.
Gas Supply
To acquire the necessary volume of natural gas to serve its customers, Union Gas maintains a diversified natural gas supply portfolio. Union Gas' system supply natural gas contracts have pricing structures responsive to supply and demand conditions in the North American natural gas market. The prices in these contracts may be indexed to Alberta, Michigan and Chicago based prices.
Transportation
Union Gas’ transmission system consists of approximately 4,900-kilometers (3,045-miles) of high-pressure pipeline and five mainline compressor stations. Key pipeline interconnects in Canada and the United States enabled Union Gas to deliver approximately 774 Bcf of gas through Union Gas’ transmission system in 2017. Union Gas’ transmission system also links an extensive network of underground storage pools at Dawn to major Canadian and United States markets. There are multiple pipelines providing access to Dawn. Customers can purchase both firm and interruptible transportation services on the Union Gas system. As the supply of natural gas in areas close to Ontario continues to grow, there is an increased demand to access these diverse supplies at Dawn and transport them along the Dawn-Parkway pipeline system to markets in Ontario, eastern Canada and the northeastern United States. To secure the continued reliable delivery of natural gas and to serve a growing demand for natural gas, Union Gas has invested $1.5 billion between 2015 and 2017 to expand the Dawn-Parkway natural gas transmission system. This has increased the takeaway capacity from Dawn to approximately 20 percent or from 6.3 bcf/d in 2014 to more than 7.5 bcf/d in 2017. A substantial amount of Union Gas’ transportation revenue is generated by fixed annual demand charges, with the average length of a long-term contract being approximately 11 years, with the longest remaining contract term being 15 years.
Storage
Union Gas’ underground natural gas storage facilities have a working capacity of approximately 165 Bcf in 25 underground facilities located in depleted gas fields. Union Gas’ storage pools give customers access to all Dawn storage capacity and deliverability.northeast US. Dawn's configuration provides flexibility for injections, withdrawals and cycling. Customers can purchase both firm and interruptible storage services at Dawn. Dawn offers customers a wide range of market choices and options with easy access to upstream and downstream markets. During 2017,2023, Dawn provided services such as storage, balancing, gas loans, transport, exchange and peaking services to over 140approximately 200 counterparties.
A substantial amount of UnionEnbridge Gas’ storage revenue is generated by fixed annual demand charges, with the average length of a long-term contract being approximately fivethree years withand the longest remaining contract term being 19 years.13 years.
NOVERCOGAZIFÈRE
We wholly own an equity interest in Noverco through ownership of 38.9% of its common shares and an investment in preferred shares. Noverco is a holding company that owns approximately 71% of Energir LP, formerly known as Gaz Metro Limited Partnership,Gazifère Inc. (Gazifère), a natural gas distribution company operatingthat serves approximately 45,000 customers in western Québec. Gazifère is regulated by the provinceQuébec Régie de l’énergie.
US GAS UTILITIES
On September 5, 2023, we announced that Enbridge had entered into three separate definitive agreements with Dominion Energy, Inc. to acquire The East Ohio Gas Company, Questar Gas Company and its related Wexpro companies, and Public Service Company of QuebecNorth Carolina for an aggregate purchase price of $19.1 billion (US$14.0 billion). If completed, the Acquisitions will create North America's largest natural gas utility platform delivering over 9 bcf/d to approximately 7 million customers across multiple regulatory jurisdictions. The Acquisitions are expected to close in 2024, subject to the satisfaction of customary closing conditions including the receipt of certain regulatory approvals, which are not cross-conditional.
COMPETITION
Enbridge Gas’ distribution system is regulated by the OEB and is subject to regulation in a number of areas, including rates. Enbridge Gas is not generally subject to third-party distribution competition within its franchise areas.
Enbridge Gas competes with interestsother forms of energy available to its customers and end-users, including electricity, coal, propane and fuel oils. Factors that influence the demand for natural gas include weather, price changes, the availability of natural gas and other forms of energy, the level of business activity, conservation, legislation including the federal carbon pricing law, governmental regulations, the ability to convert to alternative fuels and other factors.
SUPPLY AND DEMAND
We anticipate that demand for natural gas in subsidiary companies operatingNorth America will stabilize over the long term with potential growth in peak day demands; however, there are risks to the natural gas transmission,market that may challenge its growth prospects. The recent decision by the OEB on Enbridge Gas' application to establish 2024 base rates, net-zero carbon policies, evolving customer preferences for lower-carbon fuels and more efficient technologies, combined with increasing opposition to natural gas distributiondevelopment in North America, may reduce the markets’ ability to efficiently deploy capital to connect supply and power distribution businessesdemand. We monitor these factors closely to be able to develop our business strategy to align with shifts in customer preferences and public policy requirements.
The recent decision by the ProvinceOEB on Enbridge Gas' application to establish 2024 base rates includes changes to the revenue horizon over which costs can be recovered for small volume customer connections. The implications of Quebec and the State of Vermont. Noverco also holds, directly and indirectly, an investment in our Common Shares.
OTHER GAS DISTRIBUTION AND STORAGE
Otherrecent OEB decision are being assessed. Refer to Regulation - Government Regulations - Gas Distribution and Storage includes natural gas distribution utility operations in the Provinces of New Brunswick and Quebec. for further discussion.
Enbridge Gas New Brunswick Inc. operates thecontinues to focus on promoting conservation and energy efficiency by undertaking activities focused on reducing natural gas distribution franchiseconsumption through various demand side management programs offered across all markets and sourcing supply with a smaller carbon footprint. In addition to our existing and proposed RNG programs, we are also continuing our efforts to source other lower-carbon supplies, such as responsibly sourced natural gas, and H2.
Over the past decade, growth in the Province of New Brunswick, has approximately 11,800 customers and is regulatedNorth American gas supply landscape, driven mainly by the New Brunswick Energydevelopment of unconventional gas resources in the Montney, Permian, Marcellus and Utilities Board (EUB).
Gazifere isUtica supply basins, has resulted in lower annual commodity prices and narrower seasonal price spreads. However, over the past two years, geopolitical unrest has increased and led to elevated concerns with energy security in regions such as Europe and Asia. In response, one of two distributorsthe key supply sources supporting global energy security has been US LNG, which has introduced additional competition for North American supply. These market dynamics have resulted in Quebec servinghigher and more than 40,000 residential, commercial, institutionalvolatile natural gas prices across many US and industrial customers. Gazifere is regulatedCanadian natural gas trading points. Unregulated storage values are primarily determined by the Quebec Regie de l’energie.difference in value between winter and summer natural gas prices. As a result of the recent volatility exhibited in natural gas prices, storage values have risen.
RENEWABLE POWER & TRANSMISSIONGENERATION
Green
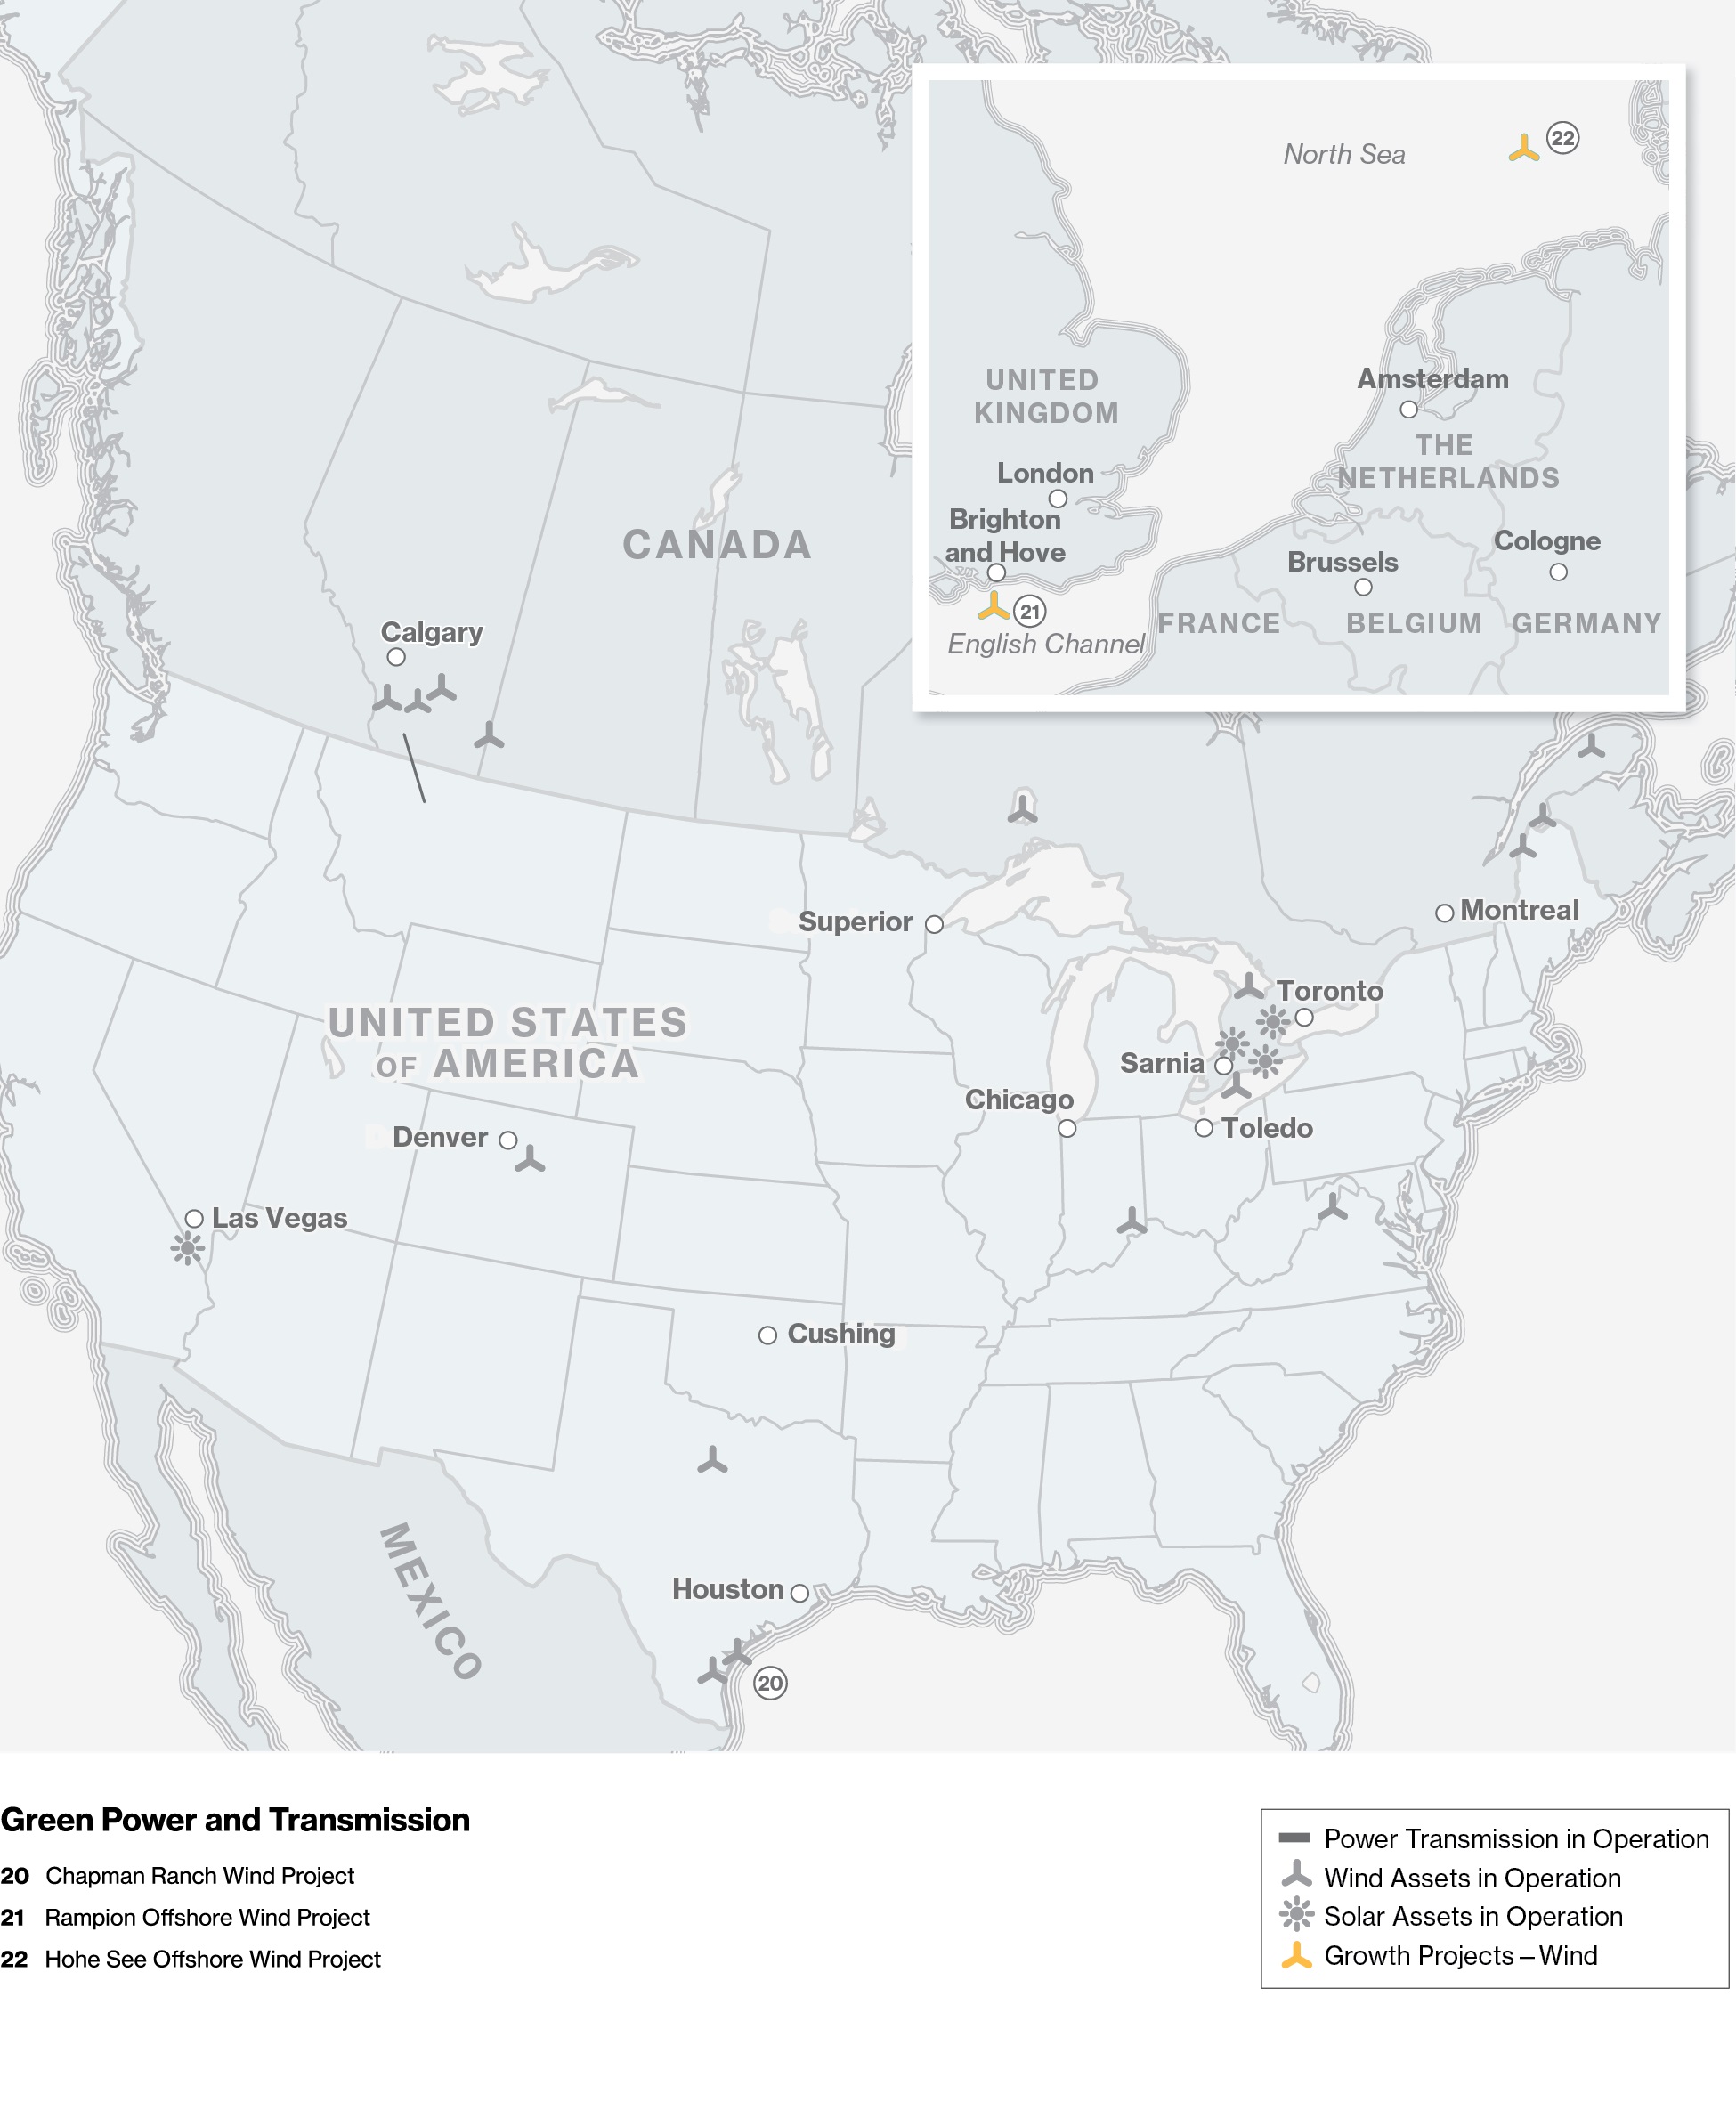
Renewable Power and TransmissionGeneration consists primarily of our investments in renewable energywind and solar assets, and transmission facilities. Renewable energy assets consist of wind, solar,as well as geothermal, and waste heat recovery, facilities and transmission assets. In North America, assets are located in Canada primarily in the provinces of Alberta, Ontario and Quebec and in the United States primarily in Colorado, Texas, Indiana and West Virginia. We also have assets under development located in Europe.
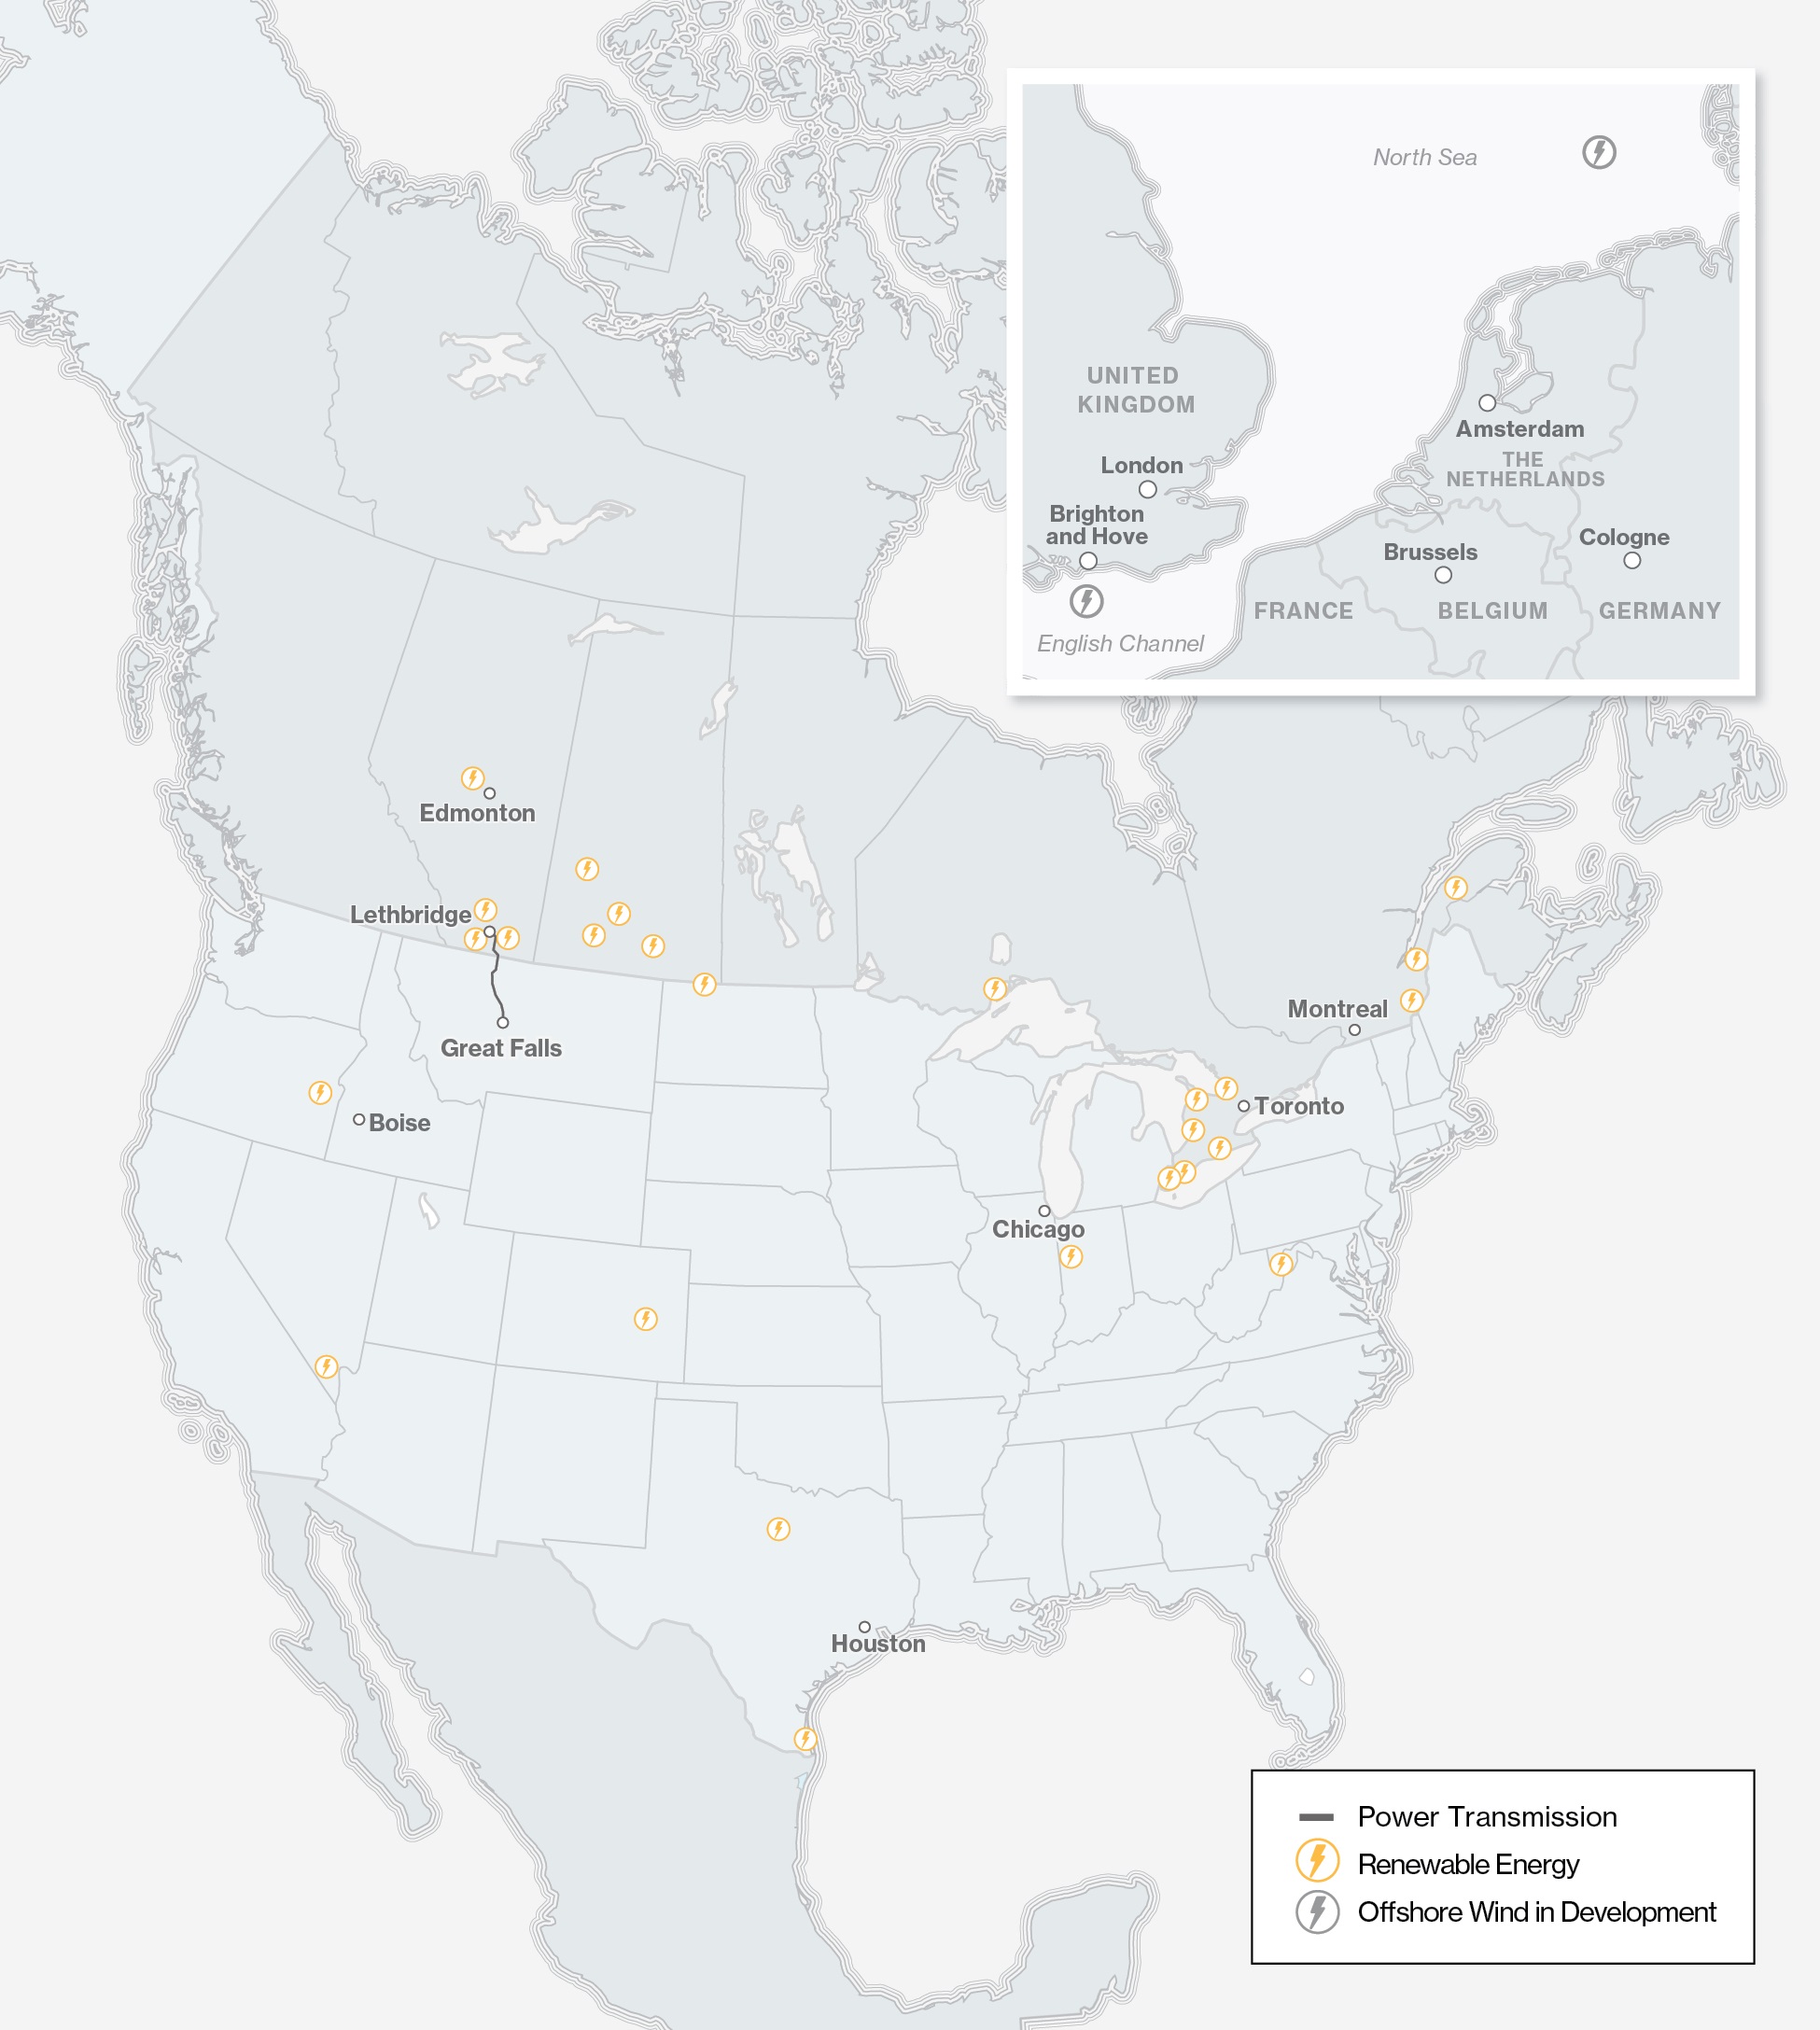
Green Power and Transmission includes approximately 2,500 MW of net operating renewable and alternative energy sources. Of this amount, approximately 930 MW of net power generating capacity comes from wind farms located in the provinces of Alberta, Ontario and QuebecQuébec, and approximately 1,040 MW of net power generating capacity comes from wind farms located in the states of Colorado, Texas, Indiana, Ohio and West Virginia, includingVirginia. In Europe, we hold equity interests in operating offshore wind facilities in the 249coastal waters of the United Kingdom, France, and Germany, as well as interests in several offshore wind projects under construction and active development in France and the United Kingdom.
Combined Renewable Power Generation investments represent approximately 2,371 MW Chapman Ranchof net generation capacity, which primarily consists of approximately:
•1,399 MW generated by North American wind facilities;
•526 MW generated by European offshore wind facilities;
•186 MW expected to be generated by the Fécamp and Calvados Offshore Wind Projects in France, both of which are currently under construction;
•6 MW expected to be generated by the Provence Grand Large Floating Offshore Wind Project (Chapman Ranch) in Texas,France, which was placed into serviceis under construction; and
•198 MW generated by North American solar facilities in late October 2017. operation, with an additional 30 MW in projects in pre-construction and under construction.
The vast majority of the power produced from these wind farmsfacilities is sold under long-term power purchase agreements. PPAs.
Renewable Power Generation also includes our 24.1% interest in the East-West Tie, a 450-MW transmission line in northwestern Ontario, which entered operations in March 2022.
JOINT VENTURES / EQUITY INVESTMENTS
Most of our investments in Canadian wind and solar assets and two of our US renewable assets are held within a joint venture in which we maintain a 51% interest and which we manage and operate. One of our US solar projects is held within a separate joint venture in which we hold a 50% stake.
We also have three solar facilities locatedown interests in Ontario and a solar facility located in Nevada, with 100 MW and 50 MW, respectively, of net power generating capacity. Also included in Green Power and Transmission is the Montana-Alberta Tie-Line, our first power transmission asset, a 300 MW transmission line from Great Falls, Montana to Lethbridge, Alberta.
In June 2017, we announced an additional 112 MW of investment in the partnership that holds the 610 MW Hohe See Offshore Wind Project in Germany, where we have an effective 50% interest. Earlier in 2016, we announced the acquisition of Chapman Ranch, as well as the acquisition of a 50% interest in a FrenchEuropean offshore wind development company, Éolien Maritime France SAS. Chapman Ranch was subsequently placed into service in late October 2017. In late 2015, we announced acquisitions offacilities through the 103-MW New Creek Wind Project in West Virginia and following joint ventures:
•a 24.9% interest in the 400 MW Rampion Offshore Wind, Projectlocated in the United Kingdom. Including these acquisitions, we have invested over $5 billionKingdom;
•a 49.9% interest in renewable power generationHohe See and transmission since 2002.Albatros Offshore Wind, located in Germany;
•a 25.5% interest in the Saint-Nazaire Offshore Wind Project, located in France;
Competition•a 25% interest in the Provence Grande Large Floating Offshore Wind Project, under construction in France;
Our Green•a 17.9% interest in the Fécamp Offshore Wind Project, under construction in France; and
•a 21.7% interest in the Calvados Offshore Wind Project, under construction in France.
COMPETITION
Renewable Power and Transmission assets operateGeneration operates in the North American and European power markets, which are subject to competition and the supply and demand balancefundamentals for power in the provinces and statesjurisdictions in which they operate.it operates. The majority of revenue is generated pursuant to long-term PPAs (or has been substantially hedged). As such, financial performance is not significantly impacted by fluctuating power prices arising from supply/demand imbalances or the actions of competing facilities during the term of the applicable contracts. However, the renewable energy market sector includes large utilities, and small independent power producers and private equity investors, which are expected to aggressively compete with us for new project development opportunities.opportunities and for the right to supply customers when contracts expire.
SupplyTo grow in an environment of heightened competition, we strategically seek opportunities to collaborate with well-established renewable power developers and Demandfinancial partners and to target regions with commercial constructs consistent with our low risk business model. In addition, we have expertise in completing and delivering large scale infrastructure projects.
The
SUPPLY AND DEMAND
Renewable power generation and transmission network in North America and Europe is expected to undergo significant growthgrow significantly over the next 20 years. years due to the replacement of older fossil fuel-based sources of electricity generation in support of announced governmental carbon emissions reduction targets. Any additional governmental actions toward reducing emissions and/or increasing electrification will further accelerate renewable electricity demand growth and electrification across all sectors.
On the demand side, North American economic growth over the longer term isand the continued electrification and transition to lower-carbon strategies within the residential, transportation and industrial sectors are expected to drive growing electricity demand. Furthermore, voluntary GHG emissions reduction targets are becoming increasingly expected by stakeholders, which is driving significant demand althoughfrom corporate electricity end-users for clean electricity and environmental attributes. However, continued efficiency gains are expected to make the economy less energy-intensive and temper overall demand growth.
On the supply side impendingin North America, legislation in Canada is expected to accelerateaccelerating the retirement of aging coal-fired generation, plants, resulting inwhile generation from conventional nuclear power is also forecast to decline. As a requirement forresult, North America requires significant new generation capacity. While coal and nuclear facilities will continue to be core components of power generation in North America, gas-firedcapacity from preferred technologies. Gas-fired and renewable energy facilities, including biomass, hydro, solar and wind (which make up the bulk of our renewable power assets), are expected to begenerally the preferred sources to replace coal-fired generation due to their lower carbonlower-carbon intensities.
North American wind Governments are also proposing tax incentives to support low-emission and solar resources fundamentals remain strong. In the United States, there is over 85 gigawatts (GW) of installed wind power capacity and in Canada over 12 GW of installed wind power capacity. Solar resources in southwestern states such as Arizona, California and Nevada are considered to be some of the best in the world for large-scale solar plants and the United States currently has over 35 GW of installed solar photovoltaic capacity. In late 2015, the United States passed legislation extending the availabilityrenewable energy generation resource development. As renewable energy takes an increasing share of certain Federalstates’ and provinces’ electricity grids, governments are also proposing tax incentives which have supportedfor natural gas and battery development to help firm the profitabilityvariable generation on the grid.
Falling capital and operating costs of wind and solar, projects. However, expanding renewable energy infrastructure in North America is not without challenges. Growing renewable generationcombined with their improving capacity is expected to necessitate substantial capital investment to upgrade existing transmission systems or, in many cases, build new transmission lines, as these high quality wind and solar resources are often found in regions that are not in close proximity to markets. In the near-term, uncertainty over the availability of tax or other government incentives in various jurisdictions, the ability to secure long-term power purchase agreements through government or investor-owned power authorities and low market prices of electricity may hinder the pace of future new renewable capacity development. However, continued improvement in technology and manufacturing capacity in the past few years has reduced capital costs associated with renewable energy infrastructure and has also
improved yield factors, of power generation assets. These positive developments are expected to rendercontinue the ongoing trend of making renewable energy more competitive and support ongoing investment over the long term.long-term, regardless of available government incentives. Generation from renewable sources is expected to double over the next two decades in North America. Aside from the construction of new wind and solar facilities, other growth opportunities include repowering projects to increase output from, and extend the project-life of, our existing facilities.
In Europe, the future outlook for renewable energy especially from offshore wind in countries with long coastlines and densely populated areas,outlook is very positive. According to the European Wind Energy Association, by 2030, wind energy capacity in Europerobust. Demand for electricity is expected to be 320 GW,gradually increase over the next two decades, driven by electrification of transportation and buildings, and the desire to reduce reliance on gas sourced from Russia. Energy efficiency gains are expected to temper, but not eliminate, demand growth. Renewable power is expected to play a significant role in Europe’s ability to meet its aggressive lower-carbon and renewable energy targets.
On the supply side, the International Energy Agency expects coal to fall by more than 90% from 2020 levels, while nuclear is expected to fall by one-third, by 2040. Over the same period, it anticipates power generation from renewable sources will more than double, including 66 GW ofinstalled (onshore and offshore) wind more than doubling and photovoltaics solar power nearly tripling. We, through our European joint ventures, continue to invest in offshore capacity.There is also wide public support for carbon reduction targetswind projects in the United Kingdom, France and broader adoption of renewable generation across all governmental levels. Furthermore, governments in Europe are seekingGermany, and to rationalizeexplore opportunities to meet the contribution of nuclear power to the overall energy mix, which has resulted in an increased focus on alternative sources such as large scale offshore wind.growing demand.
ENERGY SERVICES
The Energy Services businesses in Canada and the United States undertakeUS provide physical commodity marketing activity and logistical services, oversee refinery supply services and manage our volume commitments on various pipeline systems.
Energy Services provides energy supply and marketing services to North American refiners, producers, and other customers. Crude oil and NGL marketing services are provided by Tidal
Energy Marketing Inc. (Tidal). We transact at many North American market hubs and provides our customers with various services, including transportation, storage, supply management, hedging programs and product exchanges. TidalServices is primarily a physical barrel marketing company focused on servicing customers across the value chain and capturing value from quality, time, and location price differentials when opportunities arise. To execute these strategies, Energy Services may lease storage or rail cars, as well as hold nomination or contractual rightstransports and stores on both third partyEnbridge-owned and Enbridge-owned pipelinesthird-party assets using a combination of contracted pipeline, storage, railcar, and storage facilities. Tidal also provides natural gastruck capacity agreements.
Effective January 1, 2024, to better align how the chief operating decision-maker reviews operating performance and power marketing services, including marketing natural gasresource allocation across operating segments, we transferred our Canadian and US crude oil businesses from the Energy Services segment to optimize commitments on certain natural gas pipelines. Additionally, Tidal provides natural gas supply, transportation, balancingthe Liquids Pipelines segment. The Energy Services segment will cease to exist and storage for third parties, leveraging its natural gas marketing expertisethe remainder of the business will be reported in the Eliminations and access to transportation capacity.Other segment.
CompetitionCOMPETITION
Energy ServicesServices’ earnings are primarily generated from arbitrage opportunities which, by their nature, can be replicated by other competitors. An increase in market participants entering into similar arbitrage transactionsstrategies could have an impact on our earnings. Our effortsEfforts to mitigate competition risk includesinclude diversification of ourthe marketing business by tradingtransacting at the majority of major hubs in North America and establishing long-term relationships with clients.clients and pipelines.
ELIMINATIONS AND OTHER
Eliminations and Other includes operating and administrative costs and foreign exchange costs whichthat are not allocated to business segments.segments, the impact of foreign exchange hedge settlements and the activities of our wholly-owned captive insurance subsidiaries. The principal activity of our captive insurance subsidiaries is providing insurance and reinsurance coverage for certain insurable property and casualty risk exposures of our operating subsidiaries and certain equity investments. Eliminations and Other also includesnew business development activities and general corporate investments.
INSURANCEREGULATION
GOVERNMENT REGULATION
Pipeline Regulation
Our operationsLiquids Pipelines and Gas Transmission and Midstream assets are subject to many hazards inherent in our industry. Our assets may experience physical damage as a result of an accident or natural disaster. These hazards can also cause personal injury and loss of life, severe damage to and destruction of property and equipment, pollution or environmental damage, and suspension of operations. We maintain a comprehensive insurance program for us, our subsidiaries and our affiliates. This program includes insurance coverage in types and amounts and with terms and conditions that are generally consistent with coverage customary for our industry.
Although we believe our current coverage is adequate for our purposes, we have in the past had occurrences that led to losses exceeding our then-applicable coverage limits, and there is no assurance
that the same may not happen in the future. In the unlikely event that multiple insurable incidents which in aggregate exceed coverage limits occur within the same insurance period, the total insurance coverage will be allocated among our entities on an equitable basis based on an insurance allocation agreement among us and our subsidiaries.
OPERATIONAL AND ECONOMIC REGULATION
LIQUIDS PIPELINES
Operational Regulation
Operational regulation risks relate to compliance with applicablenumerous operational rules and regulations mandated by governments orand applicable regulatory authorities, breaches of which could result in fines, penalties, operating restrictions and an overall increase in operating and compliance costs.
Regulatory scrutiny over the integrity of liquids pipeline assets has the potential to increase operating costs or limit future projects. Potential regulatory changes could have an impact on our future earnings and the cost related to the construction of new projects. We believe operational regulation risk is mitigated by active monitoring and consulting on potential regulatory requirement changes with the respective regulators or through industry associations. We also develop robust response plans to regulatory changes or enforcement actions. While we believe the safe and reliable operation of our assets and adherence to existing regulations is the best approach to managing operational regulatory risk, the potential remains for regulators to make unilateral decisions that could have a financial impact on us.
In the United States,US, our interstate pipeline operations are subject to pipeline safety laws and regulations administered by the Pipeline and Hazardous Materials Safety Administration (PHMSA) of, an agency within the United States Department of Transportation (DOT). These laws and regulations require us to comply with a significant set of requirements for the design, construction, maintenance and operation of our interstate pipelines. These laws and regulations, among other things, include requirements to monitor and maintain the integrity of our pipelines. The regulations determine the pressures at which our pipelines can operate.and to operate them within permissible pressures.
PHMSA is designing an Integrity Verification Process intendedcontinues to createreview existing regulations and establish new regulations to support safety standards to verify maximum allowable operating pressure, andthat are designed to improve and expandoperations integrity management processes. Additionally, PHMSA will establish standards for storage facilities. There remains uncertainty as to how these standards will be implemented, but it is expected that the changes will impose additional costs on new pipeline projects as well as on existing operations. In this climate of increasingly stringent regulation, pipeline failuresfailure or failures to comply with applicable regulations could result in reduction of allowable operating pressures as authorized by PHMSA, which would reduce available capacity on our pipelines. Should any of these risks materialize, it may have an adverse effect on our operations, capital expenditures, earnings, cash flows, financial condition and cash flows.competitive advantage.
Our ability to establish transportation and storage rates on our US interstate natural gas facilities is subject to regulation by the FERC, whose rulings and policies could have an adverse impact on the ability to recover the full cost of operating these pipeline and storage assets, including a reasonable rate of return. Regulatory or administrative actions by the FERC such as rate proceedings, applications to certify construction of new facilities, and depreciation and amortization policies can affect our business, including decreasing tariff rates and revenues and increasing our costs of doing business.
In Canada, our pipeline operationspipelines are subject to pipeline safety regulations overseenadministered by the NEBCER or provincial regulators. Applicable legislation and regulationregulations require us to comply with a significant set of requirements for the design, construction, maintenance and operation of our pipelines. Among other obligations, this regulatory framework imposes requirements to monitor and maintain the integrity of our pipelines.
As in the United States, several legislative changesUS, laws and regulations addressing enhanced pipeline safety in Canada have recently come into force.been enacted over the past few years. The changes evidencedemonstrate an increased focus on the implementation of management systems to address key areas, such as emergency management, integrity management, safety, security and environmental protection. Other legislative changes have createdThe CER has authority for the NEB to impose administrative monetary penalties for non-compliance with the regulatory regime it administers, as well as to impose financial requirements for future abandonment and major pipeline releases.
A key component of pipeline safety and reliability is the approach to integrity management that uses reliability targets and safety case assessments. A long history of extensive inline inspection has provided detailed knowledge of the assets in our pipeline systems. Our pipelines are assessed and maintained in a proactive manner ensuring reliability targets are met. Furthermore, the integrity management program has an independent step to check the results of integrity assessments to validate the effectiveness of the program and to ensure that the operational risk remains as low as reasonably practicable throughout the integrity inspection and assessment cycle. As inspection technology, pipeline materials and construction practices improve with time, and new data on threats and pipeline condition are gathered, our methods of maintaining fitness for service evolves, with a strong focus on continual improvement in every aspect of integrity management.
We
Our pipelines also face economic regulatory risk. Broadly defined, economic regulatory risk is the risk that governments or regulatory agencies reject or revise proposed commercial arrangements, applications or policies, upon which future and current operations are dependent. Our pipelines are subject to the actions of various regulators, including the CER and the FERC, with respect to tariffs and tolls. The rejection or revision of applications for approval of new tariff structures or proposed commercial arrangements and changes in interpretation of existing regulations by courts or regulators could have an adverse effect on our revenues and earnings.
Gas Distribution and Storage
Our gas distribution and storage utility operations are regulated by the OEB and the Québec Régie de l’énergie, among others. To the extent that the regulators’ future actions are different from current expectations, the timing and amount of recovery or refund of amounts recorded in the Consolidated Statements of Financial Position, or amounts that would have been recorded in the Consolidated Statements of Financial Position in the absence of the effects of regulation, could be different from the amounts that are eventually recovered or refunded.
Enbridge Gas' distribution rates, were set under a five-year incentive regulation (IR) framework using a price cap mechanism, which ended on December 31, 2023. The price cap mechanism established new rates each year through an annual base rate escalation at inflation less a 0.3% productivity factor, in addition to annual updates for certain costs to be passed through to customers, and where applicable, provided for the recovery of material discrete incremental capital investments beyond those that could be funded through base rates. The IR framework included the continuation and establishment of certain deferral and variance accounts, as well as an earnings sharing mechanism that required Enbridge Gas to share equally with customers any earnings in excess of 150 basis points over the annual OEB approved return on equity (ROE).
In October 2022, Enbridge Gas filed its application with the OEB to establish a 2024 through 2028 IR rate setting framework. The application initially sought approval in two phases to establish 2024 base rates (Phase 1) on a cost-of-service basis and to establish a price cap rate setting mechanism (Phase 2) to be used for the remainder of the IR term. A third phase (Phase 3) has been established with the OEB as part of the Phase 1 Partial Settlement Proposal (Settlement Proposal).
On August 17, 2023, the OEB approved the Settlement Proposal to support the determination of just and reasonable rates effective January 1, 2024. Items resolved in whole or in part include:
•additions to rate base up to and including 2022;
•interest rates on debt and return on equity;
•deferral and variance accounts;
•Indigenous engagement; and
•rate implementation approach for 2024.
On December 21, 2023, the OEB issued its Decision and Order on Phase 1 (Phase 1 Decision). The decision addressed three main areas: energy transition, Enbridge Gas Distribution Inc. and Union Gas Limited amalgamation and harmonization issues, and other issues. The Phase 1 Decision included the following key findings or orders:
•energy transition risk requires Enbridge Gas to carry out a risk assessment to consider further risk mitigation measures in three areas: system access and expansion capital spending, system renewal capital spending and depreciation policy;
•our 2024 capital plan must be reduced by $250 million with a focus on monitoring, repair and life extension of our assets and a further $50 million of capitalized indirect overhead costs must be expensed, escalating to $250 million per year during the IR term with an offsetting adjustment to revenues in each year;
•all new small volume customers wishing to connect to natural gas pay their full connection costs as an upfront charge rather than through rates over time effective January 1, 2025;
•approval of a harmonized depreciation methodology that reduced the level of depreciation sought and adjusted asset lives including extensions of service life for certain asset classes;
•an increase in equity thickness from 36% to 38% effective for 2024; and
•January 1, 2024 will be the effective date for 2024 rates.
The issues addressed in the Settlement Proposal and the Phase 1 Decision resulted in the following items not approved for future recovery, and the subsequent impairments recognized for the year ended December 31, 2023:
•a portion of undepreciated capital projects removed from 2024 rate base of $41 million;
•undepreciated integration capital costs removed from 2024 rate base of $84 million; and
•pre-2017 Union Gas Limited related pension balances of $156 million.
Enbridge Gas filed a Notice of Appeal in the Ontario Divisional Court on January 22, 2024 regarding four aspects of the Phase 1 Decision: small volume customer revenue horizon, the 2024 capital plan reduction, the extension of service life for certain asset classes and equity thickness. On January 29, 2024 Enbridge Gas also filed a Notice of Motion with the OEB requesting the OEB to review and vary five aspects of the Phase 1 Decision: small volume customer revenue horizon, the 2024 capital plan reduction, integration capital, depreciation and equity thickness. The outcome of these proceedings is uncertain.
The Phase 1 Decision results in interim rates, pending phases 2 and 3 of the proceeding, resolution of the Notice of Appeal, Notice of Motion and any possible legislative steps that could be undertaken by the Government of Ontario further to the Ontario Minister of Energy's December 22, 2023 news release. Phase 2 will establish and determine the incentive rate mechanism for the remainder of the rebasing term, and gas cost and unregulated storage cost allocation. Phase 3 will address cost allocation and the harmonization of rates and rate classes between legacy rate zones.
Enbridge Gas continues to develop opportunities to support a lower-carbon future in Ontario. In 2021, we received OEB approval of an Integrated Resource Planning (IRP) framework and integrated the framework into our planning practices. The framework requires Enbridge Gas to consider facility and non-pipe demand and/or supply side alternatives (IRP alternatives) to address the systems needs of its regulated operations, where certain parameters have been met. The framework also allows Enbridge Gas to pursue an IRP alternative (or combination of IRP alternatives and facility alternative) where it is found to be in the best interests of Enbridge Gas and its customers, taking into account reliability and safety, cost-effectiveness, public policy, optimized scoping, and risk management.
On July 19, 2023, Enbridge Gas filed an application seeking approval for the cost consequences associated with two IRP pilot projects. The projects are designed to implement demand-side IRP alternatives, including enhanced targeted energy efficiency and residential demand response programs, in combination with supply-side IRP alternatives, in select communities in order to mitigate identified system constraints and associated facility projects. The pilot projects are intended to provide learnings on the performance of the selected IRP alternatives, including the potential for scalability, that can be leveraged in future IRP alternative plan design. An OEB decision is expected during 2024.
Renewable Power Generation
Renewable Power Generation is subject to numerous operational rules and regulations mandated by governments and applicable regulatory authorities, breaches of which could result in fines, penalties, operating restrictions and an overall increase in operating and compliance costs.
The North American Electric Reliability Council (NERC) is an international regulatory authority responsible for establishing and enforcing reliability standards to reduce risks to the reliability and security of the grid in Canada, the US, and Mexico. It is subject to oversight from the FERC in the US and provincial governments in Canada. The FERC has authority over many markets in the US and is tasked with ensuring safe, reliable, and secure interstate transmission of electricity, natural gas, and oil. This includes establishing reliability standards and determining certain pricing aspects of transmission development and access, among others. NERC and FERC standards and pricing decisions are also updated from time to time and could impact our operations, capital expenditures, earnings, and cash flows, though some of these impacts could be positive for our business.
At the US federal level, our Renewable Power Generation assets are subject to legislation overseen by the US Fish and Wildlife Service, which is aimed at reducing the impact of development and human activity on wildlife, along with other federal environmental permitting legislation. These federal environmental laws are subject to change from time to time which could require Enbridge to obtain new permits, update practices, or amend operations and operating expenditures.
In Canada, the Federal Government does not generally regulate the electricity sector, though it has imposed a federal carbon price on other sectors via its output-based pricing system (OBPS) and has proposed a Clean Electricity Regulation (CE Regulation) that would require Canada’s electricity grid to reach net-zero by 2035. The CE Regulation is expected to come into effect in 2024.
Policy changes may also provide new opportunities for existing assets and new developments. The US passed the Inflation Reduction Act in late 2022, which established long-term production and investment tax credits for renewable power generation, battery storage projects and for related manufacturing supply chains. Similarly, Canada has prepared legislation that would establish competitive tax credits for renewable power generation and battery storage projects, which it anticipates passing in early 2024. Changes to these tax programs could impact development plans.
Renewable Power Generation is also subject to provincial and state regulations governing the energy resource mix on the grid, emissions levels of the electricity grid, and market regulations related to emergency operations, extreme weather preparedness, and market participation, among others. These regulations may change from time to time, which could impact Enbridge’s operations and increase the costs of participating in regional electricity markets. In 2023, Texas introduced firming requirements that would require new wind and solar projects to be paired with batteries or other firm power supply and/or introduced caps on the percentage of the grid’s power that can be provided by variable generation. Other state and provincial governments are considering similar legislation.
Our Renewable Power Generation assets in France and Germany each have federal policies in place and are subject to directives and regulations established and enforced by the European Union (EU). These include the Renewable Energy Directive, the European Green Deal, and ongoing work on financing mechanisms and transmission directives and programs. The EU is also responsible for establishing environmental protection rules and permitting standards. During 2022, member states of the EU introduced extraordinary and temporary measures to address high energy prices including caps and demand reduction goals. As the minimum PPA prices in Germany and France are still honored, there are no negative implications to our PPA prices. The federal policies and regulations in place are subject to change from time to time, which could impact our operations and related expenditures; however, the EU’s general direction is to facilitate increased renewable power integration to its grid.
The United Kingdom (UK) government is responsible for establishing renewable energy and carbon pricing policies for the entire UK, as well as long-term electricity sector planning and procurement mechanisms and structure for auctions that are administered at the national level, e.g., England, Scotland, within the UK. Each country within the UK is also responsible for establishing its own environmental and permitting regulations. This process is still ongoing following Brexit and in some cases continues to result in more volatile merchant power prices; however, expanded interconnectors to Europe and policies aimed at increasing domestic renewable capacity are in progress. Governments have introduced temporary price controls, effective January 1, 2023, to address the significant increase in energy prices. The impact of merchant exposure on our Renewable Power Generation asset in the UK is limited by fixed revenue payments backed by the UK government.
Energy Services
Energy Services is regulated by government authorities in the areas of commodity trading, import and export compliance and the transportation of commodities. Non-compliance with governing rules and regulations could result in fines, penalties and operating restrictions. These consequences would have an adverse effect on operations, earnings, cash flows, financial condition and competitive advantage. Energy Services retains dedicated professional staff and has a robust regulatory compliance program (including targeted training) to mitigate these potential risks associated with the business.
In the US, commodity marketing is regulated by the Commodity Futures Trading Commission, the FERC, the SEC, the Federal Trade Commission, the various commodity exchanges, the US Department of Justice and state regulators. The provincial and territorial securities regulators similarly regulate commodity marketing within Canada and are members of the Canadian Securities Administrators. These various regulators enforce, among other things, the prohibition of market manipulation, fraud and disruptive trading.
The regulation of wholesale sales of electric energy is also regulated by the FERC, which authorizes Energy Services to sell electricity at market-based rates.
The export of natural gas out of Alberta is regulated by the Alberta Energy Regulator. The import and export of commodities between Canada and the US is subject to regulation by the CER and the US Department of Energy, as well as customs authorities. In particular, import and export permits are required, with associated regular reporting requirements. Breaches of import and export rules and permits could result in an inability to perform day to day operations, and can negatively impact the earnings of the business.
The transportation of crude oil and natural gas liquids by railcar or truck is regulated by the US DOT, Transport Canada and provincial regulation. Each jurisdiction requires compliance with security, safety, emergency management, and environmental laws and regulations related to ground transportation of commodities. Risks associated with transportation of crude or natural gas liquids include unplanned releases. In the event of a release, remediation of the affected area would be required. Energy Services engages third parties, such as Emergency Response Assistance Canada, the Chemical Transportation Emergency Center and the Canadian Transport Emergency Center to assist in such remediation.
ENVIRONMENTAL REGULATION
Pipeline Regulation
Our Liquids Pipelines and Gas Transmission and Midstream assets are subject to numerous federal, state and provincial environmental laws and regulations affecting many aspects of our present and future operations, including air emissions, water quality, wastewater discharges, solid wastewater discharge and hazardous waste. These laws and regulations generally require us to obtain and comply with a wide variety of environmental licenses, permits inspections and other approvals.
In particular, in the United States,US, compliance with major Clean Air Act regulatory programs is likely tomay cause us to incur significant capital expenditures to obtain permits, evaluate off-site impacts of our operations, install pollution control equipment, and otherwise assure compliance. Some equipment in states in which we operate are implementingaffected by the Good Neighbor Rule establishing new emissionsemission limits to comply with 2008 ozone standards regulated under the National Ambient Air Quality Standards.for nitrogen oxides. In 2015, the ozone standards were lowered even further from 75 parts per billion (ppb) to 70 ppb, which may require states to implement additional emissions regulations.addition, there are evolving regulations on environmental justice that could impact Enbridge facilities. The precise nature of these compliance obligations at each of our facilities has not been finally determined and may depend in part on future regulatory changes. In addition, compliance with new and emerging environmental regulatory programs is likely tomay significantly increase our operating costs compared to historical levels.
In the United States,US, climate change action is evolving at federal, state and regional and federal levels. The Supreme Court decision in Massachusetts v. EPA in 2007 established that greenhouse gas (GHG) emissions were pollutants subject to regulation under the Clean Air Act. Pursuant to federal regulations, we are currently subject to an obligation to report our GHG emissions at our largest emitting facilities. On December 2, 2023 the Environmental Protection Agency (EPA) released a final rule to minimize methane emissions for new and existing crude oil and natural gas facilities, but are not generally subjectcoupled later with a fee for excess emissions. The current US presidential administration has been implementing policies designed to limits on emissions of GHGs, (except to the extent that some GHGs consist of volatile organic compoundscombat climate change and nitrous oxides that are subject to emission limits).reduce GHG emissions. In addition, a number of provinces and states have joined regional GHG initiatives, and a number are developing their own programs that would mandate reductions in GHG emissions. Public interest groups and regulatory agencies are increasingly focusing on the emission of methane associated with natural gas development and transmission as a source of GHG emissions. However, asBased on proposed changes to measure, report and mitigate GHG emissions the key details of future GHG restrictionsexpectation is that there will be a significant increase in costs to maintain and report compliance mechanisms remain undefined, the likely future effects onfor businesses in our business are highly uncertain.industry.
Canada has reaffirmed its strong preference foradopted a harmonizedpan-Canadian approach with thatto pricing carbon emissions to incent GHG emission reductions across all sectors of the United States. Whileeconomy. This approach was adopted in 2016 and entails both a consumer price on carbon, and an intensity-based system for industry which addresses competitiveness and carbon leakage. Provinces and territories may implement their own system of carbon pricing provided it meets the federal GHG related regulatory design details remain forthcoming, provincial authorities have been actively pursuing related initiatives.
Failure to comply with environmental regulations may result in the imposition of fines, penalties and injunctive measures affecting our operating assets. In addition, changes in environmental laws and regulations or the enactment of new environmental laws or regulations could result in a material increase in our cost of compliance with such laws and regulations. We may not be able to obtain or maintain all required environmental regulatory approvals for our operating assets or development projects. If there is a delay in obtaining any required environmental regulatory approvals,benchmark (and if wethey fail to obtain or comply with them, or if environmental laws or regulations change or are administereddo so the federal system will be imposed on them). In March 2022, Canada published its 2030 Emissions Reduction Plan (ERP) which builds on the Pan-Canadian Framework, and Net-Zero Emissions Accountability Act, and details the roadmap for Canada to meet its domestic climate target of a 40-45% reduction in a more stringent manner,GHG emissions by 2030 and attaining net-zero emissions by 2050. The ERP details the operationscomplementary policies and programs that Canada will enact to enable it to meet its domestic climate goal. Effective January 1, 2023, the federal carbon price was increased from $50 to $65 per tonne of facilities or the development of new facilities could be prevented, delayed or become subjectcarbon dioxide equivalent (tCO2e). This will increase by $15 per tonne each year and rise to additional costs. We expect that costs we incur to comply with environmental regulations$170 per tCO2e in the future will have a significant effect on our earnings2030.
Gas Distribution and cash flows.
Due to the speculative outlook regarding any United States federal and state policies, we cannot estimate the potential effect of proposed GHG policies on our future consolidated results of operations, financial position or cash flows. However, such legislation or regulation could materially increase our operating costs, require material capital expenditures or create additional permitting, which could delay proposed construction projects.
Economic RegulationStorage
Our liquids pipelines also face economic regulatory risk. Broadly defined, economic regulation risk is the risk that governments or regulatory agencies change or reject proposed or existing commercial arrangements including permitsGas Distribution and regulatory approvals for new projects. The Canadian Mainline, Lakehead System and other liquids pipelines are subject to the actions of various regulators, including the
NEB and FERC, with respect to the tariffs and tolls of those operations. The changing or rejecting of commercial arrangements, including decisions by regulators on the applicable tariff structure or changes in interpretations of existing regulations by courts or regulators, could have an adverse effect on our revenues and earnings. Delays in regulatory approvals on projects such as our L3R Program, could result in cost escalations and construction delays, which also negatively impact our operations.
We believe that economic regulatory risk is reduced through the negotiation of long-term agreements with shippers that govern the majority of our liquids pipeline assets. We also involve our legal and regulatory teams in the review of new projects to ensure compliance with applicable regulations as well as in the establishment of tariffs and tolls on new and existing pipelines. However, despite our efforts to mitigate economic regulation risk, there remains a risk that a regulator could overturn long-term agreements that we have entered into with shippers or deny the approval and permits for new projects.
GAS TRANSMISSION & MIDSTREAM
Operational Regulation
The span of regulatory risks that apply to the Liquids Pipeline business as described above under Liquids Pipelines also applies to the Gas Transmission and Midstream business. Additionally, most of our United States gas transmissionStorage operations, are regulated by the FERC. The FERC regulates natural gas transmission in United States interstate commerce including the establishment of rates for services. The FERC also regulates the construction of United States interstate natural gas pipelines and storage facilities, including the extension, enlargement and abandonment of facilities. In addition, certain operations are subject to oversight by state regulatory commissions. To the extent that the natural gas intrastate pipelines that transport or store natural gas in interstate commerce provide services under Section 311 of the Natural Gas Policy Act of 1978, they are subject to FERC regulations. The FERC may propose and implement new rules and regulations affecting interstate natural gas transmission and storage companies, which remain subject to the FERC’s jurisdiction. These initiatives may also affect certain transmission of gas by intrastate pipelines.
Our SEP and DCP Midstream operations are subject to the jurisdiction of the Environmental Protection Agency and various other federal, state and local environmental agencies. Our United States interstate natural gas pipelines and certain of DCP Midstream’s gathering and transmission pipelines are also subject to the regulations of the DOT concerning pipeline safety.
The intrastate natural gas and NGL pipelines owned by us and DCP Midstream are subject to state regulation. The natural gas gathering and processing activities of DCP Midstream are not subject to FERC regulation.
Our Canadian operations are governed by various federal and provincial agencies with respect to pipeline safety, including the NEB and the Transportation Safety Board, the British Columbia Oil and Gas Commission, the Alberta Energy Regulator and the Ontario Technical Standards and Safety Authority.
Our Canadian natural gas transmission and distribution operations and approximately two-thirds of the storage operations in Canada are subject to regulation by the NEB or the provincial agencies in Canada, such as the OEB. These agencies have jurisdiction similar to the FERC for regulating rates, the terms and conditions of service, the construction of additional facilities and acquisitions. Our British Columbia Pipeline and British Columbia Field Services business in western Canada is regulated by the NEB pursuant to a framework for light-handed regulation under which the NEB acts on a complaints-basis for rates associated with that business. Similarly, the rates charged by our Canadian Gas Transmission and Midstream operations for gathering and processing services in western Canada are regulated on a complaints-basis by applicable provincial regulators.
GAS DISTRIBUTION
Economic Regulation
Our gas distribution utility operations are regulated by the OEB and the EUB among others. Regulators’ future actions may differ from current expectations, or future legislative changes may impact the regulatory environments in which we operate. To the extent that the regulators’ future actions are different from current expectations, the timing and amount of recovery or refund of amounts recorded on the Consolidated Statements of Financial Position, or that would have been recorded on the Consolidated Statements of Financial Position in absence of the effects of regulation, could be different from the amounts that are eventually recovered or refunded.
We seek to mitigate economic regulation risk. We retain dedicated professional staff and maintain strong relationships with customers, intervenors and regulators. The terms of rate negotiations are reviewed by our legal, regulatory and finance teams.
Enbridge Gas Distribution
Distribution rates are set under a five-year customized incentive rate plan (IR Plan) approved in 2014 and provide a level of stability by having a long-term agreement with the OEB which allows us to recover our expected capital investments under the agreement, as well as an opportunity to earn above the OEB allowed ROE. Under the customized IR Plan, we are permitted to recover, with OEB approval, certain costs that were beyond management control, but that were necessary for the maintenance of our services. The customized IR Plan also includes a mechanism to reassess the customized IR Plan and return to cost of service if there are significant and unanticipated developments that threaten the sustainability of the customized IR Plan.
Union Gas
Distribution rates, beginning in 2014, are set under a five-year incentive regulation framework using price cap methodology. The price cap framework establishes new rates at the beginning of each year through the use of a pricing formula rather than through the examination of revenue and cost forecasts. The framework allows for annual inflationary rate increases, offset by a productivity factor, as well as rate increases or decreases in the small volume customer classes where use declines or increases, and certain adjustments to base rates. Further, it allows for the continued pass-through of gas commodity, upstream transportation and demand side management costs, the additional pass-through of costs associated with major capital investments and certain fuel variances, an allowance for unexpected cost changes that are outside of management’s control, and equal sharing of tax changes between Union Gas and customers, and finally an opportunity to earn above the OEB allowed ROE.
Environmental Regulation
Our workers operations and facilities are subject to municipal, provincial and federal legislation which regulateregulates the protection of the environment and the health and safety of workers. For the environment,Environmental legislation primarily this includes the regulation of dischargesspills and emissions to air, land and water; the management and disposal of solid and hazardous waste management; the assessment and management of excess soil and contaminated soilsites; protection of environmentally sensitive areas, and groundwater;species at risk and their habitats; and the assessmentreporting and reduction of contaminated sites.GHG emissions.
The operation of our gasGas distribution system and gas facilities comesoperation, as with any industrial operation, has the potential risk of incidents, abnormal operatingor emergency conditions, or other unplanned events that could result in spillsreleases or emissions to the environment that could exceedexceeding permitted levels. These events could result in injuries to workers or the public, fines, penalties, adverse impacts to the environment, in which we operate within,property damage and/or property damage.regulatory infractions including orders and fines. We could also incur future liability for environmental (soilsoil and groundwater)groundwater contamination associated with past and present site activities.
In addition to the operation of the gas distribution, system, we also operate unregulated operations includinggas storage facilities and a small volume of oil and brine production and storage facilities in southwestern Ontario. Environmental risk associated with these facilities ishas the possibility of spills, releases or leaks.potential for unplanned releases. In the event of an incident (spill),a release, remediation of the affected area would be required. There would also be potential for fines and orders
or charges under environmental legislation, and potential third-party liability claims by any affected land owners.landowners.
The gas distribution system and our other operations must maintain a number of environmental approvals and permits from governmental authoritiesregulators to operate. As a result, these facilitiesassets and the distribution networkfacilities are subject to periodic inspection. An Annual Written Summary Report isinspections and/or audits. Reports are submitted to the Ontario Ministry of Environment and Climate Change (MOECC)our regulators as required to demonstrate we are in good standing in relation to its Environmental Compliance Approvals.with our environmental requirements. Failure to maintain regulatory compliance could result in operational interruptions, fines, penalties, and/or orders for additional pollution control technology or environmental remediation, etc. mitigation.
As environmental requirementsregulations continue to evolve and regulations become more stringent, the cost to maintain compliance and the time required to obtain approvals has consistently increased.
Ontario commenced a cap and trade system on January 1, 2017. Undercontinues to increase. A recent example includes the cap and trade regulation, EGD and Union Gas (together, the Utilities) are required to purchase emission allowances or credits for most of our customers’ use of natural gas as well as for emissions from our own operations. This process is complex and requires ongoing monitoringimplementation of the carbon market and related climate change and carbon policies not only in Ontario but also in other newly linked jurisdictions as at January 1, 2018 - namely California and Quebec. This linkagenew excess soil management requirements (Ontario Regulation 406/19) which has been enabledresulted in Ontario with various GHG reportingan increase in soil management costs and cap and trade regulation amendments over the course of 2017 will create a larger and more liquid market for carbon allowances and credits, which may help to keep compliance costs for our customers down. However, non-compliance or unexpected policy changes may cause significant changes to the cost of maintaining compliance and needs to be closely monitored to ensure impacts are understood.effort.
As required by the OEB Cap and Trade Framework, the Utilities each submitted 2017 Compliance Plans, which subsequently received supportive endorsement and approval of cost recovery in 2017 rates. The Utilities are in the process of defending their individually filed 2018 Compliance Plans. The OEB approved use of the 2017 final rate for recovery of 2018 cap and trade compliance costs until determined otherwise. Further, the OEB Cap and Trade Framework identifies that the Utilities are expected to file 2019/2020 Compliance Plans as well as an Annual Report summarizing 2017 results by August 1, 2018. The Compliance Plans detail how the Utilities will meet their respective carbon compliance obligations through carbon allowance and/or offset procurement as well as through customer and facility abatement projects that may be deemed cost effective. By creating prudent and thoughtful plans and executing with excellence, the Utilities can best mitigate the risk of cost disallowance.
As with previous years, in 2017 the Utilities each2023 we reported operational GHG emissions, including emissions from stationary combustion, flaring, venting and fugitive sources to the Ontario MOECC, Environment and Climate Change Canada, the Ontario Ministry of Environment, Conservation and Parks, and a number of voluntary reporting programs. Emissions from OntarioIn accordance with the provincial GHG regulations, stationary combustion sourcesand flaring emissions related to storage and transmission operations were verified in detail by a third partythird-party accredited verifier with no material discrepancies found. Additionally, operational emissions from venting, fugitive and natural gas distribution emissions were reported to the MOECC for the first time in 2017 in accordance with O. Reg. 143/16 - Quantification, Reporting, and Verification of Greenhouse
Enbridge Gas Emissions Regulation standard quantification methods ON. 350 and ON. 400, respectively. The Utilities continue to monitor developments and attend stakeholder consultations in Ontario.
The Utilities utilizeutilizes emissions data management processes and systems to help with the data capture and mandatory and voluntary reporting needs. Quantification methodologies and emission factors will continually beare updated in the systemour systems as required. Each Utility publicly reports its GHG emissions and has developed internal procedures for more frequent monthly Cap and Trade related GHG reporting. Collectively, the Utilities continueEnbridge Gas continues to work with industry associations to refine quantification methodologies and emissions factors, as well as best management practices to minimize emissions.
In October 2018, the federal government confirmed that Ontario is subject to the federal government’s carbon pricing program, otherwise known as the Federal Carbon Pricing Backstop Program. This program consists of two components: a carbon charge levied on fossil fuels, including natural gas, and an OBPS. This program applies in whole or in part to any province or territory that requested it or that did not have an equivalent carbon pricing system in place by January 1, 2019.
The Utilities plansfederal carbon charge took effect on April 1, 2019 at a rate of 3.91 cents/cubic meter (m3) of natural gas and is applicable to reducethe majority of customers. Enbridge Gas is registered as a natural gas distributor with the Canada Revenue Agency and remits the federal carbon charge on a monthly basis. The charge increases annually on April 1 of each year, rising to 12.39 cents/m3 in 2023. As confirmed by the federal government in July 2021, the federal carbon price will increase by $15 per tonne each year beginning in 2023, rising to $170 per tCO2e in 2030. This will equate to a federal carbon charge of 32.40 cents/m3 in 2030.
In September 2020, Ontario and the federal government announced that the federal government has accepted that Ontario’s Emission Performance Standards (EPS) will replace the federal OBPS for industrial facilities. In March 2021, the federal government announced that the federal OBPS would stand down in Ontario at the end of 2021 and Ontario would transition to the EPS effective January 1, 2022. In September 2021, the Greenhouse Gas Pollution Pricing Act was amended to remove Ontario as a covered province, enabling the EPS to take effect on January 1, 2022. Effective January 1, 2022, Enbridge Gas transitioned out of the federal OBPS to the provincial EPS. Enbridge Gas is registered with the Ontario Ministry of the Environment, Conservation and Parks as a covered facility under the EPS and has an annual compliance obligation for its facility-related stationary combustion and flaring emissions associated with its transmission and storage operations. Enbridge Gas must remit payment annually on the portion of emissions that exceed its total annual emissions limit. Payment is due the year following a compliance period and as such, Enbridge Gas remitted payment for its 2022 EPS compliance obligation in 2018November 2023. Enbridge Gas will remit payment for its 2023 EPS compliance obligation in 2024.
Enbridge Gas applies to the OEB annually through a Federal Carbon Pricing Program application for approval of just and reasonable rates effective April 1 each year for the Enbridge Gas Distribution Inc. and Union Gas Limited rate zones, to recover the costs associated with the Federal Carbon Charge and EPS Regulation as a pass-through to customers.
Renewable Power Generation
In summer 2023, the Federal Government of Canada introduced its draft CE Regulation that would cap emissions on electricity generation resources on Canada’s grid. The CE Regulation would cap emissions from electricity generation sources at, or near zero tCO2e per megawatt hour. Details of the CE Regulation and related compliance are outlinedunder negotiation with the provinces at this time, at least one of which has taken steps to formally resist the adoption of the CE Regulation. The Federal Government anticipates adopting the CE Regulation in 2024, which would begin to apply to projects in 2035, as drafted.
Similarly, the Facility Abatement Plan within their respective Compliance Plans.US EPA introduced emissions caps for utilities that would apply to certain coal and natural gas generation facilities by 2035. The caps would require applicable facilities to either capture a portion of carbon emissions and/or to co-fire using hydrogen.
Enbridge’s Renewable Power Generation resources are substantially non-emitting.
EMPLOYEES
We had approximately 12,700 employees as
HUMAN CAPITAL RESOURCES
WORKFORCE SIZE AND COMPOSITION
As at December 31, 2017,2023, we had approximately 11,500 regular employees, including approximately 8,5001,500 unionized employees in Canada. Approximately 1,800 ofacross our North American operations. This total rises to just over 13,400 if temporary employees and contractors are subject to collective bargaining agreements governing theirincluded. We have a strong preference for direct employment with us. Approximately 48% of thoserelationships but where we have collectively bargained-for employees, are covered under agreements that either have expired or will expire by December 31, 2018. We are currently going through the process of collective bargaining in respect to the expired or expiring contracts. Wewe have mature working relationships with our labor unions and the parties have traditionally committed themselves to the achievement of renewal agreements without a work stoppage.
EXECUTIVESWe believe all injuries, incidents and occupational illnesses are preventable. Our overall focus on employee and contractor safety, continues to result in strong performance compared against industry benchmarks and we are actively engaged in continuous improvement exercises as we pursue our goal of zero incidents.
DIVERSITY, EQUITY AND OTHERINCLUSION
In 2020, we announced Enbridge’s ESG goals – including goals to increase representation of women, underrepresented ethnic and racial groups (including Indigenous peoples), people with disabilities and veterans – to ensure our workforce is reflective of the communities where we operate. In executing on our ESG strategy, we continue to track progress towards these representation goals in 2023. Consistent with our culture, we remain committed to open, two-way dialogue related to our goals, enhancing transparency and accountability for all stakeholders.
Diversity Representation Goals
PRODUCTIVITY AND DEVELOPMENT
We continually invest in our people’s personal and professional development and productivity because we recognize their success is our success. Employees are provided access to leading productivity tools and technology, and can opt in to a range of development and growth opportunities through a variety of channels, which encourages employees to build new skills needed for our core and emerging lines of business and the broader energy transition.
EXECUTIVE OFFICERS
The following table sets forth information regarding our executive and other officers.officers as at February 9, 2024:
| | | | | | | | |
| Name | Age | Position |
| Gregory L. Ebel | 59 | |
Name | Age | Position |
Al Monaco | 58 | President & Chief Executive Officer |
John K. WhelenPatrick R. Murray | 5849 | Executive Vice President & Chief Financial Officer |
Cynthia L. HansenColin K. Gruending | 5354 | Executive Vice President, Utilities & Power Operations |
D. Guy Jarvis | 54 | Executive Vice President, Liquids Pipelines |
Byron C. Neiles | 52 | Executive Vice President, Corporate Services |
Robert R. Rooney | 61 | Executive Vice President & Chief Legal OfficerPresident, Liquids Pipelines |
William T. YardleyCynthia L. Hansen | 5359 | Executive Vice President & President, Gas Transmission &and Midstream |
Vern D. YuMichele E. Harradence | 5155 | Executive Vice President & Chief Development OfficerPresident, Gas Distribution & Storage |
Allen C. CappsMatthew A. Akman | 4756 | Executive Vice President, Corporate Strategy & President, Power |
| Reginald D. Hedgebeth | 56 | Executive Vice President, External Affairs and Chief Legal Officer |
| Maximilian G. Chan | 45 | Senior Vice President & Corporate Development Officer |
| Laura J. Sayavedra | 56 | Senior Vice President, Safety, Projects & Chief AccountingAdministrative Officer |
Al MonacoGregory L. Ebel was appointed President and Chief Executive Officer (CEO) on OctoberJanuary 1, 2012. He2023. Mr. Ebel is also a member of the Enbridge Board of Directors. Mr. Ebel served as Chair of the Enbridge Board of Directors following the merger of Enbridge and Spectra Energy Corp (Spectra Energy) in 2017 until January 1, 2023. Prior to being appointedthat time, he served as Chairman, President and CEO of Spectra Energy from 2009 until February 27, 2017. Previously, Mr. Ebel also served as Spectra Energy’s Group Executive and Chief Financial Officer beginning in 2007, President of Union Gas Limited from 2005 until 2007, and Vice President, Investor & Shareholder Relations of Duke Energy Corporation from 2002 until 2005.
Patrick R. Murray was appointed Executive Vice President & Chief Financial Officer (CFO) on July 1, 2023. Mr. Murray has oversight for all of Enbridge’s financial affairs including investor relations, financial reporting, financial planning, treasury, tax, insurance, risk and audit management functions. He also leads Enbridge’s technology and information services teams. Prior to assuming his current role, Mr. Murray was Senior Vice President & Chief Accounting Officer of Enbridge from June 2020 to June 2023, Vice President, Financial Planning & Analysis and Controller from June 2019 to May 2020,and Vice President, Financial Planning & Analysis from February 2017 to June 2019. Mr. Monaco served asMurray joined Enbridge over 25 years ago and has held a variety of roles within internal audit, corporate accounting, investor relations, treasury, and corporate development during that time.
Colin K. Gruending was appointed Executive Vice President Gasand President, Liquids Pipelines Green Energy & International with responsibilityon October 1, 2021. Mr. Gruending is responsible for the growthoverall leadership and operations of our gas pipelines, including the gas gathering and processing operations in the United States, our gulf coast offshore assets and our investments in Alliance, Vector and Aux Sable,Enbridge’s Liquids Pipelines business. Previously, he served as well as our International business development and investment activities and Green Energy.
John K. Whelen was appointed Executive Vice President and Chief Financial Officer of Enbridge onfrom June 2019 to October 15, 2014. Previously our2021; Senior Vice President, Corporate Development and Controller, Mr. Whelen retained executive leadership for our financial reporting function, while assuming responsibility for our taxInvestment Review from May 2018 to June 2019; and treasury functions. Mr. Whelen has been part of the Enbridge team since 1992, when he assumed the Manager of Treasury role at Consumers Gas (now EGD).Vice President, Corporate Development and Investment Review from February 2017 to May 2018.
Cynthia L. Hansen was appointed Executive Vice President Utilities and Power Operations,President, Gas Transmission and Midstream on February 27, 2017.March 1, 2022. Ms. Hansen is responsible for the overall leadership and operations of EGDEnbridge’s natural gas pipeline and Unionmidstream business across North America. Previously, she served as our Executive Vice President, Gas Distribution and Storage from June 2019 to March 2022 and as well asExecutive Vice President, Utilities and Power Operations from February 2017 to June 2019. Ms. Hansen is also the Executive Sponsor for Asset and Work Management Transformation across Enbridge, Gas New Brunswick Inc. and Gazifère. She also holds responsibility for the operations of our power generating assets, which currently include renewable energy investments in wind, solar, geothermal and hydroelectric, as well as waste heat recovery facilities and power transmission lines owned in whole or in part by us.working with other business unit leaders.
Michele E. Harradence was appointed Executive Vice President Liquids Pipelines and Major Projects on May 2, 2016. Mr. Jarvis has been President of our Liquids Pipelines group since March 1, 2014, with responsibility for all of our crude oil and liquids pipeline businesses across North America. Mr. Jarvis previously held the title of Chief Commercial Officer for Liquids Pipelines, with responsibility for strategic
and integrated services, customer service, finance, and business and market development. Prior to Mr. Jarvis' work in Liquids Pipelines, he served as& President, Gas Distribution providing& Storage on March 5, 2023. She is responsible for the overall leadership to EGD,and operations of Ontario-based Enbridge Gas, as well as EnbridgeGazifère, which serves the Gatineau region of Québec. Prior to assuming her current role, Ms. Harradence was Senior Vice President & President, Gas New Brunswick Inc.Distribution and Gazifère.Storage from March 2022 to March 2023. Prior thereto, she was Senior Vice President and Chief Operations Officer of Enbridge’s Gas Transmission and Midstream business unit from June 2019 to March 2022 and Senior Vice President Operations, Gas Transmission and Midstream from February 2017 to June 2019.
Byron C. NeilesMatthew A. Akman was appointed Executive Vice President, Corporate ServicesStrategy & President, Power on May 2, 2016.March 5, 2023. Mr. Neiles has oversight of our Information Technology, Human Resources, Real Estate & Workplace Services, Supply Chain Management, Enterprise Safety and Operational Reliability, and aviation groups. Mr. Neiles had previously held the role of Senior Vice President, Major Projects, Enterprise Safety and Operational Reliability, and had been Senior Vice President of Major Projects since November 2011, after joining our Major Projects group in April 2008.
Robert R. Rooney was appointed Executive Vice President and Chief Legal Officer on February 1, 2017. Mr. Rooney leads our legal team across the organization, as well as Public Affairs and Communications (including Corporate Social Responsibility).
William T. Yardley was named Executive Vice President and President of Gas Transmission and Midstream on February 27, 2017. Mr. Yardley is also the President and Chairman of the Board of SEP. Mr. Yardley, based in Houston, was previously President of Spectra Energy’s United States Transmission and Storage business, leading the business development, project execution, operations and environment, health and safety efforts associated with Spectra Energy’s United States portfolio of assets.
Vern D. Yu was appointed Executive Vice President and Chief Development Officer on May 2, 2016. Mr. Yu leads our Corporate Development team in driving growth opportunities, while also establishing capital allocation parameters and portfolio mix. Mr. Yu also provides executive oversight to our Energy Services group, Tidal Energy. Previously, Mr. Yu served as Senior Vice President, Corporate Planning and Chief Development Officer. He has been the lead of our Corporate Development team since July 1, 2014.
Allen C. Capps is the Vice President and Chief Accounting Officer of Enbridge. Mr. CappsAkman is responsible for the overall leadership and operations of Enbridge’s power business and also leads our accounting operationsnew energy technologies and financial reporting functions, including internal and external financial reports.corporate strategy efforts. Prior to assuming his current role, Mr. Akman was Senior Vice President, Corporate Strategy & President, Power from January 2023 to March 2023. Prior thereto, he was Senior Vice President, Strategy, Power & New Energy Technologies from October 2021 to December 2022, and Senior Vice President, Strategy & Power from June 2019 to October 2021. Mr. Akman joined Enbridge in early 2016 as our head of Corporate Strategy and also previously held responsibilities for Corporate Development and Investor Relations.
Reginald D. Hedgebeth was appointed Executive Vice President, External Affairs and Chief Legal Officer on January 1, 2024. Mr. Hedgebeth leads our legal, public affairs, communications & sustainability, corporate security and aviation teams across the organization. Prior to joining Enbridge, Mr. Hedgebeth served as Chief Legal Officer of Capital Group from January 2021 to June 2023, Executive Vice President, General Counsel and Chief Administrative Officer of Marathon Oil Corporation from April 2017 to December 2020 and, prior to its merger with Enbridge in 2017, Mr. Capps served asGeneral Counsel, Corporate Secretary and Chief Ethics and Compliance Officer for Spectra Energy.
Maximilian G. Chan was appointed Senior Vice President & Corporate Development Officer on March 1, 2022. He was later appointed to the Executive Leadership team on May 8, 2023. Mr. Chan is responsible for the oversight of mergers and Controlleracquisitions, capital allocation, investment review, integration and corporate growth objectives. Prior to assuming his current role, Mr. Chan was Vice President, Treasury and Head of Enterprise Risk for Enbridge from February 2020 to March 2022,and Vice President, Treasury from July 2018 to February 2020.
Laura J. Sayavedra was appointed Senior Vice President, Safety, Projects & Chief Administrative Officer on January 1, 2024. Ms. Sayavedra is responsible for the oversight of our safety, capital project execution, human resources, real estate and supply chain management functions. Prior to assuming her current role, Ms. Sayavedra was Senior Vice President, Safety & Reliability, Projects and Unify from March 2022 to December 2023. Prior to that, she led Finance Transformation at Enbridge, and prior to its merger with Enbridge in 2017, was also Vice President & Treasurer for Spectra Energy, and CFO of Spectra Energy responsible for the financial accountingPartners LP. She has held various finance, strategy, and reporting functions.business development executive leadership roles.
ADDITIONAL INFORMATION
Additional information about us is available on our website at www.enbridge.com, on SEDARSEDAR+ at www.sedar.comwww.sedarplus.ca and on EDGAR at www.sec.gov. The aforementioned information is made available in accordance with legal requirements and is not, unless otherwise specifically stated, incorporated by reference into this Annual Report on Form 10-K. We make available free of charge, through our website, annual reports on Form 10-K, quarterly reports on Form 10-Q and current reports on Form 8-K and amendments to those reports filed or furnished pursuant to Section 13(a) or 15(d) of the Securities Exchange Act, of 1934, as well as proxy statements, as soon as reasonably practicable after we electronically file such material with, or furnish it to, the SEC. Reports, proxy statements and other information filed with the SEC may also be obtained through the SEC’s website (www.sec.gov) or by visiting the Public Reference Room of the SEC at 100 F Street, N.E., Washington D.C. 20549 or calling the SEC at 1-800-SEC-0330..
ENBRIDGE ENERGY PARTNERS, L.P. AND ENBRIDGE ENERGY MANAGEMENT, L.L.C.
Additional information about EEP and Enbridge Energy Management, L.L.C. can be found in their Annual Reports on Form 10-Ks that have been filed with the SEC. These documents contain detailed disclosure with respect to EEP and Enbridge Energy Management, L.L.C., respectively, and are publicly available on EDGAR at www.sec.gov. No part of the Form10-Ks filed by EEP and Enbridge Energy Management, L.L.C. are, unless otherwise specifically stated, incorporated by reference into this Annual Report on Form 10-K.
ENBRIDGE GAS DISTRIBUTION INC.
Additional information about EGDEnbridge Gas can be found in its annual information form, financial statements and management's discussion and analysis (MD&A)MD&A for the year ended December 31, 20172023, which have been filed with the securities commissions or similar authorities in each of the provinces of Canada. These documents contain detailed disclosure with respect to EGDEnbridge Gas and are publicly available on SEDARSEDAR+ at www.sedar.com.www.sedarplus.ca. These documents are not, unless otherwise specifically stated, incorporated by reference into this Annual Report on Form 10-K.
ENBRIDGE INCOME FUND
Additional information about the Fund can be found in its annual information form, financial statements and MD&A as well as the financial statements and MD&A of EIPLP for the year ended December 31, 2017 which have been filed with the securities commissions or similar authorities in each of the provinces of Canada. These documents contain detailed disclosure with respect to the Fund and are publicly available on SEDAR at www.sedar.com under the Fund's profile. These documents are not, unless otherwise specifically stated, incorporated by reference into this Annual Report on Form 10-K.
ENBRIDGE INCOME FUND HOLDINGSPIPELINES INC.
Additional information about ENFEnbridge Pipelines Inc. (EPI) can be found in its annual information form, financial statements and MD&A for the year ended December 31, 2017 which have been filed with the securities commissions or similar authorities in each of the provinces of Canada. These documents contain detailed disclosure with respect to ENF and are publicly available on SEDAR at www.sedar.com. These documents are not, unless otherwise specifically stated, incorporated by reference into this Annual Report on Form 10-K.
ENBRIDGE PIPELINES INC.
Additional information about EPI can be found in its annual information form, financial statements and MD&A for the year ended December 31, 20172023, which have been filed with the securities commissions or similar authorities in each of the provinces of Canada. These documents contain detailed disclosure with respect to EPI and are publicly available on SEDARSEDAR+ at www.sedar.com.www.sedarplus.ca. These documents are not, unless otherwise specifically stated, incorporated by reference into this Annual Report on Form 10-K.
SPECTRAWESTCOAST ENERGY PARTNERS, L.P.INC.
Additional information about SEPWestcoast can be found in its Annual Report on Form10-K that has been filed with the SEC. This document contains detailed disclosure with respect to SEP, and is publicly available on EDGAR at www.sec.gov. No part of the Form 10-K filed by SEP is, unless otherwise specifically stated, incorporated by reference into this Annual Report on Form 10-K.
UNION GAS LIMITED
Additional information about Union Gas can be found in its annual information form, financial statements and MD&A for the year ended December 31, 2017 which have been filed with the securities commissions or similar authorities in each of the provinces of Canada. These documents contain detailed disclosure with respect to Union Gas and are publicly available on SEDAR at www.sedar.com. These documents are not, unless otherwise specifically stated, incorporated by reference into this Annual Report on Form 10-K.
WESTCOAST ENERGY INC.
Additional information about Westcoast Energy Inc. can be found in its annual information form, financial statements and MD&A for the year ended December 31, 20172023, which have been filed with the securities commissions or similar authorities in each of the provinces of Canada. These documents contain detailed disclosure with respect to Westcoast Energy Inc. and are publicly available on SEDARSEDAR+ at www.sedar.com.www.sedarplus.com. These documents are not, unless otherwise specifically stated, incorporated by reference into this Annual Report on Form 10-K.
ITEM 1A. RISK FACTORS
Execution of our capital projects subjects us to various regulatory, development, operationalThe following risk factors could materially and market risks that may affect our financial results.
Our ability to successfully execute the development of our organic growth projects is subject to various regulatory, development, operational and market risks, including:
the ability to obtain necessary approvals and permits from governments and regulatory agencies on a timely basis and on acceptable terms and to maintain those issued approvals and permits and satisfy the terms and conditions imposed therein;
potential changes in federal, state, provincial and local statutes and regulations, including environmental requirements, that may prevent a project from proceeding or increase the anticipated cost of the project;
impediments on our ability to acquire or renew rights-of-way or land rights on a timely basis and on acceptable terms;
opposition to our projects by third parties, including special interest groups;
the availability of skilled labor, equipment and materials to complete projects;
the ability to construct projects within anticipated costs, including the risk of cost overruns resulting from inflation or increased costs of equipment, materials or labor, contractor or supplier non-performance, weather, geologic conditions or other factors beyond our control, that may be material;
general economic factors that affect the demand for our projects; and
the ability to raise financing for these capital projects.
Any of these risks could prevent a project from proceeding, delay its completion or increase its anticipated cost. Recent projects that have experienced delays include the United States portion of the L3R Program (U.S. L3R Program) and NEXUS. In the fourth quarter of 2016, we determined Northern Gateway could not proceed as envisioned. New projects may not achieve their expected investment return, which could affect our financial results, and hinder our ability to secure future projects.
Cyber-attacks or security breaches could adversely affect our business, operations, financial results, market price or value of our securities. This list is not exhaustive, and we place no priority or likelihood based on order of presentation or grouping under sub-captions.
RISKS RELATED TO CLIMATE CHANGE
Climate change risks could adversely affect our reputation, strategic plan, business, operations and financial results.results, and these effects could be material.
Climate change is a systemic risk that presents both physical and transition risks to our organization. A summary of these risks is outlined below. Given the interconnected nature of climate change-related impacts, we also discuss these risks within the context of other risks impacting Enbridge throughout Item 1A. Risk Factors. Climate change and its associated impacts may also increase our exposure to, and magnitude of, other risks identified in Item 1A. Risk Factors. Our business, financial condition, results of operations, cash flows, reputation, access to and cost of capital or insurance, business plans or strategy may all be materially adversely impacted as a result of climate change and its associated impacts.
PHYSICAL RISKS
Climate-related physical risks, resulting from changing and more extreme weather, can damage our assets and affect the safety and reliability of our operations. Climate-related physical risks may be acute or chronic. Acute physical risks are those that are event-driven, including increased frequency and severity of extreme weather events, such as heavy snowfall, heavy rainfall, floods, landslides, fires, hurricanes, cyclones, tornados, tropical storms, ice storms, and extreme temperatures. Chronic physical risks are longer-term shifts in climate patterns, such as long-term changes in precipitation patterns, or sustained higher temperatures, which may cause sea level rises or chronic heat waves.
Our business is dependent upon information systems andassets are exposed to potential damage or other digital technologies for controlling our plants and pipelines, processing transactions and summarizing and reporting resultsnegative impacts from these kinds of operations. The secure processing, maintenance and transmission of information is critical to our operations. A security breach of our network or systemsevents, which could result in improper operationreduced revenue from business disruption or reduced capacity and may also lead to increased costs due to repairs and required adaptation measures. Such events may also result in personal injury, loss of life or damage to property and the environment. We have experienced operational interruptions and damage to our assets potentially including delaysfrom such weather events in the delivery or availability of our customers’ products, contamination or degradation of the productspast, and we transport, store or distribute, or releases of hydrocarbon products for which we could be held liable. Furthermore, we collect and store sensitive dataexpect to continue to experience climate-related physical risks in the ordinary coursefuture, potentially with increasing frequency or severity.
TRANSITION RISKS
Transition risks relate to the transition to a lower-emissions economy, which may increase our cost of operations, impact our business including personal identification informationplans, and influence stakeholder decisions about our company, each of which could adversely impact our employeesreputation, strategic plan, business, operations or financial results. These transition risks include the following categories:
•Policy and legal risks
Policy and legal risks may result from evolving government policy, legislation, regulations and regulatory decisions focused on climate change, as well as changing political and public opinion, stakeholder opposition, legal challenges, litigation and regulatory proceedings. Foreign and domestic governments continue to evaluate and implement policy, legislation, and regulations regarding reduction of GHG emissions, adaptation to climate change, and transition to a lower-carbon economy. Such policies, laws and regulations vary at the federal, state, provincial and municipal levels in which Enbridge operates and are continually evolving. The implementation of these measures may be accelerated by international multilateral agreements, increasing physical impacts of climate change, and changing political and public opinion. Enbridge is currently required to adhere to a number of carbon-pricing mechanisms, including explicit carbon prices (i.e., in BC) and implicit carbon prices (i.e., Canadian federal OBPS). In Canada, the federal government has proposed new clean electricity regulations and is considering options to cap and cut oil and gas sector GHG emissions, which may impact our proprietarybusiness. Such evolving policy, legislation and regulation could impact commodity demand and the overall energy mix we deliver and may result in significant expenditures and resources, as well as increased costs for our customers. In recent years, there has been an increase in climate-related regulatory action and litigation which has the potential to adversely impact our reputation, business, informationoperations and thatfinancial results.
•Technology risks
Our success in executing our strategic plan, including adapting to the energy transition over time and attaining our GHG emissions reduction goals and targets, depends, in part, on technology (including technology still under development), innovation and continued diversification with renewable power and other lower-carbon energy infrastructure as well as modernization of our customers, suppliers, investors and other stakeholders. We have a cyber-security controls framework in place which has been derived from the National Institute of Standards and Technology Cyber-security Framework and International Organization for Standardization 27001 standards. We monitor our control effectiveness in an increasing threat landscape and continuously take action to improve our security posture. We have implemented a 7X24 security operations center to monitor, detect and investigate any anomalous activity in our network together with an incident response process that we test on a monthly basis. We conduct independent cyber-security audits and penetration tests on a regular basis to test that our preventative and detective controls are working as designed. Despite our security measures, our information systems may become the target of cyber-attacks or security breaches (including employee error, malfeasance or other breaches), which could compromise our network or systems and result in the release or loss of the information stored therein, misappropriation of assets, disruption to our operations or damage to our facilities. Our current insurance coverage programs do not
contain specific coverage for cyber-attacks or security breaches. As a result of a cyber-attack or security breach, we could also be liable under laws that protect the privacy of personal information, subject to regulatory penalties, experience damage to our reputation or a loss of consumer confidence in our products and services, or incur additional costs for remediation and modification or enhancement of our information systems to prevent future occurrences,infrastructure, all of which could adversely affectrequire significant capital expenditures and resources, that could materially differ from our original estimates and expectations. There is also a risk that GHG emissions reduction technology does not materialize as expected, making it more difficult to reduce emissions, or that political or public opinion regarding such technologies continues to evolve.
•Market risks
Climate change concerns, increased demand for lower-carbon and zero-emissions energy, alternative and new energy sources and technologies, changing customer behavior and reduced energy consumption could impact the demand for our services or securities. In recent years, there has been a push toward certain investors decreasing the carbon intensity of their portfolios and pressure for banks and insurance providers to reduce or cease support for oil and natural gas and related infrastructure businesses and projects. Potential impacts include increased costs to manage these risks, adverse impacts to our access to and cost of capital, and reduced demand for, or value of, our securities. The pace and scale of the transition to a lower-carbon economy may pose a risk if Enbridge diversifies either too quickly or too slowly. Similarly, uncertainty in market signals, such as abrupt and unexpected shifts in energy costs and demands, including due to climate change concerns, can impact revenue through reduced throughput volumes on our pipeline transportation systems.
•Reputational risks
Companies across all sectors and industries are facing changing expectations or increasing scrutiny from stakeholders related to their approach to climate change and GHG emissions. Companies in the energy industry are experiencing stakeholder opposition to both existing and new infrastructure, as well as organized opposition to oil and natural gas extraction and shipment of oil and natural gas products. If we are not able to achieve our GHG emissions reduction goals and targets, are not able to meet future climate, emissions or other regulatory or reporting requirements, or are not able to meet or manage current and future expectations and issues regarding climate change that are important to our stakeholders, it could negatively impact our reputation and, in turn, our business, operations or financial results.
Changes•Disclosure risks
Enbridge currently provides certain climate-related disclosures, and from time to time, establishes and publicly announces goals and commitments related to climate change, including reduction of GHG emissions. Standards and processes for climate-related disclosure, setting goals and targets, and measuring and reporting on progress are still developing for our sector and continue to evolve. Our internal controls and processes also continue to evolve, and our climate-related disclosures, goals and targets are based on assumptions that are subject to change. Aligning with evolving requirements has required and may continue to require us to incur significant costs. There can be no assurance that our current or future disclosures and goals, the pathways by which we plan to reach our goals, or the methodologies that we currently use to measure and report on progress, will align with new and evolving standards and processes, legal requirements or expectations of stakeholders. Such misalignment may result in our reputation with stakeholders, special interest groups, political leadership, the mediareputational harm, regulatory action or other entities could have negative impacts on our business, operations or financial results.legal action.
There could be negative impacts on our business, operations or financial results due to changes in our reputation with stakeholders, special interest groups (including non-governmental organizations), political leadership, the media or other entities. Public opinion may be influenced by certain media
RISKS RELATED TO OPERATIONAL DISRUPTION OR CATASTROPHIC EVENTS
Operation of complex energy infrastructure involves many hazards and special interest groups’ negative portrayal of the industry in which we operate as well as their opposition to development projects, such as the Bakken Pipeline System. Potential impacts of a negative public opinion may include:
loss of ability to secure growth opportunities;
delays in project execution;
increased regulatory oversight or delays in regulatory approval; and
loss of ability to hire and retain top talent.
We are also exposed to the risk of higher costs, delays or even project cancellations due to increasing pressure on governments and regulators by special interest groups. Recent judicial decisions have increased the ability of special interest groups to make claims and oppose projects in regulatory and legal forums. In addition to issues raised by groups focused on particular project impacts, we and others in the energy and pipeline businesses are facing opposition from organizations opposed to oil sands development and shipment of production from oil sands regions.
Pipeline operations involve numerous risks that may adversely affect our business, financial results and financial results.the environment.
Operation of complex pipeline systems, gathering, treating, storing and processing operations involves manyThese operational risks hazards and uncertainties. These events include adverse weather conditions, natural disasters, accidents, the breakdown or failure of equipment or processes, the performance of the facilities belowand lower than expected levels of operating capacity and efficiencyefficiency. These operational risks could be catastrophic in nature.
Operational risk is also intensified by climate change. Climate change presents physical risks that may affect the safety and catastrophic eventsreliability of our operations. These include acute physical risks, such as explosions, fires, earthquakes, hurricanes,heavy snowfall, heavy rainfall, floods, landslides, fires, hurricanes, cyclones, tornados, tropical storms, ice storms, and extreme temperatures, and chronic physical risks, such as long-term changes in precipitation patterns, or sustained higher temperatures.
Our assets and operations are exposed to potential damage or other similar events beyond our control. These types of catastrophic eventsnegative impacts from these operational risks, which could result in lossreduced revenue from business disruption or reduced capacity and may also lead to increased costs due to repairs and required adaptation measures. Such events have led to, and could in the future lead to, rupture or release of human life, significantproduct from our pipeline systems and facilities, resulting in damage to property environmental pollution and impairmentthe environment, personal injury or loss of our operations, any oflife, which could also result in substantial losses for which insurance may not be sufficient or available and for which we may bear a part or all of the cost. We have experienced such events in the past, including in 2010 on Lines 6A
An environmental incident is an event that may cause environmental harm and 6B Lakehead System. which is discussed in Part II. Item 7. Management's Discussion and Analysis of Financial Condition and Results of Operations - Legal and Other Updates. In addition, we could be subject to significant fines and penalties from regulators in connection with such events. Environmental incidents could also lead to an increased cost of operating and insuring our assets,insurance costs, thereby negatively impacting earnings. An environmental incident could have lasting reputational impacts to us and could impact our ability to work with various stakeholders. For pipeline and storage assets located near populated areas, including residential communities, commercial business centers, industrial sites and other public gathering locations, the level of damage resulting from these catastrophic events could be greater.
Our assets vary in age and were constructed over many decades which may cause our inspection, maintenance or repair costs to increaseWe have experienced such events in the future.
Our pipelines varypast, and expect to continue to incur significant costs in agepreparing for or responding to operational risks and were constructed over many decades. Pipelines are generally long-lived assets,events. We expect to continue to experience climate-related physical risks, potentially with increasing frequency and pipeline constructionseverity, and coating techniques have changed over time. Depending on the era of construction, some assets require more frequent inspections, which could result in increased maintenancewe cannot guarantee that we will not experience catastrophic or repair expendituresother events in the future. AnyIn addition, we could be subject to litigation and significant increasefines and penalties from regulators in these expenditures could adversely affect our business, operations or financial results.connection with any such events.
A service interruption could have a significant impact on our operations, and negatively impact financial results, relationships with stakeholders and our reputation.
A service interruption due to a major power disruption, or curtailment of commodity supply, operational incident, security incident (cyber or physical), availability of gas supply or distribution or other reasons could have a significant impact on our operations and negatively impact financial results, relationships with stakeholders, and our reputation. Specifically, for Gas Distribution, any prolonged interruptions would ultimately impact gas distributionreputation or the safety of our end-use customers. Service interruptions that impact our crude oil and natural gas transportation services can negatively impact shippers’ operations and earnings as they are dependent on our services to move their product to market or fulfill their own contractual arrangements.arrangements, and this has in the past and may again lead to claims against us. We have experienced, and may again experience, service interruptions, restrictions or other operational constraints, including in connection with the kinds of operational incidents referred to in the previous risk factor.
Our operations involve safety risks to the public and to our workers and contractors.
Several of our pipelines and distribution systems and related assets are operated in close proximity to populated areas and a major incident could result in injury or loss of life to members of the public. In addition, given the natural hazards inherent in our operations, our workers and contractors are subject to personal safety risks. A public safety incident or an injury or loss of life to our workers or contractors, which we have experienced in the past and, despite the precautions we take, may experience in the future, could result in reputational damage to us, material repair costs or increased costs of operating and insuringinsurance costs.
Cyber attacks and other cybersecurity incidents pose threats to our assets.technology systems and could materially adversely affect our business, operations, reputation or financial results.
Our business is dependent upon information systems and other digital technologies for controlling our plants, pipelines and other assets, processing transactions and summarizing and reporting results of operations. The secure processing, maintenance and transmission of information is critical to our operations.
Our transformation projects
Cybersecurity risks have increased in recent years as a result of the proliferation of new technologies and the increased sophistication of cyber attacks and financially motivated cybercrime, as well as due to international and domestic political factors including geopolitical tensions, armed hostilities, war, civil unrest, sabotage, terrorism and state-sponsored or other cyber espionage. Human error or malfeasance can also contribute to a cyber incident, and cyber attacks can be internal as well as external and occur at any point in our supply chain. Because of the critical nature of our infrastructure and our use of information systems and other digital technologies to control our assets, we face a heightened risk of cyber attacks, such as ransomware, theft, misplaced or lost data, programming errors, phishing attacks, denial of service attacks, acts of vandalism, computer viruses, malware, hacking, malicious attacks, software vulnerabilities, employee errors and/or malfeasance, or other attacks, security or data breaches or other cybersecurity incidents. Cyber threat actors have attacked and threatened to attack energy infrastructure, and various government agencies have increasingly stressed that these attacks are targeting critical infrastructure, including pipelines, public utilities, and power generation, and are increasing in sophistication, magnitude, and frequency. Additionally, these risks may failescalate during periods of heightened geopolitical tensions. New cybersecurity legislation, regulations and orders have been recently implemented or proposed, resulting in additional actual and anticipated regulatory oversight and compliance requirements, which will require significant internal and external resources. We cannot predict the potential impact to fully deliver anticipated results.our business of potential future legislation, regulations or orders relating to cybersecurity.
We launched projectshave experienced an increase in 2016the number of attempts by external parties to transform various processes, capabilitiesaccess our systems or our company data without authorization, and reportingwe expect this trend to continue. Although we devote significant resources and security measures to prevent unwanted intrusions and to protect our systems infrastructureand data, whether such data is housed internally or by external third parties, we and our third party vendors have experienced and expect to continuously improve effectiveness and efficiency acrosscontinue to experience cyber attacks of varying degrees in the organization. Transformation project riskconduct of our business. To-date, these prior cyber attacks have not, to our knowledge, had a material adverse effect on our business, operations or financial results. However, there is thea risk that modernization projects carried outany such incidents could have a material adverse effect on us in the future.
Our technology systems or those of our vendors or other service providers are expected to become the target of further cyber attacks or security breaches which could compromise our data and systems or our access thereto by us, our customers or others, affect our ability to correctly record, process and report transactions, result in the loss of information, or cause operational disruption or incidents. There can be no assurance that our business continuity plans will be completely effective in avoiding disruption and business impacts.Furthermore, we and some of our third-party service providers (who may in turn also use third-party service providers) collect, process or store sensitive data in the ordinary course of our business, including personal information of our employees, residential gas distribution customers, land owners and investors, as well as intellectual property or other proprietary business information of ours or our customers or suppliers.We and some of our third-party services providers will process increasing amounts of personal information upon the closing of the previously announced acquisitions of gas utilities in the US, due to their large residential customer bases.
As a result of the foregoing, we could experience loss of revenues, repair, remediation or restoration costs, regulatory action, fines and penalties, litigation, breach of contract or indemnity claims, cyber extortion, ransomware, implementation costs for additional security measures, loss of customers, customer dissatisfaction, reputational harm, be liable under laws that protect the privacy of personal information, other negative consequences, or other costs or financial loss.These risks may be heightened, and the consequences magnified, upon closing of the Acquisitions. Regardless of the method or form of cyber attack or incident, any or all of the above could materially adversely affect our reputation, business, operations or financial results.
In addition, a cyber attack could occur and persist for an extended period without detection. Any investigation of a cyber attack or other security incident may be inherently unpredictable, and it would take time before the completion of any investigation and availability of full and reliable information. During such time, we may not know the extent of the harm or how best to remediate it, and certain errors or actions could be repeated or compounded before they are discovered and remediated, all or any of which could further increase the costs and consequences of a cyber attack or other security incident, and our subsidiaries doremediation efforts may not fully deliver anticipatedbe successful. The inability to implement, maintain and upgrade adequate safeguards could materially and adversely affect our results due to insufficiently addressing the risks associated with project executionof operations, cash flows, and change management. This could result in negative financial operational and reputational impacts.
An impairment of our assets, including goodwill, property, plant, and equipment, intangible assets, and/or equity method investments, could reduce our earnings.
GAAP requirescondition. Moreover, recent rulemakings may require us to test certain assets for impairment on either an annual basisdisclose information about a cybersecurity incident before it has been completely investigated or when eventsremediated in full or circumstances occur which indicate that the carrying value of such assets might be impaired. The outcome of such testing could resulteven in impairments of our assets including our goodwill, property, plant and equipment, intangible assets, and/or equity method investments. Additionally, any asset monetizations could result in impairments if such assets are sold or otherwise exchanged for amounts less than their carrying value. Ifpart. As cyber attacks continue to evolve, we determine that an impairment has occurred, we wouldmay be required to expend significant additional resources to continue to modify or enhance our protective measures or to investigate and remediate any information security vulnerabilities.
Furthermore, media reports about a cyber attack or other significant security incident affecting Enbridge, whether accurate or not, or, under certain circumstances, our failure to make adequate or timely disclosures to the public, law enforcement, other regulatory agencies or affected individuals following any such event, whether due to delayed discovery or otherwise, could negatively impact our operating results and result in other negative consequences, including damage to our reputation or competitiveness, harm to our relationships with customers, partners, suppliers, investors, and other third parties, interruption to our management, remediation or increased protection costs, significant litigation or regulatory action, fines or penalties, all of which could materially adversely affect our business, operations, reputation or financial results.
Terrorist attacks and threats, escalation of military activity in response to these attacks or acts of war, and other civil unrest or activism could adversely affect our business, operations or financial results.
Terrorist attacks and threats (which may take an immediate noncash chargethe form of cyber attacks), escalation of military activity, armed hostilities, war, sabotage, or civil unrest or activism may have significant effects on general economic conditions and may cause fluctuations in consumer confidence and spending and market liquidity, each of which could adversely affect our business. Future terrorist attacks, rumors or threats of war, actual conflicts involving the US or Canada, or military or trade disruptions may significantly affect our operations and those of our customers. Strategic critical infrastructure targets, such as energy-related assets, are at greater risk of cyber attack and may be at greater risk of other future attacks than other targets in the US and Canada. Enbridge’s infrastructure and projects under construction could be direct targets or indirect casualties of a cyber or physical attack. In addition, increased environmental activism against pipeline construction and operation could potentially result in work delays, reduced demand for our products and services, new legislation or public policy or increased stringency thereof, or denial or delay of permits and rights-of-way.
Pandemics, epidemics or infectious disease outbreaks, such as the COVID-19 pandemic, may adversely affect local and global economies and our business, operations or financial results.
Disruptions caused by pandemics, epidemics or infectious disease outbreaks could materially adversely affect our business, operations, financial results and forward-looking expectations. Governments' emergency measures to earnings.combat the spread could include restrictions on business activity and travel, as well as requirements to isolate or quarantine. The duration and magnitude of such impacts will depend on many factors that we may not be able to accurately predict. COVID-19 and government responses interrupted business activities and supply chains, disrupted travel, and contributed to significant volatility in the financial and commodity markets.
Disruptions related to pandemics, epidemics or infectious disease outbreaks could have the effect of heightening many of the other risks described in this Item 1A. Risk Factors.
RISKS RELATED TO OUR BUSINESS AND INDUSTRY
There are utilization risks inwith respect to our assets.
InWith respect to our Liquids PipelinePipelines assets, we are exposed to throughput risk under the CTS on the Canadian Mainline, and we are exposed to throughput risk under certain tolling agreements applicable to other Liquids Pipelines assets, such as the Lakehead System. A decrease in volumes transported can directly and adversely affect our revenues and earnings. Factors such as changing market fundamentals, capacity bottlenecks, regulatory restrictions, maintenance and operational incidents regulatory restrictions,on our system maintenanceand upstream or downstream facilities, and increased competition can all
impact the utilization of our assets. Market fundamentals, such as commodity prices and price differentials, weather, gasoline price and consumption, alternative and new energy sources and technologies, and global supply disruptions outside of our control can impact both the supply of and demand for crude oil and other liquid hydrocarbons transported on our pipelines.
InWith respect to our Gas Transmission and Midstream assets, gas supply and demand dynamics continue to change as adue to shifts in regional and global production and consumption. These shifts can lead to fluctuations in commodity prices and price differentials, which could result of the development of non-conventional shale gas supplies. The increase in natural gas supply has resulted in declines in the price of natural gas in North America. As a result, a shift occurred to extraction of gas in richer, wet gas areas with higher NGL content which depressed activity in dry fields. This, in turn, has contributed to a resulting oversupply of pipeline takeaway capacityour system not being fully utilized in some areas, which can adversely affect our revenuesareas. Other factors affecting system utilization include operational incidents, regulatory restrictions, system maintenance, and earnings.increased competition.
InWith respect to our Gas Distribution and Storage assets, customers are billed on both a combination of both fixed charge and volumetric basis and EGD and Union Gas'our ability to collect their respectivethe total revenue requirement (the cost of providing service, including a reasonable return to the utility) depends on achieving the forecast distribution volume established in the rate-making process. The probability of realizing such volume is contingent upon four key forecast variables: weather, economic conditions, pricing of competitive energy sources and growth in the number of customers. Weather is a significant driver of delivery volumes, given that a significant portion of EGD and Union Gas' respectiveour Gas Distribution customer base uses natural gas for space heating. Distribution volume may also be impacted by the increased adoption of energy efficient technologies, along with more efficient building construction, that continue to place downward pressure on consumption. In addition, conservation efforts by customers may further contribute to a decline in annual average consumption. EGD and Union Gas have deferral accounts approved by the OEB that provide regulatory protection against the margin impacts associated with declining annual average consumption due to efficiencies and customers’ conservation efforts. Sales and transportation service to large volume commercial and industrial customers is more susceptible to prevailing economic conditions. As well, the pricing of competitive energy sources affects volume distributed to these sectors as some customers have the ability to switch to an alternate fuel. Even in those circumstances where EGD and Union Gas each attains theirwe attain our respective total forecast distribution volume, theyour Gas Distribution business may not earn their respectiveits expected ROE due to other forecast variables, such as the mix between the higher margin residential and commercial sectors and the lower margin industrial sector. EGD and UnionOur Gas each remainDistribution business remains at risk for the actual versus forecast large volume contract commercial and industrial volumes.
InWith respect to our GreenRenewable Power and TransmissionGeneration assets, earnings from these assets are highly dependent on weather and atmospheric conditions as well as continued operational availability of these energy producing assets. While the expected energy yields for GreenRenewable Power and TransmissionGeneration projects are predicted using long-term historical data, wind and solar resources are subject to natural variation from year to yearyear-to-year and from season to season.season-to-season. Any prolonged reduction in wind or solar resources at any of the GreenRenewable Power and TransmissionGeneration facilities could lead to decreased earnings and cash flows for us.flows. Additionally, inefficiencies or interruptions of GreenRenewable Power and TransmissionGeneration facilities due to operational disturbances or outages resulting from weather conditions or other factors, could also impact earnings.
Our assets vary in age and were constructed over many decades which causes our inspection, maintenance or repair costs to increase.
Our pipelines vary in age and were constructed over many decades. Pipelines are generally long-lived assets, and pipeline construction and coating techniques have changed over time. Depending on the era of construction and construction techniques, some assets require more frequent inspections, which has resulted in and is expected to continue to result in increased maintenance or repair expenditures in the future. Any significant increase in these expenditures could adversely affect our business, operations or financial results.
Competition may result in a reduction in demand for our services, fewer project opportunities or assumption of risk that results in weaker or more volatile financial performance than expected.
Our Liquids Pipelines business faces competition from competing carriers available to ship liquid hydrocarbons to markets in Canada, the US and internationally and from proposed pipelines that seek to access basins and markets currently served by our Liquids Pipelines. Competition among existing pipelines is based primarily on the cost of transportation, access to supply, the quality and reliability of service, contract carrier alternatives and proximity to markets. The liquids transported in our pipelines currently, or are expected to increasingly, compete with other emerging alternatives for end-users, including, but not limited to, electricity, electric batteries, biofuels, and hydrogen. Additionally, we face competition from alternative storage facilities. Our natural gas transmission and storage businesses compete with similar facilities that serve our supply and market areas in the transmission and storage of natural gas. The natural gas transported in our business also competes with other forms of energy available to our customers and end-users, including electricity, coal, propane, fuel oils, and renewable energy. Our Renewable Power produced from Green Power and Transmission assets is also often sold to a single counterparty underGeneration business faces competition in the procurement of long-term power purchase agreements and from other fuel sources in the markets in which we operate. Competition in all of our businesses, including competition for new project development opportunities, could have a negative impact on our business, financial condition or results of operations.
Completion of our secured projects and maintenance programs are subject to various regulatory, operational and market risks, which may affect our ability to drive long-term growth.
Our project execution continues to face challenges with intense scrutiny on regulatory and environmental permit applications, politicized permitting, public opposition including protests, action to repeal permits, and resistance to land access. We have experienced permit denials, in particular, in relation to necessary maintenance on the Line 5 Pipeline on the Bad River Reservation in northern Wisconsin based on a stated desire of the Bad River Band to shut down the pipeline.
Continued challenges with global supply chains have created unpredictability in materials cost and availability. Labor shortages and inflationary pressures have increased costs of engineering and construction services.
Other events that can and have delayed project completion and increased anticipated costs include contractor or supplier non-performance, extreme weather events or geological factors beyond our control.
Changing expectations of stakeholders regarding ESG and climate change practices could erode stakeholder trust and confidence, damage our reputation and influence actions or decisions about our company and industry and have negative impacts on our business, operations or financial results.
Companies across all sectors and industries are facing changing expectations or increasing scrutiny from stakeholders related to their approach to ESG matters of greatest relevance to their business and to their stakeholders. For energy companies, climate change, GHG emissions, safety and stakeholder and Indigenous relations remain primary focus areas, while other environmental elements such as biodiversity, human rights, and supply chain are ascendant. Companies in the energy industry are experiencing stakeholder opposition to new and existing infrastructure, as well as organized opposition to oil and natural gas extraction and shipment of oil and natural gas products. Changing expectations of our practices and performance across these ESG areas may impose additional costs or create exposure to new or additional risks. We are also exposed to the risk of higher costs, delays, project cancellations, loss of ability to secure new growth opportunities, new restrictions or the cessation of operations of existing pipelines due to increasing pressure on governments and regulators, and legal action, such as the legal challenges to the operation of Line 5 in Michigan and Wisconsin.
Our operations, projects and growth opportunities require us to have strong relationships with key stakeholders, including local communities, Indigenous groups and others directly impacted by our activities, as well as governments, regulatory agencies, investors and investor advocacy groups, investment funds, financial institutions, insurers and others, which are increasingly focused on ESG practices and performance. Enhanced public awareness of climate change has driven an increase in demand for lower-carbon and zero-emissions energy. There have been efforts in recent years affecting the investment community, including certain investors increasing investments in lower-carbon assets and businesses while decreasing the carbon intensity of their portfolios through, among other measures, divestments of companies with high exposure to GHG-intensive operations and products. Certain stakeholders have also pressured commercial and investment banks and insurance providers to reduce or stop financing and providing insurance coverage to oil and natural gas and related infrastructure businesses and projects. Managing these risks requires significant effort and resources. Potential impacts could also include changing investor sentiment regarding investment in Enbridge, which could impair our access to and increase our cost of capital, including penalties associated with our sustainability-linked financing and could adversely impact demand for, or value of, our securities.
Over the past year, geopolitical uncertainty, slowing Canadian and US economies and continuing inflationary pressures have underscored the critical need for access to secure, affordable energy.
The pace and scale of the transition to a lower-emission economy may pose a risk if Enbridge diversifies either too quickly or too slowly. Similarly, unexpected shifts in energy demands, including due to climate change concerns, can impact revenue through reduced throughput volumes on our pipeline transportation systems.
We have long been committed to strong ESG practices, performance and reporting, and in 2020 introduced a set of ESG goals to strengthen transparency and accountability. The goals include increasing diversity and inclusion within our organization and reducing GHG emissions from our operations to net-zero by 2050, with corporate and business unit action plans aligned to our strategic priority to adapt to the energy transition over time. The costs associated with meeting our ESG goals, including our GHG emissions reduction goals, could be significant. There is also a risk that some or all of the expected benefits and opportunities of achieving our ESG goals may fail to materialize, may cost more than anticipated to achieve, may not occur within the anticipated time periods or may no longer meet changing stakeholder expectations. Similarly, there is a risk that emissions reduction technologies do not materialize as expected making it more difficult to reduce emissions. If we are not able to achieve our ESG goals, are not able to meet current and future climate, emissions or related reporting requirements of regulators, or are unable to meet or manage current and future expectations regarding issues important to investors or other long-term pricing arrangements. In this respect,stakeholders (including those related to climate change), it could erode stakeholder trust and confidence, which could negatively impact our reputation, business, operations or financial results.
Our forecasted assumptions may not materialize as expected, including on our expansion projects, acquisitions and divestitures.
We evaluate expansion projects, acquisitions and divestitures on an ongoing basis. Planning and investment analysis is highly dependent on accurate forecasting assumptions and to the extent that these assumptions do not materialize, financial performance may be lower or more volatile than expected. Volatility and unpredictability in the economy, both locally and globally, and changes in cost estimates, project scoping and risk assessment could result in a loss of profits. Similarly, uncertainty in market signals, such as abrupt and unexpected shifts in energy costs and demands, as we saw in 2020 resulting from the COVID-19 pandemic, have impacted, and may in the future impact, revenue through reduced throughput volumes on our pipeline transportation systems.
One or all of the Green PowerAcquisitions may not occur on the terms contemplated in the applicable Purchase and Transmission assetsSale Agreement or at all, or may not occur within the expected time frame, which may negatively affect the benefits we expect to obtain from the Acquisitions.
We cannot provide any assurance that the Acquisitions will be completed in the manner, on the terms and on the time frame currently anticipated, or at all. Completion of each of the Acquisitions is dependentsubject to the satisfaction or waiver of a number of conditions as set forth in the applicable Purchase and Sale Agreement that are beyond our control and may prevent, delay or otherwise materially adversely affect its completion.
The success of the Acquisitions will depend on, each counterparty performing its contractual obligations underamong other things, our ability to integrate the US gas utilities into our business in a manner that facilitates growth opportunities and achieves anticipated results. There is a significant degree of difficulty and management distraction inherent in the process of integrating an acquisition, including challenges integrating certain operations and functions (including regulatory functions), technologies, organizations, procedures, policies and operations, addressing differences in the business cultures of Enbridge and the US gas utilities and retaining key personnel. The integration may be complex and time consuming and involve delays or additional and unforeseen expenses. The integration process and other disruptions resulting from the Acquisitions may also disrupt our ongoing business.
Any failure to realize the anticipated benefits of the Acquisitions, additional unanticipated costs or other factors could negatively impact our earnings or cash flows, decrease or delay any beneficial effects of the Acquisitions and negatively impact our business, financial condition and results of operations.
Our insurance coverage may not fully cover our losses in the event of an accident, natural disaster or other hazardous event, and we may encounter increased cost arising from the maintenance of, or lack of availability of, insurance.
Our operations are subject to many hazards inherent in our industry as described in this Item 1A. Risk Factors. We maintain an insurance program for us, our subsidiaries and certain of our affiliates to mitigate a certain portion of our risks. However, not all potential risks arising from our operations are insurable, or are insured by us as a result of availability, high premiums and for various other reasons. Enbridge self-insures a significant portion of certain risks through our wholly-owned captive insurance subsidiaries, and Enbridge’s insurance coverage is subject to terms and conditions, exclusions and large deductibles or self-insured retentions which may reduce or eliminate coverage in certain circumstances.
Enbridge’s insurance policies are generally renewed on an annual basis and, depending on factors such as market conditions, the premiums, terms, policy limits and/or deductibles can vary substantially. We can give no assurance that we will be able to maintain adequate insurance in the future at rates or on other terms we consider commercially reasonable. In such case, we may decide to self-insure additional risks.
A significant self-insured loss, uninsured loss, a loss significantly exceeding the limits of our insurance policies, a significant delay in the payment of a major insurance claim, or the failure to renew insurance policies on similar or favorable terms could materially and adversely affect our business, financial condition and results of operations.
Our business is exposed to changes in market prices including interest rates and foreign exchange rates. Our risk management policies cannot eliminate all risks and may result in material financial losses. In addition, any non-compliance with our risk management policies could adversely affect our business, operations or financial results.
Our use of debt financing exposes us to changes in interest rates on both future fixed rate debt issuances and floating rate debt. While our financial results are denominated in Canadian dollars, many of our businesses have foreign currency revenues or expenses, particularly the US dollar. Changes in interest rates and foreign exchange rates could materially impact our financial results.
We use financial derivatives to manage risks associated with changes in foreign exchange rates, interest rates, commodity prices, power purchase agreements prices and our share price to reduce volatility of our cash flows. Based on our risk management policies, substantially all of our financial derivatives are associated with an underlying asset, liability and/or pricing arrangement applicableforecasted transaction and not intended for speculative purposes.
These policies cannot, however, eliminate all risk, including unauthorized trading. Although this activity is monitored independently by our Risk Management function, we can provide no assurance that we will detect and prevent all unauthorized trading and other violations, particularly if deception, collusion or other intentional misconduct is involved, and any such violations could adversely affect our business, operations or financial results.
To the extent that we hedge our exposure to it.market prices, we will forego the benefits we would otherwise experience if these were to change in our favor. In addition, hedging activities can result in losses that might be material to our financial condition, results of operations and cash flows. Such losses have occurred in the past and could occur in the future. See Part II, Item 7A. Quantitative and Qualitative Disclosures about Market Risk and Item 8. Financial Statements and Supplementary Data for a discussion of our derivative instruments and related hedging activities.
We rely on access to short-term and long-term capital markets to finance capital requirements and support liquidity needs, and costneeds. Cost effective access to those markets can be affected, particularly if we or our rated subsidiaries are unable to maintain an investment-grade credit rating.
A significant portion of our consolidated asset base is financed with debt. The maturity and repayment profile of debt used to finance investments often does not correlate to cash flows from assets. Accordingly, we rely on access to both short-term and long-term capital markets as a source of liquidity
for capital requirements not satisfied by cash flows from operations and to fundrefinance investments originally financed throughwith debt. Our senior unsecured long-term debt is currently rated investment-grade by various rating agencies. If the rating agencies were to rate us or our rated subsidiaries below investment-grade, our borrowing costs would increase, perhaps significantly. Consequently, we would likely be required to pay a higher interest rate in future financings and our potential pool of investors and funding sources could decrease.
We maintain revolving credit facilities at various entities to provide back-up forbackstop commercial paper programs, for borrowings and/orand for providing letters of credit at various entities.credit. These facilities typically include financial covenants and failure to maintain these covenants at a particular entity could preclude that entity from issuing commercial paper or letters of credit or borrowing underaccessing the revolving credit facility, which could affect cash flows or restrict business.impact liquidity. Furthermore, if our short-term debt rating were to be downgraded, access to the commercial paper market could be significantly limited. Although this would not affect our ability to draw under our credit facilities, borrowing costs could be significantly higher.
If we are not able to access capital at competitive rates or at all, our ability to finance operations and implement our strategy may be affected. Restrictions on our ability to access financial markets may also affect our ability to execute our business plan as scheduled. An inability to access capital on favorable terms or at all may limit our ability to pursue improvementsenhancements or acquisitions that we may otherwise rely on for future growth.growth or to refinance our existing indebtedness. Any downgrade or other event negatively affecting the credit ratings of our subsidiaries could make their costs of borrowing higher or access to funding sources more limited, which in turn could increase our need to provide liquidity in the form of capital contributions or loans to such subsidiaries, thus reducing the liquidity and borrowing availability of the consolidated group.
Our forecasted assumptionsLiquids Pipelines growth rate and results may not materializebe indirectly affected by commodity prices.
Wide commodity price basis between Western Canada and global tidewater markets have negatively impacted producer netbacks and margins in the past years that largely resulted from pipeline infrastructure takeaway capacity from producing regions in Western Canada and North Dakota which are operating at capacity. A protracted long-term outlook for low crude oil prices could result in delay or cancellation of future projects.
The tight conventional oil plays of Western Canada, the Permian Basin, and the Bakken region of North Dakota have short cycle break-even time horizons, typically less than 24 months, and high decline rates that can be well managed through active hedging programs and are positioned to react quickly to market signals. Accordingly, during periods of comparatively low prices, drilling programs, unsupported by hedging programs, will be reduced and as expected on our expansion projects, acquisitions and divestitures.
We evaluate expansion projects, acquisitions and divestitures on an ongoing basis. Planning and investment analysis is highly dependent on accurate forecasting assumptions and to the extent that these assumptions do not materialize, financial performancesuch, supply growth from tight oil basins may be lower, or more volatile than expected. Volatilitywhich may impact volumes on our pipeline systems.
Our Energy Services and unpredictabilityGas Transmission and Midstream results may be adversely affected by commodity price volatility.
Within our US Midstream assets, we hold investments in DCP and Aux Sable, which are engaged in the economy, both locallybusinesses of gathering, treating, processing and globally, changeselling natural gas and natural gas liquids. The financial results of these businesses are directly impacted by changes in cost estimates, project scoping and risk assessment could result incommodity prices. To a loss in our profits.
We may not be able to sell assets or, if we are able to sell assets, to raise a sufficient amount of capital from such asset sales. In addition,lesser degree, the timing to enter into and close any asset sales could be significantly different than our expected timeline.
We are planning to monetize certain assets to execute on our strategic priority to focus on core assets and to accelerate debt reduction and provide capital for capital and investment expenditures. Given the commodity markets, financial markets, and other challenges currently facing the energy sector, our competitors may also engage in asset sales leading to lower demand for the assets we wish to sell. We may not be able to sell the assets we identify for sale on favorable terms or at all. If we are able to sell assets, the timing of the receipt of the asset sale proceeds may not align with the timingresults of our capital requirements. A failure to raise sufficient capital from asset sales or a misalignment of the timing of capital raised and capital funding needs could have an adverse impact on ourUS Transmission business financial condition, results of operations, and cash flows.
Our operations are subject to pipeline safety lawsfluctuation in power prices which impact electric power costs associated with operating compressor stations.
Energy Services generates margin by capitalizing on quality, time and regulations, compliance withlocation differentials when opportunities arise. Changing market conditions that impact the prices at which may require significant capital expenditures, increase our cost of operationswe buy and affect or limit our business plans.
Many of our operations are regulated. The nature and degree of regulation and legislation affecting energy companies in Canada and the United Statessell commodities have changed significantly in past years and further substantial changes may occur.
On February 8, 2018, the Government of Canada introduced legislation to revise the process for assessing major resource projects. At this time, we are reviewing the proposed regulatory reforms and the effect upon us and our subsidiaries, whether adverse or favorable, if such legislation is passed in its current or revised form, is currently uncertain.
Compliance with legislative changes may impose additional costs on new pipeline projects as well as on existing operations. Failure to comply with applicable regulations could result in a number of consequences which may have an adverse effect on our operations, earnings, financial condition and cash flows.
Our operations are subject to numerous environmental laws and regulations, compliance with which may require significant capital expenditures, increase our cost of operations and affect or limit our business plans, or expose us to environmental liabilities.
We are subject to numerous environmental laws and regulations affecting many aspects of our present and future operations, including air emissions, water quality, wastewater discharges, solid waste and hazardous waste.
Failure to comply with environmental laws and regulations may result in the imposition of fines, penaltiespast limited margin opportunities and injunctive measures affecting our operating assets. In addition, changes in environmental lawsimpeded Energy Services' ability to cover capacity commitments and regulations or the enactment of new environmental laws or regulations could result in a material increase in our cost of compliance with such laws and regulations. We may not be able to obtain or maintain all required environmental regulatory approvals for our operating assets or development projects. If there is a delay in obtaining any required environmental regulatory approvals, if we fail to obtain or comply with them, or if environmental laws or regulations change or are administered in a more stringent manner, the operations of facilities or the development of new facilities could be prevented, delayed or become subject to additional costs. We expect that costs we incur to comply with environmental regulationsdo so again in the future willfuture. Other market conditions, such as backwardation, have a significant effect on our earnings and cash flows.likewise limited margin opportunities.
We are exposed to the credit risk of our customers.
We are exposed to the credit risk of our customers, counterparties, and vendors.
We are exposed to the credit risk of multiple parties in the ordinary course of our business. Generally, our customers are rated investment-grade, are otherwise considered creditworthy or provide us security to satisfy credit concerns. A significant amount of our credit exposures for transmission, storage, and gathering and processing services are with customers who have an investment-grade rating (or the equivalent based on our evaluation) or are secured by collateral. However, we cannot predict to what extent our business would be impacted by deteriorating conditions in the economy, including possible declines in the creditworthiness of our customers’ creditworthiness. As a result of future capital projects for which natural gas and oil producers may be the primary customer, our credit exposure with below investment-grade customers, may increase.vendors, or counterparties. It is possible that customer payment or performance defaults from these entities, if significant, could adversely affect our earnings and cash flows.
Our business requires the retention and recruitment of a skilled and diverse workforce, and difficulties in recruiting and retaining our workforce could result in a failure to implement our business plans.
Our operations and management require the retention and recruitment of a skilled and diverse workforce, including engineers, technical personnel, other professionals and other professionals.executive officers and senior management. We and our affiliates compete with other companies in the energy industry, and for some jobs the broader labor market, for this skilled workforce. If we are unable to retain current employees and/or recruit new employees of comparable knowledge and experience, our business could be negatively impacted. In addition, we could experience increased allocated costs to retain and recruit these professionals.
RISKS RELATED TO GOVERNMENT REGULATION AND LEGAL RISKS
Many of our operations are regulated and failure to secure timely regulatory approval for our proposed projects, or loss of required approvals for our existing operations, could have a negative impact on our business, operations or financial results.
The nature and degree of regulation and legislation affecting permitting and environmental review for energy infrastructure companies in Canada and the US continues to evolve.
Within the US and in Canada, pipeline companies continue to face opposition from anti-energy/anti-pipeline activists, Indigenous and tribal groups and communities, citizens, environmental groups, and politicians concerned with the safety of pipelines and their potential environmental effects. In the US, the EPA redefined the Waters of the United States to align with the U.S. Supreme Court’s May 25, 2023 Sackett v. EPA decision that limits the scope of waters regulated by the Clean Water Act, issued new rules under Section 401 of the Clean Water Act broadening the scope of state review for water quality certifications, released rules on methane control and reporting, Cross-state Ozone Pollution (The Good Neighbor Plan), and the Power Plant Rule. The Council for Environmental Quality published immediately applicable guidance for conducting analyses under the National Environmental Policy Act (NEPA), followed by a new rule governing implementation of NEPA in federal actions that may significantly change environmental scope and cost assessments. The FERC has focused on the relationship between natural gas and electric power generation, particularly in connection with reliability issues during severe weather events. The PHMSA issued a draft rule on leak detection and repair. Federal agencies also issued guidance on how environmental justice concerns should be considered and addressed. Many other regulations adopted during the previous US presidential administration are being challenged in multiple courts and some have been overturned by reviewing courts. The current US administration may take further action to modify or reverse regulations that were promulgated by the previous US administration.
In March of 2023, the Supreme Court of Canada heard the Attorney General of Canada’s appeal of the Alberta Court of Appeal’s non-binding decision that the federal Impact Assessment Act (IAA) is unconstitutional. The IAA includes impact assessment requirements that could apply to either federally or provincially regulated pipeline projects that fall within prescribed criteria or that the federal Minister of Environment otherwise designates for review. The potential for any pipeline project to be subject to IAA requirements adds significant uncertainty as to regulatory timelines and outcomes. The Alberta Court of Appeal found that the IAA is an impermissible federal overreach into provincial jurisdiction that would amount to a de facto expropriation of provincial natural resources and proprietary interests by the federal government. The Supreme Court of Canada issued its decision on October 13, 2023, with a majority of the court (5-2) finding that the federal impact assessment regime is outside of the federal Parliament’s authority and that the IAA should focus more narrowly on effects within federal jurisdiction. The decision is a non-binding advisory reference case, so the IAA and associated regulations are not "struck down"; however, the federal government will take the Supreme Court of Canada’s guidance and in collaboration with provinces and Indigenous groups, will seek to amend the IAA so that it is constitutional. The resulting amendments could impact the risks and timing of potential future regulatory approvals and the scope of federal review of intraprovincial pipeline projects.
Our operations are subject to numerous environmental laws and regulations, including those relating to climate change, GHG emissions and climate-related disclosure, compliance with which may require significant capital expenditures, increase our cost of operations, and affect or limit our business plans, or expose us to environmental liabilities.
We are subject to numerous environmental laws and regulations affecting many aspects of our past, current, and future operations, including air emissions, water and soil quality, wastewater discharges, solid waste and hazardous waste.
If we are unable to obtain or maintain all required environmental regulatory approvals and permits for our operating assets and projects or if there is a delay in obtaining any required environmental regulatory approvals or permits, the operation of existing facilities or the development of new facilities could be prevented, delayed, or become subject to additional costs. Failure to comply with environmental laws and regulations may result in the imposition of civil or criminal fines, penalties and injunctive measures affecting our operating assets. We expect that changes in environmental laws and regulations, including those related to climate change, GHG emissions and climate-related disclosure, could result in a material increase in our cost of compliance with such laws and regulations, such as costs to monitor and report our emissions and install new emission controls to reduce emissions. We may not be able to include some or all of such increased costs in the rates charged for utilization of our pipelines or other facilities.
Our operations are subject to operational regulation and other requirements, including compliance with easements and other land tenure documents, and failure to comply with applicable regulations and other requirements could have a negative impact on our reputation, business, operations or financial results.
Operational risks relate to compliance with applicable operational rules and regulations mandated by governments, applicable regulatory authorities, or other requirements that may be found in easements, permits, or other agreements that provide a legal basis for our operations, breaches of which could result in fines, penalties, awards of damages, operating restrictions (including shutdown of lines) and an overall increase in operating and compliance costs.
We do not own all of the land on which our pipelines, facilities and other assets are located and we obtain the rights to construct and operate our pipelines and other assets from third parties or government entities. In addition, some of our pipelines, facilities and other assets cross Indigenous lands pursuant to rights-of-way or other land tenure interests. Our loss of these rights, including through our inability to renew them as they expire, could have an adverse effect on our reputation, operations and financial results. We have experienced litigation in relation to certain Line 5 and other easements; refer to Part II. Item 7. Management's Discussion and Analysis of Financial Condition and Results of Operations - Legal and Other Updates.
Regulatory scrutiny over our assets and operations has the potential to increase operating costs or limit future projects. Regulatory enforcement actions issued by regulators for non-compliant findings can increase operating costs and negatively impact reputation. Potential regulatory changes and legal challenges could have an impact on our future earnings from existing operations and the cost related to the construction of new projects. Regulators' future actions may differ from current expectations, or future legislative changes may impact the regulatory environments in which we operate. While we seek to mitigate operational regulation risk by actively monitoring and consulting on potential regulatory requirement changes with the respective regulators directly, or through industry associations, and by developing response plans to regulatory changes or enforcement actions, such mitigation efforts may be ineffective or insufficient. While we believe the safe and reliable operation of our assets and adherence to existing regulations is the best approach to managing operational regulatory risk, the potential remains for regulators or other government officials to make unilateral decisions that could disrupt our operations or have an adverse financial impact on us.
Our operations are subject to economic regulation and failure to secure regulatory approval for our proposed or existing commercial arrangements could have a negative impact on our business, operations or financial results.
Our Liquids Pipelines, Gas Transmission and Gas Distribution assets face economic regulation risk. Broadly defined, economic regulation risk is the risk that governments or regulatory agencies change or reject proposed or existing commercial arrangements or policies, including permits and regulatory approvals for both new and existing projects or agreements, upon which future and current operations are dependent. Our Mainline System, other liquids pipelines, gas transmission and distribution assets are subject to the actions of various regulators, including the CER, the FERC, and the OEB with respect to the rates, tariffs, and tolls for these assets. The changing or rejecting of commercial arrangements, including decisions by regulators on the applicable permits and tariff structure or changes in interpretations of existing regulations by courts or regulators such as with respect to the negotiated settlements applicable to our Mainline System, could have an adverse effect on our revenues and earnings.
Our Renewable Power Generation assets in Canada and the US are subject to directives, regulations, and policies of federal, provincial and state governments. These measures are variable and can change as a result of, among other things, tax rate changes and a change in the government, which can have a negative impact on our commercial arrangements.
Our Renewable Power Generation assets in Europe (France, Germany and the UK) are also subject to the directives, regulations and policies established and enforced by the EU and the UK government. These measures are variable and can include price controls, caps and demand reduction goals, all of which can have a negative impact on our revenues and earnings.
We are subject to changes in our tax rates, the adoption of new US, Canadian or international tax legislation or exposure to additional tax liabilities.
We are subject to taxes in the US, Canada and numerous foreign jurisdictions. Due to economic and political conditions, tax rates in various jurisdictions may be subject to significant change. Our effective tax rates could be affected by changes in the mix of earnings in countries with differing statutory tax rates, changes in the valuation of deferred tax assets and liabilities, or changes in tax laws or their interpretation. In particular, Canada and other OECD countries have introduced a minimum tax rate to be applied on a global basis.The final legislation and list of the participating countries remains uncertain.In addition, the US enacted the Inflation Reduction Act in 2022 however key regulations still remain outstanding that could impact the interpretation of that act. All of these measures could cause our effective tax rate to increase.
We are also subject to the examination of our tax returns and other tax matters by the US Internal Revenue Service, the Canada Revenue Agency and other tax authorities and governmental bodies. We regularly assess the likelihood of an adverse outcome resulting from these examinations to determine the adequacy of our provision for taxes. There can be no assurance as to the outcome of these examinations. If our effective tax rates were to increase, particularly in the US or Canada, or if the ultimate determination of our taxes owed is for an amount in excess of amounts previously accrued, our financial condition and operating results could be materially adversely affected.
We are involved in numerous legal proceedings, the outcomes of which are uncertain, and resolutions adverse to us could adversely affect our financial results.
We are subject to numerous legal proceedings. In recent years, there has been an increase in climate and disclosure-related litigation against governments as well as companies involved in the energy industry. There is no assurance that we will not be impacted by such litigation, or by other legal proceedings. Litigation is subject to many uncertainties, and we cannot predict the outcome of individual matters with assurance. It is reasonably possible that the final resolution of some of the matters in which we are involved or new matters could require additional expenditures, in excess of established reserves, over an extended period of time and in a range of amounts that could adversely affect our financial results.
Terrorist attacks and threats, escalation of military activity in response to these attacksresults or acts of war, and other civil unrest or activism could adversely affect our business, operations or financial results.reputation. Refer to Part II. Item 7. Management's Discussion and Analysis of Financial Condition and Results of Operations - Legal and Other Updates for a discussion of certain legal proceedings with recent developments.
Terrorist attacks and threats, escalation of military activity or acts of war, or other civil unrest or activism may have significant effects on general economic conditions, fluctuations in consumer confidence and spending and market liquidity, each of which could adversely affect our business. Future terrorist attacks, rumors or threats of war, actual conflicts involving the United States, or Canada, or military or trade disruptions may significantly affect our operations and those of our customers. Strategic targets, such as energy related assets, may be at greater risk of future attacks than other targets in the United States and Canada. In addition, increased environmental activism against pipeline construction and operation could potentially result in work delays, reduced demand for our products and services, increased legislation or denial or delay of permits and rights-of-way. Finally, the disruption or a significant increase in energy prices could result in government-imposed price controls. It is possible that any of these occurrences, or a combination of them, could adversely affect our business, operations or financial results.
Our Liquids Pipelines results may be adversely affected by commodity prices.
Current oil sands production is very robust and is expected to grow in the future as producers actively improve the competitiveness of their existing projects; however, prolonged low prices negatively impact producers' balance sheets and their ability to invest. Sanctioned projects due to come on stream in the next 24 months are not as sensitive to short-term declines in crude oil prices, as investment commitments have already been made. A protracted long-term outlook for low crude oil prices could result in delay or cancellation of future projects. Wide commodity price basis between Western Canada and global tidewater markets have also negatively impacted producer netbacks and margins in the past years that largely resulted from pipeline infrastructure takeaway capacity from producing regions in Western Canada and North Dakota operating at capacity.
The tight oil plays of Western Canada and the Bakken region of North Dakota have short cycle break-even time horizons, typically less than 24 months, and high decline rates that can be well managed through active hedging programs and are positioned to react quickly at market signals. Accordingly, during periods of comparatively low prices, drilling programs, unsupported by hedging programs, will be reduced and as such supply growth from tight oil basins may be lower, which may impact volumes on our pipeline systems.
Our Gas Transmission and Midstream results may be adversely affected by commodity price volatility and risks associated with our hedging activities.
Our exposure to commodity price volatility is inherent to part of our natural gas processing activities. We employ a disciplined hedging program to manage this direct commodity price risk. Because we are not fully hedged, we may be adversely impacted by commodity price exposure on the commodities we receive in-kind as payment for our gathering, processing, treating and transportation services. As a result of our unhedged exposure and the pricing of our hedge positions, a substantial decline in the prices of these commodities could adversely affect our financial results.
Additionally, our hedging activities may not be as effective as we intend in reducing the volatility of our cash flows. To the extent that we engage in hedging activities to reduce our commodity price exposure, we likely will be prevented from realizing the full benefits of price increases above the level of the hedges. Our hedging activities can result in substantial losses if hedging arrangements are imperfect or ineffective and our hedging policies and procedures are not followed properly or do not work as intended. Further, hedging contracts are subject to the credit risk that the other party may prove unable or unwilling to perform its obligations under the contracts, particularly during periods of weak and volatile economic conditions. In addition, certain of the financial instruments we use to hedge our commodity risk exposures must be accounted for on a mark-to-market basis. This causes periodic earnings volatility due to fluctuations in commodity prices.
Our Energy Services results may be adversely affected by commodity price volatility.
Energy Services generates margin by capitalizing on quality, time and location differentials when opportunities arise. Volatility in commodity prices due to changing marketing conditions could limit margin opportunities and impede Energy Services' ability to cover capacity commitments. Furthermore, commodity prices could have negative earnings and cash flow impacts if the cost of the commodity is greater than resale prices achieved by us.
Our risk management policies cannot eliminate all risks. In addition, any non-compliance with our risk management policies could adversely affect our business, operations or financial results.
We use derivative financial instruments to manage the risks associated with movements in foreign exchange rates, interest rates, commodity prices and our share price to reduce volatility to our cash flows. Based on our risk management policies, all of our derivative financial instruments are associated with an underlying asset, liability and/or forecasted transaction. We do not enter into transactions with the objective of speculating on commodity prices or interest rates. These policies cannot, however, eliminate all risk of unauthorized trading and other speculative activity. Although this activity is monitored independently by our risk management function, we remain exposed to the risk of non-compliance with our risk management policies. We can provide no assurance that our risk management function will detect and prevent all unauthorized trading and other violations of our risk management policies and procedures, particularly if deception, collusion or other intentional misconduct is involved, and any such violations could adversely affect our business, operations or financial results.
The effects of United States Government policies on trade relations between Canada and the United States are uncertain.
The United States Government has continued interest in renegotiating and altering the North American Free Trade Agreement (NAFTA) with Canada and Mexico. NAFTA provides protection against tariffs, duties and other charges or fees and assures access by the signatories. The NAFTA negotiations have introduced a level of uncertainty in the energy markets. The outcome of the NAFTA negotiations could result in new rules or its collapse which may be disruptive to energy markets, and could jeopardize our ability to remain competitive and have a significant impact on us.
The effect of comprehensive United States tax reform legislation on us, whether adverse or favorable, is uncertain.
On December 22, 2017, President Trump signed into law H.R. 1, “An Act to provide for reconciliation pursuant to titles II and V of the concurrent resolution on the budget for fiscal year 2018” (informally titled the Tax Cuts and Jobs Act). The effect of the Tax Cuts and Jobs Act on us, our subsidiaries and our shareholders, whether adverse or favorable, is uncertain, but will become more clear as additional guidance is issued.
ITEM 1B. UNRESOLVED STAFF COMMENTS
None.
ITEM 1C. CYBERSECURITY
Cybersecurity risk management, strategy and governance
Risk oversight and management is a key role for the Board and its committees. The Board is responsible for identifying and understanding Enbridge’s principal risks and ensuring that appropriate systems are implemented to monitor, manage and mitigate those risks. The committees of the Board have oversight over risks within their respective mandates.
Oversight of cybersecurity is integrated into the responsibilities of the Board. The Audit, Finance and Risk Committee (the AFRC) provides oversight of cybersecurity matters, particularly as they relate to financial risk and controls, integrity of financial data and public disclosures, and security of the cyber landscape across data and digital. The Safety and Reliability Committee (SRC) has oversight responsibility for security (physical, data and cyber) including as it relates to operational risk and controls, safety, operations integrity and reliability, and asset operations.
Management provides regular reports to the Board at every meeting to review our top risks, identify trends and help manage risk. This includes quarterly reports to the AFRC and SRC on cybersecurity matters. In addition, on an annual basis management prepares and provides to the Board and its committees a corporate risk assessment (CRA), which analyzes and prioritizes enterprise-wide risks (including cybersecurity), highlighting top risks and trends. The annual CRA is an integrated enterprise-wide process. We assess and rank risks based on impact and probability, and we strive to ensure that mitigation measures are appropriately designed, prioritized and resourced. The CRA report is reviewed by the Board committees with responsibility for the risk category relevant to their mandate and is provided to the Board, which coordinates Enbridge's overall risk management approach. Complementary to the CRA, management prepares and provides to the SRC an annual top operational risk report that highlights the highest consequence operational risks across Enbridge and includes further detail on the risks and their treatment. This information helps inform the Board about the potential impact of top operational risks and that appropriate treatments are in place to manage those risks.
Cybersecurity has been identified as a top risk as attacks against participants in our industry have continued to increase in sophistication and frequency over the years. Cybersecurity risk is described in Item 1A. Risk Factors.
Enbridge’s management is responsible for the implementation of risk management strategies and monitoring performance. The technology and information services (TIS) function is centralized under the Senior Vice President & Chief Information Officer (CIO), who has over two decades of international leadership in the business of technology. We also engage independent third parties to assess our cybersecurity program, track their recommendations and use those to further improve the program. Reporting to the CIO is the Chief Information Security Officer who is in charge of our cybersecurity program and oversees the 24x7x365 Security Operations Center (SOC).
We conduct continuous assessments of our cybersecurity standards, perform regular tests of our ability to respond and recover, and monitor for potential threats. To further mitigate threats, we collaborate with governments and regulatory agencies, and take part in external events to learn and share. Our workforce participates in regular security awareness training, including exercises to build capabilities to identify and report suspect phishing emails to our SOC. In the last year, we continued to expand the cybersecurity training and simulated testing we administer to high-risk groups within the organization. A tailored cybersecurity training course has been implemented for team members in operational technology roles, and we have increased the frequency of phishing simulation tests.
We have a cybersecurity third party risk management program, which is an evolving, cross-functional program to help assess and mitigate risks from third party vendors and other service providers. Our cybersecurity team also uses several layers of defense and protection technologies, cybersecurity experts, and automated alerting and response mechanisms to reduce risk to Enbridge.
Although cybersecurity risks have not materially affected us, including our business strategy, results of operations or financial condition, to date, we have experienced an increasing number of cybersecurity threats in recent years. For more information about the cybersecurity risks we face, see the risk factor entitled "Cyber attacks and other cybersecurity incidents pose threats to our technology systems and could materially adversely affect our business, operations, reputation or financial results." in Item 1A. Risk Factors.
ITEM 2. PROPERTIES
Descriptions of our properties and maps depicting the locations of our liquids and natural gas systems are included in Part I. Item 1. Business.Business.
In general, our systems are located on land owned by others and are operated under easements and rights-of-way, licenses, leases or permits that have been granted by private land owners, First Nations, Native American Tribes,land-owners, Indigenous communities, public authorities, railways or public utilities. Our liquids pipeline systems have pumping stations, tanks, terminals and certain other facilities that are located on land that is owned by us and/or used by us under easements, licenses, leases or permits. Additionally, our natural gas pipeline systems have natural gas compressor stations, processing plants and treating plants,of which the vast majority of which are located on land that is owned by us, with theus. The remainder of these compressor stations and other assets, like meter and valve stations, and underground gas storage fields, are used by us under easements, leases or permits.
Titles to ourEnbridge owned properties acquired in our liquids and natural gas systems areor affiliate entities may be subject to encumbrances in some cases. We believe that none of these burdens should materially detract from the value of these properties or materially interfere with their use in the operation of our business.
ITEM 3. LEGAL PROCEEDINGS
We are involved in various legal and administrativeregulatory actions and proceedings and litigation arisingwhich arise in the ordinary course of business. TheWhile the final outcome of these matters is not predictable at this time. However, we believesuch actions and proceedings cannot be predicted with certainty, management believes that the ultimate resolution of these matterssuch actions and proceedings will not have a material adverse effectimpact on our consolidated financial condition,position or results of operations or cash flows in future periods.operations. Refer to Part II. Item 7. Management's Discussion and Analysis of Financial Condition and Results of Operations - Legal and Other Updatesfor discussion of othercertain legal proceedings.proceedings with recent developments.
SEC regulations require the disclosure of any proceeding under environmental laws to which a governmental authority is a party unless the registrant reasonably believes it will not result in monetary sanctions over a certain threshold. Given the size of our operations, we have elected to use a threshold of US$1 million for the purposes of determining proceedings requiring disclosure.
On October 17, 2022, four separate comprehensive enforcement resolutions were announced with the Minnesota Pollution Control Agency, Minnesota Department of Natural Resources (DNR), Fond du Lac Band of Lake Superior Chippewa, and Minnesota Attorney General’s Office related to alleged violations that occurred during construction of Line 3 Replacement (L3R). The Minnesota Attorney General filed a misdemeanor criminal charge for the taking of water without a permit at the Clearbrook aquifer, with this charge against us to be dismissed following one year of compliance with the state water appropriation rules. As part of its ongoing post-construction monitoring activities for L3R, Enbridge reported groundwater flow near Moose Lake in Aitkin County to the DNR. Enbridge has completed the agency approved corrective action at the site.
ITEM 4. MINE SAFETY DISCLOSURES
Not applicable.
PART II
ITEM 5. MARKET FOR REGISTRANT'S COMMON EQUITY, RELATED STOCKHOLDER MATTERS AND ISSUER PURCHASES OF EQUITY SECURITIES
Our
Common Stock
Enbridge common stock is traded on the TSX and NYSE under the symbol “ENB.”ENB. As at January 31, 2018,February 2, 2024, there were approximately 96,107 holders73,123 registered shareholders of record of ourEnbridge common stock. A substantially greater number of holders of ourEnbridge common stock are "street name" or beneficial holders, whose shares are held by banks, brokers and other financial institutions.
Common Stock Data by Quarter
The following table indicates the intra-day high and low prices of our common stock on the TSX (in Canadian dollars):
|
| | | | | | | | | |
| | | Stock Price Range |
| 2017 | Q1 |
| Q2 |
| Q3 |
| Q4 |
|
| High | $ | 58.28 |
| 57.75 |
| 53.00 |
| 52.59 |
|
| Low | | 53.87 |
| 49.61 |
| 48.98 |
| 43.91 |
|
| | | | | | |
| 2016 | | | | | |
| High | $ | 51.31 |
| 55.05 |
| 59.19 |
| 59.18 |
|
| Low | | 40.03 |
| 48.73 |
| 50.76 |
| 53.91 |
|
The following table indicates the intra-day high and low prices of our common stock on the NYSE (in U.S. dollars):
|
| | | | | | | | | |
| | | Stock Price Range |
| 2017 | Q1 |
| Q2 |
| Q3 |
| Q4 |
|
| High | US$ | 44.52 |
| 42.92 |
| 42.31 |
| 42.10 |
|
| Low | | 40.25 |
| 37.37 |
| 39.01 |
| 34.39 |
|
| | | | | | |
| 2016 | | | | | |
| High | US$ | 39.40 |
| 43.39 |
| 45.77 |
| 45.09 |
|
| Low | | 27.43 |
| 37.02 |
| 38.58 |
| 39.70 |
|
Dividends
The following table indicates the dividends paid per common share (in Canadian dollars):
|
| | | | |
| | 2017 |
| 2016 |
|
| Q1 | 0.583 |
| 0.530 |
|
| Q2 | 0.610 |
| 0.530 |
|
| Q3 | 0.610 |
| 0.530 |
|
| Q4 | 0.610 |
| 0.530 |
|
Consistent with our objective of delivering annual cash dividend increases, we announced a quarterly dividend of $0.671 per common share payable on March 1, 2018, which represents a 10 percent increase from the prior quarterly rate. We expect to continue our policy of paying regular cash dividends. The declaration and payment of dividends are subject to the sole discretion of our Board of Directors and will depend upon many factors, including the financial condition, earnings and capital requirements of our operating subsidiaries, covenants associated with certain debt obligations, legal requirements, regulatory constraints and other factors deemed relevant by our Board of Directors.
Securities Authorized for Issuance Under Equity Compensation Plans
InformationThe information required by this Item will be contained in response to this item is incorporated by reference from our Proxy Statement toForm 10-K/A, which will be filed with the SEC relating to our 2018 annual meeting of shareholders.no later than 120 days after December 31, 2023.
Recent Sales of Unregistered Equity Securities
On November 29, 2017, we entered into a private placement for common shares with three institutional investors. The issuance price was $44.84, with gross proceeds of $1.5 billion. We issued 33,456,003 common shares in reliance on Rule 506(b) of Regulation S. The proceeds were used to pay down short-term indebtedness pending reinvestment in capital projects.None.
On December 11, 2017, we issued 20,000,000 of Series 19 Preference Shares in Canada pursuant to a prospectus supplement to our Canadian base shelf prospectus in reliance on Regulation S. Please refer to Item 7 - Outstanding Share Data for further discussion of the transaction.
Issuer Purchases of Equity Securities
None. | | | | | | | | | | | | | | |
| Period | Total number of shares purchased | Average price paid per share | Total number of shares purchased as part of publicly announced plans or programs | Maximum number of shares that may yet be purchased under the plans or programs1 |
| | | | |
| | | | |
| | | | |
| | | | |
| | | | |
| | | | |
| | | | |
| | | | |
| | | | |
October 2023 (October 1 - October 31) | — | | N/A | — | | 25,433,807 | |
November 2023 (November 1 - November 30) | — | | N/A | — | | 25,433,807 | |
December 2023 (December 1 - December 31) | — | | N/A | — | | 25,433,807 | |
1On January 4, 2023, the TSX approved our normal course issuer bid (NCIB), which commenced on January 6, 2023 and expired on January 5, 2024. Our NCIB permitted us to purchase, for cancellation, up to 27,938,163 of the outstanding common shares of Enbridge to an aggregate amount of up to $1.5 billion through the facilities of the TSX, the NYSE and other designated exchanges and alternative trading systems.
Stock Performance Graph
Total Shareholder Return
The following graph reflects the comparative changes in the value from January 1, 20132019 through December 31, 20172023 of $100 invested in (1) Enbridge Inc.’s common shares traded on the TSX, (2) the S&P/TSX Composite index, and (3) the S&P 500 index, (4) our US peer group index (comprising, CU, FTS, IPL, PPL, TRP,by stock symbols, CNP, D, DTE, ETE,DUK, EPD, ET, KMI, MMP, NEE, NI, OKE, PAA, PCG, PAA,SO, SRE and WMB) and (5) our Canadian peer group (comprising, by stock symbols, CU, FTS, PPL and TRP). The amounts included in the table were calculated assuming the reinvestment of dividends at the time dividends were paid.dividends.
|
| | | | | | | | | | | | |
| | January 1, 2013 | December 31, |
| | 2013 |
| 2014 |
| 2015 |
| 2016 |
| 2017 |
|
| Enbridge Inc. | 100.00 |
| 110.93 |
| 146.76 |
| 116.80 |
| 149.53 |
| 136.37 |
|
| S&P/ TSX Composite | 100.00 |
| 112.99 |
| 124.92 |
| 114.53 |
| 138.67 |
| 151.28 |
|
Peer Group1 | 100.00 |
| 126.35 |
| 158.17 |
| 121.45 |
| 158.82 |
| 163.06 |
|
| | | | | | | | | | | | | | | | | | | | |
| | January 1,
2019 | December 31, |
| | 2019 | 2020 | 2021 | 2022 | 2023 |
| Enbridge Inc. | 100.00 | | 129.34 | | 109.69 | | 142.87 | | 162.72 | | 157.79 | |
| S&P/TSX Composite | 100.00 | | 122.88 | | 129.76 | | 162.32 | | 152.83 | | 170.79 | |
| S&P 500 Index | 100.00 | | 131.49 | | 155.68 | | 200.37 | | 164.08 | | 207.21 | |
US Peers1 | 100.00 | | 118.76 | | 101.11 | | 124.27 | | 139.24 | | 145.15 | |
| Canadian Peers | 100.00 | | 131.71 | | 108.28 | | 135.12 | | 140.43 | | 142.20 | |
1For the purpose of the graph, it was assumed that CAD:USDUS dollar conversion ratio remained at 1:1 for the years presented.
ITEM 6. SELECTED FINANCIAL DATA[Reserved]
The following selected financial data should be read in conjunction with Item 7. Management’s Discussion and Analysis of Financial Condition and Results of Operations and Item 8. Financial Statements and Supplementary Data.
|
| | | | | | | | | | | | | | | |
| | Years Ended December 31, |
| | 20171 |
| 20161 |
| 20151 |
| 2014 |
| 2013 |
|
| (millions of Canadian dollars, except per share amounts) | |
|
|
| |
| Consolidated Statements of Earnings | | | | | |
| Operating revenues |
| $44,378 |
| $ | 34,560 |
| $ | 33,794 |
| $ | 37,641 |
| $ | 32,918 |
|
| Operating income | 1,571 |
| 2,581 |
| 1,862 |
| 3,200 |
| 1,365 |
|
| Earnings/(loss) from continuing operations | 3,266 |
| 2,309 |
| (159 | ) | 1,562 |
| 490 |
|
(Earnings)/loss attributable to noncontrolling interests and redeemable noncontrolling interests
| (407 | ) | (240 | ) | 410 |
| (203 | ) | 135 |
|
| Earnings attributable to controlling interests | 2,859 |
| 2,069 |
| 251 |
| 1,405 |
| 629 |
|
| Earnings/(loss) attributable to common shareholders | 2,529 |
| 1,776 |
| (37 | ) | 1,154 |
| 446 |
|
| Common Stock Data | | | | | |
| Earnings/(loss) per common share | | | | | |
| Basic | 1.66 |
| 1.95 |
| (0.04 | ) | 1.39 |
| 0.55 |
|
| Diluted | 1.65 |
| 1.93 |
| (0.04 | ) | 1.37 |
| 0.55 |
|
| Dividends paid per common share | 2.41 |
| 2.12 |
| 1.86 |
| 1.40 |
| 1.26 |
|
|
| | | | | | | | | | | | | | | |
| | December 31, |
| | 20171 |
| 20161 |
| 20151 |
| 2014 |
| 2013 |
|
| (millions of Canadian dollars) | |
|
|
| |
| Consolidated Statements of Financial Position | | | | | |
Total assets2 | $ | 162,093 |
| $ | 85,209 |
| $ | 84,154 |
| $ | 72,280 |
| $ | 57,196 |
|
| Long-term debt including capital leases, less current portion | 60,865 |
| 36,494 |
| 39,391 |
| 33,423 |
| 22,357 |
|
| |
1 | Our Consolidated Statements of Earnings and Consolidated Statements of Financial Position data reflect the following acquisitions, dispositions and impairment: |
2017 - Spectra Merger Transaction, acquisition of public interest in Midcoast Energy Partners, L.P. and other impairment
2016 - Sandpiper Project impairment, gain on disposition of South Prairie Region assets, Tupper Plants acquisition and other
2015 - Goodwill impairment
| |
2 | We combined Cash and cash equivalents and other amounts previously presented as Bank indebtedness where the corresponding bank accounts are subject to pooling arrangements. |
ITEM 7. MANAGEMENT'S DISCUSSION AND ANALYSIS OF FINANCIAL CONDITIONSCONDITION AND RESULTS OF OPERATIONS
INTRODUCTION
The following discussion and analysis of our financial condition and results of operations is based on and should be read in conjunction with "Forward-Looking Information" and "Non-GAAP and Other Financial Measures", Part I. Item 1A. Risk Factors and our consolidated financial statements and the accompanying notes included in Part II. Item 8. Financial Statements and Supplementary Data of this Annual Report on Form 10-K.
We are a Canadian companyThis section of our Annual Report on Form 10-K discusses 2023 and a North American leader in delivering energy. As a transporter2022 items and year-over-year comparisons between 2023 and 2022. For discussion of energy, we operate, in Canada2021 items and the United States, the world’s longest crude oilyear-over-year comparisons between 2022 and liquids transportation system. Following the combination2021, refer to Part II. Item 7. Management's Discussion and Analysis of EnbridgeFinancial Condition and Spectra Energy Corp. (Spectra Energy) through a stock-for-stock merger transaction on February 27, 2017 (the Merger Transaction), we are also a leader in the natural gas transmission and midstream business moving approximately 20%Results of all natural gas in the United States, serving key supply basins and markets. As a distributorOperations of energy, we own and operate Canada’s largest natural gas distribution company and provide distribution services in Ontario, Quebec and New Brunswick. As a generator of energy, we have interests in approximately 3,500 megawatts (MW) (2,500 MW net) of renewable and alternative energy generating capacity which is operating, secured or under construction, and we continue to expand our interests in wind, solar and geothermal power.
DOMESTIC ISSUER REPORTING REQUIREMENTS
Effective January 1, 2018, we began to comply with the Securities and Exchange Commission reporting requirements applicable to United States domestic issuers and, accordingly, we are filing our annual reportAnnual Report on Form 10-K for the year ended December 31, 2017 and regular periodic reports under2022.
RECENT DEVELOPMENTS
MAINLINE TOLLING AGREEMENT
Enbridge Inc. (Enbridge) has reached an agreement on a negotiated settlement with shippers for tolls on its Mainline System. The Mainline Tolling Settlement (MTS) covers both the Canadian and United States law thereafter.US portions of the Mainline and would see the Mainline continuing to operate as a common carrier system available to all shippers on a monthly nomination basis. The MTS is subject to regulatory approval and the term is seven and a half years through the end of 2028, with revised interim tolls effective on July 1, 2023.
MERGER WITH SPECTRA ENERGY
•an International Joint Toll (IJT), for heavy crude oil movements from Hardisty to Chicago, comprised of a Canadian Mainline Toll of $1.65 per barrel plus a Lakehead System Toll of US$2.57 per barrel, plus the applicable Line 3 Replacement (L3R) surcharge;
•toll escalation for operation, administration, and power costs tied to US consumer price and power indices;
•tolls that continue to be distance and commodity adjusted, and utilize a dual currency IJT; and
•a financial performance collar providing incentives for Enbridge to optimize throughput and cost, but also providing downside protection in the event of extreme supply or demand disruptions or unforeseen operating cost exposure. This performance collar is intended to ensure the Mainline earns 11% to 14.5% returns, on a deemed 50% equity capitalization, which is similar to the returns earned on average during the previous tolling agreement.
Approximately 70% of Mainline deliveries are tolled under this settlement, while approximately 30% of deliveries are tolled on a full path basis to markets downstream of the Mainline. The other continuing feature is that the Mainline toll flexes up or down US$0.035 per barrel for 50,000 barrel per day changes in throughput.
The expected financial outcome from this settlement is in line with previously reported financial results after taking into consideration the previously recognized provision, inflationary cost adjustments and increased volumes. Enbridge filed an application with the Canada Energy Regulator (CER) for approval of the MTS on December 15, 2023, with unanimous support from its Representative Stakeholder Group. The CER indicated in its process letter that no dissenting comments were received by January 19, 2024 and that it may decide on the application or it may establish further process steps.
On February 27, 2017, we announcedMay 24, 2023, Enbridge filed an Offer of Settlement with the closingFederal Energy Regulatory Commission (FERC) for the Lakehead System (the Lakehead System Settlement). In addition to resolving litigation related to the Index portion of the Merger Transaction.
UnderLakehead System rate, the Lakehead System Settlement also includes a depreciation truncation date of December 31, 2048 for the rate base applicable to the Index and Facilities Surcharge and agreement on the terms for future recovery through the Facilities Surcharge of costs related to two Line 5 projects: the Wisconsin Relocation Project and the Straits of Mackinac Tunnel. The Lakehead System Settlement was certified by the Settlement Judge on June 23, 2023 and was approved by the FERC Commissioners on November 27, 2023. Lakehead System tolls were revised effective December 1, 2023 to reflect the terms of the Merger Transaction, Spectra Energy shareholders received 0.984 shares of Enbridge for each share of Spectra Energy common stock they held. Upon closing of the Merger Transaction, Enbridge shareholders owned approximately 57% of the combined company and Spectra Energy shareholders owned approximately 43%.Lakehead System Settlement.
Spectra Energy, which we now wholly-own, is one of North America’s leading natural gas delivery companies owning and operating a large, diversified and complementary portfolio of gas transmission, midstream gathering and processing and distribution assets. Spectra Energy also owns and operates a crude oil pipelinesystem that connects Canadian and United States producers to refineries in the United States Rocky Mountain and Midwest regions.Our combination with Spectra Energy has created the largest energy infrastructure company in North America with an extensive portfolio of energy assets that are well positioned to serve key supply basins and end use markets and multiple business platforms through which to drive future growth.
A more detailed description of each of the businesses and underlying assets acquired through the Merger Transaction is provided under Part I. Item 1. Business.The results of operations from assets acquired through the Merger Transaction are included in our financial statements and in this management's discussion and analysis (MD&A) on a prospective basis from the closing date of the Merger Transaction.
Subsequent to the completion of the Merger Transaction, our activities continue to be carried out through five business segments: Liquids Pipelines; Gas Transmission and Midstream (previously known as Gas Pipelines and Processing); Gas Distribution; Green Power and Transmission; and Energy Services. Effective February 27, 2017, as a result of the Merger Transaction:
Liquids Pipelines also includes results from the operation of the Express-Platte System;
Gas Transmission and Midstream also includes Spectra Energy’s United States Storage and Transmission Assets, Canadian Pipeline & Field Services, Canadian Gas Transmission and Midstream and Maritimes & Northeast U.S. and Canada businesses, as well as the results of the Company’s 50% interest in DCP Midstream, LLC (DCP Midstream); and
Gas Distribution also includes results from the operation of Union Gas Limited (Union Gas).
UNITED STATES TAX REFORM
On December 22, 2017, the United States enacted the “Tax Cuts and Jobs Act” (TCJA). Substantially all of the provisions in the TCJA are effective for taxation years beginning after December 31, 2017. The TCJA includes significant changes to the Internal Revenue Code of 1986 (as amended, the Code), including amendments which significantly change the taxation of individuals and business entities, and includes specific provisions related to regulated public utilities which includes our various regulated gas pipeline businesses.The most significant changes that impact us, included in the TCJA, are reductions in the corporate federal income tax rate from 35% to 21%, and several technical provisions including, among others, a onetime deemed repatriation or “toll” tax on undistributed earnings and profits of US controlled foreign affiliates, including Canadian subsidiaries. The specific provisions related to regulated public utilities in the TCJA generally allow for the continued deductibility of interest expense, the elimination of full expensing for tax purposes of certain property acquired after September 27, 2017, and the continuance of certain rate normalization requirements for accelerated depreciation benefits. For other operations, immediate full expensing of capital expenditures placed into service after September 27, 2017 and before January 1, 2023 (before January 1, 2024 for qualified long production period property) will be available under the TCJA. Inversely to the regulated public utility operations, interest deductions will be more restrictive for other operations as existing interest expense limitations are broadened to apply to all interest paid and the allowable deduction is reduced from 50% to 30% of adjusted taxable income.
Changes in the Code from the TCJA had a material impact on our consolidated financial statements as at and for the year ended December 31, 2017. Under generally accepted accounting principles in the United States of America (U.S. GAAP), the tax effects of changes in tax laws must be recognized in the period in which the law is enacted, or December 22, 2017 for the TCJA. Thus, at the date of enactment, our deferred tax liability was re-measured based upon the new tax rate. For some of our gas pipeline entities with regulated cost of service rate mechanisms, the change in the deferred tax liability is offset by a regulatory liability. In the event of a future rate case, and subject to further regulatory guidance, we anticipate that the regulatory liability may be required to be amortized over the remaining useful life of the affected assets and would be one of many factors to be considered in establishing go forward rates. For all other operations, the change in the deferred tax liability is recorded as an adjustment to our deferred tax provision.
While certain elements of the TCJA require clarification through more detailed regulation or interpretive guidance, based on the information and guidance available and our analysis (including computations of income tax effects) completed to date, at this time, we do not expect that the TCJA will have a material economic impact on us going forward.
For additional information, refer to Item 8. Financial Statements and Supplementary Data - Note 24. Income Taxes.
UNITED STATES SPONSORED VEHICLE STRATEGY
In 2017, we continued the ongoing evaluation of our investment in our United States sponsored vehicles, and alternatives to such investment, and we completed or announced certain strategic reviews and transactions. We intend to review our United States sponsored vehicle strategy on a continuing basis. From time to time, we may formulate plans or proposals with respect to such matters and hold discussions with or make formal proposals to the board of directors of the sponsored vehicles or other third parties. These plans or proposals may, subject to price, market and general economic and fiscal conditions and other factors, include potential consolidations, acquisition or sale of assets or securities, changes to capital structure or other transactions.
On April 28, 2017, we announced the completion of a strategic review of Enbridge Energy Partners, L.P. (EEP). The following actions, together with the measures announced in January 2017 and disclosed in our 2016 annual MD&A, have been taken to date to enhance EEP’s value proposition to its unitholders and to us:
ACQUISITIONS
Acquisition of Midcoast Assets and Privatization of Midcoast Energy Partners, L.P.Renewable Natural Gas (RNG) Facilities
On April 27, 2017, we completed our previously-announced merger through which we privatized Midcoast Energy Partners, L.P. (MEP) by acquiring all of the outstanding publicly-held common units of MEP,January 2, 2024, through a wholly-owned US subsidiary, we acquired the first six Morrow Renewables operating landfill gas-to-RNG production facilities located in Texas and Arkansas for total consideration of $1.4 billion (US$1.1 billion), of which $0.5 billion (US$0.4 billion) was paid at close and $0.9 billion (US$0.7 billion) is payable within two years. The total consideration for all seven facilities is $1.6 billion (US$1.2 billion). Combined RNG production of the facilities is approximately US$170 million.4.5 bcf per year. The acquired assets align with and advance our low-carbon strategy.
Fox Squirrel Solar
On June 28, 2017,November 15, 2023, we acquired a 50% interest in a newly formed partnership with EDF Renewables North America to participate in the initial phase of a solar power facility in Ohio. Cash consideration includes an upfront payment of $157 million (US$115 million) and subsequent capital commitments up to $398 million (US$291 million). Investments past the first phase are contingent on certain conditions being met. An additional payment of $164 million (US$123 million) was made at Phase 1 in-service in December 2023.
Hohe See and Albatros Offshore Wind Facilities
On November 3, 2023, we acquired an additional 24.45% interest in the Hohe See Offshore Wind Facilities and Albatros Offshore Wind Facilities (the Offshore Wind Facilities), through the acquisition of a 49% interest in Enbridge Renewable Infrastructure Investments S.à r.l (ERII), for $391 million (€267 million) of cash and assumed debt of $524 million (€358 million), bringing our interest in the Offshore Wind Facilities to 49.9%. The Hohe See Offshore Wind Facilities and Albatros Offshore Wind Facilities are located approximately 100 kilometers off the northern coast of Germany and came into service in 2019 and 2020, respectively.
Aitken Creek Gas Storage
On November 1, 2023, through a wholly-owned Canadian subsidiary, we acquired all of EEP’sa 93.8% interest in Aitken Creek Gas Storage Facility and a 100% interest in Aitken Creek North Gas Storage Facility (collectively, Aitken Creek), located in BC, Canada, for $400 million, subject to other customary closing adjustments (the Aitken Creek Acquisition). Aitken Creek is the MEPonly underground natural gas gatheringstorage facility in BC and processing businessconnects to all major natural gas pipelines in western Canada. The Aitken Creek Acquisition enables us to continue to meet regional energy needs and to support increasing demand for liquefied natural gas (LNG) exports.
US Gas Utilities
On September 5, 2023, we announced that Enbridge had entered into three separate definitive agreements with Dominion Energy, Inc. to acquire The East Ohio Gas Company, Questar Gas Company and its related Wexpro companies, and Public Service Company of North Carolina for an aggregate purchase price of $19.1 billion (US$14.0 billion), comprised of $12.8 billion (US$9.4 billion) of cash consideration and $6.3 billion (US$4.6 billion) of US$1.3assumed debt, subject to customary closing adjustments (together, the Acquisitions). If completed, the Acquisitions will create North America's largest natural gas utility platform delivering over 9 billion plus existing indebtednesscubic feet (bcf) per day to approximately 7 million customers across multiple regulatory jurisdictions. The Acquisitions are expected to close in 2024, subject to the satisfaction of MEPcustomary closing conditions including the receipt of US$953 million.certain regulatory approvals, which are not cross-conditional.
AsOn September 8, 2023, we closed a resultpublic offering of 102,913,500 common shares at a price of $44.70 per share for gross proceeds of $4.6 billion which is intended to finance a portion of the above transactions, we now own 100% ofaggregate cash consideration payable for the MEP gas gatheringAcquisitions. Refer to Financing Update for further details on the debt issuances and processing business.credit facility obtained to support the Acquisitions.
Finalization of Bakken Pipeline System Joint Funding Agreement
On February 15, 2017, EEP acquired an effective 27.6% interest in the Dakota Access and Energy Transfer Crude Oil Pipelines (collectively, the Bakken Pipeline System). On April 27, 2017, we entered into a joint funding arrangement with EEP whereby we own 75% and EEP owns 25% of the combined 27.6% effective interest in the Bakken Pipeline System (our jointly held interest). Under this arrangement, EEP has retained a five-year option to acquire from us an additional 20% interest of the jointly held interest. On finalization of this joint funding arrangement, EEP repaid the outstanding balance on its US$1.5 billion credit agreement with us, which it had drawn upon to fund the initial purchase.
EEP Strategic Restructuring ActionsTres Palacios Holdings LLC
On April 27, 2017, EEP redeemed all3, 2023, we acquired Tres Palacios Holdings LLC (Tres Palacios) for $451 million (US$335 million) of cash. Tres Palacios is a natural gas storage facility located in the US Gulf Coast and its outstanding Series 1 Preferred Units held by us at face valueinfrastructure serves Texas gas-fired power generation and LNG exports, as well as Mexico pipeline exports. Tres Palacios is comprised of US$1.2 billion through the issuance of 64.3 million Class A common units to us. Further, we irrevocably waived all of our rights associated with our ownership of 66.1 million Class D units and 1,000 Incentive Distribution Units (IDUs) of EEP, in exchange for the issuance of 1,000 Class F units. The Class F units are entitled to (i) 13% of all distributions in excess of US$0.295 per EEP unit, but equal to or less than US$0.35 per EEP unit, and (ii) 23% of all distributions in excess of US$0.35 per EEP unit. The irrevocable waiver was effective with respect to distributions declaredthree natural gas storage salt caverns with a record date after April 27, 2017. In connectiontotal FERC-certificated working gas capacity of approximately 35 billion bcf and also owns an integrated 62-mile natural gas header pipeline system, with these strategic restructuring actions, EEP reduced its quarterly distribution from US$0.583 per unit to US$0.35 per unit.eleven inter- and intrastate natural gas pipeline connections.
The irrevocable waiver of the Class D units and IDUs, the redemption of the Series 1 Preferred Units and the reduction in the quarterly distributions will result in a lower contribution of earnings from EEP. This lower contribution will be partially offset by an increased contribution of earnings as a result of our increased ownership in the Class A common units post restructuring.
Restructuring of SEP Incentive Distribution Rights
On January 22, 2018, Enbridge and Spectra Energy Partners, LP (SEP) announced the execution of a definitive agreement, resulting in us converting all of our incentive distribution rights (IDRs) and general partner economic interests in SEP into172.5 million newly issued SEP common units. As part of the transaction, all of the IDRs have been eliminated. We now hold a non-economic general partner interest in SEP and own approximately 403 million of SEP common units, representing approximately 83% of SEP's outstanding common units.
ASSET MONETIZATION
Disposition of Alliance Pipeline and Aux Sable
In conjunctionOn December 13, 2023, we announced that Enbridge has entered into a definitive agreement to sell our 50.0% interest in the Alliance Pipeline and our interest in Aux Sable (including 42.7% interest in Aux Sable Midstream LLC and Aux Sable Liquid Products L.P., and 50% interest in Aux Sable Canada LP) to Pembina Pipeline Corporation for $3.1 billion, including approximately $0.3 billion of non-recourse debt, subject to customary closing adjustments. Closing is expected to occur in the first half of 2024, subject to the receipt of regulatory approvals and satisfaction of customary closing conditions. The sales proceeds will fund a portion of the Acquisitions and be used for debt reduction.
GAS TRANSMISSION AND MIDSTREAM PROCEEDINGS
Texas Eastern Transmission
The Stipulation and Agreement for Texas Eastern Transmission, LP’s (Texas Eastern) consolidated 2021 rate cases was approved by the FERC on November 30, 2022, and became effective on January 1, 2023. Texas Eastern received FERC approval on April 3, 2023 to implement the settled rates and other settlement provisions.
Maritimes & Northeast Pipeline
The toll settlement agreement for the Canadian portion of the Maritimes & Northeast (M&N) Pipeline (M&N Canada) expired in December 2023. M&N Canada reached a toll settlement with shippers for the effective period from January 1, 2024 to December 31, 2025. On November 28, 2023, M&N Canada filed the 2024 - 2025 toll settlement agreement with the announcementCER for review and approval. A CER decision is expected in the first quarter of 2024.
GAS DISTRIBUTION AND STORAGE RATE APPLICATIONS
Incentive Regulation Rate Application
In October 2022, Enbridge Gas Inc. (Enbridge Gas) filed its application with the Ontario Energy Board (OEB) to establish a 2024 through 2028 Incentive Regulation (IR) rate setting framework. The application initially sought approval in two phases to establish 2024 base rates (Phase 1) on a cost-of-service basis and to establish a price cap rate setting mechanism (Phase 2) to be used for the remainder of the Merger TransactionIR term. A third phase (Phase 3) has been established with the OEB as part of the Phase 1 Partial Settlement Proposal (Settlement Proposal).
On August 17, 2023, the OEB approved the Settlement Proposal to support the determination of just and reasonable rates effective January 1, 2024. Items resolved in whole or in part include:
•additions to rate base up to and including 2022;
•interest rates on debt and return on equity;
•deferral and variance accounts;
•Indigenous engagement; and
•rate implementation approach for 2024.
On December 21, 2023, the OEB issued its Decision and Order on Phase 1 (Phase 1 Decision). The decision addressed three main areas: energy transition, Enbridge Gas Distribution Inc. and Union Gas Limited amalgamation and harmonization issues, and other issues. The Phase 1 Decision included the following key findings or orders:
•energy transition risk requires Enbridge Gas to carry out a risk assessment to consider further risk mitigation measures in three areas: system access and expansion capital spending, system renewal capital spending and depreciation policy;
•our 2024 capital plan must be reduced by $250 million with a focus on monitoring, repair and life extension of our assets and a further $50 million of capitalized indirect overhead costs must be expensed, escalating to $250 million per year during the IR term with an offsetting adjustment to revenues in each year;
•all new small volume customers wishing to connect to natural gas pay their full connection costs as an upfront charge rather than through rates over time effective January 1, 2025;
•approval of a harmonized depreciation methodology that reduced the level of depreciation sought and adjusted asset lives including extensions of service life for certain asset classes;
•an increase in equity thickness from 36% to 38% effective for 2024; and
•January 1, 2024 will be the effective date for 2024 rates.
The issues addressed in the Settlement Proposal and the Phase 1 Decision resulted in the following items not approved for future recovery, and the subsequent impairments recognized for the year ended December 31, 2023:
•a portion of undepreciated capital projects removed from 2024 rate base of $41 million;
•undepreciated integration capital costs removed from 2024 rate base of $84 million; and
•pre-2017 Union Gas Limited related pension balances of $156 million.
Enbridge Gas filed a Notice of Appeal in the Ontario Divisional Court on January 22, 2024 regarding four aspects of the Phase 1 Decision: small volume customer revenue horizon, the 2024 capital plan reduction, the extension of service life for certain asset classes and equity thickness. On January 29, 2024 Enbridge Gas also filed a Notice of Motion with the OEB requesting the OEB to review and vary five aspects of the Phase 1 Decision: small volume customer revenue horizon, the 2024 capital plan reduction, integration capital, depreciation and equity thickness. The outcome of these proceedings is uncertain.
The Phase 1 Decision results in interim rates, pending phases 2 and 3 of the proceeding, resolution of the Notice of Appeal, Notice of Motion and any possible legislative steps that could be undertaken by the Government of Ontario further to the Ontario Minister of Energy's December 22, 2023 news release. Phase 2 will establish and determine the incentive rate mechanism for the remainder of the rebasing term, and gas cost and unregulated storage cost allocation. Phase 3 will address cost allocation and the harmonization of rates and rate classes between legacy rate zones.
Purchase Gas Variance
The Purchase Gas Variance Account (PGVA) captures the difference between actual and forecasted natural gas prices reflected in rates. Account balances are typically recovered or refunded over a prospective 12-month period through Quarterly Rate Adjustment Mechanism (QRAM) applications.
In March 2023, the April 1, 2023 QRAM application was filed and approved by the OEB, which included an adjustment to the prior rate mitigation approved as part of the July 1, 2022 QRAM. The recovery of the outstanding PGVA balance from the extended recovery period approved as part of the July 1, 2022 QRAM will now be completed by March 31, 2024. In June, September 2016, we announced our intentionand December 2023, the July 1, 2023, October 1, 2023, and January 1, 2024 QRAM applications, respectively, were filed and approved by the OEB with no adjustments to divest $2the prior period rate mitigation plans and did not include any additional rate mitigation measures.
As at December 31, 2023, Enbridge Gas' PGVA liability balance was $16 million.
FINANCING UPDATE
We completed long-term debt issuances totaling US$8.5 billion and $3.9 billion during the year ended December 31, 2023, including aggregate amounts of US$2.3 billion of assets over10-year sustainability-linked senior notes in March 2023 and $400 million of 10-year sustainability-linked medium-term notes in May 2023.
We increased our credit facilities in March 2023 by approximately $500 million. During our annual renewal process, we renewed and extended approximately $15.4 billion of our credit facilities with maturities ranging from 2024-2028.
In September 2023, we obtained commitments for a US$9.4 billion senior unsecured bridge term loan credit facility to support the ensuing 12 months in orderAcquisitions. The commitment for this facility was subsequently reduced to further strengthen our post-combination balance sheet and enhance the financial flexibilitynil as at December 31, 2023 as a result of the combined entity.WithSeptember 2023 $4.6 billion equity offering, the completion ofSeptember 2023 subordinated long-term debt issuances, and the Secondary Offering noted below, the Ozark pipeline system sale, the Olympic refined products pipeline sale and other divestitures completed in 2016 and previously disclosed,November 2023 senior notes long-term debt issuances.
In September 2023, we exceeded the $2 billion monetization target established on announcement of the Merger Transaction.
On April 18, 2017, Enbridge Income Fund Holdings Inc. (ENF) completedclosed a secondarypublic offering of 17,347,750 ENF102,913,500 common shares to the public at a price of $33.15$44.70 per share for gross proceeds of $4.6 billion which is intended to us of approximately $0.6 billion (the Secondary Offering). To effect the Secondary Offering, we exchanged 21,657,617 Enbridge Income Fund (Fund) units we owned for an equivalent amount of ENF common shares. In order to maintain our 19.9% ownership interest in ENF, we retained 4,309,867finance a portion of the common sharesaggregate cash consideration payable for the Acquisitions.
Our 2023 financing activities have provided significant liquidity that we received in the exchange,expect will enable us to fund our current portfolio of capital projects and sold the balanceacquisitions without requiring access to the public throughcapital markets for the Secondary Offering. We usednext 12 months should market access be restricted or pricing be unattractive. Refer to Liquidity and Capital Resources.
As at December 31, 2023, after adjusting for the proceeds from the Secondary Offering to pay down short-term debt, pending reinvestment in our growing portfolioimpact of secured projects. Upon closingfloating-to-fixed interest rate swap hedges, less than 5% of the Secondary Offering, our total economic interest in ENF decreased from 86.9%debt is exposed to 84.6%.
On November 29, 2017, we finalized our 2018-2020 Strategic Plan and announced that we have identified a further $10 billion of non-core assets, of which a minimum of $3 billion we intend to sell or monetize in 2018. As a result of the announcement, we are in the process of selling certain assets within the US Midstream business of our Gas Transmission and Midstream segment.floating rates. Refer to Part II. Item 8. Financial Statements and Supplementary Data - Note 7. Acquisitions23 - Risk Management and Dispositions.Financial Instruments for more information on our interest rate hedging program.
ALBERTA CLIPPER (LINE 67) PRESIDENTIAL PERMIT
NORMAL COURSE ISSUER BID
On October 16, 2017, we received a Presidential permit for Line 67, following a nearly five-year process of review. Line 67 currently operates under an existing Presidential permit that was issued byJanuary 4, 2023, the State Department in 2009Toronto Stock Exchange (TSX) approved our normal course issuer bid (NCIB), which commenced on January 6, 2023 and the 2017 Presidential permit authorizesexpired on January 5, 2024. Our NCIB permitted us to fully utilize Line 67's capacity acrosspurchase, for cancellation up to 27,938,163 of the United States/Canada border.outstanding common shares of Enbridge to an aggregate amount of up to $1.5 billion through the facilities of the TSX, the New York Stock Exchange and other designated exchanges and alternative trading systems.
Line 67 is a key component of our mainline system, which United States refineries rely on to provide vital products to consumers across the Midwest United States.
For additional information on Line 67, refer to Growth Projects - Commercially Secured Projects - Liquids Pipelines - Lakehead System Mainline Expansion.
CANADIAN RESTRUCTURING PLAN
Effective September 1, 2015, under an agreement with the Fund and ENF, Enbridge transferred its Canadian Liquids Pipelines business, held by Enbridge Pipelines Inc. (EPI) and Enbridge Pipelines (Athabasca) Inc. (EPAI), and certain Canadian renewable energy assets to the Fund Group (comprising the Fund, Enbridge Commercial Trust, Enbridge Income Partners LP (EIPLP) and the subsidiaries of EIPLP) for consideration valued at $30.4 billion plus incentive distribution and performance rights (the Canadian Restructuring Plan). The consideration that we received included $18.7 billion of units in the Fund Group, comprised of $3 billion of Fund units and $15.7 billion of equity units of EIPLP, in which the Fund has an interest. The Fund Group also assumed debt of EPI and EPAI of approximately $11.7 billion.
RESULTS OF OPERATIONS
| | | | | | | | | | | |
| Year ended December 31, | 2023 | 2022 | 2021 |
| (millions of Canadian dollars, except per share amounts) | | | |
Segment earnings/(loss) before interest, income taxes and depreciation and amortization1 | | | |
| Liquids Pipelines | 9,499 | | 8,364 | | 7,897 | |
| Gas Transmission and Midstream | 4,264 | | 3,126 | | 3,671 | |
| Gas Distribution and Storage | 1,592 | | 1,827 | | 2,117 | |
| Renewable Power Generation | 149 | | 262 | | 508 | |
| Energy Services | (37) | | (417) | | (313) | |
| Eliminations and Other | 837 | | (1,124) | | 356 | |
Earnings before interest, income taxes and depreciation and amortization1 | 16,304 | | 12,038 | | 14,236 | |
| Depreciation and amortization | (4,613) | | (4,317) | | (3,852) | |
| Interest expense | (3,812) | | (3,179) | | (2,655) | |
| Income tax expense | (1,821) | | (1,604) | | (1,415) | |
| (Earnings)/loss attributable to noncontrolling interests and redeemable noncontrolling interests | 133 | | 65 | | (125) | |
| Preference share dividends | (352) | | (414) | | (373) | |
| Earnings attributable to common shareholders | 5,839 | | 2,589 | | 5,816 | |
| Earnings per common share attributable to common shareholders | 2.84 | | 1.28 | | 2.87 | |
| Diluted earnings per common share attributable to common shareholders | 2.84 | | 1.28 | | 2.87 | |
|
| | | | | | |
| | Year ended December 31, |
| | 2017 |
| 2016 |
| 2015 |
|
| (millions of Canadian dollars, except per share amounts) | |
| |
| |
|
| Segment earnings before interest, income taxes and depreciation and amortization | |
| |
| |
|
| Liquids Pipelines | 6,395 |
| 4,926 |
| 3,033 |
|
| Gas Transmission and Midstream | (1,269 | ) | 464 |
| 43 |
|
| Gas Distribution | 1,390 |
| 831 |
| 763 |
|
| Green Power and Transmission | 372 |
| 344 |
| 363 |
|
| Energy Services | (263 | ) | (183 | ) | 324 |
|
| Eliminations and Other | (337 | ) | (101 | ) | (867 | ) |
| | | | |
| Depreciation and amortization | (3,163 | ) | (2,240 | ) | (2,024 | ) |
| Interest expense | (2,556 | ) | (1,590 | ) | (1,624 | ) |
| Income tax recovery/(expense) | 2,697 |
| (142 | ) | (170 | ) |
| (Earnings)/loss attributable to noncontrolling interests and redeemable noncontrolling interests | (407 | ) | (240 | ) | 410 |
|
| Preference share dividends | (330 | ) | (293 | ) | (288 | ) |
| Earnings/(loss) attributable to common shareholders | 2,529 |
| 1,776 |
| (37 | ) |
| Earnings/(loss) per common share | 1.66 |
| 1.95 |
| (0.04 | ) |
| Diluted earnings/(loss) per common share | 1.65 |
| 1.93 |
| (0.04 | ) |
EARNINGS/(LOSS)EARNINGS ATTRIBUTABLE TO COMMON SHAREHOLDERS
Year ended December 31, 20172023 compared with year ended December 31, 2016
2022
Earnings Attributableattributable to Common Shareholders for the year ended December 31, 2017 were positively impactedcommon shareholders increased by contributions of approximately $2,574 million from new assets following the completion of the Merger Transaction.
After taking into consideration the contribution of additional earnings from the Merger Transaction, Earnings Attributable to Common Shareholders decreased by $151 million$3.2 billion due to certain unusual, infrequent or other non-operating factors, primarily explained by the following:
a loss•the absence in 2023 of $4,391 million ($2,753 million after-tax attributable to us) and relateda goodwill impairment of $102 million resulting from the classification of certain assets as held for sale and the subsequent measurement at the lower of their carrying value or fair value less costs$2.5 billion relating to sell, refer to Item 8. Financial Statements and Supplementary Data - Note 7. Acquisitions and Dispositions;
our Gas Transmission reporting unit;employee severance and restructuring costs of $354 million ($273 million after-tax attributable to us) in 2017, compared with $82 million in the corresponding 2016 period, related to a corporate reorganization initiative and the Merger Transaction, refer to Merger with Spectra Energy;
project development and transaction costs of $205 million ($155 after-tax attributable to us) in 2017, compared with $86 million in the corresponding 2016 period, related to the Merger Transaction, refer to Merger with Spectra Energy;
the absence of a gain of $850 million ($520 million after-tax attributable to us) recorded in 2016 related to the disposition of the South Prairie Region assets, as discussed below; partially offset by
•a non-cash, $1,936 million income tax benefit ($2,045 million federal tax recovery net of a $109 million state deferred tax expense) due to the enactment of the TCJA by the United States in December 2017, refer to Item 8. Financial Statements and Supplementary Data - Note 24. Income Taxes;
a non-cash, unrealized derivative fair value gain of $1,109$1,127 million ($856 million after-tax) in 2017 ($624 million after-tax attributable to us),2023, compared with $543a net unrealized loss of $1,246 million ($459950 million after-tax attributable to us)after-tax) in the corresponding 2016 period2022, reflecting net fair value gains and losses arising from changes in the mark-to-market value of derivative financial instruments used to manage foreign exchange, interest rate, and commodity prices risks; and
•the absence of cumulativein 2023 of: an asset impairment chargesloss of $1,561$227 million ($456173 million after-tax) to our Magic Valley Wind Farm (Magic Valley); an asset impairment loss of $183 million ($137 million after-tax) on the US and Canadian components of the interstate pipeline within the North Dakota System of our Bakken System, an impairment of $44 million ($34 million after-tax) for lease assets due to office relocation plans, and an asset impairment loss of $40 million ($30 million after-tax) relating to MacKay River line within our Alberta Regional Oil Sands System;
•a gain of $151 million ($129 million after-tax) and a deferred tax adjustment of $69 million were recognized as a result of Southern Lights Pipeline's (Southern Lights) discontinuation of regulatory accounting;
•the absence in 2023 of a transaction cost of $114 million in relation to our investment purchase in the Woodfibre LNG project;
•a deferred income tax recovery of $104 million related to a tax adjustment on asset impairments;
•a non-cash, net unrealized gain of $73 million ($55 million after-tax) in 2023, compared with a net unrealized loss of $27 million ($21 million after-tax) in 2022, reflecting the revaluation of derivatives used to manage the profitability of transportation and storage transactions, as well as to manage the exposure to movements in commodity prices;
•the receipt of a litigation claim settlement of $68 million ($52 million after-tax) in 2023; and
•a non-cash, net unrealized gain of $35 million ($33 million after-tax) in 2023, compared with a net unrealized loss of $25 million ($22 million after-tax) in 2022, reflecting changes in the mark-to-market value of equity fund investments held by our wholly-owned captive insurance subsidiaries.
The factors above were partially offset by:
•the absence in 2023 of a gain of $1,076 million ($732 million after-tax) on the closing of the joint venture merger transaction with Phillips 66 (P66) realigning our indirect economic interests in Gray Oak Pipeline LLC (Gray Oak) and DCP Midstream, LP (DCP);
•a realized loss of $638 million ($479 million after-tax) due to termination of foreign exchange hedges, as foreign exchange risks inherent within the Competitive Toll Settlement (CTS) framework are not present in the negotiated Mainline tolling agreement;
•an impairment loss of $261 million ($20 million after-tax attributableand net of noncontrolling interest) to us) recordedour Chapman Ranch wind facilities;
•an impairment of $281 million ($232 million after-tax) recognized to certain capital projects, capital costs and pension balances in 2016the fourth quarter of 2023 as a result of the OEB's Phase 1 Decision on Enbridge Gas' application;
•a deferred tax adjustment of $120 million as a result of deregulation of parts of the Canadian Mainline including Line 9 and L3R;
•a provision adjustment and settlement of $124 million ($95 million after-tax) related to EEP's Sandpiper Project, a litigation matter;
•the Northern Gateway Projectabsence in 2023 of a gain of $118 million ($89 million after-tax) on Texas Eastern recorded to reflect a settlement with a transportation customer undergoing bankruptcy;
•an asset retirement loss of $86 million ($65 million after-tax) related to our Alberta Regional Oil Sands System;
•an impairment loss of $82 million ($63 million after-tax) to certain Offshore equity investments in our Gas Transmission and Eddystone Rail,Midstream segment; and
•transaction costs of $31 million ($24 million after-tax) incurred as a result of the Acquisitions.
The non-cash, unrealized derivative fair value gains and losses discussed below.
We haveabove generally arise as a result of our comprehensive long-term economic hedging program to mitigate foreign exchange, interest rate foreign exchange and commodity price risks whichrisks. This program creates volatility in reported short-term earnings through the recognition of unrealized non-cash gains and losses on financial derivative instruments used to hedge these risks. Over the long term,long-term, we believe our hedging program supports the reliable cash flows and dividend growth upon which our investorsinvestor value proposition is based.
After taking into consideration the factors above, the remaining $1,670$51 million decreaseincrease in earnings attributable to common shareholders is primarily explained by the following significant business factors:
increased depreciation and amortization expense primarily resulting from a significant number of new assets placed into service in 2017;
increased interest expense primarily resulting•higher contributions from the settlement of certain pre-issuance hedges;
increased earnings attributable to noncontrolling interests and redeemable noncontrolling interestsMainline System in 2017, compared with the corresponding 2016 period. The increase wasour Liquids Pipelines segment driven by higher earnings attributableincreased volumes due to noncontrolling interests in EEP during 2017increased crude demand, net of a lower L3R surcharge and lower Mainline System tolls as a result of the EEP strategic restructuring actions;revised interim tolls effective July 1, 2023;
the absence of earnings from certain assets that were divested since the third quarter of 2016; partially offset by
strong•higher contributions from our Liquids Pipelines segment due to increased ownership of the Gray Oak Pipeline and Cactus II Pipeline acquired in the second half of 2022 and the Enbridge Ingleside Energy Center (EIEC) due to higher throughput primarilydemand;
•the recognition of revenues in our Gas Transmission and Midstream segment attributable to capacity optimization initiatives implementedthe Texas Eastern rate case settlement;
•higher distribution charges at our Gas Distribution and Storage segment resulting from increases in 2017 which significantly reduced heavy crude oil apportionment allowing incremental heavy crude oil barrels to be shipped;rates and customer base as well as higher demand in the contract market;
•higher contributions from new Liquids Pipelines assets placed into serviceour Energy Services segment primarily due to the expiration of transportation commitments and favorable margins due to less pronounced market structure backwardation; and
•the favorable effect of translating US dollar earnings at a higher average exchange rate in 2017; and2023, as compared to 2022; partially offset by
increased•a reduction in earnings from our Gas Transmission and Midstream segment in 2017 due to favorable seasonal firm revenue and a full year of contributions from assets acquired in 2016.
Lower earnings per common share for 2017, compared with the corresponding 2016 period, is primarily due to the increase in common shares from the issuance of approximately 33 million common shares in December 2017 in a private placement offering, the issuance of approximately 691 million common shares in February 2017 as part of the consideration for the Merger Transaction, the issuance of approximately 75 million common shares in 2016 through the public offering of 56 million common shares in the first quarter of 2016, and ongoing quarterly issuances under our Dividend Reinvestment Program. Additional earnings from the assets acquired in the Merger Transaction were offset by certain unusual, infrequent or other factors, as discussed above.
Year ended December 31, 2016 compared with year ended December 31, 2015
Earnings Attributable to Common Shareholders increased by $1,601 million due to certain unusual, infrequent or other factors, primarily explained by the following:
a gain of $850 million ($520 million after-tax attributable to us) within the Liquids Pipelines segment related to the disposition of the South Prairie Region assets in December 2016;
a non-cash, unrealized derivative fair value gain of $543 million in 2016, compared with a $2,017 million unrealized derivative fair value loss in the corresponding 2015 period reflecting net fair value gains and losses arising from changes in the mark-to-market value of derivative financial instruments used to manage foreign exchange and commodity price risks;
the absence of a goodwill impairment charge of $440 million ($167 million after-tax attributable to us) recognized in the second quarter of 2015 related to EEP’s natural gas and natural gas liquids (NGL) businesses as a result of the prolonged decline in commodity prices which reduced producers’ expected drilling programs and negatively impacted volumes on EEP’s natural gas and NGL pipelines and processing systems; partially offset by
an impairment charge of $1,004 million ($81 million after-tax attributable to us) in 2016, including related project costs, on EEP's Sandpiper Project resulting from the withdrawal of regulatory applications for the project in September 2016 that were pending with the Minnesota Public Utilities Commission (MNPUC);
an impairment charge of $373 million ($272 million after-tax attributable to us) related to the Northern Gateway Project recorded in the fourth quarter of 2016, after the Canadian Federal Government directed the National Energy Board (NEB) to dismiss our Northern Gateway Project application and rescind the Certificates of Public Convenience and Necessity for the project; and
an impairment charge of $184 million ($108 million after-tax attributable to us) recorded in 2016 related to our 75% joint venturedecreased interest in Eddystone Rail, located in the Philadelphia, Pennsylvania area. Demand for Eddystone Rail services declinedDCP as a result of a significant decrease in Bakken crude oil and West Africa/Brent crude oil and increased competitionjoint venture merger transaction with P66 that closed in the region.third quarter of 2022;
•higher operating and administrative costs in our Gas Transmission and Midstream and Gas Distribution and Storage segments;
After taking into consideration•lower commodity prices impacting the factors above, the remaining $212 million increase isDCP and Aux Sable joint ventures in our Gas Transmission and Midstream segment;
•higher interest expense primarily explained by the following significant business factors:due to higher interest rates and higher average principal; and
strong contributions from our Liquids Pipelines segment which benefited from•higher depreciation and amortization expense as a numberresult of new assets that wereseveral projects placed into service in 2015;
throughput growth period over period on the Canadian Mainline, Lakehead Pipeline System (Lakehead System) and Regional Oil Sands System primarily due to strong oil sands production growth in western Canada enabled by completed pipeline expansion projects;
contributions from the United States Gulf Coast and Mid-Continent systems in 2016, attributable to increased transportation revenues mainly resulting from an increase in the level of committed take-or-pay volumes on the Flanagan South Pipeline (Flanagan South);
contributions from Enbridge Offshore Pipelines' Heidelberg Oil Pipeline (Heidelberg Pipeline) which was placed into service in January 2016 and Canadian Gas Transmission and Midstream’s Tupper Main and Tupper West gas plants (the Tupper Plants) which were acquired on April 1, 2016; partially offset by
higher earnings attributable to noncontrolling interests and redeemable noncontrolling interests in 2016 compared with 2015 driven by stronger operating performance at EEP as a result of stronger contributions from its liquids business;
the impact of extreme wildfires in northeastern Alberta during the second quarterhalf of 2016 which led to a temporary shutdown of certain of our upstream pipelines and terminal facilities resulting in a disruption of service on our Regional Oil Sands System with corresponding impacts into and out of our downstream pipelines, including Canadian Mainline and the Lakehead System;2022.
a combination of a lower average International Joint Tariff (IJT) Residual Benchmark Toll and a lower foreign exchange hedge rate period over period used to convert Canadian Mainline United States dollar toll revenues to Canadian dollars;
the performance of the United States portion of the Bakken Pipeline System where contributions decreased period over period primarily due to a lower surcharge on tolls subject to annual adjustment;
lower contributions in 2016 from EEP’s Berthold rail facility as a result of declining volumes on expiration of contracts;
the compression of certain crude oil location and quality differentials and the impact of a weaker NGL market; and
depreciation and amortization expense increased period over period primarily as a result of a significant number of new assets placed into service in 2016.
REVENUESENERGY SERVICES
The Energy Services businesses in Canada and the US provide physical commodity marketing and logistical services to North American refiners, producers, and other customers.
Energy Services is primarily focused on servicing customers across the value chain and capturing value from quality, time, and location price differentials when opportunities arise. To execute these strategies, Energy Services transports and stores on both Enbridge-owned and third-party assets using a combination of contracted pipeline, storage, railcar, and truck capacity agreements.
Effective January 1, 2024, to better align how the chief operating decision-maker reviews operating performance and resource allocation across operating segments, we transferred our Canadian and US crude oil businesses from the Energy Services segment to the Liquids Pipelines segment. The Energy Services segment will cease to exist and the remainder of the business will be reported in the Eliminations and Other segment.
COMPETITION
Energy Services’ earnings are primarily generated from arbitrage opportunities which, by their nature, can be replicated by competitors. An increase in market participants entering into similar arbitrage strategies could have an impact on our earnings. Efforts to mitigate competition risk include diversification of the marketing business by transacting at the majority of major hubs in North America and establishing long-term relationships with clients and pipelines.
ELIMINATIONS AND OTHER
Eliminations and Other includes operating and administrative costs that are not allocated to business segments, the impact of foreign exchange hedge settlements and the activities of our wholly-owned captive insurance subsidiaries. The principal activity of our captive insurance subsidiaries is providing insurance and reinsurance coverage for certain insurable property and casualty risk exposures of our operating subsidiaries and certain equity investments. Eliminations and Other also includes new business development activities and corporate investments.
REGULATION
GOVERNMENT REGULATION
Pipeline Regulation
Our Liquids Pipelines and Gas Transmission and Midstream assets are subject to numerous operational rules and regulations mandated by governments and applicable regulatory authorities, breaches of which could result in fines, penalties, operating restrictions and an overall increase in operating and compliance costs.
In the US, our interstate pipeline operations are subject to pipeline safety laws and regulations administered by the Pipeline and Hazardous Materials Safety Administration (PHMSA), an agency within the United States Department of Transportation (DOT). These laws and regulations require us to comply with a significant set of requirements for the design, construction, maintenance and operation of our interstate pipelines. These laws and regulations, among other things, include requirements to monitor and maintain the integrity of our pipelines and to operate them within permissible pressures.
PHMSA continues to review existing regulations and establish new regulations to support safety standards that are designed to improve operations integrity management processes. In this climate of increasingly stringent regulation, pipeline failure or failures to comply with applicable regulations could result in reduction of allowable operating pressures as authorized by PHMSA, which would reduce available capacity on our pipelines. Should any of these risks materialize, it may have an adverse effect on our operations, capital expenditures, earnings, cash flows, financial condition and competitive advantage.
Our ability to establish transportation and storage rates on our US interstate natural gas facilities is subject to regulation by the FERC, whose rulings and policies could have an adverse impact on the ability to recover the full cost of operating these pipeline and storage assets, including a reasonable rate of return. Regulatory or administrative actions by the FERC such as rate proceedings, applications to certify construction of new facilities, and depreciation and amortization policies can affect our business, including decreasing tariff rates and revenues and increasing our costs of doing business.
In Canada, our pipelines are subject to safety regulations administered by the CER or provincial regulators. Applicable legislation and regulations require us to comply with a significant set of requirements for the design, construction, maintenance and operation of our pipelines. Among other obligations, this regulatory framework imposes requirements to monitor and maintain the integrity of our pipelines.
As in the US, laws and regulations addressing enhanced pipeline safety in Canada have been enacted over the past few years. The changes demonstrate an increased focus on the implementation of management systems to address key areas, such as emergency management, integrity management, safety, security and environmental protection. The CER has authority to impose administrative monetary penalties for non-compliance with the regulatory regime it administers, as well as to impose financial requirements for future abandonment and major pipeline releases.
A key component of pipeline safety and reliability is the approach to integrity management that uses reliability targets and safety case assessments. A long history of extensive inline inspection has provided detailed knowledge of the assets in our pipeline systems. Our pipelines are assessed and maintained in a proactive manner ensuring reliability targets are met. Furthermore, the integrity management program has an independent step to check the results of integrity assessments to validate the effectiveness of the program and to ensure that the operational risk remains as low as reasonably practicable throughout the integrity inspection and assessment cycle. As inspection technology, pipeline materials and construction practices improve with time, and new data on threats and pipeline condition are gathered, our methods of maintaining fitness for service evolves, with a strong focus on continual improvement in every aspect of integrity management.
Our pipelines also face economic regulatory risk. Broadly defined, economic regulatory risk is the risk that governments or regulatory agencies reject or revise proposed commercial arrangements, applications or policies, upon which future and current operations are dependent. Our pipelines are subject to the actions of various regulators, including the CER and the FERC, with respect to tariffs and tolls. The rejection or revision of applications for approval of new tariff structures or proposed commercial arrangements and changes in interpretation of existing regulations by courts or regulators could have an adverse effect on our revenues and earnings.
Gas Distribution and Storage
Our gas distribution and storage utility operations are regulated by the OEB and the Québec Régie de l’énergie, among others. To the extent that the regulators’ future actions are different from current expectations, the timing and amount of recovery or refund of amounts recorded in the Consolidated Statements of Financial Position, or amounts that would have been recorded in the Consolidated Statements of Financial Position in the absence of the effects of regulation, could be different from the amounts that are eventually recovered or refunded.
Enbridge Gas' distribution rates, were set under a five-year incentive regulation (IR) framework using a price cap mechanism, which ended on December 31, 2023. The price cap mechanism established new rates each year through an annual base rate escalation at inflation less a 0.3% productivity factor, in addition to annual updates for certain costs to be passed through to customers, and where applicable, provided for the recovery of material discrete incremental capital investments beyond those that could be funded through base rates. The IR framework included the continuation and establishment of certain deferral and variance accounts, as well as an earnings sharing mechanism that required Enbridge Gas to share equally with customers any earnings in excess of 150 basis points over the annual OEB approved return on equity (ROE).
In October 2022, Enbridge Gas filed its application with the OEB to establish a 2024 through 2028 IR rate setting framework. The application initially sought approval in two phases to establish 2024 base rates (Phase 1) on a cost-of-service basis and to establish a price cap rate setting mechanism (Phase 2) to be used for the remainder of the IR term. A third phase (Phase 3) has been established with the OEB as part of the Phase 1 Partial Settlement Proposal (Settlement Proposal).
On August 17, 2023, the OEB approved the Settlement Proposal to support the determination of just and reasonable rates effective January 1, 2024. Items resolved in whole or in part include:
•additions to rate base up to and including 2022;
•interest rates on debt and return on equity;
•deferral and variance accounts;
•Indigenous engagement; and
•rate implementation approach for 2024.
On December 21, 2023, the OEB issued its Decision and Order on Phase 1 (Phase 1 Decision). The decision addressed three main areas: energy transition, Enbridge Gas Distribution Inc. and Union Gas Limited amalgamation and harmonization issues, and other issues. The Phase 1 Decision included the following key findings or orders:
•energy transition risk requires Enbridge Gas to carry out a risk assessment to consider further risk mitigation measures in three areas: system access and expansion capital spending, system renewal capital spending and depreciation policy;
•our 2024 capital plan must be reduced by $250 million with a focus on monitoring, repair and life extension of our assets and a further $50 million of capitalized indirect overhead costs must be expensed, escalating to $250 million per year during the IR term with an offsetting adjustment to revenues in each year;
•all new small volume customers wishing to connect to natural gas pay their full connection costs as an upfront charge rather than through rates over time effective January 1, 2025;
•approval of a harmonized depreciation methodology that reduced the level of depreciation sought and adjusted asset lives including extensions of service life for certain asset classes;
•an increase in equity thickness from 36% to 38% effective for 2024; and
•January 1, 2024 will be the effective date for 2024 rates.
The issues addressed in the Settlement Proposal and the Phase 1 Decision resulted in the following items not approved for future recovery, and the subsequent impairments recognized for the year ended December 31, 2023:
•a portion of undepreciated capital projects removed from 2024 rate base of $41 million;
•undepreciated integration capital costs removed from 2024 rate base of $84 million; and
•pre-2017 Union Gas Limited related pension balances of $156 million.
Enbridge Gas filed a Notice of Appeal in the Ontario Divisional Court on January 22, 2024 regarding four aspects of the Phase 1 Decision: small volume customer revenue horizon, the 2024 capital plan reduction, the extension of service life for certain asset classes and equity thickness. On January 29, 2024 Enbridge Gas also filed a Notice of Motion with the OEB requesting the OEB to review and vary five aspects of the Phase 1 Decision: small volume customer revenue horizon, the 2024 capital plan reduction, integration capital, depreciation and equity thickness. The outcome of these proceedings is uncertain.
The Phase 1 Decision results in interim rates, pending phases 2 and 3 of the proceeding, resolution of the Notice of Appeal, Notice of Motion and any possible legislative steps that could be undertaken by the Government of Ontario further to the Ontario Minister of Energy's December 22, 2023 news release. Phase 2 will establish and determine the incentive rate mechanism for the remainder of the rebasing term, and gas cost and unregulated storage cost allocation. Phase 3 will address cost allocation and the harmonization of rates and rate classes between legacy rate zones.
Enbridge Gas continues to develop opportunities to support a lower-carbon future in Ontario. In 2021, we received OEB approval of an Integrated Resource Planning (IRP) framework and integrated the framework into our planning practices. The framework requires Enbridge Gas to consider facility and non-pipe demand and/or supply side alternatives (IRP alternatives) to address the systems needs of its regulated operations, where certain parameters have been met. The framework also allows Enbridge Gas to pursue an IRP alternative (or combination of IRP alternatives and facility alternative) where it is found to be in the best interests of Enbridge Gas and its customers, taking into account reliability and safety, cost-effectiveness, public policy, optimized scoping, and risk management.
On July 19, 2023, Enbridge Gas filed an application seeking approval for the cost consequences associated with two IRP pilot projects. The projects are designed to implement demand-side IRP alternatives, including enhanced targeted energy efficiency and residential demand response programs, in combination with supply-side IRP alternatives, in select communities in order to mitigate identified system constraints and associated facility projects. The pilot projects are intended to provide learnings on the performance of the selected IRP alternatives, including the potential for scalability, that can be leveraged in future IRP alternative plan design. An OEB decision is expected during 2024.
Renewable Power Generation
Renewable Power Generation is subject to numerous operational rules and regulations mandated by governments and applicable regulatory authorities, breaches of which could result in fines, penalties, operating restrictions and an overall increase in operating and compliance costs.
The North American Electric Reliability Council (NERC) is an international regulatory authority responsible for establishing and enforcing reliability standards to reduce risks to the reliability and security of the grid in Canada, the US, and Mexico. It is subject to oversight from the FERC in the US and provincial governments in Canada. The FERC has authority over many markets in the US and is tasked with ensuring safe, reliable, and secure interstate transmission of electricity, natural gas, and oil. This includes establishing reliability standards and determining certain pricing aspects of transmission development and access, among others. NERC and FERC standards and pricing decisions are also updated from time to time and could impact our operations, capital expenditures, earnings, and cash flows, though some of these impacts could be positive for our business.
At the US federal level, our Renewable Power Generation assets are subject to legislation overseen by the US Fish and Wildlife Service, which is aimed at reducing the impact of development and human activity on wildlife, along with other federal environmental permitting legislation. These federal environmental laws are subject to change from time to time which could require Enbridge to obtain new permits, update practices, or amend operations and operating expenditures.
In Canada, the Federal Government does not generally regulate the electricity sector, though it has imposed a federal carbon price on other sectors via its output-based pricing system (OBPS) and has proposed a Clean Electricity Regulation (CE Regulation) that would require Canada’s electricity grid to reach net-zero by 2035. The CE Regulation is expected to come into effect in 2024.
Policy changes may also provide new opportunities for existing assets and new developments. The US passed the Inflation Reduction Act in late 2022, which established long-term production and investment tax credits for renewable power generation, battery storage projects and for related manufacturing supply chains. Similarly, Canada has prepared legislation that would establish competitive tax credits for renewable power generation and battery storage projects, which it anticipates passing in early 2024. Changes to these tax programs could impact development plans.
Renewable Power Generation is also subject to provincial and state regulations governing the energy resource mix on the grid, emissions levels of the electricity grid, and market regulations related to emergency operations, extreme weather preparedness, and market participation, among others. These regulations may change from time to time, which could impact Enbridge’s operations and increase the costs of participating in regional electricity markets. In 2023, Texas introduced firming requirements that would require new wind and solar projects to be paired with batteries or other firm power supply and/or introduced caps on the percentage of the grid’s power that can be provided by variable generation. Other state and provincial governments are considering similar legislation.
Our Renewable Power Generation assets in France and Germany each have federal policies in place and are subject to directives and regulations established and enforced by the European Union (EU). These include the Renewable Energy Directive, the European Green Deal, and ongoing work on financing mechanisms and transmission directives and programs. The EU is also responsible for establishing environmental protection rules and permitting standards. During 2022, member states of the EU introduced extraordinary and temporary measures to address high energy prices including caps and demand reduction goals. As the minimum PPA prices in Germany and France are still honored, there are no negative implications to our PPA prices. The federal policies and regulations in place are subject to change from time to time, which could impact our operations and related expenditures; however, the EU’s general direction is to facilitate increased renewable power integration to its grid.
The United Kingdom (UK) government is responsible for establishing renewable energy and carbon pricing policies for the entire UK, as well as long-term electricity sector planning and procurement mechanisms and structure for auctions that are administered at the national level, e.g., England, Scotland, within the UK. Each country within the UK is also responsible for establishing its own environmental and permitting regulations. This process is still ongoing following Brexit and in some cases continues to result in more volatile merchant power prices; however, expanded interconnectors to Europe and policies aimed at increasing domestic renewable capacity are in progress. Governments have introduced temporary price controls, effective January 1, 2023, to address the significant increase in energy prices. The impact of merchant exposure on our Renewable Power Generation asset in the UK is limited by fixed revenue payments backed by the UK government.
Energy Services
Energy Services is regulated by government authorities in the areas of commodity trading, import and export compliance and the transportation of commodities. Non-compliance with governing rules and regulations could result in fines, penalties and operating restrictions. These consequences would have an adverse effect on operations, earnings, cash flows, financial condition and competitive advantage. Energy Services retains dedicated professional staff and has a robust regulatory compliance program (including targeted training) to mitigate these potential risks associated with the business.
In the US, commodity marketing is regulated by the Commodity Futures Trading Commission, the FERC, the SEC, the Federal Trade Commission, the various commodity exchanges, the US Department of Justice and state regulators. The provincial and territorial securities regulators similarly regulate commodity marketing within Canada and are members of the Canadian Securities Administrators. These various regulators enforce, among other things, the prohibition of market manipulation, fraud and disruptive trading.
The regulation of wholesale sales of electric energy is also regulated by the FERC, which authorizes Energy Services to sell electricity at market-based rates.
The export of natural gas out of Alberta is regulated by the Alberta Energy Regulator. The import and export of commodities between Canada and the US is subject to regulation by the CER and the US Department of Energy, as well as customs authorities. In particular, import and export permits are required, with associated regular reporting requirements. Breaches of import and export rules and permits could result in an inability to perform day to day operations, and can negatively impact the earnings of the business.
The transportation of crude oil and natural gas liquids by railcar or truck is regulated by the US DOT, Transport Canada and provincial regulation. Each jurisdiction requires compliance with security, safety, emergency management, and environmental laws and regulations related to ground transportation of commodities. Risks associated with transportation of crude or natural gas liquids include unplanned releases. In the event of a release, remediation of the affected area would be required. Energy Services engages third parties, such as Emergency Response Assistance Canada, the Chemical Transportation Emergency Center and the Canadian Transport Emergency Center to assist in such remediation.
ENVIRONMENTAL REGULATION
Pipeline Regulation
Our Liquids Pipelines and Gas Transmission and Midstream assets are subject to numerous federal, state and provincial environmental laws and regulations affecting many aspects of our present and future operations, including air emissions, water quality, water discharge and waste. These laws and regulations generally require us to obtain and comply with a wide variety of environmental licenses, permits and other approvals.
In particular, in the US, compliance with major Clean Air Act regulatory programs may cause us to incur significant capital expenditures to obtain permits, evaluate off-site impacts of our operations, install pollution control equipment, and otherwise assure compliance. Some equipment in states in which we operate are affected by the Good Neighbor Rule establishing new emission limits for nitrogen oxides. In addition, there are evolving regulations on environmental justice that could impact Enbridge facilities. The precise nature of these compliance obligations at each of our facilities has not been finally determined and may depend in part on future regulatory changes. In addition, compliance with new and emerging environmental regulatory programs may significantly increase our operating costs compared to historical levels.
In the US, climate change action is evolving at federal, state and regional levels. Pursuant to federal regulations, we are currently subject to an obligation to report our GHG emissions at our largest emitting facilities. On December 2, 2023 the Environmental Protection Agency (EPA) released a final rule to minimize methane emissions for new and existing crude oil and natural gas facilities, coupled later with a fee for excess emissions. The current US presidential administration has been implementing policies designed to combat climate change and reduce GHG emissions. In addition, a number of states have joined regional GHG initiatives, and a number are developing their own programs that would mandate reductions in GHG emissions. Public interest groups and regulatory agencies are increasingly focusing on the emission of methane associated with natural gas development and transmission as a source of GHG emissions. Based on proposed changes to measure, report and mitigate GHG emissions the expectation is that there will be a significant increase in costs to maintain and report compliance for businesses in our industry.
Canada has adopted a pan-Canadian approach to pricing carbon emissions to incent GHG emission reductions across all sectors of the economy. This approach was adopted in 2016 and entails both a consumer price on carbon, and an intensity-based system for industry which addresses competitiveness and carbon leakage. Provinces and territories may implement their own system of carbon pricing provided it meets the federal benchmark (and if they fail to do so the federal system will be imposed on them). In March 2022, Canada published its 2030 Emissions Reduction Plan (ERP) which builds on the Pan-Canadian Framework, and Net-Zero Emissions Accountability Act, and details the roadmap for Canada to meet its domestic climate target of a 40-45% reduction in GHG emissions by 2030 and attaining net-zero emissions by 2050. The ERP details the complementary policies and programs that Canada will enact to enable it to meet its domestic climate goal. Effective January 1, 2023, the federal carbon price was increased from $50 to $65 per tonne of carbon dioxide equivalent (tCO2e). This will increase by $15 per tonne each year and rise to $170 per tCO2e in 2030.
Gas Distribution and Storage
Our Gas Distribution and Storage operations, facilities and workers are subject to municipal, provincial and federal legislation which regulates the protection of the environment and the health and safety of workers. Environmental legislation primarily includes regulation of spills and emissions to air, land and water; hazardous waste management; the assessment and management of excess soil and contaminated sites; protection of environmentally sensitive areas, and species at risk and their habitats; and the reporting and reduction of GHG emissions.
Gas distribution system operation, as with any industrial operation, has the potential risk of abnormal or emergency conditions, or other unplanned events that could result in releases or emissions exceeding permitted levels. These events could result in injuries to workers or the public, adverse impacts to the environment, property damage and/or regulatory infractions including orders and fines. We could also incur future liability for soil and groundwater contamination associated with past and present site activities.
In addition to gas distribution, we also operate gas storage facilities and a small volume of oil and brine production in southwestern Ontario. Environmental risk associated with these facilities has the potential for unplanned releases. In the event of a release, remediation of the affected area would be required. There would also be potential for fines and orders under environmental legislation, and potential third-party liability claims by any affected landowners.
The gas distribution system and our other operations must maintain environmental approvals and permits from regulators to operate. As a result, these assets and facilities are subject to periodic inspections and/or audits. Reports are submitted to our regulators as required to demonstrate we are in good standing with our environmental requirements. Failure to maintain regulatory compliance could result in operational interruptions, fines, and/or orders for additional pollution control technology or environmental mitigation.
As environmental regulations continue to evolve and become more stringent, the cost to maintain compliance and the time required to obtain approvals continues to increase. A recent example includes the implementation of the new excess soil management requirements (Ontario Regulation 406/19) which has resulted in an increase in soil management costs and effort.
As in previous years, in 2023 we reported operational GHG emissions, including emissions from stationary combustion, flaring, venting and fugitive sources to Environment and Climate Change Canada, the Ontario Ministry of Environment, Conservation and Parks, and a number of voluntary reporting programs. In accordance with the provincial GHG regulations, stationary combustion and flaring emissions related to storage and transmission operations were verified in detail by a third-party accredited verifier with no material discrepancies found.
Enbridge Gas utilizes emissions data management processes and systems to help with the data capture and mandatory and voluntary reporting needs. Quantification methodologies and emission factors are updated in our systems as required. Enbridge Gas continues to work with industry associations to refine quantification methodologies and emissions factors, as well as best management practices to minimize emissions.
In October 2018, the federal government confirmed that Ontario is subject to the federal government’s carbon pricing program, otherwise known as the Federal Carbon Pricing Backstop Program. This program consists of two components: a carbon charge levied on fossil fuels, including natural gas, and an OBPS. This program applies in whole or in part to any province or territory that requested it or that did not have an equivalent carbon pricing system in place by January 1, 2019.
The federal carbon charge took effect on April 1, 2019 at a rate of 3.91 cents/cubic meter (m3) of natural gas and is applicable to the majority of customers. Enbridge Gas is registered as a natural gas distributor with the Canada Revenue Agency and remits the federal carbon charge on a monthly basis. The charge increases annually on April 1 of each year, rising to 12.39 cents/m3 in 2023. As confirmed by the federal government in July 2021, the federal carbon price will increase by $15 per tonne each year beginning in 2023, rising to $170 per tCO2e in 2030. This will equate to a federal carbon charge of 32.40 cents/m3 in 2030.
In September 2020, Ontario and the federal government announced that the federal government has accepted that Ontario’s Emission Performance Standards (EPS) will replace the federal OBPS for industrial facilities. In March 2021, the federal government announced that the federal OBPS would stand down in Ontario at the end of 2021 and Ontario would transition to the EPS effective January 1, 2022. In September 2021, the Greenhouse Gas Pollution Pricing Act was amended to remove Ontario as a covered province, enabling the EPS to take effect on January 1, 2022. Effective January 1, 2022, Enbridge Gas transitioned out of the federal OBPS to the provincial EPS. Enbridge Gas is registered with the Ontario Ministry of the Environment, Conservation and Parks as a covered facility under the EPS and has an annual compliance obligation for its facility-related stationary combustion and flaring emissions associated with its transmission and storage operations. Enbridge Gas must remit payment annually on the portion of emissions that exceed its total annual emissions limit. Payment is due the year following a compliance period and as such, Enbridge Gas remitted payment for its 2022 EPS compliance obligation in November 2023. Enbridge Gas will remit payment for its 2023 EPS compliance obligation in 2024.
Enbridge Gas applies to the OEB annually through a Federal Carbon Pricing Program application for approval of just and reasonable rates effective April 1 each year for the Enbridge Gas Distribution Inc. and Union Gas Limited rate zones, to recover the costs associated with the Federal Carbon Charge and EPS Regulation as a pass-through to customers.
Renewable Power Generation
In summer 2023, the Federal Government of Canada introduced its draft CE Regulation that would cap emissions on electricity generation resources on Canada’s grid. The CE Regulation would cap emissions from electricity generation sources at, or near zero tCO2e per megawatt hour. Details of the CE Regulation and related compliance are under negotiation with the provinces at this time, at least one of which has taken steps to formally resist the adoption of the CE Regulation. The Federal Government anticipates adopting the CE Regulation in 2024, which would begin to apply to projects in 2035, as drafted.
Similarly, the US EPA introduced emissions caps for utilities that would apply to certain coal and natural gas generation facilities by 2035. The caps would require applicable facilities to either capture a portion of carbon emissions and/or to co-fire using hydrogen.
Enbridge’s Renewable Power Generation resources are substantially non-emitting.
HUMAN CAPITAL RESOURCES
WORKFORCE SIZE AND COMPOSITION
As at December 31, 2023, we had approximately 11,500 regular employees, including approximately 1,500 unionized employees across our North American operations. This total rises to just over 13,400 if temporary employees and contractors are included. We have a strong preference for direct employment relationships but where we have collectively bargained-for employees, we have mature working relationships with our labor unions and the parties have traditionally committed themselves to the achievement of renewal agreements without a work stoppage.
SAFETY
We generate revenuesbelieve all injuries, incidents and occupational illnesses are preventable. Our overall focus on employee and contractor safety, continues to result in strong performance compared against industry benchmarks and we are actively engaged in continuous improvement exercises as we pursue our goal of zero incidents.
DIVERSITY, EQUITY AND INCLUSION
In 2020, we announced Enbridge’s ESG goals – including goals to increase representation of women, underrepresented ethnic and racial groups (including Indigenous peoples), people with disabilities and veterans – to ensure our workforce is reflective of the communities where we operate. In executing on our ESG strategy, we continue to track progress towards these representation goals in 2023. Consistent with our culture, we remain committed to open, two-way dialogue related to our goals, enhancing transparency and accountability for all stakeholders.
Diversity Representation Goals
PRODUCTIVITY AND DEVELOPMENT
We continually invest in our people’s personal and professional development and productivity because we recognize their success is our success. Employees are provided access to leading productivity tools and technology, and can opt in to a range of development and growth opportunities through a variety of channels, which encourages employees to build new skills needed for our core and emerging lines of business and the broader energy transition.
EXECUTIVE OFFICERS
The following table sets forth information regarding our executive officers as at February 9, 2024:
| | | | | | | | |
| Name | Age | Position |
| Gregory L. Ebel | 59 | President & Chief Executive Officer |
| Patrick R. Murray | 49 | Executive Vice President & Chief Financial Officer |
| Colin K. Gruending | 54 | Executive Vice President & President, Liquids Pipelines |
| Cynthia L. Hansen | 59 | Executive Vice President & President, Gas Transmission and Midstream |
| Michele E. Harradence | 55 | Executive Vice President & President, Gas Distribution & Storage |
| Matthew A. Akman | 56 | Executive Vice President, Corporate Strategy & President, Power |
| Reginald D. Hedgebeth | 56 | Executive Vice President, External Affairs and Chief Legal Officer |
| Maximilian G. Chan | 45 | Senior Vice President & Corporate Development Officer |
| Laura J. Sayavedra | 56 | Senior Vice President, Safety, Projects & Chief Administrative Officer |
Gregory L. Ebel was appointed President and Chief Executive Officer (CEO) on January 1, 2023. Mr. Ebel is also a member of the Enbridge Board of Directors. Mr. Ebel served as Chair of the Enbridge Board of Directors following the merger of Enbridge and Spectra Energy Corp (Spectra Energy) in 2017 until January 1, 2023. Prior to that time, he served as Chairman, President and CEO of Spectra Energy from three primary sources: transportation2009 until February 27, 2017. Previously, Mr. Ebel also served as Spectra Energy’s Group Executive and Chief Financial Officer beginning in 2007, President of Union Gas Limited from 2005 until 2007, and Vice President, Investor & Shareholder Relations of Duke Energy Corporation from 2002 until 2005.
Patrick R. Murray was appointed Executive Vice President & Chief Financial Officer (CFO) on July 1, 2023. Mr. Murray has oversight for all of Enbridge’s financial affairs including investor relations, financial reporting, financial planning, treasury, tax, insurance, risk and audit management functions. He also leads Enbridge’s technology and information services teams. Prior to assuming his current role, Mr. Murray was Senior Vice President & Chief Accounting Officer of Enbridge from June 2020 to June 2023, Vice President, Financial Planning & Analysis and Controller from June 2019 to May 2020,and Vice President, Financial Planning & Analysis from February 2017 to June 2019. Mr. Murray joined Enbridge over 25 years ago and has held a variety of roles within internal audit, corporate accounting, investor relations, treasury, and corporate development during that time.
Colin K. Gruending was appointed Executive Vice President and President, Liquids Pipelines on October 1, 2021. Mr. Gruending is responsible for the overall leadership and operations of Enbridge’s Liquids Pipelines business. Previously, he served as our Executive Vice President and Chief Financial Officer from June 2019 to October 2021; Senior Vice President, Corporate Development and Investment Review from May 2018 to June 2019; and Vice President, Corporate Development and Investment Review from February 2017 to May 2018.
Cynthia L. Hansen was appointed Executive Vice President and President, Gas Transmission and Midstream on March 1, 2022. Ms. Hansen is responsible for the overall leadership and operations of Enbridge’s natural gas pipeline and midstream business across North America. Previously, she served as our Executive Vice President, Gas Distribution and Storage from June 2019 to March 2022 and as Executive Vice President, Utilities and Power Operations from February 2017 to June 2019. Ms. Hansen is also the Executive Sponsor for Asset and Work Management Transformation across Enbridge, working with other business unit leaders.
Michele E. Harradence was appointed Executive Vice President & President, Gas Distribution & Storage on March 5, 2023. She is responsible for the overall leadership and operations of Ontario-based Enbridge Gas, as well as Gazifère, which serves the Gatineau region of Québec. Prior to assuming her current role, Ms. Harradence was Senior Vice President & President, Gas Distribution and Storage from March 2022 to March 2023. Prior thereto, she was Senior Vice President and Chief Operations Officer of Enbridge’s Gas Transmission and Midstream business unit from June 2019 to March 2022 and Senior Vice President Operations, Gas Transmission and Midstream from February 2017 to June 2019.
Matthew A. Akman was appointed Executive Vice President, Corporate Strategy & President, Power on March 5, 2023. Mr. Akman is responsible for the overall leadership and operations of Enbridge’s power business and also leads our new energy technologies and corporate strategy efforts. Prior to assuming his current role, Mr. Akman was Senior Vice President, Corporate Strategy & President, Power from January 2023 to March 2023. Prior thereto, he was Senior Vice President, Strategy, Power & New Energy Technologies from October 2021 to December 2022, and Senior Vice President, Strategy & Power from June 2019 to October 2021. Mr. Akman joined Enbridge in early 2016 as our head of Corporate Strategy and also previously held responsibilities for Corporate Development and Investor Relations.
Reginald D. Hedgebeth was appointed Executive Vice President, External Affairs and Chief Legal Officer on January 1, 2024. Mr. Hedgebeth leads our legal, public affairs, communications & sustainability, corporate security and aviation teams across the organization. Prior to joining Enbridge, Mr. Hedgebeth served as Chief Legal Officer of Capital Group from January 2021 to June 2023, Executive Vice President, General Counsel and Chief Administrative Officer of Marathon Oil Corporation from April 2017 to December 2020 and, prior to its merger with Enbridge in 2017, General Counsel, Corporate Secretary and Chief Ethics and Compliance Officer for Spectra Energy.
Maximilian G. Chan was appointed Senior Vice President & Corporate Development Officer on March 1, 2022. He was later appointed to the Executive Leadership team on May 8, 2023. Mr. Chan is responsible for the oversight of mergers and acquisitions, capital allocation, investment review, integration and corporate growth objectives. Prior to assuming his current role, Mr. Chan was Vice President, Treasury and Head of Enterprise Risk for Enbridge from February 2020 to March 2022,and Vice President, Treasury from July 2018 to February 2020.
Laura J. Sayavedra was appointed Senior Vice President, Safety, Projects & Chief Administrative Officer on January 1, 2024. Ms. Sayavedra is responsible for the oversight of our safety, capital project execution, human resources, real estate and supply chain management functions. Prior to assuming her current role, Ms. Sayavedra was Senior Vice President, Safety & Reliability, Projects and Unify from March 2022 to December 2023. Prior to that, she led Finance Transformation at Enbridge, and prior to its merger with Enbridge in 2017, was also Vice President & Treasurer for Spectra Energy, and CFO of Spectra Energy Partners LP. She has held various finance, strategy, and business development executive leadership roles.
ADDITIONAL INFORMATION
Additional information about us is available on our website at www.enbridge.com, on SEDAR+ at www.sedarplus.ca and on EDGAR at www.sec.gov. The aforementioned information is made available in accordance with legal requirements and is not, unless otherwise specifically stated, incorporated by reference into this Annual Report on Form 10-K. We make available free of charge, through our website, annual reports on Form 10-K, quarterly reports on Form 10-Q and current reports on Form 8-K and amendments to those reports filed or furnished pursuant to Section 13(a) or 15(d) of the Exchange Act, as well as proxy statements, as soon as reasonably practicable after we electronically file such material with, or furnish it to, the SEC. Reports, proxy statements and other services,information filed with the SEC may also be obtained through the SEC’s website (www.sec.gov).
ENBRIDGE GAS INC.
Additional information about Enbridge Gas can be found in its annual information form, financial statements and MD&A for the year ended December 31, 2023, which have been filed with the securities commissions or similar authorities in each of the provinces of Canada. These documents contain detailed disclosure with respect to Enbridge Gas and are publicly available on SEDAR+ at www.sedarplus.ca. These documents are not, unless otherwise specifically stated, incorporated by reference into this Annual Report on Form 10-K.
ENBRIDGE PIPELINES INC.
Additional information about Enbridge Pipelines Inc. (EPI) can be found in its annual information form, financial statements and MD&A for the year ended December 31, 2023, which have been filed with the securities commissions or similar authorities in each of the provinces of Canada. These documents contain detailed disclosure with respect to EPI and are publicly available on SEDAR+ at www.sedarplus.ca. These documents are not, unless otherwise specifically stated, incorporated by reference into this Annual Report on Form 10-K.
WESTCOAST ENERGY INC.
Additional information about Westcoast can be found in its financial statements and MD&A for the year ended December 31, 2023, which have been filed with the securities commissions or similar authorities in each of the provinces of Canada. These documents contain detailed disclosure with respect to Westcoast and are publicly available on SEDAR+ at www.sedarplus.com. These documents are not, unless otherwise specifically stated, incorporated by reference into this Annual Report on Form 10-K.
ITEM 1A. RISK FACTORS
The following risk factors could materially and adversely affect our business, operations, financial results, market price or value of our securities. This list is not exhaustive, and we place no priority or likelihood based on order of presentation or grouping under sub-captions.
RISKS RELATED TO CLIMATE CHANGE
Climate change risks could adversely affect our reputation, strategic plan, business, operations and financial results, and these effects could be material.
Climate change is a systemic risk that presents both physical and transition risks to our organization. A summary of these risks is outlined below. Given the interconnected nature of climate change-related impacts, we also discuss these risks within the context of other risks impacting Enbridge throughout Item 1A. Risk Factors. Climate change and its associated impacts may also increase our exposure to, and magnitude of, other risks identified in Item 1A. Risk Factors. Our business, financial condition, results of operations, cash flows, reputation, access to and cost of capital or insurance, business plans or strategy may all be materially adversely impacted as a result of climate change and its associated impacts.
PHYSICAL RISKS
Climate-related physical risks, resulting from changing and more extreme weather, can damage our assets and affect the safety and reliability of our operations. Climate-related physical risks may be acute or chronic. Acute physical risks are those that are event-driven, including increased frequency and severity of extreme weather events, such as heavy snowfall, heavy rainfall, floods, landslides, fires, hurricanes, cyclones, tornados, tropical storms, ice storms, and extreme temperatures. Chronic physical risks are longer-term shifts in climate patterns, such as long-term changes in precipitation patterns, or sustained higher temperatures, which may cause sea level rises or chronic heat waves.
Our assets are exposed to potential damage or other negative impacts from these kinds of events, which could result in reduced revenue from business disruption or reduced capacity and may also lead to increased costs due to repairs and required adaptation measures. Such events may also result in personal injury, loss of life or damage to property and the environment. We have experienced operational interruptions and damage to our assets from such weather events in the past, and we expect to continue to experience climate-related physical risks in the future, potentially with increasing frequency or severity.
TRANSITION RISKS
Transition risks relate to the transition to a lower-emissions economy, which may increase our cost of operations, impact our business plans, and influence stakeholder decisions about our company, each of which could adversely impact our reputation, strategic plan, business, operations or financial results. These transition risks include the following categories:
•Policy and legal risks
Policy and legal risks may result from evolving government policy, legislation, regulations and regulatory decisions focused on climate change, as well as changing political and public opinion, stakeholder opposition, legal challenges, litigation and regulatory proceedings. Foreign and domestic governments continue to evaluate and implement policy, legislation, and regulations regarding reduction of GHG emissions, adaptation to climate change, and transition to a lower-carbon economy. Such policies, laws and regulations vary at the federal, state, provincial and municipal levels in which Enbridge operates and are continually evolving. The implementation of these measures may be accelerated by international multilateral agreements, increasing physical impacts of climate change, and changing political and public opinion. Enbridge is currently required to adhere to a number of carbon-pricing mechanisms, including explicit carbon prices (i.e., in BC) and implicit carbon prices (i.e., Canadian federal OBPS). In Canada, the federal government has proposed new clean electricity regulations and is considering options to cap and cut oil and gas distribution salessector GHG emissions, which may impact our business. Such evolving policy, legislation and regulation could impact commodity sales. Transportationdemand and the overall energy mix we deliver and may result in significant expenditures and resources, as well as increased costs for our customers. In recent years, there has been an increase in climate-related regulatory action and litigation which has the potential to adversely impact our reputation, business, operations and financial results.
•Technology risks
Our success in executing our strategic plan, including adapting to the energy transition over time and attaining our GHG emissions reduction goals and targets, depends, in part, on technology (including technology still under development), innovation and continued diversification with renewable power and other lower-carbon energy infrastructure as well as modernization of our infrastructure, all of which could require significant capital expenditures and resources, that could materially differ from our original estimates and expectations. There is also a risk that GHG emissions reduction technology does not materialize as expected, making it more difficult to reduce emissions, or that political or public opinion regarding such technologies continues to evolve.
•Market risks
Climate change concerns, increased demand for lower-carbon and zero-emissions energy, alternative and new energy sources and technologies, changing customer behavior and reduced energy consumption could impact the demand for our services revenuesor securities. In recent years, there has been a push toward certain investors decreasing the carbon intensity of their portfolios and pressure for banks and insurance providers to reduce or cease support for oil and natural gas and related infrastructure businesses and projects. Potential impacts include increased costs to manage these risks, adverse impacts to our access to and cost of capital, and reduced demand for, or value of, our securities. The pace and scale of the transition to a lower-carbon economy may pose a risk if Enbridge diversifies either too quickly or too slowly. Similarly, uncertainty in market signals, such as abrupt and unexpected shifts in energy costs and demands, including due to climate change concerns, can impact revenue through reduced throughput volumes on our pipeline transportation systems.
•Reputational risks
Companies across all sectors and industries are earnedfacing changing expectations or increasing scrutiny from stakeholders related to their approach to climate change and GHG emissions. Companies in the energy industry are experiencing stakeholder opposition to both existing and new infrastructure, as well as organized opposition to oil and natural gas extraction and shipment of oil and natural gas products. If we are not able to achieve our GHG emissions reduction goals and targets, are not able to meet future climate, emissions or other regulatory or reporting requirements, or are not able to meet or manage current and future expectations and issues regarding climate change that are important to our stakeholders, it could negatively impact our reputation and, in turn, our business, operations or financial results.
•Disclosure risks
Enbridge currently provides certain climate-related disclosures, and from time to time, establishes and publicly announces goals and commitments related to climate change, including reduction of GHG emissions. Standards and processes for climate-related disclosure, setting goals and targets, and measuring and reporting on progress are still developing for our sector and continue to evolve. Our internal controls and processes also continue to evolve, and our climate-related disclosures, goals and targets are based on assumptions that are subject to change. Aligning with evolving requirements has required and may continue to require us to incur significant costs. There can be no assurance that our current or future disclosures and goals, the pathways by which we plan to reach our goals, or the methodologies that we currently use to measure and report on progress, will align with new and evolving standards and processes, legal requirements or expectations of stakeholders. Such misalignment may result in reputational harm, regulatory action or other legal action.
RISKS RELATED TO OPERATIONAL DISRUPTION OR CATASTROPHIC EVENTS
Operation of complex energy infrastructure involves many hazards and risks that may adversely affect our business, financial results and the environment.
These operational risks include adverse weather conditions, natural disasters, accidents, the breakdown or failure of equipment or processes, and lower than expected levels of operating capacity and efficiency. These operational risks could be catastrophic in nature.
Operational risk is also intensified by climate change. Climate change presents physical risks that may affect the safety and reliability of our operations. These include acute physical risks, such as heavy snowfall, heavy rainfall, floods, landslides, fires, hurricanes, cyclones, tornados, tropical storms, ice storms, and extreme temperatures, and chronic physical risks, such as long-term changes in precipitation patterns, or sustained higher temperatures.
Our assets and operations are exposed to potential damage or other negative impacts from these operational risks, which could result in reduced revenue from business disruption or reduced capacity and may also lead to increased costs due to repairs and required adaptation measures. Such events have led to, and could in the future lead to, rupture or release of product from our pipeline systems and facilities, resulting in damage to property and the environment, personal injury or loss of life, which could result in substantial losses for which insurance may not be sufficient or available and for which we may bear part or all of the cost.
An environmental incident is an event that may cause environmental harm and could lead to increased operating and insurance costs, thereby negatively impacting earnings. An environmental incident could have lasting reputational impacts and could impact our ability to work with various stakeholders. For pipeline and storage assets located near populated areas, including residential communities, commercial business centers, industrial sites and other public gathering locations, the level of damage resulting from these events could be greater.
We have experienced such events in the past, and expect to continue to incur significant costs in preparing for or responding to operational risks and events. We expect to continue to experience climate-related physical risks, potentially with increasing frequency and severity, and we cannot guarantee that we will not experience catastrophic or other events in the future. In addition, we could be subject to litigation and significant fines and penalties from regulators in connection with any such events.
A service interruption could have a significant impact on our operations, and negatively impact financial results, relationships with stakeholders and our reputation.
A service interruption due to a major power disruption, curtailment of commodity supply, operational incident, security incident (cyber or physical), availability of gas supply or distribution or other reasons could have a significant impact on our operations and negatively impact financial results, relationships with stakeholders, our reputation or the safety of our end-use customers. Service interruptions that impact our crude oil and natural gas pipeline transportation businessesservices can negatively impact shippers’ operations and earnings as they are dependent on our services to move their product to market or fulfill their own contractual arrangements, and this has in the past and may again lead to claims against us. We have experienced, and may again experience, service interruptions, restrictions or other operational constraints, including in connection with the kinds of operational incidents referred to in the previous risk factor.
Our operations involve safety risks to the public and to our workers and contractors.
Several of our pipelines and distribution systems are operated in close proximity to populated areas and a major incident could result in injury or loss of life to members of the public. In addition, given the natural hazards inherent in our operations, our workers and contractors are subject to personal safety risks. A public safety incident or an injury or loss of life to our workers or contractors, which we have experienced in the past and, despite the precautions we take, may experience in the future, could result in reputational damage to us, material repair costs or increased operating and insurance costs.
Cyber attacks and other cybersecurity incidents pose threats to our technology systems and could materially adversely affect our business, operations, reputation or financial results.
Our business is dependent upon information systems and other digital technologies for controlling our plants, pipelines and other assets, processing transactions and summarizing and reporting results of operations. The secure processing, maintenance and transmission of information is critical to our operations.
Cybersecurity risks have increased in recent years as a result of the proliferation of new technologies and the increased sophistication of cyber attacks and financially motivated cybercrime, as well as due to international and domestic political factors including geopolitical tensions, armed hostilities, war, civil unrest, sabotage, terrorism and state-sponsored or other cyber espionage. Human error or malfeasance can also include power production revenues fromcontribute to a cyber incident, and cyber attacks can be internal as well as external and occur at any point in our portfoliosupply chain. Because of renewablethe critical nature of our infrastructure and our use of information systems and other digital technologies to control our assets, we face a heightened risk of cyber attacks, such as ransomware, theft, misplaced or lost data, programming errors, phishing attacks, denial of service attacks, acts of vandalism, computer viruses, malware, hacking, malicious attacks, software vulnerabilities, employee errors and/or malfeasance, or other attacks, security or data breaches or other cybersecurity incidents. Cyber threat actors have attacked and threatened to attack energy infrastructure, and various government agencies have increasingly stressed that these attacks are targeting critical infrastructure, including pipelines, public utilities, and power generation, assets. Forand are increasing in sophistication, magnitude, and frequency. Additionally, these risks may escalate during periods of heightened geopolitical tensions. New cybersecurity legislation, regulations and orders have been recently implemented or proposed, resulting in additional actual and anticipated regulatory oversight and compliance requirements, which will require significant internal and external resources. We cannot predict the potential impact to our transportationbusiness of potential future legislation, regulations or orders relating to cybersecurity.
We have experienced an increase in the number of attempts by external parties to access our systems or our company data without authorization, and we expect this trend to continue. Although we devote significant resources and security measures to prevent unwanted intrusions and to protect our systems and data, whether such data is housed internally or by external third parties, we and our third party vendors have experienced and expect to continue to experience cyber attacks of varying degrees in the conduct of our business. To-date, these prior cyber attacks have not, to our knowledge, had a material adverse effect on our business, operations or financial results. However, there is a risk that any such incidents could have a material adverse effect on us in the future.
Our technology systems or those of our vendors or other service providers are expected to become the target of further cyber attacks or security breaches which could compromise our data and systems or our access thereto by us, our customers or others, affect our ability to correctly record, process and report transactions, result in the loss of information, or cause operational disruption or incidents. There can be no assurance that our business continuity plans will be completely effective in avoiding disruption and business impacts.Furthermore, we and some of our third-party service providers (who may in turn also use third-party service providers) collect, process or store sensitive data in the ordinary course of our business, including personal information of our employees, residential gas distribution customers, land owners and investors, as well as intellectual property or other proprietary business information of ours or our customers or suppliers.We and some of our third-party services providers will process increasing amounts of personal information upon the closing of the previously announced acquisitions of gas utilities in the US, due to their large residential customer bases.
As a result of the foregoing, we could experience loss of revenues, repair, remediation or restoration costs, regulatory action, fines and penalties, litigation, breach of contract or indemnity claims, cyber extortion, ransomware, implementation costs for additional security measures, loss of customers, customer dissatisfaction, reputational harm, be liable under laws that protect the privacy of personal information, other negative consequences, or other costs or financial loss.These risks may be heightened, and the consequences magnified, upon closing of the Acquisitions. Regardless of the method or form of cyber attack or incident, any or all of the above could materially adversely affect our reputation, business, operations or financial results.
In addition, a cyber attack could occur and persist for an extended period without detection. Any investigation of a cyber attack or other security incident may be inherently unpredictable, and it would take time before the completion of any investigation and availability of full and reliable information. During such time, we may not know the extent of the harm or how best to remediate it, and certain errors or actions could be repeated or compounded before they are discovered and remediated, all or any of which could further increase the costs and consequences of a cyber attack or other security incident, and our remediation efforts may not be successful. The inability to implement, maintain and upgrade adequate safeguards could materially and adversely affect our results of operations, cash flows, and financial condition. Moreover, recent rulemakings may require us to disclose information about a cybersecurity incident before it has been completely investigated or remediated in full or even in part. As cyber attacks continue to evolve, we may be required to expend significant additional resources to continue to modify or enhance our protective measures or to investigate and remediate any information security vulnerabilities.
Furthermore, media reports about a cyber attack or other significant security incident affecting Enbridge, whether accurate or not, or, under certain circumstances, our failure to make adequate or timely disclosures to the public, law enforcement, other regulatory agencies or affected individuals following any such event, whether due to delayed discovery or otherwise, could negatively impact our operating results and result in other negative consequences, including damage to our reputation or competitiveness, harm to our relationships with customers, partners, suppliers, investors, and other third parties, interruption to our management, remediation or increased protection costs, significant litigation or regulatory action, fines or penalties, all of which could materially adversely affect our business, operations, reputation or financial results.
Terrorist attacks and threats, escalation of military activity in response to these attacks or acts of war, and other civil unrest or activism could adversely affect our business, operations or financial results.
Terrorist attacks and threats (which may take the form of cyber attacks), escalation of military activity, armed hostilities, war, sabotage, or civil unrest or activism may have significant effects on general economic conditions and may cause fluctuations in consumer confidence and spending and market liquidity, each of which could adversely affect our business. Future terrorist attacks, rumors or threats of war, actual conflicts involving the US or Canada, or military or trade disruptions may significantly affect our operations and those of our customers. Strategic critical infrastructure targets, such as energy-related assets, operatingare at greater risk of cyber attack and may be at greater risk of other future attacks than other targets in the US and Canada. Enbridge’s infrastructure and projects under market-based arrangements, revenuesconstruction could be direct targets or indirect casualties of a cyber or physical attack. In addition, increased environmental activism against pipeline construction and operation could potentially result in work delays, reduced demand for our products and services, new legislation or public policy or increased stringency thereof, or denial or delay of permits and rights-of-way.
Pandemics, epidemics or infectious disease outbreaks, such as the COVID-19 pandemic, may adversely affect local and global economies and our business, operations or financial results.
Disruptions caused by pandemics, epidemics or infectious disease outbreaks could materially adversely affect our business, operations, financial results and forward-looking expectations. Governments' emergency measures to combat the spread could include restrictions on business activity and travel, as well as requirements to isolate or quarantine. The duration and magnitude of such impacts will depend on many factors that we may not be able to accurately predict. COVID-19 and government responses interrupted business activities and supply chains, disrupted travel, and contributed to significant volatility in the financial and commodity markets.
Disruptions related to pandemics, epidemics or infectious disease outbreaks could have the effect of heightening many of the other risks described in this Item 1A. Risk Factors.
RISKS RELATED TO OUR BUSINESS AND INDUSTRY
There are driven byutilization risks with respect to our assets.
With respect to our Liquids Pipelines assets, we are exposed to throughput risk on the Canadian Mainline, and we are exposed to throughput risk under certain tolling agreements applicable to other Liquids Pipelines assets, such as the Lakehead System. A decrease in volumes transported can directly and adversely affect our revenues and earnings. Factors such as changing market fundamentals, capacity bottlenecks, regulatory restrictions, maintenance and operational incidents on our system and upstream or downstream facilities, and increased competition can all impact the utilization of our assets. Market fundamentals, such as commodity prices and price differentials, weather, gasoline price and consumption, alternative and new energy sources and technologies, and global supply disruptions outside of our control can impact both the supply of and demand for crude oil and other liquid hydrocarbons transported on our pipelines.
With respect to our Gas Transmission and Midstream assets, gas supply and demand dynamics continue to change due to shifts in regional and global production and consumption. These shifts can lead to fluctuations in commodity prices and price differentials, which could result in our system not being fully utilized in some areas. Other factors affecting system utilization include operational incidents, regulatory restrictions, system maintenance, and increased competition.
With respect to our Gas Distribution and Storage assets, customers are billed on both a fixed charge and volumetric basis and our ability to collect the total revenue requirement (the cost of providing service, including a reasonable return to the utility) depends on achieving the forecast distribution volume established in the rate-making process. The probability of realizing such volume is contingent upon four key forecast variables: weather, economic conditions, pricing of competitive energy sources and growth in the number of customers. Weather is a significant driver of delivery volumes, given that a significant portion of our Gas Distribution customer base uses natural gas for space heating. Distribution volume may also be impacted by the increased adoption of energy efficient technologies, along with more efficient building construction, that continue to place downward pressure on consumption. In addition, conservation efforts by customers may further contribute to a decline in annual average consumption. Sales and transportation service to large volume commercial and industrial customers is more susceptible to prevailing economic conditions. As well, the pricing of competitive energy sources affects volume distributed to these sectors as some customers have the ability to switch to an alternate fuel. Even in those circumstances where we attain our respective total forecast distribution volume, our Gas Distribution business may not earn its expected ROE due to other forecast variables, such as the mix between the higher margin residential and commercial sectors and the corresponding tollslower margin industrial sector. Our Gas Distribution business remains at risk for the actual versus forecast large volume contract commercial and industrial volumes.
With respect to our Renewable Power Generation assets, earnings from these assets are highly dependent on weather and atmospheric conditions as well as continued operational availability of these energy producing assets. While the expected energy yields for Renewable Power Generation projects are predicted using long-term historical data, wind and solar resources are subject to natural variation from year-to-year and from season-to-season. Any prolonged reduction in wind or solar resources at any of the Renewable Power Generation facilities could lead to decreased earnings and cash flows. Additionally, inefficiencies or interruptions of Renewable Power Generation facilities due to operational disturbances or outages resulting from weather conditions or other factors, could also impact earnings.
Our assets vary in age and were constructed over many decades which causes our inspection, maintenance or repair costs to increase.
Our pipelines vary in age and were constructed over many decades. Pipelines are generally long-lived assets, and pipeline construction and coating techniques have changed over time. Depending on the era of construction and construction techniques, some assets require more frequent inspections, which has resulted in and is expected to continue to result in increased maintenance or repair expenditures in the future. Any significant increase in these expenditures could adversely affect our business, operations or financial results.
Competition may result in a reduction in demand for our services, fewer project opportunities or assumption of risk that results in weaker or more volatile financial performance than expected.
Our Liquids Pipelines business faces competition from competing carriers available to ship liquid hydrocarbons to markets in Canada, the US and internationally and from proposed pipelines that seek to access basins and markets currently served by our Liquids Pipelines. Competition among existing pipelines is based primarily on the cost of transportation, access to supply, the quality and reliability of service, contract carrier alternatives and proximity to markets. The liquids transported in our pipelines currently, or are expected to increasingly, compete with other emerging alternatives for end-users, including, but not limited to, electricity, electric batteries, biofuels, and hydrogen. Additionally, we face competition from alternative storage facilities. Our natural gas transmission and storage businesses compete with similar facilities that serve our supply and market areas in the transmission and storage of natural gas. The natural gas transported in our business also competes with other forms of energy available to our customers and end-users, including electricity, coal, propane, fuel oils, and renewable energy. Our Renewable Power Generation business faces competition in the procurement of long-term power purchase agreements and from other fuel sources in the markets in which we operate. Competition in all of our businesses, including competition for new project development opportunities, could have a negative impact on our business, financial condition or results of operations.
Completion of our secured projects and maintenance programs are subject to various regulatory, operational and market risks, which may affect our ability to drive long-term growth.
Our project execution continues to face challenges with intense scrutiny on regulatory and environmental permit applications, politicized permitting, public opposition including protests, action to repeal permits, and resistance to land access. We have experienced permit denials, in particular, in relation to necessary maintenance on the Line 5 Pipeline on the Bad River Reservation in northern Wisconsin based on a stated desire of the Bad River Band to shut down the pipeline.
Continued challenges with global supply chains have created unpredictability in materials cost and availability. Labor shortages and inflationary pressures have increased costs of engineering and construction services.
Other events that can and have delayed project completion and increased anticipated costs include contractor or supplier non-performance, extreme weather events or geological factors beyond our control.
Changing expectations of stakeholders regarding ESG and climate change practices could erode stakeholder trust and confidence, damage our reputation and influence actions or decisions about our company and industry and have negative impacts on our business, operations or financial results.
Companies across all sectors and industries are facing changing expectations or increasing scrutiny from stakeholders related to their approach to ESG matters of greatest relevance to their business and to their stakeholders. For energy companies, climate change, GHG emissions, safety and stakeholder and Indigenous relations remain primary focus areas, while other environmental elements such as biodiversity, human rights, and supply chain are ascendant. Companies in the energy industry are experiencing stakeholder opposition to new and existing infrastructure, as well as organized opposition to oil and natural gas extraction and shipment of oil and natural gas products. Changing expectations of our practices and performance across these ESG areas may impose additional costs or create exposure to new or additional risks. We are also exposed to the risk of higher costs, delays, project cancellations, loss of ability to secure new growth opportunities, new restrictions or the cessation of operations of existing pipelines due to increasing pressure on governments and regulators, and legal action, such as the legal challenges to the operation of Line 5 in Michigan and Wisconsin.
Our operations, projects and growth opportunities require us to have strong relationships with key stakeholders, including local communities, Indigenous groups and others directly impacted by our activities, as well as governments, regulatory agencies, investors and investor advocacy groups, investment funds, financial institutions, insurers and others, which are increasingly focused on ESG practices and performance. Enhanced public awareness of climate change has driven an increase in demand for lower-carbon and zero-emissions energy. There have been efforts in recent years affecting the investment community, including certain investors increasing investments in lower-carbon assets operating under take-or-pay contracts, revenues reflectand businesses while decreasing the carbon intensity of their portfolios through, among other measures, divestments of companies with high exposure to GHG-intensive operations and products. Certain stakeholders have also pressured commercial and investment banks and insurance providers to reduce or stop financing and providing insurance coverage to oil and natural gas and related infrastructure businesses and projects. Managing these risks requires significant effort and resources. Potential impacts could also include changing investor sentiment regarding investment in Enbridge, which could impair our access to and increase our cost of capital, including penalties associated with our sustainability-linked financing and could adversely impact demand for, or value of, our securities.
Over the past year, geopolitical uncertainty, slowing Canadian and US economies and continuing inflationary pressures have underscored the critical need for access to secure, affordable energy.
The pace and scale of the transition to a lower-emission economy may pose a risk if Enbridge diversifies either too quickly or too slowly. Similarly, unexpected shifts in energy demands, including due to climate change concerns, can impact revenue through reduced throughput volumes on our pipeline transportation systems.
We have long been committed to strong ESG practices, performance and reporting, and in 2020 introduced a set of ESG goals to strengthen transparency and accountability. The goals include increasing diversity and inclusion within our organization and reducing GHG emissions from our operations to net-zero by 2050, with corporate and business unit action plans aligned to our strategic priority to adapt to the energy transition over time. The costs associated with meeting our ESG goals, including our GHG emissions reduction goals, could be significant. There is also a risk that some or all of the expected benefits and opportunities of achieving our ESG goals may fail to materialize, may cost more than anticipated to achieve, may not occur within the anticipated time periods or may no longer meet changing stakeholder expectations. Similarly, there is a risk that emissions reduction technologies do not materialize as expected making it more difficult to reduce emissions. If we are not able to achieve our ESG goals, are not able to meet current and future climate, emissions or related reporting requirements of regulators, or are unable to meet or manage current and future expectations regarding issues important to investors or other stakeholders (including those related to climate change), it could erode stakeholder trust and confidence, which could negatively impact our reputation, business, operations or financial results.
Our forecasted assumptions may not materialize as expected, including on our expansion projects, acquisitions and divestitures.
We evaluate expansion projects, acquisitions and divestitures on an ongoing basis. Planning and investment analysis is highly dependent on accurate forecasting assumptions and to the extent that these assumptions do not materialize, financial performance may be lower or more volatile than expected. Volatility and unpredictability in the economy, both locally and globally, and changes in cost estimates, project scoping and risk assessment could result in a loss of profits. Similarly, uncertainty in market signals, such as abrupt and unexpected shifts in energy costs and demands, as we saw in 2020 resulting from the COVID-19 pandemic, have impacted, and may in the future impact, revenue through reduced throughput volumes on our pipeline transportation systems.
One or all of the Acquisitions may not occur on the terms contemplated in the applicable Purchase and Sale Agreement or at all, or may not occur within the expected time frame, which may negatively affect the benefits we expect to obtain from the Acquisitions.
We cannot provide any assurance that the Acquisitions will be completed in the manner, on the terms and on the time frame currently anticipated, or at all. Completion of each of the underlying contract for servicesAcquisitions is subject to the satisfaction or capacity. For rate-regulated assets, revenueswaiver of a number of conditions as set forth in the applicable Purchase and Sale Agreement that are charged in accordance with tolls established bybeyond our control and may prevent, delay or otherwise materially adversely affect its completion.
The success of the regulator, and in most cost-of-service based arrangements are reflective ofAcquisitions will depend on, among other things, our costability to provideintegrate the service plus a regulator-approved rate of return. Higher transportation and other services revenues reflected increased throughput onUS gas utilities into our core liquids pipeline assets combined with the incremental revenues associated with assets placed into service over the past two years.
Gas distribution sales revenues are recognizedbusiness in a manner consistentthat facilitates growth opportunities and achieves anticipated results. There is a significant degree of difficulty and management distraction inherent in the process of integrating an acquisition, including challenges integrating certain operations and functions (including regulatory functions), technologies, organizations, procedures, policies and operations, addressing differences in the business cultures of Enbridge and the US gas utilities and retaining key personnel. The integration may be complex and time consuming and involve delays or additional and unforeseen expenses. The integration process and other disruptions resulting from the Acquisitions may also disrupt our ongoing business.
Any failure to realize the anticipated benefits of the Acquisitions, additional unanticipated costs or other factors could negatively impact our earnings or cash flows, decrease or delay any beneficial effects of the Acquisitions and negatively impact our business, financial condition and results of operations.
Our insurance coverage may not fully cover our losses in the event of an accident, natural disaster or other hazardous event, and we may encounter increased cost arising from the maintenance of, or lack of availability of, insurance.
Our operations are subject to many hazards inherent in our industry as described in this Item 1A. Risk Factors. We maintain an insurance program for us, our subsidiaries and certain of our affiliates to mitigate a certain portion of our risks. However, not all potential risks arising from our operations are insurable, or are insured by us as a result of availability, high premiums and for various other reasons. Enbridge self-insures a significant portion of certain risks through our wholly-owned captive insurance subsidiaries, and Enbridge’s insurance coverage is subject to terms and conditions, exclusions and large deductibles or self-insured retentions which may reduce or eliminate coverage in certain circumstances.
Enbridge’s insurance policies are generally renewed on an annual basis and, depending on factors such as market conditions, the premiums, terms, policy limits and/or deductibles can vary substantially. We can give no assurance that we will be able to maintain adequate insurance in the future at rates or on other terms we consider commercially reasonable. In such case, we may decide to self-insure additional risks.
A significant self-insured loss, uninsured loss, a loss significantly exceeding the limits of our insurance policies, a significant delay in the payment of a major insurance claim, or the failure to renew insurance policies on similar or favorable terms could materially and adversely affect our business, financial condition and results of operations.
Our business is exposed to changes in market prices including interest rates and foreign exchange rates. Our risk management policies cannot eliminate all risks and may result in material financial losses. In addition, any non-compliance with our risk management policies could adversely affect our business, operations or financial results.
Our use of debt financing exposes us to changes in interest rates on both future fixed rate debt issuances and floating rate debt. While our financial results are denominated in Canadian dollars, many of our businesses have foreign currency revenues or expenses, particularly the US dollar. Changes in interest rates and foreign exchange rates could materially impact our financial results.
We use financial derivatives to manage risks associated with changes in foreign exchange rates, interest rates, commodity prices, power prices and our share price to reduce volatility of our cash flows. Based on our risk management policies, substantially all of our financial derivatives are associated with an underlying asset, liability and/or forecasted transaction and not intended for speculative purposes.
These policies cannot, however, eliminate all risk, including unauthorized trading. Although this activity is monitored independently by our Risk Management function, we can provide no assurance that we will detect and prevent all unauthorized trading and other violations, particularly if deception, collusion or other intentional misconduct is involved, and any such violations could adversely affect our business, operations or financial results.
To the extent that we hedge our exposure to market prices, we will forego the benefits we would otherwise experience if these were to change in our favor. In addition, hedging activities can result in losses that might be material to our financial condition, results of operations and cash flows. Such losses have occurred in the past and could occur in the future. See Part II, Item 7A. Quantitative and Qualitative Disclosures about Market Risk and Item 8. Financial Statements and Supplementary Data for a discussion of our derivative instruments and related hedging activities.
We rely on access to short-term and long-term capital markets to finance capital requirements and support liquidity needs. Cost effective access to those markets can be affected, particularly if we or our rated subsidiaries are unable to maintain an investment-grade credit rating.
A significant portion of our consolidated asset base is financed with debt. The maturity and repayment profile of debt used to finance investments often does not correlate to cash flows from assets. Accordingly, we rely on access to both short-term and long-term capital markets as a source of liquidity for capital requirements not satisfied by cash flows from operations and to refinance investments originally financed with debt. Our senior unsecured long-term debt is currently rated investment-grade by various rating agencies. If the rating agencies were to rate us or our rated subsidiaries below investment-grade, our borrowing costs would increase, perhaps significantly. Consequently, we would likely be required to pay a higher interest rate in future financings and our potential pool of investors and funding sources could decrease.
We maintain revolving credit facilities at various entities to backstop commercial paper programs, for borrowings and for providing letters of credit. These facilities typically include financial covenants and failure to maintain these covenants at a particular entity could preclude that entity from accessing the credit facility, which could impact liquidity. Furthermore, if our short-term debt rating were to be downgraded, access to the commercial paper market could be significantly limited. Although this would not affect our ability to draw under our credit facilities, borrowing costs could be significantly higher.
If we are not able to access capital at competitive rates or at all, our ability to finance operations and implement our strategy may be affected. An inability to access capital on favorable terms or at all may limit our ability to pursue enhancements or acquisitions that we may otherwise rely on for future growth or to refinance our existing indebtedness. Any downgrade or other event negatively affecting the credit ratings of our subsidiaries could make their costs of borrowing higher or access to funding sources more limited, which in turn could increase our need to provide liquidity in the form of capital contributions or loans to such subsidiaries, thus reducing the liquidity and borrowing availability of the consolidated group.
Our Liquids Pipelines growth rate and results may be indirectly affected by commodity prices.
Wide commodity price basis between Western Canada and global tidewater markets have negatively impacted producer netbacks and margins in the past years that largely resulted from pipeline infrastructure takeaway capacity from producing regions in Western Canada and North Dakota which are operating at capacity. A protracted long-term outlook for low crude oil prices could result in delay or cancellation of future projects.
The tight conventional oil plays of Western Canada, the Permian Basin, and the Bakken region of North Dakota have short cycle break-even time horizons, typically less than 24 months, and high decline rates that can be well managed through active hedging programs and are positioned to react quickly to market signals. Accordingly, during periods of comparatively low prices, drilling programs, unsupported by hedging programs, will be reduced and as such, supply growth from tight oil basins may be lower, which may impact volumes on our pipeline systems.
Our Energy Services and Gas Transmission and Midstream results may be adversely affected by commodity price volatility.
Within our US Midstream assets, we hold investments in DCP and Aux Sable, which are engaged in the businesses of gathering, treating, processing and selling natural gas and natural gas liquids. The financial results of these businesses are directly impacted by changes in commodity prices. To a lesser degree, the financial results of our US Transmission business are subject to fluctuation in power prices which impact electric power costs associated with operating compressor stations.
Energy Services generates margin by capitalizing on quality, time and location differentials when opportunities arise. Changing market conditions that impact the prices at which we buy and sell commodities have in the past limited margin opportunities and impeded Energy Services' ability to cover capacity commitments and could do so again in the future. Other market conditions, such as backwardation, have likewise limited margin opportunities.
We are exposed to the credit risk of our customers, counterparties, and vendors.
We are exposed to the credit risk of multiple parties in the ordinary course of our business. Generally, our customers are rated investment-grade, are otherwise considered creditworthy or provide us security to satisfy credit concerns. However, we cannot predict to what extent our business would be impacted by deteriorating conditions in the economy, including possible declines in the creditworthiness of our customers, vendors, or counterparties. It is possible that payment or performance defaults from these entities, if significant, could adversely affect our earnings and cash flows.
Our business requires the retention and recruitment of a skilled and diverse workforce, and difficulties in recruiting and retaining our workforce could result in a failure to implement our business plans.
Our operations and management require the retention and recruitment of a skilled and diverse workforce, including engineers, technical personnel, other professionals and executive officers and senior management. We and our affiliates compete with other companies in the energy industry, and for some jobs the broader labor market, for this skilled workforce. If we are unable to retain current employees and/or recruit new employees of comparable knowledge and experience, our business could be negatively impacted. In addition, we could experience increased costs to retain and recruit these professionals.
RISKS RELATED TO GOVERNMENT REGULATION AND LEGAL RISKS
Many of our operations are regulated and failure to secure timely regulatory approval for our proposed projects, or loss of required approvals for our existing operations, could have a negative impact on our business, operations or financial results.
The nature and degree of regulation and legislation affecting permitting and environmental review for energy infrastructure companies in Canada and the US continues to evolve.
Within the US and in Canada, pipeline companies continue to face opposition from anti-energy/anti-pipeline activists, Indigenous and tribal groups and communities, citizens, environmental groups, and politicians concerned with the underlying rate-setting mechanismsafety of pipelines and their potential environmental effects. In the US, the EPA redefined the Waters of the United States to align with the U.S. Supreme Court’s May 25, 2023 Sackett v. EPA decision that limits the scope of waters regulated by the Clean Water Act, issued new rules under Section 401 of the Clean Water Act broadening the scope of state review for water quality certifications, released rules on methane control and reporting, Cross-state Ozone Pollution (The Good Neighbor Plan), and the Power Plant Rule. The Council for Environmental Quality published immediately applicable guidance for conducting analyses under the National Environmental Policy Act (NEPA), followed by a new rule governing implementation of NEPA in federal actions that may significantly change environmental scope and cost assessments. The FERC has focused on the relationship between natural gas and electric power generation, particularly in connection with reliability issues during severe weather events. The PHMSA issued a draft rule on leak detection and repair. Federal agencies also issued guidance on how environmental justice concerns should be considered and addressed. Many other regulations adopted during the previous US presidential administration are being challenged in multiple courts and some have been overturned by reviewing courts. The current US administration may take further action to modify or reverse regulations that were promulgated by the previous US administration.
In March of 2023, the Supreme Court of Canada heard the Attorney General of Canada’s appeal of the Alberta Court of Appeal’s non-binding decision that the federal Impact Assessment Act (IAA) is unconstitutional. The IAA includes impact assessment requirements that could apply to either federally or provincially regulated pipeline projects that fall within prescribed criteria or that the federal Minister of Environment otherwise designates for review. The potential for any pipeline project to be subject to IAA requirements adds significant uncertainty as to regulatory timelines and outcomes. The Alberta Court of Appeal found that the IAA is an impermissible federal overreach into provincial jurisdiction that would amount to a de facto expropriation of provincial natural resources and proprietary interests by the federal government. The Supreme Court of Canada issued its decision on October 13, 2023, with a majority of the court (5-2) finding that the federal impact assessment regime is outside of the federal Parliament’s authority and that the IAA should focus more narrowly on effects within federal jurisdiction. The decision is a non-binding advisory reference case, so the IAA and associated regulations are not "struck down"; however, the federal government will take the Supreme Court of Canada’s guidance and in collaboration with provinces and Indigenous groups, will seek to amend the IAA so that it is constitutional. The resulting amendments could impact the risks and timing of potential future regulatory approvals and the scope of federal review of intraprovincial pipeline projects.
Our operations are subject to numerous environmental laws and regulations, including those relating to climate change, GHG emissions and climate-related disclosure, compliance with which may require significant capital expenditures, increase our cost of operations, and affect or limit our business plans, or expose us to environmental liabilities.
We are subject to numerous environmental laws and regulations affecting many aspects of our past, current, and future operations, including air emissions, water and soil quality, wastewater discharges, solid waste and hazardous waste.
If we are unable to obtain or maintain all required environmental regulatory approvals and permits for our operating assets and projects or if there is a delay in obtaining any required environmental regulatory approvals or permits, the operation of existing facilities or the development of new facilities could be prevented, delayed, or become subject to additional costs. Failure to comply with environmental laws and regulations may result in the imposition of civil or criminal fines, penalties and injunctive measures affecting our operating assets. We expect that changes in environmental laws and regulations, including those related to climate change, GHG emissions and climate-related disclosure, could result in a material increase in our cost of compliance with such laws and regulations, such as costs to monitor and report our emissions and install new emission controls to reduce emissions. We may not be able to include some or all of such increased costs in the rates charged for utilization of our pipelines or other facilities.
Our operations are subject to operational regulation and other requirements, including compliance with easements and other land tenure documents, and failure to comply with applicable regulations and other requirements could have a negative impact on our reputation, business, operations or financial results.
Operational risks relate to compliance with applicable operational rules and regulations mandated by governments, applicable regulatory authorities, or other requirements that may be found in easements, permits, or other agreements that provide a legal basis for our operations, breaches of which could result in fines, penalties, awards of damages, operating restrictions (including shutdown of lines) and an overall increase in operating and compliance costs.
We do not own all of the regulator. Revenues generatedland on which our pipelines, facilities and other assets are located and we obtain the rights to construct and operate our pipelines and other assets from third parties or government entities. In addition, some of our pipelines, facilities and other assets cross Indigenous lands pursuant to rights-of-way or other land tenure interests. Our loss of these rights, including through our inability to renew them as they expire, could have an adverse effect on our reputation, operations and financial results. We have experienced litigation in relation to certain Line 5 and other easements; refer to Part II. Item 7. Management's Discussion and Analysis of Financial Condition and Results of Operations - Legal and Other Updates.
Regulatory scrutiny over our assets and operations has the potential to increase operating costs or limit future projects. Regulatory enforcement actions issued by regulators for non-compliant findings can increase operating costs and negatively impact reputation. Potential regulatory changes and legal challenges could have an impact on our future earnings from existing operations and the cost related to the construction of new projects. Regulators' future actions may differ from current expectations, or future legislative changes may impact the regulatory environments in which we operate. While we seek to mitigate operational regulation risk by actively monitoring and consulting on potential regulatory requirement changes with the respective regulators directly, or through industry associations, and by developing response plans to regulatory changes or enforcement actions, such mitigation efforts may be ineffective or insufficient. While we believe the safe and reliable operation of our assets and adherence to existing regulations is the best approach to managing operational regulatory risk, the potential remains for regulators or other government officials to make unilateral decisions that could disrupt our operations or have an adverse financial impact on us.
Our operations are subject to economic regulation and failure to secure regulatory approval for our proposed or existing commercial arrangements could have a negative impact on our business, operations or financial results.
Our Liquids Pipelines, Gas Transmission and Gas Distribution assets face economic regulation risk. Broadly defined, economic regulation risk is the risk that governments or regulatory agencies change or reject proposed or existing commercial arrangements or policies, including permits and regulatory approvals for both new and existing projects or agreements, upon which future and current operations are dependent. Our Mainline System, other liquids pipelines, gas transmission and distribution assets are subject to the actions of various regulators, including the CER, the FERC, and the OEB with respect to the rates, tariffs, and tolls for these assets. The changing or rejecting of commercial arrangements, including decisions by regulators on the applicable permits and tariff structure or changes in interpretations of existing regulations by courts or regulators such as with respect to the negotiated settlements applicable to our Mainline System, could have an adverse effect on our revenues and earnings.
Our Renewable Power Generation assets in Canada and the US are subject to directives, regulations, and policies of federal, provincial and state governments. These measures are variable and can change as a result of, among other things, tax rate changes and a change in the government, which can have a negative impact on our commercial arrangements.
Our Renewable Power Generation assets in Europe (France, Germany and the UK) are also subject to the directives, regulations and policies established and enforced by the gas distribution businessesEU and the UK government. These measures are primarily drivenvariable and can include price controls, caps and demand reduction goals, all of which can have a negative impact on our revenues and earnings.
We are subject to changes in our tax rates, the adoption of new US, Canadian or international tax legislation or exposure to additional tax liabilities.
We are subject to taxes in the US, Canada and numerous foreign jurisdictions. Due to economic and political conditions, tax rates in various jurisdictions may be subject to significant change. Our effective tax rates could be affected by volumes delivered,changes in the mix of earnings in countries with differing statutory tax rates, changes in the valuation of deferred tax assets and liabilities, or changes in tax laws or their interpretation. In particular, Canada and other OECD countries have introduced a minimum tax rate to be applied on a global basis.The final legislation and list of the participating countries remains uncertain.In addition, the US enacted the Inflation Reduction Act in 2022 however key regulations still remain outstanding that could impact the interpretation of that act. All of these measures could cause our effective tax rate to increase.
We are also subject to the examination of our tax returns and other tax matters by the US Internal Revenue Service, the Canada Revenue Agency and other tax authorities and governmental bodies. We regularly assess the likelihood of an adverse outcome resulting from these examinations to determine the adequacy of our provision for taxes. There can be no assurance as to the outcome of these examinations. If our effective tax rates were to increase, particularly in the US or Canada, or if the ultimate determination of our taxes owed is for an amount in excess of amounts previously accrued, our financial condition and operating results could be materially adversely affected.
We are involved in numerous legal proceedings, the outcomes of which vary with weatherare uncertain, and customer compositionresolutions adverse to us could adversely affect our financial results.
We are subject to numerous legal proceedings. In recent years, there has been an increase in climate and utilization,disclosure-related litigation against governments as well as regulator-approved rates.companies involved in the energy industry. There is no assurance that we will not be impacted by such litigation, or by other legal proceedings. Litigation is subject to many uncertainties, and we cannot predict the outcome of individual matters with assurance. It is reasonably possible that the final resolution of some of the matters in which we are involved or new matters could require additional expenditures, in excess of established reserves, over an extended period of time and in a range of amounts that could adversely affect our financial results or affect our reputation. Refer to Part II. Item 7. Management's Discussion and Analysis of Financial Condition and Results of Operations - Legal and Other Updates for a discussion of certain legal proceedings with recent developments.
ITEM 1B. UNRESOLVED STAFF COMMENTS
None.
ITEM 1C. CYBERSECURITY
Cybersecurity risk management, strategy and governance
Risk oversight and management is a key role for the Board and its committees. The costBoard is responsible for identifying and understanding Enbridge’s principal risks and ensuring that appropriate systems are implemented to monitor, manage and mitigate those risks. The committees of the Board have oversight over risks within their respective mandates.
Oversight of cybersecurity is integrated into the responsibilities of the Board. The Audit, Finance and Risk Committee (the AFRC) provides oversight of cybersecurity matters, particularly as they relate to financial risk and controls, integrity of financial data and public disclosures, and security of the cyber landscape across data and digital. The Safety and Reliability Committee (SRC) has oversight responsibility for security (physical, data and cyber) including as it relates to operational risk and controls, safety, operations integrity and reliability, and asset operations.
Management provides regular reports to the Board at every meeting to review our top risks, identify trends and help manage risk. This includes quarterly reports to the AFRC and SRC on cybersecurity matters. In addition, on an annual basis management prepares and provides to the Board and its committees a corporate risk assessment (CRA), which analyzes and prioritizes enterprise-wide risks (including cybersecurity), highlighting top risks and trends. The annual CRA is an integrated enterprise-wide process. We assess and rank risks based on impact and probability, and we strive to ensure that mitigation measures are appropriately designed, prioritized and resourced. The CRA report is reviewed by the Board committees with responsibility for the risk category relevant to their mandate and is provided to the Board, which coordinates Enbridge's overall risk management approach. Complementary to the CRA, management prepares and provides to the SRC an annual top operational risk report that highlights the highest consequence operational risks across Enbridge and includes further detail on the risks and their treatment. This information helps inform the Board about the potential impact of top operational risks and that appropriate treatments are in place to manage those risks.
Cybersecurity has been identified as a top risk as attacks against participants in our industry have continued to increase in sophistication and frequency over the years. Cybersecurity risk is described in Item 1A. Risk Factors.
Enbridge’s management is responsible for the implementation of risk management strategies and monitoring performance. The technology and information services (TIS) function is centralized under the Senior Vice President & Chief Information Officer (CIO), who has over two decades of international leadership in the business of technology. We also engage independent third parties to assess our cybersecurity program, track their recommendations and use those to further improve the program. Reporting to the CIO is the Chief Information Security Officer who is in charge of our cybersecurity program and oversees the 24x7x365 Security Operations Center (SOC).
We conduct continuous assessments of our cybersecurity standards, perform regular tests of our ability to respond and recover, and monitor for potential threats. To further mitigate threats, we collaborate with governments and regulatory agencies, and take part in external events to learn and share. Our workforce participates in regular security awareness training, including exercises to build capabilities to identify and report suspect phishing emails to our SOC. In the last year, we continued to expand the cybersecurity training and simulated testing we administer to high-risk groups within the organization. A tailored cybersecurity training course has been implemented for team members in operational technology roles, and we have increased the frequency of phishing simulation tests.
We have a cybersecurity third party risk management program, which is an evolving, cross-functional program to help assess and mitigate risks from third party vendors and other service providers. Our cybersecurity team also uses several layers of defense and protection technologies, cybersecurity experts, and automated alerting and response mechanisms to reduce risk to Enbridge.
Although cybersecurity risks have not materially affected us, including our business strategy, results of operations or financial condition, to date, we have experienced an increasing number of cybersecurity threats in recent years. For more information about the cybersecurity risks we face, see the risk factor entitled "Cyber attacks and other cybersecurity incidents pose threats to our technology systems and could materially adversely affect our business, operations, reputation or financial results." in Item 1A. Risk Factors.
ITEM 2. PROPERTIES
Descriptions of our properties and maps depicting the locations of our liquids and natural gas systems are included in Part I. Item 1. Business.
In general, our systems are located on land owned by others and are operated under easements and rights-of-way, licenses, leases or permits that have been granted by private land-owners, Indigenous communities, public authorities, railways or public utilities. Our liquids pipeline systems have pumping stations, tanks, terminals and certain other facilities that are located on land that is passedowned by us and/or used by us under easements, licenses, leases or permits. Additionally, our natural gas pipeline systems have natural gas compressor stations, of which the vast majority are located on land that is owned by us. The remainder of these compressor stations and other assets, like meter and valve stations, and underground gas storage fields, are used by us under easements, leases or permits.
Titles to Enbridge owned properties or affiliate entities may be subject to encumbrances in some cases. We believe that none of these burdens should materially detract from the value of these properties or materially interfere with their use in the operation of our business.
ITEM 3. LEGAL PROCEEDINGS
We are involved in various legal and regulatory actions and proceedings which arise in the ordinary course of business. While the final outcome of such actions and proceedings cannot be predicted with certainty, management believes that the resolution of such actions and proceedings will not have a material impact on our consolidated financial position or results of operations. Refer to Part II. Item 7. Management's Discussion and Analysis of Financial Condition and Results of Operations - Legal and Other Updates for discussion of certain legal proceedings with recent developments.
SEC regulations require the disclosure of any proceeding under environmental laws to which a governmental authority is a party unless the registrant reasonably believes it will not result in monetary sanctions over a certain threshold. Given the size of our operations, we have elected to use a threshold of US$1 million for the purposes of determining proceedings requiring disclosure.
On October 17, 2022, four separate comprehensive enforcement resolutions were announced with the Minnesota Pollution Control Agency, Minnesota Department of Natural Resources (DNR), Fond du Lac Band of Lake Superior Chippewa, and Minnesota Attorney General’s Office related to alleged violations that occurred during construction of Line 3 Replacement (L3R). The Minnesota Attorney General filed a misdemeanor criminal charge for the taking of water without a permit at the Clearbrook aquifer, with this charge against us to be dismissed following one year of compliance with the state water appropriation rules. As part of its ongoing post-construction monitoring activities for L3R, Enbridge reported groundwater flow near Moose Lake in Aitkin County to the DNR. Enbridge has completed the agency approved corrective action at the site.
ITEM 4. MINE SAFETY DISCLOSURES
Not applicable.
PART II
ITEM 5. MARKET FOR REGISTRANT'S COMMON EQUITY, RELATED STOCKHOLDER MATTERS AND ISSUER PURCHASES OF EQUITY SECURITIES
Common Stock
Enbridge common stock is traded on the TSX and NYSE under the symbol ENB. As at February 2, 2024, there were 73,123 registered shareholders of record of Enbridge common stock. A substantially greater number of holders of Enbridge common stock are beneficial holders, whose shares are held by banks, brokers and other financial institutions.
Securities Authorized for Issuance Under Equity Compensation Plans
The information required by this Item will be contained in our Form 10-K/A, which will be filed no later than 120 days after December 31, 2023.
Recent Sales of Unregistered Equity Securities
None.
Issuer Purchases of Equity Securities
| | | | | | | | | | | | | | |
| Period | Total number of shares purchased | Average price paid per share | Total number of shares purchased as part of publicly announced plans or programs | Maximum number of shares that may yet be purchased under the plans or programs1 |
| | | | |
| | | | |
| | | | |
| | | | |
| | | | |
| | | | |
| | | | |
| | | | |
| | | | |
October 2023 (October 1 - October 31) | — | | N/A | — | | 25,433,807 | |
November 2023 (November 1 - November 30) | — | | N/A | — | | 25,433,807 | |
December 2023 (December 1 - December 31) | — | | N/A | — | | 25,433,807 | |
1On January 4, 2023, the TSX approved our normal course issuer bid (NCIB), which commenced on January 6, 2023 and expired on January 5, 2024. Our NCIB permitted us to purchase, for cancellation, up to 27,938,163 of the outstanding common shares of Enbridge to an aggregate amount of up to $1.5 billion through the facilities of the TSX, the NYSE and other designated exchanges and alternative trading systems.
Total Shareholder Return
The following graph reflects the comparative changes in the value from January 1, 2019 through December 31, 2023 of $100 invested in (1) Enbridge Inc.’s common shares traded on the TSX, (2) the S&P/TSX Composite index, (3) the S&P 500 index, (4) our US peer group (comprising, by stock symbols, CNP, D, DTE, DUK, EPD, ET, KMI, MMP, NEE, NI, OKE, PAA, PCG, SO, SRE and WMB) and (5) our Canadian peer group (comprising, by stock symbols, CU, FTS, PPL and TRP). The amounts included in the table were calculated assuming the reinvestment of dividends.
| | | | | | | | | | | | | | | | | | | | |
| | January 1,
2019 | December 31, |
| | 2019 | 2020 | 2021 | 2022 | 2023 |
| Enbridge Inc. | 100.00 | | 129.34 | | 109.69 | | 142.87 | | 162.72 | | 157.79 | |
| S&P/TSX Composite | 100.00 | | 122.88 | | 129.76 | | 162.32 | | 152.83 | | 170.79 | |
| S&P 500 Index | 100.00 | | 131.49 | | 155.68 | | 200.37 | | 164.08 | | 207.21 | |
US Peers1 | 100.00 | | 118.76 | | 101.11 | | 124.27 | | 139.24 | | 145.15 | |
| Canadian Peers | 100.00 | | 131.71 | | 108.28 | | 135.12 | | 140.43 | | 142.20 | |
1For the purpose of the graph, it was assumed that CAD:US dollar conversion ratio remained at 1:1 for the years presented.
ITEM 6. [Reserved]
ITEM 7. MANAGEMENT'S DISCUSSION AND ANALYSIS OF FINANCIAL CONDITION AND RESULTS OF OPERATIONS
INTRODUCTION
The following discussion and analysis of our financial condition and results of operations is based on and should be read in conjunction with "Forward-Looking Information" and "Non-GAAP and Other Financial Measures", Part I. Item 1A. Risk Factors and our consolidated financial statements and the accompanying notes included in Part II. Item 8. Financial Statements and Supplementary Data of this Annual Report on Form 10-K.
This section of our Annual Report on Form 10-K discusses 2023 and 2022 items and year-over-year comparisons between 2023 and 2022. For discussion of 2021 items and year-over-year comparisons between 2022 and 2021, refer to customers through ratesPart II. Item 7. Management's Discussion and does not ultimately impact earnings due to its flow-through nature.
Commodity salesAnalysis of $26,286 million, $22,816 millionFinancial Condition and $23,842 millionResults of Operations of our Annual Report on Form 10-K for the year ended December 31, 20172022.
RECENT DEVELOPMENTS
MAINLINE TOLLING AGREEMENT
Enbridge Inc. (Enbridge) has reached an agreement on a negotiated settlement with shippers for tolls on its Mainline System. The Mainline Tolling Settlement (MTS) covers both the Canadian and US portions of the Mainline and would see the Mainline continuing to operate as a common carrier system available to all shippers on a monthly nomination basis. The MTS is subject to regulatory approval and the term is seven and a half years through the end of 2028, with revised interim tolls effective on July 1, 2023.
The MTS includes:
•an International Joint Toll (IJT), 2016for heavy crude oil movements from Hardisty to Chicago, comprised of a Canadian Mainline Toll of $1.65 per barrel plus a Lakehead System Toll of US$2.57 per barrel, plus the applicable Line 3 Replacement (L3R) surcharge;
•toll escalation for operation, administration, and 2015,power costs tied to US consumer price and power indices;
•tolls that continue to be distance and commodity adjusted, and utilize a dual currency IJT; and
•a financial performance collar providing incentives for Enbridge to optimize throughput and cost, but also providing downside protection in the event of extreme supply or demand disruptions or unforeseen operating cost exposure. This performance collar is intended to ensure the Mainline earns 11% to 14.5% returns, on a deemed 50% equity capitalization, which is similar to the returns earned on average during the previous tolling agreement.
Approximately 70% of Mainline deliveries are tolled under this settlement, while approximately 30% of deliveries are tolled on a full path basis to markets downstream of the Mainline. The other continuing feature is that the Mainline toll flexes up or down US$0.035 per barrel for 50,000 barrel per day changes in throughput.
The expected financial outcome from this settlement is in line with previously reported financial results after taking into consideration the previously recognized provision, inflationary cost adjustments and increased volumes. Enbridge filed an application with the Canada Energy Regulator (CER) for approval of the MTS on December 15, 2023, with unanimous support from its Representative Stakeholder Group. The CER indicated in its process letter that no dissenting comments were received by January 19, 2024 and that it may decide on the application or it may establish further process steps.
On May 24, 2023, Enbridge filed an Offer of Settlement with the Federal Energy Regulatory Commission (FERC) for the Lakehead System (the Lakehead System Settlement). In addition to resolving litigation related to the Index portion of the Lakehead System rate, the Lakehead System Settlement also includes a depreciation truncation date of December 31, 2048 for the rate base applicable to the Index and Facilities Surcharge and agreement on the terms for future recovery through the Facilities Surcharge of costs related to two Line 5 projects: the Wisconsin Relocation Project and the Straits of Mackinac Tunnel. The Lakehead System Settlement was certified by the Settlement Judge on June 23, 2023 and was approved by the FERC Commissioners on November 27, 2023. Lakehead System tolls were revised effective December 1, 2023 to reflect the terms of the Lakehead System Settlement.
ACQUISITIONS
Acquisition of Renewable Natural Gas (RNG) Facilities
On January 2, 2024, through a wholly-owned US subsidiary, we acquired the first six Morrow Renewables operating landfill gas-to-RNG production facilities located in Texas and Arkansas for total consideration of $1.4 billion (US$1.1 billion), of which $0.5 billion (US$0.4 billion) was paid at close and $0.9 billion (US$0.7 billion) is payable within two years. The total consideration for all seven facilities is $1.6 billion (US$1.2 billion). Combined RNG production of the facilities is approximately 4.5 bcf per year. The acquired assets align with and advance our low-carbon strategy.
Fox Squirrel Solar
On November 15, 2023, we acquired a 50% interest in a newly formed partnership with EDF Renewables North America to participate in the initial phase of a solar power facility in Ohio. Cash consideration includes an upfront payment of $157 million (US$115 million) and subsequent capital commitments up to $398 million (US$291 million). Investments past the first phase are contingent on certain conditions being met. An additional payment of $164 million (US$123 million) was made at Phase 1 in-service in December 2023.
Hohe See and Albatros Offshore Wind Facilities
On November 3, 2023, we acquired an additional 24.45% interest in the Hohe See Offshore Wind Facilities and Albatros Offshore Wind Facilities (the Offshore Wind Facilities), through the acquisition of a 49% interest in Enbridge Renewable Infrastructure Investments S.à r.l (ERII), for $391 million (€267 million) of cash and assumed debt of $524 million (€358 million), bringing our interest in the Offshore Wind Facilities to 49.9%. The Hohe See Offshore Wind Facilities and Albatros Offshore Wind Facilities are located approximately 100 kilometers off the northern coast of Germany and came into service in 2019 and 2020, respectively.
Aitken Creek Gas Storage
On November 1, 2023, through a wholly-owned Canadian subsidiary, we acquired a 93.8% interest in Aitken Creek Gas Storage Facility and a 100% interest in Aitken Creek North Gas Storage Facility (collectively, Aitken Creek), located in BC, Canada, for $400 million, subject to other customary closing adjustments (the Aitken Creek Acquisition). Aitken Creek is the only underground natural gas storage facility in BC and connects to all major natural gas pipelines in western Canada. The Aitken Creek Acquisition enables us to continue to meet regional energy needs and to support increasing demand for liquefied natural gas (LNG) exports.
US Gas Utilities
On September 5, 2023, we announced that Enbridge had entered into three separate definitive agreements with Dominion Energy, Inc. to acquire The East Ohio Gas Company, Questar Gas Company and its related Wexpro companies, and Public Service Company of North Carolina for an aggregate purchase price of $19.1 billion (US$14.0 billion), comprised of $12.8 billion (US$9.4 billion) of cash consideration and $6.3 billion (US$4.6 billion) of assumed debt, subject to customary closing adjustments (together, the Acquisitions). If completed, the Acquisitions will create North America's largest natural gas utility platform delivering over 9 billion cubic feet (bcf) per day to approximately 7 million customers across multiple regulatory jurisdictions. The Acquisitions are expected to close in 2024, subject to the satisfaction of customary closing conditions including the receipt of certain regulatory approvals, which are not cross-conditional.
On September 8, 2023, we closed a public offering of 102,913,500 common shares at a price of $44.70 per share for gross proceeds of $4.6 billion which is intended to finance a portion of the aggregate cash consideration payable for the Acquisitions. Refer to Financing Update for further details on the debt issuances and credit facility obtained to support the Acquisitions.
Tres Palacios Holdings LLC
On April 3, 2023, we acquired Tres Palacios Holdings LLC (Tres Palacios) for $451 million (US$335 million) of cash. Tres Palacios is a natural gas storage facility located in the US Gulf Coast and its infrastructure serves Texas gas-fired power generation and LNG exports, as well as Mexico pipeline exports. Tres Palacios is comprised of three natural gas storage salt caverns with a total FERC-certificated working gas capacity of approximately 35 billion bcf and also owns an integrated 62-mile natural gas header pipeline system, with eleven inter- and intrastate natural gas pipeline connections.
ASSET MONETIZATION
Disposition of Alliance Pipeline and Aux Sable
On December 13, 2023, we announced that Enbridge has entered into a definitive agreement to sell our 50.0% interest in the Alliance Pipeline and our interest in Aux Sable (including 42.7% interest in Aux Sable Midstream LLC and Aux Sable Liquid Products L.P., and 50% interest in Aux Sable Canada LP) to Pembina Pipeline Corporation for $3.1 billion, including approximately $0.3 billion of non-recourse debt, subject to customary closing adjustments. Closing is expected to occur in the first half of 2024, subject to the receipt of regulatory approvals and satisfaction of customary closing conditions. The sales proceeds will fund a portion of the Acquisitions and be used for debt reduction.
GAS TRANSMISSION AND MIDSTREAM PROCEEDINGS
Texas Eastern Transmission
The Stipulation and Agreement for Texas Eastern Transmission, LP’s (Texas Eastern) consolidated 2021 rate cases was approved by the FERC on November 30, 2022, and became effective on January 1, 2023. Texas Eastern received FERC approval on April 3, 2023 to implement the settled rates and other settlement provisions.
Maritimes & Northeast Pipeline
The toll settlement agreement for the Canadian portion of the Maritimes & Northeast (M&N) Pipeline (M&N Canada) expired in December 2023. M&N Canada reached a toll settlement with shippers for the effective period from January 1, 2024 to December 31, 2025. On November 28, 2023, M&N Canada filed the 2024 - 2025 toll settlement agreement with the CER for review and approval. A CER decision is expected in the first quarter of 2024.
GAS DISTRIBUTION AND STORAGE RATE APPLICATIONS
Incentive Regulation Rate Application
In October 2022, Enbridge Gas Inc. (Enbridge Gas) filed its application with the Ontario Energy Board (OEB) to establish a 2024 through 2028 Incentive Regulation (IR) rate setting framework. The application initially sought approval in two phases to establish 2024 base rates (Phase 1) on a cost-of-service basis and to establish a price cap rate setting mechanism (Phase 2) to be used for the remainder of the IR term. A third phase (Phase 3) has been established with the OEB as part of the Phase 1 Partial Settlement Proposal (Settlement Proposal).
On August 17, 2023, the OEB approved the Settlement Proposal to support the determination of just and reasonable rates effective January 1, 2024. Items resolved in whole or in part include:
•additions to rate base up to and including 2022;
•interest rates on debt and return on equity;
•deferral and variance accounts;
•Indigenous engagement; and
•rate implementation approach for 2024.
On December 21, 2023, the OEB issued its Decision and Order on Phase 1 (Phase 1 Decision). The decision addressed three main areas: energy transition, Enbridge Gas Distribution Inc. and Union Gas Limited amalgamation and harmonization issues, and other issues. The Phase 1 Decision included the following key findings or orders:
•energy transition risk requires Enbridge Gas to carry out a risk assessment to consider further risk mitigation measures in three areas: system access and expansion capital spending, system renewal capital spending and depreciation policy;
•our 2024 capital plan must be reduced by $250 million with a focus on monitoring, repair and life extension of our assets and a further $50 million of capitalized indirect overhead costs must be expensed, escalating to $250 million per year during the IR term with an offsetting adjustment to revenues in each year;
•all new small volume customers wishing to connect to natural gas pay their full connection costs as an upfront charge rather than through rates over time effective January 1, 2025;
•approval of a harmonized depreciation methodology that reduced the level of depreciation sought and adjusted asset lives including extensions of service life for certain asset classes;
•an increase in equity thickness from 36% to 38% effective for 2024; and
•January 1, 2024 will be the effective date for 2024 rates.
The issues addressed in the Settlement Proposal and the Phase 1 Decision resulted in the following items not approved for future recovery, and the subsequent impairments recognized for the year ended December 31, 2023:
•a portion of undepreciated capital projects removed from 2024 rate base of $41 million;
•undepreciated integration capital costs removed from 2024 rate base of $84 million; and
•pre-2017 Union Gas Limited related pension balances of $156 million.
Enbridge Gas filed a Notice of Appeal in the Ontario Divisional Court on January 22, 2024 regarding four aspects of the Phase 1 Decision: small volume customer revenue horizon, the 2024 capital plan reduction, the extension of service life for certain asset classes and equity thickness. On January 29, 2024 Enbridge Gas also filed a Notice of Motion with the OEB requesting the OEB to review and vary five aspects of the Phase 1 Decision: small volume customer revenue horizon, the 2024 capital plan reduction, integration capital, depreciation and equity thickness. The outcome of these proceedings is uncertain.
The Phase 1 Decision results in interim rates, pending phases 2 and 3 of the proceeding, resolution of the Notice of Appeal, Notice of Motion and any possible legislative steps that could be undertaken by the Government of Ontario further to the Ontario Minister of Energy's December 22, 2023 news release. Phase 2 will establish and determine the incentive rate mechanism for the remainder of the rebasing term, and gas cost and unregulated storage cost allocation. Phase 3 will address cost allocation and the harmonization of rates and rate classes between legacy rate zones.
Purchase Gas Variance
The Purchase Gas Variance Account (PGVA) captures the difference between actual and forecasted natural gas prices reflected in rates. Account balances are typically recovered or refunded over a prospective 12-month period through Quarterly Rate Adjustment Mechanism (QRAM) applications.
In March 2023, the April 1, 2023 QRAM application was filed and approved by the OEB, which included an adjustment to the prior rate mitigation approved as part of the July 1, 2022 QRAM. The recovery of the outstanding PGVA balance from the extended recovery period approved as part of the July 1, 2022 QRAM will now be completed by March 31, 2024. In June, September and December 2023, the July 1, 2023, October 1, 2023, and January 1, 2024 QRAM applications, respectively, were generated primarily throughfiled and approved by the OEB with no adjustments to the prior period rate mitigation plans and did not include any additional rate mitigation measures.
As at December 31, 2023, Enbridge Gas' PGVA liability balance was $16 million.
FINANCING UPDATE
We completed long-term debt issuances totaling US$8.5 billion and $3.9 billion during the year ended December 31, 2023, including aggregate amounts of US$2.3 billion of 10-year sustainability-linked senior notes in March 2023 and $400 million of 10-year sustainability-linked medium-term notes in May 2023.
We increased our Energy Services operations. Energy Services includescredit facilities in March 2023 by approximately $500 million. During our annual renewal process, we renewed and extended approximately $15.4 billion of our credit facilities with maturities ranging from 2024-2028.
In September 2023, we obtained commitments for a US$9.4 billion senior unsecured bridge term loan credit facility to support the contemporaneous purchaseAcquisitions. The commitment for this facility was subsequently reduced to nil as at December 31, 2023 as a result of the September 2023 $4.6 billion equity offering, the September 2023 subordinated long-term debt issuances, and salethe November 2023 senior notes long-term debt issuances.
In September 2023, we closed a public offering of crude oil, natural gas, power and NGLs to generate102,913,500 common shares at a margin,price of $44.70 per share for gross proceeds of $4.6 billion which is typicallyintended to finance a small fractionportion of gross revenue. While sales revenue generated from these operations are impacted by commodity prices, net marginsthe aggregate cash consideration payable for the Acquisitions.
Our 2023 financing activities have provided significant liquidity that we expect will enable us to fund our current portfolio of capital projects and earnings are relatively insensitiveacquisitions without requiring access to commodity pricesthe capital markets for the next 12 months should market access be restricted or pricing be unattractive. Refer to Liquidity and reflect activity levels which are driven by differences in commodity prices between locations, grades and points in time, rather than on absolute prices. Any residual commodity margin risk is closely monitored and managed. Revenues from these operationsCapital Resources.
depend on activity levels, which vary from year-to-year depending on market conditions and commodity prices.
Our revenues also include changes in unrealized derivative fair value gains and losses related to foreign exchange and commodity price contracts used to manage exposures from movements in foreign exchange rates and commodity prices. The mark-to-market accounting creates volatility and impacts the comparability of revenues in the short-term, but we believe over the long-term, the economic hedging program supports reliable cash flows and dividend growth.
DIVIDENDS
We have paid common share dividends in every year since we became a publicly traded company in 1953. In November 2017, we announced a 10% increase in our quarterly dividend to $0.671 per common share, or $2.684 annualized, effective with the dividend payable on March 1, 2018.
BUSINESS SEGMENTS
EffectiveAs at December 31, 2017, we changed2023, after adjusting for the impact of floating-to-fixed interest rate swap hedges, less than 5% of our segment-level profit measuretotal debt is exposed to EBITDA fromfloating rates. Refer to Part II. Item 8. Financial Statements and Supplementary Data - Note 23 - Risk Management and Financial Instruments for more information on our interest rate hedging program.
NORMAL COURSE ISSUER BID
On January 4, 2023, the previous measure of Earnings before interestToronto Stock Exchange (TSX) approved our normal course issuer bid (NCIB), which commenced on January 6, 2023 and income taxes. We also renamed the Gas Pipelines and Processing segmentexpired on January 5, 2024. Our NCIB permitted us to Gas Transmission and Midstream. The presentationpurchase, for cancellation up to 27,938,163 of the prior years' tables has been revised in orderoutstanding common shares of Enbridge to align withan aggregate amount of up to $1.5 billion through the current presentation.facilities of the TSX, the New York Stock Exchange and other designated exchanges and alternative trading systems.
LIQUIDS PIPELINESRESULTS OF OPERATIONS
| | | | | | | | | | | |
| Year ended December 31, | 2023 | 2022 | 2021 |
| (millions of Canadian dollars, except per share amounts) | | | |
Segment earnings/(loss) before interest, income taxes and depreciation and amortization1 | | | |
| Liquids Pipelines | 9,499 | | 8,364 | | 7,897 | |
| Gas Transmission and Midstream | 4,264 | | 3,126 | | 3,671 | |
| Gas Distribution and Storage | 1,592 | | 1,827 | | 2,117 | |
| Renewable Power Generation | 149 | | 262 | | 508 | |
| Energy Services | (37) | | (417) | | (313) | |
| Eliminations and Other | 837 | | (1,124) | | 356 | |
Earnings before interest, income taxes and depreciation and amortization1 | 16,304 | | 12,038 | | 14,236 | |
| Depreciation and amortization | (4,613) | | (4,317) | | (3,852) | |
| Interest expense | (3,812) | | (3,179) | | (2,655) | |
| Income tax expense | (1,821) | | (1,604) | | (1,415) | |
| (Earnings)/loss attributable to noncontrolling interests and redeemable noncontrolling interests | 133 | | 65 | | (125) | |
| Preference share dividends | (352) | | (414) | | (373) | |
| Earnings attributable to common shareholders | 5,839 | | 2,589 | | 5,816 | |
| Earnings per common share attributable to common shareholders | 2.84 | | 1.28 | | 2.87 | |
| Diluted earnings per common share attributable to common shareholders | 2.84 | | 1.28 | | 2.87 | |
1 Non-GAAP financial measures.
EARNINGS BEFORE INTEREST, INCOME TAXES AND DEPRECIATION AND AMORTIZATIONATTRIBUTABLE TO COMMON SHAREHOLDERS
|
| | | | | | |
| | 2017 |
| 2016 |
| 2015 |
|
| (millions of Canadian dollars) | |
| |
| |
|
| Earnings before interest, income taxes and depreciation and amortization | 6,395 |
| 4,926 |
| 3,033 |
|
Year ended December 31, 20172023 compared with year ended December 31, 20162022
EBITDA for the year ended December 31, 2017 was positively impacted by $285 million of contributions from new assets following the completion of the Merger Transaction.
After taking into consideration the contribution of additional earnings from the Merger Transaction, EBITDAEarnings attributable to common shareholders increased by $1,312 million$3.2 billion due to certain unusual, infrequent or other non-operating factors, primarily explained by the following:
•the absence in 2023 of a goodwill impairment of $2.5 billion relating to our Gas Transmission reporting unit;
•a non-cash, net unrealized derivative fair value gain of $875$1,127 million ($856 million after-tax) in 20172023, compared with $474a net unrealized loss of $1,246 million ($950 million after-tax) in 20162022, reflecting net fair value gains and losses arising from changes in the mark-to-market value of derivative financial instruments used to manage foreign exchange, interest rate, and commodity price risks;
•the absence in 2023 of: an asset impairment loss of $227 million ($173 million after-tax) to our Magic Valley Wind Farm (Magic Valley); an asset impairment loss of $183 million ($137 million after-tax) on the US and Canadian components of the interstate pipeline within the North Dakota System of our Bakken System, an impairment charge of $1,004$44 million recorded($34 million after-tax) for lease assets due to office relocation plans, and an asset impairment loss of $40 million ($30 million after-tax) relating to MacKay River line within our Alberta Regional Oil Sands System;
•a gain of $151 million ($129 million after-tax) and a deferred tax adjustment of $69 million were recognized as a result of Southern Lights Pipeline's (Southern Lights) discontinuation of regulatory accounting;
•the absence in 2016, including2023 of a transaction cost of $114 million in relation to our investment purchase in the Woodfibre LNG project;
•a deferred income tax recovery of $104 million related project costs,to a tax adjustment on EEP's Sandpiper Project resulting fromasset impairments;
•a non-cash, net unrealized gain of $73 million ($55 million after-tax) in 2023, compared with a net unrealized loss of $27 million ($21 million after-tax) in 2022, reflecting the withdrawalrevaluation of derivatives used to manage the profitability of transportation and storage transactions, as well as to manage the exposure to movements in commodity prices;
•the receipt of a litigation claim settlement of $68 million ($52 million after-tax) in 2023; and
•a non-cash, net unrealized gain of $35 million ($33 million after-tax) in 2023, compared with a net unrealized loss of $25 million ($22 million after-tax) in 2022, reflecting changes in the mark-to-market value of equity fund investments held by our wholly-owned captive insurance subsidiaries.
The factors above were partially offset by:
•the absence in 2023 of a gain of $1,076 million ($732 million after-tax) on the closing of the regulatory applicationsjoint venture merger transaction with Phillips 66 (P66) realigning our indirect economic interests in September 2016 that were pending withGray Oak Pipeline LLC (Gray Oak) and DCP Midstream, LP (DCP);
•a realized loss of $638 million ($479 million after-tax) due to termination of foreign exchange hedges, as foreign exchange risks inherent within the MNPUC;Competitive Toll Settlement (CTS) framework are not present in the negotiated Mainline tolling agreement;
the absence of •an impairment chargeloss of $373$261 million recorded in 2016 related to the Northern Gateway Project due($20 million after-tax and net of noncontrolling interest) to our conclusion thatChapman Ranch wind facilities;
•an impairment of $281 million ($232 million after-tax) recognized to certain capital projects, capital costs and pension balances in the project could not proceed as envisionedfourth quarter of 2023 as a result of the Federal Government's decisionOEB's Phase 1 Decision on Enbridge Gas' application;
•a deferred tax adjustment of $120 million as a result of deregulation of parts of the Canadian Mainline including Line 9 and L3R;
•a provision adjustment and settlement of $124 million ($95 million after-tax) related to dismiss the application for Certificate of Public Convenience and Necessity;a litigation matter;
•the absence of an impairment charge of $184 million recorded in 2016 related to our 75% joint venture interest in Eddystone Rail attributable to market conditions which impacted volumes at the rail facility;
a gain of $72 million on sale of pipe partially offset by project wind-down costs related to EEP’s Sandpiper Project; partially offset by
the absence2023 of a gain of $850$118 million ($89 million after-tax) on Texas Eastern recorded in 2016to reflect a settlement with a transportation customer undergoing bankruptcy;
•an asset retirement loss of $86 million ($65 million after-tax) related to the sale of non-core South Prairie Region assets.
After taking into consideration the factors above, the remaining $128 million decrease is primarily explained by the following significant business factors:
a lower contribution of $46 million from Mid-Continent assets primarily due to lower contracted storage revenues and the sale of the Ozark Pipeline system in the first quarter of 2017;
a lower contribution of $76 million resulting from the sale of the South Prairie Region assets in December 2016;
higher Lakehead System operating costs including costs to implement EEP’s signed settlement agreement regarding the Lines 6A and 6B crude oil releases (the Consent Decree) approved by the United States Department of Justice (DOJ) in May 2017;
the unfavorable effect of translating United States dollar EBITDA at a lower United States to Canadian dollar average exchange rate (Average Exchange Rate) as compared with 2016, inclusive of the impact of settlements under our foreign exchange hedging program; partially offset by
contributions of from new assets placed into service including theAlberta Regional Oil Sands Optimization Project and the Norlite Pipeline System and the acquisitionSystem;
•an impairment loss of a minority interest in the Bakken Pipeline System that went into service in June 2017; and
higher Canadian Mainline and Lakehead System throughput period over period resulting from capacity optimization initiatives.
Year ended December 31, 2016 compared with year ended December 31, 2015
EBITDA increased by $1,177$82 million due($63 million after-tax) to certain unusual, infrequent or other factors, primarily explained byOffshore equity investments in our Gas Transmission and Midstream segment; and
•transaction costs of $31 million ($24 million after-tax) incurred as a result of the following:Acquisitions.
a
The non-cash, unrealized gain of $474 million in 2016 compared with an unrealized loss of $1,500 million in 2015 reflecting netderivative fair value gains and losses on derivative financial instruments used to manage foreign exchange and commodity price risks;
a gain of $850 million in 2016 related to the sale of non-core South Prairie Region assets;
the absence of an impairment charge of $86 million recorded in 2015 related to EEP's Berthold rail facility due to contracts that were not renewed beyond 2016;
hydrostatic testing recoveries of $15 million in 2016 compared with charges of $72 million in 2015; partially offset by
an impairment charge of $1,004 million in 2016, including related project costs, on EEP's Sandpiper Project resulting from the withdrawal of the regulatory applications in September 2016 that were pending with the MNPUC;
an impairment charge of $373 million in 2016 related to the Northern Gateway Project due to our conclusion that the project could not proceed as envisioneddiscussed above generally arise as a result of the Federal Government's decisionour comprehensive economic hedging program to dismiss the application for Certificate of Public Convenience and Necessity;
an impairment charge of $184 million in 2016 related to our 75% joint venture interest in Eddystone Rail attributable to market conditions which impacted volumes at the rail facility; and
the absence of a gain of $91 million recorded in 2015 related to the sale of non-core assets.
After taking into consideration the factors above, the remaining $716 million increase is primarily explained by the following significant business factors:
higher throughput period over period resulting from strong oil sands production in western Canada enabled by pipeline capacity expansion projects placed into service in 2015;
increased transportation revenues in 2016 resulting from an increase in the level of committed take-or-pay volumes on Flanagan South;
the favorable effect of translating United States dollar earnings at a higher Average Exchange Rate in 2016, inclusive of the impact of settlements under ourmitigate foreign exchange, hedging program; partially offset by
interest rate and commodity price risks. This program creates volatility in reported short-term earnings through the impactrecognition of extreme wildfires in northeastern Alberta during the second quarter of 2016 which led to a temporary shutdown of certain of our upstream pipelines and terminal facilities resulting in a disruption of service.
Supplemental information on Liquids Pipelines EBITDA for the years ended December 31, 2017, 2016 and 2015 is provided below.
|
| | | | | | | | | |
| December 31, | 2017 |
| 2016 |
| 2015 |
|
| (United States dollars per barrel) | |
| |
| |
IJT Benchmark Toll1 |
| $4.07 |
|
| $4.05 |
|
| $4.07 |
|
Lakehead System Local Toll2 |
| $2.43 |
|
| $2.58 |
|
| $2.44 |
|
Canadian Mainline IJT Residual Benchmark Toll3 |
| $1.64 |
|
| $1.47 |
|
| $1.63 |
|
| |
1 | The IJT Benchmark Toll is per barrel of heavy crude oil transported from Hardisty, Alberta to Chicago, Illinois. A separate distance adjusted toll applies to shipments originating at receipt points other than Hardisty and lighter hydrocarbon liquids pay a lower toll than heavy crude oil. Effective July 1, 2015, this toll increased from US$4.02 to US$4.07. Effective July 1, 2016, this toll decreased to US$4.05. Effective July 1, 2017, this toll increased to US$4.07. |
| |
2 | The Lakehead System Local Toll is per barrel of heavy crude oil transported from Neche, North Dakota to Chicago, Illinois. Effective April 1, 2015, the Lakehead System Local Toll decreased from US$2.49 to US$2.39 and effective July 1, 2015, this toll increased to US$2.44. Effective April 1, 2016, this toll increased to US$2.61 and effective July 1, 2016, this toll decreased to US$2.58. Effective April 1, 2017, this toll decreased to US$2.43. |
| |
3 | The Canadian Mainline IJT Residual Benchmark Toll is per barrel of heavy crude oil transported from Hardisty, Alberta to Gretna, Manitoba. For any shipment, this toll is the difference between the IJT Benchmark Toll and the Lakehead System Local Toll. Effective April 1, 2015, this toll increased from US$1.53 to US$1.63. Effective April 1, 2016, this toll decreased to US$1.46, coinciding with the revised Lakehead System Local Toll. Effective July 1, 2016, this toll increased to US$1.47. Effective April 1, 2017, this toll increased to US$1.62, coinciding with the revised Lakehead System Local Toll. Effective July 1, 2017, this toll increased to US$1.64. |
Throughput Volume
|
| | | | | | | | | | |
| | Q1 |
| Q2 |
| Q3 |
| Q4 |
| Full Year |
|
| (thousands of barrels per day (bpd)) | |
| |
| |
| |
| |
|
Canadian Mainline1 | | | | | |
| 2017 | 2,593 |
| 2,449 |
| 2,492 |
| 2,586 |
| 2,530 |
|
| 2016 | 2,543 |
| 2,242 |
| 2,353 |
| 2,481 |
| 2,405 |
|
| 2015 | 2,210 |
| 2,073 |
| 2,212 |
| 2,243 |
| 2,185 |
|
| | | | | | |
Lakehead System2 | | | | | |
| 2017 | 2,748 |
| 2,604 |
| 2,620 |
| 2,724 |
| 2,673 |
|
| 2016 | 2,735 |
| 2,440 |
| 2,495 |
| 2,624 |
| 2,574 |
|
| 2015 | 2,330 |
| 2,208 |
| 2,338 |
| 2,388 |
| 2,315 |
|
| |
1 | Average throughput volume represents mainline deliveries ex-Gretna, Manitoba which is made up of United States and eastern Canada deliveries originating from western Canada. |
| |
2 | Average throughput volume represents mainline system deliveries to the United States midwest and eastern Canada. |
Average Exchange Rate
|
| | | | | | | | | | |
| | Q1 |
| Q2 |
| Q3 |
| Q4 |
| Full Year |
|
| (United States dollar to Canadian dollar) | |
| |
| |
| |
| |
|
| 2017 | 1.32 |
| 1.34 |
| 1.25 |
| 1.27 |
| 1.30 |
|
| 2016 | 1.37 |
| 1.29 |
| 1.31 |
| 1.33 |
| 1.32 |
|
| 2015 | 1.24 |
| 1.23 |
| 1.31 |
| 1.34 |
| 1.28 |
|
GAS TRANSMISSION AND MIDSTREAM
EARNINGS/(LOSS) BEFORE INTEREST, INCOME TAXES AND DEPRECIATION AND AMORTIZATION
|
| | | | | | |
| | 2017 |
| 2016 |
| 2015 |
|
| (millions of Canadian dollars) | |
| |
| |
|
| Earnings/(loss) before interest, income taxes and depreciation and amortization | (1,269 | ) | 464 |
| 43 |
|
Year ended December 31, 2017 compared with year ended December 31, 2016
EBITDA for the year ended December 31, 2017 was positively impacted by $2,557 million of contributions from new assets following the completion of the Merger Transaction. When compared to pre-merger results from the prior year, operating results from the new assets include higher earnings primarily from business expansion projects on Algonquin Gas Transmission, Sabal Trail Transmission and Texas Eastern Transmission.
After taking into consideration the contribution of additional earnings from the Merger Transaction, EBITDA was negatively impacted by $4,287 million due to certain unusual, infrequent or other market factors primarily explained by the following:
a loss of $4,391 million and related goodwill impairment of $102 million resulting from the classification of certain United States Midstream assets as held for sale and the subsequent measurement at the lower of their carrying value or fair value less costs to sell, refer to Item 8. Financial Statements and Supplementary Data - Note 7. Acquisitions and Dispositions; partially offset by
aunrealized non-cash unrealized loss of $1 million in 2017 compared with $139 million in 2016 reflecting net fair value gains and losses arising from the change in the mark-to-market ofon derivative financial instruments used to manage foreign exchangehedge these risks. Over the long-term, we believe our hedging program supports the reliable cash flows and commodity price risk.dividend growth upon which our investor value proposition is based.
After taking into consideration the factors above, the remaining $3 million decrease is primarily explained by the following significant business factors:
lower earnings of $127 million period over period due to lower commodity prices which impacted production volume in areas served by some of our US Midstream assets; partially offset by
increased earnings of $19 million period over period from our Alliance joint venture due to favorable seasonal firm revenues that resulted from wider basis differentials;
increased earnings of $16 million due to a full year of contributions from the Tupper Plants that were acquired in April 2016;
increased fractionation margins of $45 million period over period driven by higher NGL prices and increased demand from our Aux Sable joint venture; and
increased earnings of $41 million period over period from our Offshore assets driven by higher volumes and higher earnings from certain joint venture pipelines.
Year ended December 31, 2016 compared with year ended December 31, 2015
EBITDA increased by $370 million due to certain unusual, infrequent or other market factors primarily explained by the following:
the absence of a goodwill impairment charge of $440 million recorded in 2015 related to our United States natural gas and NGL businesses due to a prolonged decline in commodity prices which reduced producers' expected drilling programs and negatively impacted volumes on our natural gas and NGL systems; partially offset by
a non-cash, unrealized loss of $139 million in 2016 compared with $77 million in 2015 reflecting net fair value gains and losses arising from the change in the mark-to-market of derivative financial instruments used to manage foreign exchange and commodity price risk.
After taking into consideration the factors above, the remaining $51 million increase in earnings attributable to common shareholders is primarily explained by the following significant business factors:
operational efficiencies achieved in 2016 on Alliance Pipeline due to lower operating costs;
•higher contributions from the Heidelberg Pipeline which was placed into serviceMainline System in January 2016;our Liquids Pipelines segment driven by increased volumes due to increased crude demand, net of a lower L3R surcharge and lower Mainline System tolls as a result of revised interim tolls effective July 1, 2023;
•higher contributions from our Liquids Pipelines segment due to increased ownership of the Tupper PlantsGray Oak Pipeline and Cactus II Pipeline acquired in April 2016;the second half of 2022 and the Enbridge Ingleside Energy Center (EIEC) due to higher demand;
•the recognition of revenues in our Gas Transmission and Midstream segment attributable to the Texas Eastern rate case settlement;
•higher distribution charges at our Gas Distribution and Storage segment resulting from increases in rates and customer base as well as higher demand in the contract market;
•higher contributions from our Energy Services segment primarily due to the expiration of transportation commitments and favorable margins due to less pronounced market structure backwardation; and
•the favorable effect of translating US dollar earnings at a higher average exchange rate in 2023, as compared to 2022; partially offset by
unfavorable market conditions•a reduction in 2016 resultingearnings from lower volumesour Gas Transmission and Midstream segment primarily due to reduced drilling by producers on our United States Midstream assets.decreased interest in DCP as a result of a joint venture merger transaction with P66 that closed in the third quarter of 2022;
GAS DISTRIBUTION
EARNINGS BEFORE INTEREST, INCOME TAXES AND DEPRECIATION AND AMORTIZATION
|
| | | | | | |
| | 2017 |
| 2016 |
| 2015 |
|
| (millions of Canadian dollars) | |
| |
| |
|
| Earnings before interest, income taxes and depreciation and amortization | 1,390 |
| 831 |
| 763 |
|
Year ended December 31, 2017 compared with year ended December 31, 2016
EBITDA for the year ended December 31, 2017 was positively impacted by $545 million of contributions from Union Gas following the completion of the Merger Transaction. When compared to pre-merger results from prior years, Union Gas' operating results benefited mainly from higher transportation revenue from the Dawn-Parkway expansion projects, increased storage optimization and increases in delivery rates, partially offset by •higher operating costs.and administrative costs in our Gas Transmission and Midstream and Gas Distribution and Storage segments;
•lower commodity prices impacting the DCP and Aux Sable joint ventures in our Gas Transmission and Midstream segment;
After taking into consideration the contribution of additional earnings from the Merger Transaction, EBITDA increased by $14 million•higher interest expense primarily due to certain unusual, infrequenthigher interest rates and other business factors, primarily explained by the following:higher average principal; and
•higher depreciation and amortization expense as a non-cash, unrealized gainresult of $16 million in 2017 compared with an unrealized loss of $6 million in 2016 arising from the change in the mark-to-market value of Noverco Inc.'s (Noverco) derivative financial instruments;
warmer than normal weather experienced during 2017 which negatively impacted EBITDA by $15 million compared with $18 million in 2016; partially offset by
the absence of other regulatory adjustments at Noverco of $17 million recorded in 2016.
Year ended December 31, 2016 compared with year ended December 31, 2015
EBITDA decreased by $11 million due to certain unusual, infrequent and other market factors, primarily explained by the following:
warmer than normal weather experienced during 2016 which negatively impacted EBITDA by $18 million compared with colder than normal weather during 2015 of $15 million; partially offset by
other regulatory adjustments at Noverco of $17 million recorded in 2016 compared with $6 million in 2015.
After taking into consideration the factors above, the remaining $79 million increase is primarily explained by the following significant business factor:
higher distribution charges arising from growth in rate base, including customer growth in excess of expectations embedded in rates.
GREEN POWER AND TRANSMISSION
EARNINGS BEFORE INTEREST, INCOME TAXES AND DEPRECIATION AND AMORTIZATION
|
| | | | | | |
| | 2017 |
| 2016 |
| 2015 |
|
| (millions of Canadian dollars) | |
| |
| |
|
| Earnings before interest, income taxes and depreciation and amortization | 372 |
| 344 |
| 363 |
|
Year ended December 31, 2017 compared with year ended December 31, 2016
EBITDA increased by $4 million due to certain unusual, infrequent and other factors, primarily explained by the following:
the absence of an investment impairment loss of $13 million recorded in 2016; partially offset by
a $9 million loss that resulted from the sale of an investment.
After taking into consideration the factors above, the remaining $24 million increase is primarily explained by the following significant business factors:
stronger wind resources of $12 million at Canadian and United States wind farms period over period; and
contributions of $9 million from new United States windseveral projects placed into service in 2016 and 2017.
Year ended December 31, 2016 compared with year ended December 31, 2015
EBITDA decreased by $13 million due to an unusual and infrequent investment impairment loss in 2016.
After taking into consideration the factor above, the remaining $6 million decrease is primarily explained by the following significant business factors:
disruptions at certain eastern Canadian wind farms in the first quarter and fourth quarter of 2016 due to weather conditions which caused a higher degree of icing on wind turbine blades;
weaker wind resources experienced at certain facilities in Canada period over period; partially offset by
stronger wind resources at United States wind farms during the second half of 2016.2022.
ENERGY SERVICES
EARNINGS/(LOSS) BEFORE INTEREST, INCOME TAXES AND DEPRECIATION AND AMORTIZATIONThe Energy Services businesses in Canada and the US provide physical commodity marketing and logistical services to North American refiners, producers, and other customers.
Energy Services is primarily focused on servicing customers across the value chain and capturing value from quality, time, and location price differentials when opportunities arise. To execute these strategies, Energy Services transports and stores on both Enbridge-owned and third-party assets using a combination of contracted pipeline, storage, railcar, and truck capacity agreements.
Effective January 1, 2024, to better align how the chief operating decision-maker reviews operating performance and resource allocation across operating segments, we transferred our Canadian and US crude oil businesses from the Energy Services segment to the Liquids Pipelines segment. The Energy Services segment will cease to exist and the remainder of the business will be reported in the Eliminations and Other segment.
|
| | | | | | |
| | 2017 |
| 2016 |
| 2015 |
|
| (millions of Canadian dollars) | |
| |
| |
|
| Earnings/(loss) before interest, income taxes and depreciation and amortization | (263 | ) | (183 | ) | 324 |
|
Energy Services’ earnings are primarily generated from arbitrage opportunities which, by their nature, can be replicated by competitors. An increase in market participants entering into similar arbitrage strategies could have an impact on our earnings. Efforts to mitigate competition risk include diversification of the marketing business by transacting at the majority of major hubs in North America and establishing long-term relationships with clients and pipelines.
ELIMINATIONS AND OTHER
Eliminations and Other includes operating and administrative costs that are not allocated to business segments, the impact of foreign exchange hedge settlements and the activities of our wholly-owned captive insurance subsidiaries. The principal activity of our captive insurance subsidiaries is providing insurance and reinsurance coverage for certain insurable property and casualty risk exposures of our operating subsidiaries and certain equity investments. Eliminations and Other also includes new business development activities and corporate investments.
REGULATION
GOVERNMENT REGULATION
Pipeline Regulation
Our Liquids Pipelines and Gas Transmission and Midstream assets are subject to numerous operational rules and regulations mandated by governments and applicable regulatory authorities, breaches of which could result in fines, penalties, operating restrictions and an overall increase in operating and compliance costs.
In the US, our interstate pipeline operations are subject to pipeline safety laws and regulations administered by the Pipeline and Hazardous Materials Safety Administration (PHMSA), an agency within the United States Department of Transportation (DOT). These laws and regulations require us to comply with a significant set of requirements for the design, construction, maintenance and operation of our interstate pipelines. These laws and regulations, among other things, include requirements to monitor and maintain the integrity of our pipelines and to operate them within permissible pressures.
PHMSA continues to review existing regulations and establish new regulations to support safety standards that are designed to improve operations integrity management processes. In this climate of increasingly stringent regulation, pipeline failure or failures to comply with applicable regulations could result in reduction of allowable operating pressures as authorized by PHMSA, which would reduce available capacity on our pipelines. Should any of these risks materialize, it may have an adverse effect on our operations, capital expenditures, earnings, cash flows, financial condition and competitive advantage.
Our ability to establish transportation and storage rates on our US interstate natural gas facilities is subject to regulation by the FERC, whose rulings and policies could have an adverse impact on the ability to recover the full cost of operating these pipeline and storage assets, including a reasonable rate of return. Regulatory or administrative actions by the FERC such as rate proceedings, applications to certify construction of new facilities, and depreciation and amortization policies can affect our business, including decreasing tariff rates and revenues and increasing our costs of doing business.
In Canada, our pipelines are subject to safety regulations administered by the CER or provincial regulators. Applicable legislation and regulations require us to comply with a significant set of requirements for the design, construction, maintenance and operation of our pipelines. Among other obligations, this regulatory framework imposes requirements to monitor and maintain the integrity of our pipelines.
As in the US, laws and regulations addressing enhanced pipeline safety in Canada have been enacted over the past few years. The changes demonstrate an increased focus on the implementation of management systems to address key areas, such as emergency management, integrity management, safety, security and environmental protection. The CER has authority to impose administrative monetary penalties for non-compliance with the regulatory regime it administers, as well as to impose financial requirements for future abandonment and major pipeline releases.
A key component of pipeline safety and reliability is the approach to integrity management that uses reliability targets and safety case assessments. A long history of extensive inline inspection has provided detailed knowledge of the assets in our pipeline systems. Our pipelines are assessed and maintained in a proactive manner ensuring reliability targets are met. Furthermore, the integrity management program has an independent step to check the results of integrity assessments to validate the effectiveness of the program and to ensure that the operational risk remains as low as reasonably practicable throughout the integrity inspection and assessment cycle. As inspection technology, pipeline materials and construction practices improve with time, and new data on threats and pipeline condition are gathered, our methods of maintaining fitness for service evolves, with a strong focus on continual improvement in every aspect of integrity management.
Our pipelines also face economic regulatory risk. Broadly defined, economic regulatory risk is the risk that governments or regulatory agencies reject or revise proposed commercial arrangements, applications or policies, upon which future and current operations are dependent. Our pipelines are subject to the actions of various regulators, including the CER and the FERC, with respect to tariffs and tolls. The rejection or revision of applications for approval of new tariff structures or proposed commercial arrangements and changes in interpretation of existing regulations by courts or regulators could have an adverse effect on our revenues and earnings.
Gas Distribution and Storage
Our gas distribution and storage utility operations are regulated by the OEB and the Québec Régie de l’énergie, among others. To the extent that the regulators’ future actions are different from current expectations, the timing and amount of recovery or refund of amounts recorded in the Consolidated Statements of Financial Position, or amounts that would have been recorded in the Consolidated Statements of Financial Position in the absence of the effects of regulation, could be different from the amounts that are eventually recovered or refunded.
Enbridge Gas' distribution rates, were set under a five-year incentive regulation (IR) framework using a price cap mechanism, which ended on December 31, 2023. The price cap mechanism established new rates each year through an annual base rate escalation at inflation less a 0.3% productivity factor, in addition to annual updates for certain costs to be passed through to customers, and where applicable, provided for the recovery of material discrete incremental capital investments beyond those that could be funded through base rates. The IR framework included the continuation and establishment of certain deferral and variance accounts, as well as an earnings sharing mechanism that required Enbridge Gas to share equally with customers any earnings in excess of 150 basis points over the annual OEB approved return on equity (ROE).
In October 2022, Enbridge Gas filed its application with the OEB to establish a 2024 through 2028 IR rate setting framework. The application initially sought approval in two phases to establish 2024 base rates (Phase 1) on a cost-of-service basis and to establish a price cap rate setting mechanism (Phase 2) to be used for the remainder of the IR term. A third phase (Phase 3) has been established with the OEB as part of the Phase 1 Partial Settlement Proposal (Settlement Proposal).
On August 17, 2023, the OEB approved the Settlement Proposal to support the determination of just and reasonable rates effective January 1, 2024. Items resolved in whole or in part include:
•additions to rate base up to and including 2022;
•interest rates on debt and return on equity;
•deferral and variance accounts;
•Indigenous engagement; and
•rate implementation approach for 2024.
On December 21, 2023, the OEB issued its Decision and Order on Phase 1 (Phase 1 Decision). The decision addressed three main areas: energy transition, Enbridge Gas Distribution Inc. and Union Gas Limited amalgamation and harmonization issues, and other issues. The Phase 1 Decision included the following key findings or orders:
•energy transition risk requires Enbridge Gas to carry out a risk assessment to consider further risk mitigation measures in three areas: system access and expansion capital spending, system renewal capital spending and depreciation policy;
•our 2024 capital plan must be reduced by $250 million with a focus on monitoring, repair and life extension of our assets and a further $50 million of capitalized indirect overhead costs must be expensed, escalating to $250 million per year during the IR term with an offsetting adjustment to revenues in each year;
•all new small volume customers wishing to connect to natural gas pay their full connection costs as an upfront charge rather than through rates over time effective January 1, 2025;
•approval of a harmonized depreciation methodology that reduced the level of depreciation sought and adjusted asset lives including extensions of service life for certain asset classes;
•an increase in equity thickness from 36% to 38% effective for 2024; and
•January 1, 2024 will be the effective date for 2024 rates.
The issues addressed in the Settlement Proposal and the Phase 1 Decision resulted in the following items not approved for future recovery, and the subsequent impairments recognized for the year ended December 31, 2023:
•a portion of undepreciated capital projects removed from 2024 rate base of $41 million;
•undepreciated integration capital costs removed from 2024 rate base of $84 million; and
•pre-2017 Union Gas Limited related pension balances of $156 million.
Enbridge Gas filed a Notice of Appeal in the Ontario Divisional Court on January 22, 2024 regarding four aspects of the Phase 1 Decision: small volume customer revenue horizon, the 2024 capital plan reduction, the extension of service life for certain asset classes and equity thickness. On January 29, 2024 Enbridge Gas also filed a Notice of Motion with the OEB requesting the OEB to review and vary five aspects of the Phase 1 Decision: small volume customer revenue horizon, the 2024 capital plan reduction, integration capital, depreciation and equity thickness. The outcome of these proceedings is uncertain.
The Phase 1 Decision results in interim rates, pending phases 2 and 3 of the proceeding, resolution of the Notice of Appeal, Notice of Motion and any possible legislative steps that could be undertaken by the Government of Ontario further to the Ontario Minister of Energy's December 22, 2023 news release. Phase 2 will establish and determine the incentive rate mechanism for the remainder of the rebasing term, and gas cost and unregulated storage cost allocation. Phase 3 will address cost allocation and the harmonization of rates and rate classes between legacy rate zones.
Enbridge Gas continues to develop opportunities to support a lower-carbon future in Ontario. In 2021, we received OEB approval of an Integrated Resource Planning (IRP) framework and integrated the framework into our planning practices. The framework requires Enbridge Gas to consider facility and non-pipe demand and/or supply side alternatives (IRP alternatives) to address the systems needs of its regulated operations, where certain parameters have been met. The framework also allows Enbridge Gas to pursue an IRP alternative (or combination of IRP alternatives and facility alternative) where it is found to be in the best interests of Enbridge Gas and its customers, taking into account reliability and safety, cost-effectiveness, public policy, optimized scoping, and risk management.
On July 19, 2023, Enbridge Gas filed an application seeking approval for the cost consequences associated with two IRP pilot projects. The projects are designed to implement demand-side IRP alternatives, including enhanced targeted energy efficiency and residential demand response programs, in combination with supply-side IRP alternatives, in select communities in order to mitigate identified system constraints and associated facility projects. The pilot projects are intended to provide learnings on the performance of the selected IRP alternatives, including the potential for scalability, that can be leveraged in future IRP alternative plan design. An OEB decision is expected during 2024.
Renewable Power Generation
Renewable Power Generation is subject to numerous operational rules and regulations mandated by governments and applicable regulatory authorities, breaches of which could result in fines, penalties, operating restrictions and an overall increase in operating and compliance costs.
The North American Electric Reliability Council (NERC) is an international regulatory authority responsible for establishing and enforcing reliability standards to reduce risks to the reliability and security of the grid in Canada, the US, and Mexico. It is subject to oversight from the FERC in the US and provincial governments in Canada. The FERC has authority over many markets in the US and is tasked with ensuring safe, reliable, and secure interstate transmission of electricity, natural gas, and oil. This includes establishing reliability standards and determining certain pricing aspects of transmission development and access, among others. NERC and FERC standards and pricing decisions are also updated from time to time and could impact our operations, capital expenditures, earnings, and cash flows, though some of these impacts could be positive for our business.
At the US federal level, our Renewable Power Generation assets are subject to legislation overseen by the US Fish and Wildlife Service, which is aimed at reducing the impact of development and human activity on wildlife, along with other federal environmental permitting legislation. These federal environmental laws are subject to change from time to time which could require Enbridge to obtain new permits, update practices, or amend operations and operating expenditures.
In Canada, the Federal Government does not generally regulate the electricity sector, though it has imposed a federal carbon price on other sectors via its output-based pricing system (OBPS) and has proposed a Clean Electricity Regulation (CE Regulation) that would require Canada’s electricity grid to reach net-zero by 2035. The CE Regulation is expected to come into effect in 2024.
Policy changes may also provide new opportunities for existing assets and new developments. The US passed the Inflation Reduction Act in late 2022, which established long-term production and investment tax credits for renewable power generation, battery storage projects and for related manufacturing supply chains. Similarly, Canada has prepared legislation that would establish competitive tax credits for renewable power generation and battery storage projects, which it anticipates passing in early 2024. Changes to these tax programs could impact development plans.
Renewable Power Generation is also subject to provincial and state regulations governing the energy resource mix on the grid, emissions levels of the electricity grid, and market regulations related to emergency operations, extreme weather preparedness, and market participation, among others. These regulations may change from time to time, which could impact Enbridge’s operations and increase the costs of participating in regional electricity markets. In 2023, Texas introduced firming requirements that would require new wind and solar projects to be paired with batteries or other firm power supply and/or introduced caps on the percentage of the grid’s power that can be provided by variable generation. Other state and provincial governments are considering similar legislation.
Our Renewable Power Generation assets in France and Germany each have federal policies in place and are subject to directives and regulations established and enforced by the European Union (EU). These include the Renewable Energy Directive, the European Green Deal, and ongoing work on financing mechanisms and transmission directives and programs. The EU is also responsible for establishing environmental protection rules and permitting standards. During 2022, member states of the EU introduced extraordinary and temporary measures to address high energy prices including caps and demand reduction goals. As the minimum PPA prices in Germany and France are still honored, there are no negative implications to our PPA prices. The federal policies and regulations in place are subject to change from time to time, which could impact our operations and related expenditures; however, the EU’s general direction is to facilitate increased renewable power integration to its grid.
The United Kingdom (UK) government is responsible for establishing renewable energy and carbon pricing policies for the entire UK, as well as long-term electricity sector planning and procurement mechanisms and structure for auctions that are administered at the national level, e.g., England, Scotland, within the UK. Each country within the UK is also responsible for establishing its own environmental and permitting regulations. This process is still ongoing following Brexit and in some cases continues to result in more volatile merchant power prices; however, expanded interconnectors to Europe and policies aimed at increasing domestic renewable capacity are in progress. Governments have introduced temporary price controls, effective January 1, 2023, to address the significant increase in energy prices. The impact of merchant exposure on our Renewable Power Generation asset in the UK is limited by fixed revenue payments backed by the UK government.
Energy Services
Energy Services is regulated by government authorities in the areas of commodity trading, import and export compliance and the transportation of commodities. Non-compliance with governing rules and regulations could result in fines, penalties and operating restrictions. These consequences would have an adverse effect on operations, earnings, cash flows, financial condition and competitive advantage. Energy Services retains dedicated professional staff and has a robust regulatory compliance program (including targeted training) to mitigate these potential risks associated with the business.
In the US, commodity marketing is regulated by the Commodity Futures Trading Commission, the FERC, the SEC, the Federal Trade Commission, the various commodity exchanges, the US Department of Justice and state regulators. The provincial and territorial securities regulators similarly regulate commodity marketing within Canada and are members of the Canadian Securities Administrators. These various regulators enforce, among other things, the prohibition of market manipulation, fraud and disruptive trading.
The regulation of wholesale sales of electric energy is also regulated by the FERC, which authorizes Energy Services to sell electricity at market-based rates.
The export of natural gas out of Alberta is regulated by the Alberta Energy Regulator. The import and export of commodities between Canada and the US is subject to regulation by the CER and the US Department of Energy, as well as customs authorities. In particular, import and export permits are required, with associated regular reporting requirements. Breaches of import and export rules and permits could result in an inability to perform day to day operations, and can negatively impact the earnings of the business.
The transportation of crude oil and natural gas liquids by railcar or truck is regulated by the US DOT, Transport Canada and provincial regulation. Each jurisdiction requires compliance with security, safety, emergency management, and environmental laws and regulations related to ground transportation of commodities. Risks associated with transportation of crude or natural gas liquids include unplanned releases. In the event of a release, remediation of the affected area would be required. Energy Services engages third parties, such as Emergency Response Assistance Canada, the Chemical Transportation Emergency Center and the Canadian Transport Emergency Center to assist in such remediation.
ENVIRONMENTAL REGULATION
Pipeline Regulation
Our Liquids Pipelines and Gas Transmission and Midstream assets are subject to numerous federal, state and provincial environmental laws and regulations affecting many aspects of our present and future operations, including air emissions, water quality, water discharge and waste. These laws and regulations generally require us to obtain and comply with a wide variety of environmental licenses, permits and other approvals.
In particular, in the US, compliance with major Clean Air Act regulatory programs may cause us to incur significant capital expenditures to obtain permits, evaluate off-site impacts of our operations, install pollution control equipment, and otherwise assure compliance. Some equipment in states in which we operate are affected by the Good Neighbor Rule establishing new emission limits for nitrogen oxides. In addition, there are evolving regulations on environmental justice that could impact Enbridge facilities. The precise nature of these compliance obligations at each of our facilities has not been finally determined and may depend in part on future regulatory changes. In addition, compliance with new and emerging environmental regulatory programs may significantly increase our operating costs compared to historical levels.
In the US, climate change action is evolving at federal, state and regional levels. Pursuant to federal regulations, we are currently subject to an obligation to report our GHG emissions at our largest emitting facilities. On December 2, 2023 the Environmental Protection Agency (EPA) released a final rule to minimize methane emissions for new and existing crude oil and natural gas facilities, coupled later with a fee for excess emissions. The current US presidential administration has been implementing policies designed to combat climate change and reduce GHG emissions. In addition, a number of states have joined regional GHG initiatives, and a number are developing their own programs that would mandate reductions in GHG emissions. Public interest groups and regulatory agencies are increasingly focusing on the emission of methane associated with natural gas development and transmission as a source of GHG emissions. Based on proposed changes to measure, report and mitigate GHG emissions the expectation is that there will be a significant increase in costs to maintain and report compliance for businesses in our industry.
Canada has adopted a pan-Canadian approach to pricing carbon emissions to incent GHG emission reductions across all sectors of the economy. This approach was adopted in 2016 and entails both a consumer price on carbon, and an intensity-based system for industry which addresses competitiveness and carbon leakage. Provinces and territories may implement their own system of carbon pricing provided it meets the federal benchmark (and if they fail to do so the federal system will be imposed on them). In March 2022, Canada published its 2030 Emissions Reduction Plan (ERP) which builds on the Pan-Canadian Framework, and Net-Zero Emissions Accountability Act, and details the roadmap for Canada to meet its domestic climate target of a 40-45% reduction in GHG emissions by 2030 and attaining net-zero emissions by 2050. The ERP details the complementary policies and programs that Canada will enact to enable it to meet its domestic climate goal. Effective January 1, 2023, the federal carbon price was increased from $50 to $65 per tonne of carbon dioxide equivalent (tCO2e). This will increase by $15 per tonne each year and rise to $170 per tCO2e in 2030.
Gas Distribution and Storage
Our Gas Distribution and Storage operations, facilities and workers are subject to municipal, provincial and federal legislation which regulates the protection of the environment and the health and safety of workers. Environmental legislation primarily includes regulation of spills and emissions to air, land and water; hazardous waste management; the assessment and management of excess soil and contaminated sites; protection of environmentally sensitive areas, and species at risk and their habitats; and the reporting and reduction of GHG emissions.
Gas distribution system operation, as with any industrial operation, has the potential risk of abnormal or emergency conditions, or other unplanned events that could result in releases or emissions exceeding permitted levels. These events could result in injuries to workers or the public, adverse impacts to the environment, property damage and/or regulatory infractions including orders and fines. We could also incur future liability for soil and groundwater contamination associated with past and present site activities.
In addition to gas distribution, we also operate gas storage facilities and a small volume of oil and brine production in southwestern Ontario. Environmental risk associated with these facilities has the potential for unplanned releases. In the event of a release, remediation of the affected area would be required. There would also be potential for fines and orders under environmental legislation, and potential third-party liability claims by any affected landowners.
The gas distribution system and our other operations must maintain environmental approvals and permits from regulators to operate. As a result, these assets and facilities are subject to periodic inspections and/or audits. Reports are submitted to our regulators as required to demonstrate we are in good standing with our environmental requirements. Failure to maintain regulatory compliance could result in operational interruptions, fines, and/or orders for additional pollution control technology or environmental mitigation.
As environmental regulations continue to evolve and become more stringent, the cost to maintain compliance and the time required to obtain approvals continues to increase. A recent example includes the implementation of the new excess soil management requirements (Ontario Regulation 406/19) which has resulted in an increase in soil management costs and effort.
As in previous years, in 2023 we reported operational GHG emissions, including emissions from stationary combustion, flaring, venting and fugitive sources to Environment and Climate Change Canada, the Ontario Ministry of Environment, Conservation and Parks, and a number of voluntary reporting programs. In accordance with the provincial GHG regulations, stationary combustion and flaring emissions related to storage and transmission operations were verified in detail by a third-party accredited verifier with no material discrepancies found.
Enbridge Gas utilizes emissions data management processes and systems to help with the data capture and mandatory and voluntary reporting needs. Quantification methodologies and emission factors are updated in our systems as required. Enbridge Gas continues to work with industry associations to refine quantification methodologies and emissions factors, as well as best management practices to minimize emissions.
In October 2018, the federal government confirmed that Ontario is subject to the federal government’s carbon pricing program, otherwise known as the Federal Carbon Pricing Backstop Program. This program consists of two components: a carbon charge levied on fossil fuels, including natural gas, and an OBPS. This program applies in whole or in part to any province or territory that requested it or that did not have an equivalent carbon pricing system in place by January 1, 2019.
The federal carbon charge took effect on April 1, 2019 at a rate of 3.91 cents/cubic meter (m3) of natural gas and is applicable to the majority of customers. Enbridge Gas is registered as a natural gas distributor with the Canada Revenue Agency and remits the federal carbon charge on a monthly basis. The charge increases annually on April 1 of each year, rising to 12.39 cents/m3 in 2023. As confirmed by the federal government in July 2021, the federal carbon price will increase by $15 per tonne each year beginning in 2023, rising to $170 per tCO2e in 2030. This will equate to a federal carbon charge of 32.40 cents/m3 in 2030.
In September 2020, Ontario and the federal government announced that the federal government has accepted that Ontario’s Emission Performance Standards (EPS) will replace the federal OBPS for industrial facilities. In March 2021, the federal government announced that the federal OBPS would stand down in Ontario at the end of 2021 and Ontario would transition to the EPS effective January 1, 2022. In September 2021, the Greenhouse Gas Pollution Pricing Act was amended to remove Ontario as a covered province, enabling the EPS to take effect on January 1, 2022. Effective January 1, 2022, Enbridge Gas transitioned out of the federal OBPS to the provincial EPS. Enbridge Gas is registered with the Ontario Ministry of the Environment, Conservation and Parks as a covered facility under the EPS and has an annual compliance obligation for its facility-related stationary combustion and flaring emissions associated with its transmission and storage operations. Enbridge Gas must remit payment annually on the portion of emissions that exceed its total annual emissions limit. Payment is due the year following a compliance period and as such, Enbridge Gas remitted payment for its 2022 EPS compliance obligation in November 2023. Enbridge Gas will remit payment for its 2023 EPS compliance obligation in 2024.
Enbridge Gas applies to the OEB annually through a Federal Carbon Pricing Program application for approval of just and reasonable rates effective April 1 each year for the Enbridge Gas Distribution Inc. and Union Gas Limited rate zones, to recover the costs associated with the Federal Carbon Charge and EPS Regulation as a pass-through to customers.
Renewable Power Generation
In summer 2023, the Federal Government of Canada introduced its draft CE Regulation that would cap emissions on electricity generation resources on Canada’s grid. The CE Regulation would cap emissions from electricity generation sources at, or near zero tCO2e per megawatt hour. Details of the CE Regulation and related compliance are under negotiation with the provinces at this time, at least one of which has taken steps to formally resist the adoption of the CE Regulation. The Federal Government anticipates adopting the CE Regulation in 2024, which would begin to apply to projects in 2035, as drafted.
Similarly, the US EPA introduced emissions caps for utilities that would apply to certain coal and natural gas generation facilities by 2035. The caps would require applicable facilities to either capture a portion of carbon emissions and/or to co-fire using hydrogen.
Enbridge’s Renewable Power Generation resources are substantially non-emitting.
HUMAN CAPITAL RESOURCES
WORKFORCE SIZE AND COMPOSITION
As at December 31, 2023, we had approximately 11,500 regular employees, including approximately 1,500 unionized employees across our North American operations. This total rises to just over 13,400 if temporary employees and contractors are included. We have a strong preference for direct employment relationships but where we have collectively bargained-for employees, we have mature working relationships with our labor unions and the parties have traditionally committed themselves to the achievement of renewal agreements without a work stoppage.
SAFETY
We believe all injuries, incidents and occupational illnesses are preventable. Our overall focus on employee and contractor safety, continues to result in strong performance compared against industry benchmarks and we are actively engaged in continuous improvement exercises as we pursue our goal of zero incidents.
DIVERSITY, EQUITY AND INCLUSION
In 2020, we announced Enbridge’s ESG goals – including goals to increase representation of women, underrepresented ethnic and racial groups (including Indigenous peoples), people with disabilities and veterans – to ensure our workforce is reflective of the communities where we operate. In executing on our ESG strategy, we continue to track progress towards these representation goals in 2023. Consistent with our culture, we remain committed to open, two-way dialogue related to our goals, enhancing transparency and accountability for all stakeholders.
Diversity Representation Goals
PRODUCTIVITY AND DEVELOPMENT
We continually invest in our people’s personal and professional development and productivity because we recognize their success is our success. Employees are provided access to leading productivity tools and technology, and can opt in to a range of development and growth opportunities through a variety of channels, which encourages employees to build new skills needed for our core and emerging lines of business and the broader energy transition.
EXECUTIVE OFFICERS
The following table sets forth information regarding our executive officers as at February 9, 2024:
| | | | | | | | |
| Name | Age | Position |
| Gregory L. Ebel | 59 | President & Chief Executive Officer |
| Patrick R. Murray | 49 | Executive Vice President & Chief Financial Officer |
| Colin K. Gruending | 54 | Executive Vice President & President, Liquids Pipelines |
| Cynthia L. Hansen | 59 | Executive Vice President & President, Gas Transmission and Midstream |
| Michele E. Harradence | 55 | Executive Vice President & President, Gas Distribution & Storage |
| Matthew A. Akman | 56 | Executive Vice President, Corporate Strategy & President, Power |
| Reginald D. Hedgebeth | 56 | Executive Vice President, External Affairs and Chief Legal Officer |
| Maximilian G. Chan | 45 | Senior Vice President & Corporate Development Officer |
| Laura J. Sayavedra | 56 | Senior Vice President, Safety, Projects & Chief Administrative Officer |
Gregory L. Ebel was appointed President and Chief Executive Officer (CEO) on January 1, 2023. Mr. Ebel is also a member of the Enbridge Board of Directors. Mr. Ebel served as Chair of the Enbridge Board of Directors following the merger of Enbridge and Spectra Energy Corp (Spectra Energy) in 2017 until January 1, 2023. Prior to that time, he served as Chairman, President and CEO of Spectra Energy from 2009 until February 27, 2017. Previously, Mr. Ebel also served as Spectra Energy’s Group Executive and Chief Financial Officer beginning in 2007, President of Union Gas Limited from 2005 until 2007, and Vice President, Investor & Shareholder Relations of Duke Energy Corporation from 2002 until 2005.
Patrick R. Murray was appointed Executive Vice President & Chief Financial Officer (CFO) on July 1, 2023. Mr. Murray has oversight for all of Enbridge’s financial affairs including investor relations, financial reporting, financial planning, treasury, tax, insurance, risk and audit management functions. He also leads Enbridge’s technology and information services teams. Prior to assuming his current role, Mr. Murray was Senior Vice President & Chief Accounting Officer of Enbridge from June 2020 to June 2023, Vice President, Financial Planning & Analysis and Controller from June 2019 to May 2020,and Vice President, Financial Planning & Analysis from February 2017 to June 2019. Mr. Murray joined Enbridge over 25 years ago and has held a variety of roles within internal audit, corporate accounting, investor relations, treasury, and corporate development during that time.
Colin K. Gruending was appointed Executive Vice President and President, Liquids Pipelines on October 1, 2021. Mr. Gruending is responsible for the overall leadership and operations of Enbridge’s Liquids Pipelines business. Previously, he served as our Executive Vice President and Chief Financial Officer from June 2019 to October 2021; Senior Vice President, Corporate Development and Investment Review from May 2018 to June 2019; and Vice President, Corporate Development and Investment Review from February 2017 to May 2018.
Cynthia L. Hansen was appointed Executive Vice President and President, Gas Transmission and Midstream on March 1, 2022. Ms. Hansen is responsible for the overall leadership and operations of Enbridge’s natural gas pipeline and midstream business across North America. Previously, she served as our Executive Vice President, Gas Distribution and Storage from June 2019 to March 2022 and as Executive Vice President, Utilities and Power Operations from February 2017 to June 2019. Ms. Hansen is also the Executive Sponsor for Asset and Work Management Transformation across Enbridge, working with other business unit leaders.
Michele E. Harradence was appointed Executive Vice President & President, Gas Distribution & Storage on March 5, 2023. She is responsible for the overall leadership and operations of Ontario-based Enbridge Gas, as well as Gazifère, which serves the Gatineau region of Québec. Prior to assuming her current role, Ms. Harradence was Senior Vice President & President, Gas Distribution and Storage from March 2022 to March 2023. Prior thereto, she was Senior Vice President and Chief Operations Officer of Enbridge’s Gas Transmission and Midstream business unit from June 2019 to March 2022 and Senior Vice President Operations, Gas Transmission and Midstream from February 2017 to June 2019.
Matthew A. Akman was appointed Executive Vice President, Corporate Strategy & President, Power on March 5, 2023. Mr. Akman is responsible for the overall leadership and operations of Enbridge’s power business and also leads our new energy technologies and corporate strategy efforts. Prior to assuming his current role, Mr. Akman was Senior Vice President, Corporate Strategy & President, Power from January 2023 to March 2023. Prior thereto, he was Senior Vice President, Strategy, Power & New Energy Technologies from October 2021 to December 2022, and Senior Vice President, Strategy & Power from June 2019 to October 2021. Mr. Akman joined Enbridge in early 2016 as our head of Corporate Strategy and also previously held responsibilities for Corporate Development and Investor Relations.
Reginald D. Hedgebeth was appointed Executive Vice President, External Affairs and Chief Legal Officer on January 1, 2024. Mr. Hedgebeth leads our legal, public affairs, communications & sustainability, corporate security and aviation teams across the organization. Prior to joining Enbridge, Mr. Hedgebeth served as Chief Legal Officer of Capital Group from January 2021 to June 2023, Executive Vice President, General Counsel and Chief Administrative Officer of Marathon Oil Corporation from April 2017 to December 2020 and, prior to its merger with Enbridge in 2017, General Counsel, Corporate Secretary and Chief Ethics and Compliance Officer for Spectra Energy.
Maximilian G. Chan was appointed Senior Vice President & Corporate Development Officer on March 1, 2022. He was later appointed to the Executive Leadership team on May 8, 2023. Mr. Chan is responsible for the oversight of mergers and acquisitions, capital allocation, investment review, integration and corporate growth objectives. Prior to assuming his current role, Mr. Chan was Vice President, Treasury and Head of Enterprise Risk for Enbridge from February 2020 to March 2022,and Vice President, Treasury from July 2018 to February 2020.
Laura J. Sayavedra was appointed Senior Vice President, Safety, Projects & Chief Administrative Officer on January 1, 2024. Ms. Sayavedra is responsible for the oversight of our safety, capital project execution, human resources, real estate and supply chain management functions. Prior to assuming her current role, Ms. Sayavedra was Senior Vice President, Safety & Reliability, Projects and Unify from March 2022 to December 2023. Prior to that, she led Finance Transformation at Enbridge, and prior to its merger with Enbridge in 2017, was also Vice President & Treasurer for Spectra Energy, and CFO of Spectra Energy Partners LP. She has held various finance, strategy, and business development executive leadership roles.
ADDITIONAL INFORMATION
Additional information about us is available on our website at www.enbridge.com, on SEDAR+ at www.sedarplus.ca and on EDGAR at www.sec.gov. The aforementioned information is made available in accordance with legal requirements and is not, unless otherwise specifically stated, incorporated by reference into this Annual Report on Form 10-K. We make available free of charge, through our website, annual reports on Form 10-K, quarterly reports on Form 10-Q and current reports on Form 8-K and amendments to those reports filed or furnished pursuant to Section 13(a) or 15(d) of the Exchange Act, as well as proxy statements, as soon as reasonably practicable after we electronically file such material with, or furnish it to, the SEC. Reports, proxy statements and other information filed with the SEC may also be obtained through the SEC’s website (www.sec.gov).
ENBRIDGE GAS INC.
Additional information about Enbridge Gas can be found in its annual information form, financial statements and MD&A for the year ended December 31, 2023, which have been filed with the securities commissions or similar authorities in each of the provinces of Canada. These documents contain detailed disclosure with respect to Enbridge Gas and are publicly available on SEDAR+ at www.sedarplus.ca. These documents are not, unless otherwise specifically stated, incorporated by reference into this Annual Report on Form 10-K.
ENBRIDGE PIPELINES INC.
Additional information about Enbridge Pipelines Inc. (EPI) can be found in its annual information form, financial statements and MD&A for the year ended December 31, 2023, which have been filed with the securities commissions or similar authorities in each of the provinces of Canada. These documents contain detailed disclosure with respect to EPI and are publicly available on SEDAR+ at www.sedarplus.ca. These documents are not, unless otherwise specifically stated, incorporated by reference into this Annual Report on Form 10-K.
WESTCOAST ENERGY INC.
Additional information about Westcoast can be found in its financial statements and MD&A for the year ended December 31, 2023, which have been filed with the securities commissions or similar authorities in each of the provinces of Canada. These documents contain detailed disclosure with respect to Westcoast and are publicly available on SEDAR+ at www.sedarplus.com. These documents are not, unless otherwise specifically stated, incorporated by reference into this Annual Report on Form 10-K.
ITEM 1A. RISK FACTORS
The following risk factors could materially and adversely affect our business, operations, financial results, market price or value of our securities. This list is not exhaustive, and we place no priority or likelihood based on order of presentation or grouping under sub-captions.
RISKS RELATED TO CLIMATE CHANGE
Climate change risks could adversely affect our reputation, strategic plan, business, operations and financial results, and these effects could be material.
Climate change is a systemic risk that presents both physical and transition risks to our organization. A summary of these risks is outlined below. Given the interconnected nature of climate change-related impacts, we also discuss these risks within the context of other risks impacting Enbridge throughout Item 1A. Risk Factors. Climate change and its associated impacts may also increase our exposure to, and magnitude of, other risks identified in Item 1A. Risk Factors. Our business, financial condition, results of operations, cash flows, reputation, access to and cost of capital or insurance, business plans or strategy may all be materially adversely impacted as a result of climate change and its associated impacts.
PHYSICAL RISKS
Climate-related physical risks, resulting from changing and more extreme weather, can damage our assets and affect the safety and reliability of our operations. Climate-related physical risks may be acute or chronic. Acute physical risks are those that are event-driven, including increased frequency and severity of extreme weather events, such as heavy snowfall, heavy rainfall, floods, landslides, fires, hurricanes, cyclones, tornados, tropical storms, ice storms, and extreme temperatures. Chronic physical risks are longer-term shifts in climate patterns, such as long-term changes in precipitation patterns, or sustained higher temperatures, which may cause sea level rises or chronic heat waves.
Our assets are exposed to potential damage or other negative impacts from these kinds of events, which could result in reduced revenue from business disruption or reduced capacity and may also lead to increased costs due to repairs and required adaptation measures. Such events may also result in personal injury, loss of life or damage to property and the environment. We have experienced operational interruptions and damage to our assets from such weather events in the past, and we expect to continue to experience climate-related physical risks in the future, potentially with increasing frequency or severity.
TRANSITION RISKS
Transition risks relate to the transition to a lower-emissions economy, which may increase our cost of operations, impact our business plans, and influence stakeholder decisions about our company, each of which could adversely impact our reputation, strategic plan, business, operations or financial results. These transition risks include the following categories:
•Policy and legal risks
Policy and legal risks may result from evolving government policy, legislation, regulations and regulatory decisions focused on climate change, as well as changing political and public opinion, stakeholder opposition, legal challenges, litigation and regulatory proceedings. Foreign and domestic governments continue to evaluate and implement policy, legislation, and regulations regarding reduction of GHG emissions, adaptation to climate change, and transition to a lower-carbon economy. Such policies, laws and regulations vary at the federal, state, provincial and municipal levels in which Enbridge operates and are continually evolving. The implementation of these measures may be accelerated by international multilateral agreements, increasing physical impacts of climate change, and changing political and public opinion. Enbridge is currently required to adhere to a number of carbon-pricing mechanisms, including explicit carbon prices (i.e., in BC) and implicit carbon prices (i.e., Canadian federal OBPS). In Canada, the federal government has proposed new clean electricity regulations and is considering options to cap and cut oil and gas sector GHG emissions, which may impact our business. Such evolving policy, legislation and regulation could impact commodity demand and the overall energy mix we deliver and may result in significant expenditures and resources, as well as increased costs for our customers. In recent years, there has been an increase in climate-related regulatory action and litigation which has the potential to adversely impact our reputation, business, operations and financial results.
•Technology risks
Our success in executing our strategic plan, including adapting to the energy transition over time and attaining our GHG emissions reduction goals and targets, depends, in part, on technology (including technology still under development), innovation and continued diversification with renewable power and other lower-carbon energy infrastructure as well as modernization of our infrastructure, all of which could require significant capital expenditures and resources, that could materially differ from our original estimates and expectations. There is also a risk that GHG emissions reduction technology does not materialize as expected, making it more difficult to reduce emissions, or that political or public opinion regarding such technologies continues to evolve.
•Market risks
Climate change concerns, increased demand for lower-carbon and zero-emissions energy, alternative and new energy sources and technologies, changing customer behavior and reduced energy consumption could impact the demand for our services or securities. In recent years, there has been a push toward certain investors decreasing the carbon intensity of their portfolios and pressure for banks and insurance providers to reduce or cease support for oil and natural gas and related infrastructure businesses and projects. Potential impacts include increased costs to manage these risks, adverse impacts to our access to and cost of capital, and reduced demand for, or value of, our securities. The pace and scale of the transition to a lower-carbon economy may pose a risk if Enbridge diversifies either too quickly or too slowly. Similarly, uncertainty in market signals, such as abrupt and unexpected shifts in energy costs and demands, including due to climate change concerns, can impact revenue through reduced throughput volumes on our pipeline transportation systems.
•Reputational risks
Companies across all sectors and industries are facing changing expectations or increasing scrutiny from stakeholders related to their approach to climate change and GHG emissions. Companies in the energy industry are experiencing stakeholder opposition to both existing and new infrastructure, as well as organized opposition to oil and natural gas extraction and shipment of oil and natural gas products. If we are not able to achieve our GHG emissions reduction goals and targets, are not able to meet future climate, emissions or other regulatory or reporting requirements, or are not able to meet or manage current and future expectations and issues regarding climate change that are important to our stakeholders, it could negatively impact our reputation and, in turn, our business, operations or financial results.
•Disclosure risks
Enbridge currently provides certain climate-related disclosures, and from time to time, establishes and publicly announces goals and commitments related to climate change, including reduction of GHG emissions. Standards and processes for climate-related disclosure, setting goals and targets, and measuring and reporting on progress are still developing for our sector and continue to evolve. Our internal controls and processes also continue to evolve, and our climate-related disclosures, goals and targets are based on assumptions that are subject to change. Aligning with evolving requirements has required and may continue to require us to incur significant costs. There can be no assurance that our current or future disclosures and goals, the pathways by which we plan to reach our goals, or the methodologies that we currently use to measure and report on progress, will align with new and evolving standards and processes, legal requirements or expectations of stakeholders. Such misalignment may result in reputational harm, regulatory action or other legal action.
RISKS RELATED TO OPERATIONAL DISRUPTION OR CATASTROPHIC EVENTS
Operation of complex energy infrastructure involves many hazards and risks that may adversely affect our business, financial results and the environment.
These operational risks include adverse weather conditions, natural disasters, accidents, the breakdown or failure of equipment or processes, and lower than expected levels of operating capacity and efficiency. These operational risks could be catastrophic in nature.
Operational risk is also intensified by climate change. Climate change presents physical risks that may affect the safety and reliability of our operations. These include acute physical risks, such as heavy snowfall, heavy rainfall, floods, landslides, fires, hurricanes, cyclones, tornados, tropical storms, ice storms, and extreme temperatures, and chronic physical risks, such as long-term changes in precipitation patterns, or sustained higher temperatures.
Our assets and operations are exposed to potential damage or other negative impacts from these operational risks, which could result in reduced revenue from business disruption or reduced capacity and may also lead to increased costs due to repairs and required adaptation measures. Such events have led to, and could in the future lead to, rupture or release of product from our pipeline systems and facilities, resulting in damage to property and the environment, personal injury or loss of life, which could result in substantial losses for which insurance may not be sufficient or available and for which we may bear part or all of the cost.
An environmental incident is an event that may cause environmental harm and could lead to increased operating and insurance costs, thereby negatively impacting earnings. An environmental incident could have lasting reputational impacts and could impact our ability to work with various stakeholders. For pipeline and storage assets located near populated areas, including residential communities, commercial business centers, industrial sites and other public gathering locations, the level of damage resulting from these events could be greater.
We have experienced such events in the past, and expect to continue to incur significant costs in preparing for or responding to operational risks and events. We expect to continue to experience climate-related physical risks, potentially with increasing frequency and severity, and we cannot guarantee that we will not experience catastrophic or other events in the future. In addition, we could be subject to litigation and significant fines and penalties from regulators in connection with any such events.
A service interruption could have a significant impact on our operations, and negatively impact financial results, relationships with stakeholders and our reputation.
A service interruption due to a major power disruption, curtailment of commodity supply, operational incident, security incident (cyber or physical), availability of gas supply or distribution or other reasons could have a significant impact on our operations and negatively impact financial results, relationships with stakeholders, our reputation or the safety of our end-use customers. Service interruptions that impact our crude oil and natural gas transportation services can negatively impact shippers’ operations and earnings as they are dependent on our services to move their product to market or fulfill their own contractual arrangements, and this has in the past and may again lead to claims against us. We have experienced, and may again experience, service interruptions, restrictions or other operational constraints, including in connection with the kinds of operational incidents referred to in the previous risk factor.
Our operations involve safety risks to the public and to our workers and contractors.
Several of our pipelines and distribution systems are operated in close proximity to populated areas and a major incident could result in injury or loss of life to members of the public. In addition, given the natural hazards inherent in our operations, our workers and contractors are subject to personal safety risks. A public safety incident or an injury or loss of life to our workers or contractors, which we have experienced in the past and, despite the precautions we take, may experience in the future, could result in reputational damage to us, material repair costs or increased operating and insurance costs.
Cyber attacks and other cybersecurity incidents pose threats to our technology systems and could materially adversely affect our business, operations, reputation or financial results.
Our business is dependent upon information systems and other digital technologies for controlling our plants, pipelines and other assets, processing transactions and summarizing and reporting results of operations. The secure processing, maintenance and transmission of information is critical to our operations.
Cybersecurity risks have increased in recent years as a result of the proliferation of new technologies and the increased sophistication of cyber attacks and financially motivated cybercrime, as well as due to international and domestic political factors including geopolitical tensions, armed hostilities, war, civil unrest, sabotage, terrorism and state-sponsored or other cyber espionage. Human error or malfeasance can also contribute to a cyber incident, and cyber attacks can be internal as well as external and occur at any point in our supply chain. Because of the critical nature of our infrastructure and our use of information systems and other digital technologies to control our assets, we face a heightened risk of cyber attacks, such as ransomware, theft, misplaced or lost data, programming errors, phishing attacks, denial of service attacks, acts of vandalism, computer viruses, malware, hacking, malicious attacks, software vulnerabilities, employee errors and/or malfeasance, or other attacks, security or data breaches or other cybersecurity incidents. Cyber threat actors have attacked and threatened to attack energy infrastructure, and various government agencies have increasingly stressed that these attacks are targeting critical infrastructure, including pipelines, public utilities, and power generation, and are increasing in sophistication, magnitude, and frequency. Additionally, these risks may escalate during periods of heightened geopolitical tensions. New cybersecurity legislation, regulations and orders have been recently implemented or proposed, resulting in additional actual and anticipated regulatory oversight and compliance requirements, which will require significant internal and external resources. We cannot predict the potential impact to our business of potential future legislation, regulations or orders relating to cybersecurity.
We have experienced an increase in the number of attempts by external parties to access our systems or our company data without authorization, and we expect this trend to continue. Although we devote significant resources and security measures to prevent unwanted intrusions and to protect our systems and data, whether such data is housed internally or by external third parties, we and our third party vendors have experienced and expect to continue to experience cyber attacks of varying degrees in the conduct of our business. To-date, these prior cyber attacks have not, to our knowledge, had a material adverse effect on our business, operations or financial results. However, there is a risk that any such incidents could have a material adverse effect on us in the future.
Our technology systems or those of our vendors or other service providers are expected to become the target of further cyber attacks or security breaches which could compromise our data and systems or our access thereto by us, our customers or others, affect our ability to correctly record, process and report transactions, result in the loss of information, or cause operational disruption or incidents. There can be no assurance that our business continuity plans will be completely effective in avoiding disruption and business impacts.Furthermore, we and some of our third-party service providers (who may in turn also use third-party service providers) collect, process or store sensitive data in the ordinary course of our business, including personal information of our employees, residential gas distribution customers, land owners and investors, as well as intellectual property or other proprietary business information of ours or our customers or suppliers.We and some of our third-party services providers will process increasing amounts of personal information upon the closing of the previously announced acquisitions of gas utilities in the US, due to their large residential customer bases.
As a result of the foregoing, we could experience loss of revenues, repair, remediation or restoration costs, regulatory action, fines and penalties, litigation, breach of contract or indemnity claims, cyber extortion, ransomware, implementation costs for additional security measures, loss of customers, customer dissatisfaction, reputational harm, be liable under laws that protect the privacy of personal information, other negative consequences, or other costs or financial loss.These risks may be heightened, and the consequences magnified, upon closing of the Acquisitions. Regardless of the method or form of cyber attack or incident, any or all of the above could materially adversely affect our reputation, business, operations or financial results.
In addition, a cyber attack could occur and persist for an extended period without detection. Any investigation of a cyber attack or other security incident may be inherently unpredictable, and it would take time before the completion of any investigation and availability of full and reliable information. During such time, we may not know the extent of the harm or how best to remediate it, and certain errors or actions could be repeated or compounded before they are discovered and remediated, all or any of which could further increase the costs and consequences of a cyber attack or other security incident, and our remediation efforts may not be successful. The inability to implement, maintain and upgrade adequate safeguards could materially and adversely affect our results of operations, cash flows, and financial condition. Moreover, recent rulemakings may require us to disclose information about a cybersecurity incident before it has been completely investigated or remediated in full or even in part. As cyber attacks continue to evolve, we may be required to expend significant additional resources to continue to modify or enhance our protective measures or to investigate and remediate any information security vulnerabilities.
Furthermore, media reports about a cyber attack or other significant security incident affecting Enbridge, whether accurate or not, or, under certain circumstances, our failure to make adequate or timely disclosures to the public, law enforcement, other regulatory agencies or affected individuals following any such event, whether due to delayed discovery or otherwise, could negatively impact our operating results and result in other negative consequences, including damage to our reputation or competitiveness, harm to our relationships with customers, partners, suppliers, investors, and other third parties, interruption to our management, remediation or increased protection costs, significant litigation or regulatory action, fines or penalties, all of which could materially adversely affect our business, operations, reputation or financial results.
Terrorist attacks and threats, escalation of military activity in response to these attacks or acts of war, and other civil unrest or activism could adversely affect our business, operations or financial results.
Terrorist attacks and threats (which may take the form of cyber attacks), escalation of military activity, armed hostilities, war, sabotage, or civil unrest or activism may have significant effects on general economic conditions and may cause fluctuations in consumer confidence and spending and market liquidity, each of which could adversely affect our business. Future terrorist attacks, rumors or threats of war, actual conflicts involving the US or Canada, or military or trade disruptions may significantly affect our operations and those of our customers. Strategic critical infrastructure targets, such as energy-related assets, are at greater risk of cyber attack and may be at greater risk of other future attacks than other targets in the US and Canada. Enbridge’s infrastructure and projects under construction could be direct targets or indirect casualties of a cyber or physical attack. In addition, increased environmental activism against pipeline construction and operation could potentially result in work delays, reduced demand for our products and services, new legislation or public policy or increased stringency thereof, or denial or delay of permits and rights-of-way.
Pandemics, epidemics or infectious disease outbreaks, such as the COVID-19 pandemic, may adversely affect local and global economies and our business, operations or financial results.
Disruptions caused by pandemics, epidemics or infectious disease outbreaks could materially adversely affect our business, operations, financial results and forward-looking expectations. Governments' emergency measures to combat the spread could include restrictions on business activity and travel, as well as requirements to isolate or quarantine. The duration and magnitude of such impacts will depend on many factors that we may not be able to accurately predict. COVID-19 and government responses interrupted business activities and supply chains, disrupted travel, and contributed to significant volatility in the financial and commodity markets.
Disruptions related to pandemics, epidemics or infectious disease outbreaks could have the effect of heightening many of the other risks described in this Item 1A. Risk Factors.
RISKS RELATED TO OUR BUSINESS AND INDUSTRY
There are utilization risks with respect to our assets.
With respect to our Liquids Pipelines assets, we are exposed to throughput risk on the Canadian Mainline, and we are exposed to throughput risk under certain tolling agreements applicable to other Liquids Pipelines assets, such as the Lakehead System. A decrease in volumes transported can directly and adversely affect our revenues and earnings. Factors such as changing market fundamentals, capacity bottlenecks, regulatory restrictions, maintenance and operational incidents on our system and upstream or downstream facilities, and increased competition can all impact the utilization of our assets. Market fundamentals, such as commodity prices and price differentials, weather, gasoline price and consumption, alternative and new energy sources and technologies, and global supply disruptions outside of our control can impact both the supply of and demand for crude oil and other liquid hydrocarbons transported on our pipelines.
With respect to our Gas Transmission and Midstream assets, gas supply and demand dynamics continue to change due to shifts in regional and global production and consumption. These shifts can lead to fluctuations in commodity prices and price differentials, which could result in our system not being fully utilized in some areas. Other factors affecting system utilization include operational incidents, regulatory restrictions, system maintenance, and increased competition.
With respect to our Gas Distribution and Storage assets, customers are billed on both a fixed charge and volumetric basis and our ability to collect the total revenue requirement (the cost of providing service, including a reasonable return to the utility) depends on achieving the forecast distribution volume established in the rate-making process. The probability of realizing such volume is contingent upon four key forecast variables: weather, economic conditions, pricing of competitive energy sources and growth in the number of customers. Weather is a significant driver of delivery volumes, given that a significant portion of our Gas Distribution customer base uses natural gas for space heating. Distribution volume may also be impacted by the increased adoption of energy efficient technologies, along with more efficient building construction, that continue to place downward pressure on consumption. In addition, conservation efforts by customers may further contribute to a decline in annual average consumption. Sales and transportation service to large volume commercial and industrial customers is more susceptible to prevailing economic conditions. As well, the pricing of competitive energy sources affects volume distributed to these sectors as some customers have the ability to switch to an alternate fuel. Even in those circumstances where we attain our respective total forecast distribution volume, our Gas Distribution business may not earn its expected ROE due to other forecast variables, such as the mix between the higher margin residential and commercial sectors and the lower margin industrial sector. Our Gas Distribution business remains at risk for the actual versus forecast large volume contract commercial and industrial volumes.
With respect to our Renewable Power Generation assets, earnings from these assets are highly dependent on weather and atmospheric conditions as well as continued operational availability of these energy producing assets. While the expected energy yields for Renewable Power Generation projects are predicted using long-term historical data, wind and solar resources are subject to natural variation from year-to-year and from season-to-season. Any prolonged reduction in wind or solar resources at any of the Renewable Power Generation facilities could lead to decreased earnings and cash flows. Additionally, inefficiencies or interruptions of Renewable Power Generation facilities due to operational disturbances or outages resulting from weather conditions or other factors, could also impact earnings.
Our assets vary in age and were constructed over many decades which causes our inspection, maintenance or repair costs to increase.
Our pipelines vary in age and were constructed over many decades. Pipelines are generally long-lived assets, and pipeline construction and coating techniques have changed over time. Depending on the era of construction and construction techniques, some assets require more frequent inspections, which has resulted in and is expected to continue to result in increased maintenance or repair expenditures in the future. Any significant increase in these expenditures could adversely affect our business, operations or financial results.
Competition may result in a reduction in demand for our services, fewer project opportunities or assumption of risk that results in weaker or more volatile financial performance than expected.
Our Liquids Pipelines business faces competition from competing carriers available to ship liquid hydrocarbons to markets in Canada, the US and internationally and from proposed pipelines that seek to access basins and markets currently served by our Liquids Pipelines. Competition among existing pipelines is based primarily on the cost of transportation, access to supply, the quality and reliability of service, contract carrier alternatives and proximity to markets. The liquids transported in our pipelines currently, or are expected to increasingly, compete with other emerging alternatives for end-users, including, but not limited to, electricity, electric batteries, biofuels, and hydrogen. Additionally, we face competition from alternative storage facilities. Our natural gas transmission and storage businesses compete with similar facilities that serve our supply and market areas in the transmission and storage of natural gas. The natural gas transported in our business also competes with other forms of energy available to our customers and end-users, including electricity, coal, propane, fuel oils, and renewable energy. Our Renewable Power Generation business faces competition in the procurement of long-term power purchase agreements and from other fuel sources in the markets in which we operate. Competition in all of our businesses, including competition for new project development opportunities, could have a negative impact on our business, financial condition or results of operations.
Completion of our secured projects and maintenance programs are subject to various regulatory, operational and market risks, which may affect our ability to drive long-term growth.
Our project execution continues to face challenges with intense scrutiny on regulatory and environmental permit applications, politicized permitting, public opposition including protests, action to repeal permits, and resistance to land access. We have experienced permit denials, in particular, in relation to necessary maintenance on the Line 5 Pipeline on the Bad River Reservation in northern Wisconsin based on a stated desire of the Bad River Band to shut down the pipeline.
Continued challenges with global supply chains have created unpredictability in materials cost and availability. Labor shortages and inflationary pressures have increased costs of engineering and construction services.
Other events that can and have delayed project completion and increased anticipated costs include contractor or supplier non-performance, extreme weather events or geological factors beyond our control.
Changing expectations of stakeholders regarding ESG and climate change practices could erode stakeholder trust and confidence, damage our reputation and influence actions or decisions about our company and industry and have negative impacts on our business, operations or financial results.
Companies across all sectors and industries are facing changing expectations or increasing scrutiny from stakeholders related to their approach to ESG matters of greatest relevance to their business and to their stakeholders. For energy companies, climate change, GHG emissions, safety and stakeholder and Indigenous relations remain primary focus areas, while other environmental elements such as biodiversity, human rights, and supply chain are ascendant. Companies in the energy industry are experiencing stakeholder opposition to new and existing infrastructure, as well as organized opposition to oil and natural gas extraction and shipment of oil and natural gas products. Changing expectations of our practices and performance across these ESG areas may impose additional costs or create exposure to new or additional risks. We are also exposed to the risk of higher costs, delays, project cancellations, loss of ability to secure new growth opportunities, new restrictions or the cessation of operations of existing pipelines due to increasing pressure on governments and regulators, and legal action, such as the legal challenges to the operation of Line 5 in Michigan and Wisconsin.
Our operations, projects and growth opportunities require us to have strong relationships with key stakeholders, including local communities, Indigenous groups and others directly impacted by our activities, as well as governments, regulatory agencies, investors and investor advocacy groups, investment funds, financial institutions, insurers and others, which are increasingly focused on ESG practices and performance. Enhanced public awareness of climate change has driven an increase in demand for lower-carbon and zero-emissions energy. There have been efforts in recent years affecting the investment community, including certain investors increasing investments in lower-carbon assets and businesses while decreasing the carbon intensity of their portfolios through, among other measures, divestments of companies with high exposure to GHG-intensive operations and products. Certain stakeholders have also pressured commercial and investment banks and insurance providers to reduce or stop financing and providing insurance coverage to oil and natural gas and related infrastructure businesses and projects. Managing these risks requires significant effort and resources. Potential impacts could also include changing investor sentiment regarding investment in Enbridge, which could impair our access to and increase our cost of capital, including penalties associated with our sustainability-linked financing and could adversely impact demand for, or value of, our securities.
Over the past year, geopolitical uncertainty, slowing Canadian and US economies and continuing inflationary pressures have underscored the critical need for access to secure, affordable energy.
The pace and scale of the transition to a lower-emission economy may pose a risk if Enbridge diversifies either too quickly or too slowly. Similarly, unexpected shifts in energy demands, including due to climate change concerns, can impact revenue through reduced throughput volumes on our pipeline transportation systems.
We have long been committed to strong ESG practices, performance and reporting, and in 2020 introduced a set of ESG goals to strengthen transparency and accountability. The goals include increasing diversity and inclusion within our organization and reducing GHG emissions from our operations to net-zero by 2050, with corporate and business unit action plans aligned to our strategic priority to adapt to the energy transition over time. The costs associated with meeting our ESG goals, including our GHG emissions reduction goals, could be significant. There is also a risk that some or all of the expected benefits and opportunities of achieving our ESG goals may fail to materialize, may cost more than anticipated to achieve, may not occur within the anticipated time periods or may no longer meet changing stakeholder expectations. Similarly, there is a risk that emissions reduction technologies do not materialize as expected making it more difficult to reduce emissions. If we are not able to achieve our ESG goals, are not able to meet current and future climate, emissions or related reporting requirements of regulators, or are unable to meet or manage current and future expectations regarding issues important to investors or other stakeholders (including those related to climate change), it could erode stakeholder trust and confidence, which could negatively impact our reputation, business, operations or financial results.
Our forecasted assumptions may not materialize as expected, including on our expansion projects, acquisitions and divestitures.
We evaluate expansion projects, acquisitions and divestitures on an ongoing basis. Planning and investment analysis is highly dependent on accurate forecasting assumptions and to the extent that these assumptions do not materialize, financial performance may be lower or more volatile than expected. Volatility and unpredictability in the economy, both locally and globally, and changes in cost estimates, project scoping and risk assessment could result in a loss of profits. Similarly, uncertainty in market signals, such as abrupt and unexpected shifts in energy costs and demands, as we saw in 2020 resulting from the COVID-19 pandemic, have impacted, and may in the future impact, revenue through reduced throughput volumes on our pipeline transportation systems.
One or all of the Acquisitions may not occur on the terms contemplated in the applicable Purchase and Sale Agreement or at all, or may not occur within the expected time frame, which may negatively affect the benefits we expect to obtain from the Acquisitions.
We cannot provide any assurance that the Acquisitions will be completed in the manner, on the terms and on the time frame currently anticipated, or at all. Completion of each of the Acquisitions is subject to the satisfaction or waiver of a number of conditions as set forth in the applicable Purchase and Sale Agreement that are beyond our control and may prevent, delay or otherwise materially adversely affect its completion.
The success of the Acquisitions will depend on, among other things, our ability to integrate the US gas utilities into our business in a manner that facilitates growth opportunities and achieves anticipated results. There is a significant degree of difficulty and management distraction inherent in the process of integrating an acquisition, including challenges integrating certain operations and functions (including regulatory functions), technologies, organizations, procedures, policies and operations, addressing differences in the business cultures of Enbridge and the US gas utilities and retaining key personnel. The integration may be complex and time consuming and involve delays or additional and unforeseen expenses. The integration process and other disruptions resulting from the Acquisitions may also disrupt our ongoing business.
Any failure to realize the anticipated benefits of the Acquisitions, additional unanticipated costs or other factors could negatively impact our earnings or cash flows, decrease or delay any beneficial effects of the Acquisitions and negatively impact our business, financial condition and results of operations.
Our insurance coverage may not fully cover our losses in the event of an accident, natural disaster or other hazardous event, and we may encounter increased cost arising from the maintenance of, or lack of availability of, insurance.
Our operations are subject to many hazards inherent in our industry as described in this Item 1A. Risk Factors. We maintain an insurance program for us, our subsidiaries and certain of our affiliates to mitigate a certain portion of our risks. However, not all potential risks arising from our operations are insurable, or are insured by us as a result of availability, high premiums and for various other reasons. Enbridge self-insures a significant portion of certain risks through our wholly-owned captive insurance subsidiaries, and Enbridge’s insurance coverage is subject to terms and conditions, exclusions and large deductibles or self-insured retentions which may reduce or eliminate coverage in certain circumstances.
Enbridge’s insurance policies are generally renewed on an annual basis and, depending on factors such as market conditions, the premiums, terms, policy limits and/or deductibles can vary substantially. We can give no assurance that we will be able to maintain adequate insurance in the future at rates or on other terms we consider commercially reasonable. In such case, we may decide to self-insure additional risks.
A significant self-insured loss, uninsured loss, a loss significantly exceeding the limits of our insurance policies, a significant delay in the payment of a major insurance claim, or the failure to renew insurance policies on similar or favorable terms could materially and adversely affect our business, financial condition and results of operations.
Our business is exposed to changes in market prices including interest rates and foreign exchange rates. Our risk management policies cannot eliminate all risks and may result in material financial losses. In addition, any non-compliance with our risk management policies could adversely affect our business, operations or financial results.
Our use of debt financing exposes us to changes in interest rates on both future fixed rate debt issuances and floating rate debt. While our financial results are denominated in Canadian dollars, many of our businesses have foreign currency revenues or expenses, particularly the US dollar. Changes in interest rates and foreign exchange rates could materially impact our financial results.
We use financial derivatives to manage risks associated with changes in foreign exchange rates, interest rates, commodity prices, power prices and our share price to reduce volatility of our cash flows. Based on our risk management policies, substantially all of our financial derivatives are associated with an underlying asset, liability and/or forecasted transaction and not intended for speculative purposes.
These policies cannot, however, eliminate all risk, including unauthorized trading. Although this activity is monitored independently by our Risk Management function, we can provide no assurance that we will detect and prevent all unauthorized trading and other violations, particularly if deception, collusion or other intentional misconduct is involved, and any such violations could adversely affect our business, operations or financial results.
To the extent that we hedge our exposure to market prices, we will forego the benefits we would otherwise experience if these were to change in our favor. In addition, hedging activities can result in losses that might be material to our financial condition, results of operations and cash flows. Such losses have occurred in the past and could occur in the future. See Part II, Item 7A. Quantitative and Qualitative Disclosures about Market Risk and Item 8. Financial Statements and Supplementary Data for a discussion of our derivative instruments and related hedging activities.
We rely on access to short-term and long-term capital markets to finance capital requirements and support liquidity needs. Cost effective access to those markets can be affected, particularly if we or our rated subsidiaries are unable to maintain an investment-grade credit rating.
A significant portion of our consolidated asset base is financed with debt. The maturity and repayment profile of debt used to finance investments often does not correlate to cash flows from assets. Accordingly, we rely on access to both short-term and long-term capital markets as a source of liquidity for capital requirements not satisfied by cash flows from operations and to refinance investments originally financed with debt. Our senior unsecured long-term debt is currently rated investment-grade by various rating agencies. If the rating agencies were to rate us or our rated subsidiaries below investment-grade, our borrowing costs would increase, perhaps significantly. Consequently, we would likely be required to pay a higher interest rate in future financings and our potential pool of investors and funding sources could decrease.
We maintain revolving credit facilities at various entities to backstop commercial paper programs, for borrowings and for providing letters of credit. These facilities typically include financial covenants and failure to maintain these covenants at a particular entity could preclude that entity from accessing the credit facility, which could impact liquidity. Furthermore, if our short-term debt rating were to be downgraded, access to the commercial paper market could be significantly limited. Although this would not affect our ability to draw under our credit facilities, borrowing costs could be significantly higher.
If we are not able to access capital at competitive rates or at all, our ability to finance operations and implement our strategy may be affected. An inability to access capital on favorable terms or at all may limit our ability to pursue enhancements or acquisitions that we may otherwise rely on for future growth or to refinance our existing indebtedness. Any downgrade or other event negatively affecting the credit ratings of our subsidiaries could make their costs of borrowing higher or access to funding sources more limited, which in turn could increase our need to provide liquidity in the form of capital contributions or loans to such subsidiaries, thus reducing the liquidity and borrowing availability of the consolidated group.
Our Liquids Pipelines growth rate and results may be indirectly affected by commodity prices.
Wide commodity price basis between Western Canada and global tidewater markets have negatively impacted producer netbacks and margins in the past years that largely resulted from pipeline infrastructure takeaway capacity from producing regions in Western Canada and North Dakota which are operating at capacity. A protracted long-term outlook for low crude oil prices could result in delay or cancellation of future projects.
The tight conventional oil plays of Western Canada, the Permian Basin, and the Bakken region of North Dakota have short cycle break-even time horizons, typically less than 24 months, and high decline rates that can be well managed through active hedging programs and are positioned to react quickly to market signals. Accordingly, during periods of comparatively low prices, drilling programs, unsupported by hedging programs, will be reduced and as such, supply growth from tight oil basins may be lower, which may impact volumes on our pipeline systems.
Our Energy Services and Gas Transmission and Midstream results may be adversely affected by commodity price volatility.
Within our US Midstream assets, we hold investments in DCP and Aux Sable, which are engaged in the businesses of gathering, treating, processing and selling natural gas and natural gas liquids. The financial results of these businesses are directly impacted by changes in commodity prices. To a lesser degree, the financial results of our US Transmission business are subject to fluctuation in power prices which impact electric power costs associated with operating compressor stations.
Energy Services generates margin by capitalizing on quality, time and location differentials when opportunities arise. Changing market conditions that impact the prices at which we buy and sell commodities have in the past limited margin opportunities and impeded Energy Services' ability to cover capacity commitments and could do so again in the future. Other market conditions, such as backwardation, have likewise limited margin opportunities.
We are exposed to the credit risk of our customers, counterparties, and vendors.
We are exposed to the credit risk of multiple parties in the ordinary course of our business. Generally, our customers are rated investment-grade, are otherwise considered creditworthy or provide us security to satisfy credit concerns. However, we cannot predict to what extent our business would be impacted by deteriorating conditions in the economy, including possible declines in the creditworthiness of our customers, vendors, or counterparties. It is possible that payment or performance defaults from these entities, if significant, could adversely affect our earnings and cash flows.
Our business requires the retention and recruitment of a skilled and diverse workforce, and difficulties in recruiting and retaining our workforce could result in a failure to implement our business plans.
Our operations and management require the retention and recruitment of a skilled and diverse workforce, including engineers, technical personnel, other professionals and executive officers and senior management. We and our affiliates compete with other companies in the energy industry, and for some jobs the broader labor market, for this skilled workforce. If we are unable to retain current employees and/or recruit new employees of comparable knowledge and experience, our business could be negatively impacted. In addition, we could experience increased costs to retain and recruit these professionals.
RISKS RELATED TO GOVERNMENT REGULATION AND LEGAL RISKS
Many of our operations are regulated and failure to secure timely regulatory approval for our proposed projects, or loss of required approvals for our existing operations, could have a negative impact on our business, operations or financial results.
The nature and degree of regulation and legislation affecting permitting and environmental review for energy infrastructure companies in Canada and the US continues to evolve.
Within the US and in Canada, pipeline companies continue to face opposition from anti-energy/anti-pipeline activists, Indigenous and tribal groups and communities, citizens, environmental groups, and politicians concerned with the safety of pipelines and their potential environmental effects. In the US, the EPA redefined the Waters of the United States to align with the U.S. Supreme Court’s May 25, 2023 Sackett v. EPA decision that limits the scope of waters regulated by the Clean Water Act, issued new rules under Section 401 of the Clean Water Act broadening the scope of state review for water quality certifications, released rules on methane control and reporting, Cross-state Ozone Pollution (The Good Neighbor Plan), and the Power Plant Rule. The Council for Environmental Quality published immediately applicable guidance for conducting analyses under the National Environmental Policy Act (NEPA), followed by a new rule governing implementation of NEPA in federal actions that may significantly change environmental scope and cost assessments. The FERC has focused on the relationship between natural gas and electric power generation, particularly in connection with reliability issues during severe weather events. The PHMSA issued a draft rule on leak detection and repair. Federal agencies also issued guidance on how environmental justice concerns should be considered and addressed. Many other regulations adopted during the previous US presidential administration are being challenged in multiple courts and some have been overturned by reviewing courts. The current US administration may take further action to modify or reverse regulations that were promulgated by the previous US administration.
In March of 2023, the Supreme Court of Canada heard the Attorney General of Canada’s appeal of the Alberta Court of Appeal’s non-binding decision that the federal Impact Assessment Act (IAA) is unconstitutional. The IAA includes impact assessment requirements that could apply to either federally or provincially regulated pipeline projects that fall within prescribed criteria or that the federal Minister of Environment otherwise designates for review. The potential for any pipeline project to be subject to IAA requirements adds significant uncertainty as to regulatory timelines and outcomes. The Alberta Court of Appeal found that the IAA is an impermissible federal overreach into provincial jurisdiction that would amount to a de facto expropriation of provincial natural resources and proprietary interests by the federal government. The Supreme Court of Canada issued its decision on October 13, 2023, with a majority of the court (5-2) finding that the federal impact assessment regime is outside of the federal Parliament’s authority and that the IAA should focus more narrowly on effects within federal jurisdiction. The decision is a non-binding advisory reference case, so the IAA and associated regulations are not "struck down"; however, the federal government will take the Supreme Court of Canada’s guidance and in collaboration with provinces and Indigenous groups, will seek to amend the IAA so that it is constitutional. The resulting amendments could impact the risks and timing of potential future regulatory approvals and the scope of federal review of intraprovincial pipeline projects.
Our operations are subject to numerous environmental laws and regulations, including those relating to climate change, GHG emissions and climate-related disclosure, compliance with which may require significant capital expenditures, increase our cost of operations, and affect or limit our business plans, or expose us to environmental liabilities.
We are subject to numerous environmental laws and regulations affecting many aspects of our past, current, and future operations, including air emissions, water and soil quality, wastewater discharges, solid waste and hazardous waste.
If we are unable to obtain or maintain all required environmental regulatory approvals and permits for our operating assets and projects or if there is a delay in obtaining any required environmental regulatory approvals or permits, the operation of existing facilities or the development of new facilities could be prevented, delayed, or become subject to additional costs. Failure to comply with environmental laws and regulations may result in the imposition of civil or criminal fines, penalties and injunctive measures affecting our operating assets. We expect that changes in environmental laws and regulations, including those related to climate change, GHG emissions and climate-related disclosure, could result in a material increase in our cost of compliance with such laws and regulations, such as costs to monitor and report our emissions and install new emission controls to reduce emissions. We may not be able to include some or all of such increased costs in the rates charged for utilization of our pipelines or other facilities.
Our operations are subject to operational regulation and other requirements, including compliance with easements and other land tenure documents, and failure to comply with applicable regulations and other requirements could have a negative impact on our reputation, business, operations or financial results.
Operational risks relate to compliance with applicable operational rules and regulations mandated by governments, applicable regulatory authorities, or other requirements that may be found in easements, permits, or other agreements that provide a legal basis for our operations, breaches of which could result in fines, penalties, awards of damages, operating restrictions (including shutdown of lines) and an overall increase in operating and compliance costs.
We do not own all of the land on which our pipelines, facilities and other assets are located and we obtain the rights to construct and operate our pipelines and other assets from third parties or government entities. In addition, some of our pipelines, facilities and other assets cross Indigenous lands pursuant to rights-of-way or other land tenure interests. Our loss of these rights, including through our inability to renew them as they expire, could have an adverse effect on our reputation, operations and financial results. We have experienced litigation in relation to certain Line 5 and other easements; refer to Part II. Item 7. Management's Discussion and Analysis of Financial Condition and Results of Operations - Legal and Other Updates.
Regulatory scrutiny over our assets and operations has the potential to increase operating costs or limit future projects. Regulatory enforcement actions issued by regulators for non-compliant findings can increase operating costs and negatively impact reputation. Potential regulatory changes and legal challenges could have an impact on our future earnings from existing operations and the cost related to the construction of new projects. Regulators' future actions may differ from current expectations, or future legislative changes may impact the regulatory environments in which we operate. While we seek to mitigate operational regulation risk by actively monitoring and consulting on potential regulatory requirement changes with the respective regulators directly, or through industry associations, and by developing response plans to regulatory changes or enforcement actions, such mitigation efforts may be ineffective or insufficient. While we believe the safe and reliable operation of our assets and adherence to existing regulations is the best approach to managing operational regulatory risk, the potential remains for regulators or other government officials to make unilateral decisions that could disrupt our operations or have an adverse financial impact on us.
Our operations are subject to economic regulation and failure to secure regulatory approval for our proposed or existing commercial arrangements could have a negative impact on our business, operations or financial results.
Our Liquids Pipelines, Gas Transmission and Gas Distribution assets face economic regulation risk. Broadly defined, economic regulation risk is the risk that governments or regulatory agencies change or reject proposed or existing commercial arrangements or policies, including permits and regulatory approvals for both new and existing projects or agreements, upon which future and current operations are dependent. Our Mainline System, other liquids pipelines, gas transmission and distribution assets are subject to the actions of various regulators, including the CER, the FERC, and the OEB with respect to the rates, tariffs, and tolls for these assets. The changing or rejecting of commercial arrangements, including decisions by regulators on the applicable permits and tariff structure or changes in interpretations of existing regulations by courts or regulators such as with respect to the negotiated settlements applicable to our Mainline System, could have an adverse effect on our revenues and earnings.
Our Renewable Power Generation assets in Canada and the US are subject to directives, regulations, and policies of federal, provincial and state governments. These measures are variable and can change as a result of, among other things, tax rate changes and a change in the government, which can have a negative impact on our commercial arrangements.
Our Renewable Power Generation assets in Europe (France, Germany and the UK) are also subject to the directives, regulations and policies established and enforced by the EU and the UK government. These measures are variable and can include price controls, caps and demand reduction goals, all of which can have a negative impact on our revenues and earnings.
We are subject to changes in our tax rates, the adoption of new US, Canadian or international tax legislation or exposure to additional tax liabilities.
We are subject to taxes in the US, Canada and numerous foreign jurisdictions. Due to economic and political conditions, tax rates in various jurisdictions may be subject to significant change. Our effective tax rates could be affected by changes in the mix of earnings in countries with differing statutory tax rates, changes in the valuation of deferred tax assets and liabilities, or changes in tax laws or their interpretation. In particular, Canada and other OECD countries have introduced a minimum tax rate to be applied on a global basis.The final legislation and list of the participating countries remains uncertain.In addition, the US enacted the Inflation Reduction Act in 2022 however key regulations still remain outstanding that could impact the interpretation of that act. All of these measures could cause our effective tax rate to increase.
We are also subject to the examination of our tax returns and other tax matters by the US Internal Revenue Service, the Canada Revenue Agency and other tax authorities and governmental bodies. We regularly assess the likelihood of an adverse outcome resulting from these examinations to determine the adequacy of our provision for taxes. There can be no assurance as to the outcome of these examinations. If our effective tax rates were to increase, particularly in the US or Canada, or if the ultimate determination of our taxes owed is for an amount in excess of amounts previously accrued, our financial condition and operating results could be materially adversely affected.
We are involved in numerous legal proceedings, the outcomes of which are uncertain, and resolutions adverse to us could adversely affect our financial results.
We are subject to numerous legal proceedings. In recent years, there has been an increase in climate and disclosure-related litigation against governments as well as companies involved in the energy industry. There is no assurance that we will not be impacted by such litigation, or by other legal proceedings. Litigation is subject to many uncertainties, and we cannot predict the outcome of individual matters with assurance. It is reasonably possible that the final resolution of some of the matters in which we are involved or new matters could require additional expenditures, in excess of established reserves, over an extended period of time and in a range of amounts that could adversely affect our financial results or affect our reputation. Refer to Part II. Item 7. Management's Discussion and Analysis of Financial Condition and Results of Operations - Legal and Other Updates for a discussion of certain legal proceedings with recent developments.
ITEM 1B. UNRESOLVED STAFF COMMENTS
None.
ITEM 1C. CYBERSECURITY
Cybersecurity risk management, strategy and governance
Risk oversight and management is a key role for the Board and its committees. The Board is responsible for identifying and understanding Enbridge’s principal risks and ensuring that appropriate systems are implemented to monitor, manage and mitigate those risks. The committees of the Board have oversight over risks within their respective mandates.
Oversight of cybersecurity is integrated into the responsibilities of the Board. The Audit, Finance and Risk Committee (the AFRC) provides oversight of cybersecurity matters, particularly as they relate to financial risk and controls, integrity of financial data and public disclosures, and security of the cyber landscape across data and digital. The Safety and Reliability Committee (SRC) has oversight responsibility for security (physical, data and cyber) including as it relates to operational risk and controls, safety, operations integrity and reliability, and asset operations.
Management provides regular reports to the Board at every meeting to review our top risks, identify trends and help manage risk. This includes quarterly reports to the AFRC and SRC on cybersecurity matters. In addition, on an annual basis management prepares and provides to the Board and its committees a corporate risk assessment (CRA), which analyzes and prioritizes enterprise-wide risks (including cybersecurity), highlighting top risks and trends. The annual CRA is an integrated enterprise-wide process. We assess and rank risks based on impact and probability, and we strive to ensure that mitigation measures are appropriately designed, prioritized and resourced. The CRA report is reviewed by the Board committees with responsibility for the risk category relevant to their mandate and is provided to the Board, which coordinates Enbridge's overall risk management approach. Complementary to the CRA, management prepares and provides to the SRC an annual top operational risk report that highlights the highest consequence operational risks across Enbridge and includes further detail on the risks and their treatment. This information helps inform the Board about the potential impact of top operational risks and that appropriate treatments are in place to manage those risks.
Cybersecurity has been identified as a top risk as attacks against participants in our industry have continued to increase in sophistication and frequency over the years. Cybersecurity risk is described in Item 1A. Risk Factors.
Enbridge’s management is responsible for the implementation of risk management strategies and monitoring performance. The technology and information services (TIS) function is centralized under the Senior Vice President & Chief Information Officer (CIO), who has over two decades of international leadership in the business of technology. We also engage independent third parties to assess our cybersecurity program, track their recommendations and use those to further improve the program. Reporting to the CIO is the Chief Information Security Officer who is in charge of our cybersecurity program and oversees the 24x7x365 Security Operations Center (SOC).
We conduct continuous assessments of our cybersecurity standards, perform regular tests of our ability to respond and recover, and monitor for potential threats. To further mitigate threats, we collaborate with governments and regulatory agencies, and take part in external events to learn and share. Our workforce participates in regular security awareness training, including exercises to build capabilities to identify and report suspect phishing emails to our SOC. In the last year, we continued to expand the cybersecurity training and simulated testing we administer to high-risk groups within the organization. A tailored cybersecurity training course has been implemented for team members in operational technology roles, and we have increased the frequency of phishing simulation tests.
We have a cybersecurity third party risk management program, which is an evolving, cross-functional program to help assess and mitigate risks from third party vendors and other service providers. Our cybersecurity team also uses several layers of defense and protection technologies, cybersecurity experts, and automated alerting and response mechanisms to reduce risk to Enbridge.
Although cybersecurity risks have not materially affected us, including our business strategy, results of operations or financial condition, to date, we have experienced an increasing number of cybersecurity threats in recent years. For more information about the cybersecurity risks we face, see the risk factor entitled "Cyber attacks and other cybersecurity incidents pose threats to our technology systems and could materially adversely affect our business, operations, reputation or financial results." in Item 1A. Risk Factors.
ITEM 2. PROPERTIES
Descriptions of our properties and maps depicting the locations of our liquids and natural gas systems are included in Part I. Item 1. Business.
In general, our systems are located on land owned by others and are operated under easements and rights-of-way, licenses, leases or permits that have been granted by private land-owners, Indigenous communities, public authorities, railways or public utilities. Our liquids pipeline systems have pumping stations, tanks, terminals and certain other facilities that are located on land that is owned by us and/or used by us under easements, licenses, leases or permits. Additionally, our natural gas pipeline systems have natural gas compressor stations, of which the vast majority are located on land that is owned by us. The remainder of these compressor stations and other assets, like meter and valve stations, and underground gas storage fields, are used by us under easements, leases or permits.
Titles to Enbridge owned properties or affiliate entities may be subject to encumbrances in some cases. We believe that none of these burdens should materially detract from the value of these properties or materially interfere with their use in the operation of our business.
ITEM 3. LEGAL PROCEEDINGS
We are involved in various legal and regulatory actions and proceedings which arise in the ordinary course of business. While the final outcome of such actions and proceedings cannot be predicted with certainty, management believes that the resolution of such actions and proceedings will not have a material impact on our consolidated financial position or results of operations. Refer to Part II. Item 7. Management's Discussion and Analysis of Financial Condition and Results of Operations - Legal and Other Updates for discussion of certain legal proceedings with recent developments.
SEC regulations require the disclosure of any proceeding under environmental laws to which a governmental authority is a party unless the registrant reasonably believes it will not result in monetary sanctions over a certain threshold. Given the size of our operations, we have elected to use a threshold of US$1 million for the purposes of determining proceedings requiring disclosure.
On October 17, 2022, four separate comprehensive enforcement resolutions were announced with the Minnesota Pollution Control Agency, Minnesota Department of Natural Resources (DNR), Fond du Lac Band of Lake Superior Chippewa, and Minnesota Attorney General’s Office related to alleged violations that occurred during construction of Line 3 Replacement (L3R). The Minnesota Attorney General filed a misdemeanor criminal charge for the taking of water without a permit at the Clearbrook aquifer, with this charge against us to be dismissed following one year of compliance with the state water appropriation rules. As part of its ongoing post-construction monitoring activities for L3R, Enbridge reported groundwater flow near Moose Lake in Aitkin County to the DNR. Enbridge has completed the agency approved corrective action at the site.
ITEM 4. MINE SAFETY DISCLOSURES
Not applicable.
PART II
ITEM 5. MARKET FOR REGISTRANT'S COMMON EQUITY, RELATED STOCKHOLDER MATTERS AND ISSUER PURCHASES OF EQUITY SECURITIES
Common Stock
Enbridge common stock is traded on the TSX and NYSE under the symbol ENB. As at February 2, 2024, there were 73,123 registered shareholders of record of Enbridge common stock. A substantially greater number of holders of Enbridge common stock are beneficial holders, whose shares are held by banks, brokers and other financial institutions.
Securities Authorized for Issuance Under Equity Compensation Plans
The information required by this Item will be contained in our Form 10-K/A, which will be filed no later than 120 days after December 31, 2023.
Recent Sales of Unregistered Equity Securities
None.
Issuer Purchases of Equity Securities
| | | | | | | | | | | | | | |
| Period | Total number of shares purchased | Average price paid per share | Total number of shares purchased as part of publicly announced plans or programs | Maximum number of shares that may yet be purchased under the plans or programs1 |
| | | | |
| | | | |
| | | | |
| | | | |
| | | | |
| | | | |
| | | | |
| | | | |
| | | | |
October 2023 (October 1 - October 31) | — | | N/A | — | | 25,433,807 | |
November 2023 (November 1 - November 30) | — | | N/A | — | | 25,433,807 | |
December 2023 (December 1 - December 31) | — | | N/A | — | | 25,433,807 | |
1On January 4, 2023, the TSX approved our normal course issuer bid (NCIB), which commenced on January 6, 2023 and expired on January 5, 2024. Our NCIB permitted us to purchase, for cancellation, up to 27,938,163 of the outstanding common shares of Enbridge to an aggregate amount of up to $1.5 billion through the facilities of the TSX, the NYSE and other designated exchanges and alternative trading systems.
Total Shareholder Return
The following graph reflects the comparative changes in the value from January 1, 2019 through December 31, 2023 of $100 invested in (1) Enbridge Inc.’s common shares traded on the TSX, (2) the S&P/TSX Composite index, (3) the S&P 500 index, (4) our US peer group (comprising, by stock symbols, CNP, D, DTE, DUK, EPD, ET, KMI, MMP, NEE, NI, OKE, PAA, PCG, SO, SRE and WMB) and (5) our Canadian peer group (comprising, by stock symbols, CU, FTS, PPL and TRP). The amounts included in the table were calculated assuming the reinvestment of dividends.
| | | | | | | | | | | | | | | | | | | | |
| | January 1,
2019 | December 31, |
| | 2019 | 2020 | 2021 | 2022 | 2023 |
| Enbridge Inc. | 100.00 | | 129.34 | | 109.69 | | 142.87 | | 162.72 | | 157.79 | |
| S&P/TSX Composite | 100.00 | | 122.88 | | 129.76 | | 162.32 | | 152.83 | | 170.79 | |
| S&P 500 Index | 100.00 | | 131.49 | | 155.68 | | 200.37 | | 164.08 | | 207.21 | |
US Peers1 | 100.00 | | 118.76 | | 101.11 | | 124.27 | | 139.24 | | 145.15 | |
| Canadian Peers | 100.00 | | 131.71 | | 108.28 | | 135.12 | | 140.43 | | 142.20 | |
1For the purpose of the graph, it was assumed that CAD:US dollar conversion ratio remained at 1:1 for the years presented.
ITEM 6. [Reserved]
ITEM 7. MANAGEMENT'S DISCUSSION AND ANALYSIS OF FINANCIAL CONDITION AND RESULTS OF OPERATIONS
INTRODUCTION
The following discussion and analysis of our financial condition and results of operations is based on and should be read in conjunction with "Forward-Looking Information" and "Non-GAAP and Other Financial Measures", Part I. Item 1A. Risk Factors and our consolidated financial statements and the accompanying notes included in Part II. Item 8. Financial Statements and Supplementary Data of this Annual Report on Form 10-K.
This section of our Annual Report on Form 10-K discusses 2023 and 2022 items and year-over-year comparisons between 2023 and 2022. For discussion of 2021 items and year-over-year comparisons between 2022 and 2021, refer to Part II. Item 7. Management's Discussion and Analysis of Financial Condition and Results of Operations of our Annual Report on Form 10-K for the year ended December 31, 2022.
RECENT DEVELOPMENTS
MAINLINE TOLLING AGREEMENT
Enbridge Inc. (Enbridge) has reached an agreement on a negotiated settlement with shippers for tolls on its Mainline System. The Mainline Tolling Settlement (MTS) covers both the Canadian and US portions of the Mainline and would see the Mainline continuing to operate as a common carrier system available to all shippers on a monthly nomination basis. The MTS is subject to regulatory approval and the term is seven and a half years through the end of 2028, with revised interim tolls effective on July 1, 2023.
The MTS includes:
•an International Joint Toll (IJT), for heavy crude oil movements from Hardisty to Chicago, comprised of a Canadian Mainline Toll of $1.65 per barrel plus a Lakehead System Toll of US$2.57 per barrel, plus the applicable Line 3 Replacement (L3R) surcharge;
•toll escalation for operation, administration, and power costs tied to US consumer price and power indices;
•tolls that continue to be distance and commodity adjusted, and utilize a dual currency IJT; and
•a financial performance collar providing incentives for Enbridge to optimize throughput and cost, but also providing downside protection in the event of extreme supply or demand disruptions or unforeseen operating cost exposure. This performance collar is intended to ensure the Mainline earns 11% to 14.5% returns, on a deemed 50% equity capitalization, which is similar to the returns earned on average during the previous tolling agreement.
Approximately 70% of Mainline deliveries are tolled under this settlement, while approximately 30% of deliveries are tolled on a full path basis to markets downstream of the Mainline. The other continuing feature is that the Mainline toll flexes up or down US$0.035 per barrel for 50,000 barrel per day changes in throughput.
The expected financial outcome from this settlement is in line with previously reported financial results after taking into consideration the previously recognized provision, inflationary cost adjustments and increased volumes. Enbridge filed an application with the Canada Energy Regulator (CER) for approval of the MTS on December 15, 2023, with unanimous support from its Representative Stakeholder Group. The CER indicated in its process letter that no dissenting comments were received by January 19, 2024 and that it may decide on the application or it may establish further process steps.
On May 24, 2023, Enbridge filed an Offer of Settlement with the Federal Energy Regulatory Commission (FERC) for the Lakehead System (the Lakehead System Settlement). In addition to resolving litigation related to the Index portion of the Lakehead System rate, the Lakehead System Settlement also includes a depreciation truncation date of December 31, 2048 for the rate base applicable to the Index and Facilities Surcharge and agreement on the terms for future recovery through the Facilities Surcharge of costs related to two Line 5 projects: the Wisconsin Relocation Project and the Straits of Mackinac Tunnel. The Lakehead System Settlement was certified by the Settlement Judge on June 23, 2023 and was approved by the FERC Commissioners on November 27, 2023. Lakehead System tolls were revised effective December 1, 2023 to reflect the terms of the Lakehead System Settlement.
ACQUISITIONS
Acquisition of Renewable Natural Gas (RNG) Facilities
On January 2, 2024, through a wholly-owned US subsidiary, we acquired the first six Morrow Renewables operating landfill gas-to-RNG production facilities located in Texas and Arkansas for total consideration of $1.4 billion (US$1.1 billion), of which $0.5 billion (US$0.4 billion) was paid at close and $0.9 billion (US$0.7 billion) is payable within two years. The total consideration for all seven facilities is $1.6 billion (US$1.2 billion). Combined RNG production of the facilities is approximately 4.5 bcf per year. The acquired assets align with and advance our low-carbon strategy.
Fox Squirrel Solar
On November 15, 2023, we acquired a 50% interest in a newly formed partnership with EDF Renewables North America to participate in the initial phase of a solar power facility in Ohio. Cash consideration includes an upfront payment of $157 million (US$115 million) and subsequent capital commitments up to $398 million (US$291 million). Investments past the first phase are contingent on certain conditions being met. An additional payment of $164 million (US$123 million) was made at Phase 1 in-service in December 2023.
Hohe See and Albatros Offshore Wind Facilities
On November 3, 2023, we acquired an additional 24.45% interest in the Hohe See Offshore Wind Facilities and Albatros Offshore Wind Facilities (the Offshore Wind Facilities), through the acquisition of a 49% interest in Enbridge Renewable Infrastructure Investments S.à r.l (ERII), for $391 million (€267 million) of cash and assumed debt of $524 million (€358 million), bringing our interest in the Offshore Wind Facilities to 49.9%. The Hohe See Offshore Wind Facilities and Albatros Offshore Wind Facilities are located approximately 100 kilometers off the northern coast of Germany and came into service in 2019 and 2020, respectively.
Aitken Creek Gas Storage
On November 1, 2023, through a wholly-owned Canadian subsidiary, we acquired a 93.8% interest in Aitken Creek Gas Storage Facility and a 100% interest in Aitken Creek North Gas Storage Facility (collectively, Aitken Creek), located in BC, Canada, for $400 million, subject to other customary closing adjustments (the Aitken Creek Acquisition). Aitken Creek is the only underground natural gas storage facility in BC and connects to all major natural gas pipelines in western Canada. The Aitken Creek Acquisition enables us to continue to meet regional energy needs and to support increasing demand for liquefied natural gas (LNG) exports.
US Gas Utilities
On September 5, 2023, we announced that Enbridge had entered into three separate definitive agreements with Dominion Energy, Inc. to acquire The East Ohio Gas Company, Questar Gas Company and its related Wexpro companies, and Public Service Company of North Carolina for an aggregate purchase price of $19.1 billion (US$14.0 billion), comprised of $12.8 billion (US$9.4 billion) of cash consideration and $6.3 billion (US$4.6 billion) of assumed debt, subject to customary closing adjustments (together, the Acquisitions). If completed, the Acquisitions will create North America's largest natural gas utility platform delivering over 9 billion cubic feet (bcf) per day to approximately 7 million customers across multiple regulatory jurisdictions. The Acquisitions are expected to close in 2024, subject to the satisfaction of customary closing conditions including the receipt of certain regulatory approvals, which are not cross-conditional.
On September 8, 2023, we closed a public offering of 102,913,500 common shares at a price of $44.70 per share for gross proceeds of $4.6 billion which is intended to finance a portion of the aggregate cash consideration payable for the Acquisitions. Refer to Financing Update for further details on the debt issuances and credit facility obtained to support the Acquisitions.
Tres Palacios Holdings LLC
On April 3, 2023, we acquired Tres Palacios Holdings LLC (Tres Palacios) for $451 million (US$335 million) of cash. Tres Palacios is a natural gas storage facility located in the US Gulf Coast and its infrastructure serves Texas gas-fired power generation and LNG exports, as well as Mexico pipeline exports. Tres Palacios is comprised of three natural gas storage salt caverns with a total FERC-certificated working gas capacity of approximately 35 billion bcf and also owns an integrated 62-mile natural gas header pipeline system, with eleven inter- and intrastate natural gas pipeline connections.
ASSET MONETIZATION
Disposition of Alliance Pipeline and Aux Sable
On December 13, 2023, we announced that Enbridge has entered into a definitive agreement to sell our 50.0% interest in the Alliance Pipeline and our interest in Aux Sable (including 42.7% interest in Aux Sable Midstream LLC and Aux Sable Liquid Products L.P., and 50% interest in Aux Sable Canada LP) to Pembina Pipeline Corporation for $3.1 billion, including approximately $0.3 billion of non-recourse debt, subject to customary closing adjustments. Closing is expected to occur in the first half of 2024, subject to the receipt of regulatory approvals and satisfaction of customary closing conditions. The sales proceeds will fund a portion of the Acquisitions and be used for debt reduction.
GAS TRANSMISSION AND MIDSTREAM PROCEEDINGS
Texas Eastern Transmission
The Stipulation and Agreement for Texas Eastern Transmission, LP’s (Texas Eastern) consolidated 2021 rate cases was approved by the FERC on November 30, 2022, and became effective on January 1, 2023. Texas Eastern received FERC approval on April 3, 2023 to implement the settled rates and other settlement provisions.
Maritimes & Northeast Pipeline
The toll settlement agreement for the Canadian portion of the Maritimes & Northeast (M&N) Pipeline (M&N Canada) expired in December 2023. M&N Canada reached a toll settlement with shippers for the effective period from January 1, 2024 to December 31, 2025. On November 28, 2023, M&N Canada filed the 2024 - 2025 toll settlement agreement with the CER for review and approval. A CER decision is expected in the first quarter of 2024.
GAS DISTRIBUTION AND STORAGE RATE APPLICATIONS
Incentive Regulation Rate Application
In October 2022, Enbridge Gas Inc. (Enbridge Gas) filed its application with the Ontario Energy Board (OEB) to establish a 2024 through 2028 Incentive Regulation (IR) rate setting framework. The application initially sought approval in two phases to establish 2024 base rates (Phase 1) on a cost-of-service basis and to establish a price cap rate setting mechanism (Phase 2) to be used for the remainder of the IR term. A third phase (Phase 3) has been established with the OEB as part of the Phase 1 Partial Settlement Proposal (Settlement Proposal).
On August 17, 2023, the OEB approved the Settlement Proposal to support the determination of just and reasonable rates effective January 1, 2024. Items resolved in whole or in part include:
•additions to rate base up to and including 2022;
•interest rates on debt and return on equity;
•deferral and variance accounts;
•Indigenous engagement; and
•rate implementation approach for 2024.
On December 21, 2023, the OEB issued its Decision and Order on Phase 1 (Phase 1 Decision). The decision addressed three main areas: energy transition, Enbridge Gas Distribution Inc. and Union Gas Limited amalgamation and harmonization issues, and other issues. The Phase 1 Decision included the following key findings or orders:
•energy transition risk requires Enbridge Gas to carry out a risk assessment to consider further risk mitigation measures in three areas: system access and expansion capital spending, system renewal capital spending and depreciation policy;
•our 2024 capital plan must be reduced by $250 million with a focus on monitoring, repair and life extension of our assets and a further $50 million of capitalized indirect overhead costs must be expensed, escalating to $250 million per year during the IR term with an offsetting adjustment to revenues in each year;
•all new small volume customers wishing to connect to natural gas pay their full connection costs as an upfront charge rather than through rates over time effective January 1, 2025;
•approval of a harmonized depreciation methodology that reduced the level of depreciation sought and adjusted asset lives including extensions of service life for certain asset classes;
•an increase in equity thickness from 36% to 38% effective for 2024; and
•January 1, 2024 will be the effective date for 2024 rates.
The issues addressed in the Settlement Proposal and the Phase 1 Decision resulted in the following items not approved for future recovery, and the subsequent impairments recognized for the year ended December 31, 2023:
•a portion of undepreciated capital projects removed from 2024 rate base of $41 million;
•undepreciated integration capital costs removed from 2024 rate base of $84 million; and
•pre-2017 Union Gas Limited related pension balances of $156 million.
Enbridge Gas filed a Notice of Appeal in the Ontario Divisional Court on January 22, 2024 regarding four aspects of the Phase 1 Decision: small volume customer revenue horizon, the 2024 capital plan reduction, the extension of service life for certain asset classes and equity thickness. On January 29, 2024 Enbridge Gas also filed a Notice of Motion with the OEB requesting the OEB to review and vary five aspects of the Phase 1 Decision: small volume customer revenue horizon, the 2024 capital plan reduction, integration capital, depreciation and equity thickness. The outcome of these proceedings is uncertain.
The Phase 1 Decision results in interim rates, pending phases 2 and 3 of the proceeding, resolution of the Notice of Appeal, Notice of Motion and any possible legislative steps that could be undertaken by the Government of Ontario further to the Ontario Minister of Energy's December 22, 2023 news release. Phase 2 will establish and determine the incentive rate mechanism for the remainder of the rebasing term, and gas cost and unregulated storage cost allocation. Phase 3 will address cost allocation and the harmonization of rates and rate classes between legacy rate zones.
Purchase Gas Variance
The Purchase Gas Variance Account (PGVA) captures the difference between actual and forecasted natural gas prices reflected in rates. Account balances are typically recovered or refunded over a prospective 12-month period through Quarterly Rate Adjustment Mechanism (QRAM) applications.
In March 2023, the April 1, 2023 QRAM application was filed and approved by the OEB, which included an adjustment to the prior rate mitigation approved as part of the July 1, 2022 QRAM. The recovery of the outstanding PGVA balance from the extended recovery period approved as part of the July 1, 2022 QRAM will now be completed by March 31, 2024. In June, September and December 2023, the July 1, 2023, October 1, 2023, and January 1, 2024 QRAM applications, respectively, were filed and approved by the OEB with no adjustments to the prior period rate mitigation plans and did not include any additional rate mitigation measures.
As at December 31, 2023, Enbridge Gas' PGVA liability balance was $16 million.
FINANCING UPDATE
We completed long-term debt issuances totaling US$8.5 billion and $3.9 billion during the year ended December 31, 2023, including aggregate amounts of US$2.3 billion of 10-year sustainability-linked senior notes in March 2023 and $400 million of 10-year sustainability-linked medium-term notes in May 2023.
We increased our credit facilities in March 2023 by approximately $500 million. During our annual renewal process, we renewed and extended approximately $15.4 billion of our credit facilities with maturities ranging from 2024-2028.
In September 2023, we obtained commitments for a US$9.4 billion senior unsecured bridge term loan credit facility to support the Acquisitions. The commitment for this facility was subsequently reduced to nil as at December 31, 2023 as a result of the September 2023 $4.6 billion equity offering, the September 2023 subordinated long-term debt issuances, and the November 2023 senior notes long-term debt issuances.
In September 2023, we closed a public offering of 102,913,500 common shares at a price of $44.70 per share for gross proceeds of $4.6 billion which is intended to finance a portion of the aggregate cash consideration payable for the Acquisitions.
Our 2023 financing activities have provided significant liquidity that we expect will enable us to fund our current portfolio of capital projects and acquisitions without requiring access to the capital markets for the next 12 months should market access be restricted or pricing be unattractive. Refer to Liquidity and Capital Resources.
As at December 31, 2023, after adjusting for the impact of floating-to-fixed interest rate swap hedges, less than 5% of our total debt is exposed to floating rates. Refer to Part II. Item 8. Financial Statements and Supplementary Data - Note 23 - Risk Management and Financial Instruments for more information on our interest rate hedging program.
NORMAL COURSE ISSUER BID
On January 4, 2023, the Toronto Stock Exchange (TSX) approved our normal course issuer bid (NCIB), which commenced on January 6, 2023 and expired on January 5, 2024. Our NCIB permitted us to purchase, for cancellation up to 27,938,163 of the outstanding common shares of Enbridge to an aggregate amount of up to $1.5 billion through the facilities of the TSX, the New York Stock Exchange and other designated exchanges and alternative trading systems.
RESULTS OF OPERATIONS
| | | | | | | | | | | |
| Year ended December 31, | 2023 | 2022 | 2021 |
| (millions of Canadian dollars, except per share amounts) | | | |
Segment earnings/(loss) before interest, income taxes and depreciation and amortization1 | | | |
| Liquids Pipelines | 9,499 | | 8,364 | | 7,897 | |
| Gas Transmission and Midstream | 4,264 | | 3,126 | | 3,671 | |
| Gas Distribution and Storage | 1,592 | | 1,827 | | 2,117 | |
| Renewable Power Generation | 149 | | 262 | | 508 | |
| Energy Services | (37) | | (417) | | (313) | |
| Eliminations and Other | 837 | | (1,124) | | 356 | |
Earnings before interest, income taxes and depreciation and amortization1 | 16,304 | | 12,038 | | 14,236 | |
| Depreciation and amortization | (4,613) | | (4,317) | | (3,852) | |
| Interest expense | (3,812) | | (3,179) | | (2,655) | |
| Income tax expense | (1,821) | | (1,604) | | (1,415) | |
| (Earnings)/loss attributable to noncontrolling interests and redeemable noncontrolling interests | 133 | | 65 | | (125) | |
| Preference share dividends | (352) | | (414) | | (373) | |
| Earnings attributable to common shareholders | 5,839 | | 2,589 | | 5,816 | |
| Earnings per common share attributable to common shareholders | 2.84 | | 1.28 | | 2.87 | |
| Diluted earnings per common share attributable to common shareholders | 2.84 | | 1.28 | | 2.87 | |
1 Non-GAAP financial measures.
EARNINGS ATTRIBUTABLE TO COMMON SHAREHOLDERS
Year ended December 31, 2023 compared with year ended December 31, 2022
Earnings attributable to common shareholders increased by $3.2 billion due to certain infrequent or other non-operating factors, primarily explained by the following:
•the absence in 2023 of a goodwill impairment of $2.5 billion relating to our Gas Transmission reporting unit;
•a non-cash, net unrealized derivative fair value gain of $1,127 million ($856 million after-tax) in 2023, compared with a net unrealized loss of $1,246 million ($950 million after-tax) in 2022, reflecting changes in the mark-to-market value of derivative financial instruments used to manage foreign exchange, interest rate, and commodity risks;
•the absence in 2023 of: an asset impairment loss of $227 million ($173 million after-tax) to our Magic Valley Wind Farm (Magic Valley); an asset impairment loss of $183 million ($137 million after-tax) on the US and Canadian components of the interstate pipeline within the North Dakota System of our Bakken System, an impairment of $44 million ($34 million after-tax) for lease assets due to office relocation plans, and an asset impairment loss of $40 million ($30 million after-tax) relating to MacKay River line within our Alberta Regional Oil Sands System;
•a gain of $151 million ($129 million after-tax) and a deferred tax adjustment of $69 million were recognized as a result of Southern Lights Pipeline's (Southern Lights) discontinuation of regulatory accounting;
•the absence in 2023 of a transaction cost of $114 million in relation to our investment purchase in the Woodfibre LNG project;
•a deferred income tax recovery of $104 million related to a tax adjustment on asset impairments;
•a non-cash, net unrealized gain of $73 million ($55 million after-tax) in 2023, compared with a net unrealized loss of $27 million ($21 million after-tax) in 2022, reflecting the revaluation of derivatives used to manage the profitability of transportation and storage transactions, as well as to manage the exposure to movements in commodity prices;
•the receipt of a litigation claim settlement of $68 million ($52 million after-tax) in 2023; and
•a non-cash, net unrealized gain of $35 million ($33 million after-tax) in 2023, compared with a net unrealized loss of $25 million ($22 million after-tax) in 2022, reflecting changes in the mark-to-market value of equity fund investments held by our wholly-owned captive insurance subsidiaries.
The factors above were partially offset by:
•the absence in 2023 of a gain of $1,076 million ($732 million after-tax) on the closing of the joint venture merger transaction with Phillips 66 (P66) realigning our indirect economic interests in Gray Oak Pipeline LLC (Gray Oak) and DCP Midstream, LP (DCP);
•a realized loss of $638 million ($479 million after-tax) due to termination of foreign exchange hedges, as foreign exchange risks inherent within the Competitive Toll Settlement (CTS) framework are not present in the negotiated Mainline tolling agreement;
•an impairment loss of $261 million ($20 million after-tax and net of noncontrolling interest) to our Chapman Ranch wind facilities;
•an impairment of $281 million ($232 million after-tax) recognized to certain capital projects, capital costs and pension balances in the fourth quarter of 2023 as a result of the OEB's Phase 1 Decision on Enbridge Gas' application;
•a deferred tax adjustment of $120 million as a result of deregulation of parts of the Canadian Mainline including Line 9 and L3R;
•a provision adjustment and settlement of $124 million ($95 million after-tax) related to a litigation matter;
•the absence in 2023 of a gain of $118 million ($89 million after-tax) on Texas Eastern recorded to reflect a settlement with a transportation customer undergoing bankruptcy;
•an asset retirement loss of $86 million ($65 million after-tax) related to our Alberta Regional Oil Sands System;
•an impairment loss of $82 million ($63 million after-tax) to certain Offshore equity investments in our Gas Transmission and Midstream segment; and
•transaction costs of $31 million ($24 million after-tax) incurred as a result of the Acquisitions.
The non-cash, unrealized derivative fair value gains and losses discussed above generally arise as a result of our comprehensive economic hedging program to mitigate foreign exchange, interest rate and commodity price risks. This program creates volatility in reported short-term earnings through the recognition of unrealized non-cash gains and losses on derivative instruments used to hedge these risks. Over the long-term, we believe our hedging program supports the reliable cash flows and dividend growth upon which our investor value proposition is based.
After taking into consideration the factors above, the remaining $51 million increase in earnings attributable to common shareholders is primarily explained by the following significant business factors:
•higher contributions from the Mainline System in our Liquids Pipelines segment driven by increased volumes due to increased crude demand, net of a lower L3R surcharge and lower Mainline System tolls as a result of revised interim tolls effective July 1, 2023;
•higher contributions from our Liquids Pipelines segment due to increased ownership of the Gray Oak Pipeline and Cactus II Pipeline acquired in the second half of 2022 and the Enbridge Ingleside Energy Center (EIEC) due to higher demand;
•the recognition of revenues in our Gas Transmission and Midstream segment attributable to the Texas Eastern rate case settlement;
•higher distribution charges at our Gas Distribution and Storage segment resulting from increases in rates and customer base as well as higher demand in the contract market;
•higher contributions from our Energy Services segment primarily due to the expiration of transportation commitments and favorable margins due to less pronounced market structure backwardation; and
•the favorable effect of translating US dollar earnings at a higher average exchange rate in 2023, as compared to 2022; partially offset by
•a reduction in earnings from our Gas Transmission and Midstream segment primarily due to our decreased interest in DCP as a result of a joint venture merger transaction with P66 that closed in the third quarter of 2022;
•higher operating and administrative costs in our Gas Transmission and Midstream and Gas Distribution and Storage segments;
•lower commodity prices impacting the DCP and Aux Sable joint ventures in our Gas Transmission and Midstream segment;
•higher interest expense primarily due to higher interest rates and higher average principal; and
•higher depreciation and amortization expense as a result of several projects placed into service in the second half of 2022.
REVENUES
We generate revenues from three primary sources: transportation and other services, gas distribution sales and commodity sales.
Transportation and other services revenues of $19.8 billion, $18.5 billion and $16.2 billion for the years ended December 31, 2023, 2022 and 2021, respectively, were earned from our crude oil and natural gas pipeline transportation businesses and also include power generation revenues from our portfolio of renewable and power generation assets. For our transportation assets operating under market-based arrangements, revenues are driven by volumes transported and the corresponding tolls for transportation services. For assets operating under take-or-pay contracts, revenues reflect the terms of the underlying contract for services or capacity. For rate-regulated assets, revenues are charged in accordance with tolls established by the regulator and, in most cost-of-service based arrangements, are reflective of our cost to provide the service plus a regulator-approved rate of return.
Gas distribution sales revenues of $4.8 billion, $5.7 billion and $4.0 billion for the years ended December 31, 2023, 2022 and 2021, respectively, were recognized in a manner consistent with the underlying rate-setting mechanism mandated by the regulator. Revenues generated by the gas distribution businesses are primarily driven by volumes delivered, which vary with weather and customer composition and utilization, as well as regulator-approved rates. The cost of natural gas is passed through to customers through rates and does not ultimately impact earnings due to its flow-through nature.
Commodity sales revenues of $19.0 billion, $29.2 billion and $26.9 billion for the years ended December 31, 2023, 2022 and 2021, respectively, were generated primarily through our Energy Services operations. Energy Services includes the purchase and sale of crude oil, natural gas, power and NGL to generate a margin, which is typically a small fraction of gross revenue. Sales revenue generated from these operations reflect activity levels which are driven by differences in commodity prices between locations, grades and points in time, rather than on absolute prices. Any residual commodity margin risk is closely monitored and managed. Revenues from these operations depend on activity levels, which vary from year-to-year depending on market conditions and commodity prices.
Our revenues also include changes in unrealized derivative fair value gains and losses related to foreign exchange and commodity price contracts used to manage exposures from movements in foreign exchange rates and commodity prices. The mark-to-market accounting creates volatility and impacts the comparability of revenues in the short-term, but we believe over the long-term, the economic hedging program supports reliable cash flows.
BUSINESS SEGMENTS
LIQUIDS PIPELINES
| | | | | | | | | | | |
| Year ended December 31, | 2023 | 2022 | 2021 |
| (millions of Canadian dollars) | | | |
Earnings before interest, income taxes and depreciation and amortization | 9,499 | | 8,364 | | 7,897 | |
Year ended December 31, 2023 compared with year ended December 31, 2022
EBITDA was positively impacted by $500 million due to certain infrequent or other non-operating factors, primarily explained by the following:
•a non-cash, net unrealized gain of $607 million in 2023, compared with a net unrealized loss of $183 million in 2022, reflecting net fair value gains and losses arising from changes in the mark-to-market value of derivative financial instruments used to manage foreign exchange and commodity price risks;
•a gain of $151 million recognized as a result of Southern Lights' discontinuation of regulatory accounting;
•the absence in 2023 of: a total asset impairment loss of $183 million on the US and Canadian components of the interstate pipeline within the North Dakota System of our Bakken System, and an asset impairment loss of $40 million relating to MacKay River line within our Alberta Regional Oil Sands System, partially offset by an asset retirement loss in 2023 of $86 million related to our Alberta Regional Oil Sands System; and
•the receipt of a litigation claim settlement of $68 million in 2023; partially offset by
•a realized loss of $638 million due to termination of foreign exchange hedges, as foreign exchange risks inherent within the CTS framework are not present in the negotiated Mainline tolling agreement.
After taking into consideration the factors above, the remaining $635 million increase is primarily explained by the following significant business factors:
•higher Mainline System ex-Gretna average throughput of 3.1 million barrels per day (mmbpd) in 2023 as compared to 3.0 mmbpd in 2022, and higher Line 9 deliveries to eastern Canada driven by higher crude demand, net of a lower L3R surcharge and lower Mainline System tolls as a result of revised interim Mainline tolls effective July 1, 2023;
•higher contributions from the Gulf Coast and Mid-Continent System due primarily to increased ownership of Gray Oak Pipeline and Cactus II Pipeline acquired in the second half of 2022 and the EIEC due to higher demand; and
•the favorable effect of translating US dollar earnings at a higher average exchange rate in 2023, as compared to 2022; partially offset by
•higher power costs as a result of increased volumes and power prices.
GAS TRANSMISSION AND MIDSTREAM
| | | | | | | | | | | |
| Year ended December 31, | 2023 | 2022 | 2021 |
| (millions of Canadian dollars) | | | |
| Earnings before interest, income taxes and depreciation and amortization | 4,264 | | 3,126 | | 3,671 | |
Year ended December 31, 2023 compared with year ended December 31, 2022
EBITDA was positively impacted by $1.2 billion due to certain infrequent or other non-operating factors primarily explained by the following:
•the absence in 2023 of a goodwill impairment of $2.5 billion; partially offset by
•the absence in 2023 of: a gain of $1,076 million on the closing of the joint venture merger transaction with P66 realigning our effective economic interests in Gray Oak and DCP, and a gain of $118 million on Texas Eastern recorded for a customer bankruptcy settlement;
•a provision adjustment and settlement of $124 million related to a litigation matter; and
•an impairment loss of $82 million to certain Offshore equity investments.
After taking into consideration the factors above, we saw a $19 million decrease, primarily explained by the following significant business factors:
•a reduction in earnings from our investment in DCP as a result of our decreased interest due to the
joint venture merger transaction with P66 that closed during the third quarter of 2022;
•higher operating and administrative costs;
•lower commodity prices impacting our DCP and Aux Sable joint ventures;
•lower AECO-Chicago basis differential impacting our investment in Alliance Pipeline, partially offset by
•the favorable effect of translating US dollar earnings at a higher average exchange rate in 2023, as compared to 2022;
•favorable contracting on our US Gas Transmission and Storage assets;
•the recognition of revenues attributable to the Texas Eastern rate case settlement effective for 2023; and
•contributions from the Tres Palacios acquisition in the second quarter of 2023 and Aitken Creek in the fourth quarter of 2023.
GAS DISTRIBUTION AND STORAGE
| | | | | | | | | | | |
| Year ended December 31, | 2023 | 2022 | 2021 |
| (millions of Canadian dollars) | | | |
| Earnings before interest, income taxes and depreciation and amortization | 1,592 | | 1,827 | | 2,117 | |
Year ended December 31, 2023 compared with year ended December 31, 2022
EBITDA was negatively impacted by $252 million due to an impairment of $281 million recognized to certain capital projects, capital costs and pension balances in the fourth quarter of 2023 as a result of the OEB's Phase 1 Decision.
After taking into consideration the factors above, the remaining $17 million increase is primarily explained by the following significant business factors:
•higher distribution charges resulting from increases in rates and customer base, as well as higher demand in the contract market; partially offset by
•when compared with the normal weather forecast embedded in rates, warmer than normal weather in 2023 negatively impacted 2023 EBITDA by approximately $86 million year over year; and
•higher operating and administrative costs primarily due to higher pension related costs.
RENEWABLE POWER GENERATION
| | | | | | | | | | | |
| Year ended December 31, | 2023 | 2022 | 2021 |
| (millions of Canadian dollars) | | | |
| Earnings before interest, income taxes and depreciation and amortization | 149 | | 262 | | 508 | |
Year ended December 31, 2023 compared with year ended December 31, 2022
EBITDA was negatively impacted by $122 million due to certain infrequent or non-operating factors, primarily explained by:
•an impairment loss of $261 million to Chapman Ranch wind facilities, partially offset by the absence in 2023 of an impairment loss of $227 million to Magic Valley; and
•a non-cash, net unrealized loss of $72 million in 2023, compared with a net unrealized gain of $8 million in 2022, reflecting changes in the mark-to-market value of derivative financial instruments used to manage commodity price risks.
After taking into consideration the negative factors above, the remaining $9 million increase is primarily explained by the following significant business factors:
•fees earned on certain wind and solar development contracts;
•higher contribution from the Hohe See and Albatros Offshore Wind Facilities as a result of the November 2023 acquisition of an additional 24.45% interest in these facilities; and
•contributions from the Saint-Nazaire Offshore Wind Project, which reached full operating capacity in December 2022; partially offset by
•lower energy pricing at European offshore wind facilities; and
•weaker wind resources at Canadian and US onshore wind facilities.
ENERGY SERVICES
| | | | | | | | | | | |
| Year ended December 31, | 2023 | 2022 | 2021 |
| (millions of Canadian dollars) | | | |
| Loss before interest, income taxes and depreciation and amortization | (37) | | (417) | | (313) | |
EBITDA from Energy Services is dependent on market conditions and results achieved in one period may not be indicative of results to be achieved in future periods.
Year ended December 31, 20172023 compared with year ended December 31, 20162022
EBITDA increasedwas positively impacted by $2$117 million due to certain unusual, infrequent or othernon-operating factors, primarily explained by the following:
a non-cash, net unrealized gain of $73 million in 2023, compared with a net unrealized loss of $200$27 million in 2017 compared with $205 million in 20162022, reflecting the revaluation of financial derivatives used to manage the profitability of transportation and storage transactions, andas well as to manage the exposure to movements in commodity prices.
After taking into consideration the factors above, the remaining $82 million decrease is primarily explained by the following significant business factor:
weaker performance from Energy Services’ Canadian and United States operations due to the compression of certain crude oil and NGL location and quality differentials in 2017 which limited opportunities to generate profitable margins.
Year ended December 31, 2016 compared with year ended December 31, 2015
EBITDA decreased by $477 million due to certain unusual, infrequent or other factors, primarily explained by the following:
a non-cash, unrealized loss of $205 million in 2016 compared with an unrealized gain of $264 million in 2015 reflecting the revaluation of financial derivatives used to manage the profitability of transportation and storage transactions and exposure to movements in commodity prices.
After taking into consideration the factor above, the remaining $30$263 million decreaseincrease is primarily explained by the following significant business factor:factors:
weaker performance from Energy Services’ Canadian and United States operations due to the compression
•expiration of certain crude oilless attractive transportation commitments;
•more favorable margins realized on facilities where we hold capacity obligations and NGL locationstorage opportunities as compared to 2022; and quality differentials in 2016 which limited opportunities
•less pronounced market structure backwardation as compared to generate profitable margins.2022.
ELIMINATIONS AND OTHER
LOSS BEFORE INTEREST, INCOME TAXES AND DEPRECIATION AND AMORTIZATION | | | | | | | | | | | |
| Year ended December 31, | 2023 | 2022 | 2021 |
| (millions of Canadian dollars) | | | |
| Earnings/(loss) before interest, income taxes and depreciation and amortization | 837 | | (1,124) | | 356 | |
|
| | | | | | |
| | 2017 |
| 2016 |
| 2015 |
|
| (millions of Canadian dollars) | |
| |
| |
|
| Loss before interest, income taxes and depreciation and amortization | (337 | ) | (101 | ) | (867 | ) |
Eliminations and Other includes operating and administrative costs andthat are not allocated to business segments, the impact of foreign exchange hedge settlements which are not allocated to business segments.and the activities of our wholly-owned captive insurance subsidiaries. Eliminations and Other also includes the impact of new business development activities generaland corporate investments and a portion of the synergies achieved thus far on integration of corporate functions in relation to the Merger Transaction.investments.
Year ended December 31, 20172023 compared with year ended December 31, 2016
2022
EBITDA decreasedwas positively impacted by $315 million$1.9 billion due to certain unusual, infrequent and otheror non-operating factors, primarily explained by:
•a non-cash, net unrealized gain of $623 million in 2023, compared with a net unrealized loss of $1,090 million in 2022, reflecting changes in the mark-to-market value of derivative financial instruments used to manage foreign exchange risk;
•the absence in 2023 of: $114 million of transaction costs in relation to our investment purchase in the Woodfibre LNG Project, and an impairment of $44 million for lease assets due to office relocation plans; and
•a non-cash, net unrealized gain of $35 million in 2023, compared with a net unrealized loss of $25 million in 2022, reflecting changes in the mark-to-market value of equity fund investments held by the following:our wholly-owned captive insurance subsidiaries; partially offset by
project development and •transaction costs of $197$31 million incurred in 2017 compared with $81 million in 2016 related toas a result of the Merger Transaction;Acquisitions.
employee severance and restructuring costs of $292 million in 2017 compared with $92 million in
2016 related to a corporate reorganization initiative and the Merger Transaction; partially offset by
a non-cash, unrealized intercompany foreign exchange loss of $29 million in 2017 compared with $43 million in 2016 under our foreign exchange risk management program.
After taking into consideration the non-operating factors above, the remaining $79we saw a $18 million increase in EBITDA that is primarily explained by higher investment income from the following significant business factor:pre-funding of the Acquisitions.
a realized loss of $173 million in 2017 compared with $281 million in 2016 related to settlements under our foreign exchange risk management program.
Year ended December 31, 2016 compared with year ended December 31, 2015
EBITDA increased by $854 million due to certain unusual, infrequent and other factors, primarily explained by the following:
a non-cash, unrealized gain of $417 million in 2016 compared with an unrealized loss of $694 million in 2015 resulting from our foreign exchange hedging program; partially offset by
a non-cash, unrealized intercompany foreign exchange loss of $43 million in 2016 compared with a gain of $131 million in 2015;
project development and transaction costs of $81 million incurred in 2016 in relation to the Merger Transaction; and
employee severances costs of $92 million in 2016 compared with $47 million in 2015 related to a corporate reorganization initiative.
After taking into consideration the factors above, the remaining $88 million decrease is primarily explained by the following significant business factor:
a realized loss of $281 million in 2016 compared with $203 million in 2015 related to settlements under our foreign exchange risk management program.
GROWTH PROJECTS –- COMMERCIALLY SECURED PROJECTS
A key element of our corporate strategy is the successful execution of our growth capital program. In 2017, we successfully placed into service approximately $12 billion of growth projects across several business units and we expect to place a further $22 billion of commercially secured projects into service through 2020.
The following table summarizes the status of our significant commercially secured projects, organized by business segment:
| | | | | | | | | | | | | | | | | | | | |
| | Enbridge's Ownership Interest | Estimated
Capital Cost1 | Expenditures
to Date2 | Status2 | Expected
In-Service
Date |
| (Canadian dollars, unless stated otherwise) | | | | |
| | | | |
| | | | | | |
| GAS TRANSMISSION AND MIDSTREAM | | |
| 1. | Texas Eastern Venice Extension Project3 | 100 | % | US$477 million | US$170 million | Under construction | 2023 - 2024 |
| 2. | Texas Eastern Modernization | 100 | % | US$394 million | US$37 million | Pre-construction | 2025 - 2026 |
| 3. | T-North Expansion | 100 | % | $1.2 billion | $70 million | Pre-construction | 2026 |
| 4. | Rio Bravo Pipeline5 | 100 | % | US$1.2 billion | US$66 million | Pre-construction | 2026 |
| 5. | Woodfibre LNG6 | 30 | % | US$1.5 billion | US$310 million | Under construction | 2027 |
| 6. | T-South Expansion4 | 100 | % | $4.0 billion | $67 million | Pre-construction | 2028 |
| | | | |
| | | | | | |
| RENEWABLE POWER GENERATION | | |
| 7. | Fécamp Offshore Wind7 | 17.9 | % | $692 million | $528 million | Under construction | 1Q-2024 |
| (€471 million) | (€362 million) |
| 8. | Calvados Offshore Wind8 | 21.7 | % | $954 million | $307 million | Under construction | 2025 |
| (€645 million) | (€214 million) |
| 9. | Fox Squirrel Solar | 50 | % | US$406 million | US$152 million | Under construction | 2023-2024 |
|
| | | | | | | | | | | | | |
| | | | Enbridge's Ownership Interest |
| | Estimated Capital Cost1 | | Expenditures to Date2 | | Status | | Expected
In-Service
Date |
| (Canadian dollars, unless stated otherwise) | | | | | | | | |
| LIQUIDS PIPELINES | | | | | | | | | |
| 1 |
| | Norlite Pipeline System (the Fund Group) | 70 | % | | $1.3 billion | | $1.1 billion | | Complete | | In service |
| |
| | | | | | | | | | |
| 2 |
| | Bakken Pipeline System (EEP)3 | 27.6 | % | | US$1.5 billion | | US$1.5 billion | | Complete | | In service |
| |
| | | | | | | | | | |
| 3 |
| | Regional Oil Sands Optimization Project (the Fund Group) | 100 | % | | $2.6 billion | | $2.3 billion | | Complete | | In service |
| | | | | | | | | | | |
| |
| | | | | | | | | | |
| 4 |
| | Lakehead System Mainline Expansion - Line 61 (EEP)4 | 100 | % | | US$0.4 billion | | US$0.4 billion | | Substantially | | 2H - 2019 |
| | | | | | | | | complete | | |
| 5 |
| | Canadian Line 3 Replacement | 100 | % | | $5.3 billion | | $2.3 billion | | Under | | 2H - 2019 |
| |
| | Program (the Fund Group) | | | | | | | construction | | |
| 6 |
| | U.S. Line 3 Replacement Program (EEP)4 | 100 | % | | US$2.9 billion | | US$0.7 billion | | Under | | 2H - 2019 |
| |
| | | | | | | | construction | | |
| 7 |
| | Other - Canada | 100 | % | | $0.2 billion | | $0.2 billion | | Various | | 2018 |
| | | | | | | | | | stages | | |
| GAS TRANSMISSION & MIDSTREAM | | | | | | | | |
| 8 |
| | Sabal Trail (SEP)5 | 50 | % | | US$1.6 billion | | US$1.5 billion | | Complete | | In service |
| | | | | | | | | | | | |
| 9 |
| | Access South, Adair Southwest and Lebanon Extension (SEP)5 | 100 | % | | US$0.5 billion | | US$0.3 billion | | Complete | | In service |
| | | | | | | | | | | |
| | | | | | | | | | | |
| 10 |
| | Atlantic Bridge (SEP)5 | 100 | % | | US$0.5 billion | | US$0.3 billion | | Under | | Q4 - 2018 |
| |
| | | | | | | | | construction | | |
| 11 |
| | NEXUS (SEP)5 | 50 | % | | US$1.3 billion | | US$0.6 billion | | Under | | Q3 - 2018 |
| | | | | | | | | | construction | | |
| 12 |
| | Reliability and Maintainability Project5 | 100 | % | | $0.5 billion | | $0.4 billion | | Under | | Q3 - 2018 |
| | | | | | | | | construction | | |
| 13 |
| | Valley Crossing Pipeline5 | 100 | % | | US$1.5 billion | | US$1.1 billion | | Under | | Q4 - 2018 |
| | | | | | | | | | construction | | |
| 14 |
| | Spruce Ridge Program5 | 100 | % | | $0.5 billion | | $0.1 billion | | Pre- | | 2019 |
| |
| | | | | | | | | construction | | |
| 15 |
| | T-South Expansion Program5 | 100 | % | | $1.0 billion | | No significant | | Pre- | | 2020 |
| | | | | | | expenditures to date | | construction | | |
| 16 |
| | Other - United States5 | 100 | % | | US$1.9 billion | | US$1.0 billion | | Various | | 2017-2019 |
| | | | | | | | | | stages | | |
| 17 |
| | Other - Canada5 | 100 | % | | $0.9 billion | | $0.7 billion | | Various | | 2017-2018 |
| | | | | | | | | | stages | | |
| GAS DISTRIBUTION | | | | | | | | | |
| 18 |
| | 2017 Dawn-Parkway Expansion5 | 100 | % | | $0.6 billion | | $0.6 billion | | Complete | | In service |
| | | | | | | | | | | |
| 19 |
| | Panhandle Reinforcement Project5 | 100 | % | | $0.3 billion | | $0.2 billion | | Complete | | In service |
| | | | | | | | | | | |
2Expenditures to date and status of the project are determined as at December 31, 2023.
3Includes the $37 million Gator Express Project placed into service in August 2023. Total estimated capital cost consists of the reversal and expansion of Texas Eastern's Line 40 expected to be completed in 2024. |
| | | | | | | | | | | | | |
| GREEN POWER & TRANSMISSION | | | | | | | | |
| 20 |
| | Chapman Ranch Wind Project | 100 | % | | US$0.4 billion | | US$0.3 billion | | Complete | | In service |
| | | | | | | | | | | |
| 21 |
| | Rampion Offshore Wind Project | 24.9 | % | | $0.8 billion | | $0.6 billion | | Under | | Q2 - 2018 |
| |
| | | | (£0.37 billion) | | (£0.3 billion) | | construction | | |
| 22 |
| | Hohe See Offshore Wind Project and Expansion | 50 | % | | $2.1 billion | | $0.5 billion | | Pre- | | 2H - 2019 |
| |
| | | | (€1.34 billion) | | (€0.4 billion) | | construction | | |
| |
1 | These amounts are estimates and are subject to upward or downward adjustment based on various factors. Where appropriate, the amounts reflect our share of joint venture projects. |
| |
2 | Expenditures to date reflect total cumulative expenditures incurred from inception of the project up to December 31, 2017. |
| |
3 | On February 15, 2017, EEP acquired an effective 27.6% interest in the Bakken Pipeline System for a purchase price of $2.0 billion (US$1.5 billion). On April 27, 2017, Enbridge entered into a joint funding arrangement with EEP whereby Enbridge owns 75% and EEP owns 25% of the combined 27.6% effective interest in the Bakken Pipeline System. |
| |
4 | The Lakehead System Mainline Expansion project is funded 75% by Enbridge and 25% by EEP, and the project will be operated by EEP on a cost-of-service basis. The U.S. L3R Program is being funded 99% by Enbridge and 1% by EEP. |
| |
5 | Project acquired as part of the Merger Transaction. For additional information, refer to Merger with Spectra Energy. |
4Capital cost estimates will be updated prior to filing the regulatory applications.
5Rio Grande LNG has reached a final investment decision for three liquefaction trains. Current estimated capital cost is based on two liquefaction trains and an update to the estimated capital cost is expected to be provided in 2024.
6Our equity contribution is approximately US$893 million, with the remainder financed through non-recourse project level debt. Capital cost estimates will be updated prior to the 60% engineering milestone, at which point Enbridge's preferred return will be set.
7Our equity contribution is $103 million, with the remainder financed through non-recourse project level debt.
8Our equity contribution is $181 million, with the remainder financed through non-recourse project level debt.
Risks related to the development and completion of growth projects are described under Part I. Item 1A.Risk Factors.
LIQUIDS PIPELINESGAS TRANSMISSION AND MIDSTREAM
The following commercially secured growth projects wereare currently in various stages of construction:
•Texas Eastern Venice Extension Project –A reversal and expansion of Texas Eastern’s Line 40 from its existing New Roads compressor station to a new delivery point with the proposed Gator Express pipeline just south of Texas Eastern’s Larose compressor station. The project is expected to deliver 1.5 billion cubic feet per day (bcf/d) of natural gas to Venture Global Plaquemines LNG, LLC’s LNG export facility located in Plaquemines Parish, Louisiana and is underpinned by long-term take or pay contracts.
•Texas Eastern Modernization – This program is the modernization of compression facilities in Pennsylvania and New Jersey to increase safety and reliability and reduce associated greenhouse gas emissions at multiple sites on our Texas Eastern system. The program will be completed in stages over a period of years beginning in 2024.
•T-North Expansion – An expansion of Westcoast Energy Inc.'s (Westcoast) BC Pipeline in northern BC that includes pipeline looping, additional compressor units and other ancillary station modifications to support 535 million cubic feet per day (mmcf/d) of additional capacity. The project will be underpinned by a cost-of-service commercial model with a target in-service date of 2026. On January 8, 2024, we filed the regulatory application with the CER.
•Rio Bravo Pipeline – In July 2023, the Rio Grande LNG export facility, owned by NextDecade Corporation (NextDecade), reached a final investment decision. As a result, the construction on our previously announced Rio Bravo Pipeline project is anticipated to proceed after obtaining necessary regulatory approvals. The first phase of the Rio Bravo Pipeline is designed to transport 2.6 bcf/d of natural gas feedstock to NextDecade's Rio Grande LNG export facility in the Port of Brownsville, Texas. The project is expected to achieve commercial operations in 2026.
•Woodfibre LNG Project –Construction of liquefaction and floating storage facilities in Squamish, BC, as well as an expansion of the BC Pipeline System. The project is expected to be placed into service in 2017:2027.
Norlite Pipeline System (the Fund Group)- a diluent•T-South Expansion – An expansion of Westcoast's BC Pipeline's T-South section that includes pipeline originating from our Stonefell Terminallooping, additional compressor units and terminating at our Fort McMurray South facility, with a transfer lineother ancillary station modifications to Suncor's East Tank Farm. support 300 mmcf/d of additional capacity. The project provides an initial capacity of approximately 218,000 bpd, with the potentialis expected to be further expanded to approximately 465,000 bpd with the addition of pump stations. The project was placed intoin service in 2028 and will be underpinned by a cost-of-service commercial service on May 1, 2017.
model.
Bakken Pipeline System (EEP) -a pipeline system that transports crude oil from the Bakken formation in North Dakota to markets in eastern PADD II, and the United States Gulf Coast. The system's initial capacity is approximately 470,000 bpd of crude oil and has the potential to be expanded to 570,000 bpd. The system was placed into service on June 1, 2017.
Regional Oil Sands Optimization Project (the Fund Group)- the Athabasca Pipeline Twin portion of the project, which includes twinning of the southern section of the crude oil Athabasca Pipeline from Kirby Lake, Alberta to the crude oil hub at Hardisty, Alberta provides an initial capacity of approximately 450,000 bpd, with the potential to be further expanded to approximately 800,000 bpd. This portion of the project was placed into service on January 1, 2017. The Wood Buffalo Extension portion of the project includes a crude oil pipeline expansion between Cheecham, Alberta and Kirby Lake, Alberta that provides an initial capacity of approximately 635,000 bpd, with the potential to be further expanded to approximately 800,000 bpd. This portion of the project was placed into service on December 1, 2017.
JACOS Hangingstone Project (the Fund Group) -a crude oil pipeline connecting the Japan Canada Oil Sands Limited (JACOS) Hangingstone project site to our existing Cheecham Terminal that provides an initial capacity of approximately 40,000 bpd. The project was placed into service on August 29, 2017.
RENEWABLE POWER GENERATION
The following commercially secured growth projects are expected to be placed into service in 2018 and 2019:from 2023 to
2025:
Lakehead System Mainline Expansion (EEP) - the remaining scope of the•Fécamp Offshore Wind Project – An offshore wind project includes the Southern Access expansion between Superior, Wisconsin and Flanagan, Illinois that will increase capacity from 950,000 bpd to 1,200,000 bpd, which was substantially completed in Junebe comprised of 2017. We currently anticipate an in-service date in71 wind turbines located off the second halfnorthwest coast of 2019 for this phase to more closely align
with the anticipated in-service date for the Line 3 Replacement Program (U.S. L3R Program). For additional updates on the project, refer to Growth Projects - Regulatory Matters.
Canadian Line 3 Replacement Program (the Fund Group)- replacement of the existing Line 3 crude oil pipeline between Hardisty, AlbertaFrance and Gretna, Manitoba. The L3R Program will not provide an increase in the overall capacity of the mainline system, but will restore approximately 370,000 bpd and supports the safety and operational reliability of the overall system, enhances flexibility and will allow us to optimize throughput from western Canada into Superior, Wisconsin. The L3R Program is expected to achieve the original capacity ofgenerate approximately 760,000 bpd. Construction commenced in early August 2017. For additional updates on the project, refer to Growth Projects - Regulatory Matters500 megawatts (MW).
United States Line 3 Replacement Program (EEP) - replacement of the existing Line 3 crude oil pipeline between Neche, North Dakota and Superior, Wisconsin. The U.S. L3R Program, along with the Canadian L3R Program discussed above, will support the safety and operational reliability of the mainline system, enhance system flexibility, and allow the Company and EEP to optimize throughput on the mainline. The L3R Program is expected to achieve the original capacity of approximately 760,000 bpd. Construction commenced on the Wisconsin portion of the U.S. L3R Program in late June 2017 and will be substantially complete in February 2018. For additional updates on the project, refer to Growth Projects - Regulatory Matters.
GAS TRANSMISSION AND MIDSTREAM
The following commercially secured growth projects were placed into service in 2017:
Sabal Trail (SEP) - a natural gas pipeline connecting Alexander City, Alabama to the Central Florida Hub in Kissimmee, Florida that provides capacity of approximately 1.1 billion cubic feet per day (bcf/d) of new capacity to access onshore shale gas supplies once approved future expansions Project revenues are completed. Facilities include a new 749-kilometer (465-mile) pipeline, laterals and various compressor stations. The project was placed into service on July 3, 2017.
Access South, Adair Southwest and Lebanon Extension (SEP) - natural gas pipeline extensions connecting the Appalachian region of the United States to markets in the Midwest and Southeast regions of the United States. The combined projects provide an initial capacity of 622 million cubic feet per day (mmcf/d) of gas to customers in Ohio, Kentucky and Mississippi. The Lebanon extension was placed into service early, on August 1, 2017 and the majority of the Access and Adair portions of the project were placed in service in November 2017 with the final 20 mmcf/d expected to be placed in service in the first quarter of 2018.
The following commercially secured growth projects are expected to be placed into service in 2018 to 2020:
Atlantic Bridge (SEP) - expansion of SEP’s Algonquin Gas Transmission systems to transport 133 mmcf/d of natural gas to the New England Region. The expansion primarily consists of the replacement of a natural gas pipeline, meter station additions, compression additions in Connecticut, and a new compressor station in Massachusetts. The Connecticut portion of the project was placed into service in the fourth quarter of 2017. The remainder of the project is expected to be in-service during the fourth quarter of 2018.
NEXUS (SEP) - a natural gas pipeline system connecting SEP’s Texas Eastern pipeline system in Ohio to the Union Gas Dawn hub in Ontario, via Vector Pipeline L.P., that will provide capacity of up to approximately 1.5 bcf/d. The project received a Notice to Proceed from the Federal Energy Regulatory Commission (FERC) in August 2017 and construction activities have commenced.
Reliability and Maintainability Project - a natural gas pipeline project designed to enhance the performance of the southern segment of the British Columbia Pipeline system to accommodate the increased base load on the system. The project involves adding new compressor units at three compressor stations along the pipeline system as well as upgrading existing pipeline crossovers and adding new crossovers at key locations. During 2017, six crossovers were placed into service.
Valley Crossing Pipeline - a natural gas pipeline connecting the Agua Dulce hub in Texas to an offshore tie-in with the Sur de Texas-Tuxpan project, which is being constructedunderpinned by a third party. The project will help Mexico meet its growing gas fired electric generation needs by providing capacity of up to approximately 2.6 bcf/d.
20-year fixed price power purchase agreement (PPA).
Spruce Ridge Program - natural gas pipeline expansion of Westcoast Energy Inc.’s British Columbia Pipeline in northern British Columbia, which consists of the Aitken Creek Looping project and the Spruce Ridge Expansion project. The combined projects will provide additional capacity of up to 402 mmcf/d.
T-South Expansion Program - natural gas pipeline expansion of Westcoast Energy Inc.’s T-South system that will provide additional capacity of approximately 190 mmcf/d into the Huntington/Sumas market at the United States/Canada border.
GAS DISTRIBUTION
In addition to normal course investment to support customer additions, the following commercially secured growth projects were placed into service in 2017:
2017 Dawn-Parkway Expansion - the expansion of the existing Dawn-Parkway pipeline system, which provides transportation service from Dawn to the Greater Toronto Area, through the addition of new compressors at each of the Dawn, Lobo and Bright compressor stations in Ontario. The project provides additional capacity of approximately 419 mmcf/d and was placed into service in October 2017.
Panhandle Reinforcement Project - the expansion of the existing Panhandle pipeline from Dawn to the Dover transmission station in Chatham-Kent, Ontario. The project serves firm demand growth in southwestern Ontario and was placed into service in November 2017.
GREEN POWER AND TRANSMISSION
The following commercially secured growth project was placed into service in 2017:
Chapman Ranch Wind Project - a wind project that consists of 81 Acciona Windpower North America, LLC (Acciona) turbines located in Nueces County, Texas which generate approximately 249-MW of power and were placed into service on October 25, 2017. Acciona provides turbine operations and maintenance services under a five-year fixed-price contract with an option to extend. The project is backed by a 12-year power offtake agreement.
The following commercially secured growth projects are expected to be placed into service in 2018 and 2019:
Rampion•Calvados Offshore Wind Project - a– An offshore wind project located off the Sussex coast in the United Kingdom, consisting of 116 turbines, which will generate approximately 400-MW when complete. We hold an effective 24.9% interest, United Kingdom’s Green Investment Bank plc holds a 25% interest and E.ON SE holds the remaining 50.1% interest in the project, which was developed and is being constructed by E.ON Climate & Renewables UK Limited, a subsidiary of E.ON SE. The Rampion Offshore Wind Project is backed by revenues from the United Kingdom’s fixed-price Renewable Obligation certificates program and a 15-year power purchase agreement. The project generated first power in November 2017 and is currently in the commissioning phase.
Hohe See Offshore Wind Project and Expansion - a wind project located in the North Sea, off the coast of Germany that will generate approximately 497-MW, with an additional 112-MW from the expansion. The Hohe See Offshore Wind Project and Expansion will be constructed under fixed-price engineering, procurement, construction and installation contracts, which have been secured with key suppliers. The Hohe See Project and Expansion is backed by a government legislated 20-year revenue support mechanism.
OTHER ANNOUNCED PROJECTS UNDER DEVELOPMENT
The following projects have been announced by us, but have not yet met our criteria to be classified as commercially secured:
LIQUIDS PIPELINES
Gray Oak Pipeline Project - a 385,000 bpd pipeline system to provide producers and other shippers the opportunity to secure crude oil transportation from West Texas to the destination markets of Corpus Christi, Freeport, and Houston, Texas with connectivity to over 3 million bpd of refining capacity and multiple dock facilities capable of crude oil exports. The project is a joint development with Phillips 66 and would be placed into service during the second half of 2019 depending on shipper interest expressed in the recently closed open season.
GAS TRANSMISSION AND MIDSTREAM
Gulf Coast Express Pipeline Project - a natural gas pipeline connecting the Waha, Texas area to Agua Dulce, Texas that will provide capacity up to approximately 1.7 bcf/d. The project is a joint development between our equity investment DCP Midstream, Kinder Morgan Texas Pipeline LLC and an affiliate of Targa Resources Corp, and is expected to be placed into service during the second half of 2019, subject to obtaining sufficient shipper commitments.
Alliance Pipeline Expansion Project - Alliance Pipeline announced a non-binding request for expressions of interest for additional transportation service on the Alliance Pipeline Canada and Alliance Pipeline US systems. Alliance Pipeline continues to engage with interested parties and assess the addition of more compression facilities along the system in order to increase throughput capacity by up to 500 mmcf/d. The projected in-service date for the potential capacity expansion is the second half of 2021.
Access Northeast - Access Northeast is a project that will bring affordable energy to New England consumers. Natural gas pipeline capacity scarcity and system reliability remains a primary issue for New England and one that must be resolved for the region to meet its energy supply needs. The project's partners continue to pursue a viable commercial and operational model to provide natural gas to the region.
GREEN POWER AND TRANSMISSION
Éolien Maritime France SAS - a 50% interest in Éolien Maritime France SAS (EMF), a French offshore wind development company, which is co-owned by EDF Energies Nouvelles, a subsidiary of Électricité de France S.A. EMF holds licenses for three large-scale offshore wind farms off thenorthwest coast of France that would generate approximately 1,428 MW. The development of these projects is subject to a final investment decision and regulatory approvals, the timing of which is not yet certain.
We also have a large portfolio of additional projects under development that have not yet progressed to the point of public announcement.
GROWTH PROJECTS - REGULATORY MATTERS
Lakehead System Mainline Expansion (EEP)
On October 16, 2017, the United States Department of State issued a Presidential permit to EEP to operate Line 67 at its design capacity of 888,889 bpd at the international border of the United States and Canada near Neche, North Dakota.
Canadian Line 3 Replacement Program (the Fund Group)
In December 2016, the Manitoba Metis Federation (MMF) and the Association of Manitoba Chiefs (AMC) applied to the Federal Court of Appeal for leave, which was subsequently granted, to judicially review the Government of Canada’s decision to approve the Canadian L3R Program. On July 4, 2017, the MMF discontinued its judicial review application. On October 25, 2017, the AMC discontinued its judicial review application. As a result, no further challenges to the Government of Canada's decision to approve the Canadian L3R Program may be brought by any party.
All required pre-construction filings have been approved by the NEB.
United States Line 3 Replacement Program (EEP)
EEP is in the process of obtaining the appropriate permits for constructing the U.S. L3R Program in Minnesota. The project requires both a Certificate of Need and an approval of the pipeline’s route (Route Permit) from the MNPUC. The MNPUC found both the Certificate of Need and Route Permit applications for the U.S. L3R Program through Minnesota to be complete. On February 1, 2016, the MNPUC issued a written order requiring the Minnesota Department of Commerce (DOC) to prepare an Environmental Impact Statement (EIS) before the filing of intervenor testimony in the Certificate of Need and Route Permit processes. The DOC issued the final EIS on August 17, 2017. The MNPUC determined the final EIS to be inadequate in four specific areas on December 7, 2017. The DOC provided a supplemental EIS on February 12, 2018, and the MNPUC will determine its adequacy in the second quarter of 2018. In the parallel Certificate of Need and Route Permit dockets, public and evidentiary hearings were held at locations along the proposed route and in Saint Paul, Minnesota from September to November 2017 and are now complete. The MNPUC is expected to vote ongenerate approximately 448 MW. Project revenues are underpinned by a 20-year fixed price PPA.
•Fox Squirrel Solar – A fully contracted, ground-mounted solar facility in Ohio with expected installed capacity of approximately 577 MW. The initial phase successfully commenced operations in December 2023. We plan to invest in the Certificate of Need and Route Permit at the end of the second quarter of 2018.following phases in 2024, assuming certain conditions are met. Project revenues are underpinned by a 20-year fixed price PPA.
LIQUIDITY AND CAPITAL RESOURCES
The maintenance of financial strength and flexibility is fundamental to our growth strategy, particularly in light of the significant number and size of capital projects and acquisitions currently secured or under development. Access to timely funding from capital markets could be limited by factors outside our control including, but not limited to, financial market volatility resulting from economic and political events both inside and outside North America. To mitigate such risks, we actively manage financial plans and strategies to ensure we maintain sufficient liquidity to meet routine operating and future capital requirements. In the near term, we generally expect to utilize cash from operations together with commercial paper issuance and/or credit facility draws and the proceeds of capital market offerings to fund liabilities as they become due, finance capital expenditures, fund debt retirements and pay common and preference share dividends.We target to maintainmaintaining sufficient liquidity through securementthe use of committed credit facilities with a diversified group of banks and financial institutions to enable us to fund all anticipated requirements for approximately one year without accessing the capital markets.
Material contractual obligations arising in the normal course of business primarily consist of long-term contracts, annual debt maturities and related interest obligations, rights-of-way and leases. See Part II. Item 8. Financial Statements and Supplementary Data - Note 17 - Debt and Note 26 - Leases for amounts outstanding at December 31, 2023, related to debt and leases.
Long-term contracts are contracts that we have signed for the purchase of services, pipe and other materials totaling $8.9 billion which are expected to be paid over the next five years. Remaining long-term contracts primarily consist of the following purchase obligations: firm capacity payments for natural gas and crude oil transportation and storage contracts, natural gas purchase commitments, service and product purchase obligations and power commitments.
Our financing plan is regularly updated to reflect evolving capital requirements and financial market conditions and identifies a variety of potential sources of debt and equity funding alternatives, including utilizationreinstatement of our sponsored vehicles. For additional information, refer to Sponsored Vehicles below.dividend reinvestment and share purchase plan or at-the-market equity issuances.
CAPITAL MARKET ACCESS
We ensure ready access to capital markets, subject to market conditions, through maintenance of shelf prospectuses that allow for issuance of long-term debt, equity and other forms of long-term capital when market conditions are attractive. In accordance with our funding plan, we completed the following long-term debt issuances totaling US$8.5 billion and $3.9 billion in 2017:2023:
| | | | | | | | | | | |
| Entity | Issuance date | Type of issuance | Amount |
| | | |
Entity | Type of Issuance | Amount |
|
| (in millions of Canadian dollars, unless stated otherwise) | |
|
| Enbridge Inc. | Common shares (via share exchange*)March 2023 | 37,429Sustainability-linked senior notes |
US$2,300 |
| Enbridge Inc. | Common shares (by private placement)March 2023 | 1,500Senior notes |
US$700 |
| Enbridge Inc. | Preference sharesMay 2023 | 500Medium-term notes |
$1,100 |
| Enbridge Inc. | Fixed-to-floating rate subordinatedMay 2023 | Sustainability-linked medium-term notes | 1,650 |
$400 |
| Enbridge Inc. | Floating rateSeptember 2023 | Fixed-to-fixed subordinated notes | 750 |
US$2,000 |
| Enbridge Inc. | Medium-termSeptember 2023 | Fixed-to-fixed subordinated notes | 1,200 |
$1,000 |
| Enbridge Inc. | US$ Fixed-to-floating rate subordinated notesNovember 2023 | US$1,000Senior notes |
US$3,500 |
| Enbridge Gas Inc. | US$ Floating rateOctober 2023 | Medium-term notes | US$1,200 |
$1,000 |
| Enbridge Pipelines Inc. | US$ Senior notesAugust 2023 | US$1,400 |
|
Enbridge Income Fund Holdings Inc.
| Common shares | 575 |
|
Enbridge Income Fund Holdings Inc.
| Common shares (Secondary offering by Enbridge) | 575 |
|
Enbridge Gas Distribution Inc. (EGD) | Medium-term notes | 300 |
|
Spectra Energy Partners, LP | Floating rate notes | US$400 |
|
Union Gas Limited | Medium-term notes | 500 |
$350 |
* In connection with the Merger Transaction
On January 9, 2018, Texas Eastern Transmission, LP, a wholly-owned operating subsidiary of SEP, completed an offering of US$800 million of senior notes, which consisted of two US$400 million tranches with fixed interest rates of 3.50% and 4.15% which mature in 2028 and 2048, respectively.
Credit Facilities, Ratings and Liquidity
To ensure ongoing liquidity and to mitigate the risk of capital market disruption, we maintain ready access to funds through committed bank credit facilities and actively manage our bank funding sources to optimize pricing and other terms. The following table provides details of our committed credit facilities, inclusive of term loans, at December 31, 2017.2023:
| | | | | | | | | | | | | | |
| Maturity1 | Total Facilities | Draws2 | Available |
| (millions of Canadian dollars) | | | | |
| Enbridge Inc. | 2024-2028 | 8,876 | | 3,177 | | 5,699 | |
| Enbridge (U.S.) Inc. | 2025-2028 | 8,373 | | 670 | | 7,703 | |
| Enbridge Pipelines Inc. | 2025 | 2,000 | | 449 | | 1,551 | |
| Enbridge Gas Inc. | 2025 | 2,500 | | 400 | | 2,100 | |
| Total committed credit facilities | | 21,749 | | 4,696 | | 17,053 | |
|
| | | | | | | |
| | | 2017 |
| | | Total |
| |
| |
|
| December 31, | Maturity | Facilities |
| Draws1 |
| Available |
|
| (millions of Canadian dollars) | | |
| |
| |
|
Enbridge Inc.2 | 2019-2022 | 7,353 |
| 2,737 |
| 4,616 |
|
| Enbridge (U.S.) Inc. | 2019 | 3,590 |
| 490 |
| 3,100 |
|
Enbridge Energy Partners, L.P.3 | 2019-2022 | 3,289 |
| 1,820 |
| 1,469 |
|
| Enbridge Gas Distribution Inc. | 2019 | 1,016 |
| 972 |
| 44 |
|
| Enbridge Income Fund | 2020 | 1,500 |
| 766 |
| 734 |
|
| Enbridge Pipelines (Southern Lights) L.L.C. | 2019 | 25 |
| — |
| 25 |
|
| Enbridge Pipelines Inc. | 2019 | 3,000 |
| 1,438 |
| 1,562 |
|
| Enbridge Southern Lights LP | 2019 | 5 |
| — |
| 5 |
|
Spectra Energy Partners, LP4,5 | 2022 | 3,133 |
| 2,824 |
| 309 |
|
Union Gas Limited5
| 2021 | 700 |
| 485 |
| 215 |
|
Westcoast Energy Inc.5
| 2021 | 400 |
| — |
| 400 |
|
| Total committed credit facilities | | 24,011 |
| 11,532 |
| 12,479 |
|
| |
1 | Includes facility draws, letters of credit and commercial paper issuances that are back-stopped by the credit facility. |
| |
2 | Includes $135 million, $157 million (US$125 million) and $150 million of commitments that expire in 2018, 2018 and 2020, respectively. |
| |
3 | Includes $219 million (US$175 million) and $232 million (US$185 million) of commitments that expire in 2018 and 2020, respectively.
|
| |
4 | Includes $421 million (US$336 million) of commitments that expire in 2021.
|
| |
5 | Committed credit facilities acquired on February 27, 2017 in conjunction with the Merger Transaction. For additional information, refer to Merger with Spectra Energy.
|
1Maturity date is inclusive of the one-year term out option for certain credit facilities.
During the first quarter of 2017,2Includes facility draws and commercial paper issuances that are back-stopped by credit facilities.
In March 2023, Enbridge established a five-year, termGas increased its 364-day extendible credit facility from $2.0 billion to $2.5 billion and in July 21, 2023, the facility's maturity date was extended to July 2025, which includes a one-year term out provision from July 2024.
In July 2023, Enbridge Pipelines Inc. extended the maturity date of its 364-day extendible credit facility to July 2025, which includes a one-year term out provision from July 2024.
In July 2023, we renewed approximately $6.8 billion of our 364-day extendible credit facilities, extending the maturity dates to July 2025, which includes a one-year term out provision from July 2024. We also renewed approximately $7.6 billion of our five-year credit facilities, extending the maturity dates to July 2028. Further, we extended our three-year credit facilities, extending the maturity dates to July 2026.
In September 2023, we obtained commitments for $239 million (¥20,000 million) with a syndicate of Japanese banks. Principal and interest onUS$9.4 billion senior unsecured bridge term loan credit facility to support the Acquisitions. The commitment for this facility have been convertedwas subsequently reduced to United States dollars usingnil as at December 31, 2023 as a cross currency interest rate swap.result of the September 2023 $4.6 billion equity offering, the September 2023 subordinated long-term debt issuances, and the November 2023 senior notes long-term debt issuances.
In addition to the committed credit facilities noted above, we have $792 millionmaintain $1.1 billion of uncommitted demand letter of credit facilities, of which $518$572 million werewas unutilized as at December 31, 2017.2023. As at December 31, 2016,2022, we had $335 million$1.3 billion of uncommitted demand letter of credit facilities, of which $177$689 million werewas unutilized.
OurAs at December 31, 2023, our net available liquidity totaled $23.0 billion (2022 - $10.0 billion), consisting of $12,959 million at December 31, 2017 was inclusiveavailable credit facilities of $480 million of$17.1 billion (2022 - $9.1 billion) and unrestricted cashCash and cash equivalents of $5.9 billion (2022 - $861 million) as reported onin the Consolidated Statements of Financial Position.
Our credit facility agreements and term debt indentures include standard events of default and covenant provisions, whereby accelerated repayment and/or termination of the agreements may result if we were to default on payment or violate certain covenants. As at December 31, 2017,2023, we were in compliance with all debt covenants and expect to continue to comply with such covenants.
Cash flow growth, in internal cash flow, ready access to liquidity from diversified sources and a stable business model have enabled us to manage our credit profile. We actively monitor and manage key financial metrics with the objective of sustaining investment grade credit ratings from the major credit rating agencies and ongoing access to bank funding and term debt capital on attractive terms. In 2023, our credit ratings with DBRS Morningstar, Fitch Ratings, Moody's Investor Services, Inc. and Standard & Poor's were all affirmed. Key measures of financial strength that are closely managed include the ability to service debt obligations from operating cash flow and the ratio of debt to total capital. As at December 31, 2017, our debt capitalization ratio was 48.3% compared with 61.8% as at December 31, 2016. The improvement in the ratio reflected an increase in equity that resulted from the Merger Transaction.EBITDA.
During 2017, our credit ratings were affirmed as follows:
DBRS Limited confirmed our issuer rating and medium-term notes and unsecured debentures rating of BBB (high), fixed-to-floating subordinated notes rating of BBB (low), preference share rating of Pfd-3 (high) and commercial paper rating of R-2 (high), and changed their rating outlook from under review with developing implications to stable.
Standard & Poor’s Rating Services (S&P) affirmed our corporate credit rating and senior unsecured debt rating of BBB+, preference share rating of P-2 (low) and commercial paper rating of A-1 (low), and reaffirmed a stable outlook. S&P also affirmed our global overall short-term rating of A-2.
In June 2017, we obtained Fitch long-term issuer default rating and senior unsecured debt rating of BBB+, preference share rating of BBB-, junior subordinated note rating of BBB-, and short-term and commercial paper rating of F2 with a stable rating outlook.
On December 22, 2017, Moody’s Investor Services, Inc. downgraded our issuer and senior unsecured ratings from Baa2 to Baa3, subordinated rating from Ba1 to Ba2, preference share rating from Ba1 to Ba2, commercial paper rating for Enbridge (U.S.) Inc. from P-2 to P-3, and changed the outlook on all of these ratings from negative to stable.
We invest surplus cash in short-term investment grade money market instruments with highly creditworthy counterparties. Short-term investments were $70 millionas at December 31, 2017 compared with $800 million as at December 31, 2016. The higher short-term investment balances at the end of 2016 reflect the temporary investment of a portion of the proceeds of capital markets offerings undertaken by us in the fourth quarter of 2016, pending its redeployment in our growth capital program.
There are no material restrictions on our cash. Total restrictedRestricted cash of $107$84 million, includes EGD’s and Union Gas’ receiptas reported in the Consolidated Statements of cash from the Government of Ontario to fund its Green Investment Fund program. In addition, our restricted cashFinancial Position, primarily includes cash collateral and amounts receivedfuture pipeline abandonment costs collected and held in respect of specific shipper commitments.trust. Cash and cash equivalents held by EEP, the Fund Group and SEP are generally not readily accessible by us until distributions are declared and paid by these entities, which occurs quarterly for EEP and SEP, and monthly for the Fund Group. Further, cash and cash equivalents held by certain foreign subsidiaries may not be readily accessible for alternative usesuse by us.
Excluding current maturities of long-term debt, as at December 31, 20172023 and 20162022, we had a positive and negative working capital positionpositions of $2,538 million$3.0 billion and $456 million,$2.1 billion, respectively. In both periods,2023, the major contributing factor to the positive working capital position was the increase in cash associated with pre-funding of the Acquisitions. In 2022, the major contributing factor to the negative working capital position was the ongoing funding ofcurrent liabilities associated with our growth capital program.
To address this negative working capital position, we maintain significant liquidity in the form of committed credit facilities and other sources as previously discussed, which enable the funding of liabilities as they become due. As at December 31, 2017 and 2016, our net available liquidity totaled $12,959 million and $14,274 million, respectively, on a consolidated basis. It is anticipated that any current maturities of long-term debt will be refinanced upon maturity.
SOURCES AND USES OF CASH
| | | | | | | | | | | |
| Year ended December 31, | 2023 | 2022 | 2021 |
| (millions of Canadian dollars) | | | |
| Operating activities | 14,201 | | 11,230 | | 9,256 | |
| Investing activities | (6,043) | | (5,270) | | (10,657) | |
| Financing activities | (2,864) | | (5,428) | | 1,236 | |
| Effect of translation of foreign denominated cash and cash equivalents and restricted cash | (216) | | 55 | | (5) | |
| Net change in cash and cash equivalents and restricted cash | 5,078 | | 587 | | (170) | |
|
| | | | | | |
| December 31, | 2017 |
| 2016 |
| 2015 |
|
| (millions of Canadian dollars) | |
| |
| |
|
| Operating activities | 6,584 |
| 5,211 |
| 4,571 |
|
| Investing activities | (11,002 | ) | (5,192 | ) | (7,933 | ) |
| Financing activities | 3,476 |
| 840 |
| 3,074 |
|
| Effect of translation of foreign denominated cash and cash equivalents | (72 | ) | (19 | ) | 143 |
|
| Increase/(decrease) in cash and cash equivalents | (1,014 | ) | 840 |
| (145 | ) |
Significant sources and uses of cash for the years ended December 31, 20172023 and 20162022 are summarized below:
Operating Activities
2017
The growth inTypically, the primary factors impacting cash flow deliveredprovided by operations in 2017 is a reflection of the positive operating factors discussed under Results of Operations, which primarily included contributions from new assets of approximately $2,574 million following the completion of the Merger Transaction.
For the year ended, partially offsetting the increase in cash flows from operating activities are transaction costsyear-over-year include changes in connection with the Merger Transaction, as well as employee severance costs in relation to our enterprise-wide reduction of workforce.
Changes in operating assets and liabilities to $314 million from $358 million for the years ended December 31, 2017 and 2016, respectively, reflected negative working capital in each of those years. Our operating assets and liabilities fluctuate in the normal course due to various factors, including the impact of fluctuations in commodity prices and activity levels on working capital within the Energy Services and Gas Distributionour business segments, the timing of tax payments, as well as timing of cash receipts and payments.
2016
The growthpayments generally. Refer to Part II. Item 8. Financial Statements and Supplementary Data - Note 28. Changes in cash flow deliveredOperating Assets and Liabilities. Cash provided by operationsoperating activities is also impacted by changes in 2016 was a reflection of the positive operatingearnings and certain infrequent or other non-operating factors, as discussed under Results of Operations,, which primarily included stronger contributions from the Liquids Pipelines segment, partially offset by higher financing costs resulting from the incurrence of incremental debt to fund asset growth and the impact of refinancing construction debt with longer-term debt financing.
Changes in operating assets and liabilities included within operating activities were $358 million for the year ended December 31, 2016 compared with $645 million for the comparative 2015 year. Our operating assets and liabilities fluctuate in the normal course due to various factors including fluctuations in commodity prices and activity levels within the Energy Services and Gas Distribution segments, the timing of tax payments, general variations in activity levels within our businesses, as well as timing of cash receipts and payments.Distributions from equity investments.
Investing Activities
We continue with the execution ofCash used in investing activities primarily relates to capital expenditures to execute our growth capital program, which is further described in Growth Projects –- Commercially Secured Projects. The timing of project approval, construction and in-service dates impacts the timing of cash requirements. Cash used in investing activities is also impacted by acquisitions and dispositions as discussed under Recent Developments, and changes in contributions to, and distributions from, our equity investments.
A summary of additions to property, plant and equipment for the years ended December 31, 2017, 20162023, 2022 and 20152021 is set out below:
| | | | | | | | | | | |
| Year ended December 31, | 2023 | 2022 | 2021 |
| (millions of Canadian dollars) | | | |
| Liquids Pipelines | 1,158 | | 1,418 | | 4,051 | |
| Gas Transmission and Midstream | 1,890 | | 1,647 | | 2,353 | |
| Gas Distribution and Storage | 1,451 | | 1,499 | | 1,343 | |
| Renewable Power Generation | 100 | | 50 | | 16 | |
| Energy Services | — | | — | | 1 | |
| Eliminations and Other | 55 | | 33 | | 54 | |
| Total capital expenditures | 4,654 | | 4,647 | | 7,818 | |
|
| | | | | | |
| Year ended December 31, | 2017 |
| 2016 |
| 2015 |
|
| (millions of Canadian dollars) | |
| |
| |
|
| Liquids Pipelines | 2,797 |
| 3,956 |
| 5,882 |
|
| Gas Transmission and Midstream | 3,883 |
| 176 |
| 385 |
|
| Gas Distribution | 1,177 |
| 713 |
| 858 |
|
| Green Power and Transmission | 321 |
| 251 |
| 68 |
|
| Energy Services | 1 |
| — |
| — |
|
| Eliminations and Other | 108 |
| 32 |
| 80 |
|
| Total capital expenditures | 8,287 |
| 5,128 |
| 7,273 |
|
2023
2017
The increase in cash used in investing activities was primarily attributableresulted from the following factors:
•the absence in 2023 of the proceeds received from the completion of a joint venture merger transaction for DCP Midstream, LLC in August 2022; and
•higher cash outflows related to capital expenditures of $8,287 millionacquisitions in 2023 when compared with $5,128 million for the comparable period, which include capital expenditures on assets and growth projects acquired through the Merger Transaction, and increased investment in equity investments. During the first half of 2017, we paid cash consideration of $2.0 billion (US $1.5 billion) for the acquisition of an interest in the Bakken Pipeline System. In addition, we also made an equity investment of $0.5 billion in connection with our 50% interest in the Hohe See Offshore Wind Project.to 2022.
The factors above increase in cash usage waswere partially offset by cash acquiredhigher distributions in the Merger Transaction2023 mainly related to our investment in the first quarter of 2017, proceeds from the disposition of the Ozark Pipeline, Sandpiper Project and Olympic Pipeline in 2017.NEXUS Gas Transmission, LLC.
20162022
The timing of projects approval,construction and in-service dates impacted the timing of cash requirements. For the year ended December 31, 2016, additions to property, plant and equipment resulted in cash expenditures of $5,128 million compared with $7,273 million for the year ended December 31, 2015. The year-over-year decrease reflected the successful completion of growth projects in 2015, including the Edmonton to Hardisty Expansion, Southern Access Extension and phases of the Eastern Access Program.
Also contributing to the decrease in year-over-year cash used in investing activities were primarily resulted from the following factors:
•lower capital expenditures due to the US L3R program that was placed into service in the fourth quarter of 2021;
•lower cash outflows related to acquisitions in 2022 when compared to 2021; and
•proceeds received from dispositionthe completion of assets. For a joint venture merger transaction for DCP Midstream LLC in August 2022.
The factors above were partially offset by:
•the year ended December 31, 2016,absence in 2022 of proceeds received from dispositions were $1,379 million compared with $146 million for the year ended December 31, 2015. The majority of the proceeds in 20162021 related to the sale of the South Prairie Region assets completedour interest in Noverco Inc. in December 2016.2021; and
Partially offsetting the above factors was higher spending in 2016 for acquisitions. During the second quarter of 2016, we made an initial equity investment in and advanced an affiliate loan to acquire a 50% interest in a French offshore wind development company and fund the ongoing development costs of that company.•increased investments held by our wholly-owned captive insurance subsidiaries.
Financing Activities
2017Cash used in financing activities primarily relates to issuances and repayments of external debt, as well as transactions with our common and preference shareholders relating to dividends, share issuances, share redemptions and common share repurchases under our NCIB. Cash used in financing activities is also impacted by changes in distributions to, and contributions from, noncontrolling interests.
2023
The increasedecrease in net cash generated fromused in financing activities primarily resulted from the following factors:
We issued a series of medium term fixed and floating rate notes, the proceeds of which were used to repay maturing term notes and credit facilities and to finance growth capital programs. For the year ended 2017, proceeds from term note•higher long-term debt issuances were primarily used to repay credit facilities and redeem tender offers for Spectra Energy’s outstanding senior unsecured notes as discussed in Liquidity and Capital Resources - Capital Market Access.
The change in cash generated from financing activities reflected overall higher cash contributions from redeemable noncontrolling interests of $1,178 million2023 when compared with $591 million in the comparable period attributable to our holdings in ENF equity. Cash contributions were also higher
for noncontrolling interests, which now include noncontrolling interests acquired through the Merger Transaction, which is more than offset by the increase in distributions to noncontrolling interests. The increase in distributions to noncontrolling interests was primarily attributable to the acquired assets,same period in 2022;
•our public offering of common shares, which were partially offset by the decreaseclosed on September 8, 2023, resulting in distributions resulting from the EEP strategic restructuring discussed under United States Sponsored Vehicle Strategy.
Cash provided from financing activities further increased as we completed the issuance of 33.5 million102,913,500 common shares at a price of $44.70 per share for gross proceeds of approximately $1.5$4.6 billion, along withwhich is intended to finance a portion of the issuanceaggregate cash consideration payable for the Acquisitions; and
•the absence in 2023 of 4 million preferred shares for gross proceedsthe redemption of $0.5 billion.Preference Shares, Series 17 and Series J in the first and second quarters of 2022, respectively.
For the year ended 2017, the
The factors above increases in cash were partially offset by $227 million paidby:
•higher net commercial paper and credit facility repayments in 2023 when compared to acquire allthe same period in 2022;
•net repayments of short-term borrowings in 2023 when compared to net issuances in 2022;
•the outstanding publicly-held common unitsabsence in 2023 of MEP during the second quarter of 2017, as well as higher cashproceeds received from the issuancesale of a non-operating interest in seven pipelines from our Regional Oil Sands System in October 2022;
•higher long-term debt repayments in 2023 when compared to the same period in 2022; and
•increased common share dividend payments primarily due to the increase in our common share dividend rate and an increase in the number of common shares outstanding.
2022
The increase in cash used in financing activities primarily resulted from the following factors:
•net commercial paper and credit facility repayments in 2022 when compared to draws in 2021;
•higher long-term debt repayments along with lower long-term debt issuances in 2022 when compared to 2021;
•the redemption of Preference Shares, Series 17 and Series J in the first and second quarters of 2022, respectively;
•the repurchase and cancellation of 2,737,965 common shares under our NCIB for approximately $151 million in 2022; and
•increased common share dividend payments primarily due to the increase in our common share dividend rate.
The factors above were partially offset by:
•proceeds received from the sale of a non-operating interest in seven pipelines from our Regional Oil Sands System in October 2022; and
•the absence in 2022 of the redemption of Westcoast's preferred shares in the first quarter of 2016, as a result of the issuance of 56 million common shares in March 2016.2021.
Finally, our common share dividend payments increased in the first half of 2017, primarily due to the increase in the common share dividend rate effective March 2017, as well as higher number of common shares outstanding as a result of the issuance of approximately 75 million common shares in 2016 and 691 million common shares issued in connection with the Merger Transaction. In addition, we paid $414 million in common share dividends to the shareholders of Spectra Energy. These dividends were declared before the closing of the Merger Transaction but were paid after the closing of the Merger Transaction.
2016
Our financing requirements decreased for the year ended December 31, 2016 compared with December 31, 2015, primarily reflecting lower expenditures on growth capital projects and the proceeds of asset sales. Our funding requirements are a reflection of the timing of various growth projects.
In 2016, our overall debt decreased by $149 million compared with an overall increase in debt of $3,663 million in 2015. The decrease was mainly due to lower debt requirements resulting from the timing of completion of various growth projects and other sources of funds, primarily the proceeds from our common share issuance in March 2016, which were partly utilized to reduce drawn credit facilities and outstanding commercial paper draws.
The increase in common share dividends paid in 2016 was attributable to the increase in the common share dividend rate effective March 2016 and a higher number of common shares outstanding primarily as a result of the common share issuance noted above.
Distributions to redeemable noncontrolling interests in the Fund Group increased during 2016 compared with the corresponding 2015 period mainly due to a higher per share distribution rate and a larger number of public shares outstanding in ENF. Higher distributions to noncontrolling interests in EEP reflected an increase to the per unit distribution in the first half of 2016 as well as the effects of a strengthening United States dollar versus the Canadian dollar.
Preference Share Issuances
Since July 2011, we have issued 310 million preference shares for gross proceeds of approximately $7.8 billion with the following characteristics.
|
| | | | | | | | | |
| | Gross Proceeds |
| Dividend Rate |
| Dividend1,9 |
| Per Share Base Redemption Value2 | Redemption and Conversion Option Date2,3 | Right to Convert Into3,4 |
| (Canadian dollars, unless otherwise stated) | |
| | | |
Series B5 | $500 million |
| 3.42 | % | $0.85360 | $25 | June 1, 2022 | Series C |
Series C5 | — |
| 3-month treasury bill plus 2.400% |
| — |
| $25 | June 1, 2022 | Series B |
Series D6 | $450 million |
| 4.00 | % | $1.00000 | $25 | March 1, 2018 | Series E |
| Series F | $500 million |
| 4.00 | % | $1.00000 | $25 | June 1, 2018 | Series G |
| Series H | $350 million |
| 4.00 | % | $1.00000 | $25 | September 1, 2018 | Series I |
Series J7 | US$200 million |
| 4.89 | % | US$1.22160 | US$25 | June 1, 2022 | Series K |
Series L7 | US$400 million |
| 4.96 | % | US$1.23972 | US$25 | September 1, 2022 | Series M |
| Series N | $450 million |
| 4.00 | % | $1.00000 | $25 | December 1, 2018 | Series O |
| Series P | $400 million |
| 4.00 | % | $1.00000 | $25 | March 1, 2019 | Series Q |
| Series R | $400 million |
| 4.00 | % | $1.00000 | $25 | June 1, 2019 | Series S |
| Series 1 | US$400 million |
| 4.00 | % | US$1.00000 | US$25 | June 1, 2018 | Series 2 |
| Series 3 | $600 million |
| 4.00 | % | $1.00000 | $25 | September 1, 2019 | Series 4 |
| Series 5 | US$200 million |
| 4.40 | % | US$1.10000 | US$25 | March 1, 2019 | Series 6 |
| Series 7 | $250 million |
| 4.40 | % | $1.10000 | $25 | March 1, 2019 | Series 8 |
| Series 9 | $275 million |
| 4.40 | % | $1.10000 | $25 | December 1, 2019 | Series 10 |
| Series 11 | $500 million |
| 4.40 | % | $1.10000 | $25 | March 1, 2020 | Series 12 |
| Series 13 | $350 million |
| 4.40 | % | $1.10000 | $25 | June 1, 2020 | Series 14 |
| Series 15 | $275 million |
| 4.40 | % | $1.10000 | $25 | September 1, 2020 | Series 16 |
| Series 17 | $750 million |
| 5.15 | % | $1.28750 | $25 | March 1, 2022 | Series 18 |
Series 198 | $500 million |
| 4.90 | % | $1.22500 | $25 | March 1, 2023 | Series 20 |
| |
1 | The holder is entitled to receive a fixed, cumulative, quarterly preferential dividend, as declared by the Board. With the exception of Series A and Series C Preference Shares, such fixed dividend rate resets every five years beginning on the initial redemption and conversion option date. The Series 17 and Series 19 Preference Shares contain a feature where the fixed dividend rate, when reset every five years, will not be less than 5.15% and 4.90%, respectively. No other series of Preference Shares has this feature. |
| |
2 | Preference Shares, Series A may be redeemed any time at our option. For all other series of Preference Shares, we may, at our option, redeem all or a portion of the outstanding Preference Shares for the Base Redemption Value per share plus all accrued and unpaid dividends on the Redemption Option Date and on every fifth anniversary thereafter. |
| |
3 | The holder will have the right, subject to certain conditions, to convert their shares into Cumulative Redeemable Preference Shares of a specified series on a one-for-one basis on the Conversion Option Date and every fifth anniversary thereafter at an ascribed issue price equal to the Base Redemption Value. |
| |
4 | With the exception of Series A Preference Shares, after the redemption and conversion option dates, holders may elect to receive quarterly floating rate cumulative dividends per share at a rate equal to: $25 x (number of days in quarter/365) x 90 day Government of Canada treasury bill rate + 2.4% (Series C), 2.4% (Series E), 2.5% (Series G), 2.1% (Series I), 2.7% (Series O), 2.5% (Series Q), 2.5% (Series S), 2.4% (Series 4), 2.6% (Series 8), 2.7% (Series 10), 2.6% (Series 12), 2.7% (Series 14), 2.7% (Series 16), 4.1% (Series 18) or 3.2% (Series 20); or US$25 x (number of days in quarter/365) x three-month United States Government treasury bill rate + 3.1% (Series K), 3.2% (Series M), 3.1% (Series 2) or 2.8% (Series 6).
|
| |
5 | On June 1, 2017, 1,730,188 of Series B fixed rate Preference Shares were converted to Series C floating rate Preference Shares based upon preference share holder elections under the terms of the Series B Preference Shares. The quarterly dividend amount for the Series B Preference Shares was decreased to $0.21340 from $0.25000 on June 1, 2017, due to the reset of the annual dividend rate on every fifth anniversary of the date of issuance of the Series B Preference Shares. The quarterly dividend amount for the Series C Preference Shares was set at $0.18600 on June 1, 2017, $0.19571 on September 1, 2017 and $0.20342 on December 1, 2017, due to reset on a quarterly basis following the issuance thereof. |
| |
6 | On January 30, 2018, we announced that we do not intend to exercise our right to redeem our Series D Preference Shares on March 1, 2018. As a result, until February 14, 2018, the holders of such shares had the right to convert all or part of their Series D fixed rate Preference Shares on a one-for-one basis into Series E floating rate Preference Shares. As of February 14, 2018, less than the 1,000,000 Series D Preference Shares required to give effect to conversions into Series E Preference Shares were tendered for conversion. As a result, none of our outstanding Series D Preference Shares will be converted into Series E Preference Shares on March 1, 2018. However, on March 1, 2018, the quarterly dividend amount for the Series D Preference Shares will be increased to $0.27875 from $0.25000, due to the reset of the annual dividend rate on every fifth anniversary of the date of issuance of the Series D Preference Shares. |
| |
7 | No Series J or Series L Preference Shares were converted on the June 1, 2017 and September 1, 2017 conversion option dates, respectively. However, the quarterly dividend amounts for the Series J and Series L Preference Shares were increased to US$0.30540 from US$0.25000 on June 1, 2017, and to US$0.30993 from US$0.25000 on September 1, 2017, respectively, due to the reset of the annual dividend rate on every fifth anniversary of the date of issuance of the Series J and Serles L Preference Shares. |
| |
8 | On December 11, 2017, 20 million Series 19 Preferred Shares, inclusive of 4 million Series 19 Preferred Shares issued on full exercise of the underwriters' option, were issued for gross proceeds of $500 million. |
| |
9 | For dividends declared, see Liquidity and Capital Resources – Sources and Uses of Cash – Dividend Reinvestment and Share Purchase Plan.
|
Common Share Issuances
On December 7, 2017, we completed the issuance of 33.5 million common shares for gross proceeds of approximately $1.5 billion. The proceeds were used to reduce short-term indebtedness pending reinvestment in secured capital projects.
On February 27, 2017, we completed the issuance of 691 million common shares with a value of $37.4 billion in exchange for shares of Spectra Energy in connection with the Merger Transaction. For further information, see Merger with Spectra Energy and Item 8. Financial Statements and Supplementary Data -Note 7. Acquisitions and Dispositions.
On March 1, 2016, we completed the issuance of 56.5 million common shares for gross proceeds of approximately $2.3 billion, inclusive of the shares issued on exercise of the full amount of the underwriters’ over-allotment option to purchase an additional 7.4 million common shares. The proceeds were used to reduce short-term indebtedness pending reinvestment in secured capital projects.
Dividend Reinvestment and Share Purchase Plan
Participants in our Dividend Reinvestment and Share Purchase Plan (DRIP) receive a 2% discount on the purchase of common shares with reinvested dividends. For the years ended December 31, 2017 and 2016, total dividends paid were $3,562 million and $1,945 million, respectively, of which $2,336 million and $1,150 million, respectively, were paid in cash and reflected in financing activities. The remaining $1,226 million and $795 million, respectively, of dividends paid were reinvested pursuant to the DRIP and resulted in the issuance of common shares rather than a cash payment. For the years ended December 31, 2017 and 2016, 34.4% and 40.9%, respectively, of total dividends paid were reinvested through the DRIP. In addition to amounts paid in cash and reflected in financing activities for the year ended December 31, 2017, were $414 million in dividends declared to Spectra Energy shareholders prior to the Merger Transaction that were paid after the Merger Transaction.
Our Board of Directors has declared the following quarterly dividends. All dividends are payable on March 1, 2018 to shareholders of record on February 15, 2018.
|
| | | |
Common Shares |
| $0.67100 |
|
Preference Shares, Series A |
| $0.34375 |
|
Preference Shares, Series B1
|
| $0.21340 |
|
Preference Shares, Series C2
|
| $0.20342 |
|
Preference Shares, Series D |
| $0.25000 |
|
Preference Shares, Series F |
| $0.25000 |
|
Preference Shares, Series H |
| $0.25000 |
|
Preference Shares, Series J3
|
| US$0.30540 |
|
Preference Shares, Series L4
|
| US$0.30993 |
|
Preference Shares, Series N |
| $0.25000 |
|
Preference Shares, Series P |
| $0.25000 |
|
Preference Shares, Series R |
| $0.25000 |
|
Preference Shares, Series 1 |
| US$0.25000 |
|
Preference Shares, Series 3 |
| $0.25000 |
|
Preference Shares, Series 5 |
| US$0.27500 |
|
Preference Shares, Series 7 |
| $0.27500 |
|
Preference Shares, Series 9 |
| $0.27500 |
|
Preference Shares, Series 11 |
| $0.27500 |
|
Preference Shares, Series 13 |
| $0.27500 |
|
Preference Shares, Series 15 |
| $0.27500 |
|
Preference Shares, Series 17 |
| $0.32188 |
|
Preference Shares, Series 19 |
| $0.26850 |
|
| |
1 | The quarterly dividend amount of Series B was decreased to $0.21340 from $0.25000 on June 1, 2017, due to the reset of the annual dividend on every fifth anniversary of the date of issuance of the Series B Preference Shares. |
| |
2
| The quarterly dividend amount of Series C was set at $0.18600 on June 1, 2017, $0.19571 on September 1, 2017 and $0.20342 on December 1, 2017, due to reset on a quarterly basis following the date of issuance of the Series C Preference Shares. |
| |
3
| The quarterly dividend amount of Series J was increased to US$0.30540 from US$0.25000 on June 1, 2017, due to the reset of the annual dividend on every fifth anniversary of the date of issuance of the Series J Preference Shares. |
4 The quarterly dividend amount of Series L was increased to US$0.30993 from US$0.25000 on September 1, 2017, due to the reset of the annual dividend on every fifth anniversary of the date of issuance of the Series L Preference Shares.
SPONSORED VEHICLES
We utilize Sponsored Vehicles to diversify our access to capital and enhance our costs of funds. When market conditions are supportive, we may also seek to raise capital and monetize the value of existing assets through drop-down transactions with our Sponsored Vehicles.
The Fund Group
|
| | | |
| | 2017 | 2016 | 2015 |
| Economic interest as at December 31, | 82.5% | 86.9% | 89.2% |
| Distributions received by us for the year ended December 31, | $1,539 million | $1,555 million | $601 million |
Common Unit Issuance
On December 7, 2017, ENF completed the issuance of 20,683,900 common shares, inclusive of 2,697,900 common shares issued on full exercise of the underwriters' over-allotment option, at a price of $27.80 for a gross proceeds of $575 million. The proceeds will be used to repay short-term indebtedness and fund growth projects associated with the Fund's Canadian liquids pipeline assets.
On April 18, 2017, ENF completed the Secondary Offering of 17,347,750 common shares to the public at a price of $33.15 per share, for gross proceeds of approximately $575 million. For further information, refer to Asset Monetization.
Restructuring
In September 2015, we completed the Canadian Restructuring Plan. For further details, refer to Canadian Restructuring Plan.
EEP
|
| | | |
| | 2017 | 2016 | 2015 |
| Economic interest as at December 31, | 34.6% | 35.3% | 35.7% |
Distributions received by us for the year ended December 31,1 | US$713 million | US$573 million | US$499 million |
| |
1 | Includes distributions for our ownership interest in EEP and distributions from direct ownership in its jointly funded projects. |
Strategic Review
In 2017, we continued the ongoing evaluation of our investment in EEP. For additional information, refer to United States Sponsored Vehicle Strategy.
Common Unit Issuance
In March 2015, EEP completed the issuance of eight million Class A common units for gross proceeds of approximately US$294 million before underwriting discounts and commissions and offering expenses. We did not participate in the issuance; however, we made a capital contribution of US$6 million to maintain our 2% general partner interest in EEP. EEP used the proceeds from the offering to fund a portion of its capital expansion projects and for general partnership purposes.
Alberta Clipper Drop Down
In January 2015, we completed the drop down of our 66.7% interest in the United States segment of the Alberta Clipper Pipeline to EEP. Aggregate consideration for the transaction was US$1 billion, consisting of approximately US$694 million of Class E equity units issued to us by EEP and the repayment of approximately US$306 million of indebtedness owed to us.
SEP
|
| | | | | |
| | 2017 | 2016 |
| 2015 |
|
| Economic interest as at December 31, | 83% | — |
| — |
|
| Distributions received by us for the year ended December 31, | US$738 million | — |
| — |
|
The Merger Transaction
As a result of the Merger Transaction, we acquired a 75% economic interest in SEP. For further information, refer to Merger with Spectra Energy.
Share Issuances
During the year ended December 31, 2017, SEP issued 3,991,977 million common units under its at-the-market program for total proceeds of US$171 million.
Restructuring of Incentive Distribution Rights
Refer to United States Sponsored Vehicle Strategy - Restructuring of SEP Incentive Distribution Rights.
OFF-BALANCE SHEET ARRANGEMENTS
We enter into guarantee arrangements in the normal course of business to facilitate commercial transactions with third parties. These arrangementsparties and can include financial guarantees, stand-by letters of credit, debt guarantees, surety bonds and indemnifications. See Please see Part II. Item 8. Financial Statements and supplementary dataSupplementary Data - Note 29.31 - Guaranteesfor further discussion of guarantee arrangements.
Most of the guarantee arrangements that we enter into enhance the credit standings of certain subsidiaries, non-consolidated entities or less than 100%-owned entities, enabling them to conduct business. As such, these guarantee arrangements involve elements of performance and credit risk which are not included on our Consolidated Statements of Financial Position. The possibility of us having to honor our contingencies is largely dependent upon the future operations of our subsidiaries, investees and other third parties, or the occurrence of certain future events. Issuance of these guarantee arrangements is not required for the majority of our operations.
We do not have material off-balance sheet financing entities or structures, except for normal operating lease arrangements, guarantee arrangements and financings entered into byfor our equity investments. For additional information on these commitments, see please refer to Part II. Item 8. Financial Statements and supplementary dataSupplementary Data -Note 28.30 - Commitments and Contingencies and Note 29. Guarantees.12 - Variable Interest Entities.
We do not have material off-balance sheet arrangements that have or are reasonably likely to have a current or future effect on our financial condition, changes in financial condition, revenues or expenses, results of operations, liquidity, capital expenditures or capital resources.
OUTSTANDING PREFERENCE SHARES
CONTRACTUAL OBLIGATIONS
Payments due under contractual obligations over the next five years and thereafterCharacteristics of our outstanding preference shares are as follows:
| | | | | | | | | | | | | | | | | |
| Dividend Rate | Dividend1 | Per Share Base Redemption Value2 | Redemption and Conversion Option Date2,3 | Right to Convert Into3,4 |
| (Canadian dollars unless otherwise stated) | | | | |
| Preference Shares, Series A | 5.50 | % | $1.37500 | $25 | — | | — | |
| Preference Shares, Series B | 5.20 | % | $1.30052 | $25 | June 1, 2027 | Series C |
Preference Shares, Series D5 | 5.41 | % | $1.35300 | $25 | March 1, 2028 | Series E |
Preference Shares, Series F6 | 5.54 | % | $1.38452 | $25 | June 1, 2028 | Series G |
Preference Shares, Series G7 | 6.96 | % | $1.90704 | $25 | June 1, 2028 | Series F |
Preference Shares, Series H8 | 6.11 | % | $1.52800 | $25 | September 1, 2028 | Series I |
Preference Shares, Series I9 | 7.19 | % | $1.81004 | $25 | September 1, 2028 | Series H |
| Preference Shares, Series L | 5.86 | % | US$1.46448 | US$25 | September 1, 2027 | Series M |
| Preference Shares, Series N | 6.70 | % | $1.67400 | $25 | December 1, 2028 | Series O |
| Preference Shares, Series P | 4.38 | % | $1.09476 | $25 | March 1, 2024 | Series Q |
| Preference Shares, Series R | 4.07 | % | $1.01825 | $25 | June 1, 2024 | Series S |
Preference Shares, Series 110 | 6.70 | % | US$1.67592 | US$25 | June 1, 2028 | Series 2 |
| Preference Shares, Series 3 | 3.74 | % | $0.93425 | $25 | September 1, 2024 | Series 4 |
| Preference Shares, Series 5 | 5.38 | % | US$1.34383 | US$25 | March 1, 2024 | Series 6 |
| Preference Shares, Series 7 | 4.45 | % | $1.11224 | $25 | March 1, 2024 | Series 8 |
| Preference Shares, Series 9 | 4.10 | % | $1.02424 | $25 | December 1, 2024 | Series 10 |
| Preference Shares, Series 11 | 3.94 | % | $0.98452 | $25 | March 1, 2025 | Series 12 |
| Preference Shares, Series 13 | 3.04 | % | $0.76076 | $25 | June 1, 2025 | Series 14 |
| Preference Shares, Series 15 | 2.98 | % | $0.74576 | $25 | September 1, 2025 | Series 16 |
Preference Shares, Series 1911 | 6.21 | % | $1.55300 | $25 | March 1, 2028 | Series 20 |
1The holder is entitled to receive a fixed cumulative quarterly preferential dividend, as declared by the Board of Directors. With the exception of Preference Shares, Series A, such fixed dividend rate resets every five years beginning on the initial Redemption and Conversion Option Date. Preference Shares, Series G and I contain a feature where the dividend rate resets on a quarterly basis. The Preference Shares, Series 19 contain a feature where the fixed dividend rate, when reset every five years, will not be less than 4.90%. No other series of preference shares has this feature.
2Preference Shares, Series A may be redeemed any time at our option. For all other series of preference shares, we may at our option, redeem all or a portion of the outstanding preference shares for the Per Share Base Redemption Value plus all accrued and unpaid dividends on the Redemption Option Date and on every fifth anniversary thereafter.
3The holder will have the right, subject to certain conditions, to convert their shares into Cumulative Redeemable Preference Shares of a specified series on a one-for-one basis on the Conversion Option Date and every fifth anniversary thereafter at an ascribed issue price equal to the Per Share Base Redemption Value.
4With the exception of Preference Shares, Series A, after the Redemption and Conversion Option Date, holders may elect to receive quarterly floating rate cumulative dividends per share at a rate equal to: $25 x (number of days in quarter/number of days in year) x three month Government of Canada treasury bill rate + 2.4% (Series C), 2.4% (Series E), 2.5% (Series G), 2.1% (Series I), 2.7% (Series O), 2.5% (Series Q), 2.5% (Series S), 2.4% (Series 4), 2.6% (Series 8), 2.7% (Series 10), 2.6% (Series 12), 2.7% (Series 14), 2.7% (Series 16), or 3.2% (Series 20); or US$25 x (number of days in quarter/number of days in year) x three month US Government treasury bill rate + 3.2% (Series M), 3.1% (Series 2), or 2.8% (Series 6).
5The quarterly dividend per share paid on Preference Shares, Series D was increased to $0.33825 from $0.27875 on March 1, 2023 due to reset of the annual dividend on March 1, 2023.
6The quarterly dividend per share paid on Preference Shares, Series F was increased to $0.34613 from $0.29306 on June 1, 2023 due to reset of the annual dividend on June 1, 2023.
7On June 1, 2023, 1,827,695 of the outstanding Preference Shares, Series F were converted into Preference Shares, Series G.
8The quarterly dividend per share paid on Preference Shares, Series H was increased to $0.38200 from $0.27350 on September 1, 2023 due to reset of the annual dividend on September 1, 2023.
9On September 1, 2023, 2,350,602 of the outstanding Preference Shares, Series H were converted into Preference Shares, Series I.
10 The quarterly dividend per share paid on Preference Shares, Series 1 was increased to US$0.41898 from US$0.37182 on June 1, 2023 due to reset of the annual dividend on June 1, 2023.
11 The quarterly dividend per share paid on Preference Shares, Series 19 was increased to $0.38825 from $0.30625 on March 1, 2023 due to reset of the annual dividend on March 1, 2023.
|
| | | | | | | | | | |
| As at December 31, 2017 | Total |
| Less than 1 year |
| 1-3 years |
| 3-5 years |
| After 5 years |
|
| (millions of Canadian dollars) | |
| |
| |
| |
| |
|
Annual debt maturities1,2 | 62,927 |
| 2,831 |
| 12,995 |
| 11,344 |
| 35,757 |
|
Interest obligations2,3 | 42,083 |
| 2,485 |
| 4,415 |
| 3,794 |
| 31,389 |
|
Operating leases4 | 1,151 |
| 106 |
| 198 |
| 184 |
| 663 |
|
| Capital leases | 35 |
| 9 |
| 10 |
| 4 |
| 12 |
|
Pension obligations5 | 162 |
| 162 |
| — |
| — |
| — |
|
Long-term contracts6 | 14,718 |
| 4,182 |
| 4,000 |
| 2,448 |
| 4,088 |
|
Other long-term liabilities7 | — |
| — |
| — |
| — |
| — |
|
| Total contractual obligations | 121,076 |
| 9,775 |
| 21,618 |
| 17,774 |
| 71,909 |
|
We have paid common share dividends in every year since we became a publicly traded company in 1953. In November 2023, we announced a 3.1% increase in our quarterly dividend to $0.9150 per common share, or $3.66 annualized, effective with the dividend payable on March 1, 2024, thereby declaring a dividend increase for 29 straight years.
For the years ended December 31, 2023 and 2022, total dividends paid were $7.3 billion and $7.0 billion, respectively, all of which were paid in cash and reflected in Cash Flows from Financing Activities in the Consolidated Statements of Cash Flows.
On November 28, 2023, our Board of Directors declared the following quarterly dividends. All dividends are payable on March 1, 2024 to shareholders of record on February 15, 2024.
| | | | | |
| Dividend per share |
Common Shares1 | Includes debentures, term notes, commercial paper and credit facility draws based on the facility's maturity date and excludes short-term borrowings, debt discount, debt issue costs and capital lease obligations. We have the ability under certain debt facilities to call and repay the obligations prior to scheduled maturities. Therefore, the actual timing of future cash repayments could be materially different than presented above.$0.91500 | |
| Preference Shares, Series A | $0.34375 | |
| Preference Shares, Series B | $0.32513 | |
| Preference Shares, Series D | $0.33825 | |
| Preference Shares, Series F | $0.34613 | |
Preference Shares, Series G2 | $0.47676 | |
| Preference Shares, Series H | $0.38200 | |
Preference Shares, Series I3 | $0.45251 | |
| Preference Shares, Series L | US$0.36612 | |
Preference Shares, Series N4 | $0.41850 | |
| Preference Shares, Series P | $0.27369 | |
| Preference Shares, Series R | $0.25456 | |
| Preference Shares, Series 1 | US$0.41898 | |
| Preference Shares, Series 3 | $0.23356 | |
| Preference Shares, Series 5 | US$0.33596 | |
| Preference Shares, Series 7 | $0.27806 | |
| Preference Shares, Series 9 | $0.25606 | |
| Preference Shares, Series 11 | $0.24613 | |
| Preference Shares, Series 13 | $0.19019 | |
| Preference Shares, Series 15 | $0.18644 | |
| Preference Shares, Series 19 | $0.38825 | |
1The quarterly dividend per common share was increased 3.1% to $0.9150 from $0.8875, effective March 1, 2024.
2The quarterly dividend per share paid on Preference Shares, Series G was increased to $0.47676 from $0.47245 on December 1, 2023 due to reset on a quarterly basis.
3The quarterly dividend per share paid on Preference Shares, Series I was increased to $0.45251 from $0.44814 on December 1, 2023 due to reset on a quarterly basis following the date of issuance.
4The quarterly dividend per share paid on Preference Shares, Series N was increased to $0.41850 from $0.31788 on December 1, 2023 due to reset of the annual dividend on December 1, 2023.
SUMMARIZED FINANCIAL INFORMATION
On January 22, 2019, Enbridge entered into supplemental indentures with its wholly-owned subsidiaries, Spectra Energy Partners, LP (SEP) and Enbridge Energy Partners, L.P. (EEP) (the Partnerships), pursuant to which Enbridge fully and unconditionally guaranteed, on a senior unsecured basis, the payment obligations of the Partnerships with respect to the outstanding series of notes issued under the respective indentures of the Partnerships. Concurrently, the Partnerships entered into a subsidiary guarantee agreement pursuant to which they fully and unconditionally guaranteed, on a senior unsecured basis, the outstanding series of senior notes of Enbridge. The Partnerships have also entered into supplemental indentures with Enbridge pursuant to which the Partnerships have issued full and unconditional guarantees, on a senior unsecured basis, of senior notes issued by Enbridge subsequent to January 22, 2019. As a result of the guarantees, holders of any of the outstanding guaranteed notes of the Partnerships (the Guaranteed Partnership Notes) are in the same position with respect to the net assets, income and cash flows of Enbridge as holders of Enbridge's outstanding guaranteed notes (the Guaranteed Enbridge Notes), and vice versa. Other than the Partnerships, Enbridge subsidiaries (including the subsidiaries of the Partnerships, collectively, the Subsidiary Non-Guarantors), are not parties to the subsidiary guarantee agreement and have not otherwise guaranteed any of Enbridge's outstanding series of senior notes.
Consenting SEP notes and EEP notes under Guarantee
| | | | | |
SEP Notes1 | EEP Notes2 |
24.750% Senior Notes due 2024 | Excludes the debt issuance of US$800 million senior notes that occurred subsequent to5.875% Notes due 2025 |
| 3.500% Senior Notes due 2025 | 5.950% Notes due 2033 |
| 3.375% Senior Notes due 2026 | 6.300% Notes due 2034 |
| 5.950% Senior Notes due 2043 | 7.500% Notes due 2038 |
| 4.500% Senior Notes due 2045 | 5.500% Notes due 2040 |
| 7.375% Notes due 2045 |
| |
1As at December 31, 2023, the aggregate outstanding principal amount of SEP notes was approximately US$3.2 billion.
2As at December 31, 2023, the aggregate outstanding principal amount of EEP notes was approximately US$2.4 billion.
Enbridge Notes under Guarantees
| | | | | |
USD Denominated1 | CAD Denominated2 |
| Floating Rate Senior Notes due 2024 | 3.950% Medium-term Notes due 2024 |
| 3.500% Senior Notes due 2024 | 2.440% Medium-term Notes due 2025 |
| 2.150% Senior Notes due 2024 | 3.200% Medium-term Notes due 2027 |
| 2.500% Senior Notes due 2025 | 5.700% Medium-term Notes due 2027 |
| 2.500% Senior Notes due 2025 | 6.100% Medium-term Notes due 2028 |
| 4.250% Senior Notes due 2026 | 4.900% Medium-term Notes due 2028 |
| 1.600% Senior Notes due 2026 | 2.990% Medium-term Notes due 2029 |
| 5.969% Senior Notes due 2026 | 7.220% Medium-term Notes due 2030 |
| 5.900% Senior Notes due 2026 | 7.200% Medium-term Notes due 2032 |
| 3.700% Senior Notes due 2027 | 6.100% Sustainability-Linked Medium-term Notes due 2032 |
| 6.000% Senior Notes due 2028 | 3.100% Sustainability-Linked Medium-term Notes due 2033 |
| 3.125% Senior Notes due 2029 | 5.360% Sustainability-Linked Medium-term Notes due 2033 |
| 6.200% Senior Notes due 2030 | 5.570% Medium-term Notes due 2035 |
| 2.500% Sustainability-Linked Senior Notes due 2033 | 5.750% Medium-term Notes due 2039 |
| 5.700% Sustainability-Linked Senior Notes due 2033 | 5.120% Medium-term Notes due 2040 |
| 4.500% Senior Notes due 2044 | 4.240% Medium-term Notes due 2042 |
| 5.500% Senior Notes due 2046 | 4.570% Medium-term Notes due 2044 |
| 4.000% Senior Notes due 2049 | 4.870% Medium-term Notes due 2044 |
| 3.400% Senior Notes due 2051 | 4.100% Medium-term Notes due 2051 |
| 6.700% Senior Notes due 2053 | 6.510% Medium-term Notes due 2052 |
| 5.760% Medium-term Notes due 2053 |
| 4.560% Medium-term Notes due 2064 |
| |
| |
| |
| |
1As at December 31, 2023, the aggregate outstanding principal amount of the Enbridge US dollar denominated notes was approximately US$15.7 billion.
2As at December 31, 2023, the aggregate outstanding principal amount of the Enbridge Canadian dollar denominated notes was approximately $11.0 billion.
Rule 3-10 of the US Securities and Exchange Commission's (SEC) Regulation S-X provides an exemption from the reporting requirements of the Securities Exchange Act of 1934, as amended (the Exchange Act) for fully consolidated subsidiary issuers of guaranteed securities and subsidiary guarantors and allows for summarized financial information in lieu of filing separate financial statements for each of the Partnerships.
The following Summarized Combined Statement of Earnings and the Summarized Combined Statements of Financial Position combines the balances of EEP, SEP and Enbridge.
Summarized Combined Statement of Earnings
| | | | | |
Year ended December 31, 2017. |
| 2023 |
3(millions of Canadian dollars) | | Includes debentures and term notes bearing interest at fixed, floating and fixed-to-floating rates.
| |
4Operating loss | Includes land leases. |
| (149) | |
5Earnings | Assumes only required payments will be made into the pension plans in 2018. Contributions are made in accordance with independent actuarial valuations as at December 31, 2017. Contributions, including discretionary payments, may vary pending future benefit design and asset performance. |
| 4,273 | |
6Earnings attributable to common shareholders | Included within long-term contracts, in the table, above are contracts that we have signed for the purchase of services, pipe and other materials totaling $2,609 million which are expected to be paid over the next five years. Also consists of the following purchase obligations: gas transportation and storage contracts (EGD), firm capacity payments and gas purchase commitments (Spectra Energy), transportation, service and product purchase obligations (MEP), and power commitments (EEP).3,921 | |
| |
7 | We are unable to estimate deferred income taxes (Item 8. Financial Statements and supplementary data - Note 24. Income Taxes) since cash payments for income taxes are determined primarily by taxable income for each discrete fiscal year. We are also unable to estimate asset retirement obligations (Item 8. Financial Statements and supplementary data - Note 18. Asset Retirement Obligations), environmental liabilities (Item 8. Financial Statements and supplementary data - Note 28. Commitments and Contingencies) and hedges payable (Item 8. Financial Statements and supplementary data - Note 23. Risk Management and Financial Instruments) due to the uncertainty as to the amount and, or, timing of when cash payments will be required. |
Summarized Combined Statements of Financial Position
| | | | | | | | |
| December 31, | 2023 | 2022 |
| (millions of Canadian dollars) | | |
| Cash and cash equivalents | 6,525 | | 425 |
| Accounts receivable from affiliates | 3,440 | | 2,486 |
| Short-term loans receivable from affiliates | 3,291 | | 5,232 |
| Other current assets | 491 | | 969 |
| Long-term loans receivable from affiliates | 45,702 | | 43,873 |
| Other long-term assets | 3,303 | | 4,111 |
| Accounts payable to affiliates | 2,264 | | 1,375 |
| Short-term loans payable to affiliates | 807 | | 1,745 |
| Trade payable and accrued liabilities | 743 | | 716 |
| Other current liabilities | 7,256 | | 8,036 |
| Long-term loans payable to affiliates | 35,556 | | 37,626 |
| Other long-term liabilities | 52,096 | | 47,447 |
The Guaranteed Enbridge Notes and the Guaranteed Partnership Notes are structurally subordinated to the indebtedness of the Subsidiary Non-Guarantors in respect of the assets of those Subsidiary Non-Guarantors.
Under US bankruptcy law and comparable provisions of state fraudulent transfer laws, a guarantee can be voided, or claims may be subordinated to all other debts of that guarantor if, among other things, the guarantor, at the time the indebtedness evidenced by its guarantee or, in some states, when payments become due under the guarantee:
•received less than reasonably equivalent value or fair consideration for the incurrence of the guarantee and was insolvent or rendered insolvent by reason of such incurrence;
•was engaged in a business or transaction for which the guarantor’s remaining assets constituted unreasonably small capital; or
•intended to incur, or believed that it would incur, debts beyond its ability to pay those debts as they mature.
The guarantees of the Guaranteed Enbridge Notes contain provisions to limit the maximum amount of liability that the Partnerships could incur without causing the incurrence of obligations under the guarantee to be a fraudulent conveyance or fraudulent transfer under US federal or state law.
Each of the Partnerships is entitled to a right of contribution from the other Partnership for 50% of all payments, damages and expenses incurred by that Partnership in discharging its obligations under the guarantees for the Guaranteed Enbridge Notes.
Under the terms of the guarantee agreement and applicable supplemental indentures, the guarantees of either of the Partnerships of any Guaranteed Enbridge Notes will be unconditionally released and discharged automatically upon the occurrence of any of the following events:
•any direct or indirect sale, exchange or transfer, whether by way of merger, sale or transfer of equity interests or otherwise, to any person that is not an affiliate of Enbridge, of any of Enbridge’s direct or indirect limited partnership of other equity interests in that Partnership as a result of which the Partnership ceases to be a consolidated subsidiary of Enbridge;
•the merger of that Partnership into Enbridge or the other Partnership or the liquidation and dissolution of that Partnership;
•the repayment in full or discharge or defeasance of those Guaranteed Enbridge Notes, as contemplated by the applicable indenture or guarantee agreement;
•with respect to EEP, the repayment in full or discharge or defeasance of each of the consenting EEP notes listed above;
•with respect to SEP, the repayment in full or discharge or defeasance of each of the consenting SEP notes listed above; or
•with respect to any series of Guaranteed Enbridge Notes, with the consent of holders of at least a majority of the outstanding principal amount of that series of Guaranteed Enbridge Notes.
The guarantee obligations of Enbridge will terminate with respect to any series of Guaranteed Partnership Notes if that series is discharged or defeased.
The Partnerships also guarantee the obligations of Enbridge under its existing credit facilities.
LEGAL AND OTHER UPDATES
LIQUIDS PIPELINES
Renewal of Line 5 Easement (Bad River Band)
On January 4, 2017, the Tribal Council ofJuly 23, 2019, the Bad River Band of the Lake Superior Tribe of Chippewa Indians (the Band) issuedfiled a press release indicating thatcomplaint in the Band had passed a resolution not to renew its interest in certainUS District Court for the Western District of Wisconsin (the Court) over our Line 5 easements throughpipeline and right-of-way across the Bad River Reservation.Reservation (the Reservation). Only a small portion of the total easements across 12 miles of the Reservation are at issue. The Band alleges that our continued use of Line 5 to transport crude oil and related liquids across the Reservation is included within our mainline system.a public nuisance under federal and state law and that the pipeline is in trespass on certain tracts of land in which the Band possesses ownership interests. The Band’s resolution calls for decommissioningcomplaint seeks an Order prohibiting us from using Line 5 to transport crude oil and related liquids across the Reservation and requiring removal of the pipeline from all Bad River tribal landsthe Reservation. Subsequently amended versions of the complaint also seek recovery of profits-based damages based on an unjust enrichment theory. Enbridge has responded to each claim in the initial and watershedamended complaints with an answer, defenses and counterclaims.
On August 29, 2022, the Government of Canada released a statement formally invoking the dispute settlement provisions of the 1977 Transit Pipelines Treaty in respect of this litigation; reiterating its concerns about the uninterrupted transmission of hydrocarbons through Line 5. On September 7, 2022, the Court issued a decision on cross-motions for summary judgment. The Court determined that the Band's nuisance claim raised factual issues that could impact our ability to operate the pipelinenot be resolved on summary judgment. The Court further determined that Enbridge is in trespass on 12 parcels on the Reservation. SinceReservation and that the Band passedis entitled to some measure of profits-based damages and to an injunction, with the resolution,level of damages and scope of the injunction to be determined at trial, which occurred October 24 through November 1, 2022.
On May 9, 2023, the Band filed an Emergency Motion for Injunctive Relief asking the Court to require Enbridge to purge and shutdown Line 5 on the Reservation due to significant erosion at the Meander. Enbridge responded and a hearing was held on May 18, 2023 in front of Judge Conley who indicated that he did not find the Band had proven imminence but his final ruling on all issues would be provided soon.
On June 26, 2023, the Court issued its Final Order ruling that (1) Enbridge shall adopt and implement its 2022 Monitoring and Shutdown Plan with the Court's modifications by July 5, 2023; (2) Enbridge owes the Band $5,151,668 for past trespass on the 12 allotted parcels; (3) Enbridge must continue to pay money on a quarterly basis using the formula set in its Order as long as Line 5 operates in trespass on the 12 allotted parcels (approximately $400,000 per year); (4) Enbridge must cease operation of Line 5 on any parcel within the Band's tribal territory without a valid right of way by June 16, 2026 and thereafter arrange prompt, reasonable remediation at those sites; and (5) The Court declined to allow for the Relocation to be completed prior to having to cease operations. The Final Judgment was entered on June 29, 2023. Enbridge filed its Notice of Appeal on June 30, 2023 and the Band filed its Notice of Cross Appeal on July 27, 2023. On December 12, 2023, the 7th Circuit requested the US to file a brief in this appeal as amicus curiae to address the effect of the Agreement Between the US and Canada Concerning Transit Pipelines, 28 U.S.T. 7449 (1977), and any other issues that the US believes to be material. Briefing by the parties have agreed to ongoing discussions withwas complete on December 15, 2023. Oral argument is scheduled in February 2024, and we anticipate a decision in 2024.
Michigan Line 5 Dual Pipelines - Straits of Mackinac Easement
In 2019, the objective of understanding and resolving the Band’s concerns onMichigan Attorney General (AG) filed a long-term basis.
Eddystone Rail Legal Matter
In February 2017, Eddystone Rail filed an action against several defendantscomplaint in the United StatesMichigan Ingham County Circuit Court (the Circuit Court) that requests the Circuit Court to declare the easement granted in 1953 that we have for the operation of Line 5 in the Straits of Mackinac (the Straits) to be invalid and to prohibit continued operation of Line 5 in the Straits. On December 15, 2021, Enbridge removed the case to the US District Court forin the EasternWestern District of Pennsylvania. Eddystone Rail allegesMichigan (US District Court), where it was assigned to Judge Janet T. Neff. The removal of the AG's case to federal court followed a November 16, 2021 ruling which held that the defendants transferred valuable assets from Eddystone Rail’s counterpartysimilar (and now dismissed) 2020 lawsuit brought by the Governor of Michigan to force Line 5's shutdown raised important federal issues that should be heard in federal court. On December 21, 2021, the AG made a maritime contract, so asrequest to avoid outstanding obligationsfile a motion to Eddystone Rail. Eddystone Rail is seeking payment of compensatory and punitive damages in excess of US$140 million. Eddystone Rail’s chances of success in connection withremand the above noted action cannot be predicted and it is possible that Eddystone Rail may not recover any of2019 case, which the amounts sought.US District Court allowed on January 5, 2022. However, after full briefing, on August 18, 2022, Judge Neff denied the AG's motion to remand. On July 19, 2017,August 30, 2022, the defendants’ motions to dismiss Eddystone Rail’s claims were denied. Defendants have filed Answers and Counterclaims, which together with subsequent amendments, seek damages from Eddystone Rail in excess of US$32 million. EddystoneAG filed a motion to dismisscertify the counterclaimsAugust 18 Order to pursue an appeal on the jurisdictional issue, which Enbridge opposed. On February 21, 2023, that motion was granted and defendants amended their Answershortly after, on March 2, 2023, the AG filed her Petition for Permission to Appeal in the 6th Circuit Court of Appeals (6th Circuit).
On July 21, 2023, the 6th Circuit granted the AG's Petition for Permission to appeal the US District Court's August 18 Order denying remand to state court. The 6th Circuit's briefing was completed by the end of 2023 and Counterclaims on September 21, 2017. Onoral argument has been scheduled for March 2024. We anticipate a decision in 2024.
October 12, 2017 Eddystone Rail moved to dismiss the latest version of defendants’ counterclaims. The defendants’ chances of success on their counterclaims cannot be predicted at this time.
Dakota Access Pipeline
As noted previously under United States Sponsored Vehicle Strategy - FinalizationWe own an effective interest of Bakken Pipeline System Joint Funding Agreement, our investment27.6% in the Bakken Pipeline System, which is inclusive of the Dakota Access Pipeline. In February 2017, thePipeline (DAPL). The Standing Rock Sioux Tribe and the Cheyenne River Sioux Tribe (the Tribes) filed motionslawsuits in 2016 with the United States DistrictUS Court for the District of Columbia (the District Court) contesting the validitylawfulness of the process used by the United States Army Corps easement for DAPL, including the adequacy of Engineers (Army Corps) to permit the Dakota Access Pipeline.Army Corps' environmental review and tribal consultation process. The plaintiffs requested the Court order the operator to shut down the pipeline until the appropriate regulatory process is completed.Oglala Sioux and Yankton Sioux Tribes also filed lawsuits alleging similar claims in 2018.
On June 14, 2017, the District Court ruled thatfound the Army Corps did not sufficiently weigh the degreeCorps' environmental review to which the project's effects would be highly controversial,deficient and the Army Corps failed to adequately consider the impact of an oil spill on the hunting and fishing rights of the Tribes and on environmental justice. The Court ordered the Army Corps to reconsider those components of itsconduct further study concerning spill risks from DAPL.
On March 25, 2020, in response to amended complaints from the Tribes, the District Court found that the Army Corps' subsequent environmental analysis.review completed in August 2018 was also deficient and ordered the Army Corps to prepare an Environmental Impact Statement (EIS) to address unresolved controversy pertaining to potential spill impacts resulting from DAPL. On October 11, 2017,July 6, 2020, the District Court issued an order vacating the Army Corps' easement for DAPL and ordering that allows the Dakota Access Pipelinepipeline be shut down by August 5, 2020. On that day, the US Court of Appeals for the District of Columbia Circuit stayed the District Court's July 6 order to continue operating whileshut down and empty the pipeline.
On January 26, 2021, the US Court of Appeals affirmed the District Court's decision, holding that the Army Corps completes the additional environmental reviewis required by the Court's June 14, 2017 orderto prepare an EIS and the Court ordered the Dakota Access Pipeline to implement certain interim measures pendingthat the Army Corps' supplemental analysis.easement for DAPL is vacated. The US Supreme Court subsequently denied the request of Dakota Access, LLC to review the decision that an EIS is required. The US Court of Appeals also determined that, absent an injunction proceeding, the District Court could not order DAPL's operations to cease. While not an issue before, the US Court of Appeals also recognized that the Army Corps could consider whether to allow DAPL to continue to operate in the absence of an easement.
Lakehead System Lines 6A and Line 6B Crude Oil ReleaseThe Army Corps earlier indicated that it did not intend to exercise its authority to bar DAPL's continued operation, notwithstanding the absence of an easement.
On July 26, 2010, a releaseSeptember 8, 2023, the Army Corps issued its draft EIS, which assesses the impacts of crude oil on Line 6B of EEP’s Lakehead System was reported near Marshall, Michigan. Further, on September 9, 2010, a release of crude oil from Line 6A of EEP’s Lakehead System was reportedDAPL under five alternative scenarios: denying the easement removing the pipeline; denying the easement and leaving the pipeline in an industrial area of Romeoville, Illinois.
As at December 31, 2017, EEP’s cumulative cost estimateplace; granting the easement with the prior conditions (which allow for the Line 6B crude oil release remains at US$1.2 billion ($195 million after-tax attributable to us) including those costs that were considered probableongoing operation, maintenance and that could be reasonably estimated at December 31, 2017. As at December 31, 2017, EEP's remaining estimated liability is approximately US$62 million.
Insurance Recoveries
EEP is included in the comprehensive insurance program that is maintained by us for our subsidiaries and affiliates. As at December 31, 2017, EEP has recorded total insurance recoveries of US$547 million ($80 million after-tax attributable to us) for the Line 6B crude oil release outultimate removal of the US$650 million applicable limit. Ofpipeline and its related facilities); granting the remaining US$103 million coverage limit, US$85 million waseasement with some new safety conditions; and rerouting the subject matterpipeline. The Army Corps did not identify a preferred alternative. The public comment period that commenced on the issuance of a lawsuit against one particular insurer. In March 2015, we reached an agreement with that insurer to submit the US$85 million claim to binding arbitration. On May 2, 2017,draft EIS closed on December 13, 2023. The pipeline will remain operational while the arbitration panel issued a decision that was not favorable to us. As a result, EEP will not receive any additional insurance recoveries in connection with the Line 6B crude oil release.environmental review process continues.
Legal and Regulatory Proceedings
A number of United States governmental agencies and regulators initiated investigations into the Line 6B crude oil release. As at December 31, 2017, there are no claims pending against us, EEP or their affiliates in United States state courts in connection with the Line 6B crude oil release.
We have accrued a provision for future legal costs and probable losses associated with the Line 6B crude oil release as described above.
Line 6B Fines and Penalties
As at December 31, 2017, EEP’s total estimated costs related to the Line 6B crude oil release include US$69 million in previously paid fines and penalties, which includes fines and penalties paid to the DOJ as discussed below.
Consent Decree
On May 23, 2017, the United States District Court for the Western District of Michigan, Southern Division, approved EEP’s signed settlement agreement with the United States Environmental Protection Agency and the DOJ regarding the Lines 6A and 6B crude oil releases (the Consent Decree). On June 15, 2017, we made a total payment of US$68 million as required by the Consent Decree, which reflects US$61 million for the civil penalty for the Line 6B release, US$1 million for the Line 6A release, and US$6 million for past removal costs and interest.
Seaway Pipeline Regulatory Matters
Seaway Crude Pipeline System (Seaway Pipeline) filed an application for market-based rates in December 2011 and refiled in December 2014. Several parties filed comments in opposition alleging that the application should be denied because Seaway Pipeline has market power in both its receipt and destination markets. On December 1, 2016, the Administrative Law Judge issued its decision which concluded that the Commission should grant the application of Seaway Pipeline for authority to charge market-based rates. The parties filed briefs during the first quarter of 2017 to defend the Administrative Law Judge's decision and to respond to criticisms of that decision. The Commissioners will now review the entire record and issue a decision. There is no timeline for the FERC to act and issue a decision.
GAS TRANSMISSION AND MIDSTREAM
Aux Sable Environmental Protection Agency Matter
On October 14, 2016, an amendedThe previously reported claim was filed against Aux Sable by a counterparty to aan NGL supply agreement. On January 5, 2017, Aux Sable filed a Statementagreement was settled and discontinued during the fourth quarter of Defence with respect to2023. A provision was recognized for this claim. While the final outcome of this action cannot be predicted with certainty, at this time management believes that the ultimate resolution of this action will not have a material impact on our consolidated financial position or results of operations.
Sabal Trail FERC Certificate Review
Sierra Club and two other non-governmental organizations filed a Petition for Review of Sabal Trail’s FERC certificate on September 20, 2016claim in the D.C. Circuit Courtthird quarter of Appeals. On August 22, 2017, the D.C. Circuit issued an opinion denying one of the petitions, and granting the other petition in part, vacating the certificates, and remanding the case to FERC to supplement the environmental impact statement for the project to estimate the quantity of green-house gases to be released into the environment by the gas-fired generation plants in Florida that will consume the gas transported by Sabal Trail. The court withheld issuance of the mandate requiring vacatur of the certificate until seven days after the disposition of any timely petition for rehearing. On October 6, 2017, Sabal Trail and FERC each filed timely petitions for rehearing. On January 31, 2018, the court denied FERC’s and Sabal Trail’s petitions for rehearing. Absent a stay, the court’s mandate could have issued on February 7, 2018. However, on February 2, 2018, Sabal Trail filed with FERC a request for expedited issuance of its order on remand or, alternatively, temporary emergency certificates to permit continued operation of the pipeline absent a stay of the court’s mandate. On February 5, 2018, FERC issued its final supplemental environmental impact statement in compliance with the D.C. Circuit decision. In addition, on February 6, 2018, FERC filed a motion with the court requesting a 45-day stay of the mandate, and stated in its motion that it intends to issue the order on remand within 45 days. Sabal Trail filed a motion with the court requesting a 90-day stay of the mandate. The February 6, 2018 motions automatically stay the issuance of the court’s mandate until the later of seven days after the court denies the motions or the expiration of any stay granted by the court. Both motions are pending.2023.
TAX MATTERS
We and our subsidiaries maintain tax liabilities related to uncertain tax positions. While fully supportable in our view, these tax positions, if challenged by tax authorities, may not be fully sustained on review.
OTHER LITIGATION
We and our subsidiaries are subject to various other legal and regulatory actions and proceedings which arise in the normal course of business, including interventions in regulatory proceedings and challenges
to regulatory approvals and permits by special interest groups.permits. While the final outcome of such actions and proceedings cannot be predicted with certainty, management believes that the resolution of such actions and proceedings will not have a material impact on our consolidated financial position or results of operations.
We and our subsidiaries maintain tax liabilities related to uncertain tax positions. While fully supportable in our view, these tax positions, if challenged by tax authorities, may not be fully sustained on review.
CRITICAL ACCOUNTING POLICIES AND ESTIMATES
Our consolidated financial statements are prepared in accordance with accounting principles generally accepted in the United States,US GAAP, which requirerequires management to make estimates, judgments and assumptions that affect the amounts reported in our consolidated financial statements and accompanying notes. In making judgments and estimates, management relies on external information and observable conditions, where possible, supplemented by internal analysis as required. We believe our most critical accounting policies and estimates discussed below have an impact across the various segments of our business.
Business Combinations
BUSINESS COMBINATIONS
We apply the provisions of Accounting Standards Codification 805 Business Combinations in accounting for our acquisitions. The acquired long-lived assets and intangible assets and assumed liabilities are recorded at their estimated fair values at the date of acquisition. Goodwill represents the excess of the purchase price over the fair value of net identifiable assets. While we use our best estimates and assumptions to accurately value assets acquired and liabilities assumed at the date of acquisition, as well as any contingent consideration, our estimates are inherently uncertain and subject to refinement. During the measurement period, which may be up to one year from the acquisition date, we record adjustments to the assets acquired and liabilities assumed with thea corresponding offset to goodwill. Upon the conclusion of the measurement period, or the final determination of values offor assets acquired or liabilities assumed, whichever comes first, any subsequent adjustments are recorded to our consolidated statementsConsolidated Statements of operations.Earnings.
Accounting for business combinations requires significant judgment, estimates and assumptions at the acquisition date. In developing estimates of fair values at the acquisition date, we utilize a variety of factors including market data, historical and future expected cash flows, growth rates and discount rates. The subjective nature of our assumptions increases the risk associated with estimates surrounding the projected performance of the acquired entity.
On February 27, 2017, we acquired Spectra Energy for a
GOODWILL IMPAIRMENT
Goodwill represents the excess of the purchase price over the fair value of $37.5 billion. In determining the valuationnet identifiable assets upon acquisition of tangible assets acquired, we applied the cost, market and income approaches. For intangible assets acquired, we used an income approacha business. The carrying value of goodwill, which included cash flow projections based on historical performance, terms found in contracts and assumptions on expected renewals. Discount rates used in the valuation were also developed using a weighted-average cost of capital based on risks specific to respective assets and returns that an investor would likely require given the expected cash flows, timing and risk.
Goodwill Impairment
We assess our goodwillis not amortized, is assessed for impairment at least annually unlessor more frequently if events or changes in circumstances indicatearise that it is more likely than not thatsuggest the faircarrying value of agoodwill may be impaired. We perform our annual review of the goodwill balance on April 1.
We perform our annual review for impairment at the reporting unit level, which is below its carrying value. Foridentified by assessing whether the purposescomponents of impairment testing,our operating segments constitute businesses for which discrete information is available, whether segment management regularly reviews the operating results of those components, and whether the economic and regulatory characteristics are similar. Our reporting units are identified as business operations within an operating segment. Liquids Pipelines, Gas Transmission, Gas Distribution and Storage, and Renewable Power Generation. The Renewable Power Generation reporting unit had goodwill beginning in the third quarter of 2022.
We have the option to first assess qualitative factors to determine whether it is necessary to perform the quantitative goodwill impairment test. Ifassessment. When performing a qualitative assessment, we determine the drivers of fair value for each reporting unit and evaluate whether those drivers have been positively or negatively affected by relevant events and circumstances since the last fair value assessment. Our evaluation includes, but is not limited to, the assessment of macroeconomic trends, changes to regulatory environments, capital accessibility, operating income trends, and changes to industry conditions. Based on our assessment of qualitative factors, if we determine it is more likely than not that the fair value of the reporting unit is less than its carrying amount, a quantitative goodwill impairment testassessment is performed, we determineperformed.
The quantitative goodwill impairment assessment involves determining the fair value of our reporting units inclusive of goodwill and comparecomparing those values to the carrying value of each reporting unit. If the carrying value of a reporting unit, including allocated goodwill, exceeds its fair value, goodwill impairment is measured at the amount by which the reporting unit’sunit's carrying value exceeds its fair value.
We also apply significant judgement when identifying This amount should not exceed the composition of disposal groups and determining which disposal groups meet the definition of a business. If the composition of disposal groups were to change as a result of a change in our marketing plans or a new agreement with a buyer, this could create a difference in thecarrying amount of goodwill allocated to assets held for sale. During 2017, we impaired $102 million of goodwill allocated to assets held for sale.
For the year ended December 31, 2017, we elected to perform a qualitative assessment to test the goodwill acquired from the acquisition of Spectra Energy for impairment. We assessed macroeconomic conditions, industry and market considerations, cost factors and overall financial performance to determine whether it is more likely than not that thegoodwill. The fair value of each of our reporting units is less than its carrying amount. Other thanestimated using a discounted cash flow technique. The determination of fair value using the discounted cash flow technique requires the use of estimates and assumptions related to discount rates, projected operating income, expected future capital expenditures and working capital levels, as discussed above,well as terminal value growth rates for the Liquids Pipelines, Gas Transmission, and Renewable Power Generation reporting units, and projected regulatory rate base and rate base multiple for the Gas Distribution and Storage reporting unit.
The allocation of goodwill to held-for-sale and disposed businesses is based on the relative fair value of businesses included in the relevant reporting unit.
On April 1, 2023, we performed our annual goodwill impairment analysisassessment which consisted of a qualitative assessment for the Liquids Pipelines, Gas Transmission, Gas Distribution and Storage, and Renewable Power Generation reporting units and did not identify impairment indicators. Due to an impairment recorded in 2022 for the Gas Transmission reporting unit and the OEB decision on Phase 1 for Enbridge Gas, we performed a quantitative assessment for the Gas Transmission and Gas Distribution and Storage reporting units as at December 31, 2017,1, 2023, which did not result in the recognition of an impairment charge.charge for either reporting unit. Also, we did not identify any indicators of goodwill impairment during the remainder of 2023.
Effective
The Gas Transmission reporting unit remains at risk as the quantitative test performed resulted in the quarter ended December 31, 2017, we have elected to movefair value exceeding carrying value by less than 10% and once the annual reviewAlliance Pipeline and Aux Sable disposition closes in 2024, the fair value of the goodwill balance from October 1 to April 1 to better align with the preparation and review of our business plan, which is used in the test. The change does not delay, accelerate or avoid an impairment charge.reporting unit will decrease.
Asset Impairment
ASSET IMPAIRMENT
We evaluate the recoverability of our property, plant and equipment when events or circumstances, such as economic obsolescence, business climate, legal or regulatory changes, or other factors, indicate that we may not recover the carrying amount of our assets. We continuallyregularly monitor our businesses, the market and business environments to identify indicators that could suggest an asset may not be recoverable. If it is determined that the carrying value of an asset exceeds theits expected undiscounted cash flows, expected from the asset, we will assess the fair value of the asset. An impairment loss is recognized when the carrying amount of the asset exceeds its fair value.
With respect to equity method investments, we assess at each balance sheet date whether there is objective evidence that the investment is impaired by completing a qualitative or quantitative analysis of factors impacting the investment. If there is objective evidence of impairment, we determine whether the decline below carrying value asis other-than-temporary. If the decline is determined by quoted market pricesto be other-than-temporary, an impairment charge is recorded in active markets orearnings with an offsetting reduction to the carrying value of the investment.
Asset fair value is determined using present value techniques. The determination of the fair value using present value techniques requires the use of projections and assumptions regarding future cash flows and weighted average cost of capital. Any changes to these projections and assumptions could result in revisions to the evaluation of the recoverability of the property, plant and equipmentasset and the recognition of an impairment loss in the Consolidated Statements of Earnings.
Assets held for sale
ASSETS HELD FOR SALE
We classify assets as held for sale when management commits to a formal plan to actively market an asset or a group of assets and when management believes it is probable the sale of the assets will occur within one year. We measure assets classified as held for sale at the lower of their carrying value and their estimated fair value less costs to sell.
We are in the process of selling certain midstream assets within our gas transmission and midstream segment. Given the state of the divestiture plan for these assets, as at December 31, 2017, we classified them as held for sale and measured them at the lower of their carrying value and fair value less costs to sell, which resulted in a loss of $4.4 billion ($2.8 billion after-tax). We determined the fair value of these assets held for sale using present value techniques which required us to make projections and assumptions regarding future cash flows, discount rates, inflation rates and growth rates, which were impacted by prolonged decline in commodity prices and deteriorating business performance. These
projections and assumptions are subject to uncertainty and could be negatively impacted by changes in market conditions, asset performance, legal environment, and other factors.
Regulatory AccountingREGULATORY ACCOUNTING
Certain parts of our businesses are subject to regulation by various authorities including, but not limited to, the NEB,CER, the FERC, the Alberta Energy Regulator, the New BrunswickBC Energy Regulator, the OEB and Utilities Board, Lathe Québec Régie de l’Energie du Québec and the Ontario Energy Board (OEB).l'énergie. Regulatory bodies exercise statutory authority over matters such as construction, rates and ratemaking, and agreements with customers. To recognize the economic effects of the actions of the regulator, the timing of recognition of certain revenues and expenses in these operations may differ from that otherwise expected under U.S.US GAAP for non-rate-regulated entities.
Key determinants in the ratemaking process are:
Costs
•costs of providing service, including operating costs, capital invested, depreciation expense;expense and taxes;
Allowed•allowed rate of return, including the equity component of the capital structure and related income taxes;
•interest costs on the debt component of the capital structure; and
Contract•contract and volume throughput assumptions.
The allowed rate of return is determined in accordance with the applicable regulatory model and may impact our profitability. The rates for a number of our projects are based on a cost-of-service recovery model that follows the regulators’regulators' authoritative guidance. Under the cost-of-service tolling methodology, we calculate tolls based on forecast volumes and cost. A difference between forecast and actual results causes an overover- or under recoveryunder-recovery in any given year. Regulatory assets represent amounts that are expected to be recovered from customers in future periods through rates. Regulatory liabilities represent amounts that are expected to be refunded to customers in future periods through rates, amounts collected from customers in advance of costs being incurred, or expected to be paid to cover future abandonment costs in relation to the NEB’sCER's Land Matters Consultation Initiative (LMCI). and for future removal and site restoration costs as approved by the regulator. If there are changes in our assessment of the probability of recovery for a regulatory asset, we reduce its carrying amount to the balance that we expect to recover from customers in future periods through rates. If a regulator later excludes from allowable costs all or a part of costs that were capitalized as a regulatory asset, we reduce the carrying amount of the asset by the excluded amounts.
The recognition of regulatory assets and liabilities is based on the actions, or expected future actions, of the regulator. To the extent that the regulator’sregulator's actions differ from our expectations, the timing and amount of recovery or settlement of regulatory balances could differ significantly from those recorded. In the absence of rate regulation, we would generally not recognize regulatory assets or liabilities and the earnings impact would be recorded in the period the expenses are incurred or revenues are earned. A regulatory asset or liability is recognized in respect of deferred income taxes when it is expected the amounts will be recovered or settled through future regulator-approved rates. During the fourth quarter of 2023, Southern Lights Pipeline completed an open season to negotiate new transportation service agreements effective 2025. We do not expect to renew the agreements under a cost-of-service toll methodology, therefore Southern Lights Pipeline is no longer subject to rate-regulated accounting. As a result, the related regulatory liabilities, regulatory tax assets and associated regulatory deferred tax liabilities were derecognized.
As at December 31, 20172023 and 2016,2022, our regulatory assets totaled $3,477 million$5.7 billion and $1,865 million,$6.5 billion, respectively, and significant regulatory liabilities totaled $2,366 million and $844 million, respectively.$3.8 billion.
Depreciation
DEPRECIATION
Depreciation of property, plant and equipment, our largest asset with a net book value at December 31, 20172023 and 2016,2022, of $90,711 million$104.6 billion and $64,284 million,$104.5 billion, respectively, is charged in accordance with two primary methods. For distinct assets, depreciation is generally provided on a straight-line basis over the estimated useful lives of the assets commencing when the asset is placed in service. For largely homogeneous groups of assets with comparable useful lives, the pool method of accounting is followed whereby similar assets are grouped and depreciated as a pool. When group assets are retired or otherwise disposed of, gains and losses are not reflected in earnings but are booked as an adjustment to accumulated depreciation.
When it is determined that the estimated service life of an asset no longer reflects the expected remaining period of benefit, prospective changes are made to the estimated service life. Estimates of useful lives are based on third partythird-party engineering studies, experience and/or industry practice. There are a number of assumptions inherent in estimating the service lives of our assets including the level of development, exploration, drilling, reserves and production of crude oil and natural gas in the supply areas served by our pipelines, as well as the demand for crude oil and natural gas and the integrity of our systems. Changes in these assumptions could result in adjustments to the estimated service lives, which could result in material changes to depreciation expense in future periods in any of our business segments. For
certain rate-regulated operations, depreciation rates are approved by the regulator and the regulator may require periodic studies or technical updates on useful lives which may change depreciation rates.
Postretirement Benefits
PENSION AND OTHER POSTRETIREMENT BENEFITS
We maintain pension plans, which provideuse certain assumptions relating to the calculation of defined benefit and/or defined contribution pension benefits and other postretirement benefits (OPEB) to eligible retirees. Pension costsliabilities and obligations for the definednet periodic benefit pension plans are determined using actuarial methods and are funded through contributions determined using the projected benefit method, which incorporates management’scosts. These assumptions comprise management's best estimates of expected return on plan assets, future salary level,levels, other cost escalations, retirement ages of employees, and other actuarial factors including discount rates and mortality. We determine discount rates by reference to rates of high-quality long-term corporate bonds with maturities that approximate the timing of future payments we anticipate makinganticipated to be made under each of the respective plans. TheseThe expected return on plan assets is determined using market-related values and assumptions on the asset mix consistent with the investment policy relating to the assets and their projected returns. The assumptions are reviewed annually by our independent actuaries. Actual results that differ from results based on assumptions are amortized over future periods and, therefore, could materially affect the expense recognized and the recorded obligation in future periods. The actual return on plan assets exceeded the expectation by $174 million and $19 million for the years ended December 31, 2017 and 2016, respectively, as disclosed in Part II. Item 8. Financial Statements and Supplementary Data - Note 25 Pension and Other Postretirement Benefits. The difference between the actual and expected return on plan assets is amortized over the remaining service period of the active employees.
The following sensitivity analysis identifies the impact on the consolidated financial statements for the year ended December 31, 2017 Consolidated Financial Statements2023 of a 0.5% change in key pension and OPEB assumptions.other postretirement benefits (OPEB) obligation assumptions:
| | | | | | | | | | | | | | | | | | | | | | | |
| | Canada | | United States |
| | Obligation | | Expense | | Obligation | | Expense |
| (millions of Canadian dollars) | | | | | | | |
| Pension | | | | | | | |
| Decrease in discount rate | 297 | | 12 | | 52 | | 3 |
| Decrease in expected return on assets | — | | 21 | | — | | 5 |
| Decrease in rate of salary increase | (60) | | (5) | | (5) | | (1) |
| OPEB | | | | | | | |
| Decrease in discount rate | 15 | | 1 | | 5 | | — |
| Decrease in expected return on assets | N/A | | N/A | | — | | 1 |
|
| | | | | | | | | | | |
| | Canada | | United States |
| | Obligation |
| | Expense |
| | Obligation |
| | Expense |
|
| (millions of Canadian dollars) | |
| | |
| | |
| | |
|
| Pension | | | | | | | |
| Decrease in discount rate | 255 |
| | 26 |
| | 71 |
| | 3 |
|
| Decrease in expected return on assets | — |
| | 12 |
| | — |
| | 5 |
|
| Decrease in rate of salary increase | (56 | ) | | (13 | ) | | (9 | ) | | (2 | ) |
| OPEB | | | | | | | |
Decrease in discount rate
| 27 |
| | 1 |
| | 18 |
| | (1 | ) |
Decrease in expected return on assets
| — |
| | — |
| | — |
| | 1 |
|
Contingent Liabilities
Provisions for claims filed against us are determined on a case-by-case basis. Case estimates are reviewed on a regular basis and are updated as new information is received. The process of evaluating claims involves the use of estimates and a high degree of management judgment. Claims outstanding, the final determination of which could have a material impact on our financial results and certain subsidiaries and investments, are detailed in Legal and Other Updates and Part II. Item 8. Financial Statements and Supplementary Data - Note 2830. Commitments and Contingencies. In addition, any unasserted claims that later may become evident could have a material impact on our financial results and certain subsidiaries and investments.
Asset Retirement Obligations
ASSET RETIREMENT OBLIGATIONS
Asset retirement obligations (ARO) associated with the retirement of long-lived assets are measured at fair value and recognized as Accounts payable and otherOther current liabilities or Other long-term liabilities in the period in which they can be reasonably determined. The fairFair value approximates the cost a third party would charge to perform the tasks necessary to retire such assets and is recognized at the present value of expected future cash flows. DiscountThe discount rates used to estimate the present value theof expected future cash flows range from 2.5% to 11.0% and 1.7% to 11.0% for the years ended December 31, 20172023 and 2016, respectively.2022 ranged from 1.5% to 9.0%. ARO is added to the carrying value of the associated asset and depreciated over the asset’sasset's useful life. The corresponding liability is accreted over time through charges to earnings and is reduced by actual costs of decommissioning and reclamation. Our estimates of retirement costs could change as a result of changes in cost estimates and regulatory requirements. Currently, for the majority of our assets, there is
insufficient data or information to reasonably determine the timing of settlement for estimating the fair value of the ARO. In these cases, the fair value of ARO cost is considered indeterminate for accounting purposes, as there is no data or information that can be derived from past practice, industry practice or the estimated economic life of the asset.
In 2009, the NEBCER issued a decision related to the LMCI, which required holders of an authorization to operate a pipeline under the NEBCER Act to file a proposed process and mechanism to set aside funds to pay for future abandonment costs in respect of the sites in Canada used for the operation of a pipeline. The NEB’sCER's decision stated that, while pipeline companies are ultimately responsible for the full costs of abandoning pipelines, abandonment costs are a legitimate cost of providing service and are recoverable from the users of the pipeline upon approval by the NEB.CER. Following the NEB’sCER's final approval of the collection mechanism and the set-aside mechanism for LMCI, we began collecting and setting aside funds to cover future abandonment costs effective January 1, 2015. The funds collected are held in trusttrusts in accordance with the NEBCER decision. The funds collected from shippers are reported within Transportation and other services revenues and Restricted long-term investments. Concurrently, we reflect the future abandonment cost as an increase to Operating and administrative expense and Other long-term liabilities.
CHANGES IN ACCOUNTING POLICIES
GoodwillRefer to Part II. Item 8. Financial Statements and Supplementary Data - Note 3. Changes in Accounting Policies.
We previously performed our annual goodwill impairment test on October 1 of each fiscal year. Beginning with the quarter ended December 31, 2017, we moved the annual goodwill impairment test from October 1 to April 1 to better align with the preparation and review of our business plan, which is used in the test. The change does not delay, accelerate or avoid an impairment charge.
ADOPTION OF NEW STANDARDS
Simplifying the Measurement of Goodwill Impairment
Effective January 1, 2017, we early adopted Accounting Standards Update (ASU) 2017-04 and applied the standard on a prospective basis. Under the new guidance, goodwill impairment will now be the amount by which a reporting unit’s carrying value exceeds its fair value; this amount should not exceed the carrying amount of goodwill. We applied this standard as at December 31, 2017 in the measurement of the goodwill impairment relating to the gas midstream reporting unit.
Clarifying the Definition of a Business in an Acquisition
Effective January 1, 2017, we early adopted ASU 2017-01 on a prospective basis. The new standard was issued with the objective of adding guidance to assist entities with evaluating whether transactions should be accounted for as acquisitions (disposals) of assets or businesses. This accounting update was applied to acquisitions and dispositions that occurred in the year.
Accounting for Intra-Entity Asset Transfers
Effective January 1, 2017, we early adopted ASU 2016-16 on a modified retrospective basis. The new standard was issued with the intent of improving the accounting for the income tax consequences of intra-entity asset transfers other than inventory. Under the new guidance, an entity should recognize the income tax consequences of an intra-entity transfer of an asset, other than inventory, when the transfer occurs. The adoption of the pronouncement did not have a material impact on our consolidated financial statements.
Improvements to Employee Share-Based Payment Accounting
Effective January 1, 2017, we adopted ASU 2016-09 and applied certain amendments on a modified retrospective basis with the remaining amendments applied on a prospective basis. The new standard was issued with the intent of simplifying and improving several aspects of accounting for share-based payment transactions including the income tax consequences, classification of awards as either equity or
liabilities, and classification on the statement of cash flows. The adoption of the pronouncement did not have a material impact on our consolidated financial statements.
Simplifying the Embedded Derivatives Analysis for Debt Instruments
Effective January 1, 2017, we adopted ASU 2016-06 on a modified retrospective basis. The new guidance simplifies the embedded derivative analysis for debt instruments containing contingent call or put options. The adoption of the pronouncement did not have a material impact on our consolidated financial statements.
FUTURE ACCOUNTING POLICY CHANGES
Reclassification of Certain Tax Effects from Accumulated Other Comprehensive Income
ASU 2018-02 was issued in February 2018 to address a specific consequence of the TCJA. This accounting update allows a reclassification from accumulated other comprehensive income to retained earnings for stranded tax effects resulting from TCJA. The amendments eliminate the stranded tax effects that were created as a result of the reduction of historical U.S. federal corporate income tax rate to the newly enacted U.S. federal corporate income tax rate. The accounting update is effective January 1, 2019, with early adoption permitted, and is to be applied either in the period of adoption or retrospectively to each period in which the effect of the change in the U.S. federal corporate income tax rate in the TCJA is recognized. We are currently assessing the impact of the new standard on the consolidated financial statements.
Improvements to Accounting for Hedging Activities
ASU 2017-12 was issued in August 2017 with the objective of better aligning a company’s risk management activities and the resulting hedge accounting reflected in the financial statements. The accounting update allows cash flow hedging of contractually specified components in financial and non-financial items. Under the new guidance, hedge ineffectiveness is no longer required to be measured and hedging instruments’ fair value changes will be recorded in the same income statement line as the hedged item. The ASU also allows the initial quantitative hedge effectiveness assessment to be performed at any time before the end of the quarter in which the hedge is designated. After initial quantitative testing is performed, an ongoing qualitative effectiveness assessment is permitted. The accounting update is effective January 1, 2019 and is to be applied on a modified retrospective basis. We are currently assessing the impact of the new standard on our consolidated financial statements.
Clarifying Guidance on the Application of Modification Accounting on Stock Compensation
ASU 2017-09 was issued in May 2017 with the intent to clarify the scope of modification accounting and when it should be applied to a change to the terms or conditions of a share based payment award. Under the new guidance, modification accounting is required for all changes to share based payment awards, unless all of the following are met: 1) there is no change to the fair value of the award, 2) the vesting conditions have not changed, and 3) the classification of the award as an equity instrument or a debt instrument has not changed. The accounting update is effective January 1, 2018 and will be applied on a prospective basis. We do not expect the adoption of this accounting update to have a material impact on our consolidated financial statements.
Amending the Amortization Period for Certain Callable Debt Securities Purchased at a Premium
ASU 2017-08 was issued in March 2017 with the intent of shortening the amortization period to the earliest call date for certain callable debt securities held at a premium. The accounting update is effective January 1, 2019 and will be applied on a modified retrospective basis. We are currently assessing the impact of the new standard on our consolidated financial statements.
Improving the Presentation of Net Periodic Benefit Cost related to Defined Benefit Plans
ASU 2017-07 was issued in March 2017 primarily to improve the income statement presentation of the components of net periodic pension cost and net periodic postretirement benefit cost for an entity’s sponsored defined benefit pension and OPEB plans. In addition, only the service cost component of net benefit cost is eligible for capitalization. The accounting update is effective January 1, 2018 and will be
applied on a retrospective basis for the statement of earnings presentation component and a prospective basis for the capitalization component. We do not expect the adoption of this accounting update to have a material impact on our consolidated financial statements.
Clarifying Guidance on Derecognition and Partial Sales of Nonfinancial Assets
ASU 2017-05 was issued in February 2017 with the intent of clarifying the scope of asset derecognition guidance and accounting for partial sales of nonfinancial assets. The ASU clarifies the scope provisions of nonfinancial assets and how to allocate consideration to each distinct asset, and amends the guidance for derecognition of a distinct nonfinancial asset in partial sale transactions. The accounting update is effective January 1, 2018 and will be applied on a modified retrospective basis. We do not expect the adoption of this accounting update to have a material impact on our consolidated financial statements.
Clarifying the Presentation of Restricted Cash in the Statement of Cash Flows
ASU 2016-18 was issued in November 2016 with the intent to clarify guidance on the classification and presentation of changes in restricted cash and restricted cash equivalents within the statement of cash flows. The accounting update requires that changes in restricted cash and restricted cash equivalents be included within cash and cash equivalents when reconciling the opening and closing period amounts shown on the statement of cash flows. We currently present the changes in restricted cash and restricted cash equivalents under investing activities in the Consolidated Statement of Cash Flows. The accounting update is effective January 1, 2018 and will be applied on a retrospective basis. We will amend the presentation in the Consolidated Statement of Cash Flows to include restricted cash and restricted cash equivalents with cash and cash equivalents and we will retrospectively reclassify all periods presented.
Simplifying Cash Flow Classification
ASU 2016-15 was issued in August 2016 with the intent of reducing diversity in practice of how certain cash receipts and cash payments are classified in the Consolidated Statement of Cash Flows. The new guidance addresses eight specific presentation issues. The accounting update is effective January 1, 2018 and will be applied on a retrospective basis. We assessed each of the eight specific presentation issues and the adoption of this ASU does not have a material impact on our consolidated financial statements.
Accounting for Credit Losses
ASU 2016-13 was issued in June 2016 with the intent of providing financial statement users with more useful information about the expected credit losses on financial instruments and other commitments to extend credit held by a reporting entity at each reporting date. Current treatment uses the incurred loss methodology for recognizing credit losses that delays the recognition until it is probable a loss has been incurred. The accounting update adds a new impairment model, known as the current expected credit loss model, which is based on expected losses rather than incurred losses. Under the new guidance, an entity recognizes as an allowance its estimate of expected credit losses, which the Financial Accounting Standards Board believes will result in more timely recognition of such losses. We are currently assessing the impact of the new standard on our consolidated financial statements. The accounting update is effective January 1, 2020.
Recognition of Leases
ASU 2016-02 was issued in February 2016 with the intent to increase transparency and comparability among organizations. It requires lessees of operating lease arrangements to recognize lease assets and lease liabilities on the statement of financial position and disclose additional key information about lease agreements. The accounting update also replaces the current definition of a lease and requires that an arrangement be recognized as a lease when a customer has the right to obtain substantially all of the economic benefits from the use of an asset, as well as the right to direct the use of the asset. We are currently gathering a complete inventory of our lease contracts in order to assess the impact of the new standard on our consolidated financial statements. The accounting update is effective January 1, 2019 and will be applied using a modified retrospective approach.
Recognition and Measurement of Financial Assets and Liabilities
ASU 2016-01 was issued in January 2016 with the intent to address certain aspects of recognition, measurement, presentation and disclosure of financial assets and liabilities. Investments in equity securities, excluding equity method and consolidated investments, are no longer classified as trading or available-for-sale securities. All investments in equity securities with readily determinable fair values are classified as investments at fair value through net income. Investments in equity securities without readily determinable fair values are measured using the fair value measurement alternative and are recorded at cost minus impairment, if any, plus or minus changes resulting from observable price changes in orderly transactions for an identical or similar investment of the same issuer. Investments in equity securities measured using the fair value measurement alternative are reviewed for indicators of impairment each reporting period. Fair value of financial instruments for disclosure purposes is measured using exit price. The accounting update is effective January 1, 2018 and applied on a prospective basis. We do not expect the adoption of this accounting update to have a material impact on our consolidated financial statements.
Revenue from Contracts with Customers
ASU 2014-09 was issued in 2014 with the intent of significantly enhancing consistency and comparability of revenue recognition practices across entities and industries. The new standard establishes a single, principles-based five-step model to be applied to all contracts with customers and introduces new and enhanced disclosure requirements. It also requires the use of more estimates and judgments than the present standards in addition to additional disclosures. The new standard is effective January 1, 2018. The new standard permits either a full retrospective method of adoption with restatement of all prior periods presented, or a modified retrospective method with the cumulative effect of applying the new standard recognized as an adjustment to opening retained earnings in the period of adoption. We have decided to adopt the new standard using the modified retrospective method.
We have reviewed our revenue contracts in order to evaluate the effect of the new standard on our revenue recognition practices. Based on our assessment to-date, the adoption of the new standard will have the following impact to our financial statements:
A change in presentation in the Gas Distribution business related to payments to customers under the earnings sharing mechanism which are currently shown as an expense in the Consolidated Statements of Earnings. Under the new standard, these payments will be reflected as a reduction of revenue.
Estimates of variable consideration, required under the new standard for certain Liquids Pipelines, Gas Transmission and Midstream and Green Power and Transmission revenue contracts as well as the allocation of the transaction price for certain Liquids Pipelines revenue contracts, may result in changes to the pattern or timing of revenue recognition for those contracts.
Non-cash consideration received in the form of a percentage of the products derived from processing natural gas in the Gas Transmission and Midstream business was previously accounted for as revenue when the commodity was sold to third parties. Under the new standard, the non-cash consideration will be accounted for as revenue when processing services are performed. The commodity will continue to be accounted for as revenue when it is subsequently sold to third parties. The impact of this change will be an increase in costs and revenues due to the recognition of this non-cash consideration.
Service fee revenue, from processing natural gas for certain contracts in the Gas Transmission and Midstream business whereby Enbridge purchases natural gas at the wellhead, then processes and subsequently sells the gas, was previously presented as revenue. Under the new standard, processing fees charged on natural gas purchased by Enbridge are presented as a reduction of commodity costs upon the transfer of control of the natural gas at the wellhead.
Revenue from certain contracts in the Gas Transmission and Midstream business that provide for Enbridge to process and sell customers’ natural gas and retain a percentage of the resulting processed natural gas and/or NGLs as payment for processing services rendered, commonly referred to as Percentage of Proceeds and Percentage of Liquids contracts, was previously
presented on a gross basis whereby Enbridge recorded one hundred percent of the value of the natural gas and products sold as revenue, with the cost of the natural gas purchased recorded as commodity cost. Under the new standard only Enbridge’s share of the products retained and sold is presented as revenue and no commodity cost is recorded.
Certain payments received from customers to offset the cost of constructing assets required to provide services to those customers, referred to as Contributions in Aid of Construction (CIAC) were previously recorded as reductions of property, plant and equipment regardless of whether the amounts were imposed by regulation or negotiated. Under the new standard, negotiated CIACs are deemed to be advance payments for services and must be recognized as revenue when those future services are provided. Negotiated CIACs will be accounted for as deferred revenue and recognized over the term of the associated revenue contract.
Upon adoption, we will recognize the significant cumulative effect of initially applying the new standard as an increase in the opening balance of retained deficit of approximately $120 million, an increase in property, plant and equipment of $130 million and an increase in deferred revenue of $120 million, subject to final determination, as at January 1, 2018. The adoption of the new standard will also result in changes in classification between Revenue and Commodity costs as discussed above.
We have also developed and tested processes to generate the disclosures which will be required under the new standard commencing in the first quarter of 2018.
ITEM 7A. QUANTITATIVE AND QUALITATIVE DISCLOSURES ABOUT MARKET RISK
Our earnings, cash flows and other comprehensive income (OCI) are subject to movements in foreign exchange rates, interest rates, commodity prices and our share price.
The following summarizes the types of market risks to which we are exposed and the risk management instruments used to mitigate them. We use a combination of qualifying and non-qualifying derivative instruments to manage the risks noted below.
Foreign Exchange Risk
We generate certain revenues, incur expenses and hold a number of investments and subsidiaries that are denominated in currencies other than Canadian dollars. As a result, our earnings, cash flows and OCI are exposed to fluctuations resulting from foreign exchange rate variability.
We employ financial derivative instruments to hedge foreign currency denominated earnings exposure. A combination of qualifying and non-qualifying derivative instruments areis used to hedge anticipated foreign currency denominated revenues and expenses and to manage variability in cash flows. We hedge certain net investments in United States dollar denominatedUS dollar-denominated investments and subsidiaries using foreign currency derivatives and United States dollar denominatedUS dollar-denominated debt.
Interest Rate Risk
Our earnings and cash flows are exposed to short-term interest rate variability due to the regular repricing of our variable rate debt, primarily commercial paper. We monitor our debt portfolio mix of fixed and variable rate debt instruments to manage a consolidated portfolio of floating rate debt within the Board of Directors' approved policy limit of a maximum of 30% of floating rate debt as a percentage of total debt outstanding. We primarily use qualifying derivative instruments to manage interest rate risk. Pay fixed-receive floating interest rate swaps aremay be used to hedge against the effect of future interest rate movements. We have implemented a hedging program to significantlypartially mitigate the impact of short-term interest rate volatility on interest expense via the execution of floating to fixedfloating-to-fixed interest rate swaps withand costless collars. These swaps have an average swapfixed rate of 2.6%4.1%.
As a result of the Merger Transaction, we are exposed to changes in the fair value of fixed rate debt that arise as a result of the changes in market interest rates. Pay floating-receive fixed interest rate swaps are used to hedge against future changes to the fair value of fixed rate debt. We have assumed a program
within our subsidiaries to mitigate the impact of fluctuations in the fair value of fixed rate debt via execution of fixed to floating interest rate swaps with an average swap rate of 2.2%.
Our earnings and cash flows are also exposed to variability in longer term interest rates ahead of anticipated fixed rate term debt issuances. Forward starting interest rate swaps are used to hedge against the effect of future interest rate movements. We have assumedestablished a program withinincluding some of our subsidiaries to partially mitigate our exposure to long-term interest rate variability on select forecastforecasted term debt issuances via execution of floating to fixedfloating-to-fixed interest rate swaps with an average swap rate of 3.1%3.5%.
We also monitor our debt portfolio mix of fixed and variable rate debt instruments to maintain a consolidated portfolio of debt within the Board of Directors approved policy limit of a maximum of 25% floating rate debt as a percentage of total debt outstanding. Effective January 1, 2018, the Board of Directors approved a policy limit increase of a maximum of 30% floating rate debt as a percentage of total debt outstanding. We primarily use qualifying derivative instruments to manage interest rate risk.
Commodity Price Risk
Our earnings, and cash flows and OCI are exposed to changes in commodity prices as a result of our ownership interests in certain assets and investments, as well as through the activities of our energy services subsidiaries. These commodities include natural gas, crude oil, power and NGL. We employ financial and physical derivative instruments to fix a portion of the variable price exposures that arise from physical transactions involving these commodities. We use primarily non-qualifying derivative instruments to manage commodity price risk.
Emission Allowance Price Risk
Emission allowance price risk is the risk of gain or loss due to changes in the market price of emission allowances that our gas distribution business is required to purchase for itself and most of its customers to meet GHG compliance obligations under the Ontario Cap and Trade framework. Similar to the gas supply procurement framework, the OEB's framework for emission allowance procurement allows recovery of fluctuations in emission allowance prices in customer rates, subject to OEB approval.
Equity Price Risk
Equity price risk is the risk of earnings fluctuations due to changes in our share price. We have exposure to our own common share price through the issuance of various forms of stock-based compensation, which affect earnings through the revaluation of the outstanding units every period. We use equity derivatives to manage the earnings volatility derived from 1one form of stock-based compensation, restricted sharestock units. We use a combination of qualifying and non-qualifying derivative instruments to manage equity price risk.
Market Risk Management
We have a Risk Policy to minimize the likelihood that adverse earningscash flow impacts arising from movements in market prices will exceed a defined risk tolerance. We identify and measure all material market risks including commodity price risks, interest rate risks, foreign exchange risk emission allowance price risk and equity price risk using a standardized measurement methodology. Our market risk metric consolidates the exposure after accounting for the impact of offsetting risks and limits the consolidated earningscash flow volatility arising from market related risks to an acceptable approved risk tolerance threshold. Our market risk metric is Cash Flow at Risk (CFaR).
We use Earnings-at-Risk (EaR),
CFaR is a statistically derived measurement used to quantify lossesmeasure the maximum cash flow loss that could potentially result from adverse market price movements over a one month holding period for price sensitive non-derivative exposures and for derivative instruments we hold or issue as recorded onin the balance sheetConsolidated Statements of Financial Position as at December 31, 2017. EaR2023. CFaR assumes that no further mitigating actions are taken to hedge or otherwise minimize exposures. Theexposures and the selection of a one month holding period reflects the mix of price risk sensitive assets at Enbridge. EaR calculates the annual earnings impact of market price movements over a one month period assuming no action is taken to hedge or otherwise mitigate exposures. As a practical matter, a large portion of Enbridge’s exposure could be hedged or unwound in a much shorter period if required to mitigate the risks.
The consolidated EaRCFaR policy limit for Enbridge is 5%3.5% of its forward 12 month forecast normalized earnings. EaR incorporates a Monte Carlo simulation, a 97.5 percent confidence level, a risk measurement horizon of one year (forward looking), a holding period of one month, and includes financial derivative instruments, other financial instruments, commodity derivative instruments, other commodity and executory contracts, positions and earnings or cash flows from anticipated transactions. EaR at December 31, 2017 and 2016 is 1.7% and 2.8% or $68 million and $59 million, respectively.
Effective January 1, 2018, the Board of Directors approved to change the market risk metric to Cash-Flows-at-Risk (CFaR) and the consolidated CFaR limit will be 3.5% of forward 12 month normalized cash flow. The policy change will align the market risk metric with other key results metrics in the organization.At December 31, 2023 and 2022 CFaR was $100 million and $144 million or 0.9% and 1.3%, respectively, of estimated 12 month forward normalized cash flow.
LIQUIDITY RISK
Liquidity risk is the risk that we will not be able to meet our financial obligations, including commitments and guarantees, as they become due. In order to mitigate this risk, we forecast cash requirements over a 12 month rolling time period to determine whether sufficient funds will be available and maintain substantial capacity under our committed bank lines of credit to address any contingencies. Our primary sources of liquidity and capital resources are funds generated from operations, the issuance of commercial paper and draws under committed credit facilities and long-term debt, which includes debentures and medium-term notes. We also maintain currentOur shelf prospectuses with securities regulators which enables, subject to market conditions,enable ready access to either the Canadian or United StatesUS public capital markets.markets, subject to market conditions. In addition, we maintain sufficient liquidity through committed credit facilities with a diversified group of banks and institutions which, if necessary, enables us to fund all anticipated requirements for approximately one year without accessing the capital markets. We arewere in compliance with all the terms and conditions of our committed credit facility agreements and term debt indentures as at December 31, 2017.2023. As a result, all credit facilities are available to us and the banks are obligated to fund and have been funding us under the terms of the facilities. We also identify a variety of other potential sources of debt and equity funding alternatives, including reinstatement of our dividend reinvestment and share purchase plan or at-the-market equity issuances.
CREDIT RISK
Entering into derivative instruments may result in exposure to credit risk from the possibility that a counterparty will default on its contractual obligations. In order to mitigate this risk, we enter into risk management transactions primarily with institutions that possess strong investment grade credit ratings. Credit risk relating to derivative counterparties is mitigated bythrough the maintenance and monitoring of credit exposure limits and contractual requirements, netting arrangements and ongoing monitoring of counterparty credit exposure using external credit rating services and other analytical tools.
We generally have a policy of entering into individual International Swaps and Derivatives Association, Inc. agreements, or other similar derivative agreements, with the majority of our financial derivative counterparties. These agreements provide for the net settlement of derivative instruments outstanding with specific counterparties in the event of bankruptcy or other significant credit events and reducesreduce our credit risk exposure on financial derivative asset positions outstanding with the counterparties in these particularthose circumstances.
Credit risk also arises from trade and other long-term receivables, and is mitigated through credit exposure limits and contractual requirements, assessment of credit ratings and netting arrangements. Within EGD and Union Gas, credit risk is mitigated by the utilities' large and diversified customer base and the ability to recover an estimate for doubtful accounts through the ratemaking process. We actively monitor the financial strength of large industrial customers and, in select cases, have obtained additional security to minimize the risk of default on receivables. Generally, we classify and provide for receivables older than 20 days as past due. The maximum exposure to credit risk related to non-derivative financial assets is their carrying value.
FAIR VALUE MEASUREMENTS
The most observable inputs available are used to estimateOur financial assets and liabilities measured at fair value on a recurring basis include derivatives and other financial instruments. We also disclose the fair value of its derivatives. When possible, we estimate theother financial instruments not measured at fair value. The fair value of financial instruments reflects our derivativesbest estimates of market value based on quotedgenerally accepted valuation techniques or models and is supported by observable market prices from exchanges. If quoted market pricesand rates. When such values are not available, we use estimates from third party brokers. For non-exchange traded derivatives classified in Levels 2 and 3, we use standard valuation techniques to calculate the estimated fair value. These methods include discounted cash flows for forwards and swaps and Black-Scholes-Merton pricing models for options. Dependingflow analysis from applicable yield curves based on the type of derivative and nature of the underlying risk, we use observable market prices (interest rates, foreign exchange rates, commodity prices and share prices, as applicable) and volatility as primary inputs to these valuation techniques. Finally, we consider our own credit default swap spread, as well as the credit default swap spreads associated with our counterparties, in our estimation ofestimate fair value.
ITEM 8. FINANCIAL STATEMENTS AND SUPPLEMENTARY DATA
Report of Independent Registered Public Accounting Firm
To the Shareholders and Board of Directors of Enbridge Inc.
Opinions on the consolidated financial statementsFinancial Statements and internal controlInternal Control over financial reportingFinancial Reporting
We have audited the accompanying consolidated statements of financial position of Enbridge Inc. and its subsidiaries (the “Company”)(together, the Company) as of December 31, 20172023 and December 31, 2016,2022, and the related consolidated statements of earnings, comprehensive income, changes in equity and cash flows for each of the three years in the period ended December 31, 2017,2023, including the related notes (collectively referred to as the “consolidatedconsolidated financial statements”)statements). We also have audited the Company'sCompany’s internal control over financial reporting as of December 31, 2017,2023, based on criteria established in Internal Control -– Integrated Framework (2013) issued by the Committee of Sponsoring Organizations of the Treadway Commission (COSO).
In our opinion, the consolidated financial statements referred to above present fairly, in all material respects, the consolidated financial position of the Company as of December 31, 20172023 and December 31, 2016,2022, and the results of theirits operations and theirits cash flows for each of the three years in the period ended December 31, 20172023 in conformity with accounting principles generally accepted in the United States of America. Also in our opinion, the Company maintained, in all material respects, effective internal control over financial reporting as of December 31, 2017,2023, based on criteria established in Internal Control -– Integrated Framework (2013) issued by the COSO.
Basis for opinions
Opinions
The Company’s management is responsible for these consolidated financial statements, for maintaining effective internal control over financial reporting, and for its assessment of the effectiveness of internal control over financial reporting, included in the Management’s Annual Report on Internal Control over Financial Reporting appearing under Item 9A. Our responsibility is to express opinions on the Company’s consolidated financial statements and on the Company’s internal control over financial reporting based on our audits. We are a public accounting firm registered with the Public Company Accounting Oversight Board (United States) (PCAOB) and are required to be independent with respect to the Company in accordance with the U.S. federal securities laws and the applicable rules and regulations of the Securities and Exchange Commission and the PCAOB.
We conducted our audits in accordance with the standards of the PCAOB. Those standards require that we plan and perform the audits to obtain reasonable assurance about whether the consolidated financial statements are free of material misstatement, whether due to error or fraud, and whether effective internal control over financial reporting was maintained in all material respects.
Our audits of the consolidated financial statements included performing procedures to assess the risks of material misstatement of the consolidated financial statements, whether due to error or fraud, and performing procedures that respond to those risks. Such procedures included examining, on a test basis, evidence regarding the amounts and disclosures in the consolidated financial statements. Our audits also included evaluating the accounting principles used and significant estimates made by management, as well as evaluating the overall presentation of the consolidated financial statements. Our audit of internal control over financial reporting included obtaining an understanding of internal control over financial reporting, assessing the risk that a material weakness exists, and testing and evaluating the design and operating effectiveness of internal control based on the assessed risk. Our audits also included performing such other procedures as we considered necessary in the circumstances. We believe that our audits provide a reasonable basis for our opinions.
Definition and limitationsLimitations of internal controlInternal Control over financial reporting
Financial Reporting
A Company’scompany’s internal control over financial reporting is a process designed to provide reasonable assurance regarding the reliability of financial reporting and the preparation of consolidated financial statements for external purposes in accordance with generally accepted accounting principles. A Company’scompany’s internal control over financial reporting includes those policies and procedures that (i) pertain to the maintenance of records that, in reasonable detail, accurately and fairly reflect the transactions and dispositions of the assets of the Company;company; (ii) provide reasonable assurance that transactions are recorded as necessary to permit preparation of consolidated financial statements in accordance with generally accepted accounting principles, and that receipts and expenditures of the Companycompany are being made only in accordance with authorizations of management and directors of the Company;company; and (iii) provide reasonable assurance regarding prevention or timely detection of unauthorized acquisition, use, or disposition of the Company’scompany’s assets that could have a material effect on the consolidated financial statements.
Because of its inherent limitations, internal control over financial reporting may not prevent or detect misstatements. Also, projections of any evaluation of effectiveness to future periods are subject to the risk that controls may become inadequate because of changes in conditions, or that the degree of compliance with the policies or procedures may deteriorate.
Critical Audit Matters
The critical audit matter communicated below is a matter arising from the current period audit of the consolidated financial statements that was communicated or required to be communicated to the audit committee and that (i) relates to accounts or disclosures that are material to the consolidated financial statements and (ii) involved our especially challenging, subjective, or complex judgments. The communication of critical audit matters does not alter in any way our opinion on the consolidated financial statements, taken as a whole, and we are not, by communicating the critical audit matter below, providing a separate opinion on the critical audit matter or on the accounts or disclosures to which it relates.
Goodwill Impairment Assessment
As described in Notes 2 and 15 to the consolidated financial statements, the Company’s goodwill balance was $31,848 million at December 31, 2023. As disclosed by management, an annual goodwill impairment assessment is performed at the reporting unit level as of April 1 of each year, or more frequently if events or circumstances indicate that the carrying value of goodwill may be impaired. Management has the option to first assess qualitative factors to determine whether it is necessary to perform the quantitative goodwill impairment assessment. In making the qualitative assessment, management considers macroeconomic trends, changes to regulatory environments, capital accessibility, operating income trends and changes to industry conditions. The quantitative goodwill impairment assessment involves determining the fair value of the Company’s reporting units and comparing those values to the carrying value of each reporting unit, including goodwill. Fair value is estimated using a discounted cash flow technique. The determination of fair value using the discounted cash flow technique requires the use of estimates and assumptions related to discount rates, projected operating income, expected future capital expenditures and working capital levels, as well as terminal value growth rates for the Liquids Pipelines, Gas Transmission and Midstream (Gas Transmission), and Renewable Power Generation reporting units, and projected regulatory rate base and rate base multiple for the Gas Distribution and Storage (Gas Distribution) reporting unit. Management performed a qualitative goodwill impairment assessment as of April 1, 2023 for the following reporting units: Liquids Pipelines, Gas Transmission, Gas Distribution and Renewable Power Generation and did not identify impairment indicators. Due to the Ontario Energy Board decision on Phase 1 for Enbridge Gas Inc., announced in December 2023, management performed a quantitative assessment for the Gas Distribution reporting unit as of December 1, 2023. In addition, management performed a quantitative assessment for the Gas Transmission reporting unit as of December 1, 2023. Neither assessment resulted in the recognition of an impairment charge of either reporting unit.
The principal considerations for our determination that performing procedures relating to the goodwill impairment assessment is a critical audit matter are the significant judgments required by management when developing such significant assumptions as discount rates, projected operating income, expected future capital expenditures, terminal value growth rates, projected regulatory rate base and rate base multiple used to estimate the fair value of the Gas Transmission and Gas Distribution reporting units, as applicable, as of December 1, 2023. This led to a high degree of auditor judgment, effort and subjectivity in performing procedures to evaluate the reasonableness of management’s significant assumptions used in the quantitative assessment. In addition, the audit effort involved the use of professionals with specialized skill and knowledge.
Addressing the matter involved performing procedures and evaluating audit evidence in connection with forming our overall opinion on the consolidated financial statements.These procedures included testing the effectiveness of controls relating to management’s quantitative goodwill impairment assessment, including controls over the determination of the fair value estimates of the Company’s reporting units. These procedures also included, among others, testing management’s process for developing the fair value estimates of the Gas Transmission and Gas Distribution reporting units.
Testing management’s process for developing the fair value estimates included evaluating the appropriateness of the discounted cash flow models; testing the completeness and accuracy of underlying data used in the models; and evaluating the reasonableness of significant assumptions used by management in determining the fair value estimates, including discount rates, projected operating income, expected future capital expenditures, projected regulatory rate base and rate base multiple and terminal value growth rates. Assessing the reasonableness of projected operating income, expected future capital expenditures and the projected regulatory rate base involved evaluating whether these significant assumptions were reasonable considering the current and past performance of the Company’s reporting units, external industry data and evidence obtained in other areas of the audit, as applicable. Professionals with specialized skill and knowledge were used to assist in evaluating the appropriateness of management’s discounted cash flow models and evaluating the reasonableness of significant assumptions used in the models, specifically discount rates, terminal value growth rates and the rate base multiple.
/s/PricewaterhouseCoopers LLP
Chartered Professional Accountants
Calgary, AlbertaCanada
February 16, 20189, 2024
We have served as the Company’sCompany's auditor since 1949.
ENBRIDGE INC.
CONSOLIDATED STATEMENTS OF EARNINGS
|
| | | | | | |
| Year ended December 31, | 2017 |
| 2016 |
| 2015 |
|
| (millions of Canadian dollars, except per share amounts) | | | |
| Operating revenues | | | |
| Commodity sales | 26,286 |
| 22,816 |
| 23,842 |
|
| Gas distribution sales | 4,215 |
| 2,486 |
| 3,096 |
|
| Transportation and other services | 13,877 |
| 9,258 |
| 6,856 |
|
| Total operating revenues | 44,378 |
| 34,560 |
| 33,794 |
|
| Operating expenses | | | |
| Commodity costs | 26,065 |
| 22,409 |
| 22,949 |
|
| Gas distribution costs | 2,572 |
| 1,596 |
| 2,292 |
|
| Operating and administrative | 6,442 |
| 4,358 |
| 4,131 |
|
| Depreciation and amortization | 3,163 |
| 2,240 |
| 2,024 |
|
Impairment of long-lived assets (Note 7 and Note 10) | 4,463 |
| 1,376 |
| 96 |
|
Impairment of goodwill (Note 7 and Note 15) | 102 |
| — |
| 440 |
|
| Total operating expenses | 42,807 |
| 31,979 |
| 31,932 |
|
| Operating income | 1,571 |
| 2,581 |
| 1,862 |
|
Income from equity investments (Note 12) | 1,102 |
| 428 |
| 475 |
|
| Other income/(expense) | | | |
| Net foreign currency gain/(loss) | 237 |
| 91 |
| (884 | ) |
| Gain on dispositions | 16 |
| 848 |
| 94 |
|
| Other | 199 |
| 93 |
| 88 |
|
Interest expense (Note 17) | (2,556 | ) | (1,590 | ) | (1,624 | ) |
| Earnings before income taxes | 569 |
| 2,451 |
| 11 |
|
Income tax recovery/(expense) (Note 24) | 2,697 |
| (142 | ) | (170 | ) |
| Earnings/(loss) | 3,266 |
| 2,309 |
| (159 | ) |
| (Earnings)/loss attributable to noncontrolling interests and redeemable noncontrolling interests | (407 | ) | (240 | ) | 410 |
|
| Earnings attributable to controlling interests | 2,859 |
| 2,069 |
| 251 |
|
| Preference share dividends | (330 | ) | (293 | ) | (288 | ) |
| Earnings/(loss) attributable to common shareholders | 2,529 |
| 1,776 |
| (37 | ) |
Earnings/(loss) per common share attributable to common shareholders (Note 5) | 1.66 |
| 1.95 |
| (0.04 | ) |
Diluted earnings/(loss) per common share attributable to common shareholders (Note 5) | 1.65 |
| 1.93 |
| (0.04 | ) |
The accompanying notes are an integral part of these consolidated financial statements.
ENBRIDGE INC.
CONSOLIDATED STATEMENTS OF COMPREHENSIVE INCOME
|
| | | | | | |
| Year ended December 31, | 2017 |
| 2016 |
| 2015 |
|
| (millions of Canadian dollars) | | | |
| Earnings/(loss) | 3,266 |
| 2,309 |
| (159 | ) |
| Other comprehensive income/(loss), net of tax | | | |
| Change in unrealized gain/(loss) on cash flow hedges | (21 | ) | (138 | ) | 198 |
|
| Change in unrealized gain/(loss) on net investment hedges | 490 |
| 166 |
| (903 | ) |
| Other comprehensive income/(loss) from equity investees | (27 | ) | — |
| 30 |
|
| Reclassification to earnings of (gain)/loss on cash flow hedges | 313 |
| 116 |
| (559 | ) |
| Reclassification to earnings of pension and other postretirement benefits amounts | 19 |
| 17 |
| 21 |
|
| Actuarial gain/(loss) on pension plans and other postretirement benefits | 8 |
| (34 | ) | 51 |
|
| Foreign currency translation adjustments | (3,060 | ) | (712 | ) | 3,347 |
|
| Other comprehensive income/(loss), net of tax | (2,278 | ) | (585 | ) | 2,185 |
|
| Comprehensive income | 988 |
| 1,724 |
| 2,026 |
|
| Comprehensive (income)/loss attributable to noncontrolling interests and redeemable noncontrolling interests | (160 | ) | (229 | ) | 292 |
|
| Comprehensive income attributable to controlling interests | 828 |
| 1,495 |
| 2,318 |
|
| Preference share dividends | (330 | ) | (293 | ) | (288 | ) |
| Comprehensive income/(loss) attributable to common shareholders | 498 |
| 1,202 |
| 2,030 |
|
| | | | | | | | | | | |
| Year ended December 31, | 2023 | 2022 | 2021 |
| (millions of Canadian dollars, except per share amounts) | | | |
| Operating revenues | | | |
| Commodity sales | 18,981 | | 29,150 | | 26,873 | |
| Gas distribution sales | 4,839 | | 5,653 | | 4,026 | |
| Transportation and other services | 19,829 | | 18,506 | | 16,172 | |
Total operating revenues (Note 4) | 43,649 | | 53,309 | | 47,071 | |
| Operating expenses | | | |
| Commodity costs | 18,526 | | 28,942 | | 26,608 | |
| Gas distribution costs | 2,840 | | 3,647 | | 2,094 | |
| Operating and administrative | 8,600 | | 8,219 | | 6,712 | |
| Depreciation and amortization | 4,613 | | 4,317 | | 3,852 | |
| Impairment of long-lived assets | 419 | | 541 | | — | |
Impairment of goodwill (Note 15) | — | | 2,465 | | — | |
| Total operating expenses | 34,998 | | 48,131 | | 39,266 | |
| Operating income | 8,651 | | 5,178 | | 7,805 | |
Income from equity investments (Note 13) | 1,816 | | 2,056 | | 1,600 | |
| | | |
Gain on joint venture merger transaction (Note 13) | — | | 1,076 | | — | |
Other income/(expense) (Note 27) | 1,224 | | (589) | | 979 | |
Interest expense (Note 17) | (3,812) | | (3,179) | | (2,655) | |
| Earnings before income taxes | 7,879 | | 4,542 | | 7,729 | |
Income tax expense (Note 24) | (1,821) | | (1,604) | | (1,415) | |
| Earnings | 6,058 | | 2,938 | | 6,314 | |
| (Earnings)/loss attributable to noncontrolling interests | 133 | | 65 | | (125) | |
| Earnings attributable to controlling interests | 6,191 | | 3,003 | | 6,189 | |
| Preference share dividends | (352) | | (414) | | (373) | |
| Earnings attributable to common shareholders | 5,839 | | 2,589 | | 5,816 | |
Earnings per common share attributable to common shareholders (Note 6) | 2.84 | | 1.28 | | 2.87 | |
Diluted earnings per common share attributable to common shareholders (Note 6) | 2.84 | | 1.28 | | 2.87 | |
The accompanying notes are an integral part of these consolidated financial statements.
ENBRIDGE INC.
CONSOLIDATED STATEMENTS OF CHANGES IN EQUITYCOMPREHENSIVE INCOME
|
| | | | | | |
| Year ended December 31, | 2017 |
| 2016 |
| 2015 |
|
(millions of Canadian dollars, except per share amounts)
| | | |
Preference shares (Note 20) | |
| |
| |
|
| Balance at beginning of year | 7,255 |
| 6,515 |
| 6,515 |
|
| Preference shares issued | 492 |
| 740 |
| — |
|
| Balance at end of year | 7,747 |
| 7,255 |
| 6,515 |
|
Common shares (Note 20) | | | |
| Balance at beginning of year | 10,492 |
| 7,391 |
| 6,669 |
|
| Common shares issued | 1,500 |
| 2,241 |
| — |
|
Common shares issued in Merger Transaction (Note 7) | 37,429 |
| — |
| — |
|
| Dividend Reinvestment and Share Purchase Plan | 1,226 |
| 795 |
| 646 |
|
| Shares issued on exercise of stock options | 90 |
| 65 |
| 76 |
|
| Balance at end of year | 50,737 |
| 10,492 |
| 7,391 |
|
| Additional paid-in capital | | | |
| Balance at beginning of year | 3,399 |
| 3,301 |
| 2,549 |
|
| Stock-based compensation | 82 |
| 41 |
| 35 |
|
Fair value of outstanding earned stock-based compensation from Merger Transaction (Note 7) | 77 |
| — |
| — |
|
| Options exercised | (95 | ) | (24 | ) | (19 | ) |
Enbridge Energy Company Inc. common control transaction
| 76 |
| — |
| — |
|
Drop down of interest to Enbridge Energy Partners, L.P. (Note 19) | — |
| — |
| 218 |
|
Dilution gain/(loss) and other (Note 19) | (345 | ) | 81 |
| 518 |
|
| Balance at end of year | 3,194 |
| 3,399 |
| 3,301 |
|
| Retained earnings/(deficit) | |
| |
| |
|
| Balance at beginning of year | (716 | ) | 142 |
| 1,571 |
|
| Earnings attributable to controlling interests | 2,859 |
| 2,069 |
| 251 |
|
| Preference share dividends | (330 | ) | (293 | ) | (288 | ) |
| Common share dividends declared | (4,702 | ) | (1,945 | ) | (1,596 | ) |
| Dividends paid to reciprocal shareholder | 30 |
| 26 |
| 22 |
|
Reversal of cumulative redemption value adjustment attributable to Enbridge Commercial Trust (Note 19) | — |
| — |
| 541 |
|
Redemption value adjustment attributable to redeemable noncontrolling interests (Note 19) | 292 |
| (686 | ) | (359 | ) |
| Adjustment for the recognition of unutilized tax deductions for stock based compensation expense | 41 |
| — |
| — |
|
| Adjustment relating to equity method investment | — |
| (29 | ) | — |
|
Other
| 58 |
| — |
| — |
|
| Balance at end of year | (2,468 | ) | (716 | ) | 142 |
|
Accumulated other comprehensive income/(loss) (Note 22) | | | |
| Balance at beginning of year | 1,058 |
| 1,632 |
| (435 | ) |
| Other comprehensive income/(loss) attributable to common shareholders, net of tax | (2,031 | ) | (574 | ) | 2,067 |
|
| Balance at end of year | (973 | ) | 1,058 |
| 1,632 |
|
| Reciprocal shareholding | | | |
Balance at beginning of year (Note 12) | (102 | ) | (83 | ) | (83 | ) |
| Issuance of treasury stock | — |
| (19 | ) | — |
|
Balance at end of year (Note 12) | (102 | ) | (102 | ) | (83 | ) |
| Total Enbridge Inc. shareholders’ equity | 58,135 |
| 21,386 |
| 18,898 |
|
Noncontrolling interests (Note 19) | |
| |
| |
|
| Balance at beginning of year | 577 |
| 1,300 |
| 2,015 |
|
| Earnings/(loss) attributable to noncontrolling interests | 232 |
| (28 | ) | (407 | ) |
| Other comprehensive income/(loss) attributable to noncontrolling interests, net of tax | | | |
| Change in unrealized gain on cash flow hedges | 15 |
| 4 |
| 161 |
|
| Foreign currency translation adjustments | (431 | ) | (44 | ) | 273 |
|
| Reclassification to earnings of (gain)/loss on cash flow hedges | 139 |
| 40 |
| (319 | ) |
| | (277 | ) | — |
| 115 |
|
| Comprehensive income/(loss) attributable to noncontrolling interests | (45 | ) | (28 | ) | (292 | ) |
Noncontrolling interests resulting from Merger Transaction (Note 7) | 8,955 |
| — |
| �� |
|
| Enbridge Energy Company, Inc. common control transaction | (343 | ) | — |
| — |
|
| Distributions | (839 | ) | (720 | ) | (680 | ) |
| Contributions | 832 |
| 28 |
| 615 |
|
| Deconsolidation of Sabal Trail Transmission, LLC | (2,318 | ) | — |
| — |
|
| Drop down of interest to Enbridge Energy Partners, L.P. | — |
| — |
| (304 | ) |
| Dilution gain/(loss) | 832 |
| — |
| (53 | ) |
Disposition of Olympic Pipeline
| (24 | ) | — |
| — |
|
| Other | (30 | ) | (3 | ) | (1 | ) |
| Balance at end of year | 7,597 |
| 577 |
| 1,300 |
|
| Total equity | 65,732 |
| 21,963 |
| 20,198 |
|
| Dividends paid per common share | 2.41 |
| 2.12 |
| 1.86 |
|
The accompanying notes are an integral part of these consolidated financial statements.
ENBRIDGE INC.
CONSOLIDATED STATEMENTS OF CASH FLOWS
|
| | | | | | |
| Year ended December 31, | 2017 |
| 2016 |
| 2015 |
|
| (millions of Canadian dollars) | | | |
| Operating activities | |
| |
| |
|
| Earnings/(loss) | 3,266 |
| 2,309 |
| (159 | ) |
| Adjustments to reconcile earnings/(loss) to net cash provided by operating activities: | | | |
| Depreciation and amortization | 3,163 |
| 2,240 |
| 2,024 |
|
| Deferred income tax expense | (2,877 | ) | 43 |
| 7 |
|
Changes in unrealized (gain)/loss on derivative instruments, net (Note 23) | (1,242 | ) | (509 | ) | 2,373 |
|
| Earnings from equity investments | (1,102 | ) | (656 | ) | (483 | ) |
| Distributions from equity investments | 1,264 |
| 827 |
| 727 |
|
| Impairment | 4,565 |
| 1,620 |
| 536 |
|
| (Gain)/loss on dispositions | (120 | ) | (848 | ) | (94 | ) |
Hedge ineffectiveness (Note 23) | (55 | ) | 61 |
| (20 | ) |
| Inventory revaluation allowance | 56 |
| 245 |
| 410 |
|
| Unrealized intercompany foreign exchange (gain)/loss | 28 |
| 43 |
| (131 | ) |
| Other | 50 |
| 198 |
| 69 |
|
| Changes in environmental liabilities, net of recoveries | (98 | ) | (4 | ) | (43 | ) |
Changes in operating assets and liabilities (Note 26) | (314 | ) | (358 | ) | (645 | ) |
| Net cash provided by operating activities | 6,584 |
| 5,211 |
| 4,571 |
|
| Investing activities | |
| |
| |
|
| Capital expenditures | (8,287 | ) | (5,128 | ) | (7,273 | ) |
| Joint venture financing | (25 | ) | (1 | ) | — |
|
| Long-term investments | (3,525 | ) | (467 | ) | (622 | ) |
| Distributions from equity investments in excess of cumulative earnings | 125 |
| — |
| — |
|
| Restricted long-term investments | (54 | ) | (46 | ) | (49 | ) |
| Additions to intangible assets | (789 | ) | (127 | ) | (101 | ) |
| Purchases of held-to-maturity securities | (529 | ) | — |
| — |
|
| Proceeds from sales and maturities of held-to-maturity securities | 584 |
| — |
| — |
|
| Purchase of available-for-sale securities | (136 | ) | — |
| — |
|
| Proceeds from sales and maturities of available-for-sale securities | 99 |
| — |
| — |
|
| Acquisitions | — |
| (644 | ) | (106 | ) |
Cash acquired in Merger Transaction (Note 7) | 682 |
| — |
| — |
|
| Proceeds from dispositions | 628 |
| 1,379 |
| 146 |
|
| Reimbursement of capital expenditures | 212 |
| — |
| — |
|
| Affiliate loans, net | (22 | ) | (118 | ) | 59 |
|
| Changes in restricted cash | 35 |
| (40 | ) | 13 |
|
| Net cash used in investing activities | (11,002 | ) | (5,192 | ) | (7,933 | ) |
| Financing activities | | | |
Net change in short-term borrowings (Note 2) | 721 |
| (248 | ) | (487 | ) |
| Net change in commercial paper and credit facility draws | (1,249 | ) | (2,297 | ) | 1,507 |
|
| Debenture and term note issues, net of issue costs | 9,483 |
| 4,080 |
| 3,767 |
|
| Debenture and term note repayments | (5,054 | ) | (1,946 | ) | (1,023 | ) |
| Purchase of interest in consolidated subsidiary | (227 | ) | — |
| — |
|
| Contributions from noncontrolling interests | 832 |
| 28 |
| 615 |
|
| Distributions to noncontrolling interests | (919 | ) | (720 | ) | (680 | ) |
| Contributions from redeemable noncontrolling interests | 1,178 |
| 591 |
| 670 |
|
| Distributions to redeemable noncontrolling interests | (247 | ) | (202 | ) | (114 | ) |
| Preference shares issued | 489 |
| 737 |
| — |
|
| Common shares issued | 1,549 |
| 2,260 |
| 57 |
|
| Preference share dividends | (330 | ) | (293 | ) | (288 | ) |
| Common share dividends | (2,750 | ) | (1,150 | ) | (950 | ) |
| Net cash provided by financing activities | 3,476 |
| 840 |
| 3,074 |
|
| Effect of translation of foreign denominated cash and cash equivalents | (72 | ) | (19 | ) | 143 |
|
| Net increase/(decrease) in cash and cash equivalents | (1,014 | ) | 840 |
| (145 | ) |
| Cash and cash equivalents at beginning of year | 1,494 |
| 654 |
| 799 |
|
| Cash and cash equivalents at end of year | 480 |
| 1,494 |
| 654 |
|
| Supplementary cash flow information | |
| |
| |
|
| Cash paid for income taxes | 172 |
| 194 |
| 80 |
|
| Cash paid for interest, net of amount capitalized | 2,668 |
| 1,820 |
| 1,835 |
|
| Property, plant and equipment non-cash accruals | 889 |
| 773 |
| 1,222 |
|
The accompanying notes are an integral part of these consolidated financial statements.
ENBRIDGE INC.
CONSOLIDATED STATEMENTS OF FINANCIAL POSITION
|
| | | | |
| December 31, | 2017 |
| 2016 |
|
| (millions of Canadian dollars; number of shares in millions) | | |
| Assets | |
| |
|
| Current assets | |
| |
|
Cash and cash equivalents (Note 2) | 480 |
| 1,494 |
|
| Restricted cash | 107 |
| 68 |
|
Accounts receivable and other (Note 8) | 7,053 |
| 4,978 |
|
| Accounts receivable from affiliates | 47 |
| 14 |
|
Inventory (Note 9) | 1,528 |
| 1,233 |
|
| | 9,215 |
| 7,787 |
|
Property, plant and equipment, net (Note 10) | 90,711 |
| 64,284 |
|
Long-term investments (Note 12) | 16,644 |
| 6,836 |
|
Restricted long-term investments (Note 13) | 267 |
| 90 |
|
Deferred amounts and other assets | 6,442 |
| 3,391 |
|
Intangible assets, net (Note 14) | 3,267 |
| 1,573 |
|
Goodwill (Note 15) | 34,457 |
| 78 |
|
Deferred income taxes (Note 24) | 1,090 |
| 1,170 |
|
| Total assets | 162,093 |
| 85,209 |
|
| | | |
| Liabilities and equity | |
| |
|
| Current liabilities | |
| |
|
Short-term borrowings (Note 17) | 1,444 |
| 351 |
|
Accounts payable and other (Note 16) | 9,478 |
| 7,295 |
|
| Accounts payable to affiliates | 157 |
| 122 |
|
| Interest payable | 634 |
| 333 |
|
| Environmental liabilities | 40 |
| 142 |
|
Current portion of long-term debt (Note 17) | 2,871 |
| 4,100 |
|
| | 14,624 |
| 12,343 |
|
Long-term debt (Note 17) | 60,865 |
| 36,494 |
|
| Other long-term liabilities | 7,510 |
| 4,981 |
|
Deferred income taxes (Note 24) | 9,295 |
| 6,036 |
|
| | 92,294 |
| 59,854 |
|
Commitments and contingencies (Note 28) |
|
|
|
|
Redeemable noncontrolling interests (Note 19) | 4,067 |
| 3,392 |
|
| Equity | | |
Share capital (Note 20) | | |
| Preference shares | 7,747 |
| 7,255 |
|
Common shares (1,695 and 943 outstanding at December 31, 2017 and | | |
| December 31, 2016, respectively) | 50,737 |
| 10,492 |
|
| Additional paid-in capital | 3,194 |
| 3,399 |
|
| Deficit | (2,468 | ) | (716 | ) |
Accumulated other comprehensive income/(loss) (Note 22) | (973 | ) | 1,058 |
|
| Reciprocal shareholding | (102 | ) | (102 | ) |
| Total Enbridge Inc. shareholders’ equity | 58,135 |
| 21,386 |
|
Noncontrolling interests (Note 19) | 7,597 |
| 577 |
|
| | 65,732 |
| 21,963 |
|
| Total liabilities and equity | 162,093 |
| 85,209 |
|
Variable Interest Entities (Note 11) | | | | | | | | | | | |
| Year ended December 31, | 2023 | 2022 | 2021 |
| (millions of Canadian dollars) | | | |
| Earnings | 6,058 | | 2,938 | | 6,314 | |
| Other comprehensive income/(loss), net of tax | | | |
| Change in unrealized gain on cash flow hedges | 220 | | 847 | | 162 | |
| Change in unrealized gain/(loss) on net investment hedges | 409 | | (971) | | 49 | |
| Other comprehensive income/(loss) from equity investees | 6 | | (6) | | (12) | |
| Excluded components of fair value hedges | 12 | | (35) | | (5) | |
| Reclassification to earnings of loss on cash flow hedges | 14 | | 143 | | 235 | |
| Reclassification to earnings of pension and other postretirement benefits (OPEB) amounts | (18) | | (10) | | 21 | |
| Reclassification to earnings of (gain)/loss on equity investees | — | | 16 | | (62) | |
| Actuarial gain/(loss) on pension and OPEB | (130) | | 312 | | 394 | |
| Foreign currency translation adjustments | (1,728) | | 4,406 | | (507) | |
| Other comprehensive income/(loss), net of tax | (1,215) | | 4,702 | | 275 | |
| Comprehensive income | 4,843 | | 7,640 | | 6,589 | |
| Comprehensive (income)/loss attributable to noncontrolling interests | 131 | | (21) | | (95) | |
| Comprehensive income attributable to controlling interests | 4,974 | | 7,619 | | 6,494 | |
| Preference share dividends | (352) | | (414) | | (373) | |
| Comprehensive income attributable to common shareholders | 4,622 | | 7,205 | | 6,121 | |
The accompanying notes are an integral part of these consolidated financial statements.
ENBRIDGE INC.
CONSOLIDATED STATEMENTS OF CHANGES IN EQUITY
| | | | | | | | | | | |
| Year ended December 31, | 2023 | 2022 | 2021 |
| (millions of Canadian dollars, except per share amounts) | | | |
Preference shares (Note 20) | | | |
| Balance at beginning of year | 6,818 | | 7,747 | | 7,747 | |
| Redemption of preference shares | — | | (929) | | — | |
| Balance at end of year | 6,818 | | 6,818 | | 7,747 | |
Common shares (Note 20) | | | |
| Balance at beginning of year | 64,760 | | 64,799 | | 64,768 | |
| Shares issued, net of issue costs | 4,485 | | — | | — | |
| Shares issued on exercise of stock options | 3 | | 53 | | 31 | |
| Shares issued on vesting of restricted stock units (RSU), net of tax | 12 | | — | | — | |
| Share purchases at stated value | (80) | | (88) | | — | |
| Other | — | | (4) | | — | |
| Balance at end of year | 69,180 | | 64,760 | | 64,799 | |
| Additional paid-in capital | | | |
| Balance at beginning of year | 275 | | 365 | | 277 | |
| Stock-based compensation | 71 | | 36 | | 28 | |
| Stock options exercised | (3) | | (50) | | (23) | |
| Vested RSUs | (20) | | — | | — | |
| Purchase of noncontrolling interest | (28) | | (43) | | — | |
| Change in reciprocal interest | — | | — | | 98 | |
| Other | (27) | | (33) | | (15) | |
| Balance at end of year | 268 | | 275 | | 365 | |
| Deficit | | | |
| Balance at beginning of year | (15,486) | | (10,989) | | (9,995) | |
| Earnings attributable to controlling interests | 6,191 | | 3,003 | | 6,189 | |
| Preference share dividends | (352) | | (414) | | (373) | |
| Common share dividends declared | (7,423) | | (7,023) | | (6,818) | |
| Dividends paid to reciprocal shareholder | — | | — | | 8 | |
| Share purchases in excess of stated value | (45) | | (63) | | — | |
| | | |
| Balance at end of year | (17,115) | | (15,486) | | (10,989) | |
Accumulated other comprehensive income/(loss) (Note 22) | | | |
| Balance at beginning of year | 3,520 | | (1,096) | | (1,401) | |
| Other comprehensive income/(loss) attributable to common shareholders, net of tax | (1,217) | | 4,616 | | 305 | |
| | | |
| Balance at end of year | 2,303 | | 3,520 | | (1,096) | |
| Reciprocal shareholding | | | |
| Balance at beginning of year | — | | — | | (29) | |
| Change in reciprocal interest | — | | — | | 29 | |
| Balance at end of year | — | | — | | — | |
| Total Enbridge Inc. shareholders' equity | 61,454 | | 59,887 | | 60,826 | |
Noncontrolling interests (Note 19) | | | |
| Balance at beginning of year | 3,511 | | 2,542 | | 2,996 | |
| Earnings/(loss) attributable to noncontrolling interests | (133) | | (65) | | 125 | |
| Other comprehensive income/(loss) attributable to noncontrolling interests, net of tax | | | |
| Change in unrealized gain/(loss) on cash flow hedges | 35 | | (28) | | (15) | |
| Foreign currency translation adjustments | (33) | | 114 | | (15) | |
| | 2 | | 86 | | (30) | |
| Comprehensive income/(loss) attributable to noncontrolling interests | (131) | | 21 | | 95 | |
| Distributions | (363) | | (259) | | (271) | |
| Contributions | 11 | | 1,105 | | 15 | |
| Redemption of noncontrolling interests | — | | — | | (293) | |
| Purchase of noncontrolling interests | 2 | | 55 | | — | |
| Other | (1) | | 47 | | — | |
| Balance at end of year | 3,029 | | 3,511 | | 2,542 | |
| Total equity | 64,483 | | 63,398 | | 63,368 | |
| Dividends paid per common share | 3.55 | | 3.44 | | 3.34 | |
The accompanying notes are an integral part of these consolidated financial statements.
ENBRIDGE INC.
CONSOLIDATED STATEMENTS OF CASH FLOWS
| | | | | | | | | | | |
| Year ended December 31, | 2023 | 2022 | 2021 |
| (millions of Canadian dollars) | | | |
| Operating activities | | | |
| Earnings | 6,058 | | 2,938 | | 6,314 | |
| Adjustments to reconcile earnings to net cash provided by operating activities: | | | |
| Depreciation and amortization | 4,613 | | 4,317 | | 3,852 | |
Deferred income tax expense (Note 24) | 1,420 | | 957 | | 1,091 | |
Unrealized derivative fair value (gain)/loss, net (Note 23) | (1,180) | | 1,280 | | (173) | |
Income from equity investments (Note 13) | (1,816) | | (2,056) | | (1,600) | |
| Distributions from equity investments | 1,998 | | 1,827 | | 1,630 | |
| Impairment of long-lived assets | 419 | | 541 | | — | |
| | | |
Impairment of goodwill (Note 15) | — | | 2,465 | | — | |
Gain on joint venture merger transaction (Note 13) | — | | (1,076) | | — | |
(Gain)/loss on dispositions (Note 27) | (15) | | 12 | | (319) | |
| Other | 393 | | 37 | | (73) | |
Changes in operating assets and liabilities (Note 28) | 2,311 | | (12) | | (1,466) | |
| Net cash provided by operating activities | 14,201 | | 11,230 | | 9,256 | |
| Investing activities | | | |
| Capital expenditures | (4,654) | | (4,647) | | (7,818) | |
| Long-term, restricted and other investments | (1,276) | | (1,041) | | (640) | |
| Distributions from equity investments in excess of cumulative earnings | 1,151 | | 763 | | 533 | |
| Additions to intangible assets | (222) | | (174) | | (275) | |
| Acquisitions | (954) | | (828) | | (3,785) | |
Proceeds from joint venture merger transaction (Note 13) | — | | 522 | | — | |
| Proceeds from dispositions | — | | — | | 1,263 | |
| Net change in affiliate loans | (27) | | 135 | | 65 | |
| Other | (61) | | — | | — | |
| Net cash used in investing activities | (6,043) | | (5,270) | | (10,657) | |
| Financing activities | | | |
| Net change in short-term borrowings | (1,596) | | 481 | | 394 | |
| Net change in commercial paper and credit facility draws | (8,157) | | (1,333) | | 2,960 | |
| Debenture and term note issues, net of issue costs | 15,377 | | 7,547 | | 8,032 | |
| Debenture and term note repayments | (4,819) | | (4,198) | | (2,264) | |
Sale of noncontrolling interest in subsidiary (Note 8) | — | | 1,092 | | — | |
| | | |
| Contributions from noncontrolling interests | 11 | | 13 | | 15 | |
| Distributions to noncontrolling interests | (363) | | (259) | | (271) | |
| | | |
| Common shares issued, net of issue costs | 4,450 | | 3 | | 5 | |
| Common shares repurchased | (125) | | (151) | | — | |
| Preference share dividends | (352) | | (338) | | (367) | |
| Common share dividends | (7,276) | | (6,968) | | (6,766) | |
| Redemption of preference shares | — | | (1,003) | | — | |
| Redemption of preferred shares held by subsidiary | — | | — | | (415) | |
| Net change in affiliate loan | 71 | | — | | — | |
| Other | (85) | | (314) | | (87) | |
| Net cash provided by/(used in) financing activities | (2,864) | | (5,428) | | 1,236 | |
| Effect of translation of foreign denominated cash and cash equivalents and restricted cash | (216) | | 55 | | (5) | |
| Net change in cash and cash equivalents and restricted cash | 5,078 | | 587 | | (170) | |
| Cash and cash equivalents and restricted cash at beginning of year | 907 | | 320 | | 490 | |
| Cash and cash equivalents and restricted cash at end of year | 5,985 | | 907 | | 320 | |
| Supplementary cash flow information | | | |
| Cash paid for income taxes | 578 | | 495 | | 489 | |
| Cash paid for interest, net of amount capitalized | 3,380 | | 2,920 | | 2,427 | |
| Property, plant and equipment and intangible assets non-cash accruals | 813 | | 937 | | 831 | |
The accompanying notes are an integral part of these consolidated financial statements.
ENBRIDGE INC.
CONSOLIDATED STATEMENTS OF FINANCIAL POSITION
| | | | | | | | |
| December 31, | 2023 | 2022 |
| (millions of Canadian dollars; number of shares in millions) | | |
| Assets | | |
| Current assets | | |
| Cash and cash equivalents | 5,901 | | 861 | |
| Restricted cash | 84 | | 46 | |
| Trade receivables and unbilled revenues | 4,410 | | 5,616 | |
Other current assets (Note 9) | 2,440 | | 3,255 | |
| Accounts receivable from affiliates | 85 | | 114 | |
Inventory (Note 10) | 1,479 | | 2,255 | |
| 14,399 | | 12,147 | |
Property, plant and equipment, net (Note 11) | 104,641 | | 104,460 | |
Long-term investments (Note 13) | 16,793 | | 15,936 | |
Restricted long-term investments (Note 23) | 717 | | 593 | |
| Deferred amounts and other assets | 8,041 | | 9,542 | |
Intangible assets, net (Note 14) | 3,537 | | 4,018 | |
Goodwill (Note 15) | 31,848 | | 32,440 | |
Deferred income taxes (Note 24) | 341 | | 472 | |
| Total assets | 180,317 | | 179,608 | |
| | |
| Liabilities and equity | | |
| Current liabilities | | |
Short-term borrowings (Note 17) | 400 | | 1,996 | |
| Trade payables and accrued liabilities | 4,308 | | 6,172 | |
Other current liabilities (Note 16) | 5,659 | | 5,220 | |
| Accounts payable to affiliates | 26 | | 105 | |
| Interest payable | 958 | | 763 | |
Current portion of long-term debt (Note 17) | 6,084 | | 6,045 | |
| 17,435 | | 20,301 | |
Long-term debt (Note 17) | 74,715 | | 72,939 | |
| Other long-term liabilities | 8,653 | | 9,189 | |
Deferred income taxes (Note 24) | 15,031 | | 13,781 | |
| 115,834 | | 116,210 | |
Commitments and contingencies (Note 30) | | |
| | |
| Equity | | |
Share capital (Note 20) | | |
| Preference shares | 6,818 | | 6,818 | |
Common shares (2,125 and 2,025 outstanding at December 31, 2023 and 2022, respectively) | 69,180 | | 64,760 | |
| Additional paid-in capital | 268 | | 275 | |
| Deficit | (17,115) | | (15,486) | |
Accumulated other comprehensive income (Note 22) | 2,303 | | 3,520 | |
| | |
| Total Enbridge Inc. shareholders’ equity | 61,454 | | 59,887 | |
Noncontrolling interests (Note 19) | 3,029 | | 3,511 | |
| 64,483 | | 63,398 | |
| Total liabilities and equity | 180,317 | | 179,608 | |
Variable Interest Entities (VIEs) (Note 12)
The accompanying notes are an integral part of these consolidated financial statements.
NOTES TO THE CONSOLIDATED FINANCIAL STATEMENTS
INDEX
| | | | | | | | |
| | | PAGE |
| 1. | Business Overview | |
| 2. | Significant Accounting Policies | |
| 3. | Changes in Accounting Policies | |
| 4. | Revenue | |
| 5. | Segmented Information | |
| 6. | Earnings per Common Share | |
| 7. | Regulatory Matters | |
| 8. | Acquisitions and Dispositions | |
| 9. | Other Current Assets | |
| 10. | Inventory | |
| 11. | Property, Plant and Equipment | |
| 12. | Variable Interest Entities | |
| 13. | Long-Term Investments | |
| 14. | Intangible Assets | |
| 15. | Goodwill | |
| 16. | Other Current Liabilities | |
| 17. | Debt | |
| 18. | Asset Retirement Obligations | |
| 19. | Noncontrolling Interests | |
| 20. | Share Capital | |
| 21. | Stock Option and Stock Unit Plans | |
| 22. | Components of Accumulated Other Comprehensive Income/(Loss) | |
| 23. | Risk Management and Financial Instruments | |
| 24. | Income Taxes | |
| 25. | Pension and Other Postretirement Benefits | |
| 26. | Leases | |
| 27. | Other Income/(Expense) | |
| 28. | Changes in Operating Assets and Liabilities | |
| 29. | Related Party Transactions | |
| 30. | Commitments and Contingencies | |
| 31. | Guarantees | |
| 32. | Quarterly Financial Data (Unaudited) | |
| 33. | Subsequent Event | |
|
| | | |
| | | Page |
| 1. |
| Business Overview | |
| 2. |
| Significant Accounting Policies | |
| 3. |
| Changes in Accounting Policies | |
| 4. |
| Segmented Information | |
| 5. |
| Earnings per Common Share | |
| 6. |
| Regulatory Matters | |
| 7. |
| Acquisitions and Dispositions | |
| 8. |
| Accounts Receivable and Other | |
| 9. |
| Inventory | |
| 10. |
| Property, Plant and Equipment | |
| 11. |
| Variable Interest Entities | |
| 12. |
| Long-Term Investments | |
| 13. |
| Restricted Long-Term Investments | |
| 14. |
| Intangible Assets | |
| 15. |
| Goodwill | |
| 16. |
| Accounts Payable and Other | |
| 17. |
| Debt | |
| 18. |
| Asset Retirement Obligations | |
| 19. |
| Noncontrolling Interests | |
| 20. |
| Share Capital | |
| 21. |
| Stock Option and Stock Unit Plans | |
| 22. |
| Components of Accumulated Other Comprehensive Income/(Loss) | |
| 23. |
| Risk Management and Financial Instruments | |
| 24. |
| Income Taxes | |
| 25. |
| Pension and Other Postretirement Benefits | |
| 26. |
| Changes in Operating Assets and Liabilities | |
| 27. |
| Related Party Transactions | |
| 28. |
| Commitments and Contingencies | |
| 29. |
| Guarantees | |
| 30. |
| Subsequent Events | |
| 31. |
| Quarterly Financial Data | |
1. BUSINESS OVERVIEW
The terms “we,” “our,” “us”"we", "our", "us" and “Enbridge”"Enbridge" as used in this report refer collectively to Enbridge Inc. and its subsidiaries unless the context suggests otherwise. These terms are used for convenience only and are not intended as a precise description of any separate legal entity within Enbridge Inc.Enbridge.
Enbridge is a publicly traded energy transportation and distribution company. We conduct our business through five business segments: Liquids Pipelines;Pipelines, Gas Transmission and Midstream;Midstream, Gas Distribution; GreenDistribution and Storage, Renewable Power and Transmission;Generation, and Energy Services. These reporting segments are strategic business units established by senior management to facilitate the achievement of our long-term objectives, to aid in resource allocation decisions and to assess operational performance.
LIQUIDS PIPELINES
Liquids Pipelines consists of common carrier and contract pipelines that transport crude oil, natural gas liquids (NGL) and refined products and terminals in Canada and the United States (US) that transport and export various grades of crude oil and other liquid hydrocarbons, including Canadianthe Mainline Lakehead Pipeline System, (Lakehead System), Regional Oil Sands System, Gulf Coast and Mid-Continent, and Other. On October 12, 2021, we acquired Moda Midstream Operating, LLC (Moda) (Note 8), which includes the Enbridge Ingleside Energy Center, and is a component of Gulf Coast Southern Lights Pipeline, Express-Platte System, Bakken System, and Feeder Pipelines and Other.Mid-Continent.
GAS TRANSMISSION AND MIDSTREAM
Gas Transmission and Midstream formerly referred to as Gas Pipelines and Processing, consists of our investments in natural gas pipelines and gathering and processing facilities. Investmentsfacilities in natural gas pipelines include our interests inCanada and the US, including US Gas Transmission, Canadian Gas Transmission, and Midstream, Alliance Pipeline, US Midstream, and Other. InvestmentsThis segment also includes certain investments in renewable natural gas processing include our interest in Aux Sable, a natural gas extraction and fractionation business located near the terminus of the Alliance Pipeline; Canadian Gas Transmission and Midstream assets located in northeast British Columbia and northwest Alberta; and DCP Midstream, LLC (DCP Midstream) assets located primarily in Texas and Oklahoma.(RNG) facilities.
GAS DISTRIBUTION AND STORAGE
Gas Distribution and Storage consists of our natural gas utility operations, the core of which areis Enbridge Gas Distribution Inc. (EGD) and Union Gas Limited (Union(Enbridge Gas), which serves residential, commercial and industrial customers primarily located inthroughout Ontario. This business segment also includes natural gas distribution activities in Québec. We sold our investment in Noverco Inc. (Noverco) and Other, previously reported in the Gas Distribution and Storage.Storage segment, to Trencap L.P. on December 30, 2021 (Note 13).
GREENRENEWABLE POWER AND TRANSMISSIONGENERATION
GreenRenewable Power and TransmissionGeneration consists primarily of our investments in renewable energywind and solar assets, and transmission facilities. Renewable energy assets consist of wind, solar,as well as geothermal, and waste heat recovery, facilities and transmission assets. In North America, assets are primarily located in Canada primarily in the provinces of Alberta, Ontario and QuebecQuébec, and in the United States primarily instates of Colorado, Texas, Indiana, Ohio and West Virginia. We also have assetshold interests in offshore wind facilities in operation, under construction and in active development located in Europe.the United Kingdom, France and Germany. This segment also includes Tri Global Energy, LLC (TGE) which was acquired on September 27, 2022 (Note 8).
ENERGY SERVICES
TheOur Energy Services businesses in Canada and the United StatesUS undertake physical commodity marketing activity and logistical services oversee refinery supply services andto manage our volume commitments on various pipeline systems. This segment also provides energy marketing services to North American refiners, producers and other customers.
ELIMINATIONS AND OTHER
In addition to the segments noteddescribed above, Eliminations and Other includes operating and administrative costs and foreign exchange costs whichthat are not allocated to business segments. Also included insegments, the impact of foreign exchange hedge settlements and the activities of our wholly-owned captive insurance subsidiaries. The principal activity of our captive insurance subsidiaries is providing insurance and reinsurance coverage for certain insurable property and casualty risk exposures of our operating subsidiaries and certain equity investments. Eliminations and Other arealso includes new business development activities generaland corporate investments and elimination of transactions between segments required to present financial performance and financial position on a consolidated basis.investments.
ACQUISITION OF SPECTRA ENERGY CORP
On February 27, 2017, Enbridge and Spectra Energy Corp (Spectra Energy) combined in a stock-for-stock merger transaction (the Merger Transaction) for a purchase price of $37.5 billion. Under the terms of the Merger Transaction, Spectra Energy shareholders received 0.984 shares of Enbridge for each share of Spectra Energy common stock that they owned, giving us 100% ownership of Spectra Energy. Please refer to Note 7 - Acquisitions and Dispositions for further discussion of the transaction.
CANADIAN RESTRUCTURING PLAN
Effective September 1, 2015, under an agreement with Enbridge Income Fund (the Fund) and Enbridge Income Fund Holdings Inc. (ENF), Enbridge transferred its Canadian Liquids Pipelines business, held by Enbridge Pipelines Inc. (EPI) and Enbridge Pipelines (Athabasca) Inc. (EPAI), and certain Canadian renewable energy assets to the Fund Group (comprising the Fund, Enbridge Commercial Trust (ECT), Enbridge Income Partners LP (EIPLP) and the subsidiaries of EIPLP) for consideration valued at $30.4 billion plus incentive distribution and performance rights (the Canadian Restructuring Plan). The consideration that we received included $18.7 billion of units in the Fund Group, comprised of $3 billion of Fund units and $15.7 billion of equity units of EIPLP, in which the Fund has an interest. The Fund Group also assumed debt of EPI and EPAI of approximately $11.7 billion.
2. SIGNIFICANT ACCOUNTING POLICIES
These consolidated financial statements are prepared in accordance with accounting principles generally accepted accounting principles in the United States of America (U.S.(US GAAP). Amounts are stated in Canadian dollars unless otherwise noted. As a Securities and Exchange Commission (SEC) registrant, we are permitted to use U.S.US GAAP for the purposes of meeting both our Canadian and United StatesUS continuous disclosure requirements.
BASIS OF PRESENTATION AND USE OF ESTIMATES
The preparation of financial statements in conformity with U.S.US GAAP requires management to make estimates and assumptions that affect the reported amounts of assets, liabilities, revenues and expenses, as well as the disclosure of contingent assets and liabilities in the consolidated financial statements. Significant estimates and assumptions used in the preparation of the consolidated financial statements include, but are not limited to: variable consideration included in revenue(Note 4);carrying values of regulatory assets and liabilities(Note 6)7); purchase price allocations (Note 7)8); unbilled revenues; expected credit losses; depreciation rates and carrying value of property, plant and equipment(Note 10)11); amortization rates and carrying value of intangible assets(Note 14); measurement of goodwill(Note 15); fair value of asset retirement obligations (ARO)(Note 18); valuation of stock-based compensation(Note 21); fair value of financial instruments(Note 23); provisions for income taxes(Note 24); assumptions used to measure retirement benefits and other postretirement benefit obligations (OPEB)OPEB (Note 25); commitments and contingencies(Note 28)30);and estimates of losses related to environmental remediation obligations(Note 28)30). Actual results could differ from these estimates.
Effective September 30, 2017, we combined Cash and cash equivalents and amounts previously presented as Bank indebtedness where the corresponding bank accounts are subject to cash pooling arrangements. As at December 31, 2017, $0.6 billion (December 31, 2016 - $0.6 billion) of Bank indebtedness has been combined within Cash and cash equivalentsCertain comparative figures in our Consolidated Statements of Financial Position. Net cash provided by financing activities inconsolidated financial statements have been reclassified to conform to the Consolidated Statements of Cash Flows for the years ended December 31, 2016 and 2015 have decreased by $0.3 billion and increased by $0.1 billion, respectively, to reflect this change.current year's presentation.
PRINCIPLES OF CONSOLIDATION
The consolidated financial statements include our accounts and the accounts of our subsidiaries and variable interest entities (VIEs)VIEs for which we are the primary beneficiary. A VIE is a legal entity that does not have sufficient equity at risk to finance its activities without additional subordinated financial support or is structured such that equity investors lack the ability to make significant decisions relating to the entity’s
entity's operations through voting rights or do not substantively participate in the gains and losses of the entity. Upon inception of a contractual agreement, we perform an assessment to determine whether the arrangement contains a variable interest in a legal entity and whether that legal entity is a VIE. The primary beneficiary has both the power to direct the activities of the VIE that most significantly impact the entity’sentity's economic performance and the obligation to absorb losses, or the right to receive benefits from, the VIE entity that could potentially be significant to the VIE. Where we conclude that we are the primary beneficiary of a VIE, we will consolidate the accounts of that VIE. We assess all variable interests in the entity and use our judgment when determining if we are the primary beneficiary. Other qualitative factors that are considered include decision-making responsibilities, the VIE capital structure, risk and rewards sharing, contractual agreements with the VIE, voting rights and level of involvement of other parties. We assess the primary beneficiary determination for a VIE on an ongoing basis asif there are changes in the facts and circumstances related to a VIE. If an entity is determined to not be a VIE, the voting interest entity model is applied, where an investor holding the majority voting rights consolidates the entity. The consolidated financial statements also include the accounts of any limited partnerships where we represent the general partner and, based on all facts and circumstances, control such limited partnerships, unless the limited partner has substantive participating rights or substantive kick-out rights. For certain investments where we retain an undivided interest in assets and liabilities, we record our proportionate share of assets, liabilities, revenues and expenses. If an entity is determined to not be a VIE, the voting interest entity model will be applied.
All significant intercompany accounts and transactions are eliminated upon consolidation. Ownership interests in subsidiaries represented by other parties that do not control the entity are presented in the consolidated financial statements as activities and balances attributable to noncontrolling interests and redeemable noncontrolling interests. Investments and entities over which we exercise significant influence are accounted for using the equity method.
As a result of the Canadian Restructuring Plan, ECT, our subsidiary, determines its equity investment earnings from EIPLP using the Hypothetical Liquidation at Book Value (HLBV) method. ECT applies the HLBV method to its equity method investments where cash distributions, including both preference and residual distributions, are not based on the investor’s ownership percentages. Under the HLBV method, a calculation is prepared at each balance sheet date to determine the amount that ECT would receive if EIPLP were to liquidate all of its assets, as valued in accordance with U.S. GAAP, and distribute that cash to the investors. The difference between the calculated liquidation distribution amounts at the beginning and the end of the reporting period, after adjusting for capital contributions and distributions, is ECT’s share of the earnings or losses from the equity investment for the period.
While ECT and EIPLP are both consolidated in these financial statements, the use of the HLBV method by ECT impacts the earnings attributable to redeemable noncontrolling interests reported on Enbridge’s Consolidated Statements of Earnings. We continue to recognize Redeemable noncontrolling interests on the Consolidated Statements of Financial Position at the maximum redemption value of the trust units held by third parties, which references the market price of ENF common shares.
REGULATION
Certain parts of our businesses are subject to regulation by various authorities including, but not limited to, the NationalCanada Energy Board (NEB)Regulator (CER), the Federal Energy Regulatory Commission (FERC), the Alberta Energy Regulator, the New BrunswickBC Energy and Utilities Board (EUB),Regulator, the Ontario Energy Board (OEB) and Lathe Québec Régie de l’Energie du Québec.l’énergie. Regulatory bodies exercise statutory authority over matters such as construction, rates and ratemaking, and agreements with customers. To recognize the economic effects of the actions of the regulator, the timing of recognition of certain revenues and expenses in these operations may differ from that otherwise expected underU.S. US GAAP for non rate-regulatednon-rate-regulated entities.
Regulatory assets represent amounts that are expected to be recovered from customers in future periods through rates. Regulatory liabilities represent amounts that are expected to be refunded to customers in future periods through rates, amounts collected from customers in advance of costs being incurred, or expected to be paid to cover future abandonment costs in relation to the NEB’sCER's Land Matters Consultation Initiative (LMCI). Long-term and for future removal and site restoration costs as approved by the regulator. If there are changes in our assessment of the probability of recovery for a regulatory assets are recordedasset, we reduce its carrying amount to the balance that we expect to recover from customers in Deferred amounts and other assets and currentfuture periods through rates. If a regulator later excludes from allowable costs all or a part of costs that were capitalized as a regulatory assets are recorded in Accounts receivable and other.
Long-term regulatory liabilities are included in Other long-term liabilities and current regulatory liabilities are recorded in Accounts payable and other. Regulatory assets are assessed for impairment ifasset, we identify an event indicativereduce the carrying amount of possible impairment.the asset by the excluded amounts. The recognition of regulatory assets and liabilities is based on the actions, or expected future actions, of the regulator. To the extent that the regulator’sregulator's actions differ from our expectations, the timing and amount of recovery or settlement of regulatory balances could differ significantly from those recorded. In the absence of rate regulation, we would generally not recognize regulatory assets or liabilities and the earnings impact would be recorded in the period the expenses are incurred or revenues are earned. A regulatory asset or liability is recognized in respect of deferred income taxes when it is expected the amounts will be recovered or settled through future regulator-approved rates.
AllowanceDuring the fourth quarter of 2023, Southern Lights Pipeline completed an open season to negotiate new transportation service agreements. We do not expect to renew the agreements under a cost-of-service toll methodology, therefore Southern Lights Pipeline is no longer subject to rate-regulated accounting. As a result, the related regulatory liabilities, regulatory tax assets and associated regulatory deferred tax liabilities were derecognized. We believe that the recovery of our remaining regulatory assets as at December 31, 2023 is probable over the periods described in Note 7 - Regulatory Matters.
Effective January 1, 2015, we began collecting and setting aside funds to cover future pipeline abandonment costs for all CER-regulated pipelines as a result of the regulatory requirements under the LMCI. The funds collected are held in trusts in accordance with the CER decision. The funds collected from shippers are reported within Transportation and other services revenues in the Consolidated Statements of Earnings and Restricted long-term investments in the Consolidated Statements of Financial Position. Concurrently, we reflect the future abandonment cost as an increase to Operating and administrative expense in the Consolidated Statements of Earnings and Other long-term liabilities in the Consolidated Statements of Financial Position.
An allowance for funds used during construction (AFUDC) is included in the cost of property, plant and equipment and is depreciated over future periods as part of the total cost of the related asset. AFUDC includes both an interest component and, if approved by the regulator, a cost of equity component, which are both capitalized based on rates set out in a regulatory agreement. The corresponding impact on earnings is included in Interest expense for the interest component and Other income/(expense) for the equity component. In the absence of rate regulation, we would capitalize interest using a capitalization rate based on itsour cost of borrowing, whereas the capitalized equity component, the corresponding earnings during the construction phase and the subsequent depreciation relating to the equity component would not be recognized. The equity component of AFUDC is included as a non-cash reconciling item to earnings within Cash Flows from Operating Activities in the Consolidated Statements of Cash Flows.
Under the pool method prescribed by certain regulated operationsregulators, it is not possible to which U.S. GAAP guidance for phase-in plans applies, negotiated depreciation rates recoveredidentify the carrying value of the equity component of AFUDC or its effect on depreciation. Similarly, gains and losses on the retirement of certain specific fixed assets in transportation tolls mayany given year cannot be less than the depreciation expense calculated in accordance with U.S. GAAP in early years of long-term contracts but recovered in future periods when tolls exceed depreciation. Depreciation expense on such assets is recorded in accordance with U.S. GAAP and no deferred regulatory asset is recorded(Note 6).identified or quantified.
With the approval of the applicable regulator, EGD, Union Gas andregulators, certain distribution operations capitalize a percentage of specified operating costs. These operations are authorized to charge depreciation and earn a return on the net book value of such capitalized costs in future years. To the extent that the regulator’s actions differ from our expectations, the timing and amount of recovery or settlement of capitalized costs could differ significantly from those recorded. In the absence of rate regulation, a portion of such operating costs maywould be charged to current period earnings.earnings in the year incurred.
For certain regulated operations to which US GAAP guidance for phase-in plans applies, negotiated depreciation rates recovered in transportation tolls may be less than the depreciation expense calculated in accordance with US GAAP in early years of long-term contracts but recovered in future periods when tolls exceed depreciation. Depreciation expense on such assets is recorded in accordance with US GAAP and no regulatory asset is recorded.
REVENUE RECOGNITION
For businesses that are not rate-regulated, revenues are recorded when products have been delivered or services have been performed, the amount of revenue can be reliably measured and collectability is reasonably assured. Customer credit worthinesscreditworthiness is assessed prior to agreement signing as well asand throughout the contract duration. Certain revenues from our liquids and natural gas pipeline businesses are recognized under the terms of committed delivery contracts, rather than the cash tolls received.
Long-term take-or-pay contracts, under which shippers are obligated to pay fixed amounts rateablyratably over the contract period regardless of volumes shipped, may contain make-up rights. Make-up rights are earned by shippers when minimum volume commitments are not utilized during the period but under certain circumstances can be used to offset overages in future periods, subject to expiry periods.expiry. We recognize revenues associated with make-up rights at the earlier of when the make-up volume is shipped, the make-up right expires, or when it is determined that the likelihood that the shipper will utilize the make-up right is remote. We also have long-term contracts where the revenue profile does not align with the cash receipt schedule, resulting in the recognition of deferred revenue.
Certain offshore pipeline transportation contracts require Enbridgeus to provide transportation services for the life of the underlying producing fields. Under these arrangements, shippers pay Enbridgeus a fixed monthly toll for a defined period of time which may be shorter than the estimated reserve life of the underlying producing fields, resulting in a contract period which extends past the period of cash collection. Fixed monthly toll revenues are recognized ratably over the committed volume made available to shippers throughout the contract period, regardless of when cash is received.
For the years ended December 31, 2017, 20162023, 2022 and 2015,2021, cash received net of revenue recognized for contracts under make-
upmake-up rights and similar deferred revenue arrangements was $196$210 million, $249$238 million and $61$127 million, respectively.
For rate-regulated businesses, revenues are recognized in a manner that is consistent with the underlying agreements as approved by the regulators. Natural gas utilitiesutility revenues are recorded based on the basis of regular meter readings and estimates of customer usage from the last meter reading to the end of the reporting period. Estimates are based on historical consumption patterns and heating degree days experienced. Heating degree days is a measure of coldness that is indicative of volumetric requirements for natural gas utilized for heating purposes in our distribution franchise area. Since July 1, 2011, Canadian Mainline (excluding Lines 8areas.
Our Energy Services segment enters into commodity purchase and 9) earnings are governed by the Competitive Toll Settlement (CTS), under which revenuessale arrangements that are recorded when serviceson a gross basis as we are performed. Effective on that date, we prospectively discontinuedacting as the applicationprincipal in the transactions.
No non-affiliated customer exceeded 10.0% of rate-regulated accounting for those assets with the exception of flow-through income taxes covered by specific rate orders.
For our energy marketing contracts, an estimate ofthird-party revenues and commodity costs for the monthyears ended December 31, 2023 and 2022. Our largest non-affiliated customer accounted for approximately 13.5% of December is included in the Consolidated Statements of Earnings for each year based on the best available volume and price dataour third-party revenues for the commodity delivered and received.year ended December 31, 2021.
DERIVATIVE INSTRUMENTS AND HEDGING
Non-qualifying Derivatives
Non-qualifying derivative instruments are used primarily to economically hedge foreign exchange, interest rate and commodity price earnings exposure. Non-qualifying derivatives are measured at fair value with changes in fair value recognized in earnings in Commodity sales, Transportation and other services revenues, Commodity costs, Operating and administrative expense, Other income/(expense) and Interest expense.
Derivatives in Qualifying Hedging Relationships
We use derivative financial instruments to manage our exposure to changes in commodity prices, foreign exchange rates, interest rates and certain compensation tied to our share price. Hedge accounting is optional and requires Enbridgeus to document the hedging relationship and test the hedging item’sitem's effectiveness in offsetting changes in fair values or cash flows of the underlying hedged item on an ongoing basis. We present the earnings effects of hedging items with the hedged transaction. Derivatives in qualifying hedging relationships are categorized as cash flow hedges, fair value hedges or net investment hedges.
Cash Flow Hedges
We use cash flow hedges to manage our exposure to changes in commodity prices, foreign exchange rates, interest rates and certain compensation tied to our share price. The effective portion of the change in the fair value of a cash flow hedging instrument is recorded in Other comprehensive income/(loss) (OCI) and is reclassified to earnings when the hedged item impacts earnings. Any hedge ineffectiveness is recorded in current period earnings.
If a derivative instrument designated as a cash flow hedge ceases to be effective or is terminated, hedge accounting is discontinued and the gain or loss at that date is deferred in OCI and recognized in earnings concurrently with the related transaction. If aan anticipated hedged anticipated transaction is no longer probable, the gain or loss is recognized immediately in earnings. Subsequent gains and losses from derivative instruments for which hedge accounting has been discontinued are recognized in earnings in the period in which they occur.
Fair Value Hedges
We may use fair value hedges to hedge the fair value of debt instruments. The change in the fair value of the hedging instrument is recorded in earnings with changes in the fair value of the hedged risk of the asset or liability that is designated as part of the hedging relationship. If a fair value hedge is discontinued or ceases to be effective, the hedged risk of the asset or liability otherwise required to be carried at cost or amortized cost, ceases
to be remeasured at fair value and the cumulative fair value adjustment to the carrying value of the hedged item is recognized in earnings over the remaining life of the hedged item.
Net Investment Hedges
Gains and losses arising from the translation of our net investment in foreign operations from their functional currencies to Enbridge’sEnbridge's Canadian dollar presentation currency are included in cumulative translation adjustments (CTA)., a component of OCI. We designate foreign currency derivatives and United States dollar denominatedcurrently have designated a portion of our US dollar-denominated debt, as hedgeswell as a portfolio of foreign exchange forward contracts in prior periods, as a hedge of our net investment in US dollar-denominated investments in United States dollar denominated foreign operations.and subsidiaries. As a result, the effective portion of the change in the fair value of the foreign currency derivatives, as well as the translation of United States dollar denominatedUS dollar-denominated debt, are reflected in OCI and any ineffectiveness is reflected in current period earnings.OCI. Amounts recognized previously in Accumulated other comprehensive income/(loss) (AOCI) are reclassified to earnings when there is a reduction of the hedged net investment resulting from the disposal of a foreign operation.
Classification of Derivatives
We recognize the fair market value of derivative instruments onin the Consolidated Statements of Financial Position as current and non-current assets or liabilities depending on the timing of the settlements and the resulting cash flows associated with the instruments. Fair value amounts related to cash flows occurring beyond one year are classified as non-current.
Cash inflows and outflows related to derivative instruments are classified as Cash Flows from Operating activities onActivities in the Consolidated Statements of Cash Flows.
Balance Sheet Offset
Assets and liabilities arising from derivative instruments may be offset in the Consolidated Statements of Financial Position when we have the legal right and intention to settle them on a net basis.
Transaction CostsTRANSACTION COSTS
Transaction costs are incremental costs directly related to the acquisition of a financial asset or the issuance of a financial liability. We incur transaction costs primarily from the issuance of debt and account for these costs as a deduction fromreduction to Long-term debt onin the Consolidated Statements of Financial Position. These costs are amortized using the effective interest rate method over the term of the related debt instrument and are recorded in Interest expense.
EQUITY INVESTMENTS
Equity investments over which we exercise significant influence, but do not have controlling financial interests, are accounted for using the equity method. EquityThese investments are initially measured at cost and are adjusted for our proportionate share of undistributed equity earnings or loss. EquityOur equity investments are increased for contributions made to, and decreased for distributions received from, the investees.investee. To the extent an equity investee undertakes activities necessary to commence its planned principal operations, we capitalize interest costs associated with itsthe investment during such period.
RESTRICTED LONG-TERM INVESTMENTS
Long-term investments that are restricted as to withdrawal or usage for the purposes of the NEB’sCER's LMCI are presented as Restricted long-term investments onin the Consolidated Statements of Financial Position.
OTHER INVESTMENTS
Generally, we classify equity investments in entities over which we do not exercise significant influence and that do not trade on an actively quoted markethave readily determinable fair values as other investments carried at cost. Financial assets in this categorymeasured using the fair value measurement alternative (FVMA). These investments are initially recorded at cost less impairment, if any, and adjusted for the impact of observable price changes occurring in orderly transactions for an identical or similar investment of the same issuer. Investments in equity securities measured using the FVMA are reviewed for impairment each reporting period and written down to their fair value if objective evidence of impairment is identified. Equity investments with no subsequent re-measurement. Any investments which do trade on an active marketreadily determinable fair values are classified as available for sale investments measured at fair value through OCI.earnings. Dividends received from investments carried at costin equity securities are recognized in earnings when the right to receive payment is established.
Investments in debt securities are classified as available-for-sale and measured at fair value through OCI.
NONCONTROLLING INTERESTS
Noncontrolling interests represent ownership interests attributable to third parties in certain consolidated subsidiaries, limited partnerships and VIEs.subsidiaries. The portion of equity not owned by us in such entities is reflected as Noncontrolling interests within the equity section of the Consolidated Statements of Financial Position and, in the case of redeemable noncontrolling interests, within the mezzanine section of the Consolidated Statements of Financial Position between long-term liabilities and equity.Position.
The Fund’s noncontrolling interest holders have the option to redeem the Fund trust units for cash, subject to certain limitations. Redeemable noncontrolling interests are recognized at the maximum redemption value of the trust units held by third parties, which references the market price of ENF common shares. On a quarterly basis, changes in estimated redemption values are reflected as a charge or credit to retained earnings.
The use of the HLBV method by ECT impacts the earnings attributable to redeemable noncontrolling interests reported on our Consolidated Statements of Earnings.
INCOME TAXES
Income taxes are accounted for using the liability method. Deferred income tax assets and liabilities are recorded based on temporary differences between the tax bases of assets and liabilities and their carrying values for accounting purposes. Deferred income tax assets and liabilities are measured using the tax rate that is expected to apply when the temporary differences reverse. For our regulated operations, a deferred income tax liability or asset is recognized with a corresponding regulatory asset or liability, respectively, to the extent that taxes can be recovered through rates. Any interest and/or penalty incurred related to tax is reflected in Income taxes.tax expense.
FOREIGN CURRENCY TRANSACTIONS AND TRANSLATION
Foreign currency transactions are those transactions whose terms are denominated in a currency other than the currency of the primary economic environment in which Enbridge or a reporting subsidiary operates, referred to as the functional currency. Transactions denominated in foreign currencies are translated intoto the functional currency using the exchange rate prevailing at the date of the transaction. Monetary assets and liabilities denominated in foreign currencies are translated to the functional currency using the exchange rate of exchange in effect as at the balance sheet date. Exchange gains and losses resulting from the translation of monetary assets and liabilities are included in the Consolidated Statements of Earningsearnings in the period in which they arise.
Gains and losses arising from the translation of foreign operations’operations' functional currencies to our Canadian dollar presentation currency are included in the CTA component of AOCI and are recognized in earnings upon sale of the foreign operation. Asset and liability accounts are translated at the exchange rates in effect onas at the balance sheet date, while revenues and expenses are translated using monthly average exchange rates.
CASH AND CASH EQUIVALENTS
Cash and cash equivalents include short-term investments with a term to maturity of three months or less when purchased.
RESTRICTED CASH
Cash and cash equivalents that are restricted as to withdrawal or usage for the purposes of the CER's LMCI or in accordance with specific commercial and debt arrangements are presented as Restricted cash onin the Consolidated Statements of Financial Position.
LOANS AND RECEIVABLES
Affiliate long-termLong-term notes receivable from affiliates are measured at amortized cost using the effective interest rate method, net of any impairment losses recognized. Accounts receivableTrade receivables and otherunbilled revenues are measured at cost. Interest income is recognized in earnings as it is earned with the passage of time.
CURRENT EXPECTED CREDIT LOSSES
ALLOWANCE FOR DOUBTFUL ACCOUNTS
AllowanceFor accounts receivable, a loss allowance matrix is utilized to measure lifetime expected credit losses. The matrix contemplates historical credit losses by age of receivables, adjusted for doubtful accounts is determinedany forward-looking information and management expectations. Other loan receivables and applicable off-balance sheet commitments utilize a discounted cash flow methodology which calculates the current expected credit losses based on collection history. When we have determined that further collection effortshistorical default probability rates associated with the credit rating of the counterparty and the related term of the loan or commitment, adjusted for forward-looking information and management expectations. Trade receivables and unbilled revenues are unlikely to be successful, amounts charged to thepresented net of allowance for doubtful accounts are applied against the impaired accounts receivable.expected credit losses of $100 million and $92 million as at December 31, 2023 and 2022, respectively.
NATURAL GAS IMBALANCES
The Consolidated Statements of Financial Position include in-kind balances as a result of differences in gas volumes received from, and delivered for, customers. SinceAs settlement of certain imbalances is in-kind, changes in the balances do not have an effect on our Consolidated Statements of Earnings or Consolidated Statements of Cash Flows. Most natural gas volumes owed to or by us are valued at natural gas market index prices as at the balance sheet dates.
INVENTORY
Inventory is comprised of natural gas held in storage held in EGD and Unionby Enbridge Gas, and crude oil and natural gas held primarily by energy services businesses in theour Energy Services segment.segment, and materials and supplies. Natural gas held in storage in EGD and Unionby Enbridge Gas is recorded at the quarterly prices approved by the OEB in the determination of distribution rates. The actual price of gas purchased may differ from the OEB approved price. The difference between the approved price and the actual cost of the gas purchased is deferred as a liability for future refund, or as an asset for collection, as approved by the OEB. Other commodities inventory is recorded at the lower of cost, as determined on a weighted average basis, or market value. Upon disposition, other commodities inventory is recorded to Commodity costs onin the Consolidated Statements of Earnings at the weighted average cost of inventory, including any adjustments recorded to reduce inventory to market value. Materials and supplies inventory is recorded at the lower of average cost or net realizable value.
PROPERTY, PLANT AND EQUIPMENT
Property, plant and equipment is recorded at historical cost. Expenditures for construction, expansion, major renewals and betterments are capitalized. Maintenance and repair costs are expensed as incurred. Expenditures for project development are capitalized if they are expected to have future benefit. We capitalize interest incurred during construction for non-rate-regulated assets. For rate-regulated assets, AFUDC is included in the cost of property, plant and equipment and is depreciated over future periods as part of the total cost of the related asset. AFUDC includes both an interest component and, if approved by the regulator, a cost of equity component.
Two primary methods of depreciation are utilized. For distinct assets, depreciation is generally provided on a straight-line basis over the estimated useful lives of the assets commencing when the asset is placed in service. For largely homogeneous groups of assets with comparable useful lives, the pool method of accounting for property, plant and equipment is followed whereby similar assets are grouped and depreciated as a pool. When group assets are retired or otherwise disposed of, gains and losses are generally not reflected in earnings but are booked as an adjustment to accumulated depreciation.
LEASES
We recognize an arrangement as a lease when a customer has the right to obtain substantially all of the economic benefits from the use of an asset, as well as the right to direct the use of the asset. We recognize right-of-use (ROU) assets and the related lease liabilities in the Consolidated Statements of Financial Position for operating lease arrangements with a term of 12 months or longer. We do not separate non-lease components from the associated lease components of our lessee contracts and account for both components as a single lease component. We combine lease and non-lease components within a contract for operating lessor leases when certain conditions are met. ROU assets are assessed for impairment using the same approach applied for other long-lived assets.
Lease liabilities and ROU assets require the use of judgment and estimates which are applied in determining the term of a lease, appropriate discount rates, whether an arrangement contains a lease, whether there are any indicators of impairment for ROU assets and whether any ROU assets should be grouped with other long-lived assets for impairment testing. The lease term may include periods associated with options to extend or terminate the lease if it is reasonably certain the options will be exercised.
DEFERRED AMOUNTS AND OTHER ASSETS
Deferred amounts and other assets primarily include:consists of costs whichthat regulatory authorities have permitted, or are expected to permit, to be recovered through future rates, includingincluding: deferred income taxes; contractual receivables under the termsfair value adjustment to long-term debt for certain regulated entities; actual cost of long-term delivery contracts;removal of previously retired or decommissioned plant assets; the difference between the actual cost and derivative financial instruments.approved cost of natural gas reflected in rates; and actuarial gains and losses arising from defined benefit pension plans for Enbridge Gas.
INTANGIBLE ASSETS
Intangible assets consist primarily of certain software costs, customer relationships and emission allowances. We capitalize costs incurred during the application development stage of internal use software projects. Customer relationships represent the underlying relationship from long-term agreements with customers that are capitalized upon acquisition. Emission allowances, which are recorded at their original cost, are purchased in order to meet greenhouse gas (GHG) compliance obligations. Intangible assets are generally amortized on a straight-line basis over their expected lives,
commencing when the asset is available for use, with the exception of emission allowances, which are not amortized as they will be used to satisfy compliance obligations as they come due.
GOODWILL
Goodwill represents the excess of the purchase price over the fair value of net identifiable assets onupon acquisition of a business. The carrying value of goodwill, which is not amortized, is assessed for impairment annually or more frequently if events or changes in circumstances arise that suggest the carrying value of goodwill may be impaired. We perform our annual review of the goodwill balance on April 1.
We perform our annual review for impairment at the reporting unit level, which is identified by assessing whether the components of our operating segments constitute businesses for which discrete information is available, whether segment management regularly reviews the operating results of those components, and whether the economic and regulatory characteristics are similar. We determined that ourOur reporting units are equivalent to our reportable segments, withLiquids Pipelines, Gas Transmission, Gas Distribution and Storage, and Renewable Power Generation. The Renewable Power Generation reporting unit had goodwill beginning in the exceptionthird quarter of the gas transmission and gas midstream reportable segment which is divided at the component level into two reporting units. 2022.
We have the option to first assess qualitative factors to determine whether it is necessary to perform the quantitative goodwill impairment test. assessment. When performing a qualitative assessment, we determine the drivers of fair value for each reporting unit and evaluate whether those drivers have been positively or negatively affected by relevant events and circumstances since the last fair value assessment. Our evaluation includes, but is not limited to, the assessment of macroeconomic trends, changes to regulatory environments, capital accessibility, operating income trends, and changes to industry conditions. Based on our assessment of qualitative factors, if we determine it is more likely than not that the fair value of the reporting unit is less than its carrying amount, a quantitative goodwill impairment assessment is performed.
The quantitative goodwill impairment testassessment involves determining the fair value of our reporting units and comparing those values to the carrying value of each reporting unit. If the carrying value of a reporting unit, including allocated goodwill, exceeds its fair value, goodwill impairment is measured at the amount by which the reporting unit’sunit's carrying value exceeds its fair value. This amount should not exceed the carrying amount of goodwill. The fair value of our reporting units is estimated using a discounted cash flow technique. The determination of fair value using the discounted cash flow technique requires the use of estimates and assumptions related to discount rates, projected operating income, expected future capital expenditures and working capital levels, as well as terminal value growth rates for the Liquids Pipelines, Gas Transmission, and Renewable Power Generation reporting units, and projected regulatory rate base and rate base multiple for the Gas Distribution and Storage reporting unit.
The allocation of goodwill to held-for-sale and disposed businesses is based on the relative fair value of businesses included in the relevant reporting unit.
On April 1, 2023, we performed our annual goodwill impairment assessment which consisted of a qualitative assessment for the Liquids Pipelines, Gas Transmission, Gas Distribution and Storage, and Renewable Power Generation reporting units and did not identify impairment indicators. Due to an impairment recorded in 2022 for the Gas Transmission reporting unit and the OEB decision on Phase 1 for Enbridge Gas, we performed a quantitative assessment for the Gas Transmission and Gas Distribution and Storage reporting units as at December 1, 2023, which did not result in the recognition of an impairment charge for either reporting unit. Also, we did not identify any indicators of goodwill impairment during the remainder of 2023.
IMPAIRMENT
We review the carrying values of our long-lived assets as events or changes in circumstances warrant. If it is determined that the carrying value of an asset exceeds theits expected undiscounted cash flows, expected from the asset, we will calculate fair value based on the discounted cash flows and write the assetsasset down to the extent that the carrying value exceeds the fair value.
With respect to investments in debt securities and equity securities,investments, we assess at each balance sheet date whether there is objective evidence that a financial asset is impaired by completing a quantitative or qualitative analysis of factors impacting the investment. If there is objective evidence of impairment, we value the expected discounted cash flows using observable market inputs andinputs. We determine whether the decline below carrying value is other than temporary.other-than-temporary for equity method investments or is due to a credit loss for investments in debt securities. If the decline is determined to be other than temporary,other-than-temporary for equity method investments or is due to a credit loss for investments in debt securities, an impairment charge is recorded in earnings with an offsetting reduction to the carrying value of the asset.investment.
With respect to other financial assets, we assess the assets for impairment when there is no longer reasonable assurance of timely collection. If evidence of impairment is noted, we reduce the value of the financial asset to its estimated realizable amount, determined using discounted expected future cash flows.
ASSET RETIREMENT OBLIGATIONS
ARO associated with the retirement of long-lived assets are measured at fair value and recognized as Accounts payable and otherOther current liabilities or Other long-term liabilities in the period in which they can be reasonably determined. The fairFair value approximates the cost a third party would charge to perform the tasks necessary to retire such assets and is recognized at the present value of expected future cash flows. AROs areARO is added to the carrying value of the associated asset and depreciated over the asset’sasset's useful life. The corresponding liability is accreted over time through charges to earnings and is reduced by actual costs of decommissioning and reclamation. Our estimates of retirement costs could change as a result of changes in cost estimates and regulatory requirements. Currently, for the majority of our assets, it is not possible to make a reasonable estimate of ARO due to the indeterminate timing and scope of the asset retirements.
RETIREMENTPENSION AND OTHER POSTRETIREMENT BENEFITS
We maintain pension plans which providesponsor defined benefit and defined contribution pension benefits.plans, as well as defined benefit OPEB plans.
DefinedObligations and net periodic benefit costs for defined benefit pension plan costsand OPEB plans are determined using actuarial methods and are funded through contributions determinedestimated using the projected benefitunit credit method, which incorporates management’sis based on years of service, as well as our best estimates of actuarial assumptions such as discount rates, future salary levels, other cost escalations, employees' retirement ages, of employees and other actuarial factors including discount rates and mortality.
We use mortality tables issued by the Society of Actuaries in the United States (revised in 2016) and the Canadian Institute of Actuaries tables (revised in 2014) to measure our benefit obligations of our United States pension plan (the United States Plan) and our Canadian pension plans (the Canadian Plans), respectively. We determine discount rates by reference to ratesusing market yields of high-quality long-term corporate bonds with maturities that approximate the estimated timing of future payments we anticipate making under eachbenefit payments.
Plan assets are measured at fair value. The expected return on plan assets is determined using the long-term target asset mixes in our investment policies and long-term market expectations.
Actuarial gains and losses arise from the difference between the actual and expected return on plan assets, and changes in actuarial assumptions such as discount rates. Periodic net actuarial gains and losses and prior service costs are accumulated and presented as follows in the Consolidated Statements of Financial Position:
•as a component of AOCI, for our non-utilities' defined benefit pension plans and all defined benefit OPEB plans; and
•as a component of Deferred amounts and other assets and/or Other long-term liabilities, for our utilities' defined benefit pension plans, to the respective plans. Pensionextent that the net actuarial gains and losses and prior service costs have been permitted or are expected to be permitted by the regulators, to be recovered through future rates.
Net periodic benefit cost is charged torecognized in earnings and includes:
Cost of pension plan benefits provided in exchange for employee services rendered during the year;
Interest cost of pension plan obligations;•current service cost;
Expected•interest cost;
•expected return on pension plan assets;
Amortization•amortization of the prior service costs and amendments on a straight-line basis over the expected average remaining service periodlife of the plans' active employee group covered by the plans;group; and
Amortization•amortization of cumulative unrecognized net actuarial gains and losses in excess of 10% of the greater of the accrued benefit obligation or the fair value of plan assets over the expected average remaining service life of the plans' active employee group covered by the plans.group.
Actuarial gains and losses arise fromOur utility operations also record regulatory adjustments for the difference between the actual and expected rate of return on plan assets for that period or from changes in actuarial assumptions used to determine the accruednet periodic benefit obligation, including discount rate, changes in headcount or salary inflation experience.
Pension plan assets are measured at fair value. The expected return on pension plan assets is determined using market related values and assumptions on the specific invested asset mix within the pension plans. The market related values reflect estimated return on investments consistent with long-term historical averages for similar assets.
For defined contribution plans, contributions made by Enbridge are expensed in the period in which the contribution occurs.
We also provide OPEB other than pensions, including group health care and life insurance benefits for eligible retirees, their spouses and qualified dependents. The cost of such benefits is accrued during the years in which employees render service.
The overfunded or underfunded status of defined benefit pension and OPEB plans is recognized as Deferred amounts and other assets, Accounts payable and other or Other long-term liabilities, on the Consolidated Statements of Financial Position. A plan’s funded status is measured as the difference between the fair value of plan assets and the plan’s projected benefit obligation. Any unrecognized actuarial gains and losses and prior service costs and credits that arise during the period are recognized as a component of OCI, net of tax.
Certain regulated utility operations of Enbridge record regulatory adjustments to reflect the difference between pension expense and OPEB costs for accounting purposes and the pension expense and OPEB costs forversus ratemaking purposes. Offsetting regulatory assets or liabilities are recorded to the extent pension expense or OPEBnet periodic benefit costs are expected to be collectedrecovered from or refunded to customers, respectively, in future rates. In the absence of rate regulation, regulatory balancesassets or liabilities would not be recorded and pension and OPEBnet periodic benefit costs would be charged to earnings and OCI on an accrual basis.
For defined contribution plans, our contributions are expensed when the contribution occurs.
STOCK-BASED COMPENSATION
Incentive Stock Optionsstock options (ISO) granted are recorded using the fair value method. Under this method, compensation expense is measured at the grant date based on the fair value of the ISO granted as calculated by the Black-Scholes-Merton model and is recognized on a straight-line basis over the shorter of the vesting period or the period to early retirement eligibility, with a corresponding credit to Additional paid-in capital. Balances in Additional paid-in capital are transferred to Share capital when the options are exercised.
Restricted Stock Units (RSU)Performance stock units (PSU) and certain RSUs are cash settledcash-settled awards for which the related liability is remeasured each reporting period. RSUsThese PSUs vest at the completion of a 35-month term.three-year term and RSUs vest one-third annually from the grant date. During the vesting term, compensation expense is recorded based on the number of units outstanding and the current market price of Enbridge’sEnbridge's common shares with an offset to Accounts payable and otherOther current liabilities or to Other long-term liabilities. The value of the PSUs is also dependent on our performance relative to performance targets set out under the plan. We also award share-settled RSUs to certain senior management employees which vest at the completion of a three-year term. Beginning in 2023, share-settled units were granted to other employees, which vest one-third annually from the grant date. During the vesting term, compensation expense is recorded based on the number of units granted and the market price of Enbridge's common shares on the day immediately preceding the grant date, with an offset to Additional paid-in capital. There is no associated liability recorded for share-settled awards.
COMMITMENTS, CONTINGENCIES AND ENVIRONMENTAL LIABILITIES
We expense or capitalize, as appropriate, expenditures for ongoing compliance with environmental regulations that relate to past or current operations. We expense costs incurred for remediation of existing environmental contamination caused by past operations that do not benefit future periods by preventing or eliminating future contamination. We record liabilities for environmental matters when assessments indicate that remediation efforts are probable and the costs can be reasonably estimated. Estimates of environmental liabilities are based on currently available facts, existing technology and presently enacted laws and regulations, taking into consideration the likely effects of inflation and other factors. These amounts also consider prior experience in remediating contaminated sites, other companies’companies' clean-up experience and data released by government organizations. Our estimates are subject to revision in future periods based on actual costs or new information and are included in EnvironmentalOther current liabilities and Other long-term liabilities in the Consolidated Statements of Financial Position at their undiscounted amounts. There is always a potential of incurring additional costs in connection with environmental liabilities due to variations in any or all of the categories described above, including modified or revised requirements from regulatory agencies, in addition to fines and penalties, as well as expenditures associated with litigation and settlement of claims. We evaluate recoveries from insurance coverage separately from the liability and, when recovery is probable, we record and report an asset separately from the associated liability in the Consolidated Statements of Financial Position.
Liabilities for other commitments and contingencies are recognized when, after fully analyzing available information, we determine it is either probable that an asset has been impaired or that a liability has been incurred, and the amount of impairment or loss can be reasonably estimated. When a range of probable loss can be estimated, we recognize the most likely amount, or if no amount is more likely than another, the minimum of the range of probable loss is accrued. We expense legal costs associated with loss contingencies as such costs are incurred.
3. CHANGES IN ACCOUNTING POLICIES
CHANGES IN ACCOUNTING POLICIES
Goodwill
We previously performed our annual goodwill impairment test on October 1 of each fiscal year. Beginning withThere were no changes in accounting policies during the quarteryear ended December 31, 2017, we moved the annual goodwill impairment test from October 1 to April 1 to better align with the preparation and review of our business plan, which is used in the test. The change does not delay, accelerate or avoid an impairment charge.2023.
ADOPTION OF NEW STANDARDS
Simplifying the Measurement of Goodwill Impairment FUTURE ACCOUNTING POLICY CHANGES
Effective January 1, 2017, we early adopted Segment Reporting
Accounting Standards Update (ASU) 2017-04 and applied the standard on a prospective basis. Under the new guidance, goodwill impairment will now be the amount by which a reporting unit’s carrying value exceeds its fair value; this amount should not exceed
the carrying amount of goodwill. We applied this standard as at December 31, 2017 in the measurement of the goodwill impairment relating to the gas midstream reporting unit (Note 15).
Clarifying the Definition of a Business in an Acquisition
Effective January 1, 2017, we early adopted ASU 2017-01 on a prospective basis. The new standard was issued with the objective of adding guidance to assist entities with evaluating whether transactions should be accounted for as acquisitions (disposals) of assets or businesses. This accounting update was applied to acquisitions and dispositions that occurred in the year.
Accounting for Intra-Entity Asset Transfers
Effective January 1, 2017, we early adopted ASU 2016-16 on a modified retrospective basis. The new standard was issued with the intent of improving the accounting for the income tax consequences of intra-entity asset transfers other than inventory. Under the new guidance, an entity should recognize the income tax consequences of an intra-entity transfer of an asset, other than inventory, when the transfer occurs. The adoption of the pronouncement did not have a material impact on our consolidated financial statements.
Improvements to Employee Share-Based Payment Accounting
Effective January 1, 2017, we adopted ASU 2016-09 and applied certain amendments on a modified retrospective basis with the remaining amendments applied on a prospective basis. The new standard was issued with the intent of simplifying and improving several aspects of accounting for share-based payment transactions including the income tax consequences, classification of awards as either equity or liabilities, and classification on the statement of cash flows. The adoption of the pronouncement did not have a material impact on our consolidated financial statements.
Simplifying the Embedded Derivatives Analysis for Debt Instruments
Effective January 1, 2017, we adopted ASU 2016-06 on a modified retrospective basis. The new guidance simplifies the embedded derivative analysis for debt instruments containing contingent call or put options. The adoption of the pronouncement did not have a material impact on our consolidated financial statements.
FUTURE ACCOUNTING POLICY CHANGES
Reclassification of Certain Tax Effects from Accumulated Other Comprehensive Income
ASU 2018-022023-07 was issued in February 2018November 2023 to addressimprove reportable segment disclosure requirements primarily through enhanced disclosures about significant segment expenses and to require in interim period financial statements all disclosures about a specific consequencereportable segment's profit or loss and assets that are currently required annually. The new ASU requires entities to disclose the title and position of the Tax Cuts and Jobs Act (TCJA). This accounting update allows a reclassification from accumulated other comprehensive income to retained earnings for stranded tax effects resulting from TCJA. The amendments eliminateindividual or the stranded tax effects that were created as a resultname of the reductiongroup or committee identified as the chief operating decision-maker (CODM) of historical U.S. federal corporate income tax rate to the newly enacted U.S. federal corporate income tax rate. The accounting updateeach segment. ASU 2023-07 is effective January 1, 2019,2024, with early adoption permitted,interim period disclosure requirements effective after January 1, 2025 and is toshould be applied either in the period of adoption or retrospectively to each period in which the effect of the change in the U.S. federal corporate income tax rate in the TCJA is recognized. We are currently assessing the impact of the new standard on the consolidated financial statements.
Improvements to Accounting for Hedging Activities
ASU 2017-12 was issued in August 2017 with the objective of better aligning a company’s risk management activities and the resulting hedge accounting reflectedall prior periods presented in the financial statements. The accounting update allows cash flow hedging of contractually specified components in financial and non-financial items. Under the new guidance, hedge ineffectiveness is no longer required to be measured and hedging instruments’ fair value changes will be recorded in the same income statement line as the hedged item. The ASU also allows the initial quantitative hedge effectiveness assessment to be performed at any time before the end of the quarter in which the hedge is designated. After initial quantitative testing is performed, an ongoing qualitative effectiveness assessment is permitted. The accounting update is effective January 1, 2019 and is to be applied on a modified retrospective basis. We are currently assessing the impact of the new standard on our consolidated financial statements.
Clarifying Guidance on the Application of Modification Accounting on Stock CompensationIncome Tax Disclosures
ASU 2017-092023-09 was issued in May 2017 withDecember 2023 to improve income tax disclosures by requiring specified categories in the intent to clarify the scope of modification accountingannual rate reconciliation that meet quantitative thresholds and when it should be applied to a change to the terms or conditions of a share based payment award. Under the new guidance, modification accounting is required for all changes to share based payment awards, unless all of the following are met: 1) there is no change to the fair value of the award, 2) the vesting conditions have not changed, and 3) the classification of the award as an equity instrument or a debt instrument has not changed. The accounting updatefurther disaggregation on income taxes paid by jurisdiction. ASU 2023-09 is effective January 1, 20182025 and willshould be applied on a prospective basis. We do not expect the adoption of this accounting update to have a material impact on our consolidated financial statements.
Amending the Amortization Period for Certain Callable Debt Securities Purchased at a Premium
ASU 2017-08 was issued in March 2017prospectively, with the intent of shortening the amortization period to the earliest call date for certain callable debt securities held at a premium. The accounting update is effective January 1, 2019 and will be applied on a modified retrospective basis.application being permitted. We are currently assessing the impact of the new standard on our consolidated financial statements.
Improving
4. REVENUE
REVENUE FROM CONTRACTS WITH CUSTOMERS
Major Products and Services
| | | | | | | | | | | | | | | | | | | | | | | |
| Liquids Pipelines | Gas Transmission and Midstream | Gas Distribution and Storage | Renewable Power Generation | Energy Services | Eliminations and Other | Consolidated |
| Year ended December 31, 2023 |
| (millions of Canadian dollars) | | | | | | | |
| Transportation revenue | 11,875 | | 5,302 | | 814 | | — | | — | | — | | 17,991 | |
| Storage and other revenue | 257 | | 461 | | 355 | | — | | — | | — | | 1,073 | |
| | | | | | | |
| Gas distribution revenue | — | | — | | 4,859 | | — | | — | | — | | 4,859 | |
| Electricity and transmission revenue | — | | — | | — | | 259 | | — | | — | | 259 | |
| Commodity sales | — | | 17 | | — | | — | | — | | — | | 17 | |
| Total revenue from contracts with customers | 12,132 | | 5,780 | | 6,028 | | 259 | | — | | — | | 24,199 | |
| Commodity sales | — | | — | | — | | — | | 18,964 | | — | | 18,964 | |
Other revenue1,2 | 257 | | 72 | | (58) | | 215 | | — | | — | | 486 | |
| Intersegment revenue | 474 | | 2 | | 6 | | 3 | | 25 | | (510) | | — | |
| Total revenue | 12,863 | | 5,854 | | 5,976 | | 477 | | 18,989 | | (510) | | 43,649 | |
| | | | | | | | | | | | | | | | | | | | | | | |
| Liquids Pipelines | Gas Transmission and Midstream | Gas Distribution and Storage | Renewable Power Generation | Energy Services | Eliminations and Other | Consolidated |
| Year ended December 31, 2022 |
| (millions of Canadian dollars) | | | | | | | |
| Transportation revenue | 11,283 | | 5,012 | | 782 | | — | | — | | — | | 17,077 | |
| Storage and other revenue | 235 | | 350 | | 308 | | — | | — | | — | | 893 | |
| Gas gathering and processing revenue | — | | 22 | | — | | — | | — | | — | | 22 | |
| Gas distribution revenue | — | | — | | 5,643 | | — | | — | | — | | 5,643 | |
| Electricity and transmission revenue | — | | — | | — | | 281 | | — | | — | | 281 | |
| | | | | | | |
| Total revenue from contracts with customers | 11,518 | | 5,384 | | 6,733 | | 281 | | — | | — | | 23,916 | |
| Commodity sales | — | | — | | — | | — | | 29,150 | | — | | 29,150 | |
Other revenue1,2 | (81) | | 39 | | (20) | | 305 | | — | | — | | 243 | |
| Intersegment revenue | 615 | | 3 | | 16 | | (4) | | 25 | | (655) | | — | |
| Total revenue | 12,052 | | 5,426 | | 6,729 | | 582 | | 29,175 | | (655) | | 53,309 | |
| | | | | | | | | | | | | | | | | | | | | | | |
| Liquids Pipelines | Gas Transmission and Midstream | Gas Distribution and Storage | Renewable Power Generation | Energy Services | Eliminations and Other | Consolidated |
| Year ended December 31, 2021 |
| (millions of Canadian dollars) | | | | | | | |
| Transportation revenue | 9,492 | | 4,364 | | 676 | | — | | — | | — | | 14,532 | |
| Storage and other revenue | 147 | | 255 | | 246 | | — | | — | | — | | 648 | |
| Gas gathering and processing revenue | — | | 49 | | — | | — | | — | | — | | 49 | |
| Gas distribution revenue | — | | — | | 4,026 | | — | | — | | — | | 4,026 | |
| Electricity and transmission revenue | — | | — | | — | | 177 | | — | | — | | 177 | |
| | | | | | | |
| Total revenue from contracts with customers | 9,639 | | 4,668 | | 4,948 | | 177 | | — | | — | | 19,432 | |
| Commodity sales | — | | — | | — | | — | | 26,873 | | — | | 26,873 | |
Other revenue1,2 | 375 | | 42 | | 13 | | 336 | | — | | — | | 766 | |
| Intersegment revenue | 567 | | 1 | | 19 | | (1) | | 44 | | (630) | | — | |
| Total revenue | 10,581 | | 4,711 | | 4,980 | | 512 | | 26,917 | | (630) | | 47,071 | |
1Includes realized and unrealized gains and losses from our hedging program which for the Presentationyear ended December 31, 2023 were a net of Net Periodic Benefit Cost related$97 million loss (2022 - $431 million loss; 2021 - $59 million gain).
2Includes revenues from lease contracts. Refer to Defined Benefit Plans Note 26 - Leases.
We disaggregate revenue into categories which represent our principal performance obligations within each business segment. These revenue categories represent the most significant revenue streams in March 2017each segment and consequently are considered to be the most relevant revenue information for management to consider in evaluating performance.
Contract Balances
| | | | | | | | | | | |
| Contract Receivables | Contract Assets | Contract Liabilities |
| (millions of Canadian dollars) | | | |
| Balance as at December 31, 2023 | 2,802 | | 400 | | 2,591 | |
| Balance as at December 31, 2022 | 3,183 | | 230 | | 2,241 | |
Contract receivables represent the amount of receivables derived from contracts with customers.
Contract assets represent the amount of revenue which has been recognized in advance of payments received for performance obligations we have fulfilled (or have partially fulfilled) and prior to the point in time at which our right to the payment is unconditional. Amounts included in contract assets are transferred to accounts receivable when our right to the consideration becomes unconditional.
Contract liabilities represent payments received for performance obligations which have not been fulfilled. Contract liabilities primarily relate to improvemake-up rights and deferred revenue. Revenue recognized during the income statement presentationyear ended December 31, 2023 included in contract liabilities at the beginning of the componentsyear is $246 million. Increases in contract liabilities from cash received, net of net periodic pension costamounts recognized as revenue during the year ended December 31, 2023, were $632 million.
Performance Obligations
| | | | | |
| Segment | Nature of Performance Obligation |
| Liquids Pipelines | •Transportation and storage of crude oil and natural gas liquids (NGL) |
| Gas Transmission and Midstream | •Transportation, storage, gathering, compression and treating of natural gas |
•Transportation of NGL |
•Sale of crude oil, natural gas and NGL |
| Gas Distribution and Storage | •Supply and delivery of natural gas |
•Transportation of natural gas |
•Storage of natural gas |
| Renewable Power Generation | •Generation and transmission of electricity |
•Delivery of electricity from renewable energy generation facilities |
There was no material revenue recognized during the year ended December 31, 2023 from performance obligations satisfied in previous periods.
Payment Terms
Payments are received monthly from customers under long-term transportation, commodity sales, and net periodic postretirement benefit cost for an entity’s sponsored defined benefit pensiongas gathering and OPEB plans. In addition, only the service cost component of net benefit cost is eligible for capitalization. The accounting update is effective January 1, 2018processing contracts. Payments from Gas Distribution and will be appliedStorage customers are received on a retrospectivecontinuous basis based on established billing cycles.
Certain contracts in our US offshore business provide for us to receive a series of fixed monthly payments (FMPs) for a specified period that is less than the period during which the performance obligations are satisfied. As a result, a portion of the FMPs are recorded as contract liabilities. The FMPs are not considered to be a financing arrangement as payments are scheduled to match the production profiles of offshore oil and gas fields, which generate greater revenue in the initial years of their productive lives.
Revenue to be Recognized from Unfulfilled Performance Obligations
Total revenue from performance obligations expected to be fulfilled in future periods is $59.1 billion, of which $7.5 billion is expected to be recognized during the year ending December 31, 2024.
The revenues excluded from the amounts above based on optional exemptions available under Accounting Standards Codification (ASC) 606, as explained below, represent a significant portion of our overall revenues and revenues from contracts with customers. Certain revenues such as flow-through operating costs charged to shippers are recognized at the amount for which we have the right to invoice our customers and are excluded from the amounts of revenue to be recognized in the future from unfulfilled performance obligations above. Variable consideration is excluded from the amounts above due to the uncertainty of the associated consideration, which is generally resolved when actual volumes and prices are determined. For example, we consider interruptible transportation service revenues to be variable revenues since volumes cannot be estimated. Additionally, the effect of escalation on certain tolls which are contractually escalated for inflation has not been reflected in the amounts above as it is not possible to reliably estimate future inflation rates. Revenues for periods extending beyond the current rate settlement term for regulated contracts where the tolls are periodically reset by the regulator are excluded from the amounts above since future tolls remain unknown. Finally, revenues from contracts with customers which have an original expected duration of one year or less are excluded from the amounts above.
SIGNIFICANT JUDGMENTS MADE IN RECOGNIZING REVENUE
Long-Term Transportation Agreements
For long-term transportation agreements, significant judgments pertain to the period over which revenue is recognized and whether the agreement provides for make-up rights for the statement of earnings presentation component and a prospective basis forshippers. Transportation revenue earned from firm contracted capacity arrangements is recognized ratably over the capitalization component. We do not expectcontract period. Transportation revenue from interruptible or volumetric-based arrangements is recognized when services are performed.
Variable Consideration
Revenue from arrangements subject to variable consideration is recognized only to the adoption of this accounting update to have a material impact on our consolidated financial statements.
Clarifying Guidance on Derecognition and Partial Sales of Nonfinancial Assets
ASU 2017-05 was issued in February 2017 with the intent of clarifying the scope of asset derecognition guidance and accounting for partial sales of nonfinancial assets. The ASU clarifies the scope provisions of nonfinancial assets and how to allocate consideration to each distinct asset, and amends the guidance for derecognition of a distinct nonfinancial asset in partial sale transactions. The accounting update is effective January 1, 2018 and will be applied on a modified retrospective basis. We do not expect the adoption of this accounting update to have a material impact on our consolidated financial statements.
Clarifying the Presentation of Restricted Cash in the Statement of Cash Flows
ASU 2016-18 was issued in November 2016 with the intent to clarify guidance on the classification and presentation of changes in restricted cash and restricted cash equivalents within the statement of cash flows. The accounting update requiresextent that changes in restricted cash and restricted cash equivalents be included within cash and cash equivalents when reconciling the opening and closing period amounts shown on the statement of cash flows. We currently present the changes in restricted cash and restricted cash equivalents under investing activities in the Consolidated Statement of Cash Flows. The accounting update is effective January 1, 2018 and will be applied on a retrospective basis. We will amend the presentation in the Consolidated Statement of Cash Flows to include restricted cash and restricted cash equivalents with cash and cash equivalents and we will retrospectively reclassify all periods presented.
Simplifying Cash Flow Classification
ASU 2016-15 was issued in August 2016 with the intent of reducing diversity in practice of how certain cash receipts and cash payments are classified in the Consolidated Statement of Cash Flows. The new guidance addresses eight specific presentation issues. The accounting update is effective January 1, 2018 and will be applied on a retrospective basis. We assessed each of the eight specific presentation issues and the adoption of this ASU does not have a material impact on our consolidated financial statements.
Accounting for Credit Losses
ASU 2016-13 was issued in June 2016 with the intent of providing financial statement users with more useful information about the expected credit losses on financial instruments and other commitments to extend credit held by a reporting entity at each reporting date. Current treatment uses the incurred loss methodology for recognizing credit losses that delays the recognition until it is probable that a loss has been incurred.significant reversal in the amount of cumulative revenue recognized will not occur when the uncertainty associated with the variable consideration is subsequently resolved. Uncertainties associated with variable consideration relate principally to differences between estimated and actual volumes and prices. These uncertainties are resolved each month when actual volumes are sold or transported and actual tolls and prices are determined.
During the first six months of 2023, revenue for the Canadian Mainline was recognized in accordance with the terms of the Competitive Toll Settlement (CTS), which expired on June 30, 2021. The accounting update addstolls in place on June 30, 2021 continued on an interim basis until July 1, 2023 when revised interim tolls took effect. Until a new impairment model, known ascommercial arrangement is approved, the current expected credit loss model, whichtolls are subject to finalization and adjustment applicable to the interim period, if any. Due to the uncertainty of adjustment to tolling pursuant to a CER decision and potential customer negotiations, interim toll revenue recognized during the year ended December 31, 2023 is based on expected losses rather than incurred losses. Under the new guidance, an entity recognizes as an allowance its estimate of expected credit losses, which the Financial Accounting Standards Board believes will result in more timely recognition of such losses. We are currently assessing the impact of the new standard on our consolidated financial statements. The accounting update is effective January 1, 2020. considered variable consideration.
Recognition of Leases
ASU 2016-02 was issued in February 2016 with the intent to increase transparency and comparability among organizations. It requires lessees of operating lease arrangements to recognize lease assets and lease liabilities on the statement of financial position and disclose additional key information about lease agreements. The accounting update also replaces the current definition of a lease and requires that an arrangement be recognized as a lease when a customer has the right to obtain substantially all of the economic benefits from the use of an asset, as well as the right to direct the use of the asset. We are currently gathering a complete inventory of our lease contracts in order to assess the impact of the new standard on our consolidated financial statements. The accounting update is effective January 1, 2019 and will be applied using a modified retrospective approach.
Recognition and Measurement of Financial AssetsRevenue
| | | | | | | | | | | | | | | | | | |
| | | | | | |
| |
| | | | | | |
| | | | | | |
| | | | | | |
| | | | | | |
| | | | | | |
| | | | | | |
| | | | | | |
| | | | | | |
| | | | | | |
| | | | | | |
| | | | | | |
| | | | | | |
| |
| | | | | | |
| | | | | | |
| |
| | | | | | |
| | | | | | |
| | | | | | |
| | | | | | |
| | | | | | |
| | | | | | |
| | | | | | |
| | | | | | |
| | | | | | |
| | | | | | |
| | | | | | |
| | | | | | |
| | | | | | |
| | | | | | |
| Liquids Pipelines | Gas Transmission and Midstream | Gas Distribution and Storage | Renewable Power Generation | | Consolidated |
| Year ended December 31, 2023 |
| (millions of Canadian dollars) | | | | | | |
| Revenue from products transferred at a point in time | — | | 17 | | 138 | | — | | | 155 | |
Revenue from products and services transferred over time1 | 12,132 | | 5,763 | | 5,890 | | 259 | | | 24,044 | |
| Total revenue from contracts with customers | 12,132 | | 5,780 | | 6,028 | | 259 | | | 24,199 | |
| | | | | | | | | | | | | | | | | | |
| Liquids Pipelines | Gas Transmission and Midstream | Gas Distribution and Storage | Renewable Power Generation | | Consolidated |
| Year ended December 31, 2022 |
| (millions of Canadian dollars) | | | | | | |
| Revenue from products transferred at a point in time | — | | — | | 127 | | — | | | 127 | |
Revenue from products and services transferred over time1 | 11,518 | | 5,384 | | 6,606 | | 281 | | | 23,789 | |
| Total revenue from contracts with customers | 11,518 | | 5,384 | | 6,733 | | 281 | | | 23,916 | |
| | | | | | | | | | | | | | | | | | |
| Liquids Pipelines | Gas Transmission and Midstream | Gas Distribution and Storage | Renewable Power Generation | | Consolidated |
| Year ended December 31, 2021 |
| (millions of Canadian dollars) | | | | | | |
| Revenue from products transferred at a point in time | — | | — | | 70 | | — | | | 70 | |
Revenue from products and services transferred over time1 | 9,639 | | 4,668 | | 4,878 | | 177 | | | 19,362 | |
| Total revenue from contracts with customers | 9,639 | | 4,668 | | 4,948 | | 177 | | | 19,432 | |
1Revenue from crude oil and Liabilities natural gas pipeline transportation, storage, natural gas gathering, compression and treating, natural gas distribution, natural gas storage services and electricity sales.
ASU 2016-01 was issued in January 2016
Performance Obligations Satisfied Over Time
For arrangements involving the transportation and sale of petroleum products and natural gas where the transportation services or commodities are simultaneously received and consumed by the shipper or customer, we recognize revenue over time using an output method based on volumes of commodities delivered or transported. The measurement of the volumes transported or delivered corresponds directly to the benefits received by the shippers or customers during that period.
Determination of Transaction Prices
Prices for transportation and gas processing services are determined based on the capital cost of the facilities, pipelines and associated infrastructure required to provide such services, plus a rate of return on capital invested that is determined either through negotiations with the intentcustomers or through regulatory processes for those operations that are subject to address certain aspects of recognition, measurement, presentation and disclosure of financial assets and liabilities. Investments in equity securities, excluding equity method and consolidated investments,rate regulation.
Prices for commodities sold are no longer classified as trading or available-for-sale securities. All investments in equity securities with readily determinable fair values are classified as investments at fair value through net income. Investments in equity securities without readily determinable fair values are measured using the fair value measurement alternative and are recorded at cost minus impairment, if any,determined by reference to market price indices, plus or minus changesa negotiated differential and in certain cases a marketing fee.
Prices for natural gas sold and distribution services provided by regulated natural gas distribution operations are prescribed by regulation.
5. SEGMENTED INFORMATION
| | | | | | | | | | | | | | | | | | | | | | | |
| Year ended December 31, 2023 | Liquids Pipelines | Gas Transmission and Midstream | Gas Distribution and Storage | Renewable Power Generation | Energy Services | Eliminations and Other | Consolidated |
| (millions of Canadian dollars) | | | | | | | |
Operating revenues (Note 4) | 12,863 | | 5,854 | | 5,976 | | 477 | | 18,989 | | (510) | | 43,649 | |
| Commodity and gas distribution costs | — | | (15) | | (2,871) | | (20) | | (18,975) | | 515 | | (21,366) | |
| Operating and administrative | (4,629) | | (2,380) | | (1,285) | | (261) | | (52) | | 7 | | (8,600) | |
Impairment of long-lived assets1 | 145 | | — | | (281) | | (283) | | — | | — | | (419) | |
| | | | | | | |
Income/(loss) from equity investments (Note 13) | 1,007 | | 688 | | 2 | | 140 | | — | | (21) | | 1,816 | |
| | | | | | | |
| | | | | | | |
Other income (Note 27) | 113 | | 117 | | 51 | | 96 | | 1 | | 846 | | 1,224 | |
| Earnings/(loss) before interest, income taxes and depreciation and amortization | 9,499 | | 4,264 | | 1,592 | | 149 | | (37) | | 837 | | 16,304 | |
| Depreciation and amortization | | | | | | | (4,613) | |
Interest expense (Note 17) | | | | | | | (3,812) | |
Income tax expense (Note 24) | | | | | | | (1,821) | |
| Earnings | | | | | | | 6,058 | |
Capital expenditures2 | 1,158 | | 1,944 | | 1,451 | | 100 | | — | | 55 | | 4,708 | |
Total property, plant and equipment, net (Note 11) | 51,851 | | 31,016 | | 18,766 | | 2,706 | | 4 | | 298 | | 104,641 | |
| | | | | | | | | | | | | | | | | | | | | | | |
| Year ended December 31, 2022 | Liquids Pipelines | Gas Transmission and Midstream | Gas Distribution and Storage | Renewable Power Generation | Energy Services | Eliminations and Other | Consolidated |
| (millions of Canadian dollars) | | | | | | | |
Operating revenues (Note 4) | 12,052 | | 5,426 | | 6,729 | | 582 | | 29,175 | | (655) | | 53,309 | |
| Commodity and gas distribution costs | — | | — | | (3,693) | | (16) | | (29,525) | | 645 | | (32,589) | |
| Operating and administrative | (4,287) | | (2,254) | | (1,289) | | (255) | | (49) | | (85) | | (8,219) | |
| Impairment of long-lived assets | (245) | | — | | — | | (235) | | (13) | | (48) | | (541) | |
Impairment of goodwill (Note 15) | — | | (2,465) | | — | | — | | — | | — | | (2,465) | |
Income/(loss) from equity investments (Note 13) | 785 | | 1,133 | | 1 | | 141 | | — | | (4) | | 2,056 | |
| | | | | | | |
Gain on joint venture merger transaction (Note 13) | — | | 1,076 | | — | | — | | — | | — | | 1,076 | |
Other income/(expense) (Note 27) | 59 | | 210 | | 79 | | 45 | | (5) | | (977) | | (589) | |
| Earnings/(loss) before interest, income taxes and depreciation and amortization | 8,364 | | 3,126 | | 1,827 | | 262 | | (417) | | (1,124) | | 12,038 | |
| Depreciation and amortization | | | | | | | (4,317) | |
Interest expense (Note 17) | | | | | | | (3,179) | |
Income tax expense (Note 24) | | | | | | | (1,604) | |
| Earnings | | | | | | | 2,938 | |
Capital expenditures2 | 1,418 | | 1,690 | | 1,499 | | 50 | | — | | 33 | | 4,690 | |
Total property, plant and equipment, net (Note 11) | 53,567 | | 29,666 | | 17,857 | | 3,082 | | 6 | | 282 | | 104,460 | |
| | | | | | | | | | | | | | | | | | | | | | | |
| Year ended December 31, 2021 | Liquids Pipelines | Gas Transmission and Midstream | Gas Distribution and Storage | Renewable Power Generation | Energy Services | Eliminations and Other | Consolidated |
| (millions of Canadian dollars) | | | | | | | |
Operating revenues (Note 4) | 10,581 | | 4,711 | | 4,980 | | 512 | | 26,917 | | (630) | | 47,071 | |
| Commodity and gas distribution costs | (25) | | — | | (2,147) | | — | | (27,174) | | 644 | | (28,702) | |
| Operating and administrative | (3,431) | | (1,877) | | (1,143) | | (180) | | (48) | | (33) | | (6,712) | |
| | | | | | | |
| | | | | | | |
Income/(loss) from equity investments (Note 13) | 759 | | 702 | | 42 | | 101 | | — | | (4) | | 1,600 | |
| | | | | | | |
Other income/(expense) (Note 27) | 13 | | 135 | | 385 | | 75 | | (8) | | 379 | | 979 | |
| Earnings/(loss) before interest, income taxes and depreciation and amortization | 7,897 | | 3,671 | | 2,117 | | 508 | | (313) | | 356 | | 14,236 | |
| Depreciation and amortization | | | | | | | (3,852) | |
Interest expense (Note 17) | | | | | | | (2,655) | |
Income tax expense (Note 24) | | | | | | | (1,415) | |
| Earnings | | | | | | | 6,314 | |
Capital expenditures2 | 4,051 | | 2,420 | | 1,343 | | 16 | | 1 | | 54 | | 7,885 | |
| Total property, plant and equipment, net | 52,530 | | 27,028 | | 16,904 | | 3,315 | | 23 | | 267 | | 100,067 | |
1The Liquids Pipelines segment includes the impact of a gain resulting from observable price changes in orderly transactions for an identical or similar investment of the same issuer. Investments in equity securities measured using the fair value measurement alternative are reviewed for indicators of impairment each reporting period. Fair value of financial instruments for disclosure purposes is measured using exit price. The accounting update is effective January 1, 2018 and applied on a prospective basis. We do not expect the adoption of this accounting update to have a material impact on our consolidated financial statements.
Revenue from Contracts with Customers
ASU 2014-09 was issued in 2014 with the intent of significantly enhancing consistency and comparability of revenue recognition practices across entities and industries. The new standard establishes a single, principles-based five-step model to be applied to all contracts with customers and introduces new and enhanced disclosure requirements. It also requires the use of more estimates and judgments than the present standards in addition to additional disclosures. The new standard is effective January 1, 2018. The new standard permits either a full retrospective method of adoption with restatement of all prior periods presented, or a modified retrospective method with the cumulative effect of applying the new standard recognized as an adjustment to opening retained earnings in the period of adoption. We have decided to adopt the new standard using the modified retrospective method.
We have reviewed our revenue contracts in order to evaluate the effect of the new standard on our revenue recognition practices. Based on our assessment to-date, the adoption of the new standard will have the following impact to our financial statements:
A change in presentation in the Gas Distribution business related to payments to customers under the earnings sharing mechanism which are currently shown as an expense in the
Consolidated Statements of Earnings. Under the new standard, these payments will be reflected as a reduction of revenue.
Estimates of variable consideration, required under the new standard for certain Liquids Pipelines, Gas Transmission and Midstream and Green Power and Transmission revenue contracts as well as the allocation of the transaction price for certain Liquids Pipelines revenue contracts, may result in changes to the pattern or timing of revenue recognition for those contracts.
Non-cash consideration received in the formderecognition of a percentage of the products derived from processing natural gas in the Gas Transmission and Midstream business was previously accounted for as revenue when the commodity was sold to third parties. Under the new standard, the non-cash consideration will be accounted for as revenue when processing services are performed. The commodity will continue to be accounted for as revenue when it is subsequently sold to third parties. The impact of this change will be an increase in costs and revenuesnet regulatory liability due to the recognitiondiscontinuance of this non-cash consideration.
regulatory accounting for our Southern Lights Pipeline (Note 7).Service fee revenue, from processing natural gas for certain contracts in the Gas Transmission and Midstream business whereby Enbridge purchases natural gas at the wellhead, then processes and subsequently sells the gas, was previously presented as revenue. Under the new standard, processing fees charged on natural gas purchased by Enbridge are presented as a reduction2Includes equity component of commodity costs upon the transfer of control of the natural gas at the wellhead.
AFUDC.Revenue from certain contracts in the Gas Transmission and Midstream business that provide for Enbridge to process and sell customers’ natural gas and retain a percentage of the resulting processed natural gas and/or NGLs as payment for processing services rendered, commonly referred to as Percentage of Proceeds and Percentage of Liquids contracts, was previously presented on a gross basis whereby Enbridge recorded one hundred percent of the value of the natural gas and products sold as revenue, with the cost of the natural gas purchased recorded as commodity cost. Under the new standard only Enbridge’s share of the products retained and sold is presented as revenue and no commodity cost is recorded.
Certain payments received from customers to offset the cost of constructing assets required to provide services to those customers, referred to as Contributions in Aid of Construction (CIAC) were previously recorded as reductions of property, plant and equipment regardless of whether the amounts were imposed by regulation or negotiated. Under the new standard, negotiated CIACs are deemed to be advance payments for services and must be recognized as revenue when those future services are provided. Negotiated CIACs will be accounted for as deferred revenue and recognized over the term of the associated revenue contract.
Upon adoption, we will recognize the significant cumulative effect of initially applying the new standard as an increase in the opening balance of retained deficit of approximately $120 million, an increase in property, plant and equipment of $130 million and an increase in deferred revenue of $120 million, subject to final determination, as at January 1, 2018. The adoption of the new standard will also result in changes in classification between Revenue and Commodity costs as discussed above.
We have also developed and tested processes to generate the disclosures which will be required under the new standard commencing in the first quarter of 2018.
4. SEGMENTED INFORMATION
Effective December 31, 2017, we changed our segment-level profit measure to Earnings before interest, income taxes and depreciation and amortization from the previous measure of Earnings before interest and income taxes. We also renamed the Gas Pipelines and Processing segment to Gas Transmission and Midstream. The presentation of the prior years' tables has been revised in order to align with the current presentation.
Segmented information for the years ended December 31, 2017, 2016 and 2015 are as follows:
|
| | | | | | | | | | | | | | |
| Year ended December 31, 2017 | Liquids Pipelines |
| Gas Transmission and Midstream |
| Gas Distribution |
| Green Power and Transmission |
| Energy Services |
| Eliminations and Other |
| Consolidated |
|
| (millions of Canadian dollars) | |
| |
| |
| |
| |
| |
| |
|
| Revenues | 8,913 |
| 7,067 |
| 4,992 |
| 534 |
| 23,282 |
| (410 | ) | 44,378 |
|
| Commodity and gas distribution costs | (18 | ) | (2,834 | ) | (2,689 | ) | — |
| (23,508 | ) | 412 |
| (28,637 | ) |
| Operating and administrative | (2,949 | ) | (1,756 | ) | (960 | ) | (163 | ) | (47 | ) | (567 | ) | (6,442 | ) |
| Impairment of long-lived assets | — |
| (4,463 | ) | — |
| — |
| — |
| — |
| (4,463 | ) |
| Impairment of goodwill | — |
| (102 | ) | — |
| — |
| — |
| — |
| (102 | ) |
| Income/(loss) from equity investments | 416 |
| 653 |
| 23 |
| 6 |
| 8 |
| (4 | ) | 1,102 |
|
| Other income/(expense) | 33 |
| 166 |
| 24 |
| (5 | ) | 2 |
| 232 |
| 452 |
|
| Earnings/(loss) before interest, income tax expense, and depreciation and amortization | 6,395 |
| (1,269 | ) | 1,390 |
| 372 |
| (263 | ) | (337 | ) | 6,288 |
|
| Depreciation and amortization | | | | | | | (3,163 | ) |
| Interest expense | |
| |
| |
| |
| |
| |
| (2,556 | ) |
| Income tax recovery | |
| |
| |
| |
| |
| |
| 2,697 |
|
| Earnings | |
| |
| |
| |
| |
| |
| 3,266 |
|
Capital expenditures1 | 2,799 |
| 4,016 |
| 1,177 |
| 321 |
| 1 |
| 108 |
| 8,422 |
|
| Total assets | 63,881 |
| 60,745 |
| 25,956 |
| 6,289 |
| 2,514 |
| 2,708 |
| 162,093 |
|
|
| | | | | | | | | | | | | | |
| Year ended December 31, 2016 | Liquids Pipelines |
| Gas Transmission and Midstream |
| Gas Distribution |
| Green Power and Transmission |
| Energy Services |
| Eliminations and Other |
| Consolidated |
|
| (millions of Canadian dollars) | |
| |
| |
| |
| |
| |
| |
|
| Revenues | 8,176 |
| 2,877 |
| 2,976 |
| 502 |
| 20,364 |
| (335 | ) | 34,560 |
|
| Commodity and gas distribution costs | (12 | ) | (2,206 | ) | (1,653 | ) | 5 |
| (20,473 | ) | 334 |
| (24,005 | ) |
| Operating and administrative | (2,908 | ) | (446 | ) | (553 | ) | (173 | ) | (63 | ) | (215 | ) | (4,358 | ) |
| Impairment of long-lived assets | (1,365 | ) | (11 | ) | — |
| — |
| — |
| — |
| (1,376 | ) |
| Income/(loss) from equity investments | 194 |
| 223 |
| 12 |
| 2 |
| (3 | ) | — |
| 428 |
|
| Other income/(expense) | 841 |
| 27 |
| 49 |
| 8 |
| (8 | ) | 115 |
| 1,032 |
|
| Earnings/(loss) before interest, income tax expense, and depreciation and amortization | 4,926 |
| 464 |
| 831 |
| 344 |
| (183 | ) | (101 | ) | 6,281 |
|
| Depreciation and amortization | | | | | | | (2,240 | ) |
| Interest expense | |
| |
| |
| |
| |
| |
| (1,590 | ) |
| Income tax expense | |
| |
| |
| |
| |
| |
| (142 | ) |
| Earnings | |
| |
| |
| |
| |
| |
| 2,309 |
|
Capital expenditures1 | 3,957 |
| 176 |
| 713 |
| 251 |
| — |
| 32 |
| 5,129 |
|
| Total assets | 52,007 |
| 11,182 |
| 10,132 |
| 5,571 |
| 1,951 |
| 4,366 |
| 85,209 |
|
|
| | | | | | | | | | | | | | |
| Year ended December 31, 2015 | Liquids Pipelines |
| Gas Transmission and Midstream |
| Gas Distribution |
| Green Power and Transmission |
| Energy Services |
| Eliminations and Other |
| Consolidated |
|
| (millions of Canadian dollars) | |
| |
| |
| |
| |
| |
| |
|
| Revenues | 5,589 |
| 3,803 |
| 3,609 |
| 498 |
| 20,842 |
| (547 | ) | 33,794 |
|
| Commodity and gas distribution costs | (9 | ) | (3,002 | ) | (2,349 | ) | 4 |
| (20,443 | ) | 558 |
| (25,241 | ) |
| Operating and administrative | (2,748 | ) | (506 | ) | (536 | ) | (143 | ) | (66 | ) | (132 | ) | (4,131 | ) |
| Impairment of long-lived assets | (80 | ) | (16 | ) | — |
| — |
| — |
| — |
| (96 | ) |
| Impairment of goodwill | — |
| (440 | ) | — |
| — |
| — |
| — |
| (440 | ) |
| Income/(loss) from equity investments | 296 |
| 200 |
| (10 | ) | 2 |
| (9 | ) | (4 | ) | 475 |
|
| Other income/(expense) | (15 | ) | 4 |
| 49 |
| 2 |
| — |
| (742 | ) | (702 | ) |
| Earnings/(loss) before interest, income tax expense, and depreciation and amortization | 3,033 |
| 43 |
| 763 |
| 363 |
| 324 |
| (867 | ) | 3,659 |
|
| Depreciation and amortization | | | | | | | (2,024 | ) |
| Interest expense | | | | | | | (1,624 | ) |
| Income tax expense |
|
|
|
|
|
|
|
|
|
|
|
| (170 | ) |
| Loss | | | | | | | (159 | ) |
Capital expenditures1 | 5,884 |
| 385 |
| 858 |
| 68 |
| — |
| 80 |
| 7,275 |
|
| |
1 | Includes allowance for equity funds used during construction. |
The measurement basis for preparation of segmented information is consistent with theour significant accounting policies(Note 2).
Our largest non-affiliated customer accounted for approximately 11.8%, 18.0%, and 21.8% of our third-party revenues for the years ended December 31, 2017, 2016 and 2015, respectively. A second customer accounted for approximately 10.4% of our third-party revenues for the year ended December 31, 2016. A third customer accounted for approximately 10.8% of our third-party revenues for the year ended December 31, 2015. Revenues from these three customers are primarily reported in the Energy Services segment.
OUT-OF-PERIOD ADJUSTMENT
Earnings attributable to common shareholders for the year ended December 31, 2015 were increased by an out-of-period adjustment of $71 million in respect of an overstatement of deferred income tax expense in 2013 and 2014.
GEOGRAPHIC INFORMATION
Revenues1
| | | | | | | | | | | |
| Year ended December 31, | 2023 | 2022 | 2021 |
| (millions of Canadian dollars) | | | |
| Canada | 23,781 | | 27,498 | | 20,474 | |
| US | 19,868 | | 25,811 | | 26,597 | |
| | 43,649 | | 53,309 | | 47,071 | |
|
| | | | | | |
| Year ended December 31, | 2017 |
| 2016 |
| 2015 |
|
| (millions of Canadian dollars) | | | |
| Canada | 18,076 |
| 12,470 |
| 11,087 |
|
| United States | 26,302 |
| 22,090 |
| 22,707 |
|
| | 44,378 |
| 34,560 |
| 33,794 |
|
1Revenues are based on the country of origin of the product or service sold.
Property, Plant and Equipment1
| | | | | | | | |
| December 31, | 2023 | 2022 |
| (millions of Canadian dollars) | | |
| Canada | 48,570 | | 47,602 | |
| US | 56,071 | | 56,858 | |
| | 104,641 | | 104,460 | |
|
| | | | |
| December 31, | 2017 |
| 2016 |
|
| (millions of Canadian dollars) | |
| |
|
| Canada | 46,025 |
| 32,008 |
|
| United States | 44,686 |
| 32,276 |
|
| | 90,711 |
| 64,284 |
|
1Amounts are based on the location where the assets are held.
5.Change in Reportable Segments
Effective January 1, 2024, to better align how the CODM reviews operating performance and resource allocation across operating segments, we transferred our Canadian and US crude oil businesses from the Energy Services segment to the Liquids Pipelines segment. The Energy Services segment will cease to exist and the remainder of the business will be reported in the Eliminations and Other segment. Beginning in the first quarter of 2024, prior period comparable results for segmented information will be recast to reflect the change in reportable segments. This segment reporting change will have no impact on our consolidated results.
6. EARNINGS PER COMMON SHARE
BASIC
Earnings per common share is calculated by dividing earnings attributable to common shareholders by the weighted average number of common shares outstanding. On December 30, 2021, we closed the sale of our minority ownership in Noverco. The weighted average number of common shares outstanding has beenwas reduced by our pro-rata weighted average interest in our own common shares of 13approximately 2 million as at December 31, 2017 and 2016, and 12 million as at December 31, 20152021 resulting from our reciprocal investment in Noverco.
DILUTED
The treasury stock method is used to determine the dilutive impact of stock options.options and RSUs. This method assumes any proceeds from the exercise of stock options and vesting of RSUs would be used to purchase common shares at the average market price during the period.
Weighted average shares outstanding used to calculate basic and diluted earnings per share are as follows:
| | | December 31, | 2017 |
| 2016 |
| 2015 |
| December 31, | 2023 | 2022 | 2021 |
| (number of shares in millions) | |
| |
| |
| (number of shares in millions) | | |
| Weighted average shares outstanding | 1,525 |
| 911 |
| 847 |
|
| Effect of dilutive options | 7 |
| 7 |
| — |
|
| Effect of dilutive options and RSUs | |
| Diluted weighted average shares outstanding | 1,532 |
| 918 |
| 847 |
|
For the years ended December 31, 2017, 20162023, 2022 and 2015, 14,271,615, 10,803,6722021, 19.3 million, 10.4 million and 36,005,043,18.6 million, respectively, of anti-dilutive stock options with a weighted average exercise price of $56.71, $52.92$54.42, $56.49 and $40.26,$52.89, respectively, were excluded from the diluted earnings per common share calculation.
6.7. REGULATORY MATTERS
GENERAL INFORMATION ON RATE REGULATION AND ITS ECONOMIC EFFECTS
We record assets and liabilities that result from the regulated ratemaking processprocesses that would not be recorded under US GAAP for non-regulated entities. See Note 2 - Significant Accounting Policies for further discussion.
A number of our businesses are subject to regulation by the NEB. We also collect and set aside funds to cover future pipeline abandonment costs for all NEB regulated pipelines as a result of the NEB’s regulatory requirements under LMCI (Note 13). Amounts expected to be paid to cover future abandonment costs are recognized as long-term regulatory liabilities. Our significant regulated businesses and otherthe related accounting impacts are described below.
Liquids PipelinesUnder the current authorized rate structure for certain operations, income tax costs are recovered in rates based on the current income tax payable and do not include accruals for deferred income tax. However, as income taxes become payable as a result of the reversal of temporary differences that created the deferred income taxes, it is expected that rates will be adjusted to recover these taxes. Since most of these temporary differences are related to property, plant and equipment costs, this recovery is expected to occur over the life of the related assets. In the absence of rate-regulated accounting, this regulatory tax asset and the related earnings impact would not be recorded.
LIQUIDS PIPELINES
Canadian Mainline
Canadian Mainline includes the Canadian portion of our Mainline system. The CTS which governed tolls paid for products shipped on the mainline systemCanadian Mainline, with the exception of Lines 8 and 9 which are tolled on a separate basis, expired on June 30, 2021 at which point the tolls in place became interim. Enbridge has reached an agreement on a new negotiated settlement, the Mainline Tolling Settlement (MTS), for tolls on its Mainline System. The settlement is subject to regulation byregulatory approval and the NEB. Canadian Mainlineterm is seven and a half years through the end of 2028, with revised interim tolls (excluding Lines 8 and 9) are currently governed byeffective on July 1, 2023. The MTS continues with the 10-year CTS, which establishesprevious CTS framework with a Canadian Local Toll for all volumes shipped on the Canadian Mainline and an International Joint Tariff for all volumes shipped from western Canadian receipt points to delivery points on the Lakehead System and delivery points on the Canadian Mainline downstream of theour Lakehead System. The CTS was negotiated with shippers in accordance with NEB guidelines, was approved by the NEB in June 2011 and took effect July 1, 2011. Under the CTS,We have recognized a regulatory asset is recognizedof $1.9 billion as at December 31, 2023 (2022 - $2.1 billion) to offset deferred income taxes, as a NEBCER rate order governing flow-through income tax treatment permits future recovery. No other material regulatory assets or liabilities are recognized under the terms of the CTS.MTS. During the year ended December 31, 2023, we wrote off $160 million related to regulatory tax assets and $40 million of regulatory deferred tax liabilities that are no longer probable to be flowed through future tolls.
Southern Lights Pipeline
The United States portionUS and Canadian portions of the Southern Lights Pipeline isare regulated by the FERC and the Canadian portion of the Southern Lights Pipeline is regulated by the NEB.CER, respectively. Shippers on the Southern Lights Pipeline are subject to long-term transportation contracts under a cost-of-service toll methodology. Toll adjustments are filed annually with the regulators. Tariffsregulators and provide for the recovery of allowable operating and debt financing costs, plus a pre-determined after-tax rate of return on equity (ROE) of 10%. During the fourth quarter of 2023, Southern Lights Pipeline tolls are based oncompleted an open season to negotiate new transportation service agreements effective 2025. We do not expect to renew the agreements under a deemed 70% debtcost-of-service toll methodology, therefore Southern Lights Pipeline is no longer subject to rate-regulated accounting. As a result, $151 million of net regulatory liabilities, $92 million of regulatory tax assets and 30% equity structure.$23 million of regulatory deferred tax liabilities were derecognized in the year.
Gas Transmission and Midstream
GAS TRANSMISSION AND MIDSTREAM
British Columbia Pipeline and Maritimes & Northeast Canada
British Columbia Field Services
Under(BC) Pipeline and Maritimes & Northeast Canada (M&N Canada) are regulated by the current NEB-authorized rate structure, income tax costsCER. Rates are recovered in tollsapproved by the CER through negotiated toll settlement agreements based on cost-of-service. Both our BC Pipeline and M&N Canada systems currently operate under the current income tax payableterms of their respective 2022 - 2026 and do not include accruals2022 - 2023 settlement agreements, which stipulate an allowable ROE and the continuation and establishment of certain deferral and variance accounts. The toll settlement agreement for deferred income tax. However, as income taxes become payable asM&N Canada expired in December 2023. M&N Canada reached a result oftoll settlement with shippers for the reversal of timing differences that createdeffective period from January 1, 2024 to December 31, 2025. On November 28, 2023, M&N Canada filed the deferred income taxes, it2024 - 2025 toll settlement agreement with the CER for review and approval. A CER decision is expected that transportation and field services tolls will be adjusted to recover these taxes. Since mostin the first quarter of these timing differences are related to property, plant and equipment costs, this recovery is expected to occur over the life2024.
US Gas Transmission
Most of those assets.
Spectra Energy Partners, LP
SEP'sour US gas transmission and storage services are regulated by the FERC. Current rates are governed byFERC and may also be subject to the applicable FERC-approvedjurisdiction of various other federal, state and local agencies. The FERC regulates natural gas tarifftransmission in US interstate commerce including the establishment of rates for services, while fee-basedrates for intrastate commerce and/or gathering services are governed by the applicable state oil and gas commissions.
For information related to regulatory assets acquired in the Merger Transaction for Union Gas, British Columbia (BC) Pipelines, BC Field Services and SEP, refer to Note 7 - Acquisitions and Dispositions.
Gas Distribution
Enbridge Gas Distribution Inc.
EGD’s gas distribution operations are regulated by the OEB. Ratesstate gas commissions. Cost-of-service is the basis for the years ended December 31, 2017calculation of regulated tariff rates, although the FERC also allows the use of negotiated and 2016 were setdiscounted rates within contracts with shippers that may result in accordance with parameters established bya rate that is above or below the customized incentiveFERC-regulated recourse rate plan (IR Plan). The customized IR Plan, inclusive of the requested capital investment amounts and an incentive mechanism providing the opportunity to earn above the allowed ROE, was approved, with modifications, by the OEB in 2014. The approved customized IR Plan is for establishing rates for 2014 through 2018.that service.
As part of the customized IR Plan, the OEB approved the adoption of a new approach for determining net salvage percentages to be included within EGD’s approved depreciation rates, as compared with the traditional approach previously employed. The new approach results in lower net salvage percentages for EGD, and therefore lowers depreciation rates and future removal and site restoration reserves. The customized IR Plan also includes an earnings sharing mechanism, whereby any return over the allowed rate of return for a given year under the customized IR Plan will be shared equally with customers. Within annual rate proceedings for 2015 through 2018, the customized requires allowed revenues, and corresponding rates, to be updated annually for select items.GAS DISTRIBUTION AND STORAGE
Enbridge Gas
EGD’s after-tax rate of return on common equity embedded in rates was 8.8% and 9.2% for the years ended December 31, 2017 and 2016, respectively, based on a 36% deemed common equity component of capital for regulatory purposes, in both years.
Union Gas Limited
Union Gas is regulated by the OEB. Union Gas'sEnbridge Gas' distribution rates, beginning January 1, 2014 arecommencing in 2019, were set under a five-year incentive regulation framework.Incentive Regulation (IR) framework using a price cap mechanism ending December 31, 2023. The incentive regulation frameworkprice cap mechanism establishes new rates at the beginning of each year through an annual base rate escalation at inflation less a 0.3% stretch factor, annual updates for certain costs to be passed through to customers, and where applicable, the userecovery of a pricing formula rather thanmaterial discrete incremental capital investments beyond those that can be funded through the examination of revenue and cost forecasts.
base rates. The incentive regulationIR framework includes the continuation and establishment of certain deferral and variance accounts, as well as an earnings sharing mechanism that permitsrequires Enbridge Gas to share equally with customers any earnings in excess of 150 basis points over the annual OEB approved ROE.
On December 21, 2023, we received a decision from the OEB on Phase 1 of our 2024 - 2028 Incentive Regulation rate setting framework (Phase 1 Decision). The Phase 1 Decision established new interim rates effective January 1, 2024. In addition, the Phase 1 Decision resulted in the following items not approved for future recovery, and the subsequent impairments recognized for the year ended December 31, 2023:
•a portion of undepreciated capital projects in Property, plant and equipment, net and Intangible assets, net were removed from 2024 rate base of $41 million;
•undepreciated integration capital costs in Intangible assets, net were removed from 2024 rate base of $84 million;
•pre-2017 Union Gas to fully retain the return on common equity from utility operations up to 9.93%, share 50%related pension balances in Deferred amounts and other assets of any earnings between 9.93% and 10.93% with customers, and share 90% of any earnings above 10.93% with customers. Union Gas's approved after-tax return on common equity is fixed at 8.93% for the five-year incentive regulation term.$156 million.
Enbridge Gas New Brunswick Inc.
Enbridge Gas New Brunswick Inc. is regulated by the EUB. The current rates are set, as prescribed by legislation for 2018 and 2019. In 2020 all rates will be set by cost-of-service methodology.
FINANCIAL STATEMENT EFFECTS
Accounting for rate-regulated activities has resulted in the recognition of the following significant regulatory assets and liabilities:liabilities in the Consolidated Statements of Financial Position. | | | | | | | | | | | |
| December 31, | 2023 | 2022 | Recovery/Refund
Period Ends |
| (millions of Canadian dollars) | | | |
| Current regulatory assets | | | |
| Purchase gas variance | 15 | | 190 | | 2024 |
| Under-recovery of fuel costs | 75 | | 109 | | 2024 |
| | | |
| | | |
| | | |
| | | |
| | | |
| Other current regulatory assets | 380 | | 305 | | 2024 |
Total current regulatory assets1 (Note 9) | 470 | | 604 | | |
| Long-term regulatory assets | | | |
Deferred income taxes2 | 4,456 | | 4,473 | | Various |
Long-term debt3 | 348 | | 378 | | 2032-2046 |
Negative salvage4 | 180 | | 265 | | Various |
| Purchase gas variance | — | | 244 | | 2024 |
Accounting policy changes5 | — | | 219 | | 2024 |
Pension plan receivable6 | 1 | | 40 | | Various |
| Other long-term regulatory assets | 252 | | 244 | | Various |
Total long-term regulatory assets1 | 5,237 | | 5,863 | | |
| Total regulatory assets | 5,707 | | 6,467 | | |
| Current regulatory liabilities | | | |
| | | |
| Purchase gas variance | 31 | | — | | 2024 |
| | | |
| | | |
| | | |
| Other current regulatory liabilities | 276 | | 167 | | 2024 |
Total current regulatory liabilities7 | 307 | | 167 | | |
| Long-term regulatory liabilities | | | |
Future removal and site restoration reserves8 | 1,693 | | 1,615 | | Various |
Regulatory liability related to US income taxes9 | 854 | | 918 | | 2050-2072 |
Pipeline future abandonment costs (Note 23) | 745 | | 610 | | Various |
Pension plan payable6 | 143 | | 231 | | Various |
| Other long-term regulatory liabilities | 86 | | 250 | | Various |
Total long-term regulatory liabilities7 | 3,521 | | 3,624 | | |
| Total regulatory liabilities | 3,828 | | 3,791 | | |
|
| | | | | |
| December 31, | Recovery/Refund Period Ends | 2017 |
| 2016 |
|
| (millions of Canadian dollars) | | |
| |
|
| Regulatory assets/(liabilities) | | |
| |
|
| Liquids Pipelines | | |
| |
|
| Deferred income taxes | Various | 1,492 |
| 1,270 |
|
| Tolling deferrals | 2018 | (34 | ) | (37 | ) |
| Recoverable income taxes | Through 2030 | 46 |
| 51 |
|
Pipeline future abandonment costs1 | Various | (141 | ) | (88 | ) |
| Gas Transmission and Midstream | | | |
| Deferred income taxes | Various | 717 |
| — |
|
Regulatory liability related to income taxes2 | Various | (1,078 | ) | — |
|
| Other | Various | (16 | ) | — |
|
| Gas Distribution | | | |
| Deferred income taxes | Various | 1,000 |
| 385 |
|
Purchased gas variance3 | Various | 51 |
| 5 |
|
Pension plans and OPEB4 | Various | 102 |
| 116 |
|
| Constant dollar net salvage adjustment | 2018 | 38 |
| 38 |
|
| Future removal and site restoration reserves | Various | (1,066 | ) | (606 | ) |
| Site restoration clearance adjustment | Various | (31 | ) | (109 | ) |
| Other | Various | 31 |
| (4 | ) |
| |
1 | Funds collected are included in Restricted long-term investments (Note 13).
|
| |
2 | Relates to the establishment of a regulatory liability as a result of the United States tax reform legislation dated December 22, 2017. |
| |
3 | Purchase gas variance is the difference between the actual cost and the approved cost of natural gas reflected in rates. EGD and Union Gas have been granted OEB approval to refund this balance to, or to collect this balance from, customers on a rolling 12-month basis via the Quarterly Rate Adjustment Mechanism process. |
| |
4 | The balances are excluded from the rate base and do not earn an ROE. |
1Current regulatory assets are included in Other current assets, while long-term regulatory assets are included in Deferred amounts and other assets.
OTHER ITEMS AFFECTED BY RATE REGULATION
Allowance for Funds Used During Construction and Other Capitalized Costs
Under2Represents the pool method prescribed by certain regulators,regulatory offset to deferred income tax liabilities to the extent that it is not possibleexpected to identifybe included in future regulator-approved rates and recovered from customers. The recovery period depends on the carrying valuetiming of the equity componentreversal of AFUDC or its effect on depreciation. Similarly, gains and losses on the retirement of certain specific fixed assets in any given year cannot be identified or quantified.
Operating Cost Capitalization
With the approval of regulators, certain operations capitalize a percentage of specified operating costs. These operations are authorized to charge depreciation and earn a return on the net book value of such capitalized costs in future years.temporary differences. In the absence of rate regulation,rate-regulated accounting, this regulatory balance and the related earnings impact would not be recorded. The balance as at December 31, 2023 is net of regulatory deferred tax write-offs.
3Represents our regulatory offset to the fair value adjustment to debt acquired in our merger with Spectra Energy Corp. (Spectra Energy). The offset is viewed as a portionproxy for the regulatory asset that would be recorded in the event such debt was extinguished at an amount higher than the carrying value.
4The negative salvage balance represents the recovery in future rates of such operatingthe actual cost of removal of previously retired or decommissioned plant assets, as approved by the FERC.
5In 2022, this deferral primarily consisted of unamortized accumulated actuarial gains/losses and past service costs incurred by Union Gas Limited, relating to the period up to our merger with Spectra Energy, which were previously recorded in AOCI. The amortization of this balance is recognized as a component of accrual-based pension expenses, which are included in Other income/(expense) and recovered in rates, as previously approved by the OEB. The Phase 1 Decision disallowed recovery of the remaining balance related to pre-2017 pension amounts and was impaired with a nil balance as at December 31, 2023. The residual balance in this account pertains to the impact of other accounting changes during the deferred rebasing period and were approved for disposition in 2024 in the Phase 1 Decision and subsequently transferred to Other current regulatory assets as at December 31, 2023.
6Represents the regulatory offset to our pension liability to the extent that it is expected to be included in regulator-approved future rates and recovered from customers. The settlement period for this balance is not determinable. In the absence of rate-regulated accounting, this regulatory balance and the related pension expense would be recorded in earnings and OCI.
7Current regulatory liabilities are included in Other current liabilities, while long-term regulatory liabilities are included in Other long-term liabilities.
8Future removal and site restoration reserves consists of amounts collected from customers, with the approval of the OEB, to fund future costs of removal and site restoration relating to property, plant and equipment. These costs are collected as part of the depreciation expense charged on property, plant and equipment that is reflected in rates. The settlement of this balance will occur over the long-term as costs are incurred. In the absence of rate-regulated accounting, depreciation rates would not include a charge for removal and site restoration and costs would be charged to earnings inas incurred with recognition of revenue for amounts previously collected.
9The regulatory liability related to US income taxes resulted from the year incurred.
EGD entered into a services contract relatingUS tax reform legislation dated December 22, 2017. These balances will be refunded to asset management initiatives. The majority of the costs, primarily consulting fees, are being capitalized to gas mainscustomers in accordance with regulatory approval. As at December 31, 2017 and 2016, the net book value of these costs included in gas mains in Property, plant and equipment, net was $118 million and $125 million, respectively. Inrespective rate settlements approved by the absence of rate regulation accounting, some of these costs would be charged to earnings in the year incurred.FERC.
7.8. ACQUISITIONS AND DISPOSITIONS
ACQUISITIONS
Spectra Energy CorpAitken Creek Gas Storage
On February 27, 2017, EnbridgeNovember 1, 2023, through a wholly-owned Canadian subsidiary, we acquired a 93.8% interest in Aitken Creek Gas Storage Facility and Spectra Energy combineda 100% interest in Aitken Creek North Gas Storage Facility (collectively, Aitken Creek), located in BC, Canada, for $400 million, subject to other customary closing adjustments (the Aitken Creek Acquisition). Aitken Creek is the Merger Transaction for a purchase price of $37.5 billion. Under the terms of the Merger Transaction, Spectra Energy shareholders received 0.984 shares of Enbridge for each share of Spectra Energy common stock that they owned, giving us 100% ownership of Spectra Energy.
Consideration offered to complete the Merger Transaction included 691 million common shares of Enbridge at US$41.34 per share, based on the February 24, 2017 closing price on the New York Stock Exchange (NYSE), for a total value of $37,429 million in common shares issued to Spectra Energy shareholders, plus approximately $3 million in cash in lieu of any fractional shares, and 3.5 million share options with a fair value of $77 million, that were exchanged for Spectra Energy’s outstanding stock compensation awards.
Spectra Energy, through its subsidiaries and equity affiliates, owns and operates a large and diversified portfolio of complementary natural gas-related energy assets and is one of North America’s leadingonly underground natural gas infrastructure companies. Spectra Energy also ownsstorage facility in BC and operates a crude oil pipeline system that connects Canadianto all major natural gas pipelines in western Canada. The Aitken Creek Acquisition enables us to continue to meet regional energy needs and United States producers to refineries in the United States Rocky Mountain and Midwest regions. The combination brings together two highly complementary platforms to create North America’s largest energy infrastructure company and meaningfully enhances customer optionality, positioning ussupport increasing demand for long-term growth opportunities, and strengthening our balance sheet.liquefied natural gas (LNG) exports.
The Merger Transaction has beenWe accounted for as a business combination underthe Aitken Creek Acquisition using the acquisition method of accounting as prescribed by Accounting Standards Codification (ASC)ASC 805 Business Combinations. TheIn accordance with valuation methodologies described in ASC 820 Fair Value Measurements, the acquired tangible and intangible assets and assumed liabilities are recorded at their estimated fair values as at the date of acquisition.
The following table summarizes the estimated preliminary fair values that were assigned to the net assets of Aitken Creek:
| | | | | |
| November 1, 2023 |
| (millions of Canadian dollars) | |
| Fair value of net assets acquired: | |
| Current assets (a) | 105 | |
| Property, plant and equipment (b) | 466 | |
| Current liabilities | 20 | |
| Long-term liabilities (c) | 130 | |
| Goodwill (d) | 46 | |
| Purchase price: | |
| Cash | 397 | |
| Additional consideration (e) | 70 | |
| 467 | |
a) Current assets consist primarily of inventory which is short-term in nature and represents natural gas held in storage. Fair value was determined using the market price of natural gas at the date of acquisition.
b) Aitken Creek's property, plant and equipment constitutes an integrated system of cavern storage facilities, associated header pipeline, and land and right-of-ways. The depreciated replacement cost approach was adopted as the primary valuation methodology to determine the fair value of property, plant and equipment, excluding the reservoir storage asset. In determining replacement cost, both indirect costing using relevant inflation indices and direct costing using relevant market quotes were utilized. Adjustments were then applied for physical deterioration as well as functional and economic obsolescence.
Fair value of the reservoir storage asset was determined using a residual approach whereby the adjusted purchase price allocationwas allocated to the fair value of the net tangible assets, excluding the reservoir storage asset, with the remaining value allocated to the reservoir storage asset. The income approach was also utilized to corroborate that the cash flows attributable to the reservoir storage asset support the residual value.
c) Long-term liabilities consist primarily of a deferred income tax liability arising from temporary differences between the tax bases of assets and liabilities and their carrying values for accounting purposes at the date of acquisition.
d) Goodwill is primarily attributable to the recognition of a deferred income tax liability. The goodwill balance recognized has been completed as at December 31, 2017, along with the allocation of goodwillassigned to reporting units (Note 15). Our reporting units are equivalent to our identified segments with the exception of the Gas Transmission and Midstream segment and is not tax deductible.
e) The $70 million of additional consideration recognized in the purchase price represents the fair value of derivative contracts and working gas as at March 31, 2023.
Upon completion of the Aitken Creek Acquisition, we began consolidating Aitken Creek. For the period beginning November 1, 2023 through to December 31, 2023, operating revenues and earnings attributable to common shareholders generated by Aitken Creek were immaterial. The impact to our supplemental pro forma consolidated operating revenues and earnings attributable to common shareholders for the years ended December 31, 2023 and 2022, as if the Aitken Creek Acquisition had been completed on January 1, 2022, was also immaterial.
Acquisitions of US Gas Utilities
On September 5, 2023, we announced that Enbridge had entered into three separate definitive agreements with Dominion Energy, Inc. to acquire The East Ohio Gas Company, Questar Gas Company and its related Wexpro companies, and Public Service Company of North Carolina for an aggregate purchase price of $19.1 billion (US$14.0 billion), comprised of $12.8 billion (US$9.4 billion) of cash consideration and $6.3 billion (US$4.6 billion) of assumed debt, subject to customary closing adjustments (together, the Acquisitions). The Acquisitions are expected to close in 2024, subject to the satisfaction of customary closing conditions including the receipt of certain regulatory approvals, which are not cross-conditional.
On September 8, 2023, we closed a public offering of 102,913,500 common shares at a price of $44.70 per share for gross proceeds of $4.6 billion which is composedintended to finance a portion of the aggregate cash consideration payable for the Acquisitions.
We closed two reporting units:offerings in September 2023 and four offerings in November 2023 for aggregate principal amounts of US$5.5 billion and $1.0 billion. The proceeds from the September 2023 offerings and a portion of the November 2023 offerings are intended to finance a portion of the aggregate cash consideration payable for the Acquisitions. Refer to Note 17 - Debt for further details on the debt issuances and credit facility obtained to support the Acquisitions.
Tres Palacios Holdings LLC
On April 3, 2023, we acquired Tres Palacios Holdings LLC (Tres Palacios) for $451 million (US$335 million) of cash. Tres Palacios is a natural gas transmissionstorage facility located in the US Gulf Coast and gas midstream.its infrastructure serves Texas gas-fired power generation and LNG exports, as well as Mexico pipeline exports.
We allocated assets with a fair value of $790 million (US$588 million) to Property, plant and equipment, net, of which $254 million (US$189 million) relates to storage cavern right-of-use assets, and recorded the related lease liabilities of $7 million (US$5 million) and $248 million (US$184 million) to Current portion of long-term debt and Long-term debt, respectively, in the Consolidated Statements of Financial Position. The acquired assets are included in our Gas Transmission and Midstream segment.
Tri Global Energy, LLC
On September 27, 2022, through a wholly-owned US subsidiary, we acquired all of the outstanding common units in TGE for cash consideration of $295 million (US$215 million) plus potential contingent payments of up to $72 million (US$53 million) dependent on the achievement of performance milestones by TGE (the TGE Acquisition).TGE is an onshore renewable project developer in the US with a development portfolio of wind and solar projects. The TGE Acquisition enhances Enbridge's renewable power platform and accelerates our North American growth strategy.
We accounted for the TGE Acquisition using the acquisition method as prescribed by ASC 805 Business Combinations. In accordance with valuation methodologies described in ASC 820 Fair Value Measurements, the acquired assets and assumed liabilities are recorded at their estimated fair values as at the date of acquisition.
The following table summarizes the estimated fair values that were assigned to the net assets of Spectra Energy:
| | | | | |
| September 27, 2022 |
| | |
February 27, | 2017 |
|
| (millions of Canadian dollars) | |
|
| Fair value of net assets acquired: | |
|
Current assets (a) | 2,4325 | |
Property, plant and equipment net (b) | 33,5553 | |
Restricted long-termLong-term investments | 1448 | |
Long-term investments (c) | 5,000 |
|
Deferred amounts and other assets (d) | 2,390 |
|
Intangible assets net (e)(a) | 1,288117 | |
| Long-term assets | 3 | |
Current liabilities (a) | (3,98261 | | )
Long-term debt (d) | (21,44418 | | )
Other long-termLong-term liabilities (b) | (1,983105 | | )
Deferred income taxes (b)Goodwill (c) | (7,670392 | | )
Noncontrolling interests (f)Purchase price: | | (8,877) |
| Cash | 853295 | |
Goodwill (g)Contingent consideration (d) | 36,65649 | |
| 344 | | 37,509
|
Purchase price: | |
|
Common shares | 37,429 |
|
Cash | 3 |
|
Fair value of outstanding earned stock compensation awards recorded in Additional paid-in capital | 77 |
|
| 37,509 |
|
| |
a)
| Accounts receivable is comprised primarily of customer trade receivables and natural gas imbalances. As such, the fair value of accounts receivable approximates the net carrying value of $1,174 million. The gross amount due of $1,190 million, of which $16 million is not expected to be collected, is included in current assets. |
Duringa) Intangible assets consist of compensation expected to be earned by TGE on existing development contracts once certain project development milestones are met. Fair value was determined using a discounted cash flow method which is an income-based approach to valuation that estimates the fourth quarterpresent value of 2017, we identifiedfuture projected benefits from the contracts. The intangible assets will be amortized on a straight-line basis over an expected useful life of three and a half years.
b) Long-term liabilities consist primarily of obligations payable to third parties which are contingent on milestones being met for certain transactions that were not reflectedprojects. Fair value represents the present value of the future cash flow payments at the date of the TGE Acquisition.
c) Goodwill is primarily attributable to expected future returns from new opportunities to develop wind and solar projects, as well as enhanced scale and operational diversity of our renewable projects portfolio. The goodwill balance recognized has been assigned to our Renewable Power Generation segment and is tax deductible over 15 years.
d) We agreed to pay additional contingent consideration of up to US$53 million to TGE's former
common unit holders if performance milestones are met on certain projects. The US$36 million of contingent consideration recognized in the purchase price equation. This resulted in a $67 million and $548 million increase in current assets and current liabilities, respectively, and a $481 million decrease in long-term debt.
| |
b)
| We have appliedrepresents the valuation methodologies described in ASC 820 Fair Value Measurements and Disclosures, to value the property, plant and equipment purchased. The fair value of Spectra Energy’s rate-regulated property, plant and equipment was determined using a market participant perspective, which is their carrying amount. The fair value of the remaining non-regulated property, plant and equipment was determined primarily using variations of the income approach, which is based on the present value of the future after-tax cash flows attributable to each non-regulated asset. Some of the more significant assumptions inherent in the development of the values, from the perspective of a market participant, include, but are not limited to, the amount and timing of projected future cash flows (including revenue and profitability); the discount rate selected to measure the risks inherent in the future cash flows; the assessment of the asset’s life cycle; the competitive trends impacting the asset; and customer turnover.
|
During the third quarter of 2017, Spectra Energy's right-of-way agreements were reclassified from intangible assets to property, plant and equipment to conform the presentation of these agreements with our accounting policy pertaining to rights-of-way. The purchase price allocation above reflects this reclassification, which amounted to $830 million as at February 27, 2017. There is no change in the amortization period for the right-of-way agreements as a result of this reclassification.
During the fourth quarter of 2017, we finalized our fair value measurement of contingent
consideration at the BC Pipeline & Field Services businesses, which resulted in decreases to property, plant and equipmentdate of $1,955 million and deferred income tax liabilities of $661 million as at February 27, 2017.
| |
c)
| Long-term investments represent Spectra Energy’s 50% equity investment in DCP Midstream, Gulfstream Natural Gas System, L.L.C., Nexus Gas Transmission, LLC (Nexus), Steckman Ridge LP, Islander East Pipeline Company, L.L.C., Southeast Supply Header L.L.C., and 20% equity interest in PennEast Pipeline Company LLC (PennEast). The fair value of these investments was determined using an income approach. |
d) Fair value of long-term debt was determined based on the current underlying Government of Canada and United States Treasury interest rates on the corresponding bonds, as well as an implied credit spread based on current market conditions and resulted in an increase in the book value of debt of $1.5 billion.acquisition. The fair value adjustment to long-term debt related to rate-regulated entities of $629 million also results in a regulatory offset in Deferred amounts and other assets in the Consolidated Statements of Financial Position.was determined using an income-based approach.
During the fourth quarter of 2017, deferred amounts and other assets decreased by $530 million as at February 27, 2017 due to the finalization of BC Pipelines & Field Services' fair value measurement, as discussed under (b) above.
During the fourth quarter of 2017, we identified certain transactions that were not reflected in the purchase price equation. This resulted in a $481 million decrease in long-term debt, as discussed under (a) above.
| |
e)
| Intangible assets primarily consist of customer relationships in the non-regulated business, which represent the underlying relationship from long-term agreements with customers that are capitalized upon acquisition, determined using the income approach. Intangible assets are amortized on a straight-line basis over their expected lives. |
During the third quarter of 2017, intangible assets decreased by $830 million as at February 27, 2017 due to a reclassification to property, plant and equipment, as discussed under (b) above.
The fair value of intangible assets acquired through the Merger Transaction, by major classes is as follows:
|
| | | | |
| | Weighted Average | Fair |
|
| As at February 27, 2017 | Amortization Rate | Value |
|
| (millions of Canadian dollars) | | |
Customer relationships1 | 3.7 | % | 739 |
|
Project agreement2 | 4.0 | % | 105 |
|
| Software | 11.1 | % | 329 |
|
| Other | 4.2 | % | 115 |
|
| | | 1,288 |
|
| |
1 | Represents customer relationships in the non-regulated business, which were capitalized upon acquisition. |
| |
2 | Represents a project agreement between SEP, NextEra Energy, Inc., Duke Energy Corporation (Duke Energy) and Williams Partners L.P. In accordance with the agreement, payments will be made, based on our proportional ownership interest in Sabal Trail Transmission, LLC (Sabal Trail), as certain milestones of the project are met. Amortization of the intangible asset began on July 3, 2017, when Sabal Trail was placed into service (Note 12). |
| |
f)
| The fair value of Spectra Energy’s noncontrolling interests includes approximately 78.4 million SEP common units outstanding to the public, valued at the February 24, 2017 closing price of US$44.88 per common unit on the NYSE, and units held by third parties in Maritimes & Northeast Pipeline, L.L.C., Sabal Trail and Algonquin Gas Transmission, L.L.C., valued based on the |
underlying net assets of each reporting unit and preferred stock held by third parties in Union Gas and Westcoast Energy Inc.
During the third quarter of 2017, we finalized our fair value measurement of Sabal Trail, which resulted in an increase to noncontrolling interests of $85 million as at February 27, 2017.
| |
g)
| We recorded $36.7 billion in goodwill, which is primarily related to expected synergies from the Merger Transaction. The goodwill balance recognized is not deductible for tax purposes. Factors that contributed to the goodwill include the opportunity to expand our natural gas pipelines segment, the potential for cost and supply chain optimization synergies, existing assembled assets and work force that cannot be duplicated at the same cost by a new entrant, franchise rights and other intangibles not separately identifiable because they are inextricably linked to the provision of regulated utility service and the enhanced scale and geographic diversity which provide greater optionality and platforms for future growth. |
During the third quarter of 2017, goodwill increased by $85 million as at February 27, 2017 due to the finalizationUpon completion of the fair value measurement of Sabal Trail as discussed under (f) above.
DuringTGE Acquisition, we began consolidating TGE. For the fourth quarter of 2017, goodwill increasedperiod beginning September 27, 2022 through to December 31, 2022, operating revenues and earnings attributable to common shareholders generated by $1,824 million as at February 27, 2017 dueTGE were immaterial. The impact to the finalization of the fair value measurement of BC Pipelines & Field Services as discussed under (b) above.
Acquisition-related expenses incurredour supplemental pro forma consolidated operating revenues and earnings attributable to date were approximately $231 million. Costs incurredcommon shareholders for the years ended December 31, 20172022 and 20162021, as if the TGE Acquisition had been completed on January 1, 2021, was also immaterial.
Moda Midstream Operating, LLC
On October 12, 2021, through a wholly-owned US subsidiary, we acquired all of $180the outstanding membership interests in Moda for $3.7 billion (US$3.0 billion) of cash plus potential contingent payments of up to US$150 million dependent on performance of the assets (the Moda Acquisition). Moda owns and $51operates a light crude export platform with very large crude carrier capability. The Moda Acquisition aligns with and advances our US Gulf Coast export strategy and enables connectivity to low-cost and long-lived reserves in the Permian and Eagle Ford basins.
We accounted for the Moda Acquisition using the acquisition method as prescribed by ASC 805 Business Combinations. In accordance with valuation methodologies described in ASC 820 Fair Value Measurements, the acquired assets and assumed liabilities were recorded at their estimated fair values as at the date of acquisition.
The following table summarizes the estimated fair values that were assigned to the net assets of Moda:
| | | | | |
| October 12, 2021 |
| (millions of Canadian dollars) | |
| Fair value of net assets acquired: | |
| Current assets | 62 | |
| Property, plant and equipment (a) | 1,480 | |
| Long-term investments (b) | 427 | |
| Intangible assets (c) | 1,781 | |
| Current liabilities | 59 | |
| Long-term liabilities | 17 | |
| Goodwill (d) | 268 | |
| Purchase price: | |
| Cash | 3,755 | |
| Contingent consideration (e) | 187 | |
| 3,942 | |
a) Due to the specialized nature of Moda's property, plant and equipment, which includes groups of assets configured for use as storage facilities, pipelines and export terminals, the depreciated replacement cost approach was adopted as the primary valuation methodology. In determining replacement cost, both indirect costing using relevant inflation indices and direct costing using relevant market quotes were utilized. Adjustments were then applied for physical deterioration as well as functional and economic obsolescence. The fair value of land was determined using a market approach, which is based on rents and offerings for comparable properties.
b) Long-term investments represent Moda's 20% equity interest in Cactus II Pipeline LLC (Cactus II). The fair value of Cactus II was determined using the discounted cash flow method. The discounted cash flow method is an income-based approach to valuation which estimates the present value of future projected benefits from the investment.
c) Intangible assets consist primarily of customer relationships associated with long-term take-or-pay contracts. Fair value was determined using an income-based approach by estimating the present value of the after-tax earnings attributable to the contracts, including earnings associated with expected renewal terms, and will be amortized on a straight-line basis over an expected useful life of 10 years.
d) Goodwill is primarily attributable to uncontracted future revenues, existing assembled assets that cannot be duplicated at the same cost by a new entrant, and enhanced scale and geographic diversity which provide greater optionality and platforms for future growth. The goodwill balance recognized has been assigned to our Liquids Pipelines segment and is tax deductible over 15 years.
e) We agreed to pay additional contingent consideration of up to US$150 million respectively,to Moda's former membership interest holders if Moda's monthly volumes of crude oil loaded onto a vessel equal or exceed specified throughput levels. These performance requirements terminate the earlier of December 31, 2023 or the date the final contingent payment is made. The US$150 million of contingent consideration recognized in the purchase price represents the fair value of contingent consideration at the date of acquisition and was fully settled as at December 31, 2022.
Acquisition-related expenses incurred were approximately $21 million for the year ended December 31, 2021 and are included in Operating and administrative expense in the Consolidated Statements of Earnings.
Upon completion of the Merger Transaction,Moda Acquisition, we began consolidating Spectra Energy. SinceModa. For the closing date of February 27, 2017period beginning October 12, 2021 through to December 31, 2017, Spectra Energy has2021, Moda generated approximately $5,740$80 million in operating revenues and $2,574$9 million in earnings.earnings attributable to common shareholders.
Our supplemental pro forma consolidated financial information for the yearsyear ended December 31, 2017 and 2016,2021, including the results of operations for Spectra EnergyModa as if the Merger TransactionModa Acquisition had been completed on January 1, 20162020, are as follows:
|
| | | | |
| Year ended December 31, | 2017 |
| 2016 |
|
| (unaudited; millions of Canadian dollars) | |
| |
|
| Revenues | 45,669 |
| 40,934 |
|
Earnings attributable to common shareholders1
| 2,902 |
| 2,820 |
|
| | | | | | |
1 | Merger Transaction costs of $180 million (after-tax $131 million) were excluded from earnings for the yearYear ended December 31, 2017. | 2021 | |
| (unaudited; millions of Canadian dollars) | | |
| Operating revenues | 47,339 | | |
Earnings attributable to common shareholders1,2 | 5,771 | | |
Tupper Main and Tupper West
On April 1 2016, we acquired the Tupper Main and Tupper West gas plants and associated pipelines (the Tupper Plants) located in northeastern BC for cash considerationAcquisition-related expenses of $539 million. The purchase price for the Tupper Plants was equal$21 million (after-tax $16 million) were excluded from earnings attributable to the fair value of identifiable net assets acquired and accordingly, we did not recognize any goodwill as part of the acquisition. Transaction costs incurred by us totaled approximately $1 million and are included in Operating and administrative expense in the Consolidated Statements of Earnings. The Tupper Plants are a part of our Gas Transmission and Midstream segment.
Since the closing date through December 31, 2016, the Tupper Plants generated approximately $33 million in revenues and $22 millionin earnings before interest and income taxes. If the acquisition had closed on January 1, 2016, the Consolidated Statements of Earningscommon shareholders for the year ended December 31, 2016 would have shown revenues2021.
2Includes the amortization of $44 million and earnings before interest and income taxes of $28 million.
The final purchase price allocation was as follows:
|
| | |
April 1, | 2016 |
|
(millions of Canadian dollars) | |
|
Fair value of net assets acquired: | |
|
Property, plant and equipment | 288 |
|
Intangible assets | 251 |
|
| 539 |
|
Purchase price: | |
|
Cash | 539 |
|
OTHER ACQUISITIONS
Chapman Ranch Wind Project
On September 9, 2016, wefair value adjustments recorded for acquired a 100% interest in the 249 megawatt (MW) Chapman Ranch Wind Project (Chapman Ranch) located in Texas for cash consideration of $65 million (US$50 million), of which $62 million (US$48 million) was allocated to property, plant and equipment, long-term investments and the balance allocated to Intangible assets. On November 2, 2016, we invested a further $40intangible assets of $193 million (US$30(after-tax of $145 million) in Chapman Ranch, of which $23 million (US$17 million) was related to Property, plant and equipment and the balance related to Intangible assets. There would have been no effect on our earnings if the transaction had occurred on January 1, 2016 as the project was under construction and had not generated revenues to date. Chapman Ranch is a part of our Green Power and Transmission segment.
New Creek Wind Project
In November 2015, we acquired a 100% interest in the 103 MW New Creek Wind Project (New Creek) for cash consideration of $48 million (US$36 million), with $35 million (US$26 million) of the purchase price allocated to Property, plant and equipment and the balance allocated to Intangible assets. New Creek was placed into service in December 2016 and is a part of our Green Power and Transmission segment.
Midstream Business
On February 27, 2015, Enbridge Energy Partners, L.P. (EEP) acquired, through its partially-owned subsidiary, Midcoast Energy Partners, L.P. (MEP), the midstream business of New Gulf Resources, LLC located in Texas for $106 million (US$85 million) in cash and a contingent future payment of up to $21 million (US$17 million). The acquisition consisted of a natural gas gathering system that is in operation and is a part of our Gas Transmission and Midstream segment. Of the purchase price, we allocated $69 million (US$55 million) to Property, plant and equipment and the balance to Intangible assets. In 2016, we determined that the likelihood of making any future contingent payments was remote.
ASSETS HELD FOR SALE
US Midstream
In November 2017, we announced that we have identified certain non-core assets that we plan to sell or monetize in 2018 as they do not meet our long-term strategy. As a result, we are in the process of selling certain assets within the United States Midstream business of our Gas Transmission and Midstream segment. As at December 31, 2017, we classified these assets as held for sale and measured them at the lower of their carrying value or fair value less costs to sell, which resulted in a loss of $4.4 billion ($2.8 billion after-tax) and a related goodwill impairment of $102 million. Fair value less cost to sell was estimated using the discounted cash flow method, which was negatively impacted by prolonged decline in commodity prices and deteriorating business performance. This loss has been included within Impairment of long-lived assets and Impairment of goodwill, respectively, on the Consolidated Statements of Earnings for the year ended December 31, 2017.2021.
St. Lawrence Gas Company, Inc.DISPOSITIONS
In August 2017,Athabasca Regional Oil Sands System
On October 5, 2022, we entered intoclosed the sale of an agreement11.6% non-operating interest in seven pipelines in the Athabasca region of northern Alberta from our Regional Oil Sands System to sell the issuedAthabasca Indigenous Investments Limited Partnership (Aii), an entity representing 23 First Nation and outstanding shares of St. Lawrence Gas Company, Inc. (St. Lawrence Gas)Métis communities, for cash proceedstotal consideration of approximately $88 million (US$70 million). Subject to regulatory approval$1.1 billion, less customary closing adjustments. No gain or loss was recognized on the sale and certain pre-closing conditions, the transaction is expected to close in
2018. As at December 31, 2017, St. Lawrence Gas, which is a part of our Gas Distribution segment,noncontrolling interest was classified as held for sale in the Consolidated Statements of Financial Position.
The table below summarizes the presentation of net assets held for salerecorded in our Consolidated Statements of Financial Position:Position as at December 31, 2022 to reflect the interest held by Aii (Note 19).
|
| | | | |
| December 31, | 2017 |
| 2016 |
|
| (millions of Canadian dollars) | |
| |
| Accounts receivable and other (current assets held for sale) | 424 |
| — |
|
| Deferred amounts and other assets (long-term assets held for sale) | 1,190 |
| 278 |
|
| Accounts payable and other (current liabilities held for sale) | (315 | ) | — |
|
| Net assets held for sale | 1,299 |
| 278 |
|
DISPOSITIONS
Olympic Pipeline
On July 31, 2017, we completedSubsequent to the sale, of ourwe maintained an 88.4% controlling interest in Olympic Pipeline for cash proceeds of approximately $203 million (US$160 million). A gain on disposal of $27 million (US$21 million) before tax was included in Other income/(expense) in the Consolidated Statements of Earnings. This interest wasthese assets, which are a partcomponent of our Liquids Pipelines segment.segment, and continue to manage, operate and provide administrative services to them.
Sandpiper Project
During the year ended December 31, 2017, we sold unused pipe related to the Sandpiper Project (Sandpiper) for cash proceeds of approximately $148 million (US$111 million). A gain on disposal of $83 million (US$63 million) before tax was included in Operating and administrative expense in the Consolidated Statements of Earnings. These assets were a part of our Liquids Pipelines segment.9. OTHER CURRENT ASSETS
| | | | | | | | |
| December 31, | 2023 | 2022 |
| (millions of Canadian dollars) | | |
Derivative assets (Note 23) | 623 | | 1,015 | |
Regulatory assets (Note 7) | 470 | | 604 | |
| Gas imbalances | 209 | | 461 | |
| Income taxes receivable | 347 | | 323 | |
| Other | 791 | | 852 | |
| | 2,440 | | 3,255 | |
Ozark Pipeline
In 2016, we classified the Ozark Pipeline assets as held for sale. On March 1, 2017, we completed the sale of the Ozark Pipeline assets to a subsidiary of MPLX LP for cash proceeds of approximately $294 million (US$220 million), including reimbursement of costs. A gain on disposal of $14 million (US$10 million) before tax was included in Operating and administrative expense in the Consolidated Statements of Earnings. These assets were a part of our Liquids Pipelines segment.
10. INVENTORY
South Prairie Region | | | | | | | | |
| December 31, | 2023 | 2022 |
| (millions of Canadian dollars) | | |
| Natural gas | 938 | | 1,491 | |
| Crude oil | 413 | | 652 | |
| Other | 128 | | 112 | |
| | 1,479 | | 2,255 | |
On December 1, 2016, we completed the sale of the South Prairie Region assets for cash proceeds of approximately $1.1 billion. A gain on disposal of $850 million before tax was included in Other income/(expense) in the Consolidated Statements of Earnings. These assets were a part of our Liquids Pipelines segment.
OTHER DISPOSITIONS
In December 2016, we sold other miscellaneous non-core assets for cash proceeds of approximately $286 million.
In August 2015, we sold our 77.8% controlling interest in the Frontier Pipeline Company, which holds pipeline assets located in the midwest United States, for gross proceeds of approximately $112 million (US$85 million). A gain on disposal of $70 million (US$53 million) before tax was included in Other income/(expense) in the Consolidated Statements of Earnings. This interest was a part of our Liquids Pipelines segment.
In May 2015, the Fund sold certain of its crude oil pipeline system assets for gross proceeds of approximately $26 million. A gain on disposal of $22 million before tax was included in Other income/(expense) in the Consolidated Statements of Earnings. These assets were a part of our Liquids Pipelines segment.
8. ACCOUNTS RECEIVABLE AND OTHER
|
| | | | |
| December 31, | 2017 |
| 2016 |
|
| (millions of Canadian dollars) | | |
Trade receivables and unbilled revenues1 | 5,325 |
| 3,814 |
|
| Other | 1,728 |
| 1,164 |
|
| | 7,053 |
| 4,978 |
|
1 Net of allowance for doubtful accounts of $50 million and $46 million as at December 31, 2017 and 2016, respectively.
During 2017, in conjunction with its restructuring actions (Note 19), EEP terminated a receivable purchase agreement with a special purpose entity wholly-owned by us.
9. INVENTORY
|
| | | | |
| December 31, | 2017 |
| 2016 |
|
| (millions of Canadian dollars) | |
| |
|
| Natural gas | 695 |
| 594 |
|
| Crude oil | 744 |
| 634 |
|
| Other commodities | 89 |
| 5 |
|
| | 1,528 |
| 1,233 |
|
10.11. PROPERTY, PLANT AND EQUIPMENT
| | | | | | | | | | | |
| | Weighted Average | | |
| December 31, | Depreciation Rate | 2023 | 2022 |
| (millions of Canadian dollars) | | | |
| Pipelines | 2.9 | % | 66,698 | | 66,528 | |
| Facilities and equipment | 3.1 | % | 37,634 | | 37,028 | |
Land and right-of-way1 | 2.3 | % | 3,600 | | 3,637 | |
| Gas mains, services and other | 2.6 | % | 15,346 | | 14,491 | |
| Storage | 2.5 | % | 4,929 | | 3,477 | |
| Wind turbines, solar panels and other | 4.1 | % | 4,511 | | 4,912 | |
| Other | 10.1 | % | 1,652 | | 1,611 | |
| Under construction | — | % | 2,829 | | 2,316 | |
| Total property, plant and equipment | | 137,199 | | 134,000 | |
| Total accumulated depreciation | | (32,558) | | (29,540) | |
| Property, plant and equipment, net | | 104,641 | | 104,460 | |
|
| | | | | | |
| | Weighted Average |
| |
| |
|
| December 31, | Depreciation Rate |
| 2017 |
| 2016 |
|
| (millions of Canadian dollars) | |
| |
| |
|
| Pipeline | 2.5 | % | 47,720 |
| 34,474 |
|
| Pumping equipment, buildings, tanks and other | 2.9 | % | 16,610 |
| 15,554 |
|
Land and right-of-way1 | 2.1 | % | 2,538 |
| 2,067 |
|
| Gas mains, services and other | 2.1 | % | 17,026 |
| 10,022 |
|
| Compressors, meters and other operating equipment | 2.1 | % | 5,774 |
| 4,014 |
|
| Processing and treating plants | 3.1 | % | 1,440 |
| 846 |
|
| Storage | 2.0 | % | 1,545 |
| — |
|
| Wind turbines, solar panels and other | 3.3 | % | 4,804 |
| 4,259 |
|
| Power transmission | 2.2 | % | 365 |
| 378 |
|
| Vehicles, office furniture, equipment and other buildings and improvements | 6.5 | % | 390 |
| 315 |
|
| Under construction | — |
| 7,601 |
| 6,966 |
|
Total property, plant and equipment2 | |
| 105,813 |
| 78,895 |
|
| Total accumulated depreciation | | (15,102 | ) | (14,611 | ) |
| Property, plant and equipment, net | |
| 90,711 |
| 64,284 |
|
1The measurement of weighted average depreciation rate excludes non-depreciable assets.
2 Certain assets were reclassified as held for sale as at December 31, 2017 (Note 7).
Depreciation expense for the years ended December 31, 2017, 20162023, 2022 and 20152021 was $2.9$4.0 billion, $2.0$3.8 billion and $1.9$3.5 billion, respectively.
IMPAIRMENT
Northern Gateway ProjectChapman Ranch Wind Farm
On November 29, 2016,Chapman Ranch Wind Farm (Chapman Ranch) is experiencing financial challenges associated with the Canadian Federal Government directed the NEB to dismiss our Northern Gateway Project application and the Certificates of Public Convenience and Necessityoriginal equipment integrity. As a result, we have been rescinded. In consultation with potential shippers and Aboriginal equity partners, we assessed this
decision and concluded that the project cannot proceed as envisioned. After taking into consideration the amount recoverable from potential shippers on Northern Gateway Project, we recognized an impairment loss of $373$251 million ($272 million after-tax),for the year ended December 31, 2023, which is included in Impairment of property, plant and equipmentlong-lived assets in the Consolidated Statements of Earnings.This impairment lossEarnings and is based on the full carrying value of the assets, which have an estimated fair value of nil, and are a part of our Liquids PipelinesRenewable Power Generation segment.
Sandpiper ProjectMagic Valley Wind Farm
On September 1, 2016, we announced that EEP applied for the withdrawal of regulatory applications pending with the Minnesota Public Utilities Commission for Sandpiper. In connection with this announcement2022, Magic Valley Wind Farm (Magic Valley) had commercial challenges caused by electricity transmission congestion and other factors, we evaluated Sandpiper for impairment.a negative price differential arising from higher transmission costs resulting in a lower electricity sale price. As a result, we recognized an impairment loss of $992$227 million ($81 million after-tax attributable to us) for the year ended December 31, 2016,2022, which is included in Impairment of property, plant and equipment in the Consolidated Statements of Earnings. Sandpiper is a part of our Liquids Pipelines segment. The estimated remaining fair value of Sandpiper was based on the estimated price that would be received to sell unused pipe, land and other related equipment in its current condition, considering the current market conditions for sale of these assets at the time. The valuation considered a range of potential selling prices from various alternatives that could be used to dispose of these assets. The estimated fair value, with the exception of $3 million in land, was reclassified into Deferred amounts and otherlong-lived assets in the Consolidated Statements of Financial Position as at December 31, 2016. During 2017, we disposedEarnings and is part of substantially all of the remaining Sandpiper assets (Note 7).our Renewable Power Generation segment.
OtherBakken Pipeline System
For the year ended December 31, 2016,2022, we recordedrecognized an impairment chargesloss of $11$183 million related to EEP’s non-core truckingon the US and Canadian components of the interstate pipeline transportation system within the North Dakota System of our Bakken Pipeline System in connection with the expiration of certain long-term take-or-pay contracts in 2023. This loss is included in Impairment of long-lived assets in the Consolidated Statements of Earnings and related facilities, which are ais part of our Gas Transmission and MidstreamLiquids Pipelines segment.
For the year ended December 31, 2015, we recorded impairment charges of $96 million, of which $80 million related to EEP’s Berthold rail facility, included within the Liquids Pipelines segment, due to contracts that were not yet renewed beyond 2016. The remaining $16 million in impairment charges relate to EEP’s non-core Louisiana propylene pipeline asset, included within the Gas Transmission and Midstream segment, following finalization of a contract restructuring with a primary customer.
Impairment charges were based on the amount by which the carrying valuesvalue of the assets exceeded fair value, determined using expected discounted future cash flows, and such charges are included in Impairment of property, plant and equipment on the Consolidated Statements of Earnings.flows.
11.12. VARIABLE INTEREST ENTITIES
CONSOLIDATED VARIABLE INTEREST ENTITIES
Enbridge Energy Partners, L.P.
EEP is a publicly-traded Delaware limited partnership and is considered a VIE as its limited partners do not have substantive kick-out rights or participating rights. ThroughOur consolidated VIEs consist of legal entities where we are the primary beneficiary. We are the primary beneficiary when our wholly-owned subsidiary, Enbridge Energy Company, Inc. (EECI), we havevariable interest(s) provide us with (i) the power to direct EEP’sthe activities of the VIE that most significantly impact the VIE's economic performance and have a(ii) the obligation to absorb losses of the VIE or the right to receive benefits from the VIE that could potentially be significant impact on EEP’s economic performance. Along with an economic interest held through an indirect common interest and general partner interest through EECI, and through our 100% ownership of EECI,to the VIE. We determine whether we are the primary beneficiary of EEP. As at December 31, 2017 and 2016, our economic interest in EEP was34.6%and 35.3% respectively. The public owns the remaining interests in EEP.
Enbridge Income Fund
The Fund is an unincorporated open-ended trust established by a trust indenture under the laws of the Province of Alberta and is considered a VIE by virtue of itsconsidering qualitative and quantitative factors, including, but not limited to: decision-making responsibilities, the VIE capital structure. We arestructure, risk and rewards sharing, contractual agreements with the primary beneficiary of the Fund through our combined 82.5% economic interest held indirectly through a common investment in ENF, a direct common interest in the Fund, a preferred unit investment in ECT, a direct common interest in Enbridge Income Partners GP Inc., and a direct common interest in EIPLP. As at
December 31, 2016, our combined economic interest was 86.9%. As at December 31, 2017 and 2016, our direct common interest in the Fund was 29.4% and 43.2%, respectively. We also serve in the capacity of Manager of ENF and the Fund Group.
Enbridge Commercial Trust
We have the ability to appoint the majority of the trustees to ECT’s Board of Trustees, resulting in a lack of decision making ability for the holders of the common trust units of ECT. As a result, ECT is considered to be a VIE, and although we do not have a common equity interest in ECT, we are considered to be the primary beneficiary of ECT. We also serve in the capacity of Manager of ECT, as part of the Fund Group.
Enbridge Income Partners LP
EIPLP, formed in 2002, is involved in the generation, transportation and storage of energy through interests in its Liquids Pipelines business, including the Canadian Mainline, the Regional Oil Sands System, a 50.0% interest in the Alliance Pipeline, which transports natural gas, and its renewable and alternative power generation facilities. EIPLP is a partnership between an indirect wholly-owned subsidiary of Enbridge and ECT. EIPLP is considered a VIE as its limited partners lack substantive kick-outvoting rights and participating rights. Through a majority ownershiplevel of EIPLP’s General Partner, 100% ownershipinvolvement of Enbridge Management Services Inc. (a service provider for EIPLP), and 53.1% of direct common interest in EIPLP, we have the power to direct the activities that most significantly impact EIPLP’s economic performance and have the obligation to absorb losses and the right to receive residual returns that are potentially significant to EIPLP, making us the primary beneficiary of EIPLP. As at December 31, 2017 and 2016, our economic interest in EIPLP was 73.5% and 79.1%, respectively.other parties.
Green Power and Transmission
Through various subsidiaries, we have a majority ownership interest in Magic Valley, Wildcat, Keechi Wind Project (Keechi), and New Creek wind farms. These wind farms are considered VIEs as they do not have sufficient equity at risk and are partially financed by tax equity investors. We are the primary beneficiary of these VIEs by virtue of our voting rights, our power to direct the activities that most significantly impact the economic performance of the wind farms, and our obligation to absorb losses.
Enbridge Holdings (DakTex) L.L.C.
Enbridge Holdings (DakTex) L.L.C. (DakTex) is owned 75% by a wholly-owned subsidiary of Enbridge and 25% by EEP, through which we have an effective 27.6% interest in the equity investment, Bakken Pipeline System (Note 12). EEP is the primary beneficiary because it has the power to direct DakTex’s activities that most significantly impact its economic performance. We consolidate EEP and by extension also consolidate DakTex.
Spectra Energy Partners, LP
We acquired a 75% ownership in SEP through the Merger Transaction. SEP is a natural gas and crude oil infrastructure master limited partnership and is considered a VIE as its limited partners do not have substantive kick-out rights or participating rights. We are the primary beneficiary of SEP because we have the power to direct SEP’s activities that most significantly impact its economic performance.
Valley Crossing Pipeline, LLC
Valley Crossing Pipeline, LLC (Valley Crossing), a wholly-owned subsidiary of Enbridge, is constructing a natural gas pipeline to transport natural gas within Texas. Valley Crossing is considered a VIE due to insufficient equity at risk to finance its activities. We are the primary beneficiary of Valley Crossing because we have the power to direct Valley Crossing’s activities that most significantly impact its economic performance.
Other Limited Partnerships
By virtue of a lack of substantive kick-out rights and participating rights, substantially all limited partnerships wholly-owned by us and/or our subsidiaries are considered VIEs. As these entities are 100% owned and directed by us with no third parties having the ability to direct any of the significant activities, we are considered the primary beneficiary.
The following table includes assets to be used to settle liabilities of our consolidated VIEs andVIEs. The creditors of the liabilities of our consolidated VIEs for which creditors do not have recourse to our general credit as the primary beneficiary. These assets and liabilities are included in the Consolidated Statements of Financial Position.
| | | December 31, | 2017 |
| 2016 |
| December 31, | 2023 | 2022 |
| (millions of Canadian dollars) | |
| |
| (millions of Canadian dollars) | | |
| Assets | |
| |
| Assets | | |
| Cash and cash equivalents | 368 |
| 314 |
|
| Accounts receivable and other | 2,132 |
| 781 |
|
| Restricted cash | |
| Trade receivables and unbilled revenue | |
| Other current assets | |
| Accounts receivable from affiliates | 3 |
| 3 |
|
| Inventory | 220 |
| 53 |
|
| | 2,723 |
| 1,151 |
|
| Property, plant and equipment, net | 68,685 |
| 45,720 |
|
| Long-term investments | 6,258 |
| 954 |
|
| Restricted long-term investments | 206 |
| 83 |
|
| Deferred amounts and other assets | 2,921 |
| 2,227 |
|
| Intangible assets, net | 296 |
| 488 |
|
| Goodwill | 29 |
| 29 |
|
| Deferred income taxes | 145 |
| 231 |
|
| | | |
| | | |
| | | 81,263 |
| 50,883 |
|
| Liabilities | |
| |
| Liabilities | | |
| Short-term borrowings | 485 |
| — |
|
| Accounts payable and other | 2,859 |
| 1,446 |
|
| | Trade payables and accrued liabilities | |
| Trade payables and accrued liabilities | |
| Trade payables and accrued liabilities | |
| Other current liabilities | |
| Accounts payable to affiliates | 131 |
| 105 |
|
| Interest payable | 312 |
| 204 |
|
| Environmental liabilities | 35 |
| 140 |
|
| Current portion of long-term debt | 2,129 |
| 342 |
|
| | | |
| | | |
| | | 5,951 |
| 2,237 |
|
| Long-term debt | 31,469 |
| 20,176 |
|
| Other long-term liabilities | 4,301 |
| 1,207 |
|
| Deferred income taxes | 3,010 |
| 1,753 |
|
| | 44,731 |
| 25,373 |
|
| Net assets before noncontrolling interests | 36,532 |
| 25,510 |
|
| 6,867 | |
We do not have an obligationobligations to provide additional financial support to any of theour consolidated VIEs, with the exception of EIPLP. We are required, when called on by ENF, to backstop equity funding required by EIPLP to undertake the growth program embedded in the assets it acquired in the Canadian Restructuring Plan.VIEs.
UNCONSOLIDATED VARIABLE INTEREST ENTITIES
Sabal Trail Transmission, LLC
SEP owns a 50% interestWe currently hold interests in Sabal Trail, a joint venture that operates a pipeline originating in Alabama that transports natural gas to Florida. On July 3, 2017,several non-consolidated VIEs where we discontinued the consolidation of Sabal Trail and accounted for our interest under the equity method. Sabal Trail is a VIE due to insufficient equity at risk to finance its activities. We are not the primary beneficiary because the power to direct Sabal Trail's activities that most significantly impact its economic performance is shared.
Nexus Gas Transmission, LLC
SEP owns a 50% equity investment in Nexus, a joint venture that is constructing a natural gas pipeline from Ohio to Michigan and continuing on to Ontario, Canada. Nexus is a VIE due to insufficient equity at risk to finance its activities. We are not the primary beneficiary because the power to direct Nexus’ activities that most significantly impact its economic performance is shared.
PennEast Pipeline Company, LLC
SEP owned a 10% equity investment in PennEast, which was increased to 20% in June 2017. PennEast is constructing a natural gas pipeline from northeastern Pennsylvania to New Jersey. PennEast is a VIE due to insufficient equity at risk to finance its activities. We are not the primary beneficiary since we do not have the power to direct PennEast’s activities that most significantly impact its economic performance.
We currently hold several equity investments in limited partnerships that are assessed to be VIEs due to limited partners not having substantive kick-out rights or participating rights. We have determined thatas we do not have the power to direct the activities of the VIEs that most significantly impact the VIEs’their economic performance. Specifically,These interests include investments in limited partnerships that are assessed to be VIEs due to the limited partners not having substantive kick-out rights or participating rights. The power to direct the activities of a majority of these non-consolidated limited partnership VIEs is shared amongst the partners. Each partner has representatives that make up an executive committee whothat makes significant decisions for the VIE, and none of the partners may make majorsignificant decisions unilaterally.
The carrying amount of our interest inthese VIEs that are unconsolidated and our estimated maximum exposure to loss as at December 31, 20172023 and 20162022 are presented below:
| | | | | | | | |
| Carrying
Amount of | Maximum
Exposure to |
| December 31, 2023 | the VIE | Loss |
| (millions of Canadian dollars) | | |
Aux Sable Liquid Products L.P.1 | 105 | | 130 | |
Rampion Offshore Wind Limited2 | 391 | | 452 | |
Vector Pipeline L.P.3 | 191 | | 320 | |
Woodfibre LNG Limited Partnership4 | 778 | | 2,854 | |
Fox Squirrel Solar LLC5 | 312 | | 661 | |
Other4 | 132 | | 230 | |
| | 1,909 | | 4,647 | |
| | | | | | | | |
| Carrying
Amount of | Maximum
Exposure to |
| December 31, 2022 | the VIE | Loss |
| (millions of Canadian dollars) | | |
Aux Sable Liquid Products L.P.1 | 91 | | 117 | |
EIH S.á r.l.6 | 37 | | 637 | |
| | |
Rampion Offshore Wind Limited2 | 413 | | 468 | |
Vector Pipeline L.P.3 | 195 | | 325 | |
Woodfibre LNG Limited Partnership4 | 635 | | 2,476 | |
Other4 | 245 | | 443 | |
| 1,616 | | 4,466 | |
1As at December 31, 2023 and 2022, the maximum exposure to loss includes a guarantee by us for our respective share of the VIE's borrowing on a bank credit facility.
2As at December 31, 2023 and 2022, the maximum exposure to loss includes our parental guarantees that have been committed in project contracts in which we would be liable for in the event of default by the VIE.
3As at December 31, 2023 and 2022, the maximum exposure to loss includes the carrying value of outstanding affiliate loans receivable for $24 million and $25 million held by us as at December 31, 2023 and 2022, respectively, and an outstanding credit facility for $105 million as at December 31, 2023 and 2022.
4As at December 31, 2023 and 2022, the maximum exposure to loss includes our parental guarantees that have been committed in connection with the project for which we would be liable in the event of default by the VIE.
5In November 2023, Enbridge acquired a 50% interest in Fox Squirrel JV, LLC (Fox Squirrel Solar LLC). Refer to Note 13 - Long-Term Investments. Fox Squirrel Solar LLC is presented below.a VIE due to its lack of sufficient equity at risk to finance its activities. Enbridge does not hold decision-making rights to direct Fox Squirrel Solar LLC's activities that most significantly impacts its economic performance. As at December 31, 2023, the maximum exposure to loss includes our parental guarantees that have been committed in project contracts in which we would be liable for in the event of default by the VIE.
6As at December 31, 2023, EIH S.á r.l no longer met the requirements of a VIE as a result of a VIE reconsideration event. As at December 31, 2022, the maximum exposure to loss includes our parental guarantees that have been committed in connection with the three French offshore wind projects for which we would be liable in the event of default by the VIE and an outstanding affiliate loan receivable for $56 million. |
| | | | |
| | Carrying Amount of Investment |
| Enbridge’s Maximum Exposure to |
|
| December 31, 2017 | in VIE |
| Loss |
|
| (millions of Canadian dollars) | |
| |
|
Aux Sable Liquid Products L.P.1 | 300 |
| 361 |
|
Eolien Maritime France SAS2 | 69 |
| 754 |
|
Hohe See Offshore Wind Project3 | 763 |
| 2,484 |
|
Illinois Extension Pipeline Company, L.L.C.4 | 686 |
| 686 |
|
Nexus Gas Transmission, LLC5 | 834 |
| 1,678 |
|
PennEast Pipeline Company, LLC5 | 69 |
| 345 |
|
Rampion Offshore Wind Limited6 | 555 |
| 679 |
|
Sabal Trail Transmissions, LLC5 | 2,355 |
| 2,529 |
|
Vector Pipeline L.P.7 | 169 |
| 278 |
|
Other4 | 21 |
| 21 |
|
| | 5,821 |
| 9,815 |
|
|
| | | | |
| | Carrying Amount of Investment |
| Enbridge’s Maximum Exposure to |
|
| December 31, 2016 | in VIE |
| Loss |
|
| (millions of Canadian dollars) | |
| |
|
| Aux Sable Liquid Products L.P. | 158 |
| 223 |
|
Eddystone Rail Company, LLC8 | 19 |
| 25 |
|
| Eolien Maritime France SAS | 58 |
| 686 |
|
| Illinois Extension Pipeline Company, L.L.C. | 759 |
| 759 |
|
| Rampion Offshore Wind Limited | 345 |
| 457 |
|
| Vector Pipeline L.P. | 159 |
| 289 |
|
| Other | 17 |
| 17 |
|
| | 1,515 |
| 2,456 |
|
| |
1 | At December 31, 2017, the maximum exposure to loss includes a guarantee by us for our respective share of the VIE’s borrowing on a bank credit facility. |
| |
2 | At December 31, 2017, the maximum exposure to loss includes the portion of our parental guarantee that has been committed in project construction contracts in which we would be liable for in the event of default by the VIE and an outstanding affiliate loan receivable for $163 million held by us. |
| |
3 | At December 31, 2017, the maximum exposure to loss includes the portion of our parental guarantee that has been committed in project construction contracts in which we would be liable for in the event of default by the VIE. |
| |
4 | At December 31, 2017, the maximum exposure to loss is limited to our equity investment as these companies are in operation and self-sustaining. |
| |
5 | At December 31, 2017 the maximum exposure to loss is limited to our equity investment and the remaining expected contributions for each joint venture. |
| |
6 | At December 31, 2017, the maximum exposure to loss includes the portion of our parental guarantee that has been committed in project construction contracts in which we would be liable for in the event of default by the VIE. |
| |
7 | At December 31, 2017 the maximum exposure to loss includes the carrying value of an outstanding loan issued by us. |
| |
8 | As at December 31, 2017, Eddystone Rail Company, LLC is a 100% owned subsidiary and therefore is no longer an unconsolidated VIE. |
We do not have an obligation to and did not provide any additional financial support to the VIEs during the years ended December 31, 20172023 and 2016.2022.
13. LONG-TERM INVESTMENTS
| | | | | | | | | | | |
| | Ownership | | |
| December 31, | Interest | 2023 | 2022 |
| (millions of Canadian dollars) | | | |
| EQUITY INVESTMENTS | | | |
| Liquids Pipelines | | | |
MarEn Bakken Company LLC1 | 75.0 | % | 1,819 | | 1,968 | |
DCP Midstream, LLC (Class B Units)2 | 90.0 | % | 1,486 | | 1,394 | |
| Seaway Crude Holdings LLC | 50.0 | % | 2,661 | | 2,744 | |
Illinois Extension Pipeline Company, L.L.C.3 | 65.0 | % | 584 | | 622 | |
Cactus II Pipeline LLC4 | 30.0 | % | 618 | | 658 | |
| Other | 30.0% - 43.8% | 84 | | 76 | |
| Gas Transmission and Midstream | | | |
Alliance Pipeline5, 7 | 50.0 | % | 359 | | 430 | |
Aux Sable6, 7 | 42.7% - 50.0% | 229 | | 214 | |
DCP Midstream, LLC (Class A Units)8 | 23.4 | % | 367 | | 317 | |
| Gulfstream Natural Gas System, L.L.C. | 50.0 | % | 1,224 | | 1,274 | |
| NEXUS Gas Transmission, LLC | 50.0 | % | 1,220 | | 1,813 | |
| Sabal Trail Transmission, LLC | 50.0 | % | 1,467 | | 1,535 | |
| Southeast Supply Header, LLC | 50.0 | % | 80 | | 86 | |
| Steckman Ridge, LP | 50.0 | % | 87 | | 91 | |
Vector Pipeline9 | 60.0 | % | 191 | | 195 | |
Woodfibre LNG Limited Partnership10 | 30.0 | % | 777 | | 635 | |
| Offshore - various joint ventures | 22.0% - 74.3% | 217 | | 314 | |
| | | |
| Gas Distribution and Storage | | | |
| Other | 30.0% - 50.0% | 22 | | 20 | |
| Renewable Power Generation | | | |
EIH S.à r.l.11 | 51.0 | % | 52 | | 37 | |
| Hohe See and Albatros Offshore Wind Facilities | 49.9 | % | 1,701 | | 163 | |
| Rampion Offshore Wind Limited | 24.9 | % | 391 | | 413 | |
| East-West Tie Limited Partnership | 24.1 | % | 132 | | 241 | |
| Fox Squirrel Solar LLC | 50.0 | % | 312 | | — | |
| Other | 16.4% - 50.0% | 110 | | 107 | |
| OTHER LONG-TERM INVESTMENTS | | | |
| Gas Transmission and Midstream | | | |
| Ara Divert HoldCo, Inc. | | 106 | | — | |
| Other | | 22 | | 22 | |
| Gas Distribution and Storage | | | |
| Other | | 24 | | 48 | |
| Renewable Power Generation | | | |
| Other | | 21 | | 31 | |
| Eliminations and Other | | | |
Other12 | | 430 | | 488 | |
| | | 16,793 | | 15,936 | |
1Owns a 49.0% interest in Bakken Pipeline Investments LLC. Bakken Pipeline Investments LLC owns 75.0% of the Bakken Pipeline System, resulting in a 27.6% effective interest in the Bakken Pipeline System by us.
2We own 90.0% of the Class B units of DCP Midstream, LLC. These units track to a 65.0% ownership in Gray Oak Pipeline, LLC (Gray Oak), resulting in a 58.5% effective interest in Gray Oak by us. On January 9, 2023, we acquired an additional 10.0% direct interest in Gray Oak for cash consideration of $230 million (US$172 million), bringing our effective interest to 68.5%.
3Owns the Southern Access Extension Project.
4On October 12, 2021, we acquired a 20.0% equity interest in Cactus II through the Moda Acquisition (Note 8). On November 2, 2022, we acquired an additional 10.0% ownership in Cactus II for cash consideration of $241 million (US$177 million), bringing our total non-operating ownership to 30.0%.
5Includes Alliance Pipeline Limited Partnership in Canada and Alliance Pipeline L.P. in the US.
6Includes Aux Sable Canada LP in Canada and Aux Sable Liquid Products L.P. and Aux Sable Midstream LLC in the US.
|
| | | | | | |
| | Ownership |
| |
| |
|
| December 31, | Interest |
| 2017 |
| 2016 |
|
| (millions of Canadian dollars) | |
| |
| |
|
| EQUITY INVESTMENTS | |
| |
| |
|
| Liquids Pipelines | |
| |
| |
|
Bakken Pipeline System1 | 27.6 | % | 1,938 |
| — |
|
| Eddystone Rail Company, LLC | 100.0 | % | — |
| 19 |
|
| Seaway Crude Pipeline System | 50.0 | % | 2,882 |
| 3,129 |
|
Illinois Extension Pipeline Company, L.L.C.2 | 65.0 | % | 686 |
| 759 |
|
| Other | 30.0% - 43.8% |
| 87 |
| 70 |
|
| Gas Transmission and Midstream | | | |
Alliance Pipeline3 | 50.0 | % | 375 |
| 411 |
|
| Aux Sable | 42.7% - 50.0% |
| 300 |
| 324 |
|
DCP Midstream, LLC4 | 50.0 | % | 2,143 |
| — |
|
Gulfstream Natural Gas System, L.L.C.4 | 50.0 | % | 1,205 |
| — |
|
Nexus Gas Transmission, LLC4 | 50.0 | % | 834 |
| — |
|
| Offshore - various joint ventures | 22.0% - 74.3% |
| 389 |
| 435 |
|
PennEast Pipeline Company LLC4 | 20.0 | % | 69 |
| — |
|
Sabal Trail Transmission, LLC5 | 50.0 | % | 2,355 |
| — |
|
Southeast Supply Header L.L.C.4 | 50.0 | % | 486 |
| — |
|
Steckman Ridge LP4 | 49.5 | % | 221 |
| — |
|
| Texas Express Pipeline | 35.0 | % | 430 |
| 484 |
|
| Vector Pipeline L.P. | 60.0 | % | 169 |
| 159 |
|
Other4 | 33.3% - 50.0% |
| 34 |
| 4 |
|
| Gas Distribution | | | |
| Noverco Common Shares | 38.9 | % | — |
| — |
|
Other4 | 50.0 | % | 15 |
| — |
|
| Green Power and Transmission | | | |
Eolien Maritime France SAS6 | 50.0 | % | 69 |
| 58 |
|
Hohe See Offshore Wind Project7 | 50.0 | % | 763 |
| — |
|
| Rampion Offshore Wind Project | 24.9 | % | 555 |
| 345 |
|
| Other | 19.0% - 50.0% |
| 95 |
| 100 |
|
| Eliminations and Other | | | |
| Other | 19.0% - 42.7% |
| 26 |
| 15 |
|
| OTHER LONG-TERM INVESTMENTS | | | |
| Gas Distribution | | | |
| Noverco Preferred Shares | | 371 |
| 355 |
|
| Green Power and Transmission | | | |
| Emerging Technologies and Other | | 80 |
| 90 |
|
| Eliminations and Other | | | |
| Other | | 67 |
| 79 |
|
| | |
| 16,644 |
| 6,836 |
|
| |
1 | On February 15, 2017, EEP acquired an effective 27.6% interest in the Dakota Access and Energy Transfer Crude Oil Pipelines (collectively, the Bakken Pipeline System) for a purchase price of $2 billion (US$1.5 billion). The Bakken Pipeline System was placed into service on June 1, 2017. For details regarding our funding arrangement, refer to Note 19 - Noncontrolling Interests.
|
| |
2 | Owns the Southern Access Extension Project. |
| |
3 | Certain assets of the Alliance Pipeline are pledged as collateral to Alliance Pipeline lenders. |
| |
4 | On February 27, 2017, we acquired Spectra Energy's interests in DCP Midstream, Gulfstream Natural Gas System, L.L.C, Nexus, PennEast, Southeast Supply Header L.L.C., Steckman Ridge LP and other equity investments as part of the Merger Transaction (Note 7).
|
| |
5 | On February 27, 2017, we acquired Spectra Energy's consolidated interest in Sabal Trail as part of the Merger Transaction (Note 7). On July 3, 2017, Sabal Trail was placed into service and the assets, liabilities, and noncontrolling interests were deconsolidated as at the in-service date.
|
| |
6 | On May 19, 2016, we acquired a 50% equity interest in Eolien Maritime France SAS. |
| |
7 | On February 8, 2017, we acquired an effective 50% interest in EnBW Hohe See GmbH & Co. KG. |
7On December 13, 2023, we announced that Enbridge had entered into a definitive agreement to sell its 50.0% interest in the Alliance Pipeline and interest in Aux Sable to Pembina Pipeline Corporation for $3.1 billion, including approximately $0.3 billion of non-recourse debt, subject to customary closing adjustments.
8We own 23.4% of the Class A units of DCP Midstream, LLC. These units track to a 56.5% ownership in DCP Midstream, LP (DCP), resulting in a 13.2% effective interest in DCP by us.
9Includes Vector Pipeline Limited Partnership in Canada and Vector Pipeline L.P. in the US.
10 On November 29, 2022, we acquired an effective 30.0% interest in Woodfibre LNG Limited Partnership (Woodfibre) for cash consideration of $533 million (US$392 million). Woodfibre will operate a LNG export facility in BC being constructed by us and our partners.
11 Owns a 50.0% interest in Éolien Maritime France SAS (EMF). Through our investment in EMF, we own equity interests in three French offshore wind projects, including effective interests in Saint-Nazaire (25.5%), Fécamp (17.9%) and Calvados (21.7%).
12 Consists of investments in exchange-traded funds and debt securities held by our wholly-owned captive insurance subsidiaries. Refer to Note 23 - Risk Management and Financial Instruments.
Equity investments include the unamortized excess of the purchase price over the underlying net book value of the investees’investees' assets at the purchase date. As at December 31, 2017,2023, this comprisedbasis difference was $3.5 billion (2022 - $3.4 billion), of $2.0which $1.7 billion in Goodwill and $643 millionin amortizable assets. As at December 31, 2016, this comprised of $859 million in Goodwill and $687 million in amortizable assets.(2022 - $1.5 billion) was amortizable.
For the years ended December 31, 2017, 20162023, 2022 and 2015, dividends2021, distributions received from equity investments were$1.4 $3.1 billion,, $825 million $2.6 billion and$719 million, $2.2 billion, respectively.
Summarized combined financial information of our interest in unconsolidated equity investments (presented at 100%) is as follows:
| | | | Year Ended December 31, |
| | 2017 | 2016 | 2015 |
| | Seaway |
| Other |
| Total |
| Seaway |
| Other |
| Total |
| Seaway |
| Other |
| Total |
|
| Year ended December 31, | | Year ended December 31, | 2023 | 20221 | 20211 |
| (millions of Canadian dollars) | | |
| Operating revenues | |
| Operating revenues | |
| Operating revenues | 959 |
| 15,254 |
| 16,213 |
| 938 |
| 3,164 |
| 4,102 |
| 833 |
| 3,054 |
| 3,887 |
|
| Operating expenses | 286 |
| 12,911 |
| 13,197 |
| 293 |
| 3,051 |
| 3,344 |
| 263 |
| 2,210 |
| 2,473 |
|
| Earnings | 672 |
| 2,056 |
| 2,728 |
| 643 |
| (2 | ) | 641 |
| 566 |
| 512 |
| 1,078 |
|
| Earnings attributable to controlling interests | 336 |
| 926 |
| 1,262 |
| 322 |
| 147 |
| 469 |
| 283 |
| 207 |
| 490 |
|
| Earnings attributable to Enbridge | |
| | | | December 31, 2017 | December 31, 2016 |
| | Seaway |
| Other |
| Total |
| Seaway |
| Other |
| Total |
|
| December 31, | | December 31, | 2023 | 20221 |
| (millions of Canadian dollars) | | |
| Current assets | |
| Current assets | |
| Current assets | 106 |
| 3,432 |
| 3,538 |
| 86 |
| 842 |
| 928 |
|
| Non-current assets | 3,329 |
| 41,697 |
| 45,026 |
| 3,651 |
| 12,264 |
| 15,915 |
|
| Current liabilities | 143 |
| 3,311 |
| 3,454 |
| 172 |
| 831 |
| 1,003 |
|
| Non-current liabilities | 13 |
| 13,582 |
| 13,595 |
| 13 |
| 5,121 |
| 5,134 |
|
| Noncontrolling interests | — |
| 3,191 |
| 3,191 |
| — |
| — |
| — |
|
1 Balances have been updated to reflect the impact of revisions made to conform to the current year's presentation. These revisions do not have an effect on our previously reported consolidated statements of earnings, comprehensive income, changes in equity, cash flows or financial position.
Eddystone Rail Company,
OTHER EQUITY INVESTMENT TRANSACTIONS
Fox Squirrel Solar LLC
On October 19, 2017,November 15, 2023, we sold all assets relatedacquired a 50% interest in a newly formed partnership with EDF Renewables North America to Eddystone Rail Company,participate in the initial phase of a solar power facility in Ohio. Cash consideration includes an upfront payment of $157 million (US$115 million) and subsequent capital commitments up to $398 million (US$291 million). Investments past the first phase are contingent on certain conditions being met. An additional payment of $164 million (US$123 million) was made at Phase 1 in-service in December 2023.
Hohe See and Albatros Offshore Wind Facilities
On November 3, 2023, we acquired an additional 24.45% interest in the Hohe See Offshore Wind Facilities and Albatros Offshore Wind Facilities (the Offshore Wind Facilities), through the acquisition of a 49% interest in Enbridge Renewable Infrastructure Investments S.à r.l (ERII), for $391 million (€267 million) of cash and assumed debt of $524 million (€358 million), bringing our interest in the Offshore Wind Facilities to 49.9%. The Hohe See Offshore Wind Facilities and Albatros Offshore Wind Facilities are located approximately 100 kilometers off the northern coast of Germany and came into service in 2019 and 2020, respectively. Subsequent to the purchase, our interest in ERII is consolidated and our interest in the Offshore Wind Facilities will continue to be accounted for as an equity method investment included in the Renewable Power Generation segment.
DCP Midstream, LLC (Eddystone Rail)
On August 17, 2022, we completed a joint venture merger transaction with Phillips 66 resulting in exchange fora single joint venture, DCP Midstream, LLC, holding both our and Phillips 66's indirect ownership interests in Gray Oak and DCP. Our ownership in DCP Midstream, LLC consists of Class A and Class B Interests which track to our investments in DCP, included in the remaining 25%Gas Transmission and Midstream segment, and Gray Oak, included in the Liquids Pipelines segment, respectively. Through our investment in DCP Midstream, LLC, we increased our effective economic interest of the joint venture.in Gray Oak to 58.5% from 22.8% and reduced our effective economic interest in DCP to 13.2% from 28.3%. As a result Eddystone Rail is now 100% ownedof the transaction, Enbridge assumed operatorship of Gray Oak in the second quarter of 2023.
We determined the fair value of our decrease in economic interest in DCP based on the unadjusted quoted market price of DCP's publicly traded common units on the transaction closing date. The fair value of our increased economic interest in Gray Oak was determined using the fair value prescribed to the change in our economic interest in DCP. As a result of the merger transaction and carried at nil value.
During the year ended December 31, 2016,realignment of our economic interests in DCP and Gray Oak, we also received cash consideration of approximately $522 million (US$404 million) and recorded an investment impairmentaccounting gain of $184 million related$1.1 billion (US$832 million) to our 75%Gain on joint venture interestmerger transaction in Eddystone Rail at the time, which is held through Enbridge Rail (Philadelphia) L.L.C., a wholly-owned subsidiary. Eddystone Rail is a rail-to-barge transloading facility located in the greater Philadelphia, Pennsylvania area that delivers Bakken and other light sweet crude oil to Philadelphia area refineries. Due to a significant decrease in price spreads between Bakken crude oil and West Africa/Brent crude oil and increased competition in the region, demand for Eddystone Rail services dropped significantly, which led to the completion of an impairment test. The impairment charge is presented within Income from equity investments on the Consolidated Statements of Earnings. The investment in Eddystone Rail isBoth DCP and Gray Oak continue to be accounted for as equity method investments.
Noverco Inc.
On June 7, 2021, IPL System Inc., a partwholly-owned subsidiary of our Liquids Pipelines segment.
The impairment charge was based on the amount by which the carrying value of the asset exceeded fair value, determined using an adjusted net worth approach. Our estimate of fair value required usEnbridge, entered into a purchase and sale agreement to use significant unobservable inputs representative of a Level 3 fair value measurement, including assumptions related to the future performance of Eddystone Rail.
Aux Sable
During the year ended December 31, 2016, Aux Sable recorded an asset impairment charge of $37 million related to certain underutilized assets at Aux Sable US' NGL extractionsell its 38.9% common share and fractionation plant.
Sabal Trail Transmission, LLC
On July 3, 2017, Sabal Trail was placed into service. In accordance with the Sabal Trail LLC Agreement, upon the in-service date, the power to direct Sabal Trail’s activities become shared with its members. We are no longer the primary beneficiary and deconsolidated the assets, liabilities and noncontrolling interests related to Sabal Trail as at the in-service date.
At deconsolidation, our 50%preferred share interest in Sabal TrailNoverco to Trencap L.P. On December 30, 2021, we closed the sale of Noverco for cash proceeds of $1.1 billion. After closing adjustments, a gain on disposal of $303 million before tax was recorded at its fair valueincluded in Other income/(expense) in the Consolidated Statements of $2.3 billion (US$1.9 billion), which approximated its carrying value as a long-term equity investment. As a result, there was no gain or loss recognizedEarnings for the year ended December 31, 2017 related2021. Noverco was previously included in our Gas Distribution and Storage segment.
IMPAIRMENT OF EQUITY INVESTMENTS
PennEast Pipeline Company, LLC
PennEast Pipeline Company, LLC (PennEast) is a joint venture formed to develop a natural gas transmission pipeline to serve local distribution companies and power generators in southeastern Pennsylvania and New Jersey, is owned 20.0% by Enbridge, and is recorded as an equity method investment. In the remeasurementthird quarter of 2021, PennEast determined further development of the retained equity interest to its fair value. The fair valueproject was determined usingno longer viable and development of the income approach which isproject was ceased. As a result, we recorded an other-than-temporary impairment loss of $111 million on our investment for the year ended December 31, 2021 based on the presentestimated fair value of our share of the future cash flows.
Noverco Inc.
Asnet assets. The carrying value of this investment was nil as at December 31, 20172023 and 2016, we owned an equity interest in Noverco through ownership of 38.9% of its common shares and an2022.
Our investment in preferred shares.PennEast formed part of our Gas Transmission and Midstream segment. The preferred shares are entitled to a cumulative preferred dividend based on the average yield of Government of Canada bonds maturingimpairment loss was recorded within Income from equity investments in 10 years plus a margin of 4.38%.
As at December 31, 2017 and 2016, Noverco owned an approximate 1.9% and 3.4% reciprocal shareholding in our common shares, respectively. Through secondary offerings, Noverco purchased 1.2 million common shares in February 2016. Shares purchased and sold in this transaction were treated as treasury stock on the Consolidated Statements of Changes in Equity.Earnings.
As a result of Noverco’s reciprocal shareholding in our common shares, as at December 31, 2017 and 2016, we had an indirect pro-rata interest of 0.7% and 1.3%, respectively, in our own shares. Both the equity investment in Noverco and shareholders’ equity have been reduced by the reciprocal shareholding of $102 million as at December 31, 2017 and 2016. Noverco records dividends paid from us as dividend income and we eliminate these dividends from our equity earnings of Noverco. We record our pro-rata share of dividends paid by us to Noverco as a reduction of dividends paid and an increase in our investment in Noverco.
13. RESTRICTED LONG-TERM INVESTMENTS
Effective January 1, 2015, we began collecting and setting aside funds to cover future pipeline abandonment costs for all NEB regulated pipelines as a result of the NEB’s regulatory requirements under LMCI. The funds collected are held in trusts in accordance with the NEB decision. The funds collected from shippers are reported within Transportation and other services revenues on the Consolidated Statements of Earnings and Restricted long-term investments on the Consolidated Statements of Financial Position. Concurrently, we reflect the future abandonment cost as an increase to Operating and administrative expense on the Consolidated Statements of Earnings and Other long-term liabilities on the Consolidated Statements of Financial Position.
We routinely invest excess cash and various restricted balances in securities such as commercial paper, bankers acceptances, corporate debt securities, Canadian equity securities, treasury bills and money market securities in the United States and Canada.
As at December 31, 2017and 2016, we had restricted long-term investments held in trust and classified as held for sale and carried at fair value of $267 million and $90 million, respectively. We had estimated future abandonment costs related to LMCI of $151 million and $97 million as at December 31, 2017 and 2016, respectively.
14. INTANGIBLE ASSETS
The following table provides the weighted average amortization rate, gross carrying value, accumulated amortization and net carrying value for each of our major classes of intangible assets: | | | | | | | | | | | | | | |
| December 31, 2023 | Weighted Average Amortization Rate | Cost | Accumulated Amortization | Net |
| (millions of Canadian dollars) | | | | |
| Software | 12.0 | % | 1,921 | | (1,090) | | 831 | |
| Power purchase agreements | 4.3 | % | 58 | | (24) | | 34 | |
Project agreement1 | 4.0 | % | 158 | | (41) | | 117 | |
| Customer relationships | 8.6 | % | 2,636 | | (675) | | 1,961 | |
| Other intangible assets | 8.2 | % | 603 | | (185) | | 418 | |
| Under development | — | % | 176 | | — | | 176 | |
| | | 5,552 | | (2,015) | | 3,537 | |
| | December 31, 2022 | | December 31, 2022 | Weighted Average Amortization Rate | Cost | Accumulated Amortization | Net |
| (millions of Canadian dollars) | | (millions of Canadian dollars) | |
| Software | |
| Power purchase agreements | |
Project agreement1 | |
| Customer relationships | |
| Other intangible assets | |
| Under development | |
| | | Weighted Average |
| | |
| | Accumulated |
| | |
|
December 31, 20171 | Amortization Rate |
| | Cost |
| | Amortization |
| | Net |
|
| (millions of Canadian dollars) | |
| | |
| | |
| | |
|
| Customer relationships | 3.5 | % | | 967 |
| | 41 |
| | 926 |
|
| Power purchase agreements | 3.5 | % | | 99 |
| | 17 |
| | 82 |
|
Project agreement2 | 4.0 | % | | 150 |
| | 3 |
| | 147 |
|
| Software | 11.3 | % | | 1,760 |
| | 714 |
| | 1,046 |
|
Other intangible assets3 | 4.4 | % | | 1,162 |
| | 96 |
| | 1,066 |
|
| | |
| | 4,138 |
| | 871 |
| | 3,267 |
|
1 Certain assets were reclassified as held for sale as at December 31, 2017 (Note 7).
2 Represents a project agreement acquired from the Merger Transaction (Note 7).merger of Enbridge and Spectra Energy.
3 The measurement of weighted average amortization rate excludes non-depreciable intangible assets.
|
| | | | | | | | | | | |
| | Weighted Average |
| | |
| | Accumulated |
| | |
|
| December 31, 2016 | Amortization Rate |
| | Cost |
| | Amortization |
| | Net |
|
| (millions of Canadian dollars) | |
| | |
| | |
| | |
|
| Customer relationships | 3.0 | % | | 251 |
| | 4 |
| | 247 |
|
| Natural gas supply opportunities | 3.2 | % | | 435 |
| | 127 |
| | 308 |
|
| Power purchase agreements | 3.2 | % | | 100 |
| | 14 |
| | 86 |
|
| Software | 11.8 | % | | 1,388 |
| | 607 |
| | 781 |
|
| Other intangible assets | 4.8 | % | | 213 |
| | 62 |
| | 151 |
|
| | |
| | 2,387 |
| | 814 |
| | 1,573 |
|
For the years ended December 31, 2017, 20162023, 2022 and 2015,2021, our amortization expense related to intangible assets totaled $280$535 million, $177$483 million and $158$348 million, respectively. The following table presents our forecast ofOur expected amortization expense associated with existing intangible assets for each of the years indicated2024 to 2028 is $514 million.
15. GOODWILL
| | | | | | | | | | | | | | | | | | | | | |
| Liquids
Pipelines | Gas
Transmission and Midstream | Gas
Distribution and Storage | Renewable Power Generation | Energy
Services | | Consolidated |
| (millions of Canadian dollars) | | | | | | | |
| Balance at January 1, 2022 | 8,041 | | 19,335 | | 5,397 | | — | | 2 | | | 32,775 | |
| Impairment | — | | (2,465) | | — | | — | | — | | | (2,465) | |
| Foreign exchange and other | 506 | | 1,236 | | — | | (4) | | — | | | 1,738 | |
Acquisition3 | — | | — | | — | | 392 | | — | | | 392 | |
Balance at December 31, 20221,2 | 8,547 | | 18,106 | | 5,397 | | 388 | | 2 | | | 32,440 | |
| | | | | | | |
| | | | | | | |
| Foreign exchange and other | (205) | | (425) | | — | | (8) | | — | | | (638) | |
Acquisition4 | — | | 46 | | — | | — | | — | | | 46 | |
Balance at December 31, 20231,2 | 8,342 | | 17,727 | | 5,397 | | 380 | | 2 | | | 31,848 | |
1Gross goodwill as follows in millions of Canadian dollars:at December 31, 2023 and 2022 was $35.9 billion and $36.5 billion, respectively.
2Accumulated impairment as at December 31, 2023 and 2022 was $4.1 billion. |
| | | | |
| 2018 | 2019 | 2020 | 2021 | 2022 |
| 264 | 240 | 217 | 197 | 179 |
15. GOODWILL
|
| | | | | | | | | | | | | | |
| | Liquids Pipelines |
| Gas
Transmission & Midstream |
| Gas
Distribution |
| Green Power and Transmission |
| Energy Services |
| Eliminations and Other |
| Consolidated |
|
| (millions of Canadian dollars) | |
| |
| |
| |
| |
| |
| |
|
| Gross Cost | | | | | | | |
| Balance at January 1, 2016 | 60 |
| 458 |
| 7 |
| — |
| 2 |
| 13 |
| 540 |
|
| Foreign exchange and other | (1 | ) | (1 | ) | — |
| — |
| — |
| — |
| (2 | ) |
| Balance at December 31, 2016 | 59 |
| 457 |
| 7 |
| — |
| 2 |
| 13 |
| 538 |
|
Acquired in Merger Transaction (Note 7) | 8,070 |
| 22,914 |
| 5,672 |
| — |
| — |
| — |
| 36,656 |
|
Sabal Trail deconsolidation (Note 12) | — |
| (966 | ) | | | | | (966 | ) |
| Disposition | (29 | ) | — |
| — |
| — |
| — |
| — |
| (29 | ) |
| Foreign exchange and other | (314 | ) | (866 | ) | — |
| — |
| — |
| — |
| (1,180 | ) |
| Balance at December 31, 2017 | 7,786 |
| 21,539 |
| 5,679 |
| — |
| 2 |
| 13 |
| 35,019 |
|
| Accumulated Impairment | | | | | | | |
| Balance at January 1, 2016 | — |
| (440 | ) | (7 | ) | — |
| — |
| (13 | ) | (460 | ) |
| Impairment | — |
| — |
| — |
| — |
| — |
| — |
| — |
|
| Balance at December 31, 2016 | — |
| (440 | ) | (7 | ) | — |
| — |
| (13 | ) | (460 | ) |
| Impairment | — |
| (102 | ) | — |
| — |
| — |
| — |
| (102 | ) |
| Balance at December 31, 2017 | — |
| (542 | ) | (7 | ) | — |
| — |
| (13 | ) | (562 | ) |
| Carrying Value | | | | | | | |
| Balance at December 31, 2016 | 59 |
| 17 |
| — |
| — |
| 2 |
| — |
| 78 |
|
| Balance at December 31, 2017 | 7,786 |
| 20,997 |
| 5,672 |
| — |
| 2 |
| — |
| 34,457 |
|
ACQUISITION AND DISPOSITION
3In 2017,2022, we recognized $36.7 billion of goodwill on the Merger Transaction and derecognized $29recorded $392 million of goodwill onrelated to the dispositionacquisition of Olympic Pipeline.TGE. Refer to Note 8 - Acquisitions and Dispositions.
4In 2023, we recorded $46 million of goodwill related to the acquisition of Aitken Creek. Refer to Note 8 - Acquisitions and Dispositions.
IMPAIRMENT
Gas Transmission and Midstream
US Midstream
During the year ended December 31, 2017, we recorded a goodwill impairment charge of $102 million related to certain assets in our Gas Transmission and Midstream segment classified as held for sale (Note 7). Goodwill was allocated to certain disposal groups qualifying as a business based on a relative fair value approach. In connection with the write-down of the carrying values of the assets held for sale to its fair value less costs to sell, the related goodwill was impaired. The fair value of these assets were estimated using the discounted cash flow method, which was negatively impacted by prolonged decline in commodity prices and deteriorating business performance. We also performed goodwill impairment testing on the associated gas midstream reporting unit resulting in no additional impairment charge.
The estimate of the gas midstream reporting unit’s fair value required the use of significant unobservable inputs representative of a Level 3 fair value measurement, including assumptions related to the future performance of the reporting unit.
Enbridge Energy Partners, L.P.
During the year ended December 31, 2015,2022, we recorded a goodwill impairment loss of $440 million ($167 million after-tax attributable to us)$2.5 billion related to EEP’s natural gas and NGL businesses, which EEP held directly and indirectly through its partially-owned subsidiary, MEP. Due to a prolonged decline in commodity prices, reduction in producers’ expected drilling programs negatively impacted forecasted cash flows from EEP’s natural gas and NGL systems. This change in circumstance led to the completion of an impairment test, resulting in a full impairment of goodwill on EEP’s natural gas and NGL businesses.
In performing the impairment assessment, EEP measured theour Gas Transmission reporting unit. The fair value of itsthe reporting units primarily byunit, determined using a combination of discounted cash flow analysis and it also considered overall market capitalizationearnings multiples techniques, was impacted by a rise in cost of its business, cash flow measurement datacapital and other factors. EEP’s estimatelower projected long term growth rates for our existing assets. No impairment was recorded for the year ended December 31, 2023.
16. OTHER CURRENT LIABILITIES
| | | | | | | | |
| December 31, | 2023 | 2022 |
| (millions of Canadian dollars) | | |
| Dividends payable | 1,975 | | 1,825 | |
| Deferred credits | 1,313 | | 1,056 | |
Derivative liabilities (Note 23) | 738 | | 898 | |
| Taxes payable | 596 | | 683 | |
| Other | 1,037 | | 758 | |
| 5,659 | | 5,220 | |
17. DEBT
| | | | | | | | | | | | | | |
| December 31, | Weighted Average Interest Rate10 | Maturity | 2023 | 2022 |
| (millions of Canadian dollars) | | | | |
| Enbridge Inc. | | | | |
| US dollar senior notes | 4.6 | % | 2024 - 2053 | 14,636 | | 12,060 | |
| Medium-term notes | 4.5 | % | 2024 - 2064 | 8,598 | | 8,223 | |
| Sustainability-linked bonds | 4.7 | % | 2032 - 2033 | 6,751 | | 3,355 | |
Fixed-to-fixed subordinated term notes1 | 7.5 | % | 2080 - 2084 | 7,156 | | 3,596 | |
Fixed-to-floating rate subordinated term notes2 | 5.8 | % | 2077 - 2078 | 5,828 | | 6,736 | |
Floating rate notes3 | | 2024 | 791 | | 1,491 | |
| Fixed-to-floating non-call notes | 6.0 | % | 2026 | 923 | | — | |
| Commercial paper and credit facility draws | 4.7 | % | 2024 - 2028 | 3,177 | | 7,984 | |
Other4 | | | 17 | | 15 | |
| Enbridge (U.S.) Inc. | | | | |
| Commercial paper and credit facility draws | 5.6 | % | 2025 - 2028 | 670 | | 4,199 | |
Other4 | | | 263 | | 7 | |
| Enbridge Energy Partners, L.P. | | | | |
| Senior notes | 6.5 | % | 2025 - 2045 | 3,231 | | 3,320 | |
| Enbridge Gas Inc. | | | | |
| Medium-term notes | 4.2 | % | 2024 - 2053 | 10,185 | | 9,535 | |
| Debentures | 9.1 | % | 2024 - 2025 | 210 | | 210 | |
| Commercial paper and credit facility draws | 5.2 | % | 2025 | 400 | | 2,000 | |
Other4 | | | 2 | | 1 | |
| Enbridge Pipelines (Southern Lights) L.L.C. | | | | |
| Senior notes | 4.0 | % | 2040 | 791 | | 921 | |
| Enbridge Pipelines Inc. | | | | |
Medium-term notes5 | 4.3 | % | 2024 - 2053 | 5,425 | | 5,425 | |
| Debentures | 8.2 | % | 2024 | 200 | | 200 | |
| Commercial paper and credit facility draws | 5.4 | % | 2025 | 449 | | 312 | |
Other4 | | | 4 | | — | |
| Enbridge Southern Lights LP | | | | |
| Senior notes | 4.0 | % | 2040 | 214 | | 222 | |
| Spectra Energy Capital, LLC | | | | |
| Senior notes | 7.0 | % | 2032 - 2038 | 228 | | 234 | |
| Algonquin Gas Transmission, LLC | | | | |
| Senior notes | 3.3 | % | 2024 - 2029 | 1,121 | | 1,152 | |
| East Tennessee Natural Gas, LLC | | | | |
| Senior notes | 3.1 | % | 2024 | 251 | | 258 | |
| Texas Eastern Transmission, LP | | | | |
| Senior notes | 4.7 | % | 2028 - 2048 | 3,362 | | 3,455 | |
| Spectra Energy Partners, LP | | | | |
| Senior notes | 4.3 | % | 2024 - 2045 | 4,220 | | 4,336 | |
| Tri Global Energy, LLC | | | | |
| Senior notes | | | — | | 18 | |
Blauracke GmbH6 | | | | |
| Senior notes | 2.1 | % | 2032 | 521 | | — | |
| Westcoast Energy Inc. | | | | |
| Medium-term notes | 4.9 | % | 2024 - 2041 | 1,225 | | 1,225 | |
| Debentures | 8.1 | % | 2025 - 2026 | 275 | | 275 | |
| Fair value adjustment | | | 514 | | 608 | |
Other7 | | | (439) | | (393) | |
Total debt8 | | | 81,199 | | 80,980 | |
| Current maturities | | | (6,084) | | (6,045) | |
Short-term borrowings9 | | | (400) | | (1,996) | |
| Long-term debt | | | 74,715 | | 72,939 | |
1For an initial five or 10 years, the notes carry a fixed interest rate. Subsequently, during each reset period the interest rate will be reset to equal to the Five-Year US Treasury rate or Five-Year Government of Canada bond yield plus a margin. The notes would be converted automatically into Conversion Preference Shares in the event of bankruptcy and related events.
2For an initial five or 10 years, the notes carry a fixed interest rate. Subsequently, the interest rate will be floating and set to equal to the Canadian Dollar Offered Rate or the Secured Overnight Financing Rate (SOFR) plus a margin. The notes would be converted automatically into Conversion Preference Shares in the event of bankruptcy and related events.
3The notes carry an interest rate equal to SOFR plus a margin of 40 basis points and SOFR plus a margin of 63 basis points.
4Primarily finance lease obligations.
5Included in medium-term notes is $100 million with a maturity date of 2112.
6In November 2023, as a part of the acquisition of an additional 49% interest in ERII, we assumed debt of $524 million (€358 million). As at December 31, 2023 $61 million (€42 million) and $460 million (€316 million) are recorded within Current portion of long-term debt and Long-term debt, respectively, on the Consolidated Statements of Financial Position. Refer to Note 13 - Long-Term Investments for further details on the transaction.
7Primarily unamortized discounts, premiums and debt issuance costs.
82023 - $37 billion, US$33 billion and €359 million; 2022 - $38 billion, US$31 billion and nil. Totals exclude capital lease obligations, unamortized discounts, premiums and debt issuance costs and fair value required it to use significant unobservable inputs representative of a Level 3 fair value measurement, including assumptions related to the future performance of its reporting units.adjustment.
16. ACCOUNTS PAYABLE AND OTHER
|
| | | | |
| December 31, | 2017 |
| 2016 |
|
| (millions of Canadian dollars) | | |
| Trade payables and operating accrued liabilities | 5,135 |
| 3,718 |
|
| Construction payables and contractor holdbacks | 706 |
| 712 |
|
| Current derivative liabilities | 1,130 |
| 1,941 |
|
| Dividends payable | 1,169 |
| 29 |
|
| Other | 1,338 |
| 895 |
|
| | 9,478 |
| 7,295 |
|
17. DEBT
|
| | | | | | | | | | |
| | Weighted Average |
| | | | |
| | |
|
| December 31, | Interest Rate |
| | Maturity | | 2017 |
| | 2016 |
|
| (millions of Canadian dollars) | |
| | | | |
| | |
|
| Enbridge Inc. | |
| | | | |
| | |
|
United States dollar term notes1 | 4.1 | % | | 2022-2046 | | 5,889 |
| | 4,968 |
|
| Medium-term notes | 4.4 | % | | 2019-2064 | | 5,698 |
| | 4,498 |
|
Fixed-to-floating subordinated term notes2,3 | 5.6 | % | | 2077 | | 3,843 |
| | 1,007 |
|
Floating rate notes4 | | | 2019-2020 | | 2,254 |
| | 1,171 |
|
Commercial paper and credit facility draws5 | 2.3 | % | | 2019-2022 | | 2,729 |
| | 4,672 |
|
Other6 | |
| | | | 3 |
| | 4 |
|
| Enbridge (U.S.) Inc. | |
| | | | | | |
Medium-term notes7 | | | | | — |
| | 14 |
|
Commercial paper and credit facility draws8 | 2.1 | % | | 2019 | | 490 |
| | 126 |
|
| Enbridge Energy Partners, L.P. | |
| | | | | | |
Senior notes9 | 6.2 | % | | 2018-2045 | | 6,328 |
| | 6,781 |
|
Junior subordinated notes10 | | | 2067 | | 501 |
| | 537 |
|
Commercial paper and credit facility draws11 | 2.3 | % | | 2019-2022 | | 1,820 |
| | 2,226 |
|
| Enbridge Gas Distribution Inc. | |
| | | | | | |
| Medium-term notes | 4.5 | % | | 2020-2050 | | 3,695 |
| | 3,904 |
|
| Debentures | 9.9 | % | | 2024 | | 85 |
| | 85 |
|
| Commercial paper and credit facility draws | 1.4 | % | | 2019 | | 960 |
| | 351 |
|
| Enbridge Income Fund | |
| | | | | | |
| Medium-term notes | 4.3 | % | | 2018-2044 | | 1,750 |
| | 2,075 |
|
| Commercial paper and credit facility draws | 2.9 | % | | 2020 | | 755 |
| | 225 |
|
| Enbridge Pipelines (Southern Lights) L.L.C. | |
| | | | | | |
Senior notes12 | 4.0 | % | | 2040 | | 1,207 |
| | 1,342 |
|
| Enbridge Pipelines Inc. | |
| | | | | | |
Medium-term notes13 | 4.5 | % | | 2018-2046 | | 4,525 |
| | 4,525 |
|
| Debentures | 8.2 | % | | 2024 | | 200 |
| | 200 |
|
Commercial paper and credit facility draws14 | 1.5 | % | | 2019 | | 1,438 |
| | 1,032 |
|
Other6 | |
| | | | 4 |
| | 4 |
|
| Enbridge Southern Lights LP | |
| | | | | | |
| Senior notes | 4.0 | % | | 2040 | | 315 |
| | 323 |
|
| Midcoast Energy Partners, L.P. | |
| | | | |
| | |
|
Senior notes15 | 4.1 | % | | 2019-2024 | | 501 |
| | 537 |
|
Commercial paper and credit facility draws16 | |
| | | | — |
| | 564 |
|
Spectra Energy Capital17 | | | | | | | |
Senior notes18 | 5.3 | % | | 2018-2038 | | 1,665 |
| | — |
|
Spectra Energy Partners, LP17
| | | | | | | |
Senior secured notes19 | 6.1 | % | | 2020 | | 138 |
| | — |
|
Senior notes20 | 2.7 | % | | 2018-2045 | | 7,192 |
| | — |
|
Floating rate notes21 | | | 2020 | | 501 |
| | — |
|
Commercial paper and credit facility draws22 | 2.0 | % | | 2022 | | 2,824 |
| | — |
|
Union Gas Limited17 | | | | | | | |
| Medium-term notes | 4.2 | % | | 2018-2047 | | 3,490 |
| | — |
|
| Senior debentures | 8.7 | % | | 2018 | | 75 |
| | — |
|
| Debentures | 8.7 | % | | 2018-2025 | | 250 |
| | — |
|
| Commercial paper and credit facility draws | 1.3 | % | | 2021 | | 485 |
| | — |
|
Westcoast Energy Inc.17
| | | | | | | |
| Senior secured notes | 6.4 | % | | 2019 | | 66 |
| | — |
|
| Medium-term notes | 4.7 | % | | 2019-2041 | | 2,177 |
| | — |
|
| Debentures | 8.6 | % | | 2018-2026 | | 525 |
| | — |
|
| Fair value adjustment - Spectra Energy acquisition | | | | | 1,114 |
| | — |
|
Other23 | |
| | | | (312 | ) | | (226 | ) |
| Total debt | |
| | | | 65,180 |
| | 40,945 |
|
| Current maturities | |
| | | | (2,871 | ) | | (4,100 | ) |
Short-term borrowings24 | |
| | | | (1,444 | ) | | (351 | ) |
| Long-term debt | |
| | | | 60,865 |
| | 36,494 |
|
| |
1 | 2017 - US$4,700 million; 2016 - US$3,700 million. |
| |
2 | 2017 - $1,650 million and US$1,750 million; 2016 - US$750 million. For the initial 10 years, the notes carry a fixed interest rate. Subsequently, the interest rate will be floating and set to equal the three-month Bankers' Acceptance Rate or London Interbank Offered Rate (LIBOR) plus a margin. |
| |
3 | The notes would be converted automatically into Conversion Preference Shares in the event of bankruptcy and related events. |
| |
4 | 2017 - $750 million and US$1,200 million; 2016 - $500 million and US$500 million. Carries an interest rate equal to the three-month Bankers' Acceptance Rate plus a margin of 59 basis points or LIBOR plus a margin of 40 or 70 basis points. |
| |
5 | 2017 - $1,593 million and US$907 million; 2016 - $3,600 million and US$799 million. |
| |
6 | Primarily capital lease obligations. |
| |
8 | 2017 - US$391 million; 2016 - US$94 million. |
| |
9 | 2017 - US$5,050 million; 2016 - US$5,050 million. |
| |
10 | 2017 - US$400 million; 2016 - US$400 million. Carries an interest rate equal to the three-month LIBOR plus a margin of 379.75 basis points. |
| |
11 | 2017 - US$1,453 million; 2016 - US$1,658 million. |
| |
12 | 2017 - US$963 million; 2016 - US$1,000 million. |
| |
13 | Included in medium-term notes is $100 million with a maturity date of 2112. |
| |
14 | 2017 - $1,080 million and US$286 million; 2016 - $750 million and US$210 million. |
| |
15 | 2017 - US$400 million; 2016 - US$400 million. |
| |
17 | Debt acquired on February 27, 2017 in conjunction with the Merger Transaction (Note 7). |
| |
18 | 2017 - US$1,329 million. |
| |
20 | 2017 - US$5,740 million. |
| |
21 | 2017 - US$400 million. Carries an interest rate equal to the three-month LIBOR plus a margin of 70 basis points. |
| |
22 | 2017 - US$2,254 million. |
| |
23 | Primarily debt discount and debt issue costs. |
| |
24 | Weighted average interest rate - 1.4%; 2016 - 0.8%. |
SECURED DEBT
Senior secured notes, totaling $206 million9Weighted average interest rates on outstanding commercial paper were 5.2% as at December 31, 2017, includes project financings for M&N Canada2023 (2022 - 4.5%).
10 Calculated based on term notes, debentures, commercial paper and Express-Platte System. Ownership interests in M&N Canada and certain of its accounts, revenues, business contracts and other assets are pledgedcredit facility draws outstanding as collateral. Express-Platte System notes payable are secured by the assignment of the Express-Platte System transportation receivables and by the Canadian portion of the Express-Platte pipeline system assets.at December 31, 2023.
As at December 31, 2023, all outstanding debt was unsecured.
CREDIT FACILITIES
The following table provides details of our committed credit facilities as at December 31, 2017:2023:
| | | | | | | | | | | | | | |
| Maturity1 | Total Facilities | Draws2 | Available |
| (millions of Canadian dollars) | | | | |
| Enbridge Inc. | 2024-2028 | 8,876 | | 3,177 | | 5,699 | |
| Enbridge (U.S.) Inc. | 2025-2028 | 8,373 | | 670 | | 7,703 | |
| Enbridge Pipelines Inc. | 2025 | 2,000 | | 449 | | 1,551 | |
| Enbridge Gas Inc. | 2025 | 2,500 | | 400 | | 2,100 | |
| Total committed credit facilities | | 21,749 | | 4,696 | | 17,053 | |
|
| | | | | | | |
| | | 2017 |
| | | Total |
| |
| |
|
| December 31, | Maturity | Facilities |
| Draws1 |
| Available |
|
| (millions of Canadian dollars) | | |
| |
| |
|
Enbridge Inc.2 | 2019-2022 | 7,353 |
| 2,737 |
| 4,616 |
|
| Enbridge (U.S.) Inc. | 2019 | 3,590 |
| 490 |
| 3,100 |
|
Enbridge Energy Partners, L.P.3 | 2019-2022 | 3,289 |
| 1,820 |
| 1,469 |
|
| Enbridge Gas Distribution Inc. | 2019 | 1,016 |
| 972 |
| 44 |
|
| Enbridge Income Fund | 2020 | 1,500 |
| 766 |
| 734 |
|
| Enbridge Pipelines (Southern Lights) L.L.C. | 2019 | 25 |
| — |
| 25 |
|
| Enbridge Pipelines Inc. | 2019 | 3,000 |
| 1,438 |
| 1,562 |
|
| Enbridge Southern Lights LP | 2019 | 5 |
| — |
| 5 |
|
Spectra Energy Partners, LP4,5 | 2022 | 3,133 |
| 2,824 |
| 309 |
|
Union Gas Limited5
| 2021 | 700 |
| 485 |
| 215 |
|
Westcoast Energy Inc.5
| 2021 | 400 |
| — |
| 400 |
|
| Total committed credit facilities | | 24,011 |
| 11,532 |
| 12,479 |
|
| |
1 | Includes facility draws, letters of credit and commercial paper issuances that are back-stopped by the credit facility. |
| |
2 | Includes $135 million, $157 million (US$125 million) and $150 million of commitments that expire in 2018, 2018 and 2020, respectively. 2Includes facility draws and commercial paper issuances that are back-stopped by credit facilities. |
| |
3 | Includes $219 million (US$175 million) and $232 million (US$185 million) of commitments that expire in 2018 and 2020, respectively.
|
| |
4 | Includes $421 million (US$336 million) of commitments that expire in 2021.
|
| |
5 | Committed credit facilities acquired on February 27, 2017 in conjunction with the Merger Transaction (Note 7). |
During the first quarter of 2017,In March 2023, Enbridge established a five-year, termGas increased its 364-day extendible credit facility from $2.0 billion to 2.5 billion and in July 21, 2023, the facility's maturity date was extended to July 2025, which includes a one-year term out provision from July 2024.
In July 2023, Enbridge Pipelines Inc. extended the maturity date of its 364-day extendible credit facility to July 2025, which includes a one-year term out provision from July 2024.
In July 2023, we renewed approximately $6.8 billion of our 364-day extendible credit facilities, extending the maturity dates to July 2025, which includes a one-year term out provision from July 2024. We also renewed approximately $7.6 billion of our five-year credit facilities, extending the maturity dates to July 2028. Further, we extended our three-year credit facilities, extending the maturity dates to July 2026.
In September 2023, we obtained commitments for $239 million (¥20,000 million) with a syndicateUS$9.4 billion senior unsecured bridge term loan credit facility to support the Acquisitions. The commitment for this facility was subsequently reduced to nil as at December 31, 2023 as a result of Japanese banks. the September 2023 $4.6 billion equity offering, the September 2023 subordinated long-term debt issuances, and the November 2023 senior notes long-term debt issuances.
In addition to the committed credit facilities noted above, we have $792 millionmaintain $1.1 billion of uncommitted demand letter of credit facilities, of which $518$572 million werewas unutilized as at December 31, 2017.2023. As at December 31, 2016,2022, we had $335 million$1.3 billion of uncommitted demand letter of credit facilities, of which $177$689 million werewas unutilized.
CreditOur credit facilities carry a weighted average standby fee of 0.2%0.1% per annum on the unused portion and draws bear interest at market rates. Certain credit facilities serve as a back-stop to the commercial paper programs and we have the option to extend such facilities, which are currently setscheduled to mature from 20192024 to 2022.2028.
As at December 31, 20172023 and 2016,2022, commercial paper and credit facility draws, net of short-term borrowings and non-revolving credit facilities that mature within one year, of $10,055 million$3.8 billion and $7,344 million,$10.5 billion, respectively, arewere supported by the availability of long-term committed credit facilities and, therefore, have been classified as long-term debt.
LONG-TERM DEBT ISSUANCES
TheDuring the year ended December 31, 2023, we completed the following are long-term debt issuances made during 2017totaling US$8.5 billion and 2016:$3.9 billion:
| | | | | | | | | | | | | | |
| Company | Issue Date | | | Principal Amount |
| (millions of Canadian dollars unless otherwise stated) | |
| Enbridge Inc. |
| March 2023 | 5.70% | sustainability-linked senior notes due March 20331 | US$2,300 |
| March 2023 | 5.97% | senior notes due March 20262 | US$700 |
| May 2023 | 4.90% | medium-term notes due May 2028 | $600 |
| May 2023 | 5.36% | sustainability-linked medium-term notes due May 20333 | $400 |
| May 2023 | 5.76% | medium-term notes due May 2053 | $500 |
| September 2023 | 8.50% | fixed-to-fixed subordinated notes due January 20844 | US$1,250 |
| September 2023 | 8.25% | fixed-to-fixed subordinated notes due January 20845 | US$750 |
| September 2023 | 8.75% | fixed-to-fixed subordinated notes due January 20846 | $700 |
| September 2023 | 8.50% | fixed-to-fixed subordinated notes due January 20847 | $300 |
| November 2023 | 5.90% | senior notes due November 2026 | US$750 |
| November 2023 | 6.00% | senior notes due November 2028 | US$750 |
| November 2023 | 6.20% | senior notes due November 2030 | US$750 |
| November 2023 | 6.70% | senior notes due November 2053 | US$1,250 |
| Enbridge Gas Inc. |
| October 2023 | 5.46% | medium-term notes due October 2028 | $250 |
| October 2023 | 5.70% | medium-term notes due October 2033 | $400 |
| October 2023 | 5.67% | medium-term notes due October 2053 | $350 |
| Enbridge Pipelines Inc. |
| August 2023 | 5.82% | medium-term notes due August 2053 | $350 |
1The sustainability-linked senior notes are subject to a sustainability performance target of 35% reduction in emissions intensity from 2018 levels at an observation date of December 31, 2030. If the target is not met, on September 8, 2031, the interest rate will be set to equal 5.70% plus 50 basis points.
2We have the option to call the notes at par after one year from issuance. Refer to Note 23 - Risk Management and Financial Instruments.
3The sustainability-linked senior notes are subject to a sustainability performance target of 35% reduction in emissions intensity from 2018 levels at an observation date of December 31, 2030. If the target is not met, on November 26, 2031, the interest rate will be set to equal 5.36% plus 50 basis points.
4For the initial 10 years, the notes carry a fixed interest rate. At year 10, the interest rate will be reset to equal to the Five-Year US Treasury rate plus a margin of 4.43%. Subsequent to year 10, every five years, the Five-year US treasury rate is reset. At year 30, the interest rate will be reset to equal to the Five-Year US Treasury rate plus a margin of 5.18%.
5For the initial five years, the notes carry a fixed interest rate. At year five, the interest rate will be reset to equal to the Five-Year US Treasury rate plus a margin of 3.79%. At year 10, the interest rate will be reset to equal the Five-Year US Treasury rate plus a margin of 4.04%. Subsequent to year 10, every five years, the Five-Year US Treasury rate is reset. At year 25, the interest rate will be reset to equal to the Five-Year US Treasury rate plus a margin of 4.79%.
6For the initial 10 years, the notes carry a fixed interest rate. At year 10, the interest rate will be reset to equal to the Five-Year Government of Canada bond yield plus a margin of 4.96%. Subsequent to year 10, every five years, the Government of Canada bond yield rate is reset. At year 30, the interest rate will be reset to equal to the Five-Year Government of Canada bond yield plus a margin of 5.71%.
7For the initial five years, the notes carry a fixed interest rate. At year five, the interest rate will be reset to equal to the Five-Year Government of Canada bond yield plus a margin of 4.30%. At year 10, the interest rate will be reset to equal the Five-Year Government of Canada bond yield plus a margin of 4.55%. Subsequent to year 10, every five years, the Five-Year Government of Canada bond yield is reset. At year 25, the interest rate will be reset to equal to the Five-Year Government of Canada bond yield plus a margin of 5.30%.
|
| | | | | |
Company | Issue Date | | | Principal Amount |
|
(millions of Canadian dollars unless otherwise stated) | | |
Enbridge Inc. | | | |
| May 2017 | Floating rate notes due May 20191
| | 750 |
|
| June 2017 | 3.19% medium-term notes due December 2022 | 450 |
|
| June 2017 | 3.20% medium-term notes due June 2027 | 450 |
|
| June 2017 | 4.57% medium-term notes due March 2044 | 300 |
|
| June 2017 | Floating rate notes due June 20202
| US$500 |
|
| July 2017 | 2.90% senior notes due July 2022 | US$700 |
|
| July 2017 | 3.70% senior notes due July 2027 | US$700 |
|
| July 2017 | Fixed-to-floating rate subordinated notes due July 20773
| US$1,000 |
|
| September 2017 | Fixed-to-floating rate subordinated notes due September 20774
| 1,000 |
|
| October 2017 | Fixed-to-floating rate subordinated notes due September 20774
| 650 |
|
| October 2017 | Floating rate notes due January 20205
| US$700 |
|
| November 2016 | 4.25% medium-term notes due December 2026 | US$750 |
|
| November 2016 | 5.50% medium-term notes due December 2046 | US$750 |
|
| December 2016 | Fixed-to-floating rate subordinated notes due January 20776
| US$750 |
|
Enbridge Gas Distribution Inc.
| | | |
| November 2017 | 3.51% medium-term notes due November 2047 | 300 |
|
| August 2016 | 2.50% medium-term notes due August 2026 | 300 |
|
Enbridge Pipelines Inc.
| | | |
| August 2016 | 3.00% medium-term notes due August 2026 | 400 |
|
| August 2016 | 4.13% medium-term notes due August 2046 | 400 |
|
Spectra Energy Partners, LP
| | | |
| June 2017 | Floating rate notes due June 20207
| US$400 |
|
Union Gas Limited | | | |
| November 2017 | 2.88% medium-term notes due November 2027 | 250 |
|
| November 2017 | 3.59% medium-term notes due November 2047 | 250 |
|
| |
1 | Carries an interest rate equal to the three-month Bankers' Acceptance Rate plus 59 basis points.
|
| |
2 | Carries an interest rate equal to the three-month LIBOR plus 70 basis points. |
| |
3 | Matures in 60 years and are callable on or after year 10. For the initial 10 years, the notes carry a fixed interest rate of 5.5%. Subsequently, the interest rate will be set to equal the three-month LIBOR plus a margin of 342 basis points from year 10 to 30, and a margin of 417 basis points from year 30 to 60. |
| |
4 | Matures in 60 years and are callable on or after year 10. For the initial 10 years, the notes carry a fixed interest rate of 5.4%. Subsequently, the interest rate will be set to equal the three-month Bankers' Acceptance Rate plus a margin of 325 basis points from year 10 to 30, and a margin of 400 basis points from year 30 to 60. |
| |
5 | Carries an interest rate equal to the three-month LIBOR plus 40 basis points. |
| |
6 | Matures in 60 years and are callable on or after year 10. For the initial 10 years, the notes carry a fixed interest rate of 6.0%. Subsequently, the interest rate will be set to equal the three-month LIBOR plus a margin of 389 basis points from year 10 to 30, and a margin of 464 basis points from year 30 to 60. |
| |
7 | Carries an interest rate equal to the three-month LIBOR plus 70 basis points. |
LONG-TERM DEBT REPAYMENTS
TheDuring the year ended December 31, 2023, we completed the following are long-term debt repayments during 2017totaling $1.4 billion and 2016:US$2.5 billion, respectively:
| | | | | | | | | | | | | | |
| Company | Repayment Date | | | Principal Amount |
| (millions of Canadian dollars, unless otherwise stated) |
| Enbridge Inc. |
| January 2023 | 3.94% | medium-term notes | $275 |
| February 2023 | Floating rate notes1 | US$500 |
| April 2023 | 6.38% | fixed-to-floating rate subordinated notes2 | US$600 |
| June 2023 | 3.94% | medium-term notes | $450 |
| October 2023 | 4.00% | senior notes | US$800 |
| October 2023 | 0.55% | senior notes | US$500 |
| Enbridge Gas Inc. |
| July 2023 | 6.05% | medium-term notes | $100 |
| July 2023 | 3.79 | % | medium-term notes | $250 |
| Enbridge Pipelines (Southern Lights) L.L.C. |
| June and December 2023 | 3.98% | senior notes | US$80 |
| Enbridge Pipelines Inc. |
| August 2023 | 3.79% | medium-term notes | $250 |
| November 2023 | 6.35% | medium-term notes | $100 |
| Enbridge Southern Lights LP |
| June 2023 | 4.01% | senior notes | $9 |
| Tri Global Energy, LLC |
| January 2023 | 10.00% | senior notes | US$4 |
| January 2023 | 14.00% | senior notes | US$9 |
|
| | | | | |
Company | Retirement/Repayment Date | | | Principal Amount |
|
(millions of Canadian dollars unless otherwise stated) | | |
Enbridge Inc. | | | |
| March 2017 | Floating rate note | 500 |
|
| April 2017 | 5.60% medium-term notes | US$400 |
|
| June 2017 | Floating rate note | US$500 |
|
| May 2016 | 5.17% medium-term notes | 400 |
|
| August 2016 | 5.00% medium-term notes | 300 |
|
| October 2016 | Floating rate note | US$350 |
|
Enbridge Energy Partners, L.P.
| | |
| December 2016 | 5.88% senior notes | US$300 |
|
Enbridge Gas Distribution Inc.
| | | |
| April 2017 | 1.85% medium-term notes | 300 |
|
| December 2017 | 5.16% medium-term notes | | 200 |
|
Enbridge Income Fund
| | | |
| June 2017 | 5.00% medium-term notes | | 100 |
|
| December 2017 | 2.92% medium-term notes | | 225 |
|
| November 2016 | Floating rate note | | 330 |
|
Enbridge Pipelines (Southern Lights) L.L.C. | | |
| June and December 2017 | 3.98% medium-term note due June 2040 | US$37 |
|
| June and December 2016 | 3.98% medium-term note due June 2040 | US$30 |
|
Enbridge Southern Lights LP
| | | |
| June 2017 | 4.01% medium-term note due June 2040 | 7 |
|
| June and December 2016 | 4.01% medium-term note due June 2040 | 14 |
|
Spectra Energy Capitals, LLC | | | |
| July and September 20171,3
| 8.00% senior notes due 2019 | US$500 |
|
| July 20172,3
| Senior notes carrying interest ranging from 3.3% to 7.5% due 2018 to 2038 | US$761 |
|
Spectra Energy Partners, LP | | | |
| September 2017 | 6.00% senior notes | US$400 |
|
| June and December 2017 | 7.39% subordinated secured notes | US$12 |
|
Union Gas Limited | | | |
| November 2017 | 9.70% debentures | 125 |
|
Westcoast Energy Inc. | | | |
| May and November 2017 | 6.90% senior secured notes | | 26 |
|
| May and November 2017 | 4.34% senior secured notes | | 24 |
|
| |
1 | On July 7, 2017 and September 8, 2017, Enbridge and Spectra Energy Capital, LLC (Spectra Capital) completed a cash tender offer for and follow-up redemption of Spectra Capital’s outstanding 8.0% senior unsecured notes due 2019. The aggregate principal amount tendered and redeemed was US$500 million. Spectra Capital paid the consenting note holders an aggregate cash consideration of US$581 million. |
| |
2 | On July 13, 2017, pursuant to a cash tender offer, Spectra Capital purchased a portion of the principal amount of its outstanding senior unsecured notes carrying interest rates ranging from 3.3% to 7.5%, with maturities ranging from one to 21 years. The principal amount tendered and accepted was US$761 million. Spectra Capital paid the consenting note holders an aggregate cash consideration of US$857 million. |
| |
3 | The loss on debt extinguishment of $50 million (US$38 million), net of the fair value adjustment recorded upon completion of the Merger Transaction, was reported within Interest expense in the Consolidated Statements of Earnings. |
1Notes carried an interest rate set to equal the SOFR plus a margin of 40 basis points.
2The five-year callable notes, with an original maturity date of April 2078, were all redeemed at par.
DEBT COVENANTS
Our credit facility agreements and term debt indentures include standard events of default and covenant provisions whereby accelerated repayment and/or termination of the agreements may result if we were to default on payment or violate certain covenants. As at December 31, 2017,2023, we were in compliance with all debt covenants.
ANNUAL DEBT MATURITIES
As at December 31, 2023, we have commitments as detailed below:
| | | | | | | | | | | | | | | | | | | | | | | |
| Total | Less than 1 year | 2 years | 3 years | 4 years | 5 years | Thereafter |
| (millions of Canadian dollars) | | | | | | | |
Annual debt maturities1 | 80,438 | | 6,067 | | 6,405 | | 5,630 | | 3,377 | | 5,307 | | 53,652 | |
| | | | | | | |
1Includes debentures, term notes, commercial paper and credit facility draws based on the facility's maturity date and excludes short-term borrowings, debt discounts, debt issuance costs, finance lease obligations and fair value adjustment. We have the ability under certain debt facilities to call and repay the obligations prior to scheduled maturities. Therefore, the actual timing of future cash repayments could be materially different than presented above.
INTEREST EXPENSE
| | | | | | | | | | | |
| Year ended December 31, | 2023 | 2022 | 2021 |
| (millions of Canadian dollars) | | | |
| Debentures and term notes | 3,439 | | 2,910 | | 2,806 | |
| Commercial paper and credit facility draws | 519 | | 388 | | 114 | |
| Amortization of fair value adjustment | (45) | | (45) | | (50) | |
| Capitalized interest | (101) | | (74) | | (215) | |
| | 3,812 | | 3,179 | | 2,655 | |
|
| | | | | | |
| Year ended December 31, | 2017 |
| 2016 |
| 2015 |
|
| (millions of Canadian dollars) | |
| |
| |
|
| Debentures and term notes | 3,011 |
| 1,714 |
| 1,805 |
|
| Commercial paper and credit facility draws | 206 |
| 197 |
| 172 |
|
| Amortization of fair value adjustment - Spectra Energy acquisition | (270 | ) | — |
| — |
|
| Capitalized | (391 | ) | (321 | ) | (353 | ) |
| | 2,556 |
| 1,590 |
| 1,624 |
|
18. ASSET RETIREMENT OBLIGATIONS
Our AROsARO relate mostly to the retirement of pipelines, renewable power generation assets and obligations related to right-of way agreements and contractual leases for land use.
The discount rates used to estimate the present value of the expected future cash flows for the years ended December 31, 2023 and 2022 ranged from1.5% to 9.0%.
A reconciliation of movements in our ARO liabilities is as follows:
| | | | | | | | |
| December 31, | 2023 | 2022 |
| (millions of Canadian dollars) | | |
| Obligations at beginning of year | 488 | | 502 | |
| Liabilities acquired | 1 | | — | |
| | |
| Liabilities incurred | — | | 30 | |
| Liabilities settled | (23) | | (126) | |
| Change in estimate and other | 5 | | 51 | |
| Foreign currency translation adjustment | (6) | | 24 | |
| Accretion expense | 28 | | 7 | |
| Obligations at end of year | 493 | | 488 | |
| Presented as follows: | | |
| Other current liabilities | 136 | | 83 | |
| Other long-term liabilities | 357 | | 405 | |
| 493 | | 488 | |
|
| | | | |
| December 31, | 2017 |
| 2016 |
|
| (millions of Canadian dollars) | | |
| Obligations at beginning of year | 232 |
| 198 |
|
| Liabilities acquired | 546 |
| — |
|
| Liabilities incurred | — |
| 2 |
|
| Liabilities settled | (22 | ) | (33 | ) |
| Change in estimate | 18 |
| 63 |
|
| Foreign currency translation adjustment | (12 | ) | (5 | ) |
| Accretion expense | 31 |
| 7 |
|
| Obligations at end of year | 793 |
| 232 |
|
| Presented as follows: | | |
| Accounts payable and other | 2 |
| 2 |
|
| Other long-term liabilities | 791 |
| 230 |
|
| | 793 |
| 232 |
|
19. NONCONTROLLING INTERESTS
NONCONTROLLING INTERESTS
The following table provides additional information regarding Noncontrolling interests as presented in our Consolidated Statements of Financial Position:
|
| | | | |
| December 31, | 2017 |
| 2016 |
|
| (millions of Canadian dollars) | | |
Enbridge Energy Management, L.L.C.1 | 34 |
| 36 |
|
Enbridge Energy Partners, L.P.2 | 157 |
| (99 | ) |
Enbridge Gas Distribution Inc.3 | 100 |
| 100 |
|
Renewable energy assets4 | 806 |
| 516 |
|
Spectra Energy Partners, LP5,8 | 5,385 |
| — |
|
Union Gas Limited6,8 | 110 |
| — |
|
Westcoast Energy Inc.7,8 | 1,005 |
| — |
|
| Other | — |
| 24 |
|
| | 7,597 |
| 577 |
|
| |
1 | Represents the 88.3% of the listed shares of Enbridge Energy Management, L.L.C. (EEM) not held by us as at December 31, 2017 and 2016. |
| |
2 | Represents the 68.2% and 80.2% interest in EEP held by public unitholders as well as interests of third parties in subsidiaries of EEP as at December 31, 2017 and 2016, respectively. |
| |
3 | Represents the four million cumulative redeemable preferred shares held by third parties in EGD as at December 31, 2017 and 2016. |
| |
4 | Represents the tax equity investors' interests in our Magic Valley, Wildcat, Keechi, New Creek and Chapman Ranch wind farms, which are accounted for using the HLBV method, with an additional 20.0% noncontrolling interest in each of the Magic Valley and Wildcat wind farms held by third parties as at December 31, 2017 and 2016. |
| |
5 | Represents the 25.7% interest in SEP held by public unitholders as at December 31, 2017. |
| |
6 | Represents the four million cumulative redeemable preferred shares held by third parties in Union Gas as at December 31, 2017. |
| |
7 | Represents the 16.6 million cumulative redeemable preferred shares and 12 million cumulative first preferred shares as at December 31, 2017 held by third parties in Westcoast Energy Inc., and the 22.0% interest in Maritimes & Northeast Pipeline Limited Partnership held by third parties. |
| |
8 | Represents noncontrolling interests resulting from the Merger Transaction (Note 7).
|
| | | | | | | | |
| December 31, | 2023 | 2022 |
| (millions of Canadian dollars) | | |
| Algonquin Gas Transmission, LLC | 384 | | 400 | |
Enbridge Athabasca Midstream Investor Limited Partnership1 | 1,086 | | 1,106 | |
| Maritimes & Northeast Pipeline, L.L.C. | 559 | | 582 | |
| Renewable energy assets | 885 | | 1,302 | |
| Maritimes & Northeast Pipeline Limited Partnership | 111 | | 117 | |
| Other | 4 | | 4 | |
| 3,029 | | 3,511 | |
Enbridge Energy Partners, L.P.
United States Sponsored Vehicle Strategy
1On April 28, 2017,October 5, 2022, we completed a strategic reviewclosed the sale of EEP and took the actions described below. As a result of these actions, we recorded an increase in Noncontrolling interests of $458 million, inclusive of foreign currency translation adjustments, and a decrease in Additional paid-in capital of $421 million, net of deferred income taxes of $253 million.
Acquisition of Midcoast Assets and Privatization of Midcoast Energy Partners, L.P.
On April 27, 2017, we completed our previously-announced merger through a wholly-owned subsidiary, through which we privatized MEP by acquiring all of the outstanding publicly-held common units of MEP for total consideration of approximately US$170 million.
On June 28, 2017, we acquired, through a wholly-owned subsidiary, all of EEP’s11.6% non-operating interest in the Midcoast gas gatheringcertain assets from our Regional Oil Sands System to Aii. Refer to Note 8 - Acquisitions and processing business for cash consideration of US$1.3 billion plus existing indebtedness of MEP of US$953 million.Dispositions.
As a result of the above transactions, 100% of the Midcoast gas gathering and processing business is now owned by us.
EEP Strategic Restructuring Actions
On April 27, 2017, EEP redeemed all of its outstanding Series 1 Preferred Units held by us at face value of US$1.2 billion through the issuance of 64.3 million Class A common units to us. We also irrevocably waived all of our rights associated with our ownership of 66.1 million Class D units and 1,000 Incentive Distribution Units of EEP, in exchange for the issuance of 1,000 Class F units. The Class F units are entitled to (i) 13% of all distributions in excess of US$0.295 per EEP unit, but equal to or less than US$0.35 per EEP unit, and (ii) 23% of all distributions in excess of US$0.35 per EEP unit. The irrevocable waiver was effective with respect to distributions declared with a record date after April 27, 2017. In connection with these strategic restructuring actions, EEP reduced its quarterly distribution from US$0.583 per unit to US$0.35 per unit. Further, in conjunction with the restructuring actions, EEP terminated a receivable purchase agreement with a special purpose entity wholly-owned by us.
Finalization of Bakken Pipeline System Joint Funding Agreement
On April 27, 2017, we entered into a joint funding arrangement with EEP. Pursuant to this joint funding arrangement, we own 75% and EEP owns 25% of the combined 27.6% effective interest in the Bakken Pipeline System. Under this arrangement, EEP retains a five-year option to acquire an additional 20% interest in the Bakken Pipeline System. Upon the execution of the joint funding arrangement, EEP repaid the outstanding balance on its US$1.5 billion credit agreement with us, which it had drawn upon to fund the initial purchase.
Drop Down of Interest to Enbridge Energy Partners, L.P.
On January 2, 2015, we transferred our 66.7% interest in the United States segment of the Alberta Clipper pipeline, held through a wholly-owned subsidiary, to EEP for aggregate consideration of $1.1 billion (US$1 billion), consisting of approximately $814 million (US$694 million) of Class E equity units issued to us by EEP and the repayment of approximately $359 million (US$306 million) of indebtedness owed to us. Prior to the transfer, EEP owned the remaining 33.3% interest in the United States segment of the Alberta Clipper pipeline. As a result of this transfer, we recorded a decrease in Noncontrolling interests of $304 million and increases in Additional paid-in capital and Deferred income tax liabilities of $218 million and $86 million, respectively.
Other
The EEP partnership agreement does not permit capital deficits to accumulate in the capital accounts of any limited partner and thus requires that such capital account deficits be "cured" by additional allocations from the positive capital accounts of the other limited partners and the General Partner, generally on a pro-rata basis. Further, as outlined in the EEP partnership agreement, when a limited partner's capital accounts have positive capital balances, such limited partner must allocate its earnings to the General Partner of EEP to reimburse them for previous curing allocations. As a result, earnings attributable to noncontrolling interests in the Consolidated Statements of Earnings for the years ended December 31, 2017 and 2016 were lower by $73 million and higher by $816 million, respectively, due to these reallocations.
On March 13, 2015, EEP completed a public common unit issuance. We participated only to the extent to maintain our 2% general partner interest. The common unit issuance resulted in contributions of $366 million (US$289 million) from noncontrolling interest holders.
REDEEMABLE NONCONTROLLING INTERESTS
The following table presents additional information regarding Redeemable noncontrolling interests as presented in our Consolidated Statements of Financial Position:
|
| | | | | | |
| Year ended December 31, | 2017 |
| 2016 |
| 2015 |
|
| (millions of Canadian dollars) | | | |
| Balance at beginning of year | 3,392 |
| 2,141 |
| 2,249 |
|
| Earnings/(loss) attributable to redeemable noncontrolling interests | 175 |
| 268 |
| (3 | ) |
| Other comprehensive income/(loss), net of tax | | | |
| Change in unrealized loss on cash flow hedges | (21 | ) | (17 | ) | (7 | ) |
| Other comprehensive loss from equity investees | — |
| — |
| (12 | ) |
| Reclassification to earnings of loss on cash flow hedges | 57 |
| 9 |
| 4 |
|
| Foreign currency translation adjustments | (6 | ) | (3 | ) | 18 |
|
| Other comprehensive income/(loss), net of tax | 30 |
| (11 | ) | 3 |
|
| Distributions to unitholders | (247 | ) | (202 | ) | (114 | ) |
| Contributions from unitholders | 1,178 |
| 591 |
| 670 |
|
| Reversal of cumulative redemption value adjustment attributable to ECT preferred units | — |
| — |
| (541 | ) |
Net dilution loss
| (169 | ) | (81 | ) | (482 | ) |
| Redemption value adjustment | (292 | ) | 686 |
| 359 |
|
| Balance at end of year | 4,067 |
| 3,392 |
| 2,141 |
|
Redeemable noncontrolling interests in the Fund as at December 31, 2017, 2016 and 2015 represented56.5%, 45.6% and 40.7%, respectively, of interests in the Fund’s trust units that are held by third parties.
Common Share Issuances
During the years ended December 31, 2017, 2016 and 2015, the following occurred:
|
| | | | | | |
| Year ended December 31, | 2017 |
| 2016 |
| 2015 |
|
| (millions of Canadian dollars) | | | |
ENF issuance of common shares1: | | | |
| Gross proceeds from the public | 575 |
| 575 |
| 700 |
|
Gross proceeds from us2 | 143 |
| 143 |
| 174 |
|
ENF purchase of Fund trust units1,3: | | | |
| Contributions from redeemable noncontrolling interest holders, net of share issue costs | 552 |
| 551 |
| 670 |
|
| Dilution gain/(loss) for redeemable noncontrolling interests | 5 |
| (4 | ) | (355 | ) |
| Dilution gain/(loss) in Additional paid-in capital | (5 | ) | 4 |
| 355 |
|
ECT purchase of EIPLP Class A units1,4: | | | |
| Proceeds used by ECT to purchase EIPLP Class A units | 718 |
| 718 |
| 874 |
|
| Dilution loss for redeemable noncontrolling interests | (123 | ) | (103 | ) | (132 | ) |
| Dilution gain in Additional paid-in capital | 123 |
| 103 |
| 132 |
|
ENF purchase of Fund trust units5: | | | |
| Contributions from redeemable noncontrolling interest holders | 51 |
| 40 |
| — |
|
| Dilution gain/(loss) for redeemable noncontrolling interests | (5 | ) | (4 | ) | — |
|
| Dilution gain/(loss) in Additional paid-in capital | 5 |
| 4 |
| — |
|
| |
1 | These transactions occurred in December 2017, April 2016 and November 2015. |
| |
2 | Concurrent with the public offerings, we subscribed for ENF common shares on a private placement basis to maintain our 19.9% ownership interest in ENF. |
| |
3 | ENF used the proceeds from the common share issuances to purchase additional trust units of the Fund. We did not participate in these offerings, resulting in increases in redeemable noncontrolling interests (2017 - 53.6% to 56.5%; 2016 - 40.7% to 45.6%; 2015 - 34.3% to 40.7%). |
| |
4 | The Fund used a portion of the proceeds from the trust unit issuances to purchase additional common units of ECT, and ECT used the proceeds to purchase additional Class A units of EIPLP, resulting in dilution losses for ECT. These dilution losses resulted in dilution losses for the Fund’s equity investment in ECT and the above-noted dilution gains/(losses) for redeemable noncontrolling interests and Additional paid-in capital. |
| |
5 | For the years ended December 31, 2017, 2016 and 2015, ENF used cash in respect of reinvested dividends and option cash payments from its Dividend Reinvestment Plan (DRIP) to purchase 1.6 million, 1.3 million and nil Fund trust units, respectively, on behalf of the public. |
Further to the above, in April 2017, Enbridge and ENF completed the secondary public offering of ENF common shares for gross proceeds of $575 million (the Secondary Offering). To effect the Secondary Offering, we exchanged 21,657,617 Fund units we owned for an equivalent amount of ENF common shares. In order to maintain our 19.9% interest in ENF, we retained 4,309,867 of the common shares we received in the exchange, and sold the balance through the Secondary Offering. Upon closing of the Secondary Offering, our total economic interest in ENF decreased from 86.9% to 84.6% and redeemable noncontrolling interests increased from 45.6% to 53.7%. As a result of the Secondary Offering, we recorded a dilution loss for redeemable noncontrolling interests of $87 million and a dilution gain in Additional paid-in capital of $87 million.
Canadian Restructuring Plan
In September 2015, our unitholdings in the Fund increased upon closing of the Canadian Restructuring Plan (Note 1), resulting in a decrease in redeemable noncontrolling interests.
Upon closing of the Canadian Restructuring Plan, ECT, an equity investment of the Fund, reclassified its Preferred Units from mezzanine equity to liabilities. Accordingly, ECT reduced the recorded redemption value of its Preferred Units to their aggregate par value, resulting in an increase to the Fund’s equity investment in ECT. This resulted in an adjustment to redeemable noncontrolling interests of approximately $541 million.
Upon closing of the Canadian Restructuring Plan, EIPLP, an indirect equity investment of the Fund, issued Special Interest Rights to us which are entitled to Temporary Performance Distribution Rights (TPDR) distributions. TPDR distributions occur when the Fund distribution rate exceeds a payout target and are paid in the form of Class D units. The Class D unitholders receive a distribution each month equal to the per unit amount paid on Class C units of EIPLP, but to be paid in kind in additional Class D units. The issuances of TPDR and additional Class D units resulted in a dilution gain for the Fund’s indirect equity investment in EIPLP, a dilution gain for redeemable noncontrolling interests of $41 million, $30 million and $5 million for the years ended December 31, 2017, 2016 and 2015, respectively, with offsetting dilution losses in Additional paid-in capital.
20. SHARE CAPITAL
Our authorized share capital consists of an unlimited number of common shares with no par value and an unlimited number of preference shares.
COMMON SHARES
| | | | | | | | | | | | | | | | | | | | |
| 2023 | 2022 | 2021 |
| December 31, | Number of Shares | Amount | Number of Shares | Amount | Number of Shares | Amount |
| (millions of Canadian dollars; number of shares in millions) | | | | | | |
| Balance at beginning of year | 2,025 | | 64,760 | | 2,026 | | 64,799 | | 2,026 | | 64,768 | |
| Shares issued, net of issue costs | 103 | | 4,485 | | — | | — | | — | | — | |
| Shares issued on exercise of stock options | — | | 3 | | 2 | | 53 | | — | | 31 | |
| Shares issued on vesting of RSUs, net of tax | — | | 12 | | — | | — | | — | | — | |
Share purchases at stated value1 | (3) | | (80) | | (3) | | (88) | | — | | — | |
| Other | — | | — | | — | | (4) | | — | | — | |
| Balance at end of year | 2,125 | | 69,180 | | 2,025 | | 64,760 | | 2,026 | | 64,799 | |
1 Reflects the repurchase and cancellation of common shares under our normal course issuer bid.
|
| | | | | | | | | | | | |
| | 2017 | 2016 | 2015 |
| | Number |
| | Number |
| | Number |
| |
| December 31, | of Shares |
| Amount |
| of Shares |
| Amount |
| of Shares |
| Amount |
|
| (millions of Canadian dollars; number of shares in millions) | | | | | | |
| Balance at beginning of year | 943 |
| 10,492 |
| 868 |
| 7,391 |
| 852 |
| 6,669 |
|
Common shares issued1 | 33 |
| 1,500 |
| 56 |
| 2,241 |
| — |
| — |
|
Common shares issued in Merger Transaction (Note 7) | 691 |
| 37,429 |
| — |
| — |
| — |
| — |
|
| Dividend Reinvestment and Share Purchase Plan | 25 |
| 1,226 |
| 16 |
| 795 |
| 12 |
| 646 |
|
| Shares issued on exercise of stock options | 3 |
| 90 |
| 3 |
| 65 |
| 4 |
| 76 |
|
| Balance at end of year | 1,695 |
| 50,737 |
| 943 |
| 10,492 |
| 868 |
| 7,391 |
|
1Gross proceeds of $1.5 billion, $2.3 billion and nil for the years ended December 31, 2017, 2016 and 2015, respectively; net issuance costs of nil, $59 million and nil for the years ended December 31, 2017, 2016 and 2015, respectively.
PREFERENCE SHARES
| | | | | | | | | | | | | | | | | | | | |
| 2023 | 2022 | 2021 |
| December 31, | Number of Shares | Amount | Number of Shares | Amount | Number of Shares | Amount |
| (millions of Canadian dollars; number of shares in millions) | | | | | | |
| Preference Shares, Series A | 5 | | 125 | | 5 | | 125 | | 5 | | 125 | |
| Preference Shares, Series B | 20 | | 500 | | 20 | | 500 | | 18 | | 457 | |
Preference Shares, Series C1 | — | | — | | — | | — | | 2 | | 43 | |
| Preference Shares, Series D | 18 | | 450 | | 18 | | 450 | | 18 | | 450 | |
| Preference Shares, Series F | 18 | | 454 | | 20 | | 500 | | 20 | | 500 | |
Preference Shares, Series G2 | 2 | | 46 | | — | | — | | — | | — | |
| Preference Shares, Series H | 12 | | 291 | | 14 | | 350 | | 14 | | 350 | |
Preference Shares, Series I3 | 2 | | 59 | | — | | — | | — | | — | |
Preference Shares, Series J4 | — | | — | | — | | — | | 8 | | 199 | |
| Preference Shares, Series L | 16 | | 411 | | 16 | | 411 | | 16 | | 411 | |
| Preference Shares, Series N | 18 | | 450 | | 18 | | 450 | | 18 | | 450 | |
| Preference Shares, Series P | 16 | | 400 | | 16 | | 400 | | 16 | | 400 | |
| Preference Shares, Series R | 16 | | 400 | | 16 | | 400 | | 16 | | 400 | |
| Preference Shares, Series 1 | 16 | | 411 | | 16 | | 411 | | 16 | | 411 | |
| Preference Shares, Series 3 | 24 | | 600 | | 24 | | 600 | | 24 | | 600 | |
| Preference Shares, Series 5 | 8 | | 206 | | 8 | | 206 | | 8 | | 206 | |
| Preference Shares, Series 7 | 10 | | 250 | | 10 | | 250 | | 10 | | 250 | |
| Preference Shares, Series 9 | 11 | | 275 | | 11 | | 275 | | 11 | | 275 | |
| Preference Shares, Series 11 | 20 | | 500 | | 20 | | 500 | | 20 | | 500 | |
| Preference Shares, Series 13 | 14 | | 350 | | 14 | | 350 | | 14 | | 350 | |
| Preference Shares, Series 15 | 11 | | 275 | | 11 | | 275 | | 11 | | 275 | |
Preference Shares, Series 175 | — | | — | | — | | — | | 30 | | 750 | |
| Preference Shares, Series 19 | 20 | | 500 | | 20 | | 500 | | 20 | | 500 | |
| Issuance costs | | (135) | | | (135) | | | (155) | |
| Balance at end of year | | 6,818 | | | 6,818 | | | 7,747 | |
1On June 1, 2022, all outstanding Preference Shares, Series C were converted to Preference Shares, Series B.
2On June 1, 2023, 1,827,695 of the outstanding Preference Shares, Series F were converted into Preference Shares, Series G.
3On September 1, 2023, 2,350,602 of the outstanding Preference Shares, Series H were converted into Preference Shares, Series I.
4On June 1, 2022, we redeemed our US$200 million outstanding Cumulative Redeemable Preference Shares, Series J.
5On March 1, 2022, we redeemed our $750 million outstanding Cumulative Redeemable Minimum Rate Reset Preference Shares, Series 17.
|
| | | | | | | | | | | | |
| | 2017 | 2016 | 2015 |
| | Number |
| | Number |
| | Number |
| |
| December 31, | of Shares |
| Amount |
| of Shares |
| Amount |
| of Shares |
| Amount |
|
| (millions of Canadian dollars; number of shares in millions) | | | | | | |
| Preference Shares, Series A | 5 |
| 125 |
| 5 |
| 125 |
| 5 |
| 125 |
|
| Preference Shares, Series B | 18 |
| 457 |
| 20 |
| 500 |
| 20 |
| 500 |
|
| Preference Shares, Series C | 2 |
| 43 |
| — |
| — |
| — |
| — |
|
| Preference Shares, Series D | 18 |
| 450 |
| 18 |
| 450 |
| 18 |
| 450 |
|
| Preference Shares, Series F | 20 |
| 500 |
| 20 |
| 500 |
| 20 |
| 500 |
|
| Preference Shares, Series H | 14 |
| 350 |
| 14 |
| 350 |
| 14 |
| 350 |
|
| Preference Shares, Series J | 8 |
| 199 |
| 8 |
| 199 |
| 8 |
| 199 |
|
| Preference Shares, Series L | 16 |
| 411 |
| 16 |
| 411 |
| 16 |
| 411 |
|
| Preference Shares, Series N | 18 |
| 450 |
| 18 |
| 450 |
| 18 |
| 450 |
|
| Preference Shares, Series P | 16 |
| 400 |
| 16 |
| 400 |
| 16 |
| 400 |
|
| Preference Shares, Series R | 16 |
| 400 |
| 16 |
| 400 |
| 16 |
| 400 |
|
| Preference Shares, Series 1 | 16 |
| 411 |
| 16 |
| 411 |
| 16 |
| 411 |
|
| Preference Shares, Series 3 | 24 |
| 600 |
| 24 |
| 600 |
| 24 |
| 600 |
|
| Preference Shares, Series 5 | 8 |
| 206 |
| 8 |
| 206 |
| 8 |
| 206 |
|
| Preference Shares, Series 7 | 10 |
| 250 |
| 10 |
| 250 |
| 10 |
| 250 |
|
| Preference Shares, Series 9 | 11 |
| 275 |
| 11 |
| 275 |
| 11 |
| 275 |
|
| Preference Shares, Series 11 | 20 |
| 500 |
| 20 |
| 500 |
| 20 |
| 500 |
|
| Preference Shares, Series 13 | 14 |
| 350 |
| 14 |
| 350 |
| 14 |
| 350 |
|
| Preference Shares, Series 15 | 11 |
| 275 |
| 11 |
| 275 |
| 11 |
| 275 |
|
| Preference Shares, Series 17 | 30 |
| 750 |
| 30 |
| 750 |
| — |
| — |
|
| Preference Shares, Series 19 | 20 |
| 500 |
| — |
| — |
| — |
| — |
|
| Issuance costs | | (155 | ) | | (147 | ) | | (137 | ) |
| Balance at end of year | |
| 7,747 |
| | 7,255 |
| | 6,515 |
|
Characteristics of theour outstanding preference shares are as follows:
| | | | | | | | | | | | | | | | | |
| Dividend Rate | Dividend1 | Per Share Base Redemption Value2 | Redemption and Conversion Option Date2,3 | Right to Convert Into3,4 |
| (Canadian dollars unless otherwise stated) | | | | | |
| Preference Shares, Series A | 5.50 | % | $1.37500 | $25 | — | | — | |
| Preference Shares, Series B | 5.20 | % | $1.30052 | $25 | June 1, 2027 | Series C |
Preference Shares, Series D5 | 5.41 | % | $1.35300 | $25 | March 1, 2028 | Series E |
Preference Shares, Series F6 | 5.54 | % | $1.38452 | $25 | June 1, 2028 | Series G |
Preference Shares, Series G7 | 6.96 | % | $1.90704 | $25 | June 1, 2028 | Series F |
Preference Shares, Series H8 | 6.11 | % | $1.52800 | $25 | September 1, 2028 | Series I |
Preference Shares, Series I9 | 7.19 | % | $1.81004 | $25 | September 1, 2028 | Series H |
| Preference Shares, Series L | 5.86 | % | US$1.46448 | US$25 | September 1, 2027 | Series M |
Preference Shares, Series N10 | 6.70 | % | $1.67400 | $25 | December 1, 2028 | Series O |
| Preference Shares, Series P | 4.38 | % | $1.09476 | $25 | March 1, 2024 | Series Q |
| Preference Shares, Series R | 4.07 | % | $1.01825 | $25 | June 1, 2024 | Series S |
Preference Shares, Series 111 | 6.70 | % | US$1.67592 | US$25 | June 1, 2028 | Series 2 |
| Preference Shares, Series 3 | 3.74 | % | $0.93425 | $25 | September 1, 2024 | Series 4 |
| Preference Shares, Series 5 | 5.38 | % | US$1.34383 | US$25 | March 1, 2024 | Series 6 |
| Preference Shares, Series 7 | 4.45 | % | $1.11224 | $25 | March 1, 2024 | Series 8 |
| Preference Shares, Series 9 | 4.10 | % | $1.02424 | $25 | December 1, 2024 | Series 10 |
| Preference Shares, Series 11 | 3.94 | % | $0.98452 | $25 | March 1, 2025 | Series 12 |
| Preference Shares, Series 13 | 3.04 | % | $0.76076 | $25 | June 1, 2025 | Series 14 |
| Preference Shares, Series 15 | 2.98 | % | $0.74576 | $25 | September 1, 2025 | Series 16 |
Preference Shares, Series 1912 | 6.21 | % | $1.55300 | $25 | March 1, 2028 | Series 20 |
|
| | | | | | | | | |
| | Dividend Rate |
| Dividend1 |
| Per Share Base Redemption Value2 | Redemption and Conversion Option Date2,3 |
| Right to Convert Into3,4 |
|
| (Canadian dollars unless otherwise stated) | | | | |
| Preference Shares, Series A | 5.50 | % | $1.37500 | $25 | — |
| — |
|
Preference Shares, Series B5 | 3.42 | % | $0.85360 | $25 | June 1, 2022 |
| Series C |
|
Preference Shares, Series C5 | 3-month treasury bill plus 2.400% |
| — |
| $25 | June 1, 2022 |
| Series B |
|
Preference Shares, Series D6 | 4.00 | % | $1.00000 | $25 | March 1, 2018 |
| Series E |
|
| Preference Shares, Series F | 4.00 | % | $1.00000 | $25 | June 1, 2018 |
| Series G |
|
| Preference Shares, Series H | 4.00 | % | $1.00000 | $25 | September 1, 2018 |
| Series I |
|
Preference Shares, Series J7 | 4.89 | % | US$1.22160 | US$25 | June 1, 2022 |
| Series K |
|
Preference Shares, Series L7 | 4.96 | % | US$1.23972 | US$25 | September 1, 2022 |
| Series M |
|
| Preference Shares, Series N | 4.00 | % | $1.00000 | $25 | December 1, 2018 |
| Series O |
|
| Preference Shares, Series P | 4.00 | % | $1.00000 | $25 | March 1, 2019 |
| Series Q |
|
| Preference Shares, Series R | 4.00 | % | $1.00000 | $25 | June 1, 2019 |
| Series S |
|
| Preference Shares, Series 1 | 4.00 | % | US$1.00000 | US$25 | June 1, 2018 |
| Series 2 |
|
| Preference Shares, Series 3 | 4.00 | % | $1.00000 | $25 | September 1, 2019 |
| Series 4 |
|
| Preference Shares, Series 5 | 4.40 | % | US$1.10000 | US$25 | March 1, 2019 |
| Series 6 |
|
| Preference Shares, Series 7 | 4.40 | % | $1.10000 | $25 | March 1, 2019 |
| Series 8 |
|
| Preference Shares, Series 9 | 4.40 | % | $1.10000 | $25 | December 1, 2019 |
| Series 10 |
|
| Preference Shares, Series 11 | 4.40 | % | $1.10000 | $25 | March 1, 2020 |
| Series 12 |
|
| Preference Shares, Series 13 | 4.40 | % | $1.10000 | $25 | June 1, 2020 |
| Series 14 |
|
| Preference Shares, Series 15 | 4.40 | % | $1.10000 | $25 | September 1, 2020 |
| Series 16 |
|
| Preference Shares, Series 17 | 5.15 | % | $1.28750 | $25 | March 1, 2022 |
| Series 18 |
|
Preference Shares, Series 19
| 4.90 | % | $1.22500 | $25 | March 1, 2023 |
| Series 20 |
|
| |
1 | 1The holder is entitled to receive a fixed, cumulative, quarterly preferential dividend, as declared by the Board of Directors. With the exception of Series A and Series C Preference Shares, such fixed dividend rate resets every five years beginning on the initial redemption and conversion option date. The Series 17 and Series 19 Preference Shares contain a feature where the fixed dividend rate, when reset every five years, will not be less than 5.15% and 4.90%, respectively. No other series of Preference Shares has this feature. |
| |
2 | Series A Preference Shares may be redeemed any time at our option. For all other series of Preference Shares, we, may at our option, redeem all or a portion of the outstanding Preference Shares for the Base Redemption Value per share plus all accrued and unpaid dividends on the Redemption Option Date and on every fifth anniversary thereafter.
|
| |
3 | The holder will have the right, subject to certain conditions, to convert their shares into Cumulative Redeemable Preference Shares of a specified series on a one-for-one basis on the Conversion Option Date and every fifth anniversary thereafter at an ascribed issue price equal to the Base Redemption Value.
|
| |
4 | With the exception of Series A Preference Shares, after the redemption and conversion option dates, holders may elect to receive quarterly floating rate cumulative dividends per share at a rate equal to: $25 x (number of days in quarter/365) x 90 day Government of Canada treasury bill rate + 2.4% (Series C), 2.4% (Series E), 2.5% (Series G), 2.1% (Series I), 2.7% (Series O), 2.5% (Series Q), 2.5% (Series S), 2.4% (Series 4), 2.6% (Series 8), 2.7% (Series 10), 2.6% (Series 12), 2.7% (Series 14), 2.7% (Series 16), 4.1% (Series 18) or 3.2% (Series 20); or US$25 x (number of days in quarter/365) x three-month United States Government treasury bill rate + 3.1% (Series K), 3.2% (Series M), 3.1% (Series 2) or 2.8% (Series 6).
|
| |
5 | On June 1, 2017, 1,730,188 of Series B fixed rate Preference Shares were converted to Series C floating rate Preference Shares based upon preference share holder elections under the terms of the Series B Preference Shares. The quarterly dividend amount for the Series B Preference Shares was decreased to $0.21340 from $0.25000 on June 1, 2017, due to the reset of the annual dividend rate on every fifth anniversary of the date of issuance of the Series B Preference Shares. The quarterly dividend amount for the Series C Preference Shares was set at $0.18600 on June 1, 2017, $0.19571 on September 1, 2017 and $0.20342 on December 1, 2017, due to reset on a quarterly basis following the issuance thereof. |
| |
6 | On January 30, 2018, we announced that we do not intend to exercise our right to redeem our Series D Preference Shares on March 1, 2018. As a result, until February 14, 2018, the holders of such shares had the right to convert all or part of their Series D fixed rate Preference Shares on a one-for-one basis into Series E floating rate Preference Shares. As of February 14, 2018, less than the 1,000,000 Series D Preference Shares required to give effect to conversions into Series E Preference Shares were tendered for conversion. As a result, none of our outstanding Series D Preference Shares will be converted into Series E Preference Shares on March 1, 2018. However, on March 1, 2018, the quarterly dividend amount for the Series D Preference Shares will be increased to $0.27875 from $0.25000, due to the reset of the annual dividend rate on every fifth anniversary of the date of issuance of the Series D Preference Shares. |
| |
7 | No Series J or Series L Preference Shares were converted on the June 1, 2017 and September 1, 2017 conversion option dates, respectively. However, the quarterly dividend amounts for the Series J and Series L Preference Shares were increased to US$0.30540 from US$0.25000 on June 1, 2017, and to US$0.30993 from US$0.25000 on September 1, 2017, respectively, due to the reset of the annual dividend rate on every fifth anniversary of the date of issuance of the Series J and Serles L Preference Shares. |
DIVIDEND REINVESTMENT AND SHARE PURCHASE PLAN
Under the DRIP, registered shareholders may reinvest dividends in our common shares and make additional optional cash payments to purchase common shares, free of brokerage or other charges. Participants in our DRIP receive a 2% discountfixed cumulative quarterly preferential dividend, as declared by the Board of Directors. With the exception of Preference Shares, Series A, such fixed dividend rate resets every five years beginning on the purchaseinitial Redemption and Conversion Option Date. Preference Shares, Series G and I contain a feature where the dividend rate resets on a quarterly basis. The Preference Shares, Series 19 contain a feature where the fixed dividend rate, when reset every five years, will not be less than 4.90%. No other series of commonpreference shares with reinvested dividends.has this feature.
2Preference Shares, Series A may be redeemed any time at our option. For all other series of preference shares, we may at our option, redeem all or a portion of the years ended December 31, 2017outstanding preference shares for the Per Share Base Redemption Value plus all accrued and 2016, totalunpaid dividends paid were $3.5 billionon the Redemption Option Date and $1.9 billion, respectively,on every fifth anniversary thereafter.
3The holder will have the right, subject to certain conditions, to convert their shares into Cumulative Redeemable Preference Shares of which $2.3 billiona specified series on a one-for-one basis on the Conversion Option Date and $1.2 billion, respectively, were paid in cash and reflected in financing activities. The remaining $1.2 billion and $795 million, respectively, of dividends paid were reinvested pursuantevery fifth anniversary thereafter at an ascribed issue price equal to the DRIP and resulted inPer Share Base Redemption Value.
4With the issuanceexception of common shares rather than a cash payment. In addition to amounts paid in cash and reflected in financing activities for the year ended December 31, 2017, were $414 million in dividends declared to Spectra Energy shareholders prior to the Merger Transaction that were paidPreference Shares, Series A, after the Merger Transaction.Redemption and Conversion Option Date, holders may elect to receive quarterly floating rate cumulative dividends per share at a rate equal to: $25 x (number of days in quarter/number of days in year) x three month Government of Canada treasury bill rate + 2.4% (Series C), 2.4% (Series E), 2.5% (Series G), 2.1% (Series I), 2.7% (Series O), 2.5% (Series Q), 2.5% (Series S), 2.4% (Series 4), 2.6% (Series 8), 2.7% (Series 10), 2.6% (Series 12), 2.7% (Series 14), 2.7% (Series 16), or 3.2% (Series 20); or US$25 x (number of days in quarter/number of days in year) x three month US Government treasury bill rate + 3.2% (Series M), 3.1% (Series 2), or 2.8% (Series 6).
5The quarterly dividend per share paid on Preference Shares, Series D was increased to $0.33825 from $0.27875 on March 1, 2023 due to reset of the annual dividend on March 1, 2023.
6The quarterly dividend per share paid on Preference Shares, Series F was increased to $0.34613 from $0.29306 on June 1, 2023 due to reset of the annual dividend on June 1, 2023.
7On June 1, 2023, 1,827,695 of the outstanding Preference Shares, Series F were converted into Preference Shares, Series G. The quarterly dividend per share paid on Preference Shares, Series G was increased to $0.47676 from $0.47245 on December 1, 2023 due to reset on a quarterly basis.
8The quarterly dividend per share paid on Preference Shares, Series H was increased to $0.38200 from $0.27350 on September 1, 2023 due to reset of the annual dividend on September 1, 2023.
9On September 1, 2023, 2,350,602 of the outstanding Preference Shares, Series H were converted into Preference Shares, Series I. The quarterly dividend per share paid on Preference Shares, Series I was increased to $0.45251 from $0.44814 on December 1, 2023 due to reset on a quarterly basis following the date of issuance.
10 The quarterly dividend per share paid on Preference Shares, Series N was increased to $0.41850 from $0.31788 on December 1, 2023 due to reset of the annual dividend on December 1, 2023.
11 The quarterly dividend per share paid on Preference Shares, Series 1 was increased to US$0.41898 from US$0.37182 on June 1, 2023 due to reset of the annual dividend on June 1, 2023.
12 The quarterly dividend per share paid on Preference Shares, Series 19 was increased to $0.38825 from $0.30625 on March 1, 2023 due to reset of the annual dividend on March 1, 2023.
SHAREHOLDER RIGHTS PLAN
The Shareholder Rights Plan is designed to encourage the fair treatment of our shareholders in connection with any takeover offer for us.offer. Rights issued under the plan become exercisable when a person and any related parties acquires or announces its intention to acquire 20% or more of our outstanding common shares without complying with certain provisions set out in the plan or without approval of our Board of Directors. Should such an acquisition occur, each rights holder, other than the acquiring person and related parties, will have the right to purchase our common shares at a 50% discount to the market price at that time.
21. STOCK OPTION AND STOCK UNIT PLANS
We maintain four long-term incentive compensation plans: the ISO Plan, the Performance Stock Options (PSO) Plan, the Performance Stock Units (PSU) Plan and the RSU Plan. A maximum of 60 million common shares were reserved for issuancethree primary vehicles under the 2002 ISO Plan, of which 50 million have been issued to date. A further 71 million common shares have been reserved for issuance under the 2007 ISO and PSO Plans, of which 16 million have been issued to date. The PSU and RSU Plans grant notional units as if a unit was one Enbridge common share and are payable in cash.
Prior to the Merger Transaction, Spectra Energy had aour long-term incentive plan providing for the granting of stock options, restricted(the Plan): ISOs, PSUs and unrestricted stock awards and units, and other equity-based awards. Upon closing of the Merger Transaction, Enbridge replaced existing Spectra Energy share-based payment awards with awards that will be settled in shares of Enbridge, with Spectra Energy's cash-settled phantom awards included in the fair value of the net assets acquired (Note 7).
RSUs. Total stock-based compensation expense recorded for the years ended December 31, 2017, 20162023, 2022 and 20152021 was $165$154 million, $130$260 million and $97$157 million, respectively. DisclosureThe number of activitycommon shares authorized for share-settled awards under the Plan was 181 million as at December 31, 2023, 2022 and assumptions for material stock-based compensation plans are included below.2021.
INCENTIVE STOCK OPTIONS
KeyCertain key employees are granted ISOs to purchase common shares at the grant date market price on the grant date.price. ISOs vest in equal annual installments over a four-yearfour-year period and expire 10 years after the issue date.
| | | | | | | | | | | | | | |
| December 31, 2023 | Number | Weighted Average Exercise Price | Weighted Average Remaining Contractual Life (years) | Aggregate Intrinsic Value |
| (number of options in thousands; weighted average exercise price in Canadian dollars; intrinsic value in millions of Canadian dollars) | | | | |
| Options outstanding at beginning of year | 27,624 | | 48.46 | | | |
| Options granted | 3,053 | | 53.11 | | | |
Options exercised1 | (648) | | 45.70 | | | |
| Options cancelled or expired | (1,300) | | 53.84 | | | |
| Options outstanding at end of year | 28,729 | | 50.79 | | 5.3 | 45 | |
Options vested at end of year2 | 20,235 | | 50.64 | | 4.1 | 36 | |
1The total intrinsic value of ISOs exercised during the years ended December 31, 2023, 2022 and 2021 was $2 million, $66 million and $24 million, respectively, and cash received on exercise was nil, $3 million and $2 million, respectively.
2The total fair value of ISOs vested during the years ended December 31, 2023, 2022 and 2021 was $20 million, $21 million and $25 million, respectively.
|
| | | | | | | |
| December 31, 2017 | Number |
| Weighted Average Exercise Price |
| Weighted Average Remaining Contractual Life (years) | Aggregate Intrinsic Value |
|
| (options in thousands; intrinsic value in millions of Canadian dollars) | |
| |
| | |
|
| Options outstanding at beginning of year | 32,909 |
| 42.51 |
| | |
|
| Options granted | 5,995 |
| 55.72 |
| | |
|
Options exercised1 | (3,350 | ) | 32.65 |
| | |
|
| Options cancelled or expired | (1,188 | ) | 53.23 |
| | |
|
| Options outstanding at end of year | 34,366 |
| 45.41 |
| 6.1 | 271 |
|
Options vested at end of year2 | 20,403 |
| 40.89 |
| 4.7 | 228 |
|
| |
1 | The total intrinsic value of ISOs exercised during the years ended December 31, 2017, 2016 and 2015 was $62 million, $123 million and $126 million, respectively, and cash received on exercise was $17 million, $37 million and $43 million, respectively. |
| |
2 | The total fair value of ISOs vested during the years ended December 31, 2017, 2016 and 2015 was $44 million, $36 million and $34 million, respectively. |
Weighted average assumptions used to determine the fair value of ISOs granted using the Black-Scholes-Merton option pricing model are as follows:
|
| | | | | | |
| Year ended December 31, | 2017 |
| 2016 |
| 2015 |
|
Fair value per option (Canadian dollars)1 | 6.00 |
| 7.37 |
| 6.48 |
|
| Valuation assumptions | | | |
Expected option term (years)2 | 5 |
| 5 |
| 5 |
|
Expected volatility3 | 20.4 | % | 25.1 | % | 19.9 | % |
Expected dividend yield4 | 4.2 | % | 4.4 | % | 3.2 | % |
Risk-free interest rate5 | 1.2 | % | 0.8 | % | 0.9 | % |
| |
1 | Options granted to United States employees are based on NYSE prices. The option value and assumptions shown are based on a weighted average of the United States and the Canadian options. The fair values per option for the years ended December 31, 2017, 2016 and 2015 were $5.66, $7.01 and $6.22, respectively, for Canadian employees and US$5.72, US$6.60 and US$6.16, respectively, for United States employees. |
| |
2 | The expected option term is six years based on historical exercise practice and three years for retirement eligible employees. |
| |
3 | Expected volatility is determined with reference to historic daily share price volatility and consideration of the implied volatility observable in call option values near the grant date. |
| |
4 | The expected dividend yield is the current annual dividend at the grant date divided by the current stock price. |
| |
5 | The risk-free interest rate is based on the Government of Canada’s Canadian Bond Yields and the United States Treasury Bond Yields. |
| | | | | | | | | | | |
| Year ended December 31, | 2023 | 2022 | 2021 |
Fair value per option (Canadian dollars)1 | 6.05 | 5.07 | 4.10 |
| Valuation assumptions | | | |
Expected option term (years)2 | 6 | 6 | 6 |
Expected volatility3 | 22.2 | % | 21.9 | % | 25.5 | % |
Expected dividend yield4 | 6.7 | % | 6.5 | % | 7.6 | % |
Risk-free interest rate5 | 3.5 | % | 1.8 | % | 0.7 | % |
1Options granted to US employees are based on the New York Stock Exchange prices. The option value and assumptions shown are based on a weighted average of the US and the Canadian options. The fair value per option for the years ended December 31, 2023, 2022 and 2021 were $5.38, $4.78 and $3.91, respectively, for Canadian employees and US$5.23, US$4.62 and US$3.65, respectively, for US employees.
2The expected option term is six years based on historical exercise practice and five years for retirement eligible employees.
3Expected volatility is determined with reference to historic daily share price volatility and consideration of the implied volatility observable in call option values near the grant date.
4The expected dividend yield is the current annual dividend at the grant date divided by the current stock price.
5The risk-free interest rate is based on the Government of Canada's Canadian bond yields and the US Treasury bond yields.
Compensation expense recorded for the years ended December 31, 2017, 20162023, 2022 and 20152021 for ISOs was $40$18 million, $43$15 million and $35$16 million, respectively. As at December 31, 2017,2023, unrecognized compensation expense related to non-vested stock-based compensation arrangements granted under the ISO PlanISOs was $47$11 million. The expense is expected to be fully recognized over a weighted average period of approximately two years.
PERFORMANCE STOCK UNITS
PSUs are granted to certain key employees where cash awards are paid following a three-year performance cycle. Awards are calculated by multiplying the number of units outstanding at the end of the performance period by Enbridge's weighted average share price for 20 days prior to the maturity of the grant and by a performance multiplier. The performance multiplier ranges from zero, if our performance fails to meet threshold performance levels, to a maximum of 2.0 if we perform within the highest range of the performance targets. The performance multiplier is derived through a calculation of our Total Shareholder Return percentile rank relative to a specified peer group of companies and our distributable cash flow per share, adjusted for unusual, infrequent or other non-operating factors, relative to targets established at the time of grant. Beginning in 2023, the performance multiplier also includes a greenhouse gas reduction component. To calculate the 2023 expense, a multiplier of 1.0 was used for 2023 PSU grants, 1.25 for 2022 PSU grants and 1.25 for the 2021 PSU grants.
| | | | | | | | | | | |
| December 31, 2023 | Number | Weighted Average Remaining Contractual Life (years) | Aggregate Intrinsic Value |
| (number of units in thousands; intrinsic value in millions of Canadian dollars) | | | |
| Units outstanding at beginning of year | 3,249 | | | |
| Units granted | 2,128 | | | |
| Units cancelled | (214) | | | |
Units matured1 | (2,218) | | | |
| Dividend reinvestment | 235 | | | |
| Units outstanding at end of year | 3,180 | | 1.1 | 175 | |
1The total amount paid during the years ended December 31, 2023, 2022 and 2021 for PSUs was $123 million, $90 million and $70 million, respectively.
Compensation expense recorded for the years ended December 31, 2023, 2022 and 2021 for PSUs was $59 million, $169 million and $56 million, respectively. As at December 31, 2023, unrecognized compensation expense related to non-vested PSUs was $54 million. The expense is expected to be fully recognized over a weighted average period of approximately two years.
RESTRICTED STOCK UNITS
We have a RSU Plan where cash awardsEmployees may also be granted cash-settled or share-settled RSUs under the Plan. Cash-settled RSUs are paid to certain key employees, vesting in equal installments on each of ourthe first, second and third anniversaries of the grant date. Share-settled awards are given to non-executive senior management employees and vest following a 35-monththree-year maturity period. Beginning in 2023, share-settled units were granted to non-senior management employees. These units vest on each of the first, second and third anniversaries of the grant date. RSU holders receive cash or shares equal to ourEnbridge's weighted average share price for 20 days prior to the maturity of the grant multiplied by the number of units outstanding on the maturity date.
| | | | | | | | | | | | | | |
| December 31, 2023 | Number | Weighted Average Grant Date Fair Value2 | Weighted Average Remaining Contractual Life (years) | Aggregate Intrinsic Value |
| (number of units in thousands; intrinsic value in millions of Canadian dollars) | | | | |
| Units outstanding at beginning of year | 3,565 | | 49.64 | | | |
| Units granted | 1,373 | | 52.05 | | | |
| Units cancelled | (246) | | 52.06 | | | |
Units matured1 | (1,401) | | 51.05 | | | |
| Dividend reinvestment | 280 | | 50.88 | | | |
| Units outstanding at end of year | 3,571 | | 50.69 | | 0.9 | 177 | |
|
| | | | | |
| December 31, 2017 | Number |
| Weighted Average Remaining Contractual Life (years) | Aggregate Intrinsic Value |
|
| (units in thousands; intrinsic value in millions of Canadian dollars) | | | |
| Units outstanding at beginning of year | 1,854 |
| | |
|
| Units granted | 741 |
| | |
|
| Units cancelled | (186 | ) | | |
|
Units matured1 | (839 | ) | | |
|
| Dividend reinvestment | 123 |
| | |
|
| Units outstanding at end of year | 1,693 |
| 1.4 | 83 |
|
| |
1 | The total amount paid during the years ended December 31, 2017, 2016 and 2015 for RSUs was $39 million, $56 million and $45 million, respectively. |
1The total amount paid during the years ended December 31, 2023, 2022 and 2021 for RSUs was $56 million, $32 million and $72 million, respectively.
2Weighted average grant date fair value excludes cash-settled units.
Compensation expense recorded for the years ended December 31, 2017, 20162023, 2022 and 20152021 for RSUs was $46$77 million,, $51 $76 million and $47$85 million, respectively. As at December 31, 2017,2023, unrecognized compensation expense related to non-vested units granted under the RSU PlanRSUs was $48$60 million. The expense is expected to be fully recognized over a weighted average period of approximately one year.two years.
22. COMPONENTS OF ACCUMULATED OTHER COMPREHENSIVE INCOME/(LOSS)
Changes in AOCI attributable to our common shareholders for the years ended December 31, 2017, 20162023, 2022 and 20152021 are as follows:
| | | | | | | | | | | | | | | | | | | | | | | |
| Cash Flow Hedges | Excluded
Components
of Fair Value
Hedges | Net Investment Hedges | Cumulative Translation Adjustment | Equity Investees | Pension and OPEB Adjustment | Total |
| (millions of Canadian dollars) | | | | | | | |
| Balance as at January 1, 2023 | 121 | | (35) | | (1,137) | | 4,348 | | 5 | | 218 | | 3,520 | |
| Other comprehensive income/(loss) retained in AOCI | 232 | | 62 | | 409 | | (1,695) | | 6 | | (158) | | (1,144) | |
| Other comprehensive (income)/loss reclassified to earnings | | | | | | | |
Interest rate contracts1 | 28 | | — | | — | | — | | — | | — | | 28 | |
| | | | | | | |
Foreign exchange contracts2 | — | | (47) | | — | | — | | — | | — | | (47) | |
| | | | | | | |
| | | | | | | |
Amortization of pension and OPEB actuarial gain3 | — | | — | | — | | — | | — | | (24) | | (24) | |
| | | | | | | |
| | 260 | | 15 | | 409 | | (1,695) | | 6 | | (182) | | (1,187) | |
| Tax impact | | | | | | | |
| Income tax on amounts retained in AOCI | (47) | | (14) | | — | | — | | — | | 28 | | (33) | |
| Income tax on amounts reclassified to earnings | (14) | | 11 | | — | | — | | — | | 6 | | 3 | |
| | (61) | | (3) | | — | | — | | — | | 34 | | (30) | |
| Balance as at December 31, 2023 | 320 | | (23) | | (728) | | 2,653 | | 11 | | 70 | | 2,303 | |
| | | | | | | | | | | | | | | | | | | | | | | |
| Cash Flow Hedges | Excluded
Components
of Fair Value
Hedges | Net Investment Hedges | Cumulative Translation Adjustment | Equity Investees | Pension and OPEB Adjustment | Total |
| (millions of Canadian dollars) | | | | | | | |
| Balance as at January 1, 2022 | (897) | | — | | (166) | | 56 | | (5) | | (84) | | (1,096) | |
| Other comprehensive income/(loss) retained in AOCI | 1,125 | | (35) | | (971) | | 4,292 | | (6) | | 411 | | 4,816 | |
| Other comprehensive (income)/loss reclassified to earnings | | | | | | | |
Interest rate contracts1 | 186 | | — | | — | | — | | — | | — | | 186 | |
| | | | | | | |
Foreign exchange contracts2 | (4) | | — | | — | | — | | — | | — | | (4) | |
Other contracts4 | 4 | | — | | — | | — | | — | | — | | 4 | |
| | | | | | | |
Amortization of pension and OPEB actuarial gain3 | — | | — | | — | | — | | — | | (14) | | (14) | |
| Other | — | | — | | — | | — | | 16 | | — | | 16 | |
| 1,311 | | (35) | | (971) | | 4,292 | | 10 | | 397 | | 5,004 | |
| Tax impact | | | | | | | |
| Income tax on amounts retained in AOCI | (250) | | — | | — | | — | | — | | (99) | | (349) | |
| Income tax on amounts reclassified to earnings | (43) | | — | | — | | — | | — | | 4 | | (39) | |
| (293) | | — | | — | | — | | — | | (95) | | (388) | |
| Balance as at December 31, 2022 | 121 | | (35) | | (1,137) | | 4,348 | | 5 | | 218 | | 3,520 | |
| | | | Cash Flow Hedges |
| Net Investment Hedges |
| Cumulative Translation Adjustment |
| Equity Investees |
| Pension and OPEB Adjustment |
| Total |
|
| Cash Flow Hedges | | | Cash Flow Hedges | Excluded
Components
of Fair Value
Hedges | Net Investment Hedges | Cumulative Translation Adjustment | Equity Investees | Pension and OPEB Adjustment | Total |
| (millions of Canadian dollars) | |
| |
| |
| |
| |
| |
|
| Balance at January 1, 2017 | (746 | ) | (629 | ) | 2,700 |
| 37 |
| (304 | ) | 1,058 |
|
| Balance as at January 1, 2021 | |
| Balance as at January 1, 2021 | |
| Balance as at January 1, 2021 | |
| Other comprehensive income/(loss) retained in AOCI | 1 |
| 478 |
| (2,623 | ) | (11 | ) | 18 |
| (2,137 | ) |
| Other comprehensive (income)/loss reclassified to earnings | |
| |
| |
| |
| |
| |
|
Interest rate contracts1 | 207 |
| — |
| — |
| — |
| — |
| 207 |
|
Commodity contracts2 | (7 | ) | — |
| — |
| — |
| — |
| (7 | ) |
Foreign exchange contracts3 | (6 | ) | — |
| — |
| — |
| — |
| (6 | ) |
Interest rate contracts1 | |
Interest rate contracts1 | |
Commodity contracts5 | |
Foreign exchange contracts2 | |
Other contracts4 | (6 | ) | — |
| — |
| — |
| — |
| (6 | ) |
Amortization of pension and OPEB actuarial loss and prior service costs5 | — |
| — |
| — |
| — |
| 41 |
| 41 |
|
| | 189 |
| 478 |
| (2,623 | ) | (11 | ) | 59 |
| (1,908 | ) |
| Equity investment disposal | |
Amortization of pension and OPEB actuarial loss and prior service costs3 | |
| Other | |
| 559 | |
| Tax impact | |
| |
| |
| |
| |
| |
|
| Income tax on amounts retained in AOCI | (16 | ) | 12 |
| — |
| (16 | ) | (10 | ) | (30 | ) |
| Income tax on amounts retained in AOCI | |
| Income tax on amounts retained in AOCI | |
| Income tax on amounts reclassified to earnings | (71 | ) | — |
| — |
| — |
| (22 | ) | (93 | ) |
| | (87 | ) | 12 |
| — |
| (16 | ) | (32 | ) | (123 | ) |
| Balance at December 31, 2017 | (644 | ) | (139 | ) | 77 |
| 10 |
| (277 | ) | (973 | ) |
| (130) | |
| Balance as at December 31, 2021 | |
1Reported within Interest expense in the Consolidated Statements of Earnings.
2Reported within Transportation and other services revenues and Other income/(expense) in the Consolidated Statements of Earnings.
3These components are included in the computation of net periodic benefit (credit)/cost and are reported within Other income/(expense) in the Consolidated Statements of Earnings.
4Reported within Operating and administrative expense in the Consolidated Statements of Earnings.
5Reported within Transportation and other services revenues, Commodity sales, Commodity costs and Operating and administrative expense in the Consolidated Statements of Earnings.
|
| | | | | | | | | | | | |
| | Cash Flow Hedges |
| Net Investment Hedges |
| Cumulative Translation Adjustment |
| Equity Investees |
| Pension and OPEB Adjustment |
| Total |
|
| (millions of Canadian dollars) | | | | | | |
| Balance at January 1, 2016 | (688 | ) | (795 | ) | 3,365 |
| 37 |
| (287 | ) | 1,632 |
|
| Other comprehensive income/(loss) retained in AOCI | (216 | ) | 171 |
| (665 | ) | (5 | ) | (45 | ) | (760 | ) |
| Other comprehensive (income)/loss reclassified to earnings | | | | | | |
Interest rate contracts1 | 147 |
| — |
| — |
| — |
| — |
| 147 |
|
Commodity contracts2 | (11 | ) | — |
| — |
| — |
| — |
| (11 | ) |
Foreign exchange contracts3 | 1 |
| — |
| — |
| — |
| — |
| 1 |
|
Other contracts4 | (18 | ) | — |
| — |
| — |
| — |
| (18 | ) |
Amortization of pension and OPEB actuarial loss and prior service costs5 | — |
| — |
| — |
| — |
| 21 |
| 21 |
|
| | (97 | ) | 171 |
| (665 | ) | (5 | ) | (24 | ) | (620 | ) |
| Tax impact | | | | | | |
| Income tax on amounts retained in AOCI | 91 |
| (5 | ) | — |
| 5 |
| 11 |
| 102 |
|
| Income tax on amounts reclassified to earnings | (52 | ) | — |
| — |
| — |
| (4 | ) | (56 | ) |
| | 39 |
| (5 | ) | — |
| 5 |
| 7 |
| 46 |
|
| Balance at December 31, 2016 | (746 | ) | (629 | ) | 2,700 |
| 37 |
| (304 | ) | 1,058 |
|
|
| | | | | | | | | | | | |
| | Cash Flow Hedges |
| Net Investment Hedges |
| Cumulative Translation Adjustment |
| Equity Investees |
| Pension and OPEB Adjustment |
| Total |
|
| (millions of Canadian dollars) | | | | | | |
| Balance at January 1, 2015 | (488 | ) | 108 |
| 309 |
| (5 | ) | (359 | ) | (435 | ) |
| Other comprehensive income/(loss) retained in AOCI | 73 |
| (952 | ) | 3,056 |
| 47 |
| 65 |
| 2,289 |
|
| Other comprehensive (income)/loss reclassified to earnings | | | | | | |
Interest rate contracts1 | (34 | ) | — |
| — |
| — |
| — |
| (34 | ) |
Commodity contracts2 | (11 | ) | — |
| — |
| — |
| — |
| (11 | ) |
Foreign exchange contracts3 | 7 |
| — |
| — |
| — |
| — |
| 7 |
|
Other contracts4 | 26 |
| — |
| — |
| — |
| — |
| 26 |
|
Amortization of pension and OPEB actuarial loss and prior service costs5 | — |
| — |
| — |
| — |
| 32 |
| 32 |
|
| Other comprehensive income reclassified to earnings of derecognized cash flow hedges | (338 | ) | — |
| — |
| — |
| — |
| (338 | ) |
| | (277 | ) | (952 | ) | 3,056 |
| 47 |
| 97 |
| 1,971 |
|
| Tax impact | | | | | | |
| Income tax on amounts retained in AOCI | (29 | ) | 49 |
| — |
| (5 | ) | (14 | ) | 1 |
|
| Income tax on amounts reclassified to earnings | 15 |
| — |
| — |
| — |
| (11 | ) | 4 |
|
| Income tax on amounts reclassified to earnings of derecognized cash flow hedges | 91 |
| — |
| — |
| — |
| — |
| 91 |
|
| | 77 |
| 49 |
| — |
| (5 | ) | (25 | ) | 96 |
|
| Balance at December 31, 2015 | (688 | ) | (795 | ) | 3,365 |
| 37 |
| (287 | ) | 1,632 |
|
| |
1 | Reported within Interest expense in the Consolidated Statements of Earnings. |
| |
2 | Reported within Commodity costs in the Consolidated Statements of Earnings. |
| |
3 | Reported within Other income/(expense) in the Consolidated Statements of Earnings. |
| |
4 | Reported within Operating and administrative expense in the Consolidated Statements of Earnings. |
| |
5 | These components are included in the computation of net benefit costs and are reported within Operating and administrative expense in the Consolidated Statements of Earnings. |
23. RISK MANAGEMENT AND FINANCIAL INSTRUMENTS
MARKET RISK
Our earnings, cash flows and OCI are subject to movements in foreign exchange rates, interest rates, commodity prices and our share price (collectively, market risk)risks). Formal risk management policies, processes and systems have been designed to mitigate these risks.
The following summarizes the types of market risks to which we are exposed and the risk management instruments used to mitigate them. We use a combination of qualifying and non-qualifying derivative instruments to manage the risks noted below.
Foreign Exchange Risk
We generate certain revenues, incur expenses and hold a number of investments and subsidiaries that are denominated in currencies other than Canadian dollars. As a result, our earnings, cash flows and OCI are exposed to fluctuations resulting from foreign exchange rate variability.
We employ financial derivative instruments to hedge foreign currency denominated earnings exposure. A combination of qualifying and non-qualifying derivative instruments areis used to hedge anticipated foreign currency denominated revenues and expenses and to manage variability in cash flows. We hedge certain net investments in United States dollar denominatedUS dollar-denominated investments and subsidiaries using foreign currency derivatives and United States dollar denominatedUS dollar-denominated debt.
The foreign exchange risks inherent within the CTS framework are not present in MTS. Accordingly, our foreign exchange hedging program related to the Canadian Mainline is no longer required, and the related derivatives were terminated in the first quarter of 2023 for a realized loss of $638 million.
Interest Rate Risk
Our earnings, and cash flows and OCI are exposed to short-term interest rate variability due to the regular repricing of our variable rate debt, primarily commercial paper. We monitor our debt portfolio mix of fixed and variable rate debt instruments to manage a consolidated portfolio of floating rate debt within the Board of Directors' approved policy limit of a maximum of 30% of floating rate debt as a percentage of total debt outstanding. We primarily use qualifying derivative instruments to manage interest rate risk. Pay fixed-receive floating interest rate swaps aremay be used to hedge against the effect of future interest rate movements. We have implemented a hedging program to significantlypartially mitigate the impact of short-term interest rate volatility on interest expense via the execution of floating to fixedfloating-to-fixed interest rate swaps withand costless collars. These swaps have an average swapfixed rate of 2.6%4.1%.
As a resultOn March 8, 2023, we issued US$700 million of the Merger Transaction, we are exposed to changes in the fair value ofthree-year fixed rate debt that arise asnotes, which include the right for us to call at par after the first year. A corresponding fixed-to-floating cancellable swap was also executed which gives the swap counterparty a result ofsimilar right to cancel the changes in market interest rates. Pay floating-receive fixed interest rate swaps are used to hedge against future changes toswap after the fair value offirst year. This swap has a fixed rate debt. We have assumed a program within our subsidiaries to mitigate the impact of fluctuations in the fair value of fixed rate debt via execution of fixed to floating interest rate swaps with an average swap rate of 2.2%6.0%.
Our earnings and cash flows are also exposed to variability in longer term interest rates ahead of anticipated fixed rate term debt issuances. Forward starting interest rate swaps are used to hedge against the effect of future interest rate movements. We have assumedestablished a program withinincluding some of our subsidiaries to partially mitigate our exposure to long-term interest rate variability on select forecastforecasted term debt issuances via execution of floating to fixedfloating-to-fixed interest rate swaps with an average swap rate of 3.1%3.5%.
We also monitor our debt portfolio mix of fixed and variable rate debt instruments to maintain a consolidated portfolio of debt within the Board of Directors approved policy limit of a maximum of 25% floating rate debt as a percentage of total debt outstanding. Effective January 1, 2018, the Board of Directors approved a policy limit increase of a maximum of 30% floating rate debt as a percentage of total debt outstanding. We primarily use qualifying derivative instruments to manage interest rate risk.
Commodity Price Risk
Our earnings, and cash flows and OCI are exposed to changes in commodity prices as a result of our ownership interests in certain assets and investments, as well as through the activities of our energy services subsidiaries. These commodities include natural gas, crude oil, power and NGL. We employ financial and physical derivative instruments to fix a portion of the variable price exposures that arise from physical transactions involving these commodities. We use primarily non-qualifying derivative instruments to manage commodity price risk.
Emission Allowance Price Risk
Emission allowance price risk is the risk of gain or loss due to changes in the market price of emission allowances that our gas distribution business is required to purchase for itself and most of its customers to meet GHG compliance obligations under the Ontario Cap and Trade framework. Similar to the gas supply procurement framework, the OEB's framework for emission allowance procurement allows recovery of fluctuations in emission allowance prices in customer rates, subject to OEB approval.
Equity Price Risk
Equity price risk is the risk of earnings fluctuations due to changes in our share price. We have exposure to our own common share price through the issuance of various forms of stock-based compensation, which affect earnings through the revaluation of the outstanding units every period. We use equity derivatives to manage the earnings volatility derived from one form of stock-based compensation, restricted share units.RSUs. We use a combination of qualifying and non-qualifying derivative instruments to manage equity price risk.
TOTAL DERIVATIVE INSTRUMENTS
The following table summarizes the Consolidated Statements of Financial Position location and carrying value of our derivative instruments.
We generally have a policy of entering into individual International Swaps and Derivatives Association, Inc. (ISDA) agreements, or other similar derivative agreements, with the majority of our financial derivative counterparties. These agreements provide for the net settlement of derivative instruments outstanding with specific counterparties in the event of bankruptcy or other significant credit events and reducesreduce our credit risk exposure on financial derivative asset positions outstanding with the counterparties in those circumstances.
The following table summarizes the Consolidated Statements of Financial Position location and carrying value of our derivative instruments, as well as the maximum potential settlement amounts, in the event of thesethe specific circumstances.circumstances described above. All amounts are presented gross in the Consolidated Statements of Financial Position.
| | | | | | | | | | | | | | | | | | | | | |
| December 31, 2023 | Derivative Instruments Used as Cash Flow Hedges | | Derivative
Instruments
Used as
Fair Value Hedges | Non- Qualifying Derivative Instruments | Total Gross Derivative Instruments as Presented | Amounts Available for Offset | Total Net Derivative Instruments |
| (millions of Canadian dollars) | | | | | | | |
| Other current assets | | | | | | | |
| Foreign exchange contracts | — | | | 41 | | 98 | | 139 | | (32) | | 107 | |
| Interest rate contracts | 31 | | | — | | 34 | | 65 | | (32) | | 33 | |
| Commodity contracts | — | | | — | | 418 | | 418 | | (270) | | 148 | |
| Other contracts | — | | | — | | 1 | | 1 | | (1) | | — | |
| | 31 | | | 41 | | 551 | | 623 | | (335) | | 288 | |
| Deferred amounts and other assets | | | | | | | |
| Foreign exchange contracts | — | | | 16 | | 319 | | 335 | | (122) | | 213 | |
| Interest rate contracts | 51 | | | — | | 2 | | 53 | | (21) | | 32 | |
| Commodity contracts | — | | | — | | 75 | | 75 | | (41) | | 34 | |
| | | | | | | |
| | 51 | | | 16 | | 396 | | 463 | | (184) | | 279 | |
| Other current liabilities | | | | | | | |
| Foreign exchange contracts | — | | | (44) | | (84) | | (128) | | 32 | | (96) | |
| Interest rate contracts | (183) | | | — | | (3) | | (186) | | 32 | | (154) | |
| Commodity contracts | (11) | | | — | | (412) | | (423) | | 270 | | (153) | |
| Other contracts | — | | | — | | (1) | | (1) | | 1 | | — | |
| (194) | | | (44) | | (500) | | (738) | | 335 | | (403) | |
| Other long-term liabilities | | | | | | | |
| Foreign exchange contracts | — | | | (17) | | (481) | | (498) | | 122 | | (376) | |
| Interest rate contracts | (3) | | | — | | (85) | | (88) | | 21 | | (67) | |
| Commodity contracts | (7) | | | — | | (159) | | (166) | | 41 | | (125) | |
| | | | | | | |
| (10) | | | (17) | | (725) | | (752) | | 184 | | (568) | |
| Total net derivative liability | | | | | | | |
| Foreign exchange contracts | — | | | (4) | | (148) | | (152) | | — | | (152) | |
| Interest rate contracts | (104) | | | — | | (52) | | (156) | | — | | (156) | |
| Commodity contracts | (18) | | | — | | (78) | | (96) | | — | | (96) | |
| Other contracts | — | | | — | | — | | — | | — | | — | |
| | (122) | | | (4) | | (278) | | (404) | | — | | (404) | |
|
| | | | | | | | | | | | | | |
| December 31, 2017 | Derivative Instruments Used as Cash Flow Hedges |
| Derivative Instruments Used as Net Investment Hedges |
| Derivative
Instruments
Used as
Fair Value Hedges |
| Non- Qualifying Derivative Instruments |
| Total Gross Derivative Instruments as Presented |
| Amounts Available for Offset |
| Total Net Derivative Instruments |
|
| (millions of Canadian dollars) | |
| |
| | |
| |
| |
| |
|
| Accounts receivable and other | |
| |
| | |
| |
| |
| |
|
| Foreign exchange contracts | 1 |
| 4 |
| — |
| 138 |
| 143 |
| (83 | ) | 60 |
|
| Interest rate contracts | 6 |
| — |
| 2 |
| — |
| 8 |
| (3 | ) | 5 |
|
| Commodity contracts | 2 |
| — |
| — |
| 143 |
| 145 |
| (64 | ) | 81 |
|
| | 9 |
| 4 |
| 2 |
| 281 |
| 296 |
| (150 | ) | 146 |
|
| Deferred amounts and other assets | |
| |
| | |
| | |
| |
| Foreign exchange contracts | 1 |
| 1 |
| — |
| 143 |
| 145 |
| (125 | ) | 20 |
|
| Interest rate contracts | 7 |
| — |
| 6 |
| — |
| 13 |
| (2 | ) | 11 |
|
| Commodity contracts | 17 |
| — |
| — |
| 6 |
| 23 |
| (19 | ) | 4 |
|
| | 25 |
| 1 |
| 6 |
| 149 |
| 181 |
| (146 | ) | 35 |
|
| Accounts payable and other | |
| |
| | |
| | |
| |
| Foreign exchange contracts | (5 | ) | (42 | ) | — |
| (312 | ) | (359 | ) | 83 |
| (276 | ) |
| Interest rate contracts | (140 | ) | — |
| (6 | ) | (183 | ) | (329 | ) | 3 |
| (326 | ) |
| Commodity contracts | — |
| — |
| — |
| (439 | ) | (439 | ) | 64 |
| (375 | ) |
| Other contracts | (1 | ) | — |
| — |
| (2 | ) | (3 | ) | — |
| (3 | ) |
| | (146 | ) | (42 | ) | (6 | ) | (936 | ) | (1,130 | ) | 150 |
| (980 | ) |
| Other long-term liabilities | |
| |
| | |
| | |
| |
| Foreign exchange contracts | (4 | ) | (9 | ) | — |
| (1,299 | ) | (1,312 | ) | 125 |
| (1,187 | ) |
| Interest rate contracts | (38 | ) | — |
| (2 | ) | — |
| (40 | ) | 2 |
| (38 | ) |
| Commodity contracts | — |
| — |
| — |
| (186 | ) | (186 | ) | 19 |
| (167 | ) |
| Other contracts | (1 | ) | — |
| — |
| — |
| (1 | ) | — |
| (1 | ) |
| | (43 | ) | (9 | ) | (2 | ) | (1,485 | ) | (1,539 | ) | 146 |
| (1,393 | ) |
| Total net derivative asset/(liability) | |
| |
| | |
| | |
| |
| Foreign exchange contracts | (7 | ) | (46 | ) | — |
| (1,330 | ) | (1,383 | ) | — |
| (1,383 | ) |
| Interest rate contracts | (165 | ) | — |
| — |
| (183 | ) | (348 | ) | — |
| (348 | ) |
| Commodity contracts | 19 |
| — |
| — |
| (476 | ) | (457 | ) | — |
| (457 | ) |
| Other contracts | (2 | ) | — |
| — |
| (2 | ) | (4 | ) | — |
| (4 | ) |
| | (155 | ) | (46 | ) | — |
| (1,991 | ) | (2,192 | ) | — |
| (2,192 | ) |
| | | December 31, 2016 | Derivative
Instruments
Used as
Cash Flow Hedges |
| Derivative
Instruments
Used as Net Investment Hedges |
| Non-
Qualifying
Derivative Instruments |
| Total Gross
Derivative
Instruments as Presented |
| Amounts
Available for Offset |
| Total Net Derivative Instruments |
|
| December 31, 2022 | |
| December 31, 2022 | |
| December 31, 2022 | | Derivative
Instruments
Used as
Cash Flow Hedges | | Derivative Instruments Used as Fair Value Hedges | Non-
Qualifying
Derivative Instruments | Total Gross
Derivative
Instruments as Presented | Amounts
Available for Offset | Total Net Derivative Instruments |
| (millions of Canadian dollars) | |
| |
| |
| |
| |
| |
| (millions of Canadian dollars) | | | | | |
| Accounts receivable and other | |
| |
| |
| |
| |
| |
|
| Foreign exchange contracts | 101 |
| 3 |
| 5 |
| 109 |
| (103 | ) | 6 |
|
| Interest rate contracts | 3 |
| — |
| — |
| 3 |
| (3 | ) | — |
|
| Commodity contracts | 9 |
| — |
| 232 |
| 241 |
| (125 | ) | 116 |
|
| | 113 |
| 3 |
| 237 |
| 353 |
| (231 | ) | 122 |
|
| Deferred amounts and other assets | |
| |
| |
| | |
| |
| Other current assets | | Other current assets | | | | | |
| Foreign exchange contracts | 1 |
| 3 |
| 69 |
| 73 |
| (72 | ) | 1 |
|
| Interest rate contracts | 8 |
| — |
| — |
| 8 |
| (6 | ) | 2 |
|
| Commodity contracts | 7 |
| — |
| 61 |
| 68 |
| (22 | ) | 46 |
|
| Other contracts | 1 |
| — |
| 1 |
| 2 |
| — |
| 2 |
|
| | 17 |
| 3 |
| 131 |
| 151 |
| (100 | ) | 51 |
|
| Accounts payable and other | |
| |
| |
| | |
| |
| Deferred amounts and other assets | |
| Foreign exchange contracts | |
| Foreign exchange contracts | |
| Foreign exchange contracts | — |
| (268 | ) | (727 | ) | (995 | ) | 103 |
| (892 | ) |
| Interest rate contracts | (452 | ) | — |
| (131 | ) | (583 | ) | 3 |
| (580 | ) |
| Commodity contracts | — |
| — |
| (359 | ) | (359 | ) | 125 |
| (234 | ) |
| Other contracts | (1 | ) | — |
| (3 | ) | (4 | ) | — |
| (4 | ) |
| | (453 | ) | (268 | ) | (1,220 | ) | (1,941 | ) | 231 |
| (1,710 | ) |
| Other current liabilities | |
| Foreign exchange contracts | |
| Foreign exchange contracts | |
| Foreign exchange contracts | |
| | Commodity contracts | |
| Commodity contracts | |
| Commodity contracts | |
| | | |
| | |
| | |
| Other long-term liabilities | |
| |
| |
| | |
| |
| Foreign exchange contracts | |
| Foreign exchange contracts | |
| Foreign exchange contracts | — |
| (68 | ) | (1,961 | ) | (2,029 | ) | 72 |
| (1,957 | ) |
| Interest rate contracts | (268 | ) | — |
| (205 | ) | (473 | ) | 6 |
| (467 | ) |
| Commodity contracts | — |
| — |
| (211 | ) | (211 | ) | 22 |
| (189 | ) |
| | (268 | ) | (68 | ) | (2,377 | ) | (2,713 | ) | 100 |
| (2,613 | ) |
| | |
| | |
| | |
| Total net derivative asset/(liability) | |
| |
| |
| | |
| |
| Foreign exchange contracts | |
| Foreign exchange contracts | |
| Foreign exchange contracts | 102 |
| (330 | ) | (2,614 | ) | (2,842 | ) | — |
| (2,842 | ) |
| Interest rate contracts | (709 | ) | — |
| (336 | ) | (1,045 | ) | — |
| (1,045 | ) |
| Commodity contracts | 16 |
| — |
| (277 | ) | (261 | ) | — |
| (261 | ) |
| Other contracts | — |
| — |
| (2 | ) | (2 | ) | — |
| (2 | ) |
| | (591 | ) | (330 | ) | (3,229 | ) | (4,150 | ) | — |
| (4,150 | ) |
The following table summarizes the maturity and notional principal or quantity outstanding related to our derivative instruments. instruments:
| | | | | | | | | | | | | | | | | | | | | | | | | | | | | | | | | | | |
| 2023 | | | | 2022 | |
| As at December 31, | 2024 | 2025 | 2026 | 2027 | 2028 | Thereafter | | Total | | Total | |
Foreign exchange contracts - US dollar forwards - purchase (millions of US dollars) | 1,360 | | 500 | | | — | | — | | — | | | 1,860 | | | 2,155 | | |
Foreign exchange contracts - US dollar forwards - sell (millions of US dollars) | 6,582 | | 5,327 | | 4,697 | | 4,091 | | 3,162 | | 888 | | | 24,747 | | | 27,610 | | |
Foreign exchange contracts - British pound (GBP) forwards - sell (millions of GBP) | 30 | | 30 | | 28 | | 32 | | — | | — | | | 120 | | | 149 | | |
Foreign exchange contracts - Euro forwards - sell (millions of Euro) | 141 | | 126 | | 121 | | 81 | | 67 | | 195 | | | 731 | | | 697 | | |
Foreign exchange contracts - Japanese yen forwards - purchase (millions of yen) | — | | 84,800 | | — | | — | | — | | — | | | 84,800 | | | 84,800 | | |
Interest rate contracts - short-term pay fixed rate (millions of Canadian dollars) | 5,903 | | 1,881 | | 1,122 | | 74 | | 25 | | 13 | | | 9,018 | | | 9,356 | | |
Interest rate contracts - short-term debt receive fixed rate (millions of Canadian dollars) | 918 | | 923 | | 174 | | — | | — | | — | | | 2,015 | | | — | | |
Interest rate contracts - long-term pay fixed rate (millions of Canadian dollars)1 | 4,582 | | 580 | | — | | — | | — | | — | | | 5,162 | | | 7,851 | | |
Interest rate contracts - costless collar (millions of Canadian dollars) | — | | 1,098 | | 41 | | — | | — | | — | | | 1,139 | | | — | | |
Equity contracts (millions of Canadian dollars) | 34 | | 13 | | — | | — | | — | | — | | | 47 | | | 80 | | |
Commodity contracts - natural gas (billions of cubic feet) | 31 | | 32 | | 13 | | 10 | | — | | — | | | 86 | | | 93 | | |
Commodity contracts - crude oil (millions of barrels) | 6 | | — | | — | | — | | — | | — | | | 6 | | | 16 | | |
| | | | | | | | | | | |
Commodity contracts - power (megawatt per hour (MW/H)) | 49 | | (14) | | (26) | | (53) | | (57) | | (30) | | | (22) | | 2 | (14) | | 2 |
1Represents the notional of long-term debt issuances hedged
2Total is an average net purchase/(sale) of power.
Derivatives Designated as Fair Value Hedges
The following table presents foreign exchange derivative instruments that are designated and qualify as fair value hedges, the realized and unrealized gain or loss on the derivative is included in Other income/(expense) or Interest expense in the Consolidated Statements of Earnings. The offsetting loss or gain on the hedged item attributable to the hedged risk is included in Other income/(expense) in the Consolidated Statements of Earnings. Any excluded components are included in the Consolidated Statements of Comprehensive Income.
| | | | | | | | |
| Year ended December 31, | 2023 | 2022 |
| (millions of Canadian dollars) | | |
| Unrealized gain/(loss) on derivative | (132) | | 262 | |
| Unrealized gain/(loss) on hedged item | 131 | | (254) | |
| Realized loss on derivative | (47) | | (110) | |
| Realized gain on hedged item | — | | 85 | |
|
| | | | | | | | | | | | | | | | |
| | 2017 | | 2016 |
| |
| As at December 31, | 2018 |
| 2019 |
| 2020 |
| 2021 |
| 2022 |
| Thereafter |
| | Total |
| |
Foreign exchange contracts - United States dollar forwards - purchase (millions of United States dollars) | 755 |
| 2 |
| 2 |
| — |
| — |
| — |
| | 997 |
| |
Foreign exchange contracts - United States dollar forwards - sell (millions of United States dollars) | 4,478 |
| 3,246 |
| 3,258 |
| 1,689 |
| 1,676 |
| 1,820 |
| | 13,591 |
| |
Foreign exchange contracts - British pound (GBP) forwards - purchase (millions of GBP) | 18 |
| — |
| — |
| — |
| — |
| — |
| | 97 |
| |
Foreign exchange contracts - GBP forwards - sell (millions of GBP) | — |
| 89 |
| 25 |
| 27 |
| 28 |
| 149 |
| | 285 |
| |
Foreign exchange contracts - Euro forwards - purchase (millions of Euro) | 280 |
| 375 |
| — |
| — |
| — |
| — |
| | — |
| |
Foreign exchange contracts - Euro forwards - sell (millions of Euro) | — |
| — |
| 35 |
| 169 |
| 169 |
| 889 |
| | — |
| |
Foreign exchange contracts - Japanese yen forwards - purchase (millions of yen) | — |
| 32,662 |
| — |
| — |
| 20,000 |
| — |
| | 32,662 |
| |
Interest rate contracts - short-term pay fixed rate (millions of Canadian dollars) | 4,950 |
| 1,585 |
| 215 |
| 95 |
| 91 |
| 202 |
| | 14,008 |
| |
Interest rate contracts - long-term receive fixed rate (millions of Canadian dollars) | 1,522 |
| 1,018 |
| 822 |
| 433 |
| 349 |
| 52 |
| | — |
| |
Interest rate contracts - long-term pay fixed rate (millions of Canadian dollars) | 4,007 |
| 957 |
| 438 |
| — |
| — |
| — |
| | 7,509 |
| |
Equity contracts (millions of Canadian dollars) | 45 |
| 37 |
| 8 |
| — |
| — |
| — |
| | 88 |
| |
Commodity contracts - natural gas (billions of cubic feet) | (59 | ) | (69 | ) | (20 | ) | (10 | ) | (1 | ) | — |
| | (161 | ) | |
Commodity contracts - crude oil (millions of barrels) | (3 | ) | — |
| — |
| — |
| — |
| — |
| | (20 | ) | |
Commodity contracts - NGL (millions of barrels) | (12 | ) | — |
| — |
| — |
| — |
| — |
| | (14 | ) | |
Commodity contracts - power (megawatt per hour (MW/H)) | 42 |
| 51 |
| 55 |
| (3 | ) | (43 | ) | (43 | ) | 1 | (4 | ) | 2 |
| |
1 | As at December 31, 2017, thereafter includes an average net purchase/(sell) of power of (43) MW/H for 2023 through 2025. |
| |
2 | As at December 31, 2016, the average net purchase/(sell) of power was (4) MW/H for 2017 through 2025 with a high of 40 MW/H and a low of (43) MW/H. |
The Effect of Derivative Instruments on the Consolidated Statements of Earnings and Comprehensive Income
The following table presents the effect of cash flow hedges and net investmentfair value hedges on our consolidated earnings and consolidated comprehensive income, before the effect of income taxes:
| | | | 2017 |
| 2016 |
| 2015 |
|
| Year ended December 31, | | Year ended December 31, | 2023 | 2022 | 2021 |
| (millions of Canadian dollars) | |
| |
| |
| (millions of Canadian dollars) | | |
| Amount of unrealized gain/(loss) recognized in OCI | |
| |
| |
| Amount of unrealized gain/(loss) recognized in OCI | | |
| Cash flow hedges | |
| |
| |
| Cash flow hedges | | |
| Foreign exchange contracts | (5 | ) | (19 | ) | 77 |
|
| Interest rate contracts | 6 |
| (90 | ) | (275 | ) |
| Commodity contracts | 11 |
| 14 |
| 9 |
|
| Other contracts | 1 |
| 39 |
| (47 | ) |
| Net investment hedges | |
| |
| |
|
| Fair value hedges | |
| Foreign exchange contracts | |
| Foreign exchange contracts | |
| Foreign exchange contracts | 284 |
| 22 |
| (248 | ) |
| | 297 |
| (34 | ) | (484 | ) |
Amount of (gain)/loss reclassified from AOCI to earnings (effective portion) | |
| |
| |
|
| | | |
| | | |
| | | |
| Amount of loss reclassified from AOCI to earnings | | Amount of loss reclassified from AOCI to earnings | | |
Foreign exchange contracts1 | (104 | ) | 2 |
| 9 |
|
Interest rate contracts2,3 | 388 |
| 145 |
| 128 |
|
Commodity contracts4 | (9 | ) | (12 | ) | (46 | ) |
Other contracts5 | 8 |
| (29 | ) | 28 |
|
Interest rate contracts2 | |
Commodity contracts3 | |
Other contracts3 | |
| | 283 |
| 106 |
| 119 |
|
| De-designation of qualifying hedges in connection with the Canadian Restructuring Plan | |
| |
| |
|
Interest rate contracts2 | — |
| — |
| 338 |
|
| | — |
| — |
| 338 |
|
Amount of (gain)/loss reclassified from AOCI to earnings (ineffective portion and amount excluded from effectiveness testing) | |
| |
| |
|
Interest rate contracts2, 3 | (4 | ) | 61 |
| 21 |
|
Commodity contracts4 | — |
| — |
| 5 |
|
| | (4 | ) | 61 |
| 26 |
|
| |
1 | Reported within Transportation and other services revenues and Other income/(expense) in the Consolidated Statements of Earnings. |
| |
2 | Reported within Interest expense in the Consolidated Statements of Earnings. |
| |
3 | For the year ended December 31, 2017, includes settlements of $296 million loss related to the termination of long-term interest rate swaps as not highly probable to issue long-term debt. |
| |
4 | Reported within Transportation and other services revenues, Commodity sales revenues, Commodity costs and Operating and administrative expense in the Consolidated Statements of Earnings. |
| |
5 | Reported within Operating and administrative expense in the Consolidated Statements of Earnings. |
1Reported within Transportation and other services revenues and Other income/(expense) in the Consolidated Statements of Earnings.
2Reported within Interest expense in the Consolidated Statements of Earnings.
3Reported within Operating and administrative expense in the Consolidated Statements of Earnings.
We estimate that a loss of $38$18 million from AOCI related to cash flow hedges will be reclassified to earnings in the next 12 months. Actual amounts reclassified to earnings depend on the foreign exchange rates, interest rates and commodity prices in effect when derivative contracts that are currently outstanding mature. For all forecasted transactions, the maximum term over which we are hedging exposures to the variability of cash flows is 36 months2 years as at December 31, 2017.2023.
Fair Value Derivatives
For interest rate derivative instruments that are designated and qualify as fair value hedges, the gain or loss on the derivative as well as the offsetting loss or gain on the hedged item attributable to the hedged risk is included in Interest expense in the Consolidated Statements of Earnings. During the years ended December 31, 2017 and 2016, we recognized an unrealized loss of $10 million and nil, respectively, on the derivative and an unrealized gain of $11 million and nil, respectively, on the hedged item in earnings. During the years ended December 31, 2017 and 2016, we recognized a realized gain of $2 million and nil, respectively, on the derivative and a realized loss of $2 million and nil, respectively, on the hedged item in earnings. The difference in the amounts, if any, represents hedge ineffectiveness.
Non-Qualifying Derivatives
The following table presents the unrealized gains and losses associated with changes in the fair value of our non-qualifying derivatives:
| | | | | | | | | | | |
| Year ended December 31, | 2023 | 2022 | 2021 |
| (millions of Canadian dollars) | | | |
Foreign exchange contracts1 | 1,292 | | (1,344) | | 92 | |
Interest rate contracts2 | (63) | | 10 | | 2 | |
Commodity contracts3 | (41) | | 50 | | 71 | |
Other contracts4 | (8) | | 4 | | 8 | |
| Total unrealized derivative fair value gain/(loss), net | 1,180 | | (1,280) | | 173 | |
1For the respective years ended, reported within Transportation and other services revenues (2023 - $645 million gain; 2022 - $238 million loss; 2021 - $98 million gain) and Other income/(expense) (2023 - $647 million gain; 2022 - $1,106 million loss; 2021 - $6 million loss) in the Consolidated Statements of Earnings.
2Reported as an increase within Interest expense in the Consolidated Statements of Earnings.
3For the respective years ended, reported within Transportation and other services revenues (2023 - $35 million loss; 2022 - $13 million gain; 2021 - $9 million gain), Commodity sales (2023 - $153 million gain; 2022 - $89 million gain; 2021 - $160 million gain), Commodity costs (2023 - $94 million loss; 2022 - $102 million loss; 2021 - $105 million loss) and Operating and administrative expense (2023 - $65 million loss; 2022 - $50 million gain; 2021 - $7 million gain) in the Consolidated Statements of Earnings.
4Reported within Operating and administrative expense in the Consolidated Statements of Earnings.
|
| | | | | | |
| Year ended December 31, | 2017 |
| 2016 |
| 2015 |
|
| (millions of Canadian dollars) | |
| |
| |
|
Foreign exchange contracts1 | 1,284 |
| 935 |
| (2,187 | ) |
Interest rate contracts2 | 157 |
| 73 |
| (363 | ) |
Commodity contracts3 | (199 | ) | (508 | ) | 199 |
|
Other contracts4 | — |
| 9 |
| (22 | ) |
| Total unrealized derivative fair value gain/(loss), net | 1,242 |
| 509 |
| (2,373 | ) |
| |
1 | For the respective annual periods, reported within Transportation and other services revenues (2017 - $800 million gain; 2016 - $497 million gain; 2015 - $1,383 million loss) and Other income/(expense) (2017 - $484 million gain; 2016 - $438 million gain; 2015 - $804 million loss) in the Consolidated Statements of Earnings. |
| |
2 | Reported as an (increase)/decrease within Interest expense in the Consolidated Statements of Earnings. |
| |
3 | For the respective annual periods, reported within Transportation and other services revenues (2017 - $104 million loss; 2016 - $52 million loss; 2015 - $328 million gain), Commodity sales (2017 - $90 million gain 2016 - $474 million loss; 2015 - $226 million loss), Commodity costs (2017 - $223 million loss; 2016 - $38 million gain; 2015 - $99 million gain) and Operating and administrative expense (2017 - $38 million gain; 2016 - $20 million loss; 2015 - $2 million loss) in the Consolidated Statements of Earnings. |
| |
4 | Reported within Operating and administrative expense in the Consolidated Statements of Earnings. |
LIQUIDITY RISK
Liquidity risk is the risk that we will not be able to meet our financial obligations, including commitments and guarantees, as they become due. In order to mitigate this risk, we forecast cash requirements over a 12 month12-month rolling time period to determine whether sufficient funds will be available and maintain substantial capacity under our committed bank lines of credit to address any contingencies. Our primary sources of liquidity and capital resources are funds generated from operations, the issuance of commercial paper and draws under committed credit facilities and long-term debt, which includes debentures and medium-term notes. We also maintain currentOur shelf prospectuses with securities regulators which enables, subject to market conditions,enable ready access to either the Canadian or United StatesUS public capital markets.markets, subject to market conditions. In addition, we maintain sufficient liquidity through committed credit facilities with a diversified group of banks and institutions which, if necessary, enables us to fund all anticipated requirements for approximately one year without accessing the capital markets. We arewere in compliance with all the terms and conditions of our committed credit facility agreements and term debt indentures as at December 31, 2017.2023. As a result, all credit facilities are available to us and the banks are obligated to fund and have been funding us under the terms of the facilities. We also identify a variety of other potential sources of debt and equity funding alternatives, including reinstatement of our dividend reinvestment and share purchase plan or at-the-market equity issuances.
CREDIT RISK
Entering into derivative instruments may result in exposure to credit risk from the possibility that a counterparty will default on its contractual obligations. In order to mitigate this risk, we enter into risk management transactions primarily with institutions that possess strong investment grade credit ratings. Credit risk relating to derivative counterparties is mitigated bythrough the maintenance and monitoring of credit exposure limits and contractual requirements, netting arrangements and ongoing monitoring of counterparty credit exposure using external credit rating services and other analytical tools.
We have group credit concentrations and maximum credit exposure, with respect to derivative instruments, in the following counterparty segments:
| | | | | | | | |
| December 31, | 2023 | 2022 |
| (millions of Canadian dollars) | | |
| Canadian financial institutions | 457 | | 644 | |
| US financial institutions | 252 | | 277 | |
| European financial institutions | 107 | | 334 | |
| Asian financial institutions | 121 | | 224 | |
Other1 | 125 | | 105 | |
| | 1,062 | | 1,584 | |
|
| | | | |
| December 31, | 2017 |
| 2016 |
|
| (millions of Canadian dollars) | |
| |
|
| Canadian financial institutions | 82 |
| 39 |
|
| United States financial institutions | 19 |
| 179 |
|
| European financial institutions | 145 |
| 106 |
|
| Asian financial institutions | 2 |
| 1 |
|
Other1 | 137 |
| 162 |
|
| | 385 |
| 487 |
|
| |
1 | Other is comprised of commodity clearing house and physical natural gas and crude oil counterparties. |
As at December 31, 2017,2023, we provideddid not provide any letters of credit totaling nil in lieu of providing cash collateral to our counterparties pursuant to the terms of the relevant ISDA agreements. We held no cash collateral on derivative asset exposures as at December 31, 20172023 and December 31, 2016.2022.
Gross derivative balances have been presented without the effects of collateral posted. Derivative assets are adjusted for non-performance risk of our counterparties using their credit default swap spread rates and are reflected at fair value. For derivative liabilities, our non-performance risk is considered in the valuation.
Credit risk also arises from trade and other long-term receivables, and is mitigated through credit exposure limits and contractual requirements, the assessment of credit ratings and netting arrangements. Within EGD and UnionEnbridge Gas, credit risk is mitigated by the utilities'utility's large and diversified customer base and the ability to recover an estimate for doubtful accountsexpected credit losses through the ratemaking process. We actively monitor the financial strength of large industrial customers and, in select cases, have obtained additional security to minimize the risk of default on receivables. Generally, we classifyutilize a loss allowance matrix which contemplates historical credit losses by age of receivables, adjusted for any forward-looking information and provide for receivables older than 20 days as past due.management expectations to measure lifetime expected credit losses of receivables. The maximum exposure to credit risk related to non-derivative financial assets is their carrying value.
FAIR VALUE MEASUREMENTS
Our financial assets and liabilities measured at fair value on a recurring basis include derivativederivatives and other financial instruments. We also disclose the fair value of other financial instruments not measured at fair value. The fair value of financial instruments reflects our best estimates of market value based on generally accepted valuation techniques or models and is supported by observable market prices and rates. When such values are not available, we use discounted cash flow analysis from applicable yield curves based on observable market inputs to estimate fair value.
FAIR VALUE OF FINANCIAL INSTRUMENTS
We categorize our derivativefinancial instruments measured at fair value into one of three different levels depending on the observability of the inputs employed in the measurement.
Level 1
Level 1 includes derivativesfinancial instruments measured at fair value based on unadjusted quoted prices for identical assets and liabilities in active markets that are accessible at the measurement date. An active market for a derivativefinancial instrument is considered to be a market where transactions occur with sufficient frequency and volume to provide pricing information on an ongoing basis. Our Level 1 instruments consist primarily of exchange-traded derivatives used to mitigate the risk of crude oil price fluctuations.fluctuations, US and Canadian treasury bills, investments in exchange-traded funds held by our captive insurance subsidiaries, as well as restricted long-term investments in exchange-traded funds that are held in trust in accordance with the CER's regulatory requirements under the LMCI.
Level 2
Level 2 includes derivativefinancial instrument valuations determined using directly or indirectly observable inputs other than quoted prices included within Level 1. DerivativesFinancial instruments in this category are valued using models or other industry standard valuation techniques derived from observable market data. Such valuation techniques
include inputs such as quoted forward prices, time value, volatility factors and broker quotes that can be observed or corroborated in the market for the entire duration of the derivative.financial instrument. Derivatives valued using Level 2 inputs include non-exchange traded derivatives such as over-the-counter foreign exchange forward and cross currencycross-currency swap contracts, interest rate swaps, physical forward commodity contracts, as well as commodity swaps and options for which observable inputs can be obtained.
We have also categorized the fair value of our held to maturity preferred share investment and long-term debt, investments in debt securities held by our captive insurance subsidiaries, and restricted long-term investments in Canadian government bonds held in trust in accordance with the CER's regulatory requirements under the LMCI as Level 2. The fair value of our held to maturity preferred share investment is primarily based on the yield of certain Government of Canada bonds. The fair value of our long-term debt is based on quoted market prices for instruments of similar yield, credit risk and tenor. When possible, the fair value of our restricted long-term investments is based on quoted market prices for similar instruments and, if not available, based on broker quotes.
Level 3
Level 3 includes derivative valuations based on inputs which are less observable, unavailable or where the observable data does not support a significant portion of the derivatives’derivative's fair value. Generally, Level 3 derivatives are longer dated transactions, occur in less active markets, occur at locations where pricing information is not available or have no binding broker quote to support Level 2 classification. We have developed methodologies, benchmarked against industry standards, to determine fair value for these derivatives based on the extrapolation of observable future prices and rates. Derivatives valued using Level 3 inputs primarily include long-dated derivative power, contracts and NGL and natural gas contracts, basis swaps, commodity swaps, and power and energy swaps, as well as options.physical forward commodity contracts. We do not have any other financial instruments categorized in Level 3.
We use the most observable inputs available to estimate the fair value of our derivatives. When possible, we estimate the fair value of our derivatives based on quoted market prices. If quoted market prices are not available, we use estimates from third partythird-party brokers. For non-exchange traded derivatives classified in Levels 2 and 3, we use standard valuation techniques to calculate the estimated fair value. These methods include discounted cash flows for forwards and swaps and Black-Scholes-Merton pricing models for options. Depending on the type of derivative and nature of the underlying risk, we use observable market prices (interest, foreign exchange, commodity and share price) and volatility as primary inputs to these valuation techniques. Finally, we consider our own credit default swap spread, as well as the credit default swap spreads associated with our counterparties, in our estimation of fair value.
Fair Value of Derivatives
We have categorized our derivative assets and liabilities measured at fair value as follows:
| | | | | | | | | | | | | | |
| December 31, 2023 | Level 1 | Level 2 | Level 3 | Total Gross Derivative Instruments |
| (millions of Canadian dollars) | | | | |
| Financial assets | | | | |
| Current derivative assets | | | | |
| Foreign exchange contracts | — | | 139 | | — | | 139 | |
| Interest rate contracts | — | | 65 | | — | | 65 | |
| Commodity contracts | 142 | | 103 | | 173 | | 418 | |
| Other contracts | — | | 1 | | — | | 1 | |
| | 142 | | 308 | | 173 | | 623 | |
| Long-term derivative assets | | | | |
| Foreign exchange contracts | — | | 335 | | — | | 335 | |
| Interest rate contracts | — | | 53 | | — | | 53 | |
| Commodity contracts | — | | 24 | | 51 | | 75 | |
| | | | |
| | — | | 412 | | 51 | | 463 | |
| Financial liabilities | | | | |
| Current derivative liabilities | | | | |
| Foreign exchange contracts | — | | (128) | | — | | (128) | |
| Interest rate contracts | — | | (186) | | — | | (186) | |
| Commodity contracts | (136) | | (76) | | (211) | | (423) | |
| Other contracts | — | | (1) | | — | | (1) | |
| . | (136) | | (391) | | (211) | | (738) | |
| Long-term derivative liabilities | | | | |
| Foreign exchange contracts | — | | (498) | | — | | (498) | |
| Interest rate contracts | — | | (88) | | — | | (88) | |
| Commodity contracts | — | | (22) | | (144) | | (166) | |
| | | | |
| | — | | (608) | | (144) | | (752) | |
| Total net financial asset/(liability) | | | | |
| Foreign exchange contracts | — | | (152) | | — | | (152) | |
| Interest rate contracts | — | | (156) | | — | | (156) | |
| Commodity contracts | 6 | | 29 | | (131) | | (96) | |
| Other contracts | — | | — | | — | | — | |
| | 6 | | (279) | | (131) | | (404) | |
|
| | | | | | | | |
| December 31, 2017 | Level 1 |
| Level 2 |
| Level 3 |
| Total Gross Derivative Instruments |
|
| (millions of Canadian dollars) | |
| |
| |
| |
|
| Financial assets | |
| |
| |
| |
|
| Current derivative assets | |
| |
| |
| |
|
| Foreign exchange contracts | — |
| 143 |
| — |
| 143 |
|
| Interest rate contracts | — |
| 8 |
| — |
| 8 |
|
| Commodity contracts | 1 |
| 30 |
| 114 |
| 145 |
|
| | 1 |
| 181 |
| 114 |
| 296 |
|
| Long-term derivative assets | |
| |
| |
| |
| Foreign exchange contracts | — |
| 145 |
| — |
| 145 |
|
| Interest rate contracts | — |
| 13 |
| — |
| 13 |
|
| Commodity contracts | — |
| 2 |
| 21 |
| 23 |
|
| | — |
| 160 |
| 21 |
| 181 |
|
| Financial liabilities | |
| |
| |
| |
| Current derivative liabilities | |
| |
| |
| |
| Foreign exchange contracts | — |
| (359 | ) | — |
| (359 | ) |
| Interest rate contracts | — |
| (329 | ) | — |
| (329 | ) |
| Commodity contracts | (13 | ) | (87 | ) | (339 | ) | (439 | ) |
| Other contracts | — |
| (3 | ) | — |
| (3 | ) |
| | (13 | ) | (778 | ) | (339 | ) | (1,130 | ) |
| Long-term derivative liabilities | |
| |
| |
| |
| Foreign exchange contracts | — |
| (1,312 | ) | — |
| (1,312 | ) |
| Interest rate contracts | — |
| (40 | ) | — |
| (40 | ) |
| Commodity contracts | — |
| (3 | ) | (183 | ) | (186 | ) |
| Other contracts | — |
| (1 | ) | — |
| (1 | ) |
| | — |
| (1,356 | ) | (183 | ) | (1,539 | ) |
| Total net financial asset/(liability) | |
| |
| |
| |
| Foreign exchange contracts | — |
| (1,383 | ) | — |
| (1,383 | ) |
| Interest rate contracts | — |
| (348 | ) | — |
| (348 | ) |
| Commodity contracts | (12 | ) | (58 | ) | (387 | ) | (457 | ) |
| Other contracts | — |
| (4 | ) | — |
| (4 | ) |
| | (12 | ) | (1,793 | ) | (387 | ) | (2,192 | ) |
| | | December 31, 2016 | Level 1 |
| Level 2 |
| Level 3 |
| Total Gross Derivative Instruments |
|
| December 31, 2022 | | December 31, 2022 | Level 1 | Level 2 | Level 3 | Total Gross Derivative Instruments |
| (millions of Canadian dollars) | |
| |
| |
| |
| (millions of Canadian dollars) | |
| Financial assets | |
| |
| |
| |
| Financial assets | |
| Current derivative assets | |
| |
| |
| |
| Current derivative assets | |
| Foreign exchange contracts | — |
| 109 |
| — |
| 109 |
|
| Interest rate contracts | — |
| 3 |
| — |
| 3 |
|
| Commodity contracts | 2 |
| 86 |
| 153 |
| 241 |
|
| Other contracts | |
| | 2 |
| 198 |
| 153 |
| 353 |
|
| Long-term derivative assets | |
| |
| |
| |
| Foreign exchange contracts | |
| Foreign exchange contracts | |
| Foreign exchange contracts | — |
| 73 |
| — |
| 73 |
|
| Interest rate contracts | — |
| 8 |
| — |
| 8 |
|
| Commodity contracts | — |
| 43 |
| 25 |
| 68 |
|
| Other contracts | — |
| 2 |
| — |
| 2 |
|
| | — |
| 126 |
| 25 |
| 151 |
|
| Financial liabilities | |
| |
| |
| |
| Current derivative liabilities | |
| |
| |
| |
| Current derivative liabilities | |
| Current derivative liabilities | |
| Foreign exchange contracts | |
| Foreign exchange contracts | |
| Foreign exchange contracts | |
| | Commodity contracts | |
| Commodity contracts | |
| Commodity contracts | |
| | | |
| | |
| | |
| Long-term derivative liabilities | |
| Foreign exchange contracts | |
| Foreign exchange contracts | |
| Foreign exchange contracts | |
| Interest rate contracts | |
| Commodity contracts | |
| | | |
| | |
| | |
| Total net financial asset/(liability) | |
| Foreign exchange contracts | |
| Foreign exchange contracts | |
| Foreign exchange contracts | — |
| (995 | ) | — |
| (995 | ) |
| Interest rate contracts | — |
| (583 | ) | — |
| (583 | ) |
| Commodity contracts | (12 | ) | (75 | ) | (272 | ) | (359 | ) |
| Other contracts | — |
| (4 | ) | — |
| (4 | ) |
| | (12 | ) | (1,657 | ) | (272 | ) | (1,941 | ) |
| Long-term derivative liabilities | |
| |
| |
| |
Foreign exchange contracts
| — |
| (2,029 | ) | — |
| (2,029 | ) |
| Interest rate contracts | — |
| (473 | ) | — |
| (473 | ) |
| Commodity contracts | — |
| (10 | ) | (201 | ) | (211 | ) |
| | — |
| (2,512 | ) | (201 | ) | (2,713 | ) |
| Total net financial asset/(liability) | |
| |
| |
| |
| Foreign exchange contracts | — |
| (2,842 | ) | — |
| (2,842 | ) |
| Interest rate contracts | — |
| (1,045 | ) | — |
| (1,045 | ) |
| Commodity contracts | (10 | ) | 44 |
| (295 | ) | (261 | ) |
| Other contracts | — |
| (2 | ) | — |
| (2 | ) |
| | (10 | ) | (3,845 | ) | (295 | ) | (4,150 | ) |
The significant unobservable inputs used in the fair value measurement of Level 3 derivative instruments were as follows:
| | | | | | | | | | | | | | | | | | | | |
| December 31, 2023 | Fair Value | Unobservable Input | Minimum Price | Maximum Price | Weighted Average Price | Unit of Measurement |
| (fair value in millions of Canadian dollars) | | | | | | |
Commodity contracts - financial1 | | | | | | |
| Natural gas | (6) | | Forward gas price | 2.66 | 8.29 | 3.78 | $/mmbtu2 |
| Crude | (7) | | Forward crude price | 69.01 | 92.76 | 80.35 | $/barrel |
| | | | | | |
| Power | (87) | | Forward power price | 29.75 | 145.24 | 59.21 | $/MW/H |
Commodity contracts - physical1 | | | | | | |
| Natural gas | 14 | | Forward gas price | 0.86 | 11.85 | 3.42 | $/mmbtu2 |
| Crude | (7) | | Forward crude price | 64.51 | 98.11 | 82.85 | $/barrel |
| | | | | | |
| Power | (38) | | Forward power price | 18.20 | 164.84 | 58.46 | $/MW/H |
| | (131) | | | | | | |
|
| | | | | | | | | | |
| December 31, 2017 | Fair Value |
| Unobservable Input | Minimum Price/Volatility |
| Maximum Price/Volatility |
| Weighted Average Price/Volatility |
| Unit of Measurement |
| (fair value in millions of Canadian dollars) | |
| | |
| |
| |
| |
Commodity contracts - financial1 | |
| | |
| |
| |
| |
| Natural gas | (1 | ) | Forward gas price | 2.67 |
| 5.52 |
| 3.38 |
| $/mmbtu3 |
| Crude | (4 | ) | Forward crude price | 43.76 |
| 65.60 |
| 51.03 |
| $/barrel |
| NGL | (12 | ) | Forward NGL price | 0.30 |
| 1.83 |
| 1.32 |
| $/gallon |
| Power | (110 | ) | Forward power price | 15.39 |
| 71.41 |
| 50.72 |
| $/MW/H |
Commodity contracts - physical1 | |
| | |
| |
| |
| |
| Natural gas | (114 | ) | Forward gas price | 2.51 |
| 7.57 |
| 2.93 |
| $/mmbtu3 |
| Crude | (148 | ) | Forward crude price | 34.38 |
| 80.56 |
| 69.01 |
| $/barrel |
| NGL | 3 |
| Forward NGL price | 0.28 |
| 1.94 |
| 0.93 |
| $/gallon |
Commodity options2 | |
| | |
| |
| |
| |
| Crude | (1 | ) | Option volatility | 15 | % | 24 | % | 22 | % | |
| Power | — |
| Option volatility | 29 | % | 55 | % | 35 | % | |
| | (387 | ) | | |
| |
| |
| |
| |
1 | Financial and physical forward commodity contracts are valued using a market approach valuation technique. |
| |
2 | Commodity options contracts are valued using an option model valuation technique. |
| |
3 | One million British thermal units (mmbtu). |
2One million British thermal units (mmbtu).
If adjusted, the significant unobservable inputs disclosed in the table above would have a direct impact on the fair value of our Level 3 derivative instruments. The significant unobservable inputs used in the fair value measurement of Level 3 derivative instruments include forward commodity prices and, for option contracts, price volatility.prices. Changes in forward commodity prices could result in significantly different fair values for our Level 3 derivatives. Changes in price volatility would change the value of the option contracts. Generally, a change in the estimate of forward commodity prices is unrelated to a change in the estimate of price volatility.
Changes in the net fair value of derivative assets and liabilities classified as Level 3 in the fair value hierarchy were as follows:
|
| | | | |
| Year ended December 31, | 2017 |
| 2016 |
|
| (millions of Canadian dollars) | |
| |
|
| Level 3 net derivative asset/(liability) at beginning of period | (295 | ) | 54 |
|
| Total gain/(loss) | |
| |
|
Included in earnings1 | (184 | ) | (113 | ) |
| Included in OCI | 4 |
| 3 |
|
| Settlements | 88 |
| (239 | ) |
| Level 3 net derivative liability at end of period | (387 | ) | (295 | ) |
| |
1 | Reported within Transportation and other services revenues, Commodity costs and Operating and administrative expense in the Consolidated Statements of Earnings. |
| | | | | | | | |
| Year ended December 31, | 2023 | 2022 |
| (millions of Canadian dollars) | | |
| Level 3 net derivative liability at beginning of period | (136) | | (108) | |
| Total gain/(loss), unrealized | | |
Included in earnings1 | (48) | | 6 | |
| Included in OCI | 67 | | (54) | |
| Settlements | (14) | | 20 | |
| Level 3 net derivative liability at end of year | (131) | | (136) | |
Our policy is to recognize transfers as at1Reported within Transportation and other services revenues, Commodity costs and Operating and administrative expense in the last dayConsolidated Statements of the reporting period. Earnings.
There were no transfers between levelsinto or out of Level 3 as at December 31, 20172023 or 2016.2022.
FAIR VALUE OF OTHER FINANCIAL INSTRUMENTSNet Investment Hedges
Our otherWe currently have designated a portion of our US dollar-denominated debt as a hedge of our net investment in US dollar-denominated investments and subsidiaries.
During the years ended December 31, 2023 and 2022, we recognized unrealized foreign exchange gains of $645 million and losses of $954 million, respectively, on the translation of US dollar-denominated debt, in OCI. No unrealized gains or losses on the change in fair value of our outstanding foreign exchange forward contracts were recognized in OCI during the years ended December 31, 2023 and 2022. No realized gains or losses associated with the settlement of foreign exchange forward contracts were recognized in OCI during the years ended December 31, 2023 and 2022. During the years ended December 31, 2023 and 2022, we recognized a realized loss of $236 million and $21 million, respectively, associated with the settlement of US dollar-denominated debt that had matured during the period, in OCI.
Fair Value of Other Financial Instruments
Certain long-term investments in other entities with no actively quoted prices are classified as FVMA investments and are recorded at cost.cost less impairment. The carrying value of other long-termFVMA investments recognized at cost totaled $99$173 million and $110$102 million as at December 31, 20172023 and 2016,2022, respectively.
We have Restricted long-term investmentswholly-owned captive insurance subsidiaries whose principal activity is providing insurance and reinsurance coverage for certain insurable property and casualty risk exposures of our operating subsidiaries and certain equity investments. As at December 31, 2023, the fair value of investments inequity funds and debt securities held in trust totaling $267by our captive insurance subsidiaries was $287 million and $90$284 million, respectively (2022 - $335 million and $298 million, respectively). Our investments in debt securities had a cost basis of $279 million as at December 31, 20172023 (2022 - $295 million). These investments in equity funds and 2016, respectively, whichdebt securities are recognized at fair value.
We have a held to maturity preferred share investment carried at its amortized costvalue, classified as Level 1 and Level 2 in the fair value hierarchy, respectively, and are recorded in Other current assets and Long-term investments in the Consolidated Statements of $371Financial Position. There were unrealized holding gains of $34 million and $355 million as atfor the year ended December 31, 2017 and 2016, respectively. These preferred shares are entitled to a cumulative preferred dividend based on the yield2023 (2022 - losses of 10-year Government of Canada bonds plus a margin of 4.38%$26 million). The fair value of this preferred share investment approximates its face value of $580 million as at December 31, 2017 and 2016.
As at December 31, 20172023 and 2016,2022, our long-term debt had a carrying value of $64.0$81.2 billion and $40.8$79.3 billion, respectively, before debt issuance costs and a fair value of $67.4$78.1 billion and $43.9$73.5 billion, respectively. We also have noncurrentnon-current notes receivable carried at book value and recorded in Deferred amounts and other assets in the Consolidated Statements of Financial Position. As at December 31, 20172023 and 2016,2022, the noncurrentnon-current notes receivable had a carrying value of $89$53 million and nil,$752 million, respectively, which also approximates their fair value.
As at December 31, 2023 and 2022, we had investments with a fair value of $89$717 million and nil, respectively.$593 million, respectively, included in Restricted long-term investments in the Consolidated Statements of Financial Position. These securities are classified as available-for-sale and represent restricted funds which are collected from customers and held in trust for the purpose of funding pipeline abandonment in accordance with the CER's regulatory requirements.
NET INVESTMENT HEDGES
We have designated a portionhad restricted long-term investments held in trust totaling $263 million and $236 million as at December 31, 2023 and 2022, respectively, which are classified as Level 1 in the fair value hierarchy. We also had restricted long-term investments held in trust totaling $454 million (cost basis - $486 million) and $357 million (cost basis - $437 million) as at December 31, 2023 and 2022, respectively, which are classified as Level 2 in the fair value hierarchy. There were unrealized holding gains of our United States dollar denominated debt, as well as a portfolio of foreign exchange forward contracts, as a hedge of our net investment in United States dollar denominated$51 million and losses $122 million on these investments and subsidiaries.
Duringfor the years ended December 31, 20172023 and 2016,2022, respectively. Within Other long-term liabilities we recognized an unrealized foreign exchange gain on the translationhad estimated future abandonment costs related to LMCI of United States dollar denominated debt of $367$745 million and $121$610 million as at December 31, 2023 and 2022, respectively and an unrealized gain on the change in(Note 7).
The fair value of financial assets and liabilities other than derivative instruments, certain long-term investments in other entities, restricted long-term investments, investments held by our outstanding foreign exchangecaptive insurance subsidiaries, long-term debt and non-current notes receivable described above approximate their carrying value due to the short period to maturity.
forward contracts of $286 million and $21 million, respectively, in OCI. During the years ended December 31, 2017 and 2016, we recognized a realized loss of $198 million and a realized gain of $3 million, respectively, in OCI associated with the settlement of foreign exchange forward contracts and also recognized a realized gain of $23 million and $26 million, respectively, in OCI associated with the settlement of United States dollar denominated debt that had matured during the period. There was no ineffectiveness during the years ended December 31, 2017 and 2016.
24. INCOME TAXES
INCOME TAX RATE RECONCILIATION
| | | | | | | | | | | |
| Year ended December 31, | 2023 | 2022 | 2021 |
| (millions of Canadian dollars) | | | |
| Earnings before income taxes | 7,879 | 4,542 | 7,729 |
| Canadian federal statutory income tax rate | 15 | % | 15 | % | 15 | % |
| Expected federal taxes at statutory rate | 1,182 | 681 | 1,159 |
| Increase/(decrease) resulting from: | | | |
Provincial and state income taxes1 | 411 | 108 | 228 |
Foreign and other statutory rate differentials2 | 187 | 295 | 134 |
| | | |
Effects of rate-regulated accounting3 | (106) | (122) | (139) |
Write-off of regulatory deferrals3,4 | 115 | — | — |
Part VI.1 tax, net of federal Part I deduction3,5 | 66 | 76 | 73 |
| | | |
US Minimum Tax6 | 100 | 107 | — |
Non-taxable portion of gain on sale of investment3,7 | — | — | (23) |
Valuation allowance3 | (12) | 6 | 5 |
Accounting impairment of non-deductible goodwill3,8 | — | 370 | — |
| | | |
Noncontrolling interests3,9 | 19 | 9 | (17) |
| Investment and production tax credits | (47) | — | — |
Other3 | (94) | 74 | (5) |
| Income tax expense | 1,821 | 1,604 | 1,415 |
| Effective income tax rate | 23.1 | % | 35.3 | % | 18.3 | % |
1The change in provincial and state income taxes from 2022 to 2023 reflects the decrease in earnings from Canadian operations and changes to the state tax apportionment partially offset by a reduction in earnings from US operations before considering the 2022 non-deductible goodwill impairment. Refer to Note 15 - Goodwill.
2The change in foreign and other statutory rate differentials from 2022 to 2023 reflects the decrease in earnings from US operations before considering the 2022 non-deductible goodwill impairment. Refer to Note 15 - Goodwill.
3The provincial and state tax component of these items is included in the Provincial and state income taxes above.
4The amount in 2023 includes the federal tax impact of the de-recognition of rate regulated accounting for income tax relating to Southern Lights Canada and portions of the Canadian Mainline including Line 9 and L3R. Refer to Note 7 - Regulatory Matters.
5Part VI.1 tax is a tax levied on preferred share dividends paid in Canada.
6There was no US Minimum Tax in 2021 as a result of tax losses from bonus tax depreciation.
7The amount in 2021 relates to the federal impact of the gain on sale of the investment in Noverco.
8The amount in 2022 relates to the federal impact of the non-deductible goodwill impairment relating to the Gas Transmission reporting unit. Refer to Note 15 - Goodwill.
|
| | | | | | |
| Year ended December 31, | 2017 |
| 2016 |
| 2015 |
|
| (millions of Canadian dollars) | |
| |
| |
|
| Earnings before income taxes | 569 |
| 2,451 |
| 11 |
|
| Canadian federal statutory income tax rate | 15 | % | 15 | % | 15 | % |
| Expected federal taxes at statutory rate | 85 |
| 368 |
| 2 |
|
| Increase/(decrease) resulting from: | |
| |
| |
|
Provincial and state income taxes1 | 133 |
| 34 |
| (204 | ) |
| Foreign and other statutory rate differentials | (601 | ) | (56 | ) | 310 |
|
Impact of United States tax reform2
| (2,045 | ) | — |
| — |
|
| Effects of rate-regulated accounting | (189 | ) | (116 | ) | (52 | ) |
| Foreign allowable interest deductions | (124 | ) | (107 | ) | (84 | ) |
| Part VI.1 tax, net of federal Part I deduction | 68 |
| 56 |
| 55 |
|
Goodwill write-down3 | 15 |
| — |
| — |
|
Intercompany sale of investment4 | — |
| 6 |
| 23 |
|
Non-taxable portion of gain on sale of investment to unrelated party5 | — |
| (61 | ) | — |
|
Valuation allowance6 | (17 | ) | 22 |
| 154 |
|
Intercorporate investment in EIPLP7 | 77 |
| — |
| — |
|
| Noncontrolling interests | (80 | ) | (15 | ) | (28 | ) |
Other8 | (19 | ) | 11 |
| (6 | ) |
| Income tax (recovery)/expense | (2,697 | ) | 142 |
| 170 |
|
| Effective income tax rate | (474.0 | )% | 5.8 | % | 1,545.5 | % |
| |
1 | The change in provincial and state income taxes from 2016 to 2017 reflects the increase in earnings from the Canadian operations and the impact of the United States tax reform on state income tax expense. |
| |
2 | The amount was due to the enactment of the “Tax Cuts and Jobs Act” by the United States on December 22, 2017, which included a reduction in the federal corporate income tax rate from 35% to 21% effective for taxation years beginning after December 31, 2017. |
| |
3 | The amount relates to the federal component of the tax effect a goodwill write-down pursuant to ASU 2017-04. |
| |
4 | In November 2016 and September 2015, certain assets were sold to entities under common control. The intercompany gains realized on these transfers were eliminated. However, because these transactions involved the sale of partnership units, tax consequences have been recognized in earnings. |
| |
5 | The amount in 2016 represents the federal component of the non-taxable portion of the gain on the sale of the South Prairie Region assets to unrelated party. |
| |
6 | The decrease from 2015 to 2016 is due to the federal component of the tax effect of a valuation allowance on the deferred tax assets related to an outside basis temporary difference that, in 2015, was no longer more likely than not to be realized. |
| |
7 | There was a change in assertion regarding the manner of recovery of the intercorporate investment in EIPLP such that deferred tax related to outside basis temporary differences was required to be recorded. |
| |
8 | 2015 included $17 million recovery related to the federal component of the tax effect of adjustments related to prior periods. |
9The amount includes the federal tax impact of impairment to Chapman Ranch in 2023 and Magic Valley in 2022 attributable to noncontrolling interests. Refer to Note 11 - Property, Plant and Equipment.
COMPONENTS OF PRETAX EARNINGS AND INCOME TAXES
| | | Year ended December 31, | 2017 |
| 2016 |
| 2015 |
| Year ended December 31, | 2023 | 2022 | 2021 |
| (millions of Canadian dollars) | |
| |
| |
| (millions of Canadian dollars) | | |
| Earnings/(loss) before income taxes | |
| |
| |
|
| Earnings before income taxes | | Earnings before income taxes | | |
| Canada | 2,200 |
| 2,034 |
| (1,365 | ) |
| United States | (2,431 | ) | (333 | ) | 808 |
|
| US | |
| Other | 800 |
| 750 |
| 568 |
|
| | 569 |
| 2,451 |
| 11 |
|
| Current income taxes | |
| |
| |
| Current income taxes | | |
| Canada | 129 |
| 74 |
| 157 |
|
| United States | 46 |
| 21 |
| 3 |
|
| US | |
| Other | 5 |
| 4 |
| 3 |
|
| | 180 |
| 99 |
| 163 |
|
| Deferred income taxes | |
| |
| |
| Deferred income taxes | | |
| Canada | 299 |
| 188 |
| (558 | ) |
| United States | (3,160 | ) | (151 | ) | 565 |
|
| US | |
| Other | (16 | ) | 6 |
| — |
|
| | (2,877 | ) | 43 |
| 7 |
|
Income tax (recovery)/expense
| (2,697 | ) | 142 |
| 170 |
|
| Income tax expense | |
A valuation allowance has been established for certain loss and credit carryforwards, and outside basis temporary differences on investments that reduce deferred income tax assets to an amount that will more likely than not be realized.
We have not provided for deferred income taxes on the difference between the carrying value of substantially all of our foreign subsidiaries and their corresponding tax basis as the earnings of those subsidiaries are intended to be permanently reinvested in their operations. As such, these investments are not anticipated to give rise to income taxes in the foreseeable future. The difference between the carrying values of the investments and their tax bases is largely a result of unremitted earnings and currency translation adjustments. The unremitted earnings and currency translation adjustment for which no deferred taxes have been recognized in respect of foreign subsidiaries were $2.1$6.6 billion and $4.1$8.0 billion for the periodperiods ended December 31, 20172023 and 2016,2022, respectively. If such earnings are remitted, in the form of dividends or otherwise, we may be subject to income taxes and foreign withholding taxes. The determination of the amount of unrecognized deferred income tax liabilities onapplicable to such amounts is not practicable.
We recognize accrued interest and penalties related to unrecognized tax benefits as a component of income taxes. IncomeInterest and penalties included in income taxes for theboth years ended December 31, 20172023 and 2016 included $3 million and2022 were a $1 million recoveries, respectively, of interest and penalties.expense. As at December 31, 20172023 and 2016,2022, interest and penalties of $8$14 million and $6$13 million, respectively, have been accrued.
25. PENSION AND OTHER POSTRETIREMENT BENEFITS
The following table details the changes in the projected benefit obligation, the fair value of plan assets and the recorded assetassets or liabilityliabilities for our defined benefit pension plans:
Pursuant to the requirements of Section 13 or 15(d) of the Securities Exchange Act of 1934, the registrant has duly caused this report to be signed on its behalf by the undersigned, thereunto duly authorized.
Pursuant to the requirements of the Securities Exchange Act of 1934, this report has been signed below on February 16, 20189, 2024 by the following persons on behalf of the registrant and in the capacities indicated.