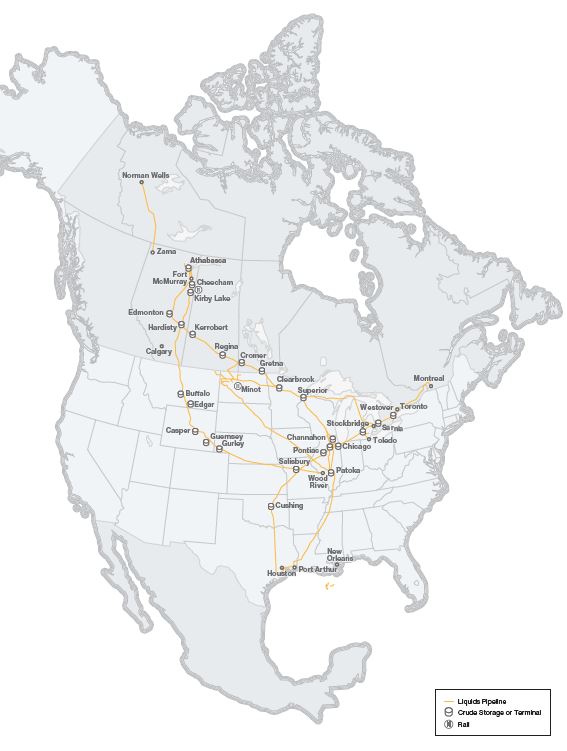
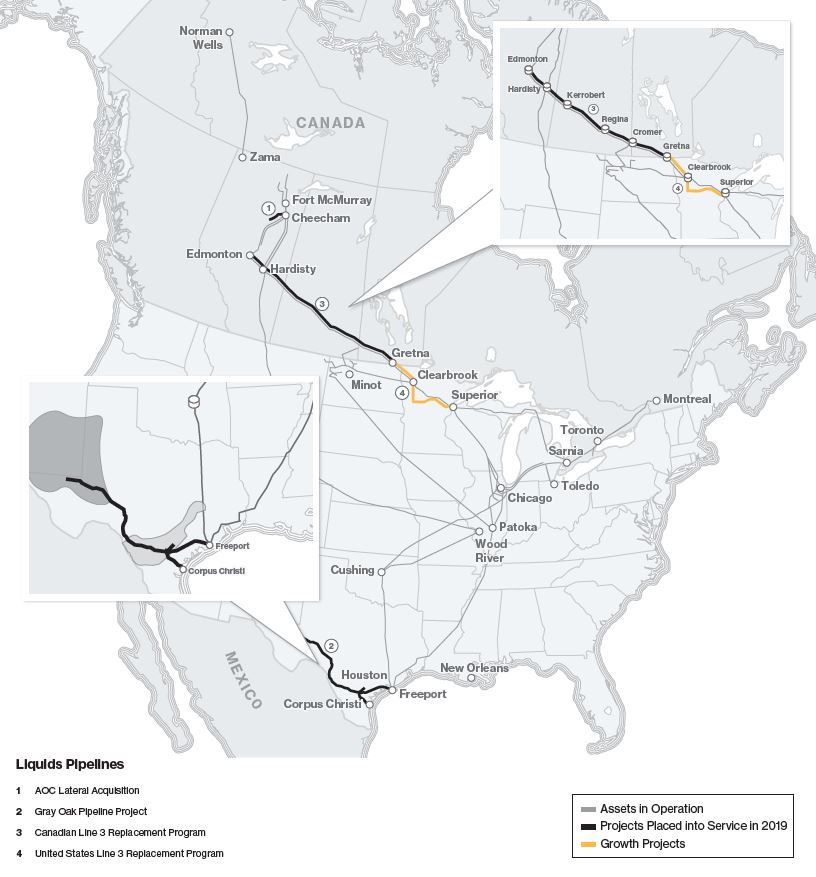
Liquids Pipelines consists of pipelines and related terminals in Canada and the United States that transport various grades of crude oil and other liquid hydrocarbons.
MAINLINE SYSTEM
The Mainline System is comprised of the Canadian Mainline and the Lakehead System. The Canadian Mainline is a common carrier pipeline system which transports various grades of oil and other liquid hydrocarbons within western Canada and from western Canada to the Canada/United States border near Gretna, Manitoba and Neche, North Dakota and from the United States/Canada border near Port Huron, Michigan and Sarnia, Ontario to eastern Canada and the northeastern United States. The Canadian Mainline includes six adjacent pipelines with a combined capacity of approximately 2.9 million barrels per day (bpd) that connect with the Lakehead System at the Canada/United States border, as well as five pipelines that deliver crude oil and refined products into eastern Canada and the northeastern United States. We have operated, and frequently expanded, the Canadian Mainline since 1949. The Lakehead System is the portion of the Mainline System in the United States. It is an interstate common carrier pipeline system regulated by FERC, and is the primary transporter of crude oil and liquid petroleum from western Canada to the United States.
Competitive Toll Settlement
The Competitive Toll Settlement (CTS) is the current framework governing tolls paid for products shipped on the Canadian Mainline, with the exception of Lines 8 and 9 which are tolled on a separate basis. The 10-year settlement was negotiated by representatives of Enbridge, the Canadian Association of Petroleum Producers and other shippers on the Canadian Mainline. It was approved by the Canada Energy Regulator (CER), formerly the National Energy Board on June 24, 2011 and took effect on July 1, 2011. The CTS provides for a Canadian Local Toll (CLT) for deliveries within western Canada, as well as an International Joint Tariff (IJT) for crude oil shipments originating in western Canada, on the Canadian Mainline, and delivered into the United States, via the Lakehead System, and into eastern Canada. The IJT tolls are denominated in United States dollars. The IJT is designed to provide shippers on the Mainline System with a stable and competitive long-term toll, thereby preserving and enhancing throughput on both the Canadian Mainline and the Lakehead System. The CLT and the IJT are adjusted annually, on July 1 of each year, at a rate equal to 75% of the Canadian Gross Domestic Product at Market Price Index published by Statistics Canada.
Although the CTS has a 10-year term, it does not require shippers to commit to certain volumes. Shippers nominate volumes on a monthly basis and we allocate capacity to maximize the efficiency of the Canadian Mainline.
Local tolls for service on the Lakehead System are not affected by the CTS and continue to be established pursuant to the Lakehead System’s existing toll agreements, as described below.Under the terms of the IJT agreement, the Canadian Mainline’s share of the IJT relating to pipeline transportation of a batch from any western Canada receipt point to the United States border is equal to the IJT applicable to that batch’s United States delivery point less the Lakehead System’s local toll to that delivery point. This amount is referred to as the Canadian Mainline IJT Residual Benchmark Toll and is denominated in United States dollars.
Lakehead System Local Tolls
Transportation rates are governed by the FERC for deliveries from the Canada/United States border near Neche, North Dakota, Clearbrook, Minnesota and other points to principal delivery points on the Lakehead System. The Lakehead System periodically adjusts these transportation rates as allowed under the FERC’s index methodology and tariff agreements, the main components of which are index rates and the Facilities Surcharge Mechanism. Index rates, the base portion of the transportation rates for the Lakehead System, are subject to an annual adjustment which cannot exceed established ceiling rates as approved by the FERC. The Facilities Surcharge Mechanism allows the Lakehead System to recover costs associated with certain shipper-requested projects through an incremental surcharge in addition to the existing index rates, and is subject to annual adjustment on April 1 of each year.
Mainline System Contracting
On December 19, 2019, we submitted an application to the CER to implement contracting on our Mainline System. The application for contracted and uncommitted service included the associated terms, conditions and tolls of each service, which would be offered in an open season following approval by the CER. The tolls and services would replace the current CTS that is in place until June 30, 2021. If a replacement agreement is not in place by that time, the CTS tolls will continue on an interim basis.
For further information, refer to Part II. Item 7. Management's Discussion and Analysis of Financial Condition and Results of Operations - Recent Developments - Mainline System Contracting.
REGIONAL OIL SANDS SYSTEM
The Regional Oil Sands System includes five intra-Alberta long-haul pipelines; the Athabasca Pipeline, Waupisoo Pipeline, Woodland Pipeline, Wood Buffalo Extension/Athabasca Twin pipeline system and the Norlite Pipeline System (Norlite), as well as two large terminals: the Athabasca Terminal located north of Fort McMurray, Alberta and the Cheecham Terminal, located south of Fort McMurray, Alberta. The Regional Oil Sands System also includes numerous laterals and related facilities which provide access for oil sands production to the system. The Regional Oil Sands System currently serves twelve producing oil sands projects.
The combined capacity of the intra-Alberta long-haul pipelines is approximately 930,000 bpd to Edmonton and 1,370,000 bpd into Hardisty, with Norlite providing approximately 218,000 bpd of diluent capacity into the Fort McMurray region. The Woodland Pipeline and Norlite are joint ventures, 50/50 between us and Imperial Oil Resources Ventures Limited and ExxonMobil Canada Properties, and 70/30 with Keyera Corp., respectively. The Regional Oil Sands System is anchored by long-term agreements with multiple oil sands producers that include provisions for the recovery of some of the operating costs of this system.
GULF COAST AND MID-CONTINENT
Gulf Coast includes Seaway Crude Pipeline System (Seaway Pipeline), Flanagan South Pipeline (Flanagan South), Spearhead Pipeline and Gray Oak Pipeline, as well as the Mid-Continent System comprised of the Cushing Terminal.
Seaway Pipeline
We have a 50% interest in the 1,078-kilometer (670-mile) Seaway Pipeline, including the 805-kilometer (500-mile), 30-inch diameter long-haul system between Cushing, Oklahoma and Freeport, Texas, as well as the Texas City Terminal and Distribution System which serve refineries in the Houston and Texas City areas. Seaway Pipeline also includes 8.8 million barrels of crude oil storage tank capacity on the Texas Gulf Coast.
The flow direction of Seaway Pipeline was reversed in 2012, enabling it to transport crude from the oversupplied hub in Cushing, Oklahoma to the Gulf Coast. Further pump station additions and modifications were completed in early 2013, increasing capacity available to shippers from an initial 150,000 bpd to approximately 400,000 bpd, depending on crude slate. In late 2014, a second line, the Seaway Pipeline Twin, was placed into service to more than double the existing capacity to 950,000 bpd. Seaway Pipeline also includes a 161-kilometer (100-mile) pipeline from the Enterprise Crude Houston crude oil terminal in Houston, Texas to the Port Arthur/Beaumont, Texas refining center.
Flanagan South
Flanagan South is a 950-kilometer (590-mile), 36-inch diameter interstate crude oil pipeline that originates at our terminal at Flanagan, Illinois, a delivery point on the Lakehead System, and terminates in Cushing, Oklahoma. Flanagan South and associated pumping stations were completed in the fourth quarter of 2014. Flanagan South has a capacity of approximately 600,000 bpd.
Spearhead Pipeline
Spearhead Pipeline is a long-haul pipeline that delivers crude oil from Flanagan, Illinois, a delivery point on the Lakehead System, to Cushing, Oklahoma. The Spearhead pipeline was originally placed into service in 2006 and has a capacity of approximately 193,000 bpd.
Gray Oak Pipeline
The Gray Oak pipeline is a 1,368-kilometer (850-mile) crude oil system, which runs from the Permian Basin in West Texas to the United States gulf coast. The Gray Oak pipeline has an expected average annual capacity of 900,000 bpd and transports light crude oil. We have an effective 22.8% interest in the pipeline. Initial in-service for the pipeline commenced in November 2019 with full in-service expected in the second quarter of 2020.
Mid-Continent System
The Mid-Continent System is comprised of storage terminals at Cushing, Oklahoma (Cushing Terminal), consisting of over 80 individual storage tanks ranging in size from 78,000 to 570,000 barrels. Total storage shell capacity of Cushing Terminal is approximately 20 million barrels. A portion of the storage facilities are used for operational purposes, while the remainder are contracted to various crude oil market participants for their term storage requirements.Contract fees include fixed monthly storage fees, throughput fees for receiving and delivering crude to and from connecting pipelines and terminals, as well as blending fees.
OTHER
Other includes Southern Lights Pipeline, Express-Platte System, Bakken System and Feeder Pipelines and Other.
Southern Lights Pipeline
Southern Lights Pipeline is a single stream pipeline that ships diluent from the Manhattan Terminal near Chicago, Illinois to three western Canadian delivery facilities, located at the Edmonton and Hardisty terminals in Alberta and the Kerrobert terminal in Saskatchewan. This 180,000 bpd 16/18/20-inch diameter pipeline was placed into service in 2010. Both the Canadian portion of Southern Lights Pipeline (Southern Lights Canada) and the United States portion of Southern Lights Pipeline (Southern Lights US) receive tariff revenues under long-term contracts with committed shippers. Southern Lights Pipeline capacity is 90% contracted with the remaining 10% of the capacity (18,000 bpd) assigned for shippers to ship uncommitted volumes.
Express-Platte System
The Express-Platte System consists of the Express pipeline and the Platte pipeline, and crude oil storage of approximately 5.6 million barrels. It is an approximate 2,736-kilometer (1,700-mile) crude oil transportation system, which begins in Hardisty, Alberta, and terminates in Wood River, Illinois. The Express pipeline carries crude oil to United States refining markets in the Rocky Mountains area, including Montana, Wyoming, Colorado and Utah. The Platte pipeline, which interconnects with the Express pipeline in Casper, Wyoming, transports crude oil predominantly from the Bakken shale and western Canada to refineries in the midwest. Express pipeline capacity is typically committed under long-term take-or-pay contracts with shippers. A small portion of Express pipeline capacity and all of the Platte pipeline capacity is used by uncommitted shippers who pay only for the pipeline capacity they actually use in a given month.
Bakken System
The Bakken System consists of the North Dakota System and the Bakken Pipeline System. The North Dakota System services the Bakken in North Dakota, and is comprised of a crude oil gathering and interstate pipeline transportation system. The gathering system provides delivery to Clearbrook, Minnesota for service on the Lakehead system or a variety of interconnecting pipeline and rail export facilities. The interstate portion of the system has both Unites States and Canadian components that extend from Berthold, North Dakota into Cromer, Manitoba.
Tariffs on the United States portion of the North Dakota System are governed by the FERC and include a local tariff. The Canadian portion is categorized as a Group 2 pipeline, and as such, its tolls are regulated by the CER on a complaint basis. Tolls on the interstate pipeline system are based on long-term take-or-pay agreements with anchor shippers.
We have an effective 27.6% interest in the Bakken Pipeline System, which connects the Bakken formation in North Dakota to markets in eastern PADD II and the United States Gulf Coast. The Bakken Pipeline System consists of the Dakota Access Pipeline from the Bakken area in North Dakota to Patoka, Illinois, and the Energy Transfer Crude Oil Pipeline from Patoka, Illinois to Nederland, Texas. Current capacity is 570,000 bpd of crude oil with the potential to be expanded through additional pumping horsepower. The Bakken Pipeline System is anchored by long-term throughput commitments from a number of producers.
Feeder Pipelines and Other
Feeder Pipelines and Other includes a number of liquids storage assets and pipeline systems in Canada and the United States.
Key assets included in Feeder Pipelines and Other are the Hardisty Contract Terminal and Hardisty Storage Caverns located near Hardisty, Alberta, a key crude oil pipeline hub in western Canada and the Southern Access Extension (SAX) pipeline which originates in Flanagan, Illinois and delivers to Patoka, Illinois. On July 1, 2014, Marathon executed an agreement with us to become an owner (35%) in SAX, thereby forming the Illinois Extension Pipeline Company (IEPC). We have a 65% ownership in IEPC. SAX was placed into service in December 2015 with the majority of its capacity commercially secured under long-term take-or-pay contracts with shippers.
Feeder Pipelines and Other also includes Patoka Storage, the Toledo pipelinesystem and the Norman Wells (NW) System. Patoka Storage is comprised of four storage tanks with 480,000 barrels of shell capacity located in Patoka, Illinois. The Toledo pipeline system connects with the Lakehead System and delivers to Ohio and Michigan. The NW System transports crude oil from Norman Wells in the Northwest Territories to Zama, Alberta and has a cost-of-service rate structure based on established terms with shippers.
COMPETITION
Other competing carriers available to ship western Canadian liquid hydrocarbons to markets in Canada, the United States and internationally represent competition to our liquids pipelines network. Competition amongst existing pipelines is based primarily on the cost of transportation, access to supply, the quality and reliability of service, contract carrier alternatives and proximity to markets.
Competition also arises from proposed pipelines that seek to access markets currently served by our liquids pipelines, such as proposed projects to the Gulf Coast and from proposed projects enhancing infrastructure in the Alberta regional oil sands market. The Mid-Continent and Bakken systems also face competition from existing pipelines, proposed future pipelines and existing and alternative gathering facilities. Competition for storage facilities in the United States includes large integrated oil companies and other midstream energy partnerships. Additionally, volatile crude price differentials and insufficient pipeline capacity on either our or competitors' pipelines can make transportation of crude oil by rail competitive, particularly to markets not currently serviced by pipelines.
We believe that our liquids pipelines continue to provide attractive options to producers in the Western Canadian Sedimentary Basin (WCSB) and North Dakota due to our competitive tolls and flexibility through our multiple delivery and storage points. We also employ long-term agreements with shippers, which mitigates competition risk by ensuring consistent supply to our liquids pipelines network. Our current complement of growth projects to expand market access and to enhance capacity on our pipeline system are expected to provide shippers reliable and long-term competitive solutions for liquids transportation. We have a proven track record of successfully executing projects to meet the needs of our customers and our existing right-of-way for the Mainline System also provides a competitive advantage as it can be difficult and costly to obtain rights-of-way for new pipelines traversing new areas. In addition, we are currently pursuing the offering of contracted service on the Mainline System which would further contribute to mitigating competition risk.
SUPPLY AND DEMAND
We have an established and successful history of being the largest transporter of crude oil to the United States, the world’s largest market for crude oil. While United States demand for Canadian crude oil production will support the use of our infrastructure for the foreseeable future, North American and global crude oil supply and demand fundamentals are shifting, and we have a role to play in this transition by developing long-term transportation options that enable the efficient flow of crude oil from supply regions to end-user markets.
The International Energy Agency 2019 World Energy Outlook indicated that upstream investment in 2019 demonstrated a continued upward trend. International prices weakened in 2019 compared to the previous year with United States tensions with China and continued supply growth outside of the Organization of Petroleum Exporting Countries (OPEC). World oil demand rose marginally over the year however, supply grew at a faster pace. The United States continued to increase its productive capacity, supported by its crude oil exports growing to over 3 million bpd in September 2019.
In western Canada, lack of export pipeline capacity resulted in the rapid buildup of inventories and discounts to the price of western Canadian crude. Western Canadian Select discounts peaked at over US$50 per barrel against West Texas Intermediate (WTI) in October 2018. This, in turn, resulted in the Alberta Government approving a plan to lease 4,400 rail cars to add approximately 120,000 bpd of rail export capacity for the industry by the end of 2020 and the adoption of a production curtailment policy directing the industry in the province to shut in 325,000 bpd starting January 1, 2019. The aim of this policy was to both draw down inventories by approximately 20 million barrels and return crude discounts to more historical norms. The policy calls for curtailment levels to be reduced as inventory levels decline and new pipeline and rail capacity come on line. Western Canadian crude prices responded almost immediately upon the release of the curtailment adoption notice, with discounts narrowing to approximately US$10 per barrel. The discount at this level would imply that rail is not financially attractive, and hence frustrating the government's efforts to draw down inventories. Rail movements dropped by more than 200,000 bpd between December 2018 and February 2019 as differentials were narrow enough that it was not economic to ship crude by rail in the first quarter of 2019. The differentials widened to above $10 per barrel in subsequent quarters to support the return of crude by rail. Throughout the year, the curtailment levels declined to a year end restriction of 75,000 bpd with an expectation that Alberta production volumes will continue to increase in 2020.
Notwithstanding the current price environment and Alberta policies, our Mainline System has thus far continued to be highly utilized. Mainline throughput as measured at the Canada/United States border at Gretna, Manitoba saw record deliveries of 2.845 million bpd in December 2019, slightly higher than our previous record in July 2019. The Mainline System continues to be subject to apportionment, as nominated volumes currently exceed capacity on portions of the system. The impact of a low crude oil price environment on the financial performance of our Liquids Pipelines business is expected to be relatively modest given the cost effectiveness of our Mainline toll and commercial arrangements which underpin many of the pipelines providing a significant measure of protection against volume fluctuations. Our Mainline System is well positioned to continue to provide safe and efficient transportation which will enable western Canadian and Bakken production to reach attractive markets in the United States and eastern Canada at a competitive cost relative to other alternatives.
The fundamentals of oil sands production and discounts for western Canadian crude have caused some sponsors to reconsider the timing of future projects. While recently updated forecasts continue to reflect long-term supply growth from the WCSB, the projected pace of growth is slower than previous forecasts as companies continue to assess the viability of capital investments in light of the current price environment and ongoing uncertainty with respect to the timing and completion of new pipeline systems proposed by our competitors.
Over the long term, continued growth in global energy consumption is expected to be primarily driven by emerging economies in regions outside theOrganization for Economic Cooperation and Development (OECD), mainly in India and China. In North America, demand growth for transportation fuels is expected to moderate due to vehicle fuel efficiencies and increasing sales of electric vehicles. Accordingly, there is a strategic opportunity to establish tide-water export facilities to service North American producers wanting access to global markets.
Global crude oil production is expected to continue to grow through 2035, primarily in North America, Brazil and OPEC. Growth in supply from OPEC is partly due to the expected recovery of Iraqi and Libyan production. Over the longer term, North American production from tight oil plays is expected to grow as technology continues to improve well productivity and efficiencies. The pace of growth in North America and level of investment in the WCSB could be tempered in future years by a number of factors including a sustained period of low crude oil prices and corresponding production decisions by OPEC, increasing environmental regulation and prolonged approval processes for new pipelines with access to tide-water for export or to United States markets.
In recent years, the combination of relatively flat domestic demand, growing supply and long lead time to build pipeline infrastructure led to a fundamental change in the North American crude oil landscape. The inability to move increasing inland supply to markets resulted in a divergence between WTI and world pricing, resulting in lower netbacks for North American producers. The impact of price differentials has been even more pronounced for western Canadian producers as insufficient pipeline infrastructure resulted in a further discounting of Alberta crude relative to WTI. Canadian pipeline export capacity is expected to remain fully utilized, resulting in continued apportionment on our Mainline System and incremental production utilizing non-pipeline transportation services (e.g. rail and trucks) until such time as sufficient pipeline capacity is made available. Over the longer term, however, we believe pipelines will continue to be the most reliable, safe and cost-effective means of transportation.
Our role in helping to address the evolving supply and demand fundamentals and alleviating price discounts for producers and supply costs to refiners is through optimization of throughput on our existing liquids pipelines systems and through investment in new pipelines and related infrastructure to provide expanded transportation capacity and sustainable connectivity to alternative markets. Progress on the development and construction of our commercially secured growth projects is discussed in Part II. Item 7.Management's Discussion and Analysis of Financial Condition and Results of Operations - Growth Projects - Commercially Secured Projects.
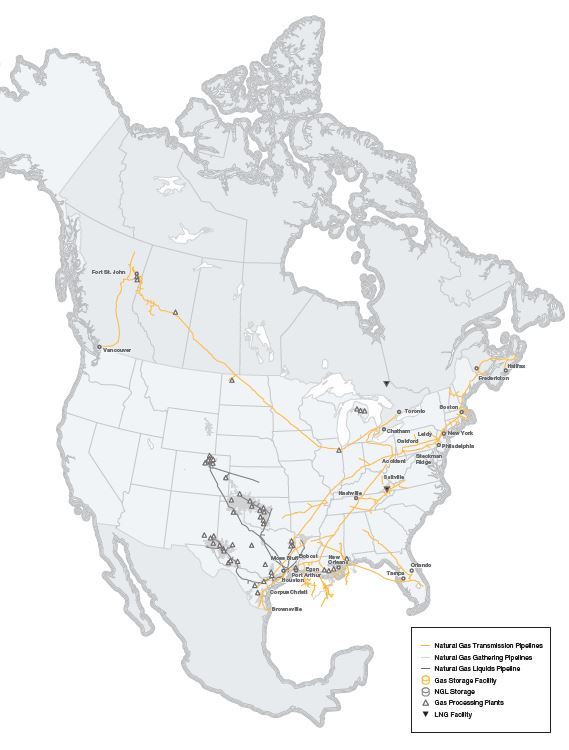
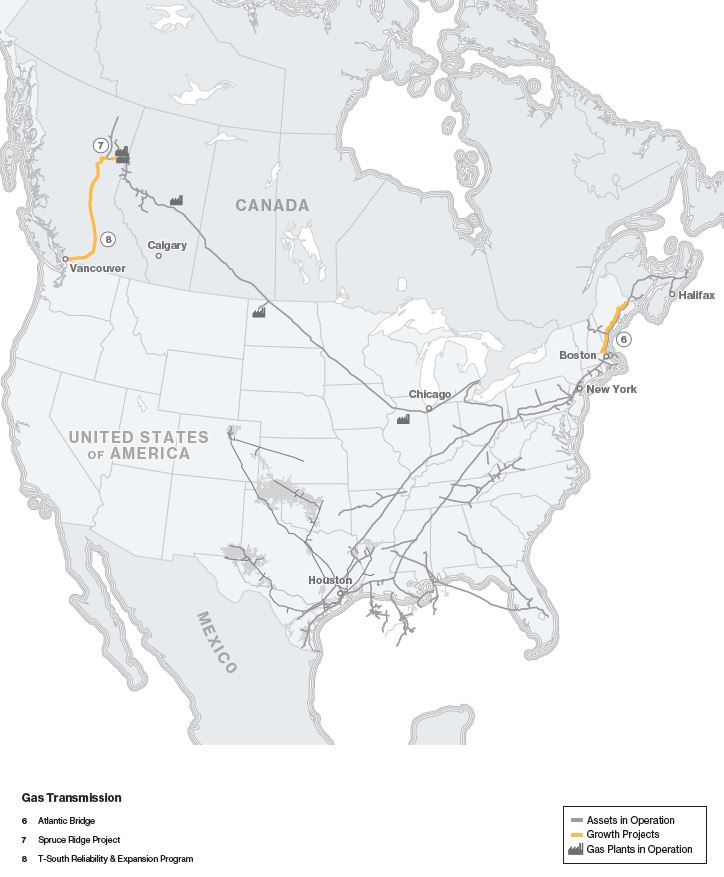
GAS TRANSMISSION AND MIDSTREAM
Gas Transmission and Midstream consists of our investments in natural gas pipelines and gathering and processing facilities in Canada and the United States, including US Gas Transmission, Canadian Gas Transmission, US Midstream and other assets.
US GAS TRANSMISSION
US Gas Transmission includes ownership interests in Texas Eastern, Algonquin, M&N U.S., East Tennessee, Gulfstream, Sabal Trail Transmission (Sabal Trail), NEXUS, Valley Crossing, Southeast Supply Header (SESH), Vector Pipeline L.P. (Vector) and certain other gas pipeline and storage assets. The US Gas Transmission business primarily provides transmission and storage of natural gas through interstate pipeline systems for customers in various regions of the northeastern, southern and midwestern United States.
The Texas Eastern natural gas transmission system extends approximately 2,735-kilometers (1,700-miles) from producing fields in the Gulf Coast region of Texas and Louisiana to Ohio, Pennsylvania, New Jersey and New York. Texas Eastern's onshore system consists of approximately 14,597-kilometers (9,070-miles) of pipeline and associated compressor stations. Texas Eastern is also connected to four affiliated storage facilities that are partially or wholly-owned by other entities within the US Gas Transmission business.
The Algonquin natural gas transmission system connects with Texas Eastern’s facilities in New Jersey and extends approximately 402-kilometers (250-miles) through New Jersey, New York, Connecticut, Rhode Island and Massachusetts where it connects to M&N U.S. The system consists of approximately 1,835-kilometers (1,140-miles) of pipeline with associated compressor stations. We have a 92% interest in the Algonquin natural gas transmission system.
M&N U.S. is an approximately 563-kilometer (350-mile) mainline interstate natural gas transmission system, including associated compressor stations, which extends from northeastern Massachusetts to the border of Canada near Baileyville, Maine. M&N U.S. is connected to the Canadian portion of the Maritimes & Northeast Pipeline system (M&N Canada) (see Gas Transmission and Midstream - Canadian Gas Transmission). We have a 78% interest in M&N U.S.
East Tennessee’s natural gas transmission system crosses Texas Eastern’s system at two locations in Tennessee and consists of two mainline systems totaling approximately 2,470-kilometers (1,535-miles) of pipeline in Tennessee, Georgia, North Carolina and Virginia, with associated compressor stations. East Tennessee has a LNG storage facility in Tennessee and also connects to the Saltville storage facilities in Virginia.
Gulfstream is an approximately 1,199-kilometer (745-mile) interstate natural gas transmission system with associated compressor stations, operated jointly with The Williams Companies, Inc. Gulfstream transports natural gas from Mississippi, Alabama, Louisiana and Texas, crossing the Gulf of Mexico to markets in central and southern Florida. We have a 50% interest in Gulfstream.
Sabal Trail is an approximately 829-kilometer (515-mile) pipeline that provides firm natural gas transportation to Florida Power & Light Company for its power generation needs and to a Duke Energy Florida natural gas plant. Facilities include a pipeline, laterals and various compressor stations. The pipeline infrastructure is located in Alabama, Georgia and Florida, and adds approximately 1.1 billion cubic feet per day (bcf/d) of new capacity enabling the access of onshore shale gas supplies once approved future expansions are completed. We have a 50% interest in Sabal Trail.
NEXUS is an approximately 410-kilometer (255-mile) interstate natural gas transmission system with associated compressor stations. NEXUS transports natural gas from our Texas Eastern system in Ohio to our Vector interstate pipeline in Michigan, with capacity of approximately 1.5 bcf/d. Through its interconnect with Vector, NEXUS provides a connection to Dawn Hub, the largest integrated underground storage facility in Canada and one of the largest in North America, located in southwestern Ontario adjacent to the Greater Toronto Area. We have a 50% interest in NEXUS.
Valley Crossing is an approximately 274-kilometer (170-mile) intrastate natural gas transmission system, with associated compressor stations. The pipeline infrastructure is located in Texas and provides market access of up to 2.6 bcf/d to the Comisión Federal de Electricidad, Mexico’s state-owned utility.
SESH is an approximately 467-kilometer (290-mile) natural gas transmission system with associated compressor stations, owned and operated jointly with Enable Gas Transmission, LLC. SESH extends from the Perryville Hub in northeastern Louisiana where the shale gas production of eastern Texas, northern Louisiana and Arkansas, along with conventional production, is reached from six major interconnections. SESH extends to Alabama, interconnecting with 14 major north-south pipelines and three high-deliverability storage facilities. We have a 50% interest in SESH.
Vector is a 560-kilometer (348-mile) pipeline that transports 1.3 bcf/d of natural gas from Joliet, Illinois in the Chicago area to parts of Indiana, Michigan and Ontario. We have a 60% interest in Vector.
Transmission and storage services are generally provided under firm agreements where customers reserve capacity in pipelines and storage facilities. The vast majority of these agreements provide for fixed reservation charges that are paid monthly regardless of the actual volumes transported on the pipelines or injected or withdrawn from our storage facilities, plus a small variable component that is based on volumes transported, injected or withdrawn, which is intended to recover variable costs.
Interruptible transmission and storage services are also available where customers can use capacity if it exists at the time of the request and are generally at a higher toll than long-term contracted rates. Interruptible revenues depend on the amount of volumes transported or stored and the associated rates for this service. Storage operations also provide a variety of other value-added services including natural gas parking, loaning and balancing services to meet customers’ needs.
CANADIAN GAS TRANSMISSION
On July 4, 2018, we entered into agreements to sell our British Columbia Field Services business to Brookfield Infrastructure Partners L.P. and its institutional partners. Separate agreements were entered into for those facilities governed by provincial regulations and those governed by federal regulations. On October 1, 2018, we closed the sale of the provincially regulated facilities and on December 31, 2019, we closed the sale of the federally regulated facilities. For further information, refer to Part II. Item 7. Management's Discussion and Analysis of Financial Condition and Results of Operations - Recent Developments - Asset Monetization and Item 8. Financial Statements and Supplementary Data - Note 8. Acquisitions and Dispositions.
On May 28, 2019, we completed the sale of our federally regulated natural gas gathering and processing assets in the Grizzly Valley area of British Columbia to Sukunka Natural Resources Inc., a subsidiary of Canadian Natural Resources Limited.
Canadian Gas Transmission still includes British Columbia Pipeline, M&N Canada, Alliance Pipeline and certain other midstream gas pipelines, gathering, processing and storage assets.
British Columbia Pipeline has approximately 2,900-kilometers (1,800-miles) of transmission pipeline in British Columbia and Alberta, as well as associated mainline compressor stations and provides fee-for-service based natural gas transmission services.
M&N Canada is an approximately 885-kilometer (550-mile) interprovincial natural gas transmission mainline system which extends from Goldboro, Nova Scotia to the United States border near Baileyville, Maine. M&N Canada is connected to M&N U.S. For further information, refer to Gas Transmission and Midstream - US Gas Transmission. We have a 78% interest in M&N Canada.
Alliance Pipeline is a 3,000-kilometer (1,864-mile) integrated, high-pressure natural gas transmission pipeline and approximately 860-kilometers (534-miles) of lateral pipelines and related infrastructure. It transports liquids-rich natural gas from northeast British Columbia, northwest Alberta and the Bakken area in North Dakota to the Alliance Chicago gas exchange hub downstream of the Aux Sable NGL extraction and fractionation plant at Channahon, Illinois. The majority of transportation services provided by Alliance Pipeline are under firm agreements, which provide for fixed reservation charges that are paid monthly regardless of actual volumes transported on the pipeline. Alliance Pipeline also provides interruptible transmission services where customers can use capacity if it is available at the time of request. We have a 50% interest in Alliance Pipeline.
The majority of transportation services provided by Canadian Gas Transmission are under firm agreements, which provide for fixed reservation charges that are paid monthly regardless of actual volumes transported on the pipeline, plus a small variable component that is based on volumes transported to recover variable costs. Canadian Gas Transmission also provides interruptible transmission services where customers can use capacity if it is available at the time of request. Payments under these services are based on volumes transported.
US MIDSTREAM
US Midstream includes a 42.7% interest in each of Aux Sable Liquid Products LP and Aux Sable Midstream LLC, and a 50% interest in Aux Sable Canada LP (collectively, Aux Sable). Aux Sable Liquid Products LP owns and operates an NGL extraction and fractionation plant at Channahon, Illinois, outside Chicago, near the terminus of Alliance Pipeline. Aux Sable also owns facilities upstream of Alliance Pipeline that facilitate deliveries of liquids-rich gas volumes into the pipeline for further processing at the Aux Sable plant. These facilities include the Palermo Conditioning Plant and the Prairie Rose Pipeline in the Bakken area of North Dakota, owned and operated by Aux Sable Midstream US; and Aux Sable Canada’s interests in the Montney area of British Columbia, comprising the Septimus Pipeline and the Septimus and Wilder Gas Plants.
US Midstream also includes a 50% investment in DCP Midstream, LLC (DCP Midstream), which indirectly owns approximately 57% of DCP Midstream, LP, including limited partner and general partner interests. DCP Midstream, LP is a master limited partnership, with a diversified portfolio of assets, engaged in the business of gathering, compressing, treating, processing, transporting, storing and selling natural gas; producing, fractionating, transporting, storing and selling NGLs; and recovering and selling condensate. DCP Midstream, LP owns and operates more than 49 plants and approximately 99,780-kilometers (62,000-miles) of natural gas and natural gas liquids pipelines, with operations in 17 states across major producing regions.
OTHER
Other consists primarily of our offshore assets. Enbridge Offshore Pipelines is comprised of 11 active natural gas gathering and FERC regulated transmission pipelines and four active oil pipelines. These pipelines are located in four major corridors in the Gulf of Mexico, extending to deepwater developments, and include almost 2,100-kilometers (1,300-miles) of underwater pipe and onshore facilities with total capacity of approximately 6.5 bcf/d.
COMPETITION
Our natural gas transmission and storage businesses compete with similar facilities that serve our supply and market areas in the transmission and storage of natural gas. The flow pattern of natural gas is changing across North America due to emerging supply sources and evolving demand centers, which creates competition for growth opportunities. The principal elements of competition are location, rates, terms of service, flexibility and reliability of service.
The natural gas transported in our business competes with other forms of energy available to our customers and end-users, including electricity, coal, propane, fuel oils, and renewable energy. Factors that influence the demand for natural gas include price changes, the availability of natural gas and other forms of energy, levels of business activity, long-term economic conditions, conservation, legislation, governmental regulations, the ability to convert to alternative fuels, weather and other factors.
Competition exists in all of the markets our businesses serve. Competitors include interstate and intrastate pipelines or their affiliates and other midstream businesses that transport, gather, treat, process and market natural gas or NGLs. Because pipelines are generally the most efficient mode of transportation for natural gas over land, the most significant competitors of our natural gas pipelines are other pipeline companies.
SUPPLY AND DEMAND
Our gas transmission assets make up one of the largest natural gas transportation networks in North America, driving connectivity between prolific supply basins and major demand centers within the continent. Our systems have been integral to the transition in natural gas fundamentals over the last decade, and will continue to play a part as the energy landscape evolves. Shifts in production and consumption, both domestic and foreign, will require that we continue to serve as a critical link between markets.
In 2010, natural gas production in each of the Appalachian and Permian basins were less than 5.0 bcf/d each. Today, these regions produce more than 50.0 bcf/d of natural gas on a combined basis. Improved technology and increased shale gas drilling has increased the supply of low-cost natural gas. As well, there has been and continues to be a corresponding increase in demand for our natural gas infrastructure in North America. Through a series of expansions and reversals on our core systems, combined with the execution of greenfield projects and strategic acquisitions, we have been able to meet the needs of producers and consumers alike. Our US Gas Transmission systems were initially designed to transport natural gas from the Gulf Coast to the supply starved northeast markets. Our asset base now has the capability to transport diverse supply to the northeast, southeast, midwest, and gulf coast markets on a fully subscribed and highly utilized basis.
The northeast market continues its role as a predominantly supply constrained region with steady growth. Natural gas demand in the northeast is expected to grow by 2.5 bcf/d through 2040, driven by continued commercial and residential load growth. Natural gas leads the fuel mix of the Independent System Operator New England market at more than 40 percent. The bidirectional capabilities offered by our system allow us to deliver both domestic and imported supplies to our regional customers, 75 percent of whom are end users with a contract renewal rate of over 99 percent. The region has seen an increase in natural gas supply due to the development of the Marcellus and Utica shales in the Appalachia region.
Demand for natural gas in the southeast region is forecast to increase by 4.0 bcf/d through 2040. Generating capacity in Florida is expected to grow 15 percent by 2026, the majority of which is projected to be natural gas-fired. The southeast market is linked to multiple, highly liquid supply pools that include the Marcellus and Utica shale developments, offering consistent supply and stable pricing to a growing population of end-use customers across our multiple systems under long term, utility-like arrangements.
With connectivity to Appalachian and western Canadian supply through our systems, the midwest market has access to two of the lowest cost gas producing regions on the continent. As demand in the region is expected to continue to grow by approximately 3.0 bcf/d over the next two decades, maintaining this link will remain important. Flexibility in supply for this market is especially critical to maintaining liquidity and price stability as natural gas continues to replace coal-fired generation.
Gulf coast demand growth is being driven by an ongoing wave of gas-intensive petrochemical facilities which are now starting to enter service, along with power generation, an increase in the volume of LNG exports and additional pipeline exports to Mexico. Demand in the region is anticipated to grow by more than 19.0 bcf/d through 2040. The gulf coast market has been the beneficiary of low cost capacity on our assets as the relationship between supply and market centers has shifted. Such cost effective capacity is difficult to access or replicate, offering existing shippers and transporters stability of capacity and utilization. Tide water market access and proximity to Mexico continue to make this region a platform of global trade as pipeline, LNG and Liquefied Petroleum Gas (LPG) exports see strong growth. The United States exported approximately 4.0 bcf/d of natural gas from the gulf coast region at the end of 2019 with an export capacity of approximately 10.0 bcf/d scheduled to be in service by 2021.
Despite there being strong growth in both supply and demand in the United States, a lack of adequate transportation capacity has placed downward pressure on local natural gas pricing. The Appalachian Basin has seen price differentials of $1.00 to $2.00 per million British Thermal Units (MMBtu) relative to Henry Hub in the gulf coast over the last few years. Unlike the dry gas production of the Marcellus, natural gas production growth in the Permian Basin is a result of robust crude oil production taking place in the region. Associated gas supplies from the region increased by approximately 10.0 bcf/d over the past two years and growth is forecasted to continue for the next decade. Until new natural gas transportation capacity begins to come online through the early 2020s, the natural gas prices in the region will continue to remain low relative to other producing regions.
Western Canada is experiencing a similar phenomenon to that of the Permian, with the local markets experiencing very low or even negative prices for natural gas as transportation bottlenecks continue. One of the few vital links to demand centers in the pacific northwest are our own systems in the region which operate near full capacity. As demand for supply out of the WCSB continues to grow, driven largely by NGL production and local oil sands production, the need for new natural gas and NGL infrastructure will continue to rise.
Global energy demand is expected to increase approximately 25 percent by 2040, according to the International Energy Agency, driven primarily by economic growth in non-OECD countries. Natural gas will play an important role in meeting this energy demand as gas consumption is anticipated to grow by approximately 40 percent during this period as one of the world’s fastest growing energy sources. North American exports will play a significant part in meeting global demand, underscoring the ability of our assets to remain highly utilized by shippers, and highlighting the need for incremental transportation solutions across North America. In response to these global fundamentals, we believe we are well positioned to provide value-added solutions to shippers. We are responding to the need for regional infrastructure with additional investments in Canadian and United States gas transportation facilities. Progress on the development and construction of our commercially secured growth projects is discussed in Part II. Item 7. Management’s Discussion and Analysis of Financial Condition and Results of Operations - Growth Projects - Commercially Secured Projects.
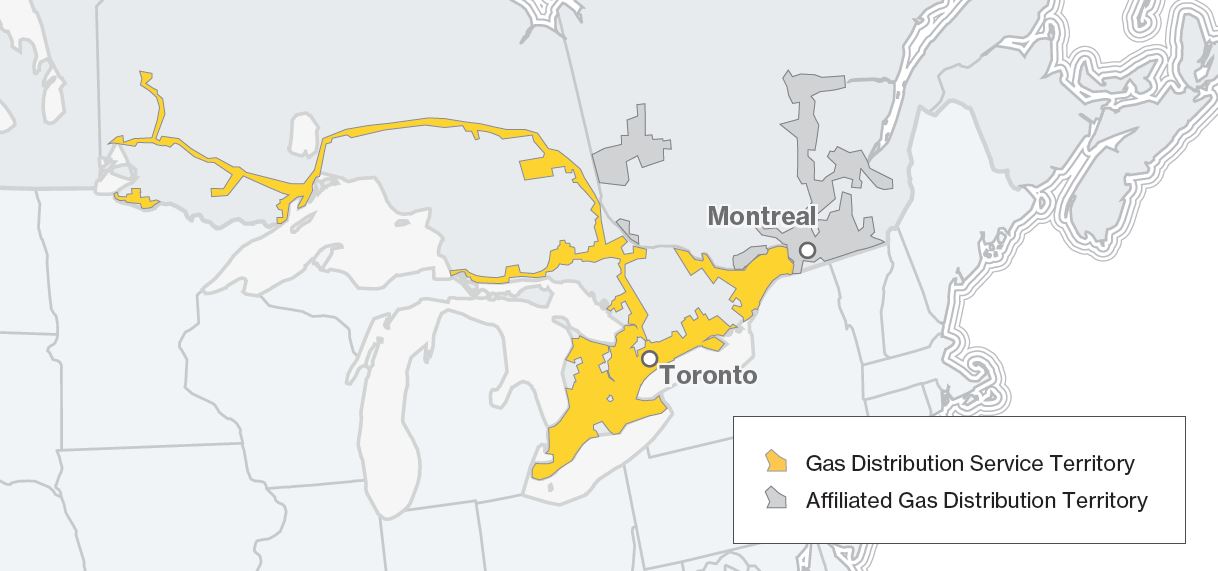
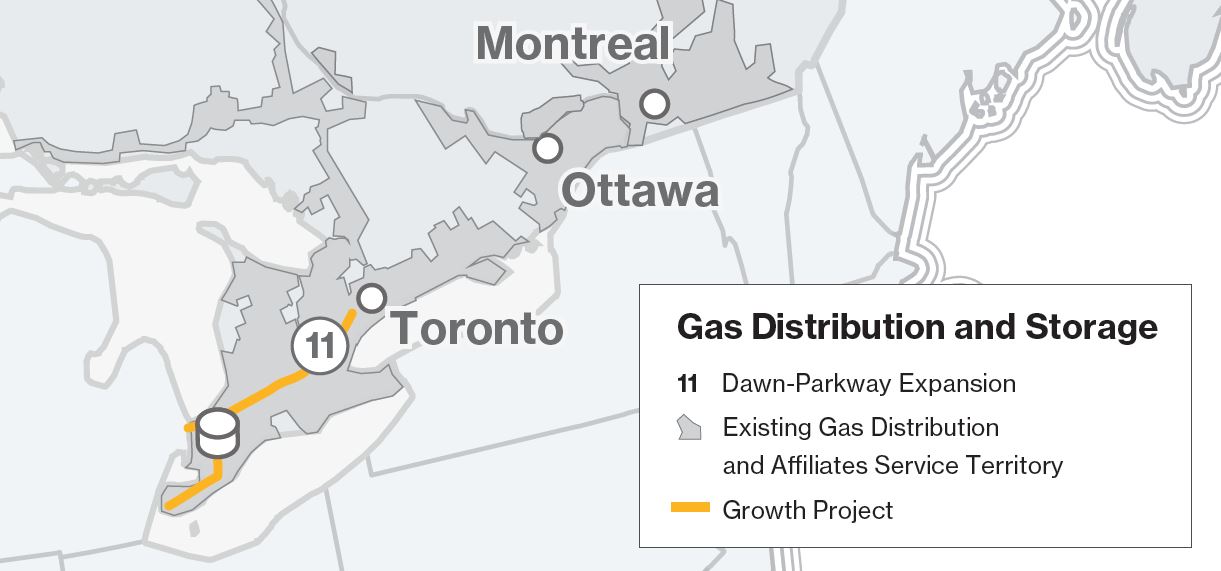
GAS DISTRIBUTION AND STORAGE
Gas Distribution and Storage consists of our natural gas utility operations, the core of which is Enbridge Gas Inc. (Enbridge Gas), which serves residential, commercial and industrial customers throughout Ontario. This business segment also includes natural gas distribution activities in Québec and an investment in Noverco Inc. (Noverco).
Enbridge Gas Distribution Inc. (EGD) and Union Gas Limited (Union Gas) were amalgamated on January 1, 2019. The amalgamated company has continued as Enbridge Gas. The amalgamation creates the single largest natural gas utility in North America in terms of send-out volumes, and third largest in terms of number of customers. We expect that the ongoing amalgamation will drive efficiencies and synergies, leverage greater supply-chain strength, create new opportunities for growth and form a stronger platform to deliver strong, provide predictable returns to shareholders and superior value and service to customers.
On October 1, 2019, we closed the sale of Enbridge Gas New Brunswick Inc. (EGNB) to Liberty Utilities (Canada) LP and on November 1, 2019, we closed the sale of St. Lawrence Gas Company, Inc. to Liberty Utilities Co., both wholly-owned subsidiaries of Algonquin Power & Utilities Corp. For further information, refer to Part II. Item 7. Management's Discussion and Analysis of Financial Condition and Results of Operations - Recent Developments - Asset Monetization and Item 8. Financial Statements and Supplementary Data - Note 8. Acquisitions and Dispositions.
ENBRIDGE GAS
Enbridge Gas is a rate-regulated natural gas distribution utility with storage and transmission services and has been in operation for approximately 170 years. Enbridge Gas serves approximately 3.8 million residential, commercial and industrial customers across Ontario.
There are three principal interrelated aspects of the natural gas distribution business in which Enbridge Gas is directly involved: Distribution, Transportation and Storage.
Distribution
Enbridge Gas’ principal source of revenue arises from distribution of natural gas to customers. The services provided to residential, small commercial and industrial heating customers are primarily on a general service basis, without a specific fixed-term or fixed-price contract. The services provided to larger commercial and industrial customers are usually on an annual contract basis under firm or interruptible service contracts. Under a firm contract, Enbridge Gas is obligated to deliver natural gas to the customer up to a maximum daily volume. The service provided under an interruptible contract is similar to that of a firm contract, except that it allows for service interruption at Enbridge Gas’ option to meet seasonal or peak demands. The Ontario Energy Board (OEB) approves rates for both contract and general services. The distribution system consists of approximately 151,000-kilometers (93,800-miles) of pipelines that carry natural gas from the point of local supply to customers.
Customers have a choice with respect to natural gas supply. Customers may purchase and deliver their own natural gas into Enbridge Gas’ distribution system or alternatively they may choose a system supply option, whereby customers purchase natural gas from Enbridge Gas’ supply portfolio. To acquire the necessary volume of natural gas to serve its customers, Enbridge Gas maintains a diversified natural gas supply portfolio, acquiring supplies on a delivered basis in Ontario, as well as acquiring supply from multiple supply basins across North America.
Transportation
Enbridge Gas contracts for firm transportation service, primarily with TransCanada Pipelines Limited (TransCanada), Vector Pipeline Limited Partnership and NEXUS Gas Transmission Pipeline, to meet its annual natural gas supply requirements. The transportation service contracts are not directly linked with any particular source of natural gas supply. Separating transportation contracts from natural gas supply allows Enbridge Gas flexibility in obtaining its own natural gas supply and accommodating the requests of its direct purchase customers for assignment of TransCanada capacity. Enbridge Gas forecasts the natural gas supply needs of its customers, including the associated transportation and storage requirements.
In addition to contracting for transportation service, Enbridge Gas offers firm and interruptible transportation services on its own Dawn-Parkway pipeline system. Enbridge Gas’ transmission system consists of approximately 5,500-kilometers (3,418-miles) of high-pressure pipeline, five mainline compressor stations and has an effective peak daily demand capacity of 7.6 bcf/d. Enbridge Gas’ transmission system also links an extensive network of underground storage pools at the Tecumseh Gas Storage facility and Dawn Hub (collectively, Dawn) to major Canadian and United States markets, and forms an important link in moving natural gas from western Canada and United States supply basins to central Canadian and northeastern United States markets.
As the supply of natural gas in areas close to Ontario continues to grow, there is an increased demand to access these diverse supplies at Dawn and transport them along the Dawn-Parkway pipeline system to markets in Ontario, eastern Canada and the northeastern United States. Enbridge Gas delivered 1,860 Bcf of gas through its distribution and transmission system in 2019. A substantial amount of Enbridge Gas’ transportation revenue is generated by fixed annual demand charges, with the average length of a long-term contract being approximately 13 years and the longest remaining contract term being 21 years.
Storage
Enbridge Gas’ business is highly seasonal as daily market demand for natural gas fluctuates with changes in weather, with peak consumption occurring in the winter months. Utilization of storage facilities permits Enbridge Gas to take delivery of natural gas on favorable terms during off peak summer periods for subsequent use during the winter heating season. This practice permits Enbridge Gas to minimize the annual cost of transportation of natural gas from its supply basins, assists in reducing its overall cost of natural gas supply and adds a measure of security in the event of any short-term interruption of transportation of natural gas to Enbridge Gas’ franchise areas.
Enbridge Gas’ storage facility at Dawn is located in southwestern Ontario, and has a total working capacity of approximately 272 bcf in 34 underground facilities located in depleted gas fields. Dawn is the largest integrated underground storage facility in Canada and one of the largest in North America. Approximately 181 bcf, at their respective current heat values, of the total working capacity is available to Enbridge Gas for utility operations. Enbridge Gas also has storage contracts with third parties for 17 bcf of storage capacity.
Dawn offers customers an important link in the movement of natural gas from western Canadian and United States supply basins to markets in central Canada and the northeast United States. Dawn's configuration provides flexibility for injections, withdrawals and cycling. Customers can purchase both firm and interruptible storage services at Dawn. Dawn offers customers a wide range of market choices and options with easy access to upstream and downstream markets. During 2019, Dawn provided services such as storage, balancing, gas loans, transport, exchange and peaking services to over 200 counterparties.
A substantial amount of Enbridge Gas’ storage revenue is generated by fixed annual demand charges, with the average length of a long-term contract being approximately four years and the longest remaining contract term being 17 years.
NOVERCO
Noverco is a holding company that wholly-owns Énergir, LP (Energir), formerly known as Gaz Metro Limited Partnership, a natural gas distribution company operating in the province of Quebec, with interests in subsidiary companies operating gas transmission, gas distribution and power distribution businesses in the Province of Québec and the State of Vermont. Energir serves approximately 525,000 residential and industrial customers and is regulated by the Québec Régie de l’énergie and the Vermont Public Utility Commission. Noverco also holds, directly and indirectly, an investment in our common shares. We own an equity interest in Noverco through ownership of 38.9% of its common shares and an investment in its preferred shares.
GAZIFÈRE
We wholly own Gazifère, a natural gas distribution company that serves approximately 43,000 customers in western Québec, a market not served by Energir. Gazifère is regulated by the Québec Régie de l’énergie.
COMPETITON
Enbridge Gas’ distribution system is regulated by the OEB and is subject to regulation in a number of areas, including rates. Enbridge Gas is not generally subject to third-party competition within its distribution franchise areas.
Enbridge Gas competes with other forms of energy available to its customers and end-users, including electricity, coal, propane and fuel oils. Factors that influence the demand for natural gas include weather, price changes, the availability of natural gas and other forms of energy, the level of business activity, conservation, legislation, governmental regulations, the ability to convert to alternative fuels and other factors.
SUPPLY AND DEMAND
We expect that demand for natural gas in North America will continue to see low annual growth over the long term with continued growth in peak day demands. Some modest growth driven by low natural gas prices is expected to continue given the significant price advantage relative to alternate energy options, with specific interest coming from communities that are not currently serviced by natural gas. Enbridge Gas continues to focus on promoting conservation and energy efficiency by undertaking activities focused on reducing natural gas consumption through various demand side management programs offered across all markets. We expect demand for natural gas in the greater Toronto metropolitan area to continue to grow due to favorable population growth supplemented by the expansion of other communities served by our system.
The storage and transportation marketplace continues to respond to changing natural gas supply dynamics including a robust supply environment. In recent years, the robust North American gas supply balance, due mainly to the development of shale gas volumes including the Alberta, British Columbia, Marcellus and Utica shale areas, has resulted in lower commodity prices and narrower seasonal price spreads. Unregulated storage values are primarily determined based on the difference in value between winter and summer natural gas prices. Storage values have been relatively stable to slightly rising as the North American natural gas supply and demand slowly returned to a more balanced position.
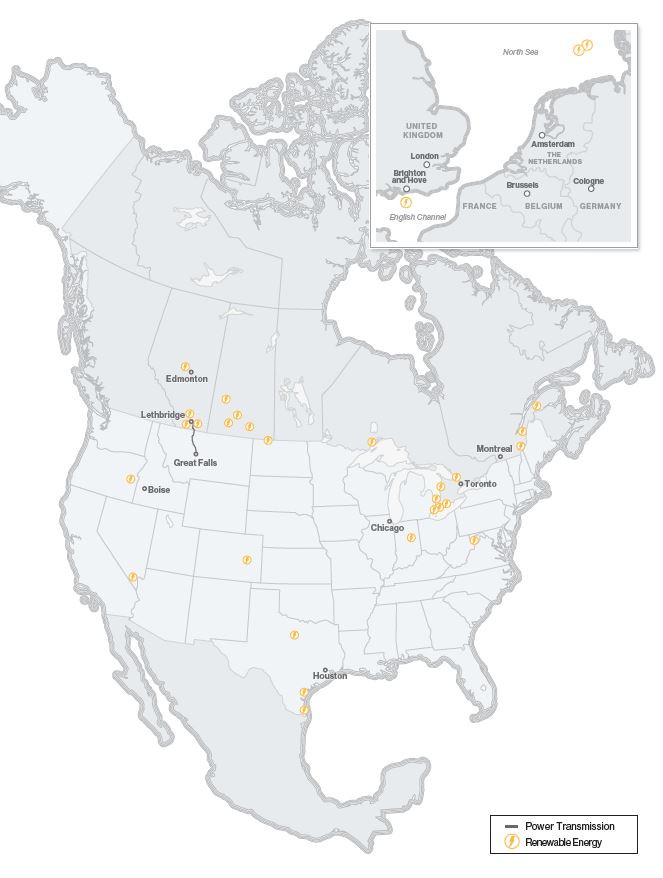
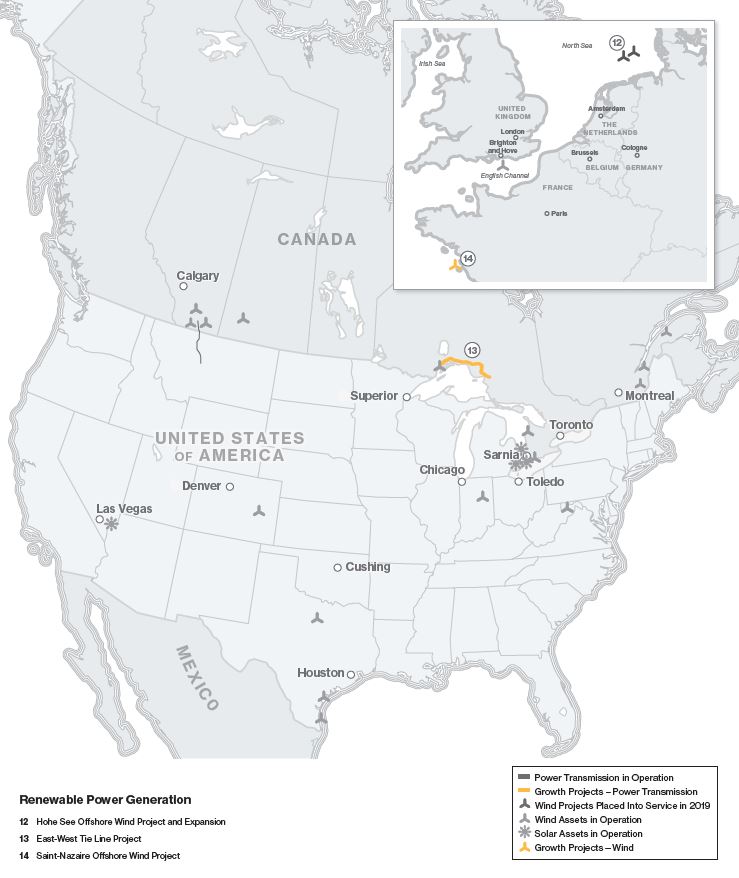
RENEWABLE POWER GENERATION
Renewable Power Generation consists primarily of investments in wind and solar assets, as well as geothermal, waste heat recovery, and transmission assets. In North America, assets are primarily located in the provinces of Alberta, Saskatchewan, Ontario, and Québec and in the states of Colorado, Texas, Indiana and West Virginia. In Europe, Enbridge holds equity interests in operating offshore wind facilities in the coastal waters of the United Kingdom and Germany, as well as in several projects under active development in France. Further, we are pursuing new European development opportunities through Maple Power Ltd., a joint venture in which we hold a 50% interest.
Combined Renewable Power Generation investments represent approximately 1,991 MW of net generation capacity. Of this amount, approximately:
1,392 MW is generated by North American wind facilities;
255 MW is generated by European offshore wind facilities;
240 MW is generated by the Saint-Nazaire Offshore Wind project, currently under construction; and
78 MW is generated by North American solar facilities.
The vast majority of the power produced from these wind facilities is sold under long-term power purchase agreements.
Renewable Power Generation includes the Montana-Alberta Tie-Line (MATL), a 300 MW transmission line which runs from Great Falls, Montana to Lethbridge, Alberta. In the fourth quarter of 2019, we committed to a plan to sell the MATL transmission assets. The purchase and sale agreement was signed in January 2020. Subject to certain regulatory approvals and customary closing conditions, the transaction is expected to close in the first quarter of 2020.
JOINT VENTURES / EQUITY INVESTMENTS
Effective August 1, 2018, the investments in the Canadian renewable assets and two of the United States renewable assets are held within a joint venture in which we maintain a 51% interest and continue to manage, operate, and provide administrative support.
We also own interests in European offshore wind facilities through the following joint ventures:
| | | | |
| |
• | | a 24.9% interest in Rampion Offshore, located in the United Kingdom, which went into service April 2018;
|
| |
• | a 25% interest in Hohe See Offshore and its subsequent expansion, located in Germany, which went into service October 2019 and January 2020, respectively; and
|
a 50% interest in the Saint-Nazaire Offshore Wind project, located in France, that is currently under construction.
COMPETITION
Our Renewable Power Generation assets operate in the North American and European power markets, which are subject to competition and supply and demand fundamentals for power in the jurisdictions in which they operate. The majority of revenue is generated pursuant to long-term power purchase agreements or has been substantially hedged. As such, the financial performance is not significantly impacted by fluctuating power prices arising from supply/demand imbalances or the actions of competing facilities during the term of the applicable contracts. However, the renewable energy sector includes large utilities, small independent power producers and private equity investors, which are expected to aggressively compete for new project development opportunities and for the right to supply customers when contracts expire.
To grow in an environment of heightened competition, we strategically seek opportunities to collaborate with well-established renewable power developers and financial partners and to target regions with commercial constructs consistent with our low risk business model. In addition, we bring to bear the expertise of completing and delivering large scale infrastructure projects.
SUPPLY AND DEMAND
The renewable power generation network in North America is expected to undergo significant growth over the next 20 years due to the replacement of older sources of electricity generation. On the demand side, North American economic growth over the longer term is expected to drive growing electricity demand, although continued efficiency gains are expected to make the economy less energy-intensive and temper demand growth. On the supply side, legislation is expected to accelerate the retirement of aging coal-fired generation plants, resulting in a requirement for significant new generation capacity and extending project lives and/or power purchase agreements of preferred technologies. While coal and nuclear facilities will continue to be core components of power generation in North America, gas-fired and renewable energy facilities, including biomass, hydro, solar and wind (the latter of which make up the bulk of our assets), are expected to be the preferred sources to replace coal-fired generation due to their lower carbon intensities. In addition, changes in the administration in the jurisdictions within which we operate, or in societal views, could result in a significant policy shift or pressure to accelerate low carbon transition.
In the near-term, uncertainty over the availability of tax or other government incentives in various jurisdictions, the ability to secure long-term power purchase agreements through government or investor-owned power authorities and low market prices of electricity may hinder the pace of future new renewable capacity development. However, continued improvement in technology and manufacturing capacity in the past few years has reduced capital costs and improved yield factors associated with renewable energy generation. These positive developments are expected to render renewable energy more competitive and support ongoing investment over the long-term, regardless of available incentives. Related growth opportunities could include repowering projects to increase output from and extend project-life of our existing facilities.
In Europe, the renewable energy outlook is positive, especially for offshore wind in countries with long coastlines and densely populated areas. According to the European Wind Energy Association, by 2030, wind energy capacity in Europe is expected to be 320 Gigawatts (GW), including 66 GW of offshore capacity as compared to 18.5 GW at the end of 2018.There is also wide public support for carbon reduction targets and broader adoption of renewable generation across all governmental levels. We, through our European joint ventures, continue to invest in offshore wind projects in the United Kingdom, France, and Germany to meet the growing demand.
ENERGY SERVICES
The Energy Services businesses in Canada and the United States undertake physical commodity marketing activity and logistical services to manage our volume commitments on various pipeline systems. Energy Services provides energy marketing services to North American refiners, producers, and other customers.
Energy Services is primarily focused on servicing customers across the value chain and capturing value from quality, time, and location price differentials when opportunities arise. To execute these strategies, Energy Services transports and stores on both Enbridge-owned and third party assets using a combination of contracted long-term and short-term pipeline, storage tank, railcar, and truck capacity agreements.
COMPETITION
Energy Services’ earnings are primarily generated from arbitrage opportunities which, by their nature, can be replicated by competitors. An increase in market participants entering into similar arbitrage strategies could have an impact on our earnings. Efforts to mitigate competition risk include diversification of the marketing business by transacting at the majority of major hubs in North America and establishing long-term relationships with clients and pipelines.
ELIMINATIONS AND OTHER
Eliminations and Other includes operating and administrative costs and the impact of foreign exchange hedge settlements, which are not allocated to business segments. Eliminations and Other also includes new business development activities and corporate investments.
OPERATIONAL, ENVIRONMENTAL AND ECONOMIC REGULATION
LIQUIDS PIPELINES
Operational Regulation
We are subject to numerous operational rules and regulations mandated by governments or applicable regulatory authorities, breaches of which could result in fines, penalties, operating restrictions and an overall increase in operating and compliance costs.
In the United States, our interstate pipeline operations are subject to pipeline safety laws and regulations administered by the Pipeline and Hazardous Materials Safety Administration (PHMSA) of the United States Department of Transportation (DOT). These laws and regulations require us to comply with a significant set of requirements for the design, construction, maintenance and operation of our interstate pipelines. These laws and regulations, among other things, include requirements to monitor and maintain the integrity of our pipelines and determine the pressures at which our pipelines can operate.
PHMSA has designed an Integrity Verification Process intended to create standards to verify maximum allowable operating pressure, and to improve and expand integrity management processes. Additionally, PHMSA has established standards for storage facilities. There remains uncertainty as to how these standards will be implemented, but it is expected that the changes will impose additional costs on new pipeline projects as well as on existing operations. In this climate of increasingly stringent regulation, pipeline failure or failures to comply with applicable regulations could result in reduction of allowable operating pressures as authorized by PHMSA, which would reduce available capacity on our pipelines. Should any of these risks materialize, it may have an adverse effect on our operations, earnings, cash flows and financial condition.
In Canada, our pipeline operations are subject to pipeline safety regulations overseen by the CER or provincial regulators. Applicable legislation and regulations require us to comply with a significant set of requirements for the design, construction, maintenance and operation of our pipelines. Among other obligations, this regulatory framework imposes requirements to monitor and maintain the integrity of our pipelines.
As in the United States, several legislative changes addressing pipeline safety in Canada have recently been enacted. The changes evidence an increased focus on the implementation of management systems to address key areas such as emergency management, integrity management, safety, security and environmental protection. Other legislative changes have created authority for the CER to impose administrative monetary penalties for non-compliance with the regulatory regime it administers, as well as to impose financial requirements for future abandonment and major pipeline releases.
Environmental Regulation
We are also subject to numerous environmental laws and regulations affecting many aspects of our present and future operations, including air emissions, water quality, wastewater discharges, solid waste and hazardous waste. These laws and regulations generally require us to obtain and comply with a wide variety of environmental licenses, permits and other approvals.
In particular, in the United States, compliance with major Clean Air Act regulatory programs is likely to cause us to incur significant capital expenditures to obtain permits, evaluate off-site impacts of our operations, install pollution control equipment, and otherwise assure compliance. Some states in which we operate are implementing new emissions limits to comply with 2008 ozone standards regulated under the National Ambient Air Quality Standards. In 2015, the ozone standards were lowered even further from 75 parts per billion (ppb) to 70 ppb, which may require states to implement additional emissions regulations. The precise nature of these compliance obligations at each of our facilities has not been finally determined and may depend in part on future regulatory changes. In addition, compliance with new and emerging environmental regulatory programs may significantly increase our operating costs compared to historical levels.
In the United States, climate change action is evolving at state, regional and federal levels. The Supreme Court decision in Massachusetts v. Environmental Protection Agency in 2007 established that GHG emissions were pollutants subject to regulation under the Clean Air Act. Pursuant to federal regulations, we are currently subject to an obligation to report our GHG emissions at our largest emitting facilities, but are not generally subject to limits on emissions of GHGs. In addition, a number of states have joined regional GHG initiatives, and a number are developing their own programs that would mandate reductions in GHG emissions. Public interest groups and regulatory agencies are increasingly focusing on the emission of methane associated with natural gas development and transmission as a source of GHG emissions. However, as the key details of future GHG restrictions and compliance mechanisms remain undefined, the likely future effects on our business are highly uncertain.
For its part, Canada has reaffirmed its strong preference for a harmonized approach with that of the United States. In 2019, the Government of Canada implemented a federal system of carbon pricing. The pricing applies to provinces and territories that are not in compliance with the federal requirements.
Due to the speculative outlook regarding any United States federal and state policies, we cannot estimate the potential effect of proposed GHG policies on our future consolidated results of operations, financial position or cash flows. However, such legislation or regulation could materially increase our operating costs, require material capital expenditures or create additional permitting, which could delay proposed construction projects.
Economic Regulation
Our liquids pipelines also face economic regulation risk. Broadly defined, economic regulation risk is the risk that governments or regulatory agencies change or reject proposed or existing commercial arrangements including permits and regulatory approvals for new projects. The Mainline System and other liquids pipelines are subject to the actions of various regulators, including the CER and FERC, with respect to the tariffs and tolls of those operations. The changing or rejecting of commercial arrangements, including decisions by regulators on the applicable tariff structure or changes in interpretations of existing regulations by courts or regulators, could have an adverse effect on our revenues and earnings. Delays in regulatory approvals on projects such as our U.S. L3R Program, could result in cost escalations and construction delays, which also negatively impact our operations.
GAS TRANSMISSION AND MIDSTREAM
Operational Regulation
The span of regulation risks that apply to the Liquids Pipeline business as described above under Liquids Pipelines also applies to the Gas Transmission and Midstream business. Most of our United States gas transmission operations are regulated by the FERC. The FERC regulates natural gas transmission in United States interstate commerce including the establishment of rates for services. The FERC also regulates the construction of United States interstate natural gas pipelines and storage facilities, including the extension, enlargement and abandonment of facilities. In addition, certain operations are subject to oversight by state regulatory commissions. To the extent that the natural gas intrastate pipelines that transport or store natural gas in interstate commerce provide services under Section 311 of the Natural Gas Policy Act of 1978, they are subject to FERC regulations. The FERC may propose and implement new rules and regulations affecting interstate natural gas transmission and storage companies, which remain subject to the FERC’s jurisdiction. These initiatives may also affect certain transmission of gas by intrastate pipelines. We reached an agreement with Texas Eastern shippers and filed a Stipulation and Agreement with the FERC on October 28, 2019. We expect a decision from the FERC in the second quarter of 2020, upon which we will begin recognizing updated rates within our results of operations.
Our operations are subject to the jurisdiction of the Environmental Protection Agency and various other federal, state and local environmental agencies. Our United States interstate natural gas pipelines and certain of DCP Midstream’s gathering and transmission pipelines are also subject to the regulations of the DOT concerning pipeline safety.
The intrastate natural gas and NGL pipelines owned by us and DCP Midstream are subject to state regulation. DCP Midstream's interstate NGL transportation pipelines are subject to FERC regulation. The natural gas gathering and processing activities of DCP Midstream are not subject to FERC regulation.
Our Canadian operations are governed by various federal and provincial agencies with respect to pipeline safety, including the CER, the Transportation Safety Board and the Ontario Technical Standards and Safety Authority.
Our Canadian natural gas transmission operations are subject to regulation by the CER or the provincial agencies in Canada, such as the OEB. These agencies have jurisdiction similar to the FERC for regulating rates, the terms and conditions of service, the construction of additional facilities and acquisitions. We are in the process of negotiating a rate settlement agreement with our British Columbia Pipeline shippers. Since the expiration of our previous Settlement Agreement at the end of 2019, we have been charging interim rates as approved by the CER.
GAS DISTRIBUTION AND STORAGE
Operational Regulation
Our gas distribution and storage utility operations are regulated by the OEB and the Québec Régie de l’énergie, among others. Regulators’ future actions may differ from current expectations or future legislative changes may impact the regulatory environments in which we operate. To the extent that the regulators’ future actions are different from current expectations, the timing and amount of recovery or refund of amounts recorded on the Consolidated Statements of Financial Position, or amounts that would have been recorded on the Consolidated Statements of Financial Position in absence of the effects of regulation, could be different from the amounts that are eventually recovered or refunded.
We seek to mitigate operational regulation risk. We retain dedicated professional staff and maintain strong relationships with customers, intervenors and regulators. This strong regulatory relationship continued in 2019 following the OEB’s Decision and Order to approve Enbridge Gas’ application for 2019 rates. The Decision and Order approved an effective date for base rates of April 1, 2019, and the inclusion of incremental capital module amounts to allow for the recovery of incremental capital investments.
Enbridge Gas' distribution rates, beginning in 2019, are set under a five-year incentive regulation (IR) framework using a price cap mechanism. The price cap mechanism establishes new rates each year through an annual base rate escalation at inflation less a 0.3% productivity factor, annual updates for certain costs to be passed through to customers, and where applicable, the recovery of material discrete incremental capital investments beyond those that can be funded through base rates. The IR framework includes the continuation and establishment of certain deferral and variance accounts, as well as an earnings sharing mechanism that requires Enbridge Gas to share equally with customers, any earnings in excess of 150 basis points over the annual OEB approved return on equity (ROE).
Environmental Regulation
Our workers, operations and facilities are subject to municipal, provincial and federal legislation which regulate the protection of the environment and the health and safety of workers. Environmental legislation primarily includes regulation of discharges to air, land and water; management and disposal of hazardous waste; the assessment and management of contaminated sites; and the reporting and reduction of GHG emissions.
Gas distribution system operation, as with any industrial operation, has the potential risk of abnormal or emergency conditions, or other unplanned events that could result in spills or emissions in excess of permitted levels. These events could result in injuries to workers or the public, adverse impacts to the environment in which we operate within, property damage or regulatory violations including order and fines. We could also incur future liability for soil and groundwater contamination associated with past and present site activities.
In addition to gas distribution, we also operate storage facilities and small oil and brine productions in southwestern Ontario. Environmental risk associated with these facilities is the potential for unplanned releases. In the event of a release, remediation of the affected area would be required. There would also be potential for fines, orders or charges under environmental legislation, and potential third-party liability claims by any affected land owners.
The gas distribution system and our other operations must maintain environmental approvals and permits from regulators to operate. As a result, these assets and facilities are subject to periodic inspections and/or audits. Annual reports, such as the Annual Written Summary Report are submitted to the Ontario Ministry of Environment, Conservation and Parks (MECP) and other regulators to demonstrate we are in good standing with our Environmental Compliance Approvals. Failure to maintain regulatory compliance could result in operational interruptions, fines, and/or orders for additional pollution control technology or environmental mitigation. As environmental requirements and regulations become more stringent, the cost to maintain compliance and the time required to obtain approvals has increased.
As with previous years, in 2019, we reported GHG emissions to Environment and Climate Change Canada (ECCC), the Ontario MECP, and a number of voluntary reporting programs. Emissions from Ontario combustion sources were verified in detail by a third-party accredited verifier with no material discrepancies found. Additionally, operational emissions from venting, fugitive and natural gas distribution emissions were reported to the MECP starting in 2017 in accordance with Ontario regulations.
Enbridge Gas utilizes emissions data management processes and systems to help with the data capture and mandatory and voluntary reporting needs. Quantification methodologies and emission factors will continually be updated in the system as required. Enbridge Gas continues to work with industry associations to refine quantification methodologies and emissions factors, as well as best management practices to minimize emissions.
In October 2018, the federal government confirmed that Ontario is subject to the federal government’s carbon pricing program, otherwise known as the Federal Carbon Pricing Backstop Program. This program consists of two components: an output-based pricing system (OBPS) and carbon charge levied on fossil fuels, including natural gas.
The OBPS component began on January 1, 2019. Under OBPS, a registered facility will have a facility-specific annual emission limit which is based on the relevant output-based standard for its level of production. Enbridge Gas has registered with ECCC as an emitter in the OBPS program and will have an annual compliance obligation associated with its natural gas pipeline transmission system. Annually, Enbridge Gas is required to report its emissions covered under the OBPS, have the emissions report verified by an accredited third-party verifier and remit payment for any emissions that exceed the facility-specific emission limit.
The federal carbon charge took effect on April 1, 2019 at a rate of 3.91 cents/cubic meter (m3) of natural gas, and is applicable to the majority of customers. Enbridge Gas has registered as a natural gas distributor with the Canadian Revenue Agency and remits the federal carbon charge on a monthly basis. The charge increases annually on April 1 by 1.96 cents/m3 up to 9.79 cents/m3 in 2022.
EMPLOYEES
We had approximately 11,300 employees as at December 31, 2019, including approximately 7,800 employees in Canada and approximately 3,500 employees in the United States. Approximately 1,700 of our employees are subject to collective bargaining agreements governing their employment with us. All of the collective bargaining agreements governing our employees have expired or will expire during the year ended December 31, 2020. We are currently in the process of collective bargaining with respect to the expired or expiring contracts. We have mature working relationships with our labor unions and the parties have traditionally committed themselves to the achievement of renewal agreements without a work stoppage.
EXECUTIVE OFFICERS
The following table sets forth information regarding our executive officers:
|
| | |
Name | Age | Position |
Al MonacoDelivered distributable cash flow (“DCF”) and dividend growth | 60 | President & Chief Executive Officer |
Colin K. Gruending | 50 | Executive Vice President & Chief Financial Officer |
Robert R. Rooney | 63 | Executive Vice President & Chief Legal Officer |
John K. Whelen | 60 | Executive Vice President & Chief Development Officer |
William T. Yardley | 55 | Executive Vice President & President, Gas Transmission and Midstream |
Cynthia L. Hansen | 55 | Executive Vice President & President, Gas Distribution and Storage |
Byron C. Neiles | 54 | Executive Vice President, Corporate Services |
D. Guy Jarvis | 56 | Executive Vice President, Liquids Pipelines |
Vern D. Yu | 53 | Executive Vice President & President, Liquids Pipelines |
Laura B. Sayavedra | 52 | Senior Vice President, Projects, Safety and Reliability, and ERP |
Al Monaco was appointed President and Chief Executive Officer on October 1, 2012. Mr. Monaco is also a member of the Enbridge Board of Directors. Prior to being appointed President of Enbridge, Mr. Monaco served as President, Gas Pipelines, Green Energy and International with responsibility for the growth and operations of our gas pipelines, including the gas gathering and processing operations in the United States, our gulf coast offshore assets and our investments in Alliance Pipeline, Vector and Aux Sable, as well as our International business development and investment activities and Renewable Power Generation.
Colin K. Gruending was appointed Executive Vice President and Chief Financial Officer of Enbridge on June 1, 2019. Previously, our Senior Vice President, Corporate Development and Investment Review, Mr. Gruending performed a number of progressively challenging executive roles such as Vice President Corporate Development and Planning and Vice President, Treasury and Tax while concurrently serving as Chief Financial Officer for Enbridge Income Fund and Enbridge Income Fund Holdings Inc. Prior to that, Mr. Gruending served as Corporate Controller and also led enterprise Investor Relations and Pension Investments.
Robert R. Rooney was appointed Executive Vice President and Chief Legal Officer on February 1, 2017. Mr. Rooney leads our legal and aviation teams across the organization.
John K. Whelen was appointed Executive Vice President and Chief Development Officer on June 1, 2019. Previously, our Executive Vice President and Chief Financial Officer, Mr. Whelen held responsibility for our financial reporting function, as well as our tax, treasury and risk management functions. Prior to that, Mr. Whelen served as Senior Vice President and Controller, Senior Vice President Corporate Development and Vice President and Treasurer. Mr. Whelen has been part of the Enbridge team since 1992.
William T. Yardley was named Executive Vice President and President, Gas Transmission and Midstream on February 27, 2017 coincident with the closing of the Merger Transaction. Mr. Yardley, based in Houston, was previously President of Spectra Energy’s United States Transmission and Storage business, leading the business development, project execution, operations and environment, health and safety efforts associated with Spectra Energy’s United States portfolio of assets.
Cynthia L. Hansen was appointed Executive Vice President and President, Gas Distribution and Storage, on June 1, 2019. Ms. Hansen is responsible for the overall leadership and operations of Enbridge Gas, following the amalgamation of EGD and Union Gas, as well as Gazifère. Previously, our Executive Vice President, Utilities and Power Operations, Ms. Hansen is also the Executive Sponsor for Asset and Work Management Transformation across Enbridge, working with other business unit leaders.
Byron C. Neiles was appointed Executive Vice President, Corporate Services on May 2, 2016. Mr. Neiles has oversight of our Technology & Information Services, Human Resources, Real Estate, Supply Chain Management, and Public Affairs, Communications & Sustainability. Mr. Neiles had previously held the role of Senior Vice President, Major Projects, Enterprise Safety and Operational Reliability and had been Senior Vice President of Major Projects since November 2011, after joining our Major Projects group in April 2008.
D. Guy Jarvis was appointed Executive Vice President, Liquids Pipelines on June 1, 2019. Mr. Jarvis had previously been President of our Liquids Pipelines group, with responsibility for all of our crude oil and liquids pipeline businesses across North America. Mr. Jarvis previously held the title of Chief Commercial Officer for Liquids Pipelines, with responsibility for strategic and integrated services, customer service, finance, and business and market development. Prior to Mr. Jarvis' work in Liquids Pipelines, he served as President, Gas Distribution, providing overall leadership to EGD, as well as EGNB and Gazifère. On November 7, 2019, Mr. Jarvis notified us of his intention to retire effective February 28, 2020.
Vern D. Yu was appointed Executive Vice President and President, Liquids Pipelines on January 1, 2020. Previously, Mr. Yu served as President and Chief Operating Officer for Liquids Pipelines and prior to that served as Executive Vice President and Chief Development Officer. He had previously served as Senior Vice President, Corporate Planning and Chief Development Officer. Prior to joining Corporate Development, Mr. Yu served as Senior Vice President of Business and Market Development for Enbridge’s Liquids Pipelines division and previously has held a series of roles with increasing responsibility in our corporate and financial areas.
Laura B. Sayavedra was appointed Senior Vice President, Projects, Safety and Reliability and Enterprise Resource Planning (ERP) on June 1, 2019. Ms. Sayavedra is accountable for providing the overall strategic vision, leadership, integration and executive oversight of Enbridge’s enterprise-wide Projects, Safety and Reliability, and ERP functions spanning operations in Canada and the United States, including multiple interests, jurisdictions and sensitivities. Previously, Ms. Sayavedra served as Vice President of Finance Transformation and took on a leadership role for the multi-year ERP program in late 2017.
ADDITIONAL INFORMATION
Additional information about us is available on our website at www.enbridge.com, on SEDAR at www.sedar.com and on EDGAR at www.sec.gov. The aforementioned information is made available in accordance with legal requirements and is not, unless otherwise specifically stated, incorporated by reference into this Annual Report on Form 10-K. We make available free of charge, through our website, annual reports on Form 10-K, quarterly reports on Form 10-Q and current reports on Form 8-K and amendments to those reports filed or furnished pursuant to Section 13(a) or 15(d) of the Securities Exchange Act of 1934, as well as proxy statements, as soon as reasonably practicable after we electronically file such material with, or furnish it to, the Securities and Exchange Commission (SEC). Reports, proxy statements and other information filed with the SEC may also be obtained through the SEC’s website (www.sec.gov).
ENBRIDGE GAS INC.
Additional information about Enbridge Gas can be found in its annual information form, financial statements and management's discussion and analysis (MD&A) for the year ended December 31, 2019, which have been filed with the securities commissions or similar authorities in each of the provinces of Canada. These documents contain detailed disclosure with respect to Enbridge Gas and are publicly available on SEDAR at www.sedar.com. These documents are not, unless otherwise specifically stated, incorporated by reference into this Annual Report on Form 10-K.
ENBRIDGE PIPELINES INC.
Additional information about Enbridge Pipelines Inc. (EPI) can be found in its annual information form, financial statements and MD&A for the year ended December 31, 2019, which have been filed with the securities commissions or similar authorities in each of the provinces of Canada. These documents contain detailed disclosure with respect to EPI and are publicly available on SEDAR at www.sedar.com. These documents are not, unless otherwise specifically stated, incorporated by reference into this Annual Report on Form 10-K.
WESTCOAST ENERGY INC.
Additional information about Westcoast Energy Inc. can be found in its annual information form, financial statements and MD&A for the year ended December 31, 2019, which have been filed with the securities commissions or similar authorities in each of the provinces of Canada. These documents contain detailed disclosure with respect to Westcoast Energy Inc. and are publicly available on SEDAR at www.sedar.com. These documents are not, unless otherwise specifically stated, incorporated by reference into this Annual Report on Form 10-K.
DCP MIDSTREAM LP
Additional information about DCP Midstream can be found in its Annual Report on Form 10-K that will be filed with the SEC. This document contains detailed disclosure with respect to DCP Midstream, and will be publicly available on EDGAR at www.sec.gov. No part of the Form 10-K filed by DCP Midstream is, unless otherwise specifically stated, incorporated by reference into this Annual Report on Form 10-K.
ITEM 1A. RISK FACTORS
Pipeline operations involve numerous risks that may adversely affect our business and financial results.
Operation of complex pipeline systems, gathering, treating, storing and processing operations involves many risks, hazards and uncertainties. These events include adverse weather conditions, accidents, the breakdown or failure of equipment or processes, the performance of the facilities below expected levels of capacity and efficiency and catastrophic events, including those related to climate change, such as explosions, fires, earthquakes, hurricanes, floods, landslides or other similar events beyond our control. These types of catastrophic events could result in loss of human life, significant damage to property, environmental pollution and impairment of our operations, any of which could also result in substantial losses for which insurance may not be sufficient or available and for which we may bear a part or all of the cost. We have experienced such events in the past, including in 2010 on Lines 6A and 6B of the Lakehead System, in October 2018 at the British Columbia (BC) Pipeline T-South system, in January 2019 at the Texas Eastern pipeline, and in August 2019 at the Texas Eastern pipeline, and cannot guarantee that we will not experience catastrophic events in the future. In addition, we could be subject to litigation and significant fines and penalties from regulators in connection with any such events. Environmental incidents could also lead to an increased cost of operating and insuring our assets, thereby negatively impacting earnings. An environmental incident could have lasting reputational impacts to us and could impact our ability to work with various stakeholders. For pipeline and storage assets located near populated areas, including residential communities, commercial business centers, industrial sites and other public gathering locations, the level of damage resulting from these catastrophic events could be greater.
A service interruption could have a significant impact on our operations, and negatively impact financial results, relationships with stakeholders and our reputation.
A service interruption due to a major power disruption, curtailment of commodity supply, operational incident or other reasons could have a significant impact on our operations and negatively impact financial results, relationships with stakeholders and our reputation. Service interruptions that impact our crude oil and natural gas transportation services can negatively impact shippers’ operations and earnings as they are dependent on our services to move their product to market or fulfill their own contractual arrangements.
Our operations involve safety risks to the public and to our workers and contractors.
Several of our pipelines and distribution systems and related assets are operated in close proximity to populated areas and a major incident could result in injury or loss of life to members of the public. In addition, given the natural hazards inherent in our operations, our workers and contractors are subject to personal safety risks. A public safety incident or an injury or loss of life to our workers or contractors could result in reputational damage to us, material repair costs or increased costs of operating and insuring our assets.
Cyber-attacks or security breaches could adversely affect our business, operations or financial results.
Our business is dependent upon information systems and other digital technologies for controlling our plants and pipelines, processing transactions and summarizing and reporting results of operations. The secure processing, maintenance and transmission of information is critical to our operations. A security breach of our network or systems, or the network or systems of our third-party vendors, could result in improper operation of our assets, potentially including delays in the delivery or availability of our customers’ products, contamination or degradation of the products we transport, store or distribute, or releases of hydrocarbon products for which we could be held liable. Furthermore, we and our third-party vendors collect and store sensitive data in the ordinary course of our business, including personal identification information of our employees as well as our proprietary business information and that of our customers, suppliers, investors and other stakeholders. We have a cyber-security controls framework in place which has been derived from the National Institute of Standards. We monitor our control effectiveness in an increasing threat landscape and continuously take action to improve our security posture. We have implemented a security operations center, which operates at all times to monitor, detect and investigate any anomalous activity in our network together with an incident response process that we test on a monthly basis. We conduct independent cyber-security audits and penetration tests on a regular basis to test that our preventative and detective controls are working as designed.
Despite our security measures, our information systems, or those of our vendors, may become the target of cyber-attacks (including hacking, viruses or acts of terrorism) or security breaches (including employee error, malfeasance or other breaches), which could compromise our network or systems, or those of our vendors, and result in the release or loss of the information stored therein, misappropriation of assets, disruption to our operations or damage to our facilities. As a result of a cyber-attack or security breach, we could also be liable under laws that protect the privacy of personal information, subject to regulatory penalties, experience damage to our reputation or a loss of consumer confidence in our products and services, or incur additional costs for remediation and modification or enhancement of our information systems to prevent future occurrences, all of which could adversely affect our reputation, business, operations or financial results.
There are utilization risks in respect to our assets.
In respect to our Liquids Pipeline assets, we are exposed to throughput risk under the CTS on the Canadian Mainline and under certain tolling agreements applicable to other Liquids Pipelines assets, such as the Lakehead System. A decrease in volumes transported can directly and adversely affect our revenues and earnings. Factors such as changing market fundamentals, capacity bottlenecks, operational incidents, regulatory restrictions, system maintenance and increased competition can all impact the utilization of our assets. Market fundamentals, such as commodity prices and price differentials, weather, gasoline price and consumption, alternative energy sources and global supply disruptions outside of our control can impact both the supply of and demand for crude oil and other liquid hydrocarbons transported on our pipelines.
In respect to our Gas Transmission and Midstream, gas supply and demand dynamics continue to change as a result of the development of non-conventional shale gas supplies. The increase in natural gas supply has resulted in declines in the price of natural gas in North America. As a result, a shift occurred to extraction of gas in richer, wet gas areas with higher NGL content which depressed activity in dry fields. This, in turn, has contributed to a resulting oversupply of pipeline takeaway capacity in some areas, which can adversely affect our revenues and earnings.
In respect to our Gas Distribution and Storage assets, customers are billed on a combination of both fixed charge and volumetric basis and our ability to collect their respective total revenue requirement (the cost of providing service, including a reasonable return to the utility) depends on achieving the forecast distribution volume established in the rate-making process. The probability of realizing such volume is contingent upon four key forecast variables: weather, economic conditions, pricing of competitive energy sources and growth in the number of customers. Weather is a significant driver of delivery volumes, given that a significant portion of our Gas Distribution customer base uses natural gas for space heating. Distribution volume may also be impacted by the increased adoption of energy efficient technologies, along with more efficient building construction, that continue to place downward pressure on consumption. In addition, conservation efforts by customers may further contribute to a decline in annual average consumption. Our Gas Distribution business has deferral accounts approved by the OEB that provide regulatory protection against the margin impacts associated with declining annual average consumption due to efficiencies and customers’ conservation efforts. Sales and transportation service to large volume commercial and industrial customers is more susceptible to prevailing economic conditions. As well, the pricing of competitive energy sources affects volume distributed to these sectors as some customers have the ability to switch to an alternate fuel. Even in those circumstances where we attain our respective total forecast distribution volume, our Gas Distribution business may not earn its expected ROE due to other forecast variables, such as the mix between the higher margin residential and commercial sectors and the lower margin industrial sector. Our Gas Distribution business remains at risk for the actual versus forecast large volume contract commercial and industrial volumes.
In respect to our Renewable Power Generation assets, earnings from these assets are highly dependent on weather and atmospheric conditions as well as continued operational availability of these energy producing assets. While the expected energy yields for Renewable Power Generation projects are predicted using long-term historical data, wind and solar resources are subject to natural variation from year to year and from season to season. Any prolonged reduction in wind or solar resources at any of the Renewable Power Generation facilities could lead to decreased earnings and cash flows for us. Additionally, inefficiencies or interruptions of Renewable Power Generation facilities due to operational disturbances or outages resulting from weather conditions or other factors, could also impact earnings.
Power produced from Renewable Power Generation assets is also often sold to a single counterparty under power purchase agreements or other long-term pricing arrangements. In this respect, the performance of the Renewable Power Generation assets is dependent on each counterparty performing its contractual obligations under the power purchase agreements or pricing arrangement applicable to it.
An impairment of our assets, including goodwill, property, plant, and equipment, intangible assets, and/or equity method investments, could reduce our earnings.
U.S. GAAP requires us to test certain assets for impairment on either an annual basis or when events or circumstances occur which indicate that the carrying value of such assets might be impaired. The outcome of such testing could result in impairments of our assets including our goodwill, property, plant and equipment, intangible assets, and/or equity method investments. Additionally, any asset monetizations could result in impairments if such assets are sold or otherwise exchanged for amounts less than their carrying value. If we determine that an impairment has occurred, we would be required to take an immediate noncash charge to earnings.
Our assets vary in age and were constructed over many decades which may cause our inspection, maintenance or repair costs to increase in the future.
Our pipelines vary in age and were constructed over many decades. Pipelines are generally long-lived assets, and pipeline construction and coating techniques have changed over time. Depending on the era of construction, some assets require more frequent inspections, which could result in increased maintenance or repair expenditures in the future. Any significant increase in these expenditures could adversely affect our business, operations or financial results.
Competition may result in a reduction in demand for our services, fewer project opportunities or assumption of risk that results in weaker or more volatile financial performance than expected.
We face competition from competing carriers available to ship western Canadian liquid hydrocarbons to markets in Canada, the United States and internationally and from proposed pipelines that seek to access markets currently served by our liquids pipelines. Competition among existing pipelines is based primarily on the cost of transportation, access to supply, the quality and reliability of service, contract carrier alternatives and proximity to markets. We also face competition from alternative gathering and storage facilities. Our natural gas transmission and storage businesses compete with similar facilities that serve our supply and market areas in the transmission and storage of natural gas. The natural gas transported in our business competes with other forms of energy available to our customers and end-users, including electricity, coal, propane, fuel oils, and renewable energy. Competition in all of our businesses, including competition for new project development opportunities, could have a negative impact on our business, financial condition or results of operations.
Execution of our projects subjects us to various regulatory, development, operational and market risks that may affect our financial results.
Our ability to successfully execute our projects is subject to various regulatory, development, operational, litigation and market risks, including:
the ability to obtain necessary approvals and permits from governments and regulatory agencies on a timely basis and on acceptable terms and to maintain those issued approvals and permits and satisfy the terms and conditions imposed therein;
potential changes in federal, state, provincial and local statutes and regulations, including environmental requirements, that may prevent a project from proceeding or increase the anticipated cost of the project;
impediments on our ability to acquire or renew rights-of-way or land rights on a timely basis and on acceptable terms;
opposition to our projects and operations by third parties, including interest groups;
the availability of skilled labor, equipment and materials to complete projects;
the ability to construct projects within anticipated costs, including the risk of cost overruns resulting from inflation or increased costs of equipment, materials or labor, contractor or supplier non-performance, weather, geologic conditions or other factors beyond our control, that may be material;
general economic factors that affect the demand for our projects; and
the ability to raise financing for these projects.
Climate related risks are integrated into multiple of our larger risk categories that encompass operational, financial and stakeholder consequences. This is done because of the interconnected economic, social and environmental nature of climate impacts requires a comprehensive review within the context of other risks that impact us.
Any of these risks could prevent a project from proceeding, delay its completion or increase its anticipated cost. Recent projects that have experienced delays include the U.S. L3R Program, Atlantic Bridge, Spruce Ridge Project and the T-South Reliability and Expansion Project. New projects may not achieve their expected investment return, which could affect our financial results, and hinder our ability to secure future projects. For additional discussion of specific proceedings that could affect our operations and financial results, refer to Part II. Item 7. Management's Discussion and Analysis of Financial Condition and Results of Operations - Legal and Other Updates.
Erosion of stakeholder trust or confidence or changes in our reputation with stakeholders, interest groups, political leadership, the media or other entities could influence actions or decisions about our company and industry and have negative impacts on our business, operations or financial results.
Our operations, projects and growth opportunities require us to have strong relationships with key stakeholders including local communities, Indigenous communities, and other groups directly impacted by our activities, as well as governments and government agencies. Inadequately managing expectations and issues important to stakeholders, including those related to environment and climate change, could affect stakeholder trust and confidence and our reputation.
There could be negative impacts on our business, operations or financial results due to erosion of stakeholder trust or confidence or changes in our reputation with stakeholders, interest groups (including non-governmental organizations), political leadership, the media or other entities. Public and stakeholder opinion may be influenced by certain media and others’ negative portrayal of the industry in which we operate as well as their opposition to our projects and ongoing operations. Potential impacts of an erosion of stakeholder trust or confidence or negative public opinion may include:
loss of business;
loss of ability to secure growth opportunities;
delays in project execution;
legal action, such as the legal challenges to the operation of Line 5 in Michigan and Wisconsin;
increased regulatory oversight;
negative impact on our ability to obtain and maintain necessary approvals and permits from governments and regulatory agencies on a timely basis and on acceptable terms;
impediments on our ability to acquire or renew rights-of-way or land rights on a timely basis and on acceptable terms
changing investor sentiment regarding investment in the oil and gas industry or our company;
negative impact on access to and cost of capital; and
loss of ability to hire and retain top talent.
We are also exposed to the risk of higher costs, delays, project cancellations, new restrictions or the cessation of operations of existing pipelines due to increasing pressure on governments and regulators. Recent judicial decisions have increased the ability of groups to make claims and oppose projects in regulatory and legal forums. In addition to issues raised by groups focused on particular project impacts, we and others in the energy and pipeline businesses are facing opposition from organizations opposed to oil and gas extraction and shipment of oil and gas products.
Our forecasted assumptions may not materialize as expected on our expansion projects, acquisitions and divestitures.
We evaluate expansion projects, acquisitions and divestitures on an ongoing basis. Planning and investment analysis is highly dependent on accurate forecasting assumptions and to the extent that these assumptions do not materialize, financial performance may be lower or more volatile than expected. Volatility and unpredictability in the economy, both locally and globally, change in cost estimates, project scoping and risk assessment could result in a loss in our profits.
Many of our operations are regulated and failure to secure regulatory approval for our proposed projects, or loss of required approvals for our existing operations, could have a negative impact on our business, financial condition or results of operations.
The nature and degree of regulation and legislation affecting energy companies in Canada and the United States have changed significantly in past years.
In Canada, the passing of the CER Act and the Impact Assessment Act under Bill C-69, which came into force on August 28, 2019, is expected to extend timelines associated with regulatory approvals for new projects which fall under Canadian federal jurisdiction and meet the criteria for an environmental impact assessment. Changes to the British Columbia regulatory framework have also been made, affecting provincially-regulated projects in a similar manner as those that are federally-regulated. Within the United States, pipelines companies continue to face opposition from anti-oil activists, Indigenous communities, citizens, environmental groups and politicians concerned with either the safety of pipelines or keeping oil in the ground. In the United States, several federal agencies are proposing changes to regulations pursuant to Executive Orders requiring them to streamline permitting, which would include changes to Section 401 of the Clean Water Act and the National Environmental Policy Act. These regulations are anticipated to be finalized this year but will be challenged in court and could be modified or withdrawn with a new administration. Additionally there are numerous cases pending in federal court challenging various aspects of other laws or regulations that could adversely impact permitting.
We may not be able to obtain or maintain all required regulatory approvals for our operating assets or development projects. If there is a delay in obtaining any required regulatory approvals, if we fail to obtain or comply with them, or if laws or regulations change or are administered in a more stringent manner, the operations of facilities or the development of new facilities could be prevented, delayed or become subject to additional costs.
Our operations are subject to numerous environmental laws and regulations, compliance with which may require significant capital expenditures, increase our cost of operations and affect or limit our business plans, or expose us to environmental liabilities.
We are subject to numerous environmental laws and regulations affecting many aspects of our present and future operations, including air emissions, water quality, wastewater discharges, solid waste and hazardous waste.
Failure to comply with environmental laws and regulations and failure to secure permits necessary for our operations may result in the imposition of fines, penalties and injunctive measures affecting our operating assets. In addition, changes in environmental laws and regulations or the enactment of new environmental laws or regulations, including those related to climate change and GHG emissions, could result in a material increase in our cost of compliance with such laws and regulations.
We may not be able to obtain or maintain all required environmental regulatory approvals and permits for our operating assets or development projects. If there is a delay in obtaining any required environmental regulatory approvals or permits, if we fail to obtain or comply with them, or if environmental laws or regulations change or are administered in a more stringent manner, the operations of facilities or the development of new facilities could be prevented, delayed or become subject to additional costs. We expect that costs we incur to comply with environmental regulations in the future may have a significant effect on our earnings and cash flows.
Our operations are subject to operational regulation and other requirements, including compliance with easements and other land tenure documents, and failure to comply with applicable regulations and other requirements could have a negative impact on our business, financial condition or results of operations.
Operational risks relate to compliance with applicable operational rules and regulations mandated by governments, applicable regulatory authorities, or other requirements that may be found in easements or other agreements that provide a legal basis for our operations, breaches of which could result in fines, penalties, awards of damages, operating restrictions (including shutdown of lines) and an overall increase in operating and compliance costs. Scrutiny over the integrity of our assets and operations has the potential to increase operating costs or limit future projects. Potential regulatory changes and legal challenges could have an impact on our future earnings from existing operations and the cost related to the construction of new projects. Regulators' future actions may differ from current expectations, or future legislative changes may impact the regulatory environments in which we operate. While we seek to mitigate operational regulation risk by active monitoring and consulting on potential regulatory requirement changes with the respective regulators directly, or through industry associations, and by developing response plans to regulatory changes or enforcement actions, such mitigation efforts may be ineffective or insufficient. While we believe the safe and reliable operation of our assets and adherence to existing regulations is the best approach to managing operational regulatory risk, the potential remains for regulators or other government officials to make unilateral decisions that could have a financial impact on us.
Our operations are subject to economic regulation and failure to secure regulatory approval for our proposed or existing commercial arrangements could have a negative impact on our business, financial condition or results of operations.
Our liquids pipelines face economic regulatory risk, the risk that governments or regulatory agencies change or reject proposed or existing commercial arrangements. We believe that economic regulatory risk is reduced through the negotiation of long-term agreements with shippers that govern the majority of our liquids pipeline assets. However, there remains a risk that a regulator could modify significantly its own long-standing policies for rate making as well as overturn long-term agreements that we have entered into with shippers.
Our transformation projects may fail to fully deliver anticipated results.
We launched projects starting in 2016 to transform various processes, capabilities and reporting systems infrastructure to continuously improve effectiveness and efficiency across the organization and are subject to transformation project risk with respect to these projects. Such projects, some of which will continue into 2020 and 2021, including integration initiatives arising out of the merger with Spectra Energy and the amalgamation of EGD and Union Gas, are subject to transformation project risk. Transformation project risk is the risk that modernization projects carried out by us and our subsidiaries do not fully deliver anticipated results due to insufficiently addressing the risks associated with project execution and change management. This could result in negative financial, operational and reputational impacts.
We are exposed to the credit risk of our customers.
We are exposed to the credit risk of our customers in the ordinary course of our business. Generally, our customers are rated investment-grade, are otherwise considered creditworthy or provide us security to satisfy credit concerns. A significant amount of our credit exposures for transmission and storage services are with customers who have an investment-grade rating (or the equivalent based on our evaluation) or are secured by collateral. However, we cannot predict to what extent our business would be impacted by deteriorating conditions in the economy, including possible declines in our customers’ creditworthiness. As a result of future capital projects for which natural gas and oil producers may be the primary customer, our credit exposure with below investment-grade customers may increase. It is possible that customer payment defaults, if significant, could adversely affect our earnings and cash flows.
We could be subject to changes in our tax rates, the adoption of new United States, Canadian or international tax legislation or exposure to additional tax liabilities.
We are subject to taxes in the United States, Canada and numerous foreign jurisdictions. Due to economic and political conditions, tax rates in various jurisdictions may be subject to significant change. Our effective tax rates could be affected by changes in the mix of earnings in countries with differing statutory tax rates, changes in the valuation of deferred tax assets and liabilities, or changes in tax laws or their interpretation, including in the United States, Canada and other foreign jurisdictions in which we operate.
We are also subject to the examination of our tax returns and other tax matters by the United States Internal Revenue Service, the Canada Revenue Agency and other tax authorities and governmental bodies. We regularly assess the likelihood of an adverse outcome resulting from these examinations to determine the adequacy of our provision for taxes. There can be no assurance as to the outcome of these examinations. If our effective tax rates were to increase, particularly in the United States or Canada, or if the ultimate determination of our taxes owed is for an amount in excess of amounts previously accrued, our financial condition and operating results could be materially adversely affected.
Our business requires the retention and recruitment of a skilled workforce, and difficulties recruiting and retaining our workforce could result in a failure to implement our business plans.
Our operations and management require the retention and recruitment of a skilled workforce, including engineers, technical personnel and other professionals. We and our affiliates compete with other companies in the energy industry for this skilled workforce. If we are unable to retain current employees and/or recruit new employees of comparable knowledge and experience, our business could be negatively impacted. In addition, we could experience increased allocated costs to retain and recruit these professionals.
We are involved in numerous legal proceedings, the outcomes of which are uncertain, and resolutions adverse to us could adversely affect our financial results.
We are subject to numerous legal proceedings. Litigation is subject to many uncertainties, and we cannot predict the outcome of individual matters with assurance. It is reasonably possible that the final resolution of some of the matters in which we are involved could require additional expenditures, in excess of established reserves, over an extended period of time and in a range of amounts that could adversely affect our financial results. Refer to Part II. Item 7. Management's Discussion and Analysis of Financial Condition and Results of Operations - Legal and Other Updates for a discussion of legal proceedings.
Terrorist attacks and threats, escalation of military activity in response to these attacks or acts of war, and other civil unrest or activism could adversely affect our business, operations or financial results.
Terrorist attacks and threats, escalation of military activity or acts of war, or other civil unrest or activism may have significant effects on general economic conditions and may cause fluctuations in consumer confidence and spending and market liquidity, each of which could adversely affect our business. Future terrorist attacks, rumors or threats of war, actual conflicts involving the United States, or Canada, or military or trade disruptions may significantly affect our operations and those of our customers. Strategic targets, such as energy related assets, may be at greater risk of future attacks than other targets in the United States and Canada. In addition, increased environmental activism against pipeline construction and operation could potentially result in work delays, reduced demand for our products and services, increased legislation or denial or delay of permits and rights-of-way. Finally, the disruption or a significant increase in energy prices could result in government-imposed price controls. It is possible that any of these occurrences, or a combination of them, could adversely affect our business, operations or financial results.
Our Liquids Pipelines growth rate and results may be directly and indirectly affected by commodity prices and Government policy.
The efforts implemented in 2019 by the Alberta Government to manage supply and inventories in Western Canada is expected to continue at diminishing levels to the end of 2020 as incremental take away capacity is introduced to the market. This intervention has negligible impact on mainline throughput, as enough inventory exists to meet refinery customer needs and service our favorable markets. Wide commodity price basis between Western Canada and global tidewater markets have negatively impacted producer netbacks and margins in the past years that largely resulted from pipeline infrastructure takeaway capacity from producing regions in Western Canada and North Dakota which are operating at capacity. A protracted long-term outlook for low crude oil prices could result in delay or cancellation of future projects.
The tight oil plays of Western Canada and the Bakken region of North Dakota have short cycle break-even time horizons, typically less than 24 months, and high decline rates that can be well managed through active hedging programs and are positioned to react quickly at market signals. Accordingly, during periods of comparatively low prices, drilling programs, unsupported by hedging programs, will be reduced and as such supply growth from tight oil basins may be lower, which may impact volumes on our pipeline systems.
Our Gas Transmission and Midstream results may be adversely affected by commodity price volatility and risks associated with our hedging activities.
Our exposure to commodity price volatility is inherent to part of our natural gas processing business. We employ a disciplined hedging program to manage this direct commodity price risk. Because we are not fully hedged, we may be adversely impacted by commodity price exposure on the commodities we receive in-kind as payment for our gathering, processing, treating and transportation services. As a result of our unhedged exposure and the pricing of our hedge positions, a substantial decline in the prices of these commodities could adversely affect our financial results.
Additionally, our hedging activities may not be as effective as we intend in reducing the volatility of our cash flows. To the extent that we engage in hedging activities to reduce our commodity price exposure, we likely will be prevented from realizing the full benefits of price increases above the level of the hedges. Our hedging activities can result in substantial losses if hedging arrangements are imperfect or ineffective and our hedging policies and procedures are not followed properly or do not work as intended. Further, hedging contracts are subject to the credit risk that the other party may prove unable or unwilling to perform its obligations under the contracts, particularly during periods of weak and volatile economic conditions. In addition, certain of the financial instruments we use to hedge our commodity risk exposures must be accounted for on a mark-to-market basis. This causes periodic earnings volatility due to fluctuations in commodity prices.
Our Energy Services results may be adversely affected by commodity price volatility.
Energy Services generates margin by capitalizing on quality, time and location differentials when opportunities arise. Volatility in commodity prices due to changing market conditions could limit margin opportunities and impede Energy Services' ability to cover capacity commitments. Furthermore, commodity prices could have negative earnings and cash flow impacts if the cost of the commodity is greater than resale prices achieved by us.
Our risk management policies cannot eliminate all risks. In addition, any non-compliance with our risk management policies could adversely affect our business, operations or financial results.
We use derivative financial instruments to manage the risks associated with movements in foreign exchange rates, interest rates, commodity prices and our share price to reduce volatility of our cash flows. Based on our risk management policies, all of our derivative financial instruments are associated with an underlying asset, liability and/or forecasted transaction. We do not enter into transactions with the objective of speculating on commodity prices or interest rates. These policies cannot, however, eliminate all risk of unauthorized trading and other speculative activity. Although this activity is monitored independently by our risk management function, we remain exposed to the risk of non-compliance with our risk management policies. We can provide no assurance that our risk management function will detect and prevent all unauthorized trading and other violations of our risk management policies and procedures, particularly if deception, collusion or other intentional misconduct is involved, and any such violations could adversely affect our business, operations or financial results.
We rely on access to short-term and long-term capital markets to finance capital requirements and support liquidity needs, and cost effective access to those markets can be affected, particularly if we or our rated subsidiaries are unable to maintain an investment-grade credit rating.
A significant portion of our consolidated asset base is financed with debt. The maturity and repayment profile of debt used to finance investments often does not correlate to cash flows from assets. Accordingly, we rely on access to both short-term and long-term capital markets as a source of liquidity for capital requirements not satisfied by cash flows from operations and to fund investments originally financed through debt. Our senior unsecured long-term debt is currently rated investment-grade by various rating agencies. If the rating agencies were to rate us or our rated subsidiaries below investment-grade, our borrowing costs would increase, perhaps significantly. Consequently, we would likely be required to pay a higher interest rate in future financings and our potential pool of investors and funding sources could decrease.
We maintain revolving credit facilities to provide back-up for commercial paper programs for borrowings and/or letters of credit at various entities. These facilities typically include financial covenants and failure to maintain these covenants at a particular entity could preclude that entity from issuing commercial paper or letters of credit or borrowing under the revolving credit facility, which could affect cash flows or restrict business. Furthermore, if our short-term debt rating were to be downgraded, access to the commercial paper market could be significantly limited. Although this would not affect our ability to draw under our credit facilities, borrowing costs could be significantly higher.
If we are not able to access capital at competitive rates, our ability to finance operations and implement our strategy may be affected. Restrictions on our ability to access financial markets may also affect our ability to execute our business plan as scheduled. An inability to access capital may limit our ability to pursue improvements or acquisitions that we may otherwise rely on for future growth. Any downgrade or other event negatively affecting the credit ratings of our subsidiaries could make their costs of borrowing higher or access to funding sources more limited, which in turn could increase our need to provide liquidity in the form of capital contributions or loans to such subsidiaries, thus reducing the liquidity and borrowing availability of the consolidated group.
Our insurance coverage may not be sufficient to cover our losses in the event of an accident, natural disaster or other hazardous event.
Our operations are subject to many hazards inherent in our industry. Our assets may experience physical damage as a result of an accident or natural disaster. These hazards can also cause personal injury and loss of life, severe damage to and destruction of property and equipment, pollution or environmental damage, and suspension of operations. We maintain a comprehensive insurance program for us, our subsidiaries and certain of our affiliates to mitigate the financial impacts arising from these hazards. This program includes insurance coverage in types and amounts and with terms and conditions that are generally consistent with coverage customary for our industry, however insurance does not cover all events in all circumstances.
In the unlikely event that multiple insurable incidents which in aggregate exceed coverage limits occur within the same insurance period, the total insurance coverage will be allocated among our entities on an equitable basis based on an insurance allocation agreement among us and our subsidiaries. Additionally, even with insurance, if any natural disaster or other hazardous event leads to a catastrophic interruption in operations, we may not be able to restore operations without significant interruption.
The effects of United States Government policies on trade relations between Canada and the United States are uncertain.
The new United States-Mexico-Canada Agreement (USMCA) (in Canada, known as the Canada-United States-Mexico Agreement (CUSMA) is intended to supersede the North American Free Trade Agreement (NAFTA). The USMCA/CUSMA has been ratified by the United States and Mexico, and will not come into effect until after Canada ratifies the agreement. NAFTA provides protection against tariffs, duties and other charges or fees and assures access by the signatories. The impact of USMCA/CUSMA, if ratified, on energy markets is uncertain.
ITEM 1B. UNRESOLVED STAFF COMMENTS
None.
ITEM 2. PROPERTIES
Descriptions of our properties and maps depicting the locations of our liquids and natural gas systems are included in Item 1. Business.
In general, our systems are located on land owned by others and are operated under easements and rights-of-way, licenses, leases or permits that have been granted by private land owners, First Nations, Native American Tribes, public authorities, railways or public utilities. Our liquids systems have pumping stations, tanks, terminals and certain other facilities that are located on land that is owned by us and/or used by us under easements, licenses, leases or permits. Additionally, our natural gas systems have natural gas compressor stations, processing plants and treating plants, the vast majority of which are located on land that is owned by us, with the remainder used by us under easements, leases or permits.
Titles to our properties acquired in our liquids and natural gas systems are subject to encumbrances in some cases. We believe that none of these burdens should materially detract from the value of these properties or materially interfere with their use in the operation of our business.
ITEM 3. LEGAL PROCEEDINGS
We are involved in various legal and administrative proceedings and litigation arising in the ordinary course of business. The outcome of these matters is not predictable at this time. However, we believe that the ultimate resolution of these matters will not have a material adverse effect on our financial condition, results of operations or cash flows in future periods. Refer to Part II. Item 7. Management's Discussion and Analysis of Financial Condition and Results of Operations - Legal and Other Updatesfor discussion of other legal proceedings.
ITEM 4. MINE SAFETY DISCLOSURES
Not applicable.
PART II
ITEM 5. MARKET FOR REGISTRANT'S COMMON EQUITY, RELATED STOCKHOLDER MATTERS AND ISSUER PURCHASES OF EQUITY SECURITIES
Common Stock
Our common stock is traded on the TSX and NYSE under the symbol “ENB.” As at February 7, 2020, there were approximately 2,024,814,011 holders of record of our common stock. A substantially greater number of holders of our common stock are "street name" or beneficial holders, whose shares are held by banks, brokers and other financial institutions.
Dividends
The following table indicates the dividends paid per common share (in Canadian dollars):
|
| | | | |
| | 2019 |
| 2018 |
|
| Q1 | 0.738 |
| 0.671 |
|
| Q2 | 0.738 |
| 0.671 |
|
| Q3 | 0.738 |
| 0.671 |
|
| Q4 | 0.738 |
| 0.671 |
|
Consistent with our objective of delivering annual cash dividend increases, we announced a quarterly dividend of $0.81 per common share payable on March 1, 2020, which represents a 9.8 percent increase from the prior quarterly rate. We expect to continue our policy of paying regular cash dividends. The declaration and payment of dividends are subject to the sole discretion of our Board of Directors and will depend upon many factors, including the financial condition, earnings and capital requirements of our operating subsidiaries, covenants associated with certain debt obligations, legal requirements, regulatory constraints and other factors deemed relevant by our Board of Directors.
Securities Authorized for Issuance Under Equity Compensation Plans
The information required by this Item will be contained in our Form 10-K/A, which will be filed no later than 120 days after December 31, 2019.
Recent Sales of Unregistered Equity Securities
None.
Issuer Purchases of Equity Securities
None.
Total Shareholder Return
The following graph reflects the comparative changes in the value from January 1, 2015 through December 31, 2019 of $100 invested in (1) Enbridge Inc.’s common shares traded on the TSX, (2) the S&P/TSX Composite index, (3) the S&P 500 index, (4) our United States peer group (comprising D, DTE, ET, EPD, KMI, MMP, NI, OKE, PCG, PAA, SRE and WMB) and (5) our Canadian peer group (comprising CU, FTS, IPL, PPL and TRP). The amounts included in the table were calculated assuming the reinvestment of dividends at the time dividends were paid.
|
| | | | | | | | | | | | |
| | January 1, 2015 | December 31, |
| | 2015 |
| 2016 |
| 2017 |
| 2018 |
| 2019 |
|
| Enbridge Inc. | 100.00 |
| 79.66 |
| 101.94 |
| 92.93 |
| 85.40 |
| 110.45 |
|
| S&P/TSX Composite | 100.00 |
| 88.91 |
| 104.48 |
| 110.78 |
| 97.88 |
| 116.61 |
|
| S&P 500 Index | 100.00 |
| 99.27 |
| 108.74 |
| 129.86 |
| 121.76 |
| 156.92 |
|
United States Peers1 | 100.00 |
| 75.58 |
| 99.08 |
| 99.42 |
| 92.47 |
| 111.43 |
|
| Canadian Peers | 100.00 |
| 80.50 |
| 105.22 |
| 113.05 |
| 102.32 |
| 133.14 |
|
1 For the purpose of the graph, it was assumed that CAD:USD conversion ratio remained at 1:1 for the years presented.
ITEM 6. SELECTED FINANCIAL DATA
The following selected financial data is not necessarily indicative of results of future operations and should be read in conjunction with Item 7. Management’s Discussion and Analysis of Financial Condition and Results of Operations and Item 8. Financial Statements and Supplementary Data to fully understand factors that may affect the comparability of the information presented below.
|
| | | | | | | | | | | | | | | |
| | Years Ended December 31, |
| | 2019 |
| 2018 |
| 2017 |
| 2016 |
| 2015 |
|
| (millions of Canadian dollars, except per share amounts) | |
|
|
| |
| Consolidated Statements of Earnings | | | | | |
| Operating revenues | $ | 50,069 |
| $ | 46,378 |
| $ | 44,378 |
| $ | 34,560 |
| $ | 33,794 |
|
| Operating income | 8,260 |
| 4,816 |
| 1,571 |
| 2,581 |
| 1,862 |
|
| Earnings/(loss) from continuing operations | 5,827 |
| 3,333 |
| 3,266 |
| 2,309 |
| (159 | ) |
(Earnings)/loss attributable to noncontrolling interests and redeemable noncontrolling interests
| (122 | ) | (451 | ) | (407 | ) | (240 | ) | 410 |
|
| Earnings attributable to controlling interests | 5,705 |
| 2,882 |
| 2,859 |
| 2,069 |
| 251 |
|
| Earnings/(loss) attributable to common shareholders | 5,322 |
| 2,515 |
| 2,529 |
| 1,776 |
| (37 | ) |
| Common Stock Data | | | | | |
| Earnings/(loss) per common share | | | | | |
| Basic | 2.64 |
| 1.46 |
| 1.66 |
| 1.95 |
| (0.04 | ) |
| Diluted | 2.63 |
| 1.46 |
| 1.65 |
| 1.93 |
| (0.04 | ) |
| Dividends paid per common share | 2.95 |
| 2.68 |
| 2.41 |
| 2.12 |
| 1.86 |
|
|
| | | | | | | | | | | | | | | |
| | December 31, |
| | 2019 |
| 2018 |
| 2017 |
| 2016 |
| 2015 |
|
| (millions of Canadian dollars) | |
|
|
| |
| Consolidated Statements of Financial Position | | | | | |
Total assets1 | $ | 163,269 |
| $ | 166,905 |
| $ | 162,093 |
| $ | 85,209 |
| $ | 84,154 |
|
| Long-term debt including capital leases, less current portion | 59,661 |
| 60,327 |
| 60,865 |
| 36,494 |
| 39,391 |
|
| |
1 | We combined Cash and cash equivalents and other amounts previously presented as Bank indebtedness where the corresponding bank accounts are subject to pooling arrangements. |
ITEM 7. MANAGEMENT'S DISCUSSION AND ANALYSIS OF FINANCIAL CONDITION AND RESULTS OF OPERATIONS
INTRODUCTION
The following discussion and analysis of our financial condition and results of operations is based on and should be read in conjunction with "Forward-Looking Information", Part I. Item 1A. Risk Factors and our consolidated financial statements and the accompanying notes included in Part II. Item 8. Financial Statements and Supplementary Data of this Annual Report on Form 10-K.
This section of our Annual Report on Form 10-K discusses 2019 and 2018 items and year-over-year comparisons between 2019 and 2018. For discussion of 2017 items and year-over-year comparisons between 2018 and 2017, refer to Part II. Item 7. Managements Discussion and Analysis of Financial Condition and Results of Operations of our Annual Report on Form 10-K for the year ended December 31, 2018.
RECENT DEVELOPMENTS
CANADIAN LINE 3 REPLACEMENT PROGRAM PLACED INTO SERVICE
The Canadian Line 3 Replacement Program was placed into service on December 1, 2019, with an interim surcharge on Mainline System volumes of US$0.20 per barrel. This safety-driven maintenance project reflects the importance of protecting the environment and ensuring the continued safe and reliable operations of our Mainline System well into the future. For further details refer to Growth Projects - Commercially Secured Projects - Liquids Pipelines.
STATE OF MINNESOTA PERMITTING TIMELINE FOR U.S. LINE 3 REPLACEMENT PROGRAM
On June 3, 2019, the Minnesota Court of Appeals rendered a decision on the Minnesota Public Utilities Commission's (MNPUC's) adequacy determination of the Final Environmental Impact Statement (FEIS) for the U.S. L3R Program. While denying eight of the nine appealed items, the Minnesota Court of Appeals identified one issue that led it to reverse the adequacy determination. On July 3, 2019, certain project opponents sought further appellate review from the Minnesota Supreme Court. On September 17, 2019, based on the respective responses of the MNPUC and the Company, the Minnesota Supreme Court denied the opponents’ petitions thus restoring the MNPUC with jurisdiction. At a hearing on October 1, 2019, the MNPUC directed the Department of Commerce to submit a revised FEIS by December 9, 2019. The Department of Commerce issued the revised FEIS on December 9, 2019, and the MNPUC gathered public comment on that document through January 16, 2020. On February 3, 2020, the MNPUC approved the adequacy of the revised FEIS and reinstated the Certificate of Need and Route Permit, clearing the way for construction of the pipeline to commence following the issuance of required permits.
At this time, we cannot determine when all necessary permits to commence construction will be issued. For further details refer to Growth Projects - Regulatory Matters - United States Line 3 Replacement Program.
MAINLINE SYSTEM CONTRACTING
On August 2, 2019, we launched an open season for transportation services on our Mainline System. The open season provided shippers with the opportunity to enter into long-term contracts for priority access on the Mainline System upon maturity of the current CTS agreement on June 30, 2021.
On September 27, 2019, after receiving complaints, the CER ordered that we may not offer firm service to prospective shippers on our Mainline System until such firm service, including all associated tolls and terms and conditions of service, has been approved by the CER. While this decision was a significant departure from past regulatory precedents, the CER noted that its decision to hold a regulatory review prior to the open season does not prejudice our ability to offer long term priority access contracts on the Mainline System.
On December 19, 2019, we submitted an application to the CER to implement contracting on our Mainline System. The application for contracted and uncommitted service included the associated terms, conditions and tolls of each service, which would be offered in an open season following approval by the CER. The tolls and services would replace the current CTS that is in place until June 30, 2021. If a replacement agreement is not in place by that time, the CTS tolls will continue on an interim basis.
The application that we filed is the result of over two years of extensive negotiations with a diverse group of shippers and has been designed to align the interests of us and our shippers. Shippers, which represent over 70 percent of our current Mainline System throughput, have filed letters supporting the application with the CER, demonstrating the strong shipper backing for the offering.
On February 7, 2020, we replied to the letters solicited by the CER regarding comments from interested parties both in opposition and support of our application. We expect a thorough regulatory process to continue through substantially all of 2020.
ASSET MONETIZATION
Enbridge Gas New Brunswick Business
On October 1, 2019, we closed the sale of EGNB to Liberty Utilities (Canada) LP, a wholly-owned subsidiary of Algonquin Power & Utilities Corp., for proceeds of approximately $331 million.
St. Lawrence Gas Company Inc.
On November 1, 2019, we closed the sale of the issued and outstanding shares of St. Lawrence Gas for proceeds of approximately $72 million.
Canadian Natural Gas Gathering and Processing Businesses
On December 31, 2019, we closed the sale of the federally regulated Canadian natural gas gathering and processing businesses to Brookfield Infrastructure Partners L.P. and its institutional partners (collectively, Brookfield) for proceeds of approximately $1.7 billion, after closing adjustments. These federally regulated businesses represent the second and final phase of the $4.3 billion transaction that was previously announced on July 4, 2018.
Montana-Alberta Tie Line
In the fourth quarter of 2019, we committed to a plan to sell the MATL transmission assets. The purchase and sale agreement was signed in January 2020. Subject to certain regulatory approvals and customary closing conditions, the transaction is expected to close in the first quarter of 2020.
Refer to Liquidity and Capital Resources - Sources and Uses of Cash for details on the use of proceeds from our asset monetization activity discussed above.
ENBRIDGE GAS INC. 2019 RATE APPLICATION
In September 2019, Enbridge Gas received a Decision and Order from the OEB on its application for 2019 rates. The 2019 rate application was filed in December 2018 in accordance with the parameters of Enbridge Gas’s OEB approved Price Cap Incentive Regulation rate setting mechanism and represents the first year of a five-year term. The Decision and Order approved an effective date for base rates of April 1, 2019, and the inclusion of incremental capital module amounts to allow for the recovery of incremental capital investments.
ENBRIDGE GAS INC. 2020 RATE APPLICATION
In October 2019, Enbridge Gas filed an application with the OEB for the setting of rates for 2020 and for the funding of discrete incremental capital investments through the incremental capital module mechanism. The 2020 rate application was filed in accordance with the parameters of Enbridge Gas' OEB approved Price Cap Incentive Regulation rate setting mechanism and represents the second year of a five-year term. In December 2019, Enbridge Gas received a Decision and Order from the OEB which approved 2020 rates on an interim basis effective January 1, 2020. A decision on Enbridge Gas' application for incremental capital module amounts is expected in the second quarter of 2020.
TEXAS EASTERN PIPELINE RUPTURE
On August 1, 2019, a rupture occurred on Line 15, a 30-inch natural gas pipeline that is a component of the Texas Eastern natural gas pipeline system in Lincoln County, Kentucky. While the two adjacent pipelines have been returned to service, Line 15 remains shut down in the affected area and the timeline for its return to service has not yet been determined. There was one fatality. We are continuing to support the National Transportation Safety Board in its investigation, the community and the community members who were impacted by the rupture. The Texas Eastern natural gas pipeline system extends approximately 1,700 miles from producing fields in the Gulf Coast region of Texas and Louisiana to Ohio, Pennsylvania, New Jersey and New York.
Due to the incident, before expected recoveries, we experienced lower revenues and higher operating costs of $34 million in 2019. Texas Eastern Transmission, LP (Texas Eastern) is included in a comprehensive insurance program that is maintained for our subsidiaries and affiliates, which includes liability, property and business interruption insurance.
TEXAS EASTERN RATE CASE
On June 1, 2019, Texas Eastern put into effect its updated rates. These increased recourse rates are subject to refund and interest. Following extensive negotiations on the Texas Eastern rate case, we reached an agreement with shippers and filed a Stipulation and Agreement with the FERC on October 28, 2019. On January 13, 2020, the Administrative Law Judge certified this uncontested Stipulation and Agreement to the FERC and we expect a decision from the FERC in the second quarter of 2020. Upon receipt of a decision from the FERC we will begin recognizing updated rates within our results of operations.
RESULTS OF OPERATIONS
|
| | | | | | |
| | Year ended December 31, |
| | 2019 |
| 2018 |
| 2017 |
|
| (millions of Canadian dollars, except per share amounts) | |
| |
| |
|
| Segment earnings/(loss) before interest, income taxes and depreciation and amortization | |
| |
| |
|
| Liquids Pipelines | 7,681 |
| 5,331 |
| 6,395 |
|
| Gas Transmission and Midstream | 3,371 |
| 2,334 |
| (1,269 | ) |
| Gas Distribution and Storage | 1,747 |
| 1,711 |
| 1,390 |
|
| Renewable Power Generation | 111 |
| 369 |
| 372 |
|
| Energy Services | 250 |
| 482 |
| (263 | ) |
| Eliminations and Other | 429 |
| (708 | ) | (337 | ) |
| | | | |
| Depreciation and amortization | (3,391 | ) | (3,246 | ) | (3,163 | ) |
| Interest expense | (2,663 | ) | (2,703 | ) | (2,556 | ) |
| Income tax expense | (1,708 | ) | (237 | ) | 2,697 |
|
| Earnings attributable to noncontrolling interests and redeemable noncontrolling interests | (122 | ) | (451 | ) | (407 | ) |
| Preference share dividends | (383 | ) | (367 | ) | (330 | ) |
| Earnings attributable to common shareholders | 5,322 |
| 2,515 |
| 2,529 |
|
| Earnings per common share | 2.64 |
| 1.46 |
| 1.66 |
|
| Diluted earnings per common share | 2.63 |
| 1.46 |
| 1.65 |
|
EARNINGS ATTRIBUTABLE TO COMMON SHAREHOLDERS
Year ended December 31, 2019 compared with year ended December 31, 2018
Earnings Attributable to Common Shareholders were net positively impacted by $2,034 million due to certain unusual, infrequent or other non-operating factors, primarily explained by the following:
a non-cash, unrealized derivative fair value gain of $1,806 million ($1,276 million after-tax attributable to us) in 2019, compared with a loss of $660 million ($397 million after-tax attributable to us) in 2018, reflecting net fair value gains and losses arising from changes in the mark-to-market value of derivative financial instruments used to manage foreign exchange and commodity prices risks;
a non-cash, write-down of crude oil and natural gas inventories to the lower of cost or market in our Energy Services business segment of $188 million ($144 million after-tax attributable to us) in 2019, compared with $327 million ($239 million after-tax attributable to us) in 2018;
the absence in 2019 of a goodwill impairment charge of $1,019 million after-tax attributable to us in 2018 resulting from the classification of our Canadian natural gas gathering and processing businesses as held for sale;
| |
• | • Strong financial and operating performance • Delivered $4.67 DCF per share1 , above the absence in 2019 of a loss of $913 million ($701 million after-tax attributable to us) in 2018 on Midcoast Operating, L.P. and its subsidiaries (MOLP) resulting from a revision to the fair valuemidpoint of the assets held for sale based on the sale price;2020 guidance range |
the absence in 2019 of a loss of $154 million ($95 million after-tax attributable to us) in 2018 related to the Line 10 crude oil pipeline, which is a component of our Mainline System, resulting from its classification as an asset held for sale and the subsequent measurement at the lower of carrying value or fair value less costs to sell; and
employee severance, transition and transformation costs of $140 million ($127 million after-tax attributable to us) in 2019, compared with $203 million ($181 million after-tax attributable to us) in 2018.
The positive factors above were partially offset by the following unusual, infrequent or other non-operating factors:
a loss of $467 million after-tax attributable to us in 2019 ($268 million loss on sale and $199 million tax expense) resulting from the sale of the federally regulated portion of our Canadian natural gas gathering and processing businesses;
a loss of $310 million ($229 million after-tax attributable to us) in 2019 resulting from the review of our comprehensive long-term economic hedging program and a payment to certain hedge counterparties to pre-settle and reset the hedge rate on a portion of our hedging program;
a loss of $297 million ($218 million after-tax attributable to us) in 2019 resulting from the classification of our MATL assets as held for sale and the subsequent measurement at the lower of their carrying value or fair value less costs to sell;
a loss of $105 million ($79 million after-tax attributable to us) in 2019 resulting from the write-off of project costs related to the Access Northeast pipeline project;
a loss of $86 million ($68 million after-tax attributable to us) in 2019 related to sale of assets, asset write-down and goodwill impairment losses at our equity investee, DCP Midstream;
the absence in 2019 of a recovery of $223 million after-tax in 2018 related to rate cases filed that eliminated a portion of the regulated liability formerly included in our US Gas Transmission business rate base; and
the absence in 2019 of a deferred income tax recovery of $267 million ($196 million attributable to us) in 2018 related to a change in the assertion for the investment in Canadian renewable energy generation assets.
The non-cash, unrealized derivative fair value gains and losses discussed above generally arise as a result of a comprehensive long-term economic hedging program to mitigate interest rate, foreign exchange and commodity price risks. This program creates volatility in reported short-term earnings through the recognition of unrealized non-cash gains and losses on financial derivative instruments used to hedge these risks. Over the long-term, we believe our hedging program supports the reliable cash flows and
• Increased dividend growth upon which our investor value proposition is based.
After taking into consideration the factors above, the remaining $773 million increase in Earnings Attributable to Common Shareholders is primarily explained by the following significant business factors:
increased earnings from our Liquids Pipelines segment due to higher Flanagan South, Seaway Pipeline and Bakken Pipeline System throughput year-over-year;
stronger contributions from our Liquids Pipelines segment due to a higher IJT Benchmark Toll and higher Mainline System ex-Gretna throughput driven by an increase in supply and continuous capacity optimization;
contributions from new Gas Transmission and Midstream assets placed into service in the fourth quarter of 2018 and 2019;
increased earnings from our Gas Distribution and Storage segment due to colder weather experienced in our franchise areas, higher distribution rates and customer base, and the absence in 2019 of earnings sharing which was recognized in 2018;
increased earnings from our Energy Services segment due to the widening of certain location and quality differentials during the second half of 2018 and the first half of 2019, which increased opportunities to generate profitable transportation margins that were realized during 2019;
lower earnings attributable to noncontrolling interests in 2019 following the completion of the Sponsored Vehicles buy-in in the fourth quarter of 2018; and
the net favorable effect of translating United States dollar EBITDA at a higher Canadian to United States dollar average exchange rate (Average Exchange Rate) of $1.33 in 2019 compared with $1.30 in 2018, partially offset by realized losses arising from our foreign exchange risk management program.
The positive business factors above were partially offset by the following:
the absence in 2019 of earnings from MOLP and the provincially regulated portion of our Canadian natural gas gathering and processing businesses which were sold in the second half of 2018;
higher operating costs on our Gas Transmission and Midstream assets primarily due to higher pipeline integrity costs;
higher depreciation and amortization expense as a result of placing new assets into service, partially offset by depreciation no longer recorded for assets which were classified as held for sale or sold during the second half of 2018; and
higher income tax expense due to higher earnings, the buy-in of our United States sponsored vehicles in the fourth quarter of 2018 and lower foreign tax rate differentials in 2019.
REVENUES
We generate revenues from three primary sources: transportation and other services, gas distribution sales and commodity sales.
Transportation and other services revenues of $16,555 million, $14,358 million and $13,877 million for the years ended December 31, 2019, 2018 and 2017, respectively, were earned from our crude oil and natural gas pipeline transportation businesses and also include power generation revenues from our portfolio of renewable and power generation assets. For our transportation assets operating under market-based arrangements, revenues are driven by volumes transported and the corresponding tolls for transportation services. For assets operating under take-or-pay contracts, revenues reflect the terms of the underlying contract for services or capacity. For rate-regulated assets, revenues are charged in accordance with tolls established by the regulator, and in most cost-of-service based arrangements are reflective of our cost to provide the service plus a regulator-approved rate of return. Higher transportation and other services revenues reflected increased throughput on our core liquids pipeline assets combined with the incremental revenues associated with assets placed into service over the past three years.
Gas distribution sales revenues of $4,205 million, $4,360 million and $4,215 million for the years ended December 31, 2019, 2018 and 2017, respectively, were recognized in a manner consistent with the underlying rate-setting mechanism mandated by the regulator. Revenues generated by the gas distribution businesses are primarily driven by volumes delivered, which vary with weather and customer composition and utilization, as well as regulator-approved rates. The cost of natural gas is passed through to customers through rates and does not ultimately impact earnings due to its flow-through nature.
Commodity sales of $29,309 million, $27,660 million and $26,286 million for the years ended December 31, 2019, 2018 and 2017, respectively, were generated primarily through our Energy Services operations. Energy Services includes the contemporaneous purchase and sale of crude oil, natural gas, power and Natural Gas Liquids (NGLs) to generate a margin, which is typically a small fraction of gross revenue. While sales revenue generated from these operations are impacted by commodity prices, net margins and earnings are relatively insensitive to commodity prices and reflect activity levels which are driven by differences in commodity prices between locations, grades and points in time, rather than on absolute prices. Any residual commodity margin risk is closely monitored and managed. Revenues from these operations depend on activity levels, which vary from year-to-year depending on market conditions and commodity prices.
Our revenues also include changes in unrealized derivative fair value gains and losses related to foreign exchange and commodity price contracts used to manage exposures from movements in foreign exchange rates and commodity prices. The mark-to-market accounting creates volatility and impacts the comparability of revenues in the short-term, but we believe over the long-term, the economic hedging program supports reliable cash flows.
DIVIDENDS
We have paid common share dividends in every year since we became a publicly traded company in 1953. In December 2019, we announced a 9.8 percent increase in our quarterly dividend to $0.81 per common share, or $3.24 annualized, effective with the dividend payable on March 1, 2020.
BUSINESS SEGMENTS
LIQUIDS PIPELINES
|
| | | | | | |
| | 2019 |
| 2018 |
| 2017 |
|
| (millions of Canadian dollars) | |
| |
| |
|
| Earnings before interest, income taxes and depreciation and amortization | 7,681 |
| 5,331 |
| 6,395 |
|
Year ended December 31, 2019 compared with year ended December 31, 2018
EBITDA was positively impacted by $1,926 million due to certain unusual, infrequent or other non-operating factors, primarily explained by the following:
a non-cash, unrealized gain of $976 million in 2019 compared with a loss of $1,077 million in 2018 reflecting net fair value gains and losses arising from changes in the mark-to-market value of derivative financial instruments used to manage foreign exchange and commodity price risks; and
the absence in 2019 of a loss of $154 million in 2018 related to Line 10, which is a component of our Mainline System, resulting from its classification as an asset held for sale and the subsequent measurement at the lower of carrying value or fair value less costs to sell.
The positive factors above were partially offset by the following unusual, infrequent or other non-operating factors:
a loss of $310 million in 2019 resulting from the review of our comprehensive long-term economic hedging program and a payment to certain hedge counterparties to pre-settle and reset the hedge rate on a portion of our hedging program; and
a loss of $21 million in 2019 related to the write-off of project development costs resulting from the withdrawal of our permit application for the Texas COLT Offshore Loading Project.
After taking into consideration the factors above, the remaining $424 million increase is primarily explained by the following significant business factors:
higher Flanagan South and Seaway Pipeline throughput year-over-year driven by the redirection of throughput to the Gulf Coast resulting from refinery outages in the United States Midwest in the first half of 2019 and strong Gulf Coast demand resulting from favorable price differentials;
higher Bakken Pipeline System throughput year-over-year driven by strong production in the region;
higher Mainline System ex-Gretna throughput of 2,705 kbpd in 2019 compared with 2,631 kbpd in 2018 driven by an increase in supply and continuous capacity optimization;
a higher average IJT Benchmark Toll of $4.18 in 2019 compared with $4.11 in 2018; and
the net favorable effect of translating United States dollar EBITDA at a higher Average Exchange Rate of $1.33 in 2019 compared with $1.30 in 2018.
The positive business factors above were partially offset by the unfavorable effect of a lower foreign exchange hedge rate used to lock-in United States dollar denominated Canadian Mainline revenues of US$1.19 in 2019 compared with US$1.26 in 2018.
GAS TRANSMISSION AND MIDSTREAM
|
| | | | | | |
| | 2019 |
| 2018 |
| 2017 |
|
| (millions of Canadian dollars) | |
| |
| |
|
| Earnings/(loss) before interest, income taxes and depreciation and amortization | 3,371 |
| 2,334 |
| (1,269 | ) |
Year ended December 31, 2019 compared with year ended December 31, 2018
EBITDA was negatively impacted by the absence of contributions in 2019 of approximately $240 million from the sale of MOLP on August 1, 2018 and the sale of the provincially regulated portion of our Canadian natural gas gathering and processing businesses on October 1, 2018.
EBITDA was positively impacted by $1,237 million due to certain unusual, infrequent or other non-operating factors primarily explained by the following:
the absence in 2019 of a goodwill impairment charge of $1,019 million in 2018 resulting from the classification of our Canadian natural gas gathering and processing businesses as held for sale; and
the absence in 2019 of a loss of $913 million in 2018 resulting from the further revision to the fair value of our MOLP assets held for sale based on the sale price.
The positive factors above were partially offset by the following unusual, infrequent or other non-operating factors:
a loss of $268 million in 2019 resulting from the sale of the federally regulated portion of our Canadian natural gas gathering and processing businesses;
a loss of $105 million in 2019 resulting from the write-off of project costs related to the Access Northeast pipeline project;
a loss of $86 million in 2019 related to the sale of assets, asset write-downs and goodwill impairment losses at our equity investee, DCP Midstream; and
the absence in 2019 of a recovery of $223 million in 2018 related to rate cases filed that eliminated a portion of the regulated liability formerly included in our US Gas Transmission business rate base.
After taking into consideration the factors above, the remaining $40 million increase is primarily explained by the following significant business factors:
contributions from Valley Crossing Pipeline and certain other Offshore and US Gas Transmission assets that were placed into service during the fourth quarter of 2018 and 2019; and
the net favorable effect of translating United States dollar EBITDA at a higher Average Exchange Rate of $1.33 in 2019 compared with $1.30 in 2018.
The positive business factors above were partially offset by the following:
higher operating costs on our US Gas Transmission assets primarily due to higher pipeline integrity costs;
| |
• | lower revenues and higher operating costs from US Gas Transmission due to the Texas Eastern natural gas pipeline system incident in Lincoln County, Kentucky, refer to Recent Developments - Texas Eastern Rupture; and
|
decreased fractionation margins at our Aux Sable joint venture driven by lower NGL prices.
GAS DISTRIBUTION AND STORAGE
|
| | | | | | |
| | 2019 |
| 2018 |
| 2017 |
|
| (millions of Canadian dollars) | |
| |
| |
|
| Earnings before interest, income taxes and depreciation and amortization | 1,747 |
| 1,711 |
| 1,390 |
|
EGD and Union Gas were amalgamated on January 1, 2019. The amalgamated company has continued as Enbridge Gas. Post amalgamation the financial results of Enbridge Gas reflect the combined performance of EGD and Union Gas.
Year ended December 31, 2019 compared with year ended December 31, 2018
EBITDA was negatively impacted by $57 million due to certain unusual, infrequent or other non-operating factors, primarily explained by the following:
employee severance costs of $39 million in 2019 related to the amalgamation of EGD and Union Gas;
a loss of $10 million in 2019 resulting from the sale of St. Lawrence Gas; and
a non-cash, unrealized loss of $12 million in 2019 compared with a gain of $6 million in 2018 arising from the change in the mark-to-market value of our equity investee's, Noverco's derivative financial instruments.
The negative factors above were partially offset by the absence in 2019 of a negative equity earnings adjustment of $9 million in 2018 at our equity investee, Noverco, arising from the Tax Cuts and Jobs Act in the United States.
After taking into consideration the factors above, the remaining $93 million increase is primarily explained by the following significant business factors:
increased earnings of $36 million resulting from colder weather experienced in our franchise service areas when compared with the corresponding period in 2018;
increased earnings from higher distribution charges primarily resulting from increases in distribution rates and customer base;
the absence in 2019 of earnings sharing which was recognized in 2018 under EGD's previous incentive rate structure; and
synergy captures realized from the amalgamation of EGD and Union Gas.
The positive business factors above were partially offset by the following:
the effects of the accelerated capital cost allowance deductions reflected as a pass through to customers, consistent with the OEB's prescribed deferral account treatment; and
the absence of contributions in 2019 from EGNB and St. Lawrence Gas which were sold on October 1, 2019 and November 1, 2019, respectively.
RENEWABLE POWER GENERATION
|
| | | | | | |
| | 2019 |
| 2018 |
| 2017 |
|
| (millions of Canadian dollars) | |
| |
| |
|
| Earnings before interest, income taxes and depreciation and amortization | 111 |
| 369 |
| 372 |
|
Year ended December 31, 2019 compared with year ended December 31, 2018
EBITDA was negatively impacted by $247 million due to certain unusual, infrequent or other non-operating factors, primarily explained by the following:
| |
• | a loss of $297 million in 2019 resulting from the classification of our MATL assets as held for sale and the subsequent measurement at the lower of their carrying value or fair value less costs to sell; and
|
a loss of $10 million in 2019 related to the write-down of offshore transmission assets anticipated to be disposed of in 2020 at our equity investee, Rampion Offshore Wind Limited.
The negative factors above were partially offset by the following unusual, infrequent or other non-operating factors:
the absence in 2019 of a loss of $20 million in 2018 resulting from the sale of 49% of our interest in the Hohe See Offshore wind facility and its expansion;
the absence in 2019 of an asset impairment charge of $22 million in 2018 from our equity investment in NRGreen Power Limited Partnership related to the Chickadee Creek waste heat recovery facility in Alberta; and
| |
▪ | the absence in 2019 of a loss of $25 million in 2018 representing our share of losses incurred by our equity investee, Rampion Offshore Wind Limited, primarily due to the repair and restoration of damaged power transmission cables. |
After taking into consideration the factors above, the remaining $11 million decrease is primarily explained by the following significant business factors:
weaker wind resources at United States wind facilities;
higher mechanical repair costs at certain United States wind facilities, net of insurance recoveries; and
the absence in 2019 of $11 million in 2018 from a positive arbitration settlement related to our Canadian wind facilities.
The negative business factors above were partially offset by the following:
contributions from the Hohe See Offshore Wind Project, which generated first power in July 2019 and reached full operating capacity in October 2019; and
stronger wind resources at Canadian wind facilities.
ENERGY SERVICES
|
| | | | | | |
| | 2019 |
| 2018 |
| 2017 |
|
| (millions of Canadian dollars) | |
| |
| |
|
| Earnings/(loss) before interest, income taxes and depreciation and amortization | 250 |
| 482 |
| (263 | ) |
EBITDA from Energy Services is dependent on market conditions and results achieved in one period may not be indicative of results to be achieved in future periods.
Year ended December 31, 2019 compared with year ended December 31, 2018
EBITDA was net negatively impacted by $334 million due to certain unusual, infrequent or other non-operating factors, primarily explained by a non-cash, unrealized gain of $169 million in 2019 compared with a gain of $642 million in 2018 reflecting the revaluation of derivatives used to manage the profitability of transportation and storage transactions and manage the exposure to movements in commodity prices. This negative factor was partially offset by a non-cash, write-down of crude oil and natural gas inventories to the lower of cost or market of $188 million in 2019 compared with $327 million in 2018.
After taking into consideration the factors above, the remaining $102 million increase is primarily due to increased earnings from Energy Services crude operations as a result of the widening of certain location and quality differentials during the second half of 2018 and the first half of 2019, which increased opportunities to generate profitable transportation margins that were realized during 2019.
ELIMINATIONS AND OTHER
|
| | | | | | |
| | 2019 |
| 2018 |
| 2017 |
|
| (millions of Canadian dollars) | |
| |
| |
|
| Earnings/(loss) before interest, income taxes and depreciation and amortization | 429 |
| (708 | ) | (337 | ) |
Eliminations and Other includes operating and administrative costs and the impact of foreign exchange hedge settlements which are not allocated to business segments. Eliminations and Other also includes the impact of new business development activities and corporate investments.
Year ended December 31, 2019 compared with year ended December 31, 2018
EBITDA was positively impacted by $1,123 million due to certain unusual, infrequent or other-non-operating factors, primarily explained by the following:
a non-cash, unrealized gain of $671 million in 2019 compared with a loss of $256 million in 2018 reflecting net fair value gains and losses arising from the change in the mark-to-market value of derivative financial instruments used to manage foreign exchange risk;
employee severance, transition and transformation costs of $84 million in 2019 compared with $152 million in 2018; and
the absence in 2019 of asset monetization transaction costs of $68 million in 2018.
After taking into consideration the factors above, the remaining $14 million increase is primarily explained by lower operating and administrative costs in 2019.
GROWTH PROJECTS – COMMERCIALLY SECURED PROJECTS
The following table summarizes the status of our commercially secured projects, organized by business segment:
|
| | | | | | | |
| | | Enbridge's Ownership Interest |
| Estimated
Capital Cost1 | Expenditures
to Date2 | Status | Expected
In-Service
Date |
| (Canadian dollars, unless stated otherwise) | | | | |
| LIQUIDS PIPELINES | | | | | |
| 1. | AOC Lateral Acquisition | 100 | % | $0.3 billion | $0.3 billion | Complete | In-service |
| 2. | Gray Oak Pipeline Project | 22.8 | % | US$0.7 billion | US$0.4 billion | Complete | In-service |
| 3. | Canadian Line 3 Replacement Program | 100 | % | $5.3 billion | $4.9 billion | Complete | In-service |
| 4. | United States Line 3 Replacement Program | 100 | % | US$2.9 billion | US$1.3 billion | Pre-construction | Under review3 |
| 5. | Other - United States4 | 100 | % | US$0.6 billion | US$0.5 billion | Various stages | 2020 - 2021 |
| GAS TRANSMISSION AND MIDSTREAM | | | | |
| 6. | Atlantic Bridge5 | 100 | % | US$0.6 billion | US$0.5 billion | Various stages | 2H - 2020 |
| 7. | Spruce Ridge Project | 100 | % | $0.5 billion | $0.2 billion | Pre-construction | 2H - 2021 |
| 8. | T-South Reliability & Expansion Program | 100 | % | $1.0 billion | $0.4 billion | Pre-construction | 2H - 2021 |
| 9. | Other - United States6 | Various |
| US$1.2 billion | US$0.5 billion | Various stages | 2020 - 2023 |
| GAS DISTRIBUTION AND STORAGE | | | | |
| 10. | Other - Canada | 100 | % | $0.2 billion | No significant expenditures to date | Pre-construction | 2H - 2020 |
| 11. | Dawn-Parkway Expansion | 100 | % | $0.2 billion | No significant expenditures to date | Pre-construction | 2H - 2021 |
| RENEWABLE POWER GENERATION | | |
| 12. | Hohe See Offshore Wind Project and Expansion | 25 | % | $1.1 billion | $0.9 billion | Complete | In-service |
| (€0.67 billion) | (€0.6 billion) |
| 13. | East-West Tie Line | 25 | % | $0.2 billion | No significant expenditures to date | Under construction | 2H - 2021 |
| 14. | Saint-Nazaire Offshore Wind Project7 | 50 | % | $1.8 billion | $0.1 billion | Under construction | 2H - 2022 |
| (€1.2 billion) | (€0.04 billion) | |
1 These amounts are estimates and are subject to upward or downward adjustment based on various factors. Where appropriate, the amounts reflect our share of joint venture projects.
2 Expenditures to date reflect total cumulative expenditures incurred from inception of the project up to December 31, 2019.
3 Update to in-service date pending receipt of all permits required to commence construction.
4 Includes the Lakehead System Mainline Expansion - Line 61. Estimated in-service date will be adjusted to coincide with the in-service date of the U.S. L3R Program.
5 Includes Connecticut and New York portions of the project that were placed into service in 2017 and in the fourth quarter of 2019, respectively.
6 Includes the US$0.2 billion Stratton Ridge Project placed into service in the second quarter of 2019 and the US$0.1 billion Generation Pipeline Acquisition closed in the third quarter of 2019.
7 Our equity contribution is $0.3 billion, with the remainder of the project financed through non-recourse project level debt.
Risks related to the development and completion of growth projects are described under Part I. Item 1A.Risk Factors.
LIQUIDS PIPELINES
The following commercially secured growth projects were acquired or placed into service in 2019:
| |
• | AOC Lateral Acquisition - in January 2019, we acquired 75-kilometers (47-miles) of existing lateral pipelines and tankage infrastructure supporting Athabasca Oil Corporation's (AOC's) Leismer oil sands asset.
|
| |
• | Gray Oak Pipeline Project - a crude oil pipeline project connecting the Permian Basin and Eagle Ford to destinations in the Corpus Christi and Sweeny/Freeport markets. The pipeline is a joint development with Phillips 66 and could have an ultimate capacity of approximately 900,000 bpd, subject to additional shipper commitments. Initial in-service for the pipeline commenced in November 2019 with full in-service expected in the second quarter25th consecutive year
• Achieved $300 million of 2020. |
| |
• | Canadian Line 3 Replacement Program - replacement of the existing Line 3 crude oil pipeline between Hardisty, Alberta and Gretna, Manitoba. This will support the safety and operational reliability of the overall system, enhancing flexibility and allowing us to optimize throughput from western Canada into Superior, Wisconsin.
|
At this time, we cannot determine when all necessary permits will be issued for the following project:
| |
• | United States Line 3 Replacement Program - replacement of the existing Line 3 crude oil pipeline between Neche, North Dakota and Superior, Wisconsin. The U.S. L3R Program will support the safety and operational reliability of the Mainline System, enhance system flexibility and allow us to optimize throughput on the mainline. The U.S. L3R Program is expected to achieve the original capacity of approximately 760,000 bpd. The Wisconsin portion of the U.S. L3R Program is in service. For additional updates on the project, refer to Growth Projects - Regulatory Matters - United States Line 3 Replacement Program.
|
GAS TRANSMISSION AND MIDSTREAM
The following commercially secured growth project is expected to be placed into service in 2020:
| |
• | Atlantic Bridge - expansion of the Algonquin natural gas transmission systems to transport 133 million cubic feet per day (mmcf/d) of natural gas to the New England Region. The expansion primarily consists of various meter station additions, the replacement of a natural gas pipeline in Connecticut and New York, compression additions in Connecticut and a new compressor station in Massachusetts. The meter stations were placed into service in 2017 and 2018. The Connecticut portion of the project was placed into service in the fourth quarter of 2017. The New York portion of the project achieved partial in-service in November 2018 and reached full in-service in October 2019, upon which we began earning incremental revenues. Due to ongoing permitting delays in Massachusetts, the revised expected in service date for the Massachusetts portion of the project is the second half of 2020.
|
The following commercially secured growth projects are expected to be placed into service in 2021:
| |
• | Spruce Ridge Project - a natural gas pipeline expansion of Westcoast Energy Inc.'s BC Pipeline in northern BC. The project will provide additional capacity of up to 402 mmcf/d. Due to commercial delays, the revised expected in-service date is the second half of 2021.
|
| |
• | T-South Reliability & Expansion Program - a natural gas pipeline expansion of Westcoast Energy Inc.'s BC Pipeline in southern BC that will provide improved compressor reliability and additional capacity of approximately 190 mmcf/d into the Huntington/Sumas market at the United States/Canada border. The projects were approved by the CER in September 2019.
|
GAS DISTRIBUTION AND STORAGE
The following commercially secured growth project is expected to be placed into service in 2021:
| |
• | Dawn-Parkway Expansion - the expansion of the existing Dawn to Parkway gas transmission system, which provides transportation service from Dawn to the Greater Toronto Area. The project is expected to provide additional capacity of approximately 83 mmcf/d.
|
RENEWABLE POWER GENERATION
The following commercially secured growth project was placed into service in 2019:
| |
• | Hohe See Offshore Wind Project and Expansion - a wind project located in the North Sea, off the coast of Germany that will generate approximately 497-MW, with an additional 112-MW from the expansion. The Hohe See Project and Expansion is backed by a government legislated 20-year revenue support mechanism. The project generated first power in July 2019, and full operating capacity was reached in October 2019. The project expansion came into service in January 2020.
|
The following commercially secured growth project is expected to be placed into service in 2021:
| |
• | East-West Tie Line - a transmission project that will parallel an existing double-circuit, 230 kilovolt transmission line that connects the Wawa Transformer Station to the Lakehead Transformer Station near Thunder Bay, Ontario, including a connection midway in Marathon, Ontario.
|
The following commercially secured growth projects are expected to be placed into service in 2022:
| |
• | Saint-Nazaire Offshore Wind Project - a wind project located off the west coast of France that is expected to generate approximately 480-MW. Project revenues are backed by a 20-year fixed price power purchase agreement with added power production protection. Our share of the total investment in the project is $1.8 billion, with an equity contribution of $0.3 billion. The remainder of the construction will be financed through non-recourse project level debt.
|
GROWTH PROJECTS - REGULATORY MATTERS
United States Line 3 Replacement Program
On June 3, 2019, the Minnesota Court of Appeals rendered a decision on the MNPUC's adequacy determination of the FEIS for the U.S. L3R Program. While denying eight of the nine issues on appeal, the Minnesota Court of Appeals identified one issue that led it to reverse the adequacy determination. The Minnesota Court of Appeals remanded and directed the MNPUC to perform spill modeling analysis within the Lake Superior Watershed. On July 3, 2019, certain project opponents sought further appellate review from the Minnesota Supreme Court. On September 17, 2019, based on the respective responses of the MNPUC and the Company, the Minnesota Supreme Court denied the opponents’ petitions thus restoring the MNPUC with jurisdiction. At a hearing on October 1, 2019, the MNPUC directed the Department of Commerce to submit a revised FEIS by December 9, 2019. The Department of Commerce issued the revised FEIS on December 9, 2019 and the MNPUC gathered public comment on that document through January 16, 2020. On February 3, 2020, the MNPUC approved the adequacy of the revised FEIS and reinstated the Certificate of Need and Route Permit, clearing the way for construction of the pipeline to commence following the issuance of required permits.
As for environmental permits, the spill modeling required by the Minnesota Court of Appeals is a prerequisite to finalizing other state permits. On September 27, 2019, the Minnesota Pollution Control Agency (MPCA) issued a denial without prejudice of the U.S. L3R Program's 401 Water Quality Certification (WQC). This action was expected since the MPCA is prohibited by state law from issuing a final 401 WQC until the FEIS is found to be adequate by the MNPUC. On November 15, 2019, we submitted a revised 401 WQC to the MPCA. The MPCA is expected to release a draft of the revised 401 WQC on February 26, 2020, and a 30-day public comment period is expected to begin on March 2, 2020.
At this time, we cannot determine when all necessary permits to commence construction will be issued. Depending on the final in-service date, there is a risk that the project may exceed our total cost estimate of $9 billion for the combined Line 3 Replacement Program. However, at this time, we do not anticipate any capital cost impacts that would be material to our financial position and outlook.
OTHER ANNOUNCED PROJECTS UNDER DEVELOPMENT
The following projects have been announced by us, but have not yet met our criteria to be classified as commercially secured:
LIQUIDS PIPELINES
| |
• | Sea Port Oil Terminal Project - the Sea Port Oil Terminal (SPOT) project consists of onshore and offshore facilities, including a fixed platform located approximately 30 miles off the coast of Brazoria County, Texas. SPOT is designed to load very large crude carriers at rates of approximately 85,000 barrels per hour, or up to approximately 2 million bpd. Along with Enterprise Products Partners, L.P., we announced our intent to jointly develop and market SPOT, and we will work to finalize an equity participation agreement. The agreement will allow us to purchase an ownership interest in SPOT, subject to SPOT receiving a deep-water port license.
|
| |
• | Jones Creek Crude Oil Storage Terminal - the Jones Creek terminal is expected to have an ultimate capability of up to 15 million barrels of storage, access to crude oil from all major North American production basins and will be fully integrated with the Seaway Pipeline system to allow for access to Houston-area refineries, existing export facilities, the SPOT project and other facilities in the future.
|
GAS TRANSMISSION AND MIDSTREAM
| |
• | Rio Bravo Pipeline- the Rio Bravo Pipeline is designed to transport up to 4.5 bcf/d of natural gas from the Agua Dulce supply area to NextDecade's Rio Grande LNG export facility in the Port of Brownsville, Texas. We have executed an agreement with NextDecade to acquire the Rio Bravo Pipeline development project. In addition, we have negotiated a precedent agreement with NextDecade, to be executed at closing, under which we will provide firm transportation capacity on the Rio Bravo Pipeline to NextDecade's Rio Grande LNG export facility for a term of at least twenty years. Construction of the pipeline will be subject to the Rio Grande LNG export facility reaching a final investment decision.
|
| |
• | Annova LNG - we have executed a precedent agreement to supply the Annova LNG facilities in the Port of Brownsville, Texas for a term of at least twenty years, by expanding our existing Valley Crossing system. The expansion will be subject to the Annova LNG facilities reaching a final investment decision.
|
| |
• | Texas Eastern Venice Extension Project - a reversal and expansion of Texas Eastern’s Line 40 from its existing New Roads compressor station to a new delivery point with the proposed Gator Express pipeline just south of Texas Eastern’s Larose compressor station. The project is expected to deliver 1.26 bcf of feed gas to Venture Global’s proposed Plaquemines LNG export facility located in Plaquemine Parish, Louisiana. The project is expected to be placed into service in 2022.
|
RENEWABLE POWER GENERATION
| |
• | Éolien Maritime France SAS - a 50% interest in EMF, a French offshore wind development company, which is co-owned by EDF Energies Nouvelles, a subsidiary of Électricité de France S.A. EMF holds licenses for three large-scale offshore wind facilities off the coast of France that is expected to generate approximately 1,428 MW. One wind facility, the Saint-Nazaire Offshore Wind Project, achieved a positive final investment decision during the third quarter of 2019. The development of the remaining two wind facilities is subject to final investment decisions and regulatory approvals, the timing of which are not yet certain.
|
We also have a large portfolio of additional projects under development that have not yet progressed to the point of public announcement.
LIQUIDITY AND CAPITAL RESOURCES
The maintenance of financial strength and flexibility is fundamental to our growth strategy, particularly in light of the significant number and size of capital projects currently secured or under development. Access to timely funding from capital markets could be limited by factors outside our control, including but not limited to financial market volatility resulting from economic and political events both inside and outside North America. To mitigate such risks, we actively manage financial plans and strategies to ensure we maintain sufficient liquidity to meet routine operating and future capital requirements. In the near term, we generally expect to utilize cash from operations together with commercial paper issuance and/or credit facility draws and the proceeds of capital market offerings to fund liabilities as they become due, finance capital expenditures, fund debt retirements and pay common and preference share dividends. We target to maintain sufficient liquidity through securement of committed credit facilities with a diversified group of banks and financial institutions to enable us to fund all anticipated requirements for approximately one year without accessing the capital markets.
Our financing plan is regularly updated to reflect evolving capital requirements and financial market conditions and identifies a variety of potential sources of debt and equity funding alternatives. Our current financing plan does not include any issuances of additional common equity and was the leading principle behind the suspension of our Dividend Reinvestment and Share Purchase Plan in November 2018.
CAPITAL MARKET ACCESS
We ensure ready access to capital markets, subject to market conditions, through maintenance of shelf prospectuses that allow for issuance of long-term debt, equity and other forms of long-term capital when market conditions are attractive. In accordance with our funding plan we completed the following issuances in 2019:
|
| | |
Entity | Type | Advanced and extended secured growth program | | • Completed $1.6 billion of Issuance | Amountsecured growth projects in 2020• Added $5 billion of planned gas pipeline modernization and utility growth capital projects to secured growth inventory through 2023 • Reached final investment decisions on 500 MW Fécamp offshore wind farm • Completed construction of the U.S. portion of Line 3 Replacement Program in North Dakota and commenced construction on the final segment in Minnesota • Advanced development and construction on $16 billion of capital to be placed into service between 2021 and 2023 |
(in millions of Canadian dollars, unless stated otherwise) | |
Enbridge Inc. | Medium-term notes | $1,000 |
Enbridge Inc. | US$ senior notes | US$2,000 |
Enbridge Gas Inc. | Medium-term notes | $700 |
Enbridge Pipelines Inc. | Medium-term notes | $1,200 |
| | Maintained balance sheet strength and flexibility | | • Exited 2020 with 4.6xDebt-to-EBITDA • Maintained industry-leading investment grade credit ratings • Added $3 billion of available liquidity • Sold $400 million in assets, further strengthening financial flexibility |
| | |
| | Advanced strategic priorities | | • Advanced Mainline Contracting offering process with the Canada Energy Partners, LPRegulator • Completed rate proceedings on Texas Eastern, Algonquin and B.C. Pipeline systems • Realized synergy capture within Gas Distribution and Storage |
| US$ senior notes | US$500DCF per share is anon-GAAP measure; this measure is defined and reconciled in Item 11 –“Non-GAAP reconciliation”. |
Compensation highlights for 2020
The following table shows annual base salary increases, voluntary base salary reductions and awards under the short-, medium- and long-term incentive plans for the NEOs, in each case as a percentage of base salary:
| | | | | | | | | | | | | | | | | | | | |
| | | | | |
| | Annual base salary increase 1 | | | | | | Short-term incentive payment | | | Medium-term incentive award | | | | |
| | | | | |
| | | 5% | | | | -15% | | | | 207% | | | | 520% | | | | 130% | |
| | | | | |
| | | | | | | -10% | | | | 130% | | | | 320% | | | | 80% | |
| | | | | |
| | | 3% | | | | -10% | | | | 127% | | | | 320% | | | | 80% | |
| | | | | |
| | | 3% | | | | -10% | | | | 121% | | | | 320% | | | | 80% | |
| | | | | |
| | | | | | | -10% | | | | 114% | | | | 320% | | | | 80% | |
| | | | | |
| | | 5% | | | | -10% | | | | 114% | | | | 280% | | | | 70% | |
| Annual base salary increases were effective April 1, 2020. |
| In response to theCOVID-19 pandemic, reduced energy demand and reduced commodity prices, the CEO implemented voluntary base salary reductions, effective June 1, 2020. |
| Mr. Gruending and Mr. Yu each received a base salary increase to better align their positioning relative to the competitive market, as part of aphased-in approach since their role changes in 2019. |
Compensation policies and practices
| |
1 | Issued through Algonquin Gas Transmission, LLC, an operating subsidiary of Spectra Energy Partners, LP (SEP). |
Credit Facilities, Ratings and Liquidity
To ensure ongoing liquidity and to mitigate the risk of capital market disruption, we maintain ready access to funds through committed bank credit facilities and actively manage our bank funding sources to optimize pricing and other terms. The following table provides details of our committed credit facilities at December 31, 2019:
|
| | | | | | | |
| | | Total |
| |
| |
|
| | Maturity | Facilities |
| Draws1 |
| Available |
|
| (millions of Canadian dollars) | | |
| |
| |
|
| Enbridge Inc. | 2021-2024 | 6,993 |
| 5,210 |
| 1,783 |
|
| Enbridge (U.S.) Inc. | 2021-2024 | 7,132 |
| 1,734 |
| 5,398 |
|
| Enbridge Pipelines Inc. | 2021 | 3,000 |
| 2,030 |
| 970 |
|
| Enbridge Gas Inc. | 2021 | 2,000 |
| 898 |
| 1,102 |
|
| Total committed credit facilities | | 19,125 |
| 9,872 |
| 9,253 |
|
| |
1 | Includes facility draws and commercial paper issuances that are back-stopped by the credit facility. |
On February 7, 2019 and February 8, 2019, we terminated certain Canadian and United States dollar credit facilities, including facilities held by Enbridge, Enbridge Gas, Enbridge Energy Partners, L.P. (EEP) and SEP. We also increased existing facilities or obtained new facilities to replace the terminated ones under Enbridge, Enbridge (U.S.) Inc. and Enbridge Gas. As a result, our total credit facility availability increased by approximately $444 million.
On May 16, 2019, Enbridge Inc. entered into a three year, non-revolving, extendible credit facility for $641 million (¥52.5 billion) with a syndicate of Japanese banks.
On July 18, 2019, Enbridge Inc. entered into a five year, non-revolving, bilateral credit facility for $500 million with an Asian bank.
In addition to the committed credit facilities noted above, we have $916 million of uncommitted demand facilities, of which $476 million were unutilized as at December 31, 2019. As at December 31, 2018, we had $807 million of uncommitted credit facilities, of which $548 million were unutilized.
As at December 31, 2019 and 2018, our net available liquidity totaled $9,901 million and $9,409 million, respectively. As at December 31, 2019, the liquidity was inclusive of $648 million of unrestricted Cash and cash equivalents as reported on the Consolidated Statements of Financial Position (2018 - $518 million).
Our credit facility agreements and term debt indentures include standard events of default and covenant provisions, whereby accelerated repayment and/or termination of the agreements may result if we were to default on payment or violate certain covenants. As at December 31, 2019, we were in compliance with all debt covenants and expect to continue to comply with such covenants.
Strong growth in internal cash flow, proceeds from non-core asset dispositions, ready access to liquidity from diversified sources and a stable business model have enabled us to manage our credit profile. We actively monitor and manage key financial metrics with the objective of sustaining investment grade credit ratings from the major credit rating agencies and ongoing access to bank funding and term debt capital on attractive terms. Key measures of financial strength that are closely managed include the ability to service debt obligations from operating cash flow and the ratio of debt to EBITDA.
During 2019, our credit ratings were affirmed as follows:
On July 23, 2019, DBRS Limited affirmed our issuer rating and medium-term notes and unsecured debentures rating of BBB (high), fixed-to-floating subordinated notes rating of BBB (low), preference share rating of Pfd-3 (high) and commercial paper rating of R-2 (high), all with stable outlooks.
On April 15, 2019, Fitch Rating services affirmed long-term issuer default rating and senior unsecured debt rating of BBB+, preference share rating of BBB-, junior subordinated note rating of BBB-, and short-term and commercial paper rating of F2 with a stable rating outlook.
On January 25, 2019, Moody’s Investor Services, Inc. upgraded our issuer and senior unsecured ratings from Baa3 to Baa2 with outlook revised to positive, upgraded our subordinated rating from Ba2 to Ba1, preference share rating from Ba2 to Ba1 and the commercial paper rating for Enbridge (U.S.) Inc. from P-3 to P-2.
On December 30, 2019, Standard & Poor’s Rating Services (S&P) affirmed our corporate credit rating and senior unsecured debt rating of BBB+, preference share rating of P-2 (low) and commercial paper rating of A-1 (low), and reaffirmed a stable outlook. S&P also affirmed our global overall short-term rating of A-2.
We invest surplus cash in short-term investment grade money market instruments with highly creditworthy counterparties. Short-term investments were $2 million as at December 31, 2019 compared with $76 million as at December 31, 2018.
There are no material restrictions on our cash. Total restricted cash of $28 million, as reported on the Consolidated Statements of Financial Position, primarily includes cash collateral and amounts received in respect of specific shipper commitments. Cash and cash equivalents held by certain subsidiaries may not be readily accessible for alternative use by us.
Excluding current maturities of long-term debt, as at December 31, 2019 and 2018, we had a negative working capital position of $2,781 million and $3,024 million, respectively. In both periods, the major contributing factor to the negative working capital position was the current liabilities associated with our growth capital program.
To address this negative working capital position, we maintain significant liquidity in the form of committed credit facilities and other sources as previously discussed, which enable the funding of liabilities as they become due.
SOURCES AND USES OF CASH
|
| | | | | | |
| December 31, | 2019 |
| 2018 |
| 2017 |
|
| (millions of Canadian dollars) | |
| |
| |
|
| Operating activities | 9,398 |
| 10,502 |
| 6,658 |
|
| Investing activities | (4,658 | ) | (3,017 | ) | (11,037 | ) |
| Financing activities | (4,745 | ) | (7,503 | ) | 3,476 |
|
| Effect of translation of foreign denominated cash and cash equivalents | 44 |
| 68 |
| (72 | ) |
| Net increase/(decrease) in cash and cash equivalents and restricted cash | 39 |
| 50 |
| (975 | ) |
Significant sources and uses of cash for the years ended December 31, 2019 and 2018 are summarized below:
Operating Activities
2019
| |
• | The decrease in cash flow provided by operations during 2019 was primarily driven by changes in operating assets and liabilities. Our operating assets and liabilities fluctuate in the normal course due to various factors, including the impact of fluctuations in commodity prices and activity levels on working capital within our business segments, the timing of tax payments, as well as timing of cash receipts and payments generally. Refer to Part II. Item 8. Financial Statements and Supplementary Data - Note 28. Changes in Operating Assets and Liabilities.
|
| |
• | The factor above was partially offset by stronger contributions from our operating segments and contributions from new assets placed into service as discussed under Results of Operations.
|
2018
The increase in cash flow provided by operations during 2018 was primarily driven by changes in operating assets and liabilities and stronger contributions from our operating segments.
Investing Activities
We continue with the execution of our growth capital program which is further described in Part II. Item 7. Management's Discussion and Analysis of Financial Condition and Results of Operations - Growth Projects - Commercially Secured Projects. The timing of project approval, construction and in-service dates impacts the timing of cash requirements.
A summary of additions to property, plant and equipment for the years ended December 31, 2019, 2018 and 2017 is set out below:
|
| | | | | | |
| Year ended December 31, | 2019 |
| 2018 |
| 2017 |
|
| (millions of Canadian dollars) | |
| |
| |
|
| Liquids Pipelines | 2,548 |
| 3,102 |
| 2,797 |
|
| Gas Transmission and Midstream | 1,695 |
| 2,578 |
| 3,883 |
|
| Gas Distribution and Storage | 1,100 |
| 1,066 |
| 1,177 |
|
| Renewable Power Generation | 23 |
| 33 |
| 321 |
|
| Energy Services | 2 |
| — |
| 1 |
|
| Eliminations and Other | 124 |
| 27 |
| 108 |
|
| Total capital expenditures | 5,492 |
| 6,806 |
| 8,287 |
|
2019
The increase in cash used in investing activities primarily resulted from the following factors:
Lower proceeds from asset dispositions in 2019 compared with 2018. In 2019, the proceeds from dispositions reflects the sale of the federally regulated portion of our Canadian natural gas gathering and processing businesses assets, St. Lawrence Gas and EGNB. In 2018, the proceeds from dispositions reflects the sale of MOLP, a portion of our renewable assets and the provincially regulated portion of our Canadian natural gas gathering and processing businesses assets.
The absence in 2019 of a distribution received from Sabal Trail in 2018 as a partial return of capital for construction and development costs previously funded by Sabal Trail's partners.
2018
The decrease in cash used in investing activities primarily resulted from the following factors:
Higher proceeds from asset dispositions in 2018 compared with 2017 primarily due to the sale of MOLP, a portion of our renewable assets and the provincially regulated portion of our Canadian natural gas gathering and processing businesses assets in 2018.
The absence in 2018 of the acquisition of an interest in the Bakken Pipeline System in 2017.
Financing Activities
2019
The decrease in cash used in financing activities primarily resulted from the following factors:
Increased commercial paper and credit facility draws and increased long-term debt issued in 2019 compared with 2018, partially offset by higher repayments of maturing long-term debt.
Decreased distributions to noncontrolling interests and redeemable noncontrolling interests in 2019 primarily as a result of the Sponsored Vehicles buy-in in the fourth quarter of 2018.
The absence in 2019 of proceeds received from the sale of a portion of our interest in our Canadian and United States renewable assets to the Canada Pension Plan Investment Board (CPPIB) in the third quarter of 2018.
The above factors were partially offset by higher common share dividend payments in 2019 due to the increase in the common share dividend rate and an increase in the number of common shares outstanding in connection with the Sponsored Vehicles buy-in in the fourth quarter of 2018.
2018
The increase in cash used in financing activities primarily resulted from the following factors:
Decreased long-term debt issuances and common shares issued in 2018 when compared with 2017, partially offset by lower repayments of maturing long-term debt.
Higher common share dividend payments in 2018 due to the increase in the common share dividend rate and an increase in the number of common shares outstanding as a result of common shares issued in connection with the Merger Transaction and the issuance of approximately 33 million common shares in December 2017 in a private placement offering.
Proceeds received from the sale of a portion of our interest in our Canadian and United States renewable assets to the CPPIB in the third quarter of 2018.
Decreased contributions from noncontrolling interests and redeemable noncontrolling interests in 2018 primarily due to a secondary public offering in 2017 attributable to our holdings in Enbridge Income Fund Holdings Inc. (ENF).
Preference Share Issuances
Since July 2011, we have issued 315 million preference shares for gross proceeds of approximately $7.9 billion with the following characteristics.
|
| | | | | | | | | | |
| | Gross Proceeds | Dividend Rate |
| Dividend1 |
| Per Share Base Redemption Value2 | Redemption and Conversion Option Date2,3 |
| Right to Convert Into3,4 |
|
| (Canadian dollars, unless otherwise stated) | |
| | |
| |
|
| Series A | $125 million | 5.50 | % | $1.37500 | $25 | — |
| — |
|
| Series B | $457 million | 3.42 | % | $0.85360 | $25 | June 1, 2022 |
| Series C |
|
Series C5 | $43 million | 3-month treasury bill plus 2.40% |
| — |
| $25 | June 1, 2022 |
| Series B |
|
Series D6 | $450 million | 4.46 | % | $1.11500 | $25 | March 1, 2023 |
| Series E |
|
Series F6 | $500 million | 4.69 | % | $1.17224 | $25 | June 1, 2023 |
| Series G |
|
Series H6 | $350 million | 4.38 | % | $1.09400 | $25 | September 1, 2023 |
| Series I |
|
| Series J | US$200 million | 4.89 | % | US$1.22160 | US$25 | June 1, 2022 |
| Series K |
|
| Series L | US$400 million | 4.96 | % | US$1.23972 | US$25 | September 1, 2022 |
| Series M |
|
Series N6 | $450 million | 5.09 | % | $1.27152 | $25 | December 1, 2023 |
| Series O |
|
| Series P | $400 million | 4.38 | % | $1.09476 | $25 | March 1, 2024 |
| Series Q |
|
| Series R | $400 million | 4.07 | % | $1.01825 | $25 | June 1, 2024 |
| Series S |
|
Series 16 | US$400 million | 5.95 | % | US$1.48728 | US$25 | June 1, 2023 |
| Series 2 |
|
| Series 3 | $600 million | 3.74 | % | $0.93425 | $25 | September 1, 2024 |
| Series 4 |
|
| Series 5 | US$200 million | 5.38 | % | US$1.34383 | US$25 | March 1, 2024 |
| Series 6 |
|
| Series 7 | $250 million | 4.45 | % | $1.11224 | $25 | March 1, 2024 |
| Series 8 |
|
| Series 9 | $275 million | 4.10 | % | $1.02424 | $25 | December 1, 2024 |
| Series 10 |
|
| Series 11 | $500 million | 4.40 | % | $1.10000 | $25 | March 1, 2020 |
| Series 12 |
|
| Series 13 | $350 million | 4.40 | % | $1.10000 | $25 | June 1, 2020 |
| Series 14 |
|
| Series 15 | $275 million | 4.40 | % | $1.10000 | $25 | September 1, 2020 |
| Series 16 |
|
| Series 17 | $750 million | 5.15 | % | $1.28750 | $25 | March 1, 2022 |
| Series 18 |
|
| Series 19 | $500 million | 4.90 | % | $1.22500 | $25 | March 1, 2023 |
| Series 20 |
|
| |
1 | The holder is entitled to receive a fixed, cumulative, quarterly preferential dividend, as declared by the Board of Directors. With the exception of Series A and Series C Preference Shares, such fixed dividend rate resets every five years beginning on the initial redemption and conversion option date. The Series 17 and Series 19 Preference Shares contain a feature where the fixed dividend rate, when reset every five years, will not be less than 5.15% and 4.90%, respectively. No other series of Preference Shares has this feature. |
| |
2 | Series A Preference Shares may be redeemed any time at our option. For all other series of Preference Shares, we, may at our option, redeem all or a portion of the outstanding Preference Shares for the Base Redemption Value per share plus all accrued and unpaid dividends on the Redemption Option Date and on every fifth anniversary thereafter. |
| |
3 | The holder will have the right, subject to certain conditions, to convert their shares into Cumulative Redeemable Preference Shares of a specified series on a one-for-one basis on the Conversion Option Date and every fifth anniversary thereafter at an ascribed issue price equal to the Base Redemption Value. |
| |
4 | With the exception of Series A Preference Shares, after the redemption and conversion option dates, holders may elect to receive quarterly floating rate cumulative dividends per share at a rate equal to: $25 x (number of days in quarter/365) x 90 day Government of Canada treasury bill rate + 2.4% (Series C), 2.4% (Series E), 2.5% (Series G), 2.1% (Series I), 2.7% (Series O), 2.5% (Series Q), 2.5% (Series S), 2.4% (Series 4), 2.6% (Series 8), 2.7% (Series 10), 2.6% (Series 12), 2.7% (Series 14), 2.7% (Series 16), 4.1% (Series 18) or 3.2% (Series 20); or US$25 x (number of days in quarter/365) x three-month United States Government treasury bill rate + 3.1% (Series K), 3.2% (Series M), 3.1% (Series 2) or 2.8% (Series 6).
|
| |
5 | The floating quarterly dividend amount for the Series C Preference Shares was decreased to $0.25395 from $0.25459 on March 1, 2019, was increased to $0.25647 from $0.25395 on June 1, 2019, was decreased to $0.25243 from $0.25647 on September 1, 2019 and was increased to $0.25305 from $0.25243 on December 1, 2019, due to reset on a quarterly basis following the issuance thereof.
|
| |
6 | No Series P, R, 3, 5, 7 or 9 Preference shares were converted on the March 1, 2019, June 1, 2019, September 1, 2019, March 1, 2019, March 1, 2019 or December 1, 2019 conversion option dates, respectively. However, the quarterly dividend amounts for Series P, R, 3, 5, 7 or 9, was increased to $0.27369 from $0.25000 on March 1, 2019, increased to $0.25456 from $0.25000 on June 1, 2019, decreased to $0.23356 from $0.25000 on September 1, 2019, increased to US$0.33625 from |
US$0.27500 on March 1, 2019, increased to $0.27806 from $0.27500 on March 1, 2019 and decreased to $0.25606 from $0.27500 on December 1, 2019, respectively, due to reset on every fifth anniversary thereafter.
Common Share Issuances
In the fourth quarter of 2018, we completed the issuance of 297 million common shares with a value of $12.7 billion in connection with the Sponsored Vehicles buy-in. For further information refer to Part II. Item 8. Financial Statements and Supplementary Data -Note 21. Share Capital.
Dividends
For the years ended December 31, 2019 and 2018, total dividends paid were $5,973 million and $4,661 million, respectively, of which $5,973 million and $3,480 million, respectively, were paid in cash and reflected in financing activities. In 2018, $1,181 million of dividends paid were reinvested pursuant to our previous dividend reinvestment program and resulted in the issuance of common shares rather than a cash payment.
On December 9, 2019, our Board of Directors declared the following quarterly dividends. All dividends are payable on March 1, 2020 to shareholders of record on February 14, 2020.
|
| | | |
| | |
| $0.81000 |
| |
Preference Shares, Series A |
| $0.34375 |
|
Preference Shares, Series B |
| $0.21340 |
|
Preference Shares, Series C2
|
| $0.25305✓ Use aphilosophy whereby the majority of compensation provided to executives is “at risk” |
| Pay out incentive awards when unwarranted by performance | | |
Preference Shares, Series D |
| $0.27875 |
|
Preference Shares, Series F |
| $0.29306 |
|
Preference Shares, Series H |
| $0.27350 |
|
Preference Shares, Series J |
| US$0.30540 |
|
Preference Shares, Series L |
| US$0.30993 |
|
Preference Shares, Series N |
| $0.31788 |
|
Preference Shares, Series P3
|
| $0.27369✓ Use a blend of short-, medium- and long-term incentive awards that are linked to business plans for the respective timeframe |
| Count performance stock units, unvested restricted stock units or unexercised stock options toward stock ownership requirements | | |
| | | |
Preference Shares, Series R4
|
| $0.25456✓ Incorporate risk management principles into all decision-making processes to ensure compensation programs do not encourage inappropriate or excessive risk-taking by executives |
| Grant stock options with exercise prices below 100% fair market value orre-price options | | |
Preference Shares, Series 1 |
| US$0.37182 |
|
Preference Shares, Series 35
|
| $0.23356✓ Regularly review executive compensation programs through third-party experts to ensure ongoing alignment with shareholders and regulatory compliance |
| Use employment agreements with single-trigger voluntary termination rights in favor of executives | | |
| | | |
Preference Shares, Series 56
|
| US$0.33596✓ Use both preventative and incident-based safety, environmental and operational metrics that are directly linked to short-term incentive awards |
| Permit hedging of Enbridge securities | | |
| | | |
Preference Shares, Series 77
|
| $0.27806✓ Have meaningful stock ownership requirements that align the interests of executives with those of Enbridge shareholders |
| Grant loans to directors or senior executives | | |
| | | |
Preference Shares, Series 98
|
| $0.25606✓ Benchmark executive compensation programs against a group of similar companies in Canada and the U.S. to ensure that executives are rewarded at competitive levels |
| Provide stock options tonon-employee directors | | |
Preference Shares, Series 11 |
| $0.27500 |
|
Preference Shares, Series 13 |
| $0.27500✓ Have an incentive compensation clawback policy |
| | | |
Preference Shares, Series 15 |
| $0.27500 |
|
Preference Shares, Series 17 |
| $0.32188✓ Use double-triggerprovisions within all incentive plan agreements beginning in 2017 |
|
Preference Shares, Series 19 |
Apply taxgross-ups to awards | $0.30625 |
|
1 The quarterly dividend per common share was increased 9.8% to $0.81000 from $0.73800, effective March 1, 2020.2 The quarterly dividend per share paid on Series C was decreased to $0.25395 from $0.25459 on March 1, 2019, increased to $0.25647 from $0.25395 on June 1, 2019, decreased to $0.25243 from $0.25647 on September 1, 2019, and increased to $0.25305 from $0.25243 on December 1, 2019, due to reset on a quarterly basis following the date21
3 The quarterly dividend per share paid on Series P was increased to $0.27369 from $0.25000 on March 1, 2019, due to reset of the annual dividend on March 1, 2019, and every five years thereafter.
4 The quarterly dividend per share paid on Series R was increased to $0.25456 from $0.25000 on June 1, 2019, due to the reset of the annual dividend on June 1, 2019, and every five year thereafter.
5 The quarterly dividend per share paid on Series 3 was decreased to $0.23356 from $0.25000 on September 1, 2019, due to the reset of the annual dividend on September 1, 2019, and every five year thereafter.
6 The quarterly dividend per share paid on Series 5 was increased to US $0.33596 from US $0.27500 on March 1, 2019, due to reset of the annual dividend on March 1, 2019, and every five years thereafter.
7 The quarterly dividend per share paid on Series 7 was increased to $0.27806 from $0.27500 on March 1, 2019, due to reset of the annual dividend on March 1, 2019, and every five years thereafter.
8 The quarterly dividend per share paid on Series 9 was decreased to $0.25606 from $0.27500 on December 1, 2019, due to the reset of the annual dividend on December 1, 2019, and every five years thereafter.
OFF-BALANCE SHEET ARRANGEMENTSAssessing 2020 performance
We enter into guarantee arrangements inAs always, Enbridge’s focus on the normal coursesafety of business to facilitate commercial transactions with third parties. These arrangements include financial guarantees, stand-by letters of credit, debt guarantees, surety bondsits employees, their families and indemnifications. See Part II. Item 8. Financial Statements and Supplementary Data - Note 31. Guarantees for further discussion of guarantee arrangements.
Most oftheir communities was at the
guarantee arrangements that we enter into enhance the credit standings of certain subsidiaries, non-consolidated entities or less than 100%-owned entities, enabling them to conduct business. As such, these guarantee arrangements involve elements of performance and credit risk which are not included on our Consolidated Statements of Financial Position. The possibility of us having to honor our contingencies is largely dependent upon the future operationsforefront of our
subsidiaries, investeescorporate actions in response to theCOVID-19
pandemic. Our response was swift and
other third parties, or the occurrence of certain future events. Issuance of these guarantee arrangements is not requiredcompassionate, supporting our employees and our operations. This included implementing an immediate work-from-home policy wherever possible and new safety protocols to protect our people, keeping our systems running safely and maintaining work on critical projects.The following tables and charts outline key performance achievements for the majority of our operations.2020.
We do not have material off-balance sheet financing entities or structures, except for normal operating lease arrangements, guarantee arrangements and financings entered into by our equity investments. For additional information on these commitments, see Part II. Item 8. Financial Statements and Supplementary Data -Note 30. Commitments and Contingencies and Note 31. Guarantees.
We do not have material off-balance sheet arrangements that have or are reasonably likely to have a current or future effect on our financial condition, changes in financial condition, revenues or expenses, results of operations, liquidity, capital expenditures or capital resources.
CONTRACTUAL OBLIGATIONS
Payments due under contractual obligations over the next five years and thereafter are as follows:
|
| | | | | | | | | | |
| As at December 31, 2019 | Total |
| Less than 1 year |
| 1-3 years |
| 4-5 years |
| After 5 years |
|
| (millions of Canadian dollars) | |
| |
| |
| |
| |
|
Annual debt maturities1 | 63,585 |
| 4,394 |
| 10,910 |
| 10,297 |
| 37,984 |
|
Interest obligations2 | 29,498 |
| 2,416 |
| 4,512 |
| 3,991 |
| 18,579 |
|
| Land leases | 1,190 |
| 30 |
| 70 |
| 71 |
| 1,019 |
|
Pension obligations3 | 135 |
| 135 |
| — |
| — |
| — |
|
Long-term contracts4 | 9,883 |
| 2,947 |
| 2,832 |
| 1,179 |
| 2,925 |
|
Other long-term liabilities5 | — |
| — |
| — |
| — |
| — |
|
| Total contractual obligations | 104,291 |
| 9,922 |
| 18,324 |
| 15,538 |
| 60,507 |
|
| |
1 | Includes debentures, term notes, commercial paper and credit facility draws based on the facility's maturity date and excludes short-term borrowings, debt discount, debt issue costs and finance lease obligations. We have the ability under certain debt facilities to call and repay the obligations prior to scheduled maturities. Therefore, the actual timing of future cash repayments could be materially different than presented above. |
| |
2 | Includes debentures and term notes bearing interest at fixed, floating and fixed-to-floating rates. |
| |
3 | Assumes only required payments will be made into the pension plans in 2019. Contributions are made in accordance with independent actuarial valuations as at December 31, 2019. Contributions, including discretionary payments, may vary depending on future benefit design and asset performance. |
| |
4 | Included within long-term contracts, in the table above, are contracts that we have signed for the purchase of services, pipe and other materials totaling $2,237 million which are expected to be paid over the next five years. Also consists of the following purchase obligations: gas transportation and storage contracts, firm capacity payments and gas purchase commitments, transportation, service and product purchase obligations, and power commitments. |
| |
5 | We are unable to estimate deferred income taxes (Part II. Item 8. Financial Statements and Supplementary Data - Note 25. Income Taxes) since cash payments for income taxes are determined primarily by taxable income for each discrete fiscal year. We are also unable to estimate asset retirement obligations (ARO) (Part II. Item 8. Financial Statements and Supplementary Data - Note 19. Asset Retirement Obligations), environmental liabilities (Part II. Item 8. Financial Statements and Supplementary Data - Note 30. Commitments and Contingencies) and hedges payable (Part II. Item 8. Financial Statements and Supplementary Data - Note 24. Risk Management and Financial Instruments) due to the uncertainty as to the amount and, or, timing of when cash payments will be required. |
LEGAL AND OTHER UPDATES
LIQUIDS PIPELINES
Eddystone Rail Legal Matter
In February 2017, our subsidiary Eddystone Rail Company, LLC (Eddystone Rail) filed an action against several defendants in the United States District Court for the Eastern District of Pennsylvania, seeking damages in excess of US$140 million. On September 7, 2018, the United States District Court for the Eastern District of Pennsylvania granted Eddystone Rail's motion to amend its complaint to add several affiliates of the corporate defendants as additional defendants (the Amended Complaint). Eddystone Rail’s chances of success on its Amended Complaint cannot be predicted at this time. Defendants have filed Answers and Counterclaims which, together with subsequent amendments, seek damages from Eddystone Rail in excess of US$32 million. The defendants’ chances of success on their counterclaims cannot be predicted at this time. The non-corporate defendants filed a Motion to Dismiss on October 25, 2019, based on alleged lack of standing. The motion has been fully briefed to the Court and decision is pending. The individual defendants’ chances of success on this motion cannot be predicted at this time.
Dakota Access Pipeline
In February 2017, the Standing Rock Sioux Tribe and the Cheyenne River Sioux Tribe filed motions with the United States Court for the District of Columbia contesting the validity of the process used by the United States Army Corps of Engineers (Army Corps) to permit the Dakota Access Pipeline. The Oglala Sioux and Yankton Sioux Tribes also filed claims in the case to challenge the Army Corps permit and environmental review process. In August 2018, in response to a Court order to reconsider components of its environmental analysis, the Army Corps issued its decision that no supplemental environmental analysis was required. All four Tribes have since amended their complaints to include claims challenging the adequacy of the Army Corps’ supplemental environmental analysis. The parties have filed cross-motions for summary judgment with the United States District Court for the District of Columbia on the merits of the plaintiffs claims challenging the adequacy of the Army Corps' remand process. Briefing on the parties’ cross-motions for summary judgment was completed on November 25, 2019. These cross-motions remain pending for decision before the District Court.
Line 5 Dual Pipelines
In December 2018, Michigan law PA 359 was enacted which created the Mackinac Straits Corridor Authority (Corridor Authority) and authorized an agreement between us and the Corridor Authority for the construction of a tunnel under the Straits of Mackinac (Straits) to house a replacement for the Line 5 Dual Pipelines that currently cross the Straits (the Tunnel Project). On December 19, 2018, we entered into a Tunnel Project agreement with the Government of Michigan. On March 28, 2019, the Michigan Attorney General issued an opinion finding the Michigan law PA 359 unconstitutional and soon after, Michigan Governor Whitmer issued a directive to Michigan agencies to cease any action implementing the statute.
To resolve the legal uncertainty created by the Michigan Attorney General's opinion and the directive issued by Michigan Governor Whitmer, on June 6, 2019, we filed a complaint with the Michigan Court of Claims to establish the constitutional validity of Michigan law PA 359 and enforceability of various agreements entered into between us and the State of Michigan related to the construction of the Tunnel Project. On June 11, 2019, State officials confirmed that we had valid permits to conduct specified geotechnical work which has now been completed. This work was necessary to prepare for Tunnel Project construction. On June 27, 2019, the Michigan Attorney General requested the Michigan Court of Claims to dismiss our complaint and we opposed her request with our response filed on August 1, 2019. On October 31, 2019, the Michigan Court of Claims determined that Michigan law PA 359 is valid and is not unconstitutional. On November 5, 2019 the Michigan Attorney General filed an appeal of this decision. According to the expedited appeal schedule, briefing is anticipated to be completed in March 2020 with a decision expected later in 2020.
On June 27, 2019, the Michigan Attorney General filed a complaint in the Michigan Ingham County Circuit Court that requests the Court to declare the easement that we have for the operation of the dual pipelines in the Straits to be invalid and to prohibit continued operation of the dual pipelines in the Straits “as soon as possible after a reasonable notice period to allow orderly adjustments by affected parties”. We continue to vigorously defend this action and on September 16, 2019, we filed our motion for summary disposition and requested dismissal of the State’s Complaint in its entirety. On that same date, the State filed a motion for partial summary disposition and judgment in its favor on its claim that the easement was void from inception. The case is now fully briefed. Oral argument on the parties' motions has been scheduled for May 22, 2020.
Line 5 Easement
For over six years, we have been in negotiations and discussions with the Bad River Band of the Lake Superior Tribe of Chippewa Indians (the Band) to resolve the Band’s concerns over our Line 5 pipeline and right-of-way across the Bad River Reservation (the Reservation). Only a small portion of the total easements across 12 miles of the Reservation are at issue. These negotiations and discussions did not resolve the Band’s concerns. On July 23, 2019, the Band filed a complaint in the United States District Court for the Western District of Wisconsin alleging that our continued use of Line 5 to transport crude oil and related liquids across the Reservation is a public nuisance under federal and state law and also alleging that the pipeline is in trespass on certain tracts of land in which the Band possesses undivided ownership interests. The Band also seeks an order prohibiting us from using Line 5 to transport crude oil and related liquids across the Reservation and requiring removal of the pipeline from the Reservation. On September 24, 2019, in response to the Band’s complaint, we filed an answer, defenses, and counterclaims against the Band, as well as a motion to dismiss. On October 15, 2019, the Band filed its first amended complaint against us, adding new assertions about allegedly unsafe conditions at a specific location of the pipeline on the Reservation and requesting a declaration by the court that the Band has regulatory authority over Line 5. On October 29, 2019, we filed our response, defenses and counterclaims to the Band's first amended complaint. A trial date has been set for July 2021.
The Band has not sought a temporary injunction to immediately discontinue operation of Line 5. However, if successful, the Band’s lawsuit could impact our ability to operate the pipeline on the Reservation. We have been vigorously defending the Band’s action since it was filed and will continue to do so. Nevertheless, we also plan to continue working with the Band in an effort to address its concerns, and at the same time, as a contingency measure, we have begun taking steps to enable the construction of a reroute of Line 5 around the Reservation. To that end, we have identified a proposed route outside the Reservation and, on February 7, 2020, we initiated the permitting process for the proposed reroute by filing applications with federal and state regulatory authorities.
GAS TRANSMMISSION
DCP Midstream, LP Definitive Agreement and Equity Restructuring
On November 6, 2019 DCP Midstream, LP (DCP MLP) announced the execution of a definitive agreement with its general partner, in which we indirectly own a 50% equity interest, and the concurrent closing of an equity restructuring transaction. The transaction resulted in the general partner converting all of its incentive distribution rights in DCP MLP, which were eliminated, and its 2% economic general partner interest in DCP MLP, while retaining a non-economic general partner interest, into newly-issued DCP MLP common units. As a result of this transaction, we increased our indirect ownership of outstanding DCP MLP common units from approximately 18% to approximately 28%, while retaining our indirect 50% ownership interest in the general partner of DCP MLP.
OTHER LITIGATION
We and our subsidiaries are involved in various other legal and regulatory actions and proceedings which arise in the normal course of business, including interventions in regulatory proceedings and challenges to regulatory approvals and permits. While the final outcome of such actions and proceedings cannot be predicted with certainty, management believes that the resolution of such actions and proceedings will not have a material impact on our consolidated financial position or results of operations.
TAX MATTERS
We and our subsidiaries maintain tax liabilities related to uncertain tax positions. While fully supportable in our view, these tax positions, if challenged by tax authorities, may not be fully sustained on review.
CRITICAL ACCOUNTING ESTIMATES
Our consolidated financial statements are prepared in accordance with generally accepted accounting principles in the United States of America (U.S. GAAP), which require management to make estimates, judgments and assumptions that affect the amounts reported in our consolidated financial statements and accompanying notes. In making judgments and estimates, management relies on external information and observable conditions, where possible, supplemented by internal analysis as required. We believe our most critical accounting policies and estimates discussed below have an impact across the various segments of our business.
Business Combinations
We apply the provisions of Accounting Standards Codification (ASC) 805 Business Combinations in accounting for our acquisitions. The acquired long-lived assets, intangible assets and assumed liabilities are recorded at their estimated fair values at the date of acquisition. Goodwill represents the excess of the purchase price over the fair value of net assets. While we use our best estimates and assumptions to accurately value assets acquired and liabilities assumed at the date of acquisition, as well as any contingent consideration, our estimates are inherently uncertain and subject to refinement. During the measurement period, which may be up to one year from the acquisition date, we record adjustments to the assets acquired and liabilities assumed with the corresponding offset to goodwill. Upon the conclusion of the measurement period or final determination of values of assets acquired or liabilities assumed, whichever comes first, any subsequent adjustments are recorded to our consolidated statements of operations.
Accounting for business combinations requires significant judgment, estimates and assumptions at the acquisition date. In developing estimates of fair values at the acquisition date, we utilize a variety of factors including market data, historical and future expected cash flows, growth rates and discount rates. The subjective nature of our assumptions increases the risk associated with estimates surrounding the projected performance of the acquired entity.
On February 27, 2017, we acquired Spectra Energy for a purchase price of $37.5 billion. In determining the valuation of tangible assets acquired, we applied the cost, market and income approaches. For intangible assets acquired, we used an income approach which included cash flow projections based on historical performance, terms found in contracts and assumptions on expected renewals. Discount rates used in the valuation were also developed using a weighted-average cost of capital based on risks specific to respective assets and returns that an investor would likely require given the expected cash flows, timing and risk.
Goodwill Impairment
Goodwill represents the excess of the purchase price over the fair value of net identifiable assets on acquisition of a business. The carrying value of goodwill, which is not amortized, is assessed for impairment annually, or more frequently if events or changes in circumstances arise that suggest the carrying value of goodwill may be impaired.
We perform our annual review for impairment at the reporting unit level, which is identified by assessing whether the components of our operating segments constitute businesses for which discrete information is available, whether segment management regularly reviews the operating results of those components and whether the economic and regulatory characteristics are similar.
We have the option to first assess qualitative factors to determine whether it is necessary to perform the quantitative goodwill impairment test. When performing a qualitative assessment, we determine the drivers of fair value for each reporting unit and evaluate whether those drivers have been positively or negatively affected by relevant events and circumstances since the last fair value assessment. Our evaluation includes, but is not limited to, assessment of macroeconomic trends, regulatory environments, capital accessibility, operating income trends, and industry conditions. Based on our assessment of the qualitative factors, if we determine it is more likely than not that the fair value of the reporting unit is less than it’s carrying amount, a quantitative goodwill impairment test is performed.
The quantitative goodwill impairment test involves determining the fair value of our reporting units and comparing those values to the carrying value of each corresponding reporting unit. If the carrying value of a reporting unit, including allocated goodwill, exceeds its fair value, goodwill impairment is measured at the amount by which the reporting unit’s carrying value exceeds its fair value. This amount should not exceed the carrying amount of goodwill. Fair value of our reporting units is estimated using a combination of discounted cash flow model and earnings multiples techniques. The determination of fair value using the discounted cash flow model technique requires the use of estimates and assumptions related to discount rates, projected operating income, terminal value growth rates, capital expenditures and working capital levels. The cash flow projections included significant judgments and assumptions relating to revenue growth rates and expected future capital expenditure. The determination of fair value using the earnings multiples technique requires assumptions to be made in relation to maintainable earnings and earnings multipliers for reporting units.
Our most recent annual review of the goodwill balance was performed on April 1, 2019, and this review did not result in an impairment charge. As at April 1, 2019, our reporting units were equivalent to our reportable segments, except for the Gas Transmission and Midstream reportable segment which was divided at the component level into two reporting units: Gas Transmission and Gas Midstream. We performed a quantitative goodwill impairment test of our Gas Midstream reporting unit. We elected to perform qualitative assessments of our Liquids Pipelines, Gas Distribution and Storage, and Gas Transmission and Midstream reporting units and concluded it was not more likely than not that these reporting units were impaired and that quantitative impairment tests were not necessary.
The allocation of goodwill to held for sale and disposed businesses is based on the fair value of businesses relative to their corresponding reporting unit. During the years ended December 31, 2019, and 2018, we impaired nil and $1,019 million, respectively, of goodwill allocated to assets held for sale.
Asset Impairment
We evaluate the recoverability of our property, plant and equipment when events or circumstances such as economic obsolescence, business climate, legal or regulatory changes, or other factors indicate we may not recover the carrying amount of our assets. We continually monitor our businesses, the market and business environments to identify indicators that could suggest an asset may not be recoverable. If it is determined that the carrying value of an asset exceeds the undiscounted cash flows expected from the asset, we will assess the fair value of the asset. An impairment loss is recognized when the carrying amount of the asset exceeds its fair value as determined by quoted market prices in active markets or present value techniques. The determination of the fair value using present value techniques requires the use of projections and assumptions regarding future cash flows and weighted average cost of capital. Any changes to these projections and assumptions could result in revisions to the evaluation of the recoverability of the property, plant and equipment and the recognition of an impairment loss in the Consolidated Statements of Earnings.
Assets held for sale
We classify assets as held for sale when management commits to a formal plan to actively market an asset or a group of assets and when management believes it is probable the sale of the assets will occur within one year. We measure assets classified as held for sale at the lower of their carrying value and their estimated fair value less costs to sell.
Regulatory Accounting
Certain of our businesses are subject to regulation by various authorities, including but not limited to, the CER, the FERC, the Alberta Energy Regulator, La Régie de l’energie du Québec and the OEB. Regulatory bodies exercise statutory authority over matters such as construction, rates and ratemaking and agreements with customers. To recognize the economic effects of the actions of the regulator, the timing of recognition of certain revenues and expenses in these operations may differ from that otherwise expected under U.S. GAAP for non-rate-regulated entities. Key determinants in the ratemaking process are:
Costs of providing service, including operating costs, capital invested and depreciation expense;
Allowed rate of return, including the equity component of the capital structure and related income taxes;
Interest costs on the debt component of the capital structure; and
Contract and volume throughput assumptions.
The allowed rate of return is determined in accordance with the applicable regulatory model and may impact our profitability. The rates for a number of our projects are based on a cost-of-service recovery model that follows the regulators’ authoritative guidance. Under the cost-of-service tolling methodology, we calculate tolls based on forecast volumes and cost. A difference between forecast and actual results causes an over or under recovery in any given year. Regulatory assets represent amounts that are expected to be recovered from customers in future periods through rates. Regulatory liabilities represent amounts that are expected to be refunded to customers in future periods through rates or expected to be paid to cover future abandonment costs in relation to the CER’s Land Matters Consultation Initiative (LMCI) and for future removal and site restoration costs as approved by the OEB.
To the extent that the regulator’s actions differ from our expectations, the timing and amount of recovery or settlement of regulatory balances could differ significantly from those recorded. In the absence of rate regulation, we would generally not recognize regulatory assets or liabilities and the earnings impact would be recorded in the period the expenses are incurred or revenues are earned. A regulatory asset or liability is recognized in respect of deferred income taxes when it is expected the amounts will be recovered or settled through future regulator-approved rates.
As at December 31, 2019 and 2018, our significant regulatory assets totaled $4,800 million and $4,695 million, respectively, and significant regulatory liabilities totaled $2,786 million and $2,363 million, respectively.
Depreciation
Depreciation of property, plant and equipment, our largest asset with a net book value at December 31, 2019 and 2018, of $93,723 million and $94,540 million, respectively, is charged in accordance with two primary methods. For distinct assets, depreciation is generally provided on a straight-line basis over the estimated useful lives of the assets commencing when the asset is placed in service. For largely homogeneous groups of assets with comparable useful lives, the pool method of accounting is followed whereby similar assets are grouped and depreciated as a pool. When group assets are retired or otherwise disposed of, gains and losses are not reflected in earnings but are booked as an adjustment to accumulated depreciation.
When it is determined that the estimated service life of an asset no longer reflects the expected remaining period of benefit, prospective changes are made to the estimated service life. Estimates of useful lives are based on third party engineering studies, experience and/or industry practice. There are a number of assumptions inherent in estimating the service lives of our assets including the level of development, exploration, drilling, reserves and production of crude oil and natural gas in the supply areas served by our pipelines as well as the demand for crude oil and natural gas and the integrity of our systems. Changes in these assumptions could result in adjustments to the estimated service lives, which could result in material changes to depreciation expense in future periods in any of our business segments. For certain rate-regulated operations, depreciation rates are approved by the regulator and the regulator may require periodic studies or technical updates on useful lives which may change depreciation rates.
Pension and Other Postretirement Benefits
We use certain assumptions relating to the calculation of defined benefit pension and other postretirement liabilities and net periodic benefit costs. These assumptions comprise management’s best estimates of expected return on plan assets, future salary levels, other cost escalations, retirement ages of employees and other actuarial factors including discount rates and mortality. We determine discount rates by reference to rates of high-quality long-term corporate bonds with maturities that approximate the timing of future payments anticipated to be made under each of the respective plans. The expected return on plan assets is determined using market-related values and assumptions on the asset mix consistent with the investment policy relating to the assets and their projected returns. The assumptions are reviewed annually by our independent actuaries. Actual results that differ from results based on assumptions are amortized over future periods and therefore could materially affect the expense recognized and the recorded obligation in future periods.
The following sensitivity analysis identifies the impact on the December 31, 2019 Consolidated Financial Statements of a 0.5% change in key pension and OPEB assumptions:
|
| | | | | | | | | | | |
| | Canada | | United States |
| | Obligation |
| | Expense |
| | Obligation |
| | Expense |
|
| (millions of Canadian dollars) | |
| | |
| | |
| | |
|
| Pension | | | | | | | |
| Decrease in discount rate | 368 |
| | 34 |
| | 69 |
| | 6 |
|
| Decrease in expected return on assets | — |
| | 18 |
| | — |
| | 5 |
|
| Decrease in rate of salary increase | (66 | ) | | (15 | ) | | (7 | ) | | (1 | ) |
| OPEB | | | | | | | |
| Decrease in discount rate | 23 |
| | 1 |
| | 15 |
| | — |
|
| Decrease in expected return on assets | — |
| | — |
| | — |
| | 1 |
|
Contingent Liabilities
Provisions for claims filed against us are determined on a case-by-case basis. Case estimates are reviewed on a regular basis and are updated as new information is received. The process of evaluating claims involves the use of estimates and a high degree of management judgment. Claims outstanding, the final determination of which could have a material impact on our financial results and certain subsidiaries and investments are detailed in Part II. Item 8. Financial Statements and Supplementary Data - Note 30. Commitments and Contingencies. In addition, any unasserted claims that later may become evident could have a material impact on our financial results and certain subsidiaries and investments.
Asset Retirement Obligations
ARO associated with the retirement of long-lived assets are measured at fair value and recognized as Accounts payable and other or Other long-term liabilities in the period in which they can be reasonably determined. The fair value approximates the cost a third party would charge to perform the tasks necessary to retire such assets and is recognized at the present value of expected future cash flows. Discount rates used to estimate the present value of the expected future cash flows range from 1.8% to 9.0% for the years ended December 31, 2019 and 2018. ARO is added to the carrying value of the associated asset and depreciated over the asset’s useful life. The corresponding liability is accreted over time through charges to earnings and is reduced by actual costs of decommissioning and reclamation. Our estimates of retirement costs could change as a result of changes in cost estimates and regulatory requirements. Currently, for the majority of our assets, there is insufficient data or information to reasonably determine the timing of settlement for estimating the fair value of the ARO. In these cases, the ARO cost is considered indeterminate for accounting purposes, as there is no data or information that can be derived from past practice, industry practice or the estimated economic life of the asset.
In 2009, the CER issued a decision related to the LMCI, which required holders of an authorization to operate a pipeline under the CER Act to file a proposed process and mechanism to set aside funds to pay for future abandonment costs in respect of the sites in Canada used for the operation of a pipeline. The CER's decision stated that while pipeline companies are ultimately responsible for the full costs of abandoning pipelines, abandonment costs are a legitimate cost of providing service and are recoverable from the users of the pipeline upon approval by the CER. Following the CER's final approval of the collection mechanism and the set-aside mechanism for LMCI, we began collecting and setting aside funds to cover future abandonment costs effective January 1, 2015. The funds collected are held in trust in accordance with the CER decision. The funds collected from shippers are reported within Transportation and other services revenues and Restricted long-term investments. Concurrently, we reflect the future abandonment cost as an increase to Operating and administrative expense and Other long-term liabilities.
CHANGES IN ACCOUNTING POLICIES
Refer to Item 8. Financial Statements and Supplementary Data - Note 3. Changes in Accounting Policies.
ITEM 7A. QUANTITATIVE AND QUALITATIVE DISCLOSURES ABOUT MARKET RISK
Our earnings, cash flows and other comprehensive income (OCI) are subject to movements in foreign exchange rates, interest rates, commodity prices and our share price.
The following summarizes the types of market risks to which we are exposed and the risk management instruments used to mitigate them. We use a combination of qualifying and non-qualifying derivative instruments to manage the risks noted below.
Foreign Exchange Risk
We generate certain revenues, incur expenses and hold a number of investments and subsidiaries that are denominated in currencies other than Canadian dollars. As a result, our earnings, cash flows and OCI are exposed to fluctuations resulting from foreign exchange rate variability.
We employ financial derivative instruments to hedge foreign currency denominated earnings exposure. A combination of qualifying and non-qualifying derivative instruments is used to hedge anticipated foreign currency denominated revenues and expenses and to manage variability in cash flows. We hedge certain net investments in United States dollar denominated investments and subsidiaries using foreign currency derivatives and United States dollar denominated debt.
Interest Rate Risk
Our earnings and cash flows are exposed to short-term interest rate variability due to the regular repricing of our variable rate debt, primarily commercial paper. We monitor our debt portfolio mix of fixed and variable rate debt instruments to manage a consolidated portfolio of floating rate debt within the Board of Directors approved policy limit of a maximum of 30% of floating rate debt as a percentage of total debt outstanding. We primarily use qualifying derivative instruments to manage interest rate risk. Pay fixed-receive floating interest rate swaps may be used to hedge against the effect of future interest rate movements. We have implemented a program to significantly mitigate the impact of short-term interest rate volatility on interest expense via execution of floating to fixed interest rate swaps with an average swap rate of 2.9%.
We are exposed to changes in the fair value of fixed rate debt that arise as a result of the changes in market interest rates. Pay floating-receive fixed interest rate swaps are used, when applicable, to hedge against future changes to the fair value of fixed rate debt which mitigates the impact of fluctuations in the fair value of fixed rate debt via execution of fixed to floating interest rate swaps. As at December 31, 2019, we do not have any pay floating-receive fixed interest rate swaps outstanding.
Our earnings and cash flows are also exposed to variability in longer term interest rates ahead of anticipated fixed rate term debt issuances. Forward starting interest rate swaps are used to hedge against the effect of future interest rate movements. We have established a program within some of our subsidiaries to mitigate our exposure to long-term interest rate variability on select forecast term debt issuances via execution of floating to fixed interest rate swaps with an average swap rate of 3%.
Commodity Price Risk
Our earnings and cash flows are exposed to changes in commodity prices as a result of our ownership interests in certain assets and investments, as well as through the activities of our energy services subsidiaries. These commodities include natural gas, crude oil, power and NGL. We employ financial and physical derivative instruments to fix a portion of the variable price exposures that arise from physical transactions involving these commodities. We use primarily non-qualifying derivative instruments to manage commodity price risk.
Equity Price Risk
Equity price risk is the risk of earnings fluctuations due to changes in our share price. We have exposure to our own common share price through the issuance of various forms of stock-based compensation, which affect earnings through revaluation of the outstanding units every period. We use equity derivatives to manage the earnings volatility derived from one form of stock-based compensation, restricted share units. We use a combination of qualifying and non-qualifying derivative instruments to manage equity price risk.
Market Risk Management
We have a Risk Policy to minimize the likelihood that adverse cash flow impacts arising from movements in market prices will exceed a defined risk tolerance. We identify and measure all material market risks including commodity price risks, interest rate risks, foreign exchange risk and equity price risk using a standardized measurement methodology. Our market risk metric consolidates the exposure after accounting for the impact of offsetting risks and limits the consolidated cash flow volatility arising from market related risks to an acceptable approved risk tolerance threshold. Our market risk metric is Cash Flow at Risk (CFaR).
CFaR is a statistically derived measurement used to measure the maximum cash flow loss that could potentially result from adverse market price movements over a one month holding period for price sensitive non-derivative exposures and for derivative instruments we hold or issue as recorded on the Consolidated Statements of Financial Position as at December 31, 2019. CFaR assumes that no further mitigating actions are taken to hedge or otherwise minimize exposures and the selection of a one month holding period reflects the mix of price risk sensitive assets at Enbridge. As a practical matter, a large portion of Enbridge’s exposure could be hedged or unwound in a much shorter period if required to mitigate the risks.
The consolidated CFaR policy limit for Enbridge is 3.5% of its forward 12 month normalized cash flow. At December 31, 2019 and 2018 CFaR was $113 million and $140 million or 1.2% and 1.6%, respectively, of estimated 12 month forward normalized cash flow.
LIQUIDITY RISK
Liquidity risk is the risk that we will not be able to meet our financial obligations, including commitments and guarantees, as they become due. In order to mitigate this risk, we forecast cash requirements over a 12 month rolling time period to determine whether sufficient funds will be available and maintain substantial capacity under our committed bank lines of credit to address any contingencies. Our primary sources of liquidity and capital resources are funds generated from operations, the issuance of commercial paper and draws under committed credit facilities and long-term debt, which includes debentures and medium-term notes. We also maintain current shelf prospectuses with securities regulators which enables ready access to either the Canadian or United States public capital markets, subject to market conditions. In addition, we maintain sufficient liquidity through committed credit facilities with a diversified group of banks and institutions which, if necessary, enables us to fund all anticipated requirements for approximately one year without accessing the capital markets. We are in compliance with all the terms and conditions of our committed credit facility agreements and term debt indentures as at December 31, 2019. As a result, all credit facilities are available to us and the banks are obligated to fund and have been funding us under the terms of the facilities.
CREDIT RISK
Entering into derivative instruments may result in exposure to credit risk from the possibility that a counterparty will default on its contractual obligations. In order to mitigate this risk, we enter into risk management transactions primarily with institutions that possess strong investment grade credit ratings. Credit risk relating to derivative counterparties is mitigated through maintenance and monitoring of credit exposure limits and contractual requirements, netting arrangements, and ongoing monitoring of counterparty credit exposure using external credit rating services and other analytical tools.
We generally have a policy of entering into individual International Swaps and Derivatives Association, Inc. agreements or other similar derivative agreements with the majority of our financial derivative counterparties. These agreements provide for the net settlement of derivative instruments outstanding with specific counterparties in the event of bankruptcy or other significant credit events, and reduces our credit risk exposure on financial derivative asset positions outstanding with the counterparties in these particular circumstances.
FAIR VALUE MEASUREMENTS
The most observable inputs available are used to estimate the fair value of derivatives. When possible, we estimate the fair value of our derivatives based on quoted market prices from exchanges. If quoted market prices are not available, we use estimates from third party brokers. For non-exchange traded derivatives classified in Levels 2 and 3, we use standard valuation techniques to calculate the estimated fair value. These methods include discounted cash flows for forwards and swaps and Black-Scholes-Merton pricing models for options. Depending on the type of derivative and nature of the underlying risk, we use observable market prices (interest rates, foreign exchange rates, commodity prices and share prices, as applicable) and volatility as primary inputs to these valuation techniques. Finally, we consider our own credit default swap spread, as well as the credit default swap spreads associated with our counterparties, in our estimation of fair value.
ITEM 8. FINANCIAL STATEMENTS AND SUPPLEMENTARY DATA
Report of Independent Registered Public Accounting Firm
To the Shareholders and Board of Directors of Enbridge Inc.
Opinions on the Financial Statements and Internal Control over Financial Reporting
We have audited the accompanying consolidated statements of financial position of Enbridge Inc. and its subsidiaries (together, the Company) as of December 31, 2019 and 2018, and the related consolidated statements of earnings, comprehensive income, changes in equity and cash flows for each of the three years in the period ended December 31, 2019, including the related notes (collectively referred to as the consolidated financial statements). We also have audited the Company's internal control over financial reporting as of December 31, 2019, based on criteria established in Internal Control - Integrated Framework (2013) issued by the Committee of Sponsoring Organizations of the Treadway Commission (COSO).
In our opinion, the consolidated financial statements referred to above present fairly, in all material respects, the financial position of the Company as of December 31, 2019 and 2018, and the results of its operations and its cash flows for each of the three years in the period ended December 31, 2019 in conformity with accounting principles generally accepted in the United States of America. Also in our opinion, the Company maintained, in all material respects, effective internal control over financial reporting as of December 31, 2019, based on criteria established in Internal Control - Integrated Framework (2013) issued by the COSO.
Basis for Opinions
The Company's management is responsible for these consolidated financial statements, for maintaining effective internal control over financial reporting, and for its assessment of the effectiveness of internal control over financial reporting, included in Management’s Annual Report on Internal Control over Financial Reporting appearing under Item 9A. Our responsibility is to express opinions on the Company’s consolidated financial statements and on the Company's internal control over financial reporting based on our audits. We are a public accounting firm registered with the Public Company Accounting Oversight Board (United States) (PCAOB) and are required to be independent with respect to the Company in accordance with the U.S. federal securities laws and the applicable rules and regulations of the Securities and Exchange Commission and the PCAOB.
We conducted our audits in accordance with the standards of the PCAOB. Those standards require that we plan and perform the audits to obtain reasonable assurance about whether the consolidated financial statements are free of material misstatement, whether due to error or fraud, and whether effective internal control over financial reporting was maintained in all material respects.
Our audits of the consolidated financial statements included performing procedures to assess the risks of material misstatement of the consolidated financial statements, whether due to error or fraud, and performing procedures that respond to those risks. Such procedures included examining, on a test basis, evidence regarding the amounts and disclosures in the consolidated financial statements. Our audits also included evaluating the accounting principles used and significant estimates made by management, as well as evaluating the overall presentation of the consolidated financial statements. Our audit of internal control over financial reporting included obtaining an understanding of internal control over financial reporting, assessing the risk that a material weakness exists, and testing and evaluating the design and operating effectiveness of internal control based on the assessed risk. Our audits also included performing such other procedures as we considered necessary in the circumstances. We believe that our audits provide a reasonable basis for our opinions.
Definition and Limitations of Internal Control over Financial Reporting
A company’s internal control over financial reporting is a process designed to provide reasonable assurance regarding the reliability of financial reporting and the preparation of financial statements for external purposes in accordance with generally accepted accounting principles. A company’s internal control over financial reporting includes those policies and procedures that (i) pertain to the maintenance of records that, in reasonable detail, accurately and fairly reflect the transactions and dispositions of the assets of the company; (ii) provide reasonable assurance that transactions are recorded as necessary to permit preparation of financial statements in accordance with generally accepted accounting principles, and that receipts and expenditures of the company are being made only in accordance with authorizations of management and directors of the company; and (iii) provide reasonable assurance regarding prevention or timely detection of unauthorized acquisition, use, or disposition of the company’s assets that could have a material effect on the financial statements.
Because of its inherent limitations, internal control over financial reporting may not prevent or detect misstatements. Also, projections of any evaluation of effectiveness to future periods are subject to the risk that controls may become inadequate because of changes in conditions, or that the degree of compliance with the policies or procedures may deteriorate.
Critical Audit Matters
The critical audit matter communicated below is a matter arising from the current period audit of the consolidated financial statements that was communicated or required to be communicated to the audit committee and that (i) relates to accounts or disclosures that are material to the consolidated financial statements and (ii) involved our especially challenging, subjective, or complex judgments. The communication of critical audit matters does not alter in any way our opinion on the consolidated financial statements, taken as a whole, and we are not, by communicating the critical audit matter below, providing a separate opinion on the critical audit matter or on the accounts or disclosures to which it relates.
Goodwill Impairment Review
As described in Notes 2 and 16 to the consolidated financial statements, the Company’s goodwill balance was $33,153 million at December 31, 2019. Management performs an annual goodwill impairment review at the reporting unit level as of April 1 of each year, or more frequently if events or circumstances indicate that the carrying value of goodwill may be impaired. Management has the option to first assess qualitative factors to determine whether it is necessary to perform the quantitative goodwill impairment test. In making the qualitative assessment, management considers macroeconomic trends, changes to regulatory environments, capital accessibility, operating income trends, and changes to industry conditions. The quantitative goodwill impairment test involves determining the fair value of the Company’s reporting units and comparing those values to the carrying value of each reporting unit, including goodwill. Fair value is estimated using a combination of discounted cash flow model and earnings multiples techniques. The determination of fair value using the discounted cash flow model technique requires the use of estimates and assumptions related to discount rates, projected operating income, revenue growth rates, terminal value growth rates, expected future capital expenditures and working capital levels. The determination of fair value using the earnings multiples technique requires assumptions to be made in relation to maintainable earnings and earnings multipliers for reporting units. In the current year, the quantitative goodwill impairment test was only performed for the Gas Midstream reporting unit.
The principal considerations for our determination that performing procedures relating to the goodwill impairment review is a critical audit matter are that there was significant judgment required by management when (i) developing the significant assumptions related to operating income trends used in the qualitative assessment for all reporting units outside of the Gas Midstream reporting unit, and (ii) developing such significant assumptions as discount rates, projected operating income, expected future capital expenditures and earnings multipliers used to estimate the fair value of the Gas Midstream reporting unit. This in turn led to a high degree of auditor judgment, effort and subjectivity in performing procedures to evaluate (a) management’s significant assumptions used in the qualitative assessment and
(b) the cash flow projections and significant assumptions used by management in their quantitative assessment of the Gas Midstream reporting unit. In addition, the audit effort involved the use of professionals with specialized skill and knowledge to assist in performing the procedures and evaluating the audit evidence obtained over the quantitative assessment.
Addressing the matter involved performing procedures and evaluating audit evidence in connection with forming our overall opinion on the consolidated financial statements. These procedures included testing the effectiveness of controls relating to management’s goodwill impairment review, including controls over (i) the development of assumptions related to operating income trends used in the qualitative assessment and (ii) the determination of the fair value estimate of the Gas Midstream reporting unit. These procedures also included, among others, evaluating the reasonableness of significant assumptions used by management in the qualitative assessment of the Company’s reporting units, specifically those related to operating income trends, and testing management’s process for developing the fair value estimate of the Gas Midstream reporting unit. Testing management’s process for developing the fair value estimate of the Gas Midstream reporting unit included evaluating the appropriateness of the discounted cash flow and the earnings multiples models; testing the completeness, accuracy, and relevance of underlying data used in the models; and evaluating the reasonableness of significant assumptions used by management in developing the fair value measurement including discount rates, projected operating income, expected future capital expenditures and earnings multipliers. When assessing the reasonableness of projected operating income and its trends, and expected future capital expenditures, we evaluated whether these significant assumptions were reasonable considering the current and past performance of the Company’s reporting units, external industry data, and evidence obtained in other areas of the audit. We utilized professionals with specialized skill and knowledge to assist in evaluating the appropriateness of management’s discounted cash flow and earnings multiples models and evaluating the reasonableness of assumptions used in the models, specifically discount rates and earnings multiples.
/s/PricewaterhouseCoopers LLP
Chartered Professional Accountants
|
|
Calgary, Alberta, Canada
February 14, 2020
|
We have served as the Company's auditor since 1949.
ENBRIDGE INC.
CONSOLIDATED STATEMENTS OF EARNINGS
|
| | | | | | |
| Year ended December 31, | 2019 |
| 2018 |
| 2017 |
|
| (millions of Canadian dollars, except per share amounts) | | | |
| Operating revenues | | | |
| Commodity sales | 29,309 |
| 27,660 |
| 26,286 |
|
| Gas distribution sales | 4,205 |
| 4,360 |
| 4,215 |
|
| Transportation and other services | 16,555 |
| 14,358 |
| 13,877 |
|
Total operating revenues (Note 4) | 50,069 |
| 46,378 |
| 44,378 |
|
| Operating expenses | | | |
| Commodity costs | 28,802 |
| 26,818 |
| 26,065 |
|
| Gas distribution costs | 2,202 |
| 2,583 |
| 2,572 |
|
| Operating and administrative | 6,991 |
| 6,792 |
| 6,442 |
|
| Depreciation and amortization | 3,391 |
| 3,246 |
| 3,163 |
|
Impairment of long-lived assets (Note 8 and Note 11) | 423 |
| 1,104 |
| 4,463 |
|
Impairment of goodwill (Note 8 and Note 16) | — |
| 1,019 |
| 102 |
|
| Total operating expenses | 41,809 |
| 41,562 |
| 42,807 |
|
| Operating income | 8,260 |
| 4,816 |
| 1,571 |
|
Income from equity investments (Note 13) | 1,503 |
| 1,509 |
| 1,102 |
|
| Other income/(expense) | | | |
| Net foreign currency gain/(loss) | 477 |
| (522 | ) | 237 |
|
| Gain/(loss) on dispositions | (300 | ) | (46 | ) | 16 |
|
| Other | 258 |
| 516 |
| 199 |
|
Interest expense (Note 18) | (2,663 | ) | (2,703 | ) | (2,556 | ) |
| Earnings before income taxes | 7,535 |
| 3,570 |
| 569 |
|
Income tax recovery/(expense) (Note 25) | (1,708 | ) | (237 | ) | 2,697 |
|
| Earnings | 5,827 |
| 3,333 |
| 3,266 |
|
| Earnings attributable to noncontrolling interests and redeemable noncontrolling interests | (122 | ) | (451 | ) | (407 | ) |
| Earnings attributable to controlling interests | 5,705 |
| 2,882 |
| 2,859 |
|
| Preference share dividends | (383 | ) | (367 | ) | (330 | ) |
| Earnings attributable to common shareholders | 5,322 |
| 2,515 |
| 2,529 |
|
Earnings per common share attributable to common shareholders (Note 6) | 2.64 |
| 1.46 |
| 1.66 |
|
Diluted earnings per common share attributable to common shareholders (Note 6) | 2.63 |
| 1.46 |
| 1.65 |
|
The accompanying notes are an integral part of these consolidated financial statements.
ENBRIDGE INC.
CONSOLIDATED STATEMENTS OF COMPREHENSIVE INCOME
|
| | | | | | |
| Year ended December 31, | 2019 |
| 2018 |
| 2017 |
|
| (millions of Canadian dollars) | | | |
| Earnings | 5,827 |
| 3,333 |
| 3,266 |
|
| Other comprehensive income/(loss), net of tax | | | |
| Change in unrealized loss on cash flow hedges | (437 | ) | (153 | ) | (21 | ) |
| Change in unrealized gain/(loss) on net investment hedges | 281 |
| (458 | ) | 490 |
|
| Other comprehensive income/(loss) from equity investees | 40 |
| 38 |
| (27 | ) |
| Reclassification to earnings of loss on cash flow hedges | 127 |
| 152 |
| 313 |
|
| Reclassification to earnings of pension and other postretirement benefits amounts | 13 |
| 12 |
| 19 |
|
| Actuarial gain/(loss) on pension plans and other postretirement benefits | (96 | ) | (52 | ) | 8 |
|
| Foreign currency translation adjustments | (3,035 | ) | 4,599 |
| (3,060 | ) |
| Other comprehensive income/(loss), net of tax | (3,107 | ) | 4,138 |
| (2,278 | ) |
| Comprehensive income | 2,720 |
| 7,471 |
| 988 |
|
| Comprehensive income attributable to noncontrolling interests and redeemable noncontrolling interests | (7 | ) | (801 | ) | (160 | ) |
| Comprehensive income attributable to controlling interests | 2,713 |
| 6,670 |
| 828 |
|
| Preference share dividends | (383 | ) | (367 | ) | (330 | ) |
| Comprehensive income attributable to common shareholders | 2,330 |
| 6,303 |
| 498 |
|
The accompanying notes are an integral part of these consolidated financial statements.
ENBRIDGE INC.
CONSOLIDATED STATEMENTS OF CHANGES IN EQUITY
|
| | | | | | |
| Year ended December 31, | 2019 |
| 2018 |
| 2017 |
|
(millions of Canadian dollars, except per share amounts)
| | | |
Preference shares (Note 21) | |
| |
| |
|
| Balance at beginning of year | 7,747 |
| 7,747 |
| 7,255 |
|
| Preference shares issued | — |
| — |
| 492 |
|
| Balance at end of year | 7,747 |
| 7,747 |
| 7,747 |
|
Common shares (Note 21) | | | |
| Balance at beginning of year | 64,677 |
| 50,737 |
| 10,492 |
|
| Common shares issued | — |
| — |
| 1,500 |
|
Common shares issued in Merger Transaction (Note 8) | — |
| — |
| 37,429 |
|
Shares issued on Sponsored Vehicles buy-in (Note 21) | — |
| 12,727 |
| — |
|
| Dividend Reinvestment and Share Purchase Plan | — |
| 1,181 |
| 1,226 |
|
| Shares issued on exercise of stock options | 69 |
| 32 |
| 90 |
|
| Balance at end of year | 64,746 |
| 64,677 |
| 50,737 |
|
| Additional paid-in capital | | | |
| Balance at beginning of year | — |
| 3,194 |
| 3,399 |
|
| Stock-based compensation | 34 |
| 49 |
| 82 |
|
Sponsored Vehicles buy-in (Note 20) | — |
| (4,323 | ) | — |
|
| Repurchase of noncontrolling interest | 65 |
| — |
| — |
|
| Options exercised | (61 | ) | (24 | ) | (95 | ) |
Dilution gain on Spectra Energy Partners, LP restructuring (Note 20) | — |
| 1,136 |
| — |
|
| Change in reciprocal interest | 117 |
| 47 |
| — |
|
| Other | 32 |
| (158 | ) | (192 | ) |
Sale of noncontrolling interest in subsidiaries (Note 20) | — |
| 79 |
| — |
|
| Balance at end of year | 187 |
| — |
| 3,194 |
|
| Retained earnings/(deficit) | |
| |
| |
|
| Balance at beginning of year | (5,538 | ) | (2,468 | ) | (716 | ) |
| Earnings attributable to controlling interests | 5,705 |
| 2,882 |
| 2,859 |
|
| Preference share dividends | (383 | ) | (367 | ) | (330 | ) |
| Common share dividends declared | (6,125 | ) | (5,019 | ) | (4,702 | ) |
| Dividends paid to reciprocal shareholder | 18 |
| 33 |
| 30 |
|
Modified retrospective adoption of ASC 606 Revenue from Contracts with Customers | — |
| (86 | ) | — |
|
Redemption value adjustment to redeemable noncontrolling interests (Note 20) | — |
| (456 | ) | 292 |
|
| Other | 9 |
| (57 | ) | 99 |
|
| Balance at end of year | (6,314 | ) | (5,538 | ) | (2,468 | ) |
Accumulated other comprehensive income/(loss) (Note 23) | | | |
| Balance at beginning of year | 2,672 |
| (973 | ) | 1,058 |
|
| Impact of Sponsored Vehicles buy-in | — |
| (142 | ) | — |
|
| Other comprehensive income/(loss) attributable to common shareholders, net of tax | (2,992 | ) | 3,787 |
| (2,031 | ) |
| Other | 48 |
| — |
| — |
|
| Balance at end of year | (272 | ) | 2,672 |
| (973 | ) |
Reciprocal shareholding (Note 13) | | | |
| Balance at beginning of year | (88 | ) | (102 | ) | (102 | ) |
| Change in reciprocal interest | 37 |
| 14 |
| — |
|
| Balance at end of year | (51 | ) | (88 | ) | (102 | ) |
| Total Enbridge Inc. shareholders’ equity | 66,043 |
| 69,470 |
| 58,135 |
|
Noncontrolling interests (Note 20) | |
| |
| |
|
| Balance at beginning of year | 3,965 |
| 7,597 |
| 577 |
|
| Earnings attributable to noncontrolling interests | 122 |
| 334 |
| 232 |
|
| Other comprehensive income/(loss) attributable to noncontrolling interests, net of tax | | | |
| Change in unrealized gain/(loss) on cash flow hedges | (7 | ) | 31 |
| 15 |
|
| Foreign currency translation adjustments | (108 | ) | 294 |
| (431 | ) |
| Reclassification to earnings of loss on cash flow hedges | — |
| 4 |
| 139 |
|
| | (115 | ) | 329 |
| (277 | ) |
| Comprehensive income/(loss) attributable to noncontrolling interests | 7 |
| 663 |
| (45 | ) |
Noncontrolling interests resulting from Merger Transaction (Note 8) | — |
| — |
| 8,955 |
|
| Enbridge Energy Company, Inc. common control transaction | — |
| — |
| (343 | ) |
| Distributions | (254 | ) | (857 | ) | (839 | ) |
| Contributions | 12 |
| 24 |
| 832 |
|
| Deconsolidation of Sabal Trail Transmission, LLC | — |
| — |
| (2,318 | ) |
Spectra Energy Partners, LP restructuring (Note 20) | — |
| (1,486 | ) | — |
|
| Sale of noncontrolling interests in subsidiaries | — |
| 1,183 |
| — |
|
Change in noncontrolling interests on Sponsored Vehicles buy-in (Note 20) | — |
| (2,867 | ) | — |
|
Preferred shares redemption (Note 20) | (300 | ) | (210 | ) | — |
|
| Repurchase of noncontrolling interest | (65 | ) | — |
| — |
|
| Dilution gain and other | (1 | ) | (82 | ) | 778 |
|
| Balance at end of year | 3,364 |
| 3,965 |
| 7,597 |
|
| Total equity | 69,407 |
| 73,435 |
| 65,732 |
|
| Dividends paid per common share | 2.95 |
| 2.68 |
| 2.41 |
|
The accompanying notes are an integral part of these consolidated financial statements.
ENBRIDGE INC.
CONSOLIDATED STATEMENTS OF CASH FLOWS
|
| | | | | | |
| Year ended December 31, | 2019 |
| 2018 |
| 2017 |
|
| (millions of Canadian dollars) | | | |
| Operating activities | |
| |
| |
|
| Earnings | 5,827 |
| 3,333 |
| 3,266 |
|
| Adjustments to reconcile earnings to net cash provided by operating activities: | | | |
| Depreciation and amortization | 3,391 |
| 3,246 |
| 3,163 |
|
Deferred income tax (recovery)/expense (Note 25) | 1,156 |
| (148 | ) | (2,877 | ) |
Changes in unrealized (gain)/loss on derivative instruments, net (Note 24) | (1,751 | ) | 903 |
| (1,242 | ) |
| Earnings from equity investments | (1,503 | ) | (1,509 | ) | (1,102 | ) |
| Distributions from equity investments | 1,804 |
| 1,539 |
| 1,264 |
|
| Impairment of long-lived assets | 423 |
| 1,104 |
| 4,463 |
|
| Impairment of goodwill | — |
| 1,019 |
| 102 |
|
| (Gain)/loss on dispositions | 254 |
| 8 |
| (120 | ) |
| Other | 56 |
| 92 |
| 79 |
|
Changes in operating assets and liabilities (Note 28) | (259 | ) | 915 |
| (338 | ) |
| Net cash provided by operating activities | 9,398 |
| 10,502 |
| 6,658 |
|
| Investing activities | |
| |
| |
|
| Capital expenditures | (5,492 | ) | (6,806 | ) | (8,287 | ) |
| Long-term investments and restricted long-term investments | (1,159 | ) | (1,312 | ) | (3,586 | ) |
| Distributions from equity investments in excess of cumulative earnings | 417 |
| 1,277 |
| 125 |
|
| Additions to intangible assets | (200 | ) | (540 | ) | (789 | ) |
Cash acquired in Merger Transaction (Note 8) | — |
| — |
| 682 |
|
| Proceeds from dispositions | 2,110 |
| 4,452 |
| 628 |
|
| Other | (20 | ) | (12 | ) | 212 |
|
| Affiliate loans, net | (314 | ) | (76 | ) | (22 | ) |
| Net cash used in investing activities | (4,658 | ) | (3,017 | ) | (11,037 | ) |
| Financing activities | | | |
Net change in short-term borrowings (Note 18) | (127 | ) | (420 | ) | 721 |
|
| Net change in commercial paper and credit facility draws | 825 |
| (2,256 | ) | (1,249 | ) |
| Debenture and term note issues, net of issue costs | 6,176 |
| 3,537 |
| 9,483 |
|
| Debenture and term note repayments | (4,668 | ) | (4,445 | ) | (5,054 | ) |
| Sale of noncontrolling interest in subsidiary | — |
| 1,289 |
| — |
|
| Purchase of interest in consolidated subsidiary | — |
| — |
| (227 | ) |
| Contributions from noncontrolling interests | 12 |
| 24 |
| 832 |
|
| Distributions to noncontrolling interests | (254 | ) | (857 | ) | (919 | ) |
| Contributions from redeemable noncontrolling interests | — |
| 70 |
| 1,178 |
|
| Distributions to redeemable noncontrolling interests | — |
| (325 | ) | (247 | ) |
| Sponsored Vehicle buy-in cash payment | — |
| (64 | ) | — |
|
| Preference shares issued | — |
| — |
| 489 |
|
| Redemption of preferred shares | (300 | ) | (210 | ) | — |
|
| Common shares issued | 18 |
| 21 |
| 1,549 |
|
| Preference share dividends | (383 | ) | (364 | ) | (330 | ) |
| Common share dividends | (5,973 | ) | (3,480 | ) | (2,750 | ) |
| Other | (71 | ) | (23 | ) | — |
|
| Net cash (used in)/provided by financing activities | (4,745 | ) | (7,503 | ) | 3,476 |
|
| Effect of translation of foreign denominated cash and cash equivalents and restricted cash | 44 |
| 68 |
| (72 | ) |
| Net increase/(decrease) in cash and cash equivalents and restricted cash | 39 |
| 50 |
| (975 | ) |
| Cash and cash equivalents and restricted cash at beginning of year | 637 |
| 587 |
| 1,562 |
|
| Cash and cash equivalents and restricted cash at end of year | 676 |
| 637 |
| 587 |
|
| Supplementary cash flow information | |
| |
| |
|
| Cash paid for income taxes | 571 |
| 277 |
| 172 |
|
| Cash paid for interest, net of amount capitalized | 2,738 |
| 2,508 |
| 2,668 |
|
| Property, plant and equipment non-cash accruals | 730 |
| 847 |
| 889 |
|
The accompanying notes are an integral part of these consolidated financial statements.
ENBRIDGE INC.
CONSOLIDATED STATEMENTS OF FINANCIAL POSITION
|
| | | | |
| December 31, | 2019 |
| 2018 |
|
| (millions of Canadian dollars; number of shares in millions) | | |
| Assets | |
| |
|
| Current assets | |
| |
|
Cash and cash equivalents (Note 2) | 648 |
| 518 |
|
| Restricted cash | 28 |
| 119 |
|
Accounts receivable and other (Note 9) | 6,781 |
| 6,517 |
|
| Accounts receivable from affiliates | 69 |
| 79 |
|
Inventory (Note 10) | 1,299 |
| 1,339 |
|
| | 8,825 |
| 8,572 |
|
Property, plant and equipment, net (Note 11) | 93,723 |
| 94,540 |
|
Long-term investments (Note 13) | 16,528 |
| 16,707 |
|
Restricted long-term investments (Note 14) | 434 |
| 323 |
|
| Deferred amounts and other assets | 7,433 |
| 8,558 |
|
Intangible assets, net (Note 15) | 2,173 |
| 2,372 |
|
Goodwill (Note 16) | 33,153 |
| 34,459 |
|
Deferred income taxes (Note 25) | 1,000 |
| 1,374 |
|
| Total assets | 163,269 |
| 166,905 |
|
| | | |
| Liabilities and equity | |
| |
|
| Current liabilities | |
| |
|
Short-term borrowings (Note 18) | 898 |
| 1,024 |
|
Accounts payable and other (Note 17) | 10,063 |
| 9,863 |
|
| Accounts payable to affiliates | 21 |
| 40 |
|
| Interest payable | 624 |
| 669 |
|
Current portion of long-term debt (Note 18) | 4,404 |
| 3,259 |
|
| | 16,010 |
| 14,855 |
|
Long-term debt (Note 18) | 59,661 |
| 60,327 |
|
| Other long-term liabilities | 8,324 |
| 8,834 |
|
Deferred income taxes (Note 25) | 9,867 |
| 9,454 |
|
| | 93,862 |
| 93,470 |
|
Commitments and contingencies (Note 30) |
|
|
|
|
| Equity | | |
Share capital (Note 21) | | |
| Preference shares | 7,747 |
| 7,747 |
|
Common shares (2,025 and 2,022 outstanding at December 31, 2019 and | | |
| December 31, 2018, respectively) | 64,746 |
| 64,677 |
|
| Additional paid-in capital | 187 |
| — |
|
| Deficit | (6,314 | ) | (5,538 | ) |
Accumulated other comprehensive income/(loss) (Note 23) | (272 | ) | 2,672 |
|
| Reciprocal shareholding | (51 | ) | (88 | ) |
| Total Enbridge Inc. shareholders’ equity | 66,043 |
| 69,470 |
|
Noncontrolling interests (Note 20) | 3,364 |
| 3,965 |
|
| | 69,407 |
| 73,435 |
|
| Total liabilities and equity | 163,269 |
| 166,905 |
|
Variable Interest Entities (VIEs) (Note 12).
The accompanying notes are an integral part of these consolidated financial statements.
NOTES TO THE CONSOLIDATED FINANCIAL STATEMENTS
INDEX
|
| | | |
| | | Page |
| 1. |
| Business Overview | |
| 2. |
| Significant Accounting Policies | |
| 3. |
| Changes in Accounting Policies | |
| 4. |
| Revenue | |
| 5. |
| Segmented Information | |
| 6. |
| Earnings per Common Share | |
| 7. |
| Regulatory Matters | |
| 8. |
| Acquisitions and Dispositions | |
| 9. |
| Accounts Receivable and Other | |
| 10. |
| Inventory | |
| 11. |
| Property, Plant and Equipment | |
| 12. |
| Variable Interest Entities | |
| 13. |
| Long-Term Investments | |
| 14. |
| Restricted Long-Term Investments | |
| 15. |
| Intangible Assets | |
| 16. |
| Goodwill | |
| 17. |
| Accounts Payable and Other | |
| 18. |
| Debt | |
| 19. |
| Asset Retirement Obligations | |
| 20. |
| Noncontrolling Interests | |
| 21. |
| Share Capital | |
| 22. |
| Stock Option and Stock Unit Plans | |
| 23. |
| Components of Accumulated Other Comprehensive Income/(Loss) | |
| 24. |
| Risk Management and Financial Instruments | |
| 25. |
| Income Taxes | |
| 26. |
| Pension and Other Postretirement Benefits | |
| 27. |
| Leases | |
| 28. |
| Changes in Operating Assets and Liabilities | |
| 29. |
| Related Party Transactions | |
| 30. |
| Commitments and Contingencies | |
| 31. |
| Guarantees | |
| 32. |
| Condensed Consolidating Financial Information | |
| 33. |
| Quarterly Financial Data (Unaudited) | |
1. BUSINESS OVERVIEW
The terms “we,” “our,” “us” and “Enbridge” as used in this report refer collectively to Enbridge Inc. and its subsidiaries unless the context suggests otherwise. These terms are used for convenience only and are not intended as a precise description of any separate legal entity within Enbridge.
Enbridge is a publicly traded energy transportation and distribution company. We conduct our business through 5 business segments: Liquids Pipelines; Gas Transmission and Midstream; Gas Distribution and Storage; Renewable Power Generation; and Energy Services. These reporting segments are strategic business units established by senior management to facilitate the achievement of our long-term objectives, to aid in resource allocation decisions and to assess operational performance.
LIQUIDS PIPELINES
Liquids Pipelines consists of pipelines and related terminals in Canada and the United States that transport various grades of crude oil and other liquid hydrocarbons, including the Mainline System, Regional Oil Sands System, Gulf Coast and Mid-Continent, Southern Lights Pipeline, Express-Platte System, Bakken System, and Feeder Pipelines and Other.
GAS TRANSMISSION AND MIDSTREAM
Gas Transmission and Midstream consists of investments in natural gas pipelines and gathering and processing facilities in Canada and the United States, including US Gas Transmission, Canadian Gas Transmission, US Midstream and Other.
GAS DISTRIBUTION AND STORAGE
Gas Distribution and Storage consists of our natural gas utility operations, the core of which is Enbridge Gas, which serves residential, commercial and industrial customers, located throughout Ontario. Gas Distribution and Storage also includes natural gas distribution activities in Quebec and an investment in Noverco, which holds a majority interest in a subsidiary entity engaged in distribution and energy transportation primarily in Quebec.
RENEWABLE POWER GENERATION
Renewable Power Generation consists primarily of investments in wind and solar power generating assets, as well as geothermal, waste heat recovery, and transmission assets. In North America, assets are primarily located in the provinces of Alberta, Saskatchewan, Ontario, and Quebec and in the states of Colorado, Texas, Indiana and West Virginia. We also have offshore wind assets in operation and under development located in United Kingdom, Germany, and France.
ENERGY SERVICES
The Energy Services businesses in Canada and the United States undertake physical commodity marketing activity and logistical services to manage our volume commitments on various pipeline systems. Energy Services also provides energy marketing services to North American refiners, producers and other customers.
ELIMINATIONS AND OTHER
In addition to the segments noted above, Eliminations and Other includes operating and administrative costs and the impact of foreign exchange hedge settlements, which are not allocated to business segments. Eliminations and Other also includes new business development activities and corporate investments.
SPONSORED VEHICLES BUY-IN
In the fourth quarter of 2018, Enbridge completed the buy-ins of our sponsored vehicles: SEP, EEP, Enbridge Energy Management, L.L.C. (EEM) and ENF, (referred to herein collectively as the Sponsored Vehicles) in a series of combination transactions, through which we acquired all of the outstanding equity securities of the Sponsored Vehicles not beneficially owned by us (collectively, the Sponsored Vehicles buy-in). Please refer to Note 20 - Noncontrolling Interests for further discussion of the transactions.
ACQUISITION OF SPECTRA ENERGY CORP
On February 27, 2017, Enbridge and Spectra Energy Corp (Spectra Energy) combined in a stock-for-stock merger transaction for a purchase price of $37.5 billion. Under the terms of the Merger Transaction, Spectra Energy shareholders received 0.984 shares of Enbridge common stock for each share of Spectra Energy common stock that they owned, resulting in us acquiring 100% ownership of Spectra Energy. Please refer to Note 8 - Acquisitions and Dispositions for further discussion of the transaction.
DISPOSITIONS
During the years ended December 31, 2019 and 2018, we have disposed of a number of our non-core assets. Please refer to Note 8 - Acquisitions and Dispositions for further discussion of these transactions.
2. SIGNIFICANT ACCOUNTING POLICIES
These consolidated financial statements are prepared in accordance with U.S. Generally accepted accounting principles in the United States of America (U.S. GAAP) . Amounts are stated in Canadian dollars unless otherwise noted. As a SEC registrant, we are permitted to use U.S. GAAP for purposes of meeting both our Canadian and United States continuous disclosure requirements.
BASIS OF PRESENTATION AND USE OF ESTIMATES
The preparation of financial statements in conformity with U.S. GAAP requires management to make estimates and assumptions that affect the reported amounts of assets, liabilities, revenues and expenses, as well as the disclosure of contingent assets and liabilities in the consolidated financial statements. Significant estimates and assumptions used in the preparation of the consolidated financial statements include, but are not limited to: carrying values of regulatory assets and liabilities (Note 7); purchase price allocations (Note 8); unbilled revenues; depreciation rates and carrying value of property, plant and equipment (Note 11); amortization rates of intangible assets (Note 15); measurement of goodwill (Note 16); fair value of ARO (Note 19); valuation of stock-based compensation (Note 22); fair value of financial instruments (Note 24); provisions for income taxes (Note 25); assumptions used to measure retirement and other postretirement benefit obligations (OPEB) (Note 26); commitments and contingencies (Note 30); and estimates of losses related to environmental remediation obligations (Note 30). Actual results could differ from these estimates.
PRINCIPLES OF CONSOLIDATION
The consolidated financial statements include our accounts and accounts of our subsidiaries and VIEs for which we are the primary beneficiary. A VIE is a legal entity that does not have sufficient equity at risk to finance its activities without additional subordinated financial support or is structured such that equity investors lack the ability to make significant decisions relating to the entity’s operations through voting rights or do not substantively participate in the gains and losses of the entity. Upon inception of a contractual agreement, we perform an assessment to determine whether the arrangement contains a variable interest in a legal entity and whether that legal entity is a VIE. The primary beneficiary has both the power to direct the activities of the VIE that most significantly impact the entity’s economic performance and the obligation to absorb losses or the right to receive benefits from the VIE entity that could potentially be significant to the VIE. Where we conclude that we are the primary beneficiary of a VIE, we consolidate the accounts of that VIE. We assess all variable interests in the entity and use our judgment when determining if we are the primary beneficiary. Other qualitative factors that are considered include decision-making responsibilities, the VIE capital structure, risk and rewards sharing, contractual agreements with the VIE, voting rights and level of involvement of other parties. We assess the primary beneficiary determination for a VIE on an ongoing basis, if there are changes in the facts and circumstances related to a VIE. The consolidated financial statements also include the accounts of any limited partnerships where we represent the general partner and, based on all facts and circumstances, control such limited partnerships, unless the limited partner has substantive participating rights or substantive kick-out rights. For certain investments where we retain an undivided interest in assets and liabilities, we record our proportionate share of assets, liabilities, revenues and expenses. If an entity is determined to not be a VIE, the voting interest entity model is applied, where an investor holding the majority voting rights consolidates the entity.
All significant intercompany accounts and transactions are eliminated upon consolidation. Ownership interests in subsidiaries represented by other parties that do not control the entity are presented in the consolidated financial statements as activities and balances attributable to noncontrolling interests and redeemable noncontrolling interests. Investments and entities over which we exercise significant influence are accounted for using the equity method.
REGULATION
Certain parts of our businesses are subject to regulation by various authorities including, but not limited to, the CER, the FERC, the Alberta Energy Regulator, the OEB and La Régie de l’Energie du Québec. Regulatory bodies exercise statutory authority over matters such as construction, rates and ratemaking and agreements with customers. To recognize the economic effects of the actions of the regulator, the timing of recognition of certain revenues and expenses in these operations may differ from that otherwise expected under U.S. GAAP for non rate-regulated entities.
Regulatory assets represent amounts that are expected to be recovered from customers in future periods through rates. Regulatory liabilities represent amounts that are expected to be refunded to customers in future periods through rates or expected to be paid to cover future abandonment costs in relation to the CER’s LMCI. Long-term regulatory assets are recorded in Deferred amounts and other assets and current regulatory assets are recorded in Accounts receivable and other. Long-term regulatory liabilities are included in Other long-term liabilities and current regulatory liabilities are recorded in Accounts payable and other. Regulatory assets are assessed for impairment if we identify an event indicative of possible impairment. The recognition of regulatory assets and liabilities is based on the actions, or expected future actions, of the regulator. To the extent that the regulator’s actions differ from our expectations, the timing and amount of recovery or settlement of regulatory balances could differ significantly from those recorded. In the absence of rate regulation, we would generally not recognize regulatory assets or liabilities and the earnings impact would be recorded in the period the expenses are incurred or revenues are earned. A regulatory asset or liability is recognized in respect of deferred income taxes when it is expected the amounts will be recovered or settled through future regulator-approved rates.
Allowance for funds used during construction (AFUDC) is included in the cost of property, plant and equipment and is depreciated over future periods as part of the total cost of the related asset. AFUDC includes both an interest component and, if approved by the regulator, a cost of equity component, which are both capitalized based on rates set out in a regulatory agreement. The corresponding impact on earnings is included in Interest expense for the interest component and Other income for the equity component. In the absence of rate regulation, we would capitalize interest using a capitalization rate based on our cost of borrowing, whereas the capitalized equity component, the corresponding earnings during the construction phase and the subsequent depreciation relating to the equity component would not be recognized.
For certain regulated operations to which U.S. GAAP guidance for phase-in plans applies, negotiated depreciation rates recovered in transportation tolls may be less than the depreciation expense calculated in accordance with U.S. GAAP in early years of long-term contracts but recovered in future periods when tolls exceed depreciation. Depreciation expense on such assets is recorded in accordance with U.S. GAAP and 0 deferred regulatory asset is recorded (Note 7).
REVENUE RECOGNITION
For businesses that are not rate-regulated, revenues are recorded when products have been delivered or services have been performed, the amount of revenue can be reliably measured and collectability is reasonably assured. Customer credit worthiness is assessed prior to agreement signing, as well as throughout the contract duration. Certain revenues from liquids and gas pipeline businesses are recognized under the terms of committed delivery contracts rather than the cash tolls received.
Long-term take-or-pay contracts, under which shippers are obligated to pay fixed amounts rateably over the contract period regardless of volumes shipped, may contain make-up rights. Make-up rights are earned by shippers when minimum volume commitments are not utilized during the period but under certain circumstances can be used to offset overages in future periods, subject to expiry periods. We recognize revenues associated with make-up rights at the earlier of when the make-up volume is shipped, the make-up right expires or when it is determined that the likelihood that the shipper will utilize the make-up right is remote.
Certain offshore pipeline transportation contracts require Enbridge to provide transportation services for the life of the underlying producing fields. Under these arrangements, shippers pay Enbridge a fixed monthly toll for a defined period of time which may be shorter than the estimated reserve life of the underlying producing fields, resulting in a contract period which extends past the period of cash collection. Fixed monthly toll revenues are recognized ratably over the committed volume made available to shippers throughout the contract period, regardless of when cash is received. For the years ended December 31, 2019, 2018 and 2017, cash received net of revenue recognized for contracts under make-up rights and similar deferred revenue arrangements was $169 million, $208 million, and $196 million, respectively.
For rate-regulated businesses, revenues are recognized in a manner that is consistent with the underlying agreements as approved by the regulators. Natural gas utilities revenues are recorded on the basis of regular meter readings and estimates of customer usage from the last meter reading to the end of the reporting period. Estimates are based on historical consumption patterns and heating degree days experienced. Heating degree days is a measure of coldness that is indicative of volumetric requirements for natural gas utilized for heating purposes in our distribution franchise area. Since July 1, 2011, Canadian Mainline (excluding Lines 8 and 9) earnings are governed by the CTS, under which revenues are recorded when services are performed. Effective on that date, we prospectively discontinued the application of rate-regulated accounting for those assets with the exception of flow-through income taxes covered by specific rate orders.
Our Energy Services segment enters into commodity purchase and sale arrangements that are recorded gross because the related contracts are not held for trading purposes and we are acting as the principal in the transactions. For our energy marketing contracts, an estimate of revenues and commodity costs for the month of December is included in the Consolidated Statements of Earnings for each year based on the best available volume and price data for the commodity delivered and received.
DERIVATIVE INSTRUMENTS AND HEDGING
Non-qualifying Derivatives
Non-qualifying derivative instruments are used primarily to economically hedge foreign exchange, interest rate and commodity price earnings exposure. Non-qualifying derivatives are measured at fair value with changes in fair value recognized in earnings in Transportation and other services revenues, Commodity costs, Operating and administrative expense, Other income/(expense) and Interest expense.
Derivatives in Qualifying Hedging Relationships
We use derivative financial instruments to manage our exposure to changes in commodity prices, foreign exchange rates, interest rates and certain compensation tied to our share price. Hedge accounting is optional and requires Enbridge to document the hedging relationship and test the hedging item’s effectiveness in offsetting changes in fair values or cash flows of the underlying hedged item on an ongoing basis. We present the earnings effects of hedging items with the hedged transaction. Derivatives in qualifying hedging relationships are categorized as cash flow hedges, fair value hedges or net investment hedges.
Cash Flow Hedges
We use cash flow hedges to manage our exposure to changes in commodity prices, foreign exchange rates, interest rates and certain compensation tied to our share price. The change in the fair value of a cash flow hedging instrument is recorded in OCI and is reclassified to earnings when the hedged item impacts earnings.
If a derivative instrument designated as a cash flow hedge ceases to be effective or is terminated, hedge accounting is discontinued and the gain or loss at that date is deferred in OCI and recognized in earnings concurrently with the related transaction. If an anticipated hedged transaction is no longer probable, the gain or loss is recognized immediately in earnings. Subsequent gains and losses from derivative instruments for which hedge accounting has been discontinued are recognized in earnings in the period in which they occur.
Fair Value Hedges
We may use fair value hedges to hedge the fair value of debt instruments. The change in the fair value of the hedging instrument is recorded in earnings with changes in the fair value of the hedged risk of the asset or liability that is designated as part of the hedging relationship. If a fair value hedge is discontinued or ceases to be effective, the hedged risk of the asset or liability ceases to be remeasured at fair value and the cumulative fair value adjustment to the carrying value of the hedged item is recognized in earnings over the remaining life of the hedged item.
Net Investment Hedges
Gains and losses arising from translation of net investment in foreign operations from their functional currencies to Enbridge’s Canadian dollar presentation currency are included in cumulative translation adjustments (CTA), a component of OCI. We designate foreign currency derivatives and United States dollar denominated debt as hedges of net investments in United States dollar denominated foreign operations. As a result, the change in the fair value of the foreign currency derivatives as well as the translation of United States dollar denominated debt are reflected in OCI. Amounts recognized previously in Accumulated other comprehensive income/(loss) (AOCI) are reclassified to earnings when there is a reduction of the hedged net investment resulting from disposal of a foreign operation.
Classification of Derivatives
We recognize the fair market value of derivative instruments on the Consolidated Statements of Financial Position as current and non-current assets or liabilities depending on the timing of the settlements and the resulting cash flows associated with the instruments. Fair value amounts related to cash flows occurring beyond one year are classified as non-current.
Cash inflows and outflows related to derivative instruments are classified as Operating activities on the Consolidated Statements of Cash Flows.
Balance Sheet Offset
Assets and liabilities arising from derivative instruments may be offset in the Consolidated Statements of Financial Position when we have the legal right and intention to settle them on a net basis.
Transaction Costs
Transaction costs are incremental costs directly related to the acquisition of a financial asset or the issuance of a financial liability. We incur transaction costs primarily from the issuance of debt and account for these costs as a deduction from Long-term debt on the Statements of Financial Position. These costs are amortized using the effective interest rate method over the term of the related debt instrument and are recorded in Interest expense.
EQUITY INVESTMENTS
Equity investments over which we exercise significant influence, but do not have controlling financial interests, are accounted for using the equity method. Equity investments are initially measured at cost and are adjusted for our proportionate share of undistributed equity earnings or loss. Equity investments are increased for contributions made to and decreased for distributions received from the investees. To the extent an equity investee undertakes activities necessary to commence its planned principal operations, we capitalize interest costs associated with the investment during such period.
RESTRICTED LONG-TERM INVESTMENTS
Long-term investments that are restricted as to withdrawal or usage, for the purposes of the CER’s LMCI, are presented as Restricted long-term investments on the Consolidated Statements of Financial Position.
OTHER INVESTMENTS
Generally, we classify equity investments in entities over which we do not exercise significant influence and that do not have readily determinable fair values as other investments measured at fair value measurement alternative and recorded at cost minus impairment, if any, plus or minus changes resulting from observable price changes in orderly transactions for an identical or similar investment of the same issuer. Investments in equity securities measured using the fair value measurement alternative are reviewed for impairment each reporting period. Equity investments with readily determinable fair values are measured at fair value through net income. Dividends received from investments in equity securities are recognized in earnings when the right to receive payment is established.
Investments in debt securities are classified either as available for sale securities measured at fair value through OCI or as held to maturity securities measured at amortized cost.
NONCONTROLLING INTERESTS
Noncontrolling interests represent ownership interests attributable to third parties in certain consolidated subsidiaries. The portion of equity not owned by us in such entities is reflected as Noncontrolling interests within the equity section of the Consolidated Statements of Financial Position.
INCOME TAXES
Income taxes are accounted for using the liability method. Deferred income tax assets and liabilities are recorded based on temporary differences between the tax bases of assets and liabilities and their carrying values for accounting purposes. Deferred income tax assets and liabilities are measured using the tax rate that is expected to apply when the temporary differences reverse. For our regulated operations, a deferred income tax liability or asset is recognized with a corresponding regulatory asset or liability, respectively, to the extent taxes can be recovered through rates. Any interest and/or penalty incurred related to tax is reflected in income taxes.
FOREIGN CURRENCY TRANSACTIONS AND TRANSLATION
Foreign currency transactions are those transactions whose terms are denominated in a currency other than the currency of the primary economic environment in which Enbridge or a reporting subsidiary operates, referred to as the functional currency. Transactions denominated in foreign currencies are translated into the functional currency using the exchange rate prevailing at the date of the transaction. Monetary assets and liabilities denominated in foreign currencies are translated to the functional currency using the rate of exchange in effect at the balance sheet date. Exchange gains and losses resulting from translation of monetary assets and liabilities are included in the Consolidated Statements of Earnings in the period in which they arise.
Gains and losses arising from translation of foreign operations’ functional currencies to our Canadian dollar presentation currency are included in the CTA component of AOCI and are recognized in earnings upon sale of the foreign operation. Asset and liability accounts are translated at the exchange rates in effect on the balance sheet date, while revenues and expenses are translated using monthly average exchange rates.
CASH AND CASH EQUIVALENTS
Cash and cash equivalents include short-term investments with a term to maturity of three months or less when purchased.
RESTRICTED CASH
Cash and cash equivalents that are restricted as to withdrawal or usage, in accordance with specific commercial arrangements, are presented as Restricted cash on the Consolidated Statements of Financial Position.
LOANS AND RECEIVABLES
Affiliate long-term notes receivable are measured at amortized cost using the effective interest rate method, net of any impairment losses recognized. Accounts receivable and other are measured at cost.
ALLOWANCE FOR DOUBTFUL ACCOUNTS
Allowance for doubtful accounts is determined based on collection history. When we have determined that further collection efforts are unlikely to be successful, amounts charged to the allowance for doubtful accounts are applied against the impaired accounts receivable.
NATURAL GAS IMBALANCES
The Consolidated Statements of Financial Position include in-kind balances as a result of differences in gas volumes received and delivered for customers. Since settlement of certain imbalances is in-kind, changes in the balances do not have an effect on our Consolidated Statements of Earnings or Consolidated Statements of Cash Flows. Most natural gas volumes owed to or by us are valued at natural gas market index prices as at the balance sheet dates.
INVENTORY
Inventory is comprised of natural gas in storage held in Enbridge Gas, and crude oil and natural gas held primarily by energy services businesses in the Energy Services segment. Natural gas in storage in Enbridge Gas is recorded at the quarterly prices approved by the OEB in the determination of distribution rates. The actual price of gas purchased may differ from the OEB approved price. The difference between the approved price and the actual cost of the gas purchased is deferred as a liability for future refund or as an asset for collection as approved by the OEB. Other commodities inventory is recorded at the lower of cost, as determined on a weighted average basis, or market value. Upon disposition, other commodities inventory is recorded to Commodity costs on the Consolidated Statements of Earnings at the weighted average cost of inventory, including any adjustments recorded to reduce inventory to market value.
PROPERTY, PLANT AND EQUIPMENT
Property, plant and equipment is recorded at historical cost. Expenditures for construction, expansion, major renewals and betterments are capitalized. Maintenance and repair costs are expensed as incurred. Expenditures for project development are capitalized if they are expected to have future benefit. We capitalize interest incurred during construction for non-rate-regulated assets. For rate-regulated assets, AFUDC is included in the cost of property, plant and equipment and is depreciated over future periods as part of the total cost of the related asset. AFUDC includes both an interest component and, if approved by the regulator, a cost of equity component.
NaN primary methods of depreciation are utilized. For distinct assets, depreciation is generally provided on a straight-line basis over the estimated useful lives of the assets commencing when the asset is placed in service. For largely homogeneous groups of assets with comparable useful lives, the pool method of accounting for property, plant and equipment is followed whereby similar assets are grouped and depreciated as a pool. When group assets are retired or otherwise disposed of, gains and losses are generally not reflected in earnings but are booked as an adjustment to accumulated depreciation.
DEFERRED AMOUNTS AND OTHER ASSETS
Deferred amounts and other assets primarily include costs which regulatory authorities have permitted, or are expected to permit, to be recovered through future rates including: deferred income taxes; contractual receivables under the terms of long-term delivery contracts; derivative financial instruments; and actuarial gains and losses arising from defined benefit pension plans.
INTANGIBLE ASSETS
Intangible assets consist primarily of certain software costs, customer relationships and emission allowances. We capitalize costs incurred during the application development stage of internal use software projects. Customer relationships represent the underlying relationship from long-term agreements with customers that are capitalized upon acquisition. From January 1, 2017 through July 3, 2018, emission allowances, which are recorded at their original cost, were purchased in order to meet GHG compliance obligations. Intangible assets are generally amortized on a straight-line basis over their expected lives, commencing when the asset is available for use, with the exception of emission allowances, which are not amortized as they will be used to satisfy compliance obligations as they come due.
GOODWILL
Goodwill represents the excess of the purchase price over the fair value of net identifiable assets on acquisition of a business. The carrying value of goodwill, which is not amortized, is assessed for impairment annually, or more frequently if events or changes in circumstances arise that suggest the carrying value of goodwill may be impaired. We perform our annual review of the goodwill balance on April 1.
We perform our annual review for impairment at the reporting unit level, which is identified by assessing whether the components of our operating segments constitute businesses for which discrete information is available, whether segment management regularly reviews the operating results of those components and whether the economic and regulatory characteristics are similar.
We have the option to first assess qualitative factors to determine whether it is necessary to perform the quantitative goodwill impairment test. When performing a qualitative assessment, we determine the drivers of fair value for each reporting unit and evaluate whether those drivers have been positively or negatively affected by relevant events and circumstances since the last fair value assessment. Our evaluation includes, but is not limited to, assessment of macroeconomic trends, regulatory environments, capital accessibility, operating income trends, and industry conditions. Based on our assessment of the qualitative factors, if we determine it is more likely than not that the fair value of the reporting unit is less than it's carrying amount, a quantitative goodwill impairment test is performed.
The quantitative goodwill impairment test involves determining the fair value of our reporting units and comparing those values to the carrying value of each reporting unit. If the carrying value of a reporting unit, including allocated goodwill, exceeds its fair value, goodwill impairment is measured at the amount by which the reporting unit’s carrying value exceeds its fair value. This amount should not exceed the carrying amount of goodwill. Fair value of our reporting units is estimated using a combination of discounted cash flow model and earnings multiples techniques. The determination of fair value using the discounted cash flow model technique requires the use of estimates and assumptions related to discount rates, projected operating income, terminal value growth rates, capital expenditures and working capital levels. The cash flow projections included significant judgments and assumptions relating to revenue growth rates and expected future capital expenditure. The determination of fair value using the earnings multiples technique requires assumptions to be made in relation to maintainable earnings and earnings multipliers for reporting units.
The allocation of goodwill to held for sale and disposed businesses is based on the relative fair value of businesses included in the particular reporting unit.
IMPAIRMENT
We review the carrying values of our long-lived assets as events or changes in circumstances warrant. If it is determined that the carrying value of an asset exceeds the undiscounted cash flows expected from the asset, we calculate fair value based on the discounted cash flows and write the assets down to the extent that the carrying value exceeds the fair value.
With respect to investments in debt securities and equity investments, we assess at each balance sheet date whether there is objective evidence that a financial asset is impaired by completing a quantitative or qualitative analysis of factors impacting the investment. If there is objective evidence of impairment, we value the expected discounted cash flows using observable market inputs and determine whether the decline below carrying value is other than temporary. If the decline is determined to be other than temporary, an impairment charge is recorded in earnings with an offsetting reduction to the carrying value of the asset.
With respect to other financial assets, we assess the assets for impairment when there is no longer reasonable assurance of timely collection. If evidence of impairment is noted, we reduce the value of the financial asset to its estimated realizable amount, determined using discounted expected future cash flows.
ASSET RETIREMENT OBLIGATIONS
ARO associated with the retirement of long-lived assets are measured at fair value and recognized as Accounts payable and other or Other long-term liabilities in the period in which they can be reasonably determined. The fair value approximates the cost a third party would charge to perform the tasks necessary to retire such assets and is recognized at the present value of expected future cash flows. ARO are added to the carrying value of the associated asset and depreciated over the asset’s useful life. The corresponding liability is accreted over time through charges to earnings and is reduced by actual costs of decommissioning and reclamation. Our estimates of retirement costs could change as a result of changes in cost estimates and regulatory requirements.
PENSION AND OTHER POSTRETIREMENT BENEFITS
We sponsor defined benefit and defined contribution pension plans, and defined benefit OPEB plans, which provide group health care, life insurance benefits and other postretirement benefits.
Defined benefit pension obligation and net periodic benefit cost are estimated using the projected unit
credit method, which incorporates management’s best estimates of future salary levels, other cost
escalations, retirement ages of employees and other actuarial factors including discount rates and
mortality. The OPEB benefit obligation and net periodic benefit cost are estimated using the projected unit
credit method, where benefits are attributed to years of service, taking into consideration projection of
benefit costs.
We use mortality tables issued by the Society of Actuaries in the United States (revised in 2019) and the Canadian Institute of Actuaries (revised in 2014) to measure the benefit obligations of our United States pension plan (the United States Plan) and our Canadian pension plans (the Canadian Plans), respectively.
We determine discount rates by reference to rates of high-quality long-term corporate bonds with maturities that approximate the timing of future payments we anticipate making under each of the respective plans.
Funded pension and OPEB plan assets are measured at fair value. The expected return on funded pension and OPEB plan assets is determined using market related values and assumptions on the invested asset mix consistent with the investment policies relating to the plan assets. The market related values reflect estimated return on investments consistent with long-term historical averages for similar assets.
Actuarial gains and losses arise from the difference between the actual and expected rate of return on plan assets for that period (funded pension and OPEB plans) or from changes in actuarial assumptions used to determine the accrued benefit obligation, including discount rate, changes in headcount and salary inflation experience.
The excess of the fair value of a plan’s assets over the fair value of a plan’s benefit obligation is
recognized as Deferred amounts and other assets in our Consolidated Statements of
Financial Position. The excess of the fair value of a plan’s benefit obligation over the fair value of a
plan’s assets is recognized as Accounts payable and other and Other long-term liabilities in our Consolidated Statements of Financial Position.
Net periodic benefit cost is charged to Earnings and includes:
Cost of benefits provided in exchange for employee services rendered during the year (current service cost);
Interest cost of plan obligations;
Expected return on plan assets (funded pension and OPEB plans);
Amortization of prior service costs on a straight-line basis over the expected average remaining service period of the active employee group covered by the plans; and
Amortization of cumulative unrecognized net actuarial gains and losses in excess of 10% of the greater of the accrued benefit obligation or the fair value of plan assets, over the expected average remaining service life of the active employee group covered by the plans.
Cumulative unrecognized net actuarial gains and losses and prior service costs arising from defined benefit pension plans for our non-utility operations and from defined benefit OPEB plans are presented as a component of AOCI in our Consolidated Statements of Changes in Equity. Any unrecognized actuarial gains and losses and prior service costs and credits related to those plans that arise during the period are recognized as a component of OCI, net of tax. Cumulative unrecognized net actuarial gains and losses and prior service costs arising from defined benefit pension plans for our utility operations, which have been permitted or are expected to be permitted by the Regulators, to be recovered through future rates, are presented as a component of Deferred amounts and other assets in our Consolidated Statements of
Financial Position.
Our utility operations also record regulatory adjustments to reflect the difference between certain net periodic benefit costs for accounting purposes and net periodic benefit costs for ratemaking purposes. Offsetting regulatory assets or liabilities are recorded to the extent net periodic benefit costs are expected to be collected from or refunded to customers, respectively, in future rates. In the absence of rate regulation, regulatory assets or liabilities would not be recorded and net periodic benefit costs would be charged to Earnings and OCI on an accrual basis.
For defined contribution plans, contributions made by us are expensed in the period in which the contribution occurs.
STOCK-BASED COMPENSATION
Incentive Stock Options (ISO) granted are recorded using the fair value method. Under this method, compensation expense is measured at the grant date based on the fair value of the ISO granted as calculated by the Black-Scholes-Merton model and is recognized on a straight-line basis over the shorter of the vesting period or the period to early retirement eligibility, with a corresponding credit to Additional paid-in capital. Balances in Additional paid-in capital are transferred to Share capital when the options are exercised.
Performance Stock Units (PSU) and Restricted Stock Units (RSU) are cash settled awards for which the related liability is remeasured each reporting period. PSUs vest at the completion of a three-year term and RSUs vest at the completion of a 35-month term. During the vesting term, compensation expense is recorded based on the number of units outstanding and the current market price of Enbridge’s shares with an offset to Accounts payable and other or to Other long-term liabilities. The value of the PSUs are also dependent on our performance relative to performance targets set out under the plan.
COMMITMENTS, CONTINGENCIES AND ENVIRONMENTAL LIABILITIES
We expense or capitalize, as appropriate, expenditures for ongoing compliance with environmental regulations that relate to past or current operations. We expense costs incurred for remediation of existing environmental contamination caused by past operations that do not benefit future periods by preventing or eliminating future contamination. We record liabilities for environmental matters when assessments indicate that remediation efforts are probable and the costs can be reasonably estimated. Estimates of environmental liabilities are based on currently available facts, existing technology and presently enacted laws and regulations taking into consideration the likely effects of inflation and other factors. These amounts also consider prior experience in remediating contaminated sites, other companies’ clean-up experience and data released by government organizations. Our estimates are subject to revision in future periods based on actual costs or new information and are included in Other long-term liabilities in the Consolidated Statements of Financial Position at their undiscounted amounts. There is always a potential of incurring additional costs in connection with environmental liabilities due to variations in any or all of the categories described above, including modified or revised requirements from regulatory agencies, in addition to fines and penalties, as well as expenditures associated with litigation and settlement of claims. We evaluate recoveries from insurance coverage separately from the liability and, when recovery is probable, we record and report an asset separately from the associated liability in the Consolidated Statements of Financial Position.
Liabilities for other commitments and contingencies are recognized when, after fully analyzing available information, we determine it is either probable that an asset has been impaired, or that a liability has been incurred, and the amount of impairment or loss can be reasonably estimated. When a range of probable loss can be estimated, we recognize the most likely amount, or if no amount is more likely than another, the minimum of the range of probable loss is accrued. We expense legal costs associated with loss contingencies as such costs are incurred.
3. CHANGES IN ACCOUNTING POLICIES
CHANGES IN ACCOUNTING POLICIES
There were no changes in accounting policies during the year ended December 31, 2019.
ADOPTION OF NEW ACCOUNTING STANDARDS
Cloud Computing Arrangements
Effective January 1, 2019, we adopted Accounting Standards Update (ASU) 2018-15 on a prospective basis. The new standard was issued to provide guidance on the accounting for implementation costs incurred in a cloud computing arrangement that is a service contract. This ASU specifies that an entity would apply ASC 350-40, Internal-use software, to determine which implementation costs related to a hosting arrangement that is a service contract should be capitalized and which should be expensed. The amendments in the update also require that the capitalized costs be amortized on a straight-line basis generally over the term of the arrangement and presented in the same income statement line as fees paid for the hosting service, in addition to specifying that the capitalized costs must be presented on the same balance sheet line as the prepayment of fees related to the hosting arrangement. This ASU requires similar consistency in classifications from a cash flow statement perspective. The adoption of this ASU did not have a material impact on our consolidated financial statements.
Improvements to Accounting for Hedging Activities
Effective January 1, 2019, we adopted ASU 2017-12 on a modified retrospective basis. The new standard was issued with the objective of better aligning a company’s risk management activities and the resulting hedge accounting reflected in the financial statements. The amendments allow cash flow hedging of contractually specified components in financial and non-financial items. As a result of the new standard, hedge ineffectiveness will no longer be measured or recorded, and hedging instruments’ fair value changes will be recorded in the same income statement line as the hedged item. The adoption of this accounting update did not have a material impact on our consolidated financial statements.
Amending the Amortization Period for Certain Callable Debt Securities Purchased at a Premium
Effective January 1, 2019, we adopted ASU 2017-08 on a modified retrospective basis. The new standard was issued with the intent of shortening the amortization period to the earliest call date for certain callable debt securities held at a premium. The adoption of this accounting update did not have a material impact on our consolidated financial statements.
Recognition of Leases
Effective January 1, 2019 we adopted ASU 2016-02 Leases (Topic 842) using the modified retrospective approach.
We recognize an arrangement as a lease when a customer has the right to obtain substantially all of the economic benefits from the use of an asset, as well as the right to direct the use of the asset. We recognize right-of-use (ROU) assets and the related lease liabilities on the statement of financial position for operating lease arrangements with a term of 12 months or longer. We do not separate non-lease components from the associated lease components of our lessee contracts and account for both components as a single lease component. We combine lease and non-lease components within a contract for operating lessor leases when certain conditions are met. ROU assets are assessed for impairment using the same approach as is applied for other long-lived assets, as described under the Impairment section of the Significant Accounting Policies Note 2 in the annual consolidated financial statements.
Lease liabilities and ROU assets require the use of judgment and estimates, which are applied in determining the term of a lease, appropriate discount rates, whether an arrangement contains a lease, whether there are any indicators of impairment for ROU assets and whether any ROU assets should be grouped with other long-lived assets for impairment testing.
In adopting Topic 842, we elected the package of practical expedients permitted under the transition guidance. The election to apply the package of practical expedients allows an entity to not apply the new lease standard to the prior year comparative periods in the year of adoption. The application of the package of practical expedients also permits entities not to reassess whether any expired or existing contracts contain leases in accordance with the new guidance, lease classifications, and whether initial direct costs capitalized under current guidance continue to meet the definition of initial direct costs under the new guidance. We also elected the practical expedient related to land easements, allowing us to carry forward our accounting treatment for land easements on existing agreements that had commenced prior to January 1, 2019.
On January 1, 2019, ROU assets and corresponding lease liabilities of $771 million were recorded in connection with the adoption of Topic 842. When added to the $85 million of pre-existing liabilities relating to operating leases for which we no longer utilize the leased assets, total lease liabilities at January 1, 2019 were $856 million. All lease liabilities were measured using a weighted average discount rate of 4.32%. The adoption of this standard had no impact to the Consolidated Statements of Earnings, Comprehensive Income, Changes in Equity or Cash Flows during the period.
Improvements to Related Party Guidance for Variable Interest Entities
Effective September 30, 2019, we adopted ASU 2018-17 on a retrospective basis. The new standard was issued with the objective to improve the related party guidance on determining whether fees paid to decision makers and service providers (decision maker fees) are variable interests. Under the new guidance, reporting entities must consider indirect interests held through related parties in common control arrangements on a proportionate basis, rather than as the equivalent of a direct interest in its entirety, when determining if decision maker fees constitute a variable interest. The adoption of this ASU did not have a material impact on our consolidated financial statements.
FUTURE ACCOUNTING POLICY CHANGES
Accounting for Income Taxes
ASU 2019-12 was issued in December 2019 with the intent of simplifying the accounting for income taxes. The accounting update removes certain exceptions to the general principles in ASC 740 as well as provides simplification by clarifying and amending existing guidance. ASU 2019-12 is effective January 1, 2021 and entities are permitted to adopt the standard early. We are currently assessing the impact of the new standard on our consolidated financial statements.
Clarifying Interaction between Collaborative Arrangements and Revenue from Contracts with Customers
ASU 2018-18 was issued in November 2018 to provide clarity on when transactions between entities in a collaborative arrangement should be accounted for under the new revenue standard, ASC 606. In determining whether transactions in collaborative arrangements should be accounted under the revenue standard, the update specifies that entities shall apply unit of account guidance to identify distinct goods or services and whether such goods and services are separately identifiable from other promises in the contract. ASU 2018-18 also precludes entities from presenting transactions with a collaborative partner which are not in scope of the new revenue standard together with revenue from contracts with customers. The accounting update is effective January 1, 2020 and early adoption is permitted. The adoption of ASU 2018-18 is not expected to have a material impact on our consolidated financial statements.
Disclosure Effectiveness
In August 2018, the Financial Accounting Standards Board issued two amendments as a part of its disclosure framework project aimed to improve the effectiveness of disclosures in the notes to financial statements.
ASU 2018-14 was issued in August 2018 to improve disclosure requirements for employers that sponsor defined benefit pension or other postretirement plans. The amendment modifies the current guidance by adding and removing several disclosure requirements while also clarifying the guidance on current disclosure requirements. ASU 2018-14 is effective January 1, 2021 and entities are permitted to adopt the standard early. The adoption of ASU 2018-14 is not expected to have a material impact on our consolidated financial statements.
ASU 2018-13 was issued to improve the disclosure requirements for fair value measurements by eliminating and modifying some disclosures, while also adding new disclosures. This update is effective January 1, 2020, however entities are permitted to early adopt the eliminated or modified disclosures. The adoption of ASU 2018-13 is not expected to have a material impact on our consolidated financial statements.
Accounting for Credit Losses
ASU 2016-13 was issued in June 2016 with the intent of providing financial statement users with more useful information about the expected credit losses on financial instruments and other commitments to extend credit held by a reporting entity at each reporting date. Current treatment uses the incurred loss methodology for recognizing credit losses that delay the recognition until it is probable a loss has been incurred. The accounting update adds a new impairment model, known as the current expected credit loss model, which is based on expected losses rather than incurred losses. Under the new guidance, an entity will recognize as an allowance its estimate of expected credit losses, which the Financial Accounting Standards Board believes will result in more timely recognition of such losses.
Further, ASU 2018-19 was issued in November 2018 to clarify that operating lease receivables should be accounted for under the new leases standard, ASC 842, and are not within the scope of ASC 326, Financial Instruments - Credit Losses. Both accounting updates are effective January 1, 2020.
We have performed a detailed evaluation as of December 31, 2019 and do not anticipate the adoption of ASU 2016-13 to have a material impact on our consolidated financial statements.
4. REVENUE
REVENUE FROM CONTRACTS WITH CUSTOMERS
Major Products and Services
|
| | | | | | | | | | | | | | |
| | Liquids Pipelines |
| Gas Transmission and Midstream |
| Gas Distribution and Storage |
| Renewable Power Generation |
| Energy Services |
| Eliminations and Other |
| Consolidated |
|
| Year ended December 31, 2019 |
| (millions of Canadian dollars) | |
| |
| |
| |
| |
| |
| |
|
| Transportation revenue | 9,082 |
| 4,477 |
| 743 |
| — |
| — |
| — |
| 14,302 |
|
| Storage and other revenue | 109 |
| 268 |
| 201 |
| — |
| — |
| — |
| 578 |
|
| Gas gathering and processing revenue | — |
| 423 |
| — |
| — |
| — |
| — |
| 423 |
|
| Gas distribution revenue | — |
| — |
| 4,210 |
| — |
| — |
| — |
| 4,210 |
|
| Electricity and transmission revenue | — |
| — |
| — |
| 180 |
| — |
| — |
| 180 |
|
| Commodity sales | — |
| 4 |
| — |
| — |
| — |
| — |
| 4 |
|
| Total revenue from contracts with customers | 9,191 |
| 5,172 |
| 5,154 |
| 180 |
| — |
| — |
| 19,697 |
|
| Commodity sales | — |
| — |
| — |
| — |
| 29,305 |
| — |
| 29,305 |
|
Other revenue1,2 | 659 |
| 30 |
| 9 |
| 387 |
| (2 | ) | (16 | ) | 1,067 |
|
| Intersegment revenue | 369 |
| 5 |
| 16 |
| — |
| 71 |
| (461 | ) | — |
|
| Total revenue | 10,219 |
| 5,207 |
| 5,179 |
| 567 |
| 29,374 |
| (477 | ) | 50,069 |
|
|
| | | | | | | | | | | | | | |
| | Liquids Pipelines |
| Gas Transmission and Midstream |
| Gas Distribution and Storage |
| Renewable Power Generation |
| Energy Services |
| Eliminations and Other |
| Consolidated |
|
| Year ended December 31, 2018 |
| (millions of Canadian dollars) | |
| | |
| |
| |
| |
| |
|
| Transportation revenue | 8,488 |
| 3,928 |
| 875 |
| — |
| — |
| — |
| 13,291 |
|
| Storage and other revenue | 101 |
| 222 |
| 196 |
| — |
| — |
| — |
| 519 |
|
| Gas gathering and processing revenue | — |
| 815 |
| — |
| — |
| — |
| — |
| 815 |
|
| Gas distribution revenue | — |
| — |
| 4,376 |
| — |
| — |
| — |
| 4,376 |
|
| Electricity and transmission revenue | — |
| — |
| — |
| 206 |
| — |
| — |
| 206 |
|
| Commodity sales | — |
| 1,590 |
| — |
| — |
| — |
| — |
| 1,590 |
|
| Total revenue from contracts with customers | 8,589 |
| 6,555 |
| 5,447 |
| 206 |
| — |
| — |
| 20,797 |
|
| Commodity sales | — |
| — |
| — |
| — |
| 26,070 |
| — |
| 26,070 |
|
Other revenue1,2 | (894 | ) | 6 |
| 9 |
| 361 |
| 4 |
| 25 |
| (489 | ) |
| Intersegment revenue | 384 |
| 10 |
| 14 |
| — |
| 154 |
| (562 | ) | — |
|
| Total revenue | 8,079 |
| 6,571 |
| 5,470 |
| 567 |
| 26,228 |
| (537 | ) | 46,378 |
|
| |
1 | Includes mark-to-market gains/(losses) from our hedging program. |
| |
2 | Includes revenues from lease contracts. Refer to Note 27 Leases. |
We disaggregate revenue into categories which represent our principal performance obligations within each business segment because these revenue categories represent the most significant revenue streams in each segment and consequently are considered to be the most relevant revenue information for management to consider in evaluating performance.
Contract Balances |
| | | | | | |
| | Contract Receivables |
| Contract Assets |
| Contract Liabilities |
|
| (millions of Canadian dollars) | | | |
| Balance as at December 31, 2018 | 1,929 |
| 191 |
| 1,297 |
|
| Balance as at December 31, 2019 | 2,099 |
| 216 |
| 1,424 |
|
Contract receivables represent the amount of receivables derived from contracts with customers.
Contract assets represent the amount of revenue which has been recognized in advance of payments received for performance obligations we have fulfilled (or partially fulfilled) and prior to the point in time at which our right to the payment is unconditional. Amounts included in contract assets are transferred to accounts receivable when our right to the consideration becomes unconditional.
Contract liabilities represent payments received for performance obligations which have not been fulfilled. Contract liabilities primarily relate to make-up rights and deferred revenue. Revenue recognized during the year ended December 31, 2019 included in contract liabilities at the beginning of the period is $185 million. Increases in contract liabilities from cash received, net of amounts recognized as revenue during the year ended December 31, 2019 were $358 million. Revenue recognized during the year ended December 31, 2018 included in contract liabilities at the beginning of the period is $183 million. Increases in contract liabilities from cash received, net of amounts recognized as revenue during the year ended December 31, 2018 were $449 million.
Performance Obligations |
| |
Segment | Nature of Performance Obligation |
Liquids Pipelines | | Delivered strong financial results | | Optimized the base business |
| | |
| | • Achieved DCF per share1 Transportationabove the midpoint of guidance range• Solid operational performance across all business lines | | • Achieved $300 million in cost savings • Completed rate proceedings on Texas Eastern, Algonquin and storage of crude oil and NGLsB.C. Pipeline • Captured synergies through amalgamated utilities |
| | |
| | | | |
| | |
| | • Added approximately $5 billion of growth capital to the secured growth inventory in 2020 • Completed construction of the U.S. portion of Line 3 Replacement Program in North Dakota and commenced construction on the final segment in Minnesota | | • Completed $1.6 billion of secured growth projects, including the final phase of Atlantic Bridge, Sabal Trail Phase II, the 2020 Modernization Program within Gas Transmission and Midstream, and the 2020 Utility Growth Program, including the Owen Sound Reinforcement and Windsor Line Replacement projects |
| •DCF per share is anon-GAAP Transportation, storage, gathering, compressionmeasure; this measure is defined and treating of natural gasreconciled in Item 11 –“Non-GAAP |
•reconciliation”.
Transportation of NGLs |
•
Sale of crude oil, natural gas and NGLs |
Gas Distribution and Storage | •
Supply and delivery of natural gas |
•
Transportation of natural gas |
|
Renewable Power Generation | •
Generation and transmission of electricity |
•
Delivery of electricity from renewable energy generation facilities |
There was no material revenue recognized in the year ended December 31, 2019 from performance obligations satisfied in previous periods.
Payment Terms
Payments are received monthly from customers under long-term transportation, commodity sales, and gas gathering and processing contracts. Payments from Gas Distribution and Storage customers are received on a continuous basis based on established billing cycles.
Certain contracts in the United States offshore business provide for us to receive a series of fixed monthly payments (FMPs) for a specified period which is less than the period during which the performance obligations are satisfied. As a result, a portion of the FMPs is recorded as a contract liability. The FMPs are not considered to be a financing arrangement because the payments are scheduled to match the production profiles of offshore oil and gas fields, which generate greater revenue in the initial years of their productive lives.
Revenue to be Recognized from Unfulfilled Performance Obligations
Total revenue from performance obligations expected to be fulfilled in future periods is $65.8 billion, of which $7.1 billion is expected to be recognized during the year ended December 31, 2020.
The revenues excluded from the amounts above based on optional exemptions available under ASC 606, as explained below, represent a significant portion of our overall revenues and revenues from contracts with customers. Certain revenues such as flow-through operating costs charged to shippers are recognized at the amount for which we have the right to invoice our customers and are excluded from the amounts of revenue to be recognized in the future from unfulfilled performance obligations above. Variable consideration is excluded from the amounts above due to the uncertainty of the associated consideration, which is generally resolved when actual volumes and prices are determined. For example, we consider interruptible transportation service revenues to be variable revenues since volumes cannot be estimated. Additionally, the effect of escalation on certain tolls which are contractually escalated for inflation has not been reflected in the amounts above as it is not possible to reliably estimate future inflation rates. Revenues for periods extending beyond the current rate settlement term for regulated contracts where the tolls are periodically reset by the regulator are excluded from the amounts above since future tolls remain unknown. Finally, revenues from contracts with customers which have an original expected duration of one year or less are excluded from the amounts above.
SIGNIFICANT JUDGMENTS MADE IN RECOGNIZING REVENUE
Long-Term Transportation Agreements
For long-term transportation agreements, significant judgments pertain to the period over which revenue is recognized and whether the agreement provides for make-up rights for the shippers. Transportation revenue earned from firm contracted capacity arrangements is recognized ratably over the contract period. Transportation revenue from interruptible or volumetric-based arrangements is recognized when services are performed.
Estimates of Variable Consideration
Revenue from arrangements subject to variable consideration is recognized only to the extent that it is probable that a significant reversal in the amount of cumulative revenue recognized will not occur when the uncertainty associated with the variable consideration is subsequently resolved. Uncertainties associated with variable consideration relate principally to differences between estimated and actual volumes and prices. These uncertainties are resolved each month when actual volumes are sold or transported and actual tolls and prices are determined.
Recognition and Measurement of Revenue
|
| | | | | | | | | | | | |
| | Liquids Pipelines |
| Gas Transmission and Midstream |
| Gas Distribution and Storage |
| Renewable Power Generation |
| Energy Services |
| Consolidated |
|
| Year ended December 31, 2019 |
| (millions of Canadian dollars) | |
| |
| |
| |
| |
| |
| Revenue from products transferred at a point in time | — |
| 4 |
| 65 |
| — |
| — |
| 69 |
|
Revenue from products and services transferred over time1 | 9,191 |
| 5,168 |
| 5,089 |
| 180 |
| — |
| 19,628 |
|
| Total revenue from contracts with customers | 9,191 |
| 5,172 |
| 5,154 |
| 180 |
| — |
| 19,697 |
|
| |
1
| Revenue from crude oil and natural gas pipeline transportation, storage, natural gas gathering, compression and treating, natural gas distribution, natural gas storage services and electricity sales. |
|
| | | | | | | | | | | | |
| | Liquids Pipelines |
| Gas Transmission and Midstream |
| Gas Distribution and Storage |
| Renewable Power Generation |
| Energy Services |
| Consolidated |
|
| Year ended December 31, 2018 |
| (millions of Canadian dollars) | |
| | |
| |
| |
| |
Revenue from products transferred at a point in time1 | — |
| 1,590 |
| 68 |
| — |
| — |
| 1,658 |
|
Revenue from products and services transferred over time2 | 8,589 |
| 4,965 |
| 5,379 |
| 206 |
| — |
| 19,139 |
|
| Total revenue from contracts with customers | 8,589 |
| 6,555 |
| 5,447 |
| 206 |
| — |
| 20,797 |
|
| | | | |
1
| Revenue from sales of crude oil, natural gas and NGLs. Revenue from commodity sales where the commodity sold is not immediately consumed prior to use is recognized at the point in time when the contractually specified volume of the commodity has been delivered. |
| |
| | | Revenue from crude oil and natural gas pipeline transportation, storage, natural gas gathering, compression and treating, natural gas distribution, natural gas storage services and electricity sales. |
Performance Obligations Satisfied Over Time
For arrangements involving the transportation and sale of petroleum products and natural gas where the transportation services or commodities are simultaneously received and consumed by the shipper or customer, we recognize revenue over time using an output method based on volumes of commodities delivered or transported. The measurement of the volumes transported or delivered corresponds directly to the benefits received by the shippers or customers during that period.
Determination of Transaction Prices
Prices for gas processing and transportation services are determined based on the capital cost of the facilities, pipelines and associated infrastructure required to provide such services plus a rate of return on capital invested that is determined either through negotiations with customers or through regulatory processes for those operations that are subject to rate regulation.
Prices for commodities sold are determined by reference to market price indices plus or minus a negotiated differential and in certain cases a marketing fee.
Prices for natural gas sold and distribution services provided by regulated natural gas distribution operations are prescribed by regulation.
5. SEGMENTED INFORMATION
Segmented information for the years ended December 31, 2019, 2018 and 2017 is as follows:
|
| | | | | | | | | | | | | | |
| Year ended December 31, 2019 | Liquids Pipelines |
| Gas Transmission and Midstream |
| Gas Distribution and Storage |
| Renewable Power Generation |
| Energy Services |
| Eliminations and Other |
| Consolidated |
|
| (millions of Canadian dollars) | |
| |
| |
| |
| |
| |
| |
|
| Revenues | 10,219 |
| 5,207 |
| 5,179 |
| 567 |
| 29,374 |
| (477 | ) | 50,069 |
|
| Commodity and gas distribution costs | (29 | ) | — |
| (2,354 | ) | (2 | ) | (29,091 | ) | 472 |
| (31,004 | ) |
| Operating and administrative | (3,298 | ) | (2,232 | ) | (1,149 | ) | (189 | ) | (44 | ) | (79 | ) | (6,991 | ) |
| Impairment of long-lived assets | (21 | ) | (105 | ) | — |
| (297 | ) | — |
| — |
| (423 | ) |
| Income/(loss) from equity investments | 780 |
| 682 |
| 4 |
| 31 |
| 8 |
| (2 | ) | 1,503 |
|
| Other income/(expense) | 30 |
| (181 | ) | 67 |
| 1 |
| 3 |
| 515 |
| 435 |
|
| Earnings before interest, income tax expense, and depreciation and amortization | 7,681 |
| 3,371 |
| 1,747 |
| 111 |
| 250 |
| 429 |
| 13,589 |
|
| Depreciation and amortization | | | | | | | (3,391 | ) |
| Interest expense | |
| |
| |
| |
| |
| |
| (2,663 | ) |
| Income tax expense | |
| |
| |
| |
| |
| |
| (1,708 | ) |
| Earnings | |
| |
| |
| |
| |
| |
| 5,827 |
|
Capital expenditures1 | 2,548 |
| 1,753 |
| 1,100 |
| 23 |
| 2 |
| 124 |
| 5,550 |
|
| Total property, plant and equipment, net | 48,783 |
| 25,268 |
| 15,622 |
| 3,658 |
| 24 |
| 368 |
| 93,723 |
|
|
| | | | | | | | | | | | | | |
| Year ended December 31, 2018 | Liquids Pipelines |
| Gas Transmission and Midstream |
| Gas Distribution and Storage |
| Renewable Power Generation |
| Energy Services |
| Eliminations and Other |
| Consolidated |
|
| (millions of Canadian dollars) | |
| |
| |
| |
| |
| |
| |
|
| Revenues | 8,079 |
| 6,571 |
| 5,470 |
| 567 |
| 26,228 |
| (537 | ) | 46,378 |
|
| Commodity and gas distribution costs | (16 | ) | (1,481 | ) | (2,748 | ) | (7 | ) | (25,689 | ) | 540 |
| (29,401 | ) |
| Operating and administrative | (3,124 | ) | (2,102 | ) | (1,111 | ) | (157 | ) | (73 | ) | (225 | ) | (6,792 | ) |
| Impairment of long-lived assets | (180 | ) | (914 | ) | — |
| (4 | ) | — |
| (6 | ) | (1,104 | ) |
| Impairment of goodwill | — |
| (1,019 | ) | — |
| — |
| — |
| — |
| (1,019 | ) |
| Income/(loss) from equity investments | 577 |
| 930 |
| 11 |
| (28 | ) | 18 |
| 1 |
| 1,509 |
|
| Other income/(expense) | (5 | ) | 349 |
| 89 |
| (2 | ) | (2 | ) | (481 | ) | (52 | ) |
| Earnings/(loss) before interest, income tax expense, and depreciation and amortization | 5,331 |
| 2,334 |
| 1,711 |
| 369 |
| 482 |
| (708 | ) | 9,519 |
|
| Depreciation and amortization | | | | | | | (3,246 | ) |
| Interest expense | |
| |
| |
| |
| |
| |
| (2,703 | ) |
| Income tax expense | |
| |
| |
| |
| |
| |
| (237 | ) |
| Earnings | |
| |
| |
| |
| |
| |
| 3,333 |
|
Capital expenditures1 | 3,102 |
| 2,644 |
| 1,066 |
| 33 |
| — |
| 27 |
| 6,872 |
|
| Total property, plant and equipment, net | 49,214 |
| 25,601 |
| 15,148 |
| 4,335 |
| 22 |
| 220 |
| 94,540 |
|
|
| | | | | | | | | | | | | | |
| Year ended December 31, 2017 | Liquids Pipelines |
| Gas Transmission and Midstream |
| Gas Distribution and Storage |
| Renewable Power Generation |
| Energy Services |
| Eliminations and Other |
| Consolidated |
|
| (millions of Canadian dollars) | |
| |
| |
| |
| |
| |
| |
|
| Revenues | 8,913 |
| 7,067 |
| 4,992 |
| 534 |
| 23,282 |
| (410 | ) | 44,378 |
|
| Commodity and gas distribution costs | (18 | ) | (2,834 | ) | (2,689 | ) | — |
| (23,508 | ) | 412 |
| (28,637 | ) |
| Operating and administrative | (2,949 | ) | (1,756 | ) | (960 | ) | (163 | ) | (47 | ) | (567 | ) | (6,442 | ) |
| Impairment of long-lived assets | — |
| (4,463 | ) | — |
| — |
| — |
| — |
| (4,463 | ) |
| Impairment of goodwill | — |
| (102 | ) | — |
| — |
| — |
| — |
| (102 | ) |
| Income/(loss) from equity investments | 416 |
| 653 |
| 23 |
| 6 |
| 8 |
| (4 | ) | 1,102 |
|
| Other income/(expense) | 33 |
| 166 |
| 24 |
| (5 | ) | 2 |
| 232 |
| 452 |
|
| Earnings/(loss) before interest, income tax expense, and depreciation and amortization | 6,395 |
| (1,269 | ) | 1,390 |
| 372 |
| (263 | ) | (337 | ) | 6,288 |
|
| Depreciation and amortization | | | | | | | (3,163 | ) |
| Interest expense | | | | | | | (2,556 | ) |
| Income tax recovery |
|
|
|
|
|
|
|
|
|
|
|
| 2,697 |
|
| Earnings | | | | | | | 3,266 |
|
Capital expenditures1 | 2,799 |
| 4,016 |
| 1,177 |
| 321 |
| 1 |
| 108 |
| 8,422 |
|
| | | | |
1 | Includes allowance for equity funds used during construction. | | |
Gas Transmission and Midstream | | Sabal Trail Phase II | | | | | US$0.1 | |
| 2020 Modernization Program | | | | | US$0.7 | |
| | | |
The measurement basis for preparation of segmented information is consistent with the significant accounting policies (Note 2).
No non-affiliated customer exceeds 10% of our third-party revenues for the years ended December 31, 2019 and 2018, respectively. Our largest non-affiliated customer accounted for approximately 11.8% of our third-party revenues for the year ended December 31, 2017. Revenue from this one customer is primarily reported in the Energy Services segment.
GEOGRAPHIC INFORMATION
Revenues1
| | | | | | | | | Year ended December 31, | 2019 |
| 2018 |
| 2017 |
| | (millions of Canadian dollars) | | | | | Canada | 19,954 |
| 19,023 |
| 18,076 |
| | United States | 30,115 |
| 27,355 |
| 26,302 |
| | | 50,069 |
| 46,378 |
| 44,378 |
|
1Revenues are based on the country of origin of the product or service sold.
Property, Plant and Equipment1
| | | | | | | December 31, | 2019 |
| 2018 |
| | (millions of Canadian dollars) | |
| |
| | Canada | 45,993 |
| 44,716 |
| | United States | 47,730 |
| 49,824 |
| | | 93,723 |
| 94,540 |
|
1Amounts are based on the location where the assets are held.
6. EARNINGS PER COMMON SHARE
BASIC
Earnings per common share is calculated by dividing earnings attributable to common shareholders by the weighted average number of common shares outstanding. The weighted average number of common shares outstanding has been reduced by our pro-rata weighted average interest in our own common shares of approximately 6 million as at December 31, 2019, 12 million as at December 31, 2018, and 13 million as at December 31, 2017, resulting from our reciprocal investment in Noverco.
DILUTED
The treasury stock method is used to determine the dilutive impact of stock options. This method assumes any proceeds from the exercise of stock options would be used to purchase common shares at the average market price during the period.
Weighted average shares outstanding used to calculate basic and diluted earnings per share are as follows:
| | | | | | | | | December 31, | 2019 |
| 2018 |
| 2017 |
| | (number of shares in millions) | |
| |
| |
| | Weighted average shares outstanding | 2,017 |
| 1,724 |
| 1,525 |
| | Effect of dilutive options | 3 |
| 3 |
| 7 |
| | Diluted weighted average shares outstanding | 2,020 |
| 1,727 |
| 1,532 |
|
For the years ended December 31, 2019, 2018 and 2017, 17.8 million, 26.8 million and 14.3 million, respectively, of anti-dilutive stock options with a weighted average exercise price of $53.56, $50.38 and $56.71, respectively, were excluded from the diluted earnings per common share calculation.
7. REGULATORY MATTERS
GENERAL INFORMATION ON RATE REGULATION AND ITS ECONOMIC EFFECTS
We record assets and liabilities that result from regulated ratemaking processes that would not be recorded under GAAP for non-regulated entities. See Note 2 - Significant Accounting Policies for further discussion.
A number of our businesses are subject to regulation by various regulators, including the CER, OEB and FERC. We also collect and set aside funds to cover future pipeline abandonment costs for all CER regulated pipelines as a result of the CER's regulatory requirements under LMCI (Note 14) and to cover future removal and site restoration reserves as approved by the OEB and other agencies. Amounts expected to be paid for these future costs are recognized as long-term regulatory liabilities. Our significant regulated businesses and the related accounting impacts, are described below.
Liquids Pipelines
Canadian Mainline
Canadian Mainline includes the Canadian portion of the mainline system and is subject to regulation by the CER. Tolls (excluding Lines 8 and 9) are currently governed by the 10-year CTS, which establishes a CLT for all volumes shipped on the Canadian Mainline and an IJT for all volumes shipped from western Canadian receipt points to delivery points on Enbridge’s Lakehead System, as well as delivery points on the Canadian Mainline downstream of the Lakehead System. The CTS was negotiated with shippers in accordance with CER guidelines, was approved by the CER in June 2011, and took effect July 1, 2011. Under the CTS, a regulatory asset is recognized to offset deferred income taxes as a CER rate order governing flow-through income tax treatment permits future recovery. No other material regulatory assets or liabilities are recognized under the terms of the CTS.
Southern Lights Pipeline
The United States portion of the Southern Lights Pipeline is regulated by the FERC and the Canadian portion of the Southern Lights Pipeline is regulated by the CER. Shippers on the Southern Lights Pipeline are subject to long-term transportation contracts under a cost-of-service toll methodology. Toll adjustments are filed annually with the regulators and provide for the recovery of allowable operating and debt financing costs, plus a pre-determined after-tax rate of return on equity of 10%.
Gas Transmission and Midstream
BC Pipeline and BC Field Services
Until December 31, 2019, our Gas Transmission and Midstream business in British Columbia was comprised of BC Pipeline and BC Field Services. BC Pipeline and BC Field Services provide fee-for-service based natural gas transmission and raw gas gathering and processing services, respectively.
BC Pipeline is regulated by the CER under full cost-of-service regulation. Under the current CER-authorized rate structure for our BC Pipeline, income tax costs are recovered in tolls based on the current income tax payable and do not include accruals for deferred income tax. However, as income taxes become payable as a result of the reversal of the temporary differences that created the deferred income taxes, it is expected that tolls will be adjusted to recover these taxes. Since most existing temporary differences are related to property, plant and equipment costs, this recovery is expected to occur over the life of the BC Pipeline assets.
On December 31, 2019, we closed the sale of our BC Field Services business to Brookfield Infrastructure Partners L.P. and its institutional partners (Brookfield) (Note 8). The BC Field Services business was regulated by the CER under the Framework for Light-Handed Regulation. Regulatory assets of $349 million, related to the regulatory offset to deferred income tax liabilities associated with the BC Field Services business, were derecognized as a result of this sale.
Spectra Energy Partners, LP
Most of SEP's gas transmission and storage services are regulated by the FERC and may also be subject to the jurisdiction of various other federal, state and local agencies. Rates for the FERC jurisdictional services are governed by the applicable FERC-approved natural gas tariffs while rates for the intrastate and/or gathering services are governed by the appropriate state gas commissions.
Gas Distribution and Storage | | 2020 Utility Growth Program | | | | | 0.5 | |
| |
| | | | |
| U.S. dollars have been converted to Canadian dollars using an exchange rate of US$1 = C$1.30. |
| DCF and DCF per share arenon-GAAP measures; these measures are defined and reconciled in Item 11 –“Non-GAAP reconciliation”. |
Approach to executive compensation
Enbridge’s approach to executive compensation is set by the Human Resources & Compensation (“HRC”) Committee and approved by the Board. The compensation programs are designed to accomplish three objectives:
attract and retain a highly effective executive team;
align executives’ actions with Enbridge’s business strategy and the interests of Enbridge shareholders and other stakeholders; and
incentivize and reward executives for short-, medium- and long-term performance.
Alignment with company strategy
|
Safety and operational reliability is Enbridge’s number one priority. |
Enbridge’s vision is to be the leading energy delivery company in North America. To achieve this goal, we are committed to delivering the energy people need and want, and creating value for all stakeholders. We aim to be the first choice of our customers, attract and retain energized employees and maintain the trust of our stakeholders.
Central to achieving this vision is a relentless focus on safety, operational reliability and protection of the environment to ensure that the needs of all stakeholders are met, and that Enbridge continues to be a good citizen within the communities in which we live and operate.
Enbridge’s executive compensation programs are aligned with the achievement of our strategic priorities and are designed to link payouts to those outcomes. They motivate management to deliver exceptional value to Enbridge stakeholders through strong corporate performance and investing capital in ways that minimize risk and maximize return, while always supporting the core business goal of delivering energy safely and reliably.
Management is committed to delivering steady, visible and predictable results, and operating assets in an ethical and responsible manner.
Executive compensation design
Enbridge’s executive compensation design consists of several components that balance the use of short- (annual incentive), medium- (performance stock units and restricted stock units) and long-term vehicles (stock options). The following chart describes the NEOs’ compensation components and the time horizon for vesting and/or realized value.
|
Performance is foundational to Enbridge’s executive compensation design; incentive compensation plans incorporate operational safety and financial performance conditions. |
Performance is the cornerstone of Enbridge’s executive compensation design. The Board reviews Enbridge’s business plans over the short-, medium- and long-term and the HRC Committee ensures the compensation programs are linked to these time frames. This focuses management on delivering value to Enbridge shareholders not only in the short term, but also continued performance over the long term.
Relevant corporate and business unit performance measures are established for the short-term incentive plan (“STIP”) that focus on the critical safety, reliability, environmental, customer, employee and financial aspects of the business.
The performance measures for the medium- and long-term incentive plans focus on overall corporate performance aligned with Enbridge shareholder expectations for cash flow growth and total shareholder return.
When assessing performance, the HRC Committee considers performance results in the context of other qualitative factors not captured in the formal metrics, including key performance indicators relative to peers and the qualitative aspects of management’s responsibilities.
|
The vast majority of compensation for Enbridge’s President & CEO and other NEOs is considered
“at risk”. |
The chart below shows the target compensation mix for the President & CEO and the average for the other NEOs. The short-, medium- and long-term incentives are “at risk” because their value is based on specific performance criteria and payout is not guaranteed.
In 2020, 89% of the target total direct compensation for the President & CEO, and an average of 83% for the other NEOs, was at risk, directly aligning corporate, business unit and individual performance with the interests of Enbridge shareholders.
2020 compensation decisions
Effective April 1, 2020, annual base salary adjustments, as shown below, were provided to the President & CEO and other NEOs. Mr. Gruending and Mr. Yu each received a base salary increase to better align their positioning relative to the competitive market, as part of aphased-in
approach since their role changes in 2019. While Enbridge demonstrated resilience throughout the crises in 2020, it was not immune to the precipitous decline in economic activity and reduced demand for energy. Management took prudent and necessary action to reduce operating costs across the business and avoided company-wide layoffs by pursuing initiatives including organization-wide salary rollbacks (with voluntary base salary reductions for the CEO (15%) and other NEOs (10%) and Board compensation reduction (15%) effective June 1, 2020), a voluntary workforce reduction program and supply chain efficiencies.
| | | | | | | | | | | | | | | | | | | | | | | | |
| | | | | | |
| | Base salary at January 1, 2020 1 | | | | | | Base salary at April 1, 2020 1 | | | | | | Base salary at December 31, 2020 1 | | | Total %
change in
base salary
in 2020 | |
| | | | | | | |
| | $ | 1,630,000 | | | | 5% | | | $ | 1,712,000 | | | | -15% | | | $ | 1,455,200 | | | | -11% | |
| | | | | | | |
| | $ | 525,000 | | | | 25% | | | $ | 656,300 | | | | -10% | | | $ | 590,670 | | | | 13% | |
| | | | | | | |
| | $ | 641,200 | | | | 3% | | | $ | 660,400 | | | | -10% | | | $ | 594,360 | | | | -7% | |
| | | | | | | |
| | $ | 725,290 | | | | 3% | | | $ | 747,075 | | | | -10% | | | $ | 672,367 | | | | -7% | |
| | | | | | | |
| | $ | 569,300 | | | | 20% | | | $ | 683,200 | | | | -10% | | | $ | 614,880 | | | | 8% | |
| | | | | | | |
| | $ | 569,300 | | | | 5% | | | $ | 597,800 | | | | -10% | | | $ | 538,020 | | | | -5% | |
| U.S. dollars have been converted to Canadian dollars using the published WM/Reuters 4 pm Londonyear-end exchange rate of US$1 = C$1.2740. |
24
It is critically important to ensure all Enbridge executives are incentivized to achieve not only financial results but also operational results in areas such as safety and environmental performance. For this reason, our STIP awards are designed to be a comprehensive analysis of corporate, business unit and individual performance, as determined by our HRC Committee.
The corporate component of the performance metrics is based on a single, objective company-wide performance metric that is designed to drive achievement of near-term business priorities and financial results for the organization. Business unit performance.
Individual performance metrics for each of our NEOs are established to align with financial, strategic and operational priorities related to each executive’s portfolio and their contributions to the overall organization in consultation with the President & CEO, in order to recognize and differentiate individual actions and contributions in final pay decisions. Performance metrics and ranges for threshold, target and maximum incentive opportunities for the corporate component of the STIP award are determined by the HRC Committee at the beginning of the year. Each executive’s target award and payout range reflect the level of responsibility associated with their role, as well as competitive practice, and is established as a percentage of base salary. In 2020, the STIP targets were adjusted as part of aphased-in
approach to align overall compensation to the competitive market, recognizing the increasing complexity of the business. For 2020, each NEO’s target STIP award and corresponding weighting of corporate, business unit and individual performance metrics were as follows:
| | | | | | | | | | | | | | | | | | | | | | | | |
| | | | |
| | 2020 target
STIP (% of
base salary) | | | | | | Performance Measure Weighting | | | 2019 target
STIP (% of
base salary) | |
| | | | | | | | | |
| | | | | | | |
| | | 145 | % | | $ | 2,241,900 | | | | 60 | % | | | 20 | % | | | 20 | % | | | | |
| | | | | | | |
| | | 90 | % | | $ | 528,370 | | | | 60 | % | | | 20 | % | | | 20 | % | | | | |
| | | | | | | |
| | | 90 | % | | $ | 488,240 | | | | 60 | % | | | 20 | % | | | 20 | % | | | | |
| | | | | | | |
| | | 90 | % | | $ | 630,020 | | | | 40 | % | | | 40 | % | | | 20 | % | | | | |
| | | | | | | |
| | | 90 | % | | $ | 555,120 | | | | 40 | % | | | 40 | % | | | 20 | % | | | | |
| | | | | | | |
| | | 80 | % | | $ | 445,920 | | | | 60 | % | | | 20 | % | | | 20 | % | | | | |
| U.S. dollars have been converted to Canadian dollars using the published WM/Reuters 4 pm Londonyear-end exchange rate of US$1 = C$1.2740. |
| 2020 target STIP awards are based on base salary earned in 2020. |
| Mr. Whelen’s 2020 target STIP award has been prorated based on his retirement date of November 15, 2020. |
The HRC Committee retains discretion to change performance measures, scorecards and the award levels when it believes it is reasonable to do so, considering matters such as key performance indicators and the business environment in which the performance was achieved. In addition, the HRC Committee retains discretion to approve adjustments to the calculated STIP award to reflect extraordinary events and other factors not contemplated in the original measures or targets. In 2020, no such adjustments were made to performance measures, scorecards or award levels, despite the unprecedented challenges Enbridge faced due to theCOVID-19
pandemic and the reduced energy demand. As illustrated below, STIP awards are earned between0-200%
of the target award based on achievement of the applicable corporate, business unit and individual performance metrics and giving effect to the applicable weighting of each metric.
The corporate performance component is reviewed annually to select measures that align with our strategy and are appropriate for measuring annual performance. The same corporate component metrics and goals apply to each NEO. In February 2020, the HRC Committee approved management’s recommendation to use DCF per share. The HRC retains discretion to consider other factors (including our performance relative to our peers, other key performance indicators and market conditions) in assessing the strength of the corporate performance metrics and also retains discretion to determine the overall corporate performance payout.
The HRC Committee agreed to the use of DCF per share as the corporate performance metric because it believes DCF per share is an appropriate measure of financial
performance for the enterprise. Focusing management on this metric will enhance transparency of Enbridge’s cash flow growth, increase comparability of results relative to peers and help ensure full value recognition for Enbridge’s superior assets and commercial and growth arrangements, which provides a low risk value proposition for shareholders.
For 2020, DCF per share targets were set using the external financial guidance range to determine threshold and target payments. For any payout to occur, Enbridge must achieve threshold performance. For a maximum payout to occur, Enbridge must achieve the top of the guidance range, which ensures there is appropriate stretch in the plan. Despite the unprecedented impact ofCOVID-19
and reduced energy demand, the targets were not revisedin-year.
For purposes of Enbridge’s 2020 STIP awards, 2020 DCF per share was determined to be $4.69 and resulted in a performance multiplier of 1.27x, representing 100% of the corporate performance metric. No discretion was applied beyond standard normalizations.
| | | | |
| | |
2020 corporate STIP metric | | | | |
| | |
Threshold (guidance minimum) | | | | |
| | |
Target (guidance midpoint) | | | | |
| | |
Maximum (guidance maximum) | | | | |
| | |
| | | | |
| DCF per share is anon-GAAP measure; this measure is defined and reconciled in Item 11 –“Non-GAAP reconciliation”. |
| DCF per share between thresholds in this table result in a performance multiplier calculated on a linear basis. |
Business unit performance
The HRC Committee approved the application of the following scorecards for each of the NEOs. While the specific metrics used vary by business unit, each scorecard includes objectives relating to operational performance and reliability, financial performance and project execution as outlined below:
| | | | |
| | |
| | | | |
| | | | • Non-financial operating measures for the combined enterprise (including enterprise safety and environment) |
| | Central Functions | | • Weighted average of overall business unit results • Financial (corporate cost containment) |
| | Central Functions (70%) | | • Weighted average of overall business unit results • Financial (corporate cost containment) |
| Energy Marketing (20%) | | • Financial, operating and commercial measures for the Energy Marketing business unit |
| Power Operations (10%) | | • Financial, operating and commercial measures for the Power Operations business unit |
| | Gas Inc.Transmission and Midstream | | • Financial, operating and commercial measures for the Gas Transmission and Midstream business unit |
| | Liquids Pipelines | | • Financial, operating and commercial measures for the Liquids Pipelines business unit |
| | Central Functions | | • Weighted average of overall business unit results Enbridge Gas' distribution rates, beginning• Financial (corporate cost containment) |
| The business unit metric for Mr. Monaco is a composite measure, representing enterprise-wide performance as, in 2019, are set under a five-year IR frameworkhis capacity as President & CEO, he oversees the overall organization. |
In the first quarter of 2020, after discussion with the Board, the HRC Committee approved individual performance objectives for Mr. Monaco, taking into consideration the company’s financial and strategic priorities. For our other NEOs, Mr. Monaco established their individual objectives for 2020 at the start of the year, based on strategic and operational priorities related to each executive’s portfolio and other factors.
Short-term incentive award outcomes
Each NEO’s calculated STIP award, as well as the actual award, is as follows:
| | | | | | | | | | | | | | | | | | | | | | | | | | | | | | | | | | | | | | | | | | | | | | | | | | | | |
| | | | | | | | | | | | | |
| | | | | | | | | | | | | | | | | | | | | | | | | | | | | | | | | | | | | | | |
| | | | | | | | | | | | | |
| | | 1.27 | | | | x | | | | 60 | % | | | + | | | | 1.34 | | | | x | | | | 20 | % | | | + | | | | 2.00 | | | | x | | | | 20 | % | | | = | | | | 1.43 | |
| | | | | | | | | | | | | |
| | | 1.27 | | | | x | | | | 60 | % | | | + | | | | 1.50 | | | | x | | | | 20 | % | | | + | | | | 1.90 | | | | x | | | | 20 | % | | | = | | | | 1.44 | |
| | | | | | | | | | | | | |
| | | 1.27 | | | | x | | | | 60 | % | | | + | | | | 1.56 | | | | x | | | | 20 | % | | | + | | | | 1.70 | | | | x | | | | 20 | % | | | = | | | | 1.41 | |
| | | | | | | | | | | | | |
| | | 1.27 | | | | x | | | | 40 | % | | | + | | | | 1.15 | | | | x | | | | 40 | % | | | + | | | | 1.90 | | | | x | | | | 20 | % | | | = | | | | 1.35 | |
| | | | | | | | | | | | | |
| | | 1.27 | | | | x | | | | 40 | % | | | + | | | | 0.95 | | | | x | | | | 40 | % | | | + | | | | 1.90 | | | | x | | | | 20 | % | | | = | | | | 1.27 | |
| | | | | | | | | | | | | |
| | | 1.27 | | | | x | | | | 60 | % | | | + | | | | 1.50 | | | | x | | | | 20 | % | | | + | | | | 1.80 | | | | x | | | | 20 | % | | | = | | | | 1.42 | |
Short-term incentive award calculations
Enbridge delivered strong results in 2020 driven by solid operating performance across the entire asset base despite the unprecedented impact ofCOVID-19
and reduced energy demand, demonstrating the resiliency of cashflows associated with Enbridge’slow-risk
business model. Though the business environment changed drastically because of these crises, management was held to account against the original 2020 STIP targets set at the beginning of the year and well in advance ofCOVID-19.
Performance outcomes are based on actual results relative to the agreed targets and were achieved through early, swift and sustained management actions throughout 2020. Furthermore, no discretion was requested nor applied to the calculated awards. | | | | | | | | | | | | | | | | | | | | | | | | | | | | | | | | |
| | | | | | | | |
| | | | | | | | | | | | | | | | | | | | | | | | |
| | | | | | | | |
| | | 1,546,139 | | | | x | | | | 145 | % | | | x | | | | 1.43 | | | | = | | | | 3,205,919 | | | | 3,205,919 | |
| | | | | | | | |
| | | 587,074 | | | | x | | | | 90 | % | | | x | | | | 1.44 | | | | = | | | | 761,904 | | | | 761,904 | |
| | | | | | | | |
| | | 542,492 | | | | x | | | | 90 | % | | | x | | | | 1.41 | | | | = | | | | 690,766 | | | | 690,766 | |
| | | | | | | | |
| | | 700,018 | | | | x | | | | 90 | % | | | x | | | | 1.35 | | | | = | | | | 849,262 | | | | 849,262 | |
| | | | | | | | |
| | | 616,801 | | | | x | | | | 90 | % | | | x | | | | 1.27 | | | | = | | | | 703,893 | | | | 703,893 | |
| | | | | | | | |
| | | 557,394 | | | | x | | | | 80 | % | | | x | | | | 1.42 | | | | = | | | | 634,091 | | | | 634,091 | |
| U.S. dollars have been converted to Canadian dollars using a price cap mechanism. The price cap mechanism establishes new rates each year through an annual basethe published WM/Reuters 4 pm Londonyear-end exchange rate escalation at inflation less a 0.3% productivity factor, annual updates for certain costs to be passed through to customers, and where applicable, the recovery of material discrete incremental capital investments beyond those that can be funded through base rates. The IR framework includes the continuation and establishment of certain deferral and variance accounts, as well as an earnings sharing mechanism that requires Enbridge Gas to share equally with customers, any earnings in excess of 150 basis points over the annual OEB approved return on equity.US$1 = C$1.2740. |
| FINANCIAL STATEMENT EFFECTS
Accounting for rate-regulated activities has resultedBase salary used in the calculation is reflective of base salary earned in 2020.
|
Medium- and long-term incentives
Medium- and long-term incentive awards were granted in 2020 under the Enbridge Inc. 2019 Long Term Incentive Plan (2019 LTIP).
In 2020, we introduced share-settled restricted stock units (“RSUs”) into the overall pay mix, enhancing retentive value and maintaining alignment with shareholders. This change aligns with our strategy and the competitive market while maintaining the majority of our pay mix inperformance-based
vehicles to align with ourpay-for-performance philosophy.
Enbridge’s medium- and long-term incentive for executives includes three primary vehicles: performance stock units (“PSUs”), RSUs and incentive stock options (“ISOs”).
Enbridge’s medium- and long-term incentives are forward-looking compensation vehicles, and as such, grants are considered part of the compensation for the year of grant and onward instead of in recognition of prior performance or previously granted awards.
The various awards that apply to executives have different terms, vesting conditions and performance criteria, mitigating the risk that executives produce only short-term results. This approach also benefits shareholders and helps maximize the ongoing retentive value of the medium- and long-term incentives granted to executives.
Medium- and long-term incentive grants are determined as follows:
The table below outlines the medium- and long-term incentive plans used in 2020.
| | | | | | |
| | | |
| | | | | | |
| | | |
| | Three years | | Three years | | 10 years |
| | | |
| | Phantom share/units with performance conditions that affect the payout | | Phantom share/units | | Options to acquire Enbridge shares For U.S. participants, awards are granted innon-qualified options that do not meet the requirements of section 422 of the following significant regulatory assets and liabilitiesU.S. Internal Revenue Code |
| | | |
| | Granted annually | | Granted annually | | Granted annually |
| | | |
| | 50% DCF per share growth relative to a target set at the beginning of the term | | n/a | | n/a |
| |
| 50% total shareholder return (“TSR”) performance relative to peers |
| | | |
| | Units cliff vest at the end of the term including dividend equivalents as additional units | | Units cliff vest at the end of the term including dividend equivalents as additional units | | Options vest 25% per year over four years, starting on the Consolidated Statementsfirst anniversary of Financial Position:the grant date |
| | | |
| | | | | | | | | | December 31, | Recovery/Refund Period Ends | 2019 |
| 2018 |
| | (millions of Canadian dollars) | | |
| |
| | Regulatory assets/(liabilities), net | | |
| |
| | Liquids Pipelines | | |
| |
| Deferred income taxes1 | Various | 1,767 |
| 1,673 |
| | Tolling deferrals | Various | (25 | ) | (28 | ) | | Recoverable income taxes | Through 2040 | 24 |
| 27 |
| Pipeline future abandonment costs2 | Various | (293 | ) | (201 | ) | | Other deferrals | Various | 32 |
| — |
| | Gas Transmission and Midstream | | | | Deferred income taxes1 | Various | 511 |
| 826 |
| Regulatory liability related to income taxes3 | Various | (866 | ) | (912 | ) | Long-term debt4 | Various | 108 |
| 124 |
| Pipeline future abandonment costs2 | Various | (159 | ) | (111 | ) | | Other | Various | 215 |
| 205 |
| | Gas Distribution and Storage | | | | Deferred income taxes1 | Various | 1,273 |
| 1,132 |
| | Purchased gas variance | 2020 | (19 | ) | 197 |
| | Pension plans and OPEB | Various | 275 |
| 118 |
| Future removal and site restoration reserves5 | Various | (1,424 | ) | (1,107 | ) | | Federal carbon program | 2020 | 145 |
| — |
| Long-term debt4 | Various | 362 |
| 387 |
| | Constant dollar net salvage adjustment | 2018 | — |
| 6 |
| | Other | Various | 88 |
| (4 | ) |
| | 1 | The deferred income taxes balance represents the regulatory offset to deferred income tax liabilities to the extent that it is expected to be included in regulator-approved future rates and recovered from future customers. The recovery period depends on the timing of the reversal of the temporary differences. In the absence of rate-regulated accounting, this regulatory balance and the related earnings impact would not be recorded. |
| | 2 | The pipeline future abandonment costs liability results from amounts collected and set aside in accordance with the CER’s LMCI to cover future abandonment costs for CER regulated Canadian pipelines. Funds collected are included in Restricted long-term investments (Note 14).Concurrently, we reflect the future abandonment cost as a regulatory liability. The settlement of this balance will occur as pipeline abandonment costs are incurred. |
| | 3 | Relates to the establishment of a regulatory liability as a result of the United States tax reform legislation enacted December 22, 2017. |
| | 4 | The debt balance represents our regulatory offset to the fair value adjustment to debt that resulted from the merger with Spectra Energy. The offset is viewed as a proxy for the regulatory asset that would be recorded in the event such debt was extinguished at an amount higher than the carrying value. |
| | 5 | Future removal and site restoration reserves result from amounts collected from customers by us, with the approval of the OEB, to fund future costs for removal and site restoration relating to property, plant and equipment. These costs are collected as part of depreciation charged on property, plant and equipment that is recorded in rates. The balance represents the amount that we have collected from customers, net of actual costs expended on removal and site restoration. The settlement of this balance will occur over the long-term as future removal and site restoration costs are incurred. In the absence of rate-regulated accounting, costs incurred for removal and site restoration would be charged to earnings as incurred with recognition of revenue for amounts previously collected. |
OTHER ITEMS AFFECTED BY RATE REGULATION
Allowance for Funds Used During Construction and Other Capitalized Costs
Under the pool method prescribed by certain regulators, it is not possible to identify the carryingPaid out in cash based on market value of an Enbridge share at the equity component of AFUDC or its effect on depreciation. Similarly, gains and losses on the retirement of certain specific fixed assets in any given year cannot be identified or quantified.
Operating Cost Capitalization
With the approval of regulators, certain operations capitalize a percentage of specified operating costs. These operations are authorized to charge depreciation and earn a return on the net book value of such capitalized costs in future years. In the absence of rate regulation, a portion of such operating costs would be charged to earnings in the year incurred.
8. ACQUISITIONS AND DISPOSITIONS
ACQUISITIONS
Spectra Energy Corp
On February 27, 2017, Enbridge and Spectra Energy combined in the Merger Transaction for a purchase price of $37.5 billion. Under the termsend of the Merger Transaction, Spectraterm, subject to adjustment from0-200% based on achievement of the performance conditions above | | Settled in shares at the end of the term | | Participant acquires Enbridge shares at the exercise price defined as fair market value at the time of grant |
Medium- and long-term incentive targets (as a % of base salary)
The table below shows the target medium- and long-term incentive awards for each NEO in 2020, as well as the amount each plan contributes to that total, in each case as a percentage of base salary. These targets represent a 60%/20%/20% PSU/RSU/ISO vehicle mix.
| | | | | | | | | | | | | | |
| | |
| | Total 2020 target medium- and long- | | | | |
| | | | | | | | |
| | | | |
| | | 650 | % | | 390% | | | 130 | % | | | 130 | % |
| | | | |
| | | 400 | % | | 240% | | | 80 | % | | | 80 | % |
| | | | |
| | | 400 | % | | 240% | | | 80 | % | | | 80 | % |
| | | | |
| | | 400 | % | | 240% | | | 80 | % | | | 80 | % |
| | | | |
| | | 400 | % | | 240% | | | 80 | % | | | 80 | % |
| | | | |
| | | 350 | % | | 210% | | | 70 | % | | | 70 | % |
PSUs are granted annually, in the first quarter of the year, and vest after three years based on the achievement ofpre-established
and specific performance measures; the executives’ potential payout at the end of the performance period can range from 0% to 200% of the target award depending on the level of achievement of the performance measures. For grants in 2020, the following two performance measures were used, each weighted at 50%:
DCF per share growth.
This measure represents a commitment to Enbridge shareholders to achieve distributable cash flow growth that demonstrates Enbridge’s ability to deliver on its growth plan and continued dividend increases. Measurement against Enbridge’s long-range plan, as well as against industry growth rates, differentiates this metric compared to its use in the STIP, which is based on the1-year
external guidance range. The different measurement standards are designed to avoid excessive overlap between Enbridge’s compensation programs. Furthermore, DCF per share growth is only one of two equally weighted metrics used for PSUs.This measure is used to compare Enbridge against its performance comparator group. For this measure, Enbridge compares itself against the following group of companies, chosen because they are all capital market competitors, operating in a comparable industry sector. | | |
|
Performance comparator group: relative TSR |
| |
Canadian Utilities Limited | | NextEra Energy shareholders received 0.984 shares of Enbridge common stock for each share of SpectraInc. |
| |
CenterPoint Energy, common stock that they owned, giving us 100% ownership of Spectra Energy.Inc. | | NiSource Inc. |
| |
| | ONEOK, Inc. |
| |
Consideration offered to complete the Merger Transaction included 691 million common sharesDTE Energy Company | | Pembina Pipeline Corporation |
| |
| | PG&E Corporation |
| |
| | Plains All American Pipeline, L.P. |
| |
Enterprise Products Partners, L.P. | | Sempra Energy |
| |
| | The Southern Company |
| |
| | TC Energy Corporation |
| |
| | The Williams Companies, Inc. |
| |
Magellan Midstream Partners, L.P. | | |
Payout is determined at the end of the three-year term using an actual performance multiplier that ranges from 0% to 200% depending on whether the performance conditions are met. The final Enbridge at US$41.34 per share price for payout is the volume weighted average trading price of Enbridge shares on the TSX or NYSE for the 20 trading days immediately preceding the maturity date, on which performance is certified. Payout is made in cash.
2020 performance stock unit grant
The mechanics of the 2020 PSU grant is illustrated below.
The following PSU grants were made to the NEOs in 2020:
| | | | | | | | |
| | |
| | Number of PSUs granted (#) | | | Grant value (as % of base salary) 1 | |
| | |
| | | | | | | | |
| | |
| | | | | | | | |
| | |
| | | | | | | | |
| | |
| | | | | | | | |
| | |
| | | | | | | | |
| | |
| | | | | | | | |
| PSU grant sizes were based on the 20-day volume weighted average share price immediately preceding January 1, 2020. |
RSUs are granted annually, in the first quarter of the year, and vest after three years. Payout is determined at the end of the three-year term. The final Enbridge share price at the end of the term is the volume weighted average trading price of Enbridge shares on the TSX or NYSE for the last 20 trading days before the end of the term. These awards, including dividend equivalents accrued as additional RSUs, are settled in Enbridge shares.
2020 restricted stock unit grant
The following RSU grants were made to the NEOs in 2020:
| | | | | | | | |
| | |
| | Number of RSUs granted (#) | | | Grant value (as % of base salary) 1 | |
| | |
| | | | | | | | |
| | |
| | | | | | | | |
| | |
| | | | | | | | |
| | |
| | | | | | | | |
| | |
| | | | | | | | |
| | |
| | | | | | | | |
| RSU grant sizes were based on the20-day volume weighted average share price immediately preceding January 1, 2020. |
ISOs provide executives an opportunity to buy Enbridge shares at some point in the future at the exercise price defined at the time of grant. Members of Enbridge’s senior management, including all of the NEOs, are eligible to receive ISOs.
ISOs are typically granted in February or March every year to both Canadian and U.S. members of senior management. ISOs vest in equal instalments over a four-year period. The maximum term of an ISO is 10 years, but the term can be reduced if the executive leaves Enbridge as described in the “Termination provisions of equity compensation plans” section. The exercise price of an ISO is the closing price of an Enbridge share on the listed exchange the last trading day before the grant date. The grant date will be no earlier than the third trading day after a trading blackout period ends. ISOs are never backdated orre-priced.
ISOs may be granted to executives when they join Enbridge, normally effective on the executive’s date of hire. If the hire date falls within a blackout period, the grant is delayed until after the end of the blackout period.
2020 incentive stock option grant
The following ISO grants were made to the NEOs in 2020:
| | | | | | | | |
| | |
| | Number of ISOs granted (#) | | | Grant value (as % of base salary) 1 | |
| | |
| | | 614,200 | | | | 130 | % |
| | |
| | | 121,740 | | | | 80 | % |
| | |
| | | 148,680 | | | | 80 | % |
| | |
| | | 129,020 | | | | 80 | % |
| | |
| | | 132,010 | | | | 80 | % |
| | |
| | | 115,510 | | | | 70 | % |
| Differences in value as reported in the 2020 summary compensation table are not reflective of discretionary adjustments but rather are due to differences in valuations using the Black-Scholes model at the time of approval and grant date. |
2018 performance stock unit payout
The PSUs granted in February 2018 matured on December 31, 2020 and both performance targets were exceeded. The DCF per share compound growth was 9.15%, while the relative TSR performance placed at the 77th percentile. The overall performance multiplier of 1.82x was calculated based on the following metrics:
| | | | | | |
| | | |
| | | | DCF per share compound growth | | |
| | | |
| | | | | | at or below 25th percentile |
| | | |
| | | | | | |
| | | |
| | | | | | at or above 75th percentile |
| | | |
| | | | | | 77th percentile (2.00x multiplier) |
| Performance between the thresholds in this table results in a performance multiplier calculated on a linear basis. |
Adjusted DCF per share is based on operating cash flows and is anon-GAAP
measure, which is defined and reconciled in Item 11 –“Non-GAAP
reconciliation”. For incentive compensation purposes, adjusted DCF per share also includes certain adjustments for events or circumstances not contemplated at the time the performance metrics were originally established – see Item 11 – “Non-GAAP reconciliation”.
The performance peer group for the 2018 PSU payout was as follows:
| | |
|
Performance comparator group: relative TSR |
| |
Canadian Utilities Limited | | NiSource Inc. |
| |
| | ONEOK, Inc. |
| |
| | Pembina Pipeline Corporation |
| |
| | PG&E Corporation |
| |
Enterprise Products Partners, L.P. | | Plains All American Pipeline, L.P. |
| |
| | Sempra Energy |
| |
| | TC Energy Corporation |
| |
| | The Williams Companies, Inc. |
| |
Magellan Midstream Partners, L.P. | | |
This resulted in the following payouts for the NEOs in early 2021:
| | | | | | | | | | | | | | | | | | | | | | | | | | | | | | | | | | | | | | | | |
| | | | | | | | | | |
| | | | | | | | Notionally
reinvested
dividends
(#) | | | | | | | | | | | | | | | | | | | | | | |
| | | | | | | | | | |
| | | 103,590 | | | | + | | | | 22,849 | | | | 126,439 | | | | x | | | | 1.82x | | | | x | | | | 42.26 | | | | = | | | | 9,724,864 | |
| | | | | | | | | | |
| | | 6,440 | | | | + | | | | 1,421 | | | | 7,861 | | | | x | | | | 1.82x | | | | x | | | | 42.26 | | | | = | | | | 604,577 | |
| | | | | | | | | | |
| | | 27,125 | | | | + | | | | 5,983 | | | | 33,108 | | | | x | | | | 1.82x | | | | x | | | | 42.26 | | | | = | | | | 2,546,456 | |
| | | | | | | | | | |
| | | 32,070 | | | | + | | | | 7,092 | | | | 39,162 | | | | x | | | | 1.82x | | | | x | | | | 41.88 | | | | = | | | | 2,984,853 | |
| | | | | | | | | | |
| | | 16,440 | | | | + | | | | 3,626 | | | | 20,066 | | | | x | | | | 1.82x | | | | x | | | | 42.26 | | | | = | | | | 1,543,361 | |
| | | | | | | | | | |
| | | 20,090 | | | | + | | | | 4,431 | | | | 24,521 | | | | x | | | | 1.82x | | | | x | | | | 42.26 | | | | = | | | | 1,886,017 | |
| The volume weighted average share price of an Enbridge share on the TSX or NYSE for the 20 trading days immediately preceding December 31, 2020. |
| U.S. dollars have been converted to Canadian dollars using the published WM/Reuters 4 pm Londonyear-end exchange rate of US$1 = C$1.2740. |
2017 Spectra Energy phantom stock unit payout
The 2017 Spectra Energy phantom stock units granted to Mr. Yardley on February 14, 2017 vested on February 14, 2020.
| | | | | | | | | | | | | | | | | | | | |
| | | | | |
| | Total
phantom
stock units
(#) | | | | | | | | | | | | | |
| | | | | |
| | | 17,908 | | | | x | | | | 53.76 | | | | = | | | | 962,820 | |
| The closing price of an Enbridge share on the NYSE on February 24, 2017 closing14, 2020. |
| U.S. dollars have been converted to Canadian dollars using the published WM/Reuters 4 pm Londonyear-end exchange rate of US$1 = C$1.2740. |
| In addition to the amount above, a dividend payout in cash of US$109,938 was made. |
2018 restricted stock unit payout
Mr. Gruending received a 2018 RSU grant which vested on December 1, 2020.
| | | | | | | | | | | | | | | | |
| | | | | | | | |
| | | | | | Notionally
reinvested
dividends
(#) | | | | | | | | | | |
| | | | | | | | |
| | 4,960 | | + | | 998 | | 5,958 | | x | | 38.25 | | = | | 227,877 |
| The volume weighted average share price of an Enbridge share on the TSX for the 20 trading days immediately preceding December 1, 2020. |
2019 restricted stock unit payout
On May 8, 2019, Mr. Yardley was awarded a retention award given his critical role in delivering Gas Transmission and Midstream strategic priorities. This award consisted of 40,421 RSUs, 20% of which vested on May 8, 2020, the first anniversary of the grant. Another 20% of the award will vest on the second anniversary, and the remaining 60% on the third anniversary of the grant date. The table below outlines the tranche that vested in 2020:
| | | | | | | | | | | | | | | | | | | | | | | | | | | | | | | | |
| | | | | | | | |
| | | | | | | | Notionally
reinvested
dividends
(#) | | | | | | | | | | | | | | | | |
| | | | | | | | |
| | | 8,084 | | | | + | | | | 522 | | | | 8,606 | | | | x | | | | 37.61 | | | | = | | | | 323,675 | |
| The volume weighted average share price of an Enbridge share on the NYSE for a total valuethe 20 trading days immediately preceding May 8, 2020. |
| U.S. dollars have been converted to Canadian dollars using the published WM/Reuters 4 pm Londonyear-end exchange rate of $37,429 million in common shares issued to Spectra Energy shareholders, plus approximately $3 million in cash in lieuUS$1 = C$1.2740. |
Enbridge has always integrated ESG into its strategy and decisions and takes pride in its industry leadership. To reinforce this, management took two important steps; the introduction of Inclusion as a core company value and, in November 2020, the announcement of ESG goals, including for GHG emissions reduction and increased diversity and inclusion within Enbridge’s workforce and on its Board of Directors. Of note, and further reinforcing accountability to stakeholders, beginning in 2021, progress towards goals will be reflected in incentive compensation for all employees, including the CEO and executive management.
2020 was an unprecedented year for Enbridge due to the impact ofCOVID-19,
reduced demand for energy and reduced commodity prices. In response to these factors, management implemented voluntary base salary reductions for NEOs, as outlined in the 2020 compensation decisions. This action supported our short-term cost reduction initiative in response to the potential financial implications of the business environment at that time. We have been closely monitoring the impact that our base salary reductions have had on our competitiveness. In light of the success of our cost reduction initiative, business performance in 2020 and to align with our compensation philosophy of providing market competitive pay levels, reinstatement ofpre-rollback
base salaries will take place in 2021. On February 18, 2021, Mr. Yu was awarded a $2 million retention award given his critical role in delivering Liquids Pipelines strategic priorities and the execution of Enbridge’s overall strategy. The award was delivered in the form of RSUs to align with the shareholder experience over the term. 20% of the award will vest on each of the first and second anniversaries of the grant date, with the remainder of such award vesting on the third anniversary of grant, in each case, subject to Mr. Yu’s continued employment with Enbridge.
Total direct compensation for Named Executive Officers Profiles have been prepared for each of the NEOs that provide:
A summary of individual accomplishments in 2020; and
2020 pay mix (2020 base salary, STIP with respect to 2020 and medium- and long-term incentives granted in 2020).
The values provided in the NEOs’ profiles are taken from the 2020 summary compensation table.
|
Mr. Monaco is responsible for setting and executing Enbridge’s strategic priorities and serves on the company’s Board of any fractional shares, and 3.5 million share options with a fair value of $77 million, that were exchanged for Spectra Energy’s outstanding stock compensation awards.Directors. |
Spectra Energy, through its subsidiaries and equity affiliates, owns and operates a large and diversified portfolio of complementary natural gas-related energy assets and is one of North America’s leading natural gas infrastructure companies. Spectra Energy also owns and operates a crude oil pipeline system that connects Canadian and United States producers to refineries in the United States Rocky Mountain and Midwest regions. The Merger Transaction brought together two highly complementary platforms to create North America’s largest energy infrastructure company and meaningfully enhanced customer optionality, positioning us for long-term growth opportunities, and strengthening our balance sheet.
The Merger Transaction was accounted for as a business combination under the acquisition method of accounting as prescribed by Accounting Standards Codification (ASC) 805 Business Combinations. The acquired tangible and intangible assets and assumed liabilities were recorded at their estimated fair values at the date of acquisition.
The purchase price allocation was completed as at December 31, 2017, along with the allocation of goodwill to reporting units (Note 16). Our reporting units are equivalent to our identified segments with the exception of the previous Gas Transmission and Midstream segment, which was composed of 2 reporting units: gas transmission and gas midstream.
The following table summarizes the estimated fair values that were assigned to the net assets of Spectra Energy:
In 2020, Mr. Monaco provided strategic and executive leadership in the following areas:
Health, safety and wellbeing of our workforce in a global pandemic
Operational reliability and undisrupted delivery service to customers across all of our systems in a pandemic-challenged environment
Early and decisive action in mitigating the financial impact ofCOVID-19
and severe disruption in North American energy demand Achievement of DCF per share budget despite unprecedented industry downturn and loss of liquids pipeline throughput
Maintaining strong balance sheet and increasing financial liquidity that protected the business in a volatile and unpredictable operating and capital markets environment
Achievement of substantial overhead savings, including through voluntary workforce reduction program while retaining critical staff and improving employee engagement
Dividend increase of 10%—25th consecutive year
Obtaining all regulatory approvals and permits and commenced Line 3 Replacement Program construction in Minnesota
Completion and into service of $1.6 billion of capital projects
Securing an additional $5 billion of new growth projects
Sale of $0.4 billion ofnon-core
assets Achievement ofat 4.6x, which is at the low end of the target leverage range Establishment of industry leading emissions reductions targets tied to executive compensation
Establishment of diversity and inclusion targets tied to executive compensation
Establishment of extended3-year
growth outlook and revised capital allocation framework Advancement of lower carbon footprint strategy including growth in offshore renewables business – one new project sanctioned; two projects began construction
Significant shareholder engagement andtop-rated
investor relations program Senior management rotations supporting development/succession planning
|
| | |
February 27, | 2017 |
|
(millions of Canadian dollars) | |
|
Fair value of net assets acquired: | |
|
Current assets (a) | 2,432 |
|
Property, plant and equipment, net (b) | 33,555 |
|
Restricted long-term investments | 144 |
|
Long-term investments (c) | 5,000 |
|
Deferred amounts and other assets (d) | 2,390 |
|
Intangible assets, net (e) | 1,288 |
|
Current liabilities (a) | (3,982 | ) |
Long-term debt (d) | (21,444 | ) |
Other long-term liabilities | (1,983 | ) |
Deferred income taxes (b) | (7,670 | ) |
Noncontrolling interests (f) | (8,877 | ) |
| 853 |
|
Goodwill (g) | 36,656 |
|
| 37,509 |
|
Purchase price: | |
|
Common shares | 37,429 |
|
Cash | 3 |
|
Fair value of outstanding earned stock compensation awards recorded in Additional paid-in capital | 77 |
|
| 37,509 |
|
| | |
a)
| Accounts receivable is comprised primarily of customer trade receivables and natural gas imbalances. As such, the fair value of accounts receivable approximates the net carrying value of $1,174 million. The gross amount due of $1,190 million, of which $16 million is not expected to be collected, is included in current assets. |
During the fourth quarter of 2017, we identified certain transactions that were not reflected in the purchase price equation. This resulted in a $67 million and $548 million increase in current assets and current liabilities, respectively, and a $481 million decrease in long-term debt.
| |
b)
| We have applied the valuation methodologies described in ASC 820 Fair Value Measurements and Disclosures, to value the property, plant and equipment purchased. The fair value of Spectra Energy’s rate-regulated property, plant and equipment was determined using a market participant perspective, which is their carrying amount. The fair value of the remaining non-regulated property, plant and equipment was determined primarily using variations of the income approach, which is based on the present value of the future after-tax cash flows attributable to each non-regulated asset. Some of the more significant assumptions inherent in the development of the values, from the perspective of a market participant, include, but are not limited to, the amount and timing of projected future cash flows (including revenue and profitability); the discount rate selected to measure the risks inherent in the future cash flows; the assessment of the asset’s life cycle; the competitive trends impacting the asset; and customer turnover.
|
During the third quarter of 2017, Spectra Energy's right-of-way agreements were reclassified from intangible assets to property, plant and equipment to conform the presentation of these agreements with our accounting policy pertaining to rights-of-way. The purchase price allocation above reflects this reclassification, which amounted to $830 million as at February 27, 2017. There is no change in the amortization period for the right-of-way agreements as a result of this reclassification.President & CEO compensation
During the fourth quarter of 2017, we finalized our fair value measurement of the BC Pipeline & Field Services businesses, which resulted in decreases to property, plant and equipment of $1,955 million and deferred income tax liabilities of $661 million as at February 27, 2017.
| |
c)
| Long-term investments represent Spectra Energy’s 50% equity investment in DCP Midstream, Gulfstream Natural Gas System, L.L.C., NEXUS Gas Transmission, LLC (NEXUS), Steckman Ridge LP, Islander East Pipeline Company, L.L.C., Southeast Supply Header L.L.C., and 20% equity interest in PennEast Pipeline Company LLC (PennEast). The fair value of these investments was determined using an income approach. |
d) Fair value ofOur President & CEO is primarily responsible for executing our long-term
debt was determined based on the current underlying Government of Canada and United States Treasury interest rates on the corresponding bonds,business strategy as well as
an implied credit spread based shorter-term strategies that support our long-term objectives. The HRC Committee recognizes that Mr. Monaco is managing a changing and increasingly complex business and that it is important to reward these efforts. In 2020, these efforts included decisive action to mitigate the impact ofCOVID-19
on
currentour financial and operational performance as well as on the health and safety of our employees, customers and communities. The HRC Committee believes Mr. Monaco’s compensation should be consistent with this level of responsibility and thus evaluates his pay annually and, if necessary, adjusts it to ensure it is aligned with the market
conditions and
our strategic goals. Recent adjustments to certain elements of Mr. Monaco’s pay have resulted in an increase in
his target total direct compensation. These adjustments demonstrate the
book valueHRC Committee’s efforts to bring his pay closer to the market median, using aphased-in
approach over a period of
debtyears, and to recognize his role in the company’s success. Consistent with our philosophy, a significant portion of
$1.5 billion. the overall increase was delivered through LTIP, which are aligned to the achievement of our strategic priorities and with shareholder interests. | |
|
Executive Vice President & Chief Financial Officer Mr. Gruending is responsible for all corporate financial affairs of the company, including financial planning and reporting, tax, treasury and financial risk management. |
In 2020, Mr. Gruending provided strategic and executive oversight in the following areas:
Stewardship of the company’s financial performance to achieve budgeted results, notwithstanding challenges posed byCOVID-19
and related lower transportation demand, including the swift development and implementation of a cost reduction and amended financing plan to retain maximum enterprise strength, in the case of a prolonged pandemic Raising $8.5 billion of long-term capital on attractive terms in support of the company’s growth program
Stewardship of the capital allocation framework and sustained and strengthened Enbridge’s financial positionratio of 4.6x, which is at the low end of the stated target range) Advancement of the execution of Enbridge’s Enterprise Resource Planning implementation, an initiative to automate and harmonize key financial and work management systems
Development of the 2021 budget, financing plan, and3-year
outlook The company’s accounting, treasury, risk management, taxation, audit, and investor relations functions, including the development of top talent and strengthening engagement levels
|
Former Executive Vice President Mr. Whelen was responsible for all corporate development affairs of the company, strategy and planning, Energy Services and the Power business. |
In 2020, Mr. Whelen provided strategic and executive oversight in the following areas:
Development and implementation of a dynamic strategic planning framework to assess and respond to challenges and opportunities arising from the impact ofCOVID-19
and energy market disruptions Delivery of an updated strategic plan in response to evolving energy fundamentals and changes in Enbridge’s business environment
Development of a framework and methodologies to support the implementation of enterprise-wide GHG emissions reduction goals and related measures that were announced in November of 2020
Advancement of a number of renewable power projects under construction or in earlier stages of development, including development and implementation of a strategy to develop renewable electric generation facilities to power Enbridge’s core operations
Development of staff and senior management for broader roles, ensuring a smooth succession and transition to new leadership of Corporate Development functions upon his retirement in November of 2020
|
Executive Vice President & President, Gas Transmission & Midstream Mr. Yardley is responsible for Enbridge’s natural gas transmission and midstream business across North America. |
In 2020, Mr. Yardley provided strategic and executive oversight in the following areas:
Completion of a transformational year in the system-wide asset integrity and modernization program
Implementation of rate initiatives on Algonquin and Texas Eastern, and filed rate proceedings on East Tennessee Natural Gas, Maritimes & Northeast Pipeline and Alliance Pipeline
Completion of the first-ever solar self-power project in Lambertville, NJ, a major step in a system-wide emissions reduction effort
Major contract renewal effort, achieving a revenue renewal rate of over 99% with customers on our major pipelines
Championing safe and responsible operations, resulting in a 50% decrease in business unit recordable injury frequency among employees and contractors and a 40% decrease in environmental incident frequency from 2019
Keeping US$3 billion of projects on track forin-service
dates Identifying $2 billion per year of future development opportunities
Securing pipeline agreements for liquefied natural gas projects for up to US$4 billion in investment opportunity, advancing gulf coast strategy
Demonstration of operational resiliency with minimal impacts to customers associated with 12 named tropical storms and hurricanes impacting Gas Transmission and Midstream assets in 2020
Ensuring safe continuity of operations at all times during theCOVID-19
pandemic |
Executive Vice President & President, Liquids Pipelines Mr. Yu is responsible for Enbridge’s crude oil and liquids pipeline business across North America. |
In 2020, Mr. Yu provided strategic and executive oversight in the following areas:
Implementation of significant new health and safety protocols related toCOVID-19
to ensure that the Liquids Pipelines system operated uninterrupted in 2020 Achievement of above target reliability
Achievement of 2020 financial performance within target range for Liquids Pipelines, overcoming an unprecedented reduction in refinery demand and an associated reduction in Mainline volumes due toCOVID-19
Implementation of significant system and cost efficiencies to offset reduced Mainline throughput
Achievement of record high volumes to the U.S. Gulf Coast through the Market Access pipelines
Completion of the North Dakota section of the Line 3 Replacement Program on budget and on schedule
Obtaining all necessary State and Federal permits to begin construction of the Minnesota section of the Line 3 Replacement Program
Progressing the regulatory process for Mainline contracting with the Canada Energy Regulator, answering more than 3,300 interrogatory requests
Completion of Line 5 tunnel permit applications
Implementation of a diversity plan for Liquids Pipelines and improved diversity within the leadership team
|
Executive Vice President & Chief Legal Officer Mr. Rooney is responsible for the legal, ethics and compliance, security and aviation functions across Enbridge. |
In 2020, Mr. Rooney provided executive oversight for a number of substantial legal, business and regulatory matters, including:
Acquiring all permits, approvals and judicial decisions necessary to commence construction of the Line 3 Replacement Program in Minnesota
Legal and regulatory aspects of the Ontario Energy Board approvals to advance Enbridge’s renewable natural gas and hydrogen projects
Legal and regulatory aspects for theT-North
andT-South
expansion projects in British Columbia Legal and regulatory strategy for Line 5 in Michigan to maintain operations and advance the Great Lakes Tunnel project
Legal aspects of the European offshore wind business that achieved final investment decision at Fécamp, acquisition of an interest in Mistral and sell-downs to Canada Pension Plan Investment Board
Development of a new strategic plan for Security to support the company
Primary legal support for all corporate finance activities
Effective corporate governance and supported leading ESG practices
Legal and regulatory strategy for the Mainline contracting application to the Canada Energy Regulator
Management of the Aviation function to provide safe and efficient pipeline patrols and services
Continued advancement of our workforce diversity and inclusion initiatives
The NEOs participate in the Senior Management Pension Plan (“SMPP”), anon-contributory
defined benefit plan that provides market competitive retirement income to all Canadian and U.S. members of senior management. Before becoming participants in the SMPP, certain NEOs participated in anon-contributory
defined benefit or defined contribution pension plan. The following graphic shows how the SMPP retirement benefit payable at normal retirement age is calculated:
Eligibility: members of senior management join the SMPP on the later of their date of hire or promotion to a senior management position;
Vesting: plan participants are fully vested immediately;
Retirement age: normal retirement date is age 65. Participants can retire with an unreduced pension at age 60, or as early as age 55 if they have 30 years of service. If they have less than 30 years of service, they can still retire as early as age 55, but their retirement benefit is reduced by 3% per year before age 60;
Adjustment for inflation: retirement benefits are indexed at 50% of the annual increase in the consumer index price; and
Survivor benefits: the pension is payable for the life of the member. If the member is single at retirement, 15 years of pension payments are guaranteed. If the member is married at retirement and dies before their spouse, 60% of the pension will continue to be paid to the spouse for his/her lifetime.
The SMPP consists of benefits paid from the followingtax-qualified
and supplemental pension plans, collectively referred to as the SMPP: Retirement Plan for Employees of Enbridge Inc. and Affiliates;
Enbridge Employee Services, Inc. Employees’ Pension Plan;
Enbridge Supplemental Pension Plan; and
Enbridge Employee Services Inc. Supplemental Pension Plan for United States Employees
Prior to the merger of Enbridge Inc. and Spectra Energy Corp (the Merger Transaction), Mr. Yardley participated in a qualified and anon-qualified
cash balance arrangement, to which there are no further contributions or service accruals.
Summary of defined benefits
The following table outlines estimated annual retirement benefits, accrued pension obligations and compensatory andnon-compensatory
changes for the NEOs under the defined benefit pension plans. All information is based on the assumptions and methods used for the purposes of reporting the company’s financial statements and which are described in the company’s financial statements. | | | | | | | | | | | | | | | | | | | | | | | | | | | | |
| | | | | | |
| | | | | | | | Accrued
obligation at
Jan 1, 2020
($) | | | | | | | | | Accrued
obligation at
Dec 31, 2020
($) | |
| | | | | | |
| | | | | | | | | | | | |
| | | | | | | |
| | | 22.08 | | | | 1,463,000 | | | | 1,625,000 | | | | 26,182,000 | | | | 1,462,000 | | | | 2,333,000 | | | | 29,977,000 | |
| | | | | | | |
| | | 17.25 | | | | 232,000 | | | | 530,000 | | | | 4,681,000 | | | | 1,017,000 | | | | 675,000 | | | | 6,373,000 | |
| | | | | | | |
| | | 23.03 | | | | 447,000 | | | | 447,000 | | | | 8,039,000 | | | | 525,000 | | | | 1,438,000 | | | | 10,002,000 | |
| | | | | | | |
| | | 20.13 | | | | 201,000 | | | | 363,000 | | | | 2,778,000 | | | | 396,000 | | | | 289,000 | | | | 3,463,000 | |
| | | | | | | |
| | | 19.75 | | | | 343,000 | | | | 525,000 | | | | 6,368,000 | | | | 1,177,000 | | | | 877,000 | | | | 8,422,000 | |
| | | | | | | |
| | | 3.92 | | | | 67,000 | | | | 86,000 | | | | 895,000 | | | | 349,000 | | | | 136,000 | | | | 1,380,000 | |
| The fair value adjustment to long-term debtcomponents of compensatory change are current service cost and the difference between actual and estimated pensionable earnings. |
| Thenon-compensatory change includes interest on the accrued obligation at the start of the year, changes in actuarial assumptions and other experience gains and losses not related to rate-regulated entitiescompensation. |
| Mr. Monaco’s retirement benefit is calculated using a 2.5% accrual rate for each year of $629 million also results incredited service between 2008 and 2013. The higher accrual rate is equivalent to approximately 1.50 years of credited service. Upon Mr. Monaco’s appointment to President & CEO, a regulatory offset in Deferred amounts and other assets in the Consolidated Statements of Financial Position.
During the fourth quarter of 2017, deferred amounts and other assets decreased by $530 million as at February 27, 2017 duecap to the finalizationannual pension payable of BC Pipelines & Field Services' fair value measurement, as discussed under (b) above.
During the fourth quarter of 2017, we identified certain transactions that were not reflected in the purchase price equation. This resulted in a $481 million decrease in long-term debt, as discussed under (a) above.
| | e)
| Intangible assets primarily consist of customer relationships in the non-regulated business, which represent the underlying relationship from long-term agreements with customers that are capitalized upon acquisition, determined using the income approach. Intangible assets are amortized on a straight-line basis over their expected lives. |
During the third quarter of 2017, intangible assets decreased by $830 million as at February 27, 2017 due to a reclassification to property, plant and equipment, as discussed under (b) above.
The fair value of intangible assets acquired through the Merger Transaction, by major classes is as follows:
$1,750,000 was implemented. | | | | | | | | Weighted Average | Fair |
| | As at February 27, 2017 | Amortization Rate | Value |
| | (millions of Canadian dollars) | | | Customer relationships1 | 3.7 | % | 739 |
| Project agreement2 | 4.0 | % | 105 |
| | Software | 11.1 | % | 329 |
| | Other | 4.2 | % | 115 |
| | | | 1,288 |
|
| | 1 | Represents customer relationships in the non-regulated business, which were capitalized upon acquisition. |
| | 2 | Represents a project agreement between SEP, NextEra Energy, Inc., Duke Energy Corporation (Duke Energy) and Williams Partners L.P. In accordance with the agreement, payments will be made, based on our proportional ownership interest in Sabal Trail, as certain milestones of the project are met. Amortization of the intangible asset began on July 3, 2017, when Sabal Trail was placed into service (Note 13). |
|
| | f)
| The fair value of Spectra Energy’s noncontrolling interests includes approximately 78.4 million SEP common units outstanding to the public, valued at the February 24, 2017 closing price of US$44.88 per common unit on the NYSE, and units held by third parties in Maritimes & Northeast Pipeline, L.L.C., Sabal Trail and Algonquin Gas Transmission, L.L.C., valued based on the underlying net assets of each reporting unit and preferred stock held by third parties in Union Gas and Westcoast Energy Inc. |
During the third quarter of 2017, we finalized our fair value measurement of Sabal Trail, which resulted in an increase to noncontrolling interests of $85 million as at February 27, 2017.
| | g)
| We recorded $36.7 billion in goodwill, which is primarily related to expected synergies from the Merger Transaction. The goodwill balance recognized is not deductible for tax purposes. Factors that contributed to the goodwill include the opportunity to expand our natural gas pipelines segment, the potential for cost and supply chain optimization synergies, existing assembled assets and work force that cannot be duplicated at the same cost by a new entrant, franchise rights and other intangibles not separately identifiable because they are inextricably linked to the provision of regulated utility service and the enhanced scale and geographic diversity which provide greater optionality and platforms for future growth. |
During the third quarter of 2017, goodwill increased by $85 million as at February 27, 2017 due to the finalization of the fair value measurement of Sabal Trail as discussed under (f) above.
During the fourth quarter of 2017, goodwill increased by $1,824 million as at February 27, 2017 due to the finalization of the fair value measurement of BC Pipelines & Field Services as discussed under (b) above.
Acquisition-related expenses incurred were approximately $231 million. Costs incurred for the year endedMr. Gruending’s SMPP retirement benefits earned after December 31, 2017 are not indexed for inflation.
|
| Mr. Whelen’s annual benefits payable and accrued obligation at year end reflects his retirement in 2020. |
| The impact of $180 million were included in Operating and administrative expensechanges to exchange rates on Mr. Yardley’s accrued obligation is reflected in the Consolidated Statements of Earnings.non-compensatory Upon completionchange. The accrued obligation for Mr. Yardley’s cash balance retirement benefits prior to joining the SMPP are US$1,019,509 at the start of the Merger Transaction, we began consolidating Spectra Energy. Sinceyear and US$1,060,289 at year end.
|
| U.S. dollars have been converted to Canadian dollars using the closing datepublished WM/Reuters 4 pm Londonyear-end exchange rate of February 27, 2017 through December 31, 2017, Spectra Energy has generated approximately $5,740 millionUS$1 = C$1.2740. |
| In 2020, all NEOs were granted a temporary hold-harmless against a reduction to their SMPP pension resulting from the significant reductions in revenues and $2,574 million in earnings.
Our supplemental pro forma consolidated financial information for the year ended December 31, 2017, including the results of operations for Spectra Energy as if the Merger Transaction had been completed on January 1, 2017 are as follows:
| | | | Year ended December 31, | 2017 |
| (unaudited; millions of Canadian dollars) | |
| Revenues | 45,669 |
| Earnings attributable to common shareholders1
| 2,902 |
|
| | 1 | Merger Transaction costs of $180 million (after-tax $131 million) were excluded from earnings for the year ended December 31, 2017. |
ASSETS HELD FOR SALE
Line 10 Crude Oil Pipeline
In the first quarter of 2018, we satisfied the condition as set out in our agreements for the sale of our Line 10 crude oil pipeline (Line 10), which originates near Hamilton, Ontario and terminates at West Seneca, New York. Our subsidiaries, Enbridge Pipelines Inc. and EEP, own the Canadian and United States portions of Line 10, respectively, and the related assets are included in our Liquids Pipeline segment. Subject to certain regulatory approvals and customary closing conditions, the transaction is expected to close in 2020.
A loss of $154 million was includedbase salary should they retire within Impairment of long-lived assets on the Consolidated Statements of Earnings for the year ended December 31, 2018 in relation to measuring Line 10 assets at the lower of their carrying value or fair value less costs to sell.
Montana-Alberta Tie Line
In the fourth quarter of 2019, we committed to a plan to sell the Montana-Alberta Tie Line transmission assets, a 345 kilometer transmission line from Great Falls, Montana to Lethbridge, Alberta. Its related assets are included in our Renewable Power Generation segment. The purchase and sale agreement was signed in January 2020. Subject to certain regulatory approvals and customary closing conditions, the transaction is expected to close in the first quarter of 2020.
Upon the reclassification and subsequent remeasurement of MATL assets as held for sale, a loss of $297 million was included within Impairment of long-lived assets on the Consolidated Statements of Earnings.
Summary of Assets Held for Sale
The table below summarizes the presentation of net assets held for sale in our Consolidated Statements of Financial Position:
| | | | | | | | December 31, 2019 |
| December 31, 20182 |
| | (millions of Canadian dollars) | |
| | | Accounts receivable and other (current assets held for sale) | 28 |
| 117 |
| Deferred amounts and other assets (long-term assets held for sale)1 | 269 |
| 2,383 |
| | Accounts payable and other (current liabilities held for sale) | — |
| (63 | ) | | Other long-term liabilities (long-term liabilities held for sale) | — |
| (96 | ) | | Net assets held for sale | 297 |
| 2,341 |
|
| | 1 | Included within Deferred amounts and other assets at December 31, 2019 and 2018 respectively is property, plant and equipment of $181 million and $2.1 billion. |
| | 2 | Figures are inclusive of net assets held for sale at December 31, 2018 and subsequently disposed of during the year ended December 31, 2019. |
DISPOSITIONS
St. Lawrence Gas Company, Inc.
In August 2017, we entered into an agreement to sell the issued and outstanding shares of St. Lawrence Gas Company, Inc. (St. Lawrence Gas). St. Lawrence Gas assets were included in the Gas Distribution and Storage segment. On November 1, 2019 we closed the sale of St. Lawrence Gas for cash proceeds of approximately $72 million (US$55 million). After closing adjustments, a loss on disposal of $10 million was included in Other income/(expense) in the Consolidated Statements of Earnings.
Enbridge Gas New Brunswick
In December 2018, we entered into an agreement for the sale of Enbridge Gas New Brunswick Limited Partnership and Enbridge Gas New Brunswick Inc. (collectively, EGNB). EGNB assets were a part of our Gas Distribution and Storage segment. On October 1, 2019 we closed the sale of EGNB to Liberty Utilities (Canada) LP, a wholly-owned subsidiary of Algonquin Power and Utilities Corp. for cash proceeds of approximately $331 million. After closing adjustments, a loss on disposal of $3 million was included in Other income/(expense) in the Consolidated Statements of Earnings.
As EGNB assets represented a portion of a reporting unit, we allocated a portion5 years of the goodwill of the reporting unit to these assets using a relative fair value approach. As such, allocated goodwill of $133 million was included in assets subsequently disposed.
Canadian Natural Gas Gathering and Processing Businesses
On July 4, 2018, we entered into agreements to sell our Canadian natural gas gathering and processing businesses to Brookfield Infrastructure Partners L.P. and its institutional partners for a cash purchase price of approximately $4.3 billion, subject to customary closing adjustments. Separate agreementsreduction. These base salary reductions were entered into for those facilities currently governed by provincial regulations and those governed by federal regulations (collectively, Canadian Natural Gas Gathering and Processing Businesses assets).
As the Canadian Natural Gas Gathering and Processing Businesses assets represented a portion of a reporting unit, we allocated a portion of the goodwill of the reporting unit of these assets using a relative fair value approach. As a result of the goodwill allocation, the carrying value of Canadian Natural Gas Gathering and Processing Businesses assets was greater than the sale price consideration less the cost to sell and we recorded a goodwill impairment of $1,019 million on the Consolidated Statements of Earnings for the year ended December 31, 2018. The held for sale classification represented a triggering event and required us to perform a goodwill impairment test for the related reporting unit. The results of the test did not indicate any additional goodwill impairment.
On October 1, 2018, we closed the sale of the provincially regulated facilities for proceeds of approximately $2.5 billion. After closing adjustments, a gain on disposal of $34 million before tax was included in Other income/(expense) in the Consolidated Statements of Earnings for the year ended December 31, 2018.
On December 31, 2019, we closed the sale of the federally regulated facilities for proceeds of approximately $1.7 billion. After closing adjustments, a loss on disposal of $268 million before tax was included in Other income/(expense) in the Consolidated Statements of Earnings for the year ended December 31, 2019. As these assets represented a portion of a reporting unit, we allocated a portion of the goodwill of the reporting unit to these assets using a relative fair value approach. As such, allocated goodwill of $55 million was included in assets subsequently disposed.
Renewable Assets
On August 1, 2018, we closed the sale of a 49% interest in all of our Canadian renewable assets, a 49% interest in two United States renewable assets and 49% of our interest in the Hohe See Offshore wind power project and its subsequent expansion, both concurrently under construction in Germany, (collectively, the Renewable Assets) to the CPPIB. Total cash proceeds from the transaction were $1.75 billion. In addition, CPPIB will fund their pro-rata share of the remaining capital expenditures on the Hohe See Offshore wind power project. We maintain a 51% interest in the Renewable Assets and will continue to manage, operate and provide administrative services for these assets.
A loss on disposal of $20 million (€14 million) was included in Other income/(expense) in the Consolidated Statements of Earnings for the year ended December 31, 2018 for the sale of 49% of our interest in the Hohe See Offshore wind power project and its subsequent expansion. Subsequent to the sale, the remaining interests in these assets continue to be accounted for as an equity method investment, and are a part of our Renewable Power Generation segment.
Gains of $62 million and $17 million (US$13 million) were included in Additional paid-in capital in the Consolidated Statements of Financial Position for the year ended December 31, 2018 for the sale of 49% interest in the Canadian and United States renewable assets, respectively.
Also, a deferred income tax recovery of $267 million ($196 million attributable to us) was recorded in the year ended December 31, 2018 as a result of the agreement entered into during the second quarter of 2018 for the Renewable Assets (Note 25).
Midcoast Operating, L.P.
On August 1, 2018, we closed the sale of MOLP to AL Midcoast Holdings, LLC (an affiliate of ArcLight Capital Partners, LLC) for total cash proceeds of $1.4 billion (US$1.1 billion). After closing adjustments recorded in the fourth quarter of 2018, a loss on disposal of $41 million (US $32 million) was included in Other income/(expense) in the Consolidated Statements of Earnings. MOLP conducted our United States natural gas and natural gas liquids gathering, processing, transportation and marketing businesses, and was a part of our Gas Transmission and Midstream segment.
Upon the reclassification and subsequent re-measurement of MOLP assets as held for sale, an asset impairment loss of $4.4 billion and a related goodwill impairment of $102 million, were included in the Consolidated Statement of Earnings for the year ended December 31, 2017.
As a result of entering into a definitive sales agreement, the fair value of the assets held for sale as at March 31, 2018 were revised based on the sale price. Accordingly, we recorded a loss of $913 million included within Impairment of long-lived assets on the Consolidated Statements of Earnings for the year ended December 31, 2018.
In the second quarter of 2018, our equity method investment in the Texas Express NGL pipeline system, also met the conditions for assets held for sale. The $447 million carrying value of Texas Express NGL pipeline system equity investment and an allocated goodwill of $262 million, were included within the disposal group as at June 30, 2018 and subsequently disposed on August 1, 2018.
Upon closing of the sale, we also recorded a liability of $387 million (US$298 million) for future volume commitments retained by us. The associated loss is included in the loss on disposal of $41 million discussed above. As at December 31, 2019 and December 31, 2018 respectively, $299 million (US$230 million) and $375 million (US$274 million) were included in liabilities on the Consolidated Statements of Financial Position.
Sandpiper Project
During the years ended December 31, 2018 and 2017, we sold unused pipe related to the Sandpiper for cash proceedsimpacts of approximately $38 million (US$30 million)COVID-19, reduced energy demand and $148 million (US$111 million), respectively. Gains on disposal of $29 million (US$22 million) and $83 million (US$63 million) before tax were included in Operating and administrative expense in the Consolidated Statements of Earnings for the years ended December 31, 2018 and 2017, respectively. These assets were a part of our Liquids Pipelines segment.
Olympic Pipeline
On July 31, 2017, we completed the sale of our interest in Olympic Pipeline for cash proceeds of approximately $203 million (US$160 million). A gain on disposal of $27 million (US$21 million) before tax was included in Other income/(expense) in the Consolidated Statements of Earnings for the year ended December 31, 2017. This interest was a part of our Liquids Pipelines segment.
Ozark Pipeline
On March 1, 2017, we completed the sale of the Ozark Pipeline assets to a subsidiary of MPLX LP for cash proceeds of approximately $294 million (US$220 million), including reimbursement of costs. A gain on disposal of $14 million (US$10 million) before tax was included in Operating and administrative expense in the Consolidated Statements of Earnings for the year ended December 31, 2017. These assets were a part of our Liquids Pipelines segment.
9. ACCOUNTS RECEIVABLE AND OTHER
| | | | | | | December 31, | 2019 |
| 2018 |
| | (millions of Canadian dollars) | | | Trade receivables and unbilled revenues1 | 5,164 |
| 4,711 |
| | Short-term portion of derivative assets | 327 |
| 498 |
| | Other | 1,290 |
| 1,308 |
| | | 6,781 |
| 6,517 |
|
1 Net of allowance for doubtful accounts of $50 million and $64 million as at December 31, 2019 and 2018, respectively.
10. INVENTORY
| | | | | | | December 31, | 2019 |
| 2018 |
| | (millions of Canadian dollars) | |
| |
| | Natural gas | 696 |
| 776 |
| | Crude oil | 542 |
| 482 |
| | Other commodities | 61 |
| 81 |
| | | 1,299 |
| 1,339 |
|
Adjustments of $188 million, $327 million and $58 million were included in Commodity costs on the Consolidated Statements of Earnings for the years ended December 31, 2019, 2018 and 2017, respectively, to reduce inventory to market value.
11. PROPERTY, PLANT AND EQUIPMENT
| | | | | | | | | | Weighted Average |
| |
| |
| | December 31, | Depreciation Rate |
| 2019 |
| 20181 |
| | (millions of Canadian dollars) | |
| |
| |
| | Pipelines | 2.5 | % | 56,330 |
| 51,647 |
| | Facilities and equipment | 2.7 | % | 29,287 |
| 27,149 |
| Land and right-of-way2 | 2.0 | % | 2,947 |
| 2,614 |
| | Gas mains, services and other | 2.7 | % | 12,194 |
| 12,088 |
| | Storage | 2.3 | % | 2,748 |
| 2,730 |
| | Wind turbines, solar panels and other | 4.1 | % | 4,914 |
| 5,015 |
| | Other | 6.4 | % | 1,486 |
| 1,463 |
| | Under construction | — | % | 4,057 |
| 9,698 |
| Total property, plant and equipment3 | |
| 113,963 |
| 112,404 |
| | Total accumulated depreciation | | (20,240 | ) | (17,864 | ) | | Property, plant and equipment, net | |
| 93,723 |
| 94,540 |
|
1 Asset categories were revised and collapsed in the current year. 2018 comparative figures have been reclassified to conform to current year's asset classifications.
2 The measurement of weighted average depreciation rate excludes non-depreciable assets.
3 Certain assets were reclassified as held for sale as at December 31, 2019 and December 31, 2018 (Note 8).
Depreciation expense for the years ended December 31, 2019, 2018 and 2017 was $3.0 billion, $2.9 billion and $2.9 billion, respectively.
IMPAIRMENT
Access Northeast Project
In 2019, we announced that we terminated the agreements with Eversource and National Grid related to the Access Northeast project. As a result, we recognized an impairment loss of $105 million for the year ended December 31, 2019, which is included in Impairment of long-lived assets in the Consolidated Statements of Earnings. Access Northeast is part of our Gas Transmission and Midstream segment.
Impairment charges were based on the amount by which the carrying values of the assets exceeded fair value, determined using expected discounted future cash flows.
12. VARIABLE INTEREST ENTITIES
CONSOLIDATED VARIABLE INTEREST ENTITIES
Enbridge Canadian Renewable LP (ECRLP)
ECRLP, an entity which we have a 51% ownership in, is a VIE as its limited partners lack substantive kick-out rights or participating rights. Because we have the power to direct the activities of ECRLP, we are exposed to potential losses, and we have the right to receive benefits from ECRLP, we are considered the primary beneficiary.
Renewable Power Generation
Through various subsidiaries, we have a majority ownership interest in Magic Valley, Wildcat, Keechi Wind Project (Keechi), New Creek and Chapman Ranch wind facilities. These wind facilities are considered VIEs due to the members’ lack of substantive kick-out rights and participating rights. We are the primary beneficiary of these VIEs by virtue of our power to direct the activities that most significantly impact the economic performance of the wind facilities, and our obligation to absorb losses and the right to receive benefits that are significant.
Enbridge Holdings (DakTex) L.L.C.
Enbridge Holdings (DakTex) L.L.C. (DakTex) is owned 75% by a wholly-owned subsidiary of Enbridge and 25% by EEP, through which we have an effective 27.6% interest in the equity investment, Bakken Pipeline System (Note 13). EEP is the primary beneficiary because it has the power to direct DakTex’s activities that most significantly impact its economic performance. We consolidate EEP and by extension, also consolidate DakTex.
Enbridge Income Partners LP (EIPLP)
EIPLP, formed in 2002, was involved in the generation, transportation and storage of energy through interests in its Liquids Pipelines business, including the Canadian Mainline, the Regional Oil Sands System, an interest in the Alliance Pipeline, which transports natural gas, and its renewable and alternative power generation facilities. EIPLP was wound up in 2019 and thus is no longer a VIE.
Enbridge Income Fund (the Fund)
The Fund is an unincorporated open-ended trust established by a trust indenture under the laws of the
Province of Alberta. In 2019, an amendment to the Fund's governing documents was executed which resulted in the Fund no longer being considered a VIE.
Enbridge Commercial Trust (ECT)
In 2019, an amendment to ECT's governing documents was executed which resulted in ECT no longer being considered a VIE.
Other Limited Partnerships
By virtue of limited partners' lack of substantive kick-out rights and participating rights, substantially all limited partnerships wholly-owned by us and/or our subsidiaries are considered VIEs, including EEP and SEP. As these entities are 100% owned and directed by us with no third parties having the ability to direct any of the significant activities, we are considered the primary beneficiary.
The following table includes assets to be used to settle liabilities of our consolidated VIEs and liabilities of our consolidated VIEs for which creditors do not have recourse to our general credit as the primary beneficiary. These assets and liabilities are included in the Consolidated Statements of Financial Position.
| | | | | | | December 31, | 20191 |
| 2018 |
| | (millions of Canadian dollars) | |
| |
| | Assets | |
| |
| | Cash and cash equivalents | 208 |
| 506 |
| | Restricted cash | 1 |
| 61 |
| | Accounts receivable and other | 76 |
| 2,006 |
| | Accounts receivable from affiliates | — |
| 38 |
| | Inventory | 4 |
| 244 |
| | | 289 |
| 2,855 |
| | Property, plant and equipment, net | 3,392 |
| 72,349 |
| | Long-term investments | 15 |
| 6,481 |
| | Restricted long-term investments | 69 |
| 244 |
| | Deferred amounts and other assets | 4 |
| 3,156 |
| | Intangible assets, net | 124 |
| 705 |
| | Goodwill | — |
| 29 |
| | Deferred income taxes | — |
| 131 |
| | | 3,893 |
| 85,950 |
| | Liabilities | |
| |
| | Short-term borrowings | — |
| 275 |
| | Accounts payable and other | 56 |
| 2,925 |
| | Accounts payable to affiliates | — |
| 4 |
| | Interest payable | — |
| 303 |
| | Environmental liabilities | — |
| 22 |
| | Current portion of long-term debt | — |
| 1,034 |
| | | 56 |
| 4,563 |
| | Long-term debt | — |
| 29,577 |
| | Other long-term liabilities | 130 |
| 5,074 |
| | Deferred income taxes | 5 |
| 6,911 |
| | | 191 |
| 46,125 |
| | Net assets before noncontrolling interests | 3,702 |
| 39,825 |
|
1 Excludes assets and liabilities of EEP and SEP following the subsidiary guarantees agreement entered on January 22, 2019 (Note 32).
We do not have an obligation to provide financial support to any of the consolidated VIEs.
UNCONSOLIDATED VARIABLE INTEREST ENTITIES
We currently hold several equity investments in limited partnerships that are assessed to be VIEs due to limited partners not having substantive kick-out rights or participating rights. We have determined that we do not have the power to direct the activities of the VIEs that most significantly impact the VIEs’ economic performance. Specifically, the power to direct the activities of a majority of these VIEs is shared amongst the partners. Each partner has representatives that make up an executive committee that makes significant decisions for the VIE and none of the partners may make major decisions unilaterally.
The carrying amount of our interest in VIEs that are unconsolidated and our estimated maximum exposure to loss as at December 31, 2019 and 2018 are presented below:
| | | | | | | | Carrying Amount of Investment |
| Enbridge’s Maximum Exposure to |
| | December 31, 2019 | in VIE |
| Loss |
| | (millions of Canadian dollars) | |
| |
| Aux Sable Liquid Products L.P.1 | 267 |
| 331 |
| Eolien Maritime France SAS2 | 67 |
| 725 |
| Enbridge Renewable Infrastructure Investments S.a.r.l.3 | 141 |
| 2,720 |
| Gray Oak Holdings LLC4 | 463 |
| 935 |
| PennEast Pipeline Company, LLC5 | 106 |
| 368 |
| Rampion Offshore Wind Limited6 | 600 |
| 620 |
| Vector Pipeline L.P.7 | 195 |
| 392 |
| Other8 | 57 |
| 57 |
| | | 1,896 |
| 6,148 |
|
| | | | | | | | Carrying Amount of Investment |
| Enbridge’s Maximum Exposure to |
| | December 31, 2018 | in VIE |
| Loss |
| | (millions of Canadian dollars) | |
| |
| Aux Sable Liquid Products L.P.1 | 311 |
| 375 |
| Eolien Maritime France SAS2 | 68 |
| 784 |
| Enbridge Renewable Infrastructure Investments S.a.r.l.3 | 127 |
| 3,037 |
| Illinois Extension Pipeline Company, L.L.C.8 | 724 |
| 724 |
| NEXUS Gas Transmission, LLC9 | 1,757 |
| 2,668 |
| PennEast Pipeline Company, LLC5 | 97 |
| 385 |
| Rampion Offshore Wind Limited6 | 638 |
| 648 |
| Vector Pipeline L.P.7 | 198 |
| 301 |
| Other8 | 27 |
| 27 |
| | | 3,947 |
| 8,949 |
|
| | 1 | At December 31, 2019 and 2018, the maximum exposure to loss includes a guarantee issued by us for our respective share of the VIE’s borrowing on a bank credit facility. |
| | 2 | At December 31, 2019 and 2018, the maximum exposure to loss includes the portion of our parental guarantee that has been committed in project construction contracts for which we would be liable in the event of default by the VIE and an outstanding affiliate loan receivable for $166 million and $202 million held by us as at December 31, 2019 and 2018, respectively. |
| | 3 | At December 31, 2019 and 2018, the maximum exposure to loss includes the portion of our parental guarantee that has been committed in project construction contracts for which we would be liable in the event of default by the VIE and an outstanding affiliate loan receivable for $766 million and $461 million held by us as at December 31, 2019 and 2018, respectively. |
| | 4 | At December 31, 2019, the maximum exposure to loss includes our portion of project construction costs. |
| | 5 | At December 31, 2019 and 2018, the maximum exposure to loss includes the remaining expected contributions to the joint venture. |
| | 6 | At December 31, 2019 and 2018, the maximum exposure to loss includes the portion of our parental guarantee that has been committed in project construction contracts for which we would be liable in the event of default by the VIE. |
| | 7 | At December 31, 2019 and 2018, the maximum exposure to loss includes the carrying value of an outstanding affiliate loan receivable for $92 million and $102 million held by us as at December 31, 2019 and 2018, respectively, in addition to us providing a credit facility for $105 million as at December 31, 2019. |
| | 8 | At December 31, 2019 and 2018, the maximum exposure to loss is limited to our equity investment as these companies are in operation and self-sustaining. |
| | 9 | As at December 31, 2018, the maximum exposure to loss includes the remaining expected contributions to the joint venture and parental guarantees for our portion of capacity lease agreements. |
We do not have an obligation to and did not provide any additional financial support to the VIEs during the years ended December 31, 2019 and 2018.
Gray Oak Holdings LLC
In December 2018, Enbridge acquired an effective 22.8% interest in the Gray Oak crude oil pipeline through acquisition of a 35% membership interest in Gray Oak Holdings LLC (Gray Oak Holdings), which operates the Gray Oak crude oil pipeline from Texas to the Gulf coast of the United States.
Gray Oak Holdings is a VIE as it does not have sufficient equity at risk to finance its activities and requires subordinated financial support from Enbridge and other partners. We have determined that we do not have the power to direct the activities of Gray Oak Holdings that most significantly impact its economic performance. Specifically, the power to direct the activities of the VIE is shared amongst the partners. Each partner has representatives that make up an executive committee that makes the significant decisions for the VIE and none of the partners may make significant decisions unilaterally. Therefore, the VIE is accounted for as an unconsolidated VIE.
NEXUS Gas Transmission, LLC
NEXUS is a joint venture that engages in transmission of natural gas received from Appalachian shale gas supplies to markets in the United States midwest, as well as Ontario, Canada was previously classified as a VIE.
The NEXUS pipeline construction was completed and the pipeline was placed into service in October 2018. After NEXUS received the last significant equity contribution, it became capable of financing its own operations without any additional subordinated financial support. As a result, it was concluded that NEXUS was no longer a VIE due to sufficient equity at risk to finance its activities.
Illinois Extension Pipeline Company, L.L.C.
Illinois Extension Pipeline Company, L.L.C. owns the Southern Access Extension Pipeline. It was previously classified as a VIE.
After Illinois Extension Pipeline Company, L.L.C. received the last significant equity contribution, it became capable of financing its own operations without any additional subordinated financial support. As a result, it was concluded that Illinois Extension Pipeline Company, L.L.C. was no longer a VIE due to sufficient equity at risk to finance its activities.
13. LONG-TERM INVESTMENTS
| | | | | | | | | | Ownership |
| |
| |
| | December 31, | Interest |
| 2019 |
| 2018 |
| | (millions of Canadian dollars) | |
| |
| |
| | EQUITY INVESTMENTS | |
| |
| |
| | Liquids Pipelines | |
| |
| |
| MarEn Bakken Company L.L.C.1 | 75.0 | % | 1,892 |
| 2,039 |
| Gray Oak Holdings L.L.C.2 | 35.0 | % | 463 |
| — |
| | Seaway Crude Pipeline System | 50.0 | % | 2,907 |
| 3,113 |
| Illinois Extension Pipeline Company, L.L.C.3 | 65.0 | % | 662 |
| 724 |
| | Other | 30.0% - 43.8% |
| 73 |
| 97 |
| | Gas Transmission and Midstream | | | | | Alliance Pipeline | 50.0 | % | 310 |
| 368 |
| | Aux Sable | 42.7% - 50.0% |
| 267 |
| 311 |
| | DCP Midstream, LLC | 50.0 | % | 2,193 |
| 2,368 |
| | Gulfstream Natural Gas System, L.L.C. | 50.0 | % | 1,213 |
| 1,289 |
| | NEXUS Gas Transmission, LLC | 50.0 | % | 1,778 |
| 1,757 |
| | Offshore - various joint ventures | 22.0% - 74.3% |
| 362 |
| 400 |
| | PennEast Pipeline Company LLC | 20.0 | % | 106 |
| 97 |
| | Sabal Trail Transmission, LLC | 50.0 | % | 1,533 |
| 1,586 |
| | Southeast Supply Header L.L.C. | 50.0 | % | 484 |
| 519 |
| | Steckman Ridge LP | 49.5 | % | 222 |
| 237 |
| | Vector Pipeline L.P. | 60.0 | % | 195 |
| 198 |
| | Other | 33.3% - 50.0% |
| 5 |
| 6 |
| | Gas Distribution and Storage | | | | | Noverco Common Shares | 38.9 | % | 95 |
| — |
| | Other | 50.0 | % | 14 |
| 15 |
| | Renewable Power Generation | | | | | Eolien Maritime France SAS | 50.0 | % | 67 |
| 68 |
| Enbridge Renewable Infrastructure Investments S.a.r.l.4 | 51.0 | % | 141 |
| 127 |
| | Rampion Offshore Wind Project | 24.9 | % | 600 |
| 638 |
| | Other | 21.0% - 50.0% |
| 127 |
| 72 |
| | Eliminations and Other | | | | | Other | 42.7% - 50% |
| 16 |
| 10 |
| | OTHER LONG-TERM INVESTMENTS | | | | | Gas Distribution and Storage | | | | | Noverco Preferred Shares | | 580 |
| 478 |
| | Renewable Power Generation | | | | | Emerging Technologies and Other | | 78 |
| 80 |
| | Eliminations and Other | | | | | Other | | 145 |
| 110 |
| | | |
| 16,528 |
| 16,707 |
|
| | 1 | Owns 49% interest in Bakken Pipeline Investments L.L.C., which owns 75% of the Bakken Pipeline System resulting in a 27.6% effective interest in the Bakken Pipeline System. |
| | 2 | In December 2018 we acquired an effective 22.8% interest in the Gray Oak crude oil pipeline through acquisition of a 35% membership interest in Gray Oak Holdings, L.L.C. (Note 12). |
| | 3 | Owns the Southern Access Extension Project. |
| | 4 | In 2018 we sold a 49% interest in the Hohe See Offshore wind facilities to CPPIB, reducing our effective interest in the project to 25.5%. |
Equity investments include the unamortized excess of the purchase price over the underlying net book value of the investees’ assets at the purchase date. As at December 31, 2019, this comprised of $2.1 billion in Goodwill and $681 million in amortizable assets. As at December 31, 2018, this comprised of $2.2 billion in Goodwill and $706 million in amortizable assets.
For the years ended December 31, 2019, 2018 and 2017, distributions received from equity investments were $2.2 billion, $2.8 billion and $1.4 billion, respectively.
Summarized combined financial information of our interest in unconsolidated equity investments (presented at 100%) is as follows:
| | | | | | | | | | | | | | | | | | | | | | Year Ended December 31, | | | 2019 | 2018 | 2017 | | | Seaway |
| Other |
| Total |
| Seaway |
| Other |
| Total |
| Seaway |
| Other |
| Total |
| | (millions of Canadian dollars) | | | | | | | | | | | Operating revenues | 1,252 |
| 14,435 |
| 15,687 |
| 966 |
| 18,251 |
| 19,217 |
| 959 |
| 15,254 |
| 16,213 |
| | Operating expenses | 428 |
| 12,725 |
| 13,153 |
| 212 |
| 15,422 |
| 15,634 |
| 286 |
| 12,911 |
| 13,197 |
| | Earnings | 818 |
| 2,198 |
| 3,016 |
| 646 |
| 2,308 |
| 2,954 |
| 672 |
| 2,056 |
| 2,728 |
| Earnings attributable to Enbridge
| 409 |
| 950 |
| 1,359 |
| 323 |
| 1,059 |
| 1,382 |
| 336 |
| 926 |
| 1,262 |
|
| | | | | | | | | | | | | | | | December 31, 2019 | December 31, 2018 | | | Seaway |
| Other |
| Total |
| Seaway |
| Other |
| Total |
| | (millions of Canadian dollars) | | | | | | | | Current assets | 107 |
| 2,374 |
| 2,481 |
| 113 |
| 3,176 |
| 3,289 |
| | Non-current assets | 3,404 |
| 45,538 |
| 48,942 |
| 3,585 |
| 45,531 |
| 49,116 |
| | Current liabilities | 136 |
| 3,911 |
| 4,047 |
| 123 |
| 5,413 |
| 5,536 |
| | Non-current liabilities | 45 |
| 18,081 |
| 18,126 |
| 16 |
| 15,859 |
| 15,875 |
| | Noncontrolling interests | — |
| 2,779 |
| 2,779 |
| — |
| 3,479 |
| 3,479 |
|
Noverco Inc.
As at December 31, 2019 and 2018, we owned an equity interest in Noverco through ownership of 38.9% of its common shares and an investment in preferred shares. The preferred shares are entitled to a cumulative preferred dividend based on the average yield of Government of Canada bonds maturing in 10 years plus a margin of 4.38%.
As at December 31, 2019 and 2018, Noverco owned an approximate 0.5% and 1.4% reciprocal shareholding in our common shares, respectively. Noverco sold 11.6 million common shares in January 2019 and 4.4 million common shares in December 2018. Shares purchased and sold were treated as treasury stock on the Consolidated Statements of Changes in Equity.
As a result of Noverco’s reciprocal shareholding in our common shares, as at December 31, 2019 and 2018, we had an indirect pro-rata interest of 0.2% and 0.5%, respectively, in our own shares. Both the equity investment in Noverco and shareholders’ equity have been reduced by the reciprocal shareholding of $51 million and $88 million as at December 31, 2019 and 2018. Noverco records dividends paid from us as dividend income and we eliminate these dividends from our equity earnings of Noverco. We record our pro-rata share of dividends paid by us to Noverco as a reduction of dividends paid and an increase in our investment in Noverco.
14. RESTRICTED LONG-TERM INVESTMENTS
Effective January 1, 2015, we began collecting and setting aside funds to cover future pipeline abandonment costs for all CER regulated pipelines as a result of the CER’s regulatory requirements under LMCI. The funds collected are held in trusts in accordance with the CER decision. The funds collected from shippers are reported within Transportation and other services revenues on the Consolidated Statements of Earnings and Restricted long-term investments on the Consolidated Statements of Financial Position. Concurrently, we reflect the future abandonment cost as an increase to Operating and administrative expense on the Consolidated Statements of Earnings and Other long-term liabilities on the Consolidated Statements of Financial Position.
We routinely invest excess cash and various restricted balances in securities such as commercial paper, bankers acceptances, corporate debt securities, Canadian equity securities, treasury bills and money market securities in the United States and Canada.
As at December 31, 2019 and 2018, we had restricted long-term investments held in trust and classified as available for sale or held to maturity of $434 million and $323 million, respectively. Within Other long-term liabilities we had estimated future abandonment costs related to LMCI of $454 million and $328 million as at December 31, 2019 and 2018, respectively.
15. INTANGIBLE ASSETS
The following table provides the weighted average amortization rate, gross carrying value, accumulated amortization and net carrying value for each of our major classes of intangible assets:
| | | | | | | | | | | | | | | Weighted Average |
| | |
| | Accumulated |
| | |
| December 31, 20191 | Amortization Rate |
| | Cost |
| | Amortization |
| | Net |
| | (millions of Canadian dollars) | |
| | |
| | |
| | |
| | Customer relationships | 5.4 | % | | 861 |
| | (231 | ) | | 630 |
| | Power purchase agreements | 4.5 | % | | 64 |
| | (16 | ) | | 48 |
| Project agreement2 | 4.0 | % | | 156 |
| | (16 | ) | | 140 |
| | Software | 11.2 | % | | 1,988 |
| | (1,014 | ) | | 974 |
| Other intangible assets3 | 2.9 | % | | 463 |
| | (82 | ) | | 381 |
| | | |
| | 3,532 |
| | (1,359 | ) | | 2,173 |
|
| | | | | | | | | | | | | | | Weighted Average |
| | |
| | Accumulated |
| | |
| December 31, 20181 | Amortization Rate |
| | Cost |
| | Amortization |
| | Net |
| | (millions of Canadian dollars) | |
| | |
| | |
| | |
| | Customer relationships | 5.7 | % | | 889 |
| | (187 | ) | | 702 |
| | Power purchase agreements | 5.4 | % | | 82 |
| | (15 | ) | | 67 |
| Project agreement2 | 4.0 | % | | 164 |
| | (10 | ) | | 154 |
| | Software | 10.0 | % | | 1,902 |
| | (875 | ) | | 1,027 |
| Other intangible assets3 | 2.0 | % | | 485 |
| | (63 | ) | | 422 |
| | | |
| | 3,522 |
| | (1,150 | ) | | 2,372 |
|
1 Certain assets were reclassified as held for sale as at December 31, 2019 and December 31, 2018 (Note 8).
2 Represents a project agreement acquired from the Merger Transaction (Note 8).
3 The measurement of weighted average amortization rate excludes non-depreciable intangible assets.
For the years ended December 31, 2019, 2018 and 2017, our amortization expense related to intangible assets totaled $296 million, $281 million and $280 million, respectively. The following table presents our expected amortization expense associated with existing intangible assets for the years indicated as follows:
| | | | | | | | | 2020 | 2021 | 2022 | 2023 | 2024 | Forecast of amortization expense (millions of Canadian dollars) | 292 | 263 | 238 | 216 | 195 |
16. GOODWILL
| | | | | | | | | | | | | | | | | | Liquids Pipelines |
| Gas
Transmission and Midstream |
| Gas
Distribution and Storage |
| Renewable Power Generation |
| Energy Services |
| Eliminations and Other |
| Consolidated |
| | (millions of Canadian dollars) | |
| |
| |
| |
| |
| |
| |
| | Gross Cost | | | | | | | | | Balance at January 1, 2018 | 7,786 |
| 21,539 |
| 5,679 |
| — |
| 2 |
| 13 |
| 35,019 |
| | Disposition | — |
| (628 | ) | — |
| — |
| — |
| — |
| (628 | ) | | Allocation to assets held for sale | — |
| (55 | ) | (133 | ) | — |
| — |
| — |
| (188 | ) | | Foreign exchange and other | 538 |
| 1,482 |
| (183 | ) | — |
| — |
| — |
| 1,837 |
| | Balance at December 31, 2018 | 8,324 |
| 22,338 |
| 5,363 |
| — |
| 2 |
| 13 |
| 36,040 |
| | Foreign exchange and other | (373 | ) | (933 | ) | — |
| — |
| — |
| — |
| (1,306 | ) | | Balance at December 31, 2019 | 7,951 |
| 21,405 |
| 5,363 |
| — |
| 2 |
| 13 |
| 34,734 |
| | Accumulated Impairment | | | | | | | | | Balance at January 1, 2018 | — |
| (542 | ) | (7 | ) | — |
| — |
| (13 | ) | (562 | ) | | Impairment | — |
| (1,019 | ) | — |
| — |
| — |
| — |
| (1,019 | ) | | Balance at December 31, 2018 | — |
| (1,561 | ) | (7 | ) | — |
| — |
| (13 | ) | (1,581 | ) | | Balance at December 31, 2019 | — |
| (1,561 | ) | (7 | ) | — |
| — |
| (13 | ) | (1,581 | ) | | Carrying Value | | | | | | | | | Balance at December 31, 2018 | 8,324 |
| 20,777 |
| 5,356 |
| — |
| 2 |
| — |
| 34,459 |
| | Balance at December 31, 2019 | 7,951 |
| 19,844 |
| 5,356 |
| — |
| 2 |
| — |
| 33,153 |
|
IMPAIRMENT
Gas Transmission and Midstream
Canadian Natural Gas Gathering and Processing Businesses
During the year ended December 31, 2018, we recorded a goodwill impairment charge of $1,019 million related to our Canadian Natural Gas Gathering and Processing Businesses assets which were classified as held for sale in the third quarter of 2018. The provincially regulated assets were subsequently sold in the fourth quarter of 2018 (Note 8). As these assets represented a portion of a reporting unit, we allocated a portion of the goodwill of the reporting unit to these assets using a relative fair value approach. In connection with the write-down of the carrying values of the assets held for sale to its sale price consideration less costs to sell, the related goodwill was impaired. We also performed a goodwill impairment test for the related reporting unit resulting in no additional impairment charge.
US Midstream
During the year ended December 31, 2017, we recorded a goodwill impairment charge of $102 million related to certain assets in our Gas Transmission and Midstream segment classified as held for sale (Note 8). Goodwill was allocated to certain disposal groups qualifying as a business based on a relative fair value approach. In connection with the write-down of the carrying values of the assets held for sale to its fair value less costs to sell, the related goodwill was impaired. The fair values of these assets were estimated using the discounted cash flow method, which was negatively impacted by a prolonged decline in commodity prices, and deteriorating business performance. We also performed goodwill impairment testingwere not intended to have a permanent impact on the associated gas midstream reporting unit resultingSMPP lifetime pensions. As indicated under “2021 changes” on page 33, NEO base salaries are to be reinstated in no additional impairment charge.2021.
|
Defined contribution plan
The defined contribution pension plan is anon-contributory
pension plan. The level of contribution varies, depending on age and years of service. None of the NEOs are currently participating in the defined contribution pension plan. Mr. Monaco, Mr. Gruending, Mr. Whelen and Mr. Yu participated in the defined contribution plan for three years, four years, four years and five years, respectively, prior to joining the SMPP. The values shown below reflect market value of assets of the defined contribution plan.
| | | | | | | | | | | | |
| | | |
| | Accumulated value at Jan 1,
2020
($) | | | | | | Accumulated value at Dec 31,
2020
($) | |
| | | |
| | | 72,413 | | | | - | | | | 77,811 | |
| | | |
| | | 79,400 | | | | - | | | | 82,499 | |
| | | |
| | | 79,579 | | | | - | | | | 83,086 | |
| | | |
| | | 79,916 | | | | - | | | | 84,966 | |
| The estimate ofcompensatory change is equal to contributions made by the gas midstream reporting unit’s fair value required the use of significant unobservable inputs representative of a Level 3 fair value measurement, including assumptionscompany during 2020. |
Enbridge’s savings plan and benefits plans are key elements of the total compensation package for our employees, including NEOs.
Enbridge provides a savings plan for Canadian employees and a 401(k) savings plan for U.S. employees. All NEOs participate in the savings plan on the same terms as eligible employees. The savings plans assist and encourage employees to save by matching 100% of employee contributions up to plan limits (maximum 2.5% and 6% of base salary for Canadian employees and U.S. employees, respectively) and subject to applicable tax limits. In Canada, matching contributions are provided as flex credits which may be used to purchase additional benefits or taken asafter-tax
cash; in the U.S., matching contributions are invested in the savings plan. Medical, dental, life insurance and disability insurance benefits are available to meet the specific needs of individuals and their families. The NEOs participate in the same plan as all other employees. The plans are structured to provide minimum basic coverage with the option of enhanced coverage at a level that is competitive and affordable.
The HRC Committee reviews the retirement and other benefits regularly. These benefits are a key element of a total compensation package and are designed to be competitive and reasonably meet the needs of executives in their current roles.
Enbridge’s compensation governance structure consists of the Board and the HRC Committee, with Mercer (Canada) Limited (“Mercer”), and others from time to time, providing independent advisory support to the HRC Committee. The HRC Committee reviews the governance structure annually against best practices and regulatory guidance.
The Board is responsible for the oversight of the compensation principles and programs at Enbridge. The HRC Committee approves major compensation programs and payouts, including reviewing and recommending the compensation for the President & CEO to the Board. The HRC Committee also approves the compensation for the other NEOs.
The HRC Committee assists the Board in carrying out its responsibilities with respect to compensation matters by providing oversight and direction on human resources strategy, policies and programs for the NEOs, senior
management and the broader employee base. This includes compensation, equity incentive plans, pension and benefits as well as talent management, succession planning, workforce recruitment, retention, diversity and inclusion, and employee health and safety in response to theCOVID-19
pandemic. The HRC Committee provides oversight regarding the management of broader people-related risk and, in addition, specifically reviews the compensation programs from a risk perspective. All members of the HRC Committee are independent under the independence standard discussed in this Amendment No. 1 on Form 10-K/A. The members of the HRC Committee are V. Maureen Kempston Darkes (chair), Pamela L. Carter, Marcel R. Coutu, Susan M. Cunningham and Gregory J. Goff.
The members of the HRC Committee have experience as members of the compensation committees of other public companies. In addition, the members of the HRC Committee have experience in top leadership roles, strong knowledge of the energy industry, experience as directors of other public companies, and a mix of other relevant skills and experience. This background provides the HRC Committee members with the collective experience, knowledge and skills to effectively carry out their responsibilities. For information on each HRC Committee member’s experience and current service on other public company boards and committees, see the director profiles, beginning on page 4. For information on each HRC Committee member’s skills and experience, see the skills and experience matrix on page 15. For information on each HRC Committee member’s participation on other Board committees, see page 14.
The HRC Committee is directly responsible for the appointment, compensation and oversight of the work of any compensation consultants, outside legal counsel or other advisors it retains (each, an “Advisor”). The HRC Committee may select or receive advice from an Advisor only after taking into consideration all factors relevant to the Advisor’s independence from management including:
the provision of other services to Enbridge by the Advisor;
the amount of fees received from Enbridge by the Advisor as a percentage of the Advisor’s total revenue;
the policies and procedures of the Advisor that are designed to prevent conflicts of interest;
any shares owned by the Advisor; and
any business or personal relationship of the Advisor with a member of the HRC Committee or with an executive officer at Enbridge.
Although the HRC Committee is required to consider these factors, it is free to select or receive advice from an Advisor that is not independent. The HRC Committee has determined that Mercer, as an Advisor, is independent.
Since 2002, Mercer, an independent Advisor, has provided guidance to the HRC Committee on compensation matters to ensure Enbridge’s programs are appropriate, market competitive and continue to meet intended goals. Advisory services include reviewing:
the competitiveness and appropriateness of executive compensation programs;
annual total direct compensation for the President & CEO and the executive leadership team;
executive compensation governance; and
the HRC Committee’s mandate and related Board committee processes.
While the HRC Committee considers the information and recommendations Mercer provides, it has full responsibility for its own decisions, which may reflect other factors and considerations.
The HRC Committee chair reviews and approves the terms of engagement with Mercer every year. The terms specify the work to be done in the year, Mercer’s responsibilities and its fees. Management can also retain Mercer on compensation matters from time to time or for prescribed compensation services. The HRC Committee chair must, however, approve all services that are not standard in nature, considering whether or not the work would compromise Mercer’s independence.
Management and the HRC Committee engaged Mercer in 2020 to provide analysis and advice on various compensation matters. The following table provides a breakdown of services provided by and fees paid to Mercer and its affiliates (a significant portion of which relate to risk brokerage service fees paid to Marsh Inc., a Mercer affiliate) by Enbridge and its affiliates in 2020 and 2019:
| | | | | | | | | | |
| | |
| | Approximate fees in 2020 ($) | | Approximate fees in 2019 ($) |
| | |
Executive compensation related fees 1 | | | | | | | | | | |
| | |
| | | | | | | | | | |
| | |
| | | | | | | | | | |
| Includes all fees related to executive compensation associated with the future performancePresident & CEO and the executive leadership team. |
| Includes fees paid for other matters that apply to Enbridge as a whole, such as pension actuarial valuations, renewal and pricing of the reporting unit.benefit plans, evaluation of geographic market differences and regulatory proceedings support. Also includes significant risk brokerage service fees paid to Marsh for services provided to our operating affiliates. |
Compensation services received by Enbridge from Advisors are not sole sourced from one provider; each situation and need is assessed independently, and other providers are used depending on the nature of the service required, and the qualifications of the provider. In 2020, Enbridge did not engage the services of other compensation consultants.
Compensation risk management
The HRC Committee oversees Enbridge’s compensation programs from the perspective of whether the programs encourage individuals to take inappropriate or excessive risks that are reasonably likely to have a material adverse impact on Enbridge.
Compensation risk mitigation practices
Enbridge uses the following compensation practices to mitigate risk:
aphilosophy that is embedded in the compensation design; a mix of pay programs benchmarked against a relevant peer group in terms of both relative proportion and prevalence;
a rigorous approach to goal setting and a process of establishing targets with multiple levels of performance, which mitigate excessive risk-taking that could harm Enbridge’s value or reward poor judgment of executives;
compensation programs that include a combination of short-, medium- and long-term elements that ensure executives are incentivized to consider both the immediate and long-term implications of their decisions;
program provisions where executives are compensated for their short-term performance using a combination of safety, system reliability, environmental, financial, and customer and employee metrics that ensure a balanced perspective and are a mix of both leading (proactive/preventative) and lagging (incident-based) indicators;
performance thresholds that include both minimum and maximum payouts;
stock award programs that vest over multiple years and are aligned with overall corporate performance that drives superior value to Enbridge shareholders;
share ownership guidelines that ensure executives have a meaningful equity stake in Enbridge to align their interests with those of Enbridge shareholders;
an anti-hedging policy to prevent activities that would weaken the intendedlink and alignment with Enbridge shareholders’ interests; and an incentive compensation clawback policy that allows Enbridge to recoup overpayments made to executives in the event of fraudulent or willful misconduct.
The HRC Committee has considered the concept of risk as it relates to the compensation programs and has concluded that the programs do not encourage excessive or inappropriate risk-taking and are aligned with the long-term interests of shareholders.
Enbridge’s insider trading and reporting guidelines, among other things, prohibit directors, officers, employees and contractors (of Enbridge and its subsidiaries) from purchasing financial instruments that are designed to hedge or offset a decrease in market value of equity securities granted as compensation or held by the NEO, as such positions delink the intended alignment of employee and shareholder interests. The following activities are specifically prohibited:
any form of hedging activity;
any form of transaction involving stock options (other than exercising options in accordance with the incentive plans);
any other form of derivative trading (including “puts” and “calls”); and
“short-selling” (selling securities that the individual does not own).
The incentive compensation clawback policy allows Enbridge to recover, from current and former executives, certain incentive compensation amounts awarded or paid to individuals if the individuals engaged in fraud or willful misconduct that led to inaccurate financial results reporting, regardless of whether the misconduct resulted in a restatement of all or a part of Enbridge’s financial statements.
Annual decision-making process
The HRC Committee reviews and approves the compensation plans and pay levels for all the NEOs except the President & CEO. The HRC Committee reviews and recommends the compensation plans and pay level for the President & CEO to the Board.
The chart below shows the process by which compensation decisions are made.
Total direct compensation for the NEOs is managed within a framework that involves input from and consideration by the President & CEO and the HRC Committee, with Mercer providing independent advisory support. The competitiveness of this framework is based on peer group market data extracted from third-party compensation surveys and publicly disclosed executive compensation information for comparable benchmark roles at peer companies. The market data is considered from several perspectives including organization size and industry sector (pipeline, energy and utility criteria).
As the responsibilities of Enbridge’s NEOs are primarily North American in scope, a North American peer group is determined and used for executive compensation benchmarking.
The following outlines Enbridge’s compensation benchmarking peer group determination criteria:
Industry (typically defined aslow-risk
regulated operations in the energy sector) remains a key criterion for identifying peers, as that will help to ensure Enbridge can pay competitively againstcompanies whose executives are often the most knowledgeable about Enbridge’s core businesses. Size/complexity remains important but is more broadly defined to consider multiple dimensions, including
DISPOSITIONS
| | In 2018, we derecognized $262 millionfinancial (e.g., market capitalization, cash flow, capital employed) and nonfinancial measures (e.g., geography and breadth of goodwill on the disposition of Midcoast Operating, L.P. and its subsidiaries and $366 million on the disposition of the provincially regulated facilities of our operations). |
Geography is not a major factor; in particular, Enbridge believes it is less important to focus on Canadian companies if they are not sufficiently comparable to Enbridge in terms of industry and/or size/complexity.
Based on these criteria, Enbridge uses a single peer group of Canadian and U.S. companies to reflect Enbridge’s identity as a North American leader that happens to be based in Canada. Our peer group of energy and infrastructure companies is weighted heavily towards the U.S. as the U.S. market offers more comparable peers from an industry and/or size/complexity perspective. It is important to note that Enbridge limits the peer group to those in the energy and infrastructure space, rather than extending to other capital-intensive sectors, as these companies are subject to the same external industry pressures and macroeconomic factors as Enbridge.
Our peer group contains companies that are generally similar in size to Enbridge, primarily in terms of enterprise value, and secondarily market capitalization and assets; size constraints were relaxed in certain instances to include those similar to Enbridge in terms of operational profile.
Enbridge’s compensation benchmarking peer group is reviewed annually by the HRC Committee. The peer group used for determining compensation in 2020 was unchanged from 2019.
| | |
| |
2020 compensation peer group | | |
| |
Canadian National Railway Company | | NextEra Energy Inc. |
| |
Canadian Natural Gas Gathering and Processing Business (Note 8).Resources Limited
ACQUISITIONS
In 2017, we recognized $36.7 billion of goodwill on the Merger Transaction (Note 8).
17. ACCOUNTS PAYABLE AND OTHER
| | Occidental Petroleum Corporation |
| |
| | | | | | | December 31, | 2019 |
| 2018 |
| | (millions of Canadian dollars) | | | | Trade payables and operating accrued liabilities | 4,536 |
| 4,604 |
| | Construction payables and contractor holdbacks | 804 |
| 804 |
| | Current derivative liabilities | 920 |
| 1,234 |
| | Dividends payable | 1,678 |
| 1,539 |
| | Taxes payable | 890 |
| 801 |
| | Current deferred credits | 652 |
| 850 |
| | Other | 583 |
| 31 |
| | | 10,063 |
| 9,863 |
|
18. DEBT
On January 22, 2019, Enbridge entered into supplemental indentures with its wholly-owned subsidiaries, SEP and EEP (together, the Partnerships), pursuant to which Enbridge fully and unconditionally guaranteed, on a senior unsecured basis, the payment obligations of the Partnerships with respect to the outstanding series of notes issued under the respective indentures of the Partnerships. Concurrently, the Partnerships entered into a subsidiary guarantee agreement pursuant to which they fully and unconditionally guaranteed, on a senior unsecured basis, the outstanding series of senior notes of Enbridge. See Note 32 - Condensed Consolidating Financial Information for further discussion.
| | Phillips 66 |
| |
| | | | | | | | | | | | | | Weighted Average |
| | | | |
| | |
| | December 31, | Interest Rate22 |
| | Maturity | | 2019 |
| | 2018 |
| | (millions of Canadian dollars) | |
| | | | |
| | |
| | Enbridge Inc. | |
| | | | |
| | |
| United States dollar senior notes1 | 3.8 | % | | 2022-2049 | | 8,689 |
| | 6,419 |
| | Medium-term notes | 4.2 | % | | 2020-2064 | | 7,623 |
| | 7,323 |
| Fixed-to-floating rate subordinated term notes2,3 | 5.9 | % | | 2077-2078 | | 6,550 |
| | 6,771 |
| Floating rate notes4 |
|
| | 2020 | | 1,556 |
| | 2,389 |
| Commercial paper and credit facility draws5 | 1.9 | % | | 2021-2024 | | 5,210 |
| | 1,999 |
| Other6 | |
| | | | 5 |
| | 4 |
| | Enbridge (U.S.) Inc. | |
| | | | | | | Commercial paper and credit facility draws7 | 2.1 | % | | 2021-2024 | | 1,734 |
| | 1,065 |
| | Enbridge Energy Partners, L.P. | |
| | | | | | | Senior notes8 | 6.0 | % | | 2021-2045 | | 3,955 |
| | 6,214 |
| Junior subordinated notes9 | | | | | — |
| | 546 |
| Commercial paper and credit facility draws10 | | | | | — |
| | 1,044 |
| Enbridge Gas Distribution Inc.11 | |
| | | | | | | | Medium-term notes |
|
| |
| | — |
| | 3,695 |
| | Debentures |
|
| |
| | — |
| | 85 |
| | Commercial paper and credit facility draws |
|
| |
| | — |
| | 750 |
| Enbridge Gas Inc.11 | | | | | | | | | Medium-term notes | 4.2 | % | | 2020-2050 | | 7,685 |
| | — |
| | Debentures | 9.1 | % | | 2024-2025 | | 210 |
| | — |
| | Commercial paper and credit facility draws | 2.0 | % | | 2021 | | 898 |
| | — |
| | Enbridge Pipelines (Southern Lights) L.L.C. | |
| | | | | | | Senior notes12 | 4.0 | % | | 2040 | | 1,129 |
| | 1,257 |
| | Enbridge Pipelines Inc. | |
| | | | | | | Medium-term notes13 | 4.2 | % | | 2020-2049 | | 5,125 |
| | 4,225 |
| | Debentures | 8.2 | % | | 2024 | | 200 |
| | 200 |
| Commercial paper and credit facility draws14 | 2.0 | % | | 2021 | | 2,030 |
| | 2,200 |
| | Enbridge Southern Lights LP | |
| | | | | | | | Senior notes | 4.0 | % | | 2040 | | 272 |
| | 289 |
| | Spectra Energy Capital, LLC | | | | | | | | Senior notes15 | 7.1 | % | | 2032-2038 | | 224 |
| | 236 |
| | Spectra Energy Partners, LP | | | | | | | | Senior secured notes16 | 6.1 | % | | 2020 | | 143 |
| | 150 |
| Senior notes17 | 4.2 | % | | 2020-2048 | | 8,481 |
| | 8,249 |
| Floating rate notes18 |
|
| | 2020 | | 519 |
| | 546 |
| Commercial paper and credit facility draws19 | | | | | — |
| | 2,065 |
| Union Gas Limited11 | | | | | | | | | Medium-term notes |
|
| |
| | — |
| | 3,290 |
| | Debentures |
|
| |
| | — |
| | 125 |
| | Commercial paper and credit facility draws |
|
| |
| | — |
| | 275 |
| | Westcoast Energy Inc. | | | | | | | | | Senior secured notes |
|
| |
| | — |
| | 33 |
| | Medium-term notes | 4.5 | % | | 2020-2041 | | 1,875 |
| | 2,175 |
| | Debentures | 8.6 | % | | 2020-2026 | | 375 |
| | 375 |
| | Fair value adjustment - Merger Transaction | | | | | 844 |
| | 964 |
| Other20 | |
| | | | (369 | ) | | (348 | ) | | Total debt | |
| | | | 64,963 |
| | 64,610 |
| | Current maturities | |
| | | | (4,404 | ) | | (3,259 | ) | Short-term borrowings21 | |
| | | | (898 | ) | | (1,024 | ) | | Long-term debt | |
| | | | 59,661 |
| | 60,327 |
|
| | 1 | 2019 - US$6,700 million; 2018 - US$4,700 million. | | Schlumberger Limited |
| | 2 | 2019 - $2,400 million and US$3,200 million; 2018 - $2,400 million and US$3,200 million. For the initial 10 years, the notes carry a fixed interest rate. Subsequently, the interest rate will be floating and set to equal the Canadian Dollar Offered Rate (CDOR) or the London Interbank Offered Rate (LIBOR) plus a margin. |
| | 3 | The notes would be converted automatically into Conversion Preference Shares in the event of bankruptcy and related events. | | | Suncor Energy Inc. |
| | 4 | 2019 - US$1,200 million; 2018 - $750 million and US$1,200 million. Carries an interest rate equal to the three-month Bankers' Acceptance Rate plus a margin of 59 basis points or LIBOR plus a margin of 40 or 70 basis points. |
| | 5 | 2019 - $5,210 million; 2018 - $1,906 million and US$69 million. | | | The Southern Company |
| | 6 | Primarily capital lease obligations. |
| | 7 | 2019 - US$1,337 million; 2018 - US$780 million. | Energy Transfer Partners, L.P. | | The Williams Companies Inc. |
| | 8 | 2019 - US$3,050 million; 2018 - US$4,550 million. |
|
Enterprise Products LP | | 9 | 2018 - US$400 million. | | TC Energy Corporation |
| | 11 | Reflects the amalgamation of EGD and Union Gas into Enbridge Gas Inc. | | Union Pacific Corporation | |
| | 12 | 2019 - US$871 million; 2018 - US$920 million. |
| | 13 | Included in medium-term notes is $100 million with a maturity date of 2112. |
| | 14 | 2019 - $1,570 million and US$355 million; 2018 - $1,905 million and US$216 million. |
| | 15 | 2019 - US$173 million; 2018 - US$173 million. |
| | 16 | 2019 - US$110 million; 2018 - US$110 million. |
| | 17 | 2019 - US$6,540 million; 2018 - US$6,040 million. |
| | 18 | 2019 - US$400 million; 2018 - US$400 million. Carries an interest rate equal to the three-month LIBOR plus a margin of 70 basis points. |
| | 19 | 2018 - US$1,512 million. |
| | 20 | Primarily unamortized discounts and debt issuance costs. |
| | 21 | Weighted average interest rates on outstanding commercial paper were 2.0% as at December 31, 2019 (2018 - 2.3%).
|
| | 22 | Calculated based on term notes and commercial paper and credit facility draws balances outstanding as at December 31, 2019.
|
SECURED DEBT
Senior secured notes, totaling $143 million as at December 31, 2019, include project financings for the Express-Platte System. Express-Platte System notes payable are secured by the assignment of the Express-Platte System transportation receivables and by the Canadian portion of the Express-Platte pipeline system assets.
CREDIT FACILITIES
The following table provides details of our committed credit facilities as at December 31, 2019:
| | | | | | | | | | | | Total |
| |
| |
| | | Maturity | Facilities |
| Draws1 |
| Available |
| | (millions of Canadian dollars) | | |
| |
| |
| | Enbridge Inc. | 2021-2024 | 6,993 |
| 5,210 |
| 1,783 |
| | Enbridge (U.S.) Inc. | 2021-2024 | 7,132 |
| 1,734 |
| 5,398 |
| | Enbridge Pipelines Inc. | 20212 | 3,000 |
| 2,030 |
| 970 |
| | Enbridge Gas Inc. | 20212 | 2,000 |
| 898 |
| 1,102 |
| | Total committed credit facilities | | 19,125 |
| 9,872 |
| 9,253 |
|
| | 1 | Includes facility draws and commercial paper issuances that are back-stopped by the credit facility. |
| | 2 | Maturity date is inclusive of the one year term out option. |
On February 7, 2019 and February 8, 2019, we terminated certain Canadian and United States dollar credit facilities, including facilities held by Enbridge, Enbridge Gas, EEP and SEP. We also increased existing facilities or obtained new facilities to replace the terminated ones under Enbridge, Enbridge (U.S.) Inc. and Enbridge Gas. As a result, our total credit facility availability increased by approximately $444 million.
On May 16, 2019, Enbridge Inc. entered into a three year, non-revolving, extendible credit facility for $641 million (¥52.5 billion) with a syndicate of Japanese banks.
On July 18, 2019, Enbridge Inc. entered into a five year, non-revolving, bilateral credit facility for $500 million with an Asian bank.
In addition to the committed credit facilities noted above, we maintain $916 million of uncommitted demand credit facilities, of which $476 million were unutilized as at December 31, 2019. As at December 31, 2018, we had $807 million of uncommitted credit facilities, of which $548 million were unutilized.
Our credit facilities carry a weighted average standby fee of 0.1% per annum on the unused portion and draws bear interest at market rates. Certain credit facilities serve as a back-stop to the commercial paper programs and we have the option to extend such facilities, which are currently scheduled to mature from 2021 to 2024.
As at December 31, 2019 and 2018, commercial paper and credit facility draws, net of short-term borrowings and non-revolving credit facilities that mature within one year, of $8,974 million and $7,967 million, respectively, are supported by the availability of long-term committed credit facilities and therefore have been classified as long-term debt.
LONG-TERM DEBT ISSUANCES
During the years ended December 31, 2019 and 2018, we completed the following long-term debt issuances, excluding the debt exchange discussed below:
| | | | | | | | Company | Issue Date | | | Principal Amount |
| (millions of Canadian dollars unless otherwise stated) | | | Enbridge Inc. |
|
| |
| October 2019 | 2.99% medium-term notes due October 2029 |
| $1,000 |
|
| November 2019 | 2.50% senior notes due July 2025 | US$500 |
|
| November 2019 | 3.13% senior notes due November 2029 | US$1,000 |
|
| November 2019 | 4.00% senior notes due November 2049 | US$500 |
|
| March 2018 | Fixed-to-floating rate subordinated notes due March 20781
| US$850 |
|
| April 2018 | Fixed-to-floating rate subordinated notes due April 20782
|
| $750 |
|
| April 2018 | Fixed-to-floating rate subordinated notes due April 20783
| US$600 |
| Enbridge Gas Inc. |
|
| |
| August 2019 | 2.37% medium-term notes due August 2029 |
| $400 |
|
| August 2019 | 3.01% medium-term notes due August 2049 |
| $300 |
| Enbridge Pipelines Inc. |
|
| |
| February 2019 | 3.52% medium-term notes due February 2029 |
| $600 |
|
| February 2019 | 4.33% medium-term notes due February 2049 |
| $600 |
| Spectra Energy Partners, LP
|
|
| |
| August 2019 | 3.24% senior notes due August 20294
| US$500 |
|
| January 2018 | 3.50% senior notes due January 20285
| US$400 |
|
| January 2018 | 4.15% senior notes due January 20485
| US$400 |
|
| | 1 | Notes mature in 60 years and are callable on or after year 10. For the initial 10 years, the notes carry a fixed interest rate of 6.25%. Subsequently, the interest rate will be set to equal the three-month LIBOR plus a margin of 364 basis points from years 10 to 30, and a margin of 439 basis points from years 30 to 60. |
| | 2 | Notes mature in 60 years and are callable on or after year 10. For the initial 10 years, the notes carry a fixed interest rate of 6.625%. Subsequently, the interest rate will be set to equal CDOR plus a margin of 432 basis points from years 10 to 30, and a margin of 507 basis points from years 30 to 60. |
| | 3 | Notes mature in 60 years and are callable on or after year five. For the initial five years, the notes carry a fixed interest rate of 6.375%. Subsequently, the interest rate will be set to equal the three-month LIBOR plus a margin of 359 basis points from years five to 10, a margin of 384 basis points from years 10 to 25, and a margin of 459 basis points from years 25 to 60. |
| | 4 | Issued through Algonquin Gas Transmission, LLC, an operating subsidiary of SEP. |
| | 5 | Issued through Texas Eastern, a wholly-owned operating subsidiary of SEP. |
LONG-TERM DEBT REPAYMENTS
During the years ended December 31, 2019 and 2018, we completed the following long-term debt repayments, excluding the debt exchange discussed below:
| | | | | | | | | | Company | Retirement/Repayment Date |
|
| Principal Amount |
| Cash Consideration1
|
| (millions of Canadian dollars unless otherwise stated) |
| | | Enbridge Inc. |
|
| | | Repayment |
|
| | |
| February 2019 | 4.10% medium-term notes |
| $300 |
| |
| May 2019 | Floating rate notes |
| $750 |
| |
| September 2019 | 4.77% medium-term notes |
| $400 |
| | Enbridge Energy Partners, L.P.
|
| | | Redemption |
| | |
| February 2019 | 8.05% fixed/floating rate junior subordinated notes due 2067 | US$400 |
| |
| December 2019 | 5.20% senior notes due 2020 | US$500 |
| US$504 |
|
| December 2019 | 4.38% senior notes due 2020 | US$500 |
| US$509 |
| Repayment |
| | |
| March 2019 | 9.88% senior notes | US$500 |
| |
| April 2018 | 6.50% senior notes | US$400 |
| |
| October 2018 | 7.00% senior notes | US$100 |
| | Enbridge Income Fund
|
|
| | | Repayment |
|
| | |
| December 2018 | 4.00% medium-term notes |
| $125 |
| | Enbridge Pipelines (Southern Lights) L.L.C. |
| | | Repayment |
| | |
| June and December 2019 | 3.98% senior notes due 2040 | US$49 |
| |
| June and December 2018 | 3.98% senior notes due 2040 | US$43 |
| | Enbridge Pipelines Inc. |
| | | Repayment |
| | |
| November 2019 | 4.49% medium-term notes |
| $200 |
| |
| November 2019 | 4.49% medium-term notes |
| $100 |
| |
| November 2018 | 6.62% medium-term notes |
| $170 |
| |
| November 2018 | 6.62% medium-term notes |
| $130 |
| | Enbridge Southern Lights LP
|
| | | Repayment |
| | |
| July and December 2019 | 4.01% senior notes due 2040 |
| $17 |
| |
| January, July and December 2018 | 4.01% senior notes due 2040 |
| $27 |
| | Midcoast Energy Partners, L.P. |
|
| | | Redemption |
|
| | |
| July 20182
| 3.56% senior notes due 2019 | US$75 |
| US$76 |
|
| July 20182
| 4.04% senior notes due 2021 | US$175 |
| US$182 |
|
| July 20182
| 4.42% senior notes due 2024 | US$150 |
| US$161 |
| Spectra Energy Capital, LLC |
|
| | | Repurchase via Tender Offer |
| | |
| March 20182
| 6.75% senior unsecured notes due 2032 | US$64 |
| US$80 |
|
| March 20182
| 7.50% senior unsecured notes due 2038 | US$43 |
| US$59 |
| Redemption |
|
| | |
| March 20182
| 5.65% senior unsecured notes due 2020 | US$163 |
| US$172 |
|
| March 20182
| 3.30% senior unsecured notes due 2023 | US$498 |
| US$508 |
| Repayment |
|
| | |
| April 2018 | 6.20% senior notes | US$272 |
| |
| July 2018 | 6.75% senior notes | US$118 |
| | Spectra Energy Partners, LP |
|
| | | Repayment |
|
| | |
| September 2018 | 2.95% senior notes | US$500 |
| |
|
|
|
| | |
Setting compensation targets | | | | | | | | | | Union Gas Limited |
|
| | | Repayment |
|
| | |
| April 2018 | 5.35% medium-term notes |
| $200 |
| |
| August 2018 | 8.75% debentures |
| $125 |
| |
| October 2018 | 8.65% senior debentures |
| $75 |
| | Westcoast Energy Inc. |
|
| | | Repayment |
|
| | |
| January 2019 | 5.60% medium-term notes |
| $250 |
| |
| January 2019 | 5.60% medium-term notes |
| $50 |
| |
| May and November 2019 | 6.90% senior secured notes |
| $26 |
| |
| May and November 2019 | 4.34% senior secured notes |
| $5 |
| |
| December 2019 | 1.00% senior secured notes |
| $2 |
| |
| May and November 2018 | 6.90% senior secured notes due 2019 |
| $26 |
| |
| May and November 2018 | 4.34% senior secured notes due 2019 |
| $9 |
| |
| September 2018 | 8.50% debentures |
| $150 |
| |
Enbridge targets overall total direct compensation at the median (including the President & CEO position), considering the skills, competencies and experience of each senior executive. It is important for the NEOs to have a meaningful equity stake in Enbridge. Owning Enbridge shares is a tangible way to align the interests of executives with those of Enbridge shareholders. Executives can acquire Enbridge shares by participating in the employee savings plan, exercising stock options or by making personal investments in Enbridge shares. Personal holdings, and Enbridge shares held in the name of a spouse, dependent child or trust, all count toward meeting the guidelines. PSUs, unvested RSUs and unexercised stock options do not count toward meeting the guidelines (resulting in a more stringent threshold than typical practice).
The share ownership requirement is six times base salary for the President & CEO and three times base salary for the other NEOs. The NEOs have until January 1, 2022 to comply with their increased target, with the exception of Mr. Gruending who has four years from his appointment to Executive Vice President & CFO. All have already met or exceeded the requirement, as noted in the following graph. Target and actual share ownership as of December 31, 2020
Executive compensation tables and other compensation disclosures 2020 summary compensation table The table below shows the total amounts that Enbridge and its subsidiaries paid and granted to the NEOs for the years ended December 31, 2020, 2019 and 2018. Amounts represented below for Mr. Yardley were originally paid in U.S. dollars and have been converted to Canadian dollars using the published WM/Reuters 4 pm Londonyear-end exchange rate of US$1 = C$1.2740, US$1 = C$1.2967, and US$1 = C$1.3657 for 2020, 2019 and 2018, respectively. | | | | | | | | | | | | | | | | | | | | | | | | | | | | | | | | | | | | | | | | | | | | | | | | | | | | | | | | | | | | | | | | All other compen- sation 6 ($) | | | | | | | | | | | | President & Chief Executive Officer | | | | 2020 | | | | | 1,546,139 | | | | | 8,475,960 | | | | | 2,303,250 | | | | | 3,205,919 | | | | | 1,462,000 | | | | | 61,568 | | | | | 17,054,836 | | | | | 2019 | | | | | 1,592,878 | | | | | 6,129,560 | | | | | 3,327,732 | | | | | 3,687,712 | | | | | 3,195,000 | | | | | 60,502 | | | | | 17,993,384 | | | | | 2018 | | | | | 1,479,450 | | | | | 4,439,868 | | | | | 2,777,446 | | | | | 3,473,453 | | | | | 1,141,000 | | | | | 68,509 | | | | | 13,379,726 | | | | | | | | | | | Executive Vice President & Chief Financial Officer | | | | 2020 | | | | | 587,074 | | | | | 1,680,385 | | | | | 456,525 | | | | | 761,904 | | | | | 1,017,000 | | | | | 12,032 | | | | | 4,514,919 | | | | | 2019 | | | | | 467,122 | | | | | 1,225,912 | | | | | 316,315 | | | | | 583,360 | | | | | 1,498,000 | | | | | 25,460 | | | | | 4,116,169 | | | | | 2018 | | | | | 361,656 | | | | | 496,675 | | | | | 172,549 | | | | | 338,078 | | | | | 421,000 | | | | | 231,272 | | | | | 2,021,230 | | | | | | | | | | | Former Executive Vice President | | | | 2020 | | | | | 542,492 | | | | | 2,052,101 | | | | | 557,550 | | | | | 690,766 | | | | | 525,000 | | | | | 73,105 | | | | | 4,441,015 | | | | | 2019 | | | | | 635,849 | | | | | 1,604,385 | | | | | 870,883 | | | | | 821,199 | | | | | 645,000 | | | | | 17,568 | | | | | 4,594,884 | | | | | 2018 | | | | | 619,500 | | | | | 1,244,477 | | | | | 758,499 | | | | | 886,132 | | | | | 126,000 | | | | | 33,466 | | | | | 3,668,074 | | | | | | | | | | | Executive Vice President & President, Gas Transmission & Midstream | | | | 2020 | | | | | 700,018 | | | | | 2,320,853 | | | | | 598,335 | | | | | 849,262 | | | | | 396,000 | | | | | 32,065 | | | | | 4,896,533 | | | | | 2019 | | | | | 732,029 | | | | | 3,828,546 | | | | | 1,069,747 | | | | | 767,701 | | | | | 351,400 | | | | | 32,993 | | | | | 6,782,416 | | | | | 2018 | | | | | 751,161 | | | | | 1,570,650 | | | | | 847,539 | | | | | 968,697 | | | | | 359,000 | | | | | 32,958 | | | | | 4,530,005 | | | | | | | | | | | Executive Vice President & President, Liquids Pipelines | | | | 2020 | | | | | 616,801 | | | | | 1,821,821 | | | | | 495,038 | | | | | 703,893 | | | | | 1,177,000 | | | | | 22,579 | | | | | 4,837,131 | | | | | 2019 | | | | | 564,541 | | | | | 1,424,276 | | | | | 773,196 | | | | | 711,996 | | | | | 1,478,000 | | | | | 22,648 | | | | | 4,974,657 | | | | | 2018 | | | | | 450,000 | | | | | 723,196 | | | | | 440,752 | | | | | 900,000 | | | | | 122,000 | | | | | 29,030 | | | | | 2,664,978 | | | | | | | | | | | Executive Vice President & Chief Legal Officer | | | | 2020 | | | | | 557,394 | | | | | 1,593,583 | | | | | 433,163 | | | | | 634,091 | | | | | 349,000 | | | | | 18,167 | | | | | 3,585,397 | | | | | 2019 | | | | | 564,541 | | | | | 1,139,225 | | | | | 618,565 | | | | | 689,992 | | | | | 286,000 | | | | | 10,283 | | | | | 3,308,606 | | | | | 2018 | | | | | 550,000 | | | | | 883,759 | | | | | 538,734 | | | | | 729,299 | | | | | 236,000 | | | | | 20,742 | | | | | 2,958,534 | |
| | 1 | Cash consideration disclosed for repayments where the cash paid differs from the principal amount. |
| | 2 | The loss on debt extinguishment of $64 million (US$50 million), net of the fair value adjustment recorded upon completion of the Merger Transaction, was reported within Interest expense in the Consolidated Statements of Earnings. |
DEBT EXCHANGE
On December 21, 2018, Enbridge and the Fund completed a transaction to exchange certain series of the Legacy Fund Notes for an equal principal amount of newly issued medium-term notes of Enbridge, having financial terms that are the same as the financial terms of the Fund Notes.
DEBT COVENANTS
Our credit facility agreements and term debt indentures include standard events of default and covenant provisions whereby accelerated repayment and/or termination of the agreements may result if we were to default on payment or violate certain covenants. As at December 31, 2019, we were in compliance with all debt covenants.
INTEREST EXPENSE
| | | | | | | | | Year ended December 31, | 2019 |
| 2018 |
| 2017 |
| | (millions of Canadian dollars) | |
| |
| |
| | Debentures and term notes | 2,783 |
| 3,011 |
| 3,011 |
| | Commercial paper and credit facility draws | 273 |
| 171 |
| 206 |
| | Amortization of fair value adjustment - Spectra Energy acquisition | (67 | ) | (131 | ) | (270 | ) | | Capitalized | (326 | ) | (348 | ) | (391 | ) | | | 2,663 |
| 2,703 |
| 2,556 |
|
19. ASSET RETIREMENT OBLIGATIONS
Our ARO relate mostly to the retirement of pipelines, renewable power generation assets, obligations related to right-of way agreements and contractual leases for land use.
The liability for the expected cash flows as recognized in the financial statements reflected discount rates ranging from 1.8% to 9.0%.
A reconciliation of movements in our ARO liabilities is as follows:
| | | | | | | | December 31, | 2019 |
| 2018 |
| | (millions of Canadian dollars) | | | | Obligations at beginning of year | 989 |
| 793 |
| | Liabilities acquired | — |
| — |
| | Liabilities disposed | (59 | ) | (13 | ) | | Liabilities incurred | 15 |
| 145 |
| | Liabilities settled | (12 | ) | (21 | ) | | Change in estimate and other | (417 | ) | 29 |
| | Foreign currency translation adjustment | (18 | ) | 22 |
| | Accretion expense | 22 |
| 34 |
| | Obligations at end of year | 520 |
| 989 |
| | Presented as follows: | | | | Accounts payable and other | 7 |
| 6 |
| | Other long-term liabilities | 513 |
| 983 |
| | | 520 |
| 989 |
|
20. NONCONTROLLING INTERESTS
NONCONTROLLING INTERESTS
The following table provides additional information regarding Noncontrolling interests as presented in our Consolidated Statements of Financial Position:
| | | | | | | December 31, | 2019 |
| 2018 |
| | (millions of Canadian dollars) | | | | Algonquin Gas Transmission, L.L.C | 394 |
| 518 |
| | Maritimes & Northeast Pipeline, L.L.C | 579 |
| 613 |
| Renewable energy assets1 | 1,864 |
| 1,961 |
| Westcoast Energy Inc.2 | 527 |
| 841 |
| | Other | — |
| 32 |
| | | 3,364 |
| 3,965 |
|
| | 1 | On August 1, 2018, we closed the sale of 49% of our interest in the Renewable Assets (Note 8). The remaining balance represents the tax equity investors' interests in Magic Valley, Wildcat, Keechi, New Creek and Chapman Ranch wind facilities, with an additional 20.0% noncontrolling interest in each of the Magic Valley and Wildcat wind facilities held by third parties as at December 31, 2019 and 2018. |
| | 2 | Represents the 16.6 million cumulative redeemable preferred shares as at December 31, 2019 and 2018, nil and 12 million cumulative first preferred shares as at December 31, 2019 and 2018, respectively, held by third parties in Westcoast Energy Inc., in addition to the 22.2% interest in Maritimes & Northeast Pipeline Limited Partnership held by third parties as at December 31, 2019 and 2018. |
United States Sponsored Vehicles Buy-in
On August 24, 2018, we entered into a definitive agreement with SEP under which we agreed to acquire all of the outstanding public common units of SEP not already owned by us or our subsidiaries on the basis of 1.111 of our common shares for each common unit of SEP. Upon the closing of the transaction on December 17, 2018, we acquired all of the public common units of SEP and SEP became an indirect, wholly-owned subsidiary of Enbridge. The transaction is valued at $3.9 billion based on the closing price of our common shares on the New York Stock Exchange on December 14, 2018. As a result of this buy-in, we recorded a decrease in Noncontrolling interests, Additional paid-in capital and Deferred income tax liabilities of $3.0 billion, $642 million and $167 million, respectively.
On September 17, 2018, we entered into definitive agreements with each of EEP and EEM under which we agreed to acquire all of the outstanding public class A common units of EEP and all of the outstanding public listed shares of EEM not already owned by us or our subsidiaries. Under the agreements, EEP public unitholders received 0.335 of our common shares for each class A common unit of EEP, and EEM public shareholders received 0.335 of our common shares for each listed share of EEM. Upon the closing of the respective transactions on December 20, 2018, we acquired all of the public Class A common units of EEP and shares of EEM, and both EEP and EEM became indirect, wholly-owned subsidiaries of Enbridge. The EEP and EEM transactions are valued at $3.0 billion and $1.3 billion, respectively, based on the closing price of our common shares on the New York Stock Exchange on December 19, 2018. As a result of the buy-ins, collectedly for EEP and EEM, we recorded an increase in Noncontrolling interests and a decrease in Additional paid-in capital and Deferred income tax liabilities of $185 million, $3.7 billion and $707 million, respectively.
For discussion on the roll-up of ENF, refer to CanadianSponsored Vehicles Buy-in under Redeemable Noncontrolling Interests below.
Renewable Assets
On August 1, 2018, we closed the sale of a 49% interest in all of our Canadian renewable assets and a 49% interest in two United States renewable assets to CPPIB (Note 8). As a result, we recorded an increase in Noncontrolling interests, Additional paid-in capital and Deferred income tax liabilities of $1,183 million, $79 million and $27 million, respectively, in the third quarter of 2018. For 2018 and 2019, CPPIB's distributions and allocation of earnings were not proportionate to its ownership.
SEP Incentive Distribution Rights
On January 22, 2018, Enbridge and SEP announced the execution of a definitive agreement, resulting in us converting all of our ownership of incentive distribution rights (IDRs) and general partner economic interests in SEP into 172.5 million newly issued SEP common units. As part of the transaction, all of the IDRs were eliminated. As a result of this restructuring, in 2018 we recorded a decrease in Noncontrolling interests of $1.5 billion and increases in Additional paid-in capital and Deferred income tax liabilities of $1.1 billion and $333 million, respectively. Subsequently in 2018, we acquired all of the outstanding common units of SEP (refer to United States Sponsored Vehicles Buy-in above).
EEP Sponsored Vehicle Strategy
On April 28, 2017, we completed a strategic review of EEP and took actions including acquisition of all EEP's interest in the Midcoast assets and privatization of Midcoast Energy Partners, L.P. As a result of these actions, we recorded an increase in Noncontrolling interests of $458 million, inclusive of foreign currency translation adjustments, and a decrease in Additional paid-in capital of $421 million, net of deferred income taxes of $253 million.
Westcoast Preferred Shares Redemption
On March 20, 2019, Westcoast Energy Inc. exercised its right to redeem all of its outstanding 5.5% Cumulative Redeemable First Preferred Shares, Series 7 (Series 7 Shares) and all of its outstanding 5.6% Cumulative Redeemable First Preferred Shares, Series 8 (Series 8 Shares) at a price of $25.00 per Series 7 Share and $25.00 per Series 8 Share, respectively, for a total payment of $300 million. In addition, payment of $4 million was made for all accrued and unpaid dividends. As a result, we recorded a $300 million decrease in Noncontrolling interests.
REDEEMABLE NONCONTROLLING INTERESTS
The following table presents additional information regarding Redeemable noncontrolling interests as presented in our Consolidated Statements of Financial Position:
| | | | | | | Year ended December 31, | 2018 |
| 2017 |
| | (millions of Canadian dollars) | | | | Balance at beginning of year | 4,067 |
| 3,392 |
| | Earnings attributable to redeemable noncontrolling interests | 117 |
| 175 |
| | Other comprehensive income/(loss), net of tax | | | | Change in unrealized loss on cash flow hedges | 3 |
| (21 | ) | | Other comprehensive loss from equity investees | 14 |
| — |
| | Reclassification to earnings of loss on cash flow hedges | — |
| 57 |
| | Foreign currency translation adjustments | 4 |
| (6 | ) | | Other comprehensive income/(loss), net of tax | 21 |
| 30 |
| | Distributions to unitholders | (300 | ) | (247 | ) | | Contributions from unitholders | 70 |
| 1,178 |
| | Modified retrospective adoption of accounting standard | (38 | ) | — |
| | Net dilution gain/(loss) | 76 |
| (169 | ) | | Redemption value adjustment | 456 |
| (292 | ) | Sponsored vehicle buy-in1 | (4,469 | ) | — |
| | Balance at end of year | — |
| 4,067 |
|
| | 1 | On November 8, 2018, we executed the definitive agreement with ENF and acquired all of the publicly held shares of ENF not already owned by us or our subsidiaries. |
Canadian Sponsored Vehicle Buy-in
On September 17, 2018, we entered into a definitive agreement with ENF under which we would acquire all of the outstanding public common shares of ENF not already owned by us or our subsidiaries on the basis of 0.735 of our common shares and cash of $0.45 for each common share of ENF. Upon the closing of the transaction onMr. Whelen retired effective November 8, 2018, we acquired all of the public common shares of ENF and ENF become a wholly-owned subsidiary of Enbridge. The transaction, excluding the cash component, is valued at $4.5 billion based on the closing price of our common shares on the Toronto Stock Exchange on November 7, 2018. As a result of this buy-in, we recorded a decrease in Redeemable noncontrolling interests and Additional paid-in capital of $4.5 billion and $25 million, respectively, with NaN deferred tax impact. As at December 31, 2018, the balance of Redeemable noncontrolling interests was NaN.15, 2020.
21. SHARE CAPITAL
Our authorized share capital consists of an unlimited number of common shares with no par value and an unlimited number of preference shares.
COMMON SHARES
| | | | | | | | | | | | | | | | 2019 | 2018 | 2017 | | | Number |
| | Number |
| | Number |
| | | December 31, | of Shares |
| Amount |
| of Shares |
| Amount |
| of Shares |
| Amount |
| | (millions of Canadian dollars; number of shares in millions) | | | | | | | | Balance at beginning of year | 2,022 |
| 64,677 |
| 1,695 |
| 50,737 |
| 943 |
| 10,492 |
| | Common shares issued | — |
| — |
| — |
| — |
| 33 |
| 1,500 |
| Common shares issued in Merger Transaction (Note 8) | — |
| — |
| — |
| — |
| 691 |
| 37,429 |
| Common shares issued in Sponsored Vehicle buy-in (SEP) (Note 20) | — |
| — |
| 91 |
| 3,888 |
| — |
| — |
| Common shares issued in Sponsored Vehicle buy-in (EEP) (Note 20) | — |
| — |
| 72 |
| 3,042 |
| — |
| — |
| Common shares issued in Sponsored Vehicle buy-in (EEM) (Note 20) | — |
| — |
| 30 |
| 1,267 |
| — |
| — |
| Common shares issued in Sponsored Vehicle buy-in (ENF) (Note 20) | — |
| — |
| 104 |
| 4,530 |
| — |
| — |
| | Dividend Reinvestment and Share Purchase Plan | — |
| — |
| 28 |
| 1,181 |
| 25 |
| 1,226 |
| | Shares issued on exercise of stock options | 3 |
| 69 |
| 2 |
| 32 |
| 3 |
| 90 |
| | Balance at end of year | 2,025 |
| 64,746 |
| 2,022 |
| 64,677 |
| 1,695 |
| 50,737 |
|
PREFERENCE SHARES
| | | | | | | | | | | | | | | | 2019 | 2018 | 2017 | | | Number |
| | Number |
| | Number |
| | | December 31, | of Shares |
| Amount |
| of Shares |
| Amount |
| of Shares |
| Amount |
| | (millions of Canadian dollars; number of shares in millions) | | | | | | | | Preference Shares, Series A | 5 |
| 125 |
| 5 |
| 125 |
| 5 |
| 125 |
| | Preference Shares, Series B | 18 |
| 457 |
| 18 |
| 457 |
| 18 |
| 457 |
| | Preference Shares, Series C | 2 |
| 43 |
| 2 |
| 43 |
| 2 |
| 43 |
| | Preference Shares, Series D | 18 |
| 450 |
| 18 |
| 450 |
| 18 |
| 450 |
| | Preference Shares, Series F | 20 |
| 500 |
| 20 |
| 500 |
| 20 |
| 500 |
| | Preference Shares, Series H | 14 |
| 350 |
| 14 |
| 350 |
| 14 |
| 350 |
| | Preference Shares, Series J | 8 |
| 199 |
| 8 |
| 199 |
| 8 |
| 199 |
| | Preference Shares, Series L | 16 |
| 411 |
| 16 |
| 411 |
| 16 |
| 411 |
| | Preference Shares, Series N | 18 |
| 450 |
| 18 |
| 450 |
| 18 |
| 450 |
| | Preference Shares, Series P | 16 |
| 400 |
| 16 |
| 400 |
| 16 |
| 400 |
| | Preference Shares, Series R | 16 |
| 400 |
| 16 |
| 400 |
| 16 |
| 400 |
| | Preference Shares, Series 1 | 16 |
| 411 |
| 16 |
| 411 |
| 16 |
| 411 |
| | Preference Shares, Series 3 | 24 |
| 600 |
| 24 |
| 600 |
| 24 |
| 600 |
| | Preference Shares, Series 5 | 8 |
| 206 |
| 8 |
| 206 |
| 8 |
| 206 |
| | Preference Shares, Series 7 | 10 |
| 250 |
| 10 |
| 250 |
| 10 |
| 250 |
| | Preference Shares, Series 9 | 11 |
| 275 |
| 11 |
| 275 |
| 11 |
| 275 |
| | Preference Shares, Series 11 | 20 |
| 500 |
| 20 |
| 500 |
| 20 |
| 500 |
| | Preference Shares, Series 13 | 14 |
| 350 |
| 14 |
| 350 |
| 14 |
| 350 |
| | Preference Shares, Series 15 | 11 |
| 275 |
| 11 |
| 275 |
| 11 |
| 275 |
| | Preference Shares, Series 17 | 30 |
| 750 |
| 30 |
| 750 |
| 30 |
| 750 |
| | Preference Shares, Series 19 | 20 |
| 500 |
| 20 |
| 500 |
| 20 |
| 500 |
| | Issuance costs | | (155 | ) | | (155 | ) | | (155 | ) | | Balance at end of year | |
| 7,747 |
| | 7,747 |
| | 7,747 |
|
Characteristics of the preference shares are as follows:
| | | | | | | | | | | | | Dividend Rate |
| Dividend1 |
| Per Share Base Redemption Value2 | Redemption and Conversion Option Date2,3 |
| Right to Convert Into3,4 |
| | (Canadian dollars unless otherwise stated) | | | | | | Preference Shares, Series A | 5.50 | % | $1.37500 | $25 | — |
| — |
| | Preference Shares, Series B | 3.42 | % | $0.85360 | $25 | June 1, 2022 |
| Series C |
| Preference Shares, Series C5 | 3-month treasury bill plus 2.40% |
| — |
| $25 | June 1, 2022 |
| Series B |
| | Preference Shares, Series D | 4.46 | % | $1.11500 | $25 | March 1, 2023 |
| Series E |
| | Preference Shares, Series F | 4.69 | % | $1.17224 | $25 | June 1, 2023 |
| Series G |
| | Preference Shares, Series H | 4.38 | % | $1.09400 | $25 | September 1, 2023 |
| Series I |
| | Preference Shares, Series J | 4.89 | % | US$1.22160 | US$25 | June 1, 2022 |
| Series K |
| | Preference Shares, Series L | 4.96 | % | US$1.23972 | US$25 | September 1, 2022 |
| Series M |
| | Preference Shares, Series N | 5.09 | % | $1.27152 | $25 | December 1, 2023 |
| Series O |
| Preference Shares, Series P6 | 4.38 | % | $1.09476 | $25 | March 1, 2024 |
| Series Q |
| Preference Shares, Series R6 | 4.07 | % | $1.01825 | $25 | June 1, 2024 |
| Series S |
| | Preference Shares, Series 1 | 5.95 | % | US$1.48728 | US$25 | June 1, 2023 |
| Series 2 |
| Preference Shares, Series 36 | 3.74 | % | $0.93425 | $25 | September 1, 2024 |
| Series 4 |
| Preference Shares, Series 56 | 5.38 | % | US$1.34383 | US$25 | March 1, 2024 |
| Series 6 |
| Preference Shares, Series 76 | 4.45 | % | $1.11224 | $25 | March 1, 2024 |
| Series 8 |
| Preference Shares, Series 96 | 4.10 | % | $1.02424 | $25 | December 1, 2024 |
| Series 10 |
| | Preference Shares, Series 11 | 4.40 | % | $1.10000 | $25 | March 1, 2020 |
| Series 12 |
| | Preference Shares, Series 13 | 4.40 | % | $1.10000 | $25 | June 1, 2020 |
| Series 14 |
| | Preference Shares, Series 15 | 4.40 | % | $1.10000 | $25 | September 1, 2020 |
| Series 16 |
| | Preference Shares, Series 17 | 5.15 | % | $1.28750 | $25 | March 1, 2022 |
| Series 18 |
| | Preference Shares, Series 19 | 4.90 | % | $1.22500 | $25 | March 1, 2023 |
| Series 20 |
|
| | 1 | The holder is entitled to receive a fixed, cumulative, quarterly preferential dividend, as declared by the Board of Directors. With the exception of Series A and Series C Preference Shares, such fixed dividend rate resets every five years beginning on the initial redemption and conversion option date. The Series 17 and Series 19 Preference Shares contain a feature where the fixed dividend rate, when reset every five years, will not be less than 5.15% and 4.90%, respectively. No other series of Preference Shares has this feature. |
| | 2 | Series A Preference Shares may be redeemed any time at our option. For all other series of Preference Shares, we, may at our option, redeem all or a portion of the outstanding Preference Shares for the Base Redemption Value per share plus all accrued and unpaid dividends on the Redemption Option Date and on every fifth anniversary thereafter. |
| | 3 | The holder will have the right, subject to certain conditions, to convert their shares into Cumulative Redeemable Preference Shares of a specified series on a 1-for-one basis on the Conversion Option Date and every fifth anniversary thereafter at an ascribed issue price equal to the Base Redemption Value. |
| | 4 | With the exception of Series A Preference Shares, after the redemption and conversion option dates, holders may elect to receive quarterly floating rate cumulative dividends per share at a rate equal to: $25 x (number of days in quarter/365) x 90 day Government of Canada treasury bill rate + 2.4% (Series C), 2.4% (Series E), 2.5% (Series G), 2.1% (Series I), 2.7% (Series O), 2.5% (Series Q), 2.5% (Series S), 2.4% (Series 4), 2.6% (Series 8), 2.7% (Series 10), 2.6% (Series 12), 2.7% (Series 14), 2.7% (Series 16), 4.1% (Series 18) or 3.2% (Series 20); or US$25 x (number of days in quarter/365) x three-month United States Government treasury bill rate + 3.1% (Series K), 3.2% (Series M), 3.1% (Series 2) or 2.8% (Series 6).
|
| | 5 | The floating quarterly dividend amount for the Series C Preference Shares was decreased to $0.25395 from $0.25459 on March 1, 2019, was increased to $0.25647 from $0.25395 on June 1, 2019, was decreased to $0.25243 from $0.25647 on September 1, 2019 and was increased to $0.25305 from $0.25243 on December 1, 2019, due to reset on a quarterly basis following the issuance thereof.
|
| | 6 | No Series P, R, 3, 5, 7 or 9 Preference shares were converted on the March 1, 2019, June 1, 2019, September 1, 2019, March 1, 2019, March 1, 2019 or December 1, 2019 conversion option dates, respectively. However, the quarterly dividend amounts for Series P, R, 3, 5, 7 or 9, was increased to $0.27369 from $0.25000 on March 1, 2019, increased to $0.25456 from $0.25000 on June 1, 2019, decreased to $0.23356 from $0.25000 on September 1, 2019, increased to US$0.33625 from |
US$0.27500 on March 1, 2019, increased to $0.27806 from $0.27500 on March 1, 2019 and decreased to $0.25606 from $0.27500 on December 1, 2019, respectively, due to reset on every fifth anniversary thereafter.2 |
DIVIDEND REINVESTMENT AND SHARE PURCHASE PLAN
On November 2, 2018, we announcedThe amounts disclosed in this column include the suspension of our DRIP, effective immediately. Prior to the announcement, our shareholders were able to participate in the DRIP, which enabled participants to reinvest their dividends in our common shares at a 2% discount to market price and to make additional optional cash payments to purchase common shares at the market price, free of brokerage or other charges. Refer to Item 7. Management's Discussion and Analysis of Financial Condition and Results of Operations - Liquidity and Capital Resources - Dividends for details on dividends paid.
SHAREHOLDER RIGHTS PLAN
The Shareholder Rights Plan is designed to encourage theaggregate grant date fair treatment of shareholders in connection with any takeover offer for us. Rights issued under the plan become exercisable when a person and any related parties acquires or announces its intention to acquire 20% or more of our outstanding common shares without complying with certain provisions set out in the plan or without approval of our Board of Directors. Should such an acquisition occur, each rights holder, other than the acquiring person and related parties, will have the right to purchase our common shares at a 50% discount to the market price at that time.
22. STOCK OPTION AND STOCK UNIT PLANS
We maintain 4 long-term incentive compensation plans: the ISO Plan, the Performance Stock Options (PSO) Plan, the PSU Plan and the RSU Plan. In 2019, Enbridge adopted a new Long Term Incentive Plan with an effective date of February 13, 2019. The 2019 plan replaced several of Enbridge's prior incentive award plans and no additional awards were made or will be made under the prior plans as of the effective date. A reserve of 50 million was approved and established for the 2019 ISO Plan. Awardsvalue of PSUs and RUSs are notional units as if a unit was 1 Enbridge common shareRSUs granted in 2020, 2019 and are payable in cash.
Prior to the Merger Transaction, Spectra Energy had a long-term incentive plan providing for the granting of stock options, restricted and unrestricted stock awards and units, and other equity-based awards. Upon closing of the Merger Transaction, Enbridge replaced existing Spectra Energy share-based payment awards with awards that will be settled in shares of Enbridge. Spectra Energy's cash-settled phantom awards were included in the fair value of the net assets acquired (Note 8).
Total stock-based compensation expense recorded for the years ended December 31, 2019, 2018 and 2017 was $117 million, $106 million and $165 million, respectively. Disclosure of activity and assumptions for material stock-based compensation plans are included below.
INCENTIVE STOCK OPTIONS
Key employees are granted ISOs to purchase common shares at the market price on the grant date. ISOs vest in equal annual installments over a four-year period and expire 10 years after the issue date.
| | | | | | | | | | December 31, 2019 | Number |
| Weighted Average Exercise Price |
| Weighted Average Remaining Contractual Life (years) | Aggregate Intrinsic Value |
| | (options in thousands; intrinsic value in millions of Canadian dollars) | |
| |
| | |
| | Options outstanding at beginning of year | 34,387 |
| 43.47 |
| | |
| | Options granted | 6,777 |
| 48.32 |
| | |
| Options exercised1 | (4,519 | ) | 34.19 |
| | |
| | Options cancelled or expired | (1,598 | ) | 50.62 |
| | |
| | Options outstanding at end of year | 35,047 |
| 47.73 |
| 6.2 | 157 |
| Options vested at end of year2 | 20,581 |
| 47.67 |
| 4.7 | 92 |
|
| | 1 | The total intrinsic value of ISOs exercised during the years ended December 31, 2019, 2018 and 2017 was $58 million, $42 million and $62 million, respectively, and cash received on exercise was $1 million, $15 million and $17 million, respectively. |
| | 2 | The total fair value of ISOs vested during the years ended December 31, 2019, 2018 and 2017 was $32 million, $36 million and $44 million, respectively. |
Weighted average assumptions used to determine the fair value of ISOs granted using the Black-Scholes-Merton option pricing model are as follows:
| | | | | | | | | Year ended December 31, | 2019 |
| 2018 |
| 2017 |
| Fair value per option (Canadian dollars)1 | 4.37 |
| 3.86 |
| 6.00 |
| | Valuation assumptions | | | | Expected option term (years)2 | 5 |
| 5 |
| 5 |
| Expected volatility3 | 19.9 | % | 21.9 | % | 20.4 | % | Expected dividend yield4 | 6.1 | % | 6.4 | % | 4.4 | % | Risk-free interest rate5 | 2.0 | % | 2.2 | % | 1.2 | % |
| | 1 | Options granted to United States employees are based on NYSE prices. The option value and assumptions shown are based on a weighted average of the United States and the Canadian options. The fair values per option for the years ended December 31, 2019, 2018 and 2017 were $4.04, $3.75 and $5.66, respectively, for Canadian employees and US$4.09, US$3.30 and US$5.72, respectively, for United States employees. |
| | 2 | The expected option term is six years based on historical exercise practice and three years for retirement eligible employees. |
| | 3 | Expected volatility is determined with reference to historic daily share price volatility and consideration of the implied volatility observable in call option values near the grant date. |
| | 4 | The expected dividend yield is the current annual dividend at the grant date divided by the current stock price. |
| | 5 | The risk-free interest rate is based on the Government of Canada’s Canadian Bond Yields and the United States Treasury Bond Yields. |
Compensation expense recorded for the years ended December 31, 2019, 2018 and 2017 for ISOs was $32 million, $28 million and $40 million, respectively. As at December 31, 2019, unrecognized compensation expense related to non-vested stock-based compensation arrangements granted under the ISO Plan was $18 million. The expense is expected to be fully recognized over a weighted average period of approximately two years.
PERFORMANCE STOCK UNITS
Under PSU awards for certain key employees, cash awards are paid following a three-year performance cycle. Awards2018. These amounts are calculated by multiplying the number of performance and restricted stock units by the unit values in the table below:
|
| In May 2019, Mr. Yardley was granted 40,421 RSUs with grant date fair value of US$37.11. |
| The amounts in this column represent the grant date fair value of stock option awards granted to each of the NEOs. The grant date fair value of stock option awards is measured using the Black-Scholes option-pricing model, based on the following assumptions: |
| The amounts disclosed in this column represent amounts paid under the Enbridge Inc. STIP with respect to the 2020, 2019 and 2018 performance years. |
| The pension values are equal to the compensatory change shown in the defined benefit plan table. |
| The table below describes the elements comprising the amounts presented in this column for 2020: |
| | | | | | | | | | | | | | | | | | | | | | | | | | | | | | | | | | | |
| | | | | | | |
| | Matching
contribution under
retirement savings
plan | | Excess flexible benefit credit a | | | | Personal use
of company
aircraft | | | | | | |
| | | | | | | |
| | - | | 40,854 | | - | | 7,865 | | 6,108 | | 6,741 | | 61,568 |
| | | | | | | |
| | - | | 7,232 | | - | | - | | 4,800 | | - | | 12,032 |
| | | | | | | |
| | - | | 4,244 | | 59,817 | | - | | 4,200 | | 4,844 | | 73,105 |
| | | | | | | |
| | 21,786 | | - | | - | | 8,950 | | - | | 1,329 | | 32,065 |
| | | | | | | |
| | - | | 12,083 | | - | | - | | 4,800 | | 5,696 | | 22,579 |
| | | | | | | |
| | - | | 11,872 | | - | | - | | 4,800 | | 1,495 | | 18,167 |
| For the NEOs domiciled in Canada, flexible benefit credits are provided based on their family status and base salary. These credits can be used to purchase benefits or can be paid in cash. Participants could receive up to 2.5% of base salary in matching contributions towards their flexible benefit credits if they made contributions into their Savings Plan. This amount represents the excess flexible benefit credits paid to the NEO. |
| Other benefits include executive medical and other incidental compensation. |
Executive compensation and shareholder return
The chart below shows the value of a $100 investment made January 1, 2016 in both Enbridge common shares and the S&P/TSX Composite Index and the S&P 500 index, at the end of each of the last five years (assuming reinvestment of dividends throughout the term). It also shows the growth in average total direct compensation for the NEOs reported in the 2020 summary compensation table over the same period.
Total direct compensation includes base salary, short-term incentive award paid, and the grant value of medium- and long-term incentive awards. Average total direct compensation is taken by dividing total direct compensation from the 2020 summary compensation table by the number of named executives in any given year. The total direct compensation value for NEOs is 0.72% of our adjusted earnings of $4,894 million for 2020.
The total return on Enbridge common shares has been positive from 2016 to 2020. Average compensation paid to the NEOs has also increased over the same period.
Outstanding option-based and share-based awards
The table below shows the option-based and share-based awards that were outstanding
on December 31, 2020. The market value of unvested or unearned awards is calculated based on C$40.71 per share for awards denominated in Canadian dollars and US$31.99 for awards denominated in U.S. dollars, the closing prices of our shares on the TSX and NYSE on December 31, 2020. The grant date fair value for U.S. option grants and the market value of unvested or unearned awards denominated in U.S. dollars were each converted from U.S. dollars to Canadian dollars using the published WM/Reuters 4 pm Londonyear-end
exchange rate of US$1 = C$1.2740. | | | | | | | | | | | | | | | | | | | | | | | | | | | | | | | | |
| | |
| | | | | | | |
| | | | | | | |
| | | Number of
securities
underlying
unexercised
options | | | | | | | | | Value of unexercised options 3 | | | Number of units that have not vested 4 5 | | | | | | Market or value of vested share-based awards not paid out or distributed 3 6 | |
| | | | | | |
| | | | | | | | |
| | | 614,200 | | | | 55.54 | | | | 2/20/2030 | | | | 0 | | | | 0 | | | | 43,966 | | | | 1,789,860 | | | | | |
| | | | | | | | |
| | | 825,740 | | | | 48.30 | | | | 2/21/2029 | | | | 0 | | | | 0 | | | | 131,898 | | | | 5,369,580 | | | | | |
| | | | | | | | |
| | | 727,080 | | | | 43.02 | | | | 2/27/2028 | | | | 0 | | | | 0 | | | | 141,635 | | | | 5,765,960 | | | | | |
| | | | | | | | |
| | | 584,000 | | | | 55.84 | | | | 2/28/2027 | | | | 0 | | | | 0 | | | | - | | | | - | | | | 9,724,864 | |
| | | | | | | | |
| | | 365,000 | | | | 44.06 | | | | 3/1/2026 | | | | 0 | | | | 0 | | | | | | | | | | | | | |
| | | | | | | | |
| | | 196,000 | | | | 59.08 | | | | 3/2/2025 | | | | 0 | | | | 0 | | | | | | | | | | | | | |
| | | | | | | | |
| | | 199,000 | | | | 48.81 | | | | 3/13/2024 | | | | 0 | | | | 0 | | | | | | | | | | | | | |
| | | | | | | | |
| | | 229,000 | | | | 44.83 | | | | 2/27/2023 | | | | 0 | | | | 0 | | | | | | | | | | | | | |
| | | | | | | | |
| | | | 147,500 | | | | 38.34 | | | | 3/2/2022 | | | | 349,575 | | | | 0 | | | | | | | | | | | | | |
| | | | | | | | |
| | | 121,740 | | | | 55.54 | | | | 2/20/2030 | | | | 0 | | | | 0 | | | | 8,719 | | | | 354,953 | | | | | |
| | | | | | | | |
| | | 78,490 | | | | 48.30 | | | | 2/21/2029 | | | | 0 | | | | 0 | | | | 26,147 | | | | 1,064,428 | | | | | |
| | | | | | | | |
| | | 45,170 | | | | 43.02 | | | | 2/27/2028 | | | | 0 | | | | 0 | | | | 28,108 | | | | 1,144,261 | | | | | |
| | | | | | | | |
| | | 48,670 | | | | 55.84 | | | | 2/28/2027 | | | | 0 | | | | 0 | | | | - | | | | - | | | | 604,577 | |
| | | | | | | | |
| | | 64,600 | | | | 44.06 | | | | 3/1/2026 | | | | 0 | | | | 0 | | | | | | | | | | | | | |
| | | | | | | | |
| | | 64,780 | | | | 59.08 | | | | 3/2/2025 | | | | 0 | | | | 0 | | | | | | | | | | | | | |
| | | | | | | | |
| | | 66,500 | | | | 48.81 | | | | 3/13/2024 | | | | 0 | | | | 0 | | | | | | | | | | | | | |
| | | | | | | | |
| | | 72,000 | | | | 44.83 | | | | 2/27/2023 | | | | 0 | | | | 0 | | | | | | | | | | | | | |
| | | | | | | | |
| | | | 69,750 | | | | 38.34 | | | | 3/2/2022 | | | | 165,308 | | | | 0 | | | | | | | | | | | | | |
| | | | | | | | |
| | | 148,680 | | | | 55.54 | | | | 11/15/2025 | | | | 0 | | | | 0 | | | | 2,772 | | | | 112,848 | | | | | |
| | | | | | | | |
| | | 216,100 | | | | 48.30 | | | | 11/15/2023 | | | | 0 | | | | 0 | | | | 9,749 | | | | 396,900 | | | | | |
| | | | | | | | |
| | | 198,560 | | | | 43.02 | | |
| 11/15/2023
|
| | | 0 | | | | 0 | | | | 23,432 | | | | 953,936 | | | | | |
| | | | | | | | |
| | | 152,910 | | | | 55.84 | | |
| 11/15/2023
|
| | | 0 | | | | 0 | | | | - | | | | - | | | | 2,546,456 | |
| | | | | | | | |
| | | 82,430 | | | | 44.06 | | |
| 11/15/2023
|
| | | 0 | | | | 0 | | | | | | | | | | | | | |
| | | | | | | | |
| | | 109,670 | | | | 59.08 | | |
| 11/15/2023
|
| | | 0 | | | | 0 | | | | | | | | | | | | | |
| | | | | | | | |
| | | 92,700 | | | | 48.81 | | |
| 11/15/2023
|
| | | 0 | | | | 0 | | | | | | | | | | | | | |
| | | | | | | | |
| | | 78,550 | | | | 44.83 | | | | 2/27/2023 | | | | 0 | | | | 0 | | | | | | | | | | | | | |
| | | | | | | | |
| | | 77,050 | | | | 38.34 | | | | 3/2/2022 | | | | 182,609 | | | | 0 | | | | | | | | | | | | | |
| | | | | | | | |
| | | | 84,000 | | | | 28.78 | | | | 2/14/2021 | | | | 1,002,540 | | | | 0 | | | | | | | | | | | | | |
| | | | | | | | |
| | | 129,020 | | | | US41.97 | | | | 2/20/2030 | | | | 0 | | | | 0 | | | | 12,448 | | | | 507,343 | | | | | |
| | | | | | | | |
| | | 202,700 | | | | US36.71 | | | | 2/21/2029 | | | | 0 | | | | 0 | | | | 37,355 | | | | 1,522,460 | | | | | |
| | | | | | | | |
| | | 182,520 | | | | US33.97 | | | | 2/27/2028 | | | | 0 | | | | 0 | | | | 44,312 | | | | 1,806,034 | | | | | |
| | | | | | | | |
| | | 56,580 | | | | US41.64 | | | | 2/28/2027 | | | | 0 | | | | 0 | | | | 36,471 | | | | 1,486,427 | | | | | |
| | | | | | | | |
| | | | 58,941 | | | | US28.87 | | | | 2/16/2026 | | | | 234,292 | | | | 0 | | | | - | | | | - | | | | 2,984,853 | |
| | | | | | | | |
| | | 132,010 | | | | 55.54 | | | | 2/20/2030 | | | | 0 | | | | 0 | | | | 9,450 | | | | 384,712 | | | | | |
| | | | | | | | |
| | | 191,860 | | | | 48.30 | | | | 2/21/2029 | | | | 0 | | | | 0 | | | | 28,350 | | | | 1,154,136 | | | | | |
| | | | | | | | |
| | | 115,380 | | | | 43.02 | | | | 2/27/2028 | | | | 0 | | | | 0 | | | | 32,911 | | | | 1,339,789 | | | | | |
| | | | | | | | |
| | | 93,300 | | | | 55.84 | | | | 2/28/2027 | | | | 0 | | | | 0 | | | | - | | | | - | | | | 1,543,361 | |
| | | | | | | | |
| | | 96,750 | | | | 44.06 | | | | 3/1/2026 | | | | 0 | | | | 0 | | | | | | | | | | | | | |
| | | | | | | | |
| | | 82,340 | | | | 59.08 | | | | 3/2/2025 | | | | 0 | | | | 0 | | | | | | | | | | | | | |
| | | | | | | | |
| | | 83,350 | | | | 48.81 | | | | 3/13/2024 | | | | 0 | | | | 0 | | | | | | | | | | | | | |
| | | | | | | | |
| | | 83,250 | | | | 44.83 | | | | 2/27/2023 | | | | 0 | | | | 0 | | | | | | | | | | | | | |
| | | | | | | | |
| | | | 64,350 | | | | 38.34 | | | | 3/2/2022 | | | | 152,510 | | | | 0 | | | | | | | | | | | | | |
| | | | | | | | |
| | | 115,510 | | | | 55.54 | | | | 2/20/2030 | | | | 0 | | | | 0 | | | | 8,264 | | | | 336,407 | | | | | |
| | | | | | | | |
| | | 153,490 | | | | 48.30 | | | | 2/21/2029 | | | | 0 | | | | 0 | | | | 24,801 | | | | 1,009,654 | | | | | |
| | | | | | | | |
| | | 141,030 | | | | 43.02 | | | | 2/27/2028 | | | | 0 | | | | 0 | | | | 26,324 | | | | 1,071,648 | | | | | |
| | | | | | | | |
| | | | 167,200 | | | | 55.84 | | | | 2/28/2027 | | | | 0 | | | | 0 | | | | - | | | | - | | | | 1,886,017 | |
| Each ISO award has a10-year term and vestspro-rata as to one fourth of the option award beginning on the first anniversary of the grant date. |
| Option exercise prices are reflected in the currency granted. |
| U.S. dollars have been converted to Canadian dollars using the published WM/Reuters 4 pm London year-end exchange rate of US$1 = C$1.2740. |
| The number of PSUs and RSUs outstanding includes dividend equivalents as of December 31, 2020. |
| A performance multiplier of 1.0x has been used (PSUs only), based on achieving the target performance level as defined in the plan. |
| Reflects the payout value of the 2018 PSU grant, which vested on December 31, 2020 but will not be paid until March 2021. A performance multiplier of 1.82x is used. |
| Reflects RSUs granted on May 8, 2019 that remain outstanding, 20% of which vested on the first anniversary of the grant date, 20% and 60% of which vest on the second and third anniversaries of the grant date, respectively. |
Value vested or earned in 2020
| | | | | | | | | | | | |
| | |
| | Value vested during the year | | | Value earned during the year | |
| | | | | | | | Non-equity incentive plan 1 4 | |
| | | |
| | | 3,406,926 | | | | 9,724,864 | | | | 3,205,919 | |
| | | |
| | | 321,146 | | | | 832,454 | | | | 761,904 | |
| | | |
| | | 888,481 | | | | 2,546,456 | | | | 690,766 | |
| | | |
| | | 333,142 | | | | 4,271,348 | | | | 849,262 | |
| | | |
| | | 704,506 | | | | 1,543,361 | | | | 703,893 | |
| | | |
| | | 544,704 | | | | 1,886,017 | | | | 634,091 | |
| U.S. dollars have been converted to Canadian dollars using the published WM/Reuters 4 pm Londonyear-end exchange rate of US$1 = C$1.2740. |
| The values of the option-based awards listed above are based on the following: |
| | | | | | | | | | | | |
| | | |
| | | | | | | | Closing price on 2020 vesting date | |
| | | |
| | | $44.06 | | | | 2/28/2020 | | | | $49.96 | |
| | | |
| | | $55.84 | | | | 2/28/2020 | | | | $49.96 | |
| | | |
| | | US$41.64 | | | | 2/28/2020 | | | | US$37.43 | |
| | | |
| | | $43.02 | | | | 2/27/2020 | | | | $50.84 | |
| | | |
| | | US$33.97 | | | | 2/27/2020 | | | | US$37.66 | |
| | | |
| | | $48.30 | | | | 2/21/2020 | | | | $55.31 | |
| | | |
| | | US$36.71 | | | | 2/21/2020 | | | | US$41.87 | |
| Includes the 2018 PSUs, including dividend equivalents, that matured on December 31, 2020. A performance multiplier of 1.82x has been used. |
| Based on corporate, business unit and individual performance for the 2020 performance year. |
| Includes the 2018 RSUs, including dividend equivalents, that matured on December 1, 2020. |
| Includes the 2019 RSUs, including dividend equivalents, that matured on May 8, 2020. |
Termination of employment andarrangements Enbridge has entered into employment agreements with each of the NEOs. The terms in the employment agreements are competitive and part of a comprehensive compensation package that assists in recruiting and retaining top executive talent.
The agreements generally provide payments for executives in the case of involuntary termination for any reason (other than for cause) or voluntary termination within 150 days after constructive dismissal, as defined in each agreement, and do not provide for any “single-trigger” severance payments upon a change in control of the company. As a condition to receiving payments under the employment agreements upon a qualifying termination of employment, the executive must execute a general release of claims in favor of Enbridge and comply with the following restrictive covenants:
| | | | |
| | |
Confidentiality provision | | Non-competition/solicitation | | |
| | |
| | 1 year after departure | | 2 years after departure |
Termination of employment scenarios
Compensation that would be paid to the NEOs pursuant to the terms of their existing employment agreements under various termination scenarios is described below.
| | | | | | | | | | | | |
| | | | | |
| | | | | | Medium- and long-term incentives | | | | |
| | | | | | |
| | Resignation | | None | | Payable in full if executive has worked the entire calendar year and remains actively employed on the payment date. Otherwise, none. | | • PSUs and RSUs forfeited. • Vested stock options must be exercised within 30 days of resignation or by the end of the original term (if sooner). • Unvested stock options are cancelled. | | No longer earns service credits. | | None |
| Retirement | | Current year’s incentive prorated to retirement date | | • PSUs and RSUs are prorated to retirement date and value is assessed and paid at the end of the performance period by the Company's weighted average share price for 20 daysusual term. • Stock options granted prior to 2020 continue to vest and can be exercised for three years after retirement (or option expiry, if sooner) • Stock options granted in 2020 continue to vest and can be exercised for five years after retirement (or option expiry, if sooner) | | Post-retirement benefits begin. |
| | | | | | |
| | Termination not for cause or constructive dismissal | | Current salary is paid in a lump sum (3x for CEO and 2x for other NEOs) | | The average short-term incentive award over the maturitypast two years is paid out in a lump sum (3x for CEO and 2x for other NEOs)
the current year’s short-term incentive, prorated based on active service during the year of termination based on target performance | | • PSUs and RSUs are prorated to date of termination (plus any applicable notice period) and value is assessed and paid at the end of the grantusual term. • Vested stock options must be exercised according to stock option terms. • Thespread value of unvested stock options is paid in cash. | | Additional years of pension credit are added to the final pension calculation (three years for CEO and bytwo years for other NEOs). | | Value of future benefits paid out in a lump sum (3x for CEO and 2x for other NEOs). |
| Termination following a change of control (CIC) | | • PSUs vest and value is assessed and paid on performance multiplier. The performance multiplier ranges from 0, if our performance failsmeasures deemed to meet threshold performance levels, to a maximum of 2 if we perform within the highest range of its performance targets. The performance multiplier is derived through a calculation of our Risk Adjusted Total Shareholder Return (in 2017) and Total Shareholder Return (commencing in 2018) percentile rank, in each case relative to a specified peer group of companies and our distributable cash flow, adjusted for unusual, non-operating or non-recurring items, relative to targets established at the time of grant. To calculate the 2019 expense, a multiplier of 1 was used for eachhave been achieved as of the 2017, 2018change of control. RSUs vest and 2019 PSU grants.are paid out. • All stock options vest and remain exercisable for 30 days following termination (or option expiry, if sooner). | | | | | | | | December 31, 2019 | Number |
| Weighted Average Remaining Contractual Life (years) | Aggregate Intrinsic Value |
| | (units in thousands; intrinsic value in millions of Canadian dollars) | |
| | |
| | Units outstanding at beginning of year | 1,069 |
| | | | Units granted | 1,093 |
| | | | Units cancelled | (65 | ) | | | Units matured1 | (25 | ) | | | | Dividend reinvestment | 117 |
| | | | Units outstanding at end of year | 2,189 |
| 1.5 | 111 |
|
| | 1 | The total amount paid during the years ended December 31, 2019, 2018 and 2017 for PSUs was $19 million, $18 million and $28 million, respectively. |
The amounts shown in the table below include the estimated potential payments and benefits that would be payable to each of our NEOs as a result of the specified triggering event, assumed to occur as of December 31, 2020. The actual amounts that would be payable in these circumstances can be determined only at the time of the executive’s separation, would include payments or benefits already earned or vested and may differ from the amounts set forth in the table below. Amounts in U.S. dollars have been converted to Canadian dollars using the published WM/Reuters 4 pm Londonyear-end exchange rate of US$1 = C$1.2740. | | | | | | | | | | | | | | | | | | | | | | | | | | | | | | | | | | | | | | | | | | | | | | | | | | | | | | | | | | | | | | | | | | | | | | | | | | | CIC | | | - | | | | - | | | | - | | | | - | | | | - | | | | - | | | | 0 | | | | Death | | | - | | | | - | | | | 12,925,401 | | | | - | | | | - | | | | 55,969 | | | | 12,981,370 | | | | Retirement | | | - | | | | - | | | | 5,883,086 | | | | - | | | | - | | | | 55,969 | | | | 5,939,056 | | | | Voluntary or for cause termination | | | - | | | | - | | | | - | | | | - | | | | - | | | | 55,969 | | | | 55,969 | | | | Involuntary termination without cause | | | 4,365,600 | | | | 10,741,747 | | | | 12,925,401 | | | | - | | | | 3,771,000 | | | | 252,009 | | | | 32,055,757 | | | | Involuntary or good reason termination after a CIC | | | 4,365,600 | | | | 10,741,747 | | | | 12,925,401 | | | | - | | | | 3,771,000 | | | | 252,009 | | | | 32,055,757 | | | | | | | | | | | | | CIC | | | - | | | | - | | | | - | | | | - | | | | - | | | | - | | | | 0 | | | | Death | | | - | | | | - | | | | 3,707,902 | | | | - | | | | - | | | | 22,718 | | | | 3,730,620 | | | | Voluntary or for cause termination | | | - | | | | - | | | | - | | | | - | | | | - | | | | 22,718 | | | | 22,718 | | | | Involuntary termination without cause | | | 1,181,340 | | | | 921,438 | | | | 3,691,385 | | | | - | | | | 1,551,000 | | | | 88,954 | | | | 7,434,117 | | | | Involuntary or good reason termination after a CIC | | | 1,181,340 | | | | 921,438 | | | | 3,691,385 | | | | - | | | | 1,551,000 | | | | 88,954 | | | | 7,434,117 | | | | | | | | | | | | | Retirement | | | - | | | | - | | | | 709,308 | | | | - | | | | - | | | | 59,817 | | | | 769,125 | | | | | | | | | | | | | CIC | | | - | | | | - | | | | - | | | | - | | | | - | | | | - | | | | 0 | | | | Death | | | - | | | | - | | | | 5,322,264 | | | | - | | | | - | | | | 25,860 | | | | 5,348,124 | | | | Retirement | | | - | | | | - | | | | 2,597,159 | | | | - | | | | - | | | | 25,860 | | | | 2,623,019 | | | | Voluntary or for cause termination | | | - | | | | - | | | | - | | | | - | | | | - | | | | 25,860 | | | | 25,860 | | | | Involuntary termination without cause | | | 1,344,735 | | | | 2,212,254 | | | | 5,298,656 | | | | - | | | | 837,000 | | | | 94,914 | | | | 9,787,559 | | | | Involuntary or good reason termination after a CIC | | | 1,344,735 | | | | 2,212,254 | | | | 5,298,656 | | | | - | | | | 837,000 | | | | 94,914 | | | | 9,787,559 | | | | | | | | | | | | | CIC | | | - | | | | - | | | | - | | | | - | | | | - | | | | - | | | | 0 | | | | Death | | | - | | | | - | | | | 2,878,638 | | | | - | | | | - | | | | 23,649 | | | | 2,902,287 | | | | Voluntary or for cause termination | | | - | | | | - | | | | - | | | | - | | | | - | | | | 23,649 | | | | 23,649 | | | | Involuntary termination without cause | | | 1,229,760 | | | | 1,611,996 | | | | 2,860,736 | | | | - | | | | 2,159,000 | | | | 100,581 | | | | 7,962,073 | | | | Involuntary or good reason termination after a CIC | | | 1,229,760 | | | | 1,611,996 | | | | 2,860,736 | | | | - | | | | 2,159,000 | | | | 100,581 | | | | 7,962,073 | | | | | | | | | | | | | CIC | | | - | | | | - | | | | - | | | | - | | | | - | | | | - | | | | 0 | | | | Death | | | - | | | | - | | | | 2,417,709 | | | | - | | | | - | | | | 20,693 | | | | 2,438,402 | | | | Retirement | | | - | | | | - | | | | 1,098,013 | | | | - | | | | - | | | | 20,693 | | | | 1,118,706 | | | | Voluntary or for cause termination | | | - | | | | - | | | | - | | | | - | | | | - | | | | 20,693 | | | | 20,693 | | | | Involuntary termination without cause | | | 1,076,040 | | | | 1,419,291 | | | | 2,402,055 | | | | - | | | | 971,000 | | | | 87,933 | | | | 5,956,319 | | | | Involuntary or good reason termination after a CIC | | | 1,076,040 | | | | 1,419,291 | | | | 2,402,055 | | | | - | | | | 971,000 | | | | 87,933 | | | | 5,956,319 | |
| Compensation expense recorded forMr. Whelen retired on November 15, 2020. |
| Messrs. Monaco, Yardley and Rooney are the years endedonly NEOs who are retirement eligible as of December 31, 2019, 2018 and 2017 for PSUs was $40 million, $15 million and $5 million, respectively. As at December 31, 2019, unrecognized compensation expense related to non-vested PSUs was $55 million. The expense is expected to be fully recognized over2020. Retirement eligibility under Enbridge programs means age 55 or older. |
| Reflects a weighted average period of approximately two years.
RESTRICTED STOCK UNITS
Under RSU awards, cash awards are paid to certain of our employees following a 35-month maturity period. RSU holders receive cashlump sum payment equal to our weighted average share price for 20 days prior tothree times (for Mr. Monaco) and two times (for Messrs. Gruending, Yardley, Yu and Rooney) the maturity of the grant multiplied by the units outstanding on the maturity date.
| | | | | | | | December 31, 2019 | Number |
| Weighted Average Remaining Contractual Life (years) | Aggregate Intrinsic Value |
| | (units in thousands; intrinsic value in millions of Canadian dollars) | | | | | Units outstanding at beginning of year | 1,213 |
| | |
| | Units granted | 1,087 |
| | |
| | Units cancelled | (96 | ) | | |
| Units matured1 | (706 | ) | | |
| | Dividend reinvestment | 126 |
| | |
| | Units outstanding at end of year | 1,624 |
| 1.6 | 82 |
|
| | 1 | The total amount paid during the years ended December 31, 2019, 2018 and 2017 for RSUs was $34 million, $41 million and $39 million, respectively. |
Compensation expense recorded for the years ended December 31, 2019, 2018 and 2017 for RSUs was $41 million, $32 million and $46 million, respectively. As at December 31, 2019, unrecognized compensation expense related to non-vested RSUs was $47 million. The expense is expected to be fully recognized over a weighted average period of approximately two years.
23. COMPONENTS OF ACCUMULATED OTHER COMPREHENSIVE INCOME/(LOSS)
ChangesNEO’s base salary in AOCI attributable to our common shareholders for the years ended December 31, 2019, 2018 and 2017 are as follows:
| | | | | | | | | | | | | | | | Cash Flow Hedges |
| Net Investment Hedges |
| Cumulative Translation Adjustment |
| Equity Investees |
| Pension and OPEB Adjustment |
| Total |
| | (millions of Canadian dollars) | |
| |
| |
| |
| |
| |
| | Balance at January 1, 2019 | (770 | ) | (598 | ) | 4,323 |
| 34 |
| (317 | ) | 2,672 |
| | Other comprehensive income/(loss) retained in AOCI | (599 | ) | 320 |
| (2,927 | ) | 34 |
| (124 | ) | (3,296 | ) | | Other comprehensive (income)/loss reclassified to earnings | |
| |
| |
| |
| |
| |
| Interest rate contracts1 | 157 |
| — |
| — |
| — |
| — |
| 157 |
| Commodity contracts2 | (1 | ) | — |
| — |
| — |
| — |
| (1 | ) | Foreign exchange contracts3 | 5 |
| — |
| — |
| — |
| — |
| 5 |
| Other contracts4 | (3 | ) | — |
| — |
| — |
| — |
| (3 | ) | Amortization of pension and OPEB actuarial loss and prior service costs5 | — |
| — |
| — |
| — |
| 17 |
| 17 |
| | | (441 | ) | 320 |
| (2,927 | ) | 34 |
| (107 | ) | (3,121 | ) | | Tax impact | |
| |
| |
| |
| |
| |
| | Income tax on amounts retained in AOCI | 169 |
| (39 | ) | — |
| 6 |
| 28 |
| 164 |
| | Income tax on amounts reclassified to earnings | (31 | ) | — |
| — |
| — |
| (4 | ) | (35 | ) | | | 138 |
| (39 | ) | — |
| 6 |
| 24 |
| 129 |
| | Other | — |
| — |
| — |
| (7 | ) | 55 |
| 48 |
| | Balance at December 31, 2019 | (1,073 | ) | (317 | ) | 1,396 |
| 67 |
| (345 | ) | (272 | ) |
| | | | | | | | | | | | | | | | Cash Flow Hedges |
| Net Investment Hedges |
| Cumulative Translation Adjustment |
| Equity Investees |
| Pension and OPEB Adjustment |
| Total |
| | (millions of Canadian dollars) | | | | | | | | Balance at January 1, 2018 | (644 | ) | (139 | ) | 77 |
| 10 |
| (277 | ) | (973 | ) | | Other comprehensive income/(loss) retained in AOCI | (244 | ) | (509 | ) | 4,301 |
| 16 |
| (85 | ) | 3,479 |
| | Other comprehensive (income)/loss reclassified to earnings | | | | | | | Interest rate contracts1 | 157 |
| — |
| — |
| — |
| — |
| 157 |
| Commodity contracts2 | (1 | ) | — |
| — |
| — |
| — |
| (1 | ) | Foreign exchange contracts3 | 7 |
| — |
| — |
| — |
| — |
| 7 |
| Other contracts4 | 22 |
| — |
| — |
| — |
| — |
| 22 |
| Amortization of pension and OPEB actuarial loss and prior service costs5 | — |
| — |
| — |
| — |
| 16 |
| 16 |
| | | (59 | ) | (509 | ) | 4,301 |
| 16 |
| (69 | ) | 3,680 |
| | Tax impact | | | | | | | | Income tax on amounts retained in AOCI | 57 |
| 50 |
| — |
| 8 |
| 33 |
| 148 |
| | Income tax on amounts reclassified to earnings | (37 | ) | — |
| — |
| — |
| (4 | ) | (41 | ) | | | 20 |
| 50 |
| — |
| 8 |
| 29 |
| 107 |
| Sponsored Vehicles buy-in6 | (87 | ) | — |
| (55 | ) | — |
| — |
| (142 | ) | | Balance at December 31, 2018 | (770 | ) | (598 | ) | 4,323 |
| 34 |
| (317 | ) | 2,672 |
|
| | | | | | | | | | | | | | | | Cash Flow Hedges |
| Net Investment Hedges |
| Cumulative Translation Adjustment |
| Equity Investees |
| Pension and OPEB Adjustment |
| Total |
| | (millions of Canadian dollars) | | | | | | | | Balance at January 1, 2017 | (746 | ) | (629 | ) | 2,700 |
| 37 |
| (304 | ) | 1,058 |
| | Other comprehensive income/(loss) retained in AOCI | 1 |
| 478 |
| (2,623 | ) | (11 | ) | 18 |
| (2,137 | ) | | Other comprehensive (income)/loss reclassified to earnings | | | | | | | Interest rate contracts1 | 207 |
| — |
| — |
| — |
| — |
| 207 |
| Commodity contracts2 | (7 | ) | — |
| — |
| — |
| — |
| (7 | ) | Foreign exchange contracts3 | (6 | ) | — |
| — |
| — |
| — |
| (6 | ) | Other contracts4 | (6 | ) | — |
| — |
| — |
| — |
| (6 | ) | Amortization of pension and OPEB actuarial loss and prior service costs5 | — |
| — |
| — |
| — |
| 41 |
| 41 |
| | | 189 |
| 478 |
| (2,623 | ) | (11 | ) | 59 |
| (1,908 | ) | | Tax impact | | | | | | | | Income tax on amounts retained in AOCI | (16 | ) | 12 |
| — |
| (16 | ) | (10 | ) | (30 | ) | | Income tax on amounts reclassified to earnings | (71 | ) | — |
| — |
| — |
| (22 | ) | (93 | ) | | | (87 | ) | 12 |
| — |
| (16 | ) | (32 | ) | (123 | ) | | Balance at December 31, 2017 | (644 | ) | (139 | ) | 77 |
| 10 |
| (277 | ) | (973 | ) |
| | 1 | Reported within Interest expense in the Consolidated Statements of Earnings. |
| | 2 | Reported within Transportation and other services revenue, Commodity sales revenues, Commodity costs and Operating and administrative expense in the Consolidated Statements of Earnings. |
| | 3 | Reported within Transportation and other services revenues and Net foreign currency gain/(loss) in the Consolidated Statements of Earnings. |
| | 4 | Reported within Operating and administrative expense in the Consolidated Statements of Earnings. |
| | 5 | These components are included in the computation of net benefit costs and are reported within Other income/(expense) in the Consolidated Statements of Earnings. |
| | 6 | Represents the historical noncontrolling interests and redeemable noncontrolling interests related to the Sponsored Vehicles reclassified to AOCI, upon the completion of the buy-in. |
24. RISK MANAGEMENT AND FINANCIAL INSTRUMENTS
MARKET RISK
Our earnings, cash flows and OCI are subject to movements in foreign exchange rates, interest rates, commodity prices and our share price (collectively, market risks). Formal risk management policies, processes and systems have been designed to mitigate these risks.
The following summarizes the types of market risks to which we are exposed and the risk management instruments used to mitigate them. We use a combination of qualifying and non-qualifying derivative instruments to manage the risks noted below.
Foreign Exchange Risk
We generate certain revenues, incur expenses and hold a number of investments and subsidiaries that are denominated in currencies other than Canadian dollars. As a result, our earnings, cash flows and OCI are exposed to fluctuations resulting from foreign exchange rate variability.
We employ financial derivative instruments to hedge foreign currency denominated earnings exposure. A combination of qualifying and non-qualifying derivative instruments is used to hedge anticipated foreign currency denominated revenues and expenses and to manage variability in cash flows. We hedge certain net investments in United States dollar denominated investments and subsidiaries using foreign currency derivatives and United States dollar denominated debt.
Interest Rate Risk
Our earnings and cash flows are exposed to short-term interest rate variability due to the regular repricing of our variable rate debt, primarily commercial paper. We monitor our debt portfolio mix of fixed and variable rate debt instruments to manage a consolidated portfolio of floating rate debt within the Board of Directors approved policy limit of a maximum of 30% of floating rate debt as a percentage of total debt outstanding. We primarily use qualifying derivative instruments to manage interest rate risk. Pay fixed-receive floating interest rate swaps may be used to hedge against the effect of future interest rate movements. We have implemented a program to significantly mitigate the impact of short-term interest rate volatility on interest expense via execution of floating to fixed interest rate swaps with an average swap rate of 2.9%.
We are exposed to changes in the fair value of fixed rate debt that arise as a result of the changes in market interest rates. Pay floating-receive fixed interest rate swaps are used, when applicable, to hedge against future changes to the fair value of fixed rate debt which mitigates the impact of fluctuations in the fair value of fixed rate debt via execution of fixed to floating interest rate swaps. As at December 31, 2019, we do not have any pay floating-receive fixed interest rate swaps outstanding.
Our earnings and cash flows are also exposed to variability in longer term interest rates ahead of anticipated fixed rate term debt issuances. Forward starting interest rate swaps are used to hedge against the effect of future interest rate movements. We have established a program within some of our subsidiaries to mitigate our exposure to long-term interest rate variability on select forecast term debt issuances via execution of floating to fixed interest rate swaps with an average swap rate of 3%.
Commodity Price Risk
Our earnings and cash flows are exposed to changes in commodity prices as a result of our ownership interests in certain assets and investments, as well as through the activities of our energy services subsidiaries. These commodities include natural gas, crude oil, power and NGL. We employ financial and physical derivative instruments to fix a portion of the variable price exposures that arise from physical transactions involving these commodities. We use primarily non-qualifying derivative instruments to manage commodity price risk.
Equity Price Risk
Equity price risk is the risk of earnings fluctuations due to changes in our share price. We have exposure to our own common share price through the issuance of various forms of stock-based compensation, which affect earnings through revaluation of the outstanding units every period. We use equity derivatives to manage the earnings volatility derived from one form of stock-based compensation, restricted share units. We use a combination of qualifying and non-qualifying derivative instruments to manage equity price risk.
TOTAL DERIVATIVE INSTRUMENTS
The following table summarizes the Consolidated Statements of Financial Position location and carrying value of our derivative instruments.
We generally have a policy of entering into individual International Swaps and Derivatives Association, Inc. agreements, or other similar derivative agreements, with the majority of our financial derivative counterparties. These agreements provide for the net settlement of derivative instruments outstanding with specific counterparties in the event of bankruptcy or other significant credit events and reduce our credit risk exposure on financial derivative asset positions outstanding with the counterparties in those circumstances. The following table summarizes the maximum potential settlement amounts in the event of these specific circumstances. All amounts are presented gross in the Consolidated Statements of Financial Position.
The following table summarizes the maximum potential settlement amounts in the event of these specific circumstances. All amounts are presented gross in the Consolidated Statements of Financial Position.
| | | | | | | | | | | | | | | | December 31, 2019 | Derivative Instruments Used as Cash Flow Hedges |
| Derivative Instruments Used as Net Investment Hedges |
| Non- Qualifying Derivative Instruments |
| Total Gross Derivative Instruments as Presented |
| | Amounts Available for Offset |
| Total Net Derivative Instruments |
| | (millions of Canadian dollars) | |
| |
| |
| |
| | |
| |
| | Accounts receivable and other | |
| |
| |
| |
| | |
| |
| | Foreign exchange contracts | — |
| — |
| 161 |
| 161 |
| | (78 | ) | 83 |
| | Commodity contracts | — |
| — |
| 163 |
| 163 |
| | (47 | ) | 116 |
| | Other contracts | 1 |
| — |
| 3 |
| 4 |
| | — |
| 4 |
| | | 1 |
| — |
| 327 |
| 328 |
| 1 | (125 | ) | 203 |
| | Deferred amounts and other assets | |
| |
| |
| | | |
| | | Foreign exchange contracts | 10 |
| — |
| 71 |
| 81 |
| | (42 | ) | 39 |
| | Commodity contracts | — |
| — |
| 17 |
| 17 |
| | (2 | ) | 15 |
| | Other contracts | 2 |
| — |
| 1 |
| 3 |
| | — |
| 3 |
| | | 12 |
| — |
| 89 |
| 101 |
| | (44 | ) | 57 |
| | Accounts payable and other | |
| |
| |
| | | |
| | | Foreign exchange contracts | (5 | ) | (13 | ) | (392 | ) | (410 | ) | | 78 |
| (332 | ) | | Interest rate contracts | (353 | ) | — |
| — |
| (353 | ) | | — |
| (353 | ) | | Commodity contracts | — |
| — |
| (173 | ) | (173 | ) | | 47 |
| (126 | ) | | | (358 | ) | (13 | ) | (565 | ) | (936 | ) | 2 | 125 |
| (811 | ) | | Other long-term liabilities | |
| |
| |
| | | |
| | | Foreign exchange contracts | — |
| — |
| (934 | ) | (934 | ) | | 42 |
| (892 | ) | | Interest rate contracts | (181 | ) | — |
| — |
| (181 | ) | | — |
| (181 | ) | | Commodity contracts | (5 | ) | — |
| (60 | ) | (65 | ) | | 2 |
| (63 | ) | | | (186 | ) | — |
| (994 | ) | (1,180 | ) | | 44 |
| (1,136 | ) | | Total net derivative asset/(liability) | |
| |
| |
| | | |
| | | Foreign exchange contracts | 5 |
| (13 | ) | (1,094 | ) | (1,102 | ) | | — |
| (1,102 | ) | | Interest rate contracts | (534 | ) | — |
| — |
| (534 | ) | | — |
| (534 | ) | | Commodity contracts | (5 | ) | — |
| (53 | ) | (58 | ) | | — |
| (58 | ) | | Other contracts | 3 |
| — |
| 4 |
| 7 |
| | — |
| 7 |
| | | (531 | ) | (13 | ) | (1,143 | ) | (1,687 | ) | | — |
| (1,687 | ) |
| | 1 | Reported within Accounts receivable and other (2019 - $327 million; 2018 - $498 million) and Accounts receivable from affiliates (2019 - $1 million; 2018 - NaN) on the Consolidated Statements of Financial Position. |
| | 2 | Reported within Accounts payable and other (2019 - $920 million; 2018 - $1,234 million) and Accounts payable to affiliates (2019 - $16 million; 2018 - NaN) on the Consolidated Statements of Financial Position. |
| | | | | | | | | | | | | | | December 31, 2018 | Derivative
Instruments
Used as
Cash Flow Hedges |
| Derivative
Instruments
Used as Net Investment Hedges |
| Non-
Qualifying
Derivative Instruments |
| Total Gross
Derivative
Instruments as Presented |
| Amounts
Available for Offset |
| Total Net Derivative Instruments |
| | (millions of Canadian dollars) | |
| |
| |
| |
| |
| |
| | Accounts receivable and other | |
| |
| |
| |
| |
| |
| | Foreign exchange contracts | — |
| — |
| 47 |
| 47 |
| (37 | ) | 10 |
| | Interest rate contracts | 22 |
| — |
| — |
| 22 |
| (2 | ) | 20 |
| | Commodity contracts | 2 |
| — |
| 427 |
| 429 |
| (114 | ) | 315 |
| | | 24 |
| — |
| 474 |
| 498 |
| (153 | ) | 345 |
| | Deferred amounts and other assets | |
| |
| |
| | |
| | | Foreign exchange contracts | 23 |
| — |
| 39 |
| 62 |
| (39 | ) | 23 |
| | Interest rate contracts | 5 |
| — |
| — |
| 5 |
| — |
| 5 |
| | Commodity contracts | 19 |
| — |
| 33 |
| 52 |
| (21 | ) | 31 |
| | | 47 |
| — |
| 72 |
| 119 |
| (60 | ) | 59 |
| | Accounts payable and other | |
| |
| |
| | |
| | | Foreign exchange contracts | (5 | ) | — |
| (610 | ) | (615 | ) | 37 |
| (578 | ) | | Interest rate contracts | (163 | ) | — |
| (178 | ) | (341 | ) | 2 |
| (339 | ) | | Commodity contracts | — |
| — |
| (273 | ) | (273 | ) | 114 |
| (159 | ) | | Other contracts | (1 | ) | — |
| (4 | ) | (5 | ) | — |
| (5 | ) | | | (169 | ) | — |
| (1,065 | ) | (1,234 | ) | 153 |
| (1,081 | ) | | Other long-term liabilities | |
| |
| |
| | |
| | | Foreign exchange contracts | (1 | ) | (15 | ) | (2,196 | ) | (2,212 | ) | 39 |
| (2,173 | ) | | Interest rate contracts | (201 | ) | — |
| — |
| (201 | ) | — |
| (201 | ) | | Commodity contracts | — |
| — |
| (178 | ) | (178 | ) | 21 |
| (157 | ) | | Other contracts | (1 | ) | — |
| (1 | ) | (2 | ) | — |
| (2 | ) | | | (203 | ) | (15 | ) | (2,375 | ) | (2,593 | ) | 60 |
| (2,533 | ) | | Total net derivative asset/(liability) | |
| |
| |
| | |
| | | Foreign exchange contracts | 17 |
| (15 | ) | (2,720 | ) | (2,718 | ) | — |
| (2,718 | ) | | Interest rate contracts | (337 | ) | — |
| (178 | ) | (515 | ) | — |
| (515 | ) | | Commodity contracts | 21 |
| — |
| 9 |
| 30 |
| — |
| 30 |
| | Other contracts | (2 | ) | — |
| (5 | ) | (7 | ) | — |
| (7 | ) | | | (301 | ) | (15 | ) | (2,894 | ) | (3,210 | ) | — |
| (3,210 | ) |
The following table summarizes the maturity and notional principal or quantity outstanding related to our derivative instruments.
| | | | | | | | | | | | | | | | | | | | | | | 2019 | | | | 2018 |
| | | As at December 31, | 2020 |
| 2021 |
| 2022 |
| 2023 |
| 2024 |
| Thereafter |
| | Total |
| | Total |
| | Foreign exchange contracts - United States dollar forwards - purchase (millions of United States dollars) | 1,121 |
| — |
| — |
| — |
| — |
| — |
| | 1,121 |
| | 926 |
| | Foreign exchange contracts - United States dollar forwards - sell (millions of United States dollars) | 5,631 |
| 4,946 |
| 5,182 |
| 1,804 |
| 1,856 |
| — |
| | 19,419 |
| | 19,075 |
| | Foreign exchange contracts - GBP forwards - sell (millions of GBP) | 94 |
| 27 |
| 28 |
| 29 |
| 30 |
| 90 |
| | 298 |
| | 318 |
| | Foreign exchange contracts - Euro forwards - purchase (millions of Euro) | — |
| — |
| — |
| — |
| — |
| — |
| | — |
| | 226 |
| | Foreign exchange contracts - Euro forwards - sell (millions of Euro) | 23 |
| 94 |
| 94 |
| 92 |
| 91 |
| 515 |
| | 909 |
| | 909 |
| | Foreign exchange contracts - Japanese yen forwards - purchase (millions of yen) | — |
| — |
| 72,500 |
| — |
| — |
| — |
| | 72,500 |
| | 52,662 |
| | Interest rate contracts - short-term pay fixed rate (millions of Canadian dollars) | 6,090 |
| 4,090 |
| 400 |
| 48 |
| 35 |
| 121 |
| | 10,784 |
| | 19,664 |
| | Interest rate contracts - long-term pay fixed rate (millions of Canadian dollars) | 3,533 |
| 1,569 |
| — |
| — |
| — |
| — |
| | 5,102 |
| | 8,558 |
| | Equity contracts (millions of Canadian dollars) | 20 |
| 34 |
| — |
| — |
| — |
| — |
| | 54 |
| | 55 |
| | Commodity contracts - natural gas (billions of cubic feet) | (33 | ) | 14 |
| 15 |
| 3 |
| — |
| — |
| | (1 | ) | | (167 | ) | | Commodity contracts - crude oil (millions of barrels) | 28 |
| — |
| — |
| — |
| — |
| — |
| | 28 |
| | 4 |
| | Commodity contracts - NGL (millions of barrels) | 2 |
| — |
| — |
| — |
| — |
| — |
| | 2 |
| | — |
| | Commodity contracts - power (megawatt per hour (MW/H) | 80 |
| (3 | ) | (43 | ) | (43 | ) | (43 | ) | (43 | ) | 1 | (16 | ) | 2 | (7 | ) | 2 |
| | 1 | As at December 31, 2019, thereafter includes an average net purchase/(sell) of power of (43) MW/H for 2025. |
| | 2 | Total is an average net purchase/(sell) of power. |
The Effect of Derivative Instruments on the Statements of Earnings and Comprehensive Income
The following table presents the effect of cash flow hedges and net investment hedges on our consolidated earnings and consolidated comprehensive income, before the effect of income taxes:
| | | | | | | | | | 2019 |
| 2018 |
| 2017 |
| | (millions of Canadian dollars) | |
| |
| |
| | Amount of unrealized gain/(loss) recognized in OCI | |
| |
| |
| | Cash flow hedges | |
| |
| |
| | Foreign exchange contracts | (19 | ) | 19 |
| (5 | ) | | Interest rate contracts | (559 | ) | (190 | ) | 6 |
| | Commodity contracts | (25 | ) | 2 |
| 11 |
| | Other contracts | 10 |
| (3 | ) | 1 |
| | Net investment hedges | |
| |
| |
| | Foreign exchange contracts | 2 |
| 31 |
| 284 |
| | | (591 | ) | (141 | ) | 297 |
| | Amount of (gain)/loss reclassified from AOCI to earnings | |
| |
| |
| Foreign exchange contracts1 | 5 |
| 5 |
| (104 | ) | Interest rate contracts2,3 | 157 |
| 184 |
| 384 |
| Commodity contracts4 | (1 | ) | (1 | ) | (9 | ) | Other contracts5 | (3 | ) | 3 |
| 8 |
| | | 158 |
| 191 |
| 279 |
|
| | 1 | Reported within Transportation and other services revenues and Net foreign currency gain/(loss) in the Consolidated Statements of Earnings. |
| | 2 | Reported within Interest expense in the Consolidated Statements of Earnings. Effective January 1, 2019, hedge ineffectiveness will no longer be measured or recorded. See Note 2. |
| | 3 | For the year ended December 31, 2017, includes settlements of $296 million loss related to the termination of long-term interest rate swaps as not highly probable to issue long-term debt. |
| | 4 | Reported within Transportation and other services revenue, Commodity sales revenues, Commodity costs and Operating and administrative expense in the Consolidated Statements of Earnings. |
| | 5 | Reported within Operating and administrative expenses in the Consolidated Statements of Earnings. |
We estimate that a loss of $80 million from AOCI related to cash flow hedges will be reclassified to earnings in the next 12 months. Actual amounts reclassified to earnings depend on the foreign exchange rates, interest rates and commodity prices in effect when derivative contracts that are currently outstanding mature. For all forecasted transactions, the maximum term over which we are hedging exposures to the variability of cash flows is 24 months as at December 31, 2019.2020.
|
| Fair Value DerivativesReflects a lump sum payment equal to three times (for Mr. Monaco) and two times (for Messrs. Gruending, Yardley, Yu and Rooney) the average of the short-term incentive award paid to the NEO in the two years preceding the year in which the termination occurs. In addition, the amount the NEO would receive as short-term incentive payment for the current year is reflected in the 2020 summary compensation table. |
For interest rate derivative instruments5 | Represents the value of RSUs and PSUs that are designatedwould vest and qualify as fair value hedges,be settled in cash upon the gain or losstriggering event, based on C$40.71 for awards granted in Canadian dollars and US$31.99 for awards granted in U.S. dollars, the closing price of an Enbridge share on the derivativeTSX and NYSE, respectively, on December 31, 2020 and assuming, in the case of PSUs, target performance. For PSUs and RSUs, severance period, as welloutlined in the executive employment agreement, counts towards active service when prorating for termination without cause. |
| Represents thevalue” of unvested ISOs as of December 31, 2020, that would be paid in cash (as a result of an involuntary termination without cause) or that would become vested (as a result of an involuntary or good reason termination after a Change in Control or retirement).value is calculated as C$40.71 for awards granted in Canadian dollars and US$31.99 for awards granted in U.S. dollars, the offsetting loss or gainclosing price of an Enbridge share on the hedged item attributable toTSX and NYSE, respectively, on December 31, 2020, less the hedged risk is included in Interest expense inapplicable exercise price of the Consolidated Statements of Earnings.option.
|
| | | | | | | Year ended December 31, | 2019 |
| 2018 |
| | (millions of Canadian dollars) | | | | Unrealized gain on derivative | — |
| 7 |
| | Unrealized gain on hedged item | — |
| 1 |
| | Realized loss on derivative | — |
| (8 | ) | | Realized loss on hedged item | — |
| (1 | ) |
|
Non-Qualifying Derivatives
The following table presentsReflects the unrealized gains and losses associated with changes in the fair value of our non-qualifying derivatives:
three additional years of pension credit for Mr. Monaco and two additional years of pension credit for each of Messrs. Gruending, Yardley, Yu and Rooney. | | | | | | | | | Year ended December 31, | 2019 |
| 2018 |
| 2017 |
| | (millions of Canadian dollars) | |
| |
| |
| Foreign exchange contracts1 | 1,626 |
| (1,390 | ) | 1,284 |
| Interest rate contracts2 | 178 |
| 5 |
| 157 |
| Commodity contracts3 | (62 | ) | 485 |
| (199 | ) | Other contracts4 | 9 |
| (3 | ) | — |
| | Total unrealized derivative fair value gain/(loss), net | 1,751 |
| (903 | ) | 1,242 |
|
| | 1 | For the respective annual periods, reported within Transportation and other services revenue (2019 - $930 million gain; 2018 - $1,108 million loss; 2017 - $800 million gain) and Net foreign currency gain/(loss) (2019 - $696 million gain; 2018 - $282 million loss; 2017 - $484 million gain) in the Consolidated Statements of Earnings. |
| | 2 | Reported as a decrease within Interest expense in the Consolidated Statements | Reflects a lump sum cash payment in respect of Earnings. |
| | 3 | For the respective annual periods, reported within Transportation and other services revenue (2019 - $26 million loss; 2018 - $66 million gain; 2017 - $104 million loss), Commodity sales (2019 - $544 million loss; 2018 - $599 million gain; 2017 - $90 million gain), Commodity costs (2019 - $459 million gain; 2018 - $193 million loss; 2017 - $223 million loss) and Operating and administrative expense (2019 - $49 million gain; 2018 - $13 million gain; 2017 - $38 million gain) in the Consolidated Statements of Earnings. |
| | 4 | Reported within Operating and administrative expense in the Consolidated Statements of Earnings. |
LIQUIDITY RISK
Liquidity risk is the riskflex credit allowance, vacation carryover and savings plan matching contributions that we will not be able to meet our financial obligations, including commitments and guarantees, as they become due. In order to mitigate this risk, we forecast cash requirementswould have been paid by Enbridge in respect of the NEO over a 12-month rolling time period to determine whether sufficient funds will be availableof three years (for Mr. Monaco) or two years (for each of Messrs. Gruending, Yardley, Yu and maintain substantial capacity under our committed bank linesRooney) following the executive’s termination, plus an allowance for financial and career counselling.
|
| Amounts shown for Mr. Whelen represent the value on his departure date, with payout value of credit to address any contingencies. Our primary sources of liquidity and capital resources are funds generated from operations, the issuance of commercial paper and draws under committed credit facilitiesunvested medium- and long-term debt, which includes debentures and medium-term notes. We also maintain current shelf prospectuses with securities regulators which enables ready access to either the Canadian or United States public capital markets, subject to market conditions. In addition, we maintain sufficient liquidity through committed credit facilities with a diversified group of banks and institutions which, if necessary, enables us to fund all anticipated requirements for approximately one year without accessing the capital markets. We are in compliance with all the terms and conditions of our committed credit facility agreements and term debt indentures as at December 31, 2019. As a result, all credit facilities are available to us and the banks are obligated to fund and have been funding us under the terms of the facilities.
CREDIT RISK
Entering into derivative instruments may result in exposure to credit risk from the possibility that a counterparty will default on its contractual obligations. In order to mitigate this risk, we enter into risk management transactions primarily with institutions that possess strong investment grade credit ratings. Credit risk relating to derivative counterparties is mitigated through maintenance and monitoring of credit exposure limits and contractual requirements, netting arrangements, and ongoing monitoring of counterparty credit exposure using external credit rating services and other analytical tools.
We have credit concentrations and credit exposure, with respect to derivative instruments, in the following counterparty segments:
| | | | | | | December 31, | 2019 |
| 2018 |
| | (millions of Canadian dollars) | |
| |
| | Canadian financial institutions | 146 |
| 28 |
| | United States financial institutions | 40 |
| 107 |
| | European financial institutions | 3 |
| 84 |
| | Asian financial institutions | 92 |
| 6 |
| Other1 | 113 |
| 337 |
| | | 394 |
| 562 |
|
| | 1 | Other is comprised of commodity clearing house and physical natural gas and crude oil counterparties. |
As at December 31, 2019, we provided letters of credit totaling NaN in lieu of providing cash collateral to our counterparties pursuant to the terms of the relevant International Swaps and Derivatives Association agreements. We held 0 cash collateral on derivative asset exposures as at December 31, 2019 and December 31, 2018.
Gross derivative balances have been presented without the effects of collateral posted. Derivative assets are adjusted for non-performance risk of our counterparties using their credit default swap spread rates, and are reflected at fair value. For derivative liabilities, our non-performance risk is considered in the valuation.
Credit risk also arises from trade and other long-term receivables, and is mitigated through credit exposure limits and contractual requirements, assessment of credit ratings and netting arrangements. Within Enbridge Gas, credit risk is mitigated by the utilities' large and diversified customer base and the ability to recover an estimate for doubtful accounts through the ratemaking process. We actively monitor the financial strength of large industrial customers and, in select cases, have obtained additional security to minimize the risk of default on receivables. Generally, we classify and provide for receivables older than 30 days as past due. The maximum exposure to credit risk related to non-derivative financial assets is their carrying value.
FAIR VALUE MEASUREMENTS
Our financial assets and liabilities measured at fair value on a recurring basis include derivative instruments. We also disclose the fair value of other financial instruments not measured at fair value. The fair value of financial instruments reflects our best estimates of market value based on generally accepted valuation techniques or models and is supported by observable market prices and rates. When such values are not available, we use discounted cash flow analysis from applicable yield curves based on observable market inputs to estimate fair value.
FAIR VALUE OF FINANCIAL INSTRUMENTS
We categorize our derivative instruments measured at fair value into one of three different levels depending on the observability of the inputs employed in the measurement.
Level 1
Level 1 includes derivatives measured at fair value based on unadjusted quoted prices for identical assets and liabilities in active markets that are accessible at the measurement date. An active market for a derivative is considered to be a market where transactions occur with sufficient frequency and volume to provide pricing information on an ongoing basis. Our Level 1 instruments consist primarily of exchange traded derivatives used to mitigate the risk of crude oil price fluctuations.
Level 2
Level 2 includes derivative valuations determined using directly or indirectly observable inputs other than quoted prices included within Level 1. Derivatives in this category are valued using models or other industry standard valuation techniques derived from observable market data. Such valuation techniques include inputs such as quoted forward prices, time value, volatility factors and broker quotes that can be observed or corroborated in the market for the entire duration of the derivative. Derivatives valued using Level 2 inputs include non-exchange traded derivatives such as over-the-counter foreign exchange forward and cross currency swap contracts, interest rate swaps, physical forward commodity contracts, as well as commodity swaps and options for which observable inputs can be obtained.
We have also categorized the fair value of our held to maturity preferred share investment and long-term debt as Level 2. The fair value of our held to maturity preferred share investment is primarilyincentives based on the yieldclosing price of certain Governmentan Enbridge share on the TSX on November 13, 2020 of Canada bonds. The fair value of our long-term debt is based on quoted market prices for instruments of similar yield, credit risk$37.38.
|
Additional equity compensation information Enbridge shares used for purposes of equity compensation Enbridge has two “prior stock option plans” which were approved by Enbridge shareholders in 2007, as follows: Enbridge Inc. Incentive Stock Option Plan (2007), as revised (“Incentive stock option plan”); and Enbridge Inc. Performance Stock Option Plan (2007), as amended and restated (2011) and further amended (2012 and 2014) (“Performance stock option plan”). The Performance stock option plan was historically used to grant options, but no options have been granted under it since 2014. Enbridge adopted the 2019 LTIP effective February 13, 2019, under which stock options were granted beginning in 2019. Beginning in 2020, share-settled RSUs were granted under the 2019 LTIP. The 2019 LTIP was approved by our shareholders at our 2019 annual meeting of shareholders. No further awards have been or will be granted under the Incentive stock option plan or Performance stock option plan after February 13, 2019, and all shares still available to be issued and not subject to awards under these prior stock option plans became available under the 2019 LTIP. Shares reserved for equity compensation as of December 31, 2020 | | | | | | | | | | | | | | | | | | | | | | | | | | | | | | Number of securities to
be issued upon exercise
of outstanding options,
warrants and rights
(#) | | | Weighted-average exercise price of outstanding options, warrants and rights ($) | | | Number of securities remaining
available for future issue under
equity compensation plans
(excluding securities reflected
in column A) | | | | | | | | | 11,683,418 | | | | 50.91 | | | | 38,016,582 | | | | | | Prior stock option plans 1 | | | 24,146,312 | | | | 48.82 | | | | — | | | | | | | | | 775,806 | | | | 36.78 | | | | — | | | | | | | | | | | | | | | | |
| 1.8770% of total issued and
outstanding Enbridge shares |
|
| Includes 24,146,312 options outstanding under the Incentive stock option plan and tenor. Level 3
Level 3 includes derivative valuations based on inputs which are less observable, unavailable or whereno options outstanding under the observable data does not support a significant portionPerformance stock option plan.
|
| Awards granted under the Spectra 2007 LTIP were assumed by Enbridge at the closing of the derivatives’ fair value. Generally, Level 3 derivatives are longer dated transactions, occurMerger Transaction, as described in less active markets, occur at locations where pricing information is not availablethe “Assumed equity-based compensation awards from Spectra Energy” section. No further awards have been or have no binding broker quote to support Level 2 classification. We have developed methodologies, benchmarked against industry standards, to determine fair value for these derivatives based on extrapolation of observable future prices and rates. Derivatives valued using Level 3 inputs primarily include long-dated derivative power contracts and NGL and natural gas contracts, basis swaps, commodity swaps, power and energy swaps, as well as options. We do not have any other financial instruments categorized in Level 3.
We usewill be granted under the most observable inputs available to estimateSpectra 2007 LTIP following the fair value of our derivatives. When possible, we estimate the fair value of our derivatives based on quoted market prices. If quoted market prices are not available, we use estimates from third party brokers. For non-exchange traded derivatives classified in Levels 2 and 3, we use standard valuation techniques to calculate the estimated fair value. These methods include discounted cash flows for forwards and swaps and Black-Scholes-Merton pricing models for options. Depending on the type of derivative and natureclosing of the underlying risk, we use observable market prices (interest, foreign Merger Transaction.
|
| U.S. dollars have been converted to Canadian dollars using the published WM/Reuters 4 pm Londonyear-end exchange commodityrate of US$1 = C$1.2740. |
| This weighted-average exercise price relates only to options granted under the 2019 LTIP. All other awards granted under the 2019 LTIP are deliverable without the payment of any consideration, and share price) and volatilitytherefore these awards have not been considered in calculating the weighted average exercise price. |
Awards granted and outstanding as of December 31, 2020 | | | | | | | | | | | | | | | | | outstanding Enbridge shares | | | | | | | | 11,683,418 | | | | 0.5768 | | | | | Incentive stock option plan | | | 24,146,312 | | | | 1.1922 | | | | | Performance stock option plan | | | 0 | | | | 0.0000 | | | | | Spectra 2007 LTIP – stock options 1 | | | 775,806 | | | | 0.0383 | |
| Awards granted under the Spectra 2007 LTIP as primary inputs to these valuation techniques. Finally, we consider our own credit default swap spread as well as the credit default swap spreads associated with our counterparties in our estimation of fair value.
We have categorized our derivative assets and liabilities measured at fair value as follows:
| | | | | | | | | | | December 31, 2019 | Level 1 |
| Level 2 |
| Level 3 |
| Total Gross Derivative Instruments |
| | (millions of Canadian dollars) | |
| |
| |
| |
| | Financial assets | |
| |
| |
| |
| | Current derivative assets | |
| |
| |
| |
| | Foreign exchange contracts | — |
| 161 |
| — |
| 161 |
| | Commodity contracts | — |
| 33 |
| 130 |
| 163 |
| | Other contracts | — |
| 4 |
| — |
| 4 |
| | | — |
| 198 |
| 130 |
| 328 |
| | Long-term derivative assets | |
| |
| |
| | | Foreign exchange contracts | — |
| 81 |
| — |
| 81 |
| | Commodity contracts | — |
| 12 |
| 5 |
| 17 |
| | Other contracts | — |
| 3 |
| — |
| 3 |
| | | — |
| 96 |
| 5 |
| 101 |
| | Financial liabilities | |
| |
| |
| | | Current derivative liabilities | |
| |
| |
| | | Foreign exchange contracts | — |
| (410 | ) | — |
| (410 | ) | | Interest rate contracts | — |
| (353 | ) | — |
| (353 | ) | | Commodity contracts | (5 | ) | (23 | ) | (145 | ) | (173 | ) | | Other contracts | — |
| — |
| — |
| — |
| | | (5 | ) | (786 | ) | (145 | ) | (936 | ) | | Long-term derivative liabilities | |
| |
| |
| | | Foreign exchange contracts | — |
| (934 | ) | — |
| (934 | ) | | Interest rate contracts | — |
| (181 | ) | — |
| (181 | ) | | Commodity contracts | — |
| (6 | ) | (59 | ) | (65 | ) | | Other contracts | — |
| — |
| — |
| — |
| | | — |
| (1,121 | ) | (59 | ) | (1,180 | ) | | Total net financial asset/(liability) | |
| |
| |
| | | Foreign exchange contracts | — |
| (1,102 | ) | — |
| (1,102 | ) | | Interest rate contracts | — |
| (534 | ) | — |
| (534 | ) | | Commodity contracts | (5 | ) | 16 |
| (69 | ) | (58 | ) | | Other contracts | — |
| 7 |
| — |
| 7 |
| | | (5 | ) | (1,613 | ) | (69 | ) | (1,687 | ) |
| | | | | | | | | | | December 31, 2018 | Level 1 |
| Level 2 |
| Level 3 |
| Total Gross Derivative Instruments |
| | (millions of Canadian dollars) | |
| |
| |
| |
| | Financial assets | |
| |
| |
| |
| | Current derivative assets | |
| |
| |
| |
| | Foreign exchange contracts | — |
| 47 |
| — |
| 47 |
| | Interest rate contracts | — |
| 22 |
| — |
| 22 |
| | Commodity contracts | 24 |
| 45 |
| 360 |
| 429 |
| | | 24 |
| 114 |
| 360 |
| 498 |
| | Long-term derivative assets | |
| |
| |
| | | Foreign exchange contracts | — |
| 62 |
| — |
| 62 |
| | Interest rate contracts | — |
| 5 |
| — |
| 5 |
| | Commodity contracts | — |
| 30 |
| 22 |
| 52 |
| | | — |
| 97 |
| 22 |
| 119 |
| | Financial liabilities | |
| |
| |
| | | Current derivative liabilities | |
| |
| |
| | | Foreign exchange contracts | — |
| (615 | ) | — |
| (615 | ) | | Interest rate contracts | — |
| (341 | ) | — |
| (341 | ) | | Commodity contracts | (7 | ) | (28 | ) | (238 | ) | (273 | ) | | Other contracts | — |
| (5 | ) | — |
| (5 | ) | | | (7 | ) | (989 | ) | (238 | ) | (1,234 | ) | | Long-term derivative liabilities | |
| |
| |
| | | Foreign exchange contracts | — |
| (2,212 | ) | — |
| (2,212 | ) | | Interest rate contracts | — |
| (201 | ) | — |
| (201 | ) | | Commodity contracts | — |
| (23 | ) | (155 | ) | (178 | ) | | Other contracts | — |
| (2 | ) | — |
| (2 | ) | | | — |
| (2,438 | ) | (155 | ) | (2,593 | ) | | Total net financial asset/(liability) | |
| |
| |
| | | Foreign exchange contracts | — |
| (2,718 | ) | — |
| (2,718 | ) | | Interest rate contracts | — |
| (515 | ) | — |
| (515 | ) | | Commodity contracts | 17 |
| 24 |
| (11 | ) | 30 |
| | Other contracts | — |
| (7 | ) | — |
| (7 | ) | | | 17 |
| (3,216 | ) | (11 | ) | (3,210 | ) |
The significant unobservable inputs useddescribed in the fair value measurement of Level 3 derivative instruments were as follows:
“Assumed equity-based compensation awards from Spectra Energy” section. | | | | | | | | | | December 31, 2019 | Fair Value |
| Unobservable Input | Minimum Price/Volatility | Maximum Price/Volatility | Weighted Average Price/Volatility | Unit of Measurement | | (fair value in millions of Canadian dollars) | |
| | | | | | Commodity contracts - financial1 | |
| | | | | | | Natural gas | — |
| Forward gas price | 1.95 | 4.88 | 3.04 | $/mmbtu2 | | Crude | 4 |
| Forward crude price | 44.24 | 82.29 | 52.76 | $/barrel | | NGL | 3 |
| Forward NGL price | 0.54 | 0.86 | 0.82 | $/gallon | | Power | (61 | ) | Forward power price | 27.84 | 71.79 | 57.46 | $/MW/H | Commodity contracts - physical1 | |
| | | | | | | Natural gas | 28 |
| Forward gas price | 1.00 | 8.37 | 2.53 | $/mmbtu2 | | Crude | (45 | ) | Forward crude price | 40.20 | 90.75 | 70.27 | $/barrel | | NGL | 2 |
| Forward NGL price | 0.18 | 2.01 | 0.79 | $/gallon | | | (69 | ) | | | | | |
| | 1 | Financial and physical forward commodity contracts are valued using a market approach valuation technique. |
| | 2 | One million British thermal units (mmbtu). |
If adjusted, the significant unobservable inputs disclosed in the table above would have a direct impact on the fair value of our Level 3 derivative instruments. The significant unobservable inputs used in the fair value measurement of Level 3 derivative instruments include forward commodity prices, and for option contracts, price volatility. Changes in forward commodity prices could result in significantly different fair values for our Level 3 derivatives. Changes in price volatility would change the value of the option contracts. Generally, a change in the estimate of forward commodity prices is unrelated to a change in the estimate of price volatility.
Changes in net fair value of derivative assets and liabilities classified as Level 3 in the fair value hierarchy were as follows:
| | | | | | | Year ended December 31, | 2019 |
| 2018 |
| | (millions of Canadian dollars) | |
| |
| | Level 3 net derivative liability at beginning of period | (11 | ) | (387 | ) | | Total gain/(loss) | |
| |
| Included in earnings1 | 27 |
| 206 |
| | Included in OCI | (25 | ) | 2 |
| | Settlements | (60 | ) | 168 |
| | Level 3 net derivative liability at end of period | (69 | ) | (11 | ) |
| | 1 | Reported within Transportation and other services revenue, Commodity costs and Operating and administrative expenses in the Consolidated Statements of Earnings. |
Our policy is to recognize transfers as at the last day of the reporting period. There were no transfers between levels as at December 31, 2019 or 2018.
FAIR VALUE OF OTHER FINANCIAL INSTRUMENTS
Our other long-term investments in other entities with no actively quoted prices are classified as Fair Value Measurement Alternative (FVMA) investments and are recorded at cost less impairment. The carrying value of FVMA and other long-term investments totaled $99 million and $102 million as at December 31, 2019 and 2018, respectively.
We have Restricted long-term investments held in trust totaling $434 million and $323 million as at December 31, 2019 and 2018, respectively, which are recognized at fair value.
We have a held to maturity preferred share investment carried at its amortized cost of $580 million and $478 million as at December 31, 2019 and 2018, respectively. These preferred shares are entitled to a cumulative preferred dividend based on the yield of 10-year Government of Canada bonds plus a margin of 4.38%. The fair value of this preferred share investment approximates its face value of $580 million as at December 31, 2019 and 2018.
As at December 31, 2019 and 2018, our long-term debt had a carrying value of $64.4 billion and $63.9 billion, respectively, before debt issuance costs and a fair value of $70.5 billion and $64.4 billion, respectively. We also have non-current notes receivable carried at book value and recorded in Deferred amounts and other assets in the Consolidated Statements of Financial Position. As at December 31, 2019 and 2018, the non-current notes receivable had a carrying value of $1,026 million and $767 million, respectively, which also approximates their fair value.
The fair value of other financial assets and liabilities other than derivative instruments, other long-term investments, restricted long-term investments and long-term debt approximate their cost due to the short period to maturity.
NET INVESTMENT HEDGES
We have designated a portion of our United States dollar denominated debt, as well as a portfolio of foreign exchange forward contracts, as a hedge of our net investment in United States dollar denominated investments and subsidiaries.
During the years ended December 31, 2019 and 2018, we recognized an unrealized foreign exchange gain of $317 million and a loss of $479 million, respectively, on the translation of United States dollar denominated debt and an unrealized gain on the change in fair value of our outstanding foreign exchange forward contracts of $2 million and $30 million, respectively, in OCI. During the years ended December 31, 2019 and 2018, we recognized a realized loss of NaN and $45 million, respectively, in OCI associated with the settlement of foreign exchange forward contracts and also recognized a realized loss of NaN and loss of $14 million, respectively, in OCI associated with the settlement of United States dollar denominated debt that had matured during the period.
25. INCOME TAXES
INCOME TAX RATE RECONCILIATION
| | | | | | | | | Year ended December 31, | 2019 |
| 2018 |
| 2017 |
| | (millions of Canadian dollars) | |
| |
| |
| | Earnings before income taxes | 7,535 |
| 3,570 |
| 569 |
| | Canadian federal statutory income tax rate | 15 | % | 15 | % | 15 | % | | Expected federal taxes at statutory rate | 1,130 |
| 536 |
| 85 |
| | Increase/(decrease) resulting from: | |
| |
| |
| Provincial and state income taxes1 | 415 |
| (24 | ) | 133 |
| | Foreign and other statutory rate differentials | 129 |
| 94 |
| (601 | ) | Impact of United States tax reform2 | — |
| (2 | ) | (2,045 | ) | Effects of rate-regulated accounting3 | (63 | ) | (163 | ) | (189 | ) | Foreign allowable interest deductions4 | (29 | ) | (134 | ) | (124 | ) | Part VI.1 tax, net of federal Part I deduction5 | 78 |
| 76 |
| 68 |
| | Impairment of goodwill | — |
| 192 |
| 15 |
| | United States BEAT tax | 67 |
| 43 |
| — |
| Non-taxable portion of gain/(loss) on sale of investment to unrelated party6 | — |
| 31 |
| — |
| Valuation allowance7 | 26 |
| (172 | ) | (17 | ) | Intercorporate investments8 | (14 | ) | (149 | ) | 77 |
| | Noncontrolling interests | (13 | ) | (47 | ) | (80 | ) | | Other | (18 | ) | (44 | ) | (19 | ) | | Income tax (recovery)/expense | 1,708 |
| 237 |
| (2,697 | ) | | Effective income tax rate | 22.7 | % | 6.6 | % | (474.0 | )% |
| | 1 | The change in provincial and state income taxes from 2018 to 2019 reflects the increase in earnings from operations and the impact of state tax rate changes in both the United States and Canada. |
| | 2 | The amount was related to the enactment of the Tax Cuts and Jobs Act (TCJA) by the United States on December 22, 2017, which included a reduction in the federal corporate income tax rate from 35% to 21% effective for taxation years beginning after December 31, 2017. |
| | 3 | The amount in 2019 included the federal component of the tax effect of the write-off of regulatory assets (Note 7). |
| | 4 | The decrease in foreign allowable interest deductions in 2019 was due to changes in the related loan portfolio and tax legislative changes in Canada, the United States, and Europe. |
| | 5 | Part VI.1 tax is a tax levied on preferred share dividends paid in Canada. |
| | 6 | The amount represents the federal component of the non-taxable portion of the gain on the sales of the Canadian Natural Gas Gathering and Processing Businesses in 2018. |
| | 7 | The increase in 2018 is due to the federal component of the tax effect of a valuation allowance on the deferred tax assets related to an outside basis temporary difference that, in 2018, was more likely than not to be realized. |
| | 8 | The amount relates to the federal component of changes in assertions regarding the manner of recovery of intercorporate investments such that deferred tax related to outside basis temporary differences was required to be recorded for MATL (Note 8), Renewable Assets in 2018 and for EIPLP in 2017. |
COMPONENTS OF PRETAX EARNINGS AND INCOME TAXES
| | | | | | | | | Year ended December 31, | 2019 |
| 2018 |
| 2017 |
| | (millions of Canadian dollars) | |
| |
| |
| | Earnings/(loss) before income taxes | |
| |
| |
| | Canada | 3,560 |
| 118 |
| 2,200 |
| | United States | 3,115 |
| 2,582 |
| (2,431 | ) | | Other | 860 |
| 870 |
| 800 |
| | | 7,535 |
| 3,570 |
| 569 |
| | Current income taxes | |
| |
| |
| | Canada | 347 |
| 311 |
| 129 |
| | United States | 107 |
| 66 |
| 46 |
| | Other | 98 |
| 8 |
| 5 |
| | | 552 |
| 385 |
| 180 |
| | Deferred income taxes | |
| |
| |
| | Canada | 490 |
| (598 | ) | 299 |
| | United States | 672 |
| 439 |
| (3,160 | ) | | Other | (6 | ) | 11 |
| (16 | ) | | | 1,156 |
| (148 | ) | (2,877 | ) | | Income tax (recovery)/expense | 1,708 |
| 237 |
| (2,697 | ) |
COMPONENTS OF DEFERRED INCOME TAXES
Deferred tax assets and liabilities are recognized for the future tax consequences of differences between carrying amounts of assets and liabilities and their respective tax bases. Major components of deferred income tax assets and liabilities are as follows:
| | | | | | | December 31, | 2019 |
| 2018 |
| | (millions of Canadian dollars) | |
| |
| | Deferred income tax liabilities | |
| |
| | Property, plant and equipment | (7,290 | ) | (7,018 | ) | | Investments | (4,620 | ) | (4,441 | ) | | Regulatory assets | (1,052 | ) | (756 | ) | | Other | (40 | ) | (192 | ) | | Total deferred income tax liabilities | (13,002 | ) | (12,407 | ) | | Deferred income tax assets | |
| |
| | Financial instruments | 679 |
| 1,103 |
| | Pension and OPEB plans | 206 |
| 181 |
| | Loss carryforwards | 1,693 |
| 1,820 |
| | Other | 1,641 |
| 1,274 |
| | Total deferred income tax assets | 4,219 |
| 4,378 |
| | Less valuation allowance | (84 | ) | (51 | ) | | Total deferred income tax assets, net | 4,135 |
| 4,327 |
| | Net deferred income tax liabilities | (8,867 | ) | (8,080 | ) | | Presented as follows: | | | | Total deferred income tax assets | 1,000 |
| 1,374 |
| | Total deferred income tax liabilities | (9,867 | ) | (9,454 | ) | | Net deferred income tax liabilities | (8,867 | ) | (8,080 | ) |
A valuation allowance has been established for certain loss and credit carryforwards, and outside basis temporary differences on investments that reduce deferred income tax assets to an amount that will more likely than not be realized.
As at December 31, 2019 and 2018, we recognized the benefit of unused tax loss carryforwards of $3.2 billion and $3.4 billion, respectively, in Canada which expire in 2026 and beyond.
As at December 31, 2019 and 2018, we recognized the benefit of unused tax loss carryforwards of $3.6 billion and $3.4 billion, respectively, in the United States which expire in 2023 and beyond.
We have not provided for deferred income taxes on the difference between the carrying value of substantially all of our foreign subsidiaries and their corresponding tax basis as the earnings of those subsidiaries are intended to be permanently reinvested in their operations. As such these investments are not anticipated to give rise to income taxes in the foreseeable future. The difference between the carrying values of the investments and their tax bases is largely a result of unremitted earnings and currency translation adjustments. The unremitted earnings and currency translation adjustment for which no deferred taxes have been recognized in respect of foreign subsidiaries were $5.3 billion and $5.8 billion for the period December 31, 2019 and 2018, respectively. If such earnings are remitted, in the form of dividends or otherwise, we may be subject to income taxes and foreign withholding taxes. The determination of the amount of unrecognized deferred income tax liabilities on such amounts is not practicable.
Enbridge and certain of our subsidiaries are subject to taxation in Canada, the United States and other foreign jurisdictions. The material jurisdictions in which we are subject to potential examinations include the United States (Federal) and Canada (Federal, Alberta and Ontario). We are open to examination by Canadian tax authorities for the 2010 to 2019 tax years and by United States tax authorities for the 2015 to 2019 tax years. We are currently under examination for income tax matters in Canada for the 2013 to 2017 tax years. We are not currently under examination for income tax matters in any other material jurisdiction where we are subject to income tax.
United States Tax Reform
On December 22, 2017, the United States enacted the TCJA. As a result of the TCJA we recorded $67 million and $43 million in tax expense for the years ended December 31, 2019 and 2018, respectively in connection with the Base erosion and Anti-abuse tax (BEAT). We recorded no provisions for the Global Intangible Low Taxed Income Tax (GILTI).
Most changes to the TCJA are effective for taxation years beginning after December 31, 2017. While the changes are broad and complex, the most significant change was the reduction in the corporate federal income tax rate from 35% to 21%. In 2017 we were also impacted by a one-time deemed repatriation or “toll” tax on undistributed earnings and profits of United States controlled foreign affiliates, including Canadian subsidiaries.
During the first quarter of 2018 we refined our calculation of the regulatory liability associated with the TCJA which resulted in a $30 million reduction to the overall regulatory liability. An additional reduction to the regulated liability in the amount of $223 million was recorded in the fourth quarter of 2018 in connection with rate cases filed that eliminated a portion of regulated liability formerly included in SEP's rate base.
In 2017 we made reasonable estimates for the measurement and accounting of certain effects of the TCJA in accordance with SEC Staff Accounting Bulletin No.118 (SAB 118). Accordingly, we recorded a $34 million increase to our 2017 current income tax provision related to the toll tax, payable over eight years. We recorded a $2.0 billion decrease to our 2017 deferred income tax provision related to the reduction in the corporate federal income tax rate. The accounting for these items decreased our accumulated deferred income tax liability by $3.1 billion and increased our regulatory liability by $1.1 billion in 2017. We have also adjusted our valuation allowance for certain deferred tax assets existing at December 31, 2016 for the reduction in the corporate federal income tax rate by $0.2 billion. We have recognized these tax impacts and included these amounts in our consolidated financial statements for the year ended December 31, 2017.
UNRECOGNIZED TAX BENEFITS
| | | | | | | Year ended December 31, | 2019 |
| 2018 |
| | (millions of Canadian dollars) | | | | Unrecognized tax benefits at beginning of year | 139 |
| 150 |
| | Gross increases for tax positions of current year | 1 |
| 2 |
| | Gross decreases for tax positions of prior year | (1 | ) | (12 | ) | | Change in translation of foreign currency | (4 | ) | 3 |
| | Lapses of statute of limitations | (6 | ) | (3 | ) | | Settlements | — |
| (1 | ) | | Unrecognized tax benefits at end of year | 129 |
| 139 |
|
The unrecognized tax benefits as at December 31, 2019, if recognized, would impact our effective income tax rate. We do not anticipate further adjustments to the unrecognized tax benefits during the next 12 months that would have a material impact on our consolidated financial statements.
We recognize accrued interest and penalties related to unrecognized tax benefits as a component of income taxes. Income taxes for the years ended December 31, 2019 and 2018 were $3 million expense and $5 million expense, respectively, of interest and penalties. As at December 31, 2019 and 2018, interest and penalties of $15 million and $12 million, respectively, have been accrued.
26. PENSION AND OTHER POSTRETIREMENT BENEFITS
PENSION PLANS
We sponsor Canadian and United States contributory and non-contributory registered defined benefit and defined contribution pension plans, which provide benefits covering substantially all employees. The Canadian Plans provide defined benefit and defined contribution pension benefits to our Canadian employees. The United States Plans provide defined benefit pension benefits to our United States employees. We also sponsor supplemental non-contributory defined benefit pension plans, which provide non-registered benefits for certain employees in Canada and the United States.
Defined Benefit Pension Plan Benefits
Benefits payable from the defined benefit pension plans are based on each plan participant’s years of service and final average remuneration. Some benefits are partially inflation-indexed after a plan participant’s retirement. Our contributions are made in accordance with independent actuarial valuations. Participant contributions to contributory defined benefit pension plans are based upon each plan participant’s current eligible remuneration.
Defined Contribution Pension Plan Benefits
Our contributions are based on each plan participant’s current eligible remuneration. Our contributions for some defined contribution pension plans are also based on age and years of service. Our defined contribution pension benefit costs are equal to the amount of contributions required to be made by us.
Benefit Obligations, Plan Assets and Funded Status
The following table details the changes in the projected benefit obligation, the fair value of plan assets and the recorded assets or liabilities for our defined benefit pension plans:
| | | | | | | | | | | | | Canada | | United States | | December 31, | 2019 |
| 2018 |
| | 2019 |
| 2018 |
| | (millions of Canadian dollars) | |
| |
| | |
| |
| | Change in projected benefit obligation | |
| |
| | |
| |
| | Projected benefit obligation at beginning of year | 3,997 |
| 4,033 |
| | 1,214 |
| 1,279 |
| | Service cost | 149 |
| 149 |
| | 45 |
| 45 |
| | Interest cost | 139 |
| 130 |
| | 41 |
| 38 |
| | Participant contributions | 32 |
| 25 |
| | — |
| — |
| | Actuarial (gain)/loss | 423 |
| (146 | ) | | 106 |
| (103 | ) | | Benefits paid | (187 | ) | (184 | ) | | (101 | ) | (60 | ) | Plan settlements1 | (99 | ) | — |
| | (1 | ) | (65 | ) | | Transfers out | (8 | ) | (10 | ) | | (6 | ) | — |
| | Foreign currency exchange rate changes | — |
| — |
| | (63 | ) | 105 |
| | Other | — |
| — |
| | (5 | ) | (25 | ) | Projected benefit obligation at end of year2 | 4,446 |
| 3,997 |
| | 1,230 |
| 1,214 |
| | Change in plan assets | | | | | | | Fair value of plan assets at beginning of year | 3,523 |
| 3,619 |
| | 1,045 |
| 1,097 |
| | Actual return/(loss) on plan assets | 448 |
| (42 | ) | | 176 |
| (48 | ) | | Employer contributions | 114 |
| 113 |
| | 46 |
| 40 |
| | Participant contributions | 32 |
| 25 |
| | — |
| — |
| | Benefits paid | (187 | ) | (184 | ) | | (101 | ) | (60 | ) | Plan settlements1 | (99 | ) | — |
| | (1 | ) | (65 | ) | | Transfers out | (4 | ) | (8 | ) | | — |
| — |
| | Foreign currency exchange rate changes | — |
| — |
| | (56 | ) | 91 |
| | Other | — |
| — |
| | (5 | ) | (10 | ) | Fair value of plan assets at end of year3 | 3,827 |
| 3,523 |
| | 1,104 |
| 1,045 |
| | Underfunded status at end of year | (619 | ) | (474 | ) | | (126 | ) | (169 | ) | | Presented as follows: | | | | | | | Deferred amounts and other assets | 35 |
| 29 |
| | — |
| — |
| | Accounts payable and other | (9 | ) | (9 | ) | | (4 | ) | (4 | ) | | Other long-term liabilities | (645 | ) | (494 | ) | | (122 | ) | (165 | ) | | | (619 | ) | (474 | ) | | (126 | ) | (169 | ) |
| | 1 | Plan settlements for the Canadian Plans are related to the disposition of our federally regulated BC Field Services business. |
| | 2 | The accumulated benefit obligation for our Canadian pension plans was $4.0 billion and $3.7 billion as at December 31, 2019 and 2018, respectively. The accumulated benefit obligation for our United States pension plans was $1.2 billion as at December 31, 2019 and 2018. |
| | 3 | Assets in the amount of $10 million (2018 - $7 million) and $51 million (2018 - $39 million), related to our Canadian and United States non-registered supplemental pension plan obligations, are held in Grantor Trusts and Rabbi Trusts that, in accordance with federal tax regulations, are not restricted from creditors. These assets are committed for the future settlement of benefit obligations included in the underfunded status as at the end of the year, however they are excluded from plan assets for accounting purposes. |
Certain of our pension plans have an accumulated benefit obligation in excess of the fair value of plan assets. For these plans, the projected benefit obligation, accumulated benefit obligation and fair value of plan assets were as follows:
| | | | | | | | | | | | | Canada | | United States | | December 31, | 2019 |
| 2018 |
| | 2019 |
| 2018 |
| | (millions of Canadian dollars) | | | | | | | Projected benefit obligation | 1,481 |
| 1,422 |
| | 103 |
| 1,214 |
| | Accumulated benefit obligation | 1,361 |
| 1,299 |
| | 98 |
| 1,179 |
| | Fair value of plan assets | 1,087 |
| 1,064 |
| | — |
| 1,045 |
|
Amount Recognized in Accumulated Other Comprehensive Income
The amount of pre-tax AOCI relating to our pension plans are as follows:
| | | | | | | | | | | | | Canada | | United States | | December 31, | 2019 |
| 2018 |
| | 2019 |
| 2018 |
| | (millions of Canadian dollars) | |
| |
| | |
| |
| | Net actuarial loss | 445 |
| 435 |
| | 134 |
| 133 |
| | Prior service credit | — |
| — |
| | (2 | ) | (3 | ) | Total amount recognized in AOCI1 | 445 |
| 435 |
| | 132 |
| 130 |
|
1 Excludes amounts related to cumulative translation adjustment.
Net Periodic Benefit Cost and Other Amounts Recognized in Comprehensive Income
The components of net periodic benefit cost and other amounts recognized in pre-tax Comprehensive income related to our pension plans are as follows:
| | | | | | | | | | | | | | | | | | Canada | | United States | | Year ended December 31, | 2019 |
| 2018 |
| 2017 |
| | 2019 |
| 2018 |
| 2017 |
| | (millions of Canadian dollars) | | | | | | | | | Service cost | 149 |
| 149 |
| 156 |
| | 45 |
| 45 |
| 48 |
| | Interest cost | 139 |
| 130 |
| 116 |
| | 41 |
| 38 |
| 35 |
| | Expected return on plan assets | (245 | ) | (245 | ) | (201 | ) | | (78 | ) | (88 | ) | (57 | ) | | Amortization/settlement of net actuarial loss | 41 |
| 25 |
| 29 |
| | 2 |
| 7 |
| 10 |
| | Amortization/curtailment of prior service (credit)/cost | — |
| — |
| — |
| | (1 | ) | 3 |
| — |
| | Net periodic benefit cost | 84 |
| 59 |
| 100 |
| | 9 |
| 5 |
| 36 |
| | Defined contribution benefit cost | 8 |
| 11 |
| 11 |
| | — |
| — |
| — |
| | Net pension cost recognized in Earnings | 92 |
| 70 |
| 111 |
| | 9 |
| 5 |
| 36 |
| | Amount recognized in OCI: | | | | | | | | | | Effect of plan combination | — |
| — |
| — |
| | (6 | ) | — |
| — |
| | | Amortization/settlement of net actuarial loss | (26 | ) | (11 | ) | (14 | ) | | (2 | ) | (7 | ) | (9 | ) | | | Amortization/curtailment of prior service credit/(cost) | — |
| — |
| — |
| | 1 |
| (3 | ) | — |
| | | Net actuarial loss arising during the year | 115 |
| 112 |
| 38 |
| | 8 |
| 28 |
| — |
| | Total amount recognized in OCI | 89 |
| 101 |
| 24 |
| | 1 |
| 18 |
| (9 | ) | | Total amount recognized in Comprehensive income | 181 |
| 171 |
| 135 |
| | 10 |
| 23 |
| 27 |
|
We estimate that approximately $21 million related to the Canadian pension plans and NaN related to the United States pension plans as at December 31, 2019 will be reclassified from AOCI into Earnings in the next 12 months.
Actuarial Assumptions
The weighted average assumptions made in the measurement of the projected benefit obligation and net periodic benefit cost of our pension plans are as follows:
| | | | | | | | | | | | | | | | | Canada | | United States | | | 2019 |
| 2018 |
| 2017 |
| | 2019 |
| 2018 |
| 2017 |
| | Projected benefit obligation | | | | | | | | | Discount rate | 3.0 | % | 3.8 | % | 3.6 | % | | 3.0 | % | 3.9 | % | 3.5 | % | | Rate of salary increase | 3.2 | % | 3.2 | % | 3.2 | % | | 2.9 | % | 2.8 | % | 3.1 | % | | Net periodic benefit cost | | | | | | | | | Discount rate | 3.8 | % | 3.6 | % | 4.0 | % | | 3.9 | % | 3.4 | % | 4.0 | % | | Expected rate of return on plan assets | 7.0 | % | 6.8 | % | 6.5 | % | | 8.0 | % | 7.4 | % | 7.2 | % | | Rate of salary increase | 3.2 | % | 3.2 | % | 3.7 | % | | 2.9 | % | 2.9 | % | 3.3 | % |
OTHER POSTRETIREMENT BENEFIT PLANS
We sponsor funded and unfunded defined benefit OPEB Plans, which provide non-contributory supplemental health, dental, life and health spending account benefit coverage for certain qualifying retired employees.
Benefit Obligations, Plan Assets and Funded Status
The following table details the changes in the accumulated postretirement benefit obligation, the fair value of plan assets and the recorded assets or liabilities for our defined benefit OPEB plans:
| | | | | | | | | | | | | Canada | | United States | | December 31, | 2019 |
| 2018 |
| | 2019 |
| 2018 |
| | (millions of Canadian dollars) | |
| |
| | |
| |
| | Change in accumulated postretirement benefit obligation | |
| |
| | |
| |
| | Accumulated postretirement benefit obligation at beginning of year | 282 |
| 321 |
| | 305 |
| 337 |
| | Service cost | 5 |
| 8 |
| | 2 |
| 3 |
| | Interest cost | 10 |
| 10 |
| | 10 |
| 10 |
| | Participant contributions | — |
| — |
| | 5 |
| 6 |
| | Actuarial (gain)/loss | 15 |
| (45 | ) | | 7 |
| (25 | ) | | Benefits paid | (6 | ) | (11 | ) | | (28 | ) | (29 | ) | | Plan amendments | — |
| — |
| | — |
| (8 | ) | | Foreign currency exchange rate changes | — |
| — |
| | (15 | ) | 27 |
| | Other | (13 | ) | (1 | ) | | 2 |
| (16 | ) | | Accumulated postretirement benefit obligation at end of year | 293 |
| 282 |
| | 288 |
| 305 |
| | Change in plan assets | | | | | | | Fair value of plan assets at beginning of year | — |
| — |
| | 181 |
| 213 |
| | Actual return/(loss) on plan assets | — |
| — |
| | 27 |
| (13 | ) | | Employer contributions | 6 |
| 11 |
| | 10 |
| 8 |
| | Participant contributions | — |
| — |
| | 5 |
| 6 |
| | Benefits paid | (6 | ) | (11 | ) | | (28 | ) | (29 | ) | | Foreign currency exchange rate changes | — |
| — |
| | (9 | ) | 16 |
| | Other | — |
| — |
| | 2 |
| (20 | ) | | Fair value of plan assets at end of year | — |
| — |
| | 188 |
| 181 |
| | Underfunded status at end of year | (293 | ) | (282 | ) | | (100 | ) | (124 | ) | | Presented as follows: | | | | | | | Deferred amounts and other assets | — |
| — |
| | — |
| 2 |
| | Accounts payable and other | (12 | ) | (12 | ) | | (8 | ) | (7 | ) | | Other long-term liabilities | (281 | ) | (270 | ) | | (92 | ) | (119 | ) | | | (293 | ) | (282 | ) | | (100 | ) | (124 | ) |
Amount Recognized in Accumulated Other Comprehensive Income
The amount of pre-tax AOCI relating to our OPEB plans are as follows:
| | | | | | | | | | | | | Canada | | United States | | December 31, | 2019 |
| 2018 |
| | 2019 |
| 2018 |
| | (millions of Canadian dollars) | |
| |
| | |
| |
| | Net actuarial gain | (7 | ) | (29 | ) | | (23 | ) | (15 | ) | | Prior service credit | (1 | ) | (2 | ) | | (13 | ) | (15 | ) | Total amount recognized in AOCI1 | (8 | ) | (31 | ) | | (36 | ) | (30 | ) |
1 Excludes amounts related to cumulative translation adjustment.
Net Periodic Benefit Cost and Other Amounts Recognized in Comprehensive Income
The components of net periodic benefit cost and other amounts recognized in pre-tax Comprehensive income related to our OPEB plans are as follows:
| | | | | | | | | | | | | | | | | Canada | | United States | | Year ended December 31, | 2019 |
| 2018 |
| 2017 |
| | 2019 |
| 2018 |
| 2017 |
| | (millions of Canadian dollars) | |
| |
| |
| | |
| |
| |
| | Service cost | 5 |
| 8 |
| 7 |
| | 2 |
| 3 |
| 5 |
| | Interest cost | 10 |
| 10 |
| 10 |
| | 10 |
| 10 |
| 10 |
| | Expected return on plan assets | — |
| — |
| — |
| | (12 | ) | (12 | ) | (10 | ) | | Amortization/settlement of net actuarial gain | (7 | ) | — |
| — |
| | — |
| (1 | ) | — |
| | Amortization/curtailment of prior service (credit)/cost | (1 | ) | — |
| 1 |
| | (2 | ) | (4 | ) | — |
| | Net periodic benefit cost recognized in Earnings | 7 |
| 18 |
| 18 |
| | (2 | ) | (4 | ) | 5 |
| | Amount recognized in OCI: | | | | | | | | | Amortization/settlement of net actuarial gain/(loss) | 7 |
| — |
| (1 | ) | | — |
| 1 |
| 1 |
| | Amortization/curtailment of prior service credit | 1 |
| — |
| — |
| | 2 |
| 4 |
| — |
| | Net actuarial (gain)/loss arising during the year | 15 |
| (46 | ) | (8 | ) | | (8 | ) | (1 | ) | (42 | ) | | Prior service (credit)/cost | — |
| — |
| (3 | ) | | — |
| (8 | ) | 1 |
| | Total amount recognized in OCI | 23 |
| (46 | ) | (12 | ) | | (6 | ) | (4 | ) | (40 | ) | | Total amount recognized in Comprehensive income | 30 |
| (28 | ) | 6 |
| | (8 | ) | (8 | ) | (35 | ) |
We estimate that approximately $1 million related to the Canadian OPEB plans and $3 million related to the United States OPEB plans as at December 31, 2019 will be reclassified from AOCI into earnings in the next 12 months.
Actuarial Assumptions
The weighted average assumptions made in the measurement of the accumulated postretirement benefit obligation and net periodic benefit cost of our OPEB plans are as follows:
| | | | | | | | | | | | | | | | | Canada | | United States | | | 2019 |
| 2018 |
| 2017 |
| | 2019 |
| 2018 |
| 2017 |
| | Accumulated postretirement benefit obligation | | | | | | | | | Discount rate | 3.1 | % | 3.8 | % | 3.6 | % | | 2.8 | % | 4.0 | % | 3.5 | % | | Net periodic benefit cost | | | | | | | | | Discount rate | 3.8 | % | 3.6 | % | 4.0 | % | | 4.0 | % | 3.3 | % | 4.0 | % | | Rate of return on plan assets | N/A |
| N/A |
| N/A |
| | 6.7 | % | 5.7 | % | 6.0 | % |
Assumed Health Care Cost Trend Rates
The assumed rates for the next year used to measure the expected cost of benefits are as follows:
| | | | | | | | | | | | | Canada | | United States | | | 2019 |
| 2018 |
| | 2019 |
| 2018 |
| | Health care cost trend rate assumed for next year | 4.0 | % | 5.6 | % | | 7.2 | % | 7.4 | % | | Rate to which the cost trend is assumed to decline (ultimate trend rate) | 4.0 | % | 4.4 | % | | 4.5 | % | 4.5 | % | | Year that the rate reaches the ultimate trend rate | N/A |
| 2034 |
| | 2037 |
| 2037 |
|
A 1% change in the assumed health care cost trend rate would have the following effects for the year ended and as at December 31, 2019:
| | | | | | | | | | | | | Canada | | United States | | | 1% Increase | 1% Decrease
| | 1% Increase | 1% Decrease
| | (millions of Canadian dollars) | | | | | | | Total service and interest costs | 1 |
| (1 | ) | | 1 |
| (1 | ) | | Accumulated postretirement benefit obligation | 21 |
| (17 | ) | | 19 |
| (17 | ) |
PLAN ASSETS
We manage the investment risk of our pension funds by setting a long-term asset mix policy for each plan after consideration of: (i) the nature of pension plan liabilities; (ii) the investment horizon of the plan; (iii) the going concern and solvency funded status and cash flow requirements of the plan; (iv) our operating environment and financial situation and our ability to withstand fluctuations in pension contributions; and (v) the future economic and capital markets outlook with respect to investment returns, volatility of returns and correlation between assets.
The overall expected rate of return on plan assets is based on the asset allocation targets with estimates for returns based on long-term expectations.
The asset allocation targets and major categories of plan assets are as follows:
| | | | | | | | | | | | | | | | | Canada | | United States | | | Target | December 31, | | Target | December 31, | | Asset Category | Allocation | 2019 |
| 2018 |
| | Allocation | 2019 |
| 2018 |
| | Equity securities | 43.4 | % | 46.4 | % | 45.8 | % | | 45.0 | % | 55.2 | % | 52.7 | % | | Fixed income securities | 30.3 | % | 31.0 | % | 38.8 | % | | 20.0 | % | 19.8 | % | 34.9 | % | Alternatives1 | 26.3 | % | 22.6 | % | 15.4 | % | | 35.0 | % | 25.0 | % | 12.4 | % |
| | 1 | Alternatives include investments in private debt, private equity, infrastructure and real estate funds. |
Pension Plans
The following table summarizes the fair value of plan assets for our pension plans recorded at each fair value hierarchy level:
| | | | | | | | | | | | | | | | | | | | | Canada | | United States | | | Level 11 |
| Level 22 |
| Level 33 |
| Total |
| | Level 11 |
| Level 22 |
| Level 33 |
| Total |
| | (millions of Canadian dollars) | |
| |
| |
| |
| | |
| |
| |
| |
| | December 31, 2019 | | | | | | | | | | | Cash and cash equivalents | 184 |
| — |
| — |
| 184 |
| | 14 |
| — |
| — |
| 14 |
| | Equity securities | | | | | | | | | | | Canada | 165 |
| 183 |
| — |
| 348 |
| | — |
| — |
| — |
| — |
| | United States | — |
| — |
| — |
| — |
| | — |
| 93 |
| — |
| 93 |
| | Global | — |
| 1,429 |
| — |
| 1,429 |
| | — |
| 516 |
| — |
| 516 |
| | Fixed income securities | | | | | | | | | | | Government | 196 |
| 418 |
| — |
| 614 |
| | — |
| 164 |
| — |
| 164 |
| | Corporate | — |
| 388 |
| — |
| 388 |
| | — |
| 41 |
| — |
| 41 |
| Alternatives4 | — |
| — |
| 852 |
| 852 |
| | — |
| — |
| 276 |
| 276 |
| | Forward currency contracts | — |
| 12 |
| — |
| 12 |
| | — |
| — |
| — |
| — |
| | Total pension plan assets at fair value | 545 |
| 2,430 |
| 852 |
| 3,827 |
| | 14 |
| 814 |
| 276 |
| 1,104 |
| | December 31, 2018 | | | | | | | | | | | Cash and cash equivalents | 240 |
| — |
| — |
| 240 |
| | 56 |
| — |
| — |
| 56 |
| | Equity securities | | | | | | | | | | | Canada | 138 |
| 481 |
| — |
| 619 |
| | — |
| — |
| — |
| — |
| | United States | — |
| — |
| — |
| — |
| | — |
| 110 |
| — |
| 110 |
| | Global | — |
| 992 |
| — |
| 992 |
| | — |
| 440 |
| — |
| 440 |
| | Fixed income securities | | | | | | | | | | | Government | 218 |
| 453 |
| — |
| 671 |
| | — |
| 265 |
| — |
| 265 |
| | Corporate | — |
| 457 |
| — |
| 457 |
| | — |
| 44 |
| — |
| 44 |
| Alternatives4 | — |
| — |
| 562 |
| 562 |
| | — |
| — |
| 130 |
| 130 |
| | Forward currency contracts | — |
| (18 | ) | — |
| (18 | ) | | — |
| — |
| — |
| — |
| | Total pension plan assets at fair value | 596 |
| 2,365 |
| 562 |
| 3,523 |
| | 56 |
| 859 |
| 130 |
| 1,045 |
|
| | 1 | Level 1 assets include assets with quoted prices in active markets for identical assets. |
| | 2 | Level 2 assets include assets with significant observable inputs. |
| | 3 | Level 3 assets include assets with significant unobservable inputs. |
| | 4 | Alternatives include investments in private debt, private equity, infrastructure and real estate funds. |
Changes in the net fair value of pension plan assets classified as Level 3 in the fair value hierarchy were as follows:
| | | | | | | | | | | | | Canada | | United States | | December 31, | 2019 |
| 2018 |
| | 2019 |
| 2018 |
| | (millions of Canadian dollars) | |
| |
| | |
| | | Balance at beginning of year | 562 |
| 340 |
| | 130 |
| 56 |
| | Unrealized and realized gains | 10 |
| 77 |
| | 13 |
| 9 |
| | Purchases and settlements, net | 280 |
| 145 |
| | 133 |
| 65 |
| | Balance at end of year | 852 |
| 562 |
| | 276 |
| 130 |
|
OPEB Plans
The following table summarizes the fair value of plan assets for our OPEB plans recorded at each fair value hierarchy level:
| | | | | | | | | | | | | | | | | | | | | Canada | | United States | | | Level 11 |
| Level 22 |
| Level 33 |
| Total |
| | Level 11 |
| Level 22 |
| Level 33 |
| Total |
| | (millions of Canadian dollars) | |
| |
| |
| |
| | |
| |
| |
| |
| | December 31, 2019 | | | | | | | | | | | Cash and cash equivalents | — |
| — |
| — |
| — |
| | 2 |
| — |
| — |
| 2 |
| | Equity securities | | | |
|
| | | | |
|
| | United States | — |
| — |
| — |
| — |
| | — |
| 75 |
| — |
| 75 |
| | Global | — |
| — |
| — |
| — |
| | — |
| 38 |
| — |
| 38 |
| | Fixed income securities | | | |
|
| | | | |
|
| | Government | — |
| — |
| — |
| — |
| | 40 |
| 15 |
| — |
| 55 |
| Alternatives4 | — |
| — |
| — |
| — |
| | — |
| — |
| 18 |
| 18 |
| | Total OPEB plan assets at fair value | — |
| — |
| — |
| — |
| | 42 |
| 128 |
| 18 |
| 188 |
| | December 31, 2018 | | | | | | | | | | | Cash and cash equivalents | — |
| — |
| — |
| — |
| | 7 |
| — |
| — |
| 7 |
| | Equity securities | | | | | | | | | | | United States | — |
| — |
| — |
| — |
| | — |
| 68 |
| — |
| 68 |
| | Global | — |
| — |
| — |
| — |
| | — |
| 30 |
| — |
| 30 |
| | Fixed income securities | | | | | | | | | | | Government | — |
| — |
| — |
| — |
| | 43 |
| 28 |
| — |
| 71 |
| | Corporate | — |
| — |
| — |
| — |
| | — |
| — |
| — |
| — |
| Alternatives4 | — |
| — |
| — |
| — |
| | — |
| — |
| 5 |
| 5 |
| | Total OPEB plan assets at fair value | — |
| — |
| — |
| — |
| | 50 |
| 126 |
| 5 |
| 181 |
|
| | 1 | Level 1 assets include assets with quoted prices in active markets for identical assets. |
| | 2 | Level 2 assets include assets with significant observable inputs. |
| | 3 | Level 3 assets include assets with significant unobservable inputs. |
| | 4 | Alternatives includes investments in private debt, private equity, infrastructure and real estate. |
Changes in the net fair value of OPEB plan assets classified as Level 3 in the fair value hierarchy were as follows:
| | | | | | | | | | | | | Canada | | United States | | December 31, | 2019 |
| 2018 |
| | 2019 |
| 2018 |
| | (millions of Canadian dollars) | | | | | | | Balance at beginning of year | — |
| — |
| | 5 |
| — |
| | Unrealized and realized gains | — |
| — |
| | 1 |
| — |
| | Purchases and settlements, net | — |
| — |
| | 12 |
| 5 |
| | Balance at end of year | — |
| — |
| | 18 |
| 5 |
|
EXPECTED BENEFIT PAYMENTS
| | | | | | | | | | | | | | | Year ending December 31, | 2020 |
| 2021 |
| 2022 |
| 2023 |
| 2024 |
| 2025-2029 |
| | (millions of Canadian dollars) | |
| |
| |
| |
| |
| |
| | Pension | | | | | | | | Canada | 180 |
| 186 |
| 192 |
| 198 |
| 204 |
| 1,105 |
| | United States | 87 |
| 90 |
| 91 |
| 89 |
| 91 |
| 402 |
| | OPEB | | | | | | | | Canada | 12 |
| 12 |
| 12 |
| 13 |
| 13 |
| 69 |
| | United States | 23 |
| 22 |
| 21 |
| 20 |
| 19 |
| 82 |
|
EXPECTED EMPLOYER CONTRIBUTIONS
In 2020, we expect to contribute approximately $104 million and $31 million to the Canadian and United States pension plans, respectively, and $12 million and $8 million to the Canadian and United States OPEB plans, respectively.
RETIREMENT SAVINGS PLANS
In addition to the pension and OPEB plans discussed above, we also have defined contribution employee savings plans available to both Canadian and United States employees. Employees may participate in a matching contribution where we match a certain percentage of before-tax employee contributions of up to 2.5% and 6.0% of eligible pay per pay period for Canadian and United States employees, respectively. For the years ended December 31, 2019, 2018 and 2017, pre-tax employer matching contribution costs were $4 million, $13 million and $14 million for Canadian employees and $27 million, $27 million and
$31 million for United States employees, respectively.
27. LEASES
LESSEE
We incur operating lease expenses related primarily to real estate, pipelines, storage and equipment. Our operating leases have remaining lease terms of 3 months to 28 years.
For the year ended December 31, 2019, we incurred operating lease expenses of $113 million. Operating lease expenses are reported under Operating and administrative expenses on the Consolidated Statements of Earnings.
For the year ended December 31, 2019, operating lease payments to settle lease liabilities were $123 million. Operating lease payments are reported under operating activities in the Consolidated Statements of Cash Flows.
Supplemental Statements of Financial Position Information
| | | | | | | | December 31, 2019 |
| January 1, 2019 |
| (millions of Canadian dollars, except lease term and discount rate)
| | | | Operating leases | | | Operating lease right-of-use assets, net1 | 713 |
| 771 |
| | | | | Operating lease liabilities - current2 | 94 |
| 86 |
| Operating lease liabilities - long-term3 | 689 |
| 770 |
| | Total operating lease liabilities | 783 |
| 856 |
| | | | | | Weighted average remaining lease term | | | | Operating leases | 13 years |
| 14 years |
| | | | | | Weighted average discount rate | | | | Operating leases | 4.3 | % | 4.3 | % |
| | 1 | Right-of-use assets are reported under Deferred amounts and other assets in the Consolidated Statements of Financial Position. |
| | 2 | Current lease liabilities are reported under Accounts payable and other in the Consolidated Statements of Financial Position. |
| | 3 | Long-term lease liabilities are reported under Other long-term liabilities in the Consolidated Statements of Financial Position. |
As at December 31, 2019, our operating lease liabilities are expected to mature as follows:
| | | | | | Operating leases |
| | (millions of Canadian dollars) | | | 2020 | 128 |
| | 2021 | 99 |
| | 2022 | 94 |
| | 2023 | 84 |
| | 2024 | 79 |
| | Thereafter | 588 |
| | Total undiscounted lease payments | 1,072 |
| | Less imputed interest | (289 | ) | | Total operating lease liabilities | 783 |
|
LESSOR
We receive revenues from operating leases primarily related to natural gas and crude oil storage and processing facilities, rail cars, and wind power generation assets. Our operating leases have remaining lease terms of 2 months to 24 years.
Plan restrictions – 2019 LTIP | | | | Year ended December 31, | 2019 |
| (millions of Canadian dollars) | | Operating lease income | 265 |
| Variable lease income | 360 |
| Total lease income1
| 625 |
|
| | 1 | Lease income is recorded under Transportation and other services in the Consolidated Statements of Earnings. |
As at December 31, 2019, the following table sets out future lease payments to be received under operating lease contracts where we are the lessor:
| | | | | | Operating leases |
| | (millions of Canadian dollars) | | | 2020 | 236 |
| | 2021 | 199 |
| | 2022 | 188 |
| | 2023 | 180 |
| | 2024 | 178 |
| | Thereafter | 2,276 |
| | Future lease payments | 3,257 |
|
28. CHANGES IN OPERATING ASSETS AND LIABILITIES
| | | | | | | | | Year ended December 31, | 2019 |
| 2018 |
| 2017 |
| | (millions of Canadian dollars) | |
| |
| |
| | Accounts receivable and other | (659 | ) | 857 |
| (783 | ) | | Accounts receivable from affiliates | 6 |
| 54 |
| 24 |
| | Inventory | (24 | ) | 164 |
| (289 | ) | | Deferred amounts and other assets | 133 |
| 226 |
| (138 | ) | | Accounts payable and other | 175 |
| (151 | ) | 277 |
| | Accounts payable to affiliates | (24 | ) | (122 | ) | (62 | ) | | Interest payable | (41 | ) | 25 |
| 124 |
| | Other long-term liabilities | 175 |
| (138 | ) | 509 |
| | | (259 | ) | 915 |
| (338 | ) |
29. RELATED PARTY TRANSACTIONS
Related party transactions are conducted in the normal course of business and unless otherwise noted, are measured at the exchange amount, which is the amount of consideration established and agreed to by the related parties.
SERVICE AGREEMENTS
Vector, a joint venture, contracts our services to operate the pipeline. Amounts for these services, which are charged at cost in accordance with service agreements, were $7 million, $7 million and $14 million for the years ended December 31, 2019, 2018 and 2017, respectively.
TRANSPORTATION AGREEMENTS
Certain wholly-owned subsidiaries within the Liquids Pipelines, Gas Transmission and Midstream, Gas Distribution and Storage and Energy Services segments have committed and uncommitted transportation arrangements with several joint venture affiliates that are accounted for using the equity method. Total amounts charged to us for transportation services for the years ended December 31, 2019, 2018 and 2017 were $812 million, $572 million and $721 million, respectively.
AFFILIATE REVENUES AND PURCHASES
Certain wholly-owned subsidiaries within the Energy Services segments made natural gas and NGL purchases of $392 million, $322 million and $142 million from several joint venture affiliates during the years ended December 31, 2019, 2018 and 2017, respectively.
In addition to this, Enbridge recorded transportation and natural gas sales of $145 million, $122 million and $60 million within the Energy Services and Gas Distribution and Storage segments to equity investment affiliates during the years ended December 31, 2019, 2018 and 2017, respectively.
DCP Midstream processes certain of our pipeline customers' gas to meet gas quality specifications in order to be transported on our system. DCP Midstream processes the gas and sells the NGLs that are extracted from the gas. A portion of the proceeds from those sales are retained by DCP Midstream and the balance is remitted to us. We received proceeds of $34 million (US$26 million), $52 million (US$40 million) and $47 million (US$36 million) during the years ended December 31, 2019, 2018 and 2017, respectively, from DCP Midstream related to those sales.
In addition to the above, we recorded other revenues from several joint venture affiliates related to the transportation and storage of natural gas of $69 million (US$52 million), $14 million (US$11 million) and $4 million (US$3 million) during the years ended December 31, 2019, 2018 and 2017, respectively.
In the ordinary course of business, we are reimbursed by joint venture partners for operating and maintenance expenses for certain projects. We received reimbursements from these joint ventures of $48 million (US$36 million), $28 million (US$22 million) and $10 million (US$8 million) during the years ended December 31, 2019, 2018 and 2017, respectively.
LONG-TERM NOTES RECEIVABLE FROM AFFILIATES
As at December 31, 2019, amounts receivable from affiliates include a series of loans totaling$1,023 million($769 million as at December 31, 2018), which require quarterly interest payments at annual interest rates ranging from 3% to 8%. These amounts are included in deferred amounts and other assets in the Consolidated Statements of Financial position.
30. COMMITMENTS AND CONTINGENCIES
COMMITMENTS
At December 31, 2019, we have commitments as detailed below:
| | | | | | | | | | | | | | | | | | Total |
| Less than 1 year |
| 2 years |
| 3 years |
| 4 years |
| 5 years |
| Thereafter |
| | (millions of Canadian dollars) | |
| |
| |
| |
| |
| |
| |
| Annual debt maturities1 | 63,585 |
| 4,394 |
| 6,856 |
| 4,054 |
| 2,585 |
| 7,712 |
| 37,984 |
| Interest obligations2 | 29,498 |
| 2,416 |
| 2,296 |
| 2,216 |
| 2,076 |
| 1,915 |
| 18,579 |
| Purchase of services, pipe and other materials, including transportation3,4 | 9,448 |
| 2,891 |
| 1,507 |
| 1,217 |
| 564 |
| 570 |
| 2,699 |
| | Maintenance agreements | 435 |
| 56 |
| 55 |
| 53 |
| 25 |
| 20 |
| 226 |
| | Land lease commitments | 1,190 |
| 30 |
| 35 |
| 35 |
| 35 |
| 36 |
| 1,019 |
| | Total | 104,156 |
| 9,787 |
| 10,749 |
| 7,575 |
| 5,285 |
| 10,253 |
| 60,507 |
|
| | 1 | Includes debentures, term notes, commercial paper and credit facility draws based on the facility's maturity date and excludes short-term borrowings, debt discount, debt issue costs and finance lease obligations. We have the ability under certain debt facilities to call and repay the obligations prior to scheduled maturities. Therefore, the actual timing of future cash repayments could be materially different than presented above. |
| | 2 | Includes debentures and term notes bearing interest at fixed, floating and fixed-to-floating rates. |
| | 3 | Includes capital and operating commitments. |
| | 4 | Consists primarily of gas transportation and storage contracts, firm capacity payments and gas purchase commitments, transportation, service and product purchase obligations, and power commitments. |
ENVIRONMENTAL
We are subject to various Canadian and US federal, state and local laws relating to the protection of the environment. These laws and regulations can change from time to time, imposing new obligations on us.
Environmental risk is inherent to liquid hydrocarbon and natural gas pipeline operations, and Enbridge and our affiliates are, at times, subject to environmental remediation obligations at various sites where we operate. We manage this environmental risk through appropriate environmental policies, programs and practices to minimize any impact our operations may have on the environment. To the extent that we are unable to recover payment for environmental liabilities from insurance or other potentially responsible parties, we will be responsible for payment of costs arising from environmental incidents associated with the operating activities of our liquids and natural gas businesses.
AUX SABLE
On October 14, 2016, an amended claim was filed against Aux Sable by a counterparty to an NGL supply agreement. On January 5, 2017, Aux Sable filed a Statement of Defence with respect to this claim.
On November 27, 2019, the counterparty filed an amended amended claim providing further particulars of its claim against Aux Sable, increasing its damages claimed, and adding defendants Aux Sable Liquid Products Inc. and Aux Sable Extraction LLC (general partners of the previously existing defendants). Aux Sable filed an amended Statement of Defence responding to the amended amended claim on January 31, 2020.
While the final outcome of this action cannot be predicted with certainty, at this time management believes that the ultimate resolution of this action will not have a material impact on our consolidated financial position or results of operations.
TAX MATTERS
We and our subsidiaries maintain tax liabilities related to uncertain tax positions. While fully supportable in our view, these tax positions, if challenged by tax authorities, may not be fully sustained on review.
OTHER LITIGATION
We and our subsidiaries are subject to various other legal and regulatory actions and proceedings which arise in the normal course of business, including interventions in regulatory proceedings and challenges to regulatory approvals and permits. While the final outcome of such actions and proceedings cannot be predicted with certainty, management believes that the resolution of such actions and proceedings will not have a material impact on our consolidated financial position or results of operations.
31. GUARANTEES
In the normal course of conducting business, we enter into agreements which indemnify third parties and affiliates. We may also be a party to agreements with subsidiaries, jointly owned entities, unconsolidated entities such as equity method investees, or entities with other ownership arrangements that require us to provide financial and performance guarantees. Financial guarantees include stand-by letters of credit, debt guarantees, surety bonds and indemnifications. To varying degrees, these guarantees involve elements of performance and credit risk, which are not included on our Consolidated Statements of Financial Position. Performance guarantees require us to make payments to a third party if the guaranteed affiliate entity does not perform on its contractual obligations, such as debt agreements, purchase or sale agreements, and construction contracts and leases. We typically enter into these arrangements to facilitate commercial transactions with third parties.
Examples include indemnifying counterparties pursuant to sale agreements for assets or businesses in matters such as breaches of representations, warranties or covenants, loss or damages to property, environmental liabilities, and litigation and contingent liabilities. We may indemnify third parties for certain liabilities relating to environmental matters arising from operations prior to the purchase or transfer of certain assets and interests. Similarly, we may indemnify the purchaser of assets for certain tax liabilities incurred while we owned the assets, a misrepresentation related to taxes that result in a loss to the purchaser or other certain tax liabilities related to those assets.
The likelihood of having to perform under these guarantees and indemnifications is largely dependent upon future operations of various subsidiaries, investees and other third parties, or the occurrence of certain future events. We cannot reasonably estimate the total maximum potential amounts that could become payable to third parties and affiliates under such agreements described above; however, historically, we have not made any significant payments under guarantee or indemnification provisions. While these agreements may specify a maximum potential exposure, or a specified duration to the guarantee or indemnification obligation, there are circumstances where the amount and duration are unlimited. As at December 31, 2019 guarantees and indemnifications have not had, and are not reasonably likely to have, a material effect on our financial condition, changes in financial condition, earnings, liquidity, capital expenditures or capital resources. Please refer to Note 12 - Variable Interest Entities for further discussion regarding specific guarantees related to unconsolidated VIEs.
32. CONDENSED CONSOLIDATING FINANCIAL INFORMATION
On January 22, 2019, Enbridge entered into supplemental indentures with its wholly-owned subsidiaries, the Partnerships, pursuant to which Enbridge fully and unconditionally guaranteed, on a senior unsecured basis, the payment obligations of the Partnerships with respect to the outstanding series of notes issued under the respective indentures of the Partnerships. Concurrently, the Partnerships entered into a subsidiary guarantee agreement pursuant to which they fully and unconditionally guaranteed, on a senior unsecured basis, the outstanding series of senior notes of Enbridge. As a result of the guarantees, holders of any of the outstanding guaranteed notes of the Partnerships are in the same position with respect to the net assets, income and cash flows of Enbridge as holders of Enbridge's outstanding guaranteed notes, and vice versa. Other than the Partnerships, Enbridge subsidiaries (including the subsidiaries of the Partnerships, collectively, the Subsidiary Non-Guarantors), are not parties to the subsidiary guarantee agreement and have not otherwise guaranteed any of Enbridge's outstanding series of senior notes.
Consenting SEP notes and EEP notes under Guarantee
| | | SEP Notes1
| EEP Notes2
| Floating Rate Senior Notes due 2020 | 4.200% Notes due 2021 | 4.600% Senior Notes due 2021 | 5.875% Notes due 2025 | 4.750% Senior Notes due 2024 | 5.950% Notes due 2033 | 3.500% Senior Notes due 2025 | 6.300% Notes due 2034 | 3.375% Senior Notes due 2026 | 7.500% Notes due 2038 | 5.950% Senior Notes due 2043 | 5.500% Notes due 2040 | 4.500% Senior Notes due 2045 | 7.375% Notes due 2045 |
| | 1 | As at December 31, 2019, the aggregate outstanding principal amount of SEP notes was approximately US$3.9 billion. |
| | 2 | As at December 31, 2019, the aggregate outstanding principal amount of EEP notes was approximately US$3.0 billion. |
Enbridge Notes under Guarantees
| | | USD Denominated1
| CAD Denominated2
| Senior Floating Rate Notes due 2020 | 4.530% Senior Notes due 2020 | Senior Floating Rate Notes due 2020 | 4.850% Senior Notes due 2020 | 2.900% Senior Notes due 2022 | 4.260% Senior Notes due 2021 | 4.000% Senior Notes due 2023 | 3.160% Senior Notes due 2021 | 3.500% Senior Notes due 2024 | 4.850% Senior Notes due 2022 | 2.500% Senior Notes due 2025 | 3.190% Senior Notes due 2022 | 4.250% Senior Notes due 2026 | 3.940% Senior Notes due 2023 | 3.700% Senior Notes due 2027 | 3.940% Senior Notes due 2023 | 3.125% Senior Notes due 2029 | 3.950% Senior Notes due 2024 | 4.500% Senior Notes due 2044 | 3.200% Senior Notes due 2027 | 5.500% Senior Notes due 2046 | 6.100% Senior Notes due 2028 | 4.000% Senior Notes due 2049 | 2.990% Senior Notes due 2029 |
| 7.220% Senior Notes due 2030 |
| 7.200% Senior Notes due 2032 |
| 5.570% Senior Notes due 2035 |
| 5.750% Senior Notes due 2039 |
| 5.120% Senior Notes due 2040 |
| 4.240% Senior Notes due 2042 |
| 4.570% Senior Notes due 2044 |
| 4.870% Senior Notes due 2044 |
| 4.560% Senior Notes due 2064 | |
| | | |
| Enbridge shares reserved for issue under the 2019 LTIP | | 49,700,000 in total, or 2.45% of Enbridge’s total issued and outstanding Enbridge shares as of December 31, 2020. | | 1 | As at December 31, 2019, the aggregate outstanding principal amount of the Enbridge United States dollar denominated notes was approximately US$7.9 billion. |
| | 2 | As at December 31, 2019, the aggregate outstanding principal amount of the Enbridge Canadian dollar denominated notes was approximately $7.6 billion. |
In accordance with Rule 3-10
The total number of Enbridge shares reserved for issuance to Insiders pursuant to all security based compensation arrangements of the United States Securitiescompany shall not exceed 10% of the number of Enbridge shares outstanding at the time of reservation. | | | Enbridge shares that can be issued in aone-year period | | The total number of Enbridge shares issued to Insiders pursuant to all security based compensation arrangements of the company shall not exceed 10% of the number of Enbridge shares outstanding at the time of issuance (excluding any other Enbridge shares issued under all security based compensation arrangements of the company during suchone-year period) | | | | The number of Enbridge shares that can be issued as incentive stock options (within the meaning of the U.S. Internal Revenue Code) | | Up to 2,000,000 Enbridge shares can be issued under the 2019 LTIP as incentive stock options. | | | | Stock options delivered to a greater than 10% shareholder | | If an Incentive Stock Option is granted to a greater than 10% shareholder, the grant price will not be less than 110% of the fair market value on the grant date of the Incentive Stock Option, and Exchange Commission's Regulation S-X, which provides an exemptionin no event will such Incentive Stock Option be exercisable after the expiration of five years from the reporting requirementsdate on which the Incentive Stock Option is granted. | | | | Minimum vesting | | All awards shall be subject to a minimum vesting schedule of at least twelve months following the date of grant of the Securities Exchange Actaward, provided that vesting may accelerate in connection with death, retirement, a change in control or other termination of 1934 for subsidiary issuers of guaranteed securities and subsidiary guarantors, in lieu of filing separate financial statements for eachservice. Notwithstanding the foregoing, up to 5% of the Partnerships, we have included the accompanying condensed consolidating financial information with separate columns representing the following:
| | 1. | Enbridge Inc., the Parent Issuer and Guarantor; |
| | 2. | SEP, a Subsidiary Issuer and Guarantor; |
| | 3. | EEP, a Subsidiary Issuer and Guarantor; |
| | 4. | Subsidiary Non-Guarantors, as defined herein; |
| | 5. | Consolidating and elimination entries required to consolidate the Parent Issuer and Guarantor and its subsidiaries, including the Subsidiary Issuers and Guarantors, and |
| | 6. | Enbridge Inc. and subsidiaries on a consolidated basis. |
For the purposes of the condensed consolidating financial information only, investments in subsidiaries are accountedEnbridge shares available for grant under the equity method. In addition,2019 LTIP may be granted with a minimum vesting schedule that is shorter than twelve months.
| |
| | | | | | | | | | | | | | | | | | | | | | | | 0.2529% | | 0.3348% | | — | | | | | Incentive stock option plan 1 | | — | | — | | 0.3350% | | | | | Performance stock option plan 2 | | — | | — | | — | | | | | Spectra 2007 LTIP – stock options 3 | | — | | — | | — |
| No grants have been made under this plan since 2018. |
| No grants have been made under this plan since 2014. |
| All grants under the Condensed Consolidating Statements of Cash Flows present the intercompany loan and distribution activity, as well as cash collection and paymentsSpectra 2007 LTIP were made on behalf of our subsidiaries, as cash activities. These intercompany investments and related activities eliminate on consolidation and are presented separately only for the purpose of the accompanying Condensed Consolidating Statements.
Condensed Consolidating Statements of Earnings and Comprehensive Income for the year ended December 31, 2019
| | | | | | | | | | | | | | | | Parent Issuer and Guarantor | Subsidiary Issuer and Guarantor - SEP | Subsidiary Issuer and Guarantor - EEP | Subsidiary Non-Guarantors | Consolidating and elimination adjustments | Consolidated - Enbridge | | (millions of Canadian dollars) | | | | | | | | Operating revenues | | | | | | | | Commodity sales | — |
| — |
| — |
| 29,309 |
| — |
| 29,309 |
| | Gas distribution sales | — |
| — |
| — |
| 4,205 |
| — |
| 4,205 |
| | Transportation and other services | — |
| — |
| — |
| 16,555 |
| — |
| 16,555 |
| | Total operating revenues | — |
| — |
| — |
| 50,069 |
| — |
| 50,069 |
| | Operating Expenses | | | | | | | | Commodity costs | — |
| — |
| — |
| 28,802 |
| — |
| 28,802 |
| | Gas distribution costs | — |
| — |
| — |
| 2,202 |
| — |
| 2,202 |
| | Operating and administrative | 128 |
| 5 |
| (16 | ) | 6,874 |
| — |
| 6,991 |
| | Depreciation and amortization | 67 |
| — |
| — |
| 3,324 |
| — |
| 3,391 |
| | Impairment of long-lived assets | — |
| — |
| — |
| 423 |
| — |
| 423 |
| | Impairment of goodwill | — |
| — |
| — |
| — |
| — |
| — |
| | Total operating expenses | 195 |
| 5 |
| (16 | ) | 41,625 |
| — |
| 41,809 |
| | Operating income/(loss) | (195 | ) | (5 | ) | 16 |
| 8,444 |
| — |
| 8,260 |
| | Income from equity investments | 70 |
| 133 |
| — |
| 1,366 |
| (66 | ) | 1,503 |
| | Equity earnings from consolidated subsidiaries | 3,881 |
| 1,189 |
| 1,043 |
| 1,696 |
| (7,809 | ) | — |
| | Other | — |
| — |
| — |
| — |
| — |
| — |
| | Net foreign currency gain/(loss) | 1,671 |
| — |
| — |
| (106 | ) | (1,088 | ) | 477 |
| | Gain/(loss) on dispositions | (7 | ) | — |
| — |
| (293 | ) | — |
| (300 | ) | | Other, including other income from affiliates | 1,944 |
| 2 |
| 189 |
| 573 |
| (2,450 | ) | 258 |
| | Interest expense | (1,268 | ) | (330 | ) | (591 | ) | (2,966 | ) | 2,492 |
| (2,663 | ) | | Earnings before income taxes | 6,096 |
| 989 |
| 657 |
| 8,714 |
| (8,921 | ) | 7,535 |
| | Income tax (expense)/recovery | (391 | ) | 44 |
| 6 |
| (1,985 | ) | 618 |
| (1,708 | ) | | Earnings | 5,705 |
| 1,033 |
| 663 |
| 6,729 |
| (8,303 | ) | 5,827 |
| | Earnings attributable to noncontrolling interests and redeemable noncontrolling interests | — |
| — |
| — |
| — |
| (122 | ) | (122 | ) | | Earnings attributable to controlling interests | 5,705 |
| 1,033 |
| 663 |
| 6,729 |
| (8,425 | ) | 5,705 |
| | Preference share dividends | (383 | ) | — |
| — |
| — |
| — |
| (383 | ) | | Earnings attributable to common shareholders | 5,322 |
| 1,033 |
| 663 |
| 6,729 |
| (8,425 | ) | 5,322 |
| | Earnings | 5,705 |
| 1,033 |
| 663 |
| 6,729 |
| (8,303 | ) | 5,827 |
| | Total other comprehensive income/(loss) | (2,992 | ) | (67 | ) | 51 |
| (929 | ) | 830 |
| (3,107 | ) | | Comprehensive income | 2,713 |
| 966 |
| 714 |
| 5,800 |
| (7,473 | ) | 2,720 |
| | Comprehensive income attributable to noncontrolling interests | — |
| — |
| — |
| — |
| (7 | ) | (7 | ) | | Comprehensive income attributable to controlling interests | 2,713 |
| 966 |
| 714 |
| 5,800 |
| (7,480 | ) | 2,713 |
|
Condensed Consolidating Statements of Earnings and Comprehensive Income for the year ended December 31, 2018
| | | | | | | | | | | | | | | | Parent Issuer and Guarantor | Subsidiary Issuer and Guarantor - SEP | Subsidiary Issuer and Guarantor - EEP | Subsidiary Non-Guarantors | Consolidating and elimination adjustments | Consolidated - Enbridge | | (millions of Canadian dollars) | | | | | | | | Operating revenues | | | | | | | | Commodity sales | — |
| — |
| — |
| 27,660 |
| — |
| 27,660 |
| | Gas distribution sales | — |
| — |
| — |
| 4,360 |
| — |
| 4,360 |
| | Transportation and other services | — |
| — |
| — |
| 14,358 |
| — |
| 14,358 |
| | Total operating revenues | — |
| — |
| — |
| 46,378 |
| — |
| 46,378 |
| | Operating Expenses | | | | | | | | Commodity costs | — |
| — |
| — |
| 26,818 |
| — |
| 26,818 |
| | Gas distribution costs | — |
| — |
| — |
| 2,583 |
| — |
| 2,583 |
| | Operating and administrative | 180 |
| 14 |
| 54 |
| 6,622 |
| (78 | ) | 6,792 |
| | Depreciation and amortization | 59 |
| — |
| — |
| 3,187 |
| — |
| 3,246 |
| | Impairment of long-lived assets | — |
| — |
| — |
| 1,104 |
| — |
| 1,104 |
| | Impairment of goodwill | — |
| — |
| — |
| 1,019 |
| — |
| 1,019 |
| | Total operating expenses | 239 |
| 14 |
| 54 |
| 41,333 |
| (78 | ) | 41,562 |
| | Operating income/(loss) | (239 | ) | (14 | ) | (54 | ) | 5,045 |
| 78 |
| 4,816 |
| | Income from equity investments | 302 |
| 142 |
| — |
| 1,360 |
| (295 | ) | 1,509 |
| | Equity earnings/(loss) from consolidated subsidiaries | 3,119 |
| (1,634 | ) | 921 |
| (1,581 | ) | (825 | ) | — |
| | Other | | | | | | | | Net foreign currency gain/(loss) | (829 | ) | 8 |
| — |
| 80 |
| 219 |
| (522 | ) | | Gain/(loss) on dispositions | 360 |
| — |
| — |
| (406 | ) | — |
| (46 | ) | | Other, including other income/(expense) from affiliates | 945 |
| 72 |
| 153 |
| 254 |
| (908 | ) | 516 |
| | Interest expense | (1,080 | ) | (302 | ) | (557 | ) | (1,689 | ) | 925 |
| (2,703 | ) | | Earnings/(loss) before income taxes | 2,578 |
| (1,728 | ) | 463 |
| 3,063 |
| (806 | ) | 3,570 |
| | Income tax recovery/(expense) | 304 |
| (319 | ) | 3 |
| (4,373 | ) | 4,148 |
| (237 | ) | | Earnings/(loss) | 2,882 |
| (2,047 | ) | 466 |
| (1,310 | ) | 3,342 |
| 3,333 |
| | Earnings attributable to noncontrolling interests and redeemable noncontrolling interests | — |
| — |
| — |
| — |
| (451 | ) | (451 | ) | | Earnings/(loss) attributable to controlling interests | 2,882 |
| (2,047 | ) | 466 |
| (1,310 | ) | 2,891 |
| 2,882 |
| | Preference share dividends | (367 | ) | — |
| — |
| — |
| — |
| (367 | ) | | Earnings/(loss) attributable to common shareholders | 2,515 |
| (2,047 | ) | 466 |
| (1,310 | ) | 2,891 |
| 2,515 |
| | Earnings/(loss) | 2,882 |
| (2,047 | ) | 466 |
| (1,310 | ) | 3,342 |
| 3,333 |
| | Total other comprehensive income/(loss) | 3,788 |
| (9 | ) | 28 |
| 556 |
| (225 | ) | 4,138 |
| | Comprehensive income/(loss) | 6,670 |
| (2,056 | ) | 494 |
| (754 | ) | 3,117 |
| 7,471 |
| | Comprehensive income attributable to noncontrolling interests | — |
| — |
| — |
| — |
| (801 | ) | (801 | ) | | Comprehensive income/(loss) attributable to controlling interests | 6,670 |
| (2,056 | ) | 494 |
| (754 | ) | 2,316 |
| 6,670 |
|
Condensed Consolidating Statements of Earnings and Comprehensive Income for the year ended December 31, 2017
| | | | | | | | | | | | | | | | Parent Issuer and Guarantor | Subsidiary Issuer and Guarantor - SEP | Subsidiary Issuer and Guarantor - EEP | Subsidiary Non-Guarantors | Consolidating and elimination adjustments | Consolidated - Enbridge | | (millions of Canadian dollars) | | | | | | | | Operating revenues | | | | | | | | Commodity sales | — |
| — |
| — |
| 26,286 |
| — |
| 26,286 |
| | Gas distribution sales | — |
| — |
| — |
| 4,215 |
| — |
| 4,215 |
| | Transportation and other services | — |
| — |
| — |
| 13,877 |
| — |
| 13,877 |
| | Total operating revenues | — |
| — |
| — |
| 44,378 |
| — |
| 44,378 |
| | Operating expenses | | | | | | | | Commodity costs | — |
| — |
| — |
| 26,065 |
| — |
| 26,065 |
| | Gas distribution costs | — |
| — |
| — |
| 2,572 |
| — |
| 2,572 |
| | Operating and administrative | 169 |
| 146 |
| 16 |
| 6,111 |
| — |
| 6,442 |
| | Depreciation and amortization | 56 |
| — |
| — |
| 3,107 |
| — |
| 3,163 |
| | Impairment of long lived assets | — |
| — |
| — |
| 4,463 |
| — |
| 4,463 |
| | Impairment of goodwill | — |
| — |
| — |
| 102 |
| — |
| 102 |
| | Total operating expenses | 225 |
| 146 |
| 16 |
| 42,420 |
| — |
| 42,807 |
| | Operating income/(loss) | (225 | ) | (146 | ) | (16 | ) | 1,958 |
| — |
| 1,571 |
| | Income from equity investments | 471 |
| 118 |
| — |
| 981 |
| (468 | ) | 1,102 |
| | Equity earnings from consolidated subsidiaries | 2,130 |
| 752 |
| 926 |
| 881 |
| (4,689 | ) | — |
| | Other | | | | | | | | Net foreign currency gain/(loss) | 500 |
| — |
| — |
| (22 | ) | (241 | ) | 237 |
| | Gain/(loss) on dispositions | (11 | ) | — |
| — |
| 27 |
| — |
| 16 |
| | Other, including other income/(expense) from affiliates | 871 |
| 11 |
| 139 |
| 74 |
| (896 | ) | 199 |
| | Interest expense | (816 | ) | (221 | ) | (691 | ) | (1,753 | ) | 925 |
| (2,556 | ) | | Earnings before income taxes | 2,920 |
| 514 |
| 358 |
| 2,146 |
| (5,369 | ) | 569 |
| | Income tax (expense)/recovery | (61 | ) | — |
| 9 |
| 2,706 |
| 43 |
| 2,697 |
| | Earnings | 2,859 |
| 514 |
| 367 |
| 4,852 |
| (5,326 | ) | 3,266 |
| | Earnings attributable to noncontrolling interests and redeemable noncontrolling interests | — |
| — |
| — |
| — |
| (407 | ) | (407 | ) | | Earnings attributable to controlling interests | 2,859 |
| 514 |
| 367 |
| 4,852 |
| (5,733 | ) | 2,859 |
| | Preference share dividends | (330 | ) | — |
| — |
| — |
| — |
| (330 | ) | | Earnings attributable to common shareholders | 2,529 |
| 514 |
| 367 |
| 4,852 |
| (5,733 | ) | 2,529 |
| | Earnings | 2,859 |
| 514 |
| 367 |
| 4,852 |
| (5,326 | ) | 3,266 |
| | Total other comprehensive income/(loss) | (2,031 | ) | 12 |
| 204 |
| (412 | ) | (51 | ) | (2,278 | ) | | Comprehensive income | 828 |
| 526 |
| 571 |
| 4,440 |
| (5,377 | ) | 988 |
| | Comprehensive income attributable to noncontrolling interests | — |
| — |
| — |
| — |
| (160 | ) | (160 | ) | | Comprehensive income attributable to controlling interests | 828 |
| 526 |
| 571 |
| 4,440 |
| (5,537 | ) | 828 |
|
Condensed Consolidating Statements of Financial Position as at December 31, 2019
| | | | | | | | | | | | | | | | Parent Issuer and Guarantor | Subsidiary Issuer and Guarantor - SEP | Subsidiary Issuer and Guarantor - EEP | Subsidiary Non-Guarantors | Consolidating and elimination adjustments | Consolidated - Enbridge | | (millions of Canadian dollars) | | | | | | | | Assets | | | | | | | | Current assets | | | | | | | | Cash and cash equivalents | — |
| 33 |
| 4 |
| 611 |
| — |
| 648 |
| | Restricted cash | 9 |
| — |
| — |
| 19 |
| — |
| 28 |
| | Accounts receivable and other | 429 |
| 8 |
| 4 |
| 6,340 |
| — |
| 6,781 |
| | Accounts receivable from affiliates | 746 |
| — |
| 12 |
| (164 | ) | (525 | ) | 69 |
| | Short-term loans receivable from affiliates | 1,691 |
| — |
| 3,961 |
| 4,417 |
| (10,069 | ) | — |
| | Inventory | — |
| — |
| — |
| 1,299 |
| — |
| 1,299 |
| | | 2,875 |
| 41 |
| 3,981 |
| 12,522 |
| (10,594 | ) | 8,825 |
| | Property, plant and equipment, net | 248 |
| — |
| — |
| 93,475 |
| — |
| 93,723 |
| | Long-term loans receivable from affiliates | 47,285 |
| 73 |
| 2,387 |
| 35,672 |
| (85,417 | ) | — |
| | Investments in subsidiaries | 80,456 |
| 18,956 |
| 5,180 |
| 14,782 |
| (119,374 | ) | — |
| | Long-term investments | 1,701 |
| 932 |
| — |
| 14,467 |
| (572 | ) | 16,528 |
| | Restricted long-term investments | — |
| — |
| — |
| 434 |
| — |
| 434 |
| | Deferred amounts and other assets | 998 |
| 1 |
| 1 |
| 7,282 |
| (849 | ) | 7,433 |
| | Intangible assets, net | 247 |
| — |
| — |
| 1,926 |
| — |
| 2,173 |
| | Goodwill | — |
| — |
| — |
| 33,153 |
| — |
| 33,153 |
| | Deferred income taxes | 486 |
| — |
| — |
| 514 |
| — |
| 1,000 |
| | Total assets | 134,296 |
| 20,003 |
| 11,549 |
| 214,227 |
| (216,806 | ) | 163,269 |
| | | | | | | | | | Liabilities and equity | | | | | | | | Current liabilities | | | | | | | | Short-term borrowings | — |
| — |
| — |
| 898 |
| — |
| 898 |
| | Accounts payable and other | 2,765 |
| 28 |
| 1 |
| 7,745 |
| (476 | ) | 10,063 |
| | Accounts payable to affiliates | 736 |
| 367 |
| 83 |
| (640 | ) | (525 | ) | 21 |
| | Interest payable | 279 |
| 52 |
| 51 |
| 242 |
| — |
| 624 |
| | Short-term loans payable to affiliates | 367 |
| 2,058 |
| 1,991 |
| 5,653 |
| (10,069 | ) | — |
| | Current portion of long-term debt | 2,160 |
| 518 |
| — |
| 1,726 |
| — |
| 4,404 |
| | | 6,307 |
| 3,023 |
| 2,126 |
| 15,624 |
| (11,070 | ) | 16,010 |
| | Long-term debt | 27,290 |
| 4,435 |
| 3,789 |
| 24,147 |
| — |
| 59,661 |
| | Other long-term liabilities | 1,295 |
| 2 |
| 12 |
| 7,864 |
| (849 | ) | 8,324 |
| | Long-term loans payable to affiliates | 33,686 |
| — |
| 3,112 |
| 48,619 |
| (85,417 | ) | — |
| | Deferred income taxes | — |
| 271 |
| — |
| 13,887 |
| (4,291 | ) | 9,867 |
| | | 68,578 |
| 7,731 |
| 9,039 |
| 110,141 |
| (101,627 | ) | 93,862 |
| | Equity | | | | | | | Controlling interests1 | 65,718 |
| 12,272 |
| 2,510 |
| 104,086 |
| (118,543 | ) | 66,043 |
| | Noncontrolling interests | — |
| — |
| — |
| — |
| 3,364 |
| 3,364 |
| | | 65,718 |
| 12,272 |
| 2,510 |
| 104,086 |
| (115,179 | ) | 69,407 |
| | Total liabilities and equity | 134,296 |
| 20,003 |
| 11,549 |
| 214,227 |
| (216,806 | ) | 163,269 |
|
1 Equity attributable to controlling interests for parent issuer and guarantor excludes reciprocal shareholding balance included within consolidating and elimination adjustments.
Condensed Consolidating Statements of Financial Position as at December 31, 2018
| | | | | | | | | | | | | | | | Parent Issuer and Guarantor | Subsidiary Issuer and Guarantor - SEP | Subsidiary Issuer and Guarantor - EEP | Subsidiary Non-Guarantors | Consolidating and elimination adjustments | Consolidated - Enbridge | | (millions of Canadian dollars) | | | | | | | | Assets | | | | | | | | Current assets | | | | | | | | Cash and cash equivalents | — |
| 16 |
| — |
| 502 |
| — |
| 518 |
| | Restricted cash | 9 |
| — |
| — |
| 110 |
| — |
| 119 |
| | Accounts receivable and other | 283 |
| 15 |
| 8 |
| 6,211 |
| — |
| 6,517 |
| | Accounts receivable from affiliates | 726 |
| — |
| 13 |
| (142 | ) | (518 | ) | 79 |
| | Short-term loans receivable from affiliates | 3,943 |
| — |
| 3,689 |
| 653 |
| (8,285 | ) | — |
| | Inventory | — |
| — |
| — |
| 1,339 |
| — |
| 1,339 |
| | | 4,961 |
| 31 |
| 3,710 |
| 8,673 |
| (8,803 | ) | 8,572 |
| | Property, plant and equipment, net | 140 |
| — |
| — |
| 94,400 |
| — |
| 94,540 |
| | Long-term loans receivable from affiliates | 10,318 |
| 73 |
| 2,539 |
| 1,344 |
| (14,274 | ) | — |
| | Investments in subsidiaries | 78,474 |
| 19,777 |
| 6,363 |
| 15,567 |
| (120,181 | ) | — |
| | Long-term investments | 4,561 |
| 987 |
| — |
| 14,841 |
| (3,682 | ) | 16,707 |
| | Restricted long-term investments | — |
| — |
| — |
| 323 |
| — |
| 323 |
| | Deferred amounts and other assets | 1,700 |
| 9 |
| 17 |
| 8,558 |
| (1,726 | ) | 8,558 |
| | Intangible assets, net | 234 |
| — |
| — |
| 2,138 |
| — |
| 2,372 |
| | Goodwill | — |
| — |
| — |
| 34,459 |
| — |
| 34,459 |
| | Deferred income taxes | 817 |
| — |
| — |
| 229 |
| 328 |
| 1,374 |
| | Total assets | 101,205 |
| 20,877 |
| 12,629 |
| 180,532 |
| (148,338 | ) | 166,905 |
| | | | | | | | | | Liabilities and equity | | | | | | | | Current liabilities | | | | | | | | Short-term borrowings | — |
| — |
| — |
| 1,024 |
| — |
| 1,024 |
| | Accounts payable and other | 2,742 |
| 7 |
| 34 |
| 7,059 |
| (6 | ) | 9,836 |
| | Accounts payable to affiliates | 946 |
| 233 |
| 56 |
| (677 | ) | (518 | ) | 40 |
| | Interest payable | 283 |
| 56 |
| 105 |
| 225 |
| — |
| 669 |
| | Short-term loans payable to affiliates | 426 |
| 682 |
| — |
| 7,177 |
| (8,285 | ) | — |
| | Environmental liabilities, current | — |
| — |
| — |
| 27 |
| — |
| 27 |
| | Current portion of long-term debt | 1,853 |
| — |
| 683 |
| 723 |
| — |
| 3,259 |
| | | 6,250 |
| 978 |
| 878 |
| 15,558 |
| (8,809 | ) | 14,855 |
| | Long-term debt | 22,893 |
| 7,276 |
| 6,943 |
| 23,215 |
| — |
| 60,327 |
| | Other long-term liabilities | 2,428 |
| 2 |
| 30 |
| 8,100 |
| (1,726 | ) | 8,834 |
| | Long-term loans payable to affiliates | 76 |
| — |
| 1,502 |
| 12,696 |
| (14,274 | ) | — |
| | Deferred income taxes | — |
| 331 |
| — |
| 13,523 |
| (4,400 | ) | 9,454 |
| | | 31,647 |
| 8,587 |
| 9,353 |
| 73,092 |
| (29,209 | ) | 93,470 |
| | Equity | | | | | | | Controlling interests1 | 69,558 |
| 12,290 |
| 3,276 |
| 107,440 |
| (123,094 | ) | 69,470 |
| | Noncontrolling interests | — |
| — |
| — |
| — |
| 3,965 |
| 3,965 |
| | | 69,558 |
| 12,290 |
| 3,276 |
| 107,440 |
| (119,129 | ) | 73,435 |
| | Total liabilities and equity | 101,205 |
| 20,877 |
| 12,629 |
| 180,532 |
| (148,338 | ) | 166,905 |
|
1 Equity attributable to controlling interests for parent issuer and guarantor excludes reciprocal shareholding balance included within consolidating and elimination adjustments.
Condensed Consolidating Statements of Cash Flows for the year ended December 31, 2019
| | | | | | | | | | | | | | | | Parent Issuer and Guarantor | Subsidiary Issuer and Guarantor - SEP | Subsidiary Issuer and Guarantor - EEP | Subsidiary Non-Guarantors | Consolidating and elimination adjustments | Consolidated - Enbridge | | (millions of Canadian dollars) | | | | | | | | Net cash provided by operating activities | 2,246 |
| 1,676 |
| (365 | ) | 9,675 |
| (3,834 | ) | 9,398 |
| | Investing activities | | | | | | | | Capital expenditures | (75 | ) | — |
| — |
| (5,417 | ) | — |
| (5,492 | ) | | Long-term investments and restricted long-term investments | (26 | ) | (11 | ) | — |
| (1,122 | ) | — |
| (1,159 | ) | | Distributions from equity investments in excess of cumulative earnings | — |
| 24 |
| 1,196 |
| 393 |
| (1,196 | ) | 417 |
| | Additions to intangible assets | (68 | ) | — |
| — |
| (132 | ) | — |
| (200 | ) | | Affiliate loans, net | — |
| — |
| — |
| (314 | ) | — |
| (314 | ) | | Proceeds from disposition | — |
| — |
| — |
| 2,110 |
| — |
| 2,110 |
| | Contributions to subsidiaries | (4,759 | ) | — |
| (12 | ) | — |
| 4,771 |
| — |
| | Return of share capital from subsidiary companies | 5,281 |
| — |
| — |
| — |
| (5,281 | ) | — |
| | Advances to affiliates | (50,897 | ) | — |
| (2,778 | ) | (60,787 | ) | 114,462 |
| — |
| | Repayment of advances to affiliates | 15,808 |
| — |
| 2,357 |
| 22,136 |
| (40,301 | ) | — |
| | Other | — |
| — |
| — |
| (20 | ) | — |
| (20 | ) | | Net cash (used in)/provided by investing activities | (34,736 | ) | 13 |
| 763 |
| (43,153 | ) | 72,455 |
| (4,658 | ) | | Financing activities | | | | | | | | Net change in short-term borrowings | — |
| — |
| — |
| (127 | ) | — |
| (127 | ) | | Net change in commercial paper and credit facility draws | 3,158 |
| (2,011 | ) | (1,017 | ) | 695 |
| — |
| 825 |
| | Debenture and term note issues, net of issue costs | 3,621 |
| — |
| — |
| 2,555 |
| — |
| 6,176 |
| | Debenture and term note repayments | (1,450 | ) | — |
| (2,514 | ) | (704 | ) | — |
| (4,668 | ) | | Contributions from noncontrolling interests | — |
| — |
| — |
| — |
| 12 |
| 12 |
| | Distributions to noncontrolling interests | — |
| — |
| — |
| — |
| (254 | ) | (254 | ) | | Contributions from redeemable noncontrolling interests | — |
| — |
| — |
| — |
| — |
| — |
| | Distributions to redeemable noncontrolling interests | — |
| — |
| — |
| — |
| — |
| — |
| | Contributions from parents | — |
| — |
| — |
| 4,771 |
| (4,771 | ) | — |
| | Distributions to parents | — |
| (1,014 | ) | (651 | ) | (8,888 | ) | 10,553 |
| — |
| | Redemption of preferred shares | — |
| — |
| — |
| (300 | ) | — |
| (300 | ) | | Common shares issued | 18 |
| — |
| — |
| — |
| — |
| 18 |
| | Preference share dividends | (383 | ) | — |
| — |
| — |
| — |
| (383 | ) | | Common share dividends | (5,973 | ) | — |
| — |
| — |
| — |
| (5,973 | ) | | Advances from affiliates | 46,860 |
| 5,678 |
| 8,249 |
| 53,675 |
| (114,462 | ) | — |
| | Repayment of advances from affiliates | (13,361 | ) | (4,321 | ) | (4,454 | ) | (18,165 | ) | 40,301 |
| — |
| | Other | — |
| (4 | ) | (7 | ) | (60 | ) | — |
| (71 | ) | | Net cash provided by/(used in) financing activities | 32,490 |
| (1,672 | ) | (394 | ) | 33,452 |
| (68,621 | ) | (4,745 | ) | | Effect of translation of foreign denominated cash and cash equivalents and restricted cash | — |
| — |
| — |
| 44 |
| — |
| 44 |
| | Net increase/(decrease) in cash and cash equivalents and restricted cash | — |
| 17 |
| 4 |
| 18 |
| — |
| 39 |
| | Cash and cash equivalents and restricted cash at beginning of year | 9 |
| 16 |
| — |
| 612 |
| — |
| 637 |
| | Cash and cash equivalents and restricted cash at end of year | 9 |
| 33 |
| 4 |
| 630 |
| — |
| 676 |
|
Condensed Consolidating Statements of Cash Flows for the year ended December 31, 2018
| | | | | | | | | | | | | | | | Parent Issuer and Guarantor | Subsidiary Issuer and Guarantor - SEP | Subsidiary Issuer and Guarantor - EEP | Subsidiary Non-Guarantors | Consolidating and elimination adjustments | Consolidated - Enbridge | | (millions of Canadian dollars) | | | | | | | | Net cash provided by/(used in) operating activities | 1,696 |
| 1,751 |
| (239 | ) | 11,683 |
| (4,389 | ) | 10,502 |
| | Investing activities | | | | | | | | Capital expenditures | (28 | ) | — |
| — |
| (6,778 | ) | — |
| (6,806 | ) | | Long-term investments and restricted long-term investments | (81 | ) | (12 | ) | — |
| (1,297 | ) | 78 |
| (1,312 | ) | | Distributions from equity investments in excess of cumulative earnings | 287 |
| 45 |
| 982 |
| 1,232 |
| (1,269 | ) | 1,277 |
| | Additions to intangible assets | (43 | ) | — |
| — |
| (497 | ) | — |
| (540 | ) | | Proceeds from dispositions | 1,790 |
| — |
| — |
| 2,662 |
| — |
| 4,452 |
| | Contributions to subsidiaries | (8,131 | ) | (79 | ) | (13 | ) | (1,655 | ) | 9,878 |
| — |
| | Return of share capital from subsidiaries | 3,753 |
| — |
| — |
| — |
| (3,753 | ) | — |
| | Advances to affiliates | (6,863 | ) | — |
| (1,703 | ) | (5,685 | ) | 14,251 |
| — |
| | Repayment of advances to affiliates | 9,427 |
| 518 |
| 1,504 |
| 4,124 |
| (15,573 | ) | — |
| | Affiliate loans, net | | | | (76 | ) | | (76 | ) | | Other | — |
| — |
| — |
| (12 | ) | — |
| (12 | ) | | Net cash provided by/(used in) investing activities | 111 |
| 472 |
| 770 |
| (7,982 | ) | 3,612 |
| (3,017 | ) | | Financing activities | | | | | | | | Net change in short-term borrowings | — |
| — |
| — |
| (420 | ) | — |
| (420 | ) | | Net change in commercial paper and credit facility draws | (734 | ) | (962 | ) | (1,009 | ) | 449 |
| — |
| (2,256 | ) | | Debenture and term note issues, net of issue costs | 2,554 |
| — |
| — |
| 983 |
| — |
| 3,537 |
| | Debenture and term note repayments | — |
| (648 | ) | (509 | ) | (3,288 | ) | — |
| (4,445 | ) | | Sale of noncontrolling interests in subsidiaries | — |
| — |
| — |
| — |
| 1,289 |
| 1,289 |
| | Contributions from noncontrolling interests | — |
| — |
| — |
| — |
| 24 |
| 24 |
| | Distributions to noncontrolling interests | — |
| — |
| — |
| — |
| (857 | ) | (857 | ) | | Contributions from redeemable noncontrolling interests | — |
| — |
| — |
| — |
| 70 |
| 70 |
| | Distributions to redeemable noncontrolling interests | — |
| — |
| — |
| — |
| (325 | ) | (325 | ) | | Contributions from parents | — |
| — |
| 1,007 |
| 8,223 |
| (9,230 | ) | — |
| | Distributions to parents | — |
| (1,902 | ) | (666 | ) | (6,564 | ) | 9,132 |
| — |
| | Sponsored Vehicle buy-in cash payment | (64 | ) | — |
| — |
| — |
| — |
| (64 | ) | | Redemption of preferred shares | — |
| — |
| — |
| (210 | ) | — |
| (210 | ) | | Common shares issued | 21 |
| 648 |
| — |
| — |
| (648 | ) | 21 |
| | Preference share dividends | (364 | ) | — |
| — |
| — |
| — |
| (364 | ) | | Common share dividends | (3,480 | ) | — |
| — |
| — |
| — |
| (3,480 | ) | | Advances from affiliates | 710 |
| 1,474 |
| 3,501 |
| 8,566 |
| (14,251 | ) | — |
| | Repayment of advances from affiliates | (443 | ) | (826 | ) | (2,855 | ) | (11,449 | ) | 15,573 |
| — |
| | Other | — |
| (5 | ) | — |
| (18 | ) | — |
| (23 | ) | | Net cash (used in)/provided by financing activities | (1,800 | ) | (2,221 | ) | (531 | ) | (3,728 | ) | 777 |
| (7,503 | ) | | Effect of translation of foreign denominated cash and cash equivalents and restricted cash | — |
| — |
| — |
| 68 |
| — |
| 68 |
| | Net increase in cash and cash equivalents and restricted cash | 7 |
| 2 |
| — |
| 41 |
| — |
| 50 |
| | Cash and cash equivalents and restricted cash at beginning of year | 2 |
| 14 |
| — |
| 571 |
| — |
| 587 |
| | Cash and cash equivalents and restricted cash at end of year | 9 |
| 16 |
| — |
| 612 |
| — |
| 637 |
|
Condensed Consolidating Statements of Cash Flows for the year ended December 31, 2017
| | | | | | | | | | | | | | | | Parent Issuer and Guarantor | Subsidiary Issuer and Guarantor - SEP | Subsidiary Issuer and Guarantor - EEP | Subsidiary Non-Guarantors | Consolidating and elimination adjustments | Consolidated - Enbridge | | (millions of Canadian dollars) | | | | | | | | Net cash (used in)/provided by operating activities | 620 |
| 355 |
| (695 | ) | 9,654 |
| (3,276 | ) | 6,658 |
| | Investing activities | | | | | | | | Capital expenditures | (21 | ) | — |
| — |
| (8,266 | ) | — |
| (8,287 | ) | | Long-term investments and restricted long-term investments | (202 | ) | (51 | ) | — |
| (3,535 | ) | 202 |
| (3,586 | ) | | Distributions from equity investments in excess of cumulative earnings | 36 |
| 22 |
| 921 |
| 103 |
| (957 | ) | 125 |
| | Additions to intangible assets | (47 | ) | — |
| — |
| (742 | ) | — |
| (789 | ) | | Cash acquired in Merger Transaction | — |
| — |
| — |
| 682 |
| — |
| 682 |
| | Proceeds from dispositions | — |
| — |
| 1,742 |
| 1,103 |
| (2,217 | ) | 628 |
| | Contributions to subsidiaries | (4,866 | ) | — |
| (2,056 | ) | — |
| 6,922 |
| — |
| | Return of share capital from subsidiaries | 2,192 |
| — |
| 1,532 |
| — |
| (3,724 | ) | — |
| | Advances to affiliates | (7,145 | ) | (519 | ) | (1,410 | ) | (3,020 | ) | 12,094 |
| — |
| | Repayment of advances to affiliates | 4,506 |
| — |
| 2,129 |
| 2,887 |
| (9,522 | ) | — |
| | Affiliate loans, net | — |
| — |
| — |
| (22 | ) | — |
| (22 | ) | | Other | — |
| — |
| — |
| 212 |
| — |
| 212 |
| | Net cash (used in)/provided by investing activities | (5,547 | ) | (548 | ) | 2,858 |
| (10,598 | ) | 2,798 |
| (11,037 | ) | | Financing activities | | | | | | | | Net change in short-term borrowings | — |
| — |
| — |
| 721 |
| — |
| 721 |
| | Net change in commercial paper and credit facility draws | (1,845 | ) | 1,965 |
| (316 | ) | (1,053 | ) | — |
| (1,249 | ) | | Debenture and term note issues, net of issue costs | 8,177 |
| 519 |
| — |
| 787 |
| — |
| 9,483 |
| | Debenture and term note repayments | (1,711 | ) | (533 | ) | — |
| (2,810 | ) | — |
| (5,054 | ) | | Purchase of interest in consolidated subsidiary | — |
| — |
| (475 | ) | (1,969 | ) | 2,217 |
| (227 | ) | | Contributions from noncontrolling interests | — |
| — |
| — |
| — |
| 832 |
| 832 |
| | Distributions to noncontrolling interests | — |
| — |
| — |
| — |
| (919 | ) | (919 | ) | | Contributions from redeemable noncontrolling interests | 563 |
| — |
| — |
| — |
| 615 |
| 1,178 |
| | Distributions to redeemable noncontrolling interests | — |
| — |
| — |
| — |
| (247 | ) | (247 | ) | | Contributions from parents | — |
| — |
| — |
| 6,922 |
| (6,922 | ) | — |
| | Distributions to parents | — |
| (1,987 | ) | (789 | ) | (6,093 | ) | 8,869 |
| — |
| | Preference shares issued | 489 |
| — |
| — |
| — |
| — |
| 489 |
| | Redemption of preferred shares | — |
| — |
| (1,613 | ) | 1,613 |
| — |
| — |
| | Common shares issued | 1,549 |
| 227 |
| 1,646 |
| — |
| (1,873 | ) | 1,549 |
| | Preference share dividends | (330 | ) | — |
| (478 | ) | — |
| 478 |
| (330 | ) | Common share dividends1 | (2,336 | ) | — |
| — |
| (414 | ) | — |
| (2,750 | ) | | Advances from affiliates | 407 |
| — |
| 2,613 |
| 9,074 |
| (12,094 | ) | — |
| | Repayment of advances from affiliates | (40 | ) | — |
| (2,847 | ) | (6,635 | ) | 9,522 |
| — |
| | Net cash provided by/(used in) financing activities | 4,923 |
| 191 |
| (2,259 | ) | 143 |
| 478 |
| 3,476 |
| | Effect of translation of foreign denominated cash and cash equivalents and restricted cash | — |
| — |
| (2 | ) | (70 | ) | — |
| (72 | ) | | Net decrease in cash and cash equivalents and restricted cash | (4 | ) | (2 | ) | (98 | ) | (871 | ) | — |
| (975 | ) | | Cash and cash equivalents and restricted cash at beginning of year | 6 |
| 16 |
| 98 |
| 1,442 |
| — |
| 1,562 |
| | Cash and cash equivalents and restricted cash at end of year | 2 |
| 14 |
| — |
| 571 |
| — |
| 587 |
|
1Common share dividends for the year ended December 31, 2017 includes amounts distributed by Spectra Energy Corp. related to dividends accrued prior to the Merger Transaction. No further awards have been or will be granted under the Spectra 2007 LTIP following the closing of the Merger Transaction.
|
Making changes to the 2019 LTIP To the extent permitted by applicable laws, the Board may amend, suspend or terminate the 2019 LTIP at any time without shareholder approval, provided that no amendment, other than an increase to the overall share limit, may materially and adversely affect any award outstanding at the time of the amendment without the affected participant’s consent. Enbridge shareholder approval is required to implement any of the following changes: increasing the overall share limit; reducing the grant, exercise or purchase price for any awards; the cancellation of any awards and the reissue of or replacement of such awards with awards having a lower grant, exercise or purchase price; removing or exceeding the limits of the 2019 LTIP on participation by insiders; the extension of the term of any award; allowing other than employees ornon-employee directors of the company or a subsidiary to become participants in the 2019 LTIP; allowing awards to become transferable or assignable other than by will or according to the laws of descent and distribution; and changing the amendment provisions of the 2019 LTIP. Termination provisions of equity compensation plans The termination provisions for equity compensation awards granted under the 2019 LTIP (as governed by the incentive stock option grant agreements and the RSU grant agreements), the incentive stock option plan (2007), as revised, and the performance stock option plan, are summarized below.
33. QUARTERLY FINANCIAL DATA (UNAUDITED)
| | | | | | | | | | | | | | | | | | | | | | | | Q1 |
| Q2 |
| Q3 |
| Q4 |
| Total |
| | (unaudited; millions of Canadian dollars, except per share amounts) | | | | | | | 2019 | | | | | | | Operating revenues | 12,856 |
| 13,263 |
| 11,598 |
| 12,352 |
| 50,069 |
| | Operating income | 2,619 |
| 2,285 |
| 1,588 |
| 1,768 |
| 8,260 |
| | Earnings | 2,023 |
| 1,830 |
| 1,060 |
| 914 |
| 5,827 |
| | Earnings attributable to controlling interests | 1,986 |
| 1,832 |
| 1,045 |
| 842 |
| 5,705 |
| | Earnings attributable to common shareholders | 1,891 |
| 1,736 |
| 949 |
| 746 |
| 5,322 |
| | Earnings per common share | | | | | | | Basic | 0.94 |
| 0.86 |
| 0.47 |
| 0.37 |
| 2.64 |
| | Diluted | 0.94 |
| 0.86 |
| 0.47 |
| 0.36 |
| 2.63 |
| | 2018 | | | | | | | Operating revenues | 12,726 |
| 10,745 |
| 11,345 |
| 11,562 |
| 46,378 |
| | Operating income | 878 |
| 1,571 |
| 854 |
| 1,513 |
| 4,816 |
| | Earnings | 510 |
| 1,327 |
| 213 |
| 1,283 |
| 3,333 |
| | Earnings attributable to controlling interests | 534 |
| 1,160 |
| 4 |
| 1,184 |
| 2,882 |
| Earnings/(loss) attributable to common shareholders
| 445 |
| 1,071 |
| (90 | ) | 1,089 |
| 2,515 |
| | Earnings/(loss) per common share | | | | | | | Basic | 0.26 |
| 0.63 |
| (0.05 | ) | 0.60 |
| 1.46 |
| | Diluted | 0.26 |
| 0.63 |
| (0.05 | ) | 0.60 |
| 1.46 |
|
Reason for termination
| |
Incentive stock option provisions1 | | Restricted stock unit provisions | | | | | | | | | Can exercise vested options up to 30 days from the date of termination or until the option term expires (if sooner). | | All outstanding RSUs are forfeited. | | | | | | | | | ITEM 9. CHANGES IN AND DISAGREEMENTS WITH ACCOUNTANTS ON ACCOUNTING AND FINANCIAL DISCLOSUREFor incentive stock options granted prior to 2020, options continue to vest and can be exercised up to three years from retirement or until the stock option term expires (if sooner).
None.
ITEM 9A. CONTROLS AND PROCEDURES
DISCLOSURE CONTROLS AND PROCEDURESFor incentive stock options granted in 2020 and thereafter, options continue to vest and can be exercised up to five years from retirement or until the stock option term expires (if sooner). Disclosure controls
Conditions for performance stock options are mentioned below. | | RSUs are prorated to retirement date and proceduresvalue is assessed and settled at the end of the usual term. | | | | | | | | | All options vest and can be exercised up to 12 months from the date of death or until the option term expires (if sooner). | | All outstanding RSUs become vested and are designedsettled no later than 30 days following the date of death. | | | | | | | | | Options continue to provide reasonable assurancevest based on the regular provisions of the plan. | | All outstanding RSUs become vested and are settled no later than 30 days following the date of disability. | | | | | | | not for cause | | Unvested options continue to vest during the notice period, and options that information requiredare vested or become vested can be exercised up to 30 days after the notice period expires or until the option term expires (if sooner). | | RSUs are prorated to termination date (plus any applicable notice period) and value is assessed and settled at the end of the usual term. | | for cause | | All options are cancelled on the date of termination. | | All outstanding RSUs are forfeited. |
| | | | | | | | | | | | Incentive stock option provisions1 | | Restricted stock unit provisions | | | | | | Beginning with the 2017 grants, if the employment of a participant is terminated without cause (including constructive dismissal) by the company or a subsidiary within two years after a change of control, then all unvested options of the participant vest on that double-trigger date. For 2016 and prior grants, for a change of control, options vest on a date determined by the HRC Committee before the change of control. For any other kind of reorganization, options are to be disclosedassumed by the successor company. If they are not assumed, they will vest and the value will be paid in reports filed with,cash. Performance stock option plan | | If the employment of a participant is terminated without cause, (including constructive dismissal) by the company or submitted to, securities regulatory authorities is recorded, processed, summarizeda subsidiary within two years after a change of control, then all outstanding RSUs become vested and reportedare settled no later than 30 days following the date of termination. | | | | | Other transfer or assignment of awards | | The holder of an option may not transfer or assign it other than by will, or as allowed by the laws of descent and distribution. | | The award may not be sold, pledged, assigned, hypothecated, transferred, or disposed of in any manner other than by will or by the laws of descent or distribution. |
| Differences in termination provisions apply for US$ options where the executive has elected treatment as incentive stock options within the time periods specified under Canadianmeaning of U.S. Internal Revenue Code Section 422. |
Options granted under the Performance stock option plan have the same termination provisions as options granted under the Incentive stock option plan, except for the following differences: for retirement, performance stock options are prorated for the period of active employment in the five-year period starting January 1 of the year of grant. These options can be exercised until the later of three years after retirement, or 30 days after the date by which the share price targets must be met (or the date the option expires, if earlier), as long as the share price targets are met; for death, unvested performance stock options are prorated and the plan assumes performance requirements have been met; for involuntary terminationunvested performance stock options are prorated; and for change of control, the plan assumes the performance requirements have been met and the plan was not amended in 2018 to implement a double trigger change of control as there are currently no plans to grant further awards under the plan. Assumed equity-based compensation awards from Spectra Energy Pursuant to the terms of the merger agreement, Enbridge assumed all awards outstanding under the Spectra Energy Corp 2007 Long Term Incentive Plan, as amended and restated (the “Spectra 2007 LTIP”) at the closing of the Merger Transaction (“Assumed Spectra LTIP Awards”). The Assumed Spectra LTIP Awards, including the shares of Enbridge issuable thereunder, were approved by Enbridge shareholders as part of the Merger Transaction on December 15, 2016. No further awards have been or will be granted under the Spectra 2007 LTIP following the closing of the Merger Transaction. The Assumed Spectra LTIP Awards remain subject to and will continue to be administered by Enbridge pursuant to the terms of Spectra 2007 LTIP. The following summarizes the material provisions of the Spectra 2007 LTIP to the extent applicable to the Assumed Spectra LTIP Awards. The summary is qualified in its entirety by the full text of the amended and restated Spectra 2007 LTIP, which is available on Enbridge’s profile on the SEC’s website at www.sec.gov. Number of shares. The aggregate number of Enbridge shares that may be issued pursuant to the Assumed Spectra LTIP Awards is 5,000,000 shares of Enbridge representing 0.25% of Enbridge’s outstanding and issued shares as at December 31, 2019. Reservation of shares. When Spectra Energy first adopted the Spectra 2007 LTIP in 2007, it reserved 30,000,000 shares of common stock for issuance under the Spectra 2007 LTIP, with an additional 10,000,000 shares and 12,500,000 shares reserved following shareholder approval on April 19, 2011 and April 26, 2016, respectively. Immediately prior to closing of the Merger Transaction, there were 19,756,580 shares of Spectra Energy common stock available for future issuance under the Spectra 2007 LTIP. However, Enbridge determined that it would not grant any additional awards under the Spectra 2007 LTIP following the closing of the Merger Transaction and as a result, assumed only those shares issuable under the Assumed Spectra LTIP Awards. All future equity-based awards granted by Enbridge (including those made to legacy Spectra Energy employees) will be awarded pursuant to Enbridge’s existing plans and not the Spectra 2007 LTIP.
Administration. Prior to the closing of the Merger Transaction, the Spectra 2007 LTIP was administered by the Compensation Committee of Spectra Energy, which had the authority to determine the persons to whom awards were granted, the types of awards granted, the time at which awards were to be granted, the number of shares, units or other rights subject to an award, and the terms and conditions of each award. Following the completion of the Merger Transaction, the Spectra 2007 LTIP will, solely to the extent applicable to the Assumed Spectra LTIP Awards, be administered by the HRC Committee consistent with the administration of Enbridge’s existing compensation programs. Eligibility. All key employees of Spectra Energy and its subsidiaries and allnon-employee directors were eligible for awards granted under the Spectra 2007 LTIP, as selected from time to time by the Compensation Committee of Spectra Energy in its sole discretion. As noted above, only those shares issuable under the Assumed Spectra LTIP Awards were assumed by Enbridge in connection with the Merger Transaction and as a result, no additional awards will be granted by Enbridge to any individual under the Spectra 2007 LTIP. Awards. As described in more detail below, the Assumed Spectra LTIP Awards include: | — | Spectra Energy phantom units; |
| — | Spectra Energy PSUs; and United States securities law. As at December 31, 2019, an evaluation was carried out |
| — | Dividend equivalent awards. |
Adjustments to awards. The HRC Committee may determine and implement appropriate adjustments to the Assumed Spectra LTIP Awards in the event of any merger, consolidation, recapitalization, reclassification, stock dividend, stock split or other similar change of control transactions. Term and amendment. The Spectra 2007 LTIP has a term of ten years from the date of approval by the shareholders of Spectra Energy, which was last granted on April 26, 2016, subject to earlier termination or amendment in accordance with the terms of the Spectra 2007 LTIP. Any amendment to the Assumed Spectra LTIP Awards or the Spectra 2007 LTIP that is implemented by the HRC Committee may not materially adversely affect the Assumed Spectra LTIP Awards without consent of the holder of such award. Assignability. A stock option granted under the Spectra 2007 LTIP may, solely to the extent permitted by the HRC Committee, be transferred to members of the participants’ immediate family or to trusts, partnerships or corporations whose beneficiaries, members or owners are members of the participant’s immediate family or such other person as may be approved by the HRC Committee in advance and set forth in the award agreement. All other Assumed Spectra LTIP Awards are not assignable or transferable except by will or the laws of descent and distribution. Nonqualified stock options and incentive stock options. Spectra Energy granted options under the Spectra 2007 LTIP to purchase shares of Spectra Energy common stock (“Spectra Energy options”) to certain of its employees. As | | of immediately prior to the closing of the Merger Transaction, there were 4,000 Spectra Energy options outstanding under the supervisionSpectra 2007 LTIP at a weighted average exercise price of US$26.33 per share of Spectra Energy common stock and with the participation of our management, including the Chief Executive Officer and Chief Financial Officer, of the effectiveness of the design and operations of our disclosure controls and procedures (as defined in Rule 13a-15(e) and 15d-15(e)892,163 Spectra Energy options outstanding under the Securities Exchange ActSpectra 2007 LTIP at a weighted average exercise price of 1934). Based on that evaluation, the Chief Executive OfficerUS$28.40 per share of Spectra Energy common stock. |
Exercise price. The exercise price of each Spectra Energy option was determined by the Compensation Committee of Spectra Energy at the date of grant, provided however, that the exercise price per option could not be less than 100% of the fair market value per share of the common stock of Spectra Energy as of the date of grant. As the exercise price of the Spectra Energy options was determined at the date of grant, the exercise price may be below the then current market price of the Enbridge shares at the time the options are exercised. Vesting and term of stock options. The Compensation Committee of Spectra Energy prescribed in the award agreement applicable to each Spectra Energy option the time or times at which, or the conditions upon which, such option vests or becomes exercisable. Spectra Energy options generally have a term of ten years from date of grant and during such term, once vested, the option could be exercised, unless a shorter exercise period was specified by the Compensation Committee of Spectra Energy in an award agreement, and subject to such limitations as may apply under an award agreement relating to the termination of a participant’s employment or other service with Spectra Energy or any of its subsidiaries. Treatment upon closing of the Merger Transaction. At the closing of the Merger Transaction, each outstanding Spectra Energy option, whether vested or unvested, was automatically converted into an option to purchase, on the same terms and conditions as were applicable immediately prior to the closing, the number of Enbridge shares equal to the product (rounded down to the nearest whole number) of (i) the number of shares of Spectra Energy common stock subject to such option immediately prior to the closing and (ii) 0.984 (“Exchange Ratio”), at an exercise price per share (rounded up to the nearest whole cent) equal to (A) the exercise price per share of Spectra Energy common stock of such Spectra Energy option immediately prior to the closing divided by (B) the Exchange Ratio. The Spectra Energy options assumed by Enbridge in connection with the Merger Transaction are exercisable for 881,819 Enbridge shares at a weighted average exercise price of US$28.86 per share of Enbridge shares, vest at various dates until February 2019 and have various terms expiring on or before February 2026. Grant, price and vesting. Spectra Energy granted awards of phantom units under the Spectra 2007 LTIP (“Spectra Energy phantom units”) which entitle the holder thereof the right to receive at the end of a fixed vesting period, payment based on the value of a share of common stock at the time of vesting. On the applicable vesting dates, Spectra Energy phantom units are settled in Enbridge shares or cash with an equivalent fair market value as required by the terms of such award.
Treatment upon closing of the Merger Transaction. At the closing of the Merger Transaction, each Spectra Energy phantom unit, whether vested or unvested, was automatically converted into a phantom unit, on the same terms and conditions as were applicable immediately prior to the closing, denominated in a number of Enbridge shares equal to the product (rounded down to the nearest whole number) of (i) the number of shares of Spectra Energy common stock subject to such Spectra Energy phantom unit immediately prior to the closing and (ii) the Exchange Ratio. Enbridge assumed 1,566,726 Spectra Energy phantom units which were converted into 1,541,094 phantom units denominated in Enbridge shares in connection with the Merger Transaction. Approximately 42% of these assumed Spectra phantom units will be settled in Enbridge shares and approximately 58% will be settled in cash at various dates until February 2020. Grant. Spectra Energy granted certain performance awards denominated in shares of Spectra Energy common stock under the Spectra 2007 LTIP (“Spectra Energy PSUs”) which become payable at the completion of a three-year performance period based upon the achievement of certain performance criteria established by the Compensation Committee of Spectra Energy. Performance award payments made in the form of Enbridge shares are valued at their fair market value at the time of payment. Treatment upon closing of the Merger Transaction – 2015 Spectra Energy PSUs. At the closing of the Merger Transaction, each outstanding Spectra Energy PSU granted in the 2015 calendar year (“2015 Spectra Energy PSU”), was automatically cancelled and converted into the right to receive a number of Enbridge shares equal to the product (rounded down to the nearest whole number) of (i) the number of shares of Spectra Energy common stock subject to such 2015 Spectra Energy PSU immediately prior to the closing multiplied by (ii) the Exchange Ratio, together with a cash payment equal to the amount of any dividend equivalents accrued with respect to such 2015 Spectra Energy PSU. The number of shares of Spectra Energy common stock subject to such 2015 Spectra Energy PSU was determined assuming a vesting percentage determined as set forth in the applicable award agreement (which was based upon Spectra Energy’s total stockholder return relative to the total stockholder return of the peer group for the period beginning on January 1, 2015, and ending on the date on which the closing of the Merger Transaction occurred). Approximately 820,671 Enbridge shares and US$2,637,494 in respect of accrued dividend equivalents (in each case, before tax withholding) were payable to holders of 2015 Spectra Energy PSUs in connection with the closing of the Merger Transaction. Treatment upon closing of the Merger Transaction – 2016 Spectra Energy PSUs. At the closing of the Merger Transaction, each outstanding Spectra Energy PSU granted in the 2016 calendar year (“2016 Spectra Energy PSU”), was automatically converted into a | | service-based stock unit denominated in Enbridge shares and Chief Financial Officer concluded that the design and operation of these disclosure controls and procedures were effective in ensuring that information required to be disclosed by us in reports that we file with or submit to the SEC and the Canadian Securities Administrators is recorded, processed, summarized and reported within the time periods required.
INTERNAL CONTROL OVER FINANCIAL REPORTING
Management’s Annual Report on Internal Control over Financial Reporting
Our management is responsible for establishing and maintaining adequate internal control over financial reporting as such term is defined in the rules of the SEC and the Canadian Securities Administrators. Our internal control over financial reporting is a process designed under the supervision and with the participation of executive and financial officers to provide reasonable assurance regarding the reliability of financial reporting and the preparation of our financial statements for external reporting purposes in accordance with U.S. GAAP.
Our internal control over financial reporting includes policies and procedures that:
pertain to the maintenance of records that, in reasonable detail, accurately and fairly reflect transactions and dispositions of our assets;
provide reasonable assurance that transactions are recorded as necessary to permit preparation of financial statements in accordance with U.S. GAAP; and
provide reasonable assurance regarding prevention or timely detection of unauthorized acquisition, use or disposition of our assets that could have a material effect on the financial statements.
Our internal control over financial reporting may not prevent or detect all misstatements because of inherent limitations. Additionally, projections of any evaluation of effectiveness to future periods are subject to the risksame terms and conditions (including service vesting terms, but excluding any performance vesting terms) as were applicable to the underlying 2016 Spectra Energy PSU prior to the closing. The number of Enbridge shares subject to each such stock unit is equal to the product (rounded down to the nearest whole number) of (i) the number of shares of Spectra Energy common stock subject to such 2016 Spectra Energy PSU immediately prior to the closing (with any performance-based vesting conditions deemed satisfied based on actual performance through the closing) multiplied by (ii) the Exchange Ratio. In connection with the Merger Transaction, Enbridge assumed 560,656 2016 Spectra Energy PSUs which, after application of the performance multiplier, were converted into 1,103,132 stock units denominated in Enbridge shares. As assumed, these stock units will be settled in Enbridge shares generally after the December 31, 2018 vesting date.
|
Other stock-based awards. In addition to the Assumed Spectra LTIP Awards, Spectra Energy had other equity-based or equity-related awards representing a right to acquire or receive shares of Spectra Energy common stock or payments or benefits measured by the value thereof (“Spectra Energy other awards”) outstanding under the Spectra Energy Executive Savings Plan and the Spectra Energy Directors’ Savings Plan (“Spectra Savings Plans”). Treatment upon closing of the Merger Transaction. At the closing of the Merger Transaction, each outstanding Spectra Energy other award was automatically converted into a right to acquire or receive benefits measured by the value of Enbridge shares, on the same terms and conditions as were applicable to the Spectra Energy other award immediately prior to the closing. As converted, the number of Enbridge shares subject to such other award is equal to the product (rounded down to the nearest whole number) of (i) the number of shares of Spectra Energy common stock subject to such award immediately prior to the closing and (ii) the Exchange Ratio. The Spectra Savings Plans have trust funding vehicles (commonly referred to as rabbi trusts) (“Spectra Savings Plan Trusts”). Obligations to fund the Spectra Savings Plan Trusts were triggered in connection with the Merger Transaction. For any share-settled Spectra Energy other awards, the Enbridge shares used to settle such awards will be obtained on the market by the trustee of the Spectra Savings Plan Trusts. Dividend equivalent awards Dividend equivalent awards. Dividend equivalent awards granted under the Spectra 2007 LTIP entitled the holder to a right to receive cash payments determined by reference to dividends declared on Spectra Energy common stock during the term of the award.
Quantification of equity-based compensation As of December 31, 2020, there is an aggregate of 775,806 Enbridge shares issuable in connection with the outstanding Assumed Spectra LTIP Awards, representing approximately 0.0383% of Enbridge’s issued and outstanding shares. Set forth below are the number of Enbridge shares issuable under the Spectra 2007 LTIP in connection with the exercise or settlement of the Assumed Spectra Energy Awards outstanding as of December 31, 2020. | | | | | | | | | | | | | | | | | Percentage of issued and
outstanding Enbridge shares | | | | | | | 0 | | 775,806 | | 0.0383% |
Termination provisions of Spectra Energy options, Spectra Energy phantom units, and Spectra Energy PSUs The termination provisions for the Spectra Energy options, Spectra Energy phantom units, and Spectra Energy PSUs are described below. | | | | | | | | Voluntary termination
(not retirement eligible) | | The unvested portion of such an award terminates immediately. Vested Spectra Energy options can be exercised through the earlier of 3 months following termination of employment or the 10th anniversary of the grant date. | Voluntary termination
(retirement eligible) | | The award ispro-rated based on full and partial months of service during the vesting period, and thepro-rated award becomes payable on the original vesting date. Vested Spectra Energy options can be exercised through the 10th anniversary of the grant date. | Involuntary termination, for cause | | The unvested portion of such an award terminates immediately. Vested Spectra Energy options can be exercised through the earlier of 3 months following termination of employment or the 10th anniversary of the grant date. | Involuntary termination, without cause or for good reason before 2 year anniversary of change in control (the2-Year CIC Period) | | The unvested portion of such an award vests upon such termination from employment. Vested Spectra Energy options can be exercised through the 10th anniversary of the grant date. | Involuntary termination, without cause after2-Year CIC Period | | The award ispro-rated based on full and partial months of service during the vesting period. Spectra Energy PSUs – Thepro-rated award becomes payable on the original vesting date. Spectra Energy phantom units – Thepro-rated award becomes payable upon such termination from employment. Vested Spectra Energy options can be exercised through the earlier of 3 months following termination of employment or the 10th anniversary of the grant date. | Employment termination as a result of death or disability | | The unvested portion of such an award vests. Vested Spectra Energy options can be exercised through the earlier of 36 months following such termination of employment or the 10th anniversary of the grant date. | Other transfer or assignment of stock options | | The holder of an option may not transfer or assign it other than by will, or as allowed by the laws of descent and distribution. The Spectra Energy phantom units and Spectra Energy PSUs are not assignable or transferable by the holder of the award. |
Treatment of Assumed Spectra LTIP Awards post-Merger Transaction Pursuant to the terms of the Spectra 2007 LTIP, the Assumed Spectra LTIP Awards will vest in the event that, the holder of such award experiences a qualifying termination within 24 months following the completion of the Merger Transaction. Under the Spectra 2007 LTIP, a qualifying termination generally includes an involuntary termination of the holder of such award by Enbridge without cause or by the holder with good reason. Report of the Human Resources & Compensation Committee The Human Resources & Compensation Committee has reviewed and discussed the preceding Compensation Discussion and Analysis with management. Based on the review and discussion, the Human Resources & Compensation Committee recommended to the Board that the Compensation Discussion and Analysis be included in the Circular. This report is provided by the following independent directors who comprise the Human Resources & Compensation Committee: V. Maureen Kempston Darkes (Chair)
The Board is responsible for developing and implementing the Directors’ Compensation Plan and has delegated theresponsibility for director compensation to the Governance Committee. Our Directors’ Compensation Plan is designed with four key objectives in mind: to attract and retain the most qualified individuals to serve as directors; to compensate our directors to reflect the risks, responsibilities and time commitment they assume when serving on our Board and Board committees; to offer directors compensation that is competitive with other public companies that are comparable to Enbridge and to deliver such compensation in a tax effective manner; and to align the interests of directors with those of our shareholders. While our executive compensation program is designed around pay for performance, director compensation is based on annual retainers. This is to meet the compensation objectives and to help ensure our directors are unbiased when making decisions and carrying out their duties while serving on our Board. The Governance Committee uses a peer group of companies to set the annual retainers for our Board and targets director compensation at or about the 50th percentile. See “Benchmarking to peers” beginning on page 43 for more information about our peer group and how we benchmark executive compensation. The Governance Committee reviews the Directors’ Compensation Plan every year, with assistance from management. Every second year a formal review by an external consultant is undertaken. Each year, as part of this review, the Governance Committee considers the time commitment and experience required of members of our Board and the director compensation paid by a group of comparable public companies when it sets the compensation. The Governance Committee also reviews the Directors’ Compensation Plan to make sure the overall program is still appropriate and reports its findings to the Board. In 2020, the Governance Committee engaged Mercer (Canada) Limited for a formal review of directors’ compensation, including peer analysis and benchmarking to the peer group. Following this review, effective January 1, 2020, the Directors’ Compensation Plan was amended to increase: the Board retainer from US$260,000 to US$285,000, the Chair of the Board retainer (including the Board annual retainer) from US$520,000 to US$550,000, the Governance Committee chair retainer from US$10,000 to US$15,000 and the Corporate Social Responsibility Committee chair retainer from US$10,000 to US$15,000. All retainers are payable in U.S. dollars regardless of director residency. Throughout theCOVID-19 pandemic, our priority has been to protect our employees, their families and our communities, while continuing to safely operate the critical infrastructure that delivers the energy people rely on every day. In the context of theCOVID-19 pandemic, reduced global energy demand and reduced commodity prices, the company initiated actions to bolster our resiliency. After a comprehensive review of operating expenditures, we initiated actions to reduce costs by approximately $300 million in 2020. These actions included company-wide compensation reductions, including a 15% reduction in Board compensation. Effective June 1, 2020, the Directors’ Compensation Plan was amended to reduce: the Board retainer from US$285,000 to US$242,250 and the Chair of the Board retainer (including the Board annual retainer) from US$550,000 to US$467,500. Board committee chair retainers were not amended. To align with our director compensation philosophy of targeting director compensation at or about the 50th percentile in our peer group, the Directors’ Compensation Plan was amended effective April 1, 2021 to reinstate the Board and Chair of the Board retainers in effect immediately before the June 2020 reductions. Allnon-employee director compensation in 2020 was paid under the Directors’ Compensation Plan. We do not compensatenon-employee directors under our 2019 Long Term Incentive Plan. 2020 director share ownership requirements | | | | | | | | | | A deferred share unit (“DSU”) is a notional share that controls may become inadequate because of changes in conditions or deteriorationhas the same value as one Enbridge common share. Its value fluctuates with variations in the degreemarket price of compliance with our policies and procedures.Enbridge shares. Our management assessedDSUs do not have voting rights but they accrue dividends as additional DSUs, at the effectivenesssame rate as dividends paid on our common shares. | | |
We expect directors to own Enbridge shares so they have an ongoing stake in the company and are aligned with the interests of shareholders. Directors must, within five years of becoming a director, hold at least three times their annual Board retainer in DSUs or Enbridge shares. The annual Board retainer since June 1, 2020 was US$242,250 and the director share ownership requirement since June 1, 2020 was US$726,750. Effective April 1, 2021, the director share ownership requirement will increase to US$855,000. If a decrease in the market value of Enbridge shares results in a director no longer meeting the share ownership requirements, we expect him or her to buy additional Enbridge shares in order to satisfy the minimum threshold. DSUs are paid out when a director retires from the Board. They are settled in cash, based on the weighted average of the trading price of common shares on the TSX for the last five trading days before the date that is three trading days before the payment date, multiplied by the number of DSUs the director holds. Directors may not engage in equity monetization transactions or hedges involving securities of Enbridge (see “Anti-hedging policy” on page 42). 2020 compensation components Our Directors’ Compensation Plan has four components: an annual retainer; an annual retainer if he or she serves as the Chair of the Board or chair of a Board committee; a travel fee for attending Board and Board committee meetings; and reimbursement for reasonable travel and otherexpenses relating to his or her duties as a director. We do not have meeting attendance fees. Our Directors’ Compensation Plan has been in effect since 2004 and was revised in 2010, 2013, 2015, 2016, 2018, 2019, 2020 and 2021. The table below shows the fee schedule for directors in 2020. Directors are paid quarterly. Mr. Monaco does not receive any director compensation because he is our President & CEO and is compensated in that role. We have not granted stock options to directors since 2002. Mr. Ebel held certain Spectra Energy equity awards at the closing of the Merger Transaction that were generally treated in the same manner as those held by other employees of Spectra Energy. Directors can receive their retainer in a combination of cash, Enbridge shares and DSUs, but they must receive a minimum amount in DSUs, described below. Travel fees are always paid in cash. | | | | | | | | | | | | | | | | | | | | | | | | | | | | | | | | | | | | | | 2020 Directors’ Compensation Plan retainers 1 | | | | | | | | | | | | | | | | | | | | | | | | | | | | | | | | | | | | | | | | | | | | | | | | Before minimum share
ownership | | | | | | After minimum share
ownership | | | | | | | | | | | | | |
| 285,000
|
| | |  | | | | | | | | | | | | | | | | 
| | | | | | | | | | | | | | | | | | | | | | | | | | | Chair of the Board retainer | |
| 265,000
|
| | | | | | | | | | | | | | | | | | | | | | | | | Board committee chair retainer | | | | | | | Up to 50% | | | | Up to 50% | | |
| 50%
to 100% |
| | | Up to 65% | | | | Up to 65% | | |
| 35%
to 100% |
| | | | 25,000 | | | | | | | | | | | | | | | | | | | | | | | | | | • Human Resources & Compensation | | | 20,000 | | | | | | | | | | | | | | | | | | | | | | | | | | | | | 15,000 | | | | | | | | | | | | | | | | | | | | | | | | | | • Corporate Social Responsibility | | | 15,000 | | | | | | | | | | | | | | | | | | | | | | | | | | | | | 15,000 | | | | | | | | | | | | | | | | | | | | | | | | | | | | | | | | | | | | | | | 1,500 | | | | | | | | 100% | | | | - | | | | - | | | | | | | | 100% | | | | - | | | | - | |
| Effective April 1, 2021, the Directors’ Compensation Plan was amended to reinstate the Board and Chair of the Board retainers in effect immediately before the June 2020 reductions. |
For purposes of the explanation that follows in this paragraph, all references to “retainer” shall include the “Board retainer” and “additional retainers” described in the table above. Before a director reaches the minimum share ownership level, at least one half of their retainer will be paid in the form of DSUs, with the balance paid in cash, Enbridge shares or DSUs, according to a percentage mix they choose. Once a director reaches the minimum share ownership level, they can choose to receive between 35% and their entire retainer in DSUs, with the balance in cash, Enbridge shares or a combination of both, according to a percentage mix they choose. Directors are allocated the DSUs and Enbridge shares based on the weighted average of the trading price of the Enbridge shares on the TSX for the five trading days immediately preceding the date that is two weeks prior to the date of payment. Directors who do not make a timely election as to the form in which they wish to receive their retainer will receive the applicable minimum amount in DSUs (in 2020, 35% if they have met the share ownership requirement and 50% if they have not) and the balance in cash. The table below shows the compensation components in which each director’s annual retainer for the year ended December 31, 2020 was delivered. | | | | | | | | | | | | | | | | | | | | | | | | 40 | | 25 | | 35 | | | | | | | - | | - | | 100 | | | | | | | 30 | | 20 | | 50 | | | | | | | 50 | | - | | 50 | | | | | | | - | | 65 | | 35 | | | | | | | 50 | | - | | 50 | | | | | V. Maureen Kempston Darkes | | - | | - | | 100 | | | | | | | 50 | | - | | 50 | | | | | | | - | | - | | - | | | | | | | 30 | | - | | 70 | | | | | | | - | | - | | 100 | | | | | | | | | | | | | | | | | | 50 | | - | | 50 | | | | | | | 20 | | 40 | | 40 |
| Mr. Monaco does not receive any compensation as a director of Enbridge because he is our internal control over financial reportingPresident & CEO. |
| Mr. Fischer passed away on June 17, 2020. |
| Ms. Williams retired from the Board effective May 5, 2020. |
Director compensation table The table below provides information concerning the compensation of eachnon-employee director who served at any time in 2020. Mr. Monaco does not receive any compensation as a director of Enbridge because he is our President & CEO. For information on Mr. Monaco’s compensation, see page 45. | | | | | | | | | | | | | | | | | | | | | | | | | | | | | | | | | | | | | | | | | | | | | | | | | | | | | | | | | | | | | | | | | | | | | | | | | | | | | | | | | | | | | | | | | | | | | | | | | | | | | | | | | | | | | | | | | | | | | | | | | | | | | | | | | | | | | | 147,200 | | | | 2,080 | | | | 92,000 | | | | 2,915 | | | | 128,800 | | | | 2,073 | | | | 78 | | | | 3,279 | | | | 373,353 | | | | | | | | | | | | | | | - | | | | - | | | | - | | | | 7,872 | | | | 347,987 | | | | - | | | | 211 | | | | 8,881 | | | | 356,868 | | | | | | | | | | | | | | | 108,261 | | | | 1,634 | | | | 72,174 | | | | 4,090 | | | | 180,435 | | | | 2,073 | | | | 108 | | | | 4,536 | | | | 367,479 | | | | | | | | | | | | | | | 335,777 | | | | - | | | | - | | | | 7,596 | | | | 335,777 | | | | 20,793 | | | | 204 | | | | 8,569 | | | | 700,916 | | | | | | | | | | | | | | | - | | | | 5,274 | | | | 233,916 | | | | 2,841 | | | | 125,955 | | | | 2,073 | | | | 78 | | | | 3,281 | | | | 365,226 | | | | | | | | | | | | | | | 151,270 | | | | - | | | | - | | | | 3,486 | | | | 151,270 | | | | 2,073 | | | | 82 | | | | 3,428 | | | | 308,041 | | | | | | | | | | | | V. Maureen Kempston Darkes | | | - | | | | - | | | | - | | | | 8,430 | | | | 372,295 | | | | 2,073 | | | | 225 | | | | 9,433 | | | | 383,801 | | | | | | | | | | | | | | | 184,729 | | | | - | | | | - | | | | 4,193 | | | | 184,729 | | | | 2,073 | | | | 110 | | | | 4,600 | | | | 376,131 | | | | | | | | | | | | | | | - | | | | - | | | | - | | | | - | | | | - | | | | - | | | | - | | | | - | | | | - | | | | | | | | | | | | | | | 75,521 | | | | - | | | | - | | | | 2,602 | | | | 106,723 | | | | - | | | | 22 | | | | 911 | | | | 183,155 | | | | | | | | | | | | | | | - | | | | - | | | | - | | | | 8,083 | | | | 356,614 | | | | - | | | | 213 | | | | 8,947 | | | | 365,561 | | | | | | | | | | | | | | | | | | | | | | | | | | | | | | | | | | | | | | | | | | | | | | | | | | | | | | | | | | | | | | 100,259 | | | | - | | | | - | | | | 2,124 | | | | 100,259 | | | | - | | | | 17 | | | | 757 | | | | 201,275 | | | | | | | | | | | | | | | 38,605 | | | | 1,181 | | | | 57,155 | | | | 1,182 | | | | 57,155 | | | | - | | | | 13 | | | | 575 | | | | 153,491 | |
| The cash portion of the retainers paid to the directors. Directors are paid quarterly in US$. The values presented in this table are in C$ and reflect U.S./Canadian exchange rates from the Bank of Canada of 1.3820 as at March 12, 2020, 1.3508 as at June 4, 2020, 1.3162 as at September 10, 2020, and 1.2880 as at December 31, 2019,3, 2020. |
| The portion of the retainer received as DSUs and Enbridge shares. |
| We pay directors quarterly. The value of the Enbridge shares and DSUs is based on the framework establishedweighted average of the trading price of Enbridge shares on the TSX for the five trading days prior to the date that is two weeks prior to the applicable payment date. The weighted average Enbridge share prices were $50.52, $44.11, $42.21 and $39.93 for the first, second, third and fourth quarters, respectively, of 2020. |
| For all of ournon-employee directors, includes a per meeting US$1,500 travel fee. For Mr. Ebel, these amounts also include expenses incurred for tax return preparation services. |
| Includes dividend equivalents granted in Internal Control – Integrated Framework (2013) issued2020 on DSUs granted in 2020 based on the 2020 quarterly dividend rate of $0.81. Dividend equivalents vest at the time of grant. |
| Mr. Monaco does not receive any compensation as a director of Enbridge because he is our President & CEO. |
| Mr. Fischer passed away on June 17, 2020. |
| Ms. Williams retired from the Board on May 5, 2020. |
Change in director equity ownership The table below shows the change in each director nominee’s equity ownership from March 2, 2020 to March 2, 2021, the dates of the management information circular for the 2020 annual meeting of shareholders and of the Circular, respectively, and his or her status in meeting the share ownership requirements. | | | | | | | | | | | | | | | | | | | | | | | | | | | | | | | | | | | | | | Enbridge shares +
DSUs (#) | | | Market (at risk) value of equity holdings (C$) 1,2 | | | | | | | | | | | | | | | | | | | | | | | | | | | | | | | | | | | | | | 44,639 | | | | - | | | | 11,744 | | | | 56,383 | | | | 2,494,943 | | | | | | | | | | | 42,559 | | | | - | | | | 8,056 | | | | 50,615 | | | | 2,576,810 | | | | | | | | | | | 2,080 | | | | - | | | | 3,688 | | | | 5,768 | | | | (81,867 | ) | | | | | | | | | | | | | | | | | | | | | | | | | | | | | | | | | | | | | 46,900 | | | | - | | | | 39,090 | | | | 85,990 | | | | 3,805,069 | | | | | | | | | | | 29,400 | | | | - | | | | 28,595 | | | | 57,995 | | | | 2,952,525 | | | | | | | | | | | 17,500 | | | | - | | | | 10,495 | | | | 27,995 | | | | 852,544 | | | | | | | | | | | | | | | | | | | | | | | | | | | | | | | | | | | | | | 2,581 | | | | - | | | | 7,827 | | | | 10,408 | | | | 460,564 | | | | | | | | | | | 947 | | | | - | | | | 3,281 | | | | 4,228 | | | | 215,247 | | | | | | | | | | | 1,634 | | | | - | | | | 4,546 | | | | 6,180 | | | | 245,317 | | | | | | | | | | | | | | | | | | | | | | | | | | | | | | | | | | | | | | 651,845 | | | | 405,408 | | | | 32,217 | | | | 684,062 | | | | 30,269,732 | | | | | | | | | | | 651,845 | | | | 405,408 | | | | 22,489 | | | | 674,334 | | | | 34,330,344 | | | | | | | | | | | - | | | | - | | | | 9,728 | | | | 9,728 | | | | (4,060,612 | ) | | | | | | | | | | | | | | | | | | | | | | | | | | | | | | | | | | | | | 37,306 | | | | - | | | | 86,576 | | | | 123,882 | | | | 5,481,792 | | | | | | | | | | | 32,032 | | | | - | | | | 77,530 | | | | 109,562 | | | | 5,577,801 | | | | | | | | | | | 5,274 | | | | - | | | | 9,046 | | | | 14,320 | | | | (96,010 | ) | | | | | | | | | | | | | | | | | | | | | | | | | | | | | | | | | | | | | - | | | | - | | | | 3,644 | | | | 3,644 | | | | 161,230 | | | | | | | | | | | - | | | | - | | | | - | | | | - | | | | - | | | | | | | | | | | - | | | | - | | | | 3,644 | | | | 3,644 | | | | 161,230 | | | | | | | | V. Maureen Kempston Darkes | | | | | | | | | | | | | | | | | | | | | | | | | | | | | | 21,735 | | | | - | | | | 57,789 | | | | 79,524 | | | | 3,518,945 | | | | | | | | | | | 21,735 | | | | - | | | | 45,396 | | | | 67,131 | | | | 3,417,639 | | | | | | | | | | | - | | | | - | | | | 12,393 | | | | 12,393 | | | | 101,306 | | | | | | | | | | | | | | | | | | | | | | | | | | | | | | | | | | | | | | 1,000 | | | | - | | | | 7,934 | | | | 8,934 | | | | 395,338 | | | | | | | | | | | - | | | | - | | | | 3,281 | | | | 3,281 | | | | 167,036 | | | | | | | | | | | 1,000 | | | | - | | | | 4,653 | | | | 5,653 | | | | 228,303 | | | | | | | | | | | | | | | | | | | | | | | | | | | | | | | | | | | | | | 920,699 | | | | 4,465,600 | | | | - | | | | 920,699 | | | | 40,740,931 | | | | | | | | | | | 876,512 | | | | 3,987,520 | | | | - | | | | 876,512 | | | | 44,623,226 | | | | | | | | | | | 44,187 | | | | 478,080 | | | | - | | | | 44,187 | | | | (3,882,295 | ) | | | | | | | | | | | | | | | | | | | | | | | | | | | | | | | | | | | | | - | | | | - | | | | 2,676 | | | | 2,676 | | | | 118,398 | | | | | | | | | | | - | | | | - | | | | - | | | | - | | | | - | | | | | | | | | | | - | | | | - | | | | 2,676 | | | | 2,676 | | | | 118,398 | | | | | | | | | | | | | | | | | | | | | | | | | | | | | | | | | | | | | | 637,523 | | | | - | | | | 138,662 | | | | 776,185 | | | | 34,346,186 | | | | | | | | | | | 637,523 | | | | - | | | | 120,743 | | | | 758,266 | | | | 38,603,322 | | | | | | | | | | | - | | | | - | | | | 17,919 | | | | 17,919 | | | | (4,257,136 | ) | | | | | | | | | | | | | | | | | | | | | | | | | | | | | | | | | | | | | 2,364,228 | | | | 4,871,008 | | | | 388,159 | | | | 2,752,387 | | | | 121,793,128 | | | | | | | | | | | 2,292,553 | | | | 4,392,928 | | | | 309,371 | | | | 2,601,924 | | | | 132,463,951 | | | | | | | | | | | 71,675 | | | | 478,080 | | | | 78,788 | | | | 150,463 | | | | (10,670,823 | ) |
| Based on the total market value of the Enbridge shares and/or DSUs owned by the Committeedirector, based on the closing prices of Sponsoring Organizations$44.25 on the TSX on March 2, 2021 and $50.91 on March 2, 2020. These amounts have been rounded to the nearest dollar in Canadian dollars. Excludes stock options. |
| Directors must hold at least three times the annual Board retainer in DSUs or Enbridge shares within five years of becoming a director on our Board. All director nominees currently meet or exceed this requirement other than Mses. Madden and Cunningham, who have until February 12, 2024 and February 13, 2024, respectively, Mr. Goff, who has until February 11, 2025, and Mr. Poloz, who has until June 4, 2025. |
| Mr. Ebel’s stock options were Spectra Energy options that converted into options to purchase Enbridge shares upon the closing of the Treadway Commission. BasedMerger Transaction. No new Enbridge stock options were granted to Mr. Ebel in his capacity as a Director of Enbridge or Chair of the Enbridge Board. |
| Mr. Monaco does not receive any compensation as a director of Enbridge. He is only compensated for his role as President & CEO. As President & CEO, he is subject to a share ownership requirement of six times base salary. Please see page 44 of this Amendment No. 1 on this assessment, our management concluded that we maintained effective internal control over financial reportingForm 10-K/A for information on his Enbridge share ownership as at December 31, 2019.
The effectivenessa multiple of our internal control over financial reporting as at December 31, 2019 has been audited by PricewaterhouseCoopers LLP, independent auditors appointed by our shareholders. As stated in their Report of Independent Registered Public Accounting Firm which appears in Item 8.Financial Statements and Supplementary Data, they expressed an unqualified opinion on the effectiveness of our internal control over financial reporting as of December 31, 2019.his base salary.
|
This Amendment No. 1 on Form 10-K/A contains references to DCF and DCF per common share, which are measures used for purposes of Enbridge’s executive compensation programs. Management believes the presentation of DCF gives useful information to investors and shareholders as they provide increased transparency and insight into the performance of the company. Ournon-GAAP measures described above are not measures that have standardized meaning prescribed by generally accepted accounting principles in the United States of America (U.S. GAAP) and are not U.S. GAAP measures. Therefore, these measures may not be comparable with similar measures presented by other issuers. The table below provides a reconciliation of thenon-GAAP measures to comparable GAAP measures. The following table presents the reconciliation of cash provided by operating activities to DCF. DCF is defined as cash flow provided by operating activities before changes in operating assets and liabilities (including changes in environmental liabilities) less distributions to noncontrolling interests and redeemable noncontrolling interests, preference share dividends and maintenance capital expenditures, and further adjusted for unusual,non-recurring ornon-operating factors. Management also uses DCF to assess the performance of the company and to set its dividend payout target. DCF for the year ended December 31, 2020 has been converted to DCF per share by taking DCF of C$9,440 million and dividing by 2,020 million, the weighted average number of Enbridge shares outstanding as of December 31, 2020. For purposes of the 2020 STIP award determinations as described on page 26, DCF was converted to DCF per share by taking DCF of C$9,473 million and dividing by 2,020 million, the weighted average number of Enbridge shares outstanding as of December 31, 2020. For purposes of 2018 PSU payout determinations as described on page 31, DCF was converted to DCF per share by taking DCF of C$9,848 million and dividing by 2,020 million, the weighted average number of Enbridge shares outstanding as of December 31, 2020. | | | | | | | | |
Changes in Internal Control Over Financial Reporting
During the three monthsYear ended December 31, 2019, there has been no material change2020
| | (unaudited, millions of Canadian dollars) | | | | | | | Cash provided by operating activities | | | 9,781 | | | | Adjusted for changes in our internal control over financial reporting.operating assets and liabilities1 | | | (93 | ) | | | | | | | ITEM 9B. OTHER INFORMATION | | |
Distributions to noncontrolling interests and redeemable noncontrolling interests2 | | | (300 | ) | | | None. Preference share dividends | | | (380 | ) | | |
Maintenance capital expenditures3 | | | (915 | ) | | | Significant adjustment items: | | | | | | | Other receipts of cash not recognized in revenue4 | | | 292 | | | | Employee severance, transition and transformation costs | | | 335 | | | | Distributions from equity investments in excess of cumulative earnings2 | | | 675 | | | | | | | 45 | | | | | | | | | | | Adjusting items in respect of: | | | | | | | For STIP calculation purposes, normalizations including (but not limited to) the net accretive impact of financing and strategic actions not contemplated at the time of target setting expressed in DCF | | | 33 | | | | Total DCF adjusted for 2020 STIP award determinations | | | | | | | | | | | | | | | | | | | Adjusting items in respect of: | | | | | | | For 2018 PSU calculation purposes, normalizations including (but not limited to) the net accretive impact of financing and strategic actions not contemplated at the time of the grant expressed in DCF | | | 408 | | | | Total DCF adjusted for 2018 PSU payout determinations | | | | |
| Changes in operating assets and liabilities, net of recoveries. |
| PART III
ITEM 10. DIRECTORS, EXECUTIVE OFFICERS AND CORPORATE GOVERNANCE
DirectorsPresented net of Registrantadjusting items.
|
| Maintenance capital expenditures are expenditures that are required by thisfor the ongoing support and maintenance of the existing pipeline system or that are necessary to maintain the service capability of the existing assets (including the replacement of components that are worn, obsolete or completing their useful lives). For the purpose of DCF, maintenance capital excludes expenditures that extend asset useful lives, increase capacities from existing levels or reduce costs to enhance revenues or provide enhancements to the service capability of the existing assets. |
| Consists of cash received net of revenue recognized for contracts undermake-up rights and similar deferred revenue arrangements. |
ITEM 12. SECURITY OWNERSHIP OF CERTAIN BENEFICIAL OWNERS AND MANAGEMENT AND RELATED STOCKHOLDER MATTERS Equity Compensation Plan Information See Item 11 – “Shares reserved for equity compensation as of December 31, 2020” for information regarding our equity plan compensation on page 51. Security ownership of certain beneficial owners and management Beneficial ownership table The table below sets forth the number and percentage of outstanding Enbridge shares beneficially owned by each of our Directors, each of our NEOs and all Directors and executive officers as a group, as of March 2, 2021. The number of Enbridge shares beneficially owned by each person is determined under applicable SEC rules. Under these rules, a person is deemed to have “beneficial ownership” of any shares over which that person, directly or indirectly, has or shares voting or investment power, plus any shares that the person has the right to acquire within 60 days, including through the exercise of stock options. Unless otherwise indicated, for each person named in the table, the number in the “Number of Enbridge shares acquirable within 60 days” column includes shares covered by stock options that may be exercised and that vest within 60 days after March 2, 2021. Unless otherwise indicated in the table, the address of each of the individuals below is c/o Enbridge Inc., 200, 425 - 1st Street SW, Calgary, Alberta, T2P 3L8. | | | | | | | | | | | | | | | | | | | | | | | | Number of
Enbridge shares
held | | | Number of
Enbridge shares
acquirable within
60 days | | | Total
Enbridge shares
beneficially owned | | | Percent of
common shares
outstanding | | | | | | | | | | 44,639 | | | | | | | | 44,639 | | | | * | | | | | | | | | | 46,900 | | | | - | | | | 46,900 | | | | * | | | | | | | | | | 2,581 | | | | - | | | | 2,581 | | | | * | | | | | | | | | | 651,845 | | | | 405,408 | | | | 1,057,253 | | | | * | | | | | | | | | | 37,306 | | | | | | | | 37,306 | | | | * | | | | | | | | | | - | | | | - | | | | - | | | | * | | | | | | | V. Maureen Kempston Darkes | | | 21,735 | | | | - | | | | 21,735 | | | | * | | | | | | | | | | 1,000 | | | | - | | | | 1,000 | | | | * | | | | | | | | | | 920,699 | | | | 2,832,230 | | | | 3,752,929 | | | | * | | | | | | | | | | - | | | | - | | | | - | | | | | | | | | | | | | | 637,523 | | | | - | | | | 637,523 | | | | * | | | | | | | | | | 59,432 | | | | 489,859 | | | | 549,291 | | | | * | | | | | | | | | | 48,656 | | | | 378,596 | | | | 427,252 | | | | * | | | | | | | | | | 122,012 | | | | 386,016 | | | | 508,028 | | | | * | | | | | | | | | | 164,753 | | | | 718,808 | | | | 883,561 | | | | * | | | | | | | | | | 204,203 | | | | 887,450 | | | | 1,091,653 | | | | * | | | | | | | All current executive officers and directors as a group 2 | | | 3,083,199 | | | | 6,824,589 | | | | 9,907,788 | | | | * | |
| Ms. Carter and Mr. England will be containedpaid a portion of their directors’ compensation in Enbridge shares on March 19, 2021. Under our Form 10-K/A, whichDirectors’ Compensation Plan, the number of Enbridge shares will be filed no later than 120calculated by dividing the applicable amount of compensation in Canadian dollars payable in Enbridge shares on the payment date by the weighted average the closing price per Enbridge share on the TSX for the five trading days after December 31, 2019. This information will also be contained inprior to the management proxy informationdate that we prepare in accordance with Canadian corporate and securities law requirements.is two weeks prior to the payment date. |
| Executive Officers of Registrant
The information regarding executive officersMr. Whelen’s security ownership is not included in Part I. Item 1. Business - Executive Officers.this total as he retired effective November 15, 2020.
|
| * |
CodeRepresents less than 1% of Ethics for Chief Executive Officer and Senior Financial Officers
The information required by this Item will be contained in our Form 10-K/A, which will be filed no later than 120 days after December 31, 2019. This information will also be contained in the management proxy information that we prepare in accordance with Canadian corporate and securities law requirements.outstanding Enbridge shares.
|
As of March 2, 2021, there are no persons known to Enbridge who beneficially own more than five percent of issued and outstanding Enbridge shares.
ITEM 13. CERTAIN RELATIONSHIPS AND RELATED TRANSACTIONS, AND DIRECTOR INDEPENDENCE Handling conflicts of interest and related person transactions If a director or officer has a material interest in a transaction or agreement involving Enbridge, or otherwise identifies a potential personal conflict, he or she must: declare the conflict or potential conflict; and abstain from voting on the matter at any Board meeting where it is being discussed or considered. This approach is consistent with the requirements of the CBCA. In addition, the Board would review related person transactions in conjunction with making director independence determinations. Completion of annual questionnaires by directors and officers of the company assists in identifying possible related person transactions. Further, as stated above, pursuant to our Statement on Business Conduct, all officers and directors are required to avoid conflicts of interest and to disclose any actual or potential conflicts of interest. They must also annually certify their compliance with the Statement on Business Conduct. Disclosures of an actual or potential conflict of interest are reviewed by the company’s Ethics & Compliance Department to ensure appropriatefollow-up and reporting. Any waiver from any part of the Statement on Business Conduct requires the approval of the CEO. For executive officers, senior financial officers and members of the Board, a waiver requires the express approval of Enbridge’s Board. Since the beginning of 2020, neither the CEO nor the Board has waived any aspect of the Statement on Business Conduct. For purposes of the foregoing, a “related person transaction” is a transaction in which the company was or is to be a participant and the amount involved exceeds US$120,000, and in which any related person had or will have a direct or indirect material interest, and a “related person” means (i) a director, nominee director or executive officer of the company; (ii) an immediate family member of a director, nominee director or executive officer, or (iii) a beneficial holder of greater than five per cent of the company’s shares or an immediate family member of such holder. Interest of informed person in material transaction On February 27, 2017, Enbridge and Spectra Energy combined through amerger transaction (the “Merger Transaction”). Upon the closing of the Merger Transaction, Gregory L. Ebel (Spectra Energy’s former Chairman, President and CEO) became thenon-executive Chair of the Enbridge Board. Enbridge was required, until the first meeting of the Board following the 2020 annual meeting of shareholders of Enbridge: to provide, without charge, to Mr. Ebel asnon-executive Chair: (i) use of Enbridge’s aircraft for business flights to Board meetings and for other business conducted on behalf of Enbridge, (ii) information technology support and (iii) administrative support; and to secure office space in the Houston area on behalf of Mr. Ebel and to reimburse thenon-executive Chair for expenses incurred for tax return preparation services (in an aggregate amount not to exceed US$100,000 per year for such office and tax return preparation services). Pursuant to the merger agreement relating to the Merger Transaction, the foregoing requirements ended in July 2020. The majority of our directors must be independent, as defined by Canadian securities regulators in NI52-110, NYSE rules and the rules and regulations of the SEC. Our Governance Guidelines, available on our website (www.enbridge.com), provide that the Board shall consist of a substantial majority of independent directors. The Board uses a detailed annual questionnaire to assist in determining if a director is independent and makes this determination annually or more often, if required. The Board has determined that 10 of our 11 directors, including the Chair of the Board, are independent. Mr. Monaco is not independent because he is our President & CEO. With respect to former directors who served as directors during any part of 2020, Charles W. Fischer and Catherine L. Williams were also independent. The Governance Committee is responsible for ensuring the Board functions independently of management. The Governance Committee has developed guidelines to ensure each director is aware of the expectations placed on them as a director. Key expectations include meeting attendance, financial literacy and ethical conduct.
ITEM 14. PRINCIPAL ACCOUNTING FEES AND SERVICES External auditor services – fees The following table sets forth all services rendered by the company’s auditors, PwC, by category, together with the corresponding fees billed by the auditors for each category of service for the financial years ended December 31, 2020 and 2019. | | | | | | | | | | | | | | | | | | Description of fee category | | | | | | | 14,764,000 | | 16,928,000 | | Represents the aggregate fees for audit services. | | | | | | | 816,000 | | 431,000 | | Represents the aggregate fees for assurance and related services by the company’s auditors that are reasonably related to the performance of the audit or review of the company’s financial statements and are not included under “Audit fees”. During fiscal years 2020 and 2019, the services provided in this category include services related to prospectus offerings. | | | | | | | 1,417,000 | | 1,993,000 | | Represents the aggregate fees for professional services rendered by the company’s auditors for tax compliance, tax advice and tax planning. | | | | | | | 366,000 | | 320,000 | | Represents the aggregate fees for products and services provided by the company’s auditors other than those services reported under “Audit fees”, “Audit-related fees” and “Tax fees”. During fiscal years 2020 and 2019, these fees include those related to French translation work. | | | | | | | 17,363,000 | | 19,672,000 | | |
Pre-approval policies and proceduresThe Audit, Finance & Risk Committee has adopted a policy that requirespre-approval by the Audit, Finance & Risk Committee of any services to be provided by the company’s external auditors, PwC, whether audit ornon-audit services. The policy prohibits the company from engaging the auditors to provide the followingnon-audit services: bookkeeping or other services related to accounting records and financial statements; financial information systems design and implementation; appraisal or valuation services, fairness opinions or contribution in kind reports; actuarial services; internal audit outsourcing services; management functions or human resources; broker or dealer, investment adviser or investment banking services; legal services; and expert services unrelated to the audit. The Audit, Finance & Risk Committee believes that the policy will protect the company from the potential loss of independence of the external auditors. The Audit, Finance & Risk Committee has also adopted a policy which prohibits the company from hiring (as a full time employee, contractor or otherwise) into a financial reporting oversight role any current or former employee or partner of its external auditor who provided audit, review or attest service in respect of the company’s financial statements (including financial statements of its reporting issuer subsidiaries and significant investees) during the 12 month period preceding the date of the initiation of the current annual audit. The policy further prohibits the hiring of a former partner of the company’s external auditor who receives pension benefits from the firm, unless such pension benefits are of a fixed amount, not dependent upon firm earnings and fully funded. In all cases, the hiring of any partner or employee or former partner or employee of the independent auditor is subject to joint approval by the lead engagement partner and the company’s Senior Vice President and Chief Accounting Officer.
ITEM 11. EXECUTIVE COMPENSATION
The information required by this Item will be contained in our Form 10-K/A, which will be filed no later than 120 days after December 31, 2019. This information will also be contained in the management proxy information that we prepare in accordance with Canadian corporate and securities law requirements.
ITEM 12. SECURITY OWNERSHIP OF CERTAIN BENEFICIAL OWNERS AND MANAGEMENT AND RELATED STOCKHOLDER MATTERS
The information required by this Item will be contained in our Form 10-K/A, which will be filed no later than 120 days after December 31, 2019. This information will also be contained in the management proxy information that we prepare in accordance with Canadian corporate and securities law requirements.
ITEM 13. CERTAIN RELATIONSHIPS AND RELATED TRANSACTIONS, AND DIRECTOR INDEPENDENCE
The information required by this Item will be contained in our Form 10-K/A, which will be filed no later than 120 days after December 31, 2019. This information will also be contained in the management proxy information that we prepare in accordance with Canadian corporate and securities law requirements.
ITEM 14. PRINCIPAL ACCOUNTING FEES AND SERVICES
The information required by this Item will be contained in our Form 10-K/A, which will be filed no later than 120 days after December 31, 2019. This information will also be contained in the management proxy information that we prepare in accordance with Canadian corporate and securities law requirements.
PART IV
ITEM 15. EXHIBITS AND FINANCIAL STATEMENT SCHEDULES
(a) Consolidated Financial Statements, Supplemental Financial Data and Supplemental Schedules includedPart IV (Item 15) of the Original Filing is hereby amended solely to add the following exhibits required to be filed in Part II ofconnection with this annual report are as follows:Amendment No. 1.
Enbridge Inc.:
Report of Independent Registered Public Accounting Firm
Consolidated Statements of Earnings
Consolidated Statements of Comprehensive Income
Consolidated Statements of Changes in Equity
Consolidated Statements of Cash Flows
Consolidated Statements of Financial Position
Notes to the Consolidated Financial Statements
All schedules are omitted because they are not required or because the required information is included in the Consolidated Financial Statements or Notes.
(b) Exhibits:
Reference is made to the “Index of Exhibits” following Item 16., which is hereby incorporated into this Item.
Each exhibit identified below is included as a part of this annual report.Amendment No. 1. Exhibits included in this filing are designated by an asterisk (“*”); all exhibits not so designated are incorporated by reference to a prior filing as indicated. Exhibits designated with a “+” constitute a management contract or compensatory plan arrangement.. | | | | | | | Name of Exhibit | | | | 2.1 |
| | | 2.2 |
| | | 2.3 |
| | Agreement and Plan of Merger, dated as of August 24, 2018, by and among Spectra Energy Partners, LP, Spectra Energy Partners (DE) GP, LP, Enbridge Inc., Enbridge (U.S.) Inc., Autumn Acquisition Sub, LLC, and solely for the purposes of Articles I, II and XI, Enbridge US Holdings Inc., Spectra Energy Corp, Spectra Energy Capital, LLC and Spectra Energy Transmission, LLC. (incorporated by reference to Exhibit 2.1 to Enbridge’s Form 8-K filed August 24, 2018) | 2.4 |
| | Agreement and Plan of Merger, dated as of September 17, 2018, by and among Enbridge Energy Partners, L.P., Enbridge Energy Company, Inc., Enbridge Energy Management, L.L.C., Enbridge Inc., Enbridge (U.S.) Inc., Winter Acquisition Sub II, LLC, and solely for the purposes of Articles I, II and XI, Enbridge US Holdings Inc. (incorporated by reference to Exhibit 2.1 to Enbridge’s Form 8-K filed September 18, 2018) | 2.5 |
| | Agreement and Plan of Merger, dated as of September 17, 2018, by and among Enbridge Energy Management, L.L.C., Enbridge Inc., Winter Acquisition Sub I, Inc., and solely for the purposes of Article I, Section 2.4 and Article X, Enbridge Energy Company, Inc. (incorporated by reference to Exhibit 2.2 to Enbridge’s Form 8-K filed September 18, 2018) | 2.6 |
| | | 3.1 |
| | Articles of Continuance of the Corporation, dated December 15, 1987 (incorporated by reference to Exhibit 2.1(a) to Enbridge’s Registration Statement on Form S-8 filed May 7, 2001) | 3.2 |
| | Certificate of Amendment, dated August 2, 1989, to the Articles of the Corporation (incorporated by reference to Exhibit 2.1(b) to Enbridge’s Registration Statement on Form S-8 filed May 7, 2001) | 3.3 |
| | Articles of Amendment of the Corporation, dated April 30, 1992 (incorporated by reference to Exhibit 2.1(c) to Enbridge’s Registration Statement on Form S-8 filed May 7, 2001) | 3.4 |
| | Articles of Amendment of the Corporation, dated July 2, 1992 (incorporated by reference to Exhibit 2.1(d) to Enbridge’s Registration Statement on Form S-8 filed May 7, 2001) | 3.5 |
| | Articles of Amendment of the Corporation, dated August 6, 1992 (incorporated by reference to Exhibit 2.1(e) to Enbridge’s Registration Statement on Form S-8 filed May 7, 2001) | 3.6 |
| | Articles of Arrangement of the Corporation dated December 18, 1992, attaching the Arrangement Agreement, dated December 15, 1992 (incorporated by reference to Exhibit 2.1(f) to Enbridge’s Registration Statement on Form S-8 filed May 7, 2001) |
| | | | | 3.7 |
| | Certificate of Amendment of the Corporation (notarial certified copy), dated December 18, 1992 (incorporated by reference to Exhibit 2.1(g) to Enbridge’s Registration Statement on Form S-8 filed May 7, 2001) | 3.8 |
| | Articles of Amendment of the Corporation, dated May 5, 1994 (incorporated by reference to Exhibit 2.1(h) to Enbridge’s Registration Statement on Form S-8 filed May 7, 2001) | 3.9 |
| | Certificate of Amendment, dated October 7, 1998 (incorporated by reference to Exhibit 2.1(i) to Enbridge’s Registration Statement on Form S-8 filed May 7, 2001) | 3.10 |
| | Certificate of Amendment, dated November 24, 1998 (incorporated by reference to Exhibit 2.1(j) to Enbridge’s Registration Statement on Form S-8 filed May 7, 2001) | 3.11 |
| | Certificate of Amendment, dated April 29, 1999 (incorporated by reference to Exhibit 2.1(k) to Enbridge’s Registration Statement on Form S-8 filed May 7, 2001) | 3.12 |
| | | 3.13 |
| | | 3.14 |
| | | 3.15 |
| | | 3.16 |
| | | 3.17 |
| | | 3.18 |
| | | 3.19 |
| | | 3.20 |
| | | 3.21 |
| | | 3.22 |
| | | 3.23 |
| | | 3.24 |
| | | 3.25 |
| | | 3.26 |
| | | 3.27 |
| | | 3.28 |
| | |
| | | | | 3.29 |
| | | 3.30 |
| | | 3.31 |
| | | 3.32 |
| | | 3.33 |
| | | 3.34 |
| | | 3.35 |
| | | 3.36 |
| | | 3.37 |
| | | 3.38 |
| | | 3.39 |
| * | | 3.40 |
| | | 4.1 |
| | | 4.2 |
| | | 4.3 |
| | | 4.4 |
| | | 4.5 |
| | | 4.6 |
| | | 4.7 |
| |
| 4.8 |
| | Shareholder Rights Plan Agreement dated as of November 9, 1995 and amended and restated as of May 1, 1996, February 24, 1999, May 3, 2002, May 5, 2005, May 7, 2008, May 11, 2011, May 7, 2014 and May 11, 2017 between Enbridge Inc. and CST Trust Company (incorporated by reference to Enbridge’s Report of Foreign Issuer on Form 6-K filed May 12, 2017) | 4.9 |
| * | |
| | | | | | | Certain instruments defining the rights of holders of long-term debt securities of the Registrant and its subsidiaries are omitted pursuant to Item 601(b)(4)(iii) of Regulation S-K. The Registrant hereby undertakes to furnish to the SEC, upon request, copies of any such instruments. | 10.1 |
| | | 10.2 |
| | | 10.3 |
| | | 10.4 |
| | | 10.5 |
| | | 10.6 |
| | | 10.7 |
| + | | 10.8 |
| + | | 10.9 |
| + | | 10.10 |
| + | | 10.11 |
| + | | 10.12 |
| + |
| 10.13 |
| + |
| 10.14 |
| + |
| 10.15 |
| + |
| 10.16 |
| + | |
| | | | | 10.17 |
| + | | 10.18 |
| + | | 10.19 |
| + | | 10.20 |
| + | | 10.21 |
| + | | 10.22 |
| + | | 10.23 |
| + | | 10.24 |
| + | | 10.25 |
| + | | 10.26 |
| + | | 10.27 |
| + | | 10.28 |
| + | | 10.29 |
| + | | 10.30 |
| + | | 10.31 |
| + | | 10.32 |
| + | | 10.33 |
| + | | 10.34 |
| + | |
| | | | | 10.35 |
| + | | 10.36 |
| + | | 10.37 |
| + | | 10.38 |
| + | | 10.39 |
| + | | 10.40 |
| + | | 10.41 |
| + | | 10.42 |
| + | | 10.43 |
| + | | 10.44 |
| + | | 10.45 |
| + | | 10.46 |
| + | | 10.47 |
| + | | 21.1 |
| * | | 23.1 |
| * | | 24.1 |
| | | 31.1 |
| * | | 31.2 |
| | 31.2* | * | | 32.1 |
| * | | 32.2 |
| * | |
| | | | | 101.INS104* |
| * | Cover Page Interactive Data File (embedded within the Inline XBRL Instance Document. | 101.SCH |
| * | XBRL Taxonomy Extension Schema. | 101.CAL |
| * | XBRL Taxonomy Extension Calculation Linkbase. | 101.DEF |
| * | XBRL Taxonomy Extension Definition Linkbase. | 101.LAB |
| * | XBRL Taxonomy Extension Label Linkbase. | 101.PRE |
| * | XBRL Taxonomy Extension Presentation Linkbase.document). |
POWER OF ATTORNEY
Each person whose signature appears below appoints Robert R. Rooney, Colin K. Gruending and Karen K. L. Uehara, and each of them, any of whom may act without the joinder of the other, as their true and lawful attorneys-in-fact and agents, with full power of substitution, for him or her and in his or her name, place and stead, in any and all capacities, to sign any and all amendments to this Annual Report of Enbridge on Form 10-K, and to file the same, with all exhibits thereto, and all other documents in connection therewith, with the Securities and Exchange Commission, granting unto said attorneys-in-fact and agents, and each of them, full power and authority to do and perform each and every act and thing requisite and necessary to be done, as fully to all intents and purposes as he or she might or would do in person, hereby ratifying and confirming all that said attorneys-in-fact and agents or any of them or their or his or her substitute and substitutes, may lawfully do or cause to be done by virtue hereof.
Pursuant to the requirements of Section 13 or 15(d) of the Securities Exchange Act of 1934, the registrant has duly caused this report to be signed on its behalf by the undersigned, thereunto duly authorized. | | | | | | | | | | | | | | | | (Registrant) | | | | | | Date: March 8, 2021 | | ENBRIDGE INC. | | | (Registrant) | | By: | | | | Date: | February 14, 2020 | By: | | | | | Al Monaco | | | | President and Chief Executive Officer |
Pursuant to the requirements of the Securities Exchange Act of 1934, this report has been signed below on February 14, 2020 by the following persons on behalf of the registrant and in the capacities indicated.
| | | | /s/ Al Monaco | | /s/ | | Colin K. Gruending | Al Monaco
President, Chief Executive Officer and Director
(Principal Executive Officer)
| | | | | | Colin K. Gruending
Executive Vice President and Chief Financial Officer (Principal Financial Officer)
| | | | /s/ Mark A. Maki | | /s/ Gregory L. Ebel | Mark A. Maki
Senior Vice President and Chief Accounting Officer
(Principal Accounting Officer)
| | Gregory L. EbelEnbridge Inc. Chairman of the Board of Directors
| | | | /s/ Pamela L. Carter | | /s/ Marcel R. Coutu | |
Pamela L. Carter
Director
| | Marcel R. Coutu
Director
| | | | /s/ Susan M. Cunningham | | /s/ J. Herb England | Susan M. Cunningham
Director
| | J. Herb England
Director | | | | /s/ Charles W. Fischer | | /s/ Gregory J. Goff | Charles W. Fischer
Director | | Gregory J. Goff
Director | | | | /s/ V. Maureen Kempston Darkes | | /s/ Teresa S. Madden | V. Maureen Kempston Darkes
Director | | Teresa S. Madden
Director | | | | /s/ Dan C. Tutcher | | /s/ Cathy L. Williams | Dan C. Tutcher
Director | | Cathy L. Williams
Director |
|