UNITED STATES
SECURITIES AND EXCHANGE COMMISSION
Washington, D.C. 20549
Annual report pursuant to Section 13 of the
Securities Exchange Act of 1934 for the fiscal year ended May 26, 200531, 2007
A Wisconsin corporation
IRS Employer Identification No. 39-1139844
Commission File No. 1-12609
We have one class of securities registered pursuant to Section 12(b) of the Act: our Common Stock, $1 par value, which is registered on the New York Stock Exchange.
We do not have any securities registered pursuant to Section 12(g) of the Act.
We are not a well-known seasoned issuer (as defined in rule 405 of the Securities Act).
We are required to file reports pursuant to Section 13 or 15(d) of the Act. We have filed all reports required to be filed by Section 13 or 15(d) of the Securities Exchange Act of 1934 during the preceding 12 months and have been subject to such filing requirements for the past 90 days.
Disclosure of delinquent filers pursuant to Item 405 of Regulation S-K iscontained in our definitive proxy statement incorporated by reference in Part III of this Form 10-K.
We are an accelerated filer (as defined in Rule 12b-2 of the Act).
We are not a shell company (as defined in Rule 12b-2 of the Act).
The aggregate market value of the voting common equity held by non-affiliates as of November 25, 2004 and August 5, 200523, 2006 was $456,165,744 and $435,287,820, respectively.$522,367,369.71. This value includes all shares of our voting and non-voting Common Stock, except for shares beneficially owned by our directors and executive officers listed in Part I below.
As of November 25, 2004 and August 5, 2005,10, 2007, there were 21,076,466 and 21,282,29921,539,284 shares of our Common Stock, $1 par value, and 9,113,582 and 9,090,4718,889,588 shares of our Class B Common Stock, $1 par value, outstanding, respectively.outstanding.
Portions of our definitive Proxy Statement for our 20052007 annual meeting of shareholders, which will be filed with the Commission under Regulation 14A within 120 days after the end of our fiscal year, and, upon such filing, will be incorporated by reference into Part III to the extent indicated therein.therein upon such filing.
Certain matters discussed in this Annual Report on Form 10-K and the accompanying annual report to shareholders, particularly in the Shareholders’ Letter and Management’s Discussion and Analysis, are “forward-looking statements” intended to qualify for the safe harbors from liability established by the Private Securities Litigation Reform Act of 1995. These forward-looking statements may generally be identified as such because the context of such statements will include words such as we “believe,” “anticipate,” “expect” or words of similar import. Similarly, statements that describe our future plans, objectives or goals are also forward-looking statements. Such forward-looking statements are subject to certain risks and uncertainties that could cause results to differ materially from those expected, including, but not limited to, the following: (1) the availability, in terms of both quantity and audience appeal, of motion pictures for our theatre division;division, as well as other industry dynamics such as the maintenance of a suitable window between the date such motion pictures are released in theatres and the date they are released to other distribution channels; (2) the effects of increasing depreciation expenses and preopening and start-up costs due to the capital intensive nature of our businesses; (3) the effects of adverse economic conditions in our markets, particularly with respect to our hotels and resorts division; (4) the effects of adverse weather conditions, particularly during the winter in the Midwest and in our other markets; (5) the effects on our occupancy and room rates from the relative industry supply of available rooms at comparable lodging facilities in our markets; (6) the effects of competitive conditions in the markets served by us;our markets; (7) our ability to identify properties to acquire, develop and/or manage and continuing availability of funds for such development; and (8) the adverse impact on business and consumer spending on travel, leisure and entertainment resulting from terrorist attacks in the United States, the United States’ responses thereto and subsequent hostilities.hostilities; and (9) the successful integration of the Cinema Entertainment Corporation theatres into our theatre circuit. Shareholders, potential investors and other readers are urged to consider these factors carefully in evaluating the forward-looking statements and are cautioned not to place undue reliance on such forward-looking statements. The forward-looking statements made herein are made only as of the date of this Form 10-K and we undertake no obligation to publicly update such forward-looking statements to reflect subsequent events or circumstances.
| Item 1. | Business. |
We are engaged primarily in two business segments: movie theatres and hotels and resorts.
As of May 26, 2005,31, 2007, our theatre operations included 4550 movie theatres with 504608 screens throughout Wisconsin, Ohio, Illinois, Minnesota, North Dakota and Minnesota,Iowa, including fourmovietwo movie theatres with 4020 screens in Illinois and Wisconsin owned by third parties but managed by us. We also operate a family entertainment center,Funset Boulevard, that is adjacent to one of our theatres in Appleton, Wisconsin.
As of May 26, 2005,31, 2007, our hotels and resorts operations included fiveeight owned and operated hotels and resorts in Wisconsin, Missouri, Illinois and Missouri. Two additional owned and operated hotels in Wisconsin and Illinois were added to our operations after our fiscal year-end.Oklahoma. We also manage fivetwelve hotels, resorts and other properties for third parties in Wisconsin, Minnesota, Ohio, Texas, Arizona, Missouri, Nevada and California and a vacation ownership club in Wisconsin.California.
Both of these business segments are discussed in detail below.
Our current strategic plans include the following goalsPlease see our discussion under “Current Plans” in Item 7 – Management’s Discussion and strategies:
2
At the end of fiscal 2005,2007, we owned or operated 4550 movie theatre locations with a total of 504608 screens in Wisconsin, Illinois, Minnesota, Ohio, North Dakota and OhioIowa for an average of 11.212.2 screens per location, compared to an average of 10.711.2 screens per location at the end of fiscal 20042006 and 10.6 at the end of fiscal 2003.2005. Included in the fiscal 20052007 totals are two theatres with 20 screens that we manage for other owners. Included in the fiscal 2006 and 20042005 totals are four theatres with 40 screens that we manage for other owners and included in the fiscal 2003 totals are three theatres with 34 screens that we managed for other owners. Our 4148 company-owned facilities include 2028 megaplex theatres (12 or more screens), representing 68%72% of our total screens, 19 multiplex theatres (two to 11 screens) and twoone single-screen theatres. Our long-term growth strategy for the theatre division is to focus on megaplex theatres having between 12 and 20 screens, which typically vary in seating capacity from 150 to 450 seats per screen. Multi-screen theatres allow us to offer a more diversified selection of films to attract additional customers, exhibit movies in larger or smaller auditoriums within the same theatre depending on the popularity of the movie and benefit from having common box office, concession, projection and lobby facilities.
3
During fiscal 2005, we opened one new theatre with 12 screens, converted our two former IMAX® screens into aSuperScreen™ (generally 45-65 feet wide) and our fifthUltraScreen™ (70-75 feet wide) and we opened eight new screens at existing theatres, including our sixthUltraScreen. We also closed two theatres with seven screens during fiscal 2005 and eliminated one screen at an existing theatre in conjunction with a project to convert two small auditoriums into one larger-capacity auditorium.theatre. At fiscal year-end, we operated 489585 first-run screens, 4020 of which are operated under management contracts, and 1523 budget-oriented screens.
On November 17, 2006, we opened our new 12-screen theatre in Green Bay, Wisconsin and our new 13-screen theatre in Sturtevant/Racine, Wisconsin. The new theatres in Green Bay and Sturtevant/Racine, Wisconsin replaced older existing facilities to offer moviegoers the latest technology and amenities. In addition, on May 4, 2007, we opened our new flagship theatre, The Marcus Majestic of Brookfield, in Brookfield, Wisconsin. The Majestic replaced two smaller existing theatres with 17 screens in the same market and features 16 stadium-style auditoriums, including two 72-feet-wideUltraScreens®, and a multi-use auditorium called the AT&T Palladium, fully equipped for live performances, meetings, broadcast concerts and sporting events and regular screenings of first-run movies, with an attached kitchen from which we offer a full menu. The Majestic also has two cafes – one serving branded pizza and another serving branded coffee, ice cream and chocolates.
On April 19, 2007, we completed the acquisition of 11 multi-screen movie theatres owned and/or leased by Cinema Entertainment Corp. in portions of Minnesota, Wisconsin, North Dakota and Iowa. The acquisition added 122 screens to our theatre operations. Additionally, we plan to add up to three new 72-foot-wideUltraScreens® to existing theatres during the next year, as well as expand our food and beverage offerings at several existing locations.
Revenues for the theatre business, and the motion picture industry in general, are heavily dependent on the general audience appeal of available films, together with studio marketing, advertising and support campaigns, factors over which we have no control. NoThree fiscal 2005 films produced box office receipts in excess of $4 million for our circuit compared to three films that reached that amount for us during the prior year. The following five fiscal 20052007 films produced box office receipts in excess of $3 million:million for our circuit, compared to two films that reached that amount during fiscal 2006. The following five fiscal 2007 films produced the most box office receipts for our circuit:SpiderMan 2Pirates of the Caribbean: Dead Man’s Chest,MeetSpider-Man 3,Night at the FockersMuseum,Shrek 2,The Incrediblesthe Third andHarry Potter and the Prisoner of AzkabanCars.
We obtain our films from several national motion picture production and distribution companies and are not dependent on any single motion picture supplier. Our booking, advertising, concession purchases and promotional activities are handled centrally by our administrative staff.
We strive to provide our movie patrons with high-quality picture and sound presentation in clean, comfortable, attractive and contemporary theatre environments. Substantially all of our movie theatre complexes feature either digital sound, Dolby or other stereo sound systems; acoustical ceilings; side wall insulation; engineered drapery folds to eliminate sound imbalance, reverberation and distortion; tiled floors; loge seats; cup-holder chair-arms; and computer-controlled heating, air conditioning and ventilation. We offer stadium seating, a tiered seating system that permits unobstructed viewing, at nearlyapproximately 90% of our first-run screens. Computerized box offices permit all of our movie theatres to sell tickets in advance. Our theatres are accessible to persons with disabilities and provide wireless headphones for hearing-impaired moviegoers. Other amenities at certain theatres include THX auditoriums, which allow customers to hear the softest and loudest sounds, and touch-screen, computerized, self-service ticket kiosks, which simplify advance ticket purchases. We also operate the Marcus Movie Hitline, which is a satellite-based automated telephone ticketing system that allows moviegoers to buy tickets to movies at any of 13 Marcus first-run theatres in the metropolitan Milwaukee area and our two theatres in Columbus, Ohio using a credit card. We own a minority interest in MovieTickets.com, a joint venture of movie and entertainment companies that was created to sell movie tickets over the internet and represents nearly 70%a large majority of the top 50 market theatre screens throughout the United States and Canada. As a result of our association with MovieTickets.com, moviegoers can buy tickets to movies at any of our first-run theatres via the internet and print them at home.
3
We are currently testing digital cinema hardware and software in our theatres and expect to expand our testing to include digital 3D technology. Digital cinema may be able to deliver an improved film presentation to our customers, increase our scheduling flexibility and provide an opportunity for alternate programming in our auditoriums other than movies, but the reliability of the hardware and software and the potential costs associated with this new technology are yet to be determined. Upon completion of successful testing and the determination of a suitable financing methodology (all film studios have indicated that they will participate in the financing of the new technology implementation), we would anticipate a broader roll-out of digital cinema to our theatres in the future.
We sell food and beverage concessions in all of our movie theatres. We believe that a wide variety of food and beverage items, properly merchandised, increases concession revenue per patron. Although popcorn and soda remain the traditional favorites with moviegoers, we continue to upgrade our available concessions by offering varied choices. For example, some of our theatres offer hot dogs, pizza, ice cream, pretzel bites, frozen yogurt, coffee, mineral water and juices. We have recently added self-serve soft drinks to many of our theatres. The initial response to our new food and beverage offerings at the Majestic has been positive and we are currently exploring opportunities to duplicate and/or expand on these food and beverage strategies at several of our existing theatres.
We have a variety of ancillary revenue sources in our theatres, with the largest related to the sale of pre-show and lobby advertising. We have held a minority interest since fiscal 2004 in Cinema Screen Media, a cinema advertising company that provides pre-show entertainment on our screensAdditional ancillary revenues can come from corporate and on over 3,000 screens nationwide.group sales, sponsorships and alternate auditorium uses.
4
We also own a family entertainment center,Funset Boulevard, adjacent to our 14-screen movie theatre in Appleton, Wisconsin.Wisconsin. Funset Boulevard features a 40,000 square foot Hollywood-themed indoor amusement facility that includes a restaurant, party room, laser tag center, virtual reality games, arcade, outdoor miniature golf course and batting cages.
Owned and Operated Hotels and Resorts
The Pfister Hotel
We own and operate the Pfister Hotel, which is located in downtown Milwaukee, Wisconsin. The Pfister Hotel is a full service luxury hotel and has 307 guest rooms (including 82 luxury suites and 176 tower rooms), three restaurants, twothree cocktail lounges and a 275-car parking ramp. The Pfister also has 24,000 square feet of banquet and convention facilities. The Pfister’s banquet and meeting rooms accommodate up to 3,000 people and the hotel features two large ballrooms, including one of the largest ballrooms in the Milwaukee metropolitan area, with banquet seating for 1,200 people. A portion of the Pfister’s first-floor space is leased for use by retail tenants. In fiscal 2005,2007, the Pfister Hotel earned its 2931th consecutive four-diamond award from the American Automobile Association and its signature restaurant,Celia, earned its 3rdst consecutive four-diamond award from the American Automobile Association. The Pfister is also a member of Preferred Hotels and Resorts Worldwide Association, an organization of independent luxury hotels and resorts, and the Association of Historic Hotels of America. We have added a new signature restaurant to this hotel named the Mason Street Grill (replacing an existing restaurant) and we recently added a new spa and salon. Renovations to guest rooms, meeting spaces and the parking garage are also planned at this hotel.
The Hilton Milwaukee City Center
We own and operate the 729-room Hilton Milwaukee City Center. Several aspects of Hilton’s franchise program have benefited this hotel, including Hilton’s international centralized reservation and marketing system, advertising cooperatives and frequent stay programs. The Hilton Milwaukee City Center also features Paradise Landing, an indoor water park and family fun center that features water slides, swimming pools, a sand beach, lounge and restaurant. The hotel also has two cocktail lounges, two restaurants and an 870-car parking ramp.
4
Hilton Madison at Monona Terrace
We own and operate the 240-room Hilton Madison at Monona Terrace in Madison, Wisconsin. The Hilton Madison, which also benefits from the aspects of Hilton’s franchise program noted above, is connected by skywalk to the Monona Terrace Community and Convention Center, has four meeting rooms totaling 2,400 square feet, an indoor swimming pool, a fitness center, a lounge and a restaurant.
The Grand Geneva Resort & Spa
We own and operate the Grand Geneva Resort & Spa in Lake Geneva, Wisconsin, which is the largest convention resort in Wisconsin. This full-facility destination resort is located on 1,300 acres and includes 355 guest rooms, 50,000over 60,000 square feet of banquet, meeting and exhibit space 6,600(including approximately 12,000 square feet added during the past year), over 13,000 square feet of ballroom space, three specialty restaurants, two cocktail lounges, two championship golf courses, several ski-hills, two indoor and five outdoor tennis courts, three swimming pools, a spa and fitness complex, horse stables and an on-site airport. In fiscal 2005,2007, the Grand Geneva Resort & Spa earned its 79th consecutive four-diamond award from the American Automobile Association. We are currently reviewing plans for a guest room renovation and a major renovation of the outdoor pool complex.
We manageThrough fiscal 2006, we managed and sellsold units of a vacation ownership development, the Marcus Vacation Club, that is adjacent to the Grand Geneva Resort & Spa. The development includes 62 timeshare units and a timeshare sales center. Our timeshare owners can participateIn early fiscal 2007, we sold the remaining inventory in exchange programs throughthis development to Orange Lake Resort Condominiums International.& Country Club of Orlando, Florida, but will continue to provide hospitality management services for the property, including check-in, housekeeping and maintenance.
5
Hotel Phillips
We own and operate the Hotel Phillips, a 217-room hotel in Kansas City, Missouri. After purchasing and completely restoring this landmark hotel, we reopened it in September 2001. The Hotel Phillips has conference rooms totaling 5,600 square feet of meeting space, a 2,300 square foot ballroom, a restaurant and a lounge.
Four Points by Sheraton Chicago Downtown/Magnificent Mile
DuringWe own and operate the first week of fiscal 2006, we opened the company-owned and operated Four Points by Sheraton Chicago Downtown/Magnificent Mile, a 226-room (including 130 suites) hotel in Chicago, Illinois. The Four Points by Sheraton Chicago Downtown/Magnificent Mile has affordable, well-appointed guestroomsguest rooms and suites, 3,000 square feet of high-tech meeting rooms, an indoor swimming pool and fitness room and an on-site parking facility that will open later in fiscal 2006.facility. The hotel will alsoleases space to one area restaurant and plans to lease space to severalup to two additional area restaurants.restaurants or retail outlets.
WyndhamInterContinental Milwaukee Center
DuringWe own and operate the first week of fiscal 2006, we purchasedInterContinental Milwaukee in Milwaukee, Wisconsin. Formerly the Wyndham Milwaukee Center.Center, this hotel recently underwent a major renovation and rebranding to the upscale InterContinental brand. The WyndhamInterContinental Milwaukee Center has 220 rooms, 12,000 square feet of flexible banquet and meeting space, on-site parking, a restaurant and two lounges and is located in the heart of Milwaukee’s theatre and financial district. We anticipate a major renovation of this hotel during fiscal 2006.
Operated and Managed HotelsSkirvin Hilton
We operateare the principal equity partner and operator of the Skirvin Hilton hotel in Oklahoma City, Oklahoma, the oldest hotel in Oklahoma. This historic hotel has 225 rooms, including 20 one-bedroom suites and one Presidential Suite, and was renovated and reopened on February 26, 2007 by a public-private joint venture. The Skirvin Hilton will benefit from the aspects of Hilton’s franchise program noted above and has a restaurant, lounge, fitness center, indoor swimming pool, business center and approximately 18,500 square feet of meeting space.
5
Managed Hotels, Resorts and Other Properties
We also manage hotels, resorts and other properties for third parties, typically under long-term management agreements. Revenues from these management contracts may include both base management fees, often in the form of a fixed percentage of defined revenues, and incentive management fees, typically calculated based upon defined profit performance. We may also earn fees for technical and preopening services before a property opens, as well as for on-going accounting and technology services.
We manage the Crowne Plaza-Northstar Hotel in Minneapolis, Minnesota. The Crowne Plaza-Northstar Hotel is located in downtown Minneapolis and has 226 guest rooms, 13 meeting rooms, 6,370 square feet of ballroom and convention space, a restaurant, a cocktail lounge and an exercise facility.
We manage the Hotel Mead in Wisconsin Rapids, Wisconsin. The Hotel Mead has 157 guest rooms, ten meeting rooms totaling 14,000 square feet of meeting space, two cocktail lounges, two restaurants and an indoor pool with a sauna and whirlpool. The Hotel Mead is expected to be sold during fiscal 2008, at which point we would likely cease managing the hotel.
We operatemanage Beverly Garland’s Holiday Inn in North Hollywood, California. The Beverly Garland has 257 guest rooms, including 12 suites, meeting space for up to 600, including an amphitheater and ballroom, an outdoor swimming pool and lighted tennis courts. The mission-style hotel is located on seven acres near Universal Studios.
We manage the Timber Ridge Lodge, an indoor/outdoor waterpark and condominium complex in Lake Geneva, Wisconsin. The Timber Ridge Lodge is a 225-unit condominium hotel on the same campus as our Grand Geneva Resort & Spa. The Timber Ridge Lodge has meeting rooms totaling 3,640 square feet, a general store, a restaurant-cafe, a snack bar and lounge, a state-of-the-art fitness center and an entertainment arcade.
Finally, we operateWe manage the Hilton Garden Inn Houston NW/Chateau in Houston, Texas. The Hilton Garden Inn has 171 guest rooms, a ballroom, a restaurant, a fitness center, a convenience mart and a swimming pool. The hotel is a part of Chateau Court, a 13-acre, European-style mixed-use development that also includes retail space and an office village.
Two new hotels are currently under construction or in development that we willWe manage upon completion of the respective projects. The Platinum Suite Hotel & Spa, will be a luxury condominium hotel in Las Vegas, Nevada just off the Las Vegas StripStrip. Developed and opened in October 2006 by a joint venture that will featurewe originally owned a 50% interest in, we now own 100% of the public space (with all condominium units to be ultimately individually-owned). In addition to earning a management fee equal to a share of room revenue when any of the 255 condo units, a luxuryone and two-bedroom suites are rented, we have the opportunity to earn revenues from the on-site restaurant, lounge, spa indoor and outdoor swimming pools, 8,440 square feet of meeting space restaurants, lounge and an upscale bar. We own 50% of the joint venture developingat this hotel, which is expected to open late in our fiscal 2006 or early fiscal 2007. We are also participating innon-gaming, non-smoking hotel.
In February 2007, we formed a joint venture to restoreacquire the Sheraton Madison Hotel in Madison, Wisconsin. We own a 15% minority interest in the joint venture and thenwill manage the Skirvin Hotelhotel and oversee a major renovation of the property. The hotel features 237 rooms and suites, an indoor heated swimming pool, whirlpool, fitness center and 18,000 square feet of meeting space. It is adjacent to the Alliant Energy Center, which boasts more than 150,000 square feet of exhibit space, and is located approximately 1.5 miles from the Monona Terrace Convention Center, the city’s convention center facility.
We manage the Westin Columbus in Oklahoma City, the oldestColumbus, Ohio. Formerly a company-owned hotel, in Oklahoma.April 2007 we sold the Westin Columbus into a joint venture with Waterton Tactical Real Estate Fund I, a discretionary real estate fund sponsored by Chicago-based Waterton Commercial, LLC. We currently expectown a 15% minority interest in the joint venture and will continue to beoperate and manage the principal equity partner in this public-private venture. Renovation of thishotel. The Westin Columbus is a AAA four-diamond full-service historic hotel that currently includes 186 rooms and suites and offers more than 12,000 square feet of meeting, banquet and ballroom space, a restaurant and a cocktail lounge. The hotel is expectedlocated in the heart of the downtown business district and is connected to begin later in fiscal 2006 and to be completedthe Southern Theatre, a historically restored performing arts theater. This property will undergo a substantial renovation during our fiscal 2007. When completed,2008.
6
In fiscal 2007, we also signed agreements to operate four additional properties for other owners. We now manage Brynwood Country Club in Milwaukee, Wisconsin. Brynwood has an 18-hole golf course, four tennis courts, a fitness center, swimming pool and banquet facilities. We also now manage Resort Suites, a four-star destination resort in Scottsdale, Arizona, offering 483 suites, four swimming pools, three whirlpools, a fitness center, a 24-hour concierge and 7,600 square feet of meeting space. Plans for renovations of and modifications to this hotel is expectedproperty are under development. In February 2007, we signed an agreement to have 225manage the Sheraton Clayton Plaza Hotel in St. Louis, Missouri, which offers 257 rooms and 25,000suites, an indoor swimming pool, a fitness facility, and a business center. The hotel will undergo a multi-million dollar renovation beginning later in 2007. Finally, we were selected to manage an under-construction Hilton Hotel in Bloomington, Minnesota. The hotel, scheduled to open in January of 2008, will offer 256 rooms, an indoor swimming pool, a club level, a fitness center, a business center and 9,100 square feet of meeting space.
6
Both of our businesses experience intense competition from national, regional and local chain and franchise operations, some of which have substantially greater financial and marketing resources than we have. Most of our facilities are located in close proximity to competing facilities.
Our movie theatres compete with large national movie theatre operators, such as AMC Entertainment, Cinemark, Regal Cinemas Loews Cineplex and Carmike Cinemas, as well as with a wide array of smaller first-run and discount exhibitors. Movie exhibitors also generally compete with the home video, pay-per-view and cable television markets. We believe that such ancillary markets have assisted the growth of the movie theatre industry by encouraging the production of first-run movies released for initial movie theatre exhibition, which has historically established the demand for such movies in these ancillary markets.
Our hotels and resorts compete with the hotels and resorts operated by Hyatt Corporation, Marriott Corporation, Ramada Inns, Holiday Inns and others, along with other regional and local hotels and resorts.
We believe that the principal factors of competition in both of our businesses, in varying degrees, are the price and quality of the product, quality and location of our facilities and customer service. We believe that we are well positioned to compete on the basis of these factors.
Historically, our first fiscal quarter has produced the strongest operating results because this period coincides with the typical summer seasonality of the movie theatre industry and the summer strength of our lodging business. Our third fiscal quarter has historically produced the weakest operating results in our hotels and resorts division primarily due to the effects of reduced travel during the winter months onmonths. Our third fiscal quarter for our lodging business.theatre division has historically been our second strongest quarter but is heavily dependent upon the quantity and quality of films released during the Thanksgiving to Christmas holiday period.
We do not expect federal, state or local environmental legislation to have a material effect on our capital expenditures, earnings or competitive position. However, our activities in acquiring and selling real estate for business development purposes have been complicated by the continued emphasis that our personnel must place on properly analyzing real estate sites for potential environmental problems. This circumstance has resulted in, and is expected to continue to result in, greater time and increased costs involved in acquiring and selling properties associated with our various businesses.
7
As of the end of fiscal 2005,2007, we had approximately 4,2006,800 employees, a majorityapproximately one-half of whom were employed on a part-time basis. A number of our (1) hotel employees at the Crowne Plaza Northstar in Minneapolis, Minnesota are covered by a collective bargaining agreement that expires on February 29, 2009;April 30, 2010; (2) operating engineers in the Hilton Milwaukee City Center and Pfister Hotel are covered by collective bargaining agreements that expireexpired on December 31, 2006 and April 30, 2007, respectively;respectively, and have been extended on a day-to-day basis during on-going negotiations; (3) a number of our hotel employees in the Hilton Milwaukee City Center and the Pfister Hotel are covered by a collective bargaining agreement that expires on June 15, 2006;2009; (4) painters in the Hilton Milwaukee City Center and the Pfister Hotel are covered by a collective bargaining agreement that expires on May 31, 2008; (5) projectionists at thea Chicago, Illinois theatrestheatre that we manage for a third party are covered by a collective bargaining agreement that expires on October 14, 2006;20, 2008; (6) projectionists at other Chicago locations are covered by a collective bargaining agreement that expires on April 30, 2006;December 31, 2008; (7) projectionists in Madison, Wisconsin are covered by a collective bargaining agreement that expires on April 2, 2008; and (8) projectionists in Milwaukee, Wisconsin are covered by a collective bargaining agreement that expires on May 30, 2007.2008; (9) a number of hotel employees at the Sheraton Clayton Plaza Hotel that we manage for a third party are covered by a collective bargaining agreement that expires on December 14, 2009; (10) operating engineers at the Sheraton Clayton Plaza Hotel are covered by a collective bargaining agreement that expires on November 30, 2009; and (11) painters at the Sheraton Clayton Plaza Hotel are covered by a collective bargaining agreement that expires on August 31, 2010.
7
Our corporate web site is www.marcuscorp.com. All of our Form 10-Ks, Form 10-Qs and Form 8-Ks, and amendments thereto, are available on this web site as soon as practicable after they have been filed with the SEC. In addition, our corporate governance guidelines and the charters for our Audit Committee, Compensation Committee and Corporate Governance and Nominating Committee are available on our web site. If you would like us to mail you a copy of our corporate governance guidelines or a committee charter, please contact Thomas F. Kissinger, Vice President, General Counsel and Secretary, The Marcus Corporation, 100 East Wisconsin Avenue, Suite 1900, Milwaukee, Wisconsin 53202-4125.
| Item 1A. | Risk Factors. |
The following risk factors and other information included in this Annual Report on Form 10-K should be carefully considered. The risks and uncertainties described below are not the only ones we face. Additional risks and uncertainties not presently known to us or that we currently deem immaterial also may impair our business operations. If any of the following risks occur, our business, financial condition, operating results, and cash flows could be materially adversely affected.
The Lack of Both the Quantity and Audience Appeal of Motion Pictures May Adversely Affect Our Financial Results.
The financial results of our movie theatre business and the motion picture industry in general are heavily dependent on the general audience appeal of available films, together with studio marketing, advertising and support campaigns, factors over which we have no control. The relative success of our movie theatre business will continue to be largely dependent upon the quantity and audience appeal of films made available by the movie studios and other producers. Also, our quarterly results of operations are significantly dependent on the quantity and audience appeal of films that we exhibit during each quarter. As a result, our quarterly results may be unpredictable and somewhat volatile.
8
Our Financial Results May be Adversely Impacted by Unique Factors Affecting the Theatre Exhibition Industry, Such as the Shrinking Video Release Window, the Increasing Piracy of Feature Films and the Increasing Use of Alternative Film Distribution Channels and Other Competing Forms of Entertainment.
Over the last decade, the average video release window, which represents the time that elapses from the date of a film’s theatrical release to the date a film is available on video or DVD, has decreased from approximately six months to less than four and one-half months. We cannot assure you that this release window, which is determined by the film studios, will not shrink further, which could have an adverse impact on our movie theatre business and results of operations.
Piracy of motion pictures is prevalent in many parts of the world. Technological advances allowing the unauthorized dissemination of motion pictures increase the threat of piracy by making it easier to create, transmit and distribute high quality unauthorized copies of such motion pictures. The proliferation of unauthorized copies and piracy of motion pictures may have an adverse effect on our movie theatre business and results of operations.
We face competition for movie theatre patrons from a number of alternative motion picture distribution channels, such as DVD, network, cable and satellite television, video on-demand, pay-per-view television and downloading utilizing the internet. We also compete with other forms of entertainment competing for our patrons’ leisure time and disposable income such as concerts, amusement parks, sporting events, home entertainment systems, video games and portable entertainment devices such as the iPod®. An increase in popularity of these alternative film distribution channels and competing forms of entertainment may have an adverse effect on our movie theatre business and results of operations.
The Relative Industry Supply of Available Rooms at Comparable Lodging Facilities May Adversely Affect Our Financial Results.
Historically, a material increase in the supply of new hotel rooms in a market can destabilize that market and cause existing hotels to experience decreasing occupancy, room rates and profitability. If such over-supply occurs in one or more of our major markets, we may experience an adverse effect on our hotels and resorts business and results of operations.
Our Businesses are Heavily Capital Intensive and Preopening and Start-Up Costs and Increasing Depreciation Expenses May Adversely Affect Our Financial Results.
Both our movie theatre and hotels and resorts businesses are heavily capital intensive. Purchasing properties and buildings, constructing buildings, renovating and remodeling buildings and investing in joint venture projects all require substantial upfront cash investments before these properties, facilities and joint ventures can generate sufficient revenues to pay for the upfront costs and positively contribute to our profitability. In addition, many growth opportunities, particularly for our hotels and resorts division, require lengthy development periods during which significant capital is committed and preopening costs and early start-up losses are incurred. We expense these preopening and start-up costs currently. As a result, our results of operations may be adversely affected by our significant levels of capital investments. Additionally, to the extent we capitalize our capital expenditures, our depreciation expenses may increase, thereby adversely affecting our results of operations.
Downturns or adverse economic conditions affecting the United States economy generally, and particularly downturns or adverse economic conditions in the Midwest and in our other markets, adversely affect our results of operations, particularly with respect to our hotels and resorts division. Poor economic conditions can significantly adversely affect the business and group travel customers, which are the largest customer segments for our hotels and resorts division. Additionally, although our theatre business has historically performed well during economic downturns as consumers seek less expensive forms of out-of-home entertainment, a significant reduction in consumer confidence or disposable income in general may temporarily affect the demand for motion pictures or severely impact the motion picture production industry, which, in turn, may adversely affect our results of operations.
9
Adverse Weather Conditions, Particularly During the Winter in the Midwest and in Our Other Markets, May Adversely Affect Our Financial Results.
Poor weather conditions adversely affect business and leisure travel plans, which directly impacts our hotels and resorts division. In addition, theatre attendance on any given day may be negatively impacted by adverse weather conditions. In particular, adverse weather during peak movie-going weekends or holiday time periods may negatively affect our results of operations. Adverse winter weather conditions may also increase our snow removal and other maintenance costs in both of our divisions.
In each of our businesses we experience intense competition from national, regional and local chain and franchise operations, some of which have substantially greater financial and marketing resources than we have. Most of our facilities are located in close proximity to other facilities which compete directly with ours. The motion picture exhibition industry is fragmented and highly competitive with no significant barriers to entry. Theatres operated by national and regional circuits and by small independent exhibitors compete with our theatres, particularly with respect to film licensing, attracting patrons and developing new theatre sites. Moviegoers are generally not brand conscious and usually choose a theatre based on its location, the films showing there and its amenities. With respect to our hotels and resorts division, our ability to remain competitive and to attract and retain business and leisure travelers depends on our success in distinguishing the quality, value and efficiency of our lodging products and services from those offered by others. If we are unable to compete successfully in either of our divisions, this could adversely affect our results of operations.
Our Ability to Identify Suitable Properties to Acquire, Develop and Manage Will Directly Impact Our Ability to Achieve Certain of Our Growth Objectives.
A portion of our ability to successfully achieve our growth objectives in both our theatre and hotels and resorts divisions is dependent upon our ability to successfully identify suitable properties to acquire, develop and manage. Failure to successfully identify, acquire and develop suitable and successful locations for new lodging properties and theatres will substantially limit our ability to achieve these important growth objectives.
Our Properties are Subject to Risks Relating to Acts of God, Terrorist Activity and War and Any Such Event May Adversely Affect our Financial Results.
Acts of God, natural disasters, war (including the potential for war), terrorist activity (including threats of terrorist activity), epidemics (such as SARs and bird flu), travel-related accidents, as well as political unrest and other forms of civil strife and geopolitical uncertainty may adversely affect the lodging and movie exhibition industries and our results of operations. Terrorism incidents, such as the events of September 11, 2001, and wars, such as the Iraq war, significantly impact business and leisure travel and consequently demand for hotel rooms. In addition, inadequate preparedness, contingency planning, insurance coverage or recovery capability in relation to a major incident or crisis may prevent operational continuity and consequently impact the reputation of our businesses.
10
Historically, our first fiscal quarter has produced our strongest operating results because this period coincides with the typically strong summer performance of the movie theatre industry and the summer strength of our lodging business. Our third fiscal quarter has historically produced our weakest operating results in our hotels and resorts division, primarily due to the affects of reduced travel during the winter months. Our third fiscal quarter for our theatre division has historically been our second strongest quarter but is heavily dependent upon the quantity and quality of films released during the Thanksgiving to Christmas holiday period.
| Item 1B. | Unresolved Staff Comments. |
None.
| Item 2. | Properties. |
We own the real estate of a substantial portion of our facilities, including, as of May 26, 2005,31, 2007, the Pfister Hotel, the Hilton Milwaukee City Center, the Hilton Madison at Monona Terrace, the Grand Geneva Resort & Spa, the Hotel Phillips, the InterContinental Milwaukee, the Skirvin Hilton and the majority of our theatres. We lease the remainder of our facilities. As of May 26, 2005,31, 2007, we also managed five hoteltwelve hotels, resorts and other properties and fourtwo theatres that are owned by third parties. Additionally, we own properties acquired for the future construction and operation of new facilities. All of our properties are suitably maintained and adequately utilized to cover the respective business segment served.
Our owned, leased and franchisedmanaged properties are summarized, as of May 26, 2005,31, 2007, in the following table:
| Business Segment | Total Number of Facilities in Operation | Owned(1) | Leased from Unrelated Parties(2) | Managed for Related Parties | Managed for Unrelated Parties(2) | Total Number of Facilities in Operation | Owned(1) | Leased from Unrelated Parties(2) | Managed for Related Parties | Managed for Unrelated Parties(2) |
|---|---|---|---|---|---|---|---|---|---|---|
| Theatres: | ||||||||||
| Movie Theatres | 45 | 32 | 9 | 0 | 4 | 50 | 40 | 8 | 0 | 2 |
| Family Entertainment Center | 1 | 0 | 0 | 1 | 0 | 0 | ||||
| Hotels and Resorts: | ||||||||||
| Hotels | 9 | 4 | 0 | 5 | 16 | 6 | 1 | 2 | 7 | |
| Resorts | 1 | 0 | 0 | 2 | 1 | 0 | 1 | |||
| Vacation Ownership | 1 | 0 | 0 | 1 | ||||||
| Other Properties | 2 | 0 | 0 | 2 | ||||||
| Limited-Service Lodging: | ||||||||||
| Baymont Inns & Suites | 3 | 0 | 0 | 3 | 0 | 2 | 0 | 0 | 2 | 0 |
| Total | 60 | 38 | 9 | 3 | 10 | 73 | 48 | 9 | 4 | 12 |
| (1) |
| (2) | The |
Certain of the above individual properties or facilities are subject to purchase money or construction mortgages or commercial lease financing arrangements, but we do not consider these encumbrances, individually or in the aggregate, to be material.
Over 90% of our operating property leases expire on various dates after the end of fiscal 20062008 (assuming we exercise all of our renewal and extension options).
11
| Item 3. | Legal Proceedings. |
We do not believe that any pending legal proceedings involving us are material to our business. No legal proceeding required to be disclosed under this item was terminated during the fourth quarter of fiscal 2005.2007.
| Item 4. | Submission of Matters to a Vote of Security Holders. |
No matters were submitted to a vote of our shareholders during the fourth quarter of fiscal 2005.2007.
8
Each of our executive officers is identified below together with information about each officer’s age, position and employment history for at least the past five years:
| Name | Position | Age |
|---|---|---|
| Stephen H. Marcus | Chairman of the Board, President and Chief Executive Officer | |
| Bruce J. Olson | Senior Vice President and President of Marcus Theatres Corporation | |
| Thomas F. Kissinger | Vice President, General Counsel and Secretary | |
| Douglas A. Neis | Chief Financial Officer and Treasurer | |
| William J. Otto | President and Chief Operating Officer of Marcus Hotels, Inc. | |
| Gregory S. Marcus | Senior Vice President - Corporate Development |
Stephen H. Marcus has been our Chairman of the Board since December 1991 and our President and Chief Executive Officer since December 1988. Mr. Marcus has worked at the Company for 4345 years.
Bruce J. Olson joined the Company in 1974. Mr. Olson served as the Executive Vice President and Chief Operating Officer of Marcus Theatres Corporation from August 1978 until October 1988, at which time he was appointed President of that corporation. Mr. Olson also served as our Vice President-Administration and Planning from September 1987 until July 1991. In July 1991, he was appointed as our Group Vice President and in October 2004, he was promoted to Senior Vice President. He was elected to serve on our Board of Directors in April 1996.
H. Fred Delmenhorst has been our Vice President-Human Resources since he joined the Company in December 1984.
Thomas F. Kissinger joined the Company in August 1993 as Secretary and Director of Legal Affairs. In August 1995, he was promoted to General Counsel and Secretary and in October 2004, he was promoted to Vice President, General Counsel and Secretary. Prior to August 1993, Mr. Kissinger was associated with the law firm of Foley & Lardner LLP for five years.
Douglas A. Neis joined the Company in February 1986 as Controller of the Marcus Theatres division and in November 1987, he was promoted to Controller of Marcus Restaurants. In July 1991, Mr. Neis was appointed Vice President of Planning and Administration for Marcus Restaurants. In September 1994, Mr. Neis was also named as our Director of Technology and in September 1995 he was elected as our Corporate Controller. In September 1996, Mr. Neis was promoted to our Chief Financial Officer and Treasurer.
William J. Otto joined the Company in 1993 as the Senior Vice President of Operations of Marcus Hotels, Inc. In 1996, Mr. Otto was promoted to Senior Vice President and Chief Operating Officer of Marcus Hotels, Inc. and in April 2001 he was further promoted to President and Chief Operating Officer of Marcus Hotels, Inc.
Gregory S. Marcus joined the Company in March 1992 as Director of Property Management/Corporate Development. He was promoted in 1999 to Senior Vice President – Corporate Development and became an executive officer of the Company in July 2005. He was elected to serve on our Board of Directors in October 2005.
12
Our executive officers are generally elected annually by the Board of Directors after the annual meeting of shareholders. Each executive officer holds office until his successor has been duly qualified and elected or until his earlier death, resignation or removal.
9
| Item 5. | Market for the Company’s Common Equity, Related Shareholder Matters and Issuer Repurchases of Equity Securities. |
| (a) | Stock Performance Graph |
The following information under the caption “Stock Performance Graph” in this Item 5 of this Annual Report on Form 10-K is not deemed to be “soliciting material” or to be “filed”” with the SEC or subject to Regulation 14A or 14C under the Securities Exchange Act of 1934 or to the liabilities of Section 18 of the Securities and Exchange Act of 1934 and will not be deemed to be incorporated by reference into any filing under the Securities Act of 1933 or the Securities Exchange Act of 1934, except to the extent we specifically incorporate it by reference into such a filing.
Set forth below is a graph comparing the annual percentage change during our last five fiscal years in our cumulative total shareholder return (stock price appreciation on a dividend reinvested basis) of our Common Shares, compared to: (1) the cumulative total return of a composite peer group index selected by us and (2) companies included in the Russell 2000 Index. The composite peer group index is comprised of a hotels and resorts index we selected that includes Choice Hotels International, Inc., Four Seasons Hotels Inc., John Q. Hammons Hotels Inc., Lodgian Inc., Orient Express Hotels, Ltd., Sonesta International Hotels Corp. and Red Lions Corporation (formerly WestCoast Hospitality Corp.) (weighted 50%) and a theatre index we selected that includes Regal Cinemas (weighted 50%). Loews Cineplex Entertainment Corp., which was previously included in our peer group for the theatre index, was acquired by a private company and no longer has a class of stock that is publicly traded. As a result, Loews Cineplex is no longer included in our peer group for the theatre index. Additionally, John Q. Hammons, which was taken private, is reflected only through September 18, 2005.
The indices within the composite peer group index are weighted to approximate the relative revenue contributions of each of our continuing business segments to our total revenues in our fiscal 2007. The shareholder returns of the companies included in the hotels and resorts index and theatre index are weighted based on each company’s relative market capitalization as of the beginning of the presented periods.
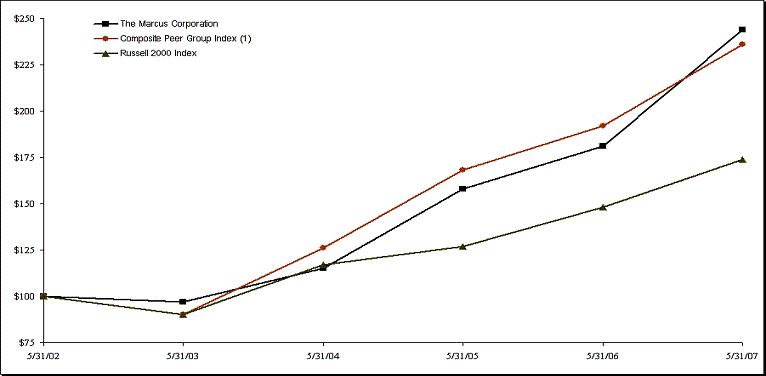
Source: FactSet Data Systems, Inc.
13
| 5/31/02 | 5/31/03 | 5/31/04 | 5/31/05 | 5/31/06 | 5/31/07 | |
|---|---|---|---|---|---|---|
| The Marcus Corporation | $100 | $97 | $115 | $158 | $181 | $244 |
| Composite Peer Group Index(1) | 100 | 90 | 126 | 168 | 192 | 236 |
| Russell 2000 Index | 100 | 90 | 117 | 127 | 148 | 174 |
| (1) | Weighted 50.0% for the Company-selected Hotels & Resorts Index and 50.0% for the Company-selected Theatre Index. |
| (b) | Market Information |
Our Common Stock, $1 par value, is listed and traded on the New York Stock Exchange under the ticker symbol “MCS.” Our Class B Common Stock, $1 par value, is neither listed nor traded on any exchange. During each quarterthe first and second quarters of fiscal 2004 and 2005,2006, we paid a dividend of $0.055 per share of our Common Stock and $0.05 per share of our Class B Common Stock. On August 5, 2005, there were 2,282 shareholdersDuring the third and fourth quarters of recordfiscal 2006, and the first and second quarters of fiscal 2007, we paid a dividend of $0.075 per share of our Common Stock and 49 shareholders$0.06818 per share of recordour Class B Common Stock. During the third and fourth quarters of fiscal 2007, we paid a dividend of $0.085 per share of our Common Stock and $0.07727 per share of our Class B Common Stock. The following table lists the high and low sale prices of our Common Stock for the periods indicated:indicated.
| Fiscal 2005 | 1st Quarter | 2nd Quarter | 3rd Quarter | 4th Quarter |
|---|---|---|---|---|
| High | $19.70 | $22.69 | $26.00 | $24.04 |
| Low | $15.50 | $18.71 | $22.08 | $17.90 |
| Fiscal 2004 | 1st Quarter | 2nd Quarter | 3rd Quarter | 4th Quarter | ||||
|---|---|---|---|---|---|---|---|---|
| Fiscal 2007 | 1st Quarter | 2nd Quarter | 3rd Quarter | 4th Quarter | ||||
| High | $15.38 | $16.43 | $17.50 | $18.30 | $21.68 | $26.10 | $26.31 | $24.17 |
| Low | $12.85 | $14.09 | $14.50 | $14.92 | $17.15 | $19.30 | $22.52 | $20.18 |
Fiscal 2006 | 1st Quarter | 2nd Quarter | 3rd Quarter | 4th Quarter | ||||
| High | $15.73 | $18.34 | $18.95 | $19.99 | ||||
| Low | $12.18 | $11.35 | $14.05 | $15.20 | ||||
On August 6, 2007, there were 2,185 shareholders of record of our Common Stock and 51 shareholders of record of our Class B Common Stock.
| Stock Repurchases |
As of May 26, 2005,31, 2007, our boardBoard of directorsDirectors had authorized the repurchase of up to 4.7 million shares of our outstanding Common Stock. Pursuant to this board authorization, we may repurchase shares of our Common Stock from time to time in the open market, pursuant to privately negotiated transactions or otherwise. The repurchased shares are held in our treasury pending potential future issuance in connection with employee benefit, option or stock ownership plans or other general corporate purposes. Pursuant to this board authorization, we have repurchased approximately 2.83.6 million shares of Common Stock.Stock as of May 31, 2007. This board authorization does not have an expiration date. We did not repurchase any shares
The following table sets forth information with respect to purchases made by us or on our behalf of our Common Stock during the fourth quarter.periods indicated. All of these repurchases were made in the open market and pursuant to the publicly announced repurchase authorization described above.
| Period | Total Number of Shares Purchased | Average Price Paid per Share | Total Number of Shares Purchased as Part of Publicly Announced Programs | Maximum Number of Shares that May Yet be Purchased Under the Plans or Programs |
|---|---|---|---|---|
| February 23 - March 22 | -- | -- | -- | 1,307,357 |
| March 23 - April 22 | 35,900 | $21.87 | 35,900 | 1,271,457 |
| April 23 - May 31 | 124,031 | 21.95 | 124,031 | 1,147,426 |
| Total | 159,931 | $21.94 | 159,931 | 1,147,426 |
1014
| Item 6. | Selected Financial Data. |
| 2005 | 2004 | 2003 | 2002 | 2001(1)(2) | 2007 | 2006 | 2005 | 2004 | 2003 | |||||||||||||||||||||||||
|---|---|---|---|---|---|---|---|---|---|---|---|---|---|---|---|---|---|---|---|---|---|---|---|---|---|---|---|---|---|---|---|---|---|---|
| Operating Results | ||||||||||||||||||||||||||||||||||
| (in thousands) | ||||||||||||||||||||||||||||||||||
| Revenues | $ | 272,707 | 274,931 | 262,814 | 255,242 | 227,881 | $ | 327,631 | 289,244 | 267,058 | 269,221 | 255,414 | ||||||||||||||||||||||
| Earnings from continuing operations | $ | 19,238 | 18,466 | 15,061 | 13,609 | 10,493 | $ | 33,927 | 22,468 | 19,578 | 18,562 | 14,851 | ||||||||||||||||||||||
| Net earnings | $ | 99,221 | 24,611 | 20,556 | 22,460 | 21,776 | $ | 33,297 | 28,271 | 99,221 | 24,611 | 20,556 | ||||||||||||||||||||||
| Common Stock Data | ||||||||||||||||||||||||||||||||||
| Earnings per share - | ||||||||||||||||||||||||||||||||||
| Earnings per common share - | ||||||||||||||||||||||||||||||||||
| continuing operations | $ | .63 | .62 | .51 | .46 | .36 | $ | 1.10 | .73 | .64 | .62 | .50 | ||||||||||||||||||||||
| Net earnings per share | $ | 3.25 | .82 | .70 | .76 | .74 | ||||||||||||||||||||||||||||
| Cash dividends per share | $ | .22 | .22 | .22 | .22 | .22 | ||||||||||||||||||||||||||||
| Net earnings per common share | $ | 1.08 | .91 | 3.25 | .82 | .70 | ||||||||||||||||||||||||||||
| Cash dividends per common share(3) | $ | .32 | 7.26 | .22 | .22 | .22 | ||||||||||||||||||||||||||||
| Weighted average shares outstanding | ||||||||||||||||||||||||||||||||||
| (in thousands) | 30,526 | 29,850 | 29,549 | 29,470 | 29,345 | 30,807 | 30,939 | 30,526 | 29,850 | 29,549 | ||||||||||||||||||||||||
| Book value per share | $ | 16.27 | 13.20 | 12.54 | 12.07 | 11.57 | $ | 10.51 | 9.87 | 16.27 | 13.20 | 12.54 | ||||||||||||||||||||||
| Financial Position | ||||||||||||||||||||||||||||||||||
| (in thousands) | ||||||||||||||||||||||||||||||||||
| Total assets | $ | 787,499 | 749,811 | 755,457 | 774,786 | 758,659 | $ | 698,383 | 587,234 | 787,499 | 749,811 | 755,457 | ||||||||||||||||||||||
| Long-term debt | $ | 170,888 | 207,282 | 203,307 | 299,761 | 310,239 | $ | 199,425 | 123,110 | 170,888 | 207,282 | 203,307 | ||||||||||||||||||||||
| Shareholders' equity | $ | 493,661 | 393,723 | 369,900 | 354,068 | 337,701 | ||||||||||||||||||||||||||||
| Capital expenditures and other | $ | 63,431 | 50,915 | 26,004 | 48,899 | 96,748 | ||||||||||||||||||||||||||||
| Shareholders’ equity | $ | 319,509 | 301,323 | 493,661 | 393,723 | 369,900 | ||||||||||||||||||||||||||||
| Capital expenditures and acquisitions | $ | 186,752 | 75,532 | 63,431 | 50,915 | 26,004 | ||||||||||||||||||||||||||||
| Financial Ratios | ||||||||||||||||||||||||||||||||||
| Current ratio | 4.17 | 2.95 | .40 | .51 | .40 | .47 | .73 | 4.18 | 2.96 | .40 | ||||||||||||||||||||||||
| Debt/capitalization ratio | .28 | .37 | .43 | .48 | .49 | .45 | .37 | .28 | .37 | .43 | ||||||||||||||||||||||||
| Return on average shareholders' equity | 22.4 | % | 6.4 | % | 5.7 | % | 6.5 | % | 6.6 | % | ||||||||||||||||||||||||
| Return on average shareholders’ equity | 10.7 | % | 7.1 | % | 22.4 | % | 6.4 | % | 5.7 | % | ||||||||||||||||||||||||
| Restated to present limited-service lodging, the Miramonte Resort and |
| (2) | All per share and shares outstanding data is on a diluted basis. Earnings per share data is calculated on our Common Stock using the two-class method. |
| (3) | Includes $7.00 per share special dividend paid during fiscal 2006. |
| (4) | 2003 |
1115
| Item 7. | Management’s Discussion and Analysis of Financial Condition and Results of Operations. |
We report our consolidated and individual segment results of operations on a 52-or-53-week fiscal year ending on the last Thursday in May. Fiscal 2005, 20042007 was a 53-week year and 2003fiscal 2006 and 2005 were 52-week years. Our upcoming fiscal 2006Fiscal 2008 will also be a 52-week year.
We divide our fiscal year into three 13-week quarters and a final quarter consisting of 13 or 14 weeks. Our primary operations are reported in two business segments: theatres and hotels and resorts. As a result of the sale of our KFC restaurants during fiscal 2001 and substantially all of the assets of our limited-service lodging division during fiscal 2005, we have presented the restaurant and limited-service lodging business segmentssegment as discontinued operations in the accompanying financial statements and in this discussion. As a result of our sale in June 2006 of the remaining inventory of real estate and development costs associated with our vacation ownership development adjacent to the Grand Geneva Resort and our sale of the Miramonte Resort during fiscal 2005, we have also presented this assetthese assets and related results of operations, previously included in our hotels and resorts segment, as part of our discontinued operations in the accompanying financial statements and in this discussion. Prior year results have been restated to conform to the current year presentation.
During the second quarter of fiscal 2007, we acquired the ownership interest of a partner in our Las Vegas Platinum Hotel joint venture, increasing our ownership of the property’s public space to 90%. The total purchase price was $10.0 million, including approximately $6.2 million of prepaid development fees. As a result of this transaction, effective October 31, 2006, the assets and liabilities of the Platinum Hotel, as well as the results of its operations, are now reported in our consolidated results. Prior to October 31, the joint venture was accounted for using the equity method of accounting. We acquired the remaining 10% of this joint venture during the second half of fiscal 2007 for $1.0 million.
Historically, our first fiscal quarter has produced the strongest operating results because this period coincides with the typical summer seasonality of the movie theatre industry and the summer strength of the lodging business. Our third fiscal quarter has historically produced the weakest operating results in our hotels and resorts division primarily due to the effects of reduced travel during the winter months onmonths. Our third fiscal quarter for our hotelstheatre division has historically been our second strongest quarter but is heavily dependent upon the quantity and resorts division.quality of films released during the Thanksgiving to Christmas holiday period.
The following table sets forth revenues, operating income, other income (loss)(expense), earnings from continuing operations, earnings (losses) from discontinued operations, net earnings and earnings per share for the past three fiscal years (in millions, except for per share and percentage change data):
| Change F05 v. F04 | Change F04 v. F03 | Change F07 v. F06 | Change F06 v. F05 | |||||||||||||||||||||||||||||||||||||||||||
|---|---|---|---|---|---|---|---|---|---|---|---|---|---|---|---|---|---|---|---|---|---|---|---|---|---|---|---|---|---|---|---|---|---|---|---|---|---|---|---|---|---|---|---|---|---|---|
| 2005 | 2004 | Amt. | Pct. | 2003 | Amt. | Pct. | 2007 | 2006 | Amt. | Pct. | 2005 | Amt. | Pct. | |||||||||||||||||||||||||||||||||
| Revenues | $ | 272.7 | $ | 274.9 | $ | (2.2 | ) | -0.8 | % | $ | 262.8 | $ | 12.1 | 4.6 | % | $ | 327.6 | $ | 289.2 | $ | 38.4 | 13.3 | % | $ | 267.1 | $ | 22.1 | 8.3 | % | |||||||||||||||||
| Operating income | 37.5 | 42.3 | (4.8 | ) | -11.4 | % | 39.1 | 3.2 | 8.2 | % | 41.1 | 39.5 | 1.6 | 4.0 | % | 38.9 | 0.6 | 1.6 | % | |||||||||||||||||||||||||||
| Other income (expense) | (6.7 | ) | (12.0 | ) | 5.3 | 43.8 | % | (14.4 | ) | 2.4 | 16.9 | % | 2.4 | (6.7 | ) | 9.1 | 135.5 | % | (7.6 | ) | 0.9 | 12.3 | % | |||||||||||||||||||||||
| Earnings from | ||||||||||||||||||||||||||||||||||||||||||||||
| continuing operations | 19.2 | 18.5 | 0.7 | 4.2 | % | 15.1 | 3.4 | 22.6 | % | 33.9 | 22.5 | 11.4 | 51.0 | % | 19.6 | 2.9 | 14.8 | % | ||||||||||||||||||||||||||||
| Earnings from | ||||||||||||||||||||||||||||||||||||||||||||||
| Earnings (losses) from | ||||||||||||||||||||||||||||||||||||||||||||||
| discontinued operations | 80.0 | 6.1 | 73.9 | 1202 | % | 5.5 | 0.6 | 11.8 | % | (0.6 | ) | 5.8 | (6.4 | ) | -110.9 | % | 79.6 | (73.8 | ) | -92.7 | % | |||||||||||||||||||||||||
| Net earnings | 99.2 | 24.6 | 74.6 | 303.2 | % | 20.6 | 4.0 | 19.7 | % | 33.3 | 28.3 | 5.0 | 17.8 | % | 99.2 | (70.9 | ) | -71.5 | % | |||||||||||||||||||||||||||
| Earnings per share - | ||||||||||||||||||||||||||||||||||||||||||||||
| Earnings per common share - | ||||||||||||||||||||||||||||||||||||||||||||||
| Diluted: | ||||||||||||||||||||||||||||||||||||||||||||||
| Continuing operations | $ | .63 | $ | .62 | $ | .01 | 1.6 | % | $ | .51 | $ | .11 | 21.6 | % | $ | 1.10 | $ | .73 | $ | .37 | 50.7 | % | $ | .64 | $ | .09 | 14.1 | % | ||||||||||||||||||
| Net earnings per share | 3.25 | .82 | 2.43 | 296.3 | % | .70 | .12 | 17.1 | % | |||||||||||||||||||||||||||||||||||||
| Net earnings per common share | 1.08 | .91 | .17 | 18.7 | % | 3.25 | (2.34 | ) | -72.0 | % | ||||||||||||||||||||||||||||||||||||
16
An increase in revenues and operating income from both our theatre division and our hotels and resorts division was offset by reduced theatre division revenues, resulting in a slight overall decrease in total revenues from continuing operations. Bothcontributed to our improved operating divisions experienced decreases in operating incomeresults during fiscal 20052007 compared to the prior year. Theatre division operating results were negativelyfavorably impacted by new screens and a weakerstronger slate of movies during our fiscal first and fourth quarters compared to the priorsame quarters last year. Operating results from our hotels and resorts division for same properties improvedincreased slightly during fiscal 2005, but2007 compared to the prior year despite significant preopening and start-up operating losses related to several of our overall segment results were negatively impacted by reduced earnings fromnew hotels. Our additional 53rd week of operations benefited both of our timeshare operationoperating divisions and combined start-upcontributed approximately $9.5 million in revenues and preopening costs associated with$2.9 million in operating income to our ongoing development projects. Significantly increased investment incomefourth quarter and fiscal 2007 results.
Increased gains on disposition of property, equipment and other assets, reduced interest expense and equity losses from unconsolidated joint ventures and a significantly lower income tax rate contributed to an overalla significant increase in earnings from continuing operations during fiscal 2005,2007, offsetting the reduced operating income from our two continuing business segments.investment income. Our overall net earnings increased significantly during fiscal 20052007 compared to the prior year due to significantdespite last year’s gains on the disposition of the previously noted discontinued operations.
12
We recognized investment income of $6.0$3.1 million during fiscal 2005,2007, representing an increasea decrease of $4.2$4.8 million, or 233.5%60.4%, compared to investment income of $1.8$7.9 million during the prior year. Investment income includes interest earned on cash, cash equivalents, cash held by intermediaries and notes receivable, including notes related to the saleprior sales of timeshare units in our hotels and resorts division. TheOur fiscal 2005 increase2007 cash balances were substantially lower than the prior year due to the impact of our $214.6 million special dividend paid on February 24, 2006, the first day of our fiscal 2006 fourth quarter, resulting in reduced investment income wasduring fiscal 2007 compared to the result of interest earned on proceeds receivedprior year. Due to our expectations that our notes receivable from timeshare sales will continue to decline (we are no longer selling timeshare units and our current notes are being paid off over time) and our average cash balances during fiscal 2008 will likely be less than fiscal 2007, we expect our fiscal 2008 investment income to be less than fiscal 2007. Our cash and cash equivalents totaled $12.0 million at the saleend of our limited-service lodging division in September 2004 and Miramonte Resort in December 2004.fiscal year, compared to $34.5 million at the end of fiscal 2006. The majority of our $259.1 million of cash and cash equivalents at the end of the fiscal year iswas invested in federal tax-exempt short-term financial instruments. A portion of these funds were held by intermediariesinstruments during the fiscal year to facilitate potential tax deferral opportunities and earned taxable interest. The majority of the cash held by intermediaries was released to us in early March 2005 and was subsequently reinvested in federal tax-exempt short-term financial instruments. The remaining $28.6 million of cash held by intermediaries for tax deferral purposes at the end of the fiscal year was used to acquire a new hotel in early fiscal 2006. Our investment income will continue to exceed prior year amounts in future periods until a further determination for the potential uses of the sales proceeds is made.year.
Our interest expense totaled $14.9$13.9 million for fiscal 2005,2007, representing a decrease of $1.6 million,approximately $500,000, or 10.0%3.3%, compared to fiscal 20042006 interest expense of $16.5$14.4 million. The decrease in interest expense was primarily the result of paying off all of our outstanding short-term borrowings, consisting of commercial paper, with cash provided by operating and investing activities (including the sale of our limited-service lodging division). In addition, we capitalized interest related to the construction of our Chicago hotel totaling approximately $835,000 during fiscal 2005, compared to capitalized interest of $296,000 during fiscal 2004. We also continued to makemaking scheduled payments on our long-term debt during the year, further reducing our interest expense. Pending a final determination of the uses of our sales proceeds, we currentlyyear. We expect our interest expense to continue to decreasemay increase by approximately $2.5-$3.0 million during fiscal 20062008 as a result of the additional payments of scheduled currentincreased net borrowings related to our fiscal 2007 fourth quarter theatre acquisition. Current maturities of our long-term debt partially offset by the fact that we anticipate capitalizing significantly less interest during fiscal 2006 dueon our balance sheet as of May 31, 2007 included a $25.5 million mortgage note related to the recent completion of theour Chicago hotel project.with a maturity date in December 2007. We currently anticipate extending the maturity date of this note, which would result in the majority of this amount being reclassified as long-term debt.
Our continuing operations recognized net gains on disposition of property, equipment and equipmentother assets of $2.2$14.5 million during fiscal 2005,2007, compared to similar gains from continuing operations of $2.8$1.7 million during fiscal 2004.2006. The fiscal 2005 gain was primarily2007 gains included gains related to the result of our sale of two outlots on existing theatrefour former restaurant properties, several parcels of land parcels,and the Westin Columbus hotel (to a four-screenjoint venture in which we retained a minority interest). We also reported a significant gain of approximately $5.1 million during fiscal 2007 related to the sale of a theatre in Beaver Dam,Waukesha, Wisconsin, and an excess land parcel.that was replaced by a new theatre in nearby Brookfield, Wisconsin. The timing of our periodic sales of property and equipment results in variations in the gains or losses that we report on disposition of property and equipment each year. We are actively attempting to sellanticipate periodic additional sales of non-core property and equipment and we believewith the potential for additional disposition gains during fiscal 2008, including the potential for another significant gain from the intended sale of a valuable theatre parcel in Brookfield, Wisconsin that additional netwas also replaced by our new theatre.
Our fiscal 2007 gains on disposition of property, equipment and equipment will be recognizedother assets also included a gain of approximately $5.9 million related to the sale of condominium units at our Las Vegas Platinum Hotel. As of May 31, 2007, we closed on sales of approximately 93% of the 255 available condominium units, with the majority of the remaining unit sales expected to close during fiscal 2008. We currently anticipate reporting a total gain on disposition of these assets of approximately $6.4 million after all condominium sales have been completed.
17
As noted earlier in this discussion, as a result of acquiring an additional equity interest in Platinum Condominium Development, LLC, the joint venture that developed our luxury condominium hotel in Las Vegas, Nevada, on October 31, 2006, results from our Platinum Hotel venture are now included in our consolidated financial statements and are no longer included in net equity losses from unconsolidated joint ventures. We reported net equity losses from unconsolidated joint ventures of approximately $1.4 million during fiscal 2007 compared to $1.9 million during the comingprior year. Losses during both years were primarily the result of preopening costs from our previous 50% ownership interest in the Platinum Hotel joint venture. These losses will not be repeated during fiscal year.2008. During our fiscal 2007 fourth quarter, we made investments in two hotel joint ventures that are accounted for under the equity method and may result in equity earnings or losses during fiscal 2008.
We reported income tax expense on continuing operations for fiscal 20052007 of $11.5$9.6 million, a decrease of $370,000,approximately $800,000, or 3.1%8.1%, compared to fiscal 2004.2006. Our effective income tax rate for continuing operations during fiscal 20052007 was 37.5% compared22.0%, significantly lower than our fiscal 2006 effective rate of 31.7% and our historical 39-40% range. This was primarily due to 39.2% in fiscal 2004. The decrease in our effective tax rate for continuing operations was the result of our previously described investments in federal tax-exempt short-term financial instruments.instruments and, more significantly, due to the impact of federal and state historic tax credits generated upon the opening of our Oklahoma City Skirvin Hilton hotel project. These historic tax credits reduced our fiscal 2007 income tax expense by approximately $7.8 million. We currently anticipate that our fiscal 2008 effective income tax rate during fiscal 2006 will continuereturn to remain below our historical 39-40% range until further determinations are made of the potential uses of our sales proceeds.range.
Net earnings during fiscal 20052007 included an after-tax incomeloss from discontinued operations of $1.7 million,$500,000, compared to $6.1an after-tax loss from discontinued operations of $1.9 million during the prior year. Net earnings for fiscal 20052007 and 2006 also included an after-tax gaingains (losses) on sale of discontinued operations of $78.3approximately $(100,000) and $7.7 million, or $2.57 per share.respectively. A detailed discussion of these items is included in the Discontinued Operations section. Weighted averageWeighted-average shares outstanding were 30.530.8 million during fiscal 20052007 and 29.930.9 million during fiscal 2004.2006. All per share data is presented on a diluted basis.
13
Both continuing operating divisions contributed to ourAn increase in revenues and operating income from our hotels and resorts division during fiscal 2004. A third consecutive year of record2006 offset a decrease in revenues and operating performanceincome from our theatre division and a second consecutive year of improved operatingcompared to the prior year. Operating results from our hotels and resorts division resulted inbenefited from the addition of two new hotels as well as improved performance from our existing properties, partially offset by combined start-up and pre-opening costs associated with ongoing development projects. Theatre division operating results were negatively impacted by a particularly weak first quarter slate of movies compared to the prior year, as the division’s operating results during the last three quarters of fiscal 2006 improved slightly compared to the last three quarters of fiscal 2005. Increased investment income and reduced interest expense contributed to an overall increase in overall operating income. A significant decrease in interest expense during fiscal 2004 contributed to our increased earnings from continuing operations during fiscal 2006, offsetting reduced gains on disposition of property and equipment and increased equity losses from unconsolidated joint ventures. Our overall net earnings decreased significantly during fiscal 2004.2006 due to the prior year’s significant gains on the disposition of the previously noted discontinued operations.
We recognized investment income of $1.8$7.9 million during fiscal 2004,2006, representing a decreasean increase of $600,000,$1.7 million, or 25.2%27.1%, compared to fiscal 2003 investment income of $2.4 million. Investment$6.2 million during the prior year. Our fiscal 2006 increase in investment income has historically includedwas the result of interest earned on cash, cash equivalents and notes receivable, including notes related toproceeds received from the sale of timeshare unitsour limited-service lodging division in September 2004. Our cash and cash equivalents totaled $34.5 million at the end of our fiscal year, but was as high as $292.7 million as of the end of our fiscal 2006 third quarter. The majority of our cash was invested in federal tax-exempt short-term financial instruments.
18
We paid a special cash dividend of $7.00 per share on February 24, 2006, the first day of our fiscal 2006 fourth quarter. The special dividend returned to our shareholders approximately $214.6 million of the proceeds received from the sale of the limited-service lodging division. As a result, our investment income was reduced in our hotels and resorts division. Investment income on these items was down from the prior year due primarilyfiscal 2006 fourth quarter. We also increased our regular quarterly dividend by 36% to an overall reduction in our notes receivable during fiscal 2004. Comparisons to fiscal 2003, however, were favorably impacted by the fact that we recognized a $494,000 pre-tax investment loss on securities held during fiscal 2003, whose decline in fair value was deemed to be other than temporary. During fiscal 2004 and in years prior to fiscal 2003, gains and losses on these available for sale investments were included in “accumulated other comprehensive income (loss)” in our consolidated statements$.075 per share of shareholders’ equity, consistent with current accounting pronouncements.common stock.
Our interest expense totaled $16.5$14.4 million for fiscal 2004,2006, representing a decrease of $2.7 million,$500,000, or 13.9%3.2%, compared to fiscal 20032005 interest expense of $19.2$14.9 million. The decrease in interest expense was primarily the result of a $38.5 million, or 16.5%, reduction inmaking scheduled payments on our total long-term debt including current maturities, atduring the end of fiscal 2004 compared to the end of the prior year.
WeOur continuing operations recognized net gains on disposition of property, equipment and equipmentother assets of $2.8$1.7 million during fiscal 2004,2006, compared to similar gains from continuing operations of $2.4$2.2 million during fiscal 2003.2005. The fiscal 20042006 net gain was primarily the result of our sale of six parcels of excess land and our salefirst quarter sales of a formertheatre outlot and real estate development in Appleton, Wisconsin and a strip shopping center developed by a joint venture on land adjacent to our theatre in Minnesota.Delafield, Wisconsin. These gains were partially offset by fourth quarter losses related to the closing of a restaurant in our Pfister Hotel and the replacement of certain hotel assets.
During fiscal 2006, we reported net equity losses from unconsolidated joint ventures of $1.9 million, compared to net equity losses of $1.1 million during the prior fiscal year. Losses during fiscal 2006 were primarily the result of pre-opening costs from our then 50% ownership interest in Platinum Condominium Development, LLC, which developed a luxury condominium hotel in Las Vegas, Nevada, and operating losses from our former minority ownership interest in Cinema Screen Media, a cinema advertising company that provided pre-show entertainment on our screens.
We reported income tax expense on continuing operations for fiscal 20042006 of $11.9$10.4 million, representing an increasea decrease of $2.2$1.3 million, or 23.1%11.3%, overcompared to fiscal 2003.2005. Our effective income tax rate for continuing operations during fiscal 20042006 was 39.2%31.7%, comparedsignificantly lower than our fiscal 2005 effective rate of 37.5%. This was primarily due to 39.1%the previously described investments in fiscal 2003.federal tax-exempt short-term financial instruments.
Net earnings during fiscal 20042006 included an after-tax loss from discontinued operations of $1.9 million, compared to after-tax income from discontinued operations of $6.1$1.3 million representing an increase of $1.9 million, or 44.7%, compared toduring the prior year. Net earnings for fiscal 2003 after-tax income from discontinued operations of $4.2 million. Fiscal 2003 net earnings2006 and 2005 also included an after-tax gaingains on sale of discontinued operations of $1.3$7.7 million or $.04 per share.and $78.3 million, respectively. A detailed discussion of these items is included in the Discontinued Operations section. Weighted averageWeighted-average shares outstanding were 29.930.9 million during fiscal 20042006 and 29.530.5 million during fiscal 2003.2005.
Our aggregate capital expenditures, acquisitions and purchases of interests in joint ventures were approximately $63$198 million during fiscal 2005, an increase over2007 compared to $77 million and $68 million during the prior two years, of approximately $12 million and $37 million, respectively. We currently anticipate that our fiscal 2008 capital expenditures, during fiscal 2006including potential purchases of interests in joint ventures (but excluding any potential acquisitions) may increase tobe in the $80 to $100$60-$80 million range, but werange. We will, however, continue to monitor our operating results and economic and industry conditions so that we can respond appropriately.
Our current strategic plans may include the following goals and strategies:
14
| • |
19
20
The actual number, mix and timing of potential future new facilities and expansions and/or divestitures will depend, in large part, on industry and economic conditions, our financial performance and available capital, the competitive environment, evolving customer needs and trends and the potential availability of attractive acquisition and investment opportunities. It is likely that our growth goals will continue to evolve and change in response to these and other factors, and there can be no assurance that these current goals will be achieved. The terrorist attacksEach of September 11, 2001our goals and strategies are subject to the subsequent war on terrorism, combined with the resulting economic downturn that followed the attacks, had an unprecedented impact on the travel and lodging industry. Business travel and lodging demandvarious risk factors discussed earlier in general is just now beginning to return to pre-September 11 levels, nearly four years later. Any additional domestic or foreign terrorist attacks may have a similar or worse effect on the lodging or theatre industries than that experienced as a result of the September 11, 2001 attacks.our Form 10-K.
1521
Our oldest and largestmost profitable division is our theatre division. The theatre division contributed 54.7%47.8% of our consolidated revenues from continuing operations and 75.6%68.6% of our consolidated operating income, excluding corporate items, during fiscal 2005.2007. The theatre division operates motion picture theatres in Wisconsin, Illinois, Ohio, Minnesota, Iowa and Minnesota,North Dakota and a family entertainment center in Wisconsin. The following tables set forth revenues, operating income, operating margin, screens and theatre locations for the last three fiscal years:
| Change F05 v. F04 | Change F04 v. F03 | ||||||||||||||||||||||
|---|---|---|---|---|---|---|---|---|---|---|---|---|---|---|---|---|---|---|---|---|---|---|---|
| 2005 | 2004 | Amt. | Pct. | 2003 | Amt. | Pct. | |||||||||||||||||
| (in millions, except percentages) | |||||||||||||||||||||||
| Revenues | $ | 149.1 | $ | 155.7 | $ | (6.6 | ) | -4.2 | % | $ | 150.4 | $ | 5.3 | 3.6 | % | ||||||||
| Operating income | 34.8 | 38.9 | (4.1 | ) | -10.6 | % | 36.2 | 2.7 | 7.7 | % | |||||||||||||
| Operating margin | 23.3 | % | 25.0 | % | 24.0 | % | |||||||||||||||||
| Number of screens and locations at fiscal year-end(1) | 2005 | 2004 | 2003 | ||||||||
|---|---|---|---|---|---|---|---|---|---|---|---|
| Theatre screens | 504 | 492 | 488 | ||||||||
| Theatre locations | 45 | 46 | 46 | ||||||||
| Average screens per location | 11.2 | 10.7 | 10.6 | ||||||||
| Change F07 v. F06 | Change F06 v. F05 | ||||||||||||||||||||||
|---|---|---|---|---|---|---|---|---|---|---|---|---|---|---|---|---|---|---|---|---|---|---|---|
| 2007 | 2006 | Amt. | Pct. | 2005 | Amt. | Pct. | |||||||||||||||||
| (in millions, except percentages) | |||||||||||||||||||||||
| Revenues | $ | 156.5 | $ | 146.0 | $ | 10.5 | 7.2 | % | $ | 149.1 | $ | (3.1 | ) | -2.1 | % | ||||||||
| Operating income | 34.6 | 32.5 | 2.1 | 6.4 | % | 34.8 | (2.3 | ) | -6.6 | % | |||||||||||||
| Operating margin | 22.1 | % | 22.2 | % | 23.3 | % | |||||||||||||||||
| Number of screens and locations at fiscal year-end(1)(2) | 2007 | 2006 | 2005 | ||||||||
|---|---|---|---|---|---|---|---|---|---|---|---|
| Theatre screens | 608 | 504 | 504 | ||||||||
| Theatre locations | 50 | 45 | 45 | ||||||||
| Average screens per location | 12.2 | 11.2 | 11.2 | ||||||||
| (1) | Includes |
| (2) | Includes 23 budget screens at four locations in 2007, 20 budget screens at four locations in 2006 and 15 budget screens at three locations |
The following table further breaks down the components of revenues for the theatre division for the last three fiscal years:
| Change F05 v. F04 | Change F04 v. F03 | Change F07 v. F06 | Change F06 v. F05 | |||||||||||||||||||||||||||||||||||||||||||
|---|---|---|---|---|---|---|---|---|---|---|---|---|---|---|---|---|---|---|---|---|---|---|---|---|---|---|---|---|---|---|---|---|---|---|---|---|---|---|---|---|---|---|---|---|---|---|
| 2005 | 2004 | Amt. | Pct. | 2003 | Amt. | Pct. | 2007 | 2006 | Amt. | Pct. | 2005 | Amt. | Pct. | |||||||||||||||||||||||||||||||||
| (in millions, except percentages) | (in millions, except percentages) | |||||||||||||||||||||||||||||||||||||||||||||
| Box office receipts | $ | 96.2 | $ | 101.1 | $ | (4.9 | ) | -4.9 | % | $ | 98.8 | $ | 2.3 | 2.4 | % | |||||||||||||||||||||||||||||||
| Box office revenues | $ | 98.2 | $ | 93.4 | $ | 4.8 | 5.1 | % | $ | 96.2 | $ | (2.8 | ) | -2.8 | % | |||||||||||||||||||||||||||||||
| Concession revenues | 45.8 | 46.7 | (0.9 | ) | -2.0 | % | 45.6 | 1.1 | 2.4 | % | 49.0 | 45.5 | 3.5 | 7.7 | % | 45.8 | (0.3 | ) | -0.6% | |||||||||||||||||||||||||||
| Other revenues | 7.1 | 7.9 | (0.8 | ) | -9.0 | % | 6.0 | 1.9 | 31.9 | % | 9.3 | 7.1 | 2.2 | 30.9 | % | 7.1 | -- | -- | ||||||||||||||||||||||||||||
| Total revenues | $ | 149.1 | $ | 155.7 | $ | (6.6 | ) | -4.2 | % | $ | 150.4 | $ | 5.3 | 3.6 | % | $ | 156.5 | $ | 146.0 | $ | 10.5 | 7.2 | % | $ | 149.1 | $ | (3.1 | ) | -2.1 | % | ||||||||||||||||
The decreaseincrease in theatre division revenues and operating income and operating margin during fiscal 20052007 compared to the prior year was entirely due to decreased overalla strong film slate during our fiscal first and fourth quarters, new screens added during the year and the additional week of operations included in our fiscal 2007 results. The additional week of operations, which included the traditionally strong Memorial Day holiday weekend, contributed approximately $5.3 million and $2.1 million, respectively, to our theatre division revenues and operating income during fiscal 2007, excluding the theatres acquired during our fiscal 2007 fourth quarter.
On April 19, 2007, we acquired 11 owned and/or leased movie theatres with 122 screens in Minnesota, Wisconsin, North Dakota and Iowa from Cinema Entertainment Corporation (CEC) and related parties for a purchase price of approximately $75.7 million. The assets purchased consisted primarily of land, buildings, leasehold improvements, equipment and goodwill and the transaction was funded by using available cash-on-hand and drawing from our current credit facility. We expect that the acquisition will be accretive to both fiscal 2008 earnings and cash flow. The CEC theatres contributed approximately $3.5 million and $650,000, respectively, to our theatre division revenues and operating income for the six weeks that we owned them during fiscal 2007, including the additional week of operations during our fiscal year.
22
Total theatre attendance increased 5.0% during fiscal 2007 compared to the prior year. Fiscal 2007 attendance at our comparable theatres. Duringtheatres increased approximately 1.3%, including the additional week of operations, but decreased approximately 1.7% excluding the additional week, compared to the prior year. As noted earlier, a stronger slate of movies during our fiscal 2005, we converted our two former IMAX® screens into2007 first and fourth quarters offset aSuperScreen™ (generally 45-65 feet wide) weaker fall and our fifthUltraScreen™ (70-75 feet wide) and we opened eight new screens at existing theatres, including four screens in LaCrosse, Wisconsin,holiday period film line-up. A particularly strong May 2007 that included the opening of three screens in Oshkosh, Wisconsinblockbuster film sequels to theSpider-Man, Shrek and our sixth UltraScreen™ at aPirates of the Caribbean movie franchises contributed to very strong fourth quarter theatre in Oakdale, Minnesota. We also opened a 12-screen small-town prototype theatre in Saukville, Wisconsin during the fiscal 2005 fourth quarter. These new screens, plus screens added in fiscal 2004 that were not open for a full year last fiscal year, generated approximately $1.8 million of additional revenues during fiscal 2005. We closed two theatres with seven screens during fiscal 2005 and eliminated one screen at an existing theatre in conjunction with a project to convert two small auditoriums into one larger-capacity auditorium. Closing those screens along with several other screens we closed during fiscal 2004 negatively impacted comparisons of this year’s theatre division revenues to prior year results by $1.4 million, although our screen closings had a minimal impact on operating income. As of May 26, 2005, we operated 489 first-run screens and only 15 budget screens. Compared to first-run theatres, budget theatres generally have lower box office revenues and associated film costs, but higher concession sales as a percentage of box office revenue.results.
16
Revenues for the theatre business and the motion picture industry in general are heavily dependent on the general audience appeal of available films, together with studio marketing, advertising and support campaigns and the maintenance of the current “windows” between the date a film is released in theatres and the date a motion picture is released to other channels, including video on-demand and DVD. These are factors over which we have no control. These factors were particularly evident during fiscal 2005. AfterExcluding a very strong summer box office, which included record Memorial Day and July 4th holiday weeks, we experienced decreases in attendance during eachrelatively small number of our last three fiscal quarters as compared to fiscal 2004 comparable periods. With no significant changechanges in the number of competitive screens in our markets, we believe that athe most significant factor contributing to these variations in attendance during fiscal 20052007 was the quantity and quality of film product released during the respective quarters compared to the films released during the same quarterquarters last year. Additional factors that are difficult to measure but which may have had some continuing impact on attendance during fiscal 20052007 include an increasing concern over piracy and the ongoing impact of DVD’sDVDs and home entertainment options on consumer spending choices. Total theatre attendance for the full year decreased 7.5%Increased average ticket prices can favorably impact box office revenues, but during fiscal 20052007, our average ticket price only increased 0.2% compared to the prior year, attributable primarily to selected regional price promotions and film product mix.
Consistent with prior years in which blockbusters accounted for a significant portion of our total box office, our top 15 performing films accounted for 36% of our fiscal 2007 and 2006 box office receipts. Three fiscal 2007 films produced box office receipts in excess of $3 million for our circuit, compared to two films that reached that amount for us during the prior year. The following five fiscal 2007 films accounted for over 17% of our total box office and produced the most box office receipts for our circuit:Pirates of the Caribbean: Dead Man’s Chest,Spider-Man 3,Night at the Museum,Shrek the Third andCars. The quantity of films shown in our theatres increased during fiscal 2007, primarily due to an increase in film distributors and independent films. We played 214 films at our theatres during fiscal 2007 compared to 189 during fiscal 2006. Based upon projected film availability, we are currently estimating that we will show a similar number of films on our screens during fiscal 2008 as we did during fiscal 2007. Generally, an increase in the quantity of films increases the potential for more blockbusters in any given year.
Our average concession sales per person increased 2.4% during fiscal 2007 compared to the prior year. Pricing and film product mix are the two primary factors that impact our average ticket price and concession sales per person. For example, on average, films that appeal to families and teenagers generally produce better than average concession sales but a lower average ticket price compared to more adult-orientated film product. During fiscal 2007, our average concession sales per person during our fiscal 2007 third quarter only increased 0.7% compared to the same period last year when our top films includedHarry Potter,King Kong andChronicles of Narnia, all of which generally attracted a younger audience.
Our theatre division’s operating margin decreased slightly to 22.1% during fiscal 2007, compared to 22.2% in fiscal 2006, due in part to the impact of approximately $800,000 of preopening expenses related primarily to the opening of our Majestic theatre. In addition, our fiscal 2007 operating margin was negatively impacted by increased film rental costs, due primarily to the fact that our top films (which historically have higher film rental costs as a percentage of revenues) represented a higher percentage of our total box office during fiscal 2007. Other revenues, which include management fees, pre-show advertising income and family entertainment center revenues, increased during fiscal 2007 compared to the prior year, favorably impacting our operating margin. Increased pre-show and lobby advertising income, which included a final payment from our former screen advertising partner, Cinema Screen Media, and a one-time fee associated with the termination of our management contract for three theatres in Chicago, Illinois contributed to the increase in other revenues. We hope to increase our operating margins in our theatre division during fiscal 2008 by reducing our film costs, increasing our ancillary revenues and increasing our food and beverage revenues.
23
We opened three new locations with 41 screens during fiscal 2007. A new 13-screen theatre, which includes anUltraScreen®, opened in November 2006 in Sturtevant, Wisconsin and replaced an existing five-screen owned theatre in Racine, Wisconsin that we closed in late September and an 8-screen leased theatre in Racine that we converted to a budget-oriented theatre. We also opened a new 12-screen theatre in November 2006 in Green Bay, Wisconsin which replaced an 8-screen leased theatre that we closed in the same market. In May 2007, we opened the previously described 16-screen Majestic theatre in Brookfield, Wisconsin, replacing two nearby theatres that had 17 screens. We also closed a 3-screen theatre in Milwaukee, Wisconsin, a single screen theatre in Cedarburg, Wisconsin and a 5-screen theatre in Madison, Wisconsin during fiscal 2007 with minimal impact on our fiscal 2007 operating results. The impact of the new theatres on fiscal 2007 operating results was also not significant, due to the timing of the openings in the fiscal year and the fact that the first year includes preopening expenses. We expect all three new theatres to favorably impact fiscal 2008 operating results. We have identified two other theatres with 12 screens that we may close during the next year with minimal impact on operating results.
Box office receipts during the summer to-date for comparable theatres have essentially matched last year’s strong summer results, despite the fact that our fiscal 2008 first quarter does not include the Memorial Day weekend. Strong performances from films such asPirates of the Caribbean:At World’s End,Fantastic 4:Rise of the Silver Surfer,Ratatouille,Transformers,Harry Potterand the Order of the Phoenix, The Simpsons Movie andThe Bourne Ultimatum have contributed to our early fiscal 2008 results.
The decrease in theatre division revenues, operating income and operating margin during fiscal 2006 compared to the prior year was entirely due to decreased overall attendance at our comparable screenstheatres. Total theatre attendance decreased 7.8%. Due primarily4.5% during fiscal 2006 compared to the unusually strong March and early April 2004 performanceprior year. Our theatre division operating results were primarily impacted by an overall weak slate ofThe Passion of the Christlast year, attendance movies during our fiscal 2005 fourth2006 first quarter, was nearly 20% below that ofcompared to a strong first quarter the prior year despitethat included record Memorial Day and July 4th holiday weeks. Total theatre attendance decreased 13.7% during our fiscal 2006 first quarter compared to the strong opening nine daysprior year’s first quarter, significantly impacting our overall fiscal 2006 results due to the fact that the summer quarter has historically accounted for 35-40% of our total year divisional operating income. In fact, not one of our five highest grossing films during the fiscal 2006 first quarter –War of the final installment ofWorlds,Star WarsWars: Episode III – Revenge of the Sithin late May.,Batman Begins,Madagascar, andCharlie & The Chocolate Factory – performed as well as any of the previous summer’s top three films,Spider-Man 2,Shrek 2 andHarry Potter and the Prisoner of Azkaban. However, attendance increased 2.4% during the second half of our fiscal 2006, with operating income increasing 5.2% during the same time period as the quality of the movies improved. Partially offsetting our reduced attendance was a 2.7%1.7% increase in our average ticket price during fiscal 20052006 compared to the prior year, attributable primarily to modest price increases. Our average concession sales per person increased 4.2% during fiscal 2006 compared to the prior year.
Consistent with prior years in which blockbusters accounted for a significant portion of our total box office, our top 15 performing films accounted for 36% of our fiscal 2006 and 2005 box office receipts, compared to 35% duringreceipts. Only two fiscal 2004. No fiscal 20052006 films produced box office receipts in excess of $4$3 million for our circuit, compared to threefive films that reached that amount for us during the prior year (Lord of the Rings: Return of the King, Finding NemoandThe Passion of the Christ).year. The following five fiscal 20052006 films accounted for over 15% of our total box office and produced the most box office receipts in excess of $3 million:Spider-Man 2, Meet the Fockers, Shrek 2, The Incrediblesandfor our circuit:Harry Potter and the PrisonerGoblet of AzkabanFire. We played 188 films at our theatres during fiscal 2005 compared to 181 during fiscal 2004.
Our average concession sales per person increased 5.9% during fiscal 2005 compared to the prior year. Average concession sales per person are impacted by changes in concession pricing, types,Chronicles of films playedNarnia: The Lion, The Witch and changes in our geographic mix of theatre locations. On average, films that appeal to families and teenagers generally produce better than average concession sales compared to more adult-oriented film product. As an example, our average concession sales per person increased by over 11% during our fiscal 2005 fourth quarter compared to the same period last year due primarily to the fact that last year’s top fourth quarter film was the adult-orientedThe PassionWardrobe,War of the ChristWorlds.
Our theatre division’s operating margin decreased to 23.3% during fiscal 2005, compared to 25.0% in fiscal 2004, due primarily to the impact of our fixed expenses on our decreased box office receipts. Our overall concession costs as a percentage of revenues decreased slightly during the current year, while our film rental costs remained essentially unchanged as a percentage of revenues. A decrease in other revenues, which included management fees, pre-show advertising income and family entertainment center revenues, also contributed to our lower operating margin. The decrease in other revenues compared to fiscal 2004 was primarily due to the fact that last year’s revenues (and resulting operating income and operating margin) were favorably impacted by an approximately $400,000 insurance settlement. We expect other revenues to increase slightly during fiscal 2006, due primarily to expected increases from in-lobby advertising. If box office performance improves during fiscal 2006, we anticipate that the expected improvements in other revenues and other various cost controls could potentially return our theatre division operating margins to prior year levels.
As noted earlier in the Current Plans section of this discussion, we expect to make selected investments in new locations and new screens at existing strategic locations during fiscal 2006 and beyond, in addition to pursuing additional management contracts. The impact of these anticipated new screens on fiscal 2006 operating results will likely be minimal, as the largest projects,Star Wars: Episode III – i.e., new theatres – would not open until the latter months of fiscal 2006 at the earliest. Excluding existing theatres in Racine, Green Bay and Brookfield, Wisconsin that are expected to be replaced with new locations previously noted, we have identified approximately four other theatres with up to 13 screens that we may close over the next three years with minimal impact on operating results.
17
We believe that our long-term competitive position has been strengthened as a result of our significant capital investments over the past few years, but ultimately, our future operating performance will be dependent upon strong film product. Box office receipts during the first halfRevenge of the summer have been very disappointing compared to last year’s record summer results. We are encouraged by the fact that our performance in recent weeks has improved due to films such asCharlieSith and the Chocolate FactoryandWedding Crashers, but it is likely that. The quantity of films remained fairly constant during fiscal 2006. We played 189 films at our theatres during fiscal 2006 compared to 188 during fiscal 2005.
Our theatre division’s operating margin decreased to 22.2% during fiscal 2006, compared to 23.3% in fiscal 2005, due in part to the impact of our fixed expenses on our decreased box office receipts. In addition, our fiscal 2006 first quarteroperating margin was negatively impacted by a one-time charge of approximately $500,000 related to a minor restructuring of our administrative and theatre operating results will again decline comparedsupervision organization and a one-time impairment charge of approximately $500,000 related to the same quarter last year. Although it is difficulttheatres scheduled to predict future box office performance, we are hopeful that upcoming fall films such asChicken Little, The Legend of ZorroandHarry Potter and the Goblet of Fire, coupled with potentially strong holiday fare includingThe Chronicles of Narnia: The Lion, the Witch and the Wardrobe, King Kong, Fun with Dick and JaneandThe Producers, will perform favorably compared to prior year product.
The increase in theatre division revenuesclose during fiscal 2004 compared to the prior year occurred despite2007. Our overall concession costs and film rental costs as a slight decrease in overall attendance. We opened six new screens at existing theatrespercentage of revenues decreased during fiscal 2004, including four screens in Menomonee Falls, Wisconsin, one screen in Madison, Wisconsin and our fourthUltraScreen™ at a theatre in Elgin, Illinois. These new screens, plus screens added in fiscal 2003 that were not open for a full year last year, generated approximately $1.4 million of additional2006. Other revenues during fiscal 2004. We closed and sold one budget-oriented theatre with six screens during fiscal 2004 and eliminated two screens at two existing theatres in conjunction with a project to convert two small auditoriums into one larger-capacity auditorium at each theatre. Closing those screens and one other theatre during fiscal 2003 negatively impacted comparisons of fiscal 2004 theatre division revenues to prior year results by $700,000, although our screen closings had a minimal impact on operating income. We also began operating a new six-screen theatre in Tomah, Wisconsin during fiscal 2004 that is owned by the Ho-Chunk Nation and represents our second management agreement.
Total theatre attendance was down 2.7%, up 0.9%, down 3.0% and up 5.1% during each of the four fiscal 2004 quarters, respectively, compared to the prior year comparable quarters. With no significant change in the number of competitive screens in our markets, we believe the primary factor contributing to these variations in attendance during fiscal 2004 was the quality and quantity of film product released during the respective quarters compared to the films released during the same quarters last year. Total theatre attendance for the full year decreased 0.4% during fiscal 2004 compared to the prior year and attendance at our comparable screens decreased 0.6%. The traditionally strong movie-going Memorial Day weekend, which was included in our fiscal 2003 fourth quarter, occurred during the first quarter of fiscal 2005, negatively impacting fiscal 2004 comparisons.
Despite the slight decrease in attendance, fiscal 2004 still was a record year at the box office for our theatre division. Contributing to our improved results was a 2.8% increase in our average ticket price during fiscal 2004 compared to the prior year. Modest price increases contributed to the average ticket price increase, with the remainder of the increase due to the fact that the fiscal 2004 first quarter film product included an unusually high number of R-rated movies. Such strong adult admission motion pictures appeal to a smaller audience but result in a higher average ticket price due to fewer child admissions. Our average concession sales per person increased 2.7% during fiscal 2004remained unchanged compared to the prior year.
Our top 15 performing films accounted for 35% of our fiscal 2004 box office receipts, compared to 36% during fiscal 2003. Four fiscal 2004 films produced box office receipts in excess of $3 million compared to three films during the prior year, but only five fiscal 2004 films produced over $2 million in receipts compared to eight films during fiscal 2003, indicating that we were much more dependent on a few blockbusters during fiscal 2004 compared to the prior year. The following five fiscal 2004 films produced box office receipts in excess of $2 million: Lord of the Rings: Return of the King, Finding Nemo, The Passion of the Christ, Pirates of the Caribbean and Elf. We played 181 films at our theatres during fiscal 2004 compared to 190 during fiscal 2003. Included in the total films played were three and two new IMAX®-exclusive films during each fiscal year, respectively.
1824
Our theatre division’s operating margin increased to 25.0% during fiscal 2004, compared to 24.0% in fiscal 2003. Contributing to the improved fiscal 2004 operating margin was reduced film rental, concession and advertising costs as a percentage of revenues. Increases in other revenues also contributed to our improved operating margin.
The hotels and resorts division contributed 44.8%51.9% of our consolidated revenues from continuing operations and 24.4%31.4% of our consolidated operating income, excluding corporate items, during fiscal 2005.2007. As of May 26, 2005,31, 2007, the hotels and resorts division owned and operated twothree full-service hotels in downtown Milwaukee, Wisconsin, a full-facility destination resort in Lake Geneva, Wisconsin and full-service hotels in Madison, Wisconsin, and downtown Kansas City, Missouri.Missouri, Chicago, Illinois and Oklahoma City, Oklahoma. In addition, we managed five12 hotels, resorts and other properties for other owners. We alsoIncluded in the 12 properties managed for others are two hotels owned by joint ventures that we have a vacation ownership developmentminority interest in Lake Geneva, Wisconsin.and two condominium hotels where we own the public space. The following table sets forth revenues, operating income, operating margin and rooms data for the hotels and resorts division for the last three fiscal years (prior year revenues, operating income and operating margin have been restated to reflect the current presentation of the Miramonte Resort and Marcus Vacation Club timesharing operation as discontinued operations):
| Change F05 v. F04 | Change F04 v. F03 | ||||||||||||||||||||||
|---|---|---|---|---|---|---|---|---|---|---|---|---|---|---|---|---|---|---|---|---|---|---|---|
| 2005 | 2004 | Amt. | Pct. | 2003 | Amt. | Pct. | |||||||||||||||||
| (in millions, except percentages) | |||||||||||||||||||||||
| Revenues | $ | 122.2 | $ | 118.0 | $ | 4.2 | 3.6 | % | $ | 111.0 | $ | 7.0 | 6.3 | % | |||||||||
| Operating income | 11.2 | 11.7 | (0.5 | ) | -4.2 | % | 10.1 | 1.6 | 15.5 | % | |||||||||||||
| Operating margin | 9.2 | % | 9.9 | % | 9.1 | % | |||||||||||||||||
| Available rooms at fiscal year-end | 2005 | 2004 | 2003 | ||||||||
|---|---|---|---|---|---|---|---|---|---|---|---|
| Company-owned | 1,848 | 2,074 | 2,074 | ||||||||
| Management contracts | 1,036 | 1,036 | 1,036 | ||||||||
| Total available rooms | 2,884 | 3,110 | 3,110 | ||||||||
| Change F07 v. F06 | Change F06 v. F05 | ||||||||||||||||||||||
|---|---|---|---|---|---|---|---|---|---|---|---|---|---|---|---|---|---|---|---|---|---|---|---|
| 2007 | 2006 | Amt. | Pct. | 2005 | Amt. | Pct. | |||||||||||||||||
| (in millions, except percentages) | |||||||||||||||||||||||
| Revenues | $ | 169.9 | $ | 141.9 | $ | 28.0 | 19.7 | % | $ | 116.5 | $ | 25.4 | 21.8 | % | |||||||||
| Operating income | 15.8 | 15.6 | 0.2 | 1.1 | % | 12.7 | 2.9 | 23.3 | % | ||||||||||||||
| Operating margin | 9.3 | % | 11.0 | % | 10.9 | % | |||||||||||||||||
| Available rooms at fiscal year-end | 2007 | 2006 | 2005 | ||||||||
|---|---|---|---|---|---|---|---|---|---|---|---|
| Company-owned | 2,520 | 2,480 | 1,848 | ||||||||
| Management contracts with joint ventures | 423 | -- | -- | ||||||||
| Management contracts with condominium hotels | 480 | 225 | 225 | ||||||||
| Management contracts with other owners | 1,670 | 811 | 811 | ||||||||
| Total available rooms | 5,093 | 3,516 | 2,884 | ||||||||
Division revenues increased during fiscal 20052007 compared to the prior year due to revenue increases at all five ofimproved overall performance from our comparable company-owned hotels and resorts, with the largest improvements attributed toaddition of two new company-owned hotels for portions of the year, increased management fees from new contracts and shared revenues from a new condominium hotel opened during the year. Continued improvement in business travel and a particularly strong year for our newest hotels (the Hotel Phillips in Kansas City, Missouri and the Hilton Madison at Monona Terrace) and our business travel-oriented Pfister Hotel. Increased food and beverage revenues alsodowntown Chicago hotel contributed to our fiscal 2005 increase in overall revenues. After two consecutive years of declining timeshare revenues, our revenues from this operation stabilized during fiscal 2005, totaling $5.6 million compared to $5.7 during fiscal 2004.improved results. Our decrease in fiscal 2005 operating income compared to the prior year is entirely attributed to reduced earnings from our timeshare operations due to increased marketing and selling costs anddespite approximately $1.5$7.0 million of combinedin start-up operating losses, andincluding $4.5 million in preopening expenses associated primarily with our Oklahoma City Hilton Skirvin project, the new Las Vegas condominium hotel and downtown Chicago hotel projects. Excluding the combined $1.9major renovation and rebranding of the InterContinental Milwaukee hotel. These projects also contributed to a lower operating margin during fiscal 2007 compared to the prior year. The additional week of operations contributed approximately $3.2 million negative year-over-year impact onand $570,000, respectively, to our division’s overall operating results related to these items, our remaining operations, including our five company-owned properties, contributed increasedhotels and resorts division revenues and operating income of nearly 12% over the prior year.during fiscal 2007.
The division’s total revenue per available room, or RevPAR, for continuingcomparable company-owned properties (excluding the Columbus Westin, InterContinental Milwaukee and Skirvin Hilton) increased 4.2%5.2% during fiscal 20052007 compared to the prior year. Our occupancy percentage (number of occupied rooms as a percentage of available rooms) increased 2.0decreased 0.1 percentage points and our average daily room rate, (“ADR”)or ADR, increased 1.0%5.4% during fiscal 20052007 compared to fiscal 2004. Our fiscal year ended on a very2006 for these same properties. The relative lack of new hotel supply growth and continued strong note, as our RevPAR increased 14.2% during our fiscal 2005 fourth quarter comparedbusiness travel demand contributed to the same period last year. Our occupancy percentage increased over four percentage points and ourthis ADR increased nearly 7% during this last quarter.
19
increase. According to data received from Smith Travel Research, comparable upper upscale hotels throughout the United States experienced ana similar increase in RevPAR of 8.6%6.0% during our fiscal 2005. We attempted2007.
25
Our Las Vegas condominium hotel project, the Platinum Hotel, opened in late October 2006. Start-up operating losses and preopening expenses, magnified by the fact that we were generally unable to retainrent a unit until after the integritycondominium sale closed, negatively impacted our fiscal 2007 results. As manager of our rate structure during the past several years (a period when others in the industry were heavily discounting), believing that this strategy was in our best long-term interest. As a result, our comparative changes in RevPAR during fiscal 2003hotel and 2004 consistently outperformed others in our segmentnow 100% owner of the industry but underperformed comparedpublic space (with all condominium units to others during fiscal 2005. Asbe ultimately individually-owned), we expect the economyPlatinum will contribute to revenues and the industry have recovered, it appears that those that heavily discounted or operated in markets that were impacted more severely by the economic downturn are generally now experiencing larger increases in RevPAR and ADR than our hotels and resorts. Historically,operating income of our hotels and resorts have generally performeddivision in several ways. In addition to earning a management fee equal to a share of room revenue, we are now reporting 100% of the revenues and profits (or losses) generated by the public space at or better than othersthis non-gaming, non-smoking hotel, including the restaurant, lounge, meeting space and spa.
Renovations of the historic Skirvin Hilton hotel were completed in late February and the 225-room property reopened during the first week of our fiscal 2007 fourth quarter, becoming our fifth historic hotel under management. As the principal equity partner in this complex public-private venture, the hotel is reported as a company-owned property and fiscal 2008 division revenues will be favorably impacted as a result. Our total equity investment in this venture was approximately $12.2 million, the majority of which is expected to be recouped from previously described federal and state historic tax credits related to this project. The remaining funds for this approximately $55 million project were provided by contributions from Oklahoma City, new markets tax credits and project-specific mortgage debt. Preopening costs from this project had a significant negative impact on our overall operating results during fiscal 2007. We expect this hotel to contribute positively to fiscal 2008 operating results.
In late April 2007, we sold the 186-room Westin Columbus hotel for $16.4 million, before transaction costs, into a joint venture formed by us and an entity sponsored by Chicago-based Waterton Commercial LLC. We own a 15% minority interest in the joint venture and will continue to manage the property under a long-term management agreement, as well as oversee a major, multi-million dollar renovation of the property. The sale of the Westin Columbus into a joint venture was contemplated when the property was initially acquired in May 2006. This hotel was included in our segmentconsolidated results for most of the industryfiscal year and contributed to our increased revenues and operating income during fiscal 2007. As a result of the sale, we will no longer include this hotel in our consolidated operating results and fiscal 2008 revenues and operating income will be slightly negatively impacted.
Six new management contracts were added during fiscal 2007. In June 2006, we agreed to provide hospitality management services to the new owner of our former vacation ownership development at Grand Geneva. In October 2006, we entered into an agreement to manage Brynwood Country Club in Milwaukee, Wisconsin and in November 2006, we assumed management of Resort Suites, a four-star 483-room destination resort in Scottsdale, Arizona owned by a subsidiary of Goldman Sachs. The new properties leverage our golf course and upscale resort management experience and should be excellent additions to our portfolio. In February 2007, we entered an agreement to manage the Sheraton Clayton Plaza Hotel St. Louis, a 257-room property in an upscale western suburb of St. Louis owned by another subsidiary of Goldman Sachs. We were also selected to manage an under-construction 256-room Hilton hotel in Bloomington, Minnesota, under a long-term contract with another owner. We are hopefulcurrently providing preopening and technical services for this project. The sixth contract added during fiscal 2007 is with another joint venture we formed with a fund sponsored by Waterton Commercial LLC to acquire the 237-room Sheraton Madison Hotel in Madison, Wisconsin. We also have a 15% minority interest in this joint venture and will manage the hotel and oversee a major renovation of the property. Although total revenues from an individual hotel management contract are significantly less than from an owned hotel, the operating margins are significantly higher due to the fact that all direct costs of operating the property are borne by the owner of the property. Management contracts provide us with an opportunity to increase our total number of rooms managed without a significant investment, thereby increasing our returns on equity from this trenddivision.
We also recently completed several capital projects at existing hotels that should enhance the long-term value of these properties. A significant renovation and repositioning of the Wyndham Milwaukee Center, including converting to the luxury InterContinental brand, was completed during our fiscal 2007 third quarter. The newly renovated lobby, ballroom, restaurant and bar opened late in our second quarter and a complete rooms renovation was completed in December 2006. As noted earlier, preopening expenses and start-up operating losses related to the repositioning of this hotel as a sophisticated, upscale property negatively impacted our fiscal 2007 results. Additional projects completed during fiscal 2007 include a 12,000 square foot conference center expansion at the Grand Geneva Resort and a new featured restaurant, the Mason Street Grill, at our Pfister Hotel. Preopening expenses for this restaurant, which has received very positive reaction from customers, also had a negative impact on fiscal 2007 results. A new spa and salon opened at the Pfister in April 2007. A major garage restoration project and a meeting and banquet space renovation currently underway at the Pfister will resume as conditions stabilize in the industry. We believelikely have a slight negative impact on that our most recent fourth quarter results support that expectation.hotel’s fiscal 2008 operating results.
26
The near-term outlook for the future performance of this division continues to appear promising. Our advanced bookings for the early months of fiscal 2008 have been strong. Favorable comparisons to fiscal 2007 operating results at our properties appears promising. Despite a brief decline in group travel duringnewest hotels that experienced significant preopening expenses and start-up operating losses should benefit our fiscal 2005 third quarter, group bookings were strong2008 results from this division. Although there is an increased number of proposed new hotels in several of our markets, including Milwaukee, supply growth during fiscal 2008 appears to be minimal. Subject to economic conditions that historically can have a significant impact on hotel demand, we currently expect continued improvement in our fourth quarterdivision operating results during fiscal 2008.
Division revenues and beginning ofoperating income increased during fiscal 2006 compared to the prior year due to improved overall performance from our five comparable company-owned hotels and resorts and the addition of three new company-owned hotels during the year. Continued improvement in business travel, particularly from the short-term transient business traveler, contributed to our advanced booking pace for groupimproved results. Group business is encouraging.was inconsistent during fiscal 2006, particularly at our Grand Geneva Resort. The group business segment is very important to several of our properties, as this is a segment of our customer base that typically provides non-room revenues to our hotels and resorts which are a key to increasing profitability levels. Our operating income and operating margin increased despite over $500,000 in start-up and preopening costs associated with our Oklahoma City Hilton Skirvin project.
The leisure customer segment hasdivision’s total RevPAR for comparable company-owned properties increased 6.8% during fiscal 2006 compared to the prior year. Our occupancy percentage increased 1.7 percentage points and our ADR increased 4.1% during fiscal 2006 compared to fiscal 2005. The relative lack of new hotel supply growth and continued to perform well for us and the individualimprovement in business travel segment continuesdemand contributed to show steady improvement, as evidenced bythis ADR increase after several years of stagnant or declining rates at our hotels and throughout the strong performancehotel industry. According to data received from Smith Travel Research, comparable upper upscale hotels throughout the United States experienced an increase in RevPAR of 9.1% during our fiscal 2006. Hotels located in the Midwest, where all of our Pfister Hotel. As a result, with cost controls remaining acomparable hotels reside, generally did not achieve as high priority, subject to economicyear-over-year RevPAR increases as those on the East and industry conditions, we expect our overall operating results and margins to improve in this division during fiscal 2006.West Coasts.
During the fiscal 2004 third quarter, we announced that we had entered into a joint venture with the developerfirst week of the Timber Ridge Lodge to develop a luxury condominium hotel just off the Las Vegas Strip. The Platinum Suite Hotel & Spa will feature 255 condo units, a luxury spa, indoor and outdoor swimming pools, 8,440 square feet of meeting space, including a 4,500 square-foot rooftop terrace overlooking the Strip, restaurants, lounge and upscale bar. The hotel will be located just over one block east of the Strip near Bellagio, Bally’s and Caesars Palace. The condo units were priced between $300,000 and $1.0 million and the hotel will manage a unit rental program for owners which will generate income for the owners from their units.
During the fiscal 2005 third quarter, we began construction on this facility, with a targeted opening date in late spring 2006. We expect to incur additional preopening expenses and other initial start-up losses from this project during fiscal 2006, but we currently expect thatpurchased the amounts will be less than those incurred during fiscal 2005 during the condominium sales process. We contributed an initial $3.5 million to this joint venture during fiscal 2004 and an additional $3.9 million during fiscal 2005 as construction began. Upon completion of construction and closing of the condominium unit sales (the project is sold out), our hotels and resorts division will share in any development profit on the project. We currently estimate that our 50% share of the development profit would be recognized late in fiscal 2006 or more likely early fiscal 2007. The division would then manage the220-room Wyndham Milwaukee Center hotel for a fee and share in any joint venture earnings ontotal cash purchase price of $23.6 million. We also opened another new hotel during the common areas, such as the restaurants, spa and bars.
Construction was recently completed on a company-owned hotel in downtown Chicago, Illinois that was originally expected to be a Baymont Inn & Suites. This project was not included in the salefirst week of our limited-service lodging division and was taken over by our hotels and resorts division. Recently namedfiscal 2006 — the Four Points by Sheraton Chicago Downtown/Magnificent Mile, this hotel opened during the first week of June 2006 and features 226 units (including 130 suites), an indoor swimming pool and fitness center, high-tech meeting rooms, an on-site parking facility (open later in fiscal 2006) and will lease space to several area restaurants. Like most new hotels, we expect thatMile. Our operating results from this property will incur some additional start-up operating losses duringcontributed favorably to our year-over-year comparison to fiscal 2006 prior2005, primarily due to stabilizing, but given that the hotel incurred significant preopening expenses incurred at this property during the fiscal 2005 we do not expectfourth quarter. We added a significant negative impactthird new company-owned hotel on year-over-year comparisons.
20
During the first week of our fiscalMay 2, 2006 first quarter,when we purchased the 220-room Wyndham Milwaukee Center hotel in the heart of Milwaukee’s theatre and financial district. The hotel features 12,000 square feet of meeting space, on-site parking, a restaurant and two lounges and complements our other two downtown Milwaukee, Wisconsin hotels. We currently anticipate a major renovation of this property during fiscal 2006, which may have some negative impact on this hotel’s operating results during the year due to the impact of selected functional areas taken out of service during the renovation .
During fiscal 2004, we announced our participation in a joint venture to restore and then manage the Skirvinhistoric Westin Columbus Hotel in Oklahoma City, the oldest existing hotel in Oklahoma. After several delays in this public-private project, we now expect renovationdowntown Columbus, Ohio for a total cash purchase price of this historic hotel to begin later in fiscal 2006 and to be completed during our fiscal 2007. When completed, this hotel is expected to have 225 rooms and 25,000 square feet of meeting space. Under the currently proposed structure for this project, we will be the principal equity partner in this venture and, as a result, we anticipate including the results from this operation in our consolidated operating results. The project includes various tax credits and we currently expect to benefit from federal historic tax credits associated with the renovation during fiscal 2007. We do not expect this project to have a significant impact on fiscal 2006 operating results.$16.3 million.
We continue to endeavor to maintain our properties consistent with our traditional high standards, making the investments necessary to improve operating results in the future. In addition to normal maintenance projects at all of our properties, several significant improvements were made to our Grand Geneva Resort & Spa during fiscal 2005,2006, including golf course improvements and a renovation of its lobby, front entrance and restaurants. We are currently considering several additional projects at the Grand Geneva and at our Pfister Hotel during fiscal 2006 in order to further enhance the value of those properties. As noted in the Current Plans section of this discussion, we also continue to explore several new growth opportunities, with a focus on expanding our hotel management business. We recently expanded our internal development team during fiscal 2006 in order to help facilitate our future growth.
Division revenues and operating income increased during fiscal 2004 compared to the prior year due to the continued improvement from our newest hotels (the Hotel Phillips in Kansas City, Missouri, the Hilton Madison at Monona Terrace and our Timber Ridge Lodge management contract) and improved results from our group-oriented hotels and resorts. In addition, fiscal 2004 revenues benefited from increased food and beverage revenues, which was at least partially attributable to the successful introduction of our “chop house” restaurant concept at our Madison and Kansas City hotels. Conversely, reduced revenues at our Marcus Vacation Club timeshare development (negatively impacted by reduced tour flow as a result of the new “no-call” laws) negatively impacted the division’s overall operating results. Excluding timeshare revenues, which decreased from $7.4 million during fiscal 2003 to $5.7 million during the current year, total revenues from this division increased 8.4% during fiscal 2004 compared to the prior year. Fiscal 2004 comparisons to the prior year were also unfavorably impacted by approximately $300,000 of preopening expenses related to the new restaurant concepts and by the fact that the division’s fiscal 2003 operating results included approximately $700,000 of favorable real estate tax adjustments, the result of reductions in our tax assessments in the wake of September 11 and the subsequent impact it had on our industry.
The division’s total RevPAR for company-owned properties increased 7.6% during fiscal 2004 compared to the prior year, excluding the discontinued Miramonte Resort. According to data received from Smith Travel Research, comparable upper upscale hotels experienced an increase in RevPAR of 4.1% during our fiscal 2004. Our hotels and resorts have generally performed at or better than others in our segment of the industry, likely due at least partially to our property and location mix. Our occupancy percentage increased 3.0 percentage points and our ADR also increased 0.7% during fiscal 2004 compared to fiscal 2003.
During fiscal 2004, we contributed an initial $3.5 million to the previously mentioned Las Vegas joint venture, representing our 50% share of the land acquisition costs and estimated initial pre-development costs. The initial sales phase of the project began in February 2004 with the opening of a sales center and model unit, along with an aggressive marketing program targeting both U.S. and international markets. Our hotels and resorts division operating income was negatively impacted by approximately $400,000 during fiscal 2004, representing our share of the sales and marketing expenses related to this phase of the project.
21
On September 3, 2004,During fiscal 2005, we sold substantially all of the assets of our limited-service lodging division to La Quinta Corporation of Dallas, Texas for a total purchase price of approximately $415 million in cash. La Quinta purchased our Baymont Inns & Suites, Woodfield Suites and Budgetel Inns brands, substantially all of the division’s real estate and related assets and assumed the operation of 90 company-owned and operated Baymont Inns & Suites, seven Woodfield Suites, one Budgetel Inn and the 87-unit Baymont franchise system (including four joint venture Baymont Inns & Suites that were excluded from the transaction and became franchisees). The total purchase price noted above includes approximately $19 million of proceeds related to the sale of four joint venture properties to LaQuinta. Our net proceeds as of the end of fiscal 2005, before the payment of income taxes resulting from the gain on sale, were $365.4 million, net ofcash, excluding transaction costs, and excluding approximately $22reported a significant after-tax gain of $74.7 million inon sale of discontinued operations. At the time of the sale, a portion of the sales proceeds was held in escrow pending completion of certain customary transfer requirements on several locations. During fiscal 2006, the necessary transfer requirements for the six remaining locations. The net proceeds amount above excludes $10.5 millionescrowed locations were met and one of proceeds related to the sale of athree remaining joint venture property to a third party. The assets sold to-date consist primarily of land, buildings and equipment with a net book value of approximately $242 million.properties was sold. As a result, we reported anadditional after-tax gaingains on sale of discontinued operations of $74.7$7.8 million were recognized during fiscal 2005. Upon completion of the transfer requirements associated with the $22 million in funds currently held in escrow, assets with a net book value of approximately $12 million will be sold and we would expect to report additional after-tax gains on sale of approximately $6 million in future periods.2006.
27
We have accounted for the results of our limited-service lodging division as discontinued operations in our consolidated financial statements for fiscal 2005 and have restated prior year results to conform with the current year presentation.all years presented. The following table sets forth revenues, operating income (loss), income (loss) from discontinued operations and income fromgain (loss) on sale of discontinued operations, net of applicable taxes, for our limited-service lodging division for the last three fiscal years (in millions, except for variance percentage):years:
| Change F05 v. F04 | Change F04 v. F03 | Change F07 v. F06 | Change F06 v. F05 | |||||||||||||||||||||||||||||||||||||||||||
|---|---|---|---|---|---|---|---|---|---|---|---|---|---|---|---|---|---|---|---|---|---|---|---|---|---|---|---|---|---|---|---|---|---|---|---|---|---|---|---|---|---|---|---|---|---|---|
| 2005 | 2004 | Amt. | Pct. | 2003 | Amt. | Pct. | 2007 | 2006 | Amt. | Pct. | 2005 | Amt. | Pct. | |||||||||||||||||||||||||||||||||
| (in millions, except percentages) | (in millions, except percentages) | |||||||||||||||||||||||||||||||||||||||||||||
| Revenues | $ | 43.0 | $ | 127.8 | $ | (84.8 | ) | -66.4 | % | $ | 126.6 | $ | 1.2 | 0.9 | % | $ | 0.1 | $ | 0.6 | $ | (0.5 | ) | -80.5 | % | $ | 43.5 | $ | (42.9 | ) | -98.6 | % | |||||||||||||||
| Operating income | 5.2 | 13.9 | (8.7 | ) | -62.4 | % | 11.6 | 2.3 | 20.4 | % | ||||||||||||||||||||||||||||||||||||
| Income from | ||||||||||||||||||||||||||||||||||||||||||||||
| Operating income (loss) | (0.2 | ) | (1.6 | ) | 1.4 | 90.1 | % | 5.7 | (7.3 | ) | -127.5 | % | ||||||||||||||||||||||||||||||||||
| Income (loss) from | ||||||||||||||||||||||||||||||||||||||||||||||
| discontinued operations | (0.5 | ) | (1.1 | ) | 0.6 | 57.1 | % | 3.0 | (4.1 | ) | -137.5 | % | ||||||||||||||||||||||||||||||||||
| (net of income taxes) | ||||||||||||||||||||||||||||||||||||||||||||||
| Gain (loss) on sale of | ||||||||||||||||||||||||||||||||||||||||||||||
| discontinued operations | 3.0 | 7.9 | (4.9 | ) | -62.0 | % | 5.1 | 2.8 | 55.7 | % | (0.3 | ) | 7.8 | (8.1 | ) | -103.1 | % | 74.7 | (66.9 | ) | -89.6 | % | ||||||||||||||||||||||||
| (net of income taxes) | ||||||||||||||||||||||||||||||||||||||||||||||
OperatingOur fiscal 2007 and 2006 operating results of the limited-service lodging division for fiscal 2005 include 14 weeks of operation prior to completion of the sale. Results reported subsequent to September 3, 2004 include various remaining costs associated with the limited-service lodging division, as well asincluded results from four of ourthe remaining joint venture Baymont Inns & Suites that were excluded from the transactionsale and beganare now operating as Baymont franchises. As noted earlier, one of the original four joint venture properties excluded from the sale to LaQuinta was sold early in our fiscal 2005 third quarter and weWe are actively exploring opportunities to sell the remaining three properties. The limited-service lodging division’stwo properties and, as a result, we continue to include their operating income and incomeresults in discontinued operations. Our fiscal 2006 loss from discontinued operations net of applicable taxes, duringincluded a one-time charge to earnings related to the costs associated with exiting leased office space for our former limited-service lodging division. Our fiscal 2005 operating results included 14 weeks of operations prior to completion of the sale and various costs associated with exiting the business, including approximately $1.8 million of severance-related costs.business.
On December 1, 2004,During fiscal 2005, we sold the Miramonte Resort for $28.7 million in cash, before transaction costs. The assets sold consisted primarily of land, building and equipment. As a result of this transaction, we reported aan after-tax gain of $5.9 million before tax and $3.6 million after tax during fiscal 2005. Settlement of a dispute with a contractor during fiscal 2006 resulted in a $90,000 after tax reduction in the reported gain. Operating results for the Miramonte Resort for fiscal 2005 included almost 27 weeks of operation prior to completion of the sale.
22
We have accounted for the results of the Miramonte Resort, which had previously been included in our hotels and resorts segment results, as discontinued operations in our consolidated financial statements for fiscal 2005 and have restated prior year results to conform with the current year presentation.all years presented. The following table sets forth revenues, operating loss, and loss from discontinued operations and gain (loss) on sale of discontinued operations, net of applicable taxes, for the Miramonte Resort for the last three fiscal years (in millions, except for variance percentage):years:
| Change F05 v. F04 | Change F04 v. F03 | Change F07 v. F06 | Change F06 v. F05 | |||||||||||||||||||||||||||||||||||||||||||
|---|---|---|---|---|---|---|---|---|---|---|---|---|---|---|---|---|---|---|---|---|---|---|---|---|---|---|---|---|---|---|---|---|---|---|---|---|---|---|---|---|---|---|---|---|---|---|
| 2005 | 2004 | Amt. | Pct. | 2003 | Amt. | Pct. | 2007 | 2006 | Amt. | Pct. | 2005 | Amt. | Pct. | |||||||||||||||||||||||||||||||||
| (in millions, except percentages) | (in millions, except percentages) | |||||||||||||||||||||||||||||||||||||||||||||
| Revenues | $ | 3.4 | $ | 6.5 | $ | (3.1 | ) | -47.1 | % | $ | 7.5 | $ | (1.0 | ) | -13.3 | % | $ | -- | $ | - | $ | - | -- | $ | 3.4 | $ | (3.4 | ) | -100.0 | % | ||||||||||||||||
| Operating loss | (2.2 | ) | (2.8 | ) | 0.6 | 22.9 | % | (1.3 | ) | (1.5 | ) | -114.1 | % | -- | (0.1 | ) | 0.1 | 100.0 | % | (2.2 | ) | 2.1 | 95.7 | % | ||||||||||||||||||||||
| Loss from | ||||||||||||||||||||||||||||||||||||||||||||||
| discontinued operations | (1.3 | ) | (1.7 | ) | 0.4 | 23.0 | % | (0.8 | ) | (0.9 | ) | -113.3 | % | -- | (0.1 | ) | 0.1 | 100.0 | % | (1.3 | ) | 1.2 | 95.3 | % | ||||||||||||||||||||||
| (net of income taxes) | ||||||||||||||||||||||||||||||||||||||||||||||
| Gain (loss) on sale of | ||||||||||||||||||||||||||||||||||||||||||||||
| discontinued operations | -- | (0.1 | ) | 0.1 | 100.0 | % | 3.6 | (3.7 | ) | -102.5 | % | |||||||||||||||||||||||||||||||||||
| (net of income taxes) | ||||||||||||||||||||||||||||||||||||||||||||||
28
Operating resultsEarly in our fiscal 2007 first quarter, we sold the remaining timeshare inventory of our Marcus Vacation Club at Grand Geneva vacation ownership development to Orange Lake Resort & Country Club of Orlando, Florida. The assets sold consisted primarily of real estate and development costs — Orange Lake acquired the remaining 34 units of the 136-unit Marcus Vacation Club property. Our hotels and resorts division will continue to provide hospitality management services for the Miramonte Resortproperty and continues to hold notes receivable from prior buyers of timeshare units, but will no longer be in the business of selling timeshare units.
We have accounted for fiscal 2005 include almost 27 weeks of operation prior to completionthe results of the sale, generally during the slowest seasons (summerMarcus Vacation Club, which had previously been included in our hotels and fall)resorts segment results, as discontinued operations in our consolidated financial statements for that property. Operating results for the period the hotel was open during fiscal 2005 benefitedall years presented. The following table sets forth revenues, operating loss, loss from increased revenues as a result of a recently opened spa. Fiscal 2004 operating results were negatively impacted by construction delays on the aforementioned spa.
On May 24, 2001, we sold our 30 KFCdiscontinued operations and KFC/Taco Bell 2-in-1 restaurants. The asset purchase agreement with the buyer provided for a potential additional future purchase price payment if certain performance conditions were met. During the first quarter of fiscal 2003, the buyer elected to terminate this provision of the agreement by paying us an additional $2.1 million. As a result, an additional gain on sale of discontinued operations, net of tax, of approximately $1.3 million, or $.04 per share, is included in our reported resultsapplicable taxes, for the Marcus Vacation Club for the last three fiscal 2003.years:
| Change F07 v. F06 | Change F06 v. F05 | ||||||||||||||||||||||
|---|---|---|---|---|---|---|---|---|---|---|---|---|---|---|---|---|---|---|---|---|---|---|---|
| 2007 | 2006 | Amt. | Pct. | 2005 | Amt. | Pct. | |||||||||||||||||
| (in millions, except percentages) | |||||||||||||||||||||||
| Revenues | $ | 4.0 | $ | 4.8 | $ | (0.8 | ) | -18.1 | % | $ | 5.6 | $ | (0.8 | ) | -14.4 | % | |||||||
| Operating loss | -- | (1.1 | ) | 1.1 | 97.0 | % | (0.6 | ) | (0.5 | ) | -93.8 | % | |||||||||||
| Loss from | |||||||||||||||||||||||
| discontinued operations | -- | (0.7 | ) | 0.7 | 97.2 | % | (0.3 | ) | (0.4 | ) | -113.0 | % | |||||||||||
| (net of income taxes) | |||||||||||||||||||||||
| Gain on sale of | |||||||||||||||||||||||
| discontinued operations | 0.1 | -- | 0.1 | N/A | -- | -- | -- | ||||||||||||||||
| (net of income taxes) | |||||||||||||||||||||||
Our movie theatre and hotels and resorts businesses each generate significant and relatively consistent daily amounts of cash, subject to previously noted seasonality, because each segment’s revenue is derived predominantly from consumer cash purchases. We believe that these relatively consistent and predictable cash sources, together with the funds from our sale of the limited-service lodging division, as well as the availability of $125$55 million of unused credit lines at fiscal 20052007 year-end, should be adequate to support the ongoing operational liquidity needs of our businesses.businesses during fiscal 2008.
Net cash provided by operating activities totaled $64.9 million during fiscal 2007, an increase of $25.3 million compared to $39.6 million during fiscal 2006. The increase was due primarily to increased earnings (excluding gains from sales of property, equipment and other assets and gains from sale of discontinued operations) and deferred taxes, as well as favorable timing in the collection of accounts and notes receivable and other current assets, partially offset by unfavorable timing in the payment of other accrued liabilities.
Net cash used in operatinginvesting activities during fiscal 2007 totaled $13.0$72.3 million compared to $20.5 million during fiscal 2006, an increase of $51.8 million. The increase in net cash used in investing activities was primarily the result of increased capital expenditures and acquisitions, decreased cash received from intermediaries and increased purchases of additional interests in joint ventures, partially offset by increased cash proceeds from disposals of property, equipment and other assets and increased proceeds from the sale of condominium units. Our fiscal 2007 results included $95.7 million of net proceeds from the sale of condominium units at our Platinum Hotel in Las Vegas. Our fiscal 2006 results included $25.0 million of net proceeds from the disposal of our limited-service lodging division. In addition, fiscal 2006 results included $26.8 million of cash received from intermediaries related to net proceeds received during fiscal 2005 from the sale of the Miramonte Resort. Cash proceeds from the disposals of property, equipment and other assets totaled $32.2 million and $6.9 million during fiscal 2007 and 2006, respectively. The cash proceeds received during fiscal 2007 were primarily the result of our sale of the Westin Columbus, a decreaseformer theatre property, four former restaurant locations and several excess parcels of $105.2land. The cash proceeds received during fiscal 2006 were primarily the result of our sale of a non-operating real estate development, a former restaurant location and several excess parcels of land. In addition, during fiscal 2007 and 2006, we received $4.0 and $7.4 million, or 114.1%,respectively, from Oklahoma City in conjunction with their contribution to the renovation of the Skirvin Hilton Hotel. The city’s total contribution of over $11 million was reported as a reduction to our property and equipment and will reduce future depreciation expense for this asset.
29
Total capital expenditures and acquisitions (including normal continuing capital maintenance projects) totaled $186.8 million during fiscal 2007, including our acquisition of the CEC theatres, compared to $75.5 million of capital expenditures and acquisitions incurred in fiscal 2006 (including the acquisitions of the Wyndham Milwaukee Center and Westin Columbus). We incurred approximately $70.6 million of capital expenditures during fiscal 2007 in our hotels and resorts division, including costs associated with the Skirvin Hilton renovation, InterContinental Milwaukee renovation and projects at the Grand Geneva Resort and Pfister Hotel. In addition to the CEC acquisition for $75.7 million, we incurred approximately $39.7 million of capital expenditures during fiscal 2007 in our theatre division, including costs associated with the three new theatres opened during the year. In addition to capital expenditures, we also incurred $11.1 million and $1.7 million, respectively, during fiscal 2007 and 2006 in connection with the purchase of interests in joint ventures, including our interests in the Platinum Hotel, the Sheraton Madison and the Columbus Westin. During fiscal 2006, we incurred $65.8 million of capital expenditures for our hotels and resorts division, the majority of which was related to our purchases of the aforementioned two hotels, completion of our Chicago hotel construction and beginning of construction on the Oklahoma City hotel project. We also incurred fiscal 2006 capital expenditures of $8.4 million in our theatre division, including costs associated with a parking structure at one of our Chicago-area theatres. Estimated current planned fiscal 2008 capital expenditures, which may be in the $60-$80 million range, are described in greater detail in the Current Plans section of this discussion.
Net cash used in financing activities in fiscal 2007 totaled $15.1 million, compared to $243.6 million in fiscal 2006, with the decrease primarily related to our $214.6 million special dividend paid during our fiscal 2006 fourth quarter. During fiscal 2007, we received $111.4 million of net proceeds from the issuance of notes payable and long-term debt, compared to $5.6 million during fiscal 2006. The proceeds during fiscal 2007 were primarily from debt related to the Skirvin Hilton and borrowings on commercial paper and our revolving credit facility used to finance the CEC theatre acquisition. Fiscal 2006 proceeds were from mortgage debt related to our downtown Chicago hotel. We made total principal payments on notes payable and long-term debt of $111.3 million and $27.3 million during fiscal 2007 and 2006, respectively, representing the payment of current maturities during both years and payment of construction loans on the Platinum Hotel of $81.9 during fiscal 2007. As a result, our total debt (including current maturities) increased to $256.7 million at the close of fiscal 2007, compared to $176.5 million at the end of fiscal 2006. Our debt-capitalization ratio was 0.45 at May 31, 2007, compared to 0.37 at the prior fiscal year-end. Based upon our current expectations for fiscal 2008 capital expenditure levels and potential asset sales proceeds, we anticipate our long-term debt total and debt-capitalization ratio will not change significantly during fiscal 2008. Our actual long-term debt total and debt-capitalization ratio at the end of fiscal 2008 will likely be dependent upon our actual capital expenditures, asset sales proceeds and equity transactions during the year.
During fiscal 2007, we repurchased 411,000 of our common shares for approximately $8.1 million in conjunction with the exercise of stock options and purchase of shares in the open market, compared to 313,000 of common shares repurchased for approximately $6.5 million during fiscal 2006. Our Board of Directors has authorized the repurchase of up to 4.7 million shares of our outstanding common stock. As of May 31, 2007, approximately 1.1 million shares remained available under this repurchase authorization. Any additional repurchases are expected to be executed on the open market or in privately negotiated transactions depending upon a number of factors, including prevailing market conditions.
Net cash provided by operating activities of $92.2totaled $39.6 million during fiscal 2004.2006, an increase of $52.6 million compared to net cash used in operating activities of $13.0 million during fiscal 2005. The decreaseincrease was due primarily to $75.7 million in income taxes, including a reduction in deferred income taxes, during fiscal 2005 related principally to the gain on sale of discontinued operations, as well as a difference in the collectiontiming of a large note receivable in fiscal 2004, resulting in anpayments of accounts payable and taxes other than income, partially offset by unfavorable comparisoncomparisons in collections of accounts and notes receivable.receivable and other current assets.
30
Net cash used in investing activities during fiscal 2006 totaled $20.5 million, compared to net cash provided by investing activities during fiscal 2005 totaledof $302.4 million, compared to net cash used in investing activities of $46.7 million during fiscal 2004.2005. Our fiscal 2005 results includeincluded $365.4 million of net proceeds from the disposal of our limited-service lodging division.division, compared to $25.0 million during fiscal 2006. In addition, fiscal 2005 results includeincluded $28.5 million of net proceeds from the sale of the Miramonte Resort, all of which was invested with intermediaries to facilitate potential tax deferral opportunities. The cash held by intermediaries was released shortly after year-end, a portion of which was used to purchase the Wyndham Milwaukee Center hotel. Cash proceeds from the disposals of other property and equipment totaled $4.2$6.9 million and $8.8$4.2 million during fiscal 20052006 and 2004,2005, respectively. The cash proceeds received during fiscal 2005 were primarily the result of our sale of two outlots on existing theatre land parcels, a four-screen theatre and an excess land parcel. The cash proceeds receivedIn addition, during fiscal 2004 were primarily2006, we received $7.4 million from Oklahoma City in conjunction with their contribution to the resultrenovation of our sale of a theatre and six excess parcels of land.the Hilton Skirvin Hotel.
23
Total capital expenditures (including normal continuing capital maintenance projects)totaled $75.5 million during fiscal 2006, including the acquisitions of the Wyndham Milwaukee Center and Westin Columbus, compared to $63.4 million and $50.9 million wereof capital expenditures incurred in fiscal 2005 and 2004, respectively.2005. We incurred $35.9$65.8 million of capital expenditures during fiscal 20052006 in our theatrehotels and resorts division compared to fund one new theatre, multiple screen additions, Project 2010 renovation costs, a parking structure at one of our Chicago-area theatres and four land parcels$21.5 million for future theatre development, as well as ongoing maintenance capital projects.this division during fiscal 2005. In addition, we incurred $21.5$8.4 million of capital expenditures during fiscal 20052006 in our hotels and resortstheatre division compared to fund construction of the downtown Chicago hotel, renovations at our Grand Geneva Resort & Spa and various other ongoing maintenance projects. Also included in our capital expenditure totals for fiscal 2005 are $4.1$35.9 million of capital expenditures infor our former limited-service lodgingtheatre division incurred prior to the sale related to previously committed capital projects.during fiscal 2005. In addition to capital expenditures, we also incurred $4.3$1.7 million and $4.5$4.3 million, respectively, during fiscal 2006 and 2005 and 2004 onin connection with the purchase of interests in joint ventures, including our interest in the Las Vegas project for our hotels and resorts division and our interest in a theatre advertising company for our theatre division. During fiscal 2004, we incurred $24.5 million of capital expenditures for discontinued limited-service lodging division and Miramonte Resort projects, $15.1 million for hotels and resorts division projects (including the downtown Chicago project) and $11.0 million for theatre division projects.
Pending a decision regarding the use of the proceeds from the sale of the limited-service lodging division, total capital expenditures in fiscal 2006 are currently expected to be as high as $80 to $100 million and are expected to be funded by cash generated from operations and existing cash balances, including proceeds from the sale of the Miramonte Resort, which were used to purchase the Wyndham Milwaukee Center. Excluding the purchase and renovation of the Wyndham Milwaukee Center hotel, we currently expect the remaining capital to be divided approximately equally across our theatre and hotels and resorts divisions and will likely include selected theatre screen additions and potential new locations, potential strategic equity investments in hotel projects and maintenance and project capital.ventures.
Net cash used in financing activities in fiscal 20052006 totaled $40.0$243.6 million, compared to $42.0$40.0 million in fiscal 2004.2005, with the increase primarily related to the $214.6 million special dividend paid during our fiscal 2006 fourth quarter. During fiscal 2005,2006, we received $13.6$5.6 million of net proceeds from the issuance of notes payable and long-term debt, compared to $10.8$13.6 million during fiscal 2004.2005. The proceeds during both fiscal years were from mortgage debt related to theour downtown Chicago development.hotel. We made total principal payments on notes payable and long-term debt of $53.7$27.3 million and $49.3$53.7 million during fiscal 20052006 and 2004,2005, respectively, representing the payment of current maturities during both years and payment of borrowings on commercial paper and revolving credit facilities with the excess operating cash flow and sales proceeds available.available during fiscal 2005. As a result, our total debt (including current maturities) decreased to $196.7$176.5 million at the close of fiscal 2005,2006, compared to $233.0$196.7 million at the end of fiscal 2004.2005. Our debt-capitalization ratio was 0.280.37 at May 26, 2005,25, 2006, compared to 0.370.28 at the prior fiscal year end. Based upon our current expectations foryear-end. During fiscal 2006, capital expenditure levels and potential asset sales proceeds, including the remaining escrowed net proceeds from the sale of the limited-service lodging division, we anticipate our long-term debt total will again decrease during fiscal 2006 by the amount of scheduled current maturities at year-end (approximately $26 million) and that our debt-capitalization ratio will remain significantly below historical levels. Our actual long-term debt total and debt-capitalization ratio at the end of fiscal 2006 will be dependent upon our decisions regarding the use of the Baymont sale proceeds.
During fiscal 2005, we repurchased 28,000purchased 313,000 of our common shares for approximately $518,000$6.5 million in conjunction with the exercise of stock options and purchase of shares in the open market, compared to 34,00028,000 of common shares repurchased for approximately $512,000$518,000 during fiscal 2004. Through May 26, 2005, our Board of Directors has authorized the repurchase of up to 4.7 million shares of our outstanding Common Stock. As of May 26, 2005, approximately 1.9 million shares remained available under these authorizations for repurchase. Any such repurchases are expected to be executed on the open market or in privately negotiated transactions depending upon a number of factors, including prevailing market conditions.2005.
2431
We have obligations and commitments to make future payments under debt and operating leases. The following schedule details these obligations at May 26, 200531, 2007 (in thousands):
| Payments Due by Period | Payments Due by Period | |||||||||||||||||||||||||||||||||
|---|---|---|---|---|---|---|---|---|---|---|---|---|---|---|---|---|---|---|---|---|---|---|---|---|---|---|---|---|---|---|---|---|---|---|
| Total | Less Than 1 Year | 1-3 Years | 4-5 Years | After 5 Years | Total | Less Than 1 Year | 1-3 Years | 4-5 Years | After 5 Years | |||||||||||||||||||||||||
| Long-term debt | $ | 196,653 | $ | 25,765 | $ | 82,549 | $ | 45,975 | $ | 42,364 | $ | 256,675 | $ | 57,250 | $ | 116,420 | $ | 28,570 | $ | 54,435 | ||||||||||||||
| Notes payable | 1,774 | 1,774 | -- | -- | -- | 239 | 239 | -- | -- | -- | ||||||||||||||||||||||||
| Operating lease obligations | 40,683 | 2,734 | 5,192 | 5,044 | 27,713 | 90,808 | 3,521 | 7,240 | 7,163 | 72,884 | ||||||||||||||||||||||||
| Construction commitments | 6,289 | 6,289 | -- | -- | -- | 7,075 | 7,075 | -- | -- | -- | ||||||||||||||||||||||||
| Total contractual obligations | $ | 245,399 | $ | 36,562 | $ | 87,741 | $ | 51,019 | $ | 70,077 | $ | 354,797 | $ | 68,085 | $ | 123,660 | $ | 35,733 | $ | 127,319 | ||||||||||||||
Additional detail describing our long-term debt is included in Note 45 to our consolidated financial statements.
As of May 26, 2005,31, 2007, we had no additional material purchase obligations other than those created in the ordinary course of business related to property and equipment, which generally have terms of less than 90 days. We also have long-term obligations related to our employee benefit plans, which are discussed in detail in Note 67 of our consolidated financial statements.
We guarantee debt of our 50% unconsolidated joint ventures and other entities. Our joint venture partners also guarantee all or a portion of this same debt.
We have approximately six and one-half years remaining on a ten and one-half year office lease. During fiscal 2004,2006, the lease was amended in order to exit leased office space for our former limited-service lodging division. To induce the landlord to amend the lease, we paid $930,000 in connection with our guaranteeguaranteed the lease obligations of debt on a joint venture that was liquidated.the new tenant of the relinquished space throughout the remaining term of the lease.
The following schedule details our guarantee obligations at May 26, 200531, 2007 (in thousands):
| Expiration by Period | |||||||||||||||||
|---|---|---|---|---|---|---|---|---|---|---|---|---|---|---|---|---|---|
| Total | Less Than 1 Year | 1-3 Years | 4-5 Years | After 5 Years | |||||||||||||
| Guarantee obligations | $ | 5,261 | $ | 187 | $ | 1,866 | $ | 3,208 | -- | ||||||||
| Expiration by Period | |||||||||||||||||
|---|---|---|---|---|---|---|---|---|---|---|---|---|---|---|---|---|---|
| Total | Less Than 1 Year | 1-3 Years | 4-5 Years | After 5 Years | |||||||||||||
| Debt guarantee obligations | $ | 4,835 | $ | 1,650 | $ | 3,185 | $ | -- | $ | -- | |||||||
| Lease guarantee obligations | 2,854 | 408 | 846 | 887 | 713 | ||||||||||||
| Total guarantee obligations | $ | 7,689 | $ | 2,058 | $ | 4,031 | $ | 887 | $ | 713 | |||||||
We are exposed to market risk related to changes in interest rates and we manage our exposure to this market risk by monitoring available financing alternatives.
Variable interest rate debt outstanding as of May 26, 200531, 2007 was $21.9$95.9 million, carried an average interest rate of 5.3%6.1% and represented 11.1%37.4% of our total debt portfolio. Our earnings are affected by changes in short-term interest rates as a result of our borrowings under our revolving credit agreements and floating-rate mortgages, industrial development revenue bonds and unsecured term notes.mortgages.
Fixed interest rate debt totaled $174.8$160.8 million as of May 26, 2005,31, 2007, carried an average interest rate of 7.31%6.4% and represented 88.9%62.6% of our total debt portfolio. Fixed interest rate debt included the following: senior notes bearing interest monthly at 10.22%, maturing in 2005; senior notes bearing interest semiannually at fixed rates ranging from 6.66% to 7.93%, maturing in 2008fiscal 2009 through 2014; and fixed rate mortgages and other debt instruments bearing interest from 6.50%1.00% to 8.22%6.96%, maturing in 20092010 through 2014.2036. The fair value of our long-term fixed interest rate debt is subject to interest rate risk. Generally, the fair market value of our fixed interest rate debt will increase as interest rates fall and decrease as interest rates rise. The fair value of our $172.7$120.0 million of senior notes is approximately $183.8$122.4 million. Based upon the respective ratesrate and prepayment provisions of our remaining fixed interest rate senior notesmortgage and mortgagesunsecured term note at May 26, 2005,31, 2007, the carrying amounts of such debt approximates fair value.
2532
The variable interest rate debt and fixed interest rate debt outstanding as of May 26, 200531, 2007 matures as follows (in thousands):
| 2006 | 2007 | 2008 | 2009 | 2010 | Thereafter | Total | 2008 | 2009 | 2010 | 2011 | 2012 | Thereafter | Total | |||||||||||||||||||||||||||||||||
|---|---|---|---|---|---|---|---|---|---|---|---|---|---|---|---|---|---|---|---|---|---|---|---|---|---|---|---|---|---|---|---|---|---|---|---|---|---|---|---|---|---|---|---|---|---|---|
| Variable interest rate | $ | 321 | $ | 21,582 | $ | -- | $ | -- | $ | -- | $ | -- | $ | 21,903 | $ | 25,514 | $ | 70,359 | $ | -- | $ | -- | $ | -- | $ | -- | $ | 95,873 | ||||||||||||||||||
| Fixed interest rate | 25,444 | 28,700 | 32,267 | 31,738 | 14,237 | 42,364 | 174,750 | 31,736 | 31,779 | 14,282 | 14,283 | 14,287 | 54,435 | 160,802 | ||||||||||||||||||||||||||||||||
| Total debt | $ | 25,765 | $ | 50,282 | $ | 32,267 | $ | 31,738 | $ | 14,237 | $ | 42,364 | $ | 196,653 | $ | 57,250 | $ | 102,138 | $ | 14,282 | $ | 14,283 | $ | 14,287 | $ | 54,435 | $ | 256,675 | ||||||||||||||||||
We periodically enter into interest rate swap agreements to manage our exposure to interest rate changes. TheThese swaps involve the exchange of fixed and variable interest rate payments without exchanging the notional principal amount. Payments or receipts on the agreements are recorded as adjustments to interest expense. We had no outstanding interest rate swap agreements at May 26, 2005.31, 2007. On May 3, 2002, we terminated a swap agreement that had effectively converted $25 million of our borrowings under revolving credit agreements from floating-rate debt to fixed-rate debt. The fair value of the swap on the date of the termination resulted in a liability of $2.8 million. The remaining loss in other comprehensive income at May 26, 2005 of $184,000 ($111,000 net of tax) will be, previously included in other comprehensive income, was reclassified into earnings as interest expense through November 15, 2005,during fiscal 2006 in conjunction with the remainingend of the original life of the original hedge, as interest payments affect earnings.hedge.
Our discussion and analysis of our financial condition and results of operations are based upon our consolidated financial statements, which have been prepared in accordance with United Statesaccounting principles generally accepted accounting principles.in the United States. The preparation of our financial statements requires us to make estimates and judgments that affect our reported amounts of assets, liabilities, revenues and expenses, and related disclosure of contingent assets and liabilities.
On an on-going basis, we evaluate our estimates, including those related to bad debts, insurance reserves, carrying value of investments in long-lived assets, intangible assets, income taxes, pensions, and contingencies and litigation. We base our estimates on historical experience and on various other assumptions that are believed to be reasonable under the circumstances, the results of which form the basis for making judgments about the carrying values of assets and liabilities that are not readily apparent from other sources. Actual results may differ from these estimates under different assumptions or conditions.
We believe the following critical accounting policies affect the most significant judgments and estimates used in the preparation of our consolidated financial statements.
2633
On December 16, 2004, the Financial Accounting Standards Board (FASB) issued FASB Statement No. 123 (revised 2004)(SFAS No. 123R), “Share Based Payment,” which is a revision of SFAS No. 123, “Accounting for Stock-Based Compensation.” SFAS No. 123(R) supersedes Accounting Principles Board (APB) Opinion No. 25, “Accounting for Stock Issued to Employees,” and Qualitative Disclosures About Market Risk.amends SFAS No. 95, “Statement of Cash Flows.” Generally, the approach in SFAS No. 123(R) is similar to the approach in SFAS No. 123. However, SFAS No. 123(R) requires all share-based payments to employees, including grants of employee stock options, to be recognized in the income statement based on their grant date fair values. Pro forma disclosure is no longer an alternative.
Prior to May 26, 2006, we accounted for stock-based compensation in accordance with APB Opinion No. 25. Accordingly, no compensation expense was recognized for stock options because all options granted had an exercise price equal to the market value of the underlying stock on the date of grant. As discussed in Note 6 of our consolidated financial statements, we began expensing the fair value of stock options on May 26, 2006, the beginning of our fiscal 2007 year, when we adopted SFAS No. 123(R) using the modified prospective method. This transition method does not result in the restatement of previously issued financial statements.
34
As a result of adopting SFAS No. 123(R) on May 26, 2006, our earnings from continuing operations before income taxes and net earnings for fiscal 2007 were lower by $1.1 million and $830,000, respectively, than if we had been allowed to continue to account for stock-based compensation under APB Opinion No. 25. We will continue to expense awards of non-vested stock over the vesting period of the awards based on the fair value of our common stock at the date of grant. At the end of fiscal 2007, total remaining unearned compensation related to non-vested stock was approximately $941,000, which will be amortized over the weighted-average remaining service period of 8.8 years.
On May 26, 2006, we adopted SFAS No. 158, “Employers’ Accounting for Defined Benefit Pension and other Postretirement Plans,” which requires us to recognize previously unrecognized actuarial losses and prior service costs in the statement of financial position and to recognize future changes in these amounts in the year in which changes occur through comprehensive income. Additionally, we are required to measure the funded status of our plan as of the date of our year-end statement of financial position. The adoption of SFAS No. 158 had no effect on our consolidated statement of earnings for the year ended May 31, 2007, or for any prior period presented, and it will not affect our operating results in future periods.
In June 2006, the Financial Accounting Standards Board (FASB) issued FASB Interpretation No. 48 (FIN 48), “Accounting for Uncertainty in Income Taxes.” This interpretation prescribes a recognition threshold and measurement criteria for a tax position taken or expected to be taken in a tax return. The new standard will be effective for our first quarter of fiscal 2008. Based upon our initial review, we do not believe adoption of FIN 48 will have a material impact on our overall financial position.
| Item 7A. | Quantitative and Qualitative Disclosures About Market Risk. |
The information required by this item is set forth in “Item 7. Management’s Discussion and Analysis of Financial Condition and Results of Operations – Quantitative and Qualitative Disclosures About Market Risk” above.
27
| Item 8. | Financial Statements and Supplementary Data. |
Our management is responsible for establishing and maintaining adequate internal control over financial reporting, as such term is defined in Rule 13a-15(f) of the Exchange Act. Under the supervision and with the participation of our management, including our principal executive officer and principal financial officer, we conducted an evaluation of the effectiveness of our internal control over financial reporting based on the framework in Internal Control – Integrated Framework issued by the Committee of Sponsoring Organizations of the Treadway Commission. Based on our evaluation under the framework in Internal Control – Integrated Framework, our management concluded that our internal control over financial reporting was effective as of May 26, 2005.31, 2007. The Company’s auditors, Ernst & Young, LLP, have issued an attestation report on management’s assessment of the Company’s internal control over financial reporting. That attestation report is set forth immediately following this report.
| Stephen H. Marcus | Douglas A. Neis |
| Chairman of the Board, President and | Chief Financial Officer and Treasurer |
| Chief Executive Officer |
2835
REPORT OF INDEPENDENT REGISTERED PUBLIC ACCOUNTING FIRM
ON INTERNAL CONTROL OVER FINANCIAL REPORTING
The Board of Directors and Shareholders
of the Marcus Corporation
We have audited management’s assessment, included in the accompanying Management’s Report on Internal Control over Financial Reporting, that The Marcus Corporation (the Company) maintained effective internal control over financial reporting as of May 26, 2005,31, 2007, based on criteria established in Internal Control—Control – Integrated Framework issued by the Committee of Sponsoring Organizations of the Treadway Commission (the COSO criteria). The Company’s management is responsible for maintaining effective internal control over financial reporting and for its assessment of the effectiveness of internal control over financial reporting. Our responsibility is to express an opinion on management’s assessment and an opinion on the effectiveness of the company’sCompany’s internal control over financial reporting based on our audit.
We conducted our audit in accordance with the standards of the Public Company Accounting Oversight Board (United States). Those standards require that we plan and perform the audit to obtain reasonable assurance about whether effective internal control over financial reporting was maintained in all material respects. Our audit included obtaining an understanding of internal control over financial reporting, evaluating management’s assessment, testing and evaluating the design and operating effectiveness of internal control, and performing such other procedures as we considered necessary in the circumstances. We believe that our audit provides a reasonable basis for our opinion.
A company’s internal control over financial reporting is a process designed to provide reasonable assurance regarding the reliability of financial reporting and the preparation of financial statements for external purposes in accordance with generally accepted accounting principles. A company’s internal control over financial reporting includes those policies and procedures that (1) pertain to the maintenance of records that, in reasonable detail, accurately and fairly reflect the transactions and dispositions of the assets of the company; (2) provide reasonable assurance that transactions are recorded as necessary to permit preparation of financial statements in accordance with generally accepted accounting principles, and that receipts and expenditures of the company are being made only in accordance with authorizations of management and directors of the company; and (3) provide reasonable assurance regarding prevention or timely detection of unauthorized acquisition, use, or disposition of the company’s assets that could have a material effect on the financial statements.
Because of its inherent limitations, internal control over financial reporting may not prevent or detect misstatements. Also, projections of any evaluation of effectiveness to future periods are subject to the risk that controls may become inadequate because of changes in conditions, or that the degree of compliance with the policies or procedures may deteriorate.
In our opinion, management’s assessment that the Company maintained effective internal control over financial reporting as of May 26, 2005,31, 2007, is fairly stated, in all material respects, based on the COSO criteria. Also, in our opinion, the Company maintained, in all material respects, effective internal control over financial reporting as of May 26, 2005,31, 2007, based ontheon the COSO criteria.criteria.
We also have audited, in accordance with the standards of the Public Company Accounting Oversight Board (United States), the consolidated balance sheets of The Marcus Corporation as of May 26, 200531, 2007 and May 27, 2004,25, 2006, and the related consolidated statements of earnings, shareholders’ equity and cash flows for each of the three years in the period ended May 26, 200531, 2007, and our report dated August 5, 200510, 2007 expressed an unqualified opinion thereon.
/s/ Ernst & Young LLP
Milwaukee, Wisconsin
August 5, 200510, 2007
2936
REPORT OF INDEPENDENT REGISTERED PUBLIC ACCOUNTING FIRM
The Board of Directors and Shareholders
of The Marcus Corporation
We have audited the accompanying consolidated balance sheets of The Marcus Corporation (the Company) as of May 26, 200531, 2007 and May 27, 2004,25, 2006, and the related consolidated statements of earnings, shareholders’ equity and cash flows for each of the three years in the period ended May 26, 2005.31, 2007. These financial statements are the responsibility of the Company’s management. Our responsibility is to express an opinion on these financial statements based on our audits.
We conducted our audits in accordance with the standards of the Public Company Accounting Oversight Board (United States). Those standards require that we plan and perform the audit to obtain reasonable assurance about whether the financial statements are free of material misstatement. An audit includes examining, on a test basis, evidence supporting the amounts and disclosures in the financial statements. An audit also includes assessing the accounting principles used and significant estimates made by management, as well as evaluating the overall financial statement presentation. We believe that our audits provide a reasonable basis for our opinion.
In our opinion, the financial statements referred to above present fairly, in all material respects, the consolidated financial position of the Company at May 26, 200531, 2007 and May 27, 2004,25, 2006, and the consolidated results of its operations and its cash flows for each of the three years in the period ended May 26, 2005,31, 2007, in conformity with United StatesU. S. generally accepted accounting principles.
As discussed in Note 6 to the consolidated financial statements, on May 26, 2006, the Company changed its method of accounting for share-based awards. Additionally, as discussed in Note 7 to the consolidated financial statements, on May 31, 2007, the Company changed its method of accounting for defined benefit pension plans.
We have also audited, in accordance with the standards of the Public Company Accounting Oversight Board (United States), the effectiveness of the Company’s internal control over financial reporting as of May 26, 2005,31, 2007, based on criteria established in Internal Control – Integrated Framework issued by the Committee of Sponsoring Organizations of the Treadway Commission and our report dated August 5, 200510, 2007 expressed an unqualified opinion thereon.
/s/ Ernst & Young LLP
Milwaukee, Wisconsin
August 5, 200510, 2007
3037
THE MARCUS CORPORATION
CONSOLIDATED BALANCE SHEETS
(in thousands, except share and per share data)
| May 26, 2005 | May 27, 2004 | |||||||
|---|---|---|---|---|---|---|---|---|
| ASSETS | ||||||||
| CURRENT ASSETS: | ||||||||
| Cash and cash equivalents | $ | 259,057 | $ | 9,439 | ||||
| Cash held by intermediaries | 28,552 | -- | ||||||
| Accounts and notes receivable, net of reserves(Note 3) | 8,911 | 7,742 | ||||||
| Receivables from joint ventures, net of reserves(Note 9) | 2,704 | 2,666 | ||||||
| Refundable income taxes | 871 | -- | ||||||
| Deferred income taxes(Note 7) | 5,464 | 4,593 | ||||||
| Real estate and development costs | 4,985 | 6,438 | ||||||
| Other current assets | 4,856 | 5,677 | ||||||
| Assets of discontinued operations(Note 2) | 16,700 | 290,372 | ||||||
| Total current assets | 332,100 | 326,927 | ||||||
PROPERTY AND EQUIPMENT, net(Note 3) | 399,923 | 373,617 | ||||||
OTHER ASSETS: | ||||||||
| Investments in joint ventures(Note 9) | 6,658 | 4,300 | ||||||
| Goodwill | 11,196 | 11,222 | ||||||
| Other(Note 3) | 37,622 | 33,745 | ||||||
| Total other assets | 55,476 | 49,267 | ||||||
| Total assets | $ | 787,499 | $ | 749,811 | ||||
LIABILITIES AND SHAREHOLDERS' EQUITY | ||||||||
| CURRENT LIABILITIES: | ||||||||
| Notes payable(Note 9) | $ | 1,774 | $ | 2,066 | ||||
| Accounts payable | 16,011 | 14,819 | ||||||
| Income taxes | -- | 1,311 | ||||||
| Taxes other than income taxes | 8,507 | 8,113 | ||||||
| Accrued compensation | 6,191 | 5,934 | ||||||
| Other accrued liabilities(Note 3) | 11,925 | 12,122 | ||||||
| Current maturities of long-term debt(Note 4) | 25,765 | 25,738 | ||||||
| Liabilities of discontinued operations(Note 2) | 9,514 | 40,658 | ||||||
| Total current liabilities | 79,687 | 110,761 | ||||||
LONG-TERM DEBT(Note 4) | 170,888 | 207,282 | ||||||
DEFERRED INCOME TAXES(Note 7) | 26,614 | 22,666 | ||||||
DEFERRED COMPENSATION AND OTHER(Note 6) | 16,649 | 15,379 | ||||||
COMMITMENTS, LICENSE RIGHTS AND CONTINGENCIES(Note 8) | ||||||||
SHAREHOLDERS' EQUITY(Note 5): | ||||||||
| Preferred Stock, $1 par; authorized 1,000,000 shares; none | -- | -- | ||||||
| issued | ||||||||
| Common Stock: | ||||||||
| Common Stock, $1 par; authorized 50,000,000 shares; issued | ||||||||
| 22,099,042 shares in 2005 and 21,865,853 shares in 2004 | 22,099 | 21,866 | ||||||
| Class B Common Stock, $1 par; authorized 33,000,000 | ||||||||
| shares; issued and outstanding 9,090,471 shares in 2005 | ||||||||
| and 9,323,660 shares in 2004 | 9,091 | 9,324 | ||||||
| Capital in excess of par | 45,481 | 42,952 | ||||||
| Retained earnings | 425,941 | 333,171 | ||||||
| Accumulated other comprehensive loss | (532 | ) | (289 | ) | ||||
| 502,080 | 407,024 | |||||||
Less unearned compensation on Restricted Stock | (413 | ) | (630 | ) | ||||
| Less cost of Common Stock in treasury (857,088 shares in 2005 and | ||||||||
| 1,356,620 shares in 2004 | (8,006 | ) | (12,671 | ) | ||||
| Total shareholders' equity | 493,661 | 393,723 | ||||||
| Total liabilities and shareholders' equity | $ | 787,499 | $ | 749,811 | ||||
| May 31, 2007 | May 25, 2006 | |||||||
|---|---|---|---|---|---|---|---|---|
| ASSETS | ||||||||
| CURRENT ASSETS: | ||||||||
| Cash and cash equivalents | $ | 12,018 | $ | 34,528 | ||||
| Cash held by intermediaries | 5,749 | 1,752 | ||||||
| Accounts and notes receivable, net of reserves(Note 4) | 16,224 | 14,306 | ||||||
| Receivables from joint ventures, net of reserves(Note 10) | 3,732 | 3,385 | ||||||
| Refundable income taxes | 5,939 | 216 | ||||||
| Deferred income taxes(Note 8) | 1,056 | 5,898 | ||||||
| Condominium units held for sale(Note 10) | 7,320 | -- | ||||||
| Other current assets(Note 4) | 6,340 | 11,273 | ||||||
| Assets of discontinued operations(Note 3) | 975 | 7,545 | ||||||
| Total current assets | 59,353 | 78,903 | ||||||
PROPERTY AND EQUIPMENT, net(Note 4) | 559,785 | 450,529 | ||||||
OTHER ASSETS: | ||||||||
| Investments in joint ventures(Note 10) | 1,868 | 7,487 | ||||||
| Goodwill | 37,805 | 11,196 | ||||||
| Other(Note 4) | 39,572 | 39,119 | ||||||
| Total other assets | 79,245 | 57,802 | ||||||
| Total assets | $ | 698,383 | $ | 587,234 | ||||
LIABILITIES AND SHAREHOLDERS’ EQUITY | ||||||||
| CURRENT LIABILITIES: | ||||||||
| Notes payable(Note 10) | $ | 239 | $ | 500 | ||||
| Accounts payable | 24,242 | 19,399 | ||||||
| Taxes other than income taxes | 11,215 | 11,064 | ||||||
| Accrued compensation | 6,720 | 7,444 | ||||||
| Other accrued liabilities(Note 4) | 24,746 | 15,137 | ||||||
| Current maturities of long-term debt(Note 5) | 57,250 | 53,402 | ||||||
| Liabilities of discontinued operations(Note 3) | 2,731 | 1,998 | ||||||
| Total current liabilities | 127,143 | 108,944 | ||||||
LONG-TERM DEBT(Note 5) | 199,425 | 123,110 | ||||||
DEFERRED INCOME TAXES(Note 8) | 29,376 | 27,946 | ||||||
DEFERRED COMPENSATION AND OTHER(Note 7) | 22,930 | 25,911 | ||||||
COMMITMENTS, LICENSE RIGHTS AND CONTINGENCIES(Note 9) | ||||||||
SHAREHOLDERS’ EQUITY(Note 6): | ||||||||
| Preferred Stock, $1 par; authorized 1,000,000 shares; none issued | -- | -- | ||||||
| Common Stock: | ||||||||
| Common Stock, $1 par; authorized 50,000,000 shares; issued | ||||||||
| 22,299,925 shares in 2007 and 22,235,822 shares in 2006 | 22,300 | 22,236 | ||||||
| Class B Common Stock, $1 par; authorized 33,000,000 shares; | ||||||||
| issued and outstanding 8,889,588 shares in 2007 and | ||||||||
| 8,953,691 shares in 2006 | 8,890 | 8,954 | ||||||
| Capital in excess of par | 46,438 | 45,911 | ||||||
| Retained earnings | 255,727 | 231,907 | ||||||
| Accumulated other comprehensive income (loss) | (1,515 | ) | 112 | |||||
| 331,840 | 309,120 | |||||||
Less unearned compensation on restricted stock | -- | (293 | ) | |||||
| Less cost of Common Stock in treasury | ||||||||
| (795,335 shares in 2007 and | ||||||||
| 646,544 shares in 2006 | (12,331 | ) | (7,504 | ) | ||||
| Total shareholders’ equity | 319,509 | 301,323 | ||||||
| Total liabilities and shareholders’ equity | $ | 698,383 | $ | 587,234 | ||||
See accompanying notes.
3138
THE MARCUS CORPORATION
CONSOLIDATED STATEMENTS OF EARNINGS
(in thousands, except per share data)
| Year ended | Year ended | |||||||||||||||||||||
|---|---|---|---|---|---|---|---|---|---|---|---|---|---|---|---|---|---|---|---|---|---|---|
| May 26, 2005 | May 27, 2004 | May 29, 2003 | May 31, 2007 | May 25, 2006 | May 26, 2005 | |||||||||||||||||
| REVENUES: | ||||||||||||||||||||||
| Rooms and telephone | $ | 56,778 | $ | 55,095 | $ | 51,614 | $ | 88,369 | $ | 75,871 | $ | 56,778 | ||||||||||
| Theatre admissions | 96,157 | 101,144 | 98,811 | 98,184 | 93,429 | 96,157 | ||||||||||||||||
| Theatre concessions | 45,785 | 46,696 | 45,590 | 49,018 | 45,496 | 45,785 | ||||||||||||||||
| Food and beverage | 36,576 | 34,940 | 31,607 | 49,183 | 41,162 | 36,576 | ||||||||||||||||
| Other revenues | 37,411 | 37,056 | 35,192 | 42,877 | 33,286 | 31,762 | ||||||||||||||||
| Total revenues | 272,707 | 274,931 | 262,814 | 327,631 | 289,244 | 267,058 | ||||||||||||||||
COSTS AND EXPENSES: | ||||||||||||||||||||||
| Rooms and telephone | 22,726 | 21,694 | 20,863 | 32,949 | 27,852 | 22,726 | ||||||||||||||||
| Theatre operations | 75,560 | 77,944 | 76,371 | 81,085 | 73,527 | 75,560 | ||||||||||||||||
| Theatre concessions | 9,896 | 10,209 | 10,198 | 10,853 | 9,672 | 9,896 | ||||||||||||||||
| Food and beverage | 28,640 | 27,046 | 24,561 | 38,505 | 31,461 | 28,640 | ||||||||||||||||
| Advertising and marketing | 15,811 | 15,653 | 14,759 | 19,608 | 16,446 | 13,442 | ||||||||||||||||
| Administrative | 26,644 | 24,662 | 22,456 | 34,464 | 29,001 | 26,084 | ||||||||||||||||
| Depreciation and amortization | 24,595 | 24,948 | 25,082 | 26,913 | 26,131 | 24,503 | ||||||||||||||||
| Rent (Note 8) | 1,989 | 1,845 | 1,905 | |||||||||||||||||||
| Rent(Note 9) | 3,413 | 3,630 | 1,989 | |||||||||||||||||||
| Property taxes | 8,158 | 7,984 | 7,785 | 9,473 | 10,395 | 8,145 | ||||||||||||||||
| Preopening expenses | 816 | 173 | 60 | 5,293 | 805 | 816 | ||||||||||||||||
| Other operating expenses | 20,393 | 20,449 | 19,646 | 23,936 | 20,784 | 16,355 | ||||||||||||||||
| Total costs and expenses | 235,228 | 232,607 | 223,686 | 286,492 | 249,704 | 228,156 | ||||||||||||||||
OPERATING INCOME | 37,479 | 42,324 | 39,128 | 41,139 | 39,540 | 38,902 | ||||||||||||||||
OTHER INCOME (EXPENSE): | ||||||||||||||||||||||
| Investment income | 5,960 | 1,787 | 2,390 | 3,110 | 7,863 | 6,187 | ||||||||||||||||
| Interest expense | (14,874 | ) | (16,529 | ) | (19,191 | ) | (13,921 | ) | (14,397 | ) | (14,874 | ) | ||||||||||
| Gain on disposition of property and equipment | 2,195 | 2,778 | 2,398 | |||||||||||||||||||
| Gain on disposition of property, equipment | ||||||||||||||||||||||
| and other assets | 14,541 | 1,749 | 2,195 | |||||||||||||||||||
| Equity losses from unconsolidated joint ventures, | ||||||||||||||||||||||
| net(Note 10) | (1,366 | ) | (1,868 | ) | (1,090 | ) | ||||||||||||||||
| (6,719 | ) | (11,964 | ) | (14,403 | ) | 2,364 | (6,653 | ) | (7,582 | ) | ||||||||||||
EARNINGS FROM CONTINUING OPERATIONS | ||||||||||||||||||||||
| BEFORE INCOME TAXES | 30,760 | 30,360 | 24,725 | |||||||||||||||||||
| INCOME TAXES(Note 7) | 11,522 | 11,894 | 9,664 | |||||||||||||||||||
EARNINGS FROM CONTINUING OPERATIONS BEFORE INCOME TAXES | 43,503 | 32,887 | 31,320 | |||||||||||||||||||
| INCOME TAXES(Note 8) | 9,576 | 10,419 | 11,742 | |||||||||||||||||||
| EARNINGS FROM CONTINUING OPERATIONS | 19,238 | 18,466 | 15,061 | 33,927 | 22,468 | 19,578 | ||||||||||||||||
See accompanying notes.
39
THE MARCUS CORPORATION
CONSOLIDATED STATEMENTS OF EARNINGS (continued)
(in thousands, except per share data)
| Year ended | |||||||||||
|---|---|---|---|---|---|---|---|---|---|---|---|
| May 31, 2007 | May 25, 2006 | May 26, 2005 | |||||||||
| DISCONTINUED OPERATIONS(Note 3): | |||||||||||
| Income (loss) from discontinued operations, net of income | |||||||||||
| taxes (benefit) of $(365), $(960) and $858 in 2007, | |||||||||||
| 2006 and 2005, respectively | $ | (515 | ) | $ | (1,905 | ) | $ | 1,322 | |||
| Gain (loss) on sale of discontinued operations, net of | |||||||||||
| income taxes of $335, $3,885 and $50,856 in 2007, 2006 | |||||||||||
| and 2005, respectively | (115 | ) | 7,708 | 78,321 | |||||||
| EARNINGS (LOSSES) FROM DISCONTINUED OPERATIONS | (630 | ) | 5,803 | 79,643 | |||||||
| NET EARNINGS | $ | 33,297 | $ | 28,271 | $ | 99,221 | |||||
EARNINGS PER SHARE FROM CONTINUING OPERATIONS- BASIC: | |||||||||||
| Common Stock | $ | 1.15 | $ | 0.76 | $ | 0.67 | |||||
| Class B Common Stock | 1.04 | 0.68 | 0.60 | ||||||||
EARNINGS (LOSS) PER SHARE FROM DISCONTINUED OPERATIONS - BASIC: | |||||||||||
| Common Stock | $ | (0.02 | ) | $ | 0.20 | $ | 2.75 | ||||
| Class B Common Stock | (0.02 | ) | 0.18 | 2.42 | |||||||
NET EARNINGS PER SHARE - BASIC: | |||||||||||
| Common Stock | $ | 1.13 | $ | 0.96 | $ | 3.42 | |||||
| Class B Common Stock | 1.02 | 0.86 | 3.02 | ||||||||
EARNINGS PER SHARE FROM CONTINUING OPERATIONS- DILUTED: | |||||||||||
| Common Stock | $ | 1.10 | $ | 0.73 | $ | 0.64 | |||||
| Class B Common Stock | 1.03 | 0.67 | 0.59 | ||||||||
EARNINGS (LOSS) PER SHARE FROM DISCONTINUED OPERATIONS - DILUTED: | |||||||||||
| Common Stock | $ | (0.02 | ) | $ | 0.18 | $ | 2.61 | ||||
| Class B Common Stock | (0.02 | ) | 0.18 | 2.40 | |||||||
NET EARNINGS PER SHARE - DILUTED: | |||||||||||
| Common Stock | $ | 1.08 | $ | 0.91 | $ | 3.25 | |||||
| Class B Common Stock | 1.01 | 0.85 | 2.99 | ||||||||
See accompanying notes.
40
THE MARCUS CORPORATION
CONSOLIDATED STATEMENTS OF SHAREHOLDERS’ EQUITY
(in thousands, except per share data)
| Common Stock | Class B Common Stock | Capital In Excess of Par | Retained Earnings | Accumulated Other Comprehensive Income (Loss) | Unearned Compensation on Non-vested Stock | Treasury Stock | Total | |||||||||||||||||||
|---|---|---|---|---|---|---|---|---|---|---|---|---|---|---|---|---|---|---|---|---|---|---|---|---|---|---|
| BALANCES AT MAY 27, 2004 | $ | 21,866 | $ | 9,324 | $ | 42,952 | $ | 333,171 | $ | (289 | ) | $ | (630 | ) | $ | (12,671 | ) | $ | 393,723 | |||||||
| Cash dividends: | ||||||||||||||||||||||||||
| $.20 per share Class B Common Stock | -- | -- | -- | (1,831 | ) | -- | -- | -- | (1,831 | ) | ||||||||||||||||
| $.22 per share Common Stock | -- | -- | -- | (4,620 | ) | -- | -- | -- | (4,620 | ) | ||||||||||||||||
| Exercise of stock options | -- | -- | 1,885 | -- | -- | -- | 4,845 | 6,730 | ||||||||||||||||||
| Purchase of treasury stock | -- | -- | -- | -- | -- | -- | (518 | ) | (518 | ) | ||||||||||||||||
| Savings and profit-sharing contribution | -- | -- | 338 | -- | -- | -- | 221 | 559 | ||||||||||||||||||
| Reissuance of treasury stock | -- | -- | 134 | -- | -- | -- | 113 | 247 | ||||||||||||||||||
| Issuance of non-vested stock | -- | -- | 98 | -- | -- | -- | 75 | 173 | ||||||||||||||||||
| Amortization of unearned compensation on | ||||||||||||||||||||||||||
| non-vested stock | -- | -- | -- | -- | -- | 107 | -- | 107 | ||||||||||||||||||
| Cancellation of non-vested stock | -- | -- | (39 | ) | -- | -- | 110 | (71 | ) | -- | ||||||||||||||||
| Acceleration of stock option vesting period | -- | -- | 113 | -- | -- | -- | -- | 113 | ||||||||||||||||||
| Conversions of Class B Common Stock | 233 | (233 | ) | -- | -- | -- | -- | -- | -- | |||||||||||||||||
| Components of comprehensive income: | ||||||||||||||||||||||||||
| Net earnings | -- | -- | -- | 99,221 | -- | -- | -- | 99,221 | ||||||||||||||||||
| Change in unrealized gain on available for | ||||||||||||||||||||||||||
| sale investments, net of tax effect of $80 | -- | -- | -- | -- | (121 | ) | -- | -- | (121 | ) | ||||||||||||||||
| Amortization of loss on swap agreement, net | ||||||||||||||||||||||||||
| of tax effect of $173 (Note 5) | -- | -- | -- | -- | 259 | -- | -- | 259 | ||||||||||||||||||
| Minimum pension liability, net of tax | ||||||||||||||||||||||||||
| benefit of $250 | -- | -- | -- | -- | (381 | ) | -- | -- | (381 | ) | ||||||||||||||||
| Total comprehensive income | 98,978 | |||||||||||||||||||||||||
| BALANCES AT MAY 26, 2005 | 22,099 | 9,091 | 45,481 | 425,941 | (532 | ) | (413 | ) | (8,006 | ) | 493,661 | |||||||||||||||
| Cash dividends: | ||||||||||||||||||||||||||
| $.24 per share Class B Common Stock | -- | -- | -- | (2,137 | ) | -- | -- | -- | (2,137 | ) | ||||||||||||||||
| $.26 per share Common Stock | -- | -- | -- | (5,592 | ) | -- | -- | -- | (5,592 | ) | ||||||||||||||||
| $7.00 per share Class B and Common Stock | ||||||||||||||||||||||||||
| special dividend | -- | -- | -- | (214,576 | ) | -- | -- | -- | (214,576 | |||||||||||||||||
| Exercise of stock options | -- | -- | (19 | ) | -- | -- | -- | 6,507 | 6,488 | |||||||||||||||||
| Purchase of treasury stock | -- | -- | -- | -- | -- | -- | (6,492 | ) | ||||||||||||||||||
| Savings and profit-sharing contribution | -- | -- | 224 | -- | -- | -- | 292 | 516 | ||||||||||||||||||
| Reissuance of treasury stock | -- | -- | 127 | -- | -- | -- | 120 | 247 | ||||||||||||||||||
| Issuance of non-vested stock | -- | -- | 98 | -- | -- | -- | 75 | 173 | ||||||||||||||||||
| Amortization of unearned compensation on | ||||||||||||||||||||||||||
| non-vested stock | -- | -- | -- | -- | -- | 120 | -- | 120 | ||||||||||||||||||
| Conversions of Class B Common Stock | 137 | (137 | ) | -- | -- | -- | -- | -- | -- | |||||||||||||||||
| Components of comprehensive income: | ||||||||||||||||||||||||||
| Net earnings | -- | -- | -- | 28,271 | -- | -- | -- | 28,271 | ||||||||||||||||||
| Change in unrealized gain on available for | ||||||||||||||||||||||||||
| sale investments, net of tax effect of $63 | -- | -- | -- | -- | 93 | -- | -- | 93 | ||||||||||||||||||
| Amortization of loss on swap agreement, net | ||||||||||||||||||||||||||
| of tax effect of $73 (Note 5) | -- | -- | -- | -- | 111 | -- | -- | 111 | ||||||||||||||||||
| Minimum pension liability, net of tax effect | ||||||||||||||||||||||||||
| of $288 | -- | -- | -- | -- | 440 | -- | -- | 440 | ||||||||||||||||||
| Total comprehensive income | 28,915 | |||||||||||||||||||||||||
| BALANCES AT MAY 26, 2006 | 22,236 | 8,954 | 45,911 | 231,907 | 112 | (293 | ) | (7,504 | ) | 301,323 | ||||||||||||||||
| Cash dividends: | ||||||||||||||||||||||||||
| $.29 per share Class B Common Stock | -- | -- | -- | (2,599 | ) | -- | -- | -- | (2,599 | ) | ||||||||||||||||
| $.32 per share Common Stock | -- | -- | -- | (6,878 | ) | -- | -- | -- | (6,878 | ) | ||||||||||||||||
| Exercise of stock options | -- | -- | (671 | ) | -- | -- | -- | 2,735 | 2,064 | |||||||||||||||||
| Purchase of treasury stock | -- | -- | -- | -- | -- | -- | (8,117 | ) | (8,117 | ) | ||||||||||||||||
| Savings and profit-sharing contribution | -- | -- | 176 | -- | -- | -- | 273 | 449 | ||||||||||||||||||
| Reissuance of treasury stock | -- | -- | 112 | -- | -- | -- | 159 | 271 | ||||||||||||||||||
| Issuance of non-vested stock | -- | -- | (123 | ) | -- | -- | -- | 123 | -- | |||||||||||||||||
| Share-based compensation | -- | -- | 1,326 | -- | -- | -- | -- | 1,326 | ||||||||||||||||||
| Reclassification of unearned compensation on | ||||||||||||||||||||||||||
| non-vested stock | -- | -- | (293 | ) | -- | -- | 293 | -- | -- | |||||||||||||||||
| Conversions of Class B Common Stock | 64 | (64 | ) | -- | -- | -- | -- | -- | -- | |||||||||||||||||
| Components of comprehensive income: | ||||||||||||||||||||||||||
| Net earnings | -- | -- | -- | 33,297 | -- | -- | -- | 33,297 | ||||||||||||||||||
| Change in unrealized gain on available for | ||||||||||||||||||||||||||
| sale investments, net of tax effect of $78 | -- | -- | -- | -- | 117 | -- | -- | 117 | ||||||||||||||||||
| Minimum pension liability, net of tax effect | ||||||||||||||||||||||||||
| of $7 | -- | -- | -- | -- | 11 | -- | -- | 11 | ||||||||||||||||||
| Total comprehensive income | 33,425 | |||||||||||||||||||||||||
| Adjustment to initially apply SFAS No. 158, | ||||||||||||||||||||||||||
| net of taxes of $1,170 | -- | -- | -- | -- | (1,755 | ) | -- | -- | (1,755 | ) | ||||||||||||||||
| BALANCES AT MAY 31, 2007 | $ | 22,300 | $ | 8,890 | $ | 46,438 | $ | 255,727 | $ | (1,515 | ) | $ | -- | $ | (12,331 | ) | $ | 319,509 | ||||||||
See accompanying notes.
3241
THE MARCUS CORPORATION
CONSOLIDATED STATEMENTS OF EARNINGS (continued)(in thousands, except per share data)
| Year ended | |||||||||||
|---|---|---|---|---|---|---|---|---|---|---|---|
| May 26, 2005 | May 27, 2004 | May 29, 2003 | |||||||||
| DISCONTINUED OPERATIONS(Note 2): | |||||||||||
| Income from discontinued operations, net of | |||||||||||
| income taxes of $1,079, $3,957 and $2,725 in | |||||||||||
| 2005, 2004 and 2003, respectively | $ | 1,662 | $ | 6,145 | $ | 4,246 | |||||
| Gain on sale of discontinued operations, net of | |||||||||||
| income taxes of $50,856 in 2005 and $801 in | |||||||||||
| 2003 | 78,321 | -- | 1,249 | ||||||||
| EARNINGS FROM DISCONTINUED OPERATIONS | 79,983 | 6,145 | 5,495 | ||||||||
| NET EARNINGS | $ | 99,221 | $ | 24,611 | $ | 20,556 | |||||
EARNINGS PER COMMON SHARE - BASIC: | |||||||||||
| Continuing operations | $ | 0.64 | $ | 0.62 | $ | 0.51 | |||||
| Discontinued operations | 2.65 | 0.21 | 0.19 | ||||||||
| Net earnings per share | $ | 3.29 | $ | 0.83 | $ | 0.70 | |||||
EARNINGS PER COMMON SHARE - DILUTED: | |||||||||||
| Continuing operations | $ | 0.63 | $ | 0.62 | $ | 0.51 | |||||
| Discontinued operations | 2.62 | 0.20 | 0.19 | ||||||||
| Net earnings per share | $ | 3.25 | $ | 0.82 | $ | 0.70 | |||||
See accompanying notes.
33
CONSOLIDATED STATEMENTS OF SHAREHOLDERS’ EQUITY(in thousands, except per share data)
| Common Stock | Class B Common Stock | Capital in Excess of Par | Retained Earnings | Accumulated Other Comprehensive Income (Loss) | Unearned Compensation on Restricted Stock | Treasury Stock | Total | |||||||||||||||||||
|---|---|---|---|---|---|---|---|---|---|---|---|---|---|---|---|---|---|---|---|---|---|---|---|---|---|---|
| BALANCES AT MAY 30, 2002 | $ | 21,584 | $ | 9,606 | $ | 41,523 | $ | 300,623 | $ | (1,866 | ) | $ | -- | $ | (17,402 | ) | $ | 354,068 | ||||||||
| Cash dividends: | ||||||||||||||||||||||||||
| $.20 per share Class B Common Stock | -- | -- | -- | (1,905 | ) | -- | -- | -- | (1,905 | ) | ||||||||||||||||
| $.22 per share Common Stock | -- | -- | -- | (4,371 | ) | -- | -- | -- | (4,371 | ) | ||||||||||||||||
| Exercise of stock options | -- | -- | (59 | ) | -- | -- | -- | 1,408 | 1,349 | |||||||||||||||||
| Purchase of treasury stock | -- | -- | -- | -- | -- | -- | (386 | ) | (386 | ) | ||||||||||||||||
| Savings and profit-sharing contribution | -- | -- | 208 | -- | -- | -- | 446 | 654 | ||||||||||||||||||
| Reissuance of treasury stock | -- | -- | 79 | -- | -- | -- | 171 | 250 | ||||||||||||||||||
| Conversions of Class B Common Stock | 100 | (100 | ) | -- | -- | -- | -- | -- | -- | |||||||||||||||||
| Components of comprehensive income: | -- | -- | -- | -- | -- | -- | -- | -- | ||||||||||||||||||
| Net earnings | -- | -- | -- | 20,556 | -- | -- | -- | 20,556 | ||||||||||||||||||
| Change in unrealized loss on available | ||||||||||||||||||||||||||
| for sale investments, net of tax | -- | -- | -- | -- | 179 | -- | -- | 179 | ||||||||||||||||||
| effect of $118 | ||||||||||||||||||||||||||
| Amortization of loss on swap | ||||||||||||||||||||||||||
| agreement, net of tax effect of $471 | -- | -- | -- | -- | 706 | -- | -- | 706 | ||||||||||||||||||
| (Note 4) | ||||||||||||||||||||||||||
| Minimum pension liability, net of tax | ||||||||||||||||||||||||||
| benefit of $787 | -- | -- | -- | -- | (1,200 | ) | -- | -- | (1,200 | ) | ||||||||||||||||
| Total comprehensive income | 20,241 | |||||||||||||||||||||||||
| BALANCES AT MAY 29, 2003 | 21,684 | 9,506 | 41,751 | 314,903 | (2,181 | ) | -- | (15,763 | ) | 369,900 | ||||||||||||||||
| Cash dividends: | ||||||||||||||||||||||||||
| $.20 per share Class B Common Stock | -- | -- | -- | (1,875 | ) | -- | -- | -- | (1,875 | ) | ||||||||||||||||
| $.22 per share Common Stock | -- | -- | -- | (4,468 | ) | -- | -- | -- | (4,468 | ) | ||||||||||||||||
| Exercise of stock options | -- | -- | 537 | -- | -- | -- | 2,597 | 3,134 | ||||||||||||||||||
| Purchase of treasury stock | -- | -- | -- | -- | -- | -- | (512 | ) | (512 | ) | ||||||||||||||||
| Savings and profit-sharing contribution | -- | -- | 302 | -- | -- | -- | 390 | 692 | ||||||||||||||||||
| Reissuance of treasury stock | -- | -- | 99 | -- | -- | -- | 149 | 248 | ||||||||||||||||||
| Issuance of Restricted Stock | -- | -- | 263 | -- | -- | (731 | ) | 468 | -- | |||||||||||||||||
| Amortization of unearned compensation on | ||||||||||||||||||||||||||
| restricted stock | -- | -- | -- | -- | -- | 101 | -- | 101 | ||||||||||||||||||
| Conversions of Class B Common Stock | 182 | (182 | ) | -- | -- | -- | -- | -- | -- | |||||||||||||||||
| Components of comprehensive income: | -- | -- | ||||||||||||||||||||||||
| Net earnings | -- | -- | -- | 24,611 | -- | -- | -- | 24,611 | ||||||||||||||||||
| Change in unrealized gain on available | ||||||||||||||||||||||||||
| for sale investments, net of tax effect | -- | -- | -- | -- | 151 | -- | -- | 151 | ||||||||||||||||||
| of $101 | ||||||||||||||||||||||||||
| Amortization of loss on swap | ||||||||||||||||||||||||||
| agreement, net of tax effect of $269 | -- | -- | -- | -- | 402 | -- | -- | 402 | ||||||||||||||||||
| (Note 4) | ||||||||||||||||||||||||||
| Minimum pension liability, net of tax | ||||||||||||||||||||||||||
| effect of $880 | -- | -- | -- | -- | 1,339 | -- | -- | 1,339 | ||||||||||||||||||
| Total comprehensive income | 26,503 | |||||||||||||||||||||||||
| BALANCES AT MAY 27, 2004 | 21,866 | 9,324 | 42,952 | 333,171 | (289 | ) | (630 | ) | (12,671 | ) | 393,723 | |||||||||||||||
| Cash dividends: | ||||||||||||||||||||||||||
| $.20 per share Class B Common Stock | -- | -- | -- | (1,831 | ) | -- | -- | -- | (1,831 | ) | ||||||||||||||||
| $.22 per share Common Stock | -- | -- | -- | (4,620 | ) | -- | -- | -- | (4,620 | ) | ||||||||||||||||
| Exercise of stock options | -- | -- | 1,885 | -- | -- | -- | 4,845 | 6,730 | ||||||||||||||||||
| Purchase of treasury stock | -- | -- | -- | -- | -- | -- | (518 | ) | (518 | ) | ||||||||||||||||
| Savings and profit-sharing contribution | -- | -- | 338 | -- | -- | -- | 221 | 559 | ||||||||||||||||||
| Reissuance of treasury stock | -- | -- | 134 | -- | -- | -- | 113 | 247 | ||||||||||||||||||
| Issuance of Restricted Stock | -- | -- | 98 | -- | -- | -- | 75 | 173 | ||||||||||||||||||
| Amortization of unearned compensation on | ||||||||||||||||||||||||||
| Restricted Stock | -- | -- | -- | -- | -- | 107 | -- | 107 | ||||||||||||||||||
| Cancellation of Restricted Stock | -- | -- | (39 | ) | -- | -- | 110 | (71 | ) | -- | ||||||||||||||||
| Acceleration of stock option vesting period | -- | -- | 113 | -- | -- | -- | -- | 113 | ||||||||||||||||||
| Conversions of Class B Common Stock | 233 | (233 | ) | -- | -- | -- | -- | -- | -- | |||||||||||||||||
| Components of comprehensive income: | ||||||||||||||||||||||||||
| Net earnings | -- | -- | -- | 99,221 | -- | -- | -- | 99,221 | ||||||||||||||||||
| Change in unrealized gain on available | ||||||||||||||||||||||||||
| for sale investments, net of tax | ||||||||||||||||||||||||||
| effect of $80 | -- | -- | -- | -- | (121 | ) | -- | -- | (121 | ) | ||||||||||||||||
| Amortization of loss on swap | ||||||||||||||||||||||||||
| agreement, net of tax effect of $173 | ||||||||||||||||||||||||||
| (Note 4) | -- | -- | -- | -- | 259 | -- | -- | 259 | ||||||||||||||||||
| Minimum pension liability, net of tax | ||||||||||||||||||||||||||
| benefit of $250 | -- | -- | -- | -- | (381 | ) | -- | -- | (381 | ) | ||||||||||||||||
| Total comprehensive income | 98,978 | |||||||||||||||||||||||||
| BALANCES AT MAY 26, 2005 | $ | 22,099 | $ | 9,091 | $ | 45,481 | $ | 425,941 | $ | (532 | ) | $ | (413 | ) | $ | (8,006 | ) | $ | 493,661 | |||||||
See accompanying notes.
34
CONSOLIDATED STATEMENTS OF CASH FLOWS
(in thousands)
| Year ended | Year ended | |||||||||||||||||||||
|---|---|---|---|---|---|---|---|---|---|---|---|---|---|---|---|---|---|---|---|---|---|---|
| May 26, 2005 | May 27, 2004 | May 29, 2003 | May 31, 2007 | May 25, 2006 | May 26, 2005 | |||||||||||||||||
| OPERATING ACTIVITIES | ||||||||||||||||||||||
| Net earnings | $ | 99,221 | $ | 24,611 | $ | 20,556 | $ | 33,297 | $ | 28,271 | $ | 99,221 | ||||||||||
| Adjustments to reconcile net earnings to net cash provided by | ||||||||||||||||||||||
| operating activities: | ||||||||||||||||||||||
| Adjustments to reconcile net earnings to net cash provided by (used | ||||||||||||||||||||||
| in) operating activities: | ||||||||||||||||||||||
| Losses on loans to and investments in joint ventures | 1,566 | 755 | 1,795 | 1,770 | 1,974 | 1,566 | ||||||||||||||||
| Gain on disposition of property, equipment and other | (2,113 | ) | (2,174 | ) | (4,161 | ) | ||||||||||||||||
| assets | ||||||||||||||||||||||
| Gain on disposition of property, equipment and other assets | (8,868 | ) | (1,749 | ) | (2,113 | ) | ||||||||||||||||
| Gain on sale of condominium units | (5,893 | ) | -- | -- | ||||||||||||||||||
| Gain on sale of limited-service lodging division | (123,283 | ) | -- | -- | -- | (11,728 | ) | (123,283 | ) | |||||||||||||
| Gain on sale of Miramonte Resort | (5,894 | ) | -- | -- | ||||||||||||||||||
| Loss (gain) on sale of Miramonte Resort | -- | 135 | (5,894 | ) | ||||||||||||||||||
| Impairment of property and equipment | -- | 501 | -- | |||||||||||||||||||
| Distributions from joint ventures | 6,638 | 296 | 1,434 | 184 | 373 | 6,638 | ||||||||||||||||
| Amortization of loss on swap agreement | 432 | 671 | 1,177 | -- | 184 | 432 | ||||||||||||||||
| Amortization of unearned compensation on Restricted Stock | 107 | 101 | -- | |||||||||||||||||||
| Amortization of favorable lease right | (9 | ) | 676 | -- | ||||||||||||||||||
| Depreciation and amortization | 28,402 | 46,036 | 45,365 | 26,925 | 26,274 | 28,402 | ||||||||||||||||
| Stock compensation expense | 1,326 | 120 | 107 | |||||||||||||||||||
| Deferred income taxes | (15,159 | ) | 1,252 | 460 | 7,405 | (3,598 | ) | (15,159 | ) | |||||||||||||
| Deferred compensation and other | 663 | 1,423 | 3,513 | 2,007 | 240 | 663 | ||||||||||||||||
| Contribution of the Company's stock to savings and | ||||||||||||||||||||||
| profit-sharing plan | 559 | 692 | 654 | 449 | 516 | 559 | ||||||||||||||||
| Loss on available for sale securities | -- | -- | 494 | |||||||||||||||||||
| Changes in operating assets and liabilities: | ||||||||||||||||||||||
| Accounts and notes receivable | 1,555 | 13,756 | (2,577 | ) | (445 | ) | (4,431 | ) | 1,555 | |||||||||||||
| Real estate and development costs | 1,453 | (1,100 | ) | (2,806 | ) | 3,173 | 1,541 | 1,453 | ||||||||||||||
| Condominium units held for sale | (692 | ) | -- | -- | ||||||||||||||||||
| Other current assets | 707 | (557 | ) | (1,259 | ) | 7,794 | (6,343 | ) | 707 | |||||||||||||
| Accounts payable | (1,324 | ) | (3,207 | ) | 3,512 | 4,711 | 4,395 | (1,324 | ) | |||||||||||||
| Income taxes | (4,092 | ) | 4,344 | 2,892 | (3,643 | ) | 194 | (4,092 | ) | |||||||||||||
| Taxes other than income taxes | (1,254 | ) | 35 | (265 | ) | 415 | 2,375 | (1,254 | ) | |||||||||||||
| Accrued compensation | (1,996 | ) | 1,517 | 542 | (724 | ) | 647 | (1,996 | ) | |||||||||||||
| Other accrued liabilities | 820 | 3,796 | (252 | ) | (4,326 | ) | (993 | ) | 820 | |||||||||||||
| Total adjustments | (112,213 | ) | 67,636 | 50,518 | 31,559 | 11,303 | (112,213 | ) | ||||||||||||||
| Net cash provided by (used in) operating activities | (12,992 | ) | 92,247 | 71,074 | 64,856 | 39,574 | (12,992 | ) | ||||||||||||||
INVESTING ACTIVITIES | ||||||||||||||||||||||
| Capital expenditures | (63,431 | ) | (50,915 | ) | (26,004 | ) | (111,102 | ) | (35,702 | ) | (63,431 | ) | ||||||||||
| Purchase of theatres, net of cash acquired | (75,650 | ) | -- | -- | ||||||||||||||||||
| Purchase of hotels, net of cash acquired | -- | (39,830 | ) | -- | ||||||||||||||||||
| Net proceeds from disposals of property, equipment and other assets | 4,154 | 8,751 | 11,752 | 32,194 | 6,902 | 4,154 | ||||||||||||||||
| Net proceeds from sale of condominium units | 95,695 | -- | -- | |||||||||||||||||||
| Net proceeds from sale of limited-service lodging division | 365,447 | -- | -- | -- | 24,979 | 365,447 | ||||||||||||||||
| Net proceeds from sale of Miramonte Resort | 28,503 | -- | -- | -- | -- | 28,503 | ||||||||||||||||
| Proceeds from sale of discontinued operations held by intermediaries | (28,552 | ) | -- | -- | ||||||||||||||||||
| Net proceeds received from (held by) intermediaries | (3,997 | ) | 26,800 | (28,552 | ) | |||||||||||||||||
| Contributions received from Oklahoma City | 3,972 | 7,372 | -- | |||||||||||||||||||
| Decrease (increase) in other assets | 446 | 798 | (2,509 | ) | (1,996 | ) | (8,608 | ) | 446 | |||||||||||||
| Purchase of interest in joint ventures | (4,276 | ) | (4,500 | ) | (649 | ) | (11,057 | ) | (1,685 | ) | (4,276 | ) | ||||||||||
| Payment on joint venture debt guarantee | -- | (930 | ) | -- | ||||||||||||||||||
| Cash received from (advanced to) joint ventures | 145 | 102 | (1,819 | ) | (344 | ) | (684 | ) | 145 | |||||||||||||
| Net cash provided by (used in) investing activities | 302,436 | (46,694 | ) | (19,229 | ) | (72,285 | ) | (20,456 | ) | 302,436 | ||||||||||||
FINANCING ACTIVITIES | ||||||||||||||||||||||
| Debt transactions: | ||||||||||||||||||||||
| Net proceeds from issuance of notes payable and long-term debt | 13,550 | 10,840 | 551 | 111,448 | 5,558 | 13,550 | ||||||||||||||||
| Principal payments on notes payable and long-term debt | (53,746 | ) | (49,330 | ) | (46,908 | ) | (111,270 | ) | (27,317 | ) | (53,746 | ) | ||||||||||
| Equity transactions: | ||||||||||||||||||||||
| Treasury stock transactions, except for stock options | (98 | ) | (264 | ) | (136 | ) | (7,846 | ) | (6,072 | ) | (98 | ) | ||||||||||
| Exercise of stock options | 6,730 | 3,134 | 1,349 | 2,064 | 6,488 | 6,730 | ||||||||||||||||
| Dividends paid | (6,451 | ) | (6,343 | ) | (6,276 | ) | (9,477 | ) | (222,305 | ) | (6,451 | ) | ||||||||||
| Net cash used in financing activities | (40,015 | ) | (41,963 | ) | (51,420 | ) | (15,081 | ) | (243,648 | ) | (40,015 | ) | ||||||||||
| Net increase in cash and cash equivalents | 249,429 | 3,590 | 425 | |||||||||||||||||||
| Net increase (decrease) in cash and cash equivalents | (22,510 | ) | (224,530 | ) | 249,429 | |||||||||||||||||
| Cash and cash equivalents at beginning of year | 9,629 | 6,039 | 5,614 | 34,528 | 259,058 | 9,629 | ||||||||||||||||
| Cash and cash equivalents at end of year | $ | 259,058 | * | $ | 9,629 | ** | $ | 6,039 | *** | $ | 12,018 | $ | 34,528 | $ | 259,058 | * | ||||||
*Includes $1 of cash included in assets of discontinued operations**Includes $190 of cash included in assets of discontinued operations***Includes $351 of cash included in assets of discontinued operations
See accompanying notes.
3542
THE MARCUS CORPORATION
NOTES TO CONSOLIDATED FINANCIAL STATEMENTS
May 26, 2005
Description of Business –The Marcus Corporation and its subsidiaries (the Company) operate principally in two business segments:
| Theatres: Operates multiscreen motion picture theatres in Wisconsin, Illinois, Ohio, Iowa, Minnesota and |
| Hotels and Resorts: Owns and operates full service hotels and resorts in Wisconsin, Illinois, Oklahoma and Missouri and manages full service hotels, resorts and other properties in Wisconsin, Ohio, Minnesota, Texas, Arizona, Missouri, Nevada and |
Principles of Consolidation –The consolidated financial statements include the accounts of The Marcus Corporation and all of its subsidiaries. Investments in affiliates which are 50% or less owned by the Company for which the Company exercises significant influence or for which the affiliate maintains separate equity accounts are accounted for on the equity method. All intercompany accounts and transactions have been eliminated in consolidation.
Fiscal Year –The Company reports on a 52/53-week year ending the last Thursday of May. All segments hadFiscal 2007 was a 53-week year and fiscal 2006 and 2005 were 52-week year in fiscal 2005, 2004 and 2003.years.
Use of Estimates –The preparation of financial statements in conformity with U.S. generally accepted accounting principles requires management to make estimates and assumptions that affect the amounts reported in the financial statements and accompanying notes. Actual results could differ from those estimates.
Cash Equivalents – The Company considers all highly liquid investments with maturities of three months or less when purchased to be cash equivalents. Cash equivalents are carried at cost, which approximates fair value.
Financial Instruments –The carrying value of the Company’s financial instruments (including cash and cash equivalents, cash held by intermediaries, accounts receivable, notes receivable, investments and accounts and notes payable) approximates fair value. The fair value of the Company’s $172,685,000$119,998,000 of senior notes is approximately $183,839,000$122,374,000 at May 26, 2005,31, 2007, determined based upon current market interest rates for financial instruments with a similar average remaining life. The carrying amounts of the Company’s remaining long-term debt based on the respective rates and prepayment provisions of the senior notes due May 31, 2005, approximate their fair value.values.
Accounts and Notes Receivable –The Company evaluates the collectibility of its accounts and notes receivable based on a number of factors. For larger accounts, an allowance for doubtful accounts is recorded based on the applicable parties’ ability and likelihood to pay based on management’s review of the facts. For all other accounts, the Company recognizes an allowance based on length of time the receivable is past due based on historical experience and industry practice.
3643
THE MARCUS CORPORATION
NOTES TO CONSOLIDATED FINANCIAL STATEMENTS (continued)
May 31, 2007
1. Description of Business and Summary of Significant Accounting Policies (continued)
Long-Lived Assets– The Company periodically considers whether indicators of impairment of long-lived assets held for use are present. If such indicators are present, the Company determines whether the sum of the estimated undiscounted future cash flows attributable to such assets is less than their carrying amounts. The Company recognizes any impairment losses based on the excess of the carrying amount of the assets over their fair value. For the purpose of determining fair value, defined as the amount at which an asset or group of assets could be bought or sold in a current transaction between willing parties, the Company utilizes currently available market valuations of similar assets in its respective industries, often expressed as a given multiple of operating cash flow. The Company evaluated the ongoing value of its property and equipment and other long-lived assets as of May 26, 2005,31, 2007, May 27, 2004,25, 2006, and May 29, 2003,26, 2005, and determined that there was no significant impact on the Company’s results of operations, other than the joint venture investmenta $501,000 before-tax impairment charge duringrecorded in fiscal 2003 described in Note 9.2006 related to closed theatres.
Intangible AssetsGoodwill –The Company reviews goodwill and other intangible assets for impairment annually or more frequently if certain indicators arise. The Company performed an annual impairment test as of the Company’s year-end date in fiscal 2005, 2004,2007, 2006 and 20032005 and deemed that no impairment loss was necessary.indicated. The Company’s goodwill relates to its Theatres segment and represents the excess of the acquisition cost over the fair value of the assets acquired.
Capitalization of Interest –The Company capitalizes interest during construction periods by adding such interest to the cost of property and equipment.constructed assets. Interest of approximately $835,000, $296,000$856,000 and $91,000$835,000 was capitalized in fiscal 2007 and 2005, 2004 and 2003, respectively. There was no interest capitalized in fiscal 2006.
Investments –Available for sale securities are stated at fair market value, with unrealized gains and losses reported as a component of shareholders’ equity. The cost of securities sold is based upon the specific identification method. Realized gains and losses and declines in value judged to be other-than-temporary are included in investment income (loss).income. The Company evaluates securities for other-than-temporary impairment on a periodic basis and principally considers the type of security, the severity of the decline in fair value, and the duration of the decline in fair value in determining whether a security’s decline in fair value is other-than-temporary. In fiscal 2003, the Company recognized a $494,000 other-than-temporary investment loss on a security whose market value was substantially below cost.
Revenue Recognition –The Company recognizes revenue from its rooms as earned on the close of business each day. Revenues from theatre admissions, concessions and food and beverage sales are recognized at the time of sale. Revenues from advanced ticket and gift certificate sales are recorded as deferred revenue and are recognized when tickets or gift certificates are used.
The following are included in other revenues:
37
Managementredeemed. Other revenues include management fees for theatres and hotels under management agreementsagreements. The management fees are recognized as earned based on the terms of the agreements and include both base fees and incentive fees. Revenues do not include sales tax as the Company considers itself a pass-through conduit for collecting and remitting sales taxes.
44
THE MARCUS CORPORATION
NOTES TO CONSOLIDATED FINANCIAL STATEMENTS
May 31, 2007
1. Description of Business and Summary of Significant Accounting Policies (continued)
Revenues from discontinued operations include, in part, sales from a vacation ownership development. Sale of vacation intervals arewere recognized on an accrual basis after a binding sales contract hashad been executed, a 10% minimum down payment is received, the recissionrescission period has expired, construction iswas substantially complete, and certain minimum sales levels havehad been reached. If all the criteria are met except that construction is not substantially complete, revenues are recognized on the percentage-of-completion basis. For sales that do not qualify for either accrual or percentage-of-completion accounting, all revenue is deferred using the deposit method. Deferred revenue is included in other accrued liabilities.
When minimum sales levels are met, revenues are recognized on the percentage-of-completion or accrual methods. Development costs, including construction costs, interest and other carrying costs, which arewere allocated based on relative sales values, are included as real estate and development costsin assets of discontinued operations in the accompanying consolidated balance sheets.
Advertising and Marketing Costs –The Company generally expenses all advertising and marketing costs as incurred.
Depreciation and Amortization –Depreciation and amortization of property and equipment are provided using the straight-line method over the shorter of the following estimated useful lives or any related lease terms:
| Years | |
Land improvements | 15 - 39 |
| Buildings and improvements | 25 - 39 |
| Leasehold improvements | 3 - |
| Furniture, fixtures and equipment | 3 - 20 |
Preopening Expenses –Costs incurred prior to opening new or remodeled facilities are expensed as incurred.
EarningsEarning Per Share – Net earnings per share (EPS) –Basic (EPS)of Common Stock and Class B Common Stock is computed in accordance with Statement of Financial Accounting Standards (SFAS) No. 128,Earnings per Share (SFAS No. 128) using the two-class method. Under the provisions of SFAS No. 128, basic net earnings per share is computed by dividing net earnings by the weighted-average number of common shares outstanding.outstanding less any non-vested stock. Diluted net earnings per share is computed by dividing net earnings by the weighted-average number of common shares outstanding, adjusted for the effect of dilutive stock options and non-vested restricted stock using the treasury method. Convertible Class B Common Stock is reflected on an if-converted basis. The computation of the diluted net earnings per share of Common Stock assumes the conversion of Class B Common Stock, while the diluted net earnings per share of Class B Common Stock does not assume the conversion of those shares.
38Holders of Common Stock are entitled to cash dividends per share equal to 110% of all dividends declared and paid on each share of the Class B Common Stock. As such, and in accordance with Emerging Issues Task Force 03-06,Participating Securities and the Two-Class Method under FASB Statement No. 128(EITF 03-06), the undistributed earnings for each year are allocated based on the proportionate share of entitled cash dividends. Basic earnings per share for fiscal 2006 and 2005 have been presented in accordance with EITF 03-06 for comparative purposes. The computation of diluted net earnings per share of Common Stock assumes the conversion of Class B Common Stock and, as such, the undistributed earnings are equal to net earnings for that computation.
45
THE MARCUS CORPORATION
NOTES TO CONSOLIDATED FINANCIAL STATEMENTS (continued)
May 31, 2007
1. Description of Business and Summary of Significant Accounting Policies (continued)
The following table illustrates the computation of Common Stock and Class B Common Stock basic and diluted earnings per share for earnings from continuing operations and provides a reconciliation of the number of weighted-average basic and diluted shares outstanding:
| Year ended | ||||||||||||||||||||||
|---|---|---|---|---|---|---|---|---|---|---|---|---|---|---|---|---|---|---|---|---|---|---|
| May 26, 2005 | May 27, 2004 | May 29, 2003 | May 31, 2007 | May 25, 2006 | May 26, 2005 | |||||||||||||||||
| (in thousands, except per share data) | (in thousands, except per share data) | |||||||||||||||||||||
| Numerator: | ||||||||||||||||||||||
| Earnings from continuing operations | $ | 19,238 | $ | 18,466 | $ | 15,061 | $ | 33,927 | $ | 22,468 | $ | 19,578 | ||||||||||
Denominator: | ||||||||||||||||||||||
| Denominator for basic EPS | 30,120 | 29,630 | 29,388 | 30,359 | 30,439 | 30,120 | ||||||||||||||||
| Effect of dilutive employee stock options and | ||||||||||||||||||||||
| non-vested restricted stock | 406 | 220 | 161 | |||||||||||||||||||
| Effect of dilutive employee stock options and non-vested | ||||||||||||||||||||||
| restricted stock | 448 | 500 | 406 | |||||||||||||||||||
| Denominator for diluted EPS | 30,526 | 29,850 | 29,549 | 30,807 | 30,939 | 30,526 | ||||||||||||||||
Earnings per share from continuing operations: | ||||||||||||||||||||||
| Basic | $ | 0.64 | $ | 0.62 | $ | 0.51 | ||||||||||||||||
| Diluted | $ | 0.63 | $ | 0.62 | $ | 0.51 | ||||||||||||||||
Earnings per share from continuing operations - Basic: | ||||||||||||||||||||||
| Common Stock | $ | 1.15 | $ | 0.76 | $ | 0.67 | ||||||||||||||||
| Class B Common Stock | $ | 1.04 | $ | 0.68 | $ | 0.60 | ||||||||||||||||
| Earnings per share from continuing operations - Diluted: | ||||||||||||||||||||||
| Common Stock | $ | 1.10 | $ | 0.73 | $ | 0.64 | ||||||||||||||||
| Class B Common Stock | $ | 1.03 | $ | 0.67 | $ | 0.59 | ||||||||||||||||
Options to purchase 4,5005,500 shares, 280,7017,778 shares, and 627,9266,416 shares of common stock at prices ranging from $22.38$22.89 to $23.16, $16.07$23.37, $16.24 to $18.13 per share$17.73, and $14.25$15.70 to $18.13$16.24 per share were outstanding at May 26, 2005,31, 2007, May 27, 200425, 2006, and May 29, 2003,26, 2005, respectively, but were not included in the computation of diluted EPS because the options’ exercise price was greater than the average market price of the common shares, and, therefore, the effect would be antidilutive.
Accumulated Other Comprehensive LossIncome (Loss) – Accumulated other comprehensive lossincome (loss) presented in the accompanying consolidated balance sheets consists of the following, all presented net of tax:
| May 26, 2005 | May 27, 2004 | |||||||
|---|---|---|---|---|---|---|---|---|
| (in thousands) | ||||||||
Unrealized gain on available for sale investments | $ | 30 | $ | 151 | ||||
| Unrecognized loss on interest rate swap agreement | (111 | ) | (370 | ) | ||||
| Minimum pension liability | (451 | ) | (70 | ) | ||||
| $ | (532 | ) | $ | (289 | ) | |||
Stock-Based Compensation –The Company has elected to follow Accounting Principles Board Opinion No. 25, “Accounting for Stock Issued to Employees” (APB No. 25), in accounting for its employee stock options. Under APB No. 25, because the number of shares is fixed and the exercise price of the Company’s employee stock options equals the market price of the underlying stock on the date of grant, no compensation expense is recognized.
Pro forma information regarding net earnings and earnings per share required by Statement of Financial Accounting Standards (SFAS) No. 123, “Accounting for Stock-Based Compensation,” has been determined as if the Company had accounted for its employee stock options under the fair value method of SFAS No. 123. The fair value for these options was estimated at the date of grant using a Black-Scholes option pricing model with the following assumptions: risk-free interest rates of 3.5%, 3.3% and 2.5% for fiscal 2005, 2004 and 2003, respectively; a dividend yield of 1.2%, 1.5% and 1.6% for fiscal 2005, 2004 and 2003, respectively; volatility factors of the expected market price of the Company’s Common Stock of 43% for fiscal 2005, and 45% for fiscal 2004 and 2003; and an expected life of the option of approximately five years in fiscal 2005 and 2004 and six years in fiscal 2003.
39
For purposes of pro forma disclosures, the estimated fair value of the options is amortized to expense over the options’ vesting period. Had compensation cost been determined based upon the fair value at the grant date for awards under the plans based on the provisions of SFAS No. 123, the Company’s pro forma earnings and earnings per share would have been as follows:
| Year ended | |||||||||||
|---|---|---|---|---|---|---|---|---|---|---|---|
| May 26, 2005 | May 27, 2004 | May 29, 2003 | |||||||||
| (in thousands, except per share data) | |||||||||||
Net earnings, as reported | $ | 99,221 | $ | 24,611 | $ | 20,556 | |||||
| Deduct: incremental stock-based employee | |||||||||||
| compensation expense determined under the | |||||||||||
| fair value method for all option awards, net | |||||||||||
| of related tax effects | (949 | ) | (1,071 | ) | (1,189 | ) | |||||
| Pro forma net earnings | $ | 98,272 | $ | 23,540 | $ | 19,367 | |||||
Earnings per share: | |||||||||||
| Basic - as reported | $ | 3.29 | $ | 0.83 | $ | 0.70 | |||||
| Basic - pro forma | $ | 3.26 | $ | 0.79 | $ | 0.66 | |||||
Diluted - as reported | $ | 3.25 | $ | 0.82 | $ | 0.70 | |||||
| Diluted - pro forma | $ | 3.22 | $ | 0.79 | $ | 0.66 | |||||
| May 31, 2007 | May 25, 2006 | |||||||
|---|---|---|---|---|---|---|---|---|
| (in thousands) | ||||||||
Unrealized gain on available for sale investments | $ | 240 | $ | 123 | ||||
| Minimum pension liability | -- | (11 | ) | |||||
| Net actuarial loss | (1,755 | ) | -- | |||||
| $ | (1,515 | ) | $ | 112 | ||||
New Accounting Pronouncements – In December 2004,June 2006, the Financial Accounting Standards Board (FASB) issued SFAS 123(R)FASB Interpretation No. 48 (FIN 48), “Shared-Based Payment,” which changedAccounting for Uncertainty in Income Taxes. This interpretation prescribes a recognition threshold and measurement criteria for a tax position taken or expected to be taken in a tax return. The new standard will be effective for the accounting rules relating to equity compensation programs. Effective for fiscal years beginning after June 15, 2005, companies that award share-based payments to employees, including stock options, must begin to recognize the expense of these awardsCompany in the financial statements atfirst quarter of fiscal 2008. Based upon the time the employee receives the award based on a fair value measurement method. As allowed by SFAS 123,Company’s initial review, the Company has elected to follow APB No. 25 (which uses an intrinsic value measurement method) in accounting for its employee stock options until the effective date of SFAS 123(R).
Under APB No. 25’s intrinsic value method, no compensation cost for the Company’s employee stock options is recognized. Accordingly, thedoes not believe adoption of SFAS 123(R)’s fair value methodFIN 48 will have an impact on the Company’s results of operations in fiscal 2007, although it will not have ana material impact on the Company’s overall financial position. The impact of adoption of SFAS 123(R) cannot be predicted at this time because it will depend on levels of share based payments granted in the future. However, it is believed that had the Company adopted SFAS 123(R) in prior periods, the impact of that standard would have approximated the impact of SFAS 123 as described in the disclosure of pro forma net earnings and earnings per share in the discussion of “Stock-Based Compensation” above.
In December 2004, the FASB issued SFAS 152, “Accounting for Real Estate Time–Sharing Transactions.” SFAS 152 was issued to address the diversity in practice caused by a lack of guidance specific to real estate time-sharing transactions. This statement is effective for fiscal years beginning after June 15, 2005. The Company does not expect the statement to have a material impact on its consolidated financial position, results of operations or cash flows.
Reclassifications –Certain reclassifications have been made to the prior year’s financial statements to conform to the current year’s presentation.
4046
THE MARCUS CORPORATION
NOTES TO CONSOLIDATED FINANCIAL STATEMENTS (continued)
May 31, 2007
On April 19, 2007, the Company acquired 11 owned and/or leased movie theatres for a total purchase price of $75,650,000, net of cash acquired. The acquisition was accounted for using the purchase method of accounting. The net assets acquired consist primarily of land, buildings, leasehold improvements and equipment. The difference between the fair value of the net assets acquired and the purchase price was recorded as goodwill of $26,609,000, which is deductible for tax purposes over fifteen years. The consolidated financial statements reflect the preliminary allocation of the purchase price to the assets acquired and liabilities assumed based on their respective fair values. From the date of acquisition, the acquired theatres contributed approximately $3,500,000 and $650,000 to revenues and operating income, respectively, in fiscal 2007.
On September 3, 2004, the Company sold substantially all of the assets of its limited-service lodging division for a total purchase price of $414,900,000 in cash. The purchase price includes approximately $19,000,000 of proceeds related to the sale of four joint venture properties in the transaction. Net proceeds related to the Company to-date from the sale are $365,447,000,were $390,426,000, net of transaction costs and excluding $21,921,000include $24,979,000 in proceeds received during fiscal 2006 related to funds held in escrow pending completion of certain customary transfer requirements. Net proceeds exclude $10,297,000 of proceeds related to the sale of a joint venture property sold in a subsequent transaction.
The assets sold to-date consistconsisted primarily of land, buildings and equipment with a net book value of approximately $242,164,000,$254,792,000, including goodwill with a net book value of approximately $551,000. The result of the transaction to-date iswas a gain on sale of $74,747,000, which is$82,545,000, net of income taxes of taxes $48,536,000. Upon completion$52,466,000, including additional after tax gains of the transfer requirements associated with the $21,921,000 in escrow, net proceeds will increase and the Company anticipates reporting additional gains on the sale of approximately $6,000,000 after income taxes.$7,798,000 recognized during fiscal 2006. In accordance with the provisions of SFAS No. 144, “AccountingAccounting for the Impairment or Disposal of Long-Lived Assets”Assets (SFAS No. 144), the results of operations of the limited-service lodging division have been reported as discontinued operations in the consolidated statement of earnings for all periods presented. Limited-service lodging revenues for the years ended May 31, 2007, May 25, 2006 and May 26, 2005 May 27, 2004,were $102,000, $523,000 and May 29, 2003 were $42,978,000, $127,781,000 and $126,612,000,$43,456,000, respectively. Operating income (loss) for the years ended May 31, 2007, May 25, 2006 and May 26, 2005 May 27, 2004,was $(166,000), $(1,679,000) and May 29, 2003 was $5,241,000, $13,943,000 and $ 11,585,000,$5,719,000, respectively.
The Company incurred approximately $1,800,000 in one-time severance related costs during fiscal 2005. Approximately2005, of which approximately $1,600,000 of these costs were paid out during the year with thefiscal 2005. The remaining payments expected to be completed by the end of the first quarter ofcosts were paid out during fiscal 2006. These one-time termination benefits are included in income (loss) from discontinued operations in the consolidated statement of earnings.
On December 1, 2004, the Company sold the Miramonte Resort for a total purchase price of approximately $28,700,000 in cash. Net proceeds to the Company from the sale arewere approximately $28,503,000, net of transaction costs, all of which was being held by intermediaries at May 26, 2005 to facilitate potential tax deferral opportunities.costs. The assets sold consistconsisted primarily of land, building and equipment with a net book value of approximately $22,609,000.$22,744,000. The result of the transaction is a gain on sale of $3,574,000,$3,484,000, which is net of income taxes of $2,320,000.$2,275,000. In accordance with SFAS No. 144, the results of operations of the Miramonte, which have historically been included in the Hotels and Resorts segment financial results, have been reported as discontinued operations in the consolidated statement of earnings for all periods presented. Miramonte revenues for the yearsyear ended May 26, 2005 May 27, 2004, and May 29, 2003 were $3,433,000, $6,495,000, and $7,489,000, respectively. Miramote’s$3,433,000. Miramonte’s operating loss for the years ended May 31, 2007, May 25, 2006 and May 26, 2005 May 27, 2004,was $25,000, $95,000 and May 29, 2003 was $2,193,000, $2,843,000 and $1,328,000, respectively.
47
THE MARCUS CORPORATION
NOTES TO CONSOLIDATED FINANCIAL STATEMENTS
May 31, 2007
On May 24, 2001,June 29, 2006, the Company sold the remaining timeshare inventory of its 30 KFCMarcus Vacation Club at Grand Geneva vacation ownership development. The assets sold consisted primarily of real estate and KFC/Taco Bell 2-in-1 restaurants. The asset purchase agreement provided for a potential additional future purchase price payment todevelopment costs. In accordance with SFAS No. 144, the Company if certain performance conditions were met. The Company received additional proceedsresults of $2,050,000 on July 9, 2002, pursuant to this agreement and recognized an additional gain on the saleoperations of the restaurantMarcus Vacation Club, which have historically been included in the Hotels and Resorts segment of $1,249,000, net of income taxes of $801,000. The gain is presentedfinancial results, have been reported as discontinued operations in the accompanying consolidated financial statements.statement of earnings for all periods presented. Marcus Vacation Club revenues for the years ended May 31, 2007, May 25, 2006 and May 26, 2005 were $3,958,000, $4,835,000 and $5,649,000, respectively. Marcus Vacation Club’s operating loss for the years ended May 31, 2007, May 25, 2006 and May 26, 2005 was $33,000, $1,085,000 and $560,000, respectively.
41The consolidated statements of cash flows include the cash flows from discontinued operations, effectively $0 for both fiscal 2007 and 2006 and $1,000 for fiscal 2005.
The components of the assets and liabilities of discontinued operations included in the consolidated balance sheets are as follows:
| May 26, 2005 | May 27, 2004 | May 31, 2007 | May 25, 2006 | |||||||||||||
|---|---|---|---|---|---|---|---|---|---|---|---|---|---|---|---|---|
| (in thousands) | (in thousands) | |||||||||||||||
Assets | ||||||||||||||||
| Cash | $ | 2 | $ | 190 | ||||||||||||
| Refundable Income taxes | 2,424 | 139 | ||||||||||||||
| Assets: | ||||||||||||||||
| Refundable income taxes | $ | 733 | $ | 2,812 | ||||||||||||
| Real estate and development costs | 24 | 3,444 | ||||||||||||||
| Other current assets | 444 | 6,210 | 203 | 144 | ||||||||||||
| Net property and equipment | 13,693 | 280,862 | -- | 1,101 | ||||||||||||
| Other assets | 137 | 2,971 | 15 | 44 | ||||||||||||
| Assets of discontinued operations | $ | 16,700 | $ | 290,372 | $ | 975 | $ | 7,545 | ||||||||
Liabilities | ||||||||||||||||
Liabilities: | ||||||||||||||||
| Current liabilities | $ | 3,859 | $ | 14,251 | $ | 463 | $ | 343 | ||||||||
| Deferred income taxes | 4,319 | 22,547 | 222 | 172 | ||||||||||||
| Other long-term liabilities | 1,336 | 3,860 | ||||||||||||||
| Other liabilities | 2,046 | 1,483 | ||||||||||||||
| Liabilities of discontinued operations | $ | 9,514 | $ | 40,658 | $ | 2,731 | $ | 1,998 | ||||||||
The composition of accounts and notes receivable is as follows:
| May 26, 2005 | May 27, 2004 | May 31, 2007 | May 25, 2006 | |||||||||||||
|---|---|---|---|---|---|---|---|---|---|---|---|---|---|---|---|---|
| (in thousands) | (in thousands) | |||||||||||||||
Trade receivables, net of allowance of $156 and $127, respectively | $ | 4,079 | $ | 3,564 | ||||||||||||
Trade receivables, net of allowance of $138 and $453, respectively | $ | 6,866 | $ | 4,715 | ||||||||||||
| Current notes receivable for interval ownership | 1,352 | 1,146 | 1,174 | 1,406 | ||||||||||||
| Other receivables | 3,480 | 3,032 | 8,184 | 8,185 | ||||||||||||
| $ | 8,911 | $ | 7,742 | $ | 16,224 | $ | 14,306 | |||||||||
4248
THE MARCUS CORPORATION
NOTES TO CONSOLIDATED FINANCIAL STATEMENTS (continued)
May 31, 2007
The composition of property and equipment, which is stated at cost, is as follows:
| May 26, 2005 | May 27, 2004 | May 31, 2007 | May 25, 2006 | |||||||||||||
|---|---|---|---|---|---|---|---|---|---|---|---|---|---|---|---|---|
| (in thousands) | (in thousands) | |||||||||||||||
Land and improvements | $ | 50,595 | $ | 43,991 | $ | 68,732 | $ | 60,889 | ||||||||
| Buildings and improvements | 344,578 | 328,246 | 464,928 | 382,555 | ||||||||||||
| Leasehold improvements | 9,138 | 9,291 | 57,309 | 39,682 | ||||||||||||
| Furniture, fixtures and equipment | 160,887 | 154,682 | 197,593 | 167,687 | ||||||||||||
| Construction in progress | 36,820 | 18,814 | 3,995 | 17,580 | ||||||||||||
| 602,018 | 555,024 | 792,557 | 668,393 | |||||||||||||
| Less accumulated depreciation and amortization | 202,095 | 181,407 | 232,772 | 217,864 | ||||||||||||
| $ | 399,923 | $ | 373,617 | $ | 559,785 | $ | 450,529 | |||||||||
The composition of other assets is as follows:
| May 26, 2005 | May 27, 2004 | May 31, 2007 | May 25, 2006 | |||||||||||||
|---|---|---|---|---|---|---|---|---|---|---|---|---|---|---|---|---|
| (in thousands) | (in thousands) | |||||||||||||||
Favorable lease rights | $ | 13,353 | $ | 13,353 | ||||||||||||
| Favorable lease right | $ | 12,686 | $ | 12,677 | ||||||||||||
| Long-term notes receivable for interval ownership, net | 5,295 | 6,275 | 2,930 | 4,540 | ||||||||||||
| Split dollar life insurance policies | 4,870 | 4,870 | 10,299 | 9,319 | ||||||||||||
| Deposit on land purchase | 5,662 | -- | ||||||||||||||
| Other assets | 8,442 | 9,247 | 13,657 | 12,583 | ||||||||||||
| $ | 37,622 | $ | 33,745 | $ | 39,572 | $ | 39,119 | |||||||||
The Company’s long-term notes receivable for interval ownership are net of a reserve for uncollectible amounts of $1,182,000$945,000 and $760,000$1,206,000 as of May 26, 200531, 2007 and May 27, 2004,25, 2006, respectively. The notes bear fixed-rate interest between 11.79%6.0% and 15.90% over the seven-year or ten-year terms of the loans. The weighted-average rate of interest on outstanding notes receivable for interval ownership is 15.27%15.30%. The notes are collateralized by the underlying vacation intervals.
The Company has escrow deposits of $722,000 and $6,895,000, which are included in other current assets as of May 31, 2007 and May 25, 2006, respectively. The Company also has deferred revenue of $4,940,000$9,654,000 and $4,412,000,$7,752,000, which is included in other accrued liabilities as of May 26, 200531, 2007 and May 27, 2004,25, 2006, respectively.
4349
THE MARCUS CORPORATION
NOTES TO CONSOLIDATED FINANCIAL STATEMENTS (continued)
May 31, 2007
Long-term debt is summarized as follows:
| May 26, 2005 | May 27, 2004 | May 31, 2007 | May 25, 2006 | |||||||||||||
|---|---|---|---|---|---|---|---|---|---|---|---|---|---|---|---|---|
| (in thousands, except payment data) | (in thousands, except payment data) | |||||||||||||||
Mortgage notes | $ | 22,043 | $ | 10,578 | $ | 61,090 | $ | 25,139 | ||||||||
| Industrial Development Revenue Bonds | -- | 140 | ||||||||||||||
| Senior notes due May 31, 2005, bearing interest at 10.22% | 359 | 4,441 | ||||||||||||||
| Senior notes | 172,685 | 194,243 | 119,998 | 148,127 | ||||||||||||
| Unsecured term note due November 1, 2014, with monthly principal | ||||||||||||||||
| and interest payments of $51,000, bearing interest at 8.22% | 1,566 | -- | ||||||||||||||
| Unsecured term note due February 2025, with monthly principal and | ||||||||||||||||
| interest payments of $39,110, bearing interest at 5.75% | 5,228 | 3,246 | ||||||||||||||
| Commercial paper | -- | 23,618 | 46,359 | -- | ||||||||||||
| Revolving credit agreement | 24,000 | -- | ||||||||||||||
| 196,653 | 233,020 | 256,675 | 176,512 | |||||||||||||
| Less current maturities | 25,765 | 25,738 | 57,250 | 53,402 | ||||||||||||
| $ | 170,888 | $ | 207,282 | $ | 199,425 | $ | 123,110 | |||||||||
The mortgage notes, both fixed rate and adjustable, bear interest from 5.34%1.0% to 6.50%7.32% at May 26, 2005,31, 2007, and mature in 2007fiscal years 2008 through 2009.2036. The mortgage notes are secured by the related land, buildings and equipment.
The $172,685,000$119,998,000 of senior notes maturing in 20082009 through 2014 require annual principal payments in varying installments and bear interest payable semiannually at fixed rates ranging from 6.66% to 7.93%, with a weighted-average fixed rate of 7.29%7.21% at May 26, 2005.31, 2007.
The Company has the ability to issueissues commercial paper through an agreement with two banks, up to a maximum of $65,000,000.$65,000,000, which bears interest at 5.45% at May 31, 2007. The agreements require the Company to maintain unused bank lines of credit at least equal to the principal amount of outstanding commercial paper.
At May 26, 2005,31, 2007, the Company had a credit line totaling $125,000,000 in place. NoThere were borrowings areof $24,000,000 outstanding on the $125,000,000 line, which bears interest at LIBOR plus a margin which adjusts based on the Company’s borrowing levels.levels, effectively 6.175% at May 31, 2007. This agreement matures in April 2009 and requires an annual facility fee of 0.175% on the total commitment. Based on noborrowings and commercial paper outstanding, availability under the line at May 26, 2005,31, 2007 totaled $125,000,000. $54,641,000.
The Company hadhas the ability and the intent to replace commercial paper borrowings with long-term borrowings under its credit line.facility. Accordingly, the Company has classified these borrowings at May 27, 200431, 2007 as long-term.
44The Company’s loan agreements include, among other covenants, maintenance of certain financial ratios.
50
THE MARCUS CORPORATION
NOTES TO CONSOLIDATED FINANCIAL STATEMENTS (continued)
May 31, 2007
Scheduled annual principal payments on long-term debt for the years subsequent to May 26, 2005,31, 2007 are:
| Fiscal Year | Fiscal Year | (in thousands) | Fiscal Year | (in thousands) | ||||||
2006 | $ | 25,765 | ||||||||
| 2007 | 50,282 | |||||||||
| 2008 | 32,267 | $ | 57,250 | |||||||
| 2009 | 31,738 | 102,138 | ||||||||
| 2010 | 14,237 | 14,282 | ||||||||
| 2011 | 14,283 | |||||||||
| 2012 | 14,287 | |||||||||
| Thereafter | 42,364 | 54,435 | ||||||||
| $ | 196,653 | $ | 256,675 | |||||||
Interest paid, net of amounts capitalized, in fiscal 2007, 2006 and 2005 2004totaled $13,581,000, $14,245,000 and 2003 totaled $14,816,000, $16,422,000 and $18,450,000,$14,682,000, respectively.
The Company has utilized derivatives in the past principally to manage market risks and reduce its exposure resulting from fluctuations in interest rates. The Company formally documents all relationships between hedging instruments and hedged items, as well as its risk-management objectives and strategies for undertaking various hedge transactions. From June 1, 2001 to May 3, 2002, the Company had an interest rate swap agreement that was considered effective and qualified as a cash flow hedge. On May 3, 2002, the Company terminated the swap, at which time cash flow hedge accounting ceased. The fair value of the swap on the date of termination was a liability of $2,791,000. In fiscal 2005, 20042006 and 2003,2005, the Company reclassified $432,000$184,000 ($259,000111,000 net of tax), $671,000 and $432,000 ($402,000 net of tax), and $1,177,000 ($706,000259,000 net of tax), respectively, from other comprehensive lossincome (loss) to interest expense. The remaining loss at May 26, 2005, in accumulated other comprehensive loss will be reclassified into earnings as interest expense through November 15, 2005, the remaining life of the original hedge. The Company expects to reclassify approximately $184,000 ($111,000 net of tax) of loss into earnings during fiscal 2006.
Shareholders may convert their shares of Class B Common Stock into shares of Common Stock at any time. Class B Common Stock shareholders are substantially restricted in their ability to transfer their Class B Common Stock. Holders of Common Stock are entitled to cash dividends per share equal to 110% of all dividends declared and paid on each share of the Class B Common Stock. Holders of Class B Common Stock are entitled to ten votes per share while holders of Common Stock are entitled to one vote per share on any matters brought before the shareholders of the Company. Liquidation rights are the same for both classes of stock.
During fiscal 2005,On February 24, 2006, the Company granted 8,000 sharespaid a special cash dividend of restricted stock with a fair value of $172,800 on the grant date. These shares were issued$7.00 per share, returning to shareholders approximately $214,576,000 in connection withproceeds resulting from the sale of the limited-service lodging division,division. In connection with the special dividend, and therefore the related compensation expense is included in discontinued operations in fiscal 2005. In fiscal 2004, the Company granted 50,000 shares of Restricted Stock. Pursuantpursuant to the saleterms of the limited-service lodging division, 7,500 of these restrictedCompany’s various stock sharesoption plans, certain adjustments were cancelledmade to the stock options outstanding under the plans in fiscal 2005. The remaining unearned compensationorder to avoid dilution of the Restricted Stock of $413,000intended benefits to existing optionees holding outstanding options under the plans which would otherwise result as of May 26, 2005 is being amortized to compensation expense over the vesting period. The Restricted Stock may not be sold, transferred, pledged or assigned, except as provided by the vesting schedule included in the Company’s equity incentive plan. The Restricted Stock cumulatively vests 25% after three yearsa consequence of the grantspecial dividend. All stock option data prior to the special dividend date 50% after five years ofhas been restated to reflect the grant date, 75% after ten years of the grant date and 100% upon retirement.adjustments.
4551
THE MARCUS CORPORATION
NOTES TO CONSOLIDATED FINANCIAL STATEMENTS
May 31, 2007
Shareholders have approved the issuance of up to 3,437,500 shares of Common Stock under various stock option plans. The options generally become exercisable 40% after two years, 60% after three years and 80% after four years. The remaining options are exercisable five years after the date of the grant. At May 26, 2005, there were 1,649,997 shares available for grants under the current plan.
A summary of the Company’s stock option activity and related information follows:
| May 26, 2005 | May 27, 2004 | May 29, 2003 | ||||||||||||||||||
|---|---|---|---|---|---|---|---|---|---|---|---|---|---|---|---|---|---|---|---|---|
| Options | Weighted- Average Exercise Price | Options | Weighted- Average Exercise Price | Options | Weighted- Average Exercise Price | |||||||||||||||
| (options in thousands) | ||||||||||||||||||||
Outstanding at beginning of | ||||||||||||||||||||
| year | 1,746 | $ | 14.04 | 1,898 | $ | 13.72 | 1,872 | $ | 13.18 | |||||||||||
| Granted | 149 | 18.28 | 186 | 14.64 | 330 | 15.52 | ||||||||||||||
| Exercised | (492 | ) | 13.69 | (257 | ) | 12.20 | (135 | ) | 9.98 | |||||||||||
| Forfeited | (238 | ) | 14.31 | (81 | ) | 13.89 | (169 | ) | 14.05 | |||||||||||
| Outstanding at end of year | 1,165 | $ | 14.65 | 1,746 | $ | 14.04 | 1,898 | $ | 13.72 | |||||||||||
| Exercisable at end of year | 614 | $ | 14.06 | 830 | $ | 13.97 | 788 | $ | 13.66 | |||||||||||
| Weighted-average fair value of | ||||||||||||||||||||
| options granted during year | $ | 7.02 | $ | 5.61 | $ | 5.78 | ||||||||||||||
Exercise prices for options outstanding as of May 26, 2005, ranged from $11.00 to $23.16. The weighted-average remaining contractual life of those options is 5.9 years. Additional information related to these options segregated by exercise price range is as follows:
| Exercise Price Range | |||||||||||
|---|---|---|---|---|---|---|---|---|---|---|---|
| $11.00 to $14.50 | $14.51 to $18.13 | $18.14 to $23.16 | |||||||||
| (options in thousands) | |||||||||||
Options outstanding | 548 | 475 | 142 | ||||||||
| Weighted-average exercise price of options outstanding | $ | 12.80 | $ | 15.70 | $ | 18.29 | |||||
| Weighted-average remaining contractual life of options outstanding | 5.2 | 5.8 | 9.2 | ||||||||
| Options exercisable | 384 | 226 | 4 | ||||||||
| Weighted-average exercise price of options exercisable | $ | 12.61 | $ | 16.40 | $ | 22.38 | |||||
Through May 26, 2005,31, 2007, the Company’s Board of Directors has approved the repurchase of up to 4,687,500 shares of Common Stock to be held in treasury. The Company intends to reissue these shares upon the exercise of stock options and for savings and profit-sharing plan contributions. The Company purchased 28,295, 33,676410,696, 313,416 and 25,75828,295 shares pursuant to these authorizations during fiscal 2005, 20042007, 2006 and 2003,2005, respectively. At May 26, 2005,31, 2007, there were 1,871,5381,147,426 shares available for repurchase under these authorizations.
46
The Company’s Board of Directors has authorized the issuance of up to 750,000 shares of Common Stock for The Marcus Corporation Dividend Reinvestment and Associate Stock Purchase Plan. At May 26, 2005,31, 2007, there were 600,941583,408 shares available under this authorization.
Shareholders have approved the issuance of up to 3,437,500 shares of Common Stock under various equity incentive plans. Options granted under the plans to employees generally become exercisable 40% after two years, 60% after three years, 80% after four years and 100% after five years of the date of grant. The options generally expire ten years from the date of grant as long as the optionee is still employed with the Company.
Awarded shares of non-vested stock cumulatively vest either 25% after three years of the grant date, 50% after five years of the grant date, 75% after ten years of the grant date and 100% upon retirement, or 50% after three years of the grant date and 100% after five years of the grant date, depending on the date of grant. The non-vested stock may not be sold, transferred, pledged or assigned, except as provided by the vesting schedule included in the Company’s loan agreements include, amongequity incentive plan. During the period of restriction, the holder of the non-vested stock has voting rights and is entitled to receive all dividends and other covenants, maintenance of certain financial ratios. The Company’s senior notes duedistributions paid with respect to the stock. Non-vested stock awards and shares issued upon option exercises are issued from previously acquired treasury shares. At May 31, 2007, there were 1,444,115 shares available for grants of additional stock options, non-vested stock and other types of equity awards under the current plan.
The Company adopted SFAS No. 123(R), Share-Based Payment, on May 26, 2006. SFAS No. 123(R) requires stock-based compensation to be expensed over the vesting period of the awards based on the grant date fair value. The Company elected to adopt SFAS No. 123(R) using the modified prospective transition method which does not result in the restatement of previously issued financial statements. The provisions of SFAS No. 123(R) apply to all awards granted or modified after the date of adoption. In addition, compensation expense must be recognized for the amortization of unvested stock option awards outstanding as of the date of adoption. Prior to May 26, 2006, the Company accounted for stock-based compensation in accordance with Accounting Principles Board Opinion (APB) No. 25,Accounting for Stock Issued to Employees. Accordingly, no compensation expense had been recognized for stock options because all options granted had an exercise price equal to the market value of the underlying stock on the date of grant.
52
THE MARCUS CORPORATION
NOTES TO CONSOLIDATED FINANCIAL STATEMENTS
May 31, 2007
The Company estimated the fair value of stock options using the Black-Scholes option pricing model with the following assumptions used for awards granted during fiscal 2007, 2006 and 2005:
| Year Ended May 31, 2007 | Year Ended May 25, 2006 | Year Ended May 26, 2005 | |
|---|---|---|---|
Risk-free interest rate | 5.0% | 4.2% | 3.5% |
| Dividend yield | 1.6% | 1.1% | 1.2% |
| Volatility | 37 - 41% | 39% | 43% |
| Expected life | 5 - 9 years | 5 years | 5 years |
Total pre-tax stock-based compensation expense was $1,326,000 in fiscal 2007 and $121,000 in both fiscal 2006 and 2005. Total pre-tax stock-based compensation expense for fiscal 2006 and 2005 included a restriction on retained earnings at May 26,2005 that has subsequently been removed aswas entirely related to non-vested stock.
As a result of final paymentadopting SFAS No. 123(R) on May 26, 2006, the Company’s fiscal 2007 earnings from continuing operations before income taxes and net earnings were $1,073,000 and $830,000 lower, respectively, than if the Company had continued to account for stock-based compensation under APB No. 25. For the fiscal year ended May 31, 2007, basic and diluted net earnings per common share were $0.02 and $0.03 lower, respectively, than if the Company had continued to account for stock-based compensation under APB No. 25.
The following table illustrates the pro forma effect on net earnings and earnings per common share if the Company had applied the fair value recognition provisions of SFAS No. 123 to stock-based compensation for fiscal 2006 and 2005:
| Year Ended May 25, 2006 | Year Ended May 26, 2005 | |||||||
|---|---|---|---|---|---|---|---|---|
| (in thousands, except per share data) | ||||||||
Net earnings, as reported | $ | 28,271 | $ | 99,221 | ||||
| Add: reported stock compensation expense, net of tax | 82 | 75 | ||||||
| Deduct: stock-based employee compensation expense determined | ||||||||
| under the fair value method, net of tax | (864 | ) | (1,025 | ) | ||||
| Pro forma net earnings | $ | 27,489 | $ | 98,271 | ||||
Earnings per common share: | ||||||||
| Basic - as reported | $ | 0.96 | $ | 3.42 | ||||
| Basic - pro forma | $ | 0.93 | $ | 3.39 | ||||
| Diluted - as reported | $ | 0.91 | $ | 3.25 | ||||
| Diluted - pro forma | $ | 0.89 | $ | 3.22 | ||||
53
THE MARCUS CORPORATION
NOTES TO CONSOLIDATED FINANCIAL STATEMENTS
May 31, 2007
A summary of the notes.Company’s stock option activity and related information follows:
| May 31, 2007 | May 25, 2006 | May 26, 2005 | ||||||||||||||||||
|---|---|---|---|---|---|---|---|---|---|---|---|---|---|---|---|---|---|---|---|---|
| Options | Weighted- Average Exercise Price | Options | Weighted- Average Exercise Price | Options | Weighted- Average Exercise Price | |||||||||||||||
| (options in thousands) | ||||||||||||||||||||
Outstanding at beginning of year | 1,157 | $ | 11.22 | 1,661 | $ | 10.28 | 2,489 | $ | 9.85 | |||||||||||
| Granted | 195 | 19.86 | 227 | 14.16 | 212 | 12.82 | ||||||||||||||
| Exercised | (185 | ) | 10.70 | (662 | ) | 9.81 | (701 | ) | 9.60 | |||||||||||
| Forfeited | (30 | ) | 14.88 | (69 | ) | 11.71 | (339 | ) | 10.04 | |||||||||||
| Outstanding at end of year | 1,137 | $ | 12.69 | 1,157 | $ | 11.22 | 1,661 | $ | 10.28 | |||||||||||
| Exercisable at end of year | 548 | $ | 10.22 | 493 | $ | 9.90 | 833 | $ | 9.86 | |||||||||||
| Weighted-average fair value of | $8.09 | $5.22 | $4.92 | |||||||||||||||||
| options granted during year | ||||||||||||||||||||
Exercise prices for options outstanding as of May 31, 2007 ranged from $7.71 to $23.37. The weighted-average remaining contractual life of those options is 6.1 years. Additional information related to these options segregated by exercise price range is as follows:
| Exercise Price Range | ||||||||||||||
|---|---|---|---|---|---|---|---|---|---|---|---|---|---|---|
| $7.71 to $10.17 | $10.18 to $12.71 | $12.72 to $17.73 | $17.74 to $23.37 | |||||||||||
| (options in thousands) | ||||||||||||||
| Options outstanding | 298 | 291 | 362 | 186 | ||||||||||
| Weighted-average exercise price of options | ||||||||||||||
| outstanding | $ | 9.00 | $ | 10.75 | $ | 13.59 | $ | 19.86 | ||||||
| Weighted-average remaining contractual life of | ||||||||||||||
| options outstanding | 3.4 | 5.0 | 7.7 | 9.1 | ||||||||||
| Options exercisable | 297 | 181 | 66 | 4 | ||||||||||
| Weighted-average exercise price of options | ||||||||||||||
| exercisable | $ | 9.00 | $ | 10.87 | $ | 13.25 | $ | 23.24 | ||||||
The intrinsic value of options outstanding at May 31, 2007 was $12,144,000, and the intrinsic value of options exercisable at May 31, 2007 was $7,209,000. The intrinsic value of options exercised was $2,246,000, $18,283,000 and $3,221,000 during fiscal 2007, 2006 and 2005, respectively. As of May 31, 2007, total remaining unearned compensation cost related to stock options was $2,111,000, which will be amortized to expense over the remaining weighted-average service period of five years.
54
THE MARCUS CORPORATION
NOTES TO CONSOLIDATED FINANCIAL STATEMENTS
May 31, 2007
Following is a summary of the Company’s non-vested stock activity and related information for the fiscal year ended May 31, 2007:
| Shares | Weighted-Average Fair Value | |||||||
|---|---|---|---|---|---|---|---|---|
| (shares in thousands) | ||||||||
Outstanding at May 26, 2006 | 59 | $ | 16.52 | |||||
| Granted | 44 | 20.26 | ||||||
| Vested | (14 | ) | 14.61 | |||||
| Forfeited | -- | -- | ||||||
| Outstanding at May 31, 2007 | 89 | $ | 18.71 | |||||
The Company previously had and will continue to expense awards of non-vested stock based on the fair value of the Company’s common stock at the date of grant. As a result of adopting SFAS No. 123(R), unearned compensation on non-vested stock was reclassified into capital in excess of par on the date of adoption. As of May 31, 2007, total remaining unearned compensation related to non-vested stock was $941,000, which will be amortized over the weighted-average remaining service period of 8.8 years.
The Company has a qualified profit-sharing savings plan (401(k) plan) covering eligible employees. The 401(k) plan provides for a contribution of a minimum of 1% of defined compensation for all plan participants and matching of 25% of employee contributions up to 6% of defined compensation. In addition, the Company may make additional discretionary contributions. During fiscal 2007, 2006 and 2005, the 1% and the discretionary contributions were made with the Company’s common stock. The Company also sponsors unfunded, nonqualified, defined-benefit and deferred compensation plans. Pension and profit-sharing expense fromrelated to continuing operations for all plans was $2,230,000, $2,097,000$2,408,000, $2,243,000 and $1,732,000$2,217,000 for fiscal 2005, 20042007, 2006 and 2003,2005, respectively.
47On May 26, 2006, the Company adopted SFAS No. 158,Employers’ Accounting for Defined Benefit Pension and Other Postretirement Plans, which requires the Company to recognize previously unrecognized actuarial losses and prior service costs in the statement of financial position and to recognize future changes in these amounts in the year in which changes occur though comprehensive income. Additionally, the Company is required to measure the funded status of its plan as of the date of its year-end statement of financial position.
55
THE MARCUS CORPORATION
NOTES TO CONSOLIDATED FINANCIAL STATEMENTS (continued)
May 31, 2007
The adoption of SFAS No. 158 had no effect on the Company’s consolidated statement of earnings for the year ended May 31, 2007, or for any prior period presented, and it will not affect the Company’s operating results in future periods. The incremental effects of adopting the provisions of SFAS No. 158 on the Company’s statement of financial position at May 31, 2007 are presented in the following table:
| At May 31, 2007 | |||||||||||
|---|---|---|---|---|---|---|---|---|---|---|---|
| Prior to Adopting SFAS No. 158 | Effect of Adopting SFAS No. 158 | As Reported | |||||||||
| (in thousands) | |||||||||||
Deferred income taxes, net | $ | 30,546 | $ | (1,170 | ) | $ | 29,376 | ||||
| Other accrued liabilities | 23,961 | 785 | 24,746 | ||||||||
| Deferred compensation and other | 20,790 | 2,140 | 22,930 | ||||||||
| Accumulated other comprehensive income | |||||||||||
| (loss) | 240 | (1,755 | ) | (1,515 | ) | ||||||
The status of the Company’s unfunded nonqualified, defined-benefit plan based on the respective May 26, 200531, 2007 and May 27, 2004,25, 2006 measurement dates is as follows:
| May 26, 2005 | May 27, 2004 | May 31, 2007 | May 25, 2006 | |||||||||||||
|---|---|---|---|---|---|---|---|---|---|---|---|---|---|---|---|---|
| (in thousands) | (in thousands) | |||||||||||||||
Change in benefit obligation: | ||||||||||||||||
| Net benefit obligation at beginning of year | $ | 12,676 | $ | 13,191 | $ | 16,896 | $ | 16,090 | ||||||||
| Service cost | 369 | 463 | 432 | 412 | ||||||||||||
| Interest cost | 891 | 767 | 1,085 | 877 | ||||||||||||
| Actuarial (gain) loss | 2,371 | (1,524 | ) | |||||||||||||
| Actuarial gain | (1,477 | ) | (239 | ) | ||||||||||||
| Benefits paid | (217 | ) | (221 | ) | (250 | ) | (244 | ) | ||||||||
| Net benefit obligation at end of year | $ | 16,090 | $ | 12,676 | $ | 16,686 | $ | 16,896 | ||||||||
Funded status at end of year | $ | (16,090 | ) | $ | (12,676 | ) | $ | (16,686 | ) | $ | (16,896 | ) | ||||
| Unrecognized net actuarial loss | 5,001 | 2,749 | -- | 4,583 | ||||||||||||
| Unrecognized prior service cost | 9 | 13 | -- | 5 | ||||||||||||
| Unrecognized transition obligation | -- | 75 | ||||||||||||||
| Other comprehensive income | 2,925 | -- | ||||||||||||||
| Net amount recognized at end of year | $ | (11,080 | ) | $ | (9,839 | ) | $ | (13,761 | ) | $ | (12,308 | ) | ||||
Amounts recognized in the statement of financial position consist of: | ||||||||||||||||
| Accrued benefit liability | $ | (11,080 | ) | $ | (9,839 | ) | ||||||||||
| Current accrued benefit liability | $ | (785 | ) | $ | (250 | ) | ||||||||||
| Noncurrent accrued benefit liability | (15,901 | ) | (12,058 | ) | ||||||||||||
| Additional minimum liability | (756 | ) | (204 | ) | -- | (24 | ) | |||||||||
| Intangible asset | 9 | 89 | -- | 5 | ||||||||||||
| Accumulated other comprehensive income | 451 | 70 | ||||||||||||||
| Accumulated other comprehensive loss | 1,755 | 11 | ||||||||||||||
| Deferred tax asset | 296 | 45 | 1,170 | 8 | ||||||||||||
| Net amount recognized at end of year | $ | (11,080 | ) | $ | (9,839 | ) | $ | (13,761 | ) | $ | (12,308 | ) | ||||
| Year ended | |||||||||||
|---|---|---|---|---|---|---|---|---|---|---|---|
| May 26, 2005 | May 27, 2004 | May 29, 2003 | |||||||||
| (in thousands) | |||||||||||
Net periodic pension cost: | |||||||||||
| Service cost | $ | 369 | $ | 463 | $ | 306 | |||||
| Interest cost | 891 | 767 | 746 | ||||||||
| Net amortization of prior service cost, transition obligation and | |||||||||||
| actuarial loss | 198 | 242 | 151 | ||||||||
| $ | 1,458 | $ | 1,472 | $ | 1,203 | ||||||
56
THE MARCUS CORPORATION
NOTES TO CONSOLIDATED FINANCIAL STATEMENTS
May 31, 2007
| Year ended | |||||||||||
|---|---|---|---|---|---|---|---|---|---|---|---|
| May 31, 2007 | May 25, 2006 | May 26, 2005 | |||||||||
| (in thousands) | |||||||||||
Net periodic pension cost: | |||||||||||
| Service cost | $ | 432 | $ | 412 | $ | 369 | |||||
| Interest cost | 1,085 | 877 | 891 | ||||||||
| Net amortization of prior service cost, transition obligation | |||||||||||
| and actuarial loss | 186 | 184 | 198 | ||||||||
| $ | 1,703 | $ | 1,473 | $ | 1,458 | ||||||
The $1,755,000 loss, net of tax, included in accumulated other comprehensive income (loss) at May 31, 2007, is the net actuarial loss which has not yet been recognized in the net periodic benefit cost.
The accumulated benefit obligation was $11,836,000$12,464,000 and $10,043,000$12,332,000 as of May 26, 200531, 2007 and May 27, 2004,25, 2006, respectively.
The benefit obligations were determined using an assumed weighted-average discount rate of 5.50%, 6.50%6.10% and 7.25%6.25% in 2005, 20042007 and 2003,2006, respectively, and an annual salary rate increase of 5.0% for all threeboth years.
The net periodic benefit cost was determined using an assumed discount rate of 6.50%6.25%, 5.5% and 5.75%6.5% in 20052007, 2006 and 2004,2005, respectively, and an annual salary rate increase of 5.0% for bothall three years.
48
Benefit payments expected to be paid subsequent to May 26, 2005,31, 2007 are:
| Fiscal Year | Fiscal Year | (in thousands) | Fiscal Year | (in thousands) | ||||||
| 2006 | $ | 599 | ||||||||
| 2007 | 677 | |||||||||
| 2008 | 677 | $ | 785,439 | |||||||
| 2009 | 786 | 903,872 | ||||||||
| 2010 | 802 | 907,828 | ||||||||
| Years 2011 - 2015 | 4,462 | |||||||||
| 2011 | 920,140 | |||||||||
| 2012 | 944,076 | |||||||||
| Years 2013 - 2017 | 5,280,197 | |||||||||
The Company recognizes deferred tax assets and liabilities based upon the expected future tax consequences of events that have been included in the financial statements or tax returns. Under the liability method, deferred tax assets and liabilities are determined based on the difference between the financial statement and tax basis of assets and liabilities using enacted tax rates for the year in which the differences are expected to reverse.
57
THE MARCUS CORPORATION
NOTES TO CONSOLIDATED FINANCIAL STATEMENTS
May 31, 2007
The components of the net deferred tax liability for continuing operations were as follows:
| May 26, 2005 | May 27, 2004 | May 31, 2007 | May 25, 2006 | |||||||||||||
|---|---|---|---|---|---|---|---|---|---|---|---|---|---|---|---|---|
| (in thousands) | (in thousands) | |||||||||||||||
Current deferred income tax assets (liabilities): | ||||||||||||||||
| Depreciation and amortization | $ | (20 | ) | $ | -- | |||||||||||
| Current deferred income tax assets: | ||||||||||||||||
| Accrued employee benefits | 5,039 | 4,192 | $ | 544 | $ | 5,413 | ||||||||||
| Other accrued liabilities | 445 | 401 | 512 | 485 | ||||||||||||
| Net current deferred tax assets | 5,464 | 4,593 | $ | 1,056 | $ | 5,898 | ||||||||||
Noncurrent deferred income tax (liabilities) assets: | ||||||||||||||||
| Depreciation and amortization | (27,905 | ) | (24,279 | ) | $ | (37,473 | ) | $ | (28,823 | ) | ||||||
| Accrued employee benefits | 708 | 1,032 | 8,161 | 741 | ||||||||||||
| Other accrued liabilities | 583 | 581 | (64 | ) | 136 | |||||||||||
| Net noncurrent deferred tax liabilities | $ | (26,614 | ) | $ | (22,666 | ) | $ | (29,376 | ) | $ | (27,946 | ) | ||||
Income tax expense for continuing operations consists of the following:
| Year ended | |||||||||||
|---|---|---|---|---|---|---|---|---|---|---|---|
| May 26, 2005 | May 27, 2004 | May 29, 2003 | |||||||||
| (in thousands) | |||||||||||
Currently payable: | |||||||||||
| Federal | $ | 6,803 | $ | 8,080 | $ | 6,573 | |||||
| State | 1,861 | 2,027 | 2,021 | ||||||||
| Deferred | 2,858 | 1,787 | 1,070 | ||||||||
| $ | 11,522 | $ | 11,894 | $ | 9,664 | ||||||
49
| Year ended | |||||||||||
|---|---|---|---|---|---|---|---|---|---|---|---|
| May 31, 2007 | May 25, 2006 | May 26, 2005 | |||||||||
| (in thousands) | |||||||||||
| Currently payable (refundable): | |||||||||||
| Federal | $ | 8,753 | $ | 7,871 | $ | 6,976 | |||||
| State | (1,244 | ) | 2,851 | 1,908 | |||||||
| Deferred: | |||||||||||
| Federal | 1,813 | (266 | ) | 2,507 | |||||||
| State | 254 | (37 | ) | 351 | |||||||
| $ | 9,576 | $ | 10,419 | $ | 11,742 | ||||||
Income tax expense is included in the accompanying consolidated statements of earnings as follows:
| Year ended | Year ended | |||||||||||||||||||||
|---|---|---|---|---|---|---|---|---|---|---|---|---|---|---|---|---|---|---|---|---|---|---|
| May 26, 2005 | May 27, 2004 | May 29, 2003 | May 31, 2007 | May 25, 2006 | May 26, 2005 | |||||||||||||||||
| (in thousands) | (in thousands) | |||||||||||||||||||||
Continuing operations | $ | 11,522 | $ | 11,894 | $ | 9,664 | $ | 9,576 | $ | 10,419 | $ | 11,742 | ||||||||||
| Discontinued operations | 51,935 | 3,957 | 3,526 | (30 | ) | 2,925 | 51,714 | |||||||||||||||
| $ | 63,457 | $ | 15,851 | $ | 13,190 | $ | 9,546 | $ | 13,344 | $ | 63,456 | |||||||||||
58
THE MARCUS CORPORATION
NOTES TO CONSOLIDATED FINANCIAL STATEMENTS
May 31, 2007
A reconciliation of the statutory federal tax rate to the effective tax rate for continuing operations follows:
| Year ended | |||||||||||
|---|---|---|---|---|---|---|---|---|---|---|---|
| May 26, 2005 | May 27, 2004 | May 29, 2003 | |||||||||
| (in thousands) | |||||||||||
Statutory federal tax rate | 35.0 | % | 35.0 | % | 35.0 | % | |||||
| State income taxes, net of federal | |||||||||||
| income tax benefit | 5.2 | 4.7 | 4.7 | ||||||||
| Other | (2.7 | ) | (0.5 | ) | (0.6 | ) | |||||
| 37.5 | % | 39.2 | % | 39.1 | % | ||||||
Included in other is the benefit of the Company’s investments in federal tax exempt financial investments for the year ended May 26, 2005.
| Year ended | |||||||||||
|---|---|---|---|---|---|---|---|---|---|---|---|
| May 31, 2007 | May 25, 2006 | May 26, 2005 | |||||||||
Statutory federal tax rate | 35.0 | % | 35.0 | % | 35.0 | % | |||||
| State income taxes, net of federal income tax benefit | 5.1 | 5.5 | 5.2 | ||||||||
| Federal tax exempt interest | (0.6 | ) | (5.9 | ) | (3.1 | ) | |||||
| Federal and state historic tax credits | (18.0 | ) | -- | -- | |||||||
| Other | 0.5 | (2.9 | ) | 0.4 | |||||||
| 22.0 | % | 31.7 | % | 37.5 | % | ||||||
Income taxes paid, net of refunds received, in fiscal 2007, 2006 and 2005 2004totaled $4,796,000, $14,374,000 and 2003 totaled $82,485,000, $12,907,000 and $13,456,000, respectively.
Lease Commitments –The Company leases real estate under various noncancellable operating leases with an initial term greater than one year that contain multiple renewal options, exercisable at the Company’s option. The Company recognizes rent expense on a straight-line basis over the expected lease term, including cancelable option periods where failure to exercise such options would result in an economic penalty. Percentage rentals are based on the revenues at the specific rented property. Certain sublease agreements include buyout incentives. Rent expense charged to operations under these leases was as follows:
| Year ended | Year ended | |||||||||||||||||||||
|---|---|---|---|---|---|---|---|---|---|---|---|---|---|---|---|---|---|---|---|---|---|---|
| May 26, 2005 | May 27, 2004 | May 29, 2003 | May 31, 2007 | May 25, 2006 | May 26, 2005 | |||||||||||||||||
| (in thousands) | (in thousands) | |||||||||||||||||||||
Fixed minimum rentals | $ | 1,866 | $ | 1,750 | $ | 1,805 | $ | 2,957 | $ | 2,833 | $ | 1,866 | ||||||||||
| Amortization of favorable lease right | 354 | 676 | -- | |||||||||||||||||||
| Percentage rentals | 135 | 137 | 142 | 102 | 121 | 135 | ||||||||||||||||
| Sublease rental income | (12 | ) | (42 | ) | (42 | ) | -- | -- | (12 | ) | ||||||||||||
| $ | 1,989 | $ | 1,845 | $ | 1,905 | $ | 3,413 | $ | 3,630 | $ | 1,989 | |||||||||||
5059
THE MARCUS CORPORATION
NOTES TO CONSOLIDATED FINANCIAL STATEMENTS (continued)
May 31, 2007
Aggregate minimum rental commitments under long-term operating leases, assuming the exercise of certain lease options, are as follows at May 26, 2005:31, 2007:
| Fiscal Year | Fiscal Year | (in thousands) | Fiscal Year | (in thousands) | ||||||
| 2006 | $ | 2,734 | ||||||||
| 2007 | 2,634 | |||||||||
| 2008 | 2,558 | $ | 3,521 | |||||||
| 2009 | 2,483 | 3,562 | ||||||||
| 2010 | 2,561 | 3,678 | ||||||||
| 2011 | 3,634 | |||||||||
| 2012 | 3,529 | |||||||||
| Thereafter | 27,713 | 72,884 | ||||||||
| $ | 40,683 | $ | 90,808 | |||||||
Commitments –The Company has commitments for the completion of construction at various properties and the purchase of various properties totaling approximately $6,289,000$7,075,000 at May 26, 2005.31, 2007.
License Rights –The Company has license rights to operate twothree hotels using the Hilton trademark, and one hotel using the Four Points by Sheraton trademark and one hotel using the InterContinental trademark. Under the terms of the licenses, the Company is obligated to pay fees based on defined gross sales.
Contingencies –The Company guarantees the debt of joint ventures and other entities totaling $5,261,000$4,835,000 at May 26, 2005.31, 2007. The debt of the joint ventures is collateralized by the real estate, buildings and improvements and all equipment of each joint venture. The Company does not anticipate these guarantees to be payable.
The Company has approximately six and one half years remaining on a ten and one half-year office lease. On July 7, 2005, the lease was amended in order to exit leased office space for the Company’s former limited-service lodging division. To induce the landlord to amend the lease, the Company guaranteed the lease obligations of the new tenant of the relinquished space throughout the remaining term of the lease. The maximum amount of future payments the Company could be required to pay if the new tenant defaults on its lease obligations was approximately $2,854,000 as of May 31, 2007.
At May 26, 200531, 2007 and May 27, 2004,25, 2006, the Company held investments with aggregate carrying values of $6,658,000$1,868,000 and $4,300,000,$7,487,000, respectively, in several joint ventures, excludingventures. The investments are accounted for under the carrying values of investments in discontinued joint ventures.equity method. Included in the May 25, 2006 investments in joint ventures totals istotal was a 50% ownership interest in Platinum Condominium Development, LLC, a joint venture developingthat developed a condominium hotel in Las Vegas, Nevada. TheNevada, with a carrying value of the investment was $5,327,000 and $3,103,000 at $7,324,000.
60
THE MARCUS CORPORATION
NOTES TO CONSOLIDATED FINANCIAL STATEMENTS
May 26, 2005 and May 27, 2004, respectively. The investments are accounted for under the equity method.31, 2007
During fiscal 2004,2007, the Company recorded a $585,000 loss onacquired the termination and disposalownership interests of a discontinuedits joint venture and paid $930,000 underpartners in Platinum Condominium Development, LLC, thus increasing the Company’s guaranteeownership of the joint venture’s outstanding debt. During fiscal 2003,property’s public space to 100%. The total purchase price was $11,000,000, including approximately $6,249,000 in prepaid development fees. As a result of these transactions, effective October 31, 2006, the Company recorded an impairment lossassets and liabilities of $600,000 relatedthe Platinum Hotel, as well as the results of its operations, are now reported in the Company’s consolidated results. Prior to October 31, 2006, the joint venture determinedwas accounted for using the equity method of accounting.
As a result of the purchase, the assets and liabilities, consisting primarily of condominium units held for sale, prepaid development fees, land, building and fixtures and other accrued liabilities are now reflected in the consolidated balance sheet. The consolidated financial statements reflect the preliminary allocation of the purchase price to the assets acquired and liabilities assumed, based on their respective fair value, which approximates the purchase price. Pro forma information is not required as the amount by whichimpact to the carrying value exceedsresults of operations is not significant.
The costs of the fair valuecondominium hotel development project attributable to the condominium units to be sold have been classified as assets held for sale in the consolidated balance sheet as of these investments.May 31, 2007.
The Company has receivables from the discontinued joint ventures of $2,704,000$3,732,000 and $2,666,000$3,385,000 at May 26, 200531, 2007 and May 27, 2004,25, 2006, respectively. The Company earns interest on $2,616,000$3,732,000 and $2,579,000$3,298,000 of the net receivables at approximately prime to prime plus 1.5% at May 26, 200531, 2007 and May 27, 2004,25, 2006, respectively.
Included in notes payable at May 26, 200531, 2007 and May 27, 2004,25, 2006 is $774,000$239,000 and $1,066,000,$500,000, respectively, dueowed to discontinued joint ventures in connection with cash advanced to the Company. The Company pays interest on the cash advances based on the 90-day certificate of deposit rates.
51
The Company evaluates performance and allocates resources based on the operating income (loss) of each segment. The accounting policies of the reportable segments are the same as those described in the summary of significant accounting policies.
61
THE MARCUS CORPORATION
NOTES TO CONSOLIDATED FINANCIAL STATEMENTS
May 31, 2007
Following is a summary of business segment information for fiscal 20032005 through 2005:2007:
| Theatres | Hotels/ Resorts | Corporate Items | Continuing Operations Total | Discontinued Operations | Total | Theatres | Hotels/ Resorts | Corporate Items | Continuing Operations Total | Discontinued Operations | Total | |||||||||||||||||||||||||||||
|---|---|---|---|---|---|---|---|---|---|---|---|---|---|---|---|---|---|---|---|---|---|---|---|---|---|---|---|---|---|---|---|---|---|---|---|---|---|---|---|---|
| (in thousands) | (in thousands) | |||||||||||||||||||||||||||||||||||||||
Fiscal 2007 | ||||||||||||||||||||||||||||||||||||||||
| Revenues | $ | 156,451 | $ | 169,942 | $ | 1,238 | $ | 327,631 | $ | 4,060 | $ | 331,691 | ||||||||||||||||||||||||||||
| Operating income (loss) | 34,561 | 15,792 | (9,214 | ) | 41,139 | (224 | ) | 40,915 | ||||||||||||||||||||||||||||||||
| Depreciation and amortization | 11,826 | 14,336 | 751 | 26,913 | 12 | 26,925 | ||||||||||||||||||||||||||||||||||
| Equity losses from | ||||||||||||||||||||||||||||||||||||||||
| unconsolidated joint ventures | (149 | ) | (1,217 | ) | -- | (1,366 | ) | (367 | ) | (1,733 | ) | |||||||||||||||||||||||||||||
| Assets | 320,280 | 329,245 | 47,883 | 697,408 | 975 | 698,383 | ||||||||||||||||||||||||||||||||||
| Capital expenditures and | ||||||||||||||||||||||||||||||||||||||||
| acquisitions | 115,403 | 70,606 | 743 | 186,752 | -- | 186,752 | ||||||||||||||||||||||||||||||||||
Fiscal 2006 | ||||||||||||||||||||||||||||||||||||||||
| Revenues | $ | 145,990 | $ | 141,917 | $ | 1,337 | $ | 289,244 | $ | 5,358 | $ | 294,602 | ||||||||||||||||||||||||||||
| Operating income (loss) | 32,481 | 15,613 | (8,554 | ) | 39,540 | (2,859 | ) | 36,681 | ||||||||||||||||||||||||||||||||
| Depreciation and amortization | 12,372 | 12,632 | 1,127 | 26,131 | 143 | 26,274 | ||||||||||||||||||||||||||||||||||
| Equity losses from | ||||||||||||||||||||||||||||||||||||||||
| unconsolidated joint ventures | (985 | ) | (850 | ) | (33 | ) | (1,868 | ) | (106 | ) | (1,974 | ) | ||||||||||||||||||||||||||||
| Assets | 220,595 | 285,132 | 73,962 | 579,689 | 7,545 | 587,234 | ||||||||||||||||||||||||||||||||||
| Capital expenditures and | ||||||||||||||||||||||||||||||||||||||||
| acquisitions | 8,394 | 65,816 | 1,187 | 75,397 | 135 | 75,532 | ||||||||||||||||||||||||||||||||||
| Fiscal 2005 | ||||||||||||||||||||||||||||||||||||||||
| Revenues | $ | 149,125 | $ | 122,181 | $ | 1,401 | $ | 272,707 | $ | 46,411 | $ | 319,118 | $ | 149,125 | $ | 116,532 | $ | 1,401 | $ | 267,058 | $ | 52,538 | $ | 319,596 | ||||||||||||||||
| Operating income (loss) | 34,791 | 11,235 | (8,547 | ) | 37,479 | 3,048 | 40,527 | 34,791 | 12,658 | (8,547 | ) | 38,902 | 2,966 | 41,868 | ||||||||||||||||||||||||||
| Depreciation and amortization | 12,148 | 11,047 | 1,400 | 24,595 | 3,807 | 28,402 | 12,148 | 10,955 | 1,400 | 24,503 | 3,899 | 28,402 | ||||||||||||||||||||||||||||
| Equity earnings (losses) from | ||||||||||||||||||||||||||||||||||||||||
| unconsolidated joint ventures | (264 | ) | (863 | ) | 37 | (1,090 | ) | (477 | ) | (1,567 | ) | |||||||||||||||||||||||||||||
| Assets | 226,127 | 250,056 | 294,616 | 770,799 | 16,700 | 787,499 | 226,127 | 243,896 | 294,616 | 764,639 | 22,860 | 787,499 | ||||||||||||||||||||||||||||
| Capital expenditures and other | 35,858 | 21,531 | 1,504 | 58,893 | 4,538 | 63,431 | ||||||||||||||||||||||||||||||||||
Fiscal 2004 | ||||||||||||||||||||||||||||||||||||||||
| Revenues | $ | 155,732 | $ | 117,976 | $ | 1,223 | $ | 274,931 | $ | 134,276 | $ | 409,207 | ||||||||||||||||||||||||||||
| Operating income (loss) | 38,933 | 11,724 | (8,333 | ) | 42,324 | 11,100 | 53,424 | |||||||||||||||||||||||||||||||||
| Depreciation and amortization | 11,782 | 11,634 | 1,532 | 24,948 | 21,088 | 46,036 | ||||||||||||||||||||||||||||||||||
| Assets | 204,711 | 211,058 | 43,670 | 459,439 | 290,372 | 749,811 | ||||||||||||||||||||||||||||||||||
| Capital expenditures and other | 10,973 | 15,064 | 399 | 26,436 | 24,479 | 50,915 | ||||||||||||||||||||||||||||||||||
Fiscal 2003 | ||||||||||||||||||||||||||||||||||||||||
| Revenues | $ | 150,383 | $ | 111,001 | $ | 1,430 | $ | 262,814 | $ | 134,101 | $ | 396,915 | ||||||||||||||||||||||||||||
| Operating income (loss) | 36,162 | 10,148 | (7,182 | ) | 39,128 | 10,257 | 49,385 | |||||||||||||||||||||||||||||||||
| Depreciation and amortization | 11,987 | 11,512 | 1,583 | 25,082 | 20,283 | 45,365 | ||||||||||||||||||||||||||||||||||
| Assets | 207,440 | 201,967 | 56,238 | 465,645 | 289,812 | 755,457 | ||||||||||||||||||||||||||||||||||
| Capital expenditures and other | 4,173 | 8,689 | 3,160 | 16,022 | 9,982 | 26,004 | ||||||||||||||||||||||||||||||||||
| Capital expenditures and | ||||||||||||||||||||||||||||||||||||||||
| acquisitions | 35,858 | 21,520 | 1,504 | 58,882 | 4,549 | 63,431 | ||||||||||||||||||||||||||||||||||
Corporate items include amounts not allocable to the business segments. Corporate revenues consist principally of rent and the corporate operating loss includes general corporate expenses. Corporate information technology costs and accounting shared services costs are allocated to the business segments based upon several factors, including actual usage and segment revenues. Corporate assets primarily include cash and cash equivalents, investments, notes receivable, receivables from joint ventures and land held for development.
5262
THE MARCUS CORPORATION
NOTES TO CONSOLIDATED FINANCIAL STATEMENTS (continued)
May 31, 2007
11.12. Unaudited Quarterly Financial Information(in thousands, except per share datadata))
| 13 Weeks Ended | ||||||||||||||
|---|---|---|---|---|---|---|---|---|---|---|---|---|---|---|
| Fiscal 2005 | August 26, 2004 | November 25, 2004 | February 24, 2005 | May 26, 2005 | ||||||||||
Revenues | $ | 87,339 | $ | 62,135 | $ | 62,472 | $ | 60,761 | ||||||
| Operating income | 21,057 | 7,755 | 4,715 | 3,952 | ||||||||||
| Net earnings | 18,145 | 71,588 | 6,595 | 2,893 | ||||||||||
| Net earnings per basic share | $ | 0.61 | $ | 2.38 | $ | 0.22 | $ | 0.10 | ||||||
| Net earnings per diluted share | $ | 0.60 | $ | 2.34 | $ | 0.21 | $ | 0.09 | ||||||
| 13 Weeks Ended | ||||||||||||||
| Fiscal 2004 | August 26, 2004 | November 25, 2004 | February 24, 2005 | May 26, 2005 | ||||||||||
Revenues | $ | 83,155 | $ | 62,485 | $ | 65,764 | $ | 63,527 | ||||||
| Operating income | 18,991 | 8,439 | 7,963 | 6,931 | ||||||||||
| Net earnings | 12,945 | 4,803 | 2,284 | 4,579 | ||||||||||
| Net earnings per basic share | $ | 0.44 | $ | 0.16 | $ | 0.08 | $ | 0.15 | ||||||
| Net earnings per diluted share | $ | 0.44 | $ | 0.16 | $ | 0.08 | $ | 0.15 | ||||||
| 13 Weeks Ended | 14 Weeks Ended | |||||||||||||
|---|---|---|---|---|---|---|---|---|---|---|---|---|---|---|
| Fiscal 2007 | August 24, 2006 | November 23, 2006 | February 22, 2007 | May 31, 2007 | ||||||||||
Revenues | $ | 93,407 | $ | 70,605 | $ | 71,418 | $ | 92,201 | ||||||
| Operating income | 21,182 | 8,467 | 1,853 | 9,637 | ||||||||||
| Net earnings | 13,707 | 10,091 | 4,028 | 5,471 | ||||||||||
| Net earnings per common share - diluted(1) | $ | 0.45 | $ | 0.33 | $ | 0.13 | $ | 0.18 | ||||||
| 13 Weeks Ended | ||||||||||||||
|---|---|---|---|---|---|---|---|---|---|---|---|---|---|---|
| Fiscal 2006 | August 25, 2005 | November 24, 2005 | February 23, 2006 | May 25, 2006 | ||||||||||
Revenues | $ | 86,245 | $ | 67,025 | $ | 68,751 | $ | 67,223 | ||||||
| Operating income | 18,487 | 8,299 | 5,637 | 7,117 | ||||||||||
| Net earnings | 15,489 | 5,044 | 4,723 | 3,015 | ||||||||||
| Net earnings per common share - diluted(1) | $ | 0.50 | $ | 0.16 | $ | 0.15 | $ | 0.10 | ||||||
12. Subsequent Events
On May 27, 2005,(1) Calculated on our Common Stock using the Company acquired the 220-room Wyndham Milwaukee Center in Milwaukee, Wisconsin. The assets purchased consist primarily of land, buildings and equipment. On June 1, 2005, the Company opened the 226-room Four Points by Sheraton Chicago Downtown/Magnificent Mile. The carrying value of this asset was included in construction in progress at year end.two-class method.
5363
| Item 9. | Changes in and Disagreements With Accountants on Accounting and Financial Disclosure. |
Not applicable.None.
| Item 9A. | Controls and Procedures. |
| (a) | Evaluation of disclosure controls and procedures. |
Based on their evaluations, as of the end of the period covered by this Annual Report on Form 10-K, our principal executive officer and principal financial officer have concluded that our disclosure controls and procedures (as defined in Rules 13a-15(e) and 15d-15(e) under the Securities Exchange Act of 1934 (the “Exchange Act”)) are effective to ensure that information required to be disclosed by us in reports that we file or furnish under the Exchange Act is recorded, processed, summarized and reported within the time periods specified in Securities and Exchange Commission rules and forms.
| (b) | Management’s report on internal control over financial |
The report of management required under this Item 9A is contained in the section titled “Item 8.8 – Financial Statements and Supplementary Data” under the heading “Management’s Report on Internal Control over Financial Reporting.”
| (c) | Attestation Report of Independent Registered Public Accounting |
The attestation report required under this Item 9A is contained in the section titled “Item 8 – Financial Statements and Supplementary Data” under the heading “Report of Independent Registered Public Accounting Firm.Firm on Internal Control over Financial Reporting.”
| (d) | Changes in internal control over financial reporting. |
There were no changes in our internal control over financial reporting identified in connection with the evaluation required by Rule 13a-15(b) of the Exchange Act during the fourth quarter of our fiscal 20052007 that has materially affected, or is reasonably likely to materially affect, our internal control over financial reporting.
| Item 10. | Directors and Executive Officers of the Company. |
The information required by this item with respect to directors is incorporated herein by reference to the information pertaining thereto set forth under the caption entitled “Election of Directors” in the definitive Proxy Statement for our 20052007 Annual Meeting of Shareholders scheduled to be held on October 6, 200516, 2007 (our “Proxy Statement”). The information required with respect to executive officers appears at the end of Part I of this Form 10-K. The required information with respect to compliance with Section 16(a) of the Securities Exchange Act of 1934 by directors and executive officers is incorporated by reference to the information pertaining thereto set forth under the caption entitled “Section 16(a) Beneficial Ownership Reporting Compliance” in our Proxy Statement.
We have adopted a written code of conduct that applies to all of our directors, officers and employees, which is available on our corporate web site (www.marcuscorp.com). No amendments to our code of conduct, or waivers from our code of conduct with respect to any of our executive officers or directors, have been made. If, in the future, we amend our code of conduct, or grant waivers from our code of conduct with respect to any of our executive officers or directors, we will make information regarding such amendments or waivers available on our corporate web site (www.marcuscorp.com) for a period of at least 12 months.
54
| Item 11. | Executive Compensation. |
The information required by this item is incorporated herein by reference to the information pertaining thereto set forth under the caption entitled “Executive Compensation”“Compensation Discussion and Analysis” in our Proxy Statement.
64
| Item 12. | Security Ownership of Certain Beneficial Owners and Management. |
The following table lists certain information about our fourthree stock option plans, our 1987 Stock Option Plan, our 1995 Equity Incentive Plan, our 1994 Nonemployee Director Stock Option Plan and our 2004 Equity Incentive Plan, all of which were approved by our shareholders:
| Number of securities to be issued upon the exercise of outstanding options | Weighted-average exercise price of outstanding options | Number of securities remaining available for future issuance under current equity compensation plan (excluding securities reflected in the first column) |
|---|---|---|
1,165,000 | $14.65 | 1,650,000 |
| Number of securities to be issued upon the exercise of outstanding options | Weighted-average exercise price of outstanding options | Number of securities remaining available for future issuance under current equity compensation plan (excluding securities reflected in the first column) |
|---|---|---|
1,137,000 | $12.69 | 1,444,000 |
The other information required by this item is incorporated herein by reference to the information pertaining thereto set forth under the caption entitled “Stock Ownership of Management and Others” in our Proxy Statement.
| Item 13. | Certain Relationships and Related Transactions. |
The information required by this item, to the extent applicable, is incorporated herein by reference to the information pertaining thereto set forth under the caption entitled “Certain Transactions” in our Proxy Statement.
| Item 14. | Principal Accounting Fees and Services. |
The information required by this item is incorporated by reference herein to the information pertaining thereto set forth under the caption “Other Matters” in our Proxy Statement.
| Item 15. | Exhibits and Financial Statement Schedules. |
| (a)(1) | Financial Statements. |
The information required by this item is set forth in “Item 8.8 – Financial Statements and Supplementary Data” above.
| (a)(2) | Financial Statement Schedules. |
All schedules are omitted because they are inapplicable, not required under the instructions or the financial information is included in the consolidated financial statements or notes thereto.
| (a)(3) | Exhibits. |
The exhibits filed herewith or incorporated by reference herein are set forth on the attached Exhibit Index.*
*Exhibits to this Form 10-K will be furnished to shareholders upon advance payment of a fee of $0.25 per page, plus mailing expenses. Requests for copies should be addressed to Thomas F. Kissinger, Vice President, General Counsel and Secretary, The Marcus Corporation, 100 East Wisconsin Avenue, Suite 1900, Milwaukee, Wisconsin 53202-4125.
5565
Pursuant to the requirements of Section 13 of the Securities Exchange Act of 1934, we havethe registrant has duly caused this report to be signed on its behalf by the undersigned, thereunto duly authorized.
| THE MARCUS CORPORATION | ||
Date: August | By: /s/ Stephen H. Marcus | |
| Stephen H. Marcus, | ||
| Chairman of the Board, President | ||
| and Chief Executive Officer |
Pursuant to the requirements of the Securities Exchange Act of 1934, this report has been signed below by the following persons on behalf of us and in the capacities as of the date indicated above.
| By: | /s/ Stephen H. Marcus | By: | /s/ Daniel F. McKeithan, Jr. |
| Stephen H. Marcus, Chairman of the | Daniel F. McKeithan, Jr., Director | ||
| Board, President and Chief Executive | |||
| Officer (Principal Executive Officer) | |||
By: | /s/ Douglas A. Neis | By: | /s/ Diane Marcus Gershowitz |
| Douglas A. Neis, Chief Financial | Diane Marcus Gershowitz, Director | ||
| Officer and Treasurer (Principal | |||
| Financial Officer and Accounting | |||
| Officer) | |||
By: | /s/ Bruce J. Olson | By: | /s/ Timothy E. Hoeksema |
| Bruce J. Olson, Director | Timothy E. Hoeksema, Director | ||
By: | /s/ Philip L. Milstein | By: | /s/ Allan H. Selig |
| Philip L. Milstein, Director | Allan H. Selig, Director | ||
By: | /s/ Bronson J. Haase | By: | /s/ James D. Ericson |
| Bronson J. Haase, Director | James D. Ericson, Director | ||
By: | /s/ Gregory S. Marcus | ||
| Gregory S. Marcus, Director |
The most recent certifications by our Chief Executive Officer and Chief Financial Officer pursuant to Section 302 of the Sarbanes-Oxley Act of 2002 are filed as exhibits to the Form 10-K. We have also filed with the New York Stock Exchange the most recent Annual CEO Certification as required by Section 303A.12(a) of the New York Stock Exchange Listed Company Manual.
S-1
EXHIBIT INDEX
| 2.1 | Asset Purchase Agreement dated |
| 3.1 | Restated Articles of Incorporation. [Incorporated by reference to Exhibit 3.2 to our Quarterly Report on Form 10-Q for the quarterly period ended November 13, 1997.] |
| 3.2 | Bylaws, as amended as of |
| The Marcus Corporation Note Purchase Agreement dated October 25, 1996. [Incorporated by reference to Exhibit 4.1 to our Quarterly Report on Form 10-Q for the quarterly period ended November 14, 1996.] |
| 4.2 | First Supplement to Note Purchase Agreements dated May 15, 1998. [Incorporated by reference to Exhibit 4.3 to our Annual Report on Form 10-K for the fiscal year ended May 28, 1998.] |
| 4.3 | Second Supplement to Note Purchase Agreements dated May 7, 1999. [Incorporated by reference to Exhibit 4.4 to our Annual Report on Form 10-K for the fiscal year ended May 27, 1999.] |
| 4.4 | Third Supplement to Note Purchase Agreements dated April 1, 2002. [Incorporated by reference to Exhibit 4.6 to our Quarterly Report on Form 10-Q for the quarterly period ended February 28, 2002.] |
| 4.5 | Credit Agreement dated April 30, 2004, by and among The Marcus Corporation, U.S. Bank National Association, Bank of America, N.A., Bank One, NA, LaSalle Bank National Association, and the other financial institutions party hereto. [Incorporated by reference to Exhibit 4.6 to our Annual Report on Form 10-K for the fiscal year ended May 27, 2004.] |
| Other than as set forth in Exhibits 4.1, 4.2, 4.3, 4.4 |
| 10.1* | The Marcus Corporation 1995 Equity Incentive Plan, as amended. [Incorporated by reference to Exhibit |
| 10.2* | The Marcus Corporation 1994 Nonemployee Director Stock Option |
| 10.3* | The Marcus Corporation 2004 Equity Incentive |
| 10.4* | Form of The Marcus Corporation 2004 Equity Incentive Plan Stock Option Award (Employees). |
E-1
E-1
| 10.5* | Form of The Marcus Corporation 2004 Equity Incentive Plan Stock Option Award (Non-Employee Directors). [Incorporated by reference to Exhibit 10.5 to our Annual Report on Form 10-K for the fiscal year ended May 26, 2005.] |
| 10.6* | Form of The Marcus Corporation Equity Incentive Plan Restricted Stock Agreement. [Incorporated by reference to Exhibit 10.6 to our Annual Report on Form 10-K for the fiscal year ended May 26, 2005.] |
| 10.7* | The Marcus Corporation Variable Incentive Plan Terms, as amended. [Incorporated by reference to Exhibit 10.1 to our Current Report on Form 8-K dated July 18, 2007.] |
| 10.8* | The Marcus Corporation Deferred Compensation Plan. [Incorporated by reference to Exhibit 10.8 to our Annual Report on Form 10-K for the fiscal year ended May 25, 2006.] |
| 10.9* | The Marcus Corporation Retirement Income Plan. [Incorporated by reference to Exhibit 10.9 to our Annual Report on Form 10-K for the fiscal year ended May 25, 2006.] |
| 21 | Our subsidiaries as of May |
| 23 | Consent of Ernst & Young LLP. |
| 31.1 | Certification by the Chief Executive Officer pursuant to Section 302 of the Sarbanes-Oxley Act of 2002. |
| 31.2 | Certification by the Chief Financial Officer pursuant to Section 302 of the Sarbanes-Oxley Act of 2002. |
| 32 | Certification of Chief Executive Officer and Chief Financial Officer pursuant to 18 U.S.C.ss.1350 |
| 99.1 | Administrative Services Agreement between Marcus Investments, LLC and The Marcus Corporation, as amended, dated July 18, 2007. |
| 99.2 | Proxy Statement for the |
*This exhibit is a management contract or compensatory plan or arrangement required to be filed as an exhibit to this form pursuant to Item 14(c) of Form 10-K.
E-2