Item 1. BusinessINTRODUCTION Coeur d’Alene Mines Corporation is a large primary silver producer located in North America and is engaged, through its subsidiaries, in the operation and/or ownership, development and exploration of silver and gold mining properties and companies located primarily within the United States (Nevada and Alaska), South America (Chile, Argentina and Bolivia), Australia (New South Wales), Mexico (Chihuahua) and Africa (Tanzania). Coeur d’Alened��Alene Mines Corporation and its subsidiaries are hereinafter referred to collectively as “Coeur” or the “Company.”OVERVIEW OF MINING PROPERTIES AND INTERESTS The Company’s most significant operating and development-stage mining properties and interests are:TheRochester mine is a silver and gold surface mining operation located in northwestern Nevada and is 100% owned and operated by Coeur. It is one of the largest primary silver mines in the United States. During 1999, the Company acquired the mineral rights to theNevada Packard property, which is located one and one-half miles south of the Rochester mine, and commenced mining there in the first quarter of 2003.
Coeur owns 100% of theCerro Bayo minein southern Chile, which comprises a high grade gold and silver underground mine and processing facilities. The Cerro Bayo deposit was discovered during 2000. Initial mining operations commenced in late 2001 and processing started in April 2002. The Company carries on an active exploration program on its 205 square mile property package.
Coeur owns 100% of the capital stock of Coeur Argentina S.R.L., which owns and operates the underground high-grade silverMartha mine located in Santa Cruz, Argentina, approximately 270 miles southeast of the Cerro Bayo mine. Mining operations commenced at the Martha mine in June 2002. The Company carries on an active exploration program at its Martha mine and on its other land in Santa Cruz which totals over 600 square miles.
The Company acquired, in May 2005, all of the silver production and reserves, up to 20.0 million payable ounces, contained at theEndeavor mine in Australia which is owned and operated by Cobar Operations Pty. Limited (“Cobar”), a wholly-owned subsidiary of CBH Resources Ltd. (“CBH”) for up to $39.1 million. The Endeavor mine is an underground zinc/lead/silver mine located in New South Wales, Australia which has been in production since 1983.
The Company acquired, in September 2005, all of the silver production and reserves, up to 17.2 million payable ounces, contained at theBroken Hill mine in Australia, which is owned and operated by Perilya Broken Hill Ltd. (“PBH”) for $36.7 million. The Broken Hill Mine is located in New South Wales, Australia and is an underground zinc/lead/silver mine.
Coeur owns 100% of Empresa Minera Manquiri S.A.(“Manquiri”), a Bolivian company that controls the mining rights for theSan Bartolome project, which is an open pit silver mine in Bolivia where an updated feasibility study was completed in 2004 and construction activities have commenced. The Company expects commercial production from the San Bartolome project to commence in early 2008.
4
The Company owns 100% of theKensington property, located north of Juneau, Alaska, which is a development-stage gold property. An updated feasibility study was completed for the property during 2004 and construction activities commenced in 2005. A lawsuit has been filed in Federal Appellate Court challenging a certain permit necessary for construction of a required tailings facility. The Company is currently conducting construction activities not impacted by the temporary injunction pending appeal. The Company believes production could commence in late 2007, subject to successful and timely resolution of the permitting challenge and pending litigation described above. On September 12, 2005 three environmental groups (“Plaintiffs”) filed a lawsuit in Federal District Court in Alaska against the Corps of Engineers and the U.S. Forest Service (“USFS”) seeking to invalidate permits issued to Coeur Alaska, Inc. for the Company’s Kensington mine. The Plaintiffs claim the Clean Water Act (“CWA”) Section 404 permit issued by the Corps of Engineers authorizing the deposition of mine tailings into Lower Slate Lake conflicts with the CWA. They additionally claim the USFS’s approval of the Amended Plan of Operations is arbitrary and capricious because it relies on the 404 permit issued by the Corps of Engineers.
On August 4, 2006,•TheRochester mineis a silver and gold surface mining operation located in northwestern Nevada that has been 100% owned and operated by the Federal District Court in Alaska dismissedCompany since 1986. During 1999, the Plaintiffs’challengeCompany acquired the mineral rights to theNevada Packardproperty, which is located one and upheld the Section 404 permit. On August 7, 2006 the Plaintiffs filed a Notice of Appealone-half miles south of the decisionRochester mine, and commenced mining there in the first quarter of 2003. The mining of ore at the mine was completed during 2007; however, silver and gold production is expected to continue through 2011 as a result of heap leach activities. The Company has announced it may consider the Ninth Circuit Courtsale of Appeals (Circuit Court)this property during 2008. • Coeur owns 100% of theCerro Bayo minein southern Chile, which comprises a high grade gold and silver underground mine and processing facilities. The Cerro Bayo deposit was discovered during 2000. Initial mining operations commenced in late 2001 and processing started in April 2002. The Company carries on an active exploration program on its 176 square mile property package in southern Chile. • Coeur owns 100% of the capital stock of Coeur Argentina S.R.L.,which owns and operates the underground high-grade silverMartha minelocated in Santa Cruz, Argentina, approximately 270 miles southeast of the Cerro Bayo mine. Mining operations commenced at the Martha mine in June 2002. In 2007 the Company built a stand-alone mill to process ore from the Martha mine which previously was transported to Cerro Bayo for processing. The Company carries on an active exploration program at its Martha mine and on August 9, 2006 Plaintiffs additionallyits other land in Santa Cruz which totals over 560 square miles. • The Company acquired, in May 2005, all of the silver production and reserves, up to 20.0 million payable ounces, contained at theEndeavor minein Australia which is owned and operated by Cobar Operations Pty. Limited (“Cobar”), a wholly-owned subsidiary of CBH Resources Ltd. (“CBH”) for up to $43.8 million. The Endeavor mine is an underground zinc/lead/silver mine located in New South Wales, Australia which has been in production since 1983. • The Company acquired, in September 2005, all of the silver production and reserves, up to 17.2 million payable ounces, contained at theBroken Hill minein Australia, which is owned and operated by Perilya Broken Hill Ltd. (“PBH”), for $36.9 million. The Broken Hill Mine is located in New South Wales, Australia and is an underground zinc/lead/silver mine.
3
| • | Coeur owns 100% of Empresa Minera Manquiri S.A.(“Manquiri”), a Bolivian company that controls the mining rights for theSan Bartolomé project, which is an open pit silver mine in Bolivia where an updated feasibility study was completed in 2004 and construction activities have commenced. The Company expects construction to be completed and commercial production to commence from the San Bartolomé project in the first quarter of 2008. | ||
| • | The Company owns 100% of theKensington property, located north of Juneau, Alaska, which is a development-stage gold property. An updated feasibility study was completed for the property during 2004 and construction activities commenced in 2005. A lawsuit was filed in 2005 in Federal Court challenging a | ||
| • | On |
development compared to $15.0 million spent on similar activities in 2007.
4
5
SOURCES OF REVENUE The Rochester mine, Cerro Bayo mine and Martha mine, each operated by the Company, and the Endeavor and Broken Hill mines operated by others, constituted the Company’s principal sources of mining revenues in 2006.2007. The following table sets forth information regarding the percentage contribution to the Company’s total revenues (i.e., revenues from the sale of concentrates and doré) by the sources of those revenues during the past five years:Mine/Company
Coeur Percentage
Ownership at
December 31, 2006
Percentage of Total Revenues(2)
for the Years Ended December 31,
2006
2005
2004
2003
2002
Rochester Mine 100 % 47 % 45 % 59 % 48 % 78 % Cerro Bayo Mine 100 23 38 32 43 17 Martha Mine 100 16 13 9 9 5 Endeavor Mine(1) 100 3 1 -- -- -- Broken Hill Mine(1) 100 11 3 -- -- --
100 % 100 % 100 % 100 % 100 %
Coeur Percentage Percentage of Total Revenues(2) Ownership at for the Years Ended December 31, Mine/Company December 31, 2007 2007 2006 2005 2004 2003 Rochester Mine 100 % 47 % 47 % 45 % 59 % 48 % Cerro Bayo Mine 100 22 23 38 32 43 Martha Mine 100 18 16 13 9 9 Endeavor Mine(1) 100 4 3 1 — — Broken Hill Mine(1) 100 9 11 3 — — 100 % 100 % 100 % 100 % 100 %
(1) Ownership interest reflects the Company’s ownership interest in the property’s silver reserves.production. Other constituent metals are owned by another non-affiliated entity.
(2) On June 1, 2006, the Company completed its sale of Coeur Silver Valley (Galena). The Company’s interest in the Galena mine was 100% prior to the sale. Revenues from the Galena mine are reflected in Discontinued Operations.
DEFINITIONS The following sets forth definitions of certain important mining terms used in this report.“Ag”is the abbreviation for silver.“Au”is the abbreviation for gold.“Cash Costs”are costs directly related to the physical activities of producing silver and gold, and include mining, processing, transportation and other plant costs, third-party refining and smelting costs, marketing expense, on-site general and administrative costs, royalties and in-mine drilling expenditures that are related to production and other direct costs. Sales of by-product metals, including gold, are deducted from the above in computing cash costs per ounce. Cash costs exclude depreciation, depletion and amortization, corporate general and administrative expense, exploration, interest, and pre-feasibility costs and accruals for mine reclamation. Cash costs are calculated and presented using the “Gold Institute Production Cost Standard” applied consistently for all periods presented.“Cash Costs per Ounce”are calculated by dividing the cash costs computed for each of the Company’s mining properties for a specific period by the amount of gold ounces or silver ounces produced by that property during that same period. Management uses cash costs per ounce produced as a key indicator of the profitability of each of its mining properties. Gold and silver are sold and priced in the world financial markets on a USU.S. dollar per ounce basis. By calculating the cash costs from each of the Company’s mines on the same unit basis, management can easily determine the gross margin that each ounce of gold and silver produced is generating. While this represents a key indicator of the performance of the Company’s mining properties you are cautioned not to place undue reliance on this single measurement. To fully evaluate a mine’s performance, management also monitors USU.S. Generally Accepted Accounting Principles (“GAAP”) based profit/(loss), depreciation and amortization expenses and capital expenditures for each mine as presented in Note Q –R — Segment Information in the Notes to the Company’s Consolidated Financial Statements. Total cash costs per ounce is a non-GAAP measurement and investors are cautioned not to place undue reliance on it and are urged to read all GAAP accounting disclosures presented in the consolidated financial statements and accompanying footnotes.5
6
“Concentrate”is a product containing the valuable metal and from which most of the waste material in the ore has been eliminated.“Cut-off Grade”is the lowest grade of mineral resource considered economic; used in the calculation of reserves in a given deposit.“Cyanidation”is a method of extracting gold or silver by dissolving it in a weak solution of sodium or potassium cyanide.“Dilution”is an estimate of the amount of waste or low-grade mineralized rock which will be mined with the ore as part of normal mining practices in extracting an ore body.“Doré”is unrefined gold and silver bullion bars which contain gold, silver and minor amounts of impurities which will be further refined to almost pure metal.“Gold”is a metallic element with minimum fineness of 999 parts per 1000 parts pure gold.“Heap Leaching Process”is a process of extracting gold and silver by placing broken ore on an impermeable pad and applying a diluted cyanide solution that dissolves a portion of the contained gold and silver, which are then recovered in metallurgical processes.“Mineralized Material”is gold and silver bearing material that has been physically delineated by one or more of a number of methods, including drilling, underground work, surface trenching and other types of sampling. This material has been found to contain a sufficient amount of mineralization of an average grade of metal or metals to have economic potential that warrants further exploration evaluation. While this material is not currently or may never be classified as ore reserves, it is reported as mineralized material only if the potential exists for reclassification into the reserves category. This material cannot be classified in the reserves category until final technical, economic and legal factors have been determined. Under the United States Securities and Exchange Commission’s standards, a mineral deposit does not qualify as a reserve unless it can be economically and legally extracted at the time of reserve determination and it constitutes a proven or probable reserve (as defined below).“Non-cash Costs”are costs that are typically accounted for ratably over the life of an operation and include depreciation, depletion and amortization of capital assets, accruals for the costs of final reclamation and long-term monitoring and care that are usually incurred at the end of mine life, and the amortization of the cost of property acquisitions.“Ore Reserve”is the part of a mineral deposit which could be economically and legally extracted or produced at the time of the reserve determination.“Probable Reserve”is a part of a mineralized deposit which can be extracted or produced economically and legally at the time of the reserve determination. The quantity and grade and/or quality of a probable reserve is computed from information similar to that used for a proven reserve, but the sites for inspection, sampling and measurement are farther apart or are otherwise less adequately spaced. The degree of assurance, although lower than that for proven reserves, is high enough to assume continuity between points of observation. Mining dilution, where appropriate, has been factored into the estimation of probable reserves.7
“Proven Reserve”is a portion of a mineral deposit which can be extracted or produced economically and legally at the time of the reserve determination. The quantity of a proven reserve is computed from dimensions revealed in outcrops, trenches, workings or drill holes; grade and/or quality are computed from the results of detailed sampling and the sites for inspections, sampling and measurement are spaced so closely and the geologic character is so well defined that size, shape, depth and mineral content of a proven reserve is well-established. Mining dilution, where appropriate, has been factored into the estimation of proven reserves.6
“Run-of-mine Ore”is mined ore which has not been subjected to any pretreatment, such as washing, sorting or crushing prior to processing.“Silver”is a metallic element with minimum fineness of 995 parts per 1000 parts pure silver.“Stripping Ratio”is the ratio of the number of tons of waste material to the number of tons of ore extracted at an open-pit mine.“Ton”means a short ton which is equivalent to 2,000 pounds, unless otherwise specified.“Total costs”are the sum of cash costs and non-cash costs.IMPORTANT FACTORS RELATING TO FORWARD-LOOKING STATEMENTS This report contains numerous forward-looking statements relating to the Company’s gold and silver mining business, including estimated production data, expected operating schedules, expected capital costs and other operating data and permit and other regulatory approvals. Such forward-looking statements are identified by the use of words such as “believes,” “intends,” “expects,” “hopes,” “may,” “should,” “plan,” “projected,” “contemplates,” “anticipates” or similar words. Actual production, operating schedules, results of operations, ore reserve and resource estimates and other projections and estimates could differ materially from those projected in the forward-looking statements. The factors that could cause actual results to differ materially from those projected in the forward-looking statements include (i) the risk factors set forth below under Item 1A, (ii) the risks and hazards inherent in the mining business (including environmental hazards, industrial accidents, weather or geologically related conditions), (iii) changes in the market prices of gold and silver, (iv) the uncertainties inherent in the Company’s production, exploratory and developmental activities, including risks relating to permitting and regulatory delays, (v) the uncertainties inherent in the estimation of gold and silver ore reserves, (vi) changes that could result from the Company’s future acquisition of new mining properties or businesses, (vii) the effects of environmental and other governmental regulations, and (viii) the risks inherent in the ownership or operation of or investment in mining properties or businesses in foreign countries. Readers are cautioned not to put undue reliance on forward-looking statements. The Company disclaims any intent or obligation to update publicly these forward-looking statements, whether as a result of new information, future events or otherwise.Item 1A. Risk Factors The following information sets forth information relating to important risks and uncertainties that could materially adversely affect the Company’s business, financial condition or operating results. References to “we,” “our” and “us” in these risk factors refer to the Company. Additional risks and uncertainties that we do not presently know or that we currently deem immaterial may also impair our business operations.Risks Relating to our Business
Prior to 2005, we incurred losses due to several factors and could incur losses in the future. We incurred net losses in the five years prior to 2005 and had losses from continuing operations in each of those prior periods. Factors that significantly contributed to our losses were:
8
historically low gold and silverThe market prices during those years;
our deliberate pursuit of a growth policy prior to 2003 calling for the acquisition of mining propertiessilver and companies and financing such growth principally by incurring convertible indebtedness which had a high coupon rate, thereby resulting in an interest expense of $21.9 million in 2002, $12.9 million in 2003 and $2.8 million in 2004;
write-offs for impaired assets and other holding costs in 2002 of $19.0 million; and
losses on the early retirement of debt of $19.1 million in 2002, and $41.6 million in 2003.
gold are volatile. If we experience low silver and gold prices declineit may result in decreased revenues and decreased net income or losses, and may negatively affect our business.
Silver and gold are commodities. Their prices fluctuate, and are affected by many factors beyond our control, including interest rates, expectations regarding inflation, speculation, currency values, governmental decisions regarding the disposal of precious metals stockpiles, global and regional demand and production, political and economic conditions and other factors. Because we currently derive approximately 70% of our revenues from continuing operations from sales of silver, our earnings are unableprimarily related to reduce our production costs, our losses may resume. If lowerthe price of this metal.7
The market prices of silver (Handy & Harman) and gold (London Final) on February 12, 2008 were $17.32 and $917 per ounce, respectively. The prices of silver and gold may decline in the future. Factors that are generally understood to contribute to a decline in the price of silver include sales by private and government holders, and a general global economic slowdown. Coeur may also suffer from declines in mineral prices. Since 1999, Coeur has not engaged in any silver hedging activities and is currently not engaged in any gold hedging activities. Accordingly, Coeur has no protection from declines in mineral prices make mining ator currency fluctuations. If the prices of silver and gold are depressed for a sustained period and our properties uneconomical,net losses resume, we may be requiredforced to recognizesuspend mining at one or more of our properties until the prices increase, and to record additional asset impairment write-downs. Any lost revenues, continued or increased net losses or additional asset impairment write-downs which would increase our operating losses and negatively impactadversely affect our results of operations.We may be required to incur additional indebtedness to fund our capital expenditures. We have historically financed our operations through the issuance of common stock and convertible debt, and may be required to incur additional indebtedness in the future. During 2004,2008, we commencedwill have construction activities at the San Bartolome projectBartolomé, Palmarejo and in 2005 we commenced constructionKensington projects as well as sustaining capital projects at Kensington project.our operating properties. Construction of bothall of these projects could require a total capital investment of approximately $398.0$398.5 million of which approximately $196.4 million will be required in future periods. While we believe that ourduring 2008. Our cash, cash equivalents and short-term investments combined with cash flow generated from operations will not be sufficient for us to make this level of capital investment and no assurance can be given that additional capital investments will not be required to be made at these or other projects. If we are unable to generate enough cash to finance such additional capital expenditures through operating cash flow and the issuance of common stock, we may be required to issue additional indebtedness.indebtedness or secure other forms of financing or delay the capital projects. Any additional indebtedness would increase our debt payment obligations, and may negatively impact our results of operations.Prior to 2005, we did not have sufficient earnings to cover fixed charges, which deficiency could occur in future periods. As a result of our net losses prior to 2005, our earnings were not adequate to satisfy fixed charges (i.e., interest, preferred stock dividends and that portion of rent deemed representative of interest) in each of those periods prior to 2005. The amounts by which earnings were inadequate to cover fixed charges were approximately $80.8 million in 2002, $63.9 million in 2003 and $22.7 million in 2004. Earnings have been sufficient to cover fixed charges subsequent to 2004. We are required to make fixed payments on the $180 million principal amount of our 1¼11/4% Senior Convertible Notes due 2024, requiring annual interest payments of approximately $2.25 million until their maturity. We expect to satisfy our fixed charges and other expense obligations in the future from cash flow from operations and, if cash flow from operations is insufficient, from working capital, which amounted to approximately $383.1$152.4 million at December 31, 2006.2007. Prior to 2005, we experienced negative cash flow from operating activities. The amount of net cash used in our operating activities amounted to approximately $8.5 million in 2002, $5.1 million in 2003 and $18.6 million in 2004. During the years ended December 31, 20062007 and 2005,2006, we generated $91.2$40.1 million and $6.7$91.2 million, respectively, of operating cash flow. The availability of future cash flow from operations or working capital to fund the payment of interest on the notes and other fixed charges will be dependent upon numerous factors, including our results of operations, silver and gold prices, levels and costs of production at our mining properties and the amount of our capital expenditures and expenditures for acquisitions, developmental and exploratory activities.8
The market prices of silver and gold are volatile. If we experience low silver and gold prices it may result in decreased revenues and decreased net income or losses, and may negatively affect our business.
9
Silver and gold are commodities. Their prices fluctuate, and are affected by many factors beyond our control, including interest rates, expectations regarding inflation, speculation, currency values, governmental decisions regarding the disposal of precious metals stockpiles, global and regional demand and production, political and economic conditions and other factors. Because we currently derive approximately 68% of our revenues from continuing operations from sales of silver, our earnings are primarily related to the price of this metal.
The market prices of silver (Handy & Harman) and gold (London Final) on February 16, 2006 were $13.96 and $665 per ounce, respectively. The prices of silver and gold may decline in the future. Factors that are generally understood to contribute to a decline in the price of silver include sales by private and government holders, and a general global economic slowdown.
If the prices of silver and gold are depressed for a sustained period and our net losses resume, we may be forced to suspend mining at one or more of our properties until the prices increase, and to record additional asset impairment write-downs. Any lost revenues, continued or increased net losses or additional asset impairment write-downs would adversely affect our results of operations.
We may have to record additional write-downs, which could negatively impact our results of operations. Statement of Financial Accounting Standards No. 144,Accounting for the Impairment or Disposal of Long-Lived Assets(“SFAS 144)144”) established accounting standards for impairment of the value of long-lived assets such as mining properties. SFAS 144 requires a company to review the recoverability of the cost of its assets by estimating the future undiscounted cash flows expected to result from the use and eventual disposition of the asset. Impairment, measured by comparing an asset’s carrying value to its fair value, must be recognized when the carrying value of the asset exceeds these cash flows, and recognizing impairment write-downs could negatively impact our results of operations. If silver or gold prices decline or we fail to control production costs or realize the mineableminable ore reserves at our mining properties, we may be required to recognize further asset write-downs. We also may record other types of additional mining property write-downscharges in the future to the extent a property is sold by us for a price less than the carrying value of the property, or if liability reservesreclamation liabilities have to be increased in connection with the closure and reclamation of a property. Additional write-downs of mining properties could negatively impact our results of operations. The Kensington property has been the subject of litigation involving a permit required to complete construction of a required tailings facility. On September 12, 2005 three environmental groups (“Plaintiffs”) filed a lawsuit in Federal District Court in Alaska against the U.S. Army Corps of Engineers (“Corps of Engineers”) and the U.S. Forest Service (“USFS”) seeking to invalidate the permit issued to Coeur Alaska, Inc. for the Company’s Kensington mine. The Plaintiffs claim the Clean Water Act (CWA)(“CWA”) Section 404 permit issued by the Corps of Engineers authorizing the deposition of mine tailings into Lower Slate Lake conflicts with the CWA. They additionally claim the USFS’s approval of the Amended Plan of Operations is arbitrary and capricious because it relies on the 404 permit issued by the Corps of Engineers. On November 8, 2005, Following the Corps of Engineers filed a Motion for Voluntary Remand with the court to review the permit issued to the Company under the CWA Section 404 and requested that the court stay the legal proceeding filed by the plaintiffs pending the outcome of review. On November 12, 2005, the Federal District Court in Alaska granted theCourt’s remand of the Section 404 permit to the Corps of Engineers for further review. On November 22, 2005,review, the Corps of Engineers advised the Company that it was suspending the Section 404 permit pursuant to the Court’s remand to further review the permit.
10
On March 29, 2006, the Corps of Engineers reinstated the Company’s 404 permit. On April 6, 2006 thepermit on March 29, 2006. The lawsuit challenging the permit was re-opened andon April 6, 2006; Coeur Alaska Inc. filed its answer to the Amended ComplaintComplaint; and Motion to Intervene as a Defendant-Intervenor in the action. Two other parties,Coeur Alaska, the State of Alaska, and Goldbelt, Inc., a local native corporation, also filed Motions to Intervene as Defendant-Intervenors as supporters of the Kensington project as permitted. The Company, the State of Alaska and Goldbelt, Inc. were granted Defendant-Intervenor status and joinedto join the agencies in their defense of the permits as issued.
permit.
On August 4, 2006, the Federal District Court in Alaska dismissed the Plaintiffs’ challenge and upheld the Section 404 permit. On August 7, 2006 the Plaintiffs filed a Notice of Appeal of the decision to the Ninth Circuit Court of Appeals (“Ninth Circuit Court”) and on August 9, 2006 the Plaintiffs additionally filed a Motion for Injunction Pending Appeal with the Ninth Circuit Court. The Ninth Circuit Court granted a temporary injunction pending appeal on August 24, 2006, enjoining certain activities relating to the lake tailings facility. The On May 22, 2007 the Ninth Circuit Court further ordered an expedited briefing schedulereversed the District Court’s August 4, 2006 decision which had upheld the Company’s 404 permit and issued its opinion that remanded the case to the District Court with instructions to vacate the Company’s 404 permit as well as the USFS Record of Decision approving the general tailings disposal plan as well as the Goldbelt 404 permit to construct the Cascade Point Marine Facility. On August 20, 2007, Coeur Alaska filed a Petition for Rehearing En Banc with the Ninth Circuit Court, as did the State of Alaska and Goldbelt, Inc. The Department of Justice, on the meritsbehalf of the legal challenge.Corps of Engineers, and USFS additionally filed a limited Petition for Rehearing with the Ninth Circuit panel seeking reconsideration of the mandate of the May 22, 2007 panel decision. On October 13, 2006,29, 2007, the parties filed their briefs inNinth Circuit denied the Petitions for Rehearing En Banc. On November 14, 2007 the Ninth Circuit granted a stay of the mandate pending further appeal to the Supreme Court, and subsequently participated in an oral argument on December 4, 2006. There is no indicationsubject to the development of whena reclamation plan for the Circuit Court may rule on the merits on appeal.lake area. The Company, is unableand the State of Alaska, filed Petitions for Certiorari to the Supreme Court of the United States on January 28, 2008. The Company cannot now predict the outcome of the litigationpotential for obtaining further appeal or the impact of the temporary injunction.if it will prevail upon appeal if one is granted.9
This litigation has contributed to an increase in capital costs. While the Company cannot now predict with certainty the outcome of this litigation, it believes it willshould ultimately prevail in the defense of the awarded permits, inprevail. In the event that the Company does not prevail, it could be necessary to seek an alternate site for the tailings disposal facility. The Company is not aware ofhas identified an alternate site that couldwhich it believes can be permitted or would be economic. Therefore, it is possible that an adverse legal decision could renderand has submitted a modified plan to the project uneconomic and an asset writedown would be necessary. As a result ofUSFS. Based upon the increase in capital and operating costs at the Kensington project,Company’s current estimates, an impairment writedown could be necessary should the expectation of the long-term price for gold decrease below approximately $510$606 per ounce. As of December 31, 2006,2007, the Kensington project has a carrying value of $206the Kensington project’s long-lived assets was $298.2 million. Additionally, the value allocated to Palmarejo’s long-lived assets will be subject to assessments of recoverability under SFAS 144 and these assessments could result in writedowns of carrying values in future periods.Coeur may not realize the cost savings and other benefits it currently anticipates due to challenges associated with integrating operations, personnel and other aspects of the companies and due to liabilities that may exist at Bolnisi and Palmarejo. Coeur’s acquisition of Bolnisi and Palmarejo reflected its expectation that the acquisitions will result in increased metal production, earnings and cash flow for the combined company. These anticipated increases will depend in part on whether Coeur’s, Bolnisi’s and Palmarejo’s operations can be integrated in an efficient and effective manner, and whether the project development in fact produces the benefits anticipated. Most operational and strategic decisions, and certain staffing decisions, with respect to the combined company have not yet been made and may not have been fully identified. These decisions and the integration of the three companies will present significant challenges to management, including the integration of systems and personnel of the three companies, and special risks, including possible unanticipated liabilities, significant one-time write-offs or restructuring charges, unanticipated costs, and the loss of key employees. There can be no assurance that there will be operational or other synergies realized by the combined company, or that the integration of the three companies’ operations, management and cultures will be timely or effectively accomplished, or ultimately will be successful in increasing earnings and reducing costs. In addition, the integration of Bolnisi and Palmarejo may subject Coeur to liabilities existing at one or both of Bolnisi and Palmarejo, some of which may be unknown. While Coeur has conducted due diligence on the operations of Bolnisi and Palmarejo, there can be no guarantee that Coeur is aware of any and all liabilities of Bolnisi and Palmarejo. These liabilities, and any additional risks and uncertainties related to the acquisitions not currently known to Coeur or that Coeur may currently deem immaterial, could negatively impact Coeur’s business, financial condition and results of operations.The Palmarejo project is a development-stage project and involves significant risks associated with development and commencement of commercial production. There can be no assurance that significant losses will not occur at the Palmarejo project in the near future or that the Palmarejo project will be profitable in the future. Coeur’s operating expenses and capital expenditures may increase in subsequent years as needed consultants, personnel and equipment associated with advancing exploration, development and commercial production of the Palmarejo project and any other properties Coeur may acquire are added. The amounts and timing of expenditures will depend on the progress of ongoing exploration and development and the results of consultants’ analyses and recommendations, which are beyond Coeur’s control. While Coeur expects production at the Palmarejo project to commence in 2009, there can be no assurance that this timetable will be met. The development of the Palmarejo project and any other properties Coeur may acquire will require the commitment of substantial resources to conduct the time-consuming exploration and development of properties. There can be no assurance that Coeur will generate any revenues or achieve profitability at the Palmarejo project and any other properties Coeur may acquire.10
Recently discovered settlement and subsidence issues at the Palmarejo project may increase development costs and delay the start of production. In early August 2007, Coeur representatives observed previously unnoticed ground settlement and subsidence in three main areas: the lower plant site, the upper plant site, and the site where the power plant is to be located. The initial engineering review conducted by Coeur technical personnel as well as third party engineering consultants concluded that the settlement and subsidence was occurring primarily due to issues with the original compaction and placement of fill material. This settlement became visible once heavy rainfall was experienced. Since that time, Coeur’s third party engineering consultants have conducted more extensive on-site analysis and have provided Coeur with a detailed report based on its review, which recommends specific remedial actions that should be initiated which includes the relocation of a substantial section of the process plant facilities to an identified alternate site. Coeur estimates that these remedial actions may cost up to $15 million, which is an estimate endorsed by Coeur’s third party engineering consultants. Coeur anticipates production from the Palmarejo project to commence in the first quarter of 2009, which takes into account the estimated time to complete these remedial activities. There can be no assurance that these preliminary estimates will prove accurate, and any inaccuracy in such estimates could materially adversely impact the development of the Palmarejo project and Coeur’s financial condition and results of operations.Our revenues and income (or loss) from our interest in the Endeavor and Broken Hill mines are dependent in part upon the performance of the operators of the mine. In May and September 2005, we acquired silver production and reserves at the Endeavor and Broken Hill mines in Australia, respectively. These mines are owned and operated by other mining companies. The Company’s revenues and income (or loss) from its interest in the silver production at these mines are dependent in part upon the performance of those operators and such mines.The estimation of ore reserves is imprecise and depends upon subjective factors. Estimated ore reserves may not be realized in actual production. Our operating results may be negatively affected by inaccurate estimates. The ore reserve figures presented in our public filings are estimates made by our technical personnel. Reserve estimates are a function of geological and engineering analyses that require us to make assumptions about production costs and silver and gold market prices. Reserve estimation is an imprecise and subjective process and the accuracy of such estimates is a function of the quality of available data and of engineering and geological interpretation, judgment and experience. Assumptions about silver and gold market prices are subject to great uncertainty as those prices have fluctuated widely in the past. Declines in the market prices of silver or gold may render reserves containing relatively lower grades of ore uneconomic to exploit, and we may be required to reduce reserve estimates, discontinue development or mining at one or more of our properties, or write down assets as impaired. Should we encounter mineralization or geologic formations at any of our mines or projects different from those we predicted, we may adjust our reserve estimates and alter our mining plans. Either of these alternatives may adversely affect our actual production and operating results. We based our ore reserve determinations as of December 31, 20062007 on a long-term silver price average of $8.00$11 per ounce, with the exception of the San Bartolome mine which used $6.00 per ounce, the Endeavor mine which uses $10.00$15 per ounce and the Broken Hill mine which uses $10.12$13.50 per ounce of silver, and a long-term gold price average of $475$600 per ounce for all properties with the exception of the Kensington property which used a gold price of $550 per ounce. On February 16, 200712, 2008 silver and gold prices were $13.96$17.32 per ounce and $665$917 per ounce, respectively.11
The estimation of the ultimate recovery of metals contained within the Rochester heap leach pad inventory is inherently inaccurate and subjective and requires the use of estimation techniques. Actual recoveries can be expected to vary from estimations. The Rochester mine utilizes the heap leach process to extract silver and gold from ore. The heap leach process is a process of extracting silver and gold by placing ore on an impermeable pad and applying a diluted cyanide solution that dissolves a portion of the contained silver and gold, which are then recovered in metallurgical processes.11
The key stages in the conversion of ore into silver and gold are (i) the blasting process in which the ore is broken into large pieces; (ii) the processing of the ore through a crushing facility that breaks it into smaller pieces; (iii) the transportation of the crushed ore to the leach pad where the leaching solution is applied; (iv) the collection of the leach solution; (v) subjecting the leach solution to the precipitation process, in which gold and silver is converted back to a fine solid; (vi) the conversion of the precipitate into doré; and (vii) the conversion by a third party refinery of the doré into refined silver and gold bullion. We use several integrated steps to scientifically measure the metal content of ore placed on the leach pads during the key stages. As the ore body is drilled in preparation for the blasting process, samples of the drill residue are assayed to determine estimated quantities of contained metal. We estimate the quantity of ore by utilizing global positioning satellite survey techniques. We then process the ore through a crushing facility where the output is again weighed and sampled for assaying. A metallurgical reconciliation with the data collected from the mining operation is completed with appropriate adjustments made to previous estimates. We then transport the crushed ore to the leach pad for application of the leaching solution. As the leach solution is collected from the leach pads, we continuously sample for assaying. We measure the quantity of leach solution with flow meters throughout the leaching and precipitation process. After precipitation, the product is converted to doré, which is the final product produced by the mine. We again weigh, sample and assay the doré. Finally, a third party smelter converts the doré and determines final ounces of silver and gold available for sale. We then review this end result and reconcile it to the estimates we developed and used throughout the production process. Based on this review, we adjust our estimation procedures when appropriate. Our reported inventories include metals estimated to be contained in the ore on the leach padspad of $66.7$50.9 million as of December 31, 2006.2007. Of this amount, $31.3$25.9 million is reported as a current asset and $35.4$25.0 million is reported as a noncurrent asset. The distinction between current and noncurrent is based upon the expected length of time necessary for the leaching process to remove the metals from the crushed ore. The historical cost of the metal that is expected to be extracted within twelve months is classified as current and the historical cost of metals contained within the crushed ore that will be extracted beyond twelve months is classified as noncurrent. The ore on leach pad inventory is stated at actual production costs incurred to produce and place ore on the leach pad during the current period, adjusted for the effects on monthly production costs of abnormal production levels. The estimate of both the ultimate recovery expected over time, and the quantity of metal that may be extracted relative to such twelve month period, requires the use of estimates which are inherently inaccurate since they rely upon laboratory test work. Test work consists of 60 day leach columns from which we project metal recoveries into the future. The quantities of metal contained in the ore are based upon actual weights and assay analysis. The rate at which the leach process extracts gold and silver from the crushed ore is based upon laboratory column tests and actual experience occurring over approximately nineteen years of leach pad operation at the Rochester mine. The assumptions we use to measure metal content during each stage of the inventory conversion process includes estimated recovery rates based on laboratory testing and assaying. We periodically review our estimates compared to actual experience and revise our estimates when appropriate. The length of time necessary to achieve our currently estimated ultimate recoveries of between 59% and 61.5% for silver, depending on the area being leached, and 93% for gold is estimated to be between 5 and 10 years. However,In August 2007, the ultimate recovery will not be known until leachingCompany terminated mining and crushing operations cease, which is currently estimated for approximatelyas ore reserves were fully mined. Residual heap leach activities are expected to continue through 2011.12
When we began leach operations in 1986, based solely on laboratory testing, we estimated the ultimate recovery of silver and gold at 50% and 80%, respectively. Since 1986, we have adjusted the expected ultimate recovery three times (once in each of 1989, 1997 and 2003) based upon actual experience gained from leach operations. In 2003, we increased our estimated recoveries for silver and gold, respectively, to between 59% and 61.5%, for silver, depending on the area being leached, for silver, and 93% for gold. The leach cycle at the Rochester Mine requires leaching to approximately the year 2011 for all recoverable metal to be recovered.12
If our estimate of ultimate recovery requires adjustment, the impact upon our inventory valuation and upon our income statement would be as follows:Positive/Negative
Change in Silver Recovery
Positive/Negative
Change in Gold Recovery
1%
2%
3%
1%
2%
3%
Quantity of recoverable ounces 1.7 million 3.4 million 5.1 million 12,900 25,800 38,700
Positive impact on future cost of production per silver equivalent ounce for increases in recovery rates $1.06 $1.83 $2.43 $0.42 $0.79 $1.13
Negative impact on future cost of production per silver equivalent ounce for decreases in recovery rates $1.51 $3.87 $8.03 $0.48 $1.03 $1.66
Positive/Negative Positive/Negative Change in Silver Recovery Change in Gold Recovery 1% 2% 3% 1% 2% 3% Quantity of recoverable ounces 1.7 million 3.5 million 5.2 million 13,240 26,480 39,720 Positive impact on future cost of production per silver equivalent ounce for increases in recovery rates $ 1.68 $ 2.78 $ 3.55 $ 0.82 $ 1.49 $ 2.04 Negative impact on future cost of production per silver equivalent ounce for decreases in recovery rates $ (2.93 ) $ (9.30 ) $ (33.77 ) $ (1.04 ) $ (2.38 ) $ (4.21 )
Inventories of ore on leach pads are valued based upon actual production costs incurred to produce and place such ore on the leach pad during the current period, adjusted for the effects on monthly production costs of abnormal production levels, less costs allocated to minerals recovered through the leach process. The costs consist of those production activities occurring at the mine site and include the costs, including depreciation, associated with mining, crushing and precipitation circuits. In addition, refining is provided by a third party refiner to place the metal extracted from the leach pad in a saleable form. These additional costs are considered in the valuation of inventory. Negative changes in our inventory valuations and correspondingly on our income statement would have an adverse impact on our results of operations.operations, financial position and cash flows.
Our estimates of current and non-current inventories may not be realized in actual production and operating results, which may negatively affect our business. We use estimates, based on prior production results and experiences, to determine whether heap leach inventory will be recovered more than one year in the future, and is non-current inventory, or will be recovered within one year, and is current inventory. The estimates involve assumptions that may not prove to be consistent with our actual production and operating results. We cannot determine the amount ultimately recoverable until leaching is completed. If our estimates prove inaccurate, our operating results may be less than anticipated.Silver mining involves significant production and operational risks. Coeur may suffer from the failure to efficiently operate its mining projects. Silver mining involves significant degrees of risk, including those related to mineral exploration success, unexpected geological or mining conditions, the development of new deposits, climatic conditions, equipment and/or service failures, compliance with current or new governmental requirements, current availability of or delays in installing and commissioning plant and equipment, import or customs delays and other general operating risks. Problems may also arise due to the quality or failure of locally obtained equipment or interruptions to services (such as power, water, fuel or transport or processing capacity) or technical support, which results in the failure to achieve expected target dates for exploration or production activities and/or result in a requirement for greater expenditure. The right to export silver and gold may depend on obtaining certain licenses and quotas, the granting of which may be at the discretion of the relevant regulatory authorities. There may be delays in obtaining such licenses and quotas leading to the financial result of Coeur being adversely affected, and it is possible that from time to time export licenses may be refused. Many of these risks are outside of the ability of Coeur’s management to control and may result in a materially adverse effect on Coeur’s operations, financial position and cash flows.13
Mineral exploration and development inherently involves significant and irreducible financial risks. Coeur may suffer from the failure to find and develop profitable mines. The exploration for and development of mineral deposits involves significant financial risks, which even a combination of careful evaluation, experience and knowledge may not eliminate. Unprofitable efforts may result from the failure to discover mineral deposits. Even if mineral deposits are found, such deposits may be insufficient in quantity and quality to return a profit from production, or it may take a number of years until production is possible, during which time the economic viability of the project may change. Few properties which are explored are ultimately developed into producing mines. Mining companies rely on consultants and others for exploration, development, construction and operating expertise. Substantial expenditures are required to establish ore reserves, extract metals from ores and, in the case of new properties, to construct mining and processing facilities. The economic feasibility of any development project is based upon, among other things, estimates of the size and grade of ore reserves, proximity to infrastructures and other resources (such as water and power), metallurgical recoveries, production rates and capital and operating costs of such development projects, and metals prices. Development projects are also subject to the completion of favorable feasibility studies, issuance and maintenance of necessary permits and receipt of adequate financing. Once a mineral deposit is developed, whether it will be commercially viable depends on a number of factors, including: the particular attributes of the deposit, such as size, grade and proximity to infrastructure; government regulations including taxes, royalties and land tenure; land use, importing and exporting of minerals and environmental protection; and mineral prices. Factors that affect adequacy of infrastructure include: reliability of roads, bridges, power sources and water supply; unusual or infrequent weather phenomena; sabotage; and government or other interference in the maintenance or provision of such infrastructure. All of these factors are highly cyclical. The exact effect of these factors cannot be accurately predicted, but the combination may result in not receiving an adequate return on invested capital.Significant investment risks and operational costs are associated with our exploration, development and mining activities, such as San BartolomeBartolomé, Kensington and Kensington.Palmarejo. These risks and costs may result in lower economic returns and may adversely affect our business.13
Our ability to sustain or increase our present production levels depends in part on successful exploration and development of new ore bodies and/or expansion of existing mining operations. Mineral exploration, particularly for silver and gold, involves many risks and is frequently unproductive. If mineralization is discovered, it may take a number of years until production is possible, during which time the economic viability of the project may change. Substantial expenditures are required to establish ore reserves, extract metals from ores and, in the case of new properties, to construct mining and processing facilities. The economic feasibility of any development project is based upon, among other things, estimates of the size and grade of ore reserves, proximity to infrastructures and other resources (such as water and power), metallurgical recoveries, production rates and capital and operating costs of such development projects, and metals prices. Development projects are also subject to the completion of favorable feasibility studies, issuance and maintenance of necessary permits and receipt of adequate financing. Development projects, such as San BartolomeBartolomé, Kensington and Kensington,Palmarejo, may have no operating history upon which to base estimates of future operating costs and capital requirements. Development project items such as estimates of reserves, metal recoveries and cash operating costs are to a large extent based upon the interpretation of geologic data obtained from a limited number of drill holes and other sampling techniques and feasibility studies. Estimates of cash operating costs are then derived based upon anticipated tonnage and grades of ore to be mined and processed, the configuration of the orebody, expected recovery rates of metals from the ore, comparable facility and equipment costs, anticipated climate conditions and other factors. As a result, actual cash operating costs and economic returns of any and all development projects may materially differ from the costs and returns estimated, and accordingly, our business results of operations may be negatively affected.14
The Company’s marketing of metals concentrates could be adversely affected if there were to be a significant delay or disruption of purchases by its third party smelter customers. In particular, a significant delay or disruption in our sales of concentrates as a result of the unexpected discontinuation of purchases by our smelter customers could have a material adverse effect on our operations. The Company currently markets its silver and gold concentrates to third party smelters in Mexico, Japan and Australia. The loss of any one smelter customer could have a material adverse effect on us in the event of the possible unavailability of alternative smelters. No assurance can be given that alternative smelters would be timely available if the need for them were to arise, or that delays or disruptions in sales could not be experienced that would result in a materially adverse effect on our operations and our financial results.Our silver and gold production may decline, reducing our revenues and negatively impacting our business. Our future silver and gold production may decline as a result of an exhaustion of reserves and possible closure of mines. It is our business strategy to conduct silver and gold exploratory activities at our existing mining and exploratory properties as well as at new exploratory projects, and to acquire silver and gold mining properties and businesses or reserves that possess mineableminable ore reserves and are expected to become operational in the near future. We can provide no assurance that our silver and gold production in the future will not decline. Accordingly, our revenues from the sale of silver and gold may decline, negatively affecting our results of operations.There are significant hazards associated with our mining activities, not allsome of which aremay not be fully covered by insurance. To the extent we must pay the costs associated with such risks, our business may be negatively affected. The mining business is subject to risks and hazards, including environmental hazards, industrial accidents, the encountering of unusual or unexpected geological formations, cave-ins, flooding, earthquakes and periodic interruptions due to inclement or hazardous weather conditions. These occurrences could result in damage to, or destruction of, mineral properties or production facilities, personal injury or death, environmental damage, reduced production and delays in mining, asset write-downs, monetary losses and possible legal liability. Although we maintain insurance in an amount that we consider to be adequate, liabilities might exceed policy limits, in which event we could incur significant costs that could adversely affect our results of operation. Insurance fully covering many environmental risks (including potential liability for pollution or other hazards as a result of disposal of waste products occurring from exploration and production) is not generally available to us or to other companies in the industry. The realization of any significant liabilities in connection with our mining activities as described above could negatively affect our results of operations.14
We are subject to significant governmental regulations, and their related costs and delays may negatively affect our business. Our
Coeur’s mining activities are subject to extensive federal, state, local and foreign laws and regulations governing environmental protection, natural resources, prospecting, development, production, post-closure reclamation, taxes, labor standards and occupational health and safety laws and regulations including mine safety, toxic substances and other matters related to ourCoeur’s business. Although these laws and regulations have never required usCoeur to close any mine, the costs associated with compliance with such laws and regulations are substantial. Possible future laws and regulations, or more restrictive interpretations of current laws and regulations by governmental authorities could cause additional expense, capital expenditures, restrictions on or suspensions of ourCoeur’s operations and delays in the development of ourits properties.15
In addition, government approvals, approval of aboriginal people and permits are currently and may in the future be required in connection with the Palmarejo project. To the extent such approvals are required and not obtained, Coeur may be curtailed or prohibited from planned mining operations or continuing its planned exploration or development of mineral properties at the Palmarejo project. Failure to comply with applicable laws, regulations and permitting requirements may result in enforcement actions thereunder, including orders issued by regulatory or judicial authorities causing operations to cease or be curtailed, and may include corrective measures requiring capital expenditures, installation of additional equipment, or remedial actions. Parties engaged in mining operations or in the exploration or development of mineral properties may be required to compensate those suffering loss or damage by reason of the mining activities and may have civil or criminal fines or penalties imposed for violations of applicable laws or regulations.Compliance with environmental regulations and litigation based on environmental regulations could require significant expenditures. Environmental regulations mandate, among other things, the maintenance of air and water quality standards and land reclamation. They also set forth limitations on the generation, transportation, storage and disposal of solid and hazardous waste. Environmental legislation is evolving in a manner which will require stricter standards and enforcement, increased fines and penalties for non-compliance, more stringent environmental assessments of proposed projects, and a heightened degree of responsibility for companies and their officers, directors and employees. To the extent Coeur is subject to environmental liabilities, the payment of such liabilities or the costs that it may incur to remedy environmental pollution would reduce funds otherwise available to it and could have a material adverse effect on the combined company. If Coeur is unable to fully remedy an environmental problem, it might be required to suspend operations or enter into interim compliance measures pending completion of the required remedy. The potential exposure may be significant and could have a material adverse effect. Moreover, governmental authorities and private parties may bring lawsuits based upon damage to property and injury to persons resulting from the environmental, health and safety impacts of ourCoeur’s past and current operations, which could lead to the imposition of substantial fines, remediation costs, penalties and other civil and criminal sanctions. Substantial costs and liabilities, including for restoring the environment after the closure of mines, are inherent in ourCoeur’s operations. Although we believe we areCoeur believes that it is in substantial compliance with applicable laws and regulations, weCoeur cannot assure you that any such law, regulation, enforcement or private claim will not have a negative effect on ourits business, financial condition or results of operations. Some of ourCoeur’s mining wastes are currently exempt to a limited extent from the extensive set of federal Environmental Protection Agency (EPA)(“EPA”) regulations governing hazardous waste under the Resource Conservation and Recovery Act (RCRA)(“RCRA”). If the EPA designates these wastes as hazardous under RCRA, weCoeur would be required to expend additional amounts on the handling of such wastes and to make significant expenditures to construct hazardous waste disposal facilities. In addition, if any of these wastes causes contamination in or damage to the environment at a mining facility, such facility may be designated as a “Superfund” site under the Comprehensive Environmental Response, Compensation and Liability Act (CERCLA)(“CERCLA”). Under CERCLA, any owner or operator of a Superfund site since the time of its contamination may be held liable and may be forced to undertake extensive remedial cleanup action or to pay for the government’s cleanup efforts. Such owner or operator may also be liable to governmental entities for the cost of damages to natural resources, which may be substantial. Additional regulations or requirements are also imposed upon ourCoeur’s tailings and waste disposal areas in Alaska under the federal Clean Water Act (CWA)(“CWA”) and in Nevada under the Nevada Water Pollution Control Law which implements the CWA. Airborne emissions are subject to controls under air pollution statutes implementing the Clean Air Act in Nevada and Alaska.16
Compliance with CERCLA, the CWA and state environmental laws could entail significant costs, which could have a material adverse effect on ourCoeur’s operations. In the context of environmental permits, including the approval of reclamation plans, weCoeur must comply with standards and regulations which entail significant costs and can entail significant delays. Such costs and delays could have a dramatic impact on ourCoeur’s operations. There is no assurance that future changes in environmental regulation, if any, will not adversely affect Coeur’s operations. Coeur intends to fully comply with all applicable environmental regulations.
We are required to obtain government permits to expand operations or begin new operations. The acquisition of such permits can be materially impacted by third party litigation seeking to prevent the issuance of such permits. The costs and delays associated with such approvals could affect our operations, reduce our revenues, and negatively affect our business as a whole.15
Mining companies are required to seek governmental permits for expansion of existing operations or for the commencement of new operations such as the Kensington development project and the Palmarejo project. Obtaining the necessary governmental permits is a complex and time-consuming process involving numerous jurisdictions and often involving public hearings and costly undertakings. The duration and success of permitting efforts are contingent on many factors that are out of our control. The governmental approval process may increase costs and cause delays depending on the nature of the activity to be permitted, and could cause us to not proceed with the development of a mine. Accordingly, this approval process could harm our results of operations. On September 12, 2005 three environmental groups filed a lawsuit in Federal District Court
Reference is made to the discussion of the current litigation regarding the validity of the mine tailings permit at the Kensington property in Alaska against the U.S. Corps of Engineers and the U.S. Forest Service seeking to invalidate the permit issued to Coeur Alaska, Inc. for the Company’s Kensington mine. On November 8, 2005, the Corps of Engineers filed a Motion for Voluntary Remand with the court to review the permit issued to the Companythat is set forth under the Clean Water Act (CWA) Section 404 and requested that the court stay the legal proceeding filed by the Southeast Alaska Conservation Council (SEACC) and the other environmental groups pending the outcomeabove risk factor entitled “We may have to record additional write-downs, which could negatively impact our results of review. On November 12, 2005, the Federal District Court in Alaska granted the remand of the permit to the Corps of Engineers for further review. On November 22, 2005, the Corps of Engineers advised the Companyoperations.” Meanwhile, although Palmarejo currently holds all consents that it was suspending the Section 404 permit pursuantrequires in order to the Court’s remand to further review the permit which was then re-instated on March 29, 2006. On April 6, 2006 the lawsuit challenging the permit was re-opened,carry out its current drilling and Coeur Alaska, Inc. filed its Answer to the Amended Complaint and Motion to Intervene as a Defendant-Intervenor in the action. That motion was granted on April 25, 2006 and the Company has joined the agencies in their defense of the permits as issued. On August 4, 2006, the Federal District Court in Alaska dismissed the Plaintiffs’ challenge and upheld the Section 404 permit. On August 7, 2006 the Plaintiffs filed a Notice of Appeal of the decision to the Ninth Circuit Court of Appeals (“Circuit Court”) and on August 9, 2006 Plaintiffs additionally filed a Motion for Injunction Pending Appeal with the Circuit Court. The Circuit Court granted a temporary injunction pending appeal on August 24, 2006, enjoining certain activities relating to the lake tailings facility. The Circuit Court further ordered an expedited briefing scheduledevelopment program on the merits ofPalmarejo project, Coeur cannot be certain that it will receive the legal challenge. On October 13, 2006,necessary permits on acceptable terms to conduct further exploration and to develop the parties filed their briefsPalmarejo project in accordance with its pre-feasibility study. The failure to obtain such permits, or delays in obtaining such permits, could increase costs and delay activities, and could adversely affect the Circuit Court and oral argument was heard on December 4, 2006. There is no indication of when the Circuit Court may rule on the merits on appeal and the Company is unable to predict the outcome of this litigation or its impact on thePalmarejo project.
Our business depends on good relations with our employees. The Company could experience labor disputes, work stoppages or other disruptions in production that could adversely affect us. As of December 31, 2006,2007, unions represented approximately 20%44% of our worldwide workforce. On that date, the Company had 117316 employees at its Cerro Bayo mine and 66120 employees at its Martha mine who were working under a collective bargaining agreement. The agreement covering the Cerro Bayo mine expires on December 21, 20072010 and a collective bargaining agreement covering the Martha mine expires on June 11,1, 2008. Additionally, the Company had 21 employees at its San Bartolomé project working under a labor agreement which does not have a fixed term.
We are an international company and are exposed to risks in the countries in which we have significant operations or interests. Foreign instability or variances in foreign currencies may cause unforeseen losses, which may affect our business. Any foreign operations or investment is subject to political and economic risks and uncertainties. These risks and uncertainties may include exchange controls; extreme fluctuations in currency exchange rates; high rates of inflation; labor unrest; civil unrest; military repression; expropriation and nationalization; renegotiation or nullification of existing concessions, licenses, permits and contracts; illegal mining; changes in taxation policies; restrictions on foreign exchange and repatriation, and laws or policies in the U.S. affecting foreign trade17
investment and taxation. Further, foreign operations or investment is subject to changes in government regulations with respect to, but not limited to, restrictions on production, price controls, export controls, currency remittance, income taxes, expropriation of property, foreign investment, maintenance of claims, environmental legislation, land use, land claims of local people, water use and mine safety. Chile, Argentina, Bolivia and Australia are the most significant foreign countries in which weCoeur now directly or indirectly ownowns or operateoperates mining properties or developmental projects. WeCoeur also conductconducts exploratory projects in these countries. With the acquisition of Palmarejo and Bolnisi, Coeur also owns a major mining operation in Mexico. Argentina and Bolivia, while currently economically and politically stable, have experienced political instability, provincial government pressures on mining operations, currency value fluctuations and changes in banking regulations in recent years. Property ownership in a foreign country is generally subject to the risk of expropriation or nationalization with inadequate compensation. It is uncertain at this time how new mining or investment policies or shifts in political attitude may affect mining in the country. Any foreign operations or investment may also be adversely affected by exchange controls, currency fluctuations, taxation and laws or policies of particular countries as well as laws and policies of the United States affecting foreign trade investment and taxation. Wethese countries. Coeur may enter into agreements which require usCoeur to purchase currencies of foreign countries in which we doCoeur does business in order to ensure fixed exchange rates. In the event that actual exchange rates vary from those set forth in the hedge contracts, weCoeur will experience U.S. dollar-denominated currency gains or losses. Future economic or political instabilities or changes in the laws of foreign countries in which we haveCoeur has significant operations or interests and unfavorable fluctuations in foreign currency exchange rates could negatively impact ourits foreign operations and ourits business as a whole.16
Further, property ownership in a foreign country is generally subject to the risk of expropriation or nationalization with inadequate compensation.
Coeur is exposed to risks with respect to the legal systems in the countries in which it has significant operations or interests, and resolutions of any disputes may adversely affect its business. Some of the jurisdictions in which Coeur currently and may in the future operate have less developed legal systems than would be found in more established economies like the United States. This may result in risks such as potential difficulties in obtaining effective legal redress in the courts of such jurisdictions, whether in respect of a breach of law or regulation, or in an ownership dispute; a higher degree of discretion on the part of governmental authorities; the lack of judicial or administrative guidance on interpreting applicable rules and regulations; inconsistencies or conflicts between and within various laws, regulations, decrees, orders and resolutions; or relative inexperience of the judiciary and courts in such matters. In certain jurisdictions the commitment of local business people, government officials and agencies and the judicial system to abide by legal requirements and negotiated agreements may be uncertain, creating particular concerns with respect to licenses and agreements for business. These may be susceptible to revision or cancellation and legal redress may be uncertain or delayed. There can be no assurance that joint ventures, licenses, license applications or other legal arrangements will not be adversely affected by the actions of government authorities or others and the effectiveness of and enforcement of such arrangements in these jurisdictions cannot be assured.Any of our future acquisitions may result in significant risks, which may adversely affect our business.business.
An important element of our business strategy is the opportunistic acquisition of silver and gold mines, properties and businesses or interests therein. While it is our practice to engage independent mining consultants to assist in evaluating and making acquisitions, any mining properties or interests therein we may acquire may not be developed profitably or, if profitable when acquired, that profitability might not be sustained. In connection with any future acquisitions, we may incur indebtedness or issue equity securities, resulting in increased interest expense, or dilution of the percentage ownership of existing shareholders. We intend to seek shareholder approval for any such acquisitions to the extent required by applicable law, regulations or stock exchange rules. We cannot predict the impact of future acquisitions on the price of our business or our common stock. Unprofitable acquisitions, or additional indebtedness or issuances of securities in connection with such acquisitions, may impact the price of our common stock and negatively affect our results of operations.18
Coeur is continuously considering possible acquisitions of additional mining properties or interests therein that are located in other countries, and could be exposed to significant risks associated with any such acquisitions. In the ordinary course of Coeur’s business, Coeur is continuously considering the possible acquisition of additional significant mining properties or interests therein that may be located in countries other than those in which Coeur now has operations or interests. Consequently, in addition to the risks inherent in the valuation and acquisition of such mining properties, as well as the subsequent development, operation or ownership thereof, Coeur could be subject to additional risks in such countries as a result of governmental policies, economic instability, currency value fluctuations and other risks associated with the development, operation or ownership of mining properties or interests therein. Such risks could adversely affect Coeur’s results of operations.Our ability to find and acquire new mineral properties is uncertain. Accordingly, our prospects are uncertain for the future growth of our business. Because mines have limited lives based on proven and probable ore reserves, we are continually seeking to replace and expand our ore reserves. Identifying promising mining properties is difficult and speculative. Furthermore, we encounter strong competition from other mining companies in connection with the acquisition of properties producing or capable of producing silver and gold. Many of these companies have greater financial resources than we do. Consequently, we may be unable to replace and expand current ore reserves through the acquisition of new mining properties or interests therein on terms we consider acceptable. As a result, our revenues from the sale of silver and gold may decline, resulting in lower income and reduced growth.Third parties may dispute our unpatented mining claims, which could result in the discovery of defective titles and losses affecting our business. The validity of unpatented mining claims, which constitute a significant portion of ourCoeur’s property holdings in the United States, is often uncertain and may be contested. Although we haveCoeur has attempted to acquire satisfactory title to undeveloped properties, we,Coeur, in accordance with mining industry practice, dodoes not generally obtain title opinions until a decision is made to develop a property. As a result, some titles, particularly titles to undeveloped properties, may be defective. Defective title to any of ourCoeur’s mining claims could result in litigation, insurance claims, and potential losses affecting ourits business as a whole. The acquisition of title to concessions and similar property interests is a detailed and time consuming process. Title to, and the area of, concessions and similar property interests may be disputed. No assurances can be given that title defects to the Palmarejo project do not exist. The Palmarejo project may be subject to prior unregistered agreements, interests or native land claims and title may be affected by undetected defects. There may be valid challenges to the title of any of the claims comprising the Palmarejo project that, if successful, could impair development and/or operations. A defect could result in Coeur losing all or a portion of its right, title, estate and interest in and to the properties to which the title defect relates. Also, while Coeur believes that the registration defects relating to certain non-material properties as described herein will be remedied; there can be no assurance as to timing or successful completion.Coeur does not own all of the concessions comprising the Palmarejo project, and Coeur’s failure to comply with its contractual commitments on such properties may result in their loss. Planet Gold, S.A. de C.V., a wholly-owned indirect subsidiary of Palmarejo, is the registered owner of most but not all of the concessions comprising the Palmarejo project. If Coeur fails to meet payments or work commitments on these properties, Coeur may lose its interests in a portion of the Palmarejo project or forfeit some of the concessions.19
Item 1B. Unresolved Staff CommentsNone
17
Item 2. Properties.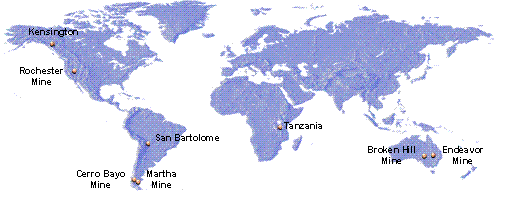
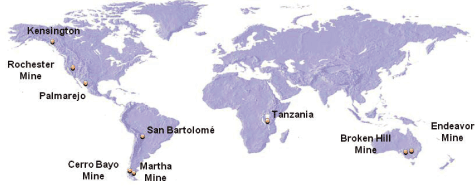 SILVER AND GOLD MINING PROPERTIESNorth America Rochester Mine The Rochester Mine is a silver and gold surface mine located in Pershing County, Nevada, which is located approximately 25 road miles northeast of the town of Lovelock. The mine commenced operations in 1986. The Company owns 100% of the Rochester Mine by virtue of its 100% ownership of its subsidiary, Coeur Rochester, Inc. (“Coeur Rochester”). The property consists of 22 patented and 589 unpatented contiguous mining claims, including 54 mill-site claims and 53 unpatented, leased claims totaling approximately 11,000 acres. The Company acquired the Rochester property from Asarco Incorporated in 1983 and commenced mining in 1986. No mining or processing was conducted at Rochester by the prior owner. The Company acquired initial interest in the adjacent Nevada Packard property in 1996, completed the full purchase in 1999 and commenced mining in 2003. Very limited mining and processing was conducted at Nevada Packard by the prior owner. Collectively, the Rochester and Nevada Packard properties comprise the Company’s Rochester silver and gold mining and processing operation. Production at the Rochester mine in
 20062007 was approximately 4.6 million ounces of silver and 50,400 ounces of gold, compared to 5.1 million ounces of silver and 71,900 ounces of gold compared to 5.7 million ounces of silver and 70,298 ounces of gold in 2005.2006. Cash costs per ounce of silver decreased by 42%$1.28 to $1.52 per ounce in 2007, compared to $2.80 per ounce in 2006, compared to $4.82 per ounce2006. The decrease in 2005,silver production was primarily due to increased byproduct credits.decreased tons mined and lower ore grades. The decrease in cash costs per ounce is due to decreased mining and crushing costs during the year due to the fact that mining and crushing operations were terminated in August 2007 as ore reserves were fully mined. Residual heap leach activities are expected to continue through 2011.
The mine utilizes the heap leaching process to extract both silver and gold from ore mined using conventional open pit methods. Approximately 34,800 tons of ore and waste per day were mined in 2006, compared to 47,300 tons per day in 2005. The average ore to waste strip ratio for the remaining life of the mine will vary based primarily on future gold and silver prices; however, it is anticipated to be less than 1:1. The Company expects to completecompleted mining of the existing ore reserves near the middlein August of 2007. While mining operations will bewere discontinued, it is expected that metal production will continue as a result of residual leaching until approximately 2011. The company is currently conducting exploration on mineralized structures that exist near the pit bottom.20
18
Ore iswas crushed and transported by conveyor to a loadout facility where it iswas transferred to 150-ton trucks which transport the crushed ore to leach pads where solution is applied via drip irrigation to dissolve the silver and gold contained in the ore. Certain low-grade ores arewere hauled directly, as run-of-mine, by 100-ton haul trucks to leach pads where solution is applied to dissolve the silver and gold contained in the ore. The solutions containing the dissolved silver and gold are pumped to a processing plant where zinc precipitation is used to recover the silver and gold from solution as doré. The doré is transported to a refinery for final processing after which the silver and gold is sold on established markets through third party broker dealers. The property, plant and equipment are maintained in good working condition through a regular preventive maintenance program and periodic improvements as required. MiningDuring 2007, the company began selling surplus equipment that is conducted with open pit methods.no longer required as a result of the cessation of mining activities. Power is provided to the mine and processing facility from the public grid servicing the local communities. Based upon actual operating experience and certain metallurgical testing, the Company estimates ultimate recovery rates from the crushed ore of between 59% and 61.5% for silver, depending on the area being leached, and 93% for gold. The leach cycle at the Rochester Mine requires leaching to approximately the year 2011 for all recoverable metal to be recovered.extracted. A significant proportion of metal recovery occurs after mining is completed. At the Nevada Packard satellite deposit, located south of the Rochester deposit, the Company commenced mining of silver in the first quarter of 2003. Mining at Nevada Packard is expected to bewas completed in mid-2007. The Company’s capital expenditures at the Rochester Mine totaled approximately $1.2$1.6 million in 2006.2007. The Company plans capital expenditures at the Rochester Mine of $0.3$0.7 million in 2007.2008.
Asarco Incorporated (“Asarco”), the prior owner, had a net smelter royalty interest which is payable only when the market price of silver equals or exceeds $21.34$22.03 per ounce up to a maximum rate of 5%. No royalties were required to be paid by the Company during the three years ended December 31, 2006.2007.
Silver and gold mineralization is hosted in folded and faulted volcanic rocks of the Rochester Formation and overlying Weaver Formation. Silver and gold, consisting of silver sulfosalt minerals, argentite, argentian tetrahedrite and minor native gold, are contained in zones of multiple quartz veins and veinlets with variable but lesser amounts of pyrite. In 2007, the Company commenced an exploration program to identify new silver- and gold-bearing structures on its large holdings in the district. This program defined several areas of interest and in the fourth quarter a program of nearly 3,000 feet of core drilling was completed on one of those targets. During 2007, we spent $0.4 million on exploration in the Rochester area. The Company has plans to follow-up on any favorable results from this drilling and to test other targets in 2008.Year-end Proven and Probable Ore Reserves-Reserves— Rochester Mine
(includes Nevada Packard)2006
2005
2004
(1,3,4,5,6) (1,3,4,5,6)
Tons (000’s) 3,720 10,168 23,998 Ounces of silver per ton 0.66 0.86 0.86 Contained ounces of silver (000’s) 2,436 8,765 20,731 Ounces of gold per ton 0.007 0.011 0.009 Contained ounces of gold 26,400 112,650 213,000
2007 2006 2005 (1), (3), (5), (6) Tons (000’s) 0 3,720 10,168 Ounces of silver per ton 0 0.66 0.86 Contained ounces of silver (000’s) 0 2,436 8,765 Ounces of gold per ton 0 0.007 0.011 Contained ounces of gold 0 26,400 112,650
21
Year-end Mineralized Material2006
2005
2004
Tons (000’s) 15,235 15,646 35,064 Ounces of silver per ton 0.94 1.03 0.86 Ounces of gold per ton 0.007 0.010 0.005
19
2007 2006 2005 Tons (000’s) 32,664 15,235 15,646 Ounces of silver per ton 0.85 0.94 1.03 Ounces of gold per ton 0.006 0.007 0.010
Operating Data2006
2005
2004
(2)
Production Tons ore mined (000’s) 9,804 9,023 10,751 Tons crushed/leached (000’s) 10,399 9,327 8,976 Ore grade silver (oz./ton) 0.74 0.91 0.74 Ore grade gold (oz./ton) 0.010 0.010 0.009 Recovery/Ag oz(4) 65.9 % 67.5 % 61.5 % Recovery/Au oz(4) 68.9 % 76.2 % 64.2 % Silver produced (oz.) 5,113,504 5,720,489 5,669,074 Gold produced (oz.) 71,891 70,298 69,456
Cost per Ounce of Silver Cash costs(2) $2.80 $4.82 $3.93 Non-cash costs 3.04 1.84 1.73
Total production costs $5.84 $6.66 $5.66
2007 2006 2005 Production Tons ore mined (000’s) 2,962 9,804 9,023 Tons crushed/leached (000’s) 5,061 10,399 9,327 Ore grade silver (oz./ton) 0.65 0.74 0.91 Ore grade gold (oz./ton) 0.006 0.010 0.010 Recovery/Ag oz(4) 141.4 % 65.9 % 67.5 % Recovery/Au oz(4) 167.6 % 68.9 % 76.2 % Silver produced (oz.) 4,614,780 5,113,504 5,720,489 Gold produced (oz.) 50,408 71,891 70,298 Cost per Ounce of Silver Cash costs(2) $ 1.52 $ 2.80 $ 4.82 Non-cash costs 2.30 3.04 1.84 Total production costs $ 3.82 $ 5.84 $ 6.66
(1) Metal prices used in calculating proven and probable reserves were $8.00$11.00 per ounce of silver and $475$600 per ounce of gold in 2006.2007.
(2) Cash costs per ounce of silver or gold represent a non-U.S. GAAP measurement that management uses to monitor and evaluate the performance of its mining operations. See “Item 7: Management’s Discussion and Analysis of Financial Condition and Results of Operations -— Reconciliation of Non-GAAP Cash Costs to GAAP Production Costs.”
(3) The ore reserves are open pit minable reserves and include no additional factors for mining dilution or recovery.
(4) The leach cycle at Rochester requires 5 to 10 years to recover gold and silver contained in the ore. The Company estimates the ultimate recovery to be approximately 61.5% for silver and 93%93.0% for gold. However, ultimate recoveries will not be known until leaching operations cease which is currently estimated for 2011. Current recovery may vary significantly from ultimate recovery. Recoveries are calculated based on the ounces recovered as a percent of the ounces placed on the pad. As ore production ceased in August 2007, silver and gold recoveries increased significantly as a percent of ore placed on the pad. See Critical Accounting Policies and Estimates –— Ore on Leach Pad.
(5) ReserveOre reserve estimates were prepared by the Company’s technical staff.
(6) Ore reserves are defined by a drill grid of at least 65 feet by 140 feet for proven and at least 100 feet by 200 feet for probable and may include open pit mine production sampling information, especially for proven. In practice, ore reserve blocks are defined by the number of proximal composites and three-dimensional geologic controls. For proven reserves, the number of composites must be at least 4 at Rochester and 20 at Nevada Packard with a maximum search distance of 75 feet. For probable reserves, the number of composites must be at least 4 at Rochester and 5 at Nevada Packard with a maximum search distance of 150 feet for Rochester and 120 feet at Nevada Packard. Mineralized material is similarly classified.
22
South America Chile –— Cerro Bayo Mine The Cerro Bayo District covers about 205176 square miles and is located south of Coyhaique, the capital of Region XI in southern Chile, and approximately 17 milesdue west of the town of Chile Chico. The project lies on the east side of the Andes mountain range at an elevation ranging from 600 to 4,500 feet and is serviced by a gravel road from Chile Chico. The mineral rights for the Cerro Bayo property are fully-owned by Compania Minera Cerro Bayo Ltd., a wholly-owned subsidiary of the Company, encompassing a continuous block of 57,09568,715 acres of mining claims. An additional 11,61344,231 acres of exploration concessions are owned by the Company.Company in Region XI. These concessions and separate surface use agreements from private owners cover the ore reserves of the property as well as the necessary rights to permit mining.20
mining and exploration.
The Company acquired the property in 1990 from Freeport Chilean Exploration Company. No mining or processing was conducted by the prior owner. Initial mining and processing commenced by the Company in 1995 at the Laguna Verde area in the western portion of the holdings. Mining and processing temporarily ceased in late 2000 then recommenced in 2002 at the Cerro Bayo area on the east. The entire holdings and infrastructure are now referred to as the Cerro Bayo district. Construction of two ramps to intersect the high-grade Lucero Vein in the Cerro Bayo zone on the east side of its holdings commenced in November 2001. Additional mineralized high-grade gold and silver vein systems were discovered since then from surface and underground exploration. Production at the Cerro Bayo mine in 20062007 was approximately 1.7 million ounces of silver and 37,479 ounces of gold compared to 2.3 million ounces of silver and 40,923 ounces of gold comparedin 2006. The decrease in silver production was due to 2.9 million ouncesa 19% decline in ore grades and a 9.6% decrease in tons mined as a result of silverthe Company focusing its mining activities on narrower vein systems of the mine. Gold grades were marginally affected. In 2008, production will include additional vein system areas that are wider and 61,058 ounces of gold in 2005.more productive. Cash costs per ounce of silver produced increased to $8.22 in 2007 from $3.04 in 2006 from $0.54 in 2005 primarily due to increased production costslower grades and lower production levels.tons mined.
The ore processing mill for the Cerro Bayo Mine uses a standard flotation process to produce a high grade gold and silver concentrate. During 2006,2007, the concentrate processed at this mill was sold to third-party smelters, primarily in Japan and Mexico. The mill has a design capacity of 1,650 tons per day. During 2006,2007, the Company experienced recovery rates of approximately 94.7%94.4% for silver and 92.9%92.2% for gold. Electrical power is generated on-site by diesel generators and process water is obtained from a combination of the adjacent General Carrera Lake and from tailings re-circulation. The property, plant and equipment are maintained in good working condition through a regular preventive maintenance program and periodic improvements as required. Mining is conducted utilizing underground methods. Total capital expenditures at the Cerro Bayo property in 20062007 were $7.6$11.3 million and the Company plans approximately $11.1$9.5 million of additional capital expenditures there in 2007.2008.
During 2006,2007, the Company continued its exploration and development program in the district with its efforts concentrated in the Cerro Bayo and Laguna Verde zones in the east and west sections of the Company’s land holdings. In 2006,2007, we spent approximately $5.3$2.9 million on exploration and mine$2.2 million on reserve development for new gold and silver mineralization and reserve definition and completed nearly 232,000204,000 feet of core drilling. In the second half of the year five new silver- and gold-bearing veins were discovered approximately one mile east of the ore processing facilities at Laguna Verde. These veins are named Dagny, Fabiola, Coyita, Yasna and Dalila. Drilling commenced on the new discoveries late in the third quarter and reached a total of 48,536 feet by the end of the year. The Company plans to continue its extensive exploration and mine development programs in the district in 20072008 with a budget of $4.7$4.9 million for this work.23
Silver and gold mineralization is hosted in epithermal quartz veins and veinlets and lesser amounts of stockworks and breccias within generally sub-horizontal volcanic rocks of the Ibanez Formation. Veins and veinlets occur in sub-parallel clusters largely trending north-northwest and dipping steeply to the west and east. The main ore minerals of silver and gold are silver sulfosalt minerals, argentite and electrum (a naturally-occurring gold and silver alloy). Numerous epithermal veins located within the 205 square mile property package in the Cerro Bayo district offer exploration and development opportunities for us. To date, we have discovered over 100 veins, the majority of which are located within nine miles of our existing ore processing facilities. During 2006, exploration continued to focus on the Marcela Sur and Cascada veins. Marcela Sur, situated about 1,000 meters west of the current mining operations in main Cero Bayo zone, was discovered beneath 50 to 70 meters of post-mineral gravels. Cascada lies south of the Cerro Bayo mining operations.
21
Year-end Proven and Probable Ore Reserves -— Cerro Bayo Mine2006
2005
2004
(1,3,4,5,6,7)
Tons (000’s) 634 935 862 Ounces of silver per ton 9.69 8.00 7.09 Contained ounces of silver (000’s) 6,144 7,476 6,109 Ounces of gold per ton 0.19 0.14 0.13 Contained ounces of gold 122,000 131,600 115,900
2007 2006 2005 (1), (3), (5), (6), (7), (8) Tons (000’s) 782 634 935 Ounces of silver per ton 9.26 9.69 8.00 Contained ounces of silver (000’s) 7,234 6,144 7,476 Ounces of gold per ton 0.14 0.19 0.14 Contained ounces of gold 111,600 122,000 131,600
Year-end Mineralized Material2006
2005
2004
Tons (000’s) 2,509 4,113 3,829 Ounces of silver per ton 8.23 6.19 4.29 Ounces of gold per ton 0.15 0.10 0.13
2007 2006 2005 Tons (000’s) 2,865 2,509 4,113 Ounces of silver per ton 9.28 8.23 6.19 Ounces of gold per ton 0.14 0.15 0.10
Operating Data2006
2005
2004
(2)
Production Tons ore milled 428,346 403,695 456,941 Ore grade silver (oz./ton) 5.76 7.52 7.51 Ore grade gold (oz./ton) 0.103 0.163 0.137 Recovery silver (%) 94.5 94.7 94.2 Recovery gold (%) 93.0 92.8 91.8 Silver produced (oz.) 2,331,060 2,875,047 3,235,192 Gold produced (oz.) 40,923 61,058 57,558
Cash costs(2) $3.04 $0.54 $1.01 Non-cash costs 2.42 1.76 1.42
Total production costs $5.46 $2.30 $2.43
2007 2006 2005 Production Tons ore milled 387,378 428,346 403,695 Ore grade silver (oz./ton) 4.68 5.76 7.52 Ore grade gold (oz./ton) 0.105 0.103 0.163 Recovery silver (%) 94.4 94.5 94.7 Recovery gold (%) 92.2 93.0 92.8 Silver produced (oz.) 1,709,830 2,331,060 2,875,047 Gold produced (oz.) 37,479 40,923 61,058 Cash costs(2) $ 8.22 $ 3.04 $ 0.54 Non-cash costs 3.60 2.42 1.76 Total production costs $ 11.82 $ 5.46 $ 2.30
(1) Metal prices used to calculate proven and probable reserves were $8.00/$11.00/ounce of Ag and $475/$600/ounce of Au.
(2) Cash costs per ounce of silver or gold represent a non-U.S.-GAAP measurement that management uses to monitor and evaluate the performance of its mining operations. See “Item 7: Management’s Discussion and Analysis of Financial Condition and Results of Operations; Reconciliation of Non-GAAP Cash Costs to GAAP Production Costs.”
(3) The ore reserves are minable reserves within underground mine designs and include factors for mining dilution and recovery.
(4) Underground mine reserves includeVeins less than 1.2 meters wide are diluted to 1.2 meters at zero grade. Veins greater than 1.2 meters wide receive a 0.2 meter dilution of 5% to 25% at zero grade. Mining recovery averages between 90% tois 95% for underground reserves..
(5) Metallurgical (mill) recovery factors of 93.8% and 91.6% should be applied to the in-place silver and gold reserves ounces, respectively.
24
(6) ReserveOre reserve estimates were prepared by the Company’s technical staff.
(7) Proven and probable ore reserves are defined by a drill spacing of no more than 35 meters and may include underground production sampling information, especially for proven. In practice, ore reserve blocks are defined by the number of proximal composites and three-dimensional geologic controls. For proven reserves the number of composites must be at least 1 with a maximum search distance of generally 15 meters. For probable, the number of composites must be at least 2 with a maximum search distance of generally 35 meters. Mineralized material is similarly classified. (8) Mineralized material includes 1,599,400 tons grading 10.21 Ag ounces per ton and 0.14 Au ounces per ton classified as additional Inferred Mineral Resources.
22
Argentina –— Martha Mine The Martha Mine,mine is an underground mine owned and operated by Coeur Argentina S.R.L., a wholly-owned subsidiary of the Company, which is located in the Santa Cruz Province of southern Argentina. Access to the mine is provided by all-weather gravel roads 30 miles northeast of the town of Gubernador Gregores and approximately 270 miles southeast of Cerro Bayo. The mineral rights for the Martha property are fully-owned by Coeur Argentina S.R.L., encompassing a continuous block of 137,978over 363,000 acres of exploration claims, 83,813 acres of discovery claims, and 351 acres of exploitation claims.claims (568 square miles). The concessions cover the ore reserves of the property as well as the necessary rights to permit mining.mining and exploration. The property and equipment are maintained in good working condition through a regular preventive maintenance program and periodic improvements as required. Power is provided by Company-owned diesel generators. The Company acquired the property in 2002 through the purchase of a subsidiary of Yamana Resources Inc. for $2.5 million. The prior owner conducted minor underground mining on the near-surface portion of the Martha vein from late 2000 to mid 2001. The Company is obligated to pay a 2% net smelter royalty on silver and gold production to Royal Gold Corporation. We transport ore mined utilizing underground methods at
Prior to January 1, 2008 we transported the Martha Minemine ore by truck approximately 600 miles by road for processing at the Cerro Bayo mill, which is located 270 miles northwest of the Martha Mine. The transport costs to ship the ore to the Cerro Bayo mill from the Martha Mine have necessitated a focus on the highest grade portions of the veins discovered at the Martha Mine; however, lower grade mineralized material exists, but is not included in reserves. Duringmill. In 2007, the Company planscommenced the construction of a 240 ton per day flotation mill which was completed in December 2007 and produces a flotation concentrate. During December 2007, the newly-constructed facility commenced operating. In 2008, we will commence shipping the concentrate to complete a feasibility study atthird party smelter located in Mexico. The new mill is expected to lower operating costs since it will no longer be necessary to transport ore to Cerro Bayo for processing. This is expected to have a beneficial impact upon the Martha mine which may allow the processing of the lower-grade material.ore reserve cut-off grade and overall ore reserves.
In June 2002, we commenced shipping of high-grade Martha Minemine ore to the Cerro Bayo mill. All of the production came from the Martha vein, which was one of six known veins on the Martha Mine property prior to our acquisition of the property. Also in 2002, exploration discovered both extensions of the Martha Mine vein and the R4 Zone within the vein, which is located 300 feet southwest of the main Martha Mine mining areas. Production at the Martha mine in 20062007 was approximately 2.7 million ounces of silver and 4,127 ounces of gold compared to 2.7 million ounces of silver and 3,440 ounces of gold compared to 2.1 million ounces of silver and 2,589 ounces of gold in 2005.2006. Cash cost per ounce of silver produced was $6.27 in 2007 compared to $4.88 in 2006 compared to $4.60 in 2005.2006.
During 2006,2007, we spent $3.6$2.0 million on exploration and mine$0.8 million on reserve development at the Martha Mine,mine, and $2.4 million at our other properties in the Santa Cruz province, to discover new silver- and gold-bearing veins and define new reserves. In 2007, exploration defined extensions at depth and on strike on the Martha, R4, Catalina, Francisca, Isabel and Betty ore-bearing structures which were a major focus of the year’s program. A total of 72,243 feet of drilling was completed in 2007. During 2007,2008, we expect to spend $4.7$6.8 million on25
exploration for the discovery of new mineralization and reserve development, across our large land holdings in the province of Santa Cruz which totals over 600568 square miles. In 2006, exploration defined extensions at depth and on strike on the Martha, R4, Catalina and Francisca ore-bearing structures which were a major focus of the year’s program. In addition to the effort around the mine this year, the Company added four new exploration properties referred to as the El Aguila, Sol del Mayo, Sascha and Joaquin properties. Silver reserves at December 31, 2006 increased by 50% to 6.1 million ounces from 2005. Silver and gold mineralization is hosted in epithermal quartz veins and veinlets within generally sub-horizontal volcanic rocks of the Chon Aike Formation. The veins and veinlets occur as sub-parallel clusters largely trending west-northwest and dipping steeply to the southwest. The main ore minerals of silver and gold are silver sulfosalt minerals, argentite, electrum (a naturally-occurring gold and silver alloy) and native silver.23
Total capital expenditures at the Martha mine in 20062007 were $2.5$16.4 million and the Company plans approximately $2.9$3.4 million of additional capital expenditures there in 2007.2008.
Year-end Proven and Probable Ore Reserves -— Martha Mine2006
2005
2004
(1,3,4,5,6)
Tons (000’s) 99 67 57 Ounces of silver per ton 61.33 60.29 68.56 Contained ounces of silver (000’s) 6,084 4,054 3,930 Ounces of gold per ton 0.09 0.08 0.08 Contained ounces of gold 8,800 5,400 4,600
2007 2006 2005 (1), (3), (4), (5), (6) Tons (000’s) 154 99 67 Ounces of silver per ton 53.97 61.33 60.29 Contained ounces of silver (000’s) 8,293 6,084 4,054 Ounces of gold per ton 0.07 0.09 0.08 Contained ounces of gold 10,600 8,800 5,400
Year-end Mineralized Material2006
2005
2004
Tons (000’s) 112 134 74 Ounces of silver per ton 42.91 45.37 52.75 Ounces of gold per ton 0.05 0.05 0.06
2007 2006 2005 (7) Tons (000’s) 165 112 134 Ounces of silver per ton 32.75 42.91 45.37 Ounces of gold per ton 0.04 0.05 0.05
Operating Data2006
2005
2004
(2)
Production Tons ore milled 35,843 35,293 30,276 Ore grade silver (oz./ton) 79.93 62.53 59.94 Ore grade gold (oz./ton) 0.104 0.079 0.084 Recovery silver (%) 94.7 94.9 94.2 Recovery gold (%) 92.5 92.9 91.6 Silver produced (oz.) 2,712,846 2,093,464 1,709,069 Gold produced (oz.) 3,440 2,589 2,318
Cash costs(2) $4.88 $4.60 $4.08 Non-cash costs 0.48 0.41 0.97
Total production costs $5.36 $5.01 $5.05
2007 2006 2005 Production Tons ore milled 37,047 35,843 35,293 Ore grade silver (oz./ton) 78.10 79.93 62.53 Ore grade gold (oz./ton) 0.120 0.104 0.079 Recovery silver (%) 95.0 94.7 94.9 Recovery gold (%) 92.7 92.5 92.9 Silver produced (oz.) 2,748,705 2,712,846 2,093,464 Gold produced (oz.) 4,127 3,440 2,589 Cash costs(2) $ 6.27 $ 4.88 $ 4.60 Non-cash costs 0.51 0.48 0.41 Total production costs $ 6.78 $ 5.36 $ 5.01
(1) Metal prices used in calculating proven and probable reserves were $8.00/$11.00/ounce of Ag and $475/$600/ounce of Au.
(2) Cash costs per ounce of silver or gold represent a non-U.S.-GAAP measurement that management uses to monitor and evaluate the performance of its mining operations. See “Item 7: Management’s Discussion and Analysis of Financial Condition and Results of Operations; Reconciliation of Non-GAAP Cash Costs to GAAP Production Costs.”
(3) The ore reserves are underground minable reserves and include 10 to 25% factors for dilution at zero grade and aan average mining recovery of 90% to 95%97.5%.
26
(4) Metallurgical (mill) recovery factors of 91.9%95% and 89.0%92% should be applied to the silver and gold reserve ounces, respectively.
(5) ReserveOre reserve estimates were prepared by the Company’s technical staff.
(6) Proven and probable reserves are defined by a drill spacing of no more than 25 meters and may include underground production sampling information, especially for proven. In practice, ore reserve blocks are defined by the number of proximal composites and three-dimensional geologic controls. For proven reserves the number of composites must be at least 2 with a maximum search distance of generally 18 meters. For probable, the number of composites must be at least 2 with a maximum search distance of generally 25 meters. Mineralized material is similarly classified. (7) Mineralized material includes 72,400 tons grading 37.78 Ag ounces per ton and 0.04 Au ounces per ton classified as additional Inferred Mineral Resources.
24
Australia –Endeavor— Endeavor Mine The Endeavor Mine is located in north central New South Wales, Australia. Access to the mine is by paved roads 30 miles to the northwest from the community of Cobar. On May 23, 2005, the Company acquired all of the silver production and reserves, up to a maximum 17.7 million payable ounces, contained at the Endeavor Mine in Australia, which is owned and operated by Cobar Operations Pty. Limited (“Cobar”), a wholly-owned subsidiary of CBH Resources Ltd. (“CBH”), for $39.1$43.8 million. The Endeavor Mine is located 720 km northwest of Sydney in New South Wales and has been in production since 1983. Under the terms of the original agreement, CDE Australia, a wholly-owned subsidiary of Coeur, paid Cobar $15.4 million of cash at the closing. In addition, CDE Australia will pay Cobar approximately $23.7$26.3 million upon the receipt of a report confirming that the reserves at the Endeavor mine are equal to or greater than the reported ore reserves for 2004. The mine met the criteria for payment of the additional $26.3 million in early 2008. Cobar and the Company have agreed to payment of this amount on April 1, 2008 plus accrued interest at the rate of 7.5% per annum from January 24, 2008. In addition to these upfront payments, Coeur originally committed to pay Cobar an operating cost contribution of $1.00 for each ounce of payable silver plus a further increment when the silver price exceeds $5.23 per ounce. This further increment was to have begun on the second anniversary of this agreement and is 50% of the amount by which the silver price exceeds $5.23 per ounce. A cost contribution of $0.25 per ounce iswas also payable by Coeur in respect of new ounces of proven and probable silver reserves as they are discovered. The Company paid a cost contribution of approximately $2.1 million during 2007.
On March 28, 2006, CDE Australia Pty, Ltd. (CDE Australia), reached an agreement with CBH Resources Ltd. to modify the terms of the original silver purchase agreement. Under the modified terms, CDE Australia owns all silver production and reserves up to a total of 20.0 million payable ounces, up from 17.7 million payable ounces in the original agreement. The conditions relating to the second payment were also modified and tied to certain paste fill plant performance criteria and mill throughput tests. The Company has received approximately 0.71.4 million payable ounces to dateto-date and the current ore reserve contains approximately 15.314.4 million payable ounces based on current metallurgical recovery and current smelter contract terms. Expansion of the ore reserve will be required to achieve the maximum payable ounces of silver production as set forth in the modified contract. contract.It is expected that future expansion to the ore reserve will occur as a result of the conversion of portions of the property’s existing inventory of mineralized material and future exploration discoveries. CBH conducts regular exploration to discover new mineralization and to define reserves from surface and underground drilling platforms. The silver price-sharing provision is deferred until such time as Coeur has received approximately 2 million cumulative ounces of silver from the mine or June 2007, whichever is later. In addition, the silver price-sharing threshold increased to US$7.00 per ounce, from the previous level of US$5.23 per ounce. It is expected that the silver price-sharing provision may become operative in 2009.27
In connection with the modification of the terms of the agreement, CDE Australia agreed to provide CBH with an advance of up to A$15.0 million of the A$30 million that remains to be paid under the terms of the original agreement. The remaining payment from Coeur to CBH is subject to the Endeavor mine achieving certain operational benchmarks. The advance, in the form of a loan facility, will bear interest at 7.75% per annum once drawn by CBH. The term is for a twelve month period with an option for CBH to extend the term for an additional six months. No advances have been drawn under the facility as of December 31, 2006.2007.
The Endeavor mine is an underground lead/zinc/silver mine. Silver, lead, zinc and lesser amounts of copper mineralization at the Endeavor Mine isare contained within sulfide lenses hosted in fine-grained sedimentary rocks of the Paleozoic-aged AmpitheatreAmphitheatre Group. Sulphide lenses are elliptically-shaped, steeply-dipping to the southwest and strike to the northwest. Principal ore minerals are galena, sphalerite and chalcopyrite. Silver occurs with both lead and zinc rich sulphide zones. The mine employs bulk mining methods and utilizes a conventional flotation mill to produce a concentrate that is sold to a third party smelter. Silver recovery averaged approximately 48.0% in 2007 and 63.5% in 2006 and 45.0% from May 28, 2005 to December 31, 2005.25
2006.
The reserves at Endeavor are covered by five Consolidated Mining Leases issued by the state of New South Wales to CBH Resource Ltd. The leases form a contiguous block of 10,121 acres in size. The property and equipment are maintained in good working condition, by CBH Resources, through a regular preventive maintenance program and periodic improvements as required. Power to the mine and processing facilities is provided by the grid servicing the local communities. CBH Resources Ltd. conducts regular exploration to define new reserves at the mine from both underground and surface core drilling platforms. For fiscal year 2006/20072007/2008 (July –— June), the 2007 exploration budget at the mine is A$1.73.3 million (US$1.32.9 million). The Company is not required to contribute to ongoing capital costs at the mine. On October 24, 2005, CBH announced that mining operations at the Endeavor mine had been suspended below the No. Four haulage level following an uncontrolled fall of waste ground into the mine’s 6Z2 crown pillar stope. Limiting production to above this level was done as a safety precaution due to the proximity of the 6Z2 crown pillar stope to the main haulage decline. In late November 2005, CBH announced that mine operations had recommenced below the No. Four haulage level, but at a reduced production rate. Based on the progress made to date in correcting issues related to the ground fall, the Company expects the mine to resume normal operations during 2007.2008.
Production at the Endeavor mine in 20062007 was approximately 482,000773,000 ounces of silver compared to 316,000482,000 ounces of silver in 2005.2006. Cash cost per ounce of silver produced was $2.67 in 2007 compared to $2.85 in 2006 compared to $2.05 in 2005.2006.
Proven and Probable Ore Reserves -— Endeavor Mine2006
2005
(1,2,3,4)
Tons (000’s) 21,385 12,125 Ounces of silver per ton 1.50 1.93 Contained ounces of silver (000’s) 31,983 23,341
2007 2006 2005 (1), (2), (3), (4), (5), (7) Tons (000’s) 19,731 21,385 12,125 Ounces of silver per ton 1.52 1.50 1.93 Contained ounces of silver (000’s) 29,926 31,983 23,341
Mineralized Material2006
2005
Tons (000’s) 9,370 8,488 Ounces of silver per ton 3.00 2.03
2007 2006 2005 Tons (000’s) 12,291 9,370 8,488 Ounces of silver per ton 2.44 3.00 2.03
28
Operating Data (Coeur’s Share)2006
2005
(2,5)
Production Tons ore milled 750,115 463,129 Ore grade silver (oz./ton) 1.01 1.52 Recovery silver (%) 63.5 45.0 Silver produced (oz.) 481,991 316,169
Cash costs(6) $2.85 $2.05 Non-cash costs 1.02 1.30
Total production costs $3.87 $3.35
2007 2006 2005 Production Tons ore milled 1,146,857 750,115 463,129 Ore grade silver (oz./ton) 1.40 1.01 1.52 Recovery silver (%) 48.0 63.5 45.0 Silver produced (oz.) 772,609 481,991 316,169 Cash costs(6) $ 2.67 $ 2.85 $ 2.05 Non-cash costs 0.98 1.02 1.30 Total production costs $ 3.65 $ 3.87 $ 3.35
(1) Ore reserves are reported as of June 30, 2006,2007, which is the end of the most recent fiscal year of the operator, CBH. Metal prices used were $10.00/$15/ounce of silver.
26
(2) The ore reserves are underground minable reserves and include an 11% average factor for mining dilution and mining recovery factors ranging from 40% to 100%.
(3) Metallurgical recovery factor of 55% should be applied to the silver reserve ounces.
(4) Classification of reserves is based on spacing from drill hole composites to reserve block centers. For proven reserves the maximum distance is 25 meters and for probable reserves it is greater than 25 meters and less than 40 meters. Mineralized material is similarly classified.
(5) The Endeavor property was purchased on May 23, 2005. Operating data is presented commencing as of that date.
(6) Cash costs per ounce of silver or gold represent a non-U.S.-GAAPnon-U.S. GAAP measurement that management uses to monitor and evaluate the performance of its mining operations. See “Item 7: Management’s Discussion and Analysis of Financial Condition and Results of Operations; Reconciliation of Non-GAAP Cash Costs to GAAP Production Costs.” (7) Mineralized material includes 118,900 tons grading 1.63 Ag ounces per ton classified as additional Inferred Mineral Resources.
Australia –— Broken Hill Mine The Broken Hill Mine is located in western New South Wales, Australia. Access to the mine is by paved roads leading from the adjacent community of Broken Hill. On September 8, 2005, the Company acquired all of the silver production and reserves, up to 17.2 million payable ounces (24.5 million contained ounces), contained at the Broken Hill mine in Australia, which is owned and operated by Perilya Broken Hill Ltd. (“PBH”), for $36.0$36.9 million. In addition, CDE Australia will pay PBH an operating cost contribution of approximately $2.00 for each ounce of payable silver. Under the terms of the agreement, PBH may earn up to US$6.00.75 million per year of additional consideration by meeting certain silver production thresholds over the next eight years.thresholds. No additional payments pursuant to production thresholds were made during 2006.2007.
The Broken Hill mine is an underground lead/zinc/silver mine. Silver, lead and zinc mineralization at Broken Hill is contained within sulfide lenses hosted in metasedimentary and igneous rocks of Precambrian-aged Broken Hill and underlying Thackaringa groups. In general sulphide lenses are tabular in shape steeply dipping to the north-northwest and striking east-northeast. Principal ore minerals are galena, sphalerite and chalcopyrite. Silver occurs with both lead- and zinc-rich sulphide zones but is higher grade in the lead zones. The mine uses bulk mining methods and utilizes a conventional flotation mill to produce a concentrate that is sold to third party smelters in Australia. Silver recovery averaged approximately 83.6% in 2007 and 74.2% in 2006 and 75.4% from September 8, 2005 to December 31, 2005.2006.29
While the Company is entitled to all of the silver production and reserves up to a maximum of 17.2 million payable ounces, to date the Company has received 2.64.2 million payable ounces and the current ore reserve contains approximately 12.412.5 million payable ounces based on current metallurgical recovery and current smelter contract terms. Expansion of the ore reserve will be required to achieve the maximum payable ounces of silver production as set forth in the contract. It is expected that future expansion to the ore reserves will occur as a result of conversion of portions of the property’s inventory of mineralized material and future exploration discoveries on the property. Perilya conducts regular exploration to discover new mineralization and define reserves from surface and underground drilling platforms. For its fiscal year 2006/20072007/2008 (July/June), Perilya has budgeted A$3.55.8 million (US$2.75.1 million) for this work. The Company is not required to contribute to ongoing capital costs at the mine. The reserves at Broken Hill are covered by nine Consolidated Mining Leases issued by the state of New South Wales to Perilya Broken Hill Ltd. The leases form a northeast elongate contiguous block of 18,502 acres in size. The property and equipment are maintained in good working condition by Perilya Broken Hill Ltd., through a regular preventive maintenance program and periodic improvements as required. Power to the mine and processing facilities is provided by the grid servicing the local community. Perilya Broken Hill Ltd. conducts regular exploration to define new reserves, largely from underground core drilling platforms.27
The Company’s share of silver production in 20062007 from the Broken Hill mine amounted to approximately 2.21.6 million ounces of silver compared to 657,0932.2 million ounces of silver in 2005.2006. Production during 2007 was impacted by a fatality in the first quarter of 2007 which necessitated a change in the mining method. The cash cost per ounce of silver production, which includes the operating cost contribution and smelting, refining and transportation costs, was $3.18 in 2007 compared to $3.09 in 2006 compared to $2.72 in 2005.2006.
Proven and Probable Ore Reserves -– Broken Hill Mine2006
2005
(1,2,3,4,5)
Tons (000’s) 12,908 11,519 Ounces of silver per ton 1.40 1.30 Contained ounces of silver (000’s) 18,015 14,955
2007 2006 2005 (1), (3), (4), (5), (7) Tons (000’s) 12,394 12,908 11,519 Ounces of silver per ton 1.45 1.40 1.30 Contained ounces of silver (000’s) 17,931 18,015 14,955
Mineralized Material2006
2005
Tons (000’s) 10,872 10,825 Ounces of silver per ton 3.82 1.93
2007 2006 2005 Tons (000’s) 9,844 10,872 10,825 Ounces of silver per ton 3.82 3.82 1.93
Operating Data (Coeur’s share)(3)2006
2005
(2) (6)
Production Tons ore milled 2,288,355 667,140 Ore grade silver (oz./ton) 1.28 1.31 Recovery (%) 74.2 75.4 Silver produced (oz.) 2,174,585 657,093
Cost per Ounce of Silver Cash costs(2) $3.09 $2.72 Non-cash costs 2.35 2.75
Total production costs $5.44 $5.47
2007 2006 2005 (6) Production Tons ore milled 1,646,203 2,288,355 667,140 Ore grade silver (oz./ton) 1.19 1.28 1.31 Recovery (%) 83.6 74.2 75.4 Silver produced (oz.) 1,642,205 2,174,585 657,093 Cost per Ounce of Silver Cash costs(2) $ 3.18 $ 3.09 $ 2.72 Non-cash costs 1.86 2.35 2.75 Total production costs $ 5.04 $ 5.44 $ 5.47
30
(1) Ore reserves are effective as of June 30, 2006.2007. Metal prices used were $10.12/$13.50/ounce of silver.
(2) Cash costs per ounce of silver or gold represent a non-U.S.-GAAP measurement that management uses to monitor and evaluate the performance of its mining operations. See “Item 7: Management’s Discussion and Analysis of Financial Condition and Results of Operations; Reconciliation of Non-GAAP Cash Costs to GAAP Production Costs.”
(3) The ore reserves are underground minable reserves and include factors for mining dilution and recovery. Dilution ranges from 0% to 20% additional tonnage while recovery ranges from 80% to 100% of the diluted tonnage and averages 85%.
(4) Metallurgical recovery factor of 74% should be applied to the silver reserve ounces.
(5) The proven and probable reserves are a combination of zinc, lead and silver mineralization remnant from historic mining and new parts or extensions of the mine. Proven and probable reserves must be accessible as defined by the site specific conditions of the mine. Furthermore, reserves are defined by definition drilling on a grid of 40 meters horizontally by 20 meters vertically and over 70% of the proven reserves are drilled on a 20 meter by 10 meter grid.
(6) The Broken Hill property was purchased on September 8, 2005. Operating data is presented commencing as of that date. (7) Mineralized material includes 4,490,000 tons grading 2.24 Ag ounces per ton classified as additional Inferred Mineral Resources.
28
Discontinued Operation — Coeur Silver Valley On June 1, 2006, the Company completed the sale of 100% of the shares of its wholly-owned subsidiary Coeur Silver Valley, Inc. to U.S. Silver Corporation for $15 million in cash and additional consideration received of $1.1 million for working capital. Coeur Silver Valley was a wholly-owned subsidiary of the Company which owned and operated the Galena underground silver mine, an operating mine, and the Coeur and Caladay properties, that adjoin to the Galena mine, located in the heart of the Coeur d’Alene Mining District. Coeur Silver Valley’s property consists of 6,131 acres of Company-owned fee land, patented mining claims and unpatented claims in addition to 4,800 acres of leased claims. Coeur Silver Valley’s operations are accessed by paved road from US Interstate 90 south of the town of Wallace, Idaho. Silver Valley recommenced operations at the Coeur mine in June 1996 and continued mining existing reserves there through July 2, 1998 when known reserves were depleted. Silver Valley resumed production at the Galena Mine in May 1997 and operations continued to the date of the sale. The Galena Mine property is located immediately west of the City of Wallace in Shoshone County in northern Idaho. The property consists of 52 patented mining claims and 25 unpatented mining claims totaling approximately 1,100 acres. The Galena Mine is an underground silver-copper mine and is served by two vertical shafts. The No. 3 shaft is the primary production shaft and is 5,800 feet deep. The Galena shaft primarily provides utility access for water, electrical power and sand backfill for underground operations down to the 2,400 level. The mine utilizes conventional and mechanized cut and fill mining methods with sand backfill to extract ore from the high grade silver-copper vein deposits that constitute the majority of the ore reserves. Silver and copper are recovered by a flotation mill that produces a silver rich concentrate which is sold to third-party smelters in Canada. Silver recovery through the mill averaged 96% in 2006 97% in 2005 and 97% in 2004.2005.
Waste material from the milling process is deposited in a tailings pond located approximately two miles from the minesite. The tailings containment pond, which is expanded on an as needed basis, has capacity for approximately seven additional years at current production rates. Silver production at the Galena Mine in 2006, up to the date of the sale, was approximately 768,674 ounces of silver versus 2.1 million ounces in 2005. Cash costs for 2006 were $9.75 compared to $8.37 per ounce in 2005. Total capital expenditures by Silver Valley at the Galena Mine in 2006 were $0.6 million.31
Silver mineralization at Coeur Silver Valley is hosted in near vertical fracture filling veins that cut through quartzite and argillite of the Upper Revett Formation. Veins consist of siderite with variable amounts of pyrite and quartz. The silver ore minerals are tetrahedrite and argentiferous galena. Lead is contained in galena and copper in tetrahedrite and chalcopyrite.Year-end Proven and Probable Ore Reserves -– Galena Mine2005
2004
Tons (000’s) 444 718 Ounces of silver per ton 24.50 18.84 Contained ounces of silver (000’s) 10,879 13,518
29
2005 Tons (000’s) 444 Ounces of silver per ton 24.50 Contained ounces of silver (000’s) 10,879
Year-end Mineralized Material2005
2004
Tons (000’s) 2,580 2,169 Ounces of silver per ton 11.74 10.92
2005 Tons (000’s) 2,580 Ounces of silver per ton 11.74
Operating Data2006
2005
2004
Production Tons ore milled 52,876 128,502 169,413 Ore grade silver (oz./ton) 15.15 16.53 21.43 Recovery (%) 96 97 97 Silver produced (oz.) 768,674 2,060,338 3,521,813 Gold produced (oz.) 180 282 354
Cost per Ounce of Silver Cash costs(1) $9.75 $8.37 $5.46 Non-cash costs 0.89 0.97 0.56
Total production costs $10.64 $9.34 $6.02
2006 2005 Production Tons ore milled 52,876 128,502 Ore grade silver (oz./ton) 15.15 16.53 Recovery (%) 96 97 Silver produced (oz.) 768,674 2,060,338 Gold produced (oz.) 180 282 Cost per Ounce of Silver Cash costs(1) $ 9.75 $ 8.37 Non-cash costs 0.89 0.97 Total production costs $ 10.64 $ 9.34
(1) Cash costs per ounce of silver or gold represent a non-U.S.-GAAP measurement that management uses to monitor and evaluate the performance of its mining operations. See “Item 7: Management’s Discussion and Analysis of Financial Condition and Results of Operations; Reconciliation of Non-GAAP Cash Costs to GAAP Production Costs.”
SILVER AND GOLD DEVELOPMENT PROPERTIES Bolivia – San BartolomeBartolomé Silver Project The San BartolomeBartolomé silver development project is located on the flanks of the Cerro Rico mountain near the town of Potosi,Potosí, Bolivia. Access to the property is by paved and all-weather gravel roads leading south from the adjacent city of Potosi.Potosí. Coeur acquired 100% of the equity in Empresa Minera Manquiri S.A. (“Manquiri”) from Asarco on September 9, 1999. Manquiri’s principal asset is the mining rights to the San Bartolome project, a silver property located near the city of Potosí, Bolivia, on the flanks of the Cerro Rico Mountain.Bartolomé project. The silver mineralization is hosted in gravel (pallaco) and reworked gravel (sucu) deposits that occur on the flanks of Cerro Rico. Cerro Rico is a prominent mountain in the region that reaches an elevation of over 15,400 feet. It is composed of Tertiary-aged volcanic and intrusive rocks that were emplaced into and over older sedimentary, basement rocks. Silver, along with tin and base metals, is located in multiple veins that occur in a northeast trending belt that transects Cerro Rico. The upper parts of the Cerro Rico mineralized system waswere subsequently eroded and redeposited into the flanking pallaco and sucu deposits. Silver is hosted in all portions of the pallacos and sucus with the best grades segregated to the coarser-grained silicified fragments. These deposits lend themselves to simple, free digging surface mining techniques and can be extracted without drilling and blasting. Of the several pallaco deposits which are controlled by Coeur and surround Cerro Rico, three are of primary importance and are known as Huacajchi, Diablo (consisting of Diablo Norte, and Diablo Este) and Santa Rita.32
30
The mineral rights for the San BartolomeBartolomé project are held through joint venture and long-term lease agreements with several independent mining cooperatives and the Bolivian State Mining Company (“COMIBOL”). Manquiri controls 67 square kilometers under lease from COMIBOL and 16,600 acres under lease from the cooperatives at San BartolomeBartolomé and approximately 17.8 square miles of concessions at the Khori Huasi property, a gold exploration target south of Potosi.Potosí. The San BartolomeBartolomé lease agreements are generally subject to a 4% production royalty payable partially to the cooperatives and partially to COMIBOL. During 2003, the Company acquired additional mining rights known as the Plahipo project which includes the mining rights to oxide dumps adjacent to the original property package. The oxide dumps included in the Plahipo project are subject to a sliding scale royalty payable to COMIBOL that is a function of silver price. The properties are currently subject to annual payments for these mining rights totaling approximately $2.5 million. Power is supplied to the development activities by the local power utility. Power for the future processing facility will be provided from the national grid via a four-mile high tension line. Silver was first discovered in the area around 1545. Mining of silver and lesser amounts of tin has been conducted nearly continuously since that time from multiple underground mines driven into Cerro Rico. The Company acquired the rights to the San BartolomeBartolomé project in MaySeptember 1999 from ASARCO Incorporated. The prior owner did not conduct any mining or processing of the surface ores at San Bartolome.Bartolomé.
We completed a preliminary feasibility study in 2000, which concluded that an open pit mine was potentially capable of producing approximately 6 million ounces of silver annually. In 2003, SRK, an independent consulting firm, was retained to review the reserve/resource estimate to include additional sampling data to incorporate additional resources acquired with the Plahipo project at Cerro Rico. During 2003, we retained Fluor Daniel Wright to prepare an updated feasibility study which was completed at the end of the third quarter of 2004. The study provides for the use of a cyanide milling flow sheet with a wet preconcentration screen circuit which will result in the production of a doré that may be treated by a number of refiners under a tolling agreement which results in the return of refined silver to the Company that is readily marketed by metal banks and brokers to the ultimate customer. Based upon the results of the updated feasibility study, we estimated the capital cost of the project to be approximately $135 million. Based on overall inflation impacting capital costs, the Company now estimates the capital cost (excluding political risk insurance premiums and capitalized interest) at San Bartolome to be approximately $174 million. In the second quarter of 2004, we obtained all operating permits. The Company estimates the total capital cost (excluding political risk insurance premiums and capitalized interest) at San Bartolomé will be approximately $220 million of which $129.2 million had been incurred as of December 31, 2007. The Company estimates initial operating cash costcosts once the plant achieves full-scale operation of production in the initial four years to average approximately $4.00$4.10 per ounce, excluding royalties and production taxes of silver produced. As a result of political unrest occurring in Bolivia during 2005, the Company reduced capital expenditures. In the second half of 2006, the Company determined conditions had improved to the point that full-scale construction and development were commenced.$2.03 per ounce. Based on the current development schedule, the Company believes thatexpects commercial production couldto begin in early 2008.
Coeur expended approximately $14.6 million in 2006the first quarter of 2008 and plans to incur construction costsexpects initial full-year production of approximately $119.4nine million in 2007.
ounces of silver per year. No assurances can be made that the project will achieve its schedule and cost estimates as discussed above.
In November 2007, Bolivia’s Congress approved a reform to the mining tax code. The Bolivia tax rate on most mining companies has increased from 25% to 37.5%. However, mining companies similar to San Bartolomé will receive a 5% credit based upon their specific operation. Thus, the tax rate for San Bartolomé will be 32.5%. The San BartolomeBartolomé project involves risks that are inherent in any mining venture, as well as particular risks associated with the location of the project. The estimate of mineralized material indicated by the geologic studies performed to date are preliminary in nature and may differ materially after further metallurgical testing is completed. Also, managing mining projects in the altiplano area of Bolivia, where Cerro Rico is located, presents logistical challenges. The political and cultural differences of Bolivia may also present challenges.33
We have obtained a political risk insurance policy from the Overseas Private Insurance Corporation (“OPIC”) and a private insurer. The combined policies are in the amount of $155 million and coverscover 85% of any loss arising from expropriation, political violence or currency inconvertibility. The policies are expected to cost approximately $3.4 million during the course of construction and $0.21 per ounce of silver produced when the project commences commercial production.31
Year-end Probable Ore Reserves -– San BartolomeBartolomé Project2006
2005
2004
(1,2,3,4,5) Tons (000’s) 46,176 46,176 46,176 Ounces of silver per ton 3.29 3.29 3.29 Contained ounces of silver (000’s) 151,882 151,882 151,882
2007 2006 2005 (1), (2), (3), (4), (5), (6) Tons (000’s) 42,043 46,176 46,176 Ounces of silver per ton 3.64 3.29 3.29 Contained ounces of silver (000’s) 153,000 151,882 151,882
Year-end Mineralized Material -– San BartolomeBartolomé Project2006
2005
2004
Tons (000’s) 1,166 1,166 1,166 Ounces of silver per ton 3.44 3.44 3.44
2007 2006 2005 Tons (000’s) 15,816 1,166 1,166 Ounces of silver per ton 2.21 3.44 3.44
(1) Metal prices used in calculating proven and probable reserves were $6.00$11 per ounce of silver.
(2) The ore reserves are open pit minable reserves and include an average 10%2.5% factor for mining dilution at zero grade and 97%97.5% for mining recovery.
(3) An average metallurgical recovery factor of 61.3% should be applied to the mined silver reserve ounces.
(4) ReserveOre reserve estimates were prepared by the Company’s technical staff.
(5) Proven and probable reserves are defined by surface sampling – drill holes or vertical shafts – with an average spacing of no more than 70 meters. In practice, ore reserve blocks are defined by the number of proximal composites and three-dimensional geologic controls. For probable reserves, the number of composites must be at least 8 with a maximum search distance of less than 275 meters. San BartolomeBartolomé has only probable reserves. Mineralized material is similarly classified. (6) Mineralized material includes 249,000 tons grading 1.78 silver ounces per ton classified as additional Inferred Mineral Resources.
Alaska – Kensington Gold Project The Kensington gold development project, consisting of the Kensington and adjacent Jualin properties, is located on the east side of the Lynn Canal about 45 miles north-northwest of Juneau, Alaska. The mine will be an underground gold mine accessed by a horizontal tunnel and will utilize conventional and mechanized underground mining methods. The ore will be processed in a flotation mill that produces a concentrate which will be sold to third party smelters. Waste material will be deposited in an impoundment facility on the property. Power is supplied to the site by on-site diesel generators. Access to the project is presently by helicopter, float plane or boat from Juneau. The Kensington property, which contains the project’s reserves, consists of over 6,100 acres of patented and unpatented federal mining claims and state claims. The adjacent Jualin property to the south consists of 9,236 acres of patented and unpatented federal mining claims and state claims.34
On July 7, 1995, Coeur, through its wholly-owned subsidiary, Coeur Alaska, Inc. (“Coeur Alaska”), acquired the 50% ownership interest of Echo Bay Exploration Inc. (“Echo Bay”) in the Kensington property from Echo Bay and Echo Bay Alaska, Inc. (collectively the “Sellers”), giving Coeur 100% ownership of the Kensington property. The Kensington project consists of approximately 6,000 acres, of which approximately 750 acres are patented claims. The property is located on the east side of Lynn Canal between Juneau and Haines, Alaska. Coeur Alaska is obligated to pay Echo Bay a scaled net smelter return royalty on 1.0 million ounces of future gold production after Coeur Alaska recoups the $32.5 million purchase price and its construction and development expenditures incurred after July 7, 1995 in connection with placing the property into commercial production. The royalty ranges from 1% at $400 gold prices to a maximum of 2 ½%1/2% at gold prices above $475, with the royalty to be capped at 1.0 million ounces of production.32
In the second quarter of 2004, we completed an updated feasibility study based on an alternative operating scenario which would eliminateeliminated the need for a man camp, simplifysimplified operating logistics and focusfocused mining on higher-grade areas of the deposit (thereby reducing significantly the size of the mill facilities). This plan significantly reduced capital and operating costs while preserving the ability to expand production as market conditions warrant. In the second quarter of 2005, the Company received its final construction permits and updated the construction and operating cost estimates set forth in the feasibility study. Due to a general increase in commodity prices impacting the industry in general, the Company retained an independent engineering firm to review its capital cost estimate during the fourth quarter of 2005. As a result of the costs associated with the challenges to the project’s permits of $29.8 million and the general increase in labor and commodity prices of $18.6 million, theThe Company currently estimates the total cost of construction to behas expended approximately $238$269.7 million as compared with the previous cost estimate of $190 million. The Company believes that commercial production could commence in late 2007, subject to successful resolution of the permitting and litigation issues described below.December 31, 2007. The Company expects the per ounce cash cost of production to be approximately $310 in the initial years of operation. During the fourth quarter of 2004, the U.S. Forest Service issued its Record of Decision (“ROD”) for the Final Supplemental Environmental Impact Statement (“FSEIS”). An environmental group, Southeast Alaska Conservation Council (“SEACC”), and a group of other community and private environmental groups, appealed the issuance The Company believes that commercial production could commence in 2009, subject to successful resolution of the ROD. On March 23, 2005,permitting and litigation issues described below. No assurances can be made that the US Forest Service upheld the decision to approve the FSEIS. On June 28, 2005, the Company received the Environmental Protection Agency’s (“EPA”) National Pollution Discharge Elimination System (“NPDES”) Permit. In addition, the Company received the U.S. Army Corps of Engineers (“Corps of Engineers”) 404 Wetlands Permit, which authorized the construction of a Lower Slate Lake tailings facility, millsite road improvementsproject will achieve its schedule and a Slate Creek Cove dock facility. All permits were reviewed for consistency by both the Alaska Coastal Management and Department of Governmental Coordination, which issued its final permit certification.
cost estimates as discussed above.
On September 12, 2005 three environmental groups (“Plaintiffs”) filed a lawsuit in Federal District Court in Alaska against the U.S. Army Corps of Engineers (“Corps of Engineers”) and the U.S. Forest Service (“USFS”) seeking to invalidate the permit issued to Coeur Alaska, Inc. for the Company’s Kensington mine. The Plaintiffs claim the Clean Water Act (CWA)(“CWA”) Section 404 permit issued by the Corps of Engineers authorizing the deposition of mine tailings into Lower Slate Lake conflicts with the CWA. They additionally claim the USFS’s approval of the Amended Plan of Operations is arbitrary and capricious because it relies on the 404 permit issued by the Corps of Engineers. On November 8, 2005, Following the Corps of Engineers filed a Motion for Voluntary Remand with the court to review the permit issued to the Company under the CWA Section 404 and requested that the court stay the legal proceeding filed by the Plaintiffs pending the outcome of review. On November 12, 2005, the Federal District Court in Alaska granted theCourt’s remand of the Section 404 permit to the Corps of Engineers for further review. On November 22, 2005,review, the Corps of Engineers advised the Company that it was suspending the Section 404 permit pursuant to the Court’s remand to further review the permit.
On March 29, 2006, the Corps of Engineers reinstated the Company’s 404 permit. On April 6, 2006 thepermit on March 29, 2006. The lawsuit challenging the permit was re-opened andon April 6, 2006; Coeur Alaska filed its answer to the Amended ComplaintComplaint; and Motion to Intervene as a Defendant-Intervenor in the action. Two other parties,Coeur Alaska, the State of Alaska, and Goldbelt, Inc., a local native corporation, also filed Motions to Intervene as Defendant-Intervenors as supporters of the Kensington project as permitted. The Company, the State of Alaska and Goldbelt, Inc. were granted Defendant-Intervenor status and joinedto join the agencies in their defense of the permits as issued.
33
permit.
On August 4, 2006, the Federal District Court in Alaska dismissed the Plaintiffs’ challenge and upheld the Section 404 permit. On August 7, 2006 the Plaintiffs filed a Notice of Appeal of the decision to the Ninth Circuit Court of Appeals (“Ninth Circuit Court”) and on August 9, 2006 the Plaintiffs additionally filed a Motion for Injunction Pending Appeal with the Ninth Circuit Court. The Ninth Circuit Court granted a temporary injunction pending appeal on August 24, 2006, enjoining certain activities relating to the lake tailings facility. The On May 22, 2007 the Ninth Circuit Court reversed the District Court’s August 4, 2006 decision which had upheld the Company’s 404 permit and issued its opinion that remanded the case to the District Court with instructions to vacate the Company’s 404 permit as well as the USFS Record of Decision approving the general tailings disposal plan as well as the Goldbelt 404 permit to construct the Cascade Point Marine Facility. On August 20, 2007, Coeur Alaska filed a Petition for Rehearing En Banc with the Ninth Circuit Court, as did the State of Alaska and Goldbelt, Inc. The Department of Justice, on behalf of the Corps of Engineers, and USFS additionally filed a limited Petition for Rehearing with the Ninth Circuit panel seeking reconsideration of the mandate of the May 22, 2007 panel decision. On October 29, 2007, the Ninth Circuit denied the Petitions for Rehearing En Banc. On November 14, 2007 the Ninth Circuit granted a stay of the mandate pending further orderedappeal to the Supreme Court, subject to the development of a reclamation plan for the lake area. The Company, and the State of Alaska, filed Petitions for Certiorari to the Supreme Court of the United States on January 28, 2008. The Company cannot now predict the potential for obtaining further appeal or if it will prevail upon appeal if one is granted.35
As a result of continuing litigation involving the proposed tailing impoundment area, the Company began investigating alternative sites. The Company believes it has located an expedited briefingalternative site and has entered into discussions with government officials and environmental groups who have indicated that they will support this alternative site. It will be necessary to obtain modified or potentially new permits for an alternative tailings site which the Company believes could occur in 2008 which would allow for the completion of the tailings facility and commencement of commercial production in 2009. When the permitting schedule onis finalized and definitive engineering is completed for the meritsalternate site, the project’s capital and operating cost estimates will be updated. No assurance can be given as to whether or when the Company will obtain any necessary modification to permits for an alternative tailing site or whether or when it will prevail upon appeal of the legal challenge. As of October 13, 2006, the parties filed their briefs in the Circuit Court and participated in an oral argument on December 4, 2006. There ischallenge set forth above. Further, no indication of when the Circuit Court may rule on the merits on appeal. The Company is unable to predict the outcome of the litigation or the impact of the temporary injunction. The Company cannot predict when the court will rule on the merits on appeal in the Circuit Court or the impact upon the project. No assurance can be given as to whether or when regulatory permits and approvals granted to the Company may be further challenged, appealed or contested by third parties or issuing agencies, or as to whether the Company will place the Kensington project into commercial production.
During 2006,2007, the Company invested $121.6$92.3 million in connection with the development of the mine. The Company plans to spend approximately $77.7$25.2 million on the project during 2007.2008.
In 2007, the Company continued the exploration program started in the third quarter of 2005 designed to increase the size and geologic continuity of gold mineralization in its mineralized material inventory and ultimately result in an increase in ore reserves. In 2007, Coeur Alaska completed 2,189 feet of drilling on exploration from surface platforms on the Jualin property and 12,873 feet of underground drilling at Kensington for a total of 15,062 feet. For the year, a total of $0.6 million was spent on this drilling. The Kensington ore deposit consists of multiple precious metals bearing mesothermal, quartz, carbonate, pyrite vein swarms and discrete quartz-pyrite veins hosted in the Cretaceous age Jualin diorite. The gold-telluride-mineral calaverite is associated with the pyrite mineralization.Year-end Proven and Probable Ore Reserves -– Kensington Property2006
2005
2004
(1,2,3,4,5)
Tons (000’s) 4,419 4,206 4,206 Ounces of gold per ton 0.31 0.25 0.25 Contained ounces of gold 1,352,140 1,050,000 1,050,000
2007 2006 2005 (1, 2, 3, 4, 5, 6, 7) Tons (000’s) 4,419 4,419 4,206 Ounces of gold per ton 0.31 0.31 0.25 Contained ounces of gold 1,352,100 1,352,100 1,050,000
Year-end Mineralized Material2006
2005
2004
Tons (000’s) 4,320 3,116 3,116 Ounces of gold per ton 0.20 0.27 0.27
2007 2006 2005 Tons (000’s) 4,320 4,320 3,116 Ounces of gold per ton 0.20 0.20 0.27
(1) A gold price of $550 per ounce was used to determine ore reserves.
(2) The ore reserves are underground minable reserves and include factors for mining dilution and recovery. An allowance of 25.6% additional tonnage at 0.124 ounce per ton is included for internal dilution. A factor for external dilution, averaging 10.2% at 0.056 ounces per ton, is also included. An average 97% factor for mining recovery is included.
(3) Average metallurgical recovery factor of 95.3% should be applied to the contained gold reserve ounces.
36
(4) ReserveOre reserve estimates were prepared by the Company’s technical staff. Snowden Mining Industry Consultants, an independent consultant group, performed an independent review of the Company’s updated resource estimate model used to prepare the ore reserve estimates.
(5) The Kensington gold development project contains only probable reserves. The reserves are defined with over 408,000470,000 feet of core drilling, largely from underground drilling fans, and 27,00038,000 feet of underground workings. In practice, reserve blocks are defined by the number of proximal composites and three-dimensional geologic controls. Probable reserve blocks must at least 2 drill holes spaced not more than 60 feet from the block center. Mineralized material is similarly classified. (6) Ore reserve estimates are based upon an operating scenario according to operating permits that have been received. Certain of these permits are the subject of legal proceedings. See the additional discussion under Alaska – Kensington Gold Project, Item 3 – Legal Proceedings and Part I, Item 1A – Risk Factors. (7) Mineralized material includes 1,183,600 tons grading 0.21 gold ounces per ton classified as additional Inferred Mineral Resources.
34
Not
Mexico – Palmarejo Silver and Gold Project On December 21, 2007, the company acquired all Kensington oreof the outstanding stock of Bolnisi Gold NL (“Bolnisi”), an Australian company listed on the Australian Stock Exchange, and Palmarejo Silver and Gold Corporation (“Palmarejo”) a Canadian company listed on the TSX Venture Exchange. The principal asset of Bolnisi was its ownership of 72.8% of the outstanding common shares of Palmarejo. Palmarejo is engaged in the exploration and development of silver and gold properties located in the state of Chihuahua in northern Mexico and its principal silver and gold properties are collectively referred to as the “Palmarejo project.” The Palmarejo project is currently under development and is expected to commence commercial production in the first half of 2009. The Palmarejo project (including the Trogan license area), the principal asset of Bolnisi Gold NL (“Bolnisi”) and Palmarejo Silver and Gold Corporation, (“Palmarejo”) is located in the state of Chihuahua in northern Mexico, approximately 15 kilometers northwest of the township of Temoris, where Bolnisi has established field headquarters. Temoris is approximately 420 kilometers southwest from the city of Chihuahua, the state capital, where Bolnisi has established its Mexican headquarters. In addition to the Palmarejo project, the Company also acquired the Yecora exploration-stage property located in Sonora, on the border with Chihuahua and the El Realito exploration-stage property in Chihuahua. Due to the focus of activities on the Palmarejo project, no exploration work was undertaken at the Yecora or El Realito projects during 2007. The Palmarejo project contains a number of mineralized zones or areas of interest. The most important of these to date is the Palmarejo zone in the far north of the concessions which covers the old Palmarejo gold-silver mine based on the northwest-southeast trending La Prieta and La Blanca gold-silver bearing structures. In addition to Palmarejo, mineralized vein and alteration systems in the Trogan license area have been fully delineated internally, oridentified on other strongly mineralized corridors, roughly sub-parallel to the Palmarejo zone. The most significant of these additional targets are the Guadalupe (including Animas) and La Patria vein systems in the southern part of the property and are currently under investigation by the Company’s exploration teams. The Palmarejo project consists of approximately 12,115 hectares covered by mining concessions, of which about 11,817 hectares are owned outright by Planet Gold, a wholly-owned subsidiary of the Company, with an additional 226 hectares held by means of leases and options to purchase, which agreements are summarized below. In addition, Planet Gold has obtained the rights to, but has not yet made all payments to complete, the purchase of 72 additional hectares.37
The Chihuahua Informe Pericial (Mines Department) administers the lands in the Palmarejo project area. The claim boundaries are surveyed as part of the process of obtaining mining concessions in Mexico. Access to Palmarejo from Chihuahua is via paved Highway 127, a two-lane road, to the town of San Rafael and then by gravel road to Temoris and finally Palmarejo. The Chihuahua-Pacifico rail service operates between Chihuahua and Los Mochis on the southwest coast of Mexico. Two passenger trains and one freight train operate daily from Chihuahua. Access from the rail station at depth orthe town of Temoris to Palmarejo is along 35 km of government-maintained gravel road, which is the extension of Highway 127, that continues on strikethrough to Chinipas. The climate of the area is moderate. Average maximum temperature is about 34°C, with an average minimum temperature of about 5°C. Rainfall occurs mainly during the summer months, with average annual precipitation of about 800 millimeters. The elevation of Palmarejo is about 1,150 meters above sea level. All anticipated exploration work can be conducted year round. The Palmarejo project area has moderately well developed infrastructure and several peripheral zonesa local work force familiar with mining operations. There are approximately four to five thousand inhabitants within about a one-hour drive of the project. Chinipas and veins remainTemoris are the two nearest towns of any size, both with an estimated population of approximately 1,500 inhabitants. The small village of Palmarejo lies immediately northwest of the Palmarejo zone area and has an estimated population of 200. A 33,000 volt power line has recently been constructed from Temoris to Chinipas by the Commission of Federal Electricidad, the Mexican federal power authority. The line passes directly through the Palmarejo area, but is inadequate to supply the electricity requirements of mining and processing operations at Palmarejo without installation of a parallel line. There are a number of potential sources of water in the area, including groundwater and local streams that drain the project area, as well as the Chinipas River, which is located 12 kilometers west of the Palmarejo-Trogan Project. The Chihuahua-Pacifico railway connects Chihuahua with Los Mochis, located on Mexico’s western coast in the state of Sinaloa. Daily passenger and freight trains pass Temoris along this railway. The rail station at Temoris is 35 kilometers by gravel road from Palmarejo. Airstrips for light aircraft are located at Temoris and Chinipas. The terrain at the Palmarejo project area is characterized by steep-sided hills and V-shaped valleys, although sites for mining infrastructures such as a mill should not pose a significant problem. Dumps and tailings will likely need to be explored.placed within the upper reaches of drainage valleys, which would require the construction of a retention dam(s). The Palmarejo project is located on the western flank of the Sierra Madre Occidental, a mountain range that comprises the central spine of northern Mexico. The north-northwest-trending Sierra Madre Occidental is composed of a relatively flat-lying sequence of Tertiary volcanic rocks that forms a volcanic plateau. This volcanic plateau is deeply incised in the Palmarejo project area, locally forming steep-walled canyons. The Sierra Madre Occidental gives way to the west to an extensional terrain that represents the southward continuation of the Basin and Range Province of the western United States, and then to the coastal plain of western Mexico. The gold and silver deposits at the Palmarejo project, typical of many of the other silver and gold deposits in the Sierra Madre, are classified as epithermal deposits, and are hosted in multiple veins, breccias and fractures. These geologic structures trend generally northwest – southeast and dip either southwest or northeast. The dip on the structures ranges from about 45 degrees to 70 degrees. In 2006,the mineralized portions of the structures gold and silver are zoned from top to bottom with higher silver values occurring in the upper parts of the deposit to a gold-rich basal portion, sometimes accompanied by base metal mineralization.38
The capital cost of the project, from the time the Company continuedacquired it on December 21, 2007 to the exploration program startedcommencement of commercial production, is currently estimated to be approximately $225 million. Based upon the original prefeasibility report, it is expected that the project will commence commercial production in the third quarter of 2005 designed to increase the size and geologic continuity of gold mineralization in its mineralized material inventory and ultimately result in an increase in ore reserves. At Kensington, Coeur Alaska completed 34,035 ft of drilling during the secondfirst half of 20052009 and an additional 32,249 ft of drilling in 2006. For the year, a total of $1.5 million was spent on this developmental program. As a result of this program, ore reserves increased byis expected to produce approximately 29% to 1.3510 million ounces of gold.silver and 110,000 ounces of gold annually at an average cash cost per silver ounce of ($1.40), including gold by-product credit. The Company is currently completing the final updated feasibility study, which is expected to be completed in the second quarter of 2008. No assurances can be made that the project will achieve its schedule and cost estimates as discussed above.
The Company has budgeted over $8.0 million for exploration at the Palmarejo District in 2008, its first year of exploration since completion of the acquisition, in an attempt to discover new silver and gold mineralization and define new ore reserves. Proven and probable ore reserves have not yet been established as of December 31, 2007. The Company is currently completing its final updated feasibility study, which is expected to be completed in the second quarter of 2008.Year-end Mineralized Material – Palmarejo Project2007 (1), (2), (3), (4) Tons (000’s) 33,852 Ounces of silver per ton 4.44 Ounces of gold per ton 0.05
(1) A cut-off grade of 0.023 ounces per ton Au equivalent (0.8 grams per tonne) was used to estimate mineralized material. Au equivalent = Au grade + (Ag grade/55). This is for the Palmarejo and La Patria deposits and the Guadalupe deposit to a depth of 150 meters. A cut off grade of 0.073 ounces per ton Au equivalent (2.5 grams per tonne) was applied to Guadalupe below 150 meters depth. (2) Mineralized material includes estimates for the Palmarejo, Guadalupe and La Patria zones prepared by Mine Development Associates (MDA) as of September 17, 2007. (3) The mineralized material estimates were based on information from 154,953 meters (508,370 feet) of core and reverse circulation drilling. (4) Mineralized material includes 17,747,000 tons grading 0.04 gold ounces per ton and 3.46 silver ounces per ton classified as additional Inferred Mineral Resources.
EXPLORATION AND DEVELOPMENT ACTIVITY Coeur, either directly or through its wholly-owned subsidiaries, owns, leases and has interests in certain exploration-stage mining properties located in the United States, Chile, Argentina, Tanzania, Bolivia, and Bolivia.as of December 21, 2007, Mexico. Exploration and mine development expenditures of approximately $11.9 million, $9.5 million $10.6 million and $8.0$10.6 million were incurred by the Company in 2007, 2006 and 2005, and 2004, respectively. US – Kensington/Jualin The Company possesses the right to develop the Jualin property, an exploratory property located adjacent to the Kensington Property. A combined total of 18,66715,062 feet of exploration drilling was completed in 2005 and 20062007 at Jualin.Kensington, including 2,189 feet at the Falls-Diana leased, patented mining claims. The Company plans for an aggressiveadditional drilling program for 2007 to follow up on the encouraging results from these programs.in 2008. The Company’s rights to use and develop the Jualin property are subject to an Amended Lease Agreement dated August 5, 2005 between Hyak Mining Company Inc. as Lessor and Coeur Alaska Inc. as Lessee which expires in August 2020 with provision for lease extension. Approximately $0.9$0.6 million was spent in exploration in 2006.2007 on Jualin and Falls-Diana.39
Chile –— Cerro Bayo Mine Coeur continued to have exploration success at its 100%-owned Cerro Bayo gold/silver mining operation in southern Chile. Approximately $5.3$2.9 million was spent in exploration, of which $2.6and $2.2 million was capitalized as minereserve development during 2006.2007. A total of nearly 232,000204,000 feet of core drilling was completed during the year to discover new mineral resourcesmineralization and define new mineralore reserves. The majoritymost significant result of this workprogram was devoted to expansion and definitionthe discovery of five new silver-and gold-bearing veins near the Laguna Verde ore reserves at the recently discovered Marcela Sur and Cascada vein systems.processing facility. The Company believes that there is potential to discover additional high grade veins within the entire Cerro Bayo district, which is over 13.6 miles east–west by 7.5 miles north-south.district. The exploration budget for 20072008 is estimated to be $4.7$4.9 million.
Argentina –— Martha Mine In 2006,2007, the Company’s exploration efforts consisted of mapping, sampling and nearly 87,000over 72,200 feet of core and reverse circulation drilling for a total expenditure of $3.6$2.8 million, of which $0.7$0.8 million was capitalized as minereserve development. An ongoing drill program during 20072008 is planned near to the Martha mine totaling approximately $3.0$3.5 million to explore for additional high-grade veins.veins and define new ore reserves.
Argentina –— Other Properties The Company also continued reconnaissance in Santa Cruz Province where its activities resulted in identification and acquisition of four new exploration-stage properties in 2006 believed to be prospective for silver and gold mineralization. These properties consist of the El Aguila, Sol de Mayo, (Costa), Sascha and Joaquin. El Aguila and Sol del Mayo are controlled by private Argentine interest. The Company has the right to purchase both properties from the owners, who will retain a production royalty, after completion of staged work and payment obligations. Sascha and Joaquin are controlled by Mirasol Resources Ltd. a publicly-traded, Canadian exploration company. Coeur has the right to earn up to a 71% managing interest in a joint venture with Mirasol in return for staged work and payment obligations. TheIn 2007 all four new properties were explored with mapping, sampling, geophysical surveys and core drilling. By property, core drilling amounted to the following subtotals: El Aguila – 6,729 feet, Sol de Mayo – 2,238 feet, Sascha – 12,221 feet, and Joaquin – 1,841 feet. In addition, the Company also conducted exploration at its wholly-owned Lejano and Cisne properties in west central Santa Cruz Province. At Cisne, a total of 2,595 core feet were drilled in the fourth quarter. Total exploration spending in 2007 on all these properties and reconnaissance activity to identify new properties in Argentina was $2.4 million and the Company plans to continue to map, sample and drill targets on its new holdings in 2007 and has budgeted $2.6 million for these activities.35
2008 with a budget of $3.3 million.
Tanzania, Africa During the first quarter of 2004, the Company acquired ten prospecting licenses for properties located in the Lake Victoria Gold Belt of Tanzania, Africa, and in 2005, 2006 and 2007 added an eleventh, Saragurwa.the Saragurwa, Bismark and Pangea properties, respectively. Based on results from its annual exploration programs, four of the original ten concessions were not renewed. Except for Saragurwa, which is owned by a private Tanzanian interest,Bismark and Pangea, all properties are held 100% by a Tanzanian subsidiary of the Company via prospecting or primary mining license provisionsCompany. Saragurwa and Bismark are owned by separate private Tanzanian interests and Pangea is controlled by a Tanzanian subsidiary of theBarrick Gold Company. Coeur Tanzania Mining Code. During 2006, initialLtd. has an option to acquire all three properties in return for staged work and payment commitments.
In 2007, exploration work consisted of mapping, trenching, sampling and acquisition and interpretation of detailed airborneground geophysical data. As a resultdata and core and reverse circulation drilling. In total 31,170 feet of this work, a large zonedrilling was completed in 2007. The majority of anomalous gold-in-soil values, measuring over 1.2 miles long in an east-west orientation, by over 0.3 miles widethe drilling was defined on thecompleted at Kiziba Hill property, a 105 square kilometer sized propertyand Saragurwa which lieslie on the same belt of Archean-aged rocks, commonly termed “greenstone”, which host the Geita gold mine to the east.40
Greenstones, a mixture of volcanic, sedimentary and intrusive rocks, are a major host to gold mineralization around the globe. Gold anomalies were also defined in trenches on the Bunda 1 property, to the northeast of the city of Mwanza. InMwanza, in 2006 over 44,000 feet of shallow, rotary air blast drilling was conducted over the gold-in-soil anomalies at Kiziba Hill. This work verified the bedrock source of the surface gold anomalies and aided in producing a map of the bedrock beneath the laterite cover, which in places reached over 75 feet in thickness. Basal rotary air blast gold anomalies are spatially coincident with contacts between volcanic rocks and later intrusive rocks of felsic (granitic) composition and along major east-wet shear/fault zones. In December 2006, core drilling commenced on the Saragurwa option property and will continue into 2007.
were further explored this year.
During 2006,2007, the Company spent $1.4$2.1 million on exploration activities in Tanzania and expects to spend approximately $1.8$2.4 million in 2007.2008.
SILVER AND GOLD PRICES The Company’s operating results are substantially dependent upon the world market prices of silver and gold. The Company has no control over silver and gold prices, which can fluctuate widely. The volatility of such prices is illustrated by the following table, which sets forth the high and low prices of silver (as reported by Handy and Harman) and gold (London Final) per ounce during the periods indicated:
Year Ended December 31,
2006
2005
2004
High
Low
High
Low
High
Low
Silver $14.93 $8.84 $9.11 $6.38 $8.24 $5.57 Gold $725.00 $524.75 $536.50 $411.10 $454.20 $375.00
Year Ended December 31, 2007 2006 2005 High Low High Low High Low Silver $ 15.67 $ 11.54 $ 14.93 $ 8.84 $ 9.11 $ 6.38 Gold $ 841.10 $ 608.40 $ 725.00 $ 524.75 $ 536.50 $ 411.10
MARKETING The Company markets its metals products and concentrates primarily to bullion trading banks and third party smelters. These customers then sell the metals to end users for use in industry applications such as electronic circuitry, jewelry and silverware production and the manufacture and development of photographic film. Sales of metals to bullion trading banks amounted to approximately 47%, 45%47% and 59%45% of total sales of metals in 2007, 2006 2005 and 2004,2005, respectively, and sales of metal concentrates to third party smelters amounted to approximately 53%, 55%53% and 41%55% of total metal sales in 2007, 2006 2005 and 2004,2005, respectively. Generally, the loss of a single bullion trading bank customer would not adversely affect the Company in view of the liquidity of the product and availability of alternative trading banks. In 2006,2007, the Company had sales of concentrates to two third-party smelters, Met-Mex Penoles and Zinifex, which each constituted 10% or more of the Company’s total metal sales. A significant delay or disruption as the result of a disruption in the Company’s contracts could have a materially adverse effect on our operations if we were unable to locate an alternate smelter to treat our concentrates.36
The Company had no future silver or gold production hedged at December 31, 20062007 and has no plans to hedge its silver in the future. Coeur has historically sold the gold from its mines both pursuant to forward contracts and at spot prices prevailing at the time of sale. Silver has been sold at spot prices prevailing at the time of sale.GOVERNMENT REGULATIONGeneral The Company’s commitment to environmental responsibility has been recognized in 24 awards received since 1987, which included the Dupont/Conoco Environmental Leadership Award, awarded to the Company on October 1, 1991 by a judging panel that included representatives from environmental organizations and the federal government, the “Star” award granted on June 23, 1993 by the National Environmental Development Association, and the Environmental Waikato Regional Council award for Golden Cross environmental initiative granted on May 15, 1995 and in March 2004 the Habitat Restoration Award from the Nevada Division of Wildlife for developing habitat at the Rochester mine. In 1994, the Company’s Chairman and Chief Executive Officer, and in 1997, the Company’s Vice President of Environmental and Governmental Affairs, were awarded the American Institute of Mining, Metallurgical and Petroleum Engineers’ Environmental Conservation Distinguished Service Award. In 2006, the Company’s Kensington Gold Project was awarded the prestigious 2006 Hardrock Mineral Community Outreach and Economic Security Award presented by the U.S. Bureau of Land Management (BLM)(“BLM”) in recognition of responsible mineral resource development while demonstrating an understanding of sustainable development.41
The Company’s activities are subject to extensive federal, state and local laws governing the protection of the environment, prospecting, development, production, taxes, labor standards, occupational health, mine safety, toxic substances and other matters. Although the Company is usually involved in regulatory proceedings for renewal or reissuance of various permits, such regulations have never caused the Company to close any mine. The costs associated with compliance with such regulatory requirements are substantial and possible future legislation and regulations could cause additional expense, capital expenditures, restrictions and delays in the development and continued operation of the Company’s properties, the extent of which cannot be predicted. In the context of environmental permitting, including the approval of reclamation plans, the Company must comply with known standards and regulations which may entail significant costs and delays. Although Coeur has been recognized for its commitment to environmental responsibility and believes it is in substantial compliance with applicable laws and regulations, amendments to current laws and regulations, the more stringent implementation thereof through judicial review or administrative action or the adoption of new laws could have a materially adverse effect upon the Company. For the years ended December 31, 2007, 2006 2005 and 2004,2005, the Company expended $5.2 million, $5.6 million $4.9 million and $4.2$4.9 million, respectively, in connection with routine environmental compliance activities at its operating properties and expects to expend approximately $4.0$5.0 million for that purpose in 2007.2008. Future environmental expenditures will be determined by governmental regulations and the overall scope of the Company’s operating and development activities.
37
Federal Environmental Laws Certain mining wastes from extraction and beneficiation of ores are currently exempt from the extensive set of Environmental Protection Agency (“EPA”) regulations governing hazardous waste, although such wastes may be subject to regulation under state law as a solid or hazardous waste. The EPA has worked on a program to regulate these mining wastes pursuant to its solid waste management authority under the Resource Conservation and Recovery Act (“RCRA”). Certain ore processing and other wastes are currently regulated as hazardous wastes by the EPA under RCRA. If the Company’s mine wastes were treated as hazardous waste or such wastes resulted in operations being designated as a “Superfund” site under the Comprehensive Environmental Response, Compensation and Liability Act (“CERCLA” or “Superfund”) for cleanup, material expenditures would be required for the construction of additional waste disposal facilities or for other remediation expenditures. Under CERCLA, any present owner or operator of a Superfund site or an owner or operator at the time of its contamination generally may be held liable and may be forced to undertake remedial cleanup action or to pay for the government’s cleanup efforts. Such owner or operator may also be liable to governmental entities for the cost of damages to natural resources, which may be substantial. Additional regulations or requirements may also be imposed upon the Company’s tailings and waste disposal in Alaska under the Federal Clean Water Act (“CWA”) and state law counterparts, and in Nevada under the Nevada Water Pollution Control Law which implements the CWA. Air emissions are subject to controls under Nevada’s and Alaska’s air pollution statutes implementing the Clean Air Act.Proposed Mining Legislation Legislation has been introduced regularly in the U.S. Congress over the last decade to change the Mining Law of 1872, as amended, under which the Company holds unpatented mining claims on federal lands. A significant portion of the Company’s U.S. mining properties are on unpatented mining claims on federal lands. It is possible that the Mining Law may be amended or be replaced by more onerous legislation in the future. Previously proposed legislation contained a production royalty obligation, new environmental standards and conditions, additional reclamation requirements and extensive new procedural steps which would be likely to result in delays in permitting. Most recently, in late 2007, the U.S. House of Representatives passed a “Hardrock Mining and Reclamation Act of 2007.” The bill contains new proposed royalties on gross revenues for new and existing mining operations on public lands, among other provisions. The ultimate content of the proposed legislation, if enacted, is uncertain. If a royalty on unpatented mining claims were to be imposed under any ultimately enacted law, the Company’s operations could be adversely affected, although the majority of the Company’s operations are either outside of the United States or on private patented lands and unaffected by potential legislation. In addition, the Forest Service and the Bureau of Land Management have considered revising regulations governing operations under the Mining Law on federal lands they administer, which, if implemented, may result in additional procedures and environmental conditions and standards on those lands.42
Any reform of the Mining Law or Bureau of Land Management and Forest Service regulations thereunder based on these initiatives could increase the costs of mining activities on unpatented mining claims, or could materially impair the ability of the Company to develop or continue operations which derive ore from federal lands, and as a result could have an adverse effect on the Company and its results of operations. Until such time, if any, as new reform legislation or regulations are enacted, the ultimate effects and costs of compliance on the Company cannot be estimated.Foreign Government Regulations The mining properties of the Company that are located in Chile and Argentina are subject to various government laws and regulations pertaining to the protection of the air, surface water, ground water and the environment in general, as well as the health of the work force, labor standards and the socioeconomic impacts of mining facilities upon the communities. A recently established State Council for the Environment (CODEMA)(“CODEMA”) has responsibility to define policy, approve plans and programs, control regulatory activities and enforce compliance. The Company believes it is in substantial compliance with all applicable laws and regulations to which it is subject in Chile and Argentina. The Republic of Bolivia, where the San BartolomeBartolomé project is located, hasand the country of Mexico, where the Palmarejo project is located, have adopted laws and guidelines for environmental permitting that are similar to those in effect in the United States and other South American countries. The permitting process requires a thorough study to determine the baseline condition of the mining site and surrounding area, an environmental impact analysis, and proposed mitigation measures to minimize and offset the environmental impact of mining operations. The Company has received all permits required to build and operate the San BartolomeBartolomé mine and the Palmarejo mine.38
The Company does not directly hold any interest in mining properties in Australia. However, under the respective Silver Sale Agreements with CBH Resources Limited and Perilya Broken Hill Limited, the Company has purchased the silver reserves and resources in the ground of these mining companies. These two companies are responsible for the mining operation and compliance with government regulations and the Company is not responsible for compliance. The Company is however at risk for any production stoppages resulting from non-compliance. The mining properties of CBH and Perilya are subject to a range of state and federal government laws and regulations pertaining to the protection of the air, surface water, ground water, noise, site rehabilitation and the environment in general, as well as the occupational health and safety of the work force, labor standards and the socio-economic impacts of mining facilities among local communities. In addition, the various federal and state native title legislation recognizes and protects the rights and interests in Australia of Aboriginal and Torres Strait Islander people in land and waters, according to their traditional laws and customs, and may restrict mining and exploration activity and/or result in additional costs. CBH and Perilya are required to deal with a number of governmental departments in development and exploitation of their respective mining properties. The Company is not aware of any substantial non-compliance with applicable laws and regulations to which its partners are subject in Australia.43
Maintenance of Claims United States At mining properties in the United States, including the Rochester and Kensington mines, operations are conducted in part upon unpatented mining claims, as well as patented mining claims. Pursuant to applicable federal law, it is necessary in order to maintain the unpatented claims, to pay to the Secretary of the Interior, on or before August 31 of each year, a claim maintenance fee of $125 per claim. This claim maintenance fee is in lieu of the assessment work requirement contained in the Mining Law. In addition, in Nevada, holders of unpatented mining claims are required to pay the county recorder of the county in which the claim is situated an annual fee of $3.50$8.50 per claim. No maintenance fees are payable for patented claims. Patented claims are similar to land held by an owner who is entitled to the entire interest in the property with unconditional power of disposition. Chile In Chile, operations are conducted upon mineral concessions granted by the national government. For exploitation concessions (somewhat similar to a U.S. patented claim), to maintain the concession, an annual tax is payable to the government before March 31 of each year in the approximate amount of $1.14 per hectare. For exploration concessions, to maintain the right, the annual tax is approximately $0.30 per hectare. An exploration concession is valid for a five-year period. It may be renewed for new periods unless a third party claims the right to explore upon the property, in which event the exploration concession must be converted to an exploitation concession in order to maintain the rights to the concession. Argentina Minerals are owned by the Argentine government, which allows individual provinces to impose a maximum 3% mine-mouth royalty on mineral production. The first step in acquiring mining rights is filing a cateo, which gives exclusive prospecting rights for the requested area for a period of time, generally up to 3 years. Maximum size of each cateo is 10,000 hectares; a maximum of 20 cateos can be held by a single entity (individual or company) in any one province.39
The holder of a cateo has exclusive right to establish a Manifestation of Discovery (“MD”) on that cateo, but MD’s can also be set without a cateo on any land not covered by someone else’s cateo. MDs are filed as either a vein or disseminated discovery. A square protection zone can be declared around the discovery – up to 840 hectares for vein MD or up to 7,000 hectares for a disseminated MD. The protection zone grants the discoverer exclusive rights for an indefinite period, during which the discoverer must provide an annual report presenting a program of exploration work and investments related to the protection zone. A MD can later be upgraded to a Mina (mining claim), which give the holder the right to begin commercial extraction of minerals. Bolivia The Bolivian national mining company, CorporacionCorporación Minera de Bolivia (“Comibol”), is the underlying owner of all of the mining rights relating to the San BartolomeBartolomé project, with the exception of the Thuru property, which is owned by the Cooperativa Reserva Fiscal, a local miners cooperative. Comibol’s ownership derives from the Supreme Decree 3196 in October 1952, when the government nationalized most of the mines in Potosi, except for Thuru. Except for Thuru,Potosí. Comibol has leased the mining rights for the surface sucu or pallaco gravel deposits to several PotosiPotosí cooperatives. The cooperatives in turn have subleased their mining rights to Manquiri through a series of “joint venture” contracts.contracts with Manquiri. In addition to those agreements with the cooperatives, Coeur, through its subsidiary Manquiri, holds additional mining rights under lease agreements.agreements with Comibol. All of Manquiri’s mining and surface rights collectively constitute the San BartolomeBartolomé project.44
Australia At mining properties in Australia operated by CBH Resources Limited and Perilya Broken Hill Limited, operations are conducted on designated Mining Leases issued by the relevant state government mining department. Mining Leases are issued for a specific term and include a range of environmental and other conditions including the payment of production royalties, annual lease fees and the use of cash or a bank guarantee as security for reclamation liabilities. The amounts required to be paid to secure reclamation liabilities are determined on a case by case basis. In addition, both CBH Resources Limited and Perilya Broken Hill Limited hold a range of exploration titles permits which are also issued by the respective state government mining departments for specified terms and require payment of annual fees and completion of designated expenditure programs on the leases to maintain title. In Australia, minerals in the ground are owned by the state until severed from the ground through mining operations.Mexico In order to carry out mining activities in Mexico, the Company is required to obtain a mining concession from the General Bureau of Mining which belongs to the Ministry of Economy (Secretaría de Economía) of the Federal Government, or previously granted concession rights assigned, and both recorded with the Public Registry of Mining. In addition, mining works may have to be authorized by other authorities when performed at villages, dams, channels, general communications ways, submarine shelf of islands, islets and reefs, marine beds and subsoil, federal maritime-terrestrial zones, etc. Reports have to be filed with the Bureau in May of each year evidencing previous calendar year mining works. Generally nominal biannual mining duties are payable in January and August of each year, however lack of said duties payment may cause cancellation of the concessions. Upon any expiration or cancellation of the concession, the Company must fulfill certain obligations such as refraining from withdrawal permanent works of fortification, providing certain technical reports, and other required actions mandated by the Bureau.EMPLOYEES The number of full-time employees at December 31, 20062007 of Coeur d’Alene Mines Corporation and its subsidiaries was:United States Corporate Staff and Office 3837 Rochester Mine 20042 Kensington PropertyProject 9180 ChileanSouth American Corporate Staff and OfficeOffices 4718 Cerro Bayo Mine(1)South American Exploration 36052 Cerro Bayo Mine/Chile(1) 502 Mina Martha/Argentina(1) 131163 San BartolomeBartolomé Project/Bolivia 6479
TotalPalmarejo Project/Mexico 93169 Australia
1
Tanzania 4 Total 1,047
(1) The Company maintains two labor agreements in South America, consisting of a labor agreement with Syndicato de Trabajadores de Compañía Minera Cerro Bayo Ltd. at its Cerro Bayo mine in Chile and with Associacion Obrera Minera Argentina at its Martha mine in Argentina. The agreement at Cerro Bayo is effective from December 22, 200524, 2007 to December 21, 20072010 and the agreement at Mina Martha is effective from June 12, 2006 to June 1, 2008. Additionally, certain employees at San Bartolomé are covered by a labor agreement that became effective October 11, 2008.2007; this Bolivian labor agreement does not have a fixed term. As of December 31, 2006,2007, the Company had approximately 20%44% of its worldwide labor force covered by collective bargaining agreements.
4045
Item 3.Legal Proceedings.Federal Natural Resources Action
An action was filed on March 22, 1996 in the United States District Court for the District of Idaho by the United States against various defendants, including the Company, asserting claims under CERCLA and the Clean Water Act for alleged damages to federal natural resources in the Coeur d’Alene River Basin of Northern Idaho. The damages are claimed to result from alleged releases of hazardous substances from mining activities conducted in the area since the late 1800s.
The Company and representatives of the U.S. Government, including the Environmental Protection Agency, the Department of Interior and the Department of Agriculture, reached an agreement to settle the lawsuit. The terms of settlement are set forth in a Consent Decree issued by the court. Pursuant to the terms of the Consent Decree, dated May 14, 2001, the Company has paid the U.S. Government a total of approximately $3.9 million, of which $3.3 million was paid in May 2001 and the remaining $0.6 million was paid in June 2001. In addition, the Company (i) paid the United States 50% of any future recoveries from insurance companies for claims for defense and indemnification under general liability insurance policies in excess of $0.6 million, (ii) completed certain cleanup work on the Mineral Point property and Caladay property, and (iii) made a conveyance to the U.S. or the State of Idaho of certain real property to possibly be used as a waste repository. Finally, commencing five years after effectiveness of the settlement, the Company is obligated to pay royalties on all of its domestic and foreign operating properties, up to a cumulative maximum of $3.0 million, amounting to a 2% net smelter royalty on silver production if the price of silver exceeds $6.50 per ounce, and a $5.00 per ounce royalty on gold production if the price of gold exceeds $325 per ounce. The royalty payment obligation commenced on May 14, 2006 and expires after May 14, 2021. As of December 31, 2006, $2.4 million of the $3.0 million was paid. It is expected that the remaining $0.5 million will be paid in the first half of 2007.
States of Maine, Idaho and Colorado Superfund Sites Related to Callahan Mining Corporation During 1991, the Company acquired all of the outstanding common stock of Callahan Mining Corporation. During 2001, the United States Forest Service made a formal request for information regarding the Deadwood Mine Site located in central Idaho. Callahan Mining Corporation had operated at this site during the 1940‘s.1940’s. The Forest Service believes that some cleanup action is required at the location. However, Coeur d’Alene Mines Corporation did not acquire Callahan until 1991, more than 40 years after Callahan disposed of its interest in the Deadwood property. The Company did not make any decisions with respect to generation, transport or disposal of hazardous waste at the site. Therefore, it is believed that the Company is not liable for any cleanup, and if Callahan might be liable, it has no substantial assets with which to satisfy any such liability. To date, no claim has been made by the United States for any cleanup costs against either the Company or Callahan. During 2002, the EPA made a formal request for information regarding a Callahan mine site in the State of Maine. Callahan operated there in the late 1960‘s,1960’s, shut the operations down in the early 1970‘s1970’s and disposed of the property. The EPA contends that some cleanup action is warranted at the site, and listed it on the National Priorities List in late 2002. The Company believes that because it made no decisions with respect to generation, transport or disposal of hazardous waste at this location, it is not liable for any cleanup costs. If Callahan might have liability, it has no substantial assets with which to satisfy such liability. To date, no claim has been made for any cleanup costs against either the Company or Callahan. In January 2003, the U.S. Forest Service made a formal request for information regarding a Callahan mine site in the State of Colorado known as the Akron Mine Site. Callahan operated there in approximately the late 1930s through the 1940s, and to the Company’s knowledge, disposed of the property. The Company is not aware of what, if any, cleanup action the Forest Service is contemplating. However, the Company did not make decisions with respect to generation, transport or disposal of hazardous waste at this location, and therefore believes it is not liable for any cleanup costs. If Callahan might have liability, it has no substantial assets with which to satisfy such liability. To date, no claim has been made for any cleanup costs against either the Company or Callahan.41
Federal District Court of Alaska Permit Challenge On September 12, 2005 three environmental groups (“Plaintiffs”) filed a lawsuit in Federal District Court in Alaska against the U.S. Army Corps of Engineers (“Corps of Engineers”) and the U.S. Forest Service (“USFS”) seeking to invalidate the permit issued to Coeur Alaska, Inc. for the Company’s Kensington mine. The Plaintiffs claim the Clean Water Act (CWA)(“CWA”) Section 404 permit issued by the Corps of Engineers authorizing the deposition of mine tailings into Lower Slate Lake conflicts with the CWA and is thus illegal.CWA. They additionally claim the USFS’s approval of the Amended Plan of Operations is arbitrary and capricious because it relies on the 404 permit issued by the Corps of Engineers. On November 8, 2005, Following the Corps of Engineers filed a Motion for Voluntary Remand with the court to review the permit issued to the Company under the CWA Section 404 and requested that the court stay the legal proceeding filed by the plaintiffs pending the outcome of review. On November 12, 2005, the Federal District Court in Alaska granted theCourt’s remand of the Section 404 permit to the Corps of Engineers for further review. On November 22, 2005,review, the Corps of Engineers advised the Company that it was suspending the Section 404 permit pursuant to the Court’s remand to further review the permit.
On March 29, 2006, the Corps of Engineers reinstated the Company’s 404 permit. On April 6, 2006 thepermit on March 29, 2006. The lawsuit challenging the permit was re-opened andon April 6, 2006; Coeur Alaska Inc. filed its answer to the Amended ComplaintComplaint; and Motion to Intervene as a Defendant-Intervenor in the action. Two other parties,Coeur Alaska, the State of Alaska, and Goldbelt, Inc., a local native corporation, also filed Motions to Intervene as Defendant-Intervenors as supporters of the Kensington project as permitted. The Company, the State of Alaska and Goldbelt, Inc. were granted Defendant-Intervenor status and joinedto join the agencies in their defense of the permits as issued.permit.
46
On August 4, 2006, the Federal District Court in Alaska dismissed the Plaintiffs’ challenge and upheld the Section 404 permit. On August 7, 2006 the Plaintiffs filed a Notice of Appeal of the decision to the Ninth Circuit Court of Appeals (“Ninth Circuit Court”) and on August 9, 2006 the Plaintiffs additionally filed a Motion for Injunction Pending Appeal with the Ninth Circuit Court. The Ninth Circuit Court granted a temporary injunction pending appeal on August 24, 2006, enjoining certain activities relating to the lake tailings facility. The On May 22, 2007 the Ninth Circuit Court further ordered an expedited briefing schedulereversed the District Court’s August 4, 2006 decision which had upheld the Company’s 404 permit and issued its opinion that remanded the case to the District Court with instructions to vacate the Company’s 404 permit as well as the USFS Record of Decision approving the general tailings disposal plan as well as the Goldbelt 404 permit to construct the Cascade Point Marine Facility. On August 20, 2007, Coeur Alaska filed a Petition for Rehearing En Banc with the Ninth Circuit Court, as did the State of Alaska and Goldbelt, Inc. The Department of Justice, on the meritsbehalf of the legal challenge. AsCorps of Engineers, and USFS additionally filed a limited Petition for Rehearing with the Ninth Circuit panel seeking reconsideration of the mandate of the May 22, 2007 panel decision. On October 13, 2006,29, 2007, the partiesNinth Circuit denied the Petitions for Rehearing En Banc. On November 14, 2007 the Ninth Circuit granted a stay of the mandate pending further appeal to the Supreme Court, subject to the development of a reclamation plan for the lake area. The Company and the State of Alaska, filed their briefs inPetitions for Certiorari to the CircuitSupreme Court and participated in an oral argumentof the United States on December 4, 2006. There is no indication of whenJanuary 28, 2008. The Company cannot now predict the Circuit Court may rule on the merits onpotential for obtaining further appeal or the impactif it will prevail upon the project.appeal if one is granted.
The Company has identified a potential alternate tailings site and is unableengaged in discussions with government officials in addition to pursuing its appeal to the Supreme Court of the United States. Coeur cannot predict the potential for obtaining a Supreme Court appeal or if one is granted, if it will prevail upon appeal. No assurance can be given as to whether or when regulatory permits and approvals granted to the Company may be further challenged, appealed or contested by third parties or issuing agencies, or as to whether the Company will place the Kensington project into commercial production. This litigation has contributed to an increase in capital costs. While the Company cannot now predict with certainty the outcome of this litigation, it believes it should ultimately prevail. In the litigation orevent that the impactCompany does not prevail, it could be necessary to seek an alternate site for the tailings disposal facility. The Company has identified an alternate site which it believes can be permitted and has submitted a modified plan to the USFS. Based upon the Company’s current estimates, an impairment writedown could be necessary should the expectation of the temporary injunction.long-term price for gold decrease below approximately $606 per ounce. As of December 31, 2007, the carrying value of the Kensington project’s long-lived assets was $298.2 million.
AVAILABLE INFORMATION The Company’s website ishttp://www.coeur.com. Coeur makes available free of charge, on or through its website, its Annual Reports on Form 10-K, Quarterly Reports on Form 10-Q, Current Reports on Form 8-K and Forms 3 and 4, as soon as reasonably practicable after electronically filing such reports with the Securities and Exchange Commission. Copies of the charters of the Audit Committee, Compensation Committee and Nominating and Corporate Governance Committee of the Board of Directors are available at our websitewww.coeur.com. Coeur has adopted a Code of Conduct and Ethics for Directors, Officers and Employees, including the chief executive officer, chief financial officer and chief accounting officer. A copy of the code of ethics and our Corporate Governance Guidelines are available at our websitewww.coeur.com. Information contained on the Company’s website is not a part of this report.42
The Company’s Board of Directors adopted an addendum to its Policies and Procedures Manual to establish a code of ethics for the chief executive and principal financial and accounting officers of the Company. The Company will provide a copy of the code free of charge to any person that requests a copy by writing to the Secretary, Coeur d’Alene Mines Corporation, 400 Coeur d’Alene Mines Building, 505 Front Avenue, Post Office Box I, Coeur d’Alene, Idaho 83816-0316.47
Item 4.Submission of Matters to a Vote of Security Holders. Not applicable.
A special meeting of shareholders of the Company was convened and adjourned (due to lack of a quorum) on December 3, 2007, and, reconvened on December 7, 2007 (at which time a quorum was present or represented by proxy). Of the Company’s total 278,465,840 shares of common stock outstanding on October 19, 2007 (the record date), 143,826,056 shares (or 51.65% of the outstanding shares of common stock) were represented in person or by proxy at the special meeting. The first proposal was a proposal to amend and restate the Company’s articles of incorporation to increase the authorized number of shares of the Company’s common stock from 500,000,000 to 750,000,000. The proposal was approved by the holders of more than the required majority of the shares voting at the meeting by a vote of 126,966,199 shares for, 11,569,155 shares against with 5,290,702 shares abstaining. The second proposal was the proposed issuance of new shares of the Company’s common stock to Bolnisi Gold NL shareholders in connection with the combination of Bolnisi with the Company, and the proposed issuance of new shares of the Company’s common stock to Palmarejo Silver and Gold Corporation shareholders in connection with the combination of the Company and Palmarejo. The proposal was approved by the holders of more than the required majority of the outstanding shares of common stock by a vote of 127,482,674 shares for, 11,034,944 shares against with 5,308,438 shares abstaining. The third and last proposal was a proposal to approve the adjournment or postponement of the special meeting, if necessary or appropriate, to solicit additional proxies if there are insufficient votes at the time of the special meeting to adopt any of the foregoing proposals. The proposal was approved by the holders of more than the required majority of the shares of common stock voting at the meeting by a vote of 123,865,808 shares for, 14,149,841 shares against with 5,810,407 shares abstaining.Item 4A.Executive Officers of the Registrant. The following table sets forth certain information regarding the Company’s current executive officers: Name Age Positions with Coeur Since Dennis E. Wheeler 65 Chairman of the Board 1992 Chief Executive Officer and President 1986 James A. Sabala 53 Executive Vice President and Chief Financial Officer 2003 Richard M. Weston 56 Senior Vice President, Operations 2006 James K. Duff 62 President, South American Operations 2005 Donald J. Birak 54 Senior Vice President, Exploration 2004 Alan L. Wilder 59 Senior Vice President, Project Development 2004 Mitchell J. Krebs 36 Senior Vice President, Corporate Development 2003 Kelli C. Kast 41 Vice President, General Counsel and Corporate Secretary 2005 Luke J. Russell 52 Vice President, Environmental Services 2005 Tom T. Angelos 52 Vice President, Controller and Chief Accounting Officer 2004 Larry A. Nelson 55 Vice President, Human Resources 2008 Carolyn S. Turner 39 Treasurer 2008
48
Name
Age
Positions with Coeur
Since
Dennis E. Wheeler64 Chairman of the Board 1992 Chief Executive Officer and President 1986
James A. Sabala52 Executive Vice President, Chief Financial Officer 2003 and Treasurer
Harry F. Cougher64 Senior Vice President, North American Operations 2005
James K. Duff62 President, South American Operations 2005
Donald J. Birak53 Senior Vice President, Exploration 2004
Alan L. Wilder58 Senior Vice President, Project Development 2004
Gary W. Banbury54 Senior Vice President, 2004 Chief Administrative Officer
Richard Weston55 Senior Vice President and Managing Director, 2006 Coeur Australia Pty Limited and Vice President of South America
Mitchell J. Krebs35 Senior Vice President, Corporate Development 2003
Kelli C. Kast40 Vice President, General Counsel and 2005 Corporate Secretary
W. Scott Lamb52 Vice President, Investor Relations 2005
Luke J. Russell50 Vice President, Environmental Services 2005
Tom T. Angelos51 Vice President, Controller and 2004 Chief Accounting Officer
Carolyn S. Turner38 Assistant Treasurer 2006
Dennis E. Wheelerhas been Chairman of the Board of Coeur d’Alene Mines Corporation since May 1992 and Chief Executive Officer since December 1986. Previously, Mr. Wheeler served as President of Coeur, commencing in December 1980. Mr. Wheeler was our Chief Administrative Officer from December 1980 to December 1986, Secretary from January 1980 to December 1980 and Senior Vice President and General Counsel from 1978 to 1980.43
James A. Sabalawas appointed as Executive Vice President and Chief Financial Officer of Coeur in January 2003. Prior to that, Mr. Sabala was Vice President and Chief Financial Officer of Stillwater Mining Company from 1998 to 2003, and from 1981 to 1998 was employed by Coeur in various capacities, most recently as Executive Vice President and Chief Financial Officer.Harry F. CougherRichard M. Westonwas appointed Senior Vice President – North American Operations in January 2005.May, 2007. Prior to that Mr. Cougher was the Vice President and General Manager of Coeur Silver Valley since 2001. Previous to this Mr. CougherWeston served as Senior Vice President Mining & Chief Operating Officer for Sunshine Mining Companyand Managing Director of Coeur Australia Pty. Limited and Vice President of South American Operations in December 2006. Prior thereto, he served as Senior Vice President and Managing Director of Coeur Australia from 1994February 2006 to 2001.December 2006. Prior to that, Mr. Weston was employed with Barrick Australia from January 2003 to February 2006 as General Manager of Cowal Gold Project and Rio Tinto Australia from December 2000 to November 2002 as General Manager of the ERA and Jabiluka mines.
James K. Duffwas appointed President South American Operations September of 2005. Prior to that Mr. Duff served as President Empressaof Empresa Manquiri SA from June 2005 to September 2005. Prior to that he was employed as an independent contractor by Coeur from November 2002 to June 2005 and prior to that he was employed from March 1990 to November 2002 as Vice President Business Development for Coeur d’Alene Mines.Donald J. Birakwas appointed as Senior Vice President – Exploration of Coeur in January 2004. Prior to that, Mr. Birak was employed with AngloGold North America, Inc. from March 1999 to January 20, 2004, as Vice President – Exploration.Exploration and as Vice President of Exploration for Independence Mining Company Inc from 1995 to 1999.
Alan L. Wilderwas appointed Senior Vice President, Project Development in July 2004. Prior to that Mr. Wilder was an independent consultant from July 2002 to July 2004 for Glamis Gold and Coeur d’Alene Mines Corporation. Prior thereto, he was Project Manager for BHP Tintaya from February 2000 to June 2002 and from 1999 to 2000 he was an independent consultant for the mining industry.Gary W. Banburywas appointed Senior Vice President and Chief Administrative Officer in February 2004. Prior to that, Mr. Banbury served as Vice President, Administration and Human Resources from 2000 to 2004. Mr. Banbury held the position of Vice President, Human Resources of Coeur from 1998 to 2000, and prior thereto he served as Manager of Human Resources with Coeur.
Richard M. Westonwas appointed Senior Vice President and Managing Director of Coeur Australia Pty. Limited and Vice President of South American Operations in December 2006. Prior to that, Mr. Weston served as Senior Vice President and Managing Director of Coeur Australia from February 2006 to December 2006. Prior to that, Mr. Weston was employed with Barrick Australia from January 2003 to February 2006 as General Manager of Cowal Gold Project and Rio Tinto Australia from December 2000 to November 2002 as General Manager of the ERA and Jabiluka mines.
Mitchell J. Krebswas appointed to the position of Senior Vice President, Corporate Development of Coeur in May 2006. Prior to that, Mr. Krebs served as Vice President, Corporate Development of Coeur from February 2003 to May 2006. Mr. Krebs was employed as an independent consultant from September 2001 through January 2003, and from May 2000 through August 2001 was employed as the President of Mine Depot Inc. From August 1999 through April 2000, Mr. Krebs was an associate with Allied Capital Corporation. From August 1995 through November 1997, Mr. Krebs was employed by Coeur as Manager, Acquisition Evaluation.49
Kelli C. Kastwas appointed Vice President, General Counsel and Corporate Secretary in May 2005. Prior to that Ms. Kast served as Corporate Counsel for HealtheTech. Inc. from April 2004 to April 2005. Prior thereto, she served as Assistant General Counsel and Corporate Secretary for Global Water Technologies Inc. and Psychrometric Systems, Inc. from December 1997 through February 2003.W. Scott Lambwas appointed Vice President Investor Relations in August 2005. Prior to that Mr. Lamb was employed with Kaiser Aluminum Corporation from January 1992 to July 2005 and held the position of Vice President Investor Relations and Corporate Communications.
44
Luke J. Russellwas appointed Vice President of Environmental Services at Coeur in 2005. Prior to that, Mr. Russell was Coeur d’Alene Basin Project Manager for the State of Idaho’s Department of Environmental Quality. Before that, he held a series of increasingly responsible positions in the management of environmental affairs at major mining companies and was previously Director of Environmental and Government Affairs for Coeur from 1995 to 2000.Tom T. Angeloswas appointed Vice President, Controller and Chief Accounting Officer in December 2006. Prior to that, he had held the position of Controller and Chief Accounting Officer of Coeur since 2004. Mr. Angelos was previously Controller of Stillwater Mining Company from 1998 to 2004, and from 1983 to 1998 was employed by Coeur in various capacities, most recently as Controller.Larry A. Nelsonwas appointed Vice President Human Resources in January 2008. Prior to that, Mr. Nelson served as Director Human Resources from 2005 to 2008. Mr. Nelson held the position of Human Resources Manager at Coeur Silver Valley from 1996 to 2005. Prior to that, he was employed in corporate and site human resource positions within the mining industry since 1977.Carolyn S. Turnerwas appointed Assistant Treasurer in December 2006.January 2008. Prior to that, Ms. Turner served as Assistant Treasurer from 2006 to 2008. Ms. Turner served as Director of Budgeting and Forecasting from 2005 to 2006 and from 1996 to 2005 held various positions at Coeur Silver Valley, most recently as Administrative Manager.Part IIItem 5.Market for Registrant’s Common Equity, Related Stockholder Matters and Issuer Purchases of Equity Securities.
Item 5. Market for Registrant’s Common Equity, Related Stockholder Matters and Issuer Purchases of Equity Securities.
The Company’s Common Stock is listed on the New York Stock Exchange (the “NYSE”) and, the Toronto Stock Exchange.Exchange (“TSX”) and the Australian Stock Exchange (“ASX”). The following table sets forth, for the periods indicated, the high and low closing sales prices of the Common Stock as reported by the NYSE: High Low 2006 First Quarter $ 6.71 $ 4.11 Second Quarter $ 7.37 $ 3.95 Third Quarter $ 5.75 $ 4.41 Fourth Quarter $ 5.45 $ 4.35 2007 First Quarter $ 4.80 $ 3.95 Second Quarter $ 4.32 $ 3.51 Third Quarter $ 4.22 $ 3.25 Fourth Quarter $ 4.94 $ 3.62 2008 First Quarter (through February 12, 2008) $ 5.06 $ 4.20
50
High
Low
2005 First Quarter $ 4.37 $ 3.33 Second Quarter $ 3.75 $ 2.75 Third Quarter $ 4.32 $ 3.36 Fourth Quarter $ 4.59 $ 3.62 2006 First Quarter $ 6.71 $ 4.11 Second Quarter $ 7.37 $ 3.95 Third Quarter $ 5.75 $ 4.41 Fourth Quarter $ 5.45 $ 4.35 2007 First Quarter (through February 16, 2007) $ 4.79 $ 4.20
The Company has not paid per share cash distributions or dividends on its Common Stock since 1996. Future distributions or dividends on the Common Stock, if any, will be determined by the Company’s Board of Directors and will depend upon the Company’s results of operations, financial conditions, capital requirements and other factors. At February 15, 2007,12, 2008, there were 4,7164,698 record holders of the Company’s outstanding Common Stock. On December 21, 2007 the Company, Bolnisi Gold NL (“Bolnisi”) and Palmarejo Silver and Gold Corporation (“Palmarejo”) completed the transactions whereby Coeur acquired all the shares of Bolnisi and Palmarejo in exchange for approximately 272 million new shares of the Company’s common stock and cash. Bolnisi shareholders received 0.682 shares of Coeur common stock for each Bolnisi share they owned (or, at the election of the Bolnisi shareholder, CHESS Depositary interests representing Coeur shares) and Palmarejo shareholders (other than Bolnisi) received 2.715 Coeur shares for each Palmarejo share they owned. The Company didCoeur shares issued were not issue any securities without registrationregistered under the Securities Act of 1933 duringin reliance on Section 3(a)(10) thereof, as the year ended December 31, 2006.shares issued to Bolnisi shareholders were issued pursuant to a scheme of arrangement that was approved by the Federal Court of Australia, and the shares issued to Palmarejo shareholders were issued pursuant to a plan of arrangement that was approved by the Ontario Superior Court of Justice.
The Company made no repurchases of its common stock during the year ended December 31, 2006.45
2007.
Equity Compensation Plan Information The following table sets forth information as of December 31, 20062007 regarding the Company’s equity compensation plans. Number of shares remaining Number of shares to be available for future issuance issued upon exercise of Weighted-average exercise under equity compensation outstanding options, price of outstanding options, plans (excluding securities Plan category warrants and rights warrants and rights reflected in column (a)) (a) (b) (c) Equity compensation plans approved by security holders 2,281,595 $ 3.42 4,875,261 Equity compensation plans not approved by security holders — — — Total 2,281,595 $ 3.42 4,875,261
51
Plan category
Number of shares to be
issued upon exercise of
outstanding options,
warrants and rights
Weighted-average exercise
price of outstanding options,
warrants and rights
Number of shares remaining
available for future issuance
under equity compensation
plans (excluding securities
reflected in column (a))
(a) (b) (c) Equity compensation plans approved by security holders 2,089,650 $ 3.56 5,361,819
Equity compensation plans not approved by security holders -- -- --
Total 2,089,650 $ 3.56 5,361,819
46
STOCK PERFORMANCE CHARTCOMPARISON OF 5 YEAR CUMULATIVE TOTAL RETURN*
AMONG COEUR D’ALENE MINES CORPORATION,
S&P 500 INDEX AND PEER GROUP INDEX The following chart compares our cumulative total shareholder return for the five years ended December 31, 20062007 with (i) the S&P 500 Index, which is a performance indicator of the overall stock market, and (ii) a peer group determined by us. Comparison of Five-Year Cumulative Total Return Coeur d’Alene Mines Corporation, S&P 500, and Coeur d’Alene Mines Comparator Group.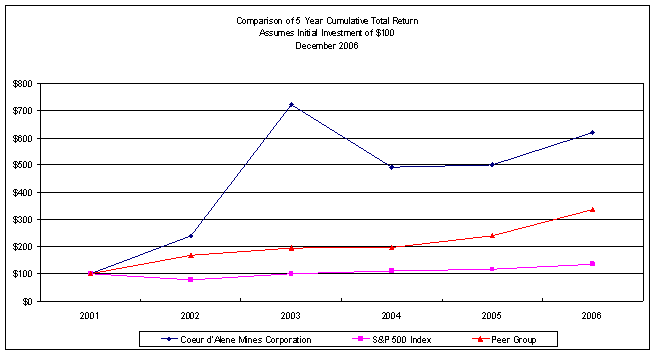
Dec.
2001
Dec.
2002
Dec.
2003
Dec.
2004
Dec.
2005
Dec.
2006
Coeur d’Alene Mines Corporation Common Stock 100.00 240.03 722.58 491.30 500.09 618.85
S&P 500 Index 100.00 77.89 100.23 111.13 116.57 134.98
Peer Group Index** 100.00 168.54 195.38 197.34 239.99 336.52
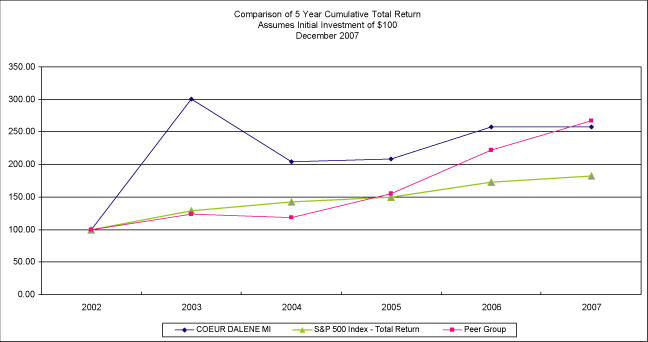
Dec. Dec. Dec. Dec. Dec. Dec. 2002 2003 2004 2005 2006 2007 Coeur d’Alene Mines Corporation Common Stock 100.00 301.04 204.68 208.34 257.82 257.29 S&P 500 Index 100.00 128.68 142.67 149.65 173.28 182.67 Peer Group Index** 100.00 123.37 117.98 155.14 221.81 266.80
Assumes $100 invested on January 1, 2002,2003, in our common stock, S&P 500 Index and the peer group index.
* Total return assumes reinvestment of dividends.
** The issuers of common stock included in the peer group in 2007 are Agnico Eagle Mines, Goldcorp, Hecla Mining Co., IAM Gold, Kinross Gold Corp., Northgate Minerals, Pan American Silver Corp. and Stillwater Mining Co. (Bema Gold was dropped due to mergers and acquisitions, Centerra was dropped due to the fact that it no longer trades on any U.S. stock exchange and Yamana Gold was added.) The issuers of common stock included in the peer group in 2006 are Agnico Eagle Mines, Bema Gold, CeterraCenterra Gold, Goldcorp, Hecla Mining Co., IAM Gold, Kinross Gold Corp., Meridian Gold, Inc., Northgate Minerals, Pan American Silver Corp. and Stillwater Mining Co. (Cambior Inc. and Glamis Gold were dropped due to mergers and acquisitions and Ceterra Gold was added.) The issuers of common stock included in the peer group in 2005 are Agnico Eagle Mines, Bema Gold, Cambior Inc., Ceterra Gold, Glamis Gold, Goldcorp, Hecla Mining Co., Kinross Gold Corp., Meridian Gold, Inc., Northgate Minerals, Pan American Silver Corp. and Stillwater Mining Co.
4752
Item 6.Selected Financial Data The following table summarizes certain selected consolidated financial data with respect to the Company and its subsidiaries and should be read in conjunction with the Consolidated Financial Statements and Notes thereto appearing elsewhere in this report. 2007 2006 2005 2004 2003 (In thousands, except per share data) Income Statement Data: Revenues: Sales of metal $ 215,319 $ 216,573 $ 156,284 $ 109,047 $ 93,620 Costs and expenses: Production costs applicable to sales 117,025 92,378 88,232 63,715 64,970 Depreciation and depletion 20,984 26,772 18,889 16,833 15,107 Administrative and general 23,875 19,369 20,624 17,499 12,264 Exploration 11,941 9,474 10,553 8,031 4,277 Litigation settlement 507 2,365 1,600 — — Pre-development — — 6,057 11,449 1,967 Other holding costs — — — — 4,478 Total costs and expenses 174,332 150,358 145,955 117,527 103,063 Operating income (loss) 40,987 66,215 10,329 (8,480 ) (9,443 ) Other income (expense) Interest and other income 18,195 18,654 8,385 3,165 2,064 Interest expense, net (365 ) (1,224 ) (2,485 ) (2,831 ) (12,851 ) Merger expenses — — — (15,675 ) — Loss on early retirement of debt — — — — (41,564 ) Total other income (expense) 17,830 17,430 5,900 (15,341 ) (52,351 ) Income (loss) from continuing operations before income taxes 58,817 83,645 16,229 (23,821 ) (61,794 ) Income tax (provision) benefit (14,927 ) (8,226 ) (1,483 ) 5,785 7 Income (loss) from continuing operations 43,890 75,419 14,746 (18,036 ) (61,787 ) Income (loss) from discontinued operations — 1,935 (4,195 ) 1,178 (2,139 ) Gain on sale of net assets of discontinued operation — 11,132 — — — Cumulative effect of accounting change — — — — (2,306 ) Net income (loss) $ 43,890 $ 88,486 $ 10,551 $ (16,858 ) $ (66,232 ) Other comprehensive income (loss) 86 2,391 447 (908 ) (556 ) Comprehensive income (loss) $ 43,976 $ 90,877 $ 10,998 $ (17,766 ) $ (66,788 ) Basic and Diluted Income (Loss) Per Share Data: Basic Income (Loss) Per Share: Income (loss) from continuing operations $ 0.15 $ 0.28 $ 0.06 $ (0.08 ) $ (0.37 ) Income (loss) from discontinued operations — 0.05 (0.02 ) 0.00 (0.01 ) Cumulative effect of accounting change — — — — (0.01 ) Net income (loss) $ 0.15 $ 0.33 $ 0.04 $ (0.08 ) $ (0.39 ) Diluted Income (Loss) Per Share: Income (loss) from continuing operations $ 0.14 $ 0.26 $ 0.06 $ (0.08 ) $ (0.37 ) Income (loss) from discontinued operations — 0.04 (0.02 ) 0.00 (0.01 ) Cumulative effect of accounting change — — — — (0.01 ) Net income (loss) $ 0.14 $ 0.30 $ 0.04 $ (0.08 ) $ (0.39 ) Weighted average number of shares of common stock Basic 285,972 271,357 242,915 215,969 168,186 Diluted 310,524 296,082 243,683 215,969 168,186 Balance Sheet Data:(1) Total assets $ 2,651,694 $ 849,626 $ 594,816 $ 525,777 $ 259,467 Working capital $ 152,390 $ 383,082 $ 281,977 $ 345,894 $ 96,994 Long-term liabilities $ 812,650 $ 210,117 $ 206,921 $ 198,873 $ 29,461 Shareholders’ equity $ 1,727,367 $ 580,994 $ 341,553 $ 293,454 $ 197,478
53
Income Statement Data: 2006
2005
2004
2003
2002
(In thousands except per share data)
Revenues: Sales of metal $ 216,573 $ 156,284 $ 109,047 $ 93,620 $ 67,117
Costs and expenses: Production costs applicable to sales 92,378 88,232 63,715 64,970 65,654 Depreciation and depletion 26,772 18,889 16,833 15,107 10,150 Administrative and general 19,369 20,624 17,499 12,264 8,806 Exploration 9,474 10,553 8,031 4,277 3,849 Pre-development -- 6,057 11,449 1,967 2,606 Other holding costs -- -- -- 4,478 3,608 Litigation settlement 2,365 1,600 -- -- --
Total costs and expenses 150,358 145,955 117,527 103,063 94,673
Other income (expense) Interest and other income 18,654 8,385 3,165 2,064 4,080 Interest expense, net (1,224 ) (2,485 ) (2,831 ) (12,851 ) (21,948 ) Merger expenses -- -- (15,675 ) -- -- Loss on early retirement of debt -- -- -- (41,564 ) (19,061 )
Total other income (expense) 17,430 5,900 (15,341 ) (52,351 ) (36,929 )
Income (loss) from continuing operations before income taxes 83,645 16,229 (23,821 ) (61,794 ) (64,485 ) Income tax (provision) benefit (8,226 ) (1,483 ) 5,785 7 --
Income(loss) from continuing operations 75,419 14,746 (18,036 ) (61,787 ) (64,485 ) Income (loss) from discontinued operations 1,935 (4,195 ) 1,178 (2,139 ) (16,334 ) Gain on sale of net assets of discontinued operation 11,132 -- -- -- -- Cumulative effect of accounting change -- -- -- (2,306 ) --
Net income (loss) $ 88,486 $ 10,551 $ (16,858 ) $ (66,232 ) $ (80,819 )
Other comprehensive income (loss) 2,391 447 (908 ) (556 ) (1,470 )
Comprehensive income (loss) $ 90,877 $ 10,998 $ (17,766 ) $ (66,788 ) $ (82,289 )
Basic and Diluted Income (Loss) Per Share Data: Basic Income (Loss) Per Share: Income (loss) from continuing operations $ 0.28 $ 0.06 $ (0.08 ) $ (0.37 ) $ (0.82 ) Income (loss) from discontinued operations 0.05 (0.02 ) 0.00 (0.01 ) (0.21 ) Cumulative effect of accounting change -- -- -- (0.01 ) --
Net income (loss) $ 0.33 $ 0.04 $ (0.08 ) $ (0.39 ) $ (1.03 )
Diluted Income (Loss) Per Share: Income (loss) from continuing operations $ 0.26 $ 0.06 $ (0.08 ) $ (0.37 ) $ (0.82 ) Income (loss) from discontinued operations 0.04 (0.02 ) 0.00 (0.01 ) (0.21 ) Cumulative effect of accounting change -- -- -- (0.01 ) --
Net income (loss) $ 0.30 $ 0.04 $ (0.08 ) $ (0.39 ) $ (1.03 )
Weighted average number of shares of common stock Basic 271,357 242,915 215,969 168,186 78,193
Diluted 296,082 243,683 215,969 168,186 78,193
48
Balance Sheet Data: 2006
2005
2004
2003
2002
(In thousands except per share data)
Total assets $ 849,626 $ 594,816 $ 525,777 $ 259,467 $ 173,491 Working capital $ 383,082 $ 281,977 $ 345,894 $ 96,994 $ 2,661 Long-term liabilities $ 210,117 $ 206,921 $ 198,873 $ 29,461 $ 81,200 Shareholders' equity $ 580,994 $ 341,553 $ 293,454 $ 197,478 $ 47,687
Item 7.Management’s Discussion and Analysis of Financial Condition andResults of Operations
(1) On December 21, 2007, the Company completed its acquisition of all the shares of Bolnisi and Palmarejo in exchange for a total of approximately 272 million shares of Coeur common stock and a total cash payment of approximately $1.1 million. The total consideration paid amounted to $1.1 billion and the total liabilities assumed were $0.7 billion.
Item 7. Management’s Discussion and Analysis of Financial Condition and Results of Operations
General The results of the Company’s operations are significantly affected by the market prices of gold and silver which fluctuate widely and are affected by many factors beyond the Company’s control, including interest rates, expectations regarding inflation, currency values, governmental decisions regarding the disposal of precious metals stockpiles, global and regional political and economic conditions, and other factors. The Company’s business strategy is to capitalize on the ore reserve/mineralized material bases located at its operating mines and the expertise of its management team to continue as a leading primary silver production company through long-term, cash flow generating growth. The principal elements of the Company’s business strategy are to: (i) increase the Company’s silver production and reserves; (ii) decrease cash costs and increase production at the Company’s existing silver mining operations; (iii) transform development-stage properties into producing mines; (iv) acquire operating mines, mineral interests, exploration and/or development properties with a view to reducing the Company’s cash and total costs, provide short-term positive cash flow return and expand its silver production base and reserves; and (v) continue to explore for new silver and gold discoveries primarily near its existing mine sites and evaluate new opportunities to expand its production through acquisitions and exploration. The Rochester mine, Cerro Bayo mine and Martha mine, each operated by the Company, and the Endeavor and Broken Hill mines which are operated by others, constituted the Company’s principal sources of mining revenues in 2006.2007.
Critical Accounting Policies and Estimates Management considers the following policies to be most critical in understanding the judgments that are involved in preparing the Company’s consolidated financial statements and the uncertainties that could impact its results of operations, financial condition and cash flows. Our consolidated financial statements are impacted by the accounting policies used and the estimates and assumptions made by management during their preparation. We have identified the policies below as critical to our business operations and the understanding of our results of operations. Management’s discussion and analysis of our financial condition and results of operations are based on our consolidated financial statements, which have been prepared in conformity with U.S. generally accepted accounting principles generally accepted in the United States (GAAP)(“GAAP”). The preparation of these statements requires that we make estimates and assumptions that affect the reported amounts of assets and liabilities, disclosure of contingent assets and liabilities at the date of our financial statements, and the reported amounts of revenue and expenses during the reporting period. We base these estimates on historical experience and on assumptions that we consider reasonable under the circumstances; however, reported results could differ from those based on the current estimates under different assumptions or conditions. The impact and any associated risks related to these policies on our business operations are discussed throughout Management’s Discussion and Analysis of Financial Condition and Results of Operations. The areas requiring the use of management’s estimates and assumptions relate to recoverable ounces from proven and probable ore reserves that are the basis of future cash flow estimates and units-of-production depreciation and amortization calculations; useful lives utilized for depreciation, depletion and amortization for long lived assets; estimates of recoverable gold and silver ounces in ore on leach pad; the amount and timing of reclamation and remediation costs; and valuation allowanceallowances for deferred tax assets; and post-employment and other employee benefit liabilities.assets. For a detailed discussion on the application of these and other accounting policies, see Note B in the Notes to the Consolidated Financial Statements of this Annual Report on Form 10-K.54
49
Revenue Recognition. Revenue includes sales value received for our principal product, silver, and associated by-product revenues from the sale of by-product metals consisting primarily of gold and copper. Revenue is recognized when title to silver and gold passes to the buyer and when collectibilitycollectability is reasonably assured. The passing of title to the customer is based on terms of the sales contract. Product pricing is determined at the point revenue is recognized by reference to active and freely traded commodity markets, for example the London Bullion Market, an active and freely traded commodity market for both gold and silver in an identical form to the product sold. Under our concentrate sales contracts with third-party smelters, final gold and silver prices are set on a specified future quotationalquotation period, typically one to three months, after the shipment date based on metal market prices. Revenues are recorded under these contracts at the time title passes to the buyer based on the forward price for the expected settlement period. The contracts, in general, provide for a provisional payment based upon provisional assays and quoted metal prices. Final settlement is based on the average applicable price for a specified future period, and generally occurs from three to six months after shipment. Final sales are settled using smelter weights, settlement assays (average of assays exchanged and/or umpire assay results) and are priced as specified in the smelter contract. The Company’s provisionally priced sales contain an embedded derivative that is required to be separated from the host contract for accounting purposes. The host contract is the receivable from the sale of concentrates at the forward price at the time of sale. The embedded derivative does not qualify for hedge accounting. The embedded derivative is recorded as a derivative asset in prepaid expenses and other, or a derivative liability in accrued liabilities and other on the balance sheet and is adjusted to fair value through revenue each period until the date of final gold and silver settlement. The form of the material being sold, after deduction for smelting and refining is in an identical form to that sold on the London Bullion Market. The form of the product is metal in flotation concentrate, which is the final process for which the Company is responsible. The effects of forward sales contracts are reflected in revenue at the date the related precious metals are delivered or the contracts expire.delivered. Third party smelting and refining costs are recorded as a reduction of revenue. At December 31, 2007, the Company had outstanding provisionally priced sales of $61.2 million consisting of 3.3 million ounces of silver and 20,775 ounces of gold, which had a fair value of approximately $63.8 million including the embedded derivative. For each one cent per ounce change in realized silver price, revenue would vary (plus or minus) approximately $33,300 and for each one dollar per ounce change in realized gold price, revenue would vary (plus or minus) approximately $20,800. At December 31, 2006, the Company had outstanding provisionally priced sales of $74.5 million consisting of 4.6 million ounces of silver and 29,577 ounces of gold, which had a fair value of approximately $75.6 million including the embedded derivative. For each one cent per ounce change in realized silver price, revenue would vary (plus or minus) approximately $45,700 and for each one dollar per ounce change in realized gold price, revenue would vary (plus or minus) approximately $29,600. At December 31, 2005, the Company had outstanding provisionally priced sales of $47.0 million consisting of 3.5 million ounces of silver and 40,000 ounces of gold. For each one cent per ounce change in realized silver price, revenue would vary (plus or minus) approximately $35,400 and for each one dollar per ounce change in realized gold price, revenue would vary (plus or minus) approximately $40,000.Ore Reserve Estimates.The preparation of this Annual Report on Form 10-K requires us to make estimates and assumptions that affect the reported amount of assets and liabilities, disclosure of contingent assets and liabilities at the date of our financial statements, and the reported amounts of revenue and expenses during the reporting period. There can be no assurance that actual results will not differ from those estimates. The most critical accounting principles upon which the Company’s financial status depends are those requiring estimates of recoverable ounces from proven and probable ore reserves and/or assumptions of future commodity prices. There are a number of uncertainties inherent in estimating quantities of ore reserves, including many factors beyond our control. Ore reserve estimates are based upon geologic and engineering evaluations of samplings of drill holes and other openings. These estimates involve assumptions regarding future silver and gold prices, the geology of our mines, the mining methods we use and the related costs we incur to develop and mine our reserves. Changes in these assumptions could result in material adjustments to our reserve estimates. We use ore reserve estimates in determining the units-of-production depreciation and amortization expense, as well as in evaluating possible mine asset impairments.55
50
We review and evaluate our long-lived assets for impairment when events or changes in circumstances indicate that the related carrying amounts may not be recoverable. We utilize the methodology set forth in Statement of Financial Accounting Standard (SFAS) No. 144, “Accounting for the Impairment or Disposal of Long-Lived Asset,Assets,” to evaluate the recoverability of capitalized mineral property costs. An impairment is considered to exist if total estimated future cash flows or probability-weighted cash flows on an undiscounted basis is less than the carrying amount of the assets, including property, plant and equipment, mineral property, development property, and any deferred costs such as deferred stripping. The accounting estimates related to impairment are critical accounting estimates because the future cash flows used to determine whether an impairment exists is dependent on reserve estimates and other assumptions, including silver and gold prices, production levels, and capital and reclamation costs, all of which are based on detailed engineering life-of-mine plans. An impairment loss exists when estimated undiscounted cash flows expected to result from the use of the asset and its eventual disposition are less than its carrying amount. Any impairment loss recognized represents the excess of the asset’s carrying value as compared toover its estimated fair value. The Company reviews the carrying value of its assets whenever events or changes in circumstances indicate that the carrying amount of its assets may not be fully recoverable. The Company did not record any impairments during the years ended December 31, 2007, 2006 2005 and 2004.2005.
We depreciate our property, plant and equipment, mining properties and mine development costs using the units-of-production method over the estimated life of the ore body based on our proven and probable recoverable reserves or on a straight-line basis over the useful life, whichever is shorter. The accounting estimates related to depreciation and amortization are critical accounting estimates because the 1) determination of reserves involves uncertainties with respect to the ultimate geology of our reserves and the assumptions used in determining the economic feasibility of mining those reservesreserves; and 2) changes in estimated proven and probable reserves and useful asset lives can have a material impact on net income.Ore on leach pad.The Rochester Mine utilizes the heap leach process to extract silver and gold from ore. The heap leach process is a process of extracting silver and gold by placing ore on an impermeable pad and applying a diluted cyanide solution that dissolves a portion of the contained silver and gold, which are then recovered in metallurgical processes. The key stages in the conversion of ore into silver and gold are (i) the blasting process in which the ore is broken into large pieces; (ii) the processing of the ore through a crushing facility that breaks it into smaller pieces; (iii) the transportation of the crushed ore to the leach pad where the leaching solution is applied; (iv) the collection of the leach solution; (v) subjecting the leach solution to the precipitation process, in which gold and silver is converted back to a fine solid; (vi) the conversion of the precipitate into dorè; and (vii) the conversion by a third party refinery of the dorè into refined silver and gold bullion. We use several integrated steps to scientifically measure the metal content of ore placed on the leach pads during the key stages. As the ore body is drilled in preparation for the blasting process, samples of the drill residue are assayed to determine estimated quantities of contained metal. We estimate the quantity of ore by utilizing global positioning satellite survey techniques. We then process the ore through a crushing facility where the output is again weighed and sampled for assaying. A metallurgical reconciliation with the data collected from the mining operation is completed with appropriate adjustments made to previous estimates. We then transport the crushed ore to the leach pad for application of the leaching solution. As the leach solution is collected from the leach pads, we continuously sample for assaying. We measure the quantity of leach solution by flow meters throughout the leaching and precipitation process. After precipitation, the product is converted to dorè, which is the final product produced by the mine. We again sample and assay the dorè. Finally, a third party smelter converts the dorè into refined silver and gold bullion. At this point we are able to determine final ounces of silver and gold available for sale. We then review this end result and reconcile it to the estimates we had used and developed throughout the production process. Based on this review, we adjust our estimation procedures when appropriate.56
51
Our reported inventories include metals estimated to be contained in the ore on the leach pads of $66.7$50.9 million as of December 31, 2006.2007. Of this amount, $31.3$25.9 million is reported as a current asset and $35.4$25.0 million is reported as a noncurrent asset. The distinction between current and noncurrent is based upon the expected length of time necessary for the leaching process to remove the metals from the broken ore. The historical cost of the metal that is expected to be extracted within twelve months is classified as current and the historical cost of metals contained within the broken ore that will be extracted beyond twelve months is classified as noncurrent. The ore on leach pad inventory is stated at actual production costs incurred to produce and place ore on the leach pad during the current period, adjusted for the effects on monthly production costs of abnormal production levels. The estimate of both the ultimate recovery expected over time, and the quantity of metal that may be extracted relative to such twelve month period, requires the use of estimates which are inherently inaccurate since they rely upon laboratory testwork. Testwork consists of 60 day leach columns from which we project metal recoveries into the future. The quantities of metal contained in the ore are based upon actual weights and assay analysis. The rate at which the leach process extracts gold and silver from the crushed ore is based upon laboratory column tests and actual experience occurring over approximately nineteen years of leach pad operation at the Rochester Mine. The assumptions we use to measure metal content during each stage of the inventory conversion process includes estimated recovery rates based on laboratory testing and assaying. We periodically review our estimates compared to actual experience and revise our estimates when appropriate. The length of time necessary to achieve our currently estimated ultimate recoveries of 61.5% for silver and 93% for gold is estimated to be between 5 and 10 years. However,In August 2007, the ultimate recovery will not be known until leachingCompany terminated mining and crushing operations cease, which is currently estimated foras ore reserves were fully mined. Residual heap leach activities are expected to continue through 2011. The Company has announced that it may consider the sale of the property during 2008.
When we began operations at the Rochester mine in 1986, based solely on laboratory testing, we estimated the ultimate recovery of silver and gold at 50% and 80%, respectively. Since 1986, we have adjusted the expected ultimate recovery 3three times (once in each of 1989, 1997 and 2003) based upon actual experience gained from leach operations. In 1989, we increased our estimated recoveries for silver and gold to 55% and 85%, respectively. The change was accounted for prospectively as a change in estimate, which had the effect of increasing the estimated recoverable ounces of silver and gold contained in the heap by 1.6 million ounces and 10,000 ounces, respectively. In 1997, we revised our estimated recoveries for silver and gold to 59% and 89%, respectively, which increased the estimated recoverable ounces of silver and gold contained in the heap by 4.7 million ounces and 39,000 ounces, respectively. Finally, in 2003, we revised our estimated recoveries for silver to between 59% and 61.5% depending on the area being leached, and 93% for gold, which increased the estimated recoverable ounces of silver and gold contained in the heap by 1.8 million ounces and 41,000 ounces, respectively. The leach cycle at the Rochester Mine requires leaching to approximately the year 2011 for all recoverable metal to be recovered.57
52
If our estimate of ultimate recovery requires adjustment, the impact upon our inventory valuation and upon our income statement would be as follows:Positive/Negative
Change in Silver Recovery
Positive/Negative
Change in Gold Recovery
1%
2%
3%
1%
2%
3%
Quantity of recoverable ounces 1.7 million 3.4 million 5.1 million 12,900 25,800 38,700
Positive impact on future cost of production per silver equivalent ounce for increases in recovery rates $1.06 $1.83 $2.43 $0.42 $0.79 $1.13
Negative impact on future cost of production per silver equivalent ounce for decreases in recovery rates $1.51 $3.87 $8.03 $0.48 $1.03 $1.66
Positive/Negative Positive/Negative Change in Silver Recovery Change in Gold Recovery 1% 2% 3% 1% 2% 3% Quantity of recoverable ounces 1.7 million 3.5 million 5.2 million 13,240 26,480 39,720 Positive impact on future cost of production per silver equivalent ounce for increases in recovery rates $ 1.68 $ 2.78 $ 3.55 $ 0.82 $ 1.49 $ 2.04 Negative impact on future cost of production per silver equivalent ounce for decreases in recovery rates $ (2.93 ) $ (9.30 ) $ (33.77 ) $ (1.04 ) $ (2.38 ) $ (4.21 )
Inventories of ore on leach pads are valued based upon actual production costs incurred to produce and place such ore on the leach pad, adjusted for the effects on monthly production of costs of abnormal production levels, less costs allocated to minerals recovered through the leach process. The costs consist of those production activities occurring at the mine site and include the costs, including depreciation, associated with mining, crushing and precipitation circuits. In addition, refining is provided by a third party refiner to place the metal extracted from the leach pad in a saleable form. These additional costs are considered in the valuation of inventory.Reclamation and remediation costs.Reclamation and remediation costs are based principally on legal and regulatory requirements. Management estimates costs associated with reclamation of mining properties as well as remediation cost for inactive properties. The Company follows SFAS No. 143, “Accounting for Asset Retirement Obligations”, which addresses financial accounting and reporting for obligations associated with the retirement of tangible long-lived assets and the associated asset retirement costs. The standard applies to legal obligations associated with the retirement of long-lived assets that result from the acquisition, construction, development and normal use of the asset. SFAS No. 143 requires that the fair value of a liability for an asset retirement obligation be recognized in the period in which it is incurred if a reasonable estimate of fair value can be made. The fair value of the liability is added to the carrying amount of the associated asset and this additional carrying amount is depreciated over the life of the asset. An accretion cost, representing the increase over time in the present value of the liability, is recorded each period in depreciation, depletion and amortization expense. As reclamation work is performed or liabilities are otherwise settled, the recorded amount of the liability is reduced. Future remediation costs for inactive mines are accrued based on management’s best estimate at the end of each period of the undiscounted costs expected to be incurred at the site. Such cost estimates include, where applicable, ongoing care and maintenance and monitoring costs. Changes in estimates are reflected in earnings in the period an estimate is revised.Operating Statistics and Ore Reserve Estimates The Company’s total production from continuing operations in 20062007 was 11.5 million ounces of silver and 92,014 ounces of gold, compared to 12.8 million ounces of silver and 116,254 ounces of gold compared to 11.7 million ounces of silver and 133,945 ounces of gold in 2005.2006. Total estimated proven and probable reserves at December 31, 20062007 were approximately 216.5216.0 million ounces of silver and 1.5 million ounces of gold, compared to silver and gold ore reserves at December 31, 20052006 of approximately 221.4216.5 million ounces and 1.31.5 million ounces, respectively.58
53
The following table shows the estimated amounts of proven and probable ore reserves and mineralized material at the Company’s following Company locations at year-end 2006:Proven and Probable(1)
Mineralized Material
Tons (000’s)
Grade
Ag oz/t
Grade
Au oz/t
Ounces AG
(000’s)
Ounces AU
(000’s)
Tons (000’s)
Grade
Ag oz/t
Grade
Au oz/t
Rochester 3,720 0.66 0.007 2,436 26 15,235 0.94 0.007 Cerro Bayo 634 9.69 0.19 6,144 122 2,509 8.23 0.15 Mina Martha 99 61.33 0.09 6,084 9 112 42.91 0.05 San Bartolome 46,176 3.29 -- 151,882 -- 1,166 3.44 -- Kensington 4,419 -- 0.31 -- 1,352 4,320 -- 0.20 Endeavor(2) 21,385 1.50 -- 31,983 -- 9,370 3.00 -- Broken Hill(2) 12,908 1.40 -- 18,015 -- 10,872 3.82 --
Total tons 89,341 216,544 1,509 Summary by metal: Total tons
(000’s)
Ag oz/t
(Wt. Avg.)
Au oz/t
(Wt. Avg.)
Total tons
(000’s)
Ag oz/t
(Wt. Avg.)
Au oz/t
(Wt. Avg.)
Silver 84,922 2.55 -- 39,264 2.89 -- Gold 8,872 -- 0.17 22,176 -- 0.06
2007: Proven and Probable Ore Reserves(1) Mineralized Material Grade Grade Ounces Ag Ounces Au Grade Grade Tons (000’s) Ag oz/t Au oz/t (000’s) (000’s) Tons (000’s) Ag oz/t Au oz/t Rochester — — — — — 32,664 0.85 0.01 Cerro Bayo 782 9.26 0.14 7,234 112 2,865 9.28 0.14 Mina Martha 154 53.97 0.07 8,293 11 165 32.75 0.04 Endeavor(2) 19,731 1.52 — 29,926 — 12,291 2.44 — Broken Hill(2) 12,394 1.45 — 17,931 — 9,844 3.82 — San Bartolomé 42,043 3.64 — 153,003 — 15,816 2.21 — Kensington 4,419 — 0.31 — 1,352 4,320 — 0.20 Palmarejo — — — — — 33,852 4.44 0.05 Total tons 79,523 216,387 1,475
Ag oz/t Au oz/t Ag oz/t Au oz/t Summary by metal: Total tons (000’s) (Wt. Avg.) (Wt. Avg.) Total tons (000’s) (Wt. Avg.) (Wt. Avg.) Silver 75,104 2.88 — 107,495 2.91 — Gold 5,354 — 0.28 73,865 — 0.04
(1) Reserves usingUsing silver price of $8.00$11.00 and gold price of $475,$600, except for Endeavor which uses a $10.00$15.00 silver price, and Broken Hill which uses a $10.12 silver price, San Bartolome which uses a $6.00$13.50 silver price and Kensington which uses a gold price of $550.
(2) ReservesOre reserves are provided by the operator as of June 30, 2006,2007, the end of the operator’s most recent fiscal year. These totals do not include additions or depletions through December 31, 2006.2007.
The ore reserves at December 31, 20062007 may change with fluctuations in the price of gold and silver. The following table shows the estimated changes to ore reserves at mines operated by the Company at different pricing ranges.Proven and Probable Ore Reserve Sensitivity to Prices Per ounce Per ounce (000’s) (000’s) Silver Price Gold Price Tons (000’s) Ounces Ag Ounces Au Cerro Bayo $ 10 $ 550 625 6,235 97 $ 11 $ 600 782 7,234 112 $ 12 $ 650 839 7,739 117 $ 13 $ 600 895 8,126 120 Mina Martha $ 10 $ 550 148 8,200 10 $ 11 $ 600 154 8,293 11 $ 12 $ 650 160 8,377 11 $ 13 $ 700 164 8,434 11 San Bartolomé $ 10 36,967 142,060 — $ 11 42,043 153,003 — $ 12 48,331 165,413 — $ 13 52,783 173,135 — Kensington $ 510 4,102 — 1,294 $ 550 4,419 — 1,352 $ 600 4,594 — 1,380
59
Per ounce
Silver Price
Per ounce
Gold Price
Tons (000’s)
(000’s)
Ounces AG
(000’s)
Ounces AU
Rochester $8.00 $475 3,720 2,436 26 $9.50 $510 4,229 2,972 30 $11.25 $550 4,368 2,986 29 $12.00 $600 4,533 3,077 30 Cerro Bayo $8.00 $475 634 122 6 $9.50 $510 643 124 6 $11.25 $550 646 124 6 $12.00 $600 668 128 6 Mina Martha $8.00 $475 99 9 6 $9.50 $510 102 9 6 $11.25 $550 102 9 6 $12.00 $600 102 9 6 Kensington $475 3,710 1,220 $510 4,102 1,294 $550 4,419 1,352 $600 4,594 1,380
54
The following table presents production information by mine and consolidated sales information for the years ended December 31: 2007 2006 2005 Rochester Tons processed 5,060,678 10,399,416 9,327,180 Ore grade/Ag oz 0.65 0.74 0.91 Ore grade/Au oz 0.01 0.01 0.01 Recovery/Ag oz(A) 141.4% 65.9% 67.5% Recovery/Au oz(A) 167.6% 68.9% 76.2% Silver production ounces 4,614,780 5,113,504 5,720,489 Gold production ounces 50,408 71,891 70,298 Cash cost/oz $ 1.52 $ 2.80 $ 4.82 Total cost/oz $ 3.82 $ 5.84 $ 6.66 Cerro Bayo Tons milled 387,378 428,346 403,695 Ore grade/Ag oz 4.68 5.76 7.52 Ore grade/Au oz 0.11 0.10 0.16 Recovery/Ag oz 94.4% 94.5% 94.7% Recovery/Au oz 92.2% 93.0% 92.8% Silver production ounces 1,709,830 2,331,060 2,875,047 Gold production ounces 37,479 40,923 61,058 Cash cost/oz $ 8.22 $ 3.04 $ 0.54 Total cost/oz $ 11.82 $ 5.46 $ 2.30 Martha Mine Tons milled 37,047 35,843 35,293 Ore grade/Ag oz 78.10 79.93 62.53 Ore grade/Au oz 0.12 0.10 0.08 Recovery/Ag oz 95.0% 94.7% 94.9% Recovery/Au oz 92.7% 92.5% 92.9% Silver production ounces 2,748,705 2,712,846 2,093,464 Gold production ounces 4,127 3,440 2,589 Cash cost/oz $ 6.27 $ 4.88 $ 4.60 Total cost/oz $ 6.78 $ 5.36 $ 5.01 Endeavor(B) Tons milled 1,146,857 750,115 463,129 Ore grade/Ag oz 1.40 1.01 1.52 Recovery/Ag oz 48.0% 63.5% 45.0% Silver production ounces 772,609 481,991 316,169 Cash cost/oz $ 2.67 $ 2.85 $ 2.05 Total cost/oz $ 3.65 $ 3.87 $ 3.35 Broken Hill(B) Tons milled 1,646,203 2,288,355 667,140 Ore grade/Ag oz 1.19 1.28 1.31 Recovery/Ag oz 83.6% 74.2% 75.4% Silver production ounces 1,642,205 2,174,585 657,093 Cash cost/oz $ 3.18 $ 3.09 $ 2.72 Total cost/oz $ 5.04 $ 5.44 $ 5.47 CONSOLIDATED PRODUCTION TOTALS Silver ounces 11,488,129 12,813,986 11,662,262 Gold ounces 92,014 116,254 133,945 Cash cost per oz/silver $ 3.97 $ 3.33 $ 3.53 Total cost/oz $ 5.88 $ 5.53 $ 5.13 CONSOLIDATED SALES TOTALS(C) Silver ounces sold 11,506,560 12,841,634 12,579,634 Gold ounces sold 94,284 116,400 146,749 Realized price per silver ounce $ 13.59 $ 12.03 $ 7.47 Realized price per gold ounce $ 700 $ 623 $ 452
60
2006
2005
2004
Rochester Tons processed 10,399,416 9,327,180 12,435,346 Ore grade/Ag oz 0.74 0.91 0.74 Ore grade/Au oz 0.01 0.01 0.01 Recovery/Ag oz(A) 65.9 % 67.5 % 61.5 % Recovery/Au oz(A) 68.9 % 76.2 % 64.2 % Silver production ounces 5,113,504 5,720,489 5,669,074 Gold production ounces 71,891 70,298 69,456 Cash cost/oz $2.80 $4.82 $3.93 Total cost/oz $5.84 $6.66 $5.66 Cerro Bayo Tons milled 428,346 403,695 456,941 Ore grade/Ag oz 5.76 7.52 7.51 Ore grade/Au oz 0.10 0.16 0.14 Recovery/Ag oz 94.5 % 94.7 % 94.2 % Recovery/Au oz 93.0 % 92.8 % 91.8 % Silver production ounces 2,331,060 2,875,047 3,235,192 Gold production ounces 40,923 61,058 57,558 Cash cost/oz $3.04 $0.54 $1.01 Total cost/oz $5.46 $2.30 $2.43 Martha Mine Tons milled 35,843 35,293 30,276 Ore grade/Ag oz 79.93 62.53 59.94 Ore grade/Au oz 0.10 0.08 0.08 Recovery/Ag oz 94.7 % 94.9 % 94.2 % Recovery/Au oz 92.5 % 92.9 % 91.6 % Silver production ounces 2,712,846 2,093,464 1,709,069 Gold production ounces 3,440 2,589 2,318 Cash cost/oz $4.88 $4.60 $4.08 Total cost/oz $5.36 $5.01 $5.05 Endeavor(B) Tons milled 750,115 463,129 -- Ore grade/Ag oz 1.01 1.52 -- Recovery/Ag oz 63.5 % 45.0 % -- Silver production ounces 481,991 316,169 -- Cash cost/oz $2.85 $2.05 -- Total cost/oz $3.87 $3.35 -- Broken Hill(B) Tons milled 2,288,355 667,140 -- Ore grade/Ag oz 1.28 1.31 -- Recovery/Ag oz 74.2 % 75.4 % -- Silver production ounces 2,174,585 657,093 -- Cash cost/oz $3.09 $2.72 -- Total cost/oz $5.44 $5.47 -- CONSOLIDATED PRODUCTION TOTALS Silver ounces 12,813,986 11,662,262 10,613,335 Gold ounces 116,254 133,945 129,332 Cash cost per oz/silver $3.33 $3.53 $3.06 Total cost/oz $5.53 $5.13 $4.58 CONSOLIDATED SALES TOTALS(C) Silver ounces sold 12,841,634 12,579,634 9,669,283 Gold ounces sold 116,400 146,749 117,257 Realized price per silver ounce $12.03 $7.47 $6.72 Realized price per gold ounce $623 $452 $409
(A) The leach cycle at Rochester requires 5 to 10 years to recover gold and silver contained in the ore. The Company estimates the ultimate recovery to be approximately 61.5% for silver and 93% for gold. However, ultimate recoveries will not be known until leaching operations cease which is currently estimated forexpected to continue through 2011. Current recovery may vary significantly from ultimate recovery. See Critical Accounting Policies and Estimates –— Ore on Leach Pad. In August 2007, mining and crushing activities were terminated as ore reserves were fully mined.
55
(B) The Company acquired its interests in the Endeavor and Broken Hill mines in May 2005 and September 2005, respectively.
(C) Units sold at realized metal prices will not match reported metal sales due primarily to the effects on revenues of mark-to-market adjustments on embedded derivatives in the Company’s provisionally priced sales contracts.
“Cash Costs per Ounce” are calculated by dividing the cash costs computed for each of the Company’s mining properties for a specified period by the amount of gold ounces or silver ounces produced by that property during that same period. Management uses cash costs per ounce as a key indicator of the profitability of each of its mining properties. Gold and silver are sold and priced in the world financial markets on a USU.S. dollar per ounce basis.“Cash Costs” are costs directly related to the physical activities of producing silver and gold, and include mining, processing and other plant costs, third-party refining and smelting costs, marketing expense, on-site general and administrative costs, royalties, in-mine drilling expenditures that are related to production and other direct costs. Sales of by-product metals are deducted from the above in computing cash costs. Cash costs exclude depreciation, depletion and amortization, accretion, corporate general and administrative expense, exploration, interest, and pre-feasibility costs. Cash costs are calculated and presented using the “Gold Institute Production Cost Standard” applied consistently for all periods presented.Total cash costs per ounce is a non-GAAP measure and investors are cautioned not to place undue reliance on it and are urged to read all GAAP accounting disclosures presented in the consolidated financial statements and accompanying footnotes. In addition, see the reconciliation of “cash costs” to production costs under “Reconciliation of Non-GAAP Cash Costs to GAAP Production Costs” set forth below.Operating Statistics From Discontinued Operation The following table presents information for Coeur Silver Valley which was sold on June 1, 2006:Year Ended December 31, 2006
2005
2004
Silver Valley/Galena Tons milled 52,876 128,502 169,413 Ore grade/Silver oz 15.15 16.53 21.43 Recovery/Silver oz 96.0 % 97.0 % 97.0 % Silver production ounces 768,674 2,060,338 3,521,813 Cash cost/oz $9.75 $8.37 $5.46 Total cost/oz $10.64 $9.34 $6.02 Gold production 180 282 354
Year Ended December 31, 2006 2005 Silver Valley/Galena Tons milled 52,876 128,502 Ore grade/Silver oz 15.15 16.53 Recovery/Silver oz 96.0 % 97.0 % Silver production ounces 768,674 2,060,338 Cash cost/oz $ 9.75 $ 8.37 Total cost/oz $ 10.64 $ 9.34 Gold production 180 282
The production figures at the Galena mine reflect the five-month period ending May 31, 2006 and therefore are not comparable to the year ended December 31, 2005. Silver production during the period of Coeur’s ownership of the Galena mine in 2006 amounted to 768,674 ounces. Silver production for the year ended December 31, 2005 was 2,060,338 ounces. Total cash costs per ounce were $9.75 during the five-month period ending May 31, 2006. Total cash costs per ounce were $8.37 for the year ended December 31, 2005, respectively.2005. The lower production and higher costs per ounce for the periods presented are due to lower than expected production grades as mine operations adjusted to changing geologic ground conditions and ultimately the sale of Coeur Silver Valley on June 1, 2006.Reconciliation of Non-GAAP Cash Costs to GAAP Production Costs The tables below present reconciliations between non-GAAP cash costs per ounce to production costs applicable to sales including depreciation, depletion and amortization (GAAP).61
Total cash costs include all direct and indirect operating cash costs related directly to the physical activities of producing metals, including mining, processing and other plant costs, third-party refining and marketing expense, on-site general and administrative costs, royalties and mining production taxes, net of by-product revenues earned from all metals other than the primary metal produced at each unit. Total cash costs are a performance measure and provide management and investors with an indication of net cash flow, after consideration of the realized price received for production sold. Management also uses this measurement for the comparative monitoring of performance of our mining operations period-to-period from a cash flow perspective. “Total cash costs per ounce” is a measure developed by precious metals companies in an effort to provide a comparable standard, however, there can be no assurance that our reporting of this non-GAAP measure is similar to that reported by other mining companies.56
Production costs applicable to sales including depreciation, depletion and amortization, is the most comparable financial measure calculated in accordance with GAAP to total cash costs. The sum of the production costs applicable to sales and depreciation, depletion and amortization for our mines as set forth in the tables below is included in our Consolidated Statements of Operations and Comprehensive Income (Loss).Income.Year Ended December 31, 2007
(In thousands except ounces and per ounce costs) Rochester Cerro Bayo Martha Endeavor(1) Broken Hill(1) Total Production of silver (ounces) 4,614,780 1,709,830 2,748,705 772,609 1,642,205 11,488,129 Cash costs per ounce $ 1.52 $ 8.22 $ 6.27 $ 2.67 $ 3.18 $ 3.97 Total Cash Costs (Non-GAAP) $ 7,035 $ 14,055 $ 17,245 $ 2,064 $ 5,228 $ 45,627 Add/Subtract: Third party smelting costs — (3,603 ) (2,112 ) (1,347 ) (2,006 ) (9,068 ) By-product credit(2) 34,664 26,199 2,889 — — 63,752 Other adjustment 1,926 — — — — 1,926 Change in inventory 16,738 (1,701 ) (146 ) (172 ) 69 14,788 Depreciation, depletion and amortization 8,697 6,155 1,383 755 3,055 20,045 Production costs applicable to sales, including depreciation, depletion and amortization (GAAP) $ 69,060 $ 41,105 $ 19,259 $ 1,300 $ 6,346 $ 137,070
Year Ended December 31, 2006
(In thousands except ounces and per ounce costs) Rochester Cerro Bayo Martha Endeavor(1) Broken Hill(1) Total Production of silver (ounces) 5,113,504 2,331,060 2,712,846 481,991 2,174,585 12,813,986 Cash costs per ounce $ 2.80 $ 3.04 $ 4.88 $ 2.85 $ 3.09 $ 3.33 Total Cash Costs (Non-GAAP) $ 14,299 $ 7,089 $ 13,240 $ 1,373 $ 6,712 $ 42,713 Add/Subtract: Third party smelting costs — (3,475 ) (1,853 ) (948 ) (2,620 ) (8,896 ) By-product credit(2) 43,697 24,861 2,079 — — 70,637 Other adjustment 1,803 — — — — 1,803 Change in inventory (12,489 ) (1,105 ) (518 ) (39 ) 272 (13,879 ) Depreciation, depletion and amortization 13,745 5,638 1,297 490 5,120 26,290 Production costs applicable to sales, including depreciation, depletion and amortization (GAAP) $ 61,055 $ 33,008 $ 14,245 $ 876 $ 9,484 $ 118,668
62
YEAR ENDED DECEMBER 31, 2006 (In thousands except ounces and per ounce costs) Rochester
Cerro Bayo
Martha
Endeavor(1)
Broken Hill(1)
Total
Production of silver (ounces) 5,113,504 2,331,060 2,712,846 481,991 2,174,585 12,813,986 Cash costs per ounce $ 2.80 $ 3.04 $ 4.88 $ 2.85 $ 3.09 $ 3.33
Total cash costs (Non-GAAP) $ 14,299 $ 7,089 $ 13,240 $ 1,373 $ 6,712 $ 42,713 Add/Subtract: Third party smelting costs -- (3,475 ) (1,853 ) (948 ) (2,620 ) (8,896 ) By-product credit (2) 43,697 24,861 2,079 -- -- 70,637 Other adjustment 1,803 -- -- -- -- 1,803 Change in inventory (12,489 ) (1,105 ) (518 ) (39 ) 272 (13,879 ) Depreciation, depletion and amortization 15,548 5,638 1,297 490 5,120 28,093
Production costs applicable to sales, including depreciation, depletion and amortization (GAAP) $ 62,858 $ 33,008 $ 14,245 $ 876 $ 9,484 $ 120,471
Year Ended December 31, 2005
YEAR ENDED DECEMBER 31, 2005 (In thousands except ounces and per ounce costs) Rochester
Cerro Bayo
Martha
Endeavor(1)
Broken Hill(1)
Total
Production of silver (ounces) 5,720,489 2,875,047 2,093,464 316,169 657,093 11,662,262 Cash costs per ounce $ 4.82 $ 0.54 $ 4.60 $ 2.05 $ 2.72 $ 3.53
Total cash costs (Non-GAAP) $ 27,575 $ 1,542 $ 9,637 $ 648 $ 1,790 $ 41,192 Add/Subtract: Third party smelting costs -- (2,783 ) (1,165 ) (370 ) (570 ) (4,888 ) By-product credit (2) 31,601 27,114 1,152 -- -- 59,867 Other adjustment 140 -- -- -- -- 140 Change in inventory (14,769 ) 7,421 (328 ) -- (403 ) (8,079 ) Depreciation, depletion and amortization 10,542 5,064 843 411 1,807 18,667
Production costs applicable to sales, including depreciation, depletion and amortization (GAAP) $ 55,089 $ 38,358 $ 10,139 $ 689 $ 2,624 $ 106,899
57
YEAR ENDED DECEMBER 31, 2004 (In thousands except ounces and per ounce costs) Rochester
Cerro Bayo
Martha
Endeavor(1)
Broken Hill(1)
Total
Production of silver (ounces) 5,669,074 3,235,192 1,709,069 -- -- 10,613,335 Cash costs per ounce $ 3.93 $ 1.01 $ 4.08 -- -- $ 3.06
Total cash costs (Non-GAAP) $ 22,287 $ 3,253 $ 6,975 -- -- $ 32,515 Add/Subtract: Third party smelting costs -- (4,106 ) (887 ) -- -- (4,993 ) By-product credit (2) 28,646 23,845 951 -- -- 53,442 Other adjustment (403 ) 110 -- -- -- (293 ) Change in inventory (13,380 ) (3,212 ) (364 ) -- -- (16,956 ) Depreciation, depletion and amortization 9,827 4,588 1,652 -- -- 16,067
Production costs applicable to sales, including depreciation, depletion and amortization (GAAP) $ 46,977 $ 24,478 $ 8,327 -- -- $ 79,782
(In thousands except ounces and per ounce costs)
Rochester Cerro Bayo Martha Endeavor(1) Broken Hill(1) Total Production of silver (ounces) 5,720,489 2,875,047 2,093,464 316,169 657,093 11,662,262 Cash costs per ounce $ 4.82 $ 0.54 $ 4.60 $ 2.05 $ 2.72 $ 3.53 Total cash costs (Non-GAAP) $ 27,575 $ 1,542 $ 9,637 $ 648 $ 1,790 $ 41,192 Add/Subtract: Third party smelting costs — (2,783 ) (1,165 ) (370 ) (570 ) (4,888 ) By-product credit(2) 31,601 27,114 1,152 — — 59,867 Other adjustment 140 — — — — 140 Change in inventory (14,769 ) 7,421 (328 ) — (403 ) (8,079 ) Depreciation, depletion and amortization 10,402 5,064 843 411 1,807 18,527 Production costs applicable to sales, including depreciation, depletion and amortization (GAAP) $ 54,949 $ 38,358 $ 10,139 $ 689 $ 2,624 $ 106,759
The following tables present a reconciliation between non-GAAP cash costs per ounce to GAAP production costs applicable to sales reported in Discontinued Operations (see Note D):Coeur Silver Valley/Galena 2006(3)
2005
2004
Production of silver (ounces) 768,674 2,060,338 3,521,813 Cash costs per ounce $ 9.75 $ 8.37 $ 5.46
Total cash costs (Non-GAAP) $ 7,498 $ 17,248 $ 19,231 Add/Subtract: Third party smelting costs (1,464 ) (3,091 ) (5,117 ) By-product credit(2) 1,473 2,722 3,766 Change in inventory 726 (181 ) 757 Depreciation, depletion and amortization 681 1,996 1,967
Production costs applicable to sales, including depreciation, depletion and amortization (GAAP) $ 8,914 $ 18,694 $ 20,604
Coeur Silver Valley/Galena 2006(3) 2005 Production of silver (ounces) 768,674 2,060,338 Cash costs per ounce $ 9.75 $ 8.37 Total Cash Costs (Non-GAAP) $ 7,498 $ 17,248 Add/Subtract: Third party smelting costs (1,464 ) (3,091 ) By-product credit(2) 1,473 2,722 Change in inventory 726 (181 ) Depreciation, depletion and amortization 681 1,996 Production costs applicable to sales, including depreciation, depletion and amortization (GAAP) $ 8,914 $ 18,694
(1) The Company’s share of silver production at Endeavor and Broken Hill commenced in May 2005 and September 2005, respectively.
(2) By-product credits are based upon production units and the period’s average metal price for purposes of reporting cash costs per ounce.
(3) Amounts represent five months ended May 31, 2006.
Results of OperationsYear Ended December 31, 2007 Compared to Year Ended December 31, 2006Revenues Sales of metal from continuing operations in the year ended December 31, 2007 decreased by $1.3 million, or 1%, from the year ended December 31, 2006 to $215.3 million. The decrease in sales of metal was primarily due to a decrease in the quantity of silver and gold ounces sold during 2007, partially offset by increased metal prices realized. In 2007, the Company sold 11.6 million ounces of silver and 94,284 ounces of gold, compared to sales of 12.8 million ounces of silver and 116,400 ounces of gold in 2006. In the year ended December 31, 2007, the Company realized average silver and gold prices of $13.59 and $700, respectively, compared with realized average prices of $12.03 and $623, respectively, in the prior year.63
Included in revenues is the by-product revenue associated with by-product metal sales consisting of gold. In 2007, by-product revenues totaled $64.4 million compared to $68.8 million in 2006. The decrease is due to a decrease in the quantity of gold sold in 2007. The Company believes, based on the best estimates, that presentation of these revenue streams as by-products from its current operations will continue to be appropriate in the future. In the year ended December 31, 2007, the Company produced a total of 11.5 million ounces of silver and 92,014 ounces of gold compared to 12.8 million ounces of silver and 116,254 ounces of gold in 2006. The decrease in silver production in 2007, as compared to 2006, was primarily due to decreased production at the Rochester, Cerro Bayo and Broken Hill mines in 2007 as compared to 2006.Costs and Expenses Production costs applicable to sales from continuing operations for the year ended 2007 increased by $24.6 million, or 26.7%, from the same period of 2006 to $117.0 million. The increase in production costs applicable to sales for the year is primarily the result of higher costs per ounce allocated with the drawdown of heap leach inventory associated with historic ore production, which is recognized as expense as ounces are recovered from the leaching process and sold. In addition, the increase in production costs is attributable to higher costs of labor, fuel, power and other consumables at the Company’s other mine operations. In addition, during 2007, the Rochester mine recorded a $1.5 million expense associated with the cessation of mining and crushing activities and a $1.0 million expense associated with early termination of employees employed in mining and crushing activities. Depreciation and amortization decreased in the year ended December 31, 2007 by $5.8 million, or 21.6%, over the prior year, primarily due to decreased depreciation and depletion expense attributable to the Rochester mine due to the cessation of mining and crushing activities in August of 2007. Administrative and general expenses increased $4.5 million in 2007 compared to 2006 due primarily to compensation costs associated with the Company’s annual incentive plan, business development activities related to the Bolnisi and Palmarejo acquisitions and increases in other corporate expenses. Total exploration expenses were $11.9 million in 2007 compared to $9.5 million in 2006. Litigation settlement expenses decreased by $1.9 million in 2007 to $0.5 million. During 2006, the Company commenced payments pursuant to the Federal Natural Resource Settlement Decree dated May 14, 2001. Under the terms of the settlement, the Company was required to pay royalties on all of its domestic and foreign operating properties, up to a cumulative maximum of $3.0 million, amounting to a 2% net smelter royalty on silver production if the price of silver exceeds $6.50 per ounce, and a $5.00 per ounce royalty on gold production if the price of gold exceeds $325 per ounce. The royalty payment obligation commenced on May 14, 2006 and expires after May 14, 2021. The Company made its final payment to the U.S. government called for under the settlement agreement in the first quarter of 2007.Other Income and Expenses Interest and other income in the year ended December 31, 2007 decreased by $0.5 million compared with the year ended December 31, 2006. The increase was primarily due to an increase in gain on sale of assets of $1.9 million offset by a decrease in interest income due to lower levels of cash and short-term investments and lower interest rates earned on the Company’s cash, cash equivalents and short-term investments.64
Income Taxes For the year ended December 31, 2007, the Company recorded an income tax provision of approximately $14.9 million compared to $8.2 million in 2006. The following table summarizes the components of the Company’s income tax provision for the years ended December 31, 2007 and 2006: Year Ended December 31, 2007 2006 Current: United States — Alternative minimum tax $ (381 ) $ (900 ) United States — Foreign withholding (904 ) (713 ) Foreign — Argentina (6,590 ) (4,842 ) Foreign — Australia (4,898 ) (4,673 ) Deferred: Foreign — Argentina 172 65 Foreign — Australia (664 ) (93 ) Foreign — Chile (1,662 ) 2,930 Income tax provision $ (14,927 ) $ (8,226 )
In 2007, due to higher metal prices, the Company recognized a current provision in the U.S. and all foreign operating jurisdictions. Further, the Company accrued foreign withholding taxes of approximately $0.9 million on interest payable on inter-company loans from the U.S. Parent to the Argentina and Australia subsidiaries. Finally, the Company recognized a $2.2 million deferred tax provision in foreign jurisdictions for the recognition of the benefit of tax loss carryforwards in Chile net of the recognition of deferred taxes on taxable temporary differences in Argentina and Australia. During 2007, the Company recorded $1.1 million in income tax provisions resulting from its assessment of prior period tax contingencies across its various tax jurisdictions in connection with the adoption of FIN 48 effective January 1, 2007. In 2006, due to significantly higher metals prices, additional proven and probable reserves, and a full year of operation in Australia, the Company recognized a current provision in the U.S. and all foreign operating jurisdictions. Further, the Company accrued foreign withholding taxes of approximately $0.7 million on interest payable on inter-company loans from the U.S. Parent to the Argentina and Australia subsidiaries. Finally, the Company recognized an additional $2.9 million deferred tax benefit in Chile as anticipated metals prices and projections of future pre-tax income are sufficient to utilize the remaining net operating loss carry-forwards in Chile.Year Ended December 31, 2006 Compared to Year Ended December 31, 2005 Revenues Sales of metal from continuing operations in the year ended December 31, 2006 increased by $60.3 million, or 39%, over the year ended December 31, 2005 to $216.6 million. The increase in sales of metal was primarily attributable to increased metal prices realized, partially offset by a decrease in the quantity of ounces of gold sold during 2006 as compared to 2005. In 2006, the Company sold 12.8 million ounces of silver and 116,400 ounces of gold, compared to sales of 12.6 million ounces of silver and 146,749 ounces of gold in 2005. In the year ended December 31, 2006, the Company realized average silver and gold prices of $12.03 and $623, respectively, compared with realized average prices of $7.47 and $452, respectively, in the prior year.65
58
Included in revenues is the by-product revenue associated with by-product metal sales consisting of gold. In 2006, by-product revenues totaled $68.8 million compared to $64.4 million in 2005. The increase is due to an increase in realized prices for gold. The Company believes, based on the best estimates, that presentation of these revenue streams as by-products from its current operations will continue to be appropriate in the future. In the year ended December 31, 2006, the Company produced a total of 12.8 million ounces of silver and 116,254 ounces of gold compared to 11.7 million ounces of silver and 133,945 ounces of gold in 2005. The increase in silver production in 2006, as compared to 2005, was primarily due to higher silver production from the Martha mine and the silver production from the Endeavor and Broken Hill mines, in which the Company acquired certain silver production and reserves on May 23, 2005 and September 8, 2005, respectively, offset by decreased silver production at the Rochester and Cerro Bayo mines. Costs and Expenses The following table sets forth
Production costs applicable to sales from continuing operations, for the year ended December 31, 2006, versus yearincreased by $4.1 million, or 4.7%, from the same period of 2005 costs and expenses: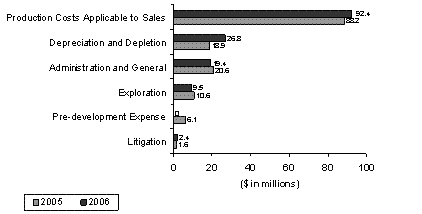
to $92.4 million. The increase in production costs applicable to sales for the year is primarily the result of production costs associated with the Endeavor and Broken Hill mines, in which the Company acquired the silver production and reserves on May 23, 2005 and September 8, 2005, respectively.
Depreciation and amortization increased in the year ended December 31, 2006 by $7.9 million, or 42%, over the prior year, primarily due to the increase in depletion associated with the newly acquired Endeavor and Broken Hill mines, and at the Rochester mine as a result of changes in its ore reserve estimates. Administrative and general expenses decreased $1.3 million in the year ended December 31, 2006 compared to 2005 due primarily to a $1.4 million decrease in general corporate services and outside audit services related to financial reporting compliance activities, partially offset by a $0.1 million increase in holding costs on inactive properties. Total exploration expenses decreased $1.1 million in the year ended December 31, 2006 compared to 2005, primarily as a result of lower exploration activities at the Kensington, Cerro Bayo and Martha mines. Pre-development expense decreased $6.1 million due to the classification of the Kensington project as a development-stage property in third quarter of 2005.59
Litigation settlement expenses increased by $0.8 million in 2006 to $2.4 million. During 2006, the Company commenced payments pursuant to the Federal Natural Resource Settlement Decree dated May 14, 2001. Under the terms of the settlement, the Company is required to pay royalties on all of its domestic and foreign operating properties, up to a cumulative maximum of $3.0 million, amounting to a 2% net smelter royalty on silver production if the price of silver exceeds $6.50 per ounce, and a $5.00 per ounce royalty on gold production if the price of gold exceeds $325 per ounce. The royalty payment obligation commenced on May 14, 2006 and expires after May 14, 2021. As of December 31, 2006, $2.5 million (including discontinued operations) of the $3.0 million has been paid. It is expected that the remaining $0.5 million will be paid in the first half of 2007. During 2005, the Company recorded a litigation settlement of $1.6 million related to the Company’s settlement of the suit by Credit Suisse First Boston. See Note R — Litigation.66
Other Income and Expenses Interest and other income in the year ended December 31, 2006 increased by $11.5 million compared with the year ended December 31, 2005. The increase was primarily due to higher levels of invested cash and short-term investments on hand and higher interest rates earned on the Company’s cash, cash equivalents and short-term investments. Interest expense decreased $1.3 million in the year ended December 31, 2006 compared to 2005, due to increased capitalized interest expense associated with the higher capital expenditures at the Kensington and San BartolomeBartolomé development projects. Capitalized interest was $1.4 million in 2006 compared to $0.2 million in 2005. Income Taxes For the year ended December 31, 2006, the Company recorded an income tax provision of approximately $8.2 million compared to $1.5 million in 2005. The following table summarizes the components regarding the Company’s income tax (provision) benefit for the years ended December 31, 2006 and 2005:Year Ended December 31,
2006
2005
Current: United States - Alternative minimum tax $ (900 ) $ 212 United States - Foreign withholding (713 ) -- Foreign - Argentina (4,842 ) (66 ) Foreign - Australia (4,673 ) -- Deferred: Foreign - Argentina 65 929 Foreign - Australia (93 ) (404 ) Foreign - Chile 2,930 (2,154 )
Income tax benefit (provision) $ (8,226 ) $ (1,483 )
Year Ended December 31, 2006 2005 Current: United States — Alternative minimum tax $ (900 ) $ 212 United States — Foreign withholding (713 ) — Foreign — Argentina (4,842 ) (66 ) Foreign — Australia (4,673 ) — Deferred: Foreign — Argentina 65 929 Foreign — Australia (93 ) (404 ) Foreign — Chile 2,930 (2,154 ) Income tax provision $ (8,226 ) $ (1,483 )
In 2006, due to significantly higher metals prices, additional proven and probable reserves, and a full year of operation in Australia, the Company recognized a current provision in the USU.S. and all foreign operating jurisdictions. Further, the Company accrued foreign withholding taxes of approximately $0.7 million on interest payable on inter-company loans from the USU.S. Parent to the Argentina and Australia subsidiaries. Finally, the Company recognized an additional $2.9 million deferred tax benefit in Chile as anticipated metals prices and projections of future pre-tax income are sufficient to utilize the remaining net operating loss carry-forwards in Chile. In 2005, the Company recognized a $0.2 million current USU.S. benefit from the refund of prior year alternative minimum taxes, an estimated current provision in Argentina, and $0.9 million Argentina deferred tax benefit from the anticipated utilization of other deductible temporary differences. Further, the Company recognized a $0.4 million Australia deferred tax provision on originating temporary differences, and a $2.2 million Chile deferred tax provision related to the utilization of net operating loss carry-forwards for which deferred tax assets were previously recognized.60
Results of Discontinued Operations On June 1, 2006, the Company completed the sale of 100% of the shares of Coeur Silver Valley Inc. to U.S. Silver Corporation for $15 million in cash. Pursuant to FASSFAS 144, Accounting“Accounting for the Impairment or Disposal of Long-Lived Assets,” Coeur Silver Valley has been classified as an asset held for sale and reported in discontinued operations for the years ended December 31, 2006 and 2005. The Company recognized a gain of approximately $11.1 million on the sale in 2006.67
The following is a summary of the Company’s discontinued operations included in the consolidated statements of operations for the years ended December 31, 2006 and 2005 (in thousands):Year Ended December 31,
2006
2005
Sales of metal $ 11,223 $ 16,052 Production costs applicable to sales (8,233 ) (16,698 ) Depreciation and depletion (681 ) (1,996 ) Mining exploration (279 ) (1,361 ) Other (95 ) (192 )
Income (loss) from discontinued operations, net of taxes 1,935 (4,195 ) Gain on sale of net assets of discontinued operations 11,132 --
Net income (loss) for discontinued operations, net of taxes $ 13,067 $ (4,195 )
Year Ended December 31, 2005 Compared to Year Ended December 31, 2004
Year Ended December 31, 2006 2005 Sales of metal $ 11,223 $ 16,052 Production costs applicable to sales (8,233 ) (16,698 ) Depreciation and depletion (681 ) (1,996 ) Mining exploration (279 ) (1,361 ) Other (95 ) (192 ) Income (loss) from discontinued operations, net of taxes 1,935 (4,195 ) Gain on sale of net assets of discontinued operations 11,132 — Net income (loss) for discontinued operations, net of taxes $ 13,067 $ (4,195 )
Revenues Sales of metal in the year ended December 31, 2005 increased by $47.2 million, or 43%, over the year ended December 31, 2004 to $156.3 million. The increase in sales was primarily attributable to an increase in the quantity of silver and gold sold during 2005 and increased metal prices realized in 2005 as compared to 2004. In 2005, the Company sold 12.6 million ounces of silver and 146,749 ounces of gold, compared to sales of 9.7 million ounces of silver and 117,257 ounces of gold in 2004. In the year ended December 31, 2005, the Company realized average silver and gold prices of $7.47 and $452, respectively, compared with realized average prices of $6.72 and $409, respectively, in the prior year.
Included in revenues is the by-product revenue associated with by-product metal sales consisting of gold. In 2005, by-product revenues totaled $64.4 million compared to $45.9 million in 2004. The increase is primarily due to an increase in the quantity of gold sold and higher gold prices realized in 2005 compared to 2004. The Company believes, based on the best estimates, that presentation of these revenue streams as by-products from its current operations will continue to be appropriate in the future.
In the year ended December 31, 2005, the Company produced a total of 11.7 million ounces of silver and 133,945 ounces of gold compared to 10.6 million ounces of silver and 129,332 ounces of gold in 2004. The higher silver production in 2005, as compared to 2004, was primarily due higher silver production from the Rochester and Martha mines. In addition, on May 23, 2005, the Company acquired silver production and reserves contained at the Endeavor mine in Australia, which is owned and operated by Cobar Operations Pty. Limited, a subsidiary of CBH Resources Ltd. Coeur’s share of silver production there amounted to 316,169 ounces. On September 8, 2005, the Company acquired silver production and reserves contained at the Broken Hill mine in Australia, which is owned and operated by Perilya Broken Hill Ltd. Coeur’s share of silver production at that mine from September 8, 2005 to December 31, 2005 amounted to 657,093 ounces.
61
Costs and Expenses
The following table sets forth year 2005 versus year 2004 costs and expenses:
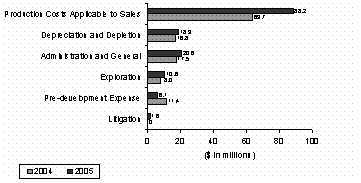
The increase in production costs applicable to sales for the year is primarily the result of higher diesel, utility and operating materials and supply costs at the Company’s mining operations and the Company’s operating costs associated with the Company’s newly acquired interests in the Endeavor and Broken Hill mines.
Depreciation and amortization increased in the year ended December 31, 2005 by $2.1 million, or 12%, over the prior year, primarily due to the increased depletion associated with the Company’s newly acquired interests in the Endeavor and Broken Hill mines.
Administrative and general expenses increased $3.1 million in the year ended December 31, 2005 compared to 2004 due primarily to higher outside audit services of $1.4 million related to financial reporting compliance activities, higher compensation costs of $0.7 million and $1.0 million in increased other general administration expenses.
Exploration expenses increased $2.5 million in the year ended December 31, 2005 compared to 2004, due to increased exploration activities at the Kensington, Cerro Bayo and Martha mines.
Pre-development expense decreased $5.4 million due to the classification of the San Bartolome and Kensington projects as development-stage properties in the fourth quarter of 2004 and the third quarter of 2005, respectively.
During 2005, the Company recorded a litigation settlement of $1.6 million related to the Company’s settlement of the suit by Credit Suisse First Boston. See Note R — Litigation.
Other Income and Expenses
Interest and other income in the year ended December 31, 2005 increased by $5.2 million compared with the year ended December 31, 2004 due to higher interest rates earned on the Company’s cash, cash equivalents and short-term investments. Interest expense decreased $0.3 million in the year ended December 31, 2005 compared to 2004, due to the fact that the Company began capitalizing a portion of its interest expense associated with the capitalization of development expenditures at the Kensington and San Bartolome development projects. Capitalized interest was $0.2 million in 2005 compared to $0.1 million in 2004.
62
Expenses of $15.7 million were incurred in 2004 in connection with the Company’s tender offer for outstanding shares of Wheaton River Minerals Ltd. That offer expired on September 30, 2004, with Coeur not purchasing any Wheaton shares tendered due to unsatisfied conditions of the offer. No such expenses were incurred in 2005.
Income Taxes
For the year ended December 31, 2005, the Company recorded an income tax provision of approximately $1.5 million compared to a tax benefit of approximately $5.8 million in 2004. The following table summarizes the components of the Company’s income tax provision (benefit) for the years 2005 and 2004:
Year Ended December 31,
2005
2004
Current: United States - Alternative minimum tax $ 212 $ 1,382 Foreign - Argentina (66 ) -- Deferred: Foreign - Argentina 929 -- Foreign - Australia (404 ) -- Foreign - Chile (2,154 ) 4,403
Income tax benefit (provision) $ (1,483 ) $ 5,785
In 2005, the Company recognized a $0.2 million current US benefit from the refund of prior year alternative minimum taxes, an estimated current provision in Argentina, and $0.9 million Argentina deferred tax benefit from the anticipated utilization of other deductible temporary differences. Further, the Company recognized a $0.4 million Australia deferred tax provision on originating temporary differences, and a $2.2 million Chile deferred tax provision related to the utilization of net operating loss carry-forwards for which deferred tax assets were previously recognized.
In 2004, the Company recognized a $1.4 million US current benefit associated with the reversal of a prior year tax accrual and a $4.4 million Chile deferred tax benefit associated with the anticipated utilization of net operating loss carry-forwards.
Results of Discontinued Operations
On June 1, 2006, the Company completed the sale of 100% of the shares of Coeur Silver Valley Inc. to U.S. Silver Corporation for $15 million in cash. Pursuant to FAS 144, Accounting for the Impairment or Disposal of Long-Lived Assets, Coeur Silver Valley has been classified as an asset held for sale and reported in discontinued operations for years ended December 31, 2005 and 2004. The Company recognized a gain of approximately $11.1 million on the sale in 2006.
The following is a summary of the Company’s discontinued operations included in the consolidated statements of operations for the years ended December 31, 2005 and 2004 (in thousands):
Year Ended December 31,
2005
2004
Sales of metal $ 16,052 $ 23,759 Production costs applicable to sales (16,698 ) (18,637 ) Depreciation and depletion (1,996 ) (1,967 ) Mining exploration (1,361 ) (1,620 ) Other (192 ) (357 )
Net income (loss) for discontinued operations $ (4,195 ) $ 1,178
63
Liquidity and Capital Resources
Working Capital; Cash and Cash Equivalents The Company’s working capital at December 31, 20062007 was approximately $383.1$152.4 million compared to $282.0$383.1 million at December 31, 2005.2006. The ratio of current assets to current liabilities was 2.4 to 1 at December 31, 2007 compared to 7.5 to 1 at December 31, 2006 compared to 7.1 to 1 at December 31, 2005.2006.
Net cash provided by operating activities in 20062007 was $91.2$40.1 million compared with net cash provided by (used in) operating activities of $91.2 million in 2006 and $6.7 million in 2005 and $(18.6) million in 2004.2005. The changes were primarily a result of the following:Year Ended December 31, 2006
2005
2004
(In thousands)
Cash collected from customers $ 212,102 $ 136,967 $ 109,383 Cash paid to suppliers, employees, etc (139,417 ) (134,321 ) (135,422 ) Interest received 17,674 9,620 4,585 Interest paid (921 ) (2,186 ) (1,507 ) Discontinued operations 1,792 (3,404 ) 4,379
Net cash provided by operating activities $ 91,230 $ 6,676 $ (18,582 )
Years Ended December 31, (In thousands) 2007 2006 2005 Cash collected from customers $ 220,055 $ 212,102 $ 136,967 Cash paid to suppliers, employees, etc. (195,377 ) (139,417 ) (134,321 ) Interest received 15,589 17,674 9,620 Interest paid (210 ) (921 ) (2,186 ) Discontinued operations — 1,792 (3,404 ) Net cash provided by operating activities $ 40,057 $ 91,230 $ 6,676
A total of $20.3$211.5 million was used in investing activities in 20062007 compared to $51.8$20.3 million used in 2005.2006. The decreaseincrease of $31.5$191.9 million used in investing activities is primarily due to an increase in capital expenditures related to the construction activities at the Kensington and San BartolomeBartolomé projects and the acquisition of silver reserves and production from the Endeavor and Broken Hill mines, partially offset by net proceeds from sales of short-term investments.68
Prior to December 31, 2006, the Company concluded that it was appropriate to classify its investments in auction rate securities as short-term investments. Previously such investments had been classified as cash and cash equivalents. Accordingly, we have revised the classification to report these investments as short-term investments on the consolidated balance sheets as of December 31, 2005 and December 31, 2004. The Company also made corresponding adjustments to the consolidated statements of cash flows for the periods ended December 31, 2005 and December 31, 2004 to reflect the gross purchases and sales of these investments as investing activities rather than as a component of cash and cash equivalents. As of December 31, 2005 and December 31, 2004, $159.7 million and $207.9 million respectively, of these investments were reclassified from cash and cash equivalents to short-term investment on the consolidated Balance Sheet. This reclassification had no effect on the total current assets, stockholders’ equity, net income (loss), net income (loss) per share, or on cash provided by (used in) operating activities.
The Company’s financing activities provided $144.9used $0.6 million of cash during 20062007 compared to $34.8net cash provided by financing activities of $144.9 million in 2005.2006. The increasedecrease is primarily due to the sale of 27.6 million shares of common stock during the first quarter of 2006. Cash and cash equivalents decreased by $172.0 million in 2007 compared to an increase of $215.8 million in 2006.
The Company believes its cash, cash equivalents and short-term investments and cash from operations will be adequate to meet its operating obligations during the next twelve months. Nevertheless,However, the Company may invest as much as approximately $398 million in capital activities in 2008 including development of San Bartolomé, Kensington and Palmarejo in addition to sustaining capital. The Company may elect to defer some capital investment activities or to secure additional capital to ensure it maintains sufficient liquidity. In addition, if the Company decides to pursue additional mineral interests or acquisitions, additional equity issuances or financing may be necessary. There can be no assurances that such financing will be available when or if needed. The Company estimates approximately $235$119.7 million will be spent during 20072008 on capital expenditures at its operating mines and development-stage properties.64
Acquisitions of Bolnisi and Palmarejo On December 21, 2007, the Company completed its acquisition of all the shares of Bolnisi Gold NL and Palmarejo Gold and Silver Corporation in exchange for a total of approximately 272 million shares of Coeur common stock, a total cash payment of approximately $1.1 million and the assumption of liabilities of $0.7 billion. Coeur issued 0.682 shares of Coeur common stock (or, at the election of the Bolnisi shareholder, CHESS Depositary Interests representing Coeur shares) and A$0.004 in cash (or approximately US$1.0 million in the aggregate) for each Bolnisi ordinary share, and 2.715 shares of Coeur common stock and C$0.004 in cash (or approximately US$0.1 million in the aggregate) for each Palmarejo common share. The total consideration paid amounted to $1.1 billion and the total liabilities assumed were $0.7 billion. Palmarejo is engaged in the exploration and development of silver and gold properties located in the State of Chihuahua in northern Mexico, and its principal silver and gold properties are collectively referred to as the “Palmarejo project.” The capital cost of the project, from the time the Company acquired it on December 21, 2007 to the commencement of commercial production, is currently estimated to be approximately $225 million. Based upon the original prefeasibility report, it is expected that the project will commence commercial production in the first half of 2009 and is expected to produce approximately 10 million ounces of silver and 110,000 ounces of gold annually at an average cash cost per silver ounce of ($1.40), including gold by-product credits. The Company is currently completing the final updated feasibility study, which is expected to be completed in the second quarter of 2008. No assurances can be made that the project will achieve its schedule and cost estimates discussed above. Capitalized Expenditures During 2006,2007, the Company expended $1.2$1.6 million at the Rochester mine, $10.0$11.3 million for continuing mine development at the Cerro Bayo and Mina Martha properties, $0.6mine, $16.4 million at the GalenaMartha mine, $0.6$2.1 million at the Endeavor mine, $0.2 million at the Broken Hill mine, $1.9 million for corporate and other activities, $14.6$100.2 million for the development of the San BartolomeBartolomé project and $121.5$92.3 million for construction and development activities at the Kensington project. During 2007,2008, the Company plans to expend approximately $0.3$0.7 million for investment activities at the Rochester mine, $11.1$9.5 million at Cerro Bayo, $2.9$2.7 million at Martha, $77.7$24.0 million at the Kensington development property, $119.4$100.7 million at the San BartolomeBartolomé development property, $24.0 million at the Palmarejo development property and $1.0$4.4 million for corporate and other activities. In addition, the Company expects to spendexpend approximately $22.7$26.3 million in 2007,2008 related to the remaining paymentobligation for the purchase of the Endeavor silver reserves.69
Debt and Capital Resources11 A summary of financing transactions for the years 2004 to 2006 is as follows:
/2004 Redemption4% Convertible Senior Notes
On February 11, 2004, the Company announced the redemption of the remaining outstanding $9.6
The $180.0 million principal amount of the Company’s 7 ¼% Convertible Subordinated11/4% Debentures due October 15, 2005. On March 11, 2004, the Company redeemed the remaining2024 outstanding $9.6 million principal amount of the 7 ¼% Debentures.2004 Issuance of 1 ¼% Convertible Senior Notes
On January 13, 2004 the Company completed its offering of $180 million aggregate principal amount of 1¼% Convertible Senior Notes due 2024 (“1¼% Notes”). The 1¼% Notesat December 31, 2007 are convertible into shares of Coeur common stock at a conversion ratethe option of approximately 131.5789 shares of Coeur common stock per $1,000 principal amount of Notes, representingthe holder on January 15, 2011, 2014, and 2019, unless previously redeemed, at a conversion price of $7.60 per share. Interestshare, subject to adjustment in certain events.
The Company is required to make semi-annual interest payments on the debentures. The debentures are redeemable at the option of the Company before January 18, 2011, if the closing price of the Company’s common stock over a specified number of trading days has exceeded 150% of the conversion price, and anytime thereafter. Before January 18, 2011, the redemption price is equal to 100% of the principal amount of the notes plus an amount equal to 8.75% of the principal amount of the notes, less the amount of any interest actually paid on the notes on or prior to the redemption date. The debentures have no other funding requirements until their maturity on January 15, 2024. The fair value of the debentures is determined by market transactions on or near December 31, 2007 and 2006, respectively. The fair value of the debentures, as of December 31, 2007 and 2006, was payable in cash$156.6 million and $163.8 million, respectively.Bridging Debt Facility On October 22, 2007, Bolnisi entered into a $20 million credit facility with Macquarie Bank Limited (“MBL”) to fund further exploration and development of the Palmarejo silver/gold project, surrounding exploration areas and for working capital purposes. The credit facility was extended to June 30, 2008 and bears interest at a variable rate (LIBOR) plus a margin of 2.45%. As of December 31, 2007, the Company has $20 million outstanding under the credit facility bearing an interest rate of 1¼% per annum beginning July 15, 2004.7.35%. Events of default under the credit facility include customary provisions for similar types of facilities.Bank Loan On August 30, 2007 (as amended on October 9, 2007), Palmarejo Gold entered into a temporary credit facility of $2.0 million secured by the Company’s investments in Asset Backed Commercial Paper, to fund working capital requirements. The credit facility has been extended through May 31, 2008. As of December 31, 2007, an amount of $1.7 million has been drawn on the facility, which bears interest at prime less 1.50%. The Company intendsis required to usereduce the proceedsamount of the offering for general corporate purposes, which may includeoutstanding credit facility with any proceeds received from the development of its Kensington gold project and its San Bartolome silver project, or the acquisition of precious metals properties or businesses. Construction commenced at the San Bartolome and Kensington projects on October 1, 2004 and July 1, 2005, respectively. The 1¼% Notes are general unsecured obligations, senior in right of payment to Coeur’s other indebtedness. The offering was made through an underwriting led by Deutsche Bank Securities. Offeringsale of the 1¼% Notes was made only by means of a prospectus under Coeur’s existing shelf registration statement, including the accompanying prospectus supplement relating to the 1¼% Notes.Asset Backed Commercial Paper.
Issuances of Common Stock During 2004, the Company completed a public offering of 26.6 million shares of common stock at a public offering price of $4.50 per share, which included 1.6 million shares purchased by the underwriter at the offering price to cover over allotment. The Company realized total net proceeds for the offering of $113.1 million after payment of the underwriters’ discount. Offering costs incurred were $6.7 million.
During 2005, the Company completed a public offering of 9.9 million shares of common stock at a public offering price of $3.70 per share. The Company realized total net proceeds for the offering of $35.9 million after payment of the underwriters’ discount. Offering costs incurred were $0.6 million.
65
During the first quarter of 2006, the Company completed a public offering of 27.6 million shares of common stock at a public offering price of $5.60 per share. The Company realized net proceeds of $146.2 million after payment of the underwriters’ discount and other offering costs. Offering costs incurred were $8.3 million. During 2005, the Company completed a public offering of 9.9 million shares of common stock at a public offering price of $3.70 per share. The Company realized total net proceeds for the offering of $35.9 million after payment of the underwriters’ discount. Offering costs incurred were $0.6 million.70
Contractual Obligations The following table summarizes our contractual obligations at December 31, 20062007 and the effect such obligations are expected to have on our liquidity and cash flow in future periods.Payments Due by Period
Contractual Obligations
Total
Less Than 1
Year
1-3
Years
3-5
Years
More Than 5
Years
Convertible debt(1) $ 180,000 $ -- $ -- $ -- $ 180,000 Interest on convertible debt 38,250 2,250 4,500 4,500 27,000 Operating lease(2) 380 380 -- -- -- Capital lease(3) 916 916 -- -- -- Kensington Trust(4) 839 345 494 -- -- Hyak Mining Lease 9,699 231 462 3,462 5,544 Phlahipo Lease with Comibol 15,270 2,121 9,825 3,324 -- TDA Grant(5) 546 546 -- -- -- Reclamation and mine closure(6) 51,778 4,962 4,498 6,437 35,881 Severance(7) 5,168 2,170 -- 1,183 1,815
Total $ 302,846 $ 13,921 $ 19,779 $ 18,906 $ 250,240
Payments Due by Period Less Than 3-5 More Than Contractual Obligations Total 1 Year 1- 3 Years Years 5 Years Convertible debt(1) $ 180,000 $ — $ — $ — $ 180,000 Interest on convertible debt 36,000 2,250 4,500 4,500 24,750 Capital lease(2) 39,196 11,554 15,731 11,911 — Kensington Trust(3) 459 385 74 — — Hyak Mining Lease 9,468 231 462 3,462 5,313 Plahipo mining lease with COMIBOL 28,680 4,972 23,708 — — Reclamation and mine closure(4) 57,387 4,183 9,518 11,157 32,529 Severance(5) 4,081 407 90 811 2,773 Macquarie Bank line of credit(6) 20,029 20,029 — — — National Bank of Canada line of credit(6) 1,728 1,728 — — — Endeavor payment 26,301 26,301 — — — Total $ 403,329 $ 72,040 $ 54,083 $ 31,841 $ 245,365
(1) The $180.0 million principal amount of 1 ¼%1/4% Debentures due 2024 outstanding at December 31, 20062007 are convertible into shares of common stock at the option of the holder on January 15, 2011, 2014 and 2019 unless previously redeemed at a conversion rate of approximately 131.5789 shares of Coeur common stock per $1,000 principal amount of Notes, representing a conversion price of $7.60 per share, subject to adjustment in certain events.
The Company is required to make semi-annual interest payments. The Debentures are redeemable at the option of the Company before January 18, 2011, if the closing price of the Company’s common stock over a specified number of trading days has exceeded 150% of the conversion price, and anytime thereafter. The Debentures have no other funding requirements until maturity on January 15, 2024.
(2) The Company has entered into various operating lease agreements which expire over a period of one year.
(3)The Company has entered into various capital lease agreements for commitments principally over the next year.
(4)(3)PurchasePurchased obligation for the Kensington property in Alaska.
(5)(4)The Company obtained a U.S. government grant to promote development in Bolivia. The amount received is expected to be reimbursed in 2007.
(6)Reclamation and mine closure amounts represent the Company’s estimate of the discounted cash flows ofassociated with its legal obligation to reclaim and remediate mining properties. This amount will increase over the passage of time for accretion of the obligation and will decrease as reclamation and remediation work is completed. Amounts shown on table are undiscounted.
(7)(5)Severance amounts represent a termination benefit program at the Rochester mine as the mine approaches the end of mine life and accrued benefits for government mandated severance at the Cerro Bayo Minemine and San BartolomeBartolomé project. (6) In connection with the Bolnisi and Palmarejo acquisition, the Company assumed a credit facility with Macquarie Bank of Australia and a line of credit loan with the National Bank of Canada.
Risk Factors; Forward-Looking Statements For information relating to important risks and uncertainties that could materially adversely affect the Company’s business, securities, financial condition or operating results, reference is made to the disclosure set forth under Item 1A above. In addition, because the preceding discussion includes numerous forward-looking statements relating to the Company, its results of operations and financial condition and business, reference is made to the information set forth above in Item 1 under the caption “Important Factors Relating to Forward-Looking Statements.”71
66
Environmental Compliance Expenditures For the years ended December 31, 2007, 2006, 2005, and 2004,2005, the Company expended $5.2 million, $5.6 million $4.9 million and $4.2$4.9 million, respectively, in connection with routine environmental compliance activities at its operating properties. Such activities include monitoring, earth moving, water treatment and re-vegetation activities. The Company estimates that environmental compliance expenditures during 20072008 will be approximately $4.0$5.0 million to obtain permit modifications and other regulatory authorizations. Future environmental expenditures will be determined by governmental regulations and the overall scope of the Company’s operating and development activities. The Company places a very high priority on its compliance with environmental regulations.Off-Balance Sheet Arrangements The Company has no off-balance sheet arrangements.67
Recent
Accounting Developments Recently Adopted Pronouncements with Delayed Effective Dates Income Taxes In June 2006, the FASB issued Interpretation No. 48, “Accounting for Uncertainty in Income Taxes”, (FIN 48)Taxes, an Interpretation of FASB Statement No. 109, “Accounting for Income Taxes”109” (FIN 48). FIN 48 prescribes a recognition threshold and measurement attribute for the financial statement recognition and measurement of a tax positions taken or expected to be taken in a tax return. FIN 48 requires that the Company recognize in its financial statements the impact of a tax position, if that tax position is more likely than not of being sustained on audit, based on the technical merits of the position. FIN 48 also provides guidance on derecognition, classification of interest and penalties, accounting in interim periods and disclosure. The provisions of FIN 48 arewere effective beginning January 1, 2007, with the cumulative effect of the change in accounting principle recorded as an adjustment to the opening balance of retained earnings. Currently, the2007. The adoption of FIN 48 isdid not expected to have a material effect on the Company’s financial position, results of operations ofor cash flows. The Company and its subsidiaries are subject to U.S. federal income tax as well as income tax of multiple state and foreign jurisdictions. The Company has substantially concluded all U.S. federal income tax matters for years through 1999. Federal income tax returns for 2000 through 2006 are subject to examination. The Company’s continuing practice is to recognize interest and/or penalties related to income tax matters in income tax expense. There were no significant accrued interest or penalties at December 31, 2007. Recently Issued PronouncementsFair Value Option In February 2007, the FASB issued FASB Statement No. 159, “The Fair Value Option for Financial Assets and Financial Liabilities” (“FAS 159”). FAS 159 permits entities to choose to measure many financial instruments and certain other items at fair value, with the objective of improving financial reporting by mitigating volatility in reported earnings caused by measuring related assets and liabilities differently without having to apply complex hedge accounting provisions. The provisions of FAS 159 are effective for the Company’s fiscal year ending December 31, 2008. The Company is currently evaluating the impact that the adoption of this statement will have on the Company’s consolidated financial position, results of operations and disclosures.72
Fair Value Measurements In September 2006, the FASB issued FASB Statement No. 157 “Fair Value Measurements” (FAS 157). FAS 157 defines fair value, establishes a framework for measuring fair value in generally accepted accounting principles, and expands disclosures about fair value measurements. The provisions of FAS 157 are effective for the Company’s fiscal year ending December 31, 2008. The Company is currently evaluating the impact of the adoption of this statement on the Company’s consolidated financial position, results of operations and disclosures.68
Recent DevelopmentsAccounting for Convertible Debt Instruments On September 5, 2007, the FASB published FASB Staff Position (“FSP”) No. APB 14-a, “Accounting for Convertible Debt Instruments That May Be Settled in Cash upon Conversion.” The proposed FSP applies to convertible debt instruments that, by their stated terms, may be settled in cash (or other assets) upon conversion, including partial cash settlement, unless the embedded conversion option is required to be separately accounted for as a derivative under SFAS 133. Convertible debt instruments within the scope of the proposed FSP are not addressed by the existing Accounting Principles Board (“APB”) Opinion No. 14. The proposed FSP would require that the liability and equity components of convertible debt instruments within the scope of the proposed FSP shall be separately accounted for in a manner that reflects the entity’s nonconvertible debt borrowing rate. This will require an allocation of the convertible debt proceeds between the liability component and the embedded conversion option (i.e., the equity component). The difference between the principal amount of the debt and the amount of the proceeds allocated to the liability component would be reported as a debt discount and subsequently amortized to earnings over the instrument’s expected life using the effective interest method. If the proposed FSP were to be adopted, the Company estimates that approximately $129.2 million of debt discount would be recorded and the effective interest rate on its 2024 11/4% notes would increase by approximately 9 percent for the non-cash amortization of the debt discount.Item 7A.Quantitative and Qualitative Disclosures About Market Risk The Company is exposed to various market risks as a part of its operations. In an effort to mitigate losses associated with these risks, the Company may, at times, enter into derivative financial instruments. These may take the form of forward sales contracts, foreign currency exchange contracts and interest rate swaps. The Company does not actively engage in the practice of trading derivative securitiesinstruments for profit. This discussion of the Company’s market risk assessments contains “forward looking statements” that contain risks and uncertainties. Actual results and actions could differ materially from those discussed below. The Company’s operating results are substantially dependent upon the world market prices of silver and gold. The Company has no control over silver and gold prices, which can fluctuate widely and are affected by numerous factors, such as supply and demand and investor sentiment. In order to mitigate some of the risk associated with these fluctuations, the Company will at times enter into forward sale contracts. The Company continually evaluates the potential benefits of engaging in these strategies based on current market conditions. The Company may be exposed to nonperformance by counterparties as a result of its hedging activities. This exposure would be limited to the amount that the spot price of the metal falls short of the contract price. The Company has historically sold silver and gold produced by our mines pursuant to forward contracts and at spot prices prevailing at the time of sale. Since 1999, the Company has not engaged in any silver hedging activities and is currently not engaged in any gold hedging activities. The Company enters into concentrate sales contracts with third-party smelters. The contracts, in general, provide for a provisional payment based upon provisional assays and quoted metal prices. The provisionally priced sales contracts contain an embedded derivative that is required to be separated from the host contract for accounting purposes. The host contract is the receivable from the sale of concentrates at the forward price at the time of sale. The embedded derivative, which is the final settlement price based on a future price, does not qualify for hedge accounting. These embedded derivatives are recorded as derivative assets (in Prepaid expenses and other), or derivative liabilities (in Accrued liabilities and other), on the balance sheet and are adjusted to fair value through earnings each period until the date of final settlement.73
At December 31, 2006,2007, the Company had outstanding receivables for provisionally priced sales of $74.5$61.2 million consisting of 4.63.3 million ounces of silver and 29,57720,775 ounces of gold, which had a fair value of approximately $75.6$63.8 million including the embedded derivative. For each one cent per ounce change in realized silver price, revenue would vary (plus or minus) approximately $45,700$33,300 and for each one dollar per ounce change in realized gold price, revenue would vary (plus or minus) approximately $29,600.$20,800.
The Company operates, or has mining interests, in several foreign countries, specifically Australia, Bolivia, Chile, and Argentina, which exposes it to risks associated with fluctuations in the exchange rates of the currencies involved. As part of its program to manage foreign currency risk, the Company enters into, from time to time, foreign currency forward exchange contracts. These contracts enable the Company to purchase a fixed amount of foreign currencies. Gains and losses on foreign exchange contracts that are related to firm commitments are designated and effective as hedges and are deferred and recognized in the same period as the related transaction. All other contracts that do not qualify as hedges are marked to market and the resulting gains or losses are recorded in income. The Company continually evaluates the potential benefits of entering into these contracts to mitigate foreign currency risk and proceeds when it believes that the exchange rates are most beneficial. During 2007 and 2006, the Company entered into forward foreign currency exchange contracts to reduce the foreign exchange risk associated with forecasted Chilean peso operating costs for 2007 and 2008 at its Cerro Bayo mine. The contracts entered into in 2007 require the Company to exchange U.S. dollars for Chilean pesos at a weighted average exchange rate of 531503 pesos to each U.S. dollar. At December 31, 2007 and 2006, the Company had foreign exchange contracts to exchangeof $9.0 million and $4.8 million in U.S. dollars, for Chilean pesos. Atrespectively. For the years ended December 31, 2007 and 2006, the Company recorded a realized gain (loss) of approximately $0.4 million and $(0.4) million, respectively, in connection with its foreign currency hedging program. As of December 31, 2007, the fair value of the foreign exchange contracts was a liability of $0.1 million.69
All of the Company’s long-term debt at December 31, 2006,2007, is fixed-rate based. The fair value of the Company’s long-term debt at December 31, 20062007 was $163.8$156.6 million. The fair value was estimated based upon bond market closing prices near the balance sheet date.Item 8.Financial Statements and Supplementary Data The financial statements required hereunder and contained herein are listed under Item 15(a)(1) below.Item 9.Changes in and Disagreements with Accountants on Accounting and Financial Disclosure Not applicable.Item 9A.Controls and Procedures(a) Disclosure Controls and Procedures The Company’s disclosure controls and procedures are designed to provide reasonable assurance that information required to be disclosed by it in its periodic reports filed with the Securities and Exchange Commission is recorded, processed, summarized and reported, within the time periods specified in the Commission’s rules and forms. Based on an evaluation of the Company’s disclosure controls and procedures conducted by the Company’s Chief Executive Officer and Chief Financial Officer, such officers concluded that the Company’s disclosure controls and procedures were effective at a reasonable assurance level as of December 31, 2006.2007.74
(b) Management’s Report on Internal Control Over Financial Reporting The management of the Company is responsible for establishing and maintaining adequate internal control over financial reporting. The Securities and Exchange Act of 1934 defines internal control over financial reporting in Rule 13a-15(f) and 15d-15(f) as a process designed by, or under the supervision of, the company’s principal executive and principal financial officers and effected by the company’s board of directors, management and other personnel, to provide reasonable assurance regarding the reliability of financial reporting and the preparation of financial statements for external purposes in accordance with generally accepted accounting principles and includes those policies and procedures that:• Pertain to the maintenance of records that in reasonable detail accurately and fairly reflect the transactions and dispositions of the assets of the company; • Provide reasonable assurance that transactions are recorded as necessary to permit preparation of financial statements in accordance with generally accepted accounting principles, and that receipts and expenditures of the company are being made only in accordance with authorizations of management and directors of the company; and • Provide reasonable assurance regarding prevention or timely detection of unauthorized acquisition, use or disposition of the company’s assets that could have a material effect on the consolidated financial statements.
Provide reasonable assurance that transactions are recorded as necessary to permit preparation of financial statements in accordance with generally accepted accounting principles, and that receipts and expenditures of the company are being made only in accordance with authorizations of management and directors of the company; and
Provide reasonable assurance regarding prevention or timely detection of unauthorized acquisition, use or disposition of the company’s assets that could have a material effect on the consolidated financial statements.
Because of its inherent limitations, internal control over financial reporting may not prevent or detect misstatements. Also, projections of any evaluation of effectiveness to future periods are subject to risk that controls may become inadequate because of changes in conditions, or that the degree of compliance with the policies or procedures may deteriorate.
70
The Company’s management assessed the effectiveness of the Company’s internal control over financial reporting as of December 31, 2006.2007. In making this assessment, the Company’s management used the criteria set forth by the Committee of Sponsoring Organizations of the Treadway Commission (COSO) inInternal Control-Integrated Framework. Based upon its assessment, management concluded that, as of December 31, 2006,2007, the Company’s internal control over financial reporting is effective based upon those criteria. Management’s
In accordance with SEC regulations, management’s above assessment of the effectiveness of internal control over financial reporting excludes Bolnisi Gold NL and Palmarejo Silver and Gold Corporation, which the Company acquired on December 21, 2007. The total assets of Bolnisi and Palmarejo at December 31, 2007, were approximately $1.8 billion of the Company’s total consolidated assets. The acquired businesses will be included in management’s assessment for the year ending December 31, 2008. The Company’s auditors, KPMG LLP (“KPMG”), have audited the Company’s internal control over financial reporting as of December 31, 2007, in accordance with the standards of the Public Company Accounting Oversight Board (United States), based on criteria established inInternal Control — Integrated Framework issued by the Committee of Sponsoring Organizations of the Treadway Commission (COSO). KPMG’s attestation report dated February 29, 2008 expressed an unqualified opinion on the effectiveness of the Company’s internal control over financial reporting as of December 31, 2006 has been audited by KPMG LLP, an independent registered public accounting firm, as stated2007. KPMG’s attestation report on the Company’s internal control over financial reporting is included in their report which appearsthe Company’s consolidated financial statements set forth elsewhere herein.75
(c) Changes in Internal Control Over Financial Reporting There have been no changes in our internal control over financial reporting during the most recently completed fiscal quarter that have materially affected, or are reasonably likely to materially affect, our internal control over financial reporting.Item 9B.Other Information Not applicable.Part IIIItem 10.Directors, Executive Officers and Corporate Governance Pursuant to General Instruction G(3) of Form 10-K, the information called for by this item regarding directors is hereby incorporated by reference from our definitive proxy statement or amendment hereto to be filed pursuant to Regulation 14A not later than 120 days after the end of the fiscal year covered by this report. Information regarding our executive officers is set forth under Item 4A of this Form 10-K.Item 11.Executive Compensation Pursuant to General Instruction G(3) of Form 10-K, the information called for by this item is hereby incorporated by reference from our definitive proxy statement or amendment hereto to be filed pursuant to Regulation 14A not later than 120 days after the end of the fiscal year covered by this report.Item 12.Security Ownership of Certain Beneficial Owners and Management and Related Stockholder Matters Pursuant to General Instruction G(3) of Form 10-K, the information called for by this item is hereby incorporated by reference from our definitive proxy statement or amendment hereto to be filed pursuant to Regulation 14A not later than 120 days after the end of the fiscal year covered by this report.Item 13.Certain Relationships and Related Transactions, and Director Independence Pursuant to General Instruction G(3) of Form 10-K, the information called for by this item is hereby incorporated by reference from our definitive proxy statement or amendment hereto to be filed pursuant to Regulation 14A not later than 120 days after the end of the fiscal year covered by this report.71
Item 14.Principal Accounting Fees and Services Pursuant to General Instruction G(3) of Form 10-K, the information called for by this item is hereby incorporated by reference from our definitive proxy statement or amendment hereto to be filed pursuant to Regulation 14A not later than 120 days after the end of the fiscal year covered by this report.76
Part IVItem 15.Exhibits and Financial Statement Schedules(a) The following financial statements are filed herewith:
(1) The following consolidated financial statements of Coeur d’Alene Mines Corporation and subsidiaries are included in Item 8:
Consolidated Balance Sheets -– December 31, 20062007 and 2005.2006.
Consolidated Statements of Operations and Comprehensive Income (Loss) -– Years Ended December 31, 2007, 2006 2005 and 20042005.
Consolidated Statements of Changes in Shareholders’ Equity for the Years Ended December 31, 2007, 2006 2005 and 2004.2005.
Consolidated Statements of Cash Flows for the Years Ended December 31, 2007, 2006 2005 and 2004.2005.
Notes to Consolidated Financial Statements.
(b) Exhibits: The following listed documents are filed as Exhibits to this report:
3(a)–2 (a) Merger Implementation Agreement dated May 3, 2007 by and among Coeur d’Alene Mines Corporation, Coeur d’Alene Mines Australia Pty Ltd, Coeur Sub Two, Inc. and Bolnisi Gold NL (Incorporated herein by reference to Exhibit 2.2 to the Registrant’s Form 8-K filed May 4, 2007.) 2 (b) Amending Agreement dated June 8, 2007 Relating to Merger Implementation Agreement dated May 3, 2007 by and among Coeur d’Alene Mines Corporation, Coeur d’Alene Mines Australia Pty Ltd, Coeur Sub Two, Inc. and Bolnisi Gold NL (Incorporated herein by reference to Exhibit 2.1 to the Registrant’s Current Report on Form 8-K filed June 8, 2007.) 2 (c) - Second Amending Agreement dated June 22, 2007 Relating to Merger Implementation Agreement dated May 3, 2007 by and among Coeur d’Alene Mines Corporation, Coeur d’Alene Mines Australia Pty Ltd, Coeur Sub Two, Inc. and Bolnisi Gold NL, as amended on June 8, 2007 (Incorporated herein by reference to Exhibit 2.1 to the Registrant’s Current Report on Form 8-K filed June 22, 2007.) 2 (d) - Deed Poll made by the Registrant in favor of Bolnisi shareholders dated May 3, 2007 (Incorporated herein by reference to Exhibit 2.3 to the Registrant’s Current Report on Form 8-K filed May 4, 2007.) 2 (e) - Conditional Extension dated September 24, 2007 to Merger Implementation Agreement dated May 3, 2007 by and among Coeur d’Alene Mines Corporation, Coeur d’Alene Mines Australia Pty Ltd, Coeur Sub Two, Inc. and Bolnisi Gold NL (Incorporated herein by reference to Exhibit 2.1 to the Registrant’s Current Report on Form 8-K filed September 25, 2007.)
77
2 (f) - Third Amending Agreement dated October 23, 2007 to Merger Implementation Agreement dated May 3, 2007 by and among Coeur d’Alene Mines Corporation, Coeur d’Alene Mines Australia Pty Ltd, Coeur Sub Two, Inc. and Bolnisi Gold NL (Incorporated herein by reference to Exhibit 2.1 to the Registrant’s Current Report on Form 8-K filed October 29, 2007.) 2 (g) - Fourth Amending Agreement dated December 5, 2007 to Merger Implementation Agreement dated May 3, 2007 by and among Coeur d’Alene Mines Corporation, Coeur d’Alene Mines Australia Pty Ltd, Coeur Sub Two, Inc. and Bolnisi Gold NL (Incorporated herein by reference to Exhibit 2.1 to the Registrant’s Current Report on Form 8-K filed December 10, 2007.) 2 (h) - Merger Implementation Agreement dated May 3, 2007 by and among Coeur d’Alene Mines Corporation and Palmarejo Silver and Gold Corporation (Incorporated herein by reference to Exhibit 2.1 to the Registrant’s Current Report on Form 8-K filed May 4, 2007.) 2 (i) - Extension dated September 24, 2007 to Merger Implementation Agreement dated May 3, 2007 by and between Coeur d’Alene Mines Corporation and Palmarejo Silver and Gold Corporation. (Incorporated herein by reference to Exhibit 2.2 to the Registrant’s Current Report on Form 8-K filed September 25, 2007.) 2 (j) - Amendment dated October 23, 2007 to Merger Implementation Agreement dated May 3, 2007 by and between Coeur d’Alene Mines Corporation and Palmarejo Silver and Gold Corporation (Incorporated herein by reference to Exhibit 2.2 to the Registrant’s Current Report on Form 8-K filed October 29, 2007.) 2 (k) - Second Amendment dated December 4, 2007 to Merger Implementation Agreement dated May 3, 2007 by and between Coeur d’Alene Mines Corporation and Palmarejo Silver and Gold Corporation (Incorporated herein by reference to Exhibit 2.2 to the Registrant’s Current Report on Form 8-K filed December 10, 2007.) 3 (a) - Articles of Incorporation of the Registrant and amendments thereto. (Incorporated herein by reference to Exhibit 3(a) to the Registrant’s Annual Report on Form 10-K for the year ended December 31, 1988.)
3(b)–3 (b) - Bylaws of the Registrant and amendments thereto. (Incorporated herein by reference to Exhibit 3.1 to the Registrant’s Current Report on Form 8-K dated August 30, 2004.)
3(c)–3 (c) - Certificate of Designations, Powers and Preferences of the Series B Junior Preferred Stock of the Registrant, as filed with Idaho Secretary of State on May 13, 1999. (Incorporated herein by reference to the Registrant’s Annual Report on Form 10-K for the year ended December 31, 2002.)
3(d)–3 (d) - Restated and Amended Articles of Incorporation of the Registrant as filed with the Secretary of State of the State of Idaho effective September 13, 1999. (Incorporated herein by reference to Exhibit 3 to the Registrant’s Quarterly Report on Form 10-Q for the quarter ended September 30, 1999.)
78
3(e)–3 (e) - Amendment to Restated and Amended Articles of Incorporation of the Registrant (Incorporated herein by reference to Exhibit 3.1 to the Registrant’s Quarterly Report on Form 10-Q for the quarter ended September 30, 2002.)
4(a)–3 (f) - Articles of Amendment, dated May 20, 2004, to the Restated and Amended Articles of Incorporation of the Registrant (Incorporated herein by reference to Exhibit 3.5 to the Form S-4 Registration Statement of Coeur d’ Alene Mines Holding Company and Coeur d’ Alene Canadian Acquisition Corporation filed on July 13, 2004 (file No. 333-117325).) 3 (g) - Certificate of Amendment to the Certificate of Designations, Powers and Preferences of the Series B Junior Preferred Stock of the Registrant, dated December 7, 2007. (Filed herewith.) 3 (h) - Amended and Restated Certificate of Designations, Powers and Preferences of the Series B Junior Preferred Stock of the Registrant, dated December 7, 2007. (Filed herewith.) 3 (i) - Articles of Amendment to the Restated and Amended Articles of Incorporation of the Registrant, dated December 7, 2007. (Filed herewith.) 3 (j) - Restated and Amended Articles of Incorporation of the Registrant, dated December 7, 2007. (Filed herewith.) 3 (k) - Bylaws of the Registrant, as amended effective July 16, 2007. (Incorporated herein by reference to Exhibit 3 to the Registrant’s Quarterly Report on Form 10-Q for the quarter ended September 30, 2007.) 4 (a) - Specimen certificate of the Registrant’s stock. (Incorporated herein by reference to Exhibit 4 to the Registrant’s Registration Statement on Form S-2 (File No. 2-84174).)
72
4(b)–4 (b) - Indenture dated as of January 13, 2004, by and between the Registrant and the Bank of New York relating to the Registrant’s 1 ¼%1/4% Convertible Senior Notes due 2024 (Incorporated herein by reference to Exhibit 4.1 to Registrant’s Current Report on Form 8-K dated January 7, 2004).2004.)
10(a)–10 (a) - Agreement, dated January 1, 1994, between Coeur-Rochester, Inc. and Johnson Matthey Inc. (Incorporated herein by reference to Exhibit 10(m) of the Registrant’s Annual Report on Form 10-K for the year ended December 31, 1993.)
10(b)–10 (b) - Master Equipment Lease No. 099-03566-01, dated as of December 28, 1988, between Idaho First National Bank and the Registrant. (Incorporated herein by reference to Exhibit 10(w) of the Registrant’s Annual Report on Form 10-K for the year ended December 31, 1988.)
10(c)–10 (c) - Master Equipment Lease No. 01893, dated as of December 28, 1988, between Cargill Leasing Corporation and the Registrant. (Incorporated herein by reference to Exhibit 10(x) of the Registrant’s Annual Report on Form 10-K for the year ended December 31, 1988.)
* Management contract or compensatory plan.
79
10(d)–10 (d) - Rights Agreement, dated as of May 11, 1999, between the Registrant and ChaseMellon Shareholder Services, L.L.C., as Rights Agent. (Incorporated herein by reference to Exhibit 1 to the Registrant’s Form 8-A relating to the registration of the Rights on the New York and Pacific Stock Exchanges.)
10(e)–10 (e) - Amended and Restated Profit Sharing Retirement Plan of the Registrant. (Incorporated herein by reference to Exhibit 10(ff) to the Registrant’s Annual Report on Form 10-K for the year ended December 31, 1993.) *
10(f)–10 (f) - 1993 Annual Incentive Plan and Long-Term Performance Share Plan of the Registrant. (Incorporated herein by reference to Exhibit 10(jj) to the Registrant’s Annual Report on Form 10-K for the year ended December 31, 1993.)*
10(g)–10 (g) - Lease Agreement, dated January 12, 1994, between First Security Bank of Idaho and Coeur Rochester, Inc. (Incorporated herein by reference to Exhibit 10(mm) to the Registrant’s Annual Report on Form 10-K for the year ended December 31, 1993.)
10(h)–401k10 (h) - 401(k) Plan of the Registrant. (Incorporated by reference to Exhibit 10 (pp) to the Registrants Annual Report on Form 10-K for the year ended December 31, 1994.)*
10(i)–10 (i) - Form of severance/change in control agreements entered into by the Registrant with each of its executive officers (James A. Sabala – January 13, 2003). (Incorporated by reference to Exhibit 10(hh) to the Registrant’s Annual Report on Form 10-K for the year ended December 31, 2001).*
10(j)–10 (j) - Employment Agreement, dated as of January 13, 2003, between the Registrant and James A. Sabala. (Incorporated by reference to Exhibit 10(jj) to Registrant’s Annual Report on Form 10-K for the period ended December 31, 2002).*
* Management contract or compensatory plan.
73
10(k)–10 (k) - 2003 Long-Term Incentive Plan of the Registrant. (Incorporated herein by reference to Appendix A to the Registrant’s definitive Proxy Statement on Schedule 14A filed with the SEC on April 21, 2003.) *
10(l)–10 (l) - Silver Sale and Purchase Agreement, dated April 7, 2005, between CDE Australia Pty. Limited and Cobar Operations Pty. Limited. (Portions of this exhibit have been omitted pursuant to a request for confidential treatment.) (Incorporated by reference to Exhibit 10.1 to the Registrant’s Quarterly Report on Form 10-Q for the quarter ended March 31, 2005.)
10(m)–10 (m) - 2005 Non-Employee Directors’ Equity Incentive Plan (Incorporated herein by reference to Appendix A to the Registrant’s proxy statement dated April 5, 2005).
* Management contract or compensatory plan.
80
10(n)–10 (n) - Amended and restated employment agreementRestated Employment Agreement and changeChange in control agreement,Control Agreement, effective July 1, 2005, between the Registrant and Donald J. Birak (Incorporated herein by reference to Exhibit 10.4 to the Registrant’s Quarterly Report on Form 10-Q for the quarter ended June 30, 2005).*
10(o)–10 (o) - Employment Agreement, dated as of September 17, 2002, between the Registrant and Dennis E. Wheeler (Incorporated herein by reference to Exhibit 10(z) to the Registrant’s Annual Report on Form 10-K for the year ended December 31, 2005).2005.)*
10(p)–10 (p) - Amended Mining Lease, effective as of August 5, 2005, between Hyak Mining Company, Inc. and Coeur Alaska, Inc. (Incorporated herein by reference to Exhibit 10.5 to the Registrant'sRegistrant’s Quarterly Report on Form 10-Q for the quarter ended June 30, 2005).
10(q)–10 (q) - Silver Sale Agreement, dated September 8, 2005, between the Registrant, Perilya Broken Hill Ltd and CDE Australia Pty. Ltd. (Portions of this exhibit have been omitted pursuant to a request for confidential treatment.) (Incorporated herein by reference to Exhibit 10.1 to the Registrant’s Quarterly Report on Form 10-Q for the quarter ended September 30, 2005).
10(r)–10 (r) - Employment agreementAgreement and changeChange in control agreement,Control Agreement, effective October 15, 2005, between the Registrant and James K. Duff. (Incorporated herein by reference to Exhibit 10.2 to the Registrant'sRegistrant’s Quarterly Report on Form 10-Q for the quarter ended September 30, 2005).*
10(s)–10 (s) - Form of Restricted Stock Agreement (Incorporated herein by reference to Exhibit 10.1 to the Registrant’s Current Report on Form 8-K dated February 15, 2005).*
10(t)–10 (t) - Form of Incentive Stock Option Agreement (Incorporated herein by reference to Exhibit 10.2 to the Registrant’s Current Report on Form 8-K dated February 15, 2005).*
10(u)–10 (u) - Form of Non-Qualified Stock Option Agreement (Incorporated herein by reference to Exhibit 10.3 to the Registrant’s Current Report on Form 8-K dated February 15, 2005).*
* Management contract or compensatory plan.
74
10(v)–10 (v) - First Amendment to Employment to Agreement, effective March 30, 2006, between the Registrant and Dennis E. Wheeler (Incorporated herein by reference to Exhibit 10(a) to the Registrant’s Quarterly Report on Form 10-Q for the quarter ended March 31, 2006).*
10(w)–10 (w) - Amended and Restated Silver Sale and Purchase Agreement, dated March 28, 2006, between CDE Australia Pty Limited and Cobar Operations Pty Limited (Portions of this exhibit have been omitted pursuant to a request for confidential treatment.) (Incorporated herein by reference to Exhibit 10(b) to the Registrant’s Quarterly Report on Form 10-Q for the quarter ended March 31, 2006).
* Management contract or compensatory plan.
81
10(x)–10 (x) - Employment Agreement, dated July 31, 2006, between the Registrant and Alan L. Wilder. (Incorporated herein by reference to Exhibit 10.1 to the Registrant’s Quarterly Report on Form 10-Q for the quarter ended June 30, 2006).2006.)*
10(y)–10 (y) - Amendment, dated July 31, 2006, to Employment Agreement between the Registrant and Donald J. Birak. (Incorporated herein by reference to Exhibit 10.2 to the Registrant’s Quarterly Report on Form 10-Q for the quarter ended June 30, 2006).2006.)*
10(z)–10 (z) - Amendment, dated July 31, 2006, to Employment Agreement between the Registrant and James K. Duff. (Incorporated herein by reference to Exhibit 10(z) to the Registrant’s Annual Report on Form 10-K for the year ended December 31, 2006.)* 10(aa) - Second Amendment to Employment Agreement, dated July 31, 2007, to employment agreement dated July 1, 2005, as amended on July 31, 2006, between the Registrant and Donald J. Birak (Incorporated herein by reference to Exhibit 10.1 to the Registrant’s Quarterly Report on Form 10-Q for the quarter ended June 30, 2007.)* 10(bb) - Second Amendment to Employment Agreement, dated May 2, 2007, between the Registrant and Dennis E. Wheeler (Incorporated herein by reference to Exhibit 10.1 to the Registrant’s Current Report on Form 8-K filed on May 7, 2007.)* 10(cc) - Supplemental Agreement in respect of the Amended and Restated Silver Sale and Purchase Agreement, dated January 29, 2008, between CDE Australia Pty Limited and Cobar Operations Pty Limited. (Filed herewith)herewith.) 10(dd) - Amended and Restated Employment Agreement and Change in Control Agreement, effective July 1, 2005, between the Registrant and Mitchell J. Krebs (Incorporated herein by reference to Exhibit 10.3 to the Registrant’s Quarterly Report on Form 10-Q for the quarter ended June 30, 2005).* 10(ee) - First Amendment to Employment Agreement, effective July 31, 2006, between the Registrant and Mitchell J. Krebs. (Filed herewith.)* 10(ff) - Second Amendment to Employment Agreement, effective July 31, 2007, between the Registrant and Mitchell J. Krebs. (Filed herewith.)* 10(gg) - Amended and Restated Employment Agreement and Change in Control Agreement, effective July 1, 2005, between the Registrant and Harry F. Cougher (Incorporated herein by reference to Exhibit 10.2 to the Registrant’s Quarterly Report on Form 10-Q for the quarter ended June 30, 2005).* 10(hh) - First Amendment to Employment Agreement, effective July 31, 2006, between the Registrant and Harry F. Cougher. (Filed herewith.)* 10(ii) - Employment Agreement, dated as of February 13, 2006, between CDE Australia Pty Ltd and Richard M. Weston. (Filed herewith.)*
* Management contract or compensatory plan.
82
10(jj) - First Amendment to Employment Agreement, effective as of July 31, 2006, between the Registrant and Richard M. Weston. (Filed herewith.)* 10(kk) - Second Amendment to Employment Agreement, effective as of July 31, 2007, between the Registrant and Richard M. Weston. (Filed herewith.)* 10(ll) - First Amendment to Employment Agreement, dated February 6, 2008, between the Registrant and Alan L. Wilder. (Filed herewith.)* 21 –- List of subsidiaries of the Registrant. (Filed herewith.)
23 –- Consent of KPMG LLP (Filed herewith.)
31.1 –- Certification of the CEO (Filed herewith.)
31.2 –- Certification of the CFO (Filed herewith.)
32.1 –- CEO Section 1350 Certification (Filed herewith.)
32.2 –- CFO Section 1350 Certification (Filed herewith.) 99 (a) - Option Deed dated May 3, 2007 by and between Coeur d’Alene Mines Corporation and Kenneth M. Phillips (Incorporated herein by reference to Exhibit 99.1(a) to the Registrant’s Current Report on Form 8-K filed May 4, 2007.) 99 (b) - Option Deed dated May 3, 2007 by and between Coeur d’Alene Mines Corporation and Altinova Nominees Pty Ltd (Incorporated herein by reference to Exhibit 99.1(b) to the Registrant’s Current Report on Form 8-K filed May 4, 2007.) 99 (c) - Option Deed dated May 3, 2007 by and between Coeur d’Alene Mines Corporation and Dragonlyn Pty Ltd (Incorporated herein by reference to Exhibit 99.1(c) to the Registrant’s Current Report on Form 8-K filed May 4, 2007.) 99 (d) - Option Deed dated May 3, 2007 by and between Coeur d’Alene Mines Corporation and Rosignol Consultants Pty Ltd (Incorporated herein by reference to Exhibit 99.1(d) to the Registrant’s Current Report on Form 8-K filed May 4, 2007.) 99 (e) - Option Deed dated May 3, 2007 by and between Coeur d’Alene Mines Corporation and Promin Mining Services Pty Limited (Incorporated herein by reference to Exhibit 99.1(e) to the Registrant’s Current Report on Form 8-K filed May 4, 2007.) 99 (f) - Option Deed dated May 3, 2007 by and between Coeur d’Alene Mines Corporation and Rosignol Pty Limited (Incorporated herein by reference to Exhibit 99.1(f) to the Registrant’s Current Report on Form 8-K filed May 4, 2007.) 99 (g) - Amendments dated September 24, 2007 to Option Deed dated May 3, 2007 by and between Coeur d’Alene Mines Corporation and Kenneth M. Phillips. (Incorporated herein by reference to Exhibit 99.1 to the Registrant’s Form 8-K filed September 25, 2007.)
* Management contract or compensatory plan.
83
99 (h) - Amendments dated September 24, 2007 to Option Deed dated May 3, 2007 by and between Coeur d’Alene Mines Corporation and Altinova Nominees Pty Ltd. (Incorporated herein by reference to Exhibit 99.2 to the Registrant’s Form 8-K filed September 25, 2007.) 99 (i) - Amendments dated September 24, 2007 to Option Deed dated May 3, 2007 by and between Coeur d’Alene Mines Corporation and Dragonlyn Pty Ltd. (Incorporated herein by reference to Exhibit 99.3 to the Registrant’s Form 8-K filed September 25, 2007.) 99 (j) - Amendments dated September 24, 2007 to Option Deed dated May 3, 2007 by and between Coeur d’Alene Mines Corporation and Rosignol Consultants Pty Ltd. (Incorporated herein by reference to Exhibit 99.4 to the Registrant’s Form 8-K filed September 25, 2007.) 99 (k) - Amendments dated September 24, 2007 to Option Deed dated May 3, 2007 by and between Coeur d’Alene Mines Corporation and Promin Mining Services Pty Ltd. (Incorporated herein by reference to Exhibit 99.5 to the Registrant’s Form 8-K filed September 25, 2007.) 99 (l) - Amendments dated September 24, 2007 to Option Deed dated May 3, 2007 by and between Coeur d’Alene Mines Corporation and Rosignol Consultants Pty Ltd. (Incorporated herein by reference to Exhibit 99.6 to the Registrant’s Form 8-K filed September 25, 2007.) 99 (m) - Amending Agreement dated October 23, 2007 relating to Option Deed dated May 3, 2007 by and between Coeur d’Alene Mines Corporation and Kenneth M. Phillips, as amended to date (Incorporated herein by reference to Exhibit 99.1 to the Registrant’s Current Report on Form 8-K filed October 29, 2007.) 99 (n) - Amending Agreement dated October 23, 2007 relating to Option Deed dated May 3, 2007 by and between Coeur d’Alene Mines Corporation and Altinova Nominees Pty Ltd, as amended to date (Incorporated herein by reference to Exhibit 99.2 to the Registrant’s Current Report on Form 8-K filed October 29, 2007.) 99 (o) - Amending Agreement dated October 23, 2007 relating to Option Deed dated May 3, 2007 by and between Coeur d’Alene Mines Corporation and Dragonlyn Pty Ltd, as amended to date (Incorporated herein by reference to Exhibit 99.3 to the Registrant’s Current Report on Form 8-K filed October 29, 2007.) 99 (p) - Amending Agreement dated October 23, 2007 relating to Option Deed dated May 3, 2007 by and between Coeur d’Alene Mines Corporation and Rosignol Consultants Pty Ltd, as amended to date (Incorporated herein by reference to Exhibit 99.4 to the Registrant’s Current Report on Form 8-K filed October 29, 2007.) 99 (q) - Amending Agreement dated October 23, 2007 relating to Option Deed dated May 3, 2007 by and between Coeur d’Alene Mines Corporation and Promin Mining Services Pty Limited, as amended to date (Incorporated herein by reference to Exhibit 99.5 to the Registrant’s Current Report on Form 8-K filed October 29, 2007.)
84
99 (r) - Amending Agreement dated October 23, 2007 relating to Option Deed dated May 3, 2007 by and between Coeur d’Alene Mines Corporation and Rosignol Pty Limited, as amended to date (Incorporated herein by reference to Exhibit 99.6 to the Registrant’s Current Report on Form 8-K filed October 29, 2007.)
(c) Independent auditors’ reports are included herein as follows:
Report of KPMG LLP as of December 31, 20062007 and for the years ended December 31, 2007, 2006 2005 and 2004.2005.
* Management or compensatory plan.
7585
SIGNATURES
SIGNATURES Pursuant to the requirements of Section 13 or 15(d) of the Securities Exchange Act of 1934, the registrant has duly caused this report to be signed on its behalf by the undersigned, thereunto duly authorized.Coeur d’Alene Mines Corporation
(Registrant)
(Registrant)
Date: February 22, 200729, 2008 By: /s/ Dennis E. Wheeler Dennis E. Wheeler (Chairman, (Chairman, President and Chief Executive Officer)
Pursuant to the requirements of the Securities Exchange Act of 1934, this report has been signed below by the following persons on behalf of the registrant and in the capacities and on the dates indicated./s/ Dennis E. Wheeler Chairman, President, Chief Executive Officer February 22, 200729, 2008 Dennis E. Wheeler and Director
/s/ James A. SabalaJames A. Sabala Executive Vice President February 22, 2007James A. Sabalaand Chief Financial Officer February 29, 2008
/s/ Tom T. AngelosTom T. Angelos Vice President, Controller February 22, 2007Tom T. Angelosand Chief Accounting Officer
/s/ Cecil D. AndrusDirectorFebruary 22, 200729, 2008 Cecil D. Andrus
/s/ James J. CurranDirectorFebruary 22, 2007James J. Curran Director February 29, 2008
/s/ Sebastian EdwardsSebastian Edwards Director February 29, 2008 /s/ Andrew D. Lundquist DirectorFebruary 22, 2007Andrew D. Lundquist Director February 29, 2008
/s/ Robert E. Mellor DirectorFebruary 22, 2007Robert E. Mellor Director February 29, 2008
/s/ John H. Robinson DirectorFebruary 22, 2007John H. Robinson Director February 29, 2008
/s/ J. Kenneth Thompson DirectorFebruary 22, 2007J. Kenneth Thompson Director February 29, 2008
/s/ Alex VitaleAlex Vitale Director February 22, 200729, 2008 Alex Vitale
/s/ Timothy R. WintererDirectorFebruary 22, 2007Timothy R. Winterer Director February 29, 2008
7686
ANNUAL REPORT ON FORM 10-KCONSOLIDATED FINANCIAL STATEMENTSYEAR ENDED DECEMBER 31, 20062007
COEUR D’ALENE MINES CORPORATIONCOEUR D’ALENE, IDAHOReports of Independent Registered Public Accounting Firm F-2 -– F-4
Consolidated Balance Sheets -– December 31, 20062007 and 20052006 F-5 -– F-6
Consolidated Statements of Operations and Comprehensive Income (Loss) for the Years Ended December 31, 2007, 2006 and
2005 and 2004 F-7
Consolidated Statements of Changes in Shareholders'Shareholders’ Equity for the Years Ended December 31, 2007, 2006 2005 and 20042005 F-8
Consolidated Statements of Cash Flows for the Years Ended December 31, 2007, 2006 2005 and 20042005 F-9
Notes to Consolidated Financial Statements F-10
F-1
Report of Independent Registered Public Accounting FirmThe Board of Directors and Shareholders
Coeur d’Alene Mines Corporation:We have audited the accompanying consolidated balance sheets of Coeur d’Alene Mines Corporation and subsidiaries as of December 31, 20062007 and 2005,2006, and the related consolidated statements of operations and comprehensive income, (loss),changes in shareholders’ equity, and cash flows for each of the years in the three-year period ended December 31, 2006.2007. These consolidated financial statements are the responsibility of the Company’s management. Our responsibility is to express an opinion on these consolidated financial statements based on our audits.We conducted our audits in accordance with the standards of the Public Company Accounting Oversight Board (United States). Those standards require that we plan and perform the audit to obtain reasonable assurance about whether the financial statements are free of material misstatement. An audit includes examining, on a test basis, evidence supporting the amounts and disclosures in the financial statements. An audit also includes assessing the accounting principles used and significant estimates made by management, as well as evaluating the overall financial statement presentation. We believe that our audits provide a reasonable basis for our opinion.In our opinion, the consolidated financial statements referred to above present fairly, in all material respects, the financial position of Coeur d’Alene Mines Corporation and subsidiaries as of December 31, 20062007 and 2005,2006, and the results of their operations and their cash flows for each of the years in the three-year period ended December 31, 2006,2007, in conformity with U.S. generally accepted accounting principles.As discussed in Note B to the Consolidated Financial Statements,consolidated financial statements, the Company has adopted Statement of Financial Accounting Standards No. 123 (revised 2004),Share-Based Payment, and Emerging Issues Task Force Issue No. 04-6,Accounting for Stripping Costs Incurred during Production in the Mining Industry, as of January 1, 2006.We also have audited, in accordance with the standards of the Public Company Accounting Oversight Board (United States), the effectiveness of Coeur d’Alene Mines Corporation’s internal control over financial reporting as of December 31, 2006,2007, based on criteria established inInternal Control-IntegratedControl — Integrated Framework issued by the Committee of Sponsoring Organizations of the Treadway Commission (COSO), and our report dated February 22, 200729, 2008 expressed an unqualified opinion on management’s assessmentthe effectiveness of and the effective operation of,Company’s internal control over financial reporting./s/
KPMG LLPBoise, Idaho
February 22, 2007
29, 2008F-2
Report of Independent Registered Public Accounting FirmThe Board of Directors and Shareholders
Coeur d’Alene Mines Corporation:We have audited management's assessment, included in the accompanying Management’s Report on Internal Control Over Financial Reporting, that Coeur d’Alene Mines Corporation maintained effectiveCorporation’s internal control over financial reporting as of December 31, 2006,2007, based on criteria established inInternal Control-IntegratedControl — Integrated Frameworkissued by the Committee of Sponsoring Organizations of the Treadway Commission (COSO).Coeur d’Alene Mines Corporation’s management is responsible for maintaining effective internal control over financial reporting and for its assessment of the effectiveness of internal control over financial reporting.reporting, included in the accompanying Management’s Report on Internal Control Over Financial Reporting. Our responsibility is to express an opinion on management’s assessment and an opinion on the effectiveness of the Company’s internal control over financial reporting based on our audit.We conducted our audit in accordance with the standards of the Public Company Accounting Oversight Board (United States). Those standards require that we plan and perform the audit to obtain reasonable assurance about whether effective internal control over financial reporting was maintained in all material respects. Our audit included obtaining an understanding of internal control over financial reporting, evaluating management’s assessment,assessing the risk that a material weakness exists, and testing and evaluating the design and operating effectiveness of internal control andbased on the assessed risk. Our audit also included performing such other procedures as we considered necessary in the circumstances. We believe that our audit provides a reasonable basis for our opinion.A company'scompany’s internal control over financial reporting is a process designed to provide reasonable assurance regarding the reliability of financial reporting and the preparation of financial statements for external purposes in accordance with generally accepted accounting principles. A company’s internal control over financial reporting includes those policies and procedures that (1) pertain to the maintenance of records that, in reasonable detail, accurately and fairly reflect the transactions and dispositions of the assets of the company; (2) provide reasonable assurance that transactions are recorded as necessary to permit preparation of financial statements in accordance with generally accepted accounting principles, and that receipts and expenditures of the company are being made only in accordance with authorizations of management and directors of the company; and (3) provide reasonable assurance regarding prevention or timely detection of unauthorized acquisition, use, or disposition of the company’s assets that could have a material effect on the financial statements.Because of its inherent limitations, internal control over financial reporting may not prevent or detect misstatements. Also, projections of any evaluation of effectiveness to future periods are subject to the risk that controls may become inadequate because of changes in conditions, or that the degree of compliance with the policies or procedures may deteriorate.In our opinion, management's assessment that Coeur d’Alene Mines Corporation maintained effective internal control over financial reporting as of December 31, 2006, is fairly stated, in all material respects, based on criteria established inInternal Control-Integrated Framework issued by the Committee of Sponsoring Organizations of the Treadway Commission (COSO). Also, in our opinion, Coeur d’Alene Mines Corporation maintained, in all material respects, effective internal control over financial reporting as of December 31, 2006,2007, based on criteria established inInternal Control-IntegratedControl — Integrated Frameworkissued by the Committee of Sponsoring Organizations of the Treadway Commission (COSO).Commission.The Company acquired Bolnisi Gold NL and Palmarejo Silver and Gold Corporation on December 21, 2007, and management excluded from its assessment of the effectiveness of the Company’s internal control over financial reporting as of December 31, 2007, Bolnisi Gold NL’s and Palmarejo Silver and Gold Corporation’s internal control over financial reporting associated with total assets of $1.8 billion and total revenues of nil, included in the consolidated financial statements of Coeur d’Alene Mines Corporation and subsidiaries as of and for the year ended December 31, 2007. Our audit of internal control over financial reporting of Coeur d’Alene Mines Corporation also excluded an evaluation of the internal control over financial reporting of Bolnisi Gold NL and Palmarejo Silver and Gold Corporation.F-3
We also have audited, in accordance with the standards of the Public Company Accounting Oversight Board (United States), the consolidated balance sheets of Coeur d’Alene Mines Corporation as of December 31, 20062007 and 2005,2006, and the related consolidated statements of operations and comprehensive income, (loss), shareholders’ equity, and cash flows for each of the years in the three-year period ended December 31, 2006,2007, and our report dated February 22, 200729, 2008 expressed an unqualified opinion on those consolidated financial statements./s/
KPMG LLPBoise, Idaho
February 22, 2007
29, 2008F-4
COEUR D’ALENE MINES CORPORATION AND SUBSIDIARIES
CONSOLIDATED BALANCE SHEETSDecember 31, 2006
2005
ASSETS (In Thousands)
CURRENT ASSETS Cash and cash equivalents $ 270,672 $ 54,896 Short-term investments 70,373 185,446 Receivables 43,233 27,986 Ore on leach pad 31,302 25,394 Metal and other inventory 16,341 12,807 Deferred tax assets 3,629 2,255 Prepaid expenses and other 6,047 4,707 Assets of discontinued operations held for sale -- 14,828
441,597 328,319
PROPERTY, PLANT AND EQUIPMENT Property, plant and equipment 132,315 105,107 Less accumulated depreciation (64,206 ) (57,929 )
68,109 47,178
MINING PROPERTIES Operational mining properties 130,447 121,441 Less accumulated depletion (116,361 ) (105,486 )
14,086 15,955
Mineral interests 72,201 72,201 Less accumulated depletion (7,828 ) (2,218 )
64,373 69,983
Non-producing and development properties 190,988 72,488
269,447 158,426
OTHER ASSETS Ore on leach pad, non-current portion 35,367 29,254 Restricted cash and cash equivalents 19,492 16,943 Debt issuance costs, net 5,151 5,454 Deferred tax assets 2,544 923 Other 7,919 8,319
70,473 60,893
TOTAL ASSETS $ 849,626 $ 594,816
December 31, 2007 2006 (In thousands) ASSETS CURRENT ASSETS Cash and cash equivalents $ 98,671 $ 270,672 Short-term investments 53,039 70,373 Receivables 56,121 43,233 Ore on leach pad 25,924 31,302 Metal and other inventory 18,918 16,341 Deferred tax assets 3,573 3,629 Prepaid expenses and other 7,821 6,047 264,067 441,597 PROPERTY, PLANT AND EQUIPMENT Property, plant and equipment 322,733 132,315 Less accumulated depreciation (69,937 ) (64,206 ) 252,796 68,109 MINING PROPERTIES Operational mining properties 143,324 130,447 Less accumulated depletion (124,401 ) (116,361 ) 18,923 14,086 Mineral interests 1,731,715 72,201 Less accumulated depletion (11,639 ) (7,828 ) 1,720,076 64,373 Non-producing and development properties 311,469 190,988 2,050,468 269,447 OTHER ASSETS Ore on leach pad, non-current portion 24,995 35,367 Restricted cash and cash equivalents 25,760 23,508 Debt issuance costs, net 4,848 5,151 Deferred tax assets 1,109 2,544 Other 27,651 3,903 84,363 70,473 TOTAL ASSETS $ 2,651,694 $ 849,626
The accompanying notes are an integral part of these consolidated financial statements.F-5
COEUR D’ALENE MINES CORPORATION AND SUBSIDIARIES
CONSOLIDATED BALANCE SHEETSDecember 31, 2006
2005
(In thousands except
share data) LIABILITIES AND SHAREHOLDERS’ EQUITY
CURRENT LIABILITIES Accounts payable $ 22,315 $ 17,189 Accrued liabilities and other 11,865 5,662 Accrued income taxes 10,317 66 Accrued payroll and related benefits 8,527 7,840 Accrued interest payable 1,031 1,031 Current portion of reclamation and mine closure 4,460 1,646 Liabilities of discontinued operations held for sale -- 12,908
58,515 46,342
LONG-TERM LIABILITIES 1 1/4% Convertible Senior Notes due January 2024 180,000 180,000 Reclamation and mine closure 27,226 23,048 Other long-term liabilities 2,891 3,873
210,117 206,921
COMMITMENTS AND CONTINGENCIES (See Notes I, J, L, M, N, O, P and R)
SHAREHOLDERS’ EQUITY Common Stock, par value $1.00 per share; authorized 500,000,000 shares, issued 279,054,344 and 250,961,353 shares in 2006 and 2005 (1,059,211 shares held in treasury) 279,054 250,961 Additional paid-in capital 777,798 656,977 Accumulated deficit (463,221 ) (551,357 ) Shares held in treasury (13,190 ) (13,190 ) Accumulated other comprehensive income (loss) 553 (1,838 )
580,994 341,553
TOTAL LIABILITIES AND SHAREHOLDERS’ EQUITY $ 849,626 $ 594,816
December 31, 2007 2006 (In thousands, except share data) LIABILITIES AND SHAREHOLDERS’ EQUITY CURRENT LIABILITIES Accounts payable $ 49,642 $ 22,315 Accrued liabilities and other 9,072 10,971 Accrued income taxes 7,547 10,317 Accrued payroll and related benefits 9,342 8,527 Accrued interest payable 1,060 1,031 Current portion of long-term debt and capital lease obligations 30,831 894 Current portion of reclamation and mine closure 4,183 4,460 111,677 58,515 LONG-TERM LIABILITIES 1 1/4% Convertible Senior Notes due January 2024 180,000 180,000 Reclamation and mine closure 30,629 27,226 Deferred income taxes 573,681 272 Obligations under capital leases 23,661 — Other long-term liabilities 4,679 2,619 812,650 210,117 COMMITMENTS AND CONTINGENCIES (See Notes I, J, M, N, O, P, Q and S) SHAREHOLDERS’ EQUITY Common Stock, par value $1.00 per share; authorized 750,000,000 shares in 2007 and 500,000,000 in 2006, issued 551,512,230 and 279,054,344 shares in 2007 and 2006 (1,059,211 shares held in treasury) 551,512 279,054 Additional paid-in capital 1,607,737 777,798 Accumulated deficit (419,331 ) (463,221 ) Shares held in treasury (13,190 ) (13,190 ) Accumulated other comprehensive income 639 553 1,727,367 580,994 TOTAL LIABILITIES AND SHAREHOLDERS’ EQUITY $ 2,651,694 $ 849,626
The accompanying notes are an integral part of these consolidated financial statements.
F-6
COEUR D’ALENE MINES CORPORATION AND SUBSIDIARIES
CONSOLIDATED STATEMENTS OF OPERATIONS AND COMPREHENSIVE INCOME (LOSS)Years Ended December 31, 2006
2005
2004
(In Thousands, except per share data)
REVENUES Sales of metal $ 216,573 $ 156,284 $ 109,047
COSTS AND EXPENSES Production costs applicable to sales 92,378 88,232 63,715 Depreciation and depletion 26,772 18,889 16,833 Administrative and general 19,369 20,624 17,499 Exploration 9,474 10,553 8,031 Pre-development -- 6,057 11,449 Litigation settlement 2,365 1,600 --
Total cost and expenses 150,358 145,955 117,527
OTHER INCOME AND EXPENSE Interest and other income 18,654 8,385 3,165 Interest expense, net of capitalized interest (1,224 ) (2,485 ) (2,831 ) Merger expenses -- -- (15,675 )
Total other income and expense 17,430 5,900 (15,341 )
Income (loss) from continuing operations before income taxes 83,645 16,229 (23,821 ) Income tax (provision) benefit (8,226 ) (1,483 ) 5,785
Income (loss) from continuing operations 75,419 14,746 (18,036 ) Income (loss) from discontinued operations, net of income taxes 1,935 (4,195 ) 1,178 Gain on sale of net assets of discontinued operations, net of income taxes 11,132 -- --
NET INCOME (LOSS) 88,486 10,551 (16,858 ) Other comprehensive income (loss) 2,391 447 (908 )
COMPREHENSIVE INCOME (LOSS) $ 90,877 $ 10,998 $ (17,766 )
BASIC AND DILUTED INCOME (LOSS) PER SHARE Basic income (loss) per share: Income (loss) from continuing operations $ 0.28 $ 0.06 $ (0.08 ) Income (loss) from discontinued operations 0.05 (0.02 ) --
Net income (loss) $ 0.33 $ 0.04 $ (0.08 )
Diluted income (loss) per share: Income (loss) from continuing operations $ 0.26 $ 0.06 $ (0.08 ) Income (loss) from discontinued operations 0.04 (0.02 ) --
Net income (loss) $ 0.30 $ 0.04 $ (0.08 )
Weighted average number of shares of common stock Basic 271,357 242,915 215,969 Diluted 296,082 243,683 215,969
Years Ended December 31, 2007 2006 2005 (In thousands, except per share data) REVENUES Sales of metal $ 215,319 $ 216,573 $ 156,284 COSTS AND EXPENSES Production costs applicable to sales 117,025 92,378 88,232 Depreciation and depletion 20,984 26,772 18,889 Administrative and general 23,875 19,369 20,624 Exploration 11,941 9,474 10,553 Litigation settlements 507 2,365 1,600 Pre-development — — 6,057 Total cost and expenses 174,332 150,358 145,955 Operating income 40,987 66,215 10,329 OTHER INCOME AND EXPENSE Interest and other income 18,195 18,654 8,385 Interest expense, net of capitalized interest (365 ) (1,224 ) (2,485 ) Total other income and expense 17,830 17,430 5,900 Income from continuing operations before income taxes 58,817 83,645 16,229 Income tax provision (14,927 ) (8,226 ) (1,483 ) Income from continuing operations 43,890 75,419 14,746 Income (loss) from discontinued operations, net of income taxes — 1,935 (4,195 ) Gain on sale of net assets of discontinued operations, net of income taxes — 11,132 — NET INCOME 43,890 88,486 10,551 Other comprehensive income 86 2,391 447 COMPREHENSIVE INCOME $ 43,976 $ 90,877 $ 10,998 BASIC AND DILUTED INCOME (LOSS) PER SHARE Basic income per share: Income from continuing operations $ 0.15 $ 0.28 $ 0.06 Income (loss) from discontinued operations — 0.05 (0.02 ) Net income $ 0.15 $ 0.33 $ 0.04 Diluted income per share: Income from continuing operations $ 0.14 $ 0.26 $ 0.06 Income (loss) from discontinued operations — 0.04 (0.02 ) Net income $ 0.14 $ 0.30 $ 0.04 Weighted average number of shares of common stock Basic 285,972 271,357 242,915 Diluted 310,524 296,082 243,683
The accompanying notes are an integral part of these consolidated financial statements.F-7
COEUR D’ALENE MINES CORPORATION AND SUBSIDIARIES
CONSOLIDATED STATEMENTS OF CHANGES IN SHAREHOLDERS’ EQUITYFor Years Ended December 31, 2006, 2005 and 2004
(In thousands except share data) Common
Stock
Shares
Common
Stock
$1 Par
Additional
Paid-In
Capital
Accumulated
Deficit
Shares
Held in
Treasury
Accumulated
Other
Comprehensive
Income (Loss)
Total
Balances at January 1, 2004 214,195 $ 214,195 $ 542,900 $ (545,050 ) $ (13,190 ) $ (1,377 ) $ 197,478 Net loss -- -- -- (16,858 ) -- -- (16,858 ) Unrealized losses on short-term investments and marketable securities -- -- -- -- -- (347 ) (347 ) Change in fair value of derivative hedging instruments, net of settlements -- -- -- -- -- (130 ) (130 ) Excess additional pension liability over unrecognized prior service cost -- -- -- -- -- (431 ) (431 ) Issuance of common stock 26,625 26,625 86,475 -- -- -- 113,100 Common stock issued under long-term incentive plans 208 208 432 -- -- -- 640 Other -- -- 2 -- -- -- 2
Balances at December 31, 2004 241,028 $ 241,028 $ 629,809 $ (561,908 ) $ (13,190 ) $ (2,285 ) $ 293,454 Net income -- -- -- 10,551 -- -- 10,551 Unrealized gain on short-term investments and marketable securities -- -- -- -- -- 853 853 Change in fair value of derivative hedging instruments, net of settlements -- -- -- -- -- (171 ) (171 ) Excess additional pension liability over unrecognized prior service cost -- -- -- -- -- (237 ) (237 ) Issuance of common stock 9,863 9,863 26,351 -- -- -- 36,214 Common stock issued under long-term incentive plans 70 70 817 -- -- -- 887 Foreign currency translation -- -- -- -- -- 2 2
Balances at December 31, 2005 250,961 $ 250,961 $ 656,977 $ (551,357 ) $ (13,190 ) $ (1,838 ) $ 341,553 Net income -- -- -- 88,486 -- -- 88,486 Cumulative effect of accounting change -- -- -- (350 ) -- -- (350 ) Unrealized gain on short-term investments and marketable securities -- -- -- -- -- 63 63 Change in fair value of cash flow hedging instruments, net of settlements -- -- -- -- -- 111 111 Elimination of excess additional pension liability over unrecognized prior service cost attributable to discontinued operations -- -- -- -- -- 2,219 2,219 Issuance of common stock 27,600 27,600 118,631 -- -- -- 146,231 Common stock issued under long-term incentive plans 493 493 2,190 -- -- -- 2,683 Foreign currency translation -- -- -- -- -- (2 ) (2 )
Balances at December 31, 2006 279,054 $ 279,054 $ 777,798 $ (463,221 ) $ (13,190 ) $ 553 $ 580,994
Years Ended December 31, 2007, 2006 and 2005 (In thousands, except share data) Accumulated Common Common Additional Shares Other Stock Stock Paid-In Accumulated Held in Comprehensive Shares $1 Par Capital Deficit Treasury Income (Loss) Total Balances at January 1, 2005 241,028 $ 241,028 $ 629,809 $ (561,908 ) $ (13,190 ) $ (2,285 ) $ 293,454 Net income — — — 10,551 — — 10,551 Unrealized gain on short-term investments and marketable securities — — — — — 853 853 Change in fair value of derivative hedging instruments, net of settlements — — — — — (171 ) (171 ) Excess additional pension liability over unrecognized prior service cost — — — — — (237 ) (237 ) Issuance of common stock 9,863 9,863 26,351 — — — 36,214 Common stock issued under long-term incentive plans, net 70 70 817 — — — 887 Foreign currency translation — — — — — 2 2 Balances at December 31, 2005 250,961 $ 250,961 $ 656,977 $ (551,357 ) $ (13,190 ) $ (1,838 ) $ 341,553 Net income — — — 88,486 — — 88,486 Cumulative effect of accounting change — — — (350 ) — — (350 ) Unrealized gain on short-term investments and marketable securities — — — — — 63 63 Change in fair value of cash flow hedging instruments, net of settlements — — — — — 111 111 Elimination of excess additional pension liability over unrecognized prior service cost attributable to discontinued operations — — — — — 2,219 2,219 Issuance of common stock 27,600 27,600 118,631 — — — 146,231 Common stock issued under long-term incentive plans, net 493 493 2,190 — — — 2,683 Foreign currency translation — — — — — (2 ) (2 ) Balances at December 31, 2006 279,054 $ 279,054 $ 777,798 $ (463,221 ) $ (13,190 ) $ 553 $ 580,994 Net income — — — 43,890 — — 43,890 Unrealized gain on short-term investments and marketable securities — — — — — 103 103 Change in fair value of cash flow hedging instruments, net of settlements — — — — — (23 ) (23 ) Issuance of common stock in Bolnisi/Palmarejo merger 271,969 271,969 826,061 — — — 1,098,030 Common stock issued under long-term incentive plans, net 489 489 3,878 — — — 4,367 Foreign currency translation — — — — — 6 6 Balances at December 31, 2007 551,512 $ 551,512 $ 1,607,737 $ (419,331 ) $ (13,190 ) $ 639 $ 1,727,367
The accompanying notes are an integral part of these consolidated financial statements.
F-8
COEUR D’ALENE MINES CORPORATION AND SUBSIDIARIES
CONSOLIDATED STATEMENTS OF CASH FLOWSYears Ended December 31, 2006
2005
2004
(In Thousands)
CASH FLOWS FROM OPERATING ACTIVITIES: Net income (loss) $ 88,486 $ 10,551 $ (16,858 ) Add (deduct) non-cash items: Depreciation and depletion 26,772 18,889 16,833 Deferred taxes (2,902 ) 1,629 (4,403 ) Unrealized (gain) loss on embedded derivatives 1,166 (2,052 ) (82 ) Share-based compensation 2,218 1,237 1,137 Amortization of debt issuance costs 303 303 408 Amortization of premium and/or discount on short-term investments, net 24 790 1,527 Other non-cash charges (313 ) 250 (16 ) Changes in operating assets and liabilities: Receivables (14,781 ) (19,571 ) (2,014 ) Prepaid expenses and other (599 ) (183 ) (517 ) Inventories (15,555 ) (8,308 ) (17,492 ) Accounts payable and accrued liabilities 17,686 2,349 (167 ) Discontinued operations (11,275 ) 792 3,062
CASH PROVIDED BY (USED IN) OPERATING ACTIVITIES 91,230 6,676 (18,582 )
CASH FLOWS FROM INVESTING ACTIVITIES: Purchases of short-term investments (317,743 ) (212,252 ) (343,019 ) Proceeds from sales of short-term investments 430,292 277,021 142,128 Capital expenditures (147,998 ) (113,290 ) (8,363 ) Other (328 ) 103 372 Discontinued operations 15,446 (3,346 ) (2,041 )
CASH USED IN INVESTING ACTIVITIES (20,331 ) (51,764 ) (210,923 )
CASH FLOWS FROM FINANCING ACTIVITIES: Repayment of long-term debt -- -- (9,561 ) Proceeds from issuance of common stock 154,560 36,493 119,803 Payments of common stock issuance costs (8,329 ) (557 ) (6,702 ) Proceeds from issuance of notes -- -- 180,000 Payments of debt issuance costs -- -- (6,089 ) Borrowings from bank on working capital facility -- -- 6,056 Payments to bank on working capital facility -- -- (8,422 ) Other (1,354 ) (1,170 ) (2,055 )
CASH PROVIDED BY FINANCING ACTIVITIES: 144,877 34,766 273,030
INCREASE (DECREASE) IN CASH AND CASH EQUIVALENTS 215,776 (10,322 ) 43,525
Cash and cash equivalents at beginning of period 54,896 65,218 21,693
Cash and cash equivalents at end of period 270,672 $ 54,896 $ 65,218
SUPPLEMENTAL DISCLOSURES OF CASH FLOW INFORMATION Cash paid for: Interest $ 2,334 $ 2,280 $ 1,572 Taxes $ 814 -- --
Years Ended December 31, 2007 2006 2005 (In thousands) CASH FLOWS FROM OPERATING ACTIVITIES: Net income $ 43,890 $ 88,486 $ 10,551 Add (deduct) non-cash items: Depreciation and depletion 20,984 26,772 18,889 Deferred taxes 2,154 (2,902 ) 1,629 Unrealized (gain) loss on embedded derivatives (1,462 ) 1,166 (2,052 ) Share-based compensation 3,448 2,218 1,237 Amortization of debt issuance costs 303 303 303 Amortization of premium and/or discount on short-term investments, net (6 ) 24 790 Gain on asset retirement obligation (871 ) (41 ) (215 ) Gain on foreign currency transactions (433 ) (147 ) 170 (Gain) loss of sales of assets (1,947 ) (237 ) 90 Other non-cash charges 616 112 205 Changes in operating assets and liabilities: Receivables (24,021 ) (14,781 ) (19,571 ) Prepaid expenses and other (4,065 ) (599 ) (183 ) Inventories 13,172 (15,555 ) (8,308 ) Accounts payable and accrued liabilities (11,705 ) 17,686 2,349 Discontinued operations — (11,275 ) 792 CASH PROVIDED BY OPERATING ACTIVITIES 40,057 91,230 6,676 CASH FLOWS FROM INVESTING ACTIVITIES: Purchases of short-term investments (167,346 ) (317,743 ) (212,252 ) Proceeds from sales of short-term investments 183,121 430,292 277,021 Capital expenditures (216,978 ) (147,998 ) (113,290 ) Merger related costs (13,727 ) — — Proceeds from sale of assets 3,270 314 289 Other 187 (642 ) (186 ) Discontinued operations — 15,446 (3,346 ) CASH USED IN INVESTING ACTIVITIES (211,473 ) (20,331 ) (51,764 ) CASH FLOWS FROM FINANCING ACTIVITIES: Proceeds from short-term borrowings 1,698 — — Repayment of long-term debt and capital leases (1,360 ) (1,448 ) (685 ) Proceeds from issuance of common stock — 154,560 36,493 Payments of common stock issuance costs (726 ) (8,329 ) (557 ) Other (197 ) 94 (485 ) CASH PROVIDED BY FINANCING ACTIVITIES: (585 ) 144,877 34,766 INCREASE (DECREASE) IN CASH AND CASH EQUIVALENTS (172,001 ) 215,776 (10,322 ) Cash and cash equivalents at beginning of period 270,672 54,896 65,218 Cash and cash equivalents at end of period $ 98,671 $ 270,672 $ 54,896 SUPPLEMENTAL DISCLOSURES OF CASH FLOW INFORMATION Cash paid for: Interest $ 2,283 $ 2,334 $ 2,280 Income taxes $ 11,994 $ 814 —
The accompanying notes are an integral part of these consolidated financial statements.F-9
COEUR D’ALENE MINES CORPORATION AND SUBSIDIARIES
NOTES TO CONSOLIDATED FINANCIAL STATEMENTS(Dollar amounts in thousands, unless otherwise specified)NOTE A — BUSINESS OF COEUR D’ALENE MINES CORPORATION Coeur d’Alene Mines Corporation and its subsidiaries (collectively, “Coeur” or the “Company”) is principally engaged in silver and gold mining and related activities including exploration, development, and mining at its properties located in the United States (Nevada and Alaska), South America (Chile, Argentina and Bolivia) and, Australia (New South Wales), Mexico (Chihuahua) and Africa (Tanzania).NOTE B — SUMMARY OF SIGNIFICANT ACCOUNTING POLICIES Principles of Consolidation: The consolidated financial statements include the wholly-owned subsidiaries of the Company, the most significant of which are Coeur Rochester, Inc., Coeur Silver Valley, Inc., Coeur Alaska, Inc., CDE Cerro Bayo Ltd., Coeur Argentina, CDE Australia and EmpressaEmpresa Minera Manquiri S.A., Bolnisi Gold NL and Palmarejo Silver and Gold Corporation. The consolidated financial statements also include all entities in which voting control of more than 50% is held by the Company. The Company has no investments in entities in which it has greater than 50% ownership interest accounted for using the equity method. Intercompany balances and transactions have been eliminated in consolidation. Investments in corporate joint ventures where the Company has ownership of 50% or less and funds its proportionate share of expenses are accounted for under the equity method. The Company has no investments in entities in which it has a greater than 20% ownership interest accounted for using the cost method. Revenue Recognition: Pursuant to guidance in Staff Accounting Bulletin (“SAB”) No. 104, “Revenue Recognition for Financial Statements”, revenue is recognized when persuasive evidence of an arrangement exists, delivery has occurred, the price is fixed or determinable, no obligations remain and collectibilitycollectability is probable. The passing of title to the customer is based on the terms of the sales contract. Product pricing is determined at the point revenue is recognized by reference to active and freely traded commodity markets, for example the London Bullion Market for both gold and silver, in an identical form to the product sold. Under our concentrate sales contracts with third-party smelters, final gold and silver prices are set on a specified future quotational period, typically one to three months, after the shipment date based on market metal prices. Revenues are recorded under these contracts at the time title passes to the buyer based on the forward price for the expected settlement period. The contracts, in general, provide for a provisional payment based upon provisional assays and quoted metal prices. Final settlement is based on the average applicable price for a specified future period, and generally occurs from three to six months after shipment. Final sales are settled using smelter weights, settlement assays (average of assays exchanged and/or umpire assay results) and are priced as specified in the smelter contract. The Company’s provisionally priced sales contain an embedded derivative that is required to be separated from the host contract for accounting purposes. The host contract is the receivable from the sale of concentrates measured at the forward price at the time of sale. The embedded derivative does not qualify for hedge accounting. The embedded derivative is recorded as a derivative asset, in prepaid expenses and other assets or as a derivative liability in accrued liabilities and other on the balance sheet and is adjusted to fair value through revenue each period until the date of final gold and silver settlement. The form of the material being sold, after deduction for smelting and refining is in an identical form to that sold on the London Bullion Market. The form of the product is metal in flotation concentrate, which is the final process for which the Company is responsible.F-10
The effects of forward sales contracts are reflected in revenue at the date the related precious metals are delivered or the contracts expire. Third party smelting and refining costs of $8.4 million, $9.1 million and $6.1 million in 2007, 2006 and $3.3 million in 2006, 2005, and 2004, respectively, are recorded as a reduction of revenue. At December 31, 2007, the Company had outstanding provisionally priced sales of $61.2 million consisting of 3.3 million ounces of silver and 20,775 ounces of gold, which had a fair value of approximately $63.8 million including the embedded derivative. For each one cent per ounce change in realized silver price, revenue would vary (plus or minus) approximately $33,300 and for each one dollar per ounce change in realized gold price, revenue would vary (plus or minus) approximately $20,800. At December 31, 2006, the Company had outstanding provisionally priced sales of $74.5 million, consisting of 4.6 million ounces of silver and 29,577 ounces of gold. For each one cent per ounce change in realized silver price, revenue would vary (plus or minus) approximately $45,700 and for each one dollar per ounce change in realized gold price, revenue would vary (plus or minus) approximately $29,600. At December 31, 2005, the Company had outstanding provisionally priced sales of $47.0 million, consisting of 3.5 million ounces of silver and 40,000 ounces of gold. For each one cent per ounce change in realized silver price, revenue would vary (plus or minus) approximately $35,400 and for each one dollar per ounce change in realized gold price, revenue would vary (plus or minus) approximately $40,000. Cash and Cash Equivalents: Cash and cash equivalents include all highly-liquid investments with a maturity of three months or less at the date of purchase. The Company minimizes its credit risk by investing its cash and cash equivalents with major international banks and financial institutions located principally in the United States and Chile with a minimum credit rating of A1 as defined by Standard & Poor’s. The Company’s management believes that no concentration of credit risk exists with respect to the investment of its cash and cash equivalents. Short-term Investments: Short-term investments principally consist of highly-liquid United States, foreign government and corporate securities and investment-grade auction rate securities, all classified as available-for-sale and reported at fair value with maturities that could range from three months to forty years. Unrealized gains and losses on these investments are recorded in accumulated other comprehensive lossincome as a separate component of shareholders’ equity. Any decline in market value considered to be other than temporary is recognized in determining net income/loss. Realized gains and losses from the sale of these investments are included in determining net income/loss. The Company maintains a pledge of collateral agreement to reserve $1.0 million against the investment portfolio to cover credit exposure related to ACH transactions. Prior to December 31, 2006, the Company classified its auction rate securities as cash and cash equivalents because the securities were highly liquid and the periods between interest rate resets generally did not exceed 90 days. During the fourth quarter of 2006, the Company determined that, pursuant to SFAS 95, “Statement of Cash Flows”, its auction securities cannot be classified as cash equivalents because their contractual maturities exceed 90 days. The Company classified its auction rate securities as of December 31, 2006 as short term investments.
The Company also corrected the classification in its 2005 and 2004 financial statement presentation by reclassifying $159.7 million and $207.9 million, respectively, of auction rate securities as of December 31, 2005 and December 31, 2004 from cash and cash equivalents to short-term investments. As a result, the following table shows the amounts, as originally presented in the Company’s Form 10-K, for the years ended December 31, 2005 and December 31, 2004 and the corrected 2005 and 2004 amounts as presented in its Form 10-K for the year ended December 31, 2006. This reclassification had no effect on total current assets, stockholders’ equity, net income (loss), net income (loss) per share or on cash provided by operating activities.
For the year ended December 31, 2005 As Previously
Reported
Adjustment
Corrected
(In Thousands) Cash and Cash Equivalents $ 214,616 $ (159,720 ) $ 54,896 Short-term Investments 25,726 159,720 185,446 Net Cash Used in Investing Activities (99,894 ) 48,130 (51,764 ) Decrease in Cash and Cash Equivalents (58,452 ) 48,130 (10,322 )
F-11
For the year ended December 31, 2004 As Previously
Reported
Adjustment
Corrected
(In Thousands) Cash and Cash Equivalents $ 273,068 $ (207,850 ) $ 65,218 Short-term Investments 48,993 207,850 256,843 Net Cash Used in Investing Activities (43,787 ) (167,136 ) (210,923 ) Decrease in Cash and Cash Equivalents 210,661 (167,136 ) 43,525
$66.7$50.9 million as of December 31, 2006.2007. Of this amount, $31.3$25.9 million is reported as a current asset and $35.4$25.0 million is reported as a non-current asset. The distinction between current and non-current is based upon the expected length of time necessary for the leaching process to remove the metals from the broken ore. The historical cost of the metal that is expected to be extracted within twelve months is classified as current and the historical cost of metals contained within the broken ore that will be extracted beyond twelve months is classified as non-current. Inventories of ore on leach pad are valued based on actual production costs incurred to produce and place ore on the leach pad, adjusted for effects on monthly production of costs of abnormal production levels, less costs allocated to minerals recovered through the leach process.F-11
The estimate of both the ultimate recovery expected over time and the quantity of metal that may be extracted relative to the time the leach process occurs requires the use of estimates which are inherently inaccurate since they rely upon laboratory testwork. Testwork consists of 60 day leach columns from which the Company projects metal recoveries up to five years in the future. The quantities of metal contained in the ore are based upon actual weights and assay analysis. The rate at which the leach process extracts gold and silver from the crushed ore is based upon laboratory column tests and actual experience occurring over approximately nineteen years of leach pad operations at the Rochester Mine. The assumptions used by the Company to measure metal content during each stage of the inventory conversion process includes estimated recovery rates based on laboratory testing and assaying. The Company periodically reviews its estimates compared to actual experience and revises its estimates when appropriate. The length of time necessary to achieve ultimate recoveries for silver and gold is currently estimated between 5 and 10 years.F-12
In August 2007, the Company terminated mining and crushing operations at the Rochester mine as ore reserves were fully mined. Residual heap leach activities are expected to continue through 2011.
Metal and Other Inventory: Inventories include concentrate ore, dorè, ore in stockpiles and operating materials and supplies. The classification of inventory is determined by the stage at which the ore is in the production process. Inventories of ore in stock piles are sampled for gold and silver content and are valued based on the lower of actual costs incurred or estimated net realizable value based upon the period ending prices of gold and silver. Material that does not contain a minimum quantity of gold and silver to cover estimated processing expense to recover the contained gold and silver is not classified as inventory and is assigned no value. All inventories are stated at the lower of cost or market, with cost being determined using a weighted average cost method. Concentrate and dorè inventory includes product at the mine site and product held by refineries and are also valued at lower of cost or market value. Metal inventory costs include direct labor, materials, depreciation, depletion and amortization as well as administrative overhead costs relating to mining activities. Property, Plant, and Equipment: Expenditures for new facilities, capital leases, new assets or expenditures that extend the useful lives of existing facilities are capitalized and depreciated using the straight-line method at rates sufficient to depreciate such costs over the shorter of estimated productive lives of such facilities or the useful life of the individual assets. Productive lives range from 7 to 31 years for buildings and improvements, 3 to 13 years for machinery and equipment and 3 to 7 years for furniture and fixtures. Certain mining equipment is depreciated using the units-of-production method based upon estimated total proven and probable reserves. Maintenance and repairs are expensed as incurred. Operational Mining Properties and Mine Development: Costs incurred to develop new properties are capitalized as incurred, where it has been determined that the property can be economically developed. At the Company’s surface mines, these costs include costs to further delineate the ore body. At the Company’s underground mines, these costs include the cost of building access ways, shaft sinking and access, lateral development, drift development, ramps and infrastructure development. All such costs are amortized using the units of production method over the estimated life of the ore body based on recoverable ounces to be mined from proven and probable reserves. Interest expense allocable to the cost of developing mining properties and to construct new facilities is capitalized until assets are ready for their intended use. Gains or losses from sales or retirements of assets are included in other income or expense. Costs incurred during the start-up phase of a mine are expensed as incurred. Ongoing mining expenditures on producing properties are charged against earnings as incurred. Major development expenditures incurred to increase production or extend the life of the mine are capitalized. Mineral exploration costs are expensed as incurred. Mineral Interests: Significant payments related to the acquisition of the land and mineral rights are capitalized as incurred. Prior to acquiring such land or mineral rights, the Company generally makes a preliminary evaluation to determine that the property has significant potential to develop an economic ore body. The time between initial acquisition and full evaluation of a property’s potential is variable and is determined by many factors including: location relative to existing infrastructure, the property’s stage of development, geological controls and metal prices. If a mineableminable ore body is discovered, such costs are amortized when production begins using the units-of-production method based on recoverable ounces to be mined from proven and probable reserves. If no mineableminable ore body is discovered, such costs are expensed in the period in which it is determined the property has no future economic value.F-12
Asset Impairment: The Company follows Statement of Financial Accounting Standard (“SFAS”) No. 144, “Accounting for the Impairment or Disposal of Long-Lived Assets,” to evaluate the recoverability of its assets. Management reviews and evaluates its long-lived assets for impairment when events and changes in circumstances indicate that the related carrying amounts of its assets may not be recoverable. Impairment is considered to exist if total estimated future cash flows or probability-weighted cash flows on an undiscounted basis, are less than the carrying amount of the assets, including property plant and equipment, mineral property, development property, and any deferred costs such as deferred stripping. An impairment loss is measured and recorded based on the difference between book value and discounted estimated future cash flows or the application of an expected present value technique to estimate fair value in the absence of a market price. Future cash flows include estimates of recoverable ounces, gold and silver prices (considering current and historical prices, price trends and related factors), production levels and capital, all based on life-of-mine plans and projections. Assumptions underlying future cash flow estimates are subject to risks and uncertainties. If the assets are impaired, a calculation of fair value is performed and if the fair value is lower than the carrying value of the assets, the assets are reduced to their fair market value. Any differences between significant assumptions and market conditions and/or the Company’s operating performance could have a material effect on the Company’s determination of ore reserves, or its ability to recover the carrying amounts of its long-lived assets resulting in impairment charges. In estimating future cash flows, assets are grouped at the lowest level for which there are identifiable cash flows that are largely independent of cash flows from other asset groups. Generally, in estimating future cash flows, all assets are grouped at a particular mine for which there is identifiable cash flow.F-13
Restricted Cash and Cash Equivalents: The Company, under the terms of its lease, self insurance, and bonding agreements with certain banks, lending institutions and regulatory agencies, is required to collateralize certain portions of the Company’s obligations. The Company has collateralized these obligations by assigning certificates of deposit that have maturity dates ranging from three months to a year, to the respective institutions or agency. At December 31, 20062007 and December 31, 2005,2006, the Company held certificates of deposit and cash under these agreements of $19.5$25.8 million and $16.9$23.5 million, respectively, restricted for this purpose. The ultimate timing for the release of the collateralized amounts is dependent on the timing and closure of each mine. In order to release the collateral, the Company must seek approval from certain government agencies responsible for monitoring the mine closure status. Collateral could also be released to the extent the Company was able to secure alternative financial assurance satisfactory to the regulatory agencies. The Company believes there is a reasonable probability that the collateral will remain in place beyond a twelve-month period and has therefore classified these investments as long-term. Deferred Stripping Costs: Effective January 1, 2006, the Company adopted Emerging Issues Task Force (“EITF”) Issue No. 04-06, “Accounting for Stripping Costs Incurred during Production in the Mining Industry.” EITF Issue No. 04-06 addresses the accounting for stripping costs incurred during the production phase of a mine and refers to these costs as variable production costs that should be included as a component of inventory to be recognized in costs applicable to sales in the same period as the revenue from the sale of inventory. The consensus requires application through recognition of a cumulative effect adjustment to opening retained earnings in the period of adoption, with no charge to current earnings for prior periods. The Company recorded a charge of approximately $0.4 million to retained earnings at January 1, 2006 to write off previously capitalized deferred stripping costs, as the cumulative effect of a change in accounting method.F-13
Reclamation and Remediation Costs: The Company follows SFAS No. 143, “Accounting for Asset Retirement Obligations”, which addresses financial accounting and reporting for obligations associated with the retirement of tangible long-lived assets and the associated asset retirement costs. The standard applies to legal obligations associated with the retirement of long-lived assets that result from the acquisition, construction, development and normal use of the asset. SFAS No. 143 requires that the fair value of a liability for an asset retirement obligation be recognized in the period in which it is incurred if a reasonable estimate of fair value can be made. The fair value of the liability is added to the carrying amount of the associated asset and this additional carrying amount is depreciated over the life of the asset. An accretion cost, representing the increase over time in the present value of the liability, is recorded each period in depreciation, depletion and amortization expense. As reclamation work is performed or liabilities are otherwise settled, the recorded amount of the liability is reduced. Future remediation costs for inactive mines are accrued based on management’s best estimate at the end of each period of the undiscounted costs expected to be incurred at the site. Such cost estimates include, where applicable, ongoing care and maintenance and monitoring costs. Changes in estimates are reflected in earnings in the period an estimate is revised.F-14
Foreign Currency: Substantially all assets and liabilities of foreign subsidiaries are translated at exchange rates in effect at the end of each period. Revenues and expenses are translated at the average exchange rate for the period. Foreign currency transaction gains and losses are included in the determination of net income. Derivative Financial Instruments: The Company accounts for derivative financial instruments in accordance with SFAS No. 133, “Accounting for Derivative Instruments and Hedging Activities,” (as amended by SFAS No. 137) and SFAS No. 138, “Accounting for Certain Derivative Instruments and Certain Hedging Activities.” These Statements require recognition of all derivatives as either assets or liabilities on the balance sheet and measurement of those instruments at fair value. Appropriate accounting for changes in the fair value of derivatives held is dependent on whether the derivative instrument is designated and qualifies as an accounting hedge and on the classification of the hedge transaction. For derivative instruments that are designated and qualify as cash flow hedges, the effective portions of changes in fair value of the derivative are recorded in other comprehensive income, (loss), and are recognized in the Consolidated Statement of Consolidated Operations when the hedged item affects net income (loss) for the period. Ineffective portions of changes in the fair value of cash flow hedges are recognized currently in earnings. Refer to Note NO – Derivative Financial Instruments and Fair Value of Financial Instruments. Stock-based Compensation Plans: Effective January 1, 2006, the Company began recording compensation expense associated with awards of equity instruments in accordance with Statement of Financial Accounting Standards (“SFAS”)SFAS No. 123(R), “Share-Based Payment”. Prior to January 1, 2006, the Company accounted for awards of equity instruments according to the provisions of SFAS No. 123, “Accounting for Stock-Based Compensation,” and related interpretations, and therefore no related compensation expense was recorded for awards granted with no intrinsic value. The Company adopted the modified prospective transition method provided for under SFAS No. 123(R), and, consequently, has not retroactively adjusted results from prior periods. Under this transition method, compensation cost associated with awards of equity instruments recognized during 2006 includes: 1) amortization related to the remaining unvested portion of all awards granted for the fiscal years 1995 to 2005, based on the grant date fair value, estimated in accordance with the original provisions of SFAS No. 123, “Accounting for Stock-Based Compensation”; and 2) amortization related to all equity instrument awards granted subsequent to December 31, 2005, based on the grant-date fair value estimated in accordance with the provisions of SFAS No. 123(R). The compensation costs are included in administrative and general expenses, productions costs and the cost of self-constructed property, plant and equipment as deemed appropriate.F-14
The compensation expense recognized in the Company’s consolidated financial statements for the years ended December 31, 2006, 2005 and 2004 for awards of equity instruments was $2.4 million, $1.2 million and $1.1 million, respectively. As of December 31, 2006, there was $1.8 million of total unrecognized compensation cost (net of estimated forfeitures) related to unvested stock options, restricted stock grants and performance share grants which is expected to be recognized over a weighted-average vesting period of 2.0 years.
The Company continues to estimate the fair value of each stock option award on the date of grant using the Black-Scholes option valuation model. The Company now estimates forfeitures of stock based awards based on historical data and adjusts the forfeiture rate periodically. The adjustment of the forfeiture rate will result in a cumulative adjustment in the period the forfeiture estimate is changed. During the year ended December 31, 2006, the Company recorded an adjustment of $0.1 million to reduce compensation expense for forfeited awards. Income Taxes: The Company computes income taxes in accordance with SFAS No. 109, “Accounting for Income Taxes.” SFAS No. 109 requires an asset and liability approach which results in the recognition of deferred tax liabilities and assets for the expected future tax consequences or benefits of temporary differences between the financial reporting basis and the tax basis of assets and liabilities, as well as operating loss and tax credit carryforwards, using enacted tax rates in effect in the years in which the differences are expected to reverse.F-15
In assessing the realizability of deferred tax assets, management considers whether it is more likely than not that some portion or all of theits deferred tax assets will not be realized. Management considers the scheduled reversal of deferred tax liabilities, projected future taxable income and tax planning strategies in making this assessment. A valuation allowance has been provided for the portion of the Company’s net deferred tax assets for which it is more likely than not that they will not be realized. The Company and its subsidiaries are subject to U.S. federal income tax as well as income tax of multiple state and foreign jurisdictions. The Company has substantially concluded all U.S. federal income tax matters for years through 1999. Federal income tax returns for 2000 through 2006 are subject to examination. The Company’s continuing practice is to recognize interest and/or penalties related to income tax matters in income tax expense. There were no significant accrued interest or penalties at December 31, 2007. Comprehensive Income (Loss):Income: Comprehensive income (loss) includes net income (loss) as well as changes in stockholders’ equity that result from transactions and events other than those with stockholders. Items of comprehensive income (loss) include the following:2006
2005
2004
Net income (loss) $ 88,486 $ 10,551 $ (16,858 ) Unrealized gain (loss) on marketable securities 63 853 (347 ) Change in fair value of cash flow hedges, net of 111 (169 ) (130 ) settlements Minimum pension liabilities 2,219 (237 ) (431 ) Other (2 ) -- --
$ 90,877 $ 10,998 $ (17,766 )
following (in thousands):
2007 2006 2005 Net income $ 43,890 $ 88,486 $ 10,551 Unrealized gain on short-term investments and marketable securities 103 63 853 Change in fair value of cash flow hedges, net of settlements (23 ) 111 (169 ) Minimum pension liabilities — 2,219 (237 ) Foreign currency translation 6 (2 ) — $ 43,976 $ 90,877 $ 10,998
Net Income (Loss) Per Share: The Company follows SFAS No. 128, “Earnings Per Share,” which requires the presentation of basic and diluted earnings per share. Basic earnings per share is computed by dividing net income (loss) available to common shareholders by the weighted average number of common shares outstanding during each period. Diluted earnings per share reflect the potential dilution that could occur if securities or other contracts to issue common stock were exercised or converted into common stock. The effect of potentially dilutive stock options and debentures outstanding in the years ending December 31, 2007, 2006 2005 and 20042005 are as follows:F-15
For the Year Ended
December 31, 2006
For the Year Ended
December 31, 2005
For the Year Ended
December 31, 2004
(In thousands except for EPS) Income
(Numerator)
Shares
(Denominator)
Per-Share
Amount
Income
(Numerator)
Shares
(Denominator)
Per-Share
Amount
Income
(Numerator)
Shares
(Denominator)
Per-Share
Amount
Basic EPS Income (loss) from continuing operations $ 75,419 271,357 $ 0.28 $ 14,746 242,915 $ 0.06 $ (18,036 ) 215,969 $ (0.08 ) Income (loss) from discontinued operations 13,067 271,357 0.05 (4,195 ) 242,915 (0.02 ) 1,178 215,969 --
Net income (loss) $ 88,486 271,357 $ 0.33 $ 10,551 242,915 $ 0.04 $ (16,858 ) 215,969 $ (0.08 ) Effect of Dilutive Securities Equity awards -- 1,041 -- -- 768 -- -- -- -- 1.25% convertible notes 1,117 23,684 -- -- -- -- -- -- -- Diluted EPS Income (loss) from continuing operations $ 76,536 296,082 0.26 $ 14,746 243,683 $ 0.06 $ (18,036 ) 215,969 $ (0.08 ) Income (loss) from discontinued operations 13,067 296,082 0.04 (4,195 ) 243,683 (0.02 ) 1,178 215,969 --
Net income (loss) $ 89,603 296,082 $ 0.30 $ 10,551 243,683 $ 0.04 $ (16,858 ) 215,969 $ (0.08 )
The following potentially dilutive shares have been excluded from earnings per share calculation as their effect is antidilutive:
December 31, 2006
December 31, 2005
December 31, 2004
Stock options -- -- 1,796,908 1.25% Notes Convertible at $7.06 per share -- 23,684,211 23,684,211
Total potentially dilutive shares -- 23,684,211 25,481,119
F-16
Year Ended Year Ended Year Ended December 31, 2007 December 31, 2006 December 31, 2005 Income Shares Per-Share Income Shares Per-Share Income Shares Per-Share (In thousands except for EPS) (Numerator) (Denominator) Amount (Numerator) (Denominator) Amount (Numerator) (Denominator) Amount Basic EPS Income from continuing operations $ 43,890 285,972 $ 0.15 $ 75,419 271,357 $ 0.28 $ 14,746 242,915 $ 0.06 Income from discontinued operations — 285,972 — 13,067 271,357 0.05 (4,195 ) 242,915 (0.02 ) Net income $ 43,890 285,972 $ 0.15 $ 88,486 271,357 $ 0.33 $ 10,551 242,915 $ 0.04 Effect of Dilutive Securities Equity awards — 868 — 1,041 — 768 1.25% convertible notes 297 23,684 1,117 23,684 — — Diluted EPS Income from continuing operations $ 44,187 310,524 0.14 $ 76,536 296,082 0.26 $ 14,746 243,683 $ 0.06 Income (loss) from discontinued operations — — 13,067 296,082 0.04 (4,195 ) 243,683 (0.02 ) Net income $ 44,187 310,524 $ 0.14 $ 89,603 296,082 $ 0.30 $ 10,551 243,683 $ 0.04
For the years ended 2007, 2006 2005 and 2004,2005, options to purchase 531,112, 322,653 876,192 and -0-876,192 shares of common stock at prices between $4.81 to $8.94, $6.66 to $15.15$15.19 and $3.92 to $17.94, respectively, were not included in the computation of diluted EPS because the exercise price of options was greater than the average market price of the common shares. The options, which expire between 20072008 to 2016,2017, are outstanding at December 31, 2006.2007. Potentially diluting shares totaling 23,684,211 shares attributed to the 1.25% convertible notes have been excluded from the earnings per share calculation for the year ended December 31, 2005 as their effect was anti-dilutive.
Debt Issuance Costs: Costs associated with the issuance of debt are included in other noncurrent assets and are amortized over the term of the related debt. Use of Estimates: The preparation of the Company’s consolidated financial statements in conformity with U.S. generally accepted accounting principles generally accepted in the United States of America(“GAAP”) requires management to make estimates and assumptions that affect the amounts reported in their consolidated financial statements and accompanying notes. The areas requiring the use of management’s estimates and assumptions relate to recoverable ounces from proven and probable reserves that are the basis of future cash flow estimates and units-of-production depreciation and amortization calculations; useful lives utilized for depreciation, depletion and amortization of future cash flows for long lived assets; estimates of recoverable gold and silver ounces in ore on leach pad; the amount and timing of reclamation and remediation costs; valuation allowanceallowances for deferred tax assets; and post-employment and other employee benefit liabilities. Reclassifications: Certain reclassifications of prior year balances have been made to conform to the current year presentation. These reclassifications had no impact on the Company’s consolidated financial position, results of operations or cash flows for the periods presented. The most significant reclassifications were to reclassify the balance sheet amounts and the income statement results from historical presentation to assets and liabilities of discontinued operations and toincome (loss) income from discontinued operations in the consolidated statements of operations for all periods presented.the years ended December 31, 2006 and 2005. The consolidated statements of cash flows have been reclassified for discontinued operations for allthe periods presented.ended December 31, 2006 and 2005. In addition, investments in auction rate securities have been reclassified from cash and cash equivalents to short-term investments on the consolidated balance sheet as of December 31, 2005. We also madeand corresponding adjustments were made to the consolidated statements of cash flows for all of the periods presented.ended December 31, 2006 and 2005.
Recent Accounting Pronouncements: In November 2004, FASB issued SFAS No. 151, “Inventory Costs,” which amends the guidance in ARB No. 43, Chapter 4, “Inventory Pricing,” to clarify the accounting for abnormal amounts of idle facility expense, freight, handling costs, and wasted material (spoilage). This Statement now requires that these items be recognized as current-period expenses regardless of whether they meet the criterion of “so abnormal” as previously stated in ARB No. 43, Chapter 5, “Intangible Assets”. In addition, this Statement requires that the allocation of fixed production overhead to costs of conversion be based on the normal capacity of the production facility. SFAS No. 151 is effective for inventory costs incurred during fiscal years beginning after June 15, 2005. The Company has performed a review of the provisions of the Statement and has determined that its current accounting practice is to recognize the costs attibuted to idle facilities as a current-period expense and, therefore adoption in 2006 did not impact the Company’s financial statements. In December 2004,February 2007, the FASB issued Statement No. 159, “The Fair Value Option for Financial Assets and Financial Liabilities” (“SFAS No. 123(R), “Share-Based Payments”, which revised159”). SFAS No. 123, “Accounting for Stock-Based Compensation”159 permits entities to choose to measure many financial instruments and superseded Accounting Principles Board (“APB”) Opinion 25, “Accounting for Stock Issued to Employees” and its related implementation guidance. SFAS No. 123(R) requires measurement and recording in the financial statements of the costs of employee services received in exchange for an award of equity instruments based on the grant-datecertain other items at fair value, with the objective of the award, recognized over the period during which an employee is requiredimproving financial reporting by mitigating volatility in reported earnings caused by measuring related assets and liabilities differently without having to provide services in exchange for such award.apply complex hedge accounting provisions. The Company adopted the provisions of SFAS No. 123(R) on January 1, 2006, using the modified prospective method. Accordingly, compensation expense was recognized for all newly granted awards and awards modified, repurchased, or cancelled after January 1, 2006. Compensation cost for the unvested portion of awards that were outstanding, as of January 1, 2006, is recognized ratably over the remaining vesting period. The compensation cost for the unvested portion of awards is based on the fair value at date of grant, adjusted for forfeitures, as determined pursuant to SFAS No. 123. The actual effect on net income and earnings per share in future periods will vary depending upon the number and fair value of options granted in future years compared to prior years. The adoption resulted in a charge to the Company’s statement of operations of $1.4 million in 2006 and did not impact the Company’s cash flow.
F-17
In March 2005, the Financial Accounting Standards Board (“FASB”) ratified Emerging Issues Task Force (“EITF#148;) Issue No. 04-06, “Accounting for Stripping Costs Incurred during Production in the Mining Industry.#148; EITF Issue No. 04-06 addresses the accounting for stripping costs incurred during the production phase of a mine and refers to these costs as variable production costs that should be included as a component of inventory to be recognized in costs applicable to sales in the same period as the revenue from the sale of inventory. The guidance in EITF Issue No. 04-06 was159 are effective for the Company in 2006. The guidance requires application through recognition of a cumulative effect adjustment to opening retained earnings in the period of adoption.Company’s fiscal year ending December 31, 2008. The Company adoptedis currently evaluating the impact that the adoption of this pronouncement as of January 1, 2006 and recorded a charge of approximately $0.4 million to write off deferred stripping costs, asstatement will have on the cumulative effect of a change in accounting method.
In May 2005, the FASB issued SFAS No. 154, “Accounting Changes and Error Corrections.” SFAS No. 154 established new standards on accounting for changes in accounting principles. SFAS No. 154 requires all such changes to be accounted for by retrospective application to the financial statements of prior periods unless prescribed otherwise or it is impracticable to do so. SFAS No. 154 is effective for accounting changes and error corrections made in fiscal years beginning after December 15, 2005. Adoption of SFAS No. 154 did not have a material impact on ourCompany’s consolidated financial position, results of operations or cash flows.and disclosures.
F-16
In September 2006, the FASB issued Statement No. 157 “Fair Value Measurements” (SFAS 157). SFAS 157 defines fair value, establishes a framework for measuring fair value in generally accepted accounting principles, and expands disclosures about fair value measurements. The provisions of SFAS 157 are effective for the Company’s fiscal year ending December 31, 2008. The Company is currently evaluating the impact of the adoption of this statement on the Company’s consolidated financial position, results of operations and disclosures. In June 2006, the FASB issued Interpretation No. 48, “Accounting for Uncertainty in Income Taxes”, (FIN 48)Taxes, an Interpretation of FASB Statement No. 109, “Accounting for Income Taxes”109” (FIN 48). FIN 48 prescribes a recognition threshold and measurement attribute for the financial statement recognition and measurement of tax positions taken or expected to be taken in a tax return. FIN 48 requires that the Company recognize in its financial statements the impact of a tax position, if that tax position is more likely than not of being sustained on audit, based on the technical merits of the position. FIN 48 also provides guidance on derecognition, classification of interest and penalties, accounting in interim periods and disclosure. The provisions of FIN 48 arewere effective beginning January 1, 2007, with the cumulative effect of the change in accounting principle recorded as an adjustment to the opening balance of retained earnings. Currently, the2007. The adoption of FIN 48 isdid not expected to have a material effect on the Company’s financial position, results of operations or cash flows.F-18
The Company and its subsidiaries are subject to U.S. federal income tax as well as income tax of multiple state and foreign jurisdictions. The Company has substantially concluded all U.S. federal income tax matters for years through 1999. Federal income tax returns for 2000 through 2006 are subject to examination. The Company’s continuing practice is to recognize interest and/or penalties related to income tax matters in income tax expense. There were no significant accrued interest or penalties at December 31, 2007.NOTE C — SHORT-TERM INVESTMENTSACQUISITIONS OF BOLNISI AND MARKETABLE SECURITIES ThePALMAREJO
On December 21, 2007, the Company classifiescompleted its investment securities as available-for-sale securities. Pursuant to SFAS 115, “Accountingacquisition of all the shares of Bolnisi Gold NL (“Bolnisi”) and Palmarejo Gold and Silver Corporation (“Palmarejo”) in exchange for Certain Investmentsa total of approximately 272 million shares of Coeur common stock, a total cash payment of approximately $1.1 million and assumption of liabilities of $0.7 billion. Coeur issued 0.682 shares of Coeur common stock (or, at the election of the Bolnisi shareholder, CHESS Depositary Interests representing Coeur shares) and A$0.004 in Debt and Equity Securities”, such securities are measured at fair market valuecash (or approximately US$1.0 million in the financial statements with unrealized gains or losses recordedaggregate) for each Bolnisi ordinary share, and 2.715 shares of Coeur common stock and C$0.004 in other comprehensive income (loss). Atcash (or approximately US$0.1 million in the time securitiesaggregate) for each Palmarejo common share. The transaction was accounted for as a purchase of assets and not as a business combination since Bolnisi and Palmarejo are sold or otherwise disposed of, gains or losses are includedconsidered to be in net income (loss).the development stage. The total consideration paid for the acquisition was as follows (in thousands): Consideration: Coeur stock issued (271,969,428 shares at $4.04) $ 1,098,757 Cash payments 1,102 Transaction advisory fees and other costs 16,621 Total purchase price 1,116,480 Current liabilities 54,946 Other long-term liabilities 23,642 Deferred income taxes 572,711 Total liabilities assumed 651,299 $ 1,767,779
F-17
The following is a summarysummarizes the estimated fair values of available-for-sale securities:Available-For-Sale Securities
Cost
Gross
Unrealized
Losses
Gross
Unrealized
Gains
Estimated
Fair
Value
As of December 31, 2006 U.S. Corporate $ 65,372 $ -- $ -- $ 65,372 U.S. Government 5,000 -- 1 5,001
Total debt securities 70,372 -- 1 70,373 Equity securities 99 1 622 720
70,471 1 623 71,093
As of December 31, 2005 Auction Rate Securities $ 159,720 $ -- $ -- $ 159,720 U.S. Corporate 23,893 51 -- 23,842 U.S. Government 1,891 7 -- 1,884
Total debt securities 185,504 58 -- 185,446 Equity securities 19 4 615 630
$ 185,523 $ 62 $ 615 $ 186,076
As of December 31, 2004 Auction Rate Securities $ 207,850 $ -- $ -- $ 207,850 U.S. Corporate 18,964 107 1 18,858 U.S. Government 29,062 205 -- 28,857 State/Municipal 1,285 7 -- 1,278
Total debt securities 257,161 319 1 256,843 Equity securities 20 3 17 34
$ 257,181 $ 322 $ 18 $ 256,877
Gross realized gains and losses are basedthe assets acquired on a carrying value (cost, net of discount or premium) of short-term investments sold or adjusted for other than temporary decline in market value. Short-term investments mature at various dates. There were no realized gains and/or losses for the years ended 2006, 2005 and 2004.
Prior to December 31, 2006, the Company concluded that it was appropriate to classify its investments in auction rate securities as short-term investments. Previously such investments had been classified as cash and cash equivalents. Accordingly, the Company revised the classification to report these investments as short-term investments on the consolidated balance sheets as of December 31, 2005 and December 31, 2004. The Company also made corresponding adjustments to the consolidated statements of cash flows for the periods ended December 31, 2005 and December 31, 2004 to reflect the gross purchases and sales of these investments as investing activities rather than as a component of cash and cash equivalents. As of December 31, 2005 and December 31, 2004, $159.7 million and $207.9 million respectively, of these investments were reclassified from cash and cash equivalents to short-term investment on the consolidated Balance Sheet. This reclassification had no effect on the total current assets, stockholders’ equity, net income (loss), net income (loss) per share or cash provided by (used in) operating activities.
F-19
21, 2007 (in thousands):
Fair value of assets acquired: Cash $ 3,996 Other current assets 3,789 Property, plant and equipment 97,519 Mineral interests 1,657,189 Other assets 5,286 Total assets acquired $ 1,767,779
NOTE D –— DISCONTINUED OPERATIONS AND ASSETS AND LIABILITIES HELD FOR SALE During the first quarter of 2006, the Company committed to a plan to sell Coeur Silver Valley Inc. (“CSV”), a wholly owned subsidiary of Coeur d’Alene Mines Corporation, that ownsowned and operatesoperated the Galena underground silver mine and adjoining properties in Northern Idaho. On April 10, 2006, the Company announced that it had entered into an agreement to sell 100% of the shares of CSV to U.S. Silver Corporation for $15 million in cash. On June 1, 2006, the Company completed the sale of 100% of CSV to U.S. Silver Corporation for a total of $15 million in cash plus a post-closing working capital adjustment of $1.1 million. The Company recorded, within discontinued operations, a gain of approximately $11.1 million in the year ended December 31, 2006. Pursuant to SFAS No. 144, “Accounting for the Impairment or Disposal of Long-Lived Assets,” CSV was classified as held for sale and the results of its operations reported in discontinued operations for all prior periods.beginning in the period ended June 30, 2006.
The following table details selected financial information included in the income (loss) from discontinued operations in the consolidated statements of operations for the years ended December 31, 2006 2005 and 20042005 (in thousands): Years ended December 31, 2006 2005 Sales of metal $ 11,223 $ 16,052 Production costs applicable to sales (8,233 ) (16,698 ) Depreciation and depletion (681 ) (1,996 ) Mining exploration (279 ) (1,361 ) Other (95 ) (192 ) Income (loss) from discontinued operations 1,935 (4,195 ) Gain on sale of net assets of discontinued operations 11,132 — Net income (loss) from discontinued operations $ 13,067 $ (4,195 )
F-18
2006
2005
2004
Sales of metal $ 11,223 $ 16,052 $ 23,759 Production costs applicable to sales (8,233 ) (16,698 ) (18,637 ) Depreciation and depletion (681 ) (1,996 ) (1,967 ) Mining exploration (279 ) (1,361 ) (1,620 ) Other (95 ) (192 ) (357 )
Income (loss) from discontinued operations 1,935 (4,195 ) 1,178 Gain on sale of net assets of discontinued operations 11,132 -- --
Net income (loss) from discontinued operations $ 13,067 $ (4,195 ) $ 1,178
NOTE E — INVESTMENTS AND OTHER MARKETABLE SECURITIES The major classes of assetsCompany classifies its investment securities as available-for-sale securities. Pursuant to SFAS 115, “Accounting for Certain Investments in Debt and liabilities of discontinued operations held for saleEquity Securities”, such securities are measured at fair market value in the consolidated balance sheet asfinancial statements with unrealized gains or losses recorded in other comprehensive income. At the time securities are sold or otherwise disposed of, gains or losses are included in net income. The following is a summary of available-for-sale securities (in thousands): Available-For-Sale Securities Gross Gross Estimated Unrealized Unrealized Fair Cost Losses Gains Value As of December 31, 2007 U.S. Corporate $ 2,000 $ — $ — $ 2,000 U.S. Government 51,031 — 8 51,039 Total debt securities 53,031 — 8 53,039 Equity securities 99 — 702 801 $ 53,130 $ — $ 710 $ 53,840 As of December 31, 2006 U.S. Corporate $ 65,372 $ — $ — $ 65,372 U.S. Government 5,000 — 1 5,001 Total debt securities 70,372 — 1 70,373 Equity securities 99 1 622 720 $ 70,471 $ 1 $ 623 $ 71,093
Gross realized gains and losses are based on a carrying value (cost, net of discount or premium) of short-term investments sold or adjusted for other than temporary decline in market value. Short-term investments mature at various dates. There were no realized gains and/or losses in 2007, 2006 and 2005.Asset-Backed Commercial Paper (“ABCP”) The Company acquired certain asset-backed securities in connection with the Bolnisi and Palmarejo acquisition. Palmarejo has investments in non-bank sponsored ABCP (before accounting for an impairment charge), of which $6.3 million is invested in Apsley Trust Class E and $0.5 million in Aurora Trust Class A. Since a certain percentage of the assets supporting the commercial paper was invested in U.S. sub-prime residual mortgage-backed securities, the Company recorded an impairment based on the best available market data for such investments at the date of acquisition. Consequently, the Company recorded these investments at their estimated fair value of $5.3 million for the ABCP held by Palmarejo. The fair value of the ABCP are determined based on the Company’s assessment of market conditions at the date of acquisition, no further impairments were deemed necessary at December 31, 2005 is as follows (in thousands):December 31, 2005
Assets Receivables $ 2,036 Prepaids 906 Inventory 2,561 Property, plant and equipment (net) 2,016 Operational mining properties, net 6,357 Other 952
Total assets of discontinued operations $ 14,828
Liabilities Accounts payable $ 747 Accrued liabilities 166 Accrued payroll and related benefits 578 Reclamation and mine closure 6,905 Defined benefit liabilities 2,588 Other non-current liabilities 1,924
Total liabilities of discontinued operations $ 12,908
F-20
2007. The fair value reported may change materially in subsequent periods.
NOTE EF — METAL AND OTHER INVENTORIES Inventories consist of the following:following (in thousands): December 31, 2007 2006 Concentrate and dorè inventory $ 11,221 $ 9,680 Supplies 7,697 6,661 Metal and other inventory $ 18,918 $ 16,341
F-19
December 31, 2006
2005
Concentrate and doré inventory $ 9,680 $ 7,835 Supplies 6,661 4,972
Metal and other inventory $ 16,341 $ 12,807
NOTE FG — PROPERTY, PLANT AND EQUIPMENT Property, plant and equipment consists of the following:December 31, 2006
2005
Land $ 1,112 $ 1,423 Building improvements 51,818 40,869 Machinery and equipment 77,040 60,470 Capitalized leases for machinery and equipment 2,345 2,345
132,315 105,107 Accumulated depreciation (64,206 ) (57,929 )
$ 68,109 $ 47,178
following (in thousands):
December 31, 2007 2006 Land $ 1,133 $ 1,112 Building improvements 130,795 51,818 Machinery and equipment 153,328 77,040 Capitalized leases for machinery and equipment 37,477 2,345 322,733 132,315 Accumulated depreciation (69,937 ) (64,206 ) $ 252,796 $ 68,109
The Company’s capital expenditures, excluding the acquisitions of Bolnisi and Palmarejo, were as follows:2006
2005
2004
Rochester $ 1,225 $ 1,197 $ 3,548 Cerro Bayo 7,555 2,731 2,451 Martha 2,481 2,108 689 San Bartolome 14,597 10,477 950 Kensington 121,552 44,201 83 Endeavor -- 15,410 -- Broken Hill -- 36,667 -- Other 588 499 642
Net asset additions $ 147,998 $ 113,290 $ 8,363
Discontinued Operations - Coeur Silver Valley $ 617 $ 3,537 $ 2,151
follows (in thousands):
Years ended December 31, 2007 2006 2005 Rochester $ 1,647 $ 1,225 $ 1,197 Cerro Bayo 11,330 7,555 2,731 Martha 16,444 2,481 2,108 San Bartolomé 100,169 16,805 11,089 Kensington 92,337 122,640 53,155 Endeavor 2,112 — 15,410 Broken Hill 213 — 36,667 Other 1,942 588 499 Net asset additions $ 226,194 $ 151,294 $ 122,856 Discontinued Operations — Coeur Silver Valley $ — $ 617 $ 3,537
At December 31, 2007, 2006 and 2005, and 2004, approximately $22.1 million, $12.9 million $9.6 million and $0,$9.6, respectively, of invoices for capital expenditures remained in accounts payable and for purposes of the consolidated cash flows were treated as non-cash transactions. In connection with the acquisition of Bolnisi and Palmarejo, the Company assumed certain liabilities related to capital leases. In December 2006, Bolnisi, through its Canadian subsidiary Palmarejo, entered into a 2-year lease agreement for a power station. Under the terms of the agreement, including an amendment in January 2007, the Company will pay a fixed monthly amount of $0.3 million, including interest calculated at the rate of LIBOR plus 2.5%, starting at the date that the construction of the equipment is completed. The Company has the option at the end of the agreement to purchase the equipment by paying a nominal amount. In June 2007, Palmarejo entered into a 5-year lease agreement for $30.6 million of mining equipment to be delivered to Palmarejo as the equipment becomes available from the supplier. Mining equipment with a cost of $30.1 million has been delivered as of December 31, 2007. The Company will pay a monthly amount varying between $0.6 million and $0.8 million during the 2008 period and a fixed monthly amount of $0.6 million thereafter, including interest calculated at the rate of LIBOR plus 3.65%. The Company has the option at the end of the agreement to purchase the equipment by paying a nominal amount.F-20
F-21
Minimum future lease payments under both capital and operating leases at December 31, 20062007 are as follows:Year Ending December 31, Capital
Leases
Operating
Leases
2007 $ 916 $ 380 2008 -- -- 2009 -- -- 2010 -- -- Thereafter -- --
916 $ 380
Less: Amount representing interest 22
$ 894
follows (in thousands):
Capital Year Ending December 31, Leases 2008 11,554 2009 8,976 2010 6,755 2011 6,755 Thereafter 5,156 Total minimum payments due 39,196 Less: Amount representing interest 6,432 Present value of net minimum lease payments 32,764 Less: Current maturities 9,103 $ 23,661
The Company has entered into various operating lease agreements which expire over the next year. Total rent expense charged to net income (loss) under these agreements was $1.7 million, $2.6 million and $3.5 million for 2007, 2006, and $4.2 million for 2006, 2005, 2004, respectively.NOTE GH — MINING PROPERTIESDecember 31, 2006
2005
Capitalized costs for mining properties, net of accumulated depletion consist of the following(A): Operational mining properties: Rochester Mine $ 4,445 $ 8,582 Cerro Bayo Mine 8,531 6,660 Martha Mine 1,110 713
Total operational mining properties 14,086 15,955
Mineral interests, net of accumulated depletion Endeavor Mine 14,508 14,998 Broken Hill Mine 29,740 34,860 San Bartolome(B) 20,125 20,125
Total mineral interests 64,373 69,983
Non-producing and developmental properties: Kensington(C) 170,458 62,517 San Bartolome(D) 20,388 9,829 Other 142 142
Total non-producing and developmental properties 190,988 72,488
Total mining properties $ 269,447 $ 158,426
December 31, 2007 2006 Capitalized costs for mining properties, net of accumulated depletion consist of the following (in thousands):(A) Operational mining properties: Rochester Mine $ — $ 4,445 Cerro Bayo Mine 17,091 8,531 Martha Mine 1,832 1,110 Total operational mining properties 18,923 14,086 Mineral interests, net of accumulated depletion Endeavor Mine 15,865 14,508 Broken Hill Mine 26,897 29,740 San Bartolomé(B) 20,125 20,125 Palmarejo(C) 1,657,189 — Total mineral interests 1,720,076 64,373 Non-producing and developmental properties: Kensington(D) 256,443 170,458 San Bartolomé(E) 54,884 20,388 Other 142 142 Total non-producing and developmental properties 311,469 190,988 Total mining properties $ 2,050,468 $ 269,447
(A) On June 1, 2006, the Company completed the sale of 100% of the shares of its wholly-owned subsidiary, Coeur Silver Valley Inc., to US Silver Corporation for $15 million in cash and additional consideration received of $1.1 million for working capital.
(B) Balance represents acquisition cost of mineral interest.
(C) On December 31, 2007, the Company completed its acquisition of all of the shares of Bolnisi and Palmarejo in exchange for a total of approximately 272 million shares of Coeur common stock and a total cash payment of approximately $1.1 million.The total consideration paid was $1.1 billion and assumed liabilities were $0.7 billion. (D) During the third quarter of 2005, the Company commenced construction activities at its Kensington property. The costs incurred subsequent to commencing construction were capitalized as developmental properties.
F-21
(D)(E)During the fourth quarter of 2004, the Company commenced construction activities at its San BartolomeBartolomé property. The costs incurred subsequent to commencing construction were capitalized as developmental properties.
F-22
Operational Mining Properties Rochester Mine: The Company has conducted operations at the Rochester Mine, located in Western Nevada, since September 1986. The mine utilizes the heap-leaching process to extract both silver and gold from ore mined using open pit methods. Rochester’s primary product is silver with gold produced as a by-product. Cerro Bayo Mine: The Cerro Bayo Mine is a gold and silver underground mine located in southern Chile. Commercial production commenced on April 18, 2002. Martha Mine: The Martha Mine is an underground silver mine located in Argentina, approximately 270 miles southeast of Coeur’s Cerro Bayo mine. Coeur acquired a 100% interest in the Martha mine in April 2002. In July 2002, Coeur commenced shipment of ore from the Martha mine to the Cerro Bayo facility for processing. In December 2007, the Company completed a 240 tonne per day flotation mill which produces a flotation concentrate.
Mineral Interests Endeavor Mine: On May 23, 2005, the Company acquired all of the silver production and reserves, up to a maximum 17.7 million payable ounces, contained at the Endeavor Mine in Australia, which is owned and operated by Cobar Operations Pty. Limited (“Cobar”), a wholly-owned subsidiary of CBH Resources Ltd. (“CBH”), for $39.1$43.8 million. The Company is entitled to all of the silver production and reserves up to a maximum of 17.7 million payable ounces. The Endeavor Mine is located 720 km northwest of Sydney in New South Wales and has been in production since 1983. Under the terms of the original agreement, CDE Australia, a wholly-owned subsidiary of Coeur, paid Cobar $15.1$15.4 million of cash at the closing. In addition, CDE Australia, subject to certain conditions, will pay Cobar approximately $23.7$26.3 million upon the receipt of a report confirming that the reserves at the Endeavor mine are equal to or greater than the reported ore reserves for 2004. Payment couldwill occur in 2007.2008. In addition to these upfront payments, pursuant to the original agreement, Coeur pays Cobar an operating cost contribution of $1.00 for each ounce of payable silver plus a further increment which was to begin when the silver price exceeds $5.23 per ounce. This further increment was to begin on the second anniversary of the agreement and would have been 50% of the amount by which the silver price exceeds $5.23 per ounce. A cost contribution of $0.25 per ounce is also payable by Coeur in respect of new ounces of proven and probable silver reserves as they are discovered. The Company has paid a cost contribution of approximately $2.1 million during 2007.
On March 28, 2006, CDE Australia Pty, Ltd. (CDE Australia), reached an agreement with CBH Resources Ltd. to modify the terms of the original silver purchase agreement. Under the modified terms, CDE Australia owns all silver production and reserves up to a total of 20.0 million payable ounces, up from 17.7 million payable ounces in the original agreement. Based on the most recent ore reserve report, the current ore reserve contains approximately 15.314.4 million payable ounces. To date, the Company has received 0.71.4 million payable ounces based on current metallurgical recovery and current smelter contract terms. Expansion of the ore reserve will be required to achieve the maximum payable ounces of silver production as set forth in the modified contract. The silver price-sharing provision is deferred until such time as Coeur has received approximately 2 million cumulative ounces of silver from the mine or June 2007, whichever is later. In addition, the silver price-sharing threshold increased to US$7.00 per ounce, from the previous level of US$5.23 per ounce.F-22
Broken Hill Mine:On September 8, 2005, the Company acquired all of the silver production and reserves, up to a maximum of 17.2 million payable ounces, contained at the Broken Hill mine in Australia, which is owned and operated by Perilya Broken Hill Ltd. (“PBH”) for $36.7$36.9 million. The Broken Hill Mine is located in New South Wales, Australia and is a zinc/lead/silver ore body. Pursuant to the Agreement, the transaction includes up to a maximum of approximately 24.5 million contained ounces (or 17.2 million payable ounces) of silver to be mined by PBH at Broken Hill on the Company’s behalf. In addition, CDE Australia will pay PBH an operating cost contribution of approximately US$2.00 for each ounce of payable silver under the terms of the Agreement and PBH may earn up to US$6.0 million of additional consideration by meeting certain silver production thresholds through 2014. No additional payments were made during 2007, 2006 or 2005.F-23
Non-Producing and Development Properties San Bartolome Project:Bartolomé: On September 9, 1999, the Company acquired EmpressaEmpresa Minera Manquiri (“Manquiri”). Manquiri’s principal asset is the San BartolomeBartolomé project, a silver exploration and development property located near the city of Potosi,Potosí, Bolivia. The San BartolomeBartolomé project consists of silver-bearing gravel deposits which lend themselves to simple surface mining methods. The mineral rights for the San BartolomeBartolomé project are held through long-term joint venture/lease agreements with several local independent mining co-operatives and the Bolivian State owned mining company, (“COMIBOL”). Production from San BartolomeBartolomé is subject to a royalty of 4% payable to the co-operatives and COMIBOL. During 2004, the Company completed an updated feasibility study, obtained all required permits and commenced construction of the San BartolomeBartolomé mine. The Company estimates the cost of constructiontotal capital costs (excluding political risk insurance premiums and capitalized interest) of theat San BartolomeBartolomé mine to be approximately $174 million.$220 million of which $129.2 million had been incurred as of December 31, 2007. During 2006,2007, the Company capitalized $14.6$100.2 million in connection with construction activities at San Bartolome.Bartolomé.
Kensington Project:Kensington: Kensington is a gold property located near Juneau, Alaska. The mine will be an underground gold mine accessed by a horizontal tunnel and will utilize conventional and mechanized underground mining methods. The ore will be processed in a flotation mill that produces a concentrate which will be sold to third party smelters. During 2006,2007, the Company capitalized $121.6$99.0 million in connection with construction activities at Kensington. The company estimatesCompany has expended approximately $269.7 million as of December 31, 2007.Palmarejo: Palmarejo is engaged in the exploration and development of silver and gold properties located in the State of Chihuahua in northern Mexico, and its principal silver and gold properties are collectively referred to as the “Palmarejo project.” The Palmarejo project is currently under development and is expected to commence commercial production in the first half of 2009. The total capital cost of contructionthe project, from the time the Company acquired it on December 21, 2007, is estimated to be approximatly $238approximately $225 million.Discontinued Operations Coeur Silver Valley (Galena) Mine: On June 1, 2006, the Company completed the sale of 100% of the shares of its wholly owned subsidiary Coeur Silver Valley, Inc. to U.S. Silver Corporation for $15 million in cash plus a post-closing working capital adjustment of $1.1 million.NOTE HI — LONG-TERM DEBT11/1 ¼%4% Debentures
The $180.0 million principal amount of 1 ¼%1/4% Debentures due 2024 outstanding at December 31, 20062007 are convertible into shares of common stock at the option of the holder on January 15, 2011, 2014, and 2019, unless previously redeemed, at a conversion price of $7.60 per share, subject to adjustment in certain events.F-23
The Company is required to make semi-annual interest payments on the debentures. The debentures are redeemable at the option of the Company before January 18, 2011, if the closing price of the Company’s common stock over a specified number of trading days has exceeded 150% of the conversion price, and anytime thereafter. Before January 18, 2011, the redemption price is equal to 100% of the principal amount of the notes plus an amount equal to 8.75% of the principal amount of the notes, less the amount of any interest actually paid on the notes on or prior to the redemption date. The debentures have no other funding requirements until their maturity on January 15, 2024.F-24
The fair value of the debentures is determined by market transactions on or near December 31, 20062007 and 2005,2006, respectively. The fair value of the debentures, as of December 31, 2007 and 2006, was $156.6 million and 2005, was $163.8 million, and $146.7 million, respectively. Total interest expense on debentures and notes for the year ended December 31, 2007, 2006, and 2005 and 2004 was $2.3 million, of which $2.3 million was capitalized as a cost of certain properties under development in 2007; $2.3 million, of which $1.4 million was capitalized as a cost of certain properties under development in 2006,2006; and $2.3 million, of which $0.2 million was capitalized as a cost of certain properties under development in 2005, and $2.9 million, of which $0.1 million was capitalized as a cost of certain properties under development in 2004, respectively. Interest paid was $2.3 million in 2006,2007, $2.3 million in 2005,2006, and $1.6$2.3 million in 2004.2005.
Bridging Debt Facility On October 22, 2007, Bolnisi entered into a $20 million credit facility with Macquarie Bank Limited to fund further exploration and development of the Palmarejo silver/gold project, surrounding exploration areas and for working capital purposes. The credit facility was extended to June 30, 2008 and bears interest at a variable rate (LIBOR) plus a margin of 2.45%. As of December 31, 2007, the Company has $20 million outstanding under the credit facility bearing an interest rate of 7.35%. Events of default under the credit facility include customary provisions for similar types of facilities.Bank Loan On August 30, 2007 (with amendment dated October 9, 2007), Palmarejo entered into a temporary credit facility of $2.0 million secured by the Company’s investments in Asset Backed Commercial Paper, to fund working capital requirements. The credit facility has been extended through May 31, 2008. As of December 31, 2007, an amount of $1.7 million has been drawn on the facility, which bears interest at prime less 1.50% and matures on May 31, 2008. The Company is required to reduce the amount of the outstanding credit facility with any proceeds received from the sale of the Asset Backed Commercial Paper.NOTE IJ — RECLAMATION AND REMEDIATION COSTS Reclamation and remediation costs are based principally on legal and regulatory requirements. Management estimates costs associated with reclamation of mining properties as well as remediation costs for inactive properties. The Company uses assumptions about future costs, mineral prices, mineral processing recovery rates, production levels and capital and reclamation costs. Such assumptions are based on the Company’s current mining plan and the best available information for making such estimates. On an ongoing basis, management evaluates its estimates and assumptions; however, actual amounts could differ from those based on such estimates and assumptions. The Asset Retirement Obligationasset retirement obligation is measured using the following factors: 1) Expected labor costs, 2) Allocated overhead and equipment charges, 3) Contractor markup, 4) Inflation adjustment, and 5) Market risk premium. The sum of all these costs is discounted, using the Company’s credit adjusted risk-free interest rate from the time we expect to pay the retirement obligation to the time we incur the obligation. The measurement objective is to determine the amount a third party would demand to assume the asset retirement obligation.F-24
Upon initial recognition of a liability for an asset retirement obligation, the Company capitalized the asset retirement cost as an increase in the carrying amount of the related long-lived asset. The Company depletes this amount using the units-of-production method. The Company is not required to re-measure the obligation at fair value each period, but the Company is required to evaluate the cash flow estimates at the end of each reporting period to determine whether the estimates continue to be appropriate. Upward revisions in the amount of undiscounted cash flows are discounted using a current credit-adjusted risk-free rate. Downward revisions are discounted using the credit-adjusted risk-free rate that existed when the original liability was recorded.recorded, or, if not readily determinable, at the weighted average discount rate used to record the liability.
At December 31, 2007 and 2006, $33.1 million and 2005, $29.9 million, and $23.5 million, respectively, werewas accrued for reclamation obligations related to currently producing and developmental mineral properties. In addition, the Company has accrued $1.8$1.7 million and $1.2$1.8 million, respectively, for reclamation obligations associated with former mining activities. These amounts are also included in reclamation and mine closure liabilities. In the fourth quarter of 2007, the Company reviewed its cash flow estimates for its asset retirement obligations. This resulted in a net increase to the asset retirement obligation of $3.4 million and a corresponding increase to the carrying amount of the asset to be retired. For the purpose of consolidated statement of cash flows, these amounts are non-cash transactions. The increase was due to additional reclamation required at the Company’s Cerro Bayo mine, Kensington project and San Bartolomé project. The increase was discounted using the Company’s current weighted average credit adjusted risk-free rate of 9.34%. In the fourth quarter of 2006, the Company reviewed its cash flow estimates for its asset retirement obligations. This resulted in a net increase to the asset retirement obligation of $6.1 million and a corresponding increase to the carrying amount of the asset to be retired. For the purpose of consolidated statement of cash flows, these amounts are non-cash transactions. The increase was due to additional reclamation required at the Company’s Rochester mine, Kensington and San Bartolome projects. The increase was discounted using the Company’s current weighted average credit adjusted risk-free rate of 7.6%. In the fourth quarter of 2005, the Company reviewed its cash flow estimates for its asset retirement obligations. This resulted in a net increase to the asset retirement obligation of $6.4 million and a corresponding increase to the carrying amount of the asset to be retired. For the purpose of consolidated statement of cash flows, these amounts are non-cash transactions. The increase was due to additional reclamation required as a result of the expansion of the Company’s Cerro Bayo mine and adjustments to future estimated costs at the Company’s Rochester mine, Kensington project and San BartolomeBartolomé project. The increase was discounted using the Company’s current weighted average credit adjusted risk-free rate of 7.79%7.6%.
F-25
The following is a description of the changes to the Company’s asset retirement obligations for the years ended December 31, 2007 and 2006 and 2005:(in thousands): Years Ended December 31, 2007 2006 Asset retirement obligation — January 1 $ 29,909 $ 23,524 Accretion 2,260 1,780 Additions 3,390 6,069 Changes in estimates (1,202 ) (507 ) Settlements (1,222 ) (957 ) Asset retirement obligation — December 31 $ 33,135 $ 29,909
F-25
Year Ended December 31, 2006
2005
(in thousands) Asset retirement obligation - January 1 $ 23,524 $ 16,921 Accretion 1,780 1,265 Additions 6,069 6,397 Changes in estimates (507 ) (74 ) Settlements (957 ) (985 )
Asset retirement obligation - December 31 $ 29,909 $ 23,524
NOTE JK — INCOME TAXESIncome (loss)
The components of income from continuing operations before income taxes iswere as follows:Year Ended December 31, 2006
2005
2004
(in thousands) United States $ 33,252 $ (5,576 ) $ (22,281 ) Foreign 50,393 21,805 (1,540 )
Total $ 83,645 $ 16,229 $ (23,821 )
follows (in thousands):
Years Ended December 31, 2007 2006 2005 United States $ 21,909 $ 33,252 $ (5,576 ) Foreign 36,908 50,393 21,805 Total $ 58,817 $ 83,645 $ 16,229
The components of the consolidated income tax (provision) benefitprovision from continuing operations were as follows:Years Ended December 31,
2006
2005
2004
Current: United States - Alternative minimum tax $ (900 ) $ 212 $ 1,382 United States - Foreign withholding (713 ) -- -- Foreign - Argentina (4,842 ) (66 ) -- Foreign - Australia (4,673 ) -- -- Deferred: Foreign - Argentina 65 929 -- Foreign - Australia (93 ) (404 ) -- Foreign - Chile 2,930 (2,154 ) 4,403
Income tax benefit (provision) $ (8,226 ) $ (1,483 ) $ 5,785
follows (in thousands):
Years Ended December 31, 2007 2006 2005 Current: United States — Alternative minimum tax $ (381 ) $ (900 ) $ 212 United States — Foreign withholding tax (904 ) (713 ) — Foreign — Argentina (6,590 ) (4,842 ) (66 ) Foreign — Australia (4,898 ) (4,673 ) — Deferred: Foreign — Argentina 172 65 929 Foreign — Australia (664 ) (93 ) (404 ) Foreign — Chile (1,662 ) 2,930 (2,154 ) Income tax provision $ (14,927 ) $ (8,226 ) $ (1,483 )
A reconciliation of the Company’s effective tax rate with the federal statutory tax rate for the periods indicated is as follows:Years Ended December 31 2006
2005
2004
Tax benefit (provision) from continuing operations $ (29,276 ) $ (5,680 ) $ 8,337 State tax benefit (provision) from continuing operations (2,509 ) (487 ) 715 Excess percentage depletion and related deductions 6,199 4,265 3,698 Change in valuation allowances 14,778 (5,555 ) (9,474 ) Effect of foreign earnings 4,744 4,744 1,346 US and foreign non-deductible expenses (1,059 ) 632 610 Foreign currency exchange rates -- 827 -- Other net (1,103 ) (229 ) 553
$ (8,226 ) $ (1,483 ) $ 5,785
Years Ended December 31 2007 2006 2005 Tax provision from continuing operations $ (20,600 ) $ (29,276 ) $ (5,680 ) State tax provision from continuing operations (1,766 ) (2,509 ) (487 ) Percentage depletion and related deductions 4,860 6,199 4,265 Change in valuation allowance 3,896 14,778 (5,555 ) U.S. and Foreign non-deductible expenses (663 ) (711 ) 632 Foreign tax rate differences 2,309 4,744 4,744 Foreign withholding taxes (904 ) (713 ) — Other, net (2,059 ) (738 ) 598 $ (14,927 ) $ (8,226 ) $ (1,483 )
F-26
As of December 31, 20062007 and 2005,2006, the significant components of the Company’s deferred tax assets and liabilities were as follows:Years Ended December 31, 2006
2005
Deferred tax liabilities: Property, plant and equipment , net $ 7,318 $ 7,665 Investments in foreign subsidiaries 9,761 471
17,079 8,136
Deferred tax assets: Mineral properties 62,284 66,664 Net operating loss carryforwards 68,794 88,130 Alternative minimum tax credit 2,479 1,246 carryforwards Investments in foreign subsidiaries 8,129 404 Capital loss carryforwards 12,864 5,672 Other 6,197 3,173
160,747 165,289 Valuation allowance (137,992 ) (154,379 )
22,755 10,910
Net deferred tax assets $ 5,676 $ 2,774
The Company has not had a strong earnings history which would be objective evidence as required by generally accepted accounting principles to recognize its net operating less carryforwards and other deductible temporary differences. It is likely that the alternative minimum tax will exceed the regular tax for the foreseeable future. Accordingly, the Company has recorded a valuation allowance of $138.0 million as of December 31, 2006, which includes a full valuation allowance against the $2.5 million minimum tax credit carryforward, which is available for an unlimited carryforward period to offset regular federal income tax in excess of the alternative minimum tax. The Company has reviewed its domestic and foreign deferred tax assets and, except for approximately $6.2 million deferred tax assets related to the Company’s Cerro Bayo and Martha mines, has not recognized the potential tax benefits in other jurisdictions because at this time management believes that the realization of such benefits in future periods does not meet the more likely than not criteria.follows (in thousands):
Years Ended December 31 2007 2006 Deferred tax liabilities: Mineral properties $ 552,007 $ — Investment in foreign subsidiaries 18,430 9,761 Property, plant and equipment, net 2,836 3,580 573,273 13,341 Deferred tax assets: Net operating loss carryforwards 111,996 80,869 Investment in foreign subsidiaries 16,331 8,129 Capital loss carryforwards 10,305 12,897 Asset retirement obligation 10,234 9,914 Unrealized foreign currency loss and other 8,651 — Accrued expenses 3,330 2,345 Alternative minimum tax credit carryforwards 2,520 2,139 Inventory 1,523 4,274 Mineral properties — 53,290 164,890 173,857 Valuation allowance (160,898 ) (154,840 ) 3,992 19,017 Net deferred tax assets (liabilities) $ (569,281 ) $ 5,676
The Company has evaluated the amount of taxable income and periods over which it must be earned to allow for realization of itsthe deferred tax assets. Based onupon this analysis, the Company determined it is more likely than not that over the next two years pretax book income in Chile and Argentina where the future tax rate is 17% and 35%, respectively, is sufficient for recognition of $6.2 million ofnet deferred tax assets.assets of $1.1 million and $3.5 million will be realized in Argentina and Chile, respectively. Thus, the Company has recorded valuation allowances as follows (in thousands): Years Ended December 31 2007 2006 U.S. $ 111,685 $ 122,101 Argentina 1,966 1,130 Australia 7,282 — Canada 8,220 — New Zealand 30,999 30,778 Chile and other 746 831 $ 160,898 $ 154,840
The Company monitorscontinues to monitor the valuation allowance each quarterquarterly, and makeswill make the appropriate adjustments as necessary. The Company adopted the provisions of FASB Interpretation No. 48, “Accounting for Uncertainty in Income Taxes,” (FIN 48) an interpretation of FASB Statement No. 109, “Accounting for Income Taxes” on January 1, 2007. FIN 48 clarifies the criteria that an individual tax position must satisfy for some or all of the benefits of that position to be recognized in a company’s financial statements. FIN 48 prescribes a recognition threshold of more likely than not, and a measurement attribute for all tax positions taken or expected to be taken on a tax return. The Company determined that FIN 48 had no impact on the financial statements, and as a result, did not record any cumulative effect adjustment related to the allowance as appropriate based primarily upon continued developmentadoption of anFIN 48.F-27
The Company files income tax returns in the US federal jurisdiction, various US states and in certain foreign jurisdictions. To the extent there are loss carryovers in any such jurisdictions, the statute of limitations generally remains open. The Company has previously determined the earnings historyfrom certain foreign jurisdictions were not indefinitely reinvested. Accordingly, the Company has recognized deferred taxes and projected future earnings.withholding taxes related to those jurisdictions where the subsidiary’s net equity determined for financial reporting purposes exceeds tax basis.
During the first quarter of 2006,2007, the Company incurred anotheran ownership change which generally limits the availability of existing tax attributes, including net operating loss carryforwards to reduce future taxable income. The Company will be limited from utilizing tax attributes to reduce future taxable income or tax liabilities. Therefore, the Company has the following tax attribute carryforwards as of December 31, 2006:U.S.
Chile
New Zealand
Other
Total
Regular net operating losses $86,004 $30,464 $93,267 $444 $210,179 Alternative minimum tax net operating losses 53,651 -- -- -- 53,651 Capital losses 33,853 -- -- -- 33,853 Alternative minimum tax credits 2,180 -- -- -- 2,180 Foreign tax credits 299 -- -- -- 299
2007 (in thousands):
New U.S. Chile Mexico Canada Australia Zealand Other Total Regular net operating losses $ 110,286 $ 22,110 $ 109,600 $ 5,653 $ 6,389 $ 93,936 $ 2,487 $ 350,461 Alternative minimum tax net operating losses 26,946 — — — — — — 26,946 Capital losses 19,339 — — — 9,855 — — 29,194 Alternative minimum tax credits 2,520 — — — — — — 2,520
The U.S. net operating losses expire in 2011from 2016 through 2025 and the Canada net operating losses expire from 2025 through 2027. The Mexico net operating losses expire in 2017 and 2018, while the foreign countryremaining net operating losses from the foreign jurisdictions have an indefinite carryforward period. The U.S. capital losses expire from 2008 through 2012 while the Australia capital losses generally have an indefinite carryforward period. The Company’s capital losses expire in 2007 through 2011; alternativeAlternative minimum tax credits have an indefinite carryforward period and the foreign tax credits generally expire in 2026.F-27
do not expire.
NOTE KL — SHAREHOLDERSSHAREHOLDER’S EQUITY On May 11, 1999, the Company’s shareholders adopted a new shareholder rights plan (the “Plan”). The Plan entitles each holder of the Company’s common stock to one right. Each right entitles the holder to purchase one one-hundredth of a share of newly authorized Series B Junior Preferred Stock at an exercise price of $100. The rights will not be distributed and become exercisable unless and until ten business days after a person acquires 20% of the outstanding common shares or commences an offer that would result in the ownership of 30% or more of the shares. Each right also carries the right to receive upon exercise that number of Coeur common shares which has a market value equal to two times the exercise price. Each preferred share issued is entitled to receive 100 times the dividend declared per share of common stock and 100 votes for each share of common stock and is entitled to 100 times the liquidation payment made per common share. The Board may elect to redeem the rights prior to their exercisability at a price of $0.01 per right. The new rights will expire on May 24, 2009, unless earlier redeemed or exchanged by the Company. Any preferred shares issued are not redeemable. At December 31, 20062007 and 2005,2006, there were a total of 277,995,133550,453,019 and 249,902,142277,995,133 rights outstanding, respectively, which was equal to the number of outstanding shares of common stock.Stock Issues During 2006
During the first quarter of 2006, the Company completed a public offering of 27.6 million shares of common stock at a public offering price of $5.60 per share. The Company realized net proceeds of $146.2 million after payment of the underwriters’ discount. Offering costs incurred were $8.3 million.Stock Issues During 2005
During the third quarter of 2005, the Company completed a public offering of 9.9 million shares of common stock at a public offering price of $3.70 per share. The Company realized total net proceeds from the offering, after payment of the underwriters’ discount, of approximately $35.9 million. Offering costs incurred were $0.6 million.F-28
Stock Issues During 2004
During the fourth quarter of 2004, the Company completed a public offering of 26.6 million shares of common stock at a public offering price of $4.50 per share, which included 1.6 million shares purchased by the underwriters at the offering price to cover over allotments. The Company realized total net proceeds from the offering, after payment of the underwriters’ discount, of approximately $113.1 million. Offering costs incurred were $6.7 million.
NOTE LM — STOCK-BASED COMPENSATION PLANS The Company has an Annual Incentive Plan, a Long-Term Incentive Plan (the “2003 Long-Term Incentive Plan”) and a Directors’ Plan (the “Directors’ Plan”). Total employee compensation expense charged to operations and capital projects under these Plans was $4.6$6.3 million, $3.9$4.7 million and $2.8$3.8 million for 2007, 2006 and 2005, and 2004, respectively. Annual Incentive Plan Under the Annual Incentive Plan, the Board of Directors may annually approve cash-based awards to the executive officers and key management employees based on certain Company and employee performance measures. Cash payments for 2007, 2006 2005 and 20042005 amounted to $2.6 million, $2.2 million and $2.7 million, and $2.0 million, respectively.F-28
1989 Long-Term Incentive Plan Under the 1989 Long-Term Incentive Plan, as amended by shareholders in 1995, the Company may grant non-qualified and incentive stock options that are exercisable at prices equal to the fair market value of the shares on the date of grant and vest cumulatively at an annual rate of one third during the three-year period following the date of grant. In addition to stock options, the Company’s 1989 Long-Term Incentive Plan provides for grants of stock appreciation rights (SAR’s)(SARs), restricted stock, restricted stock units, performance shares, performance units, cash based awards, and stock based awards. The number of shares authorized to be issued under this plan was 2.9 million shares. There were 0.6 million shares reserved for issuance under this plan at December 31, 20062007 for stock options previously awarded. No further awards will be made under this plan. 2003 Long-Term Incentive Plan The 2003 Long-Term Incentive Plan (the “LTIP”) was approved by our shareholders on May 20, 2003, and replaced our prior 1989 Long-Term Incentive Plan. Under the plan, we may grant nonqualified stock options, incentive stock options, stock appreciation rights (“SARs”), restricted stock, restricted stock units, performance shares, performance units, cash-based awards and other stock-based awards to our executive officers. The number of shares authorized for grant under this plan was 6.8 million shares. There were 6.25.8 million shares reserved for issuance under this plan at December 31, 2006.2007. Of the 6.25.8 million shares, 4.94.1 million shares can be issued for future grants. There are 1.01.3 million options and 0.20.4 million performance shares outstanding under these plans. Directors Plan On June 3, 2005, the Company’s shareholders approved the 2005 Non-Employee Directors’ Equity Incentive Plan and authorized 500,000 shares of common stock for issuance under the plan. During 2007 and 2006, 59,476 and 2005, 35,042 and 35,996 shares were issued in lieu of $0.2$0.3 million and $0.1$0.2 million, respectively, of Directors’ fees. At December 31, 2006, 0.4 million2007, 400,000 shares are reserved for issuance under this plan. Under the previous Directors’ plan, options were granted only in lieu of annual directors’ fees. For the year ended December 31, 2004, a total of 40,318 options had been granted in lieu of directors’ fees of $0.1 million. At December 31, 2006, 0.5 million2007, 500,000 shares are reserved for issuance under this plan for stock options previously awarded. No further grants will be made under this plan.F-29
As of December 31, 20062007 and 2005,2006, options to purchase 2,089,6502,281,595 shares and 2,218,6292,089,650 shares of common stock, respectively, were outstanding under the Long-Term and the Directors’ Plans described above. The options are exercisable at prices ranging from $0.74 to $17.94$8.94 per share. Stock options granted under the Company’s incentive plans vest over three years and are exercisable over a period not to exceed 10 years from the grant date. Exercise prices are equal to the fair market value of the shares on the date of the grant. The value of each option award is estimated on the date of the grant using the Black-Scholes option pricing model. Restricted stock is granted at the fair market value of the underlying shares on the date of grant and vest in equal installments annually over three years. Holders of the restricted stock are entitled to vote the shares and to receive any dividends declared on the shares. Performance shares also are granted at the fair market value of the underlying shares on the date of grant. Compensation costs ultimately recognized are equal to the grant date fair value. Vesting is contingent on meeting certain performance measuresmarket conditions based on relative total shareholder return. The performance shares vest at the end of the three-year service period. Performance shares granted underperiod if the plan assume that the performance measure will be achieved. If such performance measuresmarket conditions are not met, no furthermet. The existence of a market condition requires recognition of compensation cost regardless of whether the market condition is recognized and if determined improbable of achieving the performance measures any previously recognized compensation is reversed.F-29
ever satisfied.
Effective January 1, 2006, the Company began recording compensation expense associated with awards of equity instruments in accordance with Statement of Financial Accounting Standards (“SFAS”)SFAS No. 123(R), “Share-Based Payment”. Prior to January 1, 2006, the Company accounted for awards of equity instruments according to the provisions of SFAS No. 123 and related interpretations, and therefore no related compensation expense was recorded for awards granted with no intrinsic value. The Company adopted the modified prospective transition method provided for under SFAS No. 123(R), and, consequently, has not retroactively adjusted results fromfor prior periods. Under this transition method, compensation cost associated with awards of equity instruments recognized in 2006 includes: 1) amortization related to the remaining unvested portion of all awards granted for the fiscal years 1995 to 2005, based on the grant date fair value, estimated in accordance with the original provisions of SFAS No. 123, “Accounting for Stock-Based Compensation”; and 2) amortization related to all equity instruments awards granted subsequent to December 31, 2005, based on the grant-date fair value estimated in accordance with the provisions of SFAS No. 123(R). The compensation cost is included in administrative and general expenses, production costs and the cost of self-constructed property, plant and equipment as deemed appropriate. Prior to the Company’s adoption of SFAS No. 123(R), benefits of tax deduction in excess of recognized compensation costs were reported as operating cash flows. SFAS No. 123(R) requires excess tax benefits be reported as a financing cash inflow rather than as a reduction of taxes paid. There were no significant excess tax benefits for the years ended December 31, 2007, 2006 2005 and 2004.2005.
The compensation expense recognized in the Company’s consolidated financial statements for the year ended December 31, 2007, 2006 2005 and 20042005 for awards of equity instruments was $2.2$3.7 million, $2.5 million and $1.2 million, respectively, of which $0.2 million, $0.3 million, and $1.1$0 million, respectively.respectively, was capitalized as part of mine development activities. As of December 31, 2006,2007, there was $1.8$1.7 million of total unrecognized compensation cost (net of estimated forfeitures) related to unvested stock options, restricted stock grants and performance share grants which is expected to be recognized over a weighted-average vesting period of 2.0 years. The Company continues to estimate the fair value of each stock option award on the date of grant using the Black-Scholes option valuation model. The Company now estimates forfeitures of stock-based awards based on historical data and adjusts the forfeiture rate periodically. The adjustment of the forfeiture rate will result in a cumulative adjustment in the period the forfeiture estimate is changed. During the year ended December 31, 2006, the Company recorded an adjustment of $0.1 million to reduce compensation expense for forfeited awards.F-30
The impact of adopting SFAS No. 123(R) as of January 1, 2006 resulted in a decrease in net income of $1.4 million, or less than $0.01 per basic and diluted share for the year ended December 31, 2006. The impact of adoption excludes the amortization of restricted stock awards in the amount of $1.1 million for the year ended December 31, 2006. Compensation expense related to the amortization of restricted stock awards was recognized prior to the implementation of SFAS No. 123(R). Cash received from share options exercised under the Long-Term Incentive Plan for the years ended December 31, 2007, 2006 and 2005 and 2004 were $0.2 million, $0.8 million $0.1 million and $0.3$0.1 million, respectively, and is reflected as an other financing activity in the Company’s consolidated statements of cash flows. The adjustment of the forfeiture rate resulted in a cumulative adjustment in the period the forfeiture estimate is charged. During the year ended December 31, 2006, the Company recorded an adjustment of $0.1 million to reduce compensation expense for forfeiture awards.
The following pro-forma information, as required by SFAS No. 148, “Accounting for Stock-Based Compensation-Transition and Disclosure an amendment of FASB Statement No. 123,” is presented for comparative purposes and illustrates the effect on net income per common share for the periodsperiod presented as if the Company had applied the fair value recognition provisions of SFAS No. 123(R) to stock-based employee compensation prior to December 31, 2005.F-30
Year Ended December 31,
2005
2004
(in thousands except per share data)
Net income (loss) as reported $ 10,551 $ (16,858 ) Add: Stock-based employee compensation expense included in reported net income 1,237 1,137 Less: Stock-based employee compensation expense determined under fair value for all awards (2,316 ) (2,017 )
Net income (loss) - Pro forma $ 9,472 $ (17,738 )
Net income (loss) per share: Basic and diluted - As reported $ 0.04 $ (0.08 )
Basic and diluted - Pro forma $ 0.04 $ (0.08 )
Year Ended December 31, 2005 (in thousands, except per share data) Net income as reported $ 10,551 Add: Stock-based employee compensation expense included in reported net income 1,237 Less: Stock-based employee compensation expense determined under fair value for all awards (2,316 ) Net income — Pro forma $ 9,472 Net income per share: Basic and diluted — As reported $ 0.04 Basic and diluted — Pro forma $ 0.04
The weighted average fair value of stock options on the date of grant, and the assumptions used to estimate the fair value of the stock options using the Black-Scholes option valuation model were as follows:Year Ended December 31, 2006
2005
2004
Weighted average fair value of options granted $3.35 $2.53 $4.83 Expected volatility 68.5% 68.5% 75.7% Expected life 6 years 6 years 6 years Risk-free interest rate 4.6% 3.9% 3.3% Expected dividend yield 0.0% 0.0% 0.0%
Years Ended December 31, 2007 2006 2005 Weighted average fair value of options granted $ 2.35 $ 3.35 $ 2.53 Expected volatility 58.9 % 68.5 % 68.5 % Expected life 6 years 6 years 6 years Risk-free interest rate 4.5 % 4.6 % 3.9 % Expected dividend yield 0.0 % 0.0 % 0.0 %
The expected volatility of the option is determined using historical volatilities based on historical stock prices. The Company estimated the expected life of options granted using the midpoint between the vesting date and the original contractual term. The risk free rate was determined using the yield available on U.S. Treasury Zero-coupon issues with a remaining term equal to the expected life of the option. The Company has not paid dividends on its common stock since 1996.F-31
The following table summarizes stock option activity during the years ended December 31, 2004, 2005, 2006 and 2006:Shares
Weighted Average
Exercise Price
Stock options outstanding at December 31, 2003 1,650,054 $2.11 Granted 333,250 $6.95 Exercised (169,527 ) $1.69 Canceled/expired (16,869 ) $6.32
Stock options outstanding at December 31, 2004 1,796,908 $3.01 Granted 566,149 $3.92 Exercised (52,007 ) $1.61 Canceled/expired (92,421 ) $5.69
Stock options outstanding at December 31, 2005 2,218,629 $3.16 Granted 332,169 $5.14 Exercised (395,723 ) $1.99 Canceled/expired (65,425 ) $7.65
Stock options outstanding at December 31, 2006 2,089,650 $3.56
F-31
2007:
Weighted Average Shares Exercise Price Stock options outstanding at December 31, 2004 1,796,908 $ 3.01 Granted 566,149 $ 3.92 Exercised (52,007 ) $ 1.61 Cancelled/expired (92,421 ) $ 5.69 Stock options outstanding at December 31, 2005 2,218,629 $ 3.16 Granted 332,169 $ 5.14 Exercised (395,723 ) $ 1.99 Canceled/expired (65,425 ) $ 7.65 Stock options outstanding at December 31, 2006 2,089,650 $ 3.56 Granted 462,015 $ 3.99 Exercised (56,167 ) $ 3.29 Canceled/expired (213,903 ) $ 5.99 Stock options outstanding at December 31, 2007 2,281,595 $ 3.42
Options exercisable at December 31, 2007, 2006 and 2005 were for 1,598,685, 1,413,117, and 2004 were 1,413,117, 1,562,217 and 1,509,217,shares, respectively, with a weighted average exercise price of $3.06, $2.95 and $2.53, and $2.25, respectively. The following table summarizes information for options currently outstanding at December 31, 2006:Options Outstanding
Options Exercisable
Range of
Exercise
Price
Number
Outstanding
Weighted
Average
Exercise
Price
Weighted
Average
Remaining
Contractual
Life (Years)
Number
Exercisable
Weighted
Average
Exercise
Price
Weighted
Average
Remaining
Contractual
Life (Years)
$0.74 to $1.22 442,641 $0.80 4.77 442,641 $0.80 4.77 $1.23 to $1.85 336,525 $1.75 5.67 336,525 $1.75 5.67 $1.86 to $2.63 111,502 $2.10 5.90 111,502 $2.10 5.90 $2.64 to $3.92 537,089 $3.86 7.50 248,767 $3.78 6.77 $3.93 to $7.09 624,288 $6.00 7.96 236,077 $6.81 6.62 $7.10 to $17.94 37,605 $11.68 0.57 37,605 $11.68 0.57
2,089,650 $3.56 6.55 1,413,117 $2.95 5.62
2007:
Options Outstanding Options Exercisable Weighted Weighted Weighted Average Weighted Average Range of Average Remaining Average Remaining Exercise Number Exercise Contractual Number Exercise Contractual Price Outstanding Price Life (Years) Exercisable Price Life (Years) $0.74 to $1.22 442,641 $ 0.80 3.77 442,641 $ 0.80 3.77 $1.23 to $1.85 320,420 $ 1.75 4.67 320,420 $ 1.75 4.67 $1.86 to $2.63 111,502 $ 2.10 4.90 111,502 $ 2.10 4.90 $2.64 to $3.92 497,135 $ 3.85 6.45 362,061 $ 3.83 6.19 $3.93 to $5.14 661,175 $ 4.47 8.51 113,339 $ 5.06 6.72 $5.15 to $8.94 248,722 $ 7.19 5.60 248,722 $ 7.19 5.60 2,281,595 $ 3.42 6.11 1,598,685 $ 3.06 5.07
As of December 31, 2006,2007, the total future compensation cost related to non-vested options not yet recognized in the statement of income was $0.6$1.7 million and the weighted average period over which these awards are expected to be recognized was 2 years. The total intrinsic value of share options exercised during the year ended December 31, 2007, 2006 and 2005 and 2004 was $0.04 million, $1.6 million $0.1 million and $0.3$0.1 million, respectively. At December 31, 2006,2007, the total intrinsic value was $3.8$4.1 million and $3.5$3.6 million for stock options outstanding and exercisable, respectively.F-32
The following table summarizes restricted stock activity during the years ended December 31, 2004, 2005, 2006 and 2006:Number of
Shares
Weighted Average
Grant Date Fair
Value
Outstanding at December 31, 2003 1,115,000 $1.28 Granted 236,070 $6.39 Vested (371,673 ) $1.28 Forfeited (168,399 ) $2.09
Outstanding at December 31, 2004 810,998 $2.60 Granted 359,640 $3.94 Vested (433,623 ) $2.30 Forfeited (75,634 ) $4.58
Outstanding at December 31, 2005 661,381 $3.30 Granted 220,894 $5.14 Vested (445,025 ) $2.71 Forfeited (24,218 ) $4.83
Outstanding at December 31, 2006 413,032 $4.83
2007:
Weighted Number of Average Grant Shares Date Fair Value Outstanding at December 31, 2004 810,998 $ 2.60 Granted 359,640 $ 3.94 Vested (433,623 ) $ 2.30 Forfeited (75,634 ) $ 4.58 Outstanding at December 31, 2005 661,381 $ 3.30 Granted 220,894 $ 5.14 Vested (445,025 ) $ 2.71 Forfeited (24,218 ) $ 4.83 Outstanding at December 31, 2006 413,032 $ 4.83 Granted 497,990 $ 3.99 Vested (241,784 ) $ 4.82 Forfeited (66,043 ) $ 4.30 Outstanding at December 31, 2007 603,195 $ 4.20
The fair value of restricted stock is determined based on the closing stock price on the grant date. As of December 31, 2006,2007, there was $0.6 million of total unrecognized compensation cost related to restricted awards to be recognized over a weighted-averageweighted average period of 1.92.1 years.F-32
The following table summarizes performance shares activity during the year ended December 31, 2006:Number of
Shares
Weighted Average
Grant Date Fair
Value
Outstanding at December 31, 2005 -- $-- Granted 220,894 5.14 Exercised -- -- Forfeited (10,449 ) 5.14
Outstanding at December 31, 2006 210,445 $5.14
2007:
Weighted Number of Average Grant Shares Date Fair Value Outstanding at December 31, 2005 — $ — Granted 220,894 5.14 Exercised — — Forfeited (10,449 ) 5.14 Outstanding at December 31, 2006 210,445 $ 5.14 Granted 306,852 3.99 Exercised (30,298 ) 4.48 Forfeited (66,456 ) 4.47 Outstanding at December 31, 2007 420,543 $ 4.45
The fair value of performance shares is determined based on fair value modeling techniques that consider the closing price on the grant date.market and service conditions relevant for these grants. As of December 31, 2006,2007, there was $0.7 million of total unrecognized compensation cost related to performance shares to be recognized over a weighted average period of 2.11.9 years.NOTE M –N — DEFINED BENEFIT PENSION, POST-RETIREMENT MEDICAL BENEFIT, DEFINED CONTRIBUTION AND 401(k) PLANSOn
In June 2006, the Company completed the sale of 100% of the shares of its wholly owned subsidiary Coeur Silver Valley Inc. As a result, the liabilities were assumed by the purchaser and the Company has no longer maintainsfurther obligations related to the defined benefit plan and post retirement medical benefits plan summarized below.Defined Benefit Plan In connection with the acquisition of Coeur Silver Valley acquired in 1999, the Company was required to maintain non-contributory defined benefit pension plans covering substantially all employees. Benefits for salaried plans were based on salary and years of service. Hourly plans were based on negotiated benefits and years of service. The Company’s funding policy was to contribute annually the minimum amount prescribed, as specified by applicable regulations. Prior service costs and actuarial gains and losses were amortized over plan participants’ expected future period of service using the straight-line method.F-33
Actuarial Present Value of Projected Benefit Obligation: The actuarial present value of our projected benefit obligations was determined using the following assumptions:Factor 2005 2004 Discount Rate for Benefit Obligations 5.75% 6.0% Expected Return on Plan Assets 6.0% 6.0% Rate of Compensation Increases 5.0% 5.0%
Factor 2005 Discount Rate for Benefit Obligations 5.75 % Expected Return on Plan Assets 6.0 % Rate of Compensation Increases 5.0 %
Expected rate of return on plan assets: The expected rate of return on plan assets for purposes of the actuarial valuation was assumed to be 6% as of both December 31, 2005 and 2004.2005. The rate of return used was based on the plan’s experience and asset mix of the portfolio, as well as taking into consideration the fact that no lump sum distributions were paid from the plan. The plan had an expected return on plan assets of $0.3 million and $0.2 million for 2005 and 2004, respectively.2005. The actual return on plan assets was $0.2 million and $0.3 million for 2005 and 2004, respectively.2005. The discount rate was determined based on Moody’s Aaa bond rating.F-33
Plan assets and determination of fair value: The fair value of plan assets was determined using the market value of the investments held by the plan at December 31 of each year as quoted by public equity and bond markets. The asset mix iswas in accordance with the plan’s investment policy which allowed for 60% equity investments, 35% fixed income investments and 5% cash and cash equivalents. The investment portfolio for the funded portion of the obligation iswas held in a trust. The Company’s funding policy was to contribute amounts to the plan sufficient to meet the minimum funding requirements as set forth in the Employee Retirement Income Security Act of 1974 plus such additional tax deductible amounts as was advisable under the circumstances. The Company had funded $0.4 million through June 1, 2006 (the date of the Coeur Silver Valley sale), and $0.7 million and $0.7 million in 2005, and 2004, respectively, toward the obligation. The plan assets were invested principally in commingled stock funds, mutual funds and securities issued by the United States government. Pursuant to the plan’s investment policy, the plan adoptsadopted more specific investment directives from time to time. The plan’s actual portfolio at December 31, 2005 had 60% equity investments and 40% fixed income investments. Since the performance of each asset class of the portfolio within any measurement period impacted its relative weight in the portfolio, the actual percentage of each asset class in the portfolio may not have matched to the current directive. The expected long-term rates of return for each asset class within the portfolio, and therefore the portfolio weighted average, was based on an estimate of the return for each of the securities within an asset class, currently benchmarked at 10.0% for equity investments, 3.0% for fixed income investments and 2%2.0% for cash and cash equivalents. For each type of investment within the Trust’s portfolio structure, the Trustees evaluated both returns and the relationship between risk and return. The expectation was that each asset class would produce a superior risk-adjusted return over a market cycle.F-34
The following table shows the expected long term rates of return associated with each asset class:Asset Class
Actual Mix
Target Mix
Expected Long
Term Rates of
Return
Equity investments 60 % 60 % 10.00 % Fixed income investments 40 % 35 % 3.00 % Cash and cash equivalents 0 % 5 % 2.00 %
Weighted average 7.15 %
Expected Long Term Actual Target Rates of Asset Class Mix Mix Return Equity investments 60 % 60 % 10.00 % Fixed income investments 40 % 35 % 3.00 % Cash and cash equivalents 0 % 5 % 2.00 % Weighted average 7.15 %
The Trustees evaluated the level of volatility within the total Trust and each of its component investments. The Trustees set maximum volatility thresholds for each class of investment which consisted of 16% for equity investments, 7.25% for fixed income investments and 1% for cash and cash equivalents, with the total portfolio volatility expected to not exceed 11%. The Trustees then compared how these specific investments performed against other indexed funds and other managed portfolios with similar objectives. The specific criteria used to measure the performance was as follows: 1) A targeted 7-11% average annualized return based on long-term historical market data;
2) Expected returns over a market cycle that exceed the total portfolio indexed benchmark;
3) Volatility that was not substantially greater than the portfolio indexed benchmark volatility of 11%; and
4) Risk adjusted returns that were comparable with indexed benchmarks.
F-34
The components of net periodic benefit costs were as follows:follows (in thousands, except for discount rate): For the Year Ended December 31, 2005 Assumptions: Discount rate 5.75 % Components of net periodic benefit cost: Service cost $ 309 Interest cost 464 Expected return on plan assets (261 ) Amortization of prior service cost 59 Recognized actuarial loss 339 Net periodic benefit cost $ 910
F-35
For the Year Ended
December 31,
2006
2005
2004
Assumptions: Discount rate -- 5.75 % 6.0 % Components of net periodic benefit cost: Service cost -- $ 309 $ 319 Interest cost -- 464 412 Expected return on plan assets -- (261 ) (215 ) Amortization of prior service cost -- 59 56 Recognized actuarial loss -- 339 327
Net periodic benefit cost -- $ 910 $ 899
The change in benefit obligation and plan assets and a reconciliation of funded status were as follows:At December 31,
2006
2005
Change in benefit obligation Projected benefit obligation at beginning of year $ 8,405 $ 7,494 Service cost -- 309 Interest cost -- 464 Benefits paid (105 ) (217 ) Actuarial loss -- 355 Discontinued operations (8,300 ) --
Projected benefit obligation at end of year $ -- $ 8,405
Accumulated benefit obligation $ -- $ 6,606
Change in plan assets Fair value of plan assets at beginning of year $ 4,806 $ 4,098 Actual return on plan assets -- 205 Employer contributions 360 720 Benefits paid (105 ) (217 ) Discontinued operations (5,061 ) --
Fair value of plan assets at end of year $ -- $ 4,806
Reconciliation of funded status Funded status $ -- $ (3,599 ) Unrecognized actuarial loss -- 3,803 Unrecognized prior service cost -- 369
Net asset reflected in the consolidated balance sheet $ -- $ 573
Weighted average assumptions Discount rate -- 5.75 % Expected long-term rate of return on plan assets -- 6.0 % Rate of compensation increase -- 5.0 %
follows (in thousands):
At December 31, 2006 Change in benefit obligation Projected benefit obligation at beginning of year $ 8,405 Service cost — Interest cost — Benefits paid (105 ) Actuarial loss — Discontinued operations (8,300 ) Projected benefit obligation at end of year $ — Accumulated benefit obligation $ — Change in plan assets Fair value of plan assets at beginning of year $ 4,806 Actual return on plan assets — Employer contributions 360 Benefits paid (105 ) Discontinued operations (5,061 ) Fair value of plan assets at end of year $ — Reconciliation of funded status Funded status $ — Unrecognized actuarial loss — Unrecognized prior service cost — Net asset reflected in the consolidated balance sheet $ — Weighted average assumptions Discount rate — Expected long-term rate of return on plan assets — Rate of compensation increase —
Post Retirement Medical Benefits In connection with the acquisition of Coeur Silver Valley in 1999, the Company reimbursed Asarco, Inc. (prior owner) for certain healthcare benefits for retired employees and their dependents who retired before September 9, 1999. There were ten active hourly and salaried employees of Coeur Silver Valley and three inactive participants eligible under Asarco’s post-retirement medical benefits plan. These post-retirement medical benefits were self-insured by the plan’s prior sponsor. The actuarial present value of the post retirement benefit obligation iswas determined as of December 31 for each of the years presented.F-35
Actuarial Present Value of Projected Benefit Obligation: The discount rate was determined based on Moody’s Aaa Bond Rating as reported on the last business day of the plan year plus 0.50%. The Company amortized its unrecognized, unfunded accumulated post-retirement benefit obligation using a straight-line method over a 3.1-year period. The 3.1-year estimate was based on the average remaining service period of the active participants. Expected long-term rate of return on plan assets No assets arewere held in a trust for the post retirement health care plan; therefore, there iswas no expected long-term rate of return assumption. A “pay as you go” funding method was utilized for this plan. The Company contributed $0.01 million and $0.2 million to the plan as benefit payments for 2005 and 2004, respectively.2005.F-36
The following table sets forth the actuarial present value of postretirement medical benefit obligations and amounts recognized in the Company’s financial statements:At December 31,
2006
2005
(in thousands)
Assumptions: Discount rate -- 5.75 %
Change in benefit obligation Net benefit obligation at beginning of year $ 356 $ 1,973 Service cost -- 8 Interest cost -- 20 Prior service cost (credit) -- (387 ) Actuarial (gain) loss -- (1,248 ) Benefits paid -- (10 ) Discontinued operations (356 ) --
Net benefit obligation at end of year -- $ 356
Change in plan assets Assets at beginning of year $ -- $ -- Benefits paid -- (10 ) Contributions -- 10
Assets at end of year $ -- $ --
Reconciliation of funded status Funded status at end of year $ -- $ (356 ) Unrecognized net actuarial (gain) loss -- (815 ) Unrecognized prior service cost (credit) -- (262 )
Net amount recognized at end of year (recorded as accrued benefit cost in the accompanying balance sheet) $ -- $ (1,433 )
F-36
statements (in thousands, except for discount rate):
At December 31, 2006 2005 Assumptions: Discount rate — 5.75 % Change in benefit obligation Net benefit obligation at beginning of year $ 356 $ 1,973 Service cost — 8 Interest cost — 20 Prior service cost (credit) — (387 ) Actuarial (gain) loss — (1,248 ) Benefits paid — (10 ) Discontinued operations (356 ) — Net benefit obligation at end of year — $ 356 Change in plan assets Assets at beginning of year $ — $ — Benefits paid — (10 ) Contributions — 10 Assets at end of year $ — $ — Reconciliation of funded status Funded status at end of year $ — $ (356 ) Unrecognized net actuarial (gain) loss — (815 ) Unrecognized prior service cost (credit) — (262 ) Net amount recognized at end of year (recorded as accrued benefit cost in the accompanying balance sheet) $ — $ (1,433 )
The components of net periodic benefit costs were as follows:For the Year Ended December 31,
2006
2005
2004
(in thousands)
Assumptions: Discount rate -- 6.0 % 6.0 %
Components of net periodic benefit cost: Service cost -- $ 8 $ 17 Interest cost -- 20 116 Amortization of prior service cost -- (125 ) -- Amortization of actuarial gain -- (372 ) --
Net periodic pension cost (benefit) -- $ (469 ) $ 133
follows (in thousands, except for discount rate):
For the Year Ended December 31, 2006 2005 Assumptions: Discount rate — 6.0 % Components of net periodic benefit: Service cost — $ 8 Interest cost — 20 Amortization of prior service cost — (125 ) Amortization of actuarial gain — (372 ) Net periodic pension benefit — $ (469 )
During 2005, an adjustment was required to reflect a decreased liability of $1.6 million related to a reduction in plan participation. This adjustment resulted in an actuarial gain. The amortization of the prior service cost of $0.4 million and the unrealized actuarial gain of $1.2 million is greater than 10% of the benefit obligation which required the gain to be amortized over the average remaining service period of the active participants, estimated to be approximately 3.1 years. The amortization of the unrealized gain is included as a component on net periodic benefit cost. The Company also amortized the unrecognized actuarial gain over the same period.F-37
A 1% change in assumed medical trend rates would have had the following effects:(in thousands) 1% Increase
1% Decrease
2005
2004
2005
2004
Effect on total of service and interest cost components $ 2 $ 8 $ (2 ) $ (7 ) Effect on postretirement benefit obligation $ 22 $ 106 $ (19 ) $ (91 )
effects (in thousands):
1% 1% Increase Decrease 2005 2005 Effect on total of service and interest cost components $ 2 $ (2 ) Effect on postretirement benefit obligation $ 22 $ (19 )
Postretirement benefits included medical benefits for retirees and their dependents. In December 2003, The Medicare Prescription Drug, Improvement and Modernization Act of 2003 was enacted. Our accumulated postretirement benefit obligation and net periodic postretirement obligation do not reflect the effects that the requirements of this law since eligibility under this plan ends at age 65.Defined Contribution Plan The Company provides a noncontributory defined contribution retirement plan for all eligible U.S. employees. Total contributions charged to expense were $1.2$0.8 million, $0.9$1.2 million and $0.9 million for 2007, 2006 2005 and 2004,2005, respectively, which is based on a percentage of the salary of eligible employees.401(k) Plan The Company maintains a retirement savings plan (which qualifies under Section 401(k) of the U.S. Internal Revenue code) covering all eligible U.S. employees. Under the plan, employees may elect to contribute up to 100% of their cash compensation, subject to ERISA limitations. The Company is required to make matching cash contributions equal to 50% of the employees’ contribution, up to a maximum of 3% of the employees’ compensation. Contributions to the plan charged to operations were $0.6 million, $0.5$0.6 million and $0.5 million in 2007, 2006, and 2005, and 2004, respectively.F-37
NOTE NO — DERIVATIVE FINANCIAL INSTRUMENTS AND FAIR VALUE OF FINANCIAL INSTRUMENTS The Company enters into derivative instruments to manage the Company’s exposure to foreign currency exchange rates and market prices associated with changes in gold and silver commodity prices. The Company accounts for its derivative contracts in accordance with SFAS No. 133, “Accounting for Derivative Instruments and Hedging Activities.” Accordingly, unrealized gains and losses related to the change in fair market value of derivative contracts, which qualify and are designated as cash flow hedges, are recorded as other comprehensive income or loss and such amounts are recognized into earnings as the associated contracts are settled.Forward Foreign Exchange Contracts During 20062007 and 2005,2006, the Company entered into forward foreign currency exchange contracts to reduce the foreign exchange risk associated with forecasted Chilean peso operating costs for 2007 and 2008 at its Cerro Bayo mine. The contracts entered into in 20062007 require the Company to exchange U.S. dollars for Chilean pesos at a weighted average exchange rate of 531503 pesos to each U.S. dollar. At December 31, 20062007 and 2005,2006, the Company had foreign exchange contracts of $4.8$9.0 million and $7.2$4.8 million in U.S. dollars, respectively. For the years ended December 31, 20062007 and 2005,2006, the Company recorded a realized gain (loss) of approximately $(0.4)$0.4 million and $0.1$(0.4) million, respectively, in connection with its foreign currency hedging program. As of December 31, 2006,2007, the fair value of the foreign exchange contracts was a liability of $0.1 million. Change in gains (losses) accumulated in other comprehensive income (loss) for cash flow hedging contracts are as follows:follows (in thousands):F-38
December 31, 2006
2005
2004
(in thousands) Beginning balance $ (171 ) $ -- $ 131 Reclassification to earnings 379 (68 ) 8 Change in fair value (268 ) (103 ) (139 )
Ending balance $ (60 ) $ (171 ) $ --
December 31, 2007 2006 2005 Beginning balance $ (60 ) $ (171 ) $ — Reclassification to earnings (371 ) 379 (68 ) Change in fair value 349 (268 ) (103 ) Ending balance $ (82 ) $ (60 ) $ (171 )
Commodity Derivatives The Company has occasionally entered into forward metal sales contracts to manage the price risk onassociated with a portion of its cash flows against fluctuating gold prices. As of December 31, 2006,2007, the Company had no outstanding forward sales contracts for either gold or silver. For metal delivery contracts, the realized price pursuant to the contract is recognized when physical gold or silver is delivered in satisfaction of the contract. For the year ended December 31, 2004, the Company incurred realized hedging losses of $1.2 million.Concentrate Sales Contracts The Company enters into concentrate sales contracts with third-party smelters. The contracts, in general, provide for a provisional payment based upon provisional assays and quoted metal prices and the provisionally priced sales contain an embedded derivative that is required to be separated from the host contract for accounting purposes. The host contract is the receivable from the sale of concentrates at the forward price at the time of sale. The embedded derivative, which is the final settlement price based on a future price, does not qualify for hedge accounting. These embedded derivatives are recorded as derivative assets (in Prepaid expenses and other), or derivative liabilities (in Accrued liabilities and other), on the balance sheet and are adjusted to fair value through earnings each period until the date of final settlement.F-38
At December 31, 2007, the Company had outstanding provisionally priced sales of $61.2 million consisting of 3.3 million ounces of silver and 20,775 ounces of gold, which had a fair value of approximately $63.8 million including the embedded derivative. At December 31, 2006, the Company had outstanding receivables for provisionally priced sales of $74.5 million, consisting of 4.6 million ounces of silver and 29,577 ounces of gold, which had a fair market value of approximately $75.6 million including the embedded derivative. At December 31, 2005, the Company had outstanding receivables for provisionally priced sales of $47.0 million, consisting of 3.5 million ounces of silver and 40,000 ounces of gold, which had a fair market value of approximately $49.3 million including the embedded derivative.
Credit Risk The credit risk exposure related to any potential hedging activities is limited to the unrealized gains, if any, on outstanding contracts based on current market prices. To reduce counter-party credit exposure, the Company deals only with a group of large credit-worthy financial institutions and limits credit exposure to each. The Company does not anticipate non-performance by any of its counter parties. In addition, to allow for situations where positions may need to be revised, the Company deals only in markets that it considers highly liquid.NOTE OP — COMMITMENTS AND CONTINGENCIESLabor Union Contract The Company maintains two labor agreements in South America, consisting of a labor agreement with Syndicato de Trabajadores de Compañía Minera Cerro Bayo Ltd. at its Cerro Bayo mine in Chile and with Associacion Obrera Minera Argentina at its Martha mine in Argentina. The agreement at Cerro Bayo is effective from December 22, 200524, 2007 to December 21, 20072010 and the agreement at Mina Martha is effective from June 12, 2006 to June 1, 2008. Additionally certain employees at San Bartolomé are covered by a labor agreement that became effective October 11, 2008.2007; this Bolivian labor agreement does not have a fixed term. As of December 31, 2006,2007, the Company had approximately 20%44% of its worldwide labor force covered by collective bargaining agreements.F-39
Termination Benefits In September 2005, the Company established a one-time termination benefit program at the Rochester mine as the mine approaches the end of its mine life. The employees will be required to render service until they are terminated in order to be eligible for benefits. Approximately 80% of the workforce is expected to bewas severed by mid-2007,the end of the third quarter of 2007, while the remaining 20% are expected to stay on for residual leaching and reclamation activities. As of December 31, 2006,2007, the total amount expected to be incurred under this plan is approximately $3.4$4.7 million. The liability is recognized ratably over the minimum future service period. The amount accrued as of December 31, 2006 was $2.0 million and was charged to production costs. The following is a description of the changes to the Company’s termination benefits for the years ended December 31, 2007, 2006 and 2005 and 2004.Year Ended December 31, 2006
2005
2004
(in thousands) Beginning Balance $ 542 $ -- $ -- Accruals 1,803 542 -- Payments (386 ) -- --
Ending Balance $ 1,959 $ 542 $ --
(in thousands):
Year Ended December 31, 2007 2006 2005 Beginning Balance $ 1,959 $ 542 $ — Accruals 1,917 1,803 542 Payments (3,056 ) (386 ) — Ending Balance $ 820 $ 1,959 $ 542
NOTE PQ — SIGNIFICANT CUSTOMERS The Company markets its metals products and concentrates primarily to bullion trading banks and five third party smelters. These customers then sell the metals to end users for use in industry applications such as electronic circuitry, jewelry and silverware production and the manufacture and development of photographic film. Sales of metals to bullion trading banks amounted to approximately 47%, 45%47% and 59%45% of total metals sales in 2007, 2006 2005 and 2004,2005, respectively. Generally, the loss of a single bullion trading bank customer would not adversely affect the Company in view of the liquidity of the markets and availability of alternative trading banks.F-39
The Company currently markets its silver and gold concentrates to third party smelters in Japan, Mexico, Australia and Germany. Sales of metals concentrates to third party smelters amounted to approximately 53%, 55%53% and 41%55% of metals sales in 2007, 2006 2005 and 2004,2005, respectively. The loss of any one smelter customer could have a material adverse effect on the Company in the event of the possible unavailability of alternative smelters.NOTE QR — SEGMENT INFORMATION Operating segments are defined as components of an enterprise about which separate financial information is available that is evaluated regularly by the chief operating decision maker, or decision-making group, in deciding how to allocate resources and in assessing performance. The Company’s chief operating decision-making group is comprised of the Chief Executive Officer, Chief Financial Officer, the Senior Vice President of North American Operations and the President of South American Operations. The operating segments are managed separately because each segment represents a distinct use of Company resources which contribute to Company cash flows in its respective geographic area. The Company’s reportable operating segments include the Rochester, Cerro Bayo, Martha, San Bartolome,Bartolomé, Kensington, Palmarejo and CDE Australia (Endeavor and Broken Hill) mining properties. All operating segments are engaged in the discovery and/or mining of gold and silver and generate the majority of their revenues from the sale of these precious metal concentrates and/or refined precious metals. The Cerro Bayo and Martha mines sell precious metal concentrates, typically under long-term contracts, to a smelter located in Japan (Dowa Mining Ltd.), Mexico (Met-Mex Penoles) and Germany (Noordeutche)(Norddeutsche). Refined gold and silver produced by the Rochester mine is principally sold on a spot basis to precious metals trading banks such as Standard Bank and Mitsui. Concentrates produced at CDE Australia (Endeavor and Broken Hill mines) are sold to Zinifex,Nystar (formerly Zinifex), an Australia smelter. The Company’s exploration programs are included as other. The other segment also includes the corporate headquarters, elimination of intersegment transactions and other items necessary to reconcile to consolidated amounts.F-40
The accounting policies of the operating segments are the same as those described in the summary of significant accounting policies above. The Company evaluates performance and allocates resources based on profit or loss before interest, income taxes, depreciation and amortization, unusual and infrequent items, and extraordinary items. Revenues from silver sales were $151.0 million, $147.8 million and $91.9 million in 2007, 2006, and $63.1 million in 2006, 2005, and 2004, respectively. Revenues from gold sales were $64.3 million, $68.8 million and $64.4 million in 2007, 2006, and $45.9 million in 2006, 2005, and 2004, respectively. Financial information relating to the Company’s segments is as follows:Rochester
Mine
Cerro
Bayo Mine
Martha
Mine
Endeavor
Mine
Broken Hill
Mine
San
Bartolome
Project
Kensington
Project
Other
Total
2006
Total net sales and revenues $ 102,393 $ 50,293 $ 34,733 $ 5,363 $ 23,791 $ -- $ -- $ -- $ 216,573
Depreciation and depletion $ 13,745 $ 5,795 $ 1,313 $ 490 $ 5,120 $ -- $ -- $ 309 $ 26,772 Interest income -- 663 39 -- -- -- 8 17,276 17,986 Interest expense -- 84 -- -- -- -- -- 1,140 1,224 Litigation settlement -- -- -- -- -- -- -- (2,365 ) (2,365 ) Income tax (benefit) provision from continuing operations -- (2,930 ) 4,689 -- -- -- -- 6,500 8,259 Segment profit (loss) 55,109 22,652 17,290 4,977 �� 19,427 (6 ) (1,030 ) (4,413 ) 114,006
Segment assets (A) 87,423 49,428 11,596 14,508 29,740 59,080 207,745 10,326 469,846 Capital expenditures 1,225 7,555 2,481 -- -- 14,597 121,552 588 147,998
F-40
Rochester
Mine
Cerro
Bayo Mine
Martha
Mine
Endeavor
Mine
Broken Hill
Mine
San
Bartolome
Project
Kensington
Project
Other
Total
2005
Total net sales and revenues $ 69,636 $ 59,624 $ 20,606 $ 2,148 $ 4,270 $ -- $ -- $ -- $ 156,284
Depreciation and depletion $ 10,403 $ 5,064 $ 860 $ 411 $ 1,807 $ -- $ 35 $ 309 $ 18,889 Interest income -- 154 (1 ) -- -- -- -- 9,036 9,189 Interest expense -- 26 -- -- -- -- -- 2,459 2,485 Litigation settlement -- -- -- -- -- -- -- (1,600 ) (1,600 ) Income tax (benefit) provision from continuing operations -- 2,154 (863 ) -- -- -- -- 192 1,483 Segment profit (loss) 24,876 22,978 6,105 1,700 3,282 (119 ) (7,143 ) (12,476 ) 39,203
Segment assets (A) 82,806 45,474 6,291 14,999 34,860 32,687 80,653 7,982 305,752 Capital expenditures 1,197 2,731 2,108 15,410 36,667 10,477 44,201 499 113,290
Rochester
Mine
Cerro
Bayo Mine
Martha
Mine
Endeavor
Mine
Broken Hill
Mine
San
Bartolome
Project
Kensington
Project
Other
Total
2004
Total net sales and revenues $ 64,005 $ 35,267 $ 9,775 $ -- $ - $ -- $ -- $ -- $ 109,047
Depreciation and depletion $ 10,229 $ 4,588 $ 1,669 $ -- $ - $ 4 $ 52 $ 291 $ 16,833 Interest income -- 13 -- -- -- -- -- 3,626 3,639 Interest expense 1 123 -- -- -- -- -- 2,707 2,831 Loss on forward sales contracts -- -- -- -- -- -- -- (936 ) (936 ) Income tax (benefit) provision from continuing operations -- (4,403 ) -- -- -- -- -- (1,382 ) (5,785 ) Merger expenses -- -- -- -- -- -- -- 15,676 15,676 Segment profit (loss) 26,784 9,638 (387 ) -- -- (4,549 ) (7,347 ) (11,684 ) 12,455
Segment assets (A) 75,529 30,898 3,387 -- -- 21,304 25,833 5,813 162,764 Capital expenditures 3,548 2,451 689 -- -- 950 83 642 8,363
Notes:
follows (in thousands): Broken San Rochester Cerro Bayo Martha Endeavor Hill Bartolomé Kensington Palmarejo Mine Mine Mine Mine Mine Project Project Project Other Total December 31, 2007 Total net sales of metals $ 100,903 $ 47,794 $ 38,077 $ 7,943 $ 20,602 $ — $ — $ — $ — $ 215,319 Productions costs applicable to sales 60,364 35,594 17,231 545 3,292 — (1 ) — — 117,025 Depreciation and depletion 8,697 6,260 1,731 755 3,054 — — — 487 20,984 Exploration expense 361 2,908 4,418 — — — 619 — 3,635 11,941 Other operating expenses 62 113 38 — — — 38 — 24,131 24,382 Interest and other income 2,948 1,590 (303 ) — — — 85 — 13,875 18,195 Interest expense — 23 — — — — — — 342 365 Income tax (credit) expense — 1,662 6,418 — — — 20 — 6,827 14,927 Profit (loss) $ 34,367 $ 2,824 $ 7,938 $ 6,643 $ 14,256 $ — $ (591 ) $ — $ (21,547 ) $ 43,890 Segment assets(A) $ 62,848 $ 63,570 $ 25,799 $ 17,885 $ 29,391 $ 169,196 $ 301,730 $ 1,759,153 $ 7,470 $ 2,437,042 Capital expenditures $ 1,647 $ 11,330 $ 16,444 $ 2,112 $ 213 $ 100,169 $ 92,337 $ — $ 1,942 $ 226,194
Broken San Rochester Cerro Bayo Martha Endeavor Hill Bartolomé Kensington Mine Mine Mine Mine Mine Project Project Other Total December 31, 2006 Total net sales of metals $ 102,393 $ 50,293 $ 34,733 $ 5,363 $ 23,791 $ — $ — $ — $ 216,573 Productions costs applicable to sales 47,310 27,780 12,538 386 4,364 — — — 92,378 Depreciation and depletion 13,745 5,795 1,313 490 5,120 — — 309 26,772 Exploration expense — 2,639 2,904 — — — 936 2,995 9,474 Other operating expenses — 28 17 — — — 108 21,581 21,734 Interest and other income 25 809 13 — — (6 ) 13 17,800 18,654 Interest expense — 84 — — — — — 1,140 1,224 Income tax (credit) expense — (2,930 ) 4,777 — — — — 6,379 8,226 Profit (loss) $ 41,364 $ 17,707 $ 13,196 $ 4,487 $ 14,307 $ (6 ) $ (1,031 ) $ (14,605 ) $ 75,419 Segment assets(A) $ 87,371 $ 49,428 $ 11,508 $ 15,666 $ 32,894 $ 59,080 $ 207,745 $ 6,154 $ 469,846 Capital expenditures $ 1,225 $ 7,555 $ 2,481 $ — $ — $ 16,805 $ 122,640 $ 588 $ 151,294
Broken San Rochester Cerro Bayo Martha Endeavor Hill Bartolomé Kensington Mine Mine Mine Mine Mine Project Project Other Total December 31, 2005 Total net sales of metals $ 69,636 $ 59,624 $ 20,606 $ 2,148 $ 4,270 $ — $ — $ — $ 156,284 Productions costs applicable to sales 44,547 33,574 9,016 278 817 — — — 88,232 Depreciation and depletion 10,403 5,064 860 411 1,807 — 35 309 18,889 Exploration expense 169 4,812 2,976 — — 83 1,165 1,431 10,636 Other operating expenses 225 110 690 — — — 5,979 21,194 28,198 Interest and other income 181 224 (172 ) — — (36 ) — 8,188 8,385 Interest expense — 26 92 — — — — 2,367 2,485 Income tax (credit) expense — 2,154 (862 ) — — — — 191 1,483 Profit (loss) $ 14,473 $ 14,108 $ 7,662 $ 1,459 $ 1,646 $ (119 ) $ (7,179 ) $ (17,304 ) $ 14,746 Segment assets(A) $ 82,631 $ 45,474 $ 3,791 $ 15,152 $ 36,493 $ 32,687 $ 80,653 $ 8,871 $ 305,752 Capital expenditures $ 1,197 $ 2,731 $ 2,108 $ 15,410 $ 36,667 $ 11,089 $ 53,155 $ 499 $ 122,856
(A) Segment assets consist of receivables, prepaids, inventories, property, plant and equipment, and mining properties.
2006
2005
2004
Income (loss) Total segment profit $ 114,006 $ 39,203 $ 12,455 Depreciation and amortization (26,772 ) (18,889 ) (16,833 ) Interest expense (1,224 ) (2,485 ) (2,831 ) Other (2,365 ) (1,600 ) (16,612 )
Income (loss) from continuing operations before income taxes $ 83,645 $ 16,229 $ (23,821 )
Assets Total assets for reportable segments $ 469,846 $ 305,752 $ 162,764 Cash and cash equivalents 270,672 54,896 65,218 Short-term investments 70,373 185,446 256,843 Other assets 38,735 33,894 28,350 Assets held for sale -- 14,828 12,602
Total consolidated assets $ 849,626 $ 594,816 $ 525,777
F-41
Geographic Information 2006 Revenues
Long-Lived
Assets
United States $ 102,393 $ 218,236 Australia 29,154 44,253 Chile 50,293 20,295 Argentina 34,733 3,700 Bolivia -- 50,858 Other foreign countries -- 214
Total $ 216,573 $ 337,556
2005
United States $ 69,636 $ 101,338 Australia 6,418 49,860 Chile 59,624 19,407 Argentina 20,606 2,568 Bolivia -- 32,194 Other foreign countries -- 237
Total $ 156,284 $ 205,604
2004
United States $ 64,005 $ 54,306 Australia -- -- Chile 35,267 15,332 Argentina 9,775 1,050 Bolivia -- 21,103 Other foreign countries -- 144
Total $ 109,047 $ 91,935
(a)Includes property, plant and equipment and mineral properties.
2007 2006 2005 Assets Total assets for reportable segments $ 2,437,042 $ 469,846 $ 305,752 Cash and cash equivalents 98,671 270,672 54,896 Short-term investments 53,039 70,373 185,446 Other assets 62,942 38,735 33,894 Total assets held for sale — — 14,828 Total consolidated assets $ 2,651,694 $ 849,626 $ 594,816
Geographic Information Long-Lived Revenues Assets 2007 United States $ 100,903 $ 305,876 Australia 28,545 42,772 Chile 47,794 28,028 Argentina 38,077 18,640 Mexico — 1,756,042 Bolivia — 151,716 Other foreign countries — 190 Total $ 215,319 $ 2,303,264 2006 United States $ 102,393 $ 218,236 Australia 29,154 44,253 Chile 50,293 20,295 Argentina 34,733 3,700 Bolivia — 50,858 Other foreign countries — 214 Total $ 216,573 $ 337,556 2005 United States $ 69,636 $ 101,338 Australia 6,418 49,860 Chile 59,624 19,407 Argentina 20,606 2,568 Bolivia — 32,194 Other foreign countries — 237 Total $ 156,284 $ 205,604
NOTE RS — LITIGATIONFederal Natural Resources Action
On March 22, 1996, an action was filed in the United States District Court for the District of Idaho by the United States against various defendants, including the Company, asserting claims under CERCLA and the Clean Water Act for alleged damages to federal natural resources in the Coeur d’Alene River Basin of Northern Idaho. The damages are claimed to result from alleged releases of hazardous substances from mining activities conducted in the area since the late 1800s.
In May 2001, the Company and representatives of the U.S. Government, including the Environmental Protection Agency, the Department of Interior and the Department of Agriculture, reached an agreement to settle the lawsuit. The terms of settlement are set forth in a Consent Decree issued by the court. Pursuant to the terms of the Consent Decree, dated May 14, 2001, the Company has paid the U.S. Government a total of approximately $3.9 million, of which $3.3 million was paid in May 2001 and the remaining $0.6 million was paid in June 2001. In addition, the Company will (i) pay the United States 50% of any future recoveries from insurance companies for claims for defense and indemnification under general liability insurance policies in excess of $0.6 million, (ii) accomplish certain cleanup work on the Mineral Point property and Caladay property, and (iii) make a conveyance to the U.S. or the State of Idaho of certain real property to possibly be used as a waste repository. Finally, commencing five years after effectiveness of the settlement, the Company will be obligated to pay royalties on all of its domestic and foreign operating properties, up to a cumulative of $3 million, amounting to a 2% net smelter royalty on silver production if the price of silver exceeds $6.50 per ounce, and a $5.00 per ounce royalty on gold production if the price of gold exceeds $325 per ounce. The royalty payment obligation commenced on May 14, 2006 and expires May 14, 2021. As of December 31, 2006, $2.5 million (including discontinued operations) of the $3.0 million was paid. It is expected that the remaining $0.5 million will be paid in the first half of 2007.
F-42
States of Maine, Idaho Andand Colorado Superfund Sites Related to Callahan Mining Corporation During 1991, the Company acquired all of the outstanding common stock of Callahan Mining Corporation. During 2001, the United States Forest Service made a formal request for information regarding the Deadwood Mine Site located in central Idaho. Callahan Mining Corporation had operated at this site during the 1940‘s.1940’s. The Forest Service believes that some cleanup action is required at the location. However, Coeur d’Alene Mines Corporation did not acquire Callahan until 1991, more than 40 years after Callahan disposed of its interest in the Deadwood property. The Company did not make any decisions with respect to generation, transport or disposal of hazardous waste at the site. Therefore, it is believed that the Company is not liable for any cleanup, and if Callahan might be liable, it has no substantial assets with which to satisfy any such liability. To date, no claim has been made by the United States for any cleanup costs against either the Company or Callahan.F-42
During 2002, the EPA made a formal request for information regarding a Callahan mine site in the State of Maine. Callahan operated there in the late 1960‘s,1960’s, shut the operations down in the early 1970‘s1970’s and disposed of the property. The EPA contends that some cleanup action is warranted at the site, and listed it on the National Priorities List in late 2002. The Company believes that because it made no decisions with respect to generation, transport or disposal of hazardous waste at this location, it is not liable for any cleanup costs. If Callahan might have liability, it has no substantial assets with which to satisfy such liability. To date, no claim has been made for any cleanup costs against either the Company or Callahan. In January 2003, the U.S. Forest Service made a formal request for information regarding a Callahan mine site in the State of Colorado known as the Akron Mine Site. Callahan operated there in approximately the late 1930s through the 1940s, and to the Company’s knowledge, disposed of the property. The Company is not aware of what, if any, cleanup action the Forest Service is contemplating. However, the Company did not make decisions with respect to generation, transport or disposal of hazardous waste at this location, and therefore believes it is not liable for any cleanup costs. If Callahan might have liability, it has no substantial assets with which to satisfy such liability. To date, no claim has been made for any cleanup costs against either the Company or Callahan.Federal District Court of Alaska Permit Challenge On September 12, 2005 three environmental groups (“Plaintiffs”) filed a lawsuit in Federal District Court in Alaska against the U.S. Army Corps of Engineers (“Corps of Engineers”) and the U.S. Forest Service (“USFS”) seeking to invalidate the permit issued to Coeur Alaska, Inc. for the Company’s Kensington mine. The Plaintiffs claim the Clean Water Act (CWA)(“CWA”) Section 404 permit issued by the Corps of Engineers authorizing the deposition of mine tailings into Lower Slate Lake conflicts with the CWA and is thus illegal.CWA. They additionally claim the USFS’s approval of the Amended Plan of Operations is arbitrary and capricious because it relies on the 404 permit issued by the Corps of Engineers. On November 8, 2005, Following the Corps of Engineers filed a Motion for Voluntary Remand with the court to review the permit issued to the Company under the CWA Section 404 and requested that the court stay the legal proceeding filed by the plaintiffs pending the outcome of review. On November 12, 2005, the Federal District Court in Alaska granted theCourt’s remand of the Section 404 permit to the Corps of Engineers for further review. On November 22, 2005,review, the Corps of Engineers advised the Company that it was suspending the Section 404 permit pursuant to the Court’s remand to further review the permit.
On March 29, 2006, the Corps of Engineers reinstated the Company’s 404 permit. On April 6, 2006 thepermit on March 29, 2006. The lawsuit challenging the permit was re-opened andon April 6, 2006; Coeur Alaska Inc. filed its answer to the Amended ComplaintComplaint; and Motion to Intervene as a Defendant-Intervenor in the action. Two other parties,Coeur Alaska, the State of Alaska, and Goldbelt, Inc., a local native corporation, also filed Motions to Intervene as Defendant-Intervenors as supporters of the Kensington project as permitted. The Company, the State of Alaska and Goldbelt, Inc. were granted Defendant-Intervenor status and joinedto join the agencies in their defense of the permits as issued.
F-43
permit.
On August 4, 2006, the Federal District Court in Alaska dismissed the Plaintiffs’ challenge and upheld the Section 404 permit. On August 7, 2006 the Plaintiffs filed a Notice of Appeal of the decision to the Ninth Circuit Court of Appeals (“Ninth Circuit Court”) and on August 9, 2006 the Plaintiffs additionally filed a Motion for Injunction Pending Appeal with the Ninth Circuit Court. The Ninth Circuit Court granted a temporary injunction pending appeal on August 24, 2006, enjoining certain activities relating to the lake tailings facility. The On May 22, 2007 the Ninth Circuit Court further ordered an expedited briefing schedulereversed the District Court’s August 4, 2006 decision which had upheld the Company’s 404 permit and issued its opinion that remanded the case to the District Court with instructions to vacate the Company’s 404 permit as well as the USFS Record of Decision approving the general tailings disposal plan as well as the Goldbelt 404 permit to construct the Cascade Point Marine Facility. On August 20, 2007, Coeur Alaska filed a Petition for Rehearing En Banc with the Ninth Circuit Court, as did the State of Alaska and Goldbelt, Inc. The Department of Justice, on the meritsbehalf of the legal challenge. AsCorps of Engineers, and USFS additionally filed a limited Petition for Rehearing with the Ninth Circuit panel seeking reconsideration of the mandate of the May 22, 2007 panel decision. On October 13, 2006,29, 2007, the parties filed their briefs inNinth Circuit denied the Petitions for Rehearing En Banc. On November 14, 2007, the Ninth Circuit granted a stay of the mandate pending further appeal to the Supreme Court, and participated in an oral argument on December 4, 2006. There is no indicationsubject to the development of whena reclamation plan for the Circuit Court may rule on the merits of appeal.lake area. The Company is unableand the State of Alaska filed Petitions for Certiorari to the Supreme Court of the United States on January 28, 2008. The Company cannot now predict the outcome ofpotential for obtaining further appeal or if it will prevail upon appeal if one is granted.F-43
No assurance can be given as to whether or when regulatory permits and approvals granted to the litigation.Company may be further challenged, appealed or contested by third parties or issuing agencies, or as to whether the Company will place the Kensington project into commercial production.
This litigation has contributed to an increase in capital costs. While the Company cannot now predict with certainty the outcome of this litigation, it believes it willshould ultimately prevail in the defense of the awarded permits, inprevail. In the event that the Company does not prevail, it could be necessary to seek an alternate site for the tailings disposal facility. The Company is not aware ofhas identified an alternate site that couldwhich it believes can be permitted or would be economic. Therefore, it is possible that an adverse legal decision could renderand has submitted a modified plan to the project uneconomic and an asset impairment would be necessary. As a result ofUSFS. Based upon the increase in capital and operating costs at the Kensington project,Company’s current estimates, an impairment writedown could be necessary should the expectation of the long-term price for gold decrease below approximately $510$606 per ounce. As of December 31, 2006,2007, the Kensington project has a carrying value of $206the Kensington project’s long-lived assets was $298.2 million.NOTE ST — SUMMARY OF QUARTERLY FINANCIAL DATA (UNAUDITED) The following table sets forth a summary of the quarterly results of operations for the years ended December 31, 2007 and 2006 and 2005:First
Quarter
Second
Quarter
Third
Quarter
Fourth
Quarter
(In Thousands - Except Per Share Data)
2006: Sales of metal $ 44,854 $ 54,041 $ 50,606 $ 67,072
Income (loss) from continuing operations $ 13,726 $ 20,132 $ 18,378 $ 23,183 Income (loss) from discontinued operations 612 12,516 (27 ) (33 )
Net income (loss) $ 14,338 $ 32,648 $ 18,351 $ 23,150
Basic net income (loss) per share Income (loss) from continuing operations $ 0.06 $ 0.07 $ 0.07 $ 0.08 Income (loss) from discontinued operations -- 0.05 -- --
Net income (loss) $ 0.06 $ 0.12 $ 0.07 $ 0.08
Diluted net income (loss) per share Income (loss) from continuing operations $ 0.05 $ 0.07 $ 0.06 $ 0.08 Income (loss) from discontinued operations -- 0.04 -- --
Net income (loss) $ 0.05 $ 0.11 $ 0.06 $ 0.08
(in thousands — except for per share data): First Second Third Fourth Quarter Quarter Quarter Quarter 2007: Sales of metal $ 50,860 $ 51,664 $ 52,863 $ 59,931 Net income $ 14,018 $ 11,918 $ 3,635 $ 14,319 Basic net income per share $ 0.05 $ 0.04 $ 0.01 $ 0.05 Diluted net income per share $ 0.05 $ 0.04 $ 0.01 $ 0.04
First Second Third Fourth Quarter Quarter Quarter Quarter 2006: Sales of metal $ 44,854 $ 54,041 $ 50,606 $ 67,072 Income from continuing operations $ 13,726 $ 20,132 $ 18,378 $ 23,183 Income from discontinued operations 612 12,516 (27 ) (33 ) Net income $ 14,338 $ 32,648 $ 18,351 $ 23,150 Basic net income per share Income from continuing operations $ 0.06 $ 0.07 $ 0.07 $ 0.08 Income from discontinued operations — 0.05 — — Net income $ 0.06 $ 0.12 $ 0.07 $ 0.08 Diluted net income per share Income from continuing operations $ 0.05 $ 0.07 $ 0.06 $ 0.08 Income from discontinued operations — 0.04 — — Net income $ 0.05 $ 0.11 $ 0.06 $ 0.08
F-44
First
Quarter
Second
Quarter
Third
Quarter
Fourth
Quarter
(In Thousands - Except Per Share Data)
2005: Sales of metal $ 32,235 $ 33,504 $ 39,281 $ 51,264 Income (loss) from continuing operations $ (784 ) $ (529 ) $ 4,722 $ 11,337 Income (loss) from discontinued operations (361 ) (1,172 ) (1,269 ) (1,393 )
Net income (loss) $ (1,145 ) $ (1,701 ) $ 3,453 $ 9,944
Basic net income (loss) per share Income (loss) from continuing operations $ 0.00 $ 0.00 $ 0.02 $ 0.05 Income (loss) from discontinued operations -- (0.01 ) (0.01 ) (0.01 )
Net income (loss) $ 0.00 $ (0.01 ) $ 0.01 $ 0.04
Diluted net income (loss) per share Income (loss) from continuing operations $ 0.00 $ 0.00 $ 0.02 $ 0.04 Income (loss) from discontinued operations -- (0.01 ) (0.01 ) --
Net income (loss) $ 0.00 $ (0.01 ) $ 0.01 $ 0.04
NOTE U — SUBSEQUENT EVENTDuring February 2008, Cobar reported to the Company that the reserves at the Endeavor mine exceed those reported for 2004, thereby fulfilling the contractual condition discussed in Note H. Consequently, the Company expects to pay Cobar the additional $26.3 million on April 1, 2008 plus accrued interest at the rate of 7.5% per annum from January 24, 2008.F-45
| Mine/Company | Coeur Percentage Ownership at December 31, 2006 | Percentage of Total Revenues(2) for the Years Ended December 31, | |||||||||||
| 2006 | 2005 | 2004 | 2003 | 2002 | |||||||||
| Rochester Mine | 100 | % | 47 | % | 45 | % | 59 | % | 48 | % | 78 | % | |
| Cerro Bayo Mine | 100 | 23 | 38 | 32 | 43 | 17 | |||||||
| Martha Mine | 100 | 16 | 13 | 9 | 9 | 5 | |||||||
| Endeavor Mine(1) | 100 | 3 | 1 | -- | -- | -- | |||||||
| Broken Hill Mine(1) | 100 | 11 | 3 | -- | -- | -- | |||||||
| 100 | % | 100 | % | 100 | % | 100 | % | 100 | % | ||||
| Coeur Percentage | Percentage of Total Revenues(2) | |||||||||||||||||||||||
| Ownership at | for the Years Ended December 31, | |||||||||||||||||||||||
| Mine/Company | December 31, 2007 | 2007 | 2006 | 2005 | 2004 | 2003 | ||||||||||||||||||
| Rochester Mine | 100 | % | 47 | % | 47 | % | 45 | % | 59 | % | 48 | % | ||||||||||||
| Cerro Bayo Mine | 100 | 22 | 23 | 38 | 32 | 43 | ||||||||||||||||||
| Martha Mine | 100 | 18 | 16 | 13 | 9 | 9 | ||||||||||||||||||
Endeavor Mine(1) | 100 | 4 | 3 | 1 | — | — | ||||||||||||||||||
Broken Hill Mine(1) | 100 | 9 | 11 | 3 | — | — | ||||||||||||||||||
| 100 | % | 100 | % | 100 | % | 100 | % | 100 | % | |||||||||||||||
| (1) | Ownership interest reflects the Company’s ownership interest in the property’s silver |
| (2) | On June 1, 2006, the Company completed its sale of Coeur Silver Valley (Galena). The Company’s interest in the Galena mine was 100% prior to the sale. Revenues from the Galena mine are reflected in Discontinued Operations. |
DEFINITIONS The following sets forth definitions of certain important mining terms used in this report.“Ag”is the abbreviation for silver.“Au”is the abbreviation for gold.“Cash Costs”are costs directly related to the physical activities of producing silver and gold, and include mining, processing, transportation and other plant costs, third-party refining and smelting costs, marketing expense, on-site general and administrative costs, royalties and in-mine drilling expenditures that are related to production and other direct costs. Sales of by-product metals, including gold, are deducted from the above in computing cash costs per ounce. Cash costs exclude depreciation, depletion and amortization, corporate general and administrative expense, exploration, interest, and pre-feasibility costs and accruals for mine reclamation. Cash costs are calculated and presented using the “Gold Institute Production Cost Standard” applied consistently for all periods presented.“Cash Costs per Ounce”are calculated by dividing the cash costs computed for each of the Company’s mining properties for a specific period by the amount of gold ounces or silver ounces produced by that property during that same period. Management uses cash costs per ounce produced as a key indicator of the profitability of each of its mining properties. Gold and silver are sold and priced in the world financial markets on a USU.S. dollar per ounce basis. By calculating the cash costs from each of the Company’s mines on the same unit basis, management can easily determine the gross margin that each ounce of gold and silver produced is generating. While this represents a key indicator of the performance of the Company’s mining properties you are cautioned not to place undue reliance on this single measurement. To fully evaluate a mine’s performance, management also monitors USU.S. Generally Accepted Accounting Principles (“GAAP”) based profit/(loss), depreciation and amortization expenses and capital expenditures for each mine as presented in Note Q –R — Segment Information in the Notes to the Company’s Consolidated Financial Statements. Total cash costs per ounce is a non-GAAP measurement and investors are cautioned not to place undue reliance on it and are urged to read all GAAP accounting disclosures presented in the consolidated financial statements and accompanying footnotes.5
7
6
Item 1A. Risk Factors The following information sets forth information relating to important risks and uncertainties that could materially adversely affect the Company’s business, financial condition or operating results. References to “we,” “our” and “us” in these risk factors refer to the Company. Additional risks and uncertainties that we do not presently know or that we currently deem immaterial may also impair our business operations.Risks Relating to our Business
Prior to 2005, we incurred losses due to several factors and could incur losses in the future. We incurred net losses in the five years prior to 2005 and had losses from continuing operations in each of those prior periods. Factors that significantly contributed to our losses were:
8
historically low gold and silverThe market prices during those years;
our deliberate pursuit of a growth policy prior to 2003 calling for the acquisition of mining propertiessilver and companies and financing such growth principally by incurring convertible indebtedness which had a high coupon rate, thereby resulting in an interest expense of $21.9 million in 2002, $12.9 million in 2003 and $2.8 million in 2004;
write-offs for impaired assets and other holding costs in 2002 of $19.0 million; and
losses on the early retirement of debt of $19.1 million in 2002, and $41.6 million in 2003.
gold are volatile. If we experience low silver and gold prices declineit may result in decreased revenues and decreased net income or losses, and may negatively affect our business.
Silver and gold are commodities. Their prices fluctuate, and are affected by many factors beyond our control, including interest rates, expectations regarding inflation, speculation, currency values, governmental decisions regarding the disposal of precious metals stockpiles, global and regional demand and production, political and economic conditions and other factors. Because we currently derive approximately 70% of our revenues from continuing operations from sales of silver, our earnings are unableprimarily related to reduce our production costs, our losses may resume. If lowerthe price of this metal.7
Risks Relating to our Business
We incurred net losses in the five years prior to 2005 and had losses from continuing operations in each of those prior periods. Factors that significantly contributed to our losses were:
8
gold are volatile. If we experience low silver and gold prices declineit may result in decreased revenues and decreased net income or losses, and may negatively affect our business.
8
The market prices of silver and gold are volatile. If we experience low silver and gold prices it may result in decreased revenues and decreased net income or losses, and may negatively affect our business.
9
Silver and gold are commodities. Their prices fluctuate, and are affected by many factors beyond our control, including interest rates, expectations regarding inflation, speculation, currency values, governmental decisions regarding the disposal of precious metals stockpiles, global and regional demand and production, political and economic conditions and other factors. Because we currently derive approximately 68% of our revenues from continuing operations from sales of silver, our earnings are primarily related to the price of this metal.
On November 8, 2005, Following the Corps of Engineers filed a Motion for Voluntary Remand with the court to review the permit issued to the Company under the CWA Section 404 and requested that the court stay the legal proceeding filed by the plaintiffs pending the outcome of review. On November 12, 2005, the Federal District Court in Alaska granted theCourt’s remand of the Section 404 permit to the Corps of Engineers for further review. On November 22, 2005,review, the Corps of Engineers advised the Company that it was suspending the Section 404 permit pursuant to the Court’s remand to further review the permit.
10
On March 29, 2006, the Corps of Engineers reinstated the Company’s 404 permit. On April 6, 2006 thepermit on March 29, 2006. The lawsuit challenging the permit was re-opened andon April 6, 2006; Coeur Alaska Inc. filed its answer to the Amended ComplaintComplaint; and Motion to Intervene as a Defendant-Intervenor in the action. Two other parties,Coeur Alaska, the State of Alaska, and Goldbelt, Inc., a local native corporation, also filed Motions to Intervene as Defendant-Intervenors as supporters of the Kensington project as permitted. The Company, the State of Alaska and Goldbelt, Inc. were granted Defendant-Intervenor status and joinedto join the agencies in their defense of the permits as issued.
permit.
9
10
11
11
12
12
| Positive/Negative Change in Silver Recovery | Positive/Negative Change in Gold Recovery | |||||||||||||||||||
|---|---|---|---|---|---|---|---|---|---|---|---|---|---|---|---|---|---|---|---|---|
| 1% | 2% | 3% | 1% | 2% | 3% | |||||||||||||||
| Quantity of recoverable | ||||||||||||||||||||
| ounces | 1.7 million | 3.4 million | 5.1 million | 12,900 | 25,800 | 38,700 | ||||||||||||||
Positive impact on | ||||||||||||||||||||
| future cost of | ||||||||||||||||||||
| production per silver | ||||||||||||||||||||
| equivalent ounce for | ||||||||||||||||||||
| increases in recovery rates | $1.06 | $1.83 | $2.43 | $0.42 | $0.79 | $1.13 | ||||||||||||||
Negative impact on | ||||||||||||||||||||
| future cost of | ||||||||||||||||||||
| production per silver | ||||||||||||||||||||
| equivalent ounce for | ||||||||||||||||||||
| decreases in recovery rates | $1.51 | $3.87 | $8.03 | $0.48 | $1.03 | $1.66 | ||||||||||||||
| Positive/Negative | Positive/Negative | |||||||||||||||||||||||
| Change in Silver Recovery | Change in Gold Recovery | |||||||||||||||||||||||
| 1% | 2% | 3% | 1% | 2% | 3% | |||||||||||||||||||
| Quantity of recoverable ounces | 1.7 million | 3.5 million | 5.2 million | 13,240 | 26,480 | 39,720 | ||||||||||||||||||
| Positive impact on future cost of production per silver equivalent ounce for increases in recovery rates | $ | 1.68 | $ | 2.78 | $ | 3.55 | $ | 0.82 | $ | 1.49 | $ | 2.04 | ||||||||||||
| Negative impact on future cost of production per silver equivalent ounce for decreases in recovery rates | $ | (2.93 | ) | $ | (9.30 | ) | $ | (33.77 | ) | $ | (1.04 | ) | $ | (2.38 | ) | $ | (4.21 | ) | ||||||
operations, financial position and cash flows.
13
13
14
14
Our
15
16
There is no assurance that future changes in environmental regulation, if any, will not adversely affect Coeur’s operations. Coeur intends to fully comply with all applicable environmental regulations.
15
On September 12, 2005 three environmental groups filed a lawsuit in Federal District Court
On August 4, 2006, the Federal District Court in Alaska dismissed the Plaintiffs’ challenge and upheld the Section 404 permit. On August 7, 2006 the Plaintiffs filed a Notice of Appeal of the decision to the Ninth Circuit Court of Appeals (“Circuit Court”) and on August 9, 2006 Plaintiffs additionally filed a Motion for Injunction Pending Appeal with the Circuit Court. The Circuit Court granted a temporary injunction pending appeal on August 24, 2006, enjoining certain activities relating to the lake tailings facility. The Circuit Court further ordered an expedited briefing scheduledevelopment program on the merits ofPalmarejo project, Coeur cannot be certain that it will receive the legal challenge. On October 13, 2006,necessary permits on acceptable terms to conduct further exploration and to develop the parties filed their briefsPalmarejo project in accordance with its pre-feasibility study. The failure to obtain such permits, or delays in obtaining such permits, could increase costs and delay activities, and could adversely affect the Circuit Court and oral argument was heard on December 4, 2006. There is no indication of when the Circuit Court may rule on the merits on appeal and the Company is unable to predict the outcome of this litigation or its impact on thePalmarejo project.
Additionally, the Company had 21 employees at its San Bartolomé project working under a labor agreement which does not have a fixed term.
17
16
Further, property ownership in a foreign country is generally subject to the risk of expropriation or nationalization with inadequate compensation.
.
18
19
Item 1B. Unresolved Staff CommentsNone
17
Item 2. Properties.20062007 was approximately 4.6 million ounces of silver and 50,400 ounces of gold, compared to 5.1 million ounces of silver and 71,900 ounces of gold compared to 5.7 million ounces of silver and 70,298 ounces of gold in 2005.2006. Cash costs per ounce of silver decreased by 42%$1.28 to $1.52 per ounce in 2007, compared to $2.80 per ounce in 2006, compared to $4.82 per ounce2006. The decrease in 2005,silver production was primarily due to increased byproduct credits.decreased tons mined and lower ore grades. The decrease in cash costs per ounce is due to decreased mining and crushing costs during the year due to the fact that mining and crushing operations were terminated in August 2007 as ore reserves were fully mined. Residual heap leach activities are expected to continue through 2011.
The mine utilizes the heap leaching process to extract both silver and gold from ore mined using conventional open pit methods. Approximately 34,800 tons of ore and waste per day were mined in 2006, compared to 47,300 tons per day in 2005. The average ore to waste strip ratio for the remaining life of the mine will vary based primarily on future gold and silver prices; however, it is anticipated to be less than 1:1. The Company expects to completecompleted mining of the existing ore reserves near the middlein August of 2007. While mining operations will bewere discontinued, it is expected that metal production will continue as a result of residual leaching until approximately 2011. The company is currently conducting exploration on mineralized structures that exist near the pit bottom.20
17
decreased tons mined and lower ore grades. The decrease in cash costs per ounce is due to decreased mining and crushing costs during the year due to the fact that mining and crushing operations were terminated in August 2007 as ore reserves were fully mined. Residual heap leach activities are expected to continue through 2011.
20
2008.
2007.
(includes Nevada Packard)
| 2006 | 2005 | 2004 | |||||
|---|---|---|---|---|---|---|---|
| (1,3,4,5,6) | (1,3,4,5,6) | ||||||
Tons (000’s) | 3,720 | 10,168 | 23,998 | ||||
| Ounces of silver per ton | 0.66 | 0.86 | 0.86 | ||||
| Contained ounces of silver (000’s) | 2,436 | 8,765 | 20,731 | ||||
| Ounces of gold per ton | 0.007 | 0.011 | 0.009 | ||||
| Contained ounces of gold | 26,400 | 112,650 | 213,000 | ||||
| 2007 | 2006 | 2005 | ||||||||||
| (1), (3), (5), (6) | ||||||||||||
| Tons (000’s) | 0 | 3,720 | 10,168 | |||||||||
| Ounces of silver per ton | 0 | 0.66 | 0.86 | |||||||||
| Contained ounces of silver (000’s) | 0 | 2,436 | 8,765 | |||||||||
| Ounces of gold per ton | 0 | 0.007 | 0.011 | |||||||||
| Contained ounces of gold | 0 | 26,400 | 112,650 | |||||||||
21
| 2006 | 2005 | 2004 | |||||
|---|---|---|---|---|---|---|---|
| Tons (000’s) | 15,235 | 15,646 | 35,064 | ||||
| Ounces of silver per ton | 0.94 | 1.03 | 0.86 | ||||
| Ounces of gold per ton | 0.007 | 0.010 | 0.005 | ||||
19
| 2007 | 2006 | 2005 | ||||||||||
| Tons (000’s) | 32,664 | 15,235 | 15,646 | |||||||||
| Ounces of silver per ton | 0.85 | 0.94 | 1.03 | |||||||||
| Ounces of gold per ton | 0.006 | 0.007 | 0.010 | |||||||||
| 2006 | 2005 | 2004 | |||||
|---|---|---|---|---|---|---|---|
| (2) | |||||||
Production | |||||||
| Tons ore mined (000’s) | 9,804 | 9,023 | 10,751 | ||||
| Tons crushed/leached (000’s) | 10,399 | 9,327 | 8,976 | ||||
| Ore grade silver (oz./ton) | 0.74 | 0.91 | 0.74 | ||||
| Ore grade gold (oz./ton) | 0.010 | 0.010 | 0.009 | ||||
| Recovery/Ag oz(4) | 65.9 | % | 67.5 | % | 61.5 | % | |
| Recovery/Au oz(4) | 68.9 | % | 76.2 | % | 64.2 | % | |
| Silver produced (oz.) | 5,113,504 | 5,720,489 | 5,669,074 | ||||
| Gold produced (oz.) | 71,891 | 70,298 | 69,456 | ||||
Cost per Ounce of Silver | |||||||
| Cash costs(2) | $2.80 | $4.82 | $3.93 | ||||
| Non-cash costs | 3.04 | 1.84 | 1.73 | ||||
| Total production costs | $5.84 | $6.66 | $5.66 | ||||
| 2007 | 2006 | 2005 | ||||||||||
Production | ||||||||||||
| Tons ore mined (000’s) | 2,962 | 9,804 | 9,023 | |||||||||
| Tons crushed/leached (000’s) | 5,061 | 10,399 | 9,327 | |||||||||
| Ore grade silver (oz./ton) | 0.65 | 0.74 | 0.91 | |||||||||
| Ore grade gold (oz./ton) | 0.006 | 0.010 | 0.010 | |||||||||
Recovery/Ag oz(4) | 141.4 | % | 65.9 | % | 67.5 | % | ||||||
Recovery/Au oz(4) | 167.6 | % | 68.9 | % | 76.2 | % | ||||||
| Silver produced (oz.) | 4,614,780 | 5,113,504 | 5,720,489 | |||||||||
| Gold produced (oz.) | 50,408 | 71,891 | 70,298 | |||||||||
Cost per Ounce of Silver | ||||||||||||
Cash costs(2) | $ | 1.52 | $ | 2.80 | $ | 4.82 | ||||||
| Non-cash costs | 2.30 | 3.04 | 1.84 | |||||||||
| Total production costs | $ | 3.82 | $ | 5.84 | $ | 6.66 | ||||||
| (1) | Metal prices used in calculating proven and probable reserves were |
| (2) | Cash costs per ounce of silver or gold represent a non-U.S. GAAP measurement that management uses to monitor and evaluate the performance of its mining operations. See “Item 7: Management’s Discussion and Analysis of Financial Condition and Results of Operations |
| (3) | The ore reserves are open pit minable reserves and include no additional factors for mining dilution or recovery. |
| (4) | The leach cycle at Rochester requires 5 to 10 years to recover gold and silver contained in the ore. The Company estimates the ultimate recovery to be approximately 61.5% for silver and |
| (5) | Ore reserve estimates were prepared by the Company’s technical staff. |
| (6) | Ore reserves are defined by a drill grid of at least 65 feet by 140 feet for proven and at least 100 feet by 200 feet for probable and may include open pit mine production sampling information, especially for proven. In practice, ore reserve blocks are defined by the number of proximal composites and three-dimensional geologic controls. For proven reserves, the number of composites must be at least 4 at Rochester and 20 at Nevada Packard with a maximum search distance of 75 feet. For probable reserves, the number of composites must be at least 4 at Rochester and 5 at Nevada Packard with a maximum search distance of 150 feet for Rochester and 120 feet at Nevada Packard. Mineralized material is similarly classified. |
22
20
mining and exploration.
tons mined.
2008.
23
21
| 2006 | 2005 | 2004 | |||||
|---|---|---|---|---|---|---|---|
| (1,3,4,5,6,7) | |||||||
Tons (000’s) | 634 | 935 | 862 | ||||
| Ounces of silver per ton | 9.69 | 8.00 | 7.09 | ||||
| Contained ounces of silver (000’s) | 6,144 | 7,476 | 6,109 | ||||
| Ounces of gold per ton | 0.19 | 0.14 | 0.13 | ||||
| Contained ounces of gold | 122,000 | 131,600 | 115,900 | ||||
| 2007 | 2006 | 2005 | ||||||||||
| (1), (3), (5), (6), (7), (8) | ||||||||||||
| Tons (000’s) | 782 | 634 | 935 | |||||||||
| Ounces of silver per ton | 9.26 | 9.69 | 8.00 | |||||||||
| Contained ounces of silver (000’s) | 7,234 | 6,144 | 7,476 | |||||||||
| Ounces of gold per ton | 0.14 | 0.19 | 0.14 | |||||||||
| Contained ounces of gold | 111,600 | 122,000 | 131,600 | |||||||||
| 2006 | 2005 | 2004 | |||||
|---|---|---|---|---|---|---|---|
| Tons (000’s) | 2,509 | 4,113 | 3,829 | ||||
| Ounces of silver per ton | 8.23 | 6.19 | 4.29 | ||||
| Ounces of gold per ton | 0.15 | 0.10 | 0.13 | ||||
| 2007 | 2006 | 2005 | ||||||||||
| Tons (000’s) | 2,865 | 2,509 | 4,113 | |||||||||
| Ounces of silver per ton | 9.28 | 8.23 | 6.19 | |||||||||
| Ounces of gold per ton | 0.14 | 0.15 | 0.10 | |||||||||
| 2006 | 2005 | 2004 | |||||
|---|---|---|---|---|---|---|---|
| (2) | |||||||
Production | |||||||
| Tons ore milled | 428,346 | 403,695 | 456,941 | ||||
| Ore grade silver (oz./ton) | 5.76 | 7.52 | 7.51 | ||||
| Ore grade gold (oz./ton) | 0.103 | 0.163 | 0.137 | ||||
| Recovery silver (%) | 94.5 | 94.7 | 94.2 | ||||
| Recovery gold (%) | 93.0 | 92.8 | 91.8 | ||||
| Silver produced (oz.) | 2,331,060 | 2,875,047 | 3,235,192 | ||||
| Gold produced (oz.) | 40,923 | 61,058 | 57,558 | ||||
Cash costs(2) | $3.04 | $0.54 | $1.01 | ||||
| Non-cash costs | 2.42 | 1.76 | 1.42 | ||||
| Total production costs | $5.46 | $2.30 | $2.43 | ||||
| 2007 | 2006 | 2005 | ||||||||||
Production | ||||||||||||
| Tons ore milled | 387,378 | 428,346 | 403,695 | |||||||||
| Ore grade silver (oz./ton) | 4.68 | 5.76 | 7.52 | |||||||||
| Ore grade gold (oz./ton) | 0.105 | 0.103 | 0.163 | |||||||||
| Recovery silver (%) | 94.4 | 94.5 | 94.7 | |||||||||
| Recovery gold (%) | 92.2 | 93.0 | 92.8 | |||||||||
| Silver produced (oz.) | 1,709,830 | 2,331,060 | 2,875,047 | |||||||||
| Gold produced (oz.) | 37,479 | 40,923 | 61,058 | |||||||||
Cash costs(2) | $ | 8.22 | $ | 3.04 | $ | 0.54 | ||||||
| Non-cash costs | 3.60 | 2.42 | 1.76 | |||||||||
| Total production costs | $ | 11.82 | $ | 5.46 | $ | 2.30 | ||||||
| (1) | Metal prices used to calculate proven and probable reserves were |
| (2) | Cash costs per ounce of silver or gold represent a non-U.S.-GAAP measurement that management uses to monitor and evaluate the performance of its mining operations. See “Item 7: Management’s Discussion and Analysis of Financial Condition and Results of Operations; Reconciliation of Non-GAAP Cash Costs to GAAP Production Costs.” |
| (3) | The ore reserves are minable reserves within underground mine designs and include factors for mining dilution and recovery. |
| (4) | Veins less than 1.2 meters wide are diluted to 1.2 meters at zero grade. Veins greater than 1.2 meters wide receive a 0.2 meter dilution |
| (5) | Metallurgical (mill) recovery factors of 93.8% and 91.6% should be applied to the in-place silver and gold reserves ounces, respectively. |
24
| (6) | Ore reserve estimates were prepared by the Company’s technical staff. |
| (7) | Proven and probable ore reserves are defined by a drill spacing of no more than 35 meters and may include underground production sampling information, especially for proven. In practice, ore reserve blocks are defined by the number of proximal composites and three-dimensional geologic controls. For proven reserves the number of composites must be at least 1 with a maximum search distance of generally 15 meters. For probable, the number of composites must be at least 2 with a maximum search distance of generally 35 meters. Mineralized material is similarly classified. | |
| (8) | Mineralized material includes 1,599,400 tons grading 10.21 Ag ounces per ton and 0.14 Au ounces per ton classified as additional Inferred Mineral Resources. |
22
Argentina –— Martha Mine The Martha Mine,mine is an underground mine owned and operated by Coeur Argentina S.R.L., a wholly-owned subsidiary of the Company, which is located in the Santa Cruz Province of southern Argentina. Access to the mine is provided by all-weather gravel roads 30 miles northeast of the town of Gubernador Gregores and approximately 270 miles southeast of Cerro Bayo. The mineral rights for the Martha property are fully-owned by Coeur Argentina S.R.L., encompassing a continuous block of 137,978over 363,000 acres of exploration claims, 83,813 acres of discovery claims, and 351 acres of exploitation claims.claims (568 square miles). The concessions cover the ore reserves of the property as well as the necessary rights to permit mining.mining and exploration. The property and equipment are maintained in good working condition through a regular preventive maintenance program and periodic improvements as required. Power is provided by Company-owned diesel generators. The Company acquired the property in 2002 through the purchase of a subsidiary of Yamana Resources Inc. for $2.5 million. The prior owner conducted minor underground mining on the near-surface portion of the Martha vein from late 2000 to mid 2001. The Company is obligated to pay a 2% net smelter royalty on silver and gold production to Royal Gold Corporation. We transport ore mined utilizing underground methods at
Prior to January 1, 2008 we transported the Martha Minemine ore by truck approximately 600 miles by road for processing at the Cerro Bayo mill, which is located 270 miles northwest of the Martha Mine. The transport costs to ship the ore to the Cerro Bayo mill from the Martha Mine have necessitated a focus on the highest grade portions of the veins discovered at the Martha Mine; however, lower grade mineralized material exists, but is not included in reserves. Duringmill. In 2007, the Company planscommenced the construction of a 240 ton per day flotation mill which was completed in December 2007 and produces a flotation concentrate. During December 2007, the newly-constructed facility commenced operating. In 2008, we will commence shipping the concentrate to complete a feasibility study atthird party smelter located in Mexico. The new mill is expected to lower operating costs since it will no longer be necessary to transport ore to Cerro Bayo for processing. This is expected to have a beneficial impact upon the Martha mine which may allow the processing of the lower-grade material.ore reserve cut-off grade and overall ore reserves.
In June 2002, we commenced shipping of high-grade Martha Minemine ore to the Cerro Bayo mill. All of the production came from the Martha vein, which was one of six known veins on the Martha Mine property prior to our acquisition of the property. Also in 2002, exploration discovered both extensions of the Martha Mine vein and the R4 Zone within the vein, which is located 300 feet southwest of the main Martha Mine mining areas. Production at the Martha mine in 20062007 was approximately 2.7 million ounces of silver and 4,127 ounces of gold compared to 2.7 million ounces of silver and 3,440 ounces of gold compared to 2.1 million ounces of silver and 2,589 ounces of gold in 2005.2006. Cash cost per ounce of silver produced was $6.27 in 2007 compared to $4.88 in 2006 compared to $4.60 in 2005.2006.
During 2006,2007, we spent $3.6$2.0 million on exploration and mine$0.8 million on reserve development at the Martha Mine,mine, and $2.4 million at our other properties in the Santa Cruz province, to discover new silver- and gold-bearing veins and define new reserves. In 2007, exploration defined extensions at depth and on strike on the Martha, R4, Catalina, Francisca, Isabel and Betty ore-bearing structures which were a major focus of the year’s program. A total of 72,243 feet of drilling was completed in 2007. During 2007,2008, we expect to spend $4.7$6.8 million on25
We transport ore mined utilizing underground methods at
ore reserve cut-off grade and overall ore reserves.
2006.
23
2008.
| 2006 | 2005 | 2004 | |||||
|---|---|---|---|---|---|---|---|
| (1,3,4,5,6) | |||||||
Tons (000’s) | 99 | 67 | 57 | ||||
| Ounces of silver per ton | 61.33 | 60.29 | 68.56 | ||||
| Contained ounces of silver (000’s) | 6,084 | 4,054 | 3,930 | ||||
| Ounces of gold per ton | 0.09 | 0.08 | 0.08 | ||||
| Contained ounces of gold | 8,800 | 5,400 | 4,600 | ||||
| 2007 | 2006 | 2005 | ||||||||||
| (1), (3), (4), (5), (6) | ||||||||||||
| Tons (000’s) | 154 | 99 | 67 | |||||||||
| Ounces of silver per ton | 53.97 | 61.33 | 60.29 | |||||||||
| Contained ounces of silver (000’s) | 8,293 | 6,084 | 4,054 | |||||||||
| Ounces of gold per ton | 0.07 | 0.09 | 0.08 | |||||||||
| Contained ounces of gold | 10,600 | 8,800 | 5,400 | |||||||||
| 2006 | 2005 | 2004 | |||||
|---|---|---|---|---|---|---|---|
| Tons (000’s) | 112 | 134 | 74 | ||||
| Ounces of silver per ton | 42.91 | 45.37 | 52.75 | ||||
| Ounces of gold per ton | 0.05 | 0.05 | 0.06 | ||||
| 2007 | 2006 | 2005 | ||||||||||
| (7) | ||||||||||||
| Tons (000’s) | 165 | 112 | 134 | |||||||||
| Ounces of silver per ton | 32.75 | 42.91 | 45.37 | |||||||||
| Ounces of gold per ton | 0.04 | 0.05 | 0.05 | |||||||||
| 2006 | 2005 | 2004 | |||||
|---|---|---|---|---|---|---|---|
| (2) | |||||||
Production | |||||||
| Tons ore milled | 35,843 | 35,293 | 30,276 | ||||
| Ore grade silver (oz./ton) | 79.93 | 62.53 | 59.94 | ||||
| Ore grade gold (oz./ton) | 0.104 | 0.079 | 0.084 | ||||
| Recovery silver (%) | 94.7 | 94.9 | 94.2 | ||||
| Recovery gold (%) | 92.5 | 92.9 | 91.6 | ||||
| Silver produced (oz.) | 2,712,846 | 2,093,464 | 1,709,069 | ||||
| Gold produced (oz.) | 3,440 | 2,589 | 2,318 | ||||
Cash costs(2) | $4.88 | $4.60 | $4.08 | ||||
| Non-cash costs | 0.48 | 0.41 | 0.97 | ||||
| Total production costs | $5.36 | $5.01 | $5.05 | ||||
| 2007 | 2006 | 2005 | ||||||||||
Production | ||||||||||||
| Tons ore milled | 37,047 | 35,843 | 35,293 | |||||||||
| Ore grade silver (oz./ton) | 78.10 | 79.93 | 62.53 | |||||||||
| Ore grade gold (oz./ton) | 0.120 | 0.104 | 0.079 | |||||||||
| Recovery silver (%) | 95.0 | 94.7 | 94.9 | |||||||||
| Recovery gold (%) | 92.7 | 92.5 | 92.9 | |||||||||
| Silver produced (oz.) | 2,748,705 | 2,712,846 | 2,093,464 | |||||||||
| Gold produced (oz.) | 4,127 | 3,440 | 2,589 | |||||||||
Cash costs(2) | $ | 6.27 | $ | 4.88 | $ | 4.60 | ||||||
| Non-cash costs | 0.51 | 0.48 | 0.41 | |||||||||
| Total production costs | $ | 6.78 | $ | 5.36 | $ | 5.01 | ||||||
| (1) | Metal prices used in calculating proven and probable reserves were |
| (2) | Cash costs per ounce of silver or gold represent a non-U.S.-GAAP measurement that management uses to monitor and evaluate the performance of its mining operations. See “Item 7: Management’s Discussion and Analysis of Financial Condition and Results of Operations; Reconciliation of Non-GAAP Cash Costs to GAAP Production Costs.” |
| (3) | The ore reserves are underground minable reserves and include |
26
| (4) | Metallurgical (mill) recovery factors of |
| (5) | Ore reserve estimates were prepared by the Company’s technical staff. |
| (6) | Proven and probable reserves are defined by a drill spacing of no more than 25 meters and may include underground production sampling information, especially for proven. In practice, ore reserve blocks are defined by the number of proximal composites and three-dimensional geologic controls. For proven reserves the number of composites must be at least 2 with a maximum search distance of generally 18 meters. For probable, the number of composites must be at least 2 with a maximum search distance of generally 25 meters. Mineralized material is similarly classified. | |
| (7) | Mineralized material includes 72,400 tons grading 37.78 Ag ounces per ton and 0.04 Au ounces per ton classified as additional Inferred Mineral Resources. |
24
The Company paid a cost contribution of approximately $2.1 million during 2007. 27–Endeavor— Endeavor Mine$39.1$43.8 million. The Endeavor Mine is located 720 km northwest of Sydney in New South Wales and has been in production since 1983. Under the terms of the original agreement, CDE Australia, a wholly-owned subsidiary of Coeur, paid Cobar $15.4 million of cash at the closing. In addition, CDE Australia will pay Cobar approximately $23.7$26.3 million upon the receipt of a report confirming that the reserves at the Endeavor mine are equal to or greater than the reported ore reserves for 2004. The mine met the criteria for payment of the additional $26.3 million in early 2008. Cobar and the Company have agreed to payment of this amount on April 1, 2008 plus accrued interest at the rate of 7.5% per annum from January 24, 2008. In addition to these upfront payments, Coeur originally committed to pay Cobar an operating cost contribution of $1.00 for each ounce of payable silver plus a further increment when the silver price exceeds $5.23 per ounce. This further increment was to have begun on the second anniversary of this agreement and is 50% of the amount by which the silver price exceeds $5.23 per ounce. A cost contribution of $0.25 per ounce iswas also payable by Coeur in respect of new ounces of proven and probable silver reserves as they are discovered., reached an agreement with CBH Resources Ltd. to modify the terms of the original silver purchase agreement. Under the modified terms, CDE Australia owns all silver production and reserves up to a total of 20.0 million payable ounces, up from 17.7 million payable ounces in the original agreement. The conditions relating to the second payment were also modified and tied to certain paste fill plant performance criteria and mill throughput tests. The Company has received approximately 0.71.4 million payable ounces to dateto-date and the current ore reserve contains approximately 15.314.4 million payable ounces based on current metallurgical recovery and current smelter contract terms. Expansion of the ore reserve will be required to achieve the maximum payable ounces of silver production as set forth in the modified contract. contract.It is expected that future expansion to the ore reserve will occur as a result of the conversion of portions of the property’s existing inventory of mineralized material and future exploration discoveries. CBH conducts regular exploration to discover new mineralization and to define reserves from surface and underground drilling platforms. The silver price-sharing provision is deferred until such time as Coeur has received approximately 2 million cumulative ounces of silver from the mine or June 2007, whichever is later. In addition, the silver price-sharing threshold increased to US$7.00 per ounce, from the previous level of US$5.23 per ounce. It is expected that the silver price-sharing provision may become operative in 2009.
2007.
25
2006.
2008.
2006.
| 2006 | 2005 | ||||
|---|---|---|---|---|---|
| (1,2,3,4) | |||||
Tons (000’s) | 21,385 | 12,125 | |||
| Ounces of silver per ton | 1.50 | 1.93 | |||
| Contained ounces of silver (000’s) | 31,983 | 23,341 | |||
| 2007 | 2006 | 2005 | ||||||||||
| (1), (2), (3), (4), (5), (7) | ||||||||||||
| Tons (000’s) | 19,731 | 21,385 | 12,125 | |||||||||
| Ounces of silver per ton | 1.52 | 1.50 | 1.93 | |||||||||
| Contained ounces of silver (000’s) | 29,926 | 31,983 | 23,341 | |||||||||
| 2006 | 2005 | ||||
|---|---|---|---|---|---|
| Tons (000’s) | 9,370 | 8,488 | |||
| Ounces of silver per ton | 3.00 | 2.03 | |||
| 2007 | 2006 | 2005 | ||||||||||
| Tons (000’s) | 12,291 | 9,370 | 8,488 | |||||||||
| Ounces of silver per ton | 2.44 | 3.00 | 2.03 | |||||||||
28
| 2006 | 2005 | ||||
|---|---|---|---|---|---|
| (2,5) | |||||
Production | |||||
| Tons ore milled | 750,115 | 463,129 | |||
| Ore grade silver (oz./ton) | 1.01 | 1.52 | |||
| Recovery silver (%) | 63.5 | 45.0 | |||
| Silver produced (oz.) | 481,991 | 316,169 | |||
Cash costs(6) | $2.85 | $2.05 | |||
| Non-cash costs | 1.02 | 1.30 | |||
| Total production costs | $3.87 | $3.35 | |||
| 2007 | 2006 | 2005 | ||||||||||
Production | ||||||||||||
| Tons ore milled | 1,146,857 | 750,115 | 463,129 | |||||||||
| Ore grade silver (oz./ton) | 1.40 | 1.01 | 1.52 | |||||||||
| Recovery silver (%) | 48.0 | 63.5 | 45.0 | |||||||||
| Silver produced (oz.) | 772,609 | 481,991 | 316,169 | |||||||||
Cash costs(6) | $ | 2.67 | $ | 2.85 | $ | 2.05 | ||||||
| Non-cash costs | 0.98 | 1.02 | 1.30 | |||||||||
| Total production costs | $ | 3.65 | $ | 3.87 | $ | 3.35 | ||||||
| (1) | Ore reserves are reported as of June 30, |
26
| (2) | The ore reserves are underground minable reserves and include an 11% average factor for mining dilution and mining recovery factors ranging from 40% to 100%. |
| (3) | Metallurgical recovery factor of 55% should be applied to the silver reserve ounces. |
| (4) | Classification of reserves is based on spacing from drill hole composites to reserve block centers. For proven reserves the maximum distance is 25 meters and for probable reserves it is greater than 25 meters and less than 40 meters. Mineralized material is similarly classified. |
| (5) | The Endeavor property was purchased on May 23, 2005. Operating data is presented commencing as of that date. |
| (6) | Cash costs per ounce of silver or gold represent a | |
| (7) | Mineralized material includes 118,900 tons grading 1.63 Ag ounces per ton classified as additional Inferred Mineral Resources. |
2007. 29–— Broken Hill Mine$36.0$36.9 million. In addition, CDE Australia will pay PBH an operating cost contribution of approximately $2.00 for each ounce of payable silver. Under the terms of the agreement, PBH may earn up to US$6.00.75 million per year of additional consideration by meeting certain silver production thresholds over the next eight years.thresholds. No additional payments pursuant to production thresholds were made during 2006.2006 and 75.4% from September 8, 2005 to December 31, 2005.2006.
27
2006.
| 2006 | 2005 | ||||
|---|---|---|---|---|---|
| (1,2,3,4,5) | |||||
Tons (000’s) | 12,908 | 11,519 | |||
| Ounces of silver per ton | 1.40 | 1.30 | |||
| Contained ounces of silver (000’s) | 18,015 | 14,955 | |||
| 2007 | 2006 | 2005 | ||||||||||
| (1), (3), (4), (5), (7) | ||||||||||||
| Tons (000’s) | 12,394 | 12,908 | 11,519 | |||||||||
| Ounces of silver per ton | 1.45 | 1.40 | 1.30 | |||||||||
| Contained ounces of silver (000’s) | 17,931 | 18,015 | 14,955 | |||||||||
| 2006 | 2005 | ||||
|---|---|---|---|---|---|
| Tons (000’s) | 10,872 | 10,825 | |||
| Ounces of silver per ton | 3.82 | 1.93 | |||
| 2007 | 2006 | 2005 | ||||||||||
| Tons (000’s) | 9,844 | 10,872 | 10,825 | |||||||||
| Ounces of silver per ton | 3.82 | 3.82 | 1.93 | |||||||||
| 2006 | 2005 | ||||
|---|---|---|---|---|---|
| (2) | (6) | ||||
Production | |||||
| Tons ore milled | 2,288,355 | 667,140 | |||
| Ore grade silver (oz./ton) | 1.28 | 1.31 | |||
| Recovery (%) | 74.2 | 75.4 | |||
| Silver produced (oz.) | 2,174,585 | 657,093 | |||
Cost per Ounce of Silver | |||||
| Cash costs(2) | $3.09 | $2.72 | |||
| Non-cash costs | 2.35 | 2.75 | |||
| Total production costs | $5.44 | $5.47 | |||
| 2007 | 2006 | 2005 | |||||||||||||
| (6) | |||||||||||||||
Production | |||||||||||||||
| Tons ore milled | 1,646,203 | 2,288,355 | 667,140 | ||||||||||||
| Ore grade silver (oz./ton) | 1.19 | 1.28 | 1.31 | ||||||||||||
| Recovery (%) | 83.6 | 74.2 | 75.4 | ||||||||||||
| Silver produced (oz.) | 1,642,205 | 2,174,585 | 657,093 | ||||||||||||
Cost per Ounce of Silver | |||||||||||||||
Cash costs(2) | $ | 3.18 | $ | 3.09 | $ | 2.72 | |||||||||
| Non-cash costs | 1.86 | 2.35 | 2.75 | ||||||||||||
| Total production costs | $ | 5.04 | $ | 5.44 | $ | 5.47 | |||||||||
30
| (1) | Ore reserves are effective as of June 30, |
| (2) | Cash costs per ounce of silver or gold represent a non-U.S.-GAAP measurement that management uses to monitor and evaluate the performance of its mining operations. See “Item 7: Management’s Discussion and Analysis of Financial Condition and Results of Operations; Reconciliation of Non-GAAP Cash Costs to GAAP Production Costs.” |
| (3) | The ore reserves are underground minable reserves and include factors for mining dilution and recovery. Dilution ranges from 0% to 20% additional tonnage while recovery ranges from 80% to 100% of the diluted tonnage and averages 85%. |
| (4) | Metallurgical recovery factor of 74% should be applied to the silver reserve ounces. |
| (5) | The proven and probable reserves are a combination of zinc, lead and silver mineralization remnant from historic mining and new parts or extensions of the mine. Proven and probable reserves must be accessible as defined by the site specific conditions of the mine. Furthermore, reserves are defined by definition drilling on a grid of 40 meters horizontally by 20 meters vertically and over 70% of the proven reserves are drilled on a 20 meter by 10 meter grid. |
| (6) | The Broken Hill property was purchased on September 8, 2005. Operating data is presented commencing as of that date. | |
| (7) | Mineralized material includes 4,490,000 tons grading 2.24 Ag ounces per ton classified as additional Inferred Mineral Resources. |
28
Discontinued Operation — Coeur Silver Valley On June 1, 2006, the Company completed the sale of 100% of the shares of its wholly-owned subsidiary Coeur Silver Valley, Inc. to U.S. Silver Corporation for $15 million in cash and additional consideration received of $1.1 million for working capital. Coeur Silver Valley was a wholly-owned subsidiary of the Company which owned and operated the Galena underground silver mine, an operating mine, and the Coeur and Caladay properties, that adjoin to the Galena mine, located in the heart of the Coeur d’Alene Mining District. Coeur Silver Valley’s property consists of 6,131 acres of Company-owned fee land, patented mining claims and unpatented claims in addition to 4,800 acres of leased claims. Coeur Silver Valley’s operations are accessed by paved road from US Interstate 90 south of the town of Wallace, Idaho. Silver Valley recommenced operations at the Coeur mine in June 1996 and continued mining existing reserves there through July 2, 1998 when known reserves were depleted. Silver Valley resumed production at the Galena Mine in May 1997 and operations continued to the date of the sale. The Galena Mine property is located immediately west of the City of Wallace in Shoshone County in northern Idaho. The property consists of 52 patented mining claims and 25 unpatented mining claims totaling approximately 1,100 acres. The Galena Mine is an underground silver-copper mine and is served by two vertical shafts. The No. 3 shaft is the primary production shaft and is 5,800 feet deep. The Galena shaft primarily provides utility access for water, electrical power and sand backfill for underground operations down to the 2,400 level. The mine utilizes conventional and mechanized cut and fill mining methods with sand backfill to extract ore from the high grade silver-copper vein deposits that constitute the majority of the ore reserves. Silver and copper are recovered by a flotation mill that produces a silver rich concentrate which is sold to third-party smelters in Canada. Silver recovery through the mill averaged 96% in 2006 97% in 2005 and 97% in 2004.2005.
Waste material from the milling process is deposited in a tailings pond located approximately two miles from the minesite. The tailings containment pond, which is expanded on an as needed basis, has capacity for approximately seven additional years at current production rates. Silver production at the Galena Mine in 2006, up to the date of the sale, was approximately 768,674 ounces of silver versus 2.1 million ounces in 2005. Cash costs for 2006 were $9.75 compared to $8.37 per ounce in 2005. Total capital expenditures by Silver Valley at the Galena Mine in 2006 were $0.6 million.31
2005.
| 2005 | 2004 | ||||
|---|---|---|---|---|---|
| Tons (000’s) | 444 | 718 | |||
| Ounces of silver per ton | 24.50 | 18.84 | |||
| Contained ounces of silver (000’s) | 10,879 | 13,518 | |||
29
| 2005 | ||||
| Tons (000’s) | 444 | |||
| Ounces of silver per ton | 24.50 | |||
| Contained ounces of silver (000’s) | 10,879 | |||
| 2005 | 2004 | ||||
|---|---|---|---|---|---|
| Tons (000’s) | 2,580 | 2,169 | |||
| Ounces of silver per ton | 11.74 | 10.92 | |||
| 2005 | ||||
| Tons (000’s) | 2,580 | |||
| Ounces of silver per ton | 11.74 | |||
| 2006 | 2005 | 2004 | |||||
|---|---|---|---|---|---|---|---|
Production | |||||||
| Tons ore milled | 52,876 | 128,502 | 169,413 | ||||
| Ore grade silver (oz./ton) | 15.15 | 16.53 | 21.43 | ||||
| Recovery (%) | 96 | 97 | 97 | ||||
| Silver produced (oz.) | 768,674 | 2,060,338 | 3,521,813 | ||||
| Gold produced (oz.) | 180 | 282 | 354 | ||||
Cost per Ounce of Silver | |||||||
| Cash costs(1) | $9.75 | $8.37 | $5.46 | ||||
| Non-cash costs | 0.89 | 0.97 | 0.56 | ||||
| Total production costs | $10.64 | $9.34 | $6.02 | ||||
| 2006 | 2005 | |||||||
Production | ||||||||
| Tons ore milled | 52,876 | 128,502 | ||||||
| Ore grade silver (oz./ton) | 15.15 | 16.53 | ||||||
| Recovery (%) | 96 | 97 | ||||||
| Silver produced (oz.) | 768,674 | 2,060,338 | ||||||
| Gold produced (oz.) | 180 | 282 | ||||||
Cost per Ounce of Silver | ||||||||
Cash costs(1) | $ | 9.75 | $ | 8.37 | ||||
| Non-cash costs | 0.89 | 0.97 | ||||||
| Total production costs | $ | 10.64 | $ | 9.34 | ||||
| (1) | Cash costs per ounce of silver or gold represent a non-U.S.-GAAP measurement that management uses to monitor and evaluate the performance of its mining operations. See “Item 7: Management’s Discussion and Analysis of Financial Condition and Results of Operations; Reconciliation of Non-GAAP Cash Costs to GAAP Production Costs.” |
SILVER AND GOLD DEVELOPMENT PROPERTIES Bolivia – San BartolomeBartolomé Silver Project The San BartolomeBartolomé silver development project is located on the flanks of the Cerro Rico mountain near the town of Potosi,Potosí, Bolivia. Access to the property is by paved and all-weather gravel roads leading south from the adjacent city of Potosi.Potosí. Coeur acquired 100% of the equity in Empresa Minera Manquiri S.A. (“Manquiri”) from Asarco on September 9, 1999. Manquiri’s principal asset is the mining rights to the San Bartolome project, a silver property located near the city of Potosí, Bolivia, on the flanks of the Cerro Rico Mountain.Bartolomé project. The silver mineralization is hosted in gravel (pallaco) and reworked gravel (sucu) deposits that occur on the flanks of Cerro Rico. Cerro Rico is a prominent mountain in the region that reaches an elevation of over 15,400 feet. It is composed of Tertiary-aged volcanic and intrusive rocks that were emplaced into and over older sedimentary, basement rocks. Silver, along with tin and base metals, is located in multiple veins that occur in a northeast trending belt that transects Cerro Rico. The upper parts of the Cerro Rico mineralized system waswere subsequently eroded and redeposited into the flanking pallaco and sucu deposits. Silver is hosted in all portions of the pallacos and sucus with the best grades segregated to the coarser-grained silicified fragments. These deposits lend themselves to simple, free digging surface mining techniques and can be extracted without drilling and blasting. Of the several pallaco deposits which are controlled by Coeur and surround Cerro Rico, three are of primary importance and are known as Huacajchi, Diablo (consisting of Diablo Norte, and Diablo Este) and Santa Rita.32
Bartolomé.
As a result of political unrest occurring in Bolivia during 2005, the Company reduced capital expenditures. In the second half of 2006, the Company determined conditions had improved to the point that full-scale construction and development were commenced.$2.03 per ounce. Based on the current development schedule, the Company believes thatexpects commercial production couldto begin in early 2008.
Coeur expended approximately $14.6 million in 2006the first quarter of 2008 and plans to incur construction costsexpects initial full-year production of approximately $119.4nine million in 2007.
ounces of silver per year. No assurances can be made that the project will achieve its schedule and cost estimates as discussed above.
33
31
| 2006 | 2005 | 2004 | |||||
|---|---|---|---|---|---|---|---|
| (1,2,3,4,5) | |||||||
| Tons (000’s) | 46,176 | 46,176 | 46,176 | ||||
| Ounces of silver per ton | 3.29 | 3.29 | 3.29 | ||||
| Contained ounces of silver (000’s) | 151,882 | 151,882 | 151,882 | ||||
| 2007 | 2006 | 2005 | ||||||||||
| (1), (2), (3), (4), (5), (6) | ||||||||||||
| Tons (000’s) | 42,043 | 46,176 | 46,176 | |||||||||
| Ounces of silver per ton | 3.64 | 3.29 | 3.29 | |||||||||
| Contained ounces of silver (000’s) | 153,000 | 151,882 | 151,882 | |||||||||
| 2006 | 2005 | 2004 | |||||
|---|---|---|---|---|---|---|---|
| Tons (000’s) | 1,166 | 1,166 | 1,166 | ||||
| Ounces of silver per ton | 3.44 | 3.44 | 3.44 | ||||
| 2007 | 2006 | 2005 | ||||||||||
| Tons (000’s) | 15,816 | 1,166 | 1,166 | |||||||||
| Ounces of silver per ton | 2.21 | 3.44 | 3.44 | |||||||||
| (1) | Metal prices used in calculating proven and probable reserves were |
| (2) | The ore reserves are open pit minable reserves and include an average |
| (3) | An average metallurgical recovery factor of 61.3% should be applied to the mined silver reserve ounces. |
| (4) | Ore reserve estimates were prepared by the Company’s technical staff. |
| (5) | Proven and probable reserves are defined by surface sampling – drill holes or vertical shafts – with an average spacing of no more than 70 meters. In practice, ore reserve blocks are defined by the number of proximal composites and three-dimensional geologic controls. For probable reserves, the number of composites must be at least 8 with a maximum search distance of less than 275 meters. San | |
| (6) | Mineralized material includes 249,000 tons grading 1.78 silver ounces per ton classified as additional Inferred Mineral Resources. |
34
32
During the fourth quarter of 2004, the U.S. Forest Service issued its Record of Decision (“ROD”) for the Final Supplemental Environmental Impact Statement (“FSEIS”). An environmental group, Southeast Alaska Conservation Council (“SEACC”), and a group of other community and private environmental groups, appealed the issuance The Company believes that commercial production could commence in 2009, subject to successful resolution of the ROD. On March 23, 2005,permitting and litigation issues described below. No assurances can be made that the US Forest Service upheld the decision to approve the FSEIS. On June 28, 2005, the Company received the Environmental Protection Agency’s (“EPA”) National Pollution Discharge Elimination System (“NPDES”) Permit. In addition, the Company received the U.S. Army Corps of Engineers (“Corps of Engineers”) 404 Wetlands Permit, which authorized the construction of a Lower Slate Lake tailings facility, millsite road improvementsproject will achieve its schedule and a Slate Creek Cove dock facility. All permits were reviewed for consistency by both the Alaska Coastal Management and Department of Governmental Coordination, which issued its final permit certification.
cost estimates as discussed above.
On November 8, 2005, Following the Corps of Engineers filed a Motion for Voluntary Remand with the court to review the permit issued to the Company under the CWA Section 404 and requested that the court stay the legal proceeding filed by the Plaintiffs pending the outcome of review. On November 12, 2005, the Federal District Court in Alaska granted theCourt’s remand of the Section 404 permit to the Corps of Engineers for further review. On November 22, 2005,review, the Corps of Engineers advised the Company that it was suspending the Section 404 permit pursuant to the Court’s remand to further review the permit.
On March 29, 2006, the Corps of Engineers reinstated the Company’s 404 permit. On April 6, 2006 thepermit on March 29, 2006. The lawsuit challenging the permit was re-opened andon April 6, 2006; Coeur Alaska filed its answer to the Amended ComplaintComplaint; and Motion to Intervene as a Defendant-Intervenor in the action. Two other parties,Coeur Alaska, the State of Alaska, and Goldbelt, Inc., a local native corporation, also filed Motions to Intervene as Defendant-Intervenors as supporters of the Kensington project as permitted. The Company, the State of Alaska and Goldbelt, Inc. were granted Defendant-Intervenor status and joinedto join the agencies in their defense of the permits as issued.
33
permit.
35
No assurance can be given as to whether or when regulatory permits and approvals granted to the Company may be further challenged, appealed or contested by third parties or issuing agencies, or as to whether the Company will place the Kensington project into commercial production.
2008.
| 2006 | 2005 | 2004 | |||||
|---|---|---|---|---|---|---|---|
| (1,2,3,4,5) | |||||||
Tons (000’s) | 4,419 | 4,206 | 4,206 | ||||
| Ounces of gold per ton | 0.31 | 0.25 | 0.25 | ||||
| Contained ounces of gold | 1,352,140 | 1,050,000 | 1,050,000 | ||||
| 2007 | 2006 | 2005 | ||||||||||
| (1, 2, 3, 4, 5, 6, 7) | ||||||||||||
| Tons (000’s) | 4,419 | 4,419 | 4,206 | |||||||||
| Ounces of gold per ton | 0.31 | 0.31 | 0.25 | |||||||||
| Contained ounces of gold | 1,352,100 | 1,352,100 | 1,050,000 | |||||||||
| 2006 | 2005 | 2004 | |||||
|---|---|---|---|---|---|---|---|
| Tons (000’s) | 4,320 | 3,116 | 3,116 | ||||
| Ounces of gold per ton | 0.20 | 0.27 | 0.27 | ||||
| 2007 | 2006 | 2005 | ||||||||||
| Tons (000’s) | 4,320 | 4,320 | 3,116 | |||||||||
| Ounces of gold per ton | 0.20 | 0.20 | 0.27 | |||||||||
| (1) | A gold price of $550 per ounce was used to determine ore reserves. |
| (2) | The ore reserves are underground minable reserves and include factors for mining dilution and recovery. An allowance of 25.6% additional tonnage at 0.124 ounce per ton is included for internal dilution. A factor for external dilution, averaging 10.2% at 0.056 ounces per ton, is also included. An average 97% factor for mining recovery is included. |
| (3) | Average metallurgical recovery factor of 95.3% should be applied to the contained gold reserve ounces. |
36
| (4) | Ore reserve estimates were prepared by the Company’s technical staff. Snowden Mining Industry Consultants, an independent consultant group, performed an independent review of the Company’s updated resource estimate model used to prepare the ore reserve estimates. |
| (5) | The Kensington gold development project contains only probable reserves. The reserves are defined with over | |
| (6) | Ore reserve estimates are based upon an operating scenario according to operating permits that have been received. Certain of these permits are the subject of legal proceedings. See the additional discussion under Alaska – Kensington Gold Project, Item 3 – Legal Proceedings and Part I, Item 1A – Risk Factors. | |
| (7) | Mineralized material includes 1,183,600 tons grading 0.21 gold ounces per ton classified as additional Inferred Mineral Resources. |
34
Not
37
38
silver and 110,000 ounces of gold annually at an average cash cost per silver ounce of ($1.40), including gold by-product credit. The Company is currently completing the final updated feasibility study, which is expected to be completed in the second quarter of 2008. No assurances can be made that the project will achieve its schedule and cost estimates as discussed above.
| 2007 | ||||
| (1), (2), (3), (4) | ||||
| Tons (000’s) | 33,852 | |||
| Ounces of silver per ton | 4.44 | |||
| Ounces of gold per ton | 0.05 | |||
| (1) | A cut-off grade of 0.023 ounces per ton Au equivalent (0.8 grams per tonne) was used to estimate mineralized material. Au equivalent = Au grade + (Ag grade/55). This is for the Palmarejo and La Patria deposits and the Guadalupe deposit to a depth of 150 meters. A cut off grade of 0.073 ounces per ton Au equivalent (2.5 grams per tonne) was applied to Guadalupe below 150 meters depth. | |
| (2) | Mineralized material includes estimates for the Palmarejo, Guadalupe and La Patria zones prepared by Mine Development Associates (MDA) as of September 17, 2007. | |
| (3) | The mineralized material estimates were based on information from 154,953 meters (508,370 feet) of core and reverse circulation drilling. | |
| (4) | Mineralized material includes 17,747,000 tons grading 0.04 gold ounces per ton and 3.46 silver ounces per ton classified as additional Inferred Mineral Resources. |
39
processing facility. The Company believes that there is potential to discover additional high grade veins within the entire Cerro Bayo district, which is over 13.6 miles east–west by 7.5 miles north-south.district. The exploration budget for 20072008 is estimated to be $4.7$4.9 million.
veins and define new ore reserves.
35
2008 with a budget of $3.3 million.
During 2006, initialLtd. has an option to acquire all three properties in return for staged work and payment commitments.
40
InMwanza, in 2006 over 44,000 feet of shallow, rotary air blast drilling was conducted over the gold-in-soil anomalies at Kiziba Hill. This work verified the bedrock source of the surface gold anomalies and aided in producing a map of the bedrock beneath the laterite cover, which in places reached over 75 feet in thickness. Basal rotary air blast gold anomalies are spatially coincident with contacts between volcanic rocks and later intrusive rocks of felsic (granitic) composition and along major east-wet shear/fault zones. In December 2006, core drilling commenced on the Saragurwa option property and will continue into 2007.
were further explored this year.
2008.
| Year Ended December 31, | |||||||||||||
| 2006 | 2005 | 2004 | |||||||||||
| High | Low | High | Low | High | Low | ||||||||
| Silver | $14.93 | $8.84 | $9.11 | $6.38 | $8.24 | $5.57 | |||||||
| Gold | $725.00 | $524.75 | $536.50 | $411.10 | $454.20 | $375.00 | |||||||
| Year Ended December 31, | ||||||||||||||||||||||||
| 2007 | 2006 | 2005 | ||||||||||||||||||||||
| High | Low | High | Low | High | Low | |||||||||||||||||||
| Silver | $ | 15.67 | $ | 11.54 | $ | 14.93 | $ | 8.84 | $ | 9.11 | $ | 6.38 | ||||||||||||
| Gold | $ | 841.10 | $ | 608.40 | $ | 725.00 | $ | 524.75 | $ | 536.50 | $ | 411.10 | ||||||||||||
36
41
37
42
38
43
39
44
| United States Corporate Staff and Office | 37 | |||
| Rochester Mine | 42 | |||
| Kensington | 80 | |||
| 18 | ||||
| 52 | ||||
Cerro Bayo Mine/Chile(1) | 502 | |||
Mina Martha/Argentina(1) | 163 | |||
| San | 79 | |||
| 69 | ||||
| Australia | 1 |
| Tanzania | 4 | |||
| Total | 1,047 | |||
| (1) | The Company maintains two labor agreements in South America, consisting of a labor agreement with Syndicato de Trabajadores de Compañía Minera Cerro Bayo Ltd. at its Cerro Bayo mine in Chile and with Associacion Obrera Minera Argentina at its Martha mine in Argentina. The agreement at Cerro Bayo is effective from December |
4045
Federal Natural Resources Action
An action was filed on March 22, 1996 in the United States District Court for the District of Idaho by the United States against various defendants, including the Company, asserting claims under CERCLA and the Clean Water Act for alleged damages to federal natural resources in the Coeur d’Alene River Basin of Northern Idaho. The damages are claimed to result from alleged releases of hazardous substances from mining activities conducted in the area since the late 1800s.
The Company and representatives of the U.S. Government, including the Environmental Protection Agency, the Department of Interior and the Department of Agriculture, reached an agreement to settle the lawsuit. The terms of settlement are set forth in a Consent Decree issued by the court. Pursuant to the terms of the Consent Decree, dated May 14, 2001, the Company has paid the U.S. Government a total of approximately $3.9 million, of which $3.3 million was paid in May 2001 and the remaining $0.6 million was paid in June 2001. In addition, the Company (i) paid the United States 50% of any future recoveries from insurance companies for claims for defense and indemnification under general liability insurance policies in excess of $0.6 million, (ii) completed certain cleanup work on the Mineral Point property and Caladay property, and (iii) made a conveyance to the U.S. or the State of Idaho of certain real property to possibly be used as a waste repository. Finally, commencing five years after effectiveness of the settlement, the Company is obligated to pay royalties on all of its domestic and foreign operating properties, up to a cumulative maximum of $3.0 million, amounting to a 2% net smelter royalty on silver production if the price of silver exceeds $6.50 per ounce, and a $5.00 per ounce royalty on gold production if the price of gold exceeds $325 per ounce. The royalty payment obligation commenced on May 14, 2006 and expires after May 14, 2021. As of December 31, 2006, $2.4 million of the $3.0 million was paid. It is expected that the remaining $0.5 million will be paid in the first half of 2007.
41
On November 8, 2005, Following the Corps of Engineers filed a Motion for Voluntary Remand with the court to review the permit issued to the Company under the CWA Section 404 and requested that the court stay the legal proceeding filed by the plaintiffs pending the outcome of review. On November 12, 2005, the Federal District Court in Alaska granted theCourt’s remand of the Section 404 permit to the Corps of Engineers for further review. On November 22, 2005,review, the Corps of Engineers advised the Company that it was suspending the Section 404 permit pursuant to the Court’s remand to further review the permit.
On March 29, 2006, the Corps of Engineers reinstated the Company’s 404 permit. On April 6, 2006 thepermit on March 29, 2006. The lawsuit challenging the permit was re-opened andon April 6, 2006; Coeur Alaska Inc. filed its answer to the Amended ComplaintComplaint; and Motion to Intervene as a Defendant-Intervenor in the action. Two other parties,Coeur Alaska, the State of Alaska, and Goldbelt, Inc., a local native corporation, also filed Motions to Intervene as Defendant-Intervenors as supporters of the Kensington project as permitted. The Company, the State of Alaska and Goldbelt, Inc. were granted Defendant-Intervenor status and joinedto join the agencies in their defense of the permits as issued.permit.
46
There is no indication of whenJanuary 28, 2008. The Company cannot now predict the Circuit Court may rule on the merits onpotential for obtaining further appeal or the impactif it will prevail upon the project.appeal if one is granted.
long-term price for gold decrease below approximately $606 per ounce. As of December 31, 2007, the carrying value of the Kensington project’s long-lived assets was $298.2 million.
42
47
Not applicable.
| Name | Age | Positions with Coeur | Since | |||||||
| Dennis E. Wheeler | 65 | Chairman of the Board | 1992 | |||||||
| Chief Executive Officer and President | 1986 | |||||||||
| James A. Sabala | 53 | Executive Vice President and Chief Financial Officer | 2003 | |||||||
| Richard M. Weston | 56 | Senior Vice President, Operations | 2006 | |||||||
| James K. Duff | 62 | President, South American Operations | 2005 | |||||||
| Donald J. Birak | 54 | Senior Vice President, Exploration | 2004 | |||||||
| Alan L. Wilder | 59 | Senior Vice President, Project Development | 2004 | |||||||
| Mitchell J. Krebs | 36 | Senior Vice President, Corporate Development | 2003 | |||||||
| Kelli C. Kast | 41 | Vice President, General Counsel and Corporate Secretary | 2005 | |||||||
| Luke J. Russell | 52 | Vice President, Environmental Services | 2005 | |||||||
| Tom T. Angelos | 52 | Vice President, Controller and Chief Accounting Officer | 2004 | |||||||
| Larry A. Nelson | 55 | Vice President, Human Resources | 2008 | |||||||
| Carolyn S. Turner | 39 | Treasurer | 2008 | |||||||
48
| Name | Age | Positions with Coeur | Since |
|---|---|---|---|
Dennis E. Wheeler | 64 | Chairman of the Board | 1992 |
| Chief Executive Officer and President | 1986 | ||
James A. Sabala | 52 | Executive Vice President, Chief Financial Officer | 2003 |
| and Treasurer | |||
Harry F. Cougher | 64 | Senior Vice President, North American Operations | 2005 |
James K. Duff | 62 | President, South American Operations | 2005 |
Donald J. Birak | 53 | Senior Vice President, Exploration | 2004 |
Alan L. Wilder | 58 | Senior Vice President, Project Development | 2004 |
Gary W. Banbury | 54 | Senior Vice President, | 2004 |
| Chief Administrative Officer | |||
Richard Weston | 55 | Senior Vice President and Managing Director, | 2006 |
| Coeur Australia Pty Limited and Vice President | |||
| of South America | |||
Mitchell J. Krebs | 35 | Senior Vice President, Corporate Development | 2003 |
Kelli C. Kast | 40 | Vice President, General Counsel and | 2005 |
| Corporate Secretary | |||
W. Scott Lamb | 52 | Vice President, Investor Relations | 2005 |
Luke J. Russell | 50 | Vice President, Environmental Services | 2005 |
Tom T. Angelos | 51 | Vice President, Controller and | 2004 |
| Chief Accounting Officer | |||
Carolyn S. Turner | 38 | Assistant Treasurer | 2006 |
43
December 2006. Prior to that, Mr. Weston was employed with Barrick Australia from January 2003 to February 2006 as General Manager of Cowal Gold Project and Rio Tinto Australia from December 2000 to November 2002 as General Manager of the ERA and Jabiluka mines.
Exploration and as Vice President of Exploration for Independence Mining Company Inc from 1995 to 1999.
Gary W. Banburywas appointed Senior Vice President and Chief Administrative Officer in February 2004. Prior to that, Mr. Banbury served as Vice President, Administration and Human Resources from 2000 to 2004. Mr. Banbury held the position of Vice President, Human Resources of Coeur from 1998 to 2000, and prior thereto he served as Manager of Human Resources with Coeur.
Richard M. Westonwas appointed Senior Vice President and Managing Director of Coeur Australia Pty. Limited and Vice President of South American Operations in December 2006. Prior to that, Mr. Weston served as Senior Vice President and Managing Director of Coeur Australia from February 2006 to December 2006. Prior to that, Mr. Weston was employed with Barrick Australia from January 2003 to February 2006 as General Manager of Cowal Gold Project and Rio Tinto Australia from December 2000 to November 2002 as General Manager of the ERA and Jabiluka mines.
49
W. Scott Lambwas appointed Vice President Investor Relations in August 2005. Prior to that Mr. Lamb was employed with Kaiser Aluminum Corporation from January 1992 to July 2005 and held the position of Vice President Investor Relations and Corporate Communications.
44
Item 5.Market for Registrant’s Common Equity, Related Stockholder Matters and Issuer Purchases of Equity Securities.
| Item 5. | Market for Registrant’s Common Equity, Related Stockholder Matters and Issuer Purchases of Equity Securities. |
| High | Low | |||||||
2006 | ||||||||
| First Quarter | $ | 6.71 | $ | 4.11 | ||||
| Second Quarter | $ | 7.37 | $ | 3.95 | ||||
| Third Quarter | $ | 5.75 | $ | 4.41 | ||||
| Fourth Quarter | $ | 5.45 | $ | 4.35 | ||||
2007 | ||||||||
| First Quarter | $ | 4.80 | $ | 3.95 | ||||
| Second Quarter | $ | 4.32 | $ | 3.51 | ||||
| Third Quarter | $ | 4.22 | $ | 3.25 | ||||
| Fourth Quarter | $ | 4.94 | $ | 3.62 | ||||
2008 | ||||||||
| First Quarter (through February 12, 2008) | $ | 5.06 | $ | 4.20 | ||||
50
| High | Low | ||||
|---|---|---|---|---|---|
| 2005 | |||||
| First Quarter | $ 4.37 | $ 3.33 | |||
| Second Quarter | $ 3.75 | $ 2.75 | |||
| Third Quarter | $ 4.32 | $ 3.36 | |||
| Fourth Quarter | $ 4.59 | $ 3.62 | |||
| 2006 | |||||
| First Quarter | $ 6.71 | $ 4.11 | |||
| Second Quarter | $ 7.37 | $ 3.95 | |||
| Third Quarter | $ 5.75 | $ 4.41 | |||
| Fourth Quarter | $ 5.45 | $ 4.35 | |||
| 2007 | |||||
| First Quarter (through February 16, 2007) | $ 4.79 | $ 4.20 | |||
shares issued to Bolnisi shareholders were issued pursuant to a scheme of arrangement that was approved by the Federal Court of Australia, and the shares issued to Palmarejo shareholders were issued pursuant to a plan of arrangement that was approved by the Ontario Superior Court of Justice.
45
2007.
| Number of shares remaining | ||||||||||||
| Number of shares to be | available for future issuance | |||||||||||
| issued upon exercise of | Weighted-average exercise | under equity compensation | ||||||||||
| outstanding options, | price of outstanding options, | plans (excluding securities | ||||||||||
| Plan category | warrants and rights | warrants and rights | reflected in column (a)) | |||||||||
| (a) | (b) | (c) | ||||||||||
| Equity compensation plans approved by security holders | 2,281,595 | $ | 3.42 | 4,875,261 | ||||||||
| Equity compensation plans not approved by security holders | — | — | — | |||||||||
| Total | 2,281,595 | $ | 3.42 | 4,875,261 | ||||||||
51
| Plan category | Number of shares to be issued upon exercise of outstanding options, warrants and rights | Weighted-average exercise price of outstanding options, warrants and rights | Number of shares remaining available for future issuance under equity compensation plans (excluding securities reflected in column (a)) | ||||||||
| (a) | (b) | (c) | |||||||||
| Equity compensation | |||||||||||
| plans approved by | |||||||||||
| security holders | 2,089,650 | $ | 3.56 | 5,361,819 | |||||||
Equity compensation | |||||||||||
| plans not approved | |||||||||||
| by security holders | -- | -- | -- | ||||||||
| Total | 2,089,650 | $ | 3.56 | 5,361,819 | |||||||
46
STOCK PERFORMANCE CHARTCOMPARISON OF 5 YEAR CUMULATIVE TOTAL RETURN*
AMONG COEUR D’ALENE MINES CORPORATION,
S&P 500 INDEX AND PEER GROUP INDEX The following chart compares our cumulative total shareholder return for the five years ended December 31, 20062007 with (i) the S&P 500 Index, which is a performance indicator of the overall stock market, and (ii) a peer group determined by us. Comparison of Five-Year Cumulative Total Return Coeur d’Alene Mines Corporation, S&P 500, and Coeur d’Alene Mines Comparator Group.
Dec.
2001
Dec.
2002
Dec.
2003
Dec.
2004
Dec.
2005
Dec.
2006
Coeur d’Alene Mines Corporation Common Stock 100.00 240.03 722.58 491.30 500.09 618.85
S&P 500 Index 100.00 77.89 100.23 111.13 116.57 134.98
Peer Group Index** 100.00 168.54 195.38 197.34 239.99 336.52
Dec. Dec. Dec. Dec. Dec. Dec. 2002 2003 2004 2005 2006 2007 Coeur d’Alene Mines Corporation Common Stock 100.00 301.04 204.68 208.34 257.82 257.29 S&P 500 Index 100.00 128.68 142.67 149.65 173.28 182.67 Peer Group Index** 100.00 123.37 117.98 155.14 221.81 266.80
Assumes $100 invested on January 1, 2002,2003, in our common stock, S&P 500 Index and the peer group index.
* Total return assumes reinvestment of dividends.
** The issuers of common stock included in the peer group in 2007 are Agnico Eagle Mines, Goldcorp, Hecla Mining Co., IAM Gold, Kinross Gold Corp., Northgate Minerals, Pan American Silver Corp. and Stillwater Mining Co. (Bema Gold was dropped due to mergers and acquisitions, Centerra was dropped due to the fact that it no longer trades on any U.S. stock exchange and Yamana Gold was added.) The issuers of common stock included in the peer group in 2006 are Agnico Eagle Mines, Bema Gold, CeterraCenterra Gold, Goldcorp, Hecla Mining Co., IAM Gold, Kinross Gold Corp., Meridian Gold, Inc., Northgate Minerals, Pan American Silver Corp. and Stillwater Mining Co. (Cambior Inc. and Glamis Gold were dropped due to mergers and acquisitions and Ceterra Gold was added.) The issuers of common stock included in the peer group in 2005 are Agnico Eagle Mines, Bema Gold, Cambior Inc., Ceterra Gold, Glamis Gold, Goldcorp, Hecla Mining Co., Kinross Gold Corp., Meridian Gold, Inc., Northgate Minerals, Pan American Silver Corp. and Stillwater Mining Co.
4752
Item 6.Selected Financial Data The following table summarizes certain selected consolidated financial data with respect to the Company and its subsidiaries and should be read in conjunction with the Consolidated Financial Statements and Notes thereto appearing elsewhere in this report. 2007 2006 2005 2004 2003 (In thousands, except per share data) Income Statement Data: Revenues: Sales of metal $ 215,319 $ 216,573 $ 156,284 $ 109,047 $ 93,620 Costs and expenses: Production costs applicable to sales 117,025 92,378 88,232 63,715 64,970 Depreciation and depletion 20,984 26,772 18,889 16,833 15,107 Administrative and general 23,875 19,369 20,624 17,499 12,264 Exploration 11,941 9,474 10,553 8,031 4,277 Litigation settlement 507 2,365 1,600 — — Pre-development — — 6,057 11,449 1,967 Other holding costs — — — — 4,478 Total costs and expenses 174,332 150,358 145,955 117,527 103,063 Operating income (loss) 40,987 66,215 10,329 (8,480 ) (9,443 ) Other income (expense) Interest and other income 18,195 18,654 8,385 3,165 2,064 Interest expense, net (365 ) (1,224 ) (2,485 ) (2,831 ) (12,851 ) Merger expenses — — — (15,675 ) — Loss on early retirement of debt — — — — (41,564 ) Total other income (expense) 17,830 17,430 5,900 (15,341 ) (52,351 ) Income (loss) from continuing operations before income taxes 58,817 83,645 16,229 (23,821 ) (61,794 ) Income tax (provision) benefit (14,927 ) (8,226 ) (1,483 ) 5,785 7 Income (loss) from continuing operations 43,890 75,419 14,746 (18,036 ) (61,787 ) Income (loss) from discontinued operations — 1,935 (4,195 ) 1,178 (2,139 ) Gain on sale of net assets of discontinued operation — 11,132 — — — Cumulative effect of accounting change — — — — (2,306 ) Net income (loss) $ 43,890 $ 88,486 $ 10,551 $ (16,858 ) $ (66,232 ) Other comprehensive income (loss) 86 2,391 447 (908 ) (556 ) Comprehensive income (loss) $ 43,976 $ 90,877 $ 10,998 $ (17,766 ) $ (66,788 ) Basic and Diluted Income (Loss) Per Share Data: Basic Income (Loss) Per Share: Income (loss) from continuing operations $ 0.15 $ 0.28 $ 0.06 $ (0.08 ) $ (0.37 ) Income (loss) from discontinued operations — 0.05 (0.02 ) 0.00 (0.01 ) Cumulative effect of accounting change — — — — (0.01 ) Net income (loss) $ 0.15 $ 0.33 $ 0.04 $ (0.08 ) $ (0.39 ) Diluted Income (Loss) Per Share: Income (loss) from continuing operations $ 0.14 $ 0.26 $ 0.06 $ (0.08 ) $ (0.37 ) Income (loss) from discontinued operations — 0.04 (0.02 ) 0.00 (0.01 ) Cumulative effect of accounting change — — — — (0.01 ) Net income (loss) $ 0.14 $ 0.30 $ 0.04 $ (0.08 ) $ (0.39 ) Weighted average number of shares of common stock Basic 285,972 271,357 242,915 215,969 168,186 Diluted 310,524 296,082 243,683 215,969 168,186 Balance Sheet Data:(1) Total assets $ 2,651,694 $ 849,626 $ 594,816 $ 525,777 $ 259,467 Working capital $ 152,390 $ 383,082 $ 281,977 $ 345,894 $ 96,994 Long-term liabilities $ 812,650 $ 210,117 $ 206,921 $ 198,873 $ 29,461 Shareholders’ equity $ 1,727,367 $ 580,994 $ 341,553 $ 293,454 $ 197,478
53
Income Statement Data: 2006
2005
2004
2003
2002
(In thousands except per share data)
Revenues: Sales of metal $ 216,573 $ 156,284 $ 109,047 $ 93,620 $ 67,117
Costs and expenses: Production costs applicable to sales 92,378 88,232 63,715 64,970 65,654 Depreciation and depletion 26,772 18,889 16,833 15,107 10,150 Administrative and general 19,369 20,624 17,499 12,264 8,806 Exploration 9,474 10,553 8,031 4,277 3,849 Pre-development -- 6,057 11,449 1,967 2,606 Other holding costs -- -- -- 4,478 3,608 Litigation settlement 2,365 1,600 -- -- --
Total costs and expenses 150,358 145,955 117,527 103,063 94,673
Other income (expense) Interest and other income 18,654 8,385 3,165 2,064 4,080 Interest expense, net (1,224 ) (2,485 ) (2,831 ) (12,851 ) (21,948 ) Merger expenses -- -- (15,675 ) -- -- Loss on early retirement of debt -- -- -- (41,564 ) (19,061 )
Total other income (expense) 17,430 5,900 (15,341 ) (52,351 ) (36,929 )
Income (loss) from continuing operations before income taxes 83,645 16,229 (23,821 ) (61,794 ) (64,485 ) Income tax (provision) benefit (8,226 ) (1,483 ) 5,785 7 --
Income(loss) from continuing operations 75,419 14,746 (18,036 ) (61,787 ) (64,485 ) Income (loss) from discontinued operations 1,935 (4,195 ) 1,178 (2,139 ) (16,334 ) Gain on sale of net assets of discontinued operation 11,132 -- -- -- -- Cumulative effect of accounting change -- -- -- (2,306 ) --
Net income (loss) $ 88,486 $ 10,551 $ (16,858 ) $ (66,232 ) $ (80,819 )
Other comprehensive income (loss) 2,391 447 (908 ) (556 ) (1,470 )
Comprehensive income (loss) $ 90,877 $ 10,998 $ (17,766 ) $ (66,788 ) $ (82,289 )
Basic and Diluted Income (Loss) Per Share Data: Basic Income (Loss) Per Share: Income (loss) from continuing operations $ 0.28 $ 0.06 $ (0.08 ) $ (0.37 ) $ (0.82 ) Income (loss) from discontinued operations 0.05 (0.02 ) 0.00 (0.01 ) (0.21 ) Cumulative effect of accounting change -- -- -- (0.01 ) --
Net income (loss) $ 0.33 $ 0.04 $ (0.08 ) $ (0.39 ) $ (1.03 )
Diluted Income (Loss) Per Share: Income (loss) from continuing operations $ 0.26 $ 0.06 $ (0.08 ) $ (0.37 ) $ (0.82 ) Income (loss) from discontinued operations 0.04 (0.02 ) 0.00 (0.01 ) (0.21 ) Cumulative effect of accounting change -- -- -- (0.01 ) --
Net income (loss) $ 0.30 $ 0.04 $ (0.08 ) $ (0.39 ) $ (1.03 )
Weighted average number of shares of common stock Basic 271,357 242,915 215,969 168,186 78,193
Diluted 296,082 243,683 215,969 168,186 78,193
48
Balance Sheet Data: 2006
2005
2004
2003
2002
(In thousands except per share data)
Total assets $ 849,626 $ 594,816 $ 525,777 $ 259,467 $ 173,491 Working capital $ 383,082 $ 281,977 $ 345,894 $ 96,994 $ 2,661 Long-term liabilities $ 210,117 $ 206,921 $ 198,873 $ 29,461 $ 81,200 Shareholders' equity $ 580,994 $ 341,553 $ 293,454 $ 197,478 $ 47,687
Item 7.Management’s Discussion and Analysis of Financial Condition andResults of Operations
(1) On December 21, 2007, the Company completed its acquisition of all the shares of Bolnisi and Palmarejo in exchange for a total of approximately 272 million shares of Coeur common stock and a total cash payment of approximately $1.1 million. The total consideration paid amounted to $1.1 billion and the total liabilities assumed were $0.7 billion.
Item 7. Management’s Discussion and Analysis of Financial Condition and Results of Operations
General The results of the Company’s operations are significantly affected by the market prices of gold and silver which fluctuate widely and are affected by many factors beyond the Company’s control, including interest rates, expectations regarding inflation, currency values, governmental decisions regarding the disposal of precious metals stockpiles, global and regional political and economic conditions, and other factors. The Company’s business strategy is to capitalize on the ore reserve/mineralized material bases located at its operating mines and the expertise of its management team to continue as a leading primary silver production company through long-term, cash flow generating growth. The principal elements of the Company’s business strategy are to: (i) increase the Company’s silver production and reserves; (ii) decrease cash costs and increase production at the Company’s existing silver mining operations; (iii) transform development-stage properties into producing mines; (iv) acquire operating mines, mineral interests, exploration and/or development properties with a view to reducing the Company’s cash and total costs, provide short-term positive cash flow return and expand its silver production base and reserves; and (v) continue to explore for new silver and gold discoveries primarily near its existing mine sites and evaluate new opportunities to expand its production through acquisitions and exploration. The Rochester mine, Cerro Bayo mine and Martha mine, each operated by the Company, and the Endeavor and Broken Hill mines which are operated by others, constituted the Company’s principal sources of mining revenues in 2006.2007.
Critical Accounting Policies and Estimates Management considers the following policies to be most critical in understanding the judgments that are involved in preparing the Company’s consolidated financial statements and the uncertainties that could impact its results of operations, financial condition and cash flows. Our consolidated financial statements are impacted by the accounting policies used and the estimates and assumptions made by management during their preparation. We have identified the policies below as critical to our business operations and the understanding of our results of operations. Management’s discussion and analysis of our financial condition and results of operations are based on our consolidated financial statements, which have been prepared in conformity with U.S. generally accepted accounting principles generally accepted in the United States (GAAP)(“GAAP”). The preparation of these statements requires that we make estimates and assumptions that affect the reported amounts of assets and liabilities, disclosure of contingent assets and liabilities at the date of our financial statements, and the reported amounts of revenue and expenses during the reporting period. We base these estimates on historical experience and on assumptions that we consider reasonable under the circumstances; however, reported results could differ from those based on the current estimates under different assumptions or conditions. The impact and any associated risks related to these policies on our business operations are discussed throughout Management’s Discussion and Analysis of Financial Condition and Results of Operations. The areas requiring the use of management’s estimates and assumptions relate to recoverable ounces from proven and probable ore reserves that are the basis of future cash flow estimates and units-of-production depreciation and amortization calculations; useful lives utilized for depreciation, depletion and amortization for long lived assets; estimates of recoverable gold and silver ounces in ore on leach pad; the amount and timing of reclamation and remediation costs; and valuation allowanceallowances for deferred tax assets; and post-employment and other employee benefit liabilities.assets. For a detailed discussion on the application of these and other accounting policies, see Note B in the Notes to the Consolidated Financial Statements of this Annual Report on Form 10-K.54
49
Revenue Recognition. Revenue includes sales value received for our principal product, silver, and associated by-product revenues from the sale of by-product metals consisting primarily of gold and copper. Revenue is recognized when title to silver and gold passes to the buyer and when collectibilitycollectability is reasonably assured. The passing of title to the customer is based on terms of the sales contract. Product pricing is determined at the point revenue is recognized by reference to active and freely traded commodity markets, for example the London Bullion Market, an active and freely traded commodity market for both gold and silver in an identical form to the product sold. Under our concentrate sales contracts with third-party smelters, final gold and silver prices are set on a specified future quotationalquotation period, typically one to three months, after the shipment date based on metal market prices. Revenues are recorded under these contracts at the time title passes to the buyer based on the forward price for the expected settlement period. The contracts, in general, provide for a provisional payment based upon provisional assays and quoted metal prices. Final settlement is based on the average applicable price for a specified future period, and generally occurs from three to six months after shipment. Final sales are settled using smelter weights, settlement assays (average of assays exchanged and/or umpire assay results) and are priced as specified in the smelter contract. The Company’s provisionally priced sales contain an embedded derivative that is required to be separated from the host contract for accounting purposes. The host contract is the receivable from the sale of concentrates at the forward price at the time of sale. The embedded derivative does not qualify for hedge accounting. The embedded derivative is recorded as a derivative asset in prepaid expenses and other, or a derivative liability in accrued liabilities and other on the balance sheet and is adjusted to fair value through revenue each period until the date of final gold and silver settlement. The form of the material being sold, after deduction for smelting and refining is in an identical form to that sold on the London Bullion Market. The form of the product is metal in flotation concentrate, which is the final process for which the Company is responsible. The effects of forward sales contracts are reflected in revenue at the date the related precious metals are delivered or the contracts expire.delivered. Third party smelting and refining costs are recorded as a reduction of revenue. At December 31, 2007, the Company had outstanding provisionally priced sales of $61.2 million consisting of 3.3 million ounces of silver and 20,775 ounces of gold, which had a fair value of approximately $63.8 million including the embedded derivative. For each one cent per ounce change in realized silver price, revenue would vary (plus or minus) approximately $33,300 and for each one dollar per ounce change in realized gold price, revenue would vary (plus or minus) approximately $20,800. At December 31, 2006, the Company had outstanding provisionally priced sales of $74.5 million consisting of 4.6 million ounces of silver and 29,577 ounces of gold, which had a fair value of approximately $75.6 million including the embedded derivative. For each one cent per ounce change in realized silver price, revenue would vary (plus or minus) approximately $45,700 and for each one dollar per ounce change in realized gold price, revenue would vary (plus or minus) approximately $29,600. At December 31, 2005, the Company had outstanding provisionally priced sales of $47.0 million consisting of 3.5 million ounces of silver and 40,000 ounces of gold. For each one cent per ounce change in realized silver price, revenue would vary (plus or minus) approximately $35,400 and for each one dollar per ounce change in realized gold price, revenue would vary (plus or minus) approximately $40,000.Ore Reserve Estimates.The preparation of this Annual Report on Form 10-K requires us to make estimates and assumptions that affect the reported amount of assets and liabilities, disclosure of contingent assets and liabilities at the date of our financial statements, and the reported amounts of revenue and expenses during the reporting period. There can be no assurance that actual results will not differ from those estimates. The most critical accounting principles upon which the Company’s financial status depends are those requiring estimates of recoverable ounces from proven and probable ore reserves and/or assumptions of future commodity prices. There are a number of uncertainties inherent in estimating quantities of ore reserves, including many factors beyond our control. Ore reserve estimates are based upon geologic and engineering evaluations of samplings of drill holes and other openings. These estimates involve assumptions regarding future silver and gold prices, the geology of our mines, the mining methods we use and the related costs we incur to develop and mine our reserves. Changes in these assumptions could result in material adjustments to our reserve estimates. We use ore reserve estimates in determining the units-of-production depreciation and amortization expense, as well as in evaluating possible mine asset impairments.55
50
We review and evaluate our long-lived assets for impairment when events or changes in circumstances indicate that the related carrying amounts may not be recoverable. We utilize the methodology set forth in Statement of Financial Accounting Standard (SFAS) No. 144, “Accounting for the Impairment or Disposal of Long-Lived Asset,Assets,” to evaluate the recoverability of capitalized mineral property costs. An impairment is considered to exist if total estimated future cash flows or probability-weighted cash flows on an undiscounted basis is less than the carrying amount of the assets, including property, plant and equipment, mineral property, development property, and any deferred costs such as deferred stripping. The accounting estimates related to impairment are critical accounting estimates because the future cash flows used to determine whether an impairment exists is dependent on reserve estimates and other assumptions, including silver and gold prices, production levels, and capital and reclamation costs, all of which are based on detailed engineering life-of-mine plans. An impairment loss exists when estimated undiscounted cash flows expected to result from the use of the asset and its eventual disposition are less than its carrying amount. Any impairment loss recognized represents the excess of the asset’s carrying value as compared toover its estimated fair value. The Company reviews the carrying value of its assets whenever events or changes in circumstances indicate that the carrying amount of its assets may not be fully recoverable. The Company did not record any impairments during the years ended December 31, 2007, 2006 2005 and 2004.2005.
We depreciate our property, plant and equipment, mining properties and mine development costs using the units-of-production method over the estimated life of the ore body based on our proven and probable recoverable reserves or on a straight-line basis over the useful life, whichever is shorter. The accounting estimates related to depreciation and amortization are critical accounting estimates because the 1) determination of reserves involves uncertainties with respect to the ultimate geology of our reserves and the assumptions used in determining the economic feasibility of mining those reservesreserves; and 2) changes in estimated proven and probable reserves and useful asset lives can have a material impact on net income.Ore on leach pad.The Rochester Mine utilizes the heap leach process to extract silver and gold from ore. The heap leach process is a process of extracting silver and gold by placing ore on an impermeable pad and applying a diluted cyanide solution that dissolves a portion of the contained silver and gold, which are then recovered in metallurgical processes. The key stages in the conversion of ore into silver and gold are (i) the blasting process in which the ore is broken into large pieces; (ii) the processing of the ore through a crushing facility that breaks it into smaller pieces; (iii) the transportation of the crushed ore to the leach pad where the leaching solution is applied; (iv) the collection of the leach solution; (v) subjecting the leach solution to the precipitation process, in which gold and silver is converted back to a fine solid; (vi) the conversion of the precipitate into dorè; and (vii) the conversion by a third party refinery of the dorè into refined silver and gold bullion. We use several integrated steps to scientifically measure the metal content of ore placed on the leach pads during the key stages. As the ore body is drilled in preparation for the blasting process, samples of the drill residue are assayed to determine estimated quantities of contained metal. We estimate the quantity of ore by utilizing global positioning satellite survey techniques. We then process the ore through a crushing facility where the output is again weighed and sampled for assaying. A metallurgical reconciliation with the data collected from the mining operation is completed with appropriate adjustments made to previous estimates. We then transport the crushed ore to the leach pad for application of the leaching solution. As the leach solution is collected from the leach pads, we continuously sample for assaying. We measure the quantity of leach solution by flow meters throughout the leaching and precipitation process. After precipitation, the product is converted to dorè, which is the final product produced by the mine. We again sample and assay the dorè. Finally, a third party smelter converts the dorè into refined silver and gold bullion. At this point we are able to determine final ounces of silver and gold available for sale. We then review this end result and reconcile it to the estimates we had used and developed throughout the production process. Based on this review, we adjust our estimation procedures when appropriate.56
51
Our reported inventories include metals estimated to be contained in the ore on the leach pads of $66.7$50.9 million as of December 31, 2006.2007. Of this amount, $31.3$25.9 million is reported as a current asset and $35.4$25.0 million is reported as a noncurrent asset. The distinction between current and noncurrent is based upon the expected length of time necessary for the leaching process to remove the metals from the broken ore. The historical cost of the metal that is expected to be extracted within twelve months is classified as current and the historical cost of metals contained within the broken ore that will be extracted beyond twelve months is classified as noncurrent. The ore on leach pad inventory is stated at actual production costs incurred to produce and place ore on the leach pad during the current period, adjusted for the effects on monthly production costs of abnormal production levels. The estimate of both the ultimate recovery expected over time, and the quantity of metal that may be extracted relative to such twelve month period, requires the use of estimates which are inherently inaccurate since they rely upon laboratory testwork. Testwork consists of 60 day leach columns from which we project metal recoveries into the future. The quantities of metal contained in the ore are based upon actual weights and assay analysis. The rate at which the leach process extracts gold and silver from the crushed ore is based upon laboratory column tests and actual experience occurring over approximately nineteen years of leach pad operation at the Rochester Mine. The assumptions we use to measure metal content during each stage of the inventory conversion process includes estimated recovery rates based on laboratory testing and assaying. We periodically review our estimates compared to actual experience and revise our estimates when appropriate. The length of time necessary to achieve our currently estimated ultimate recoveries of 61.5% for silver and 93% for gold is estimated to be between 5 and 10 years. However,In August 2007, the ultimate recovery will not be known until leachingCompany terminated mining and crushing operations cease, which is currently estimated foras ore reserves were fully mined. Residual heap leach activities are expected to continue through 2011. The Company has announced that it may consider the sale of the property during 2008.
When we began operations at the Rochester mine in 1986, based solely on laboratory testing, we estimated the ultimate recovery of silver and gold at 50% and 80%, respectively. Since 1986, we have adjusted the expected ultimate recovery 3three times (once in each of 1989, 1997 and 2003) based upon actual experience gained from leach operations. In 1989, we increased our estimated recoveries for silver and gold to 55% and 85%, respectively. The change was accounted for prospectively as a change in estimate, which had the effect of increasing the estimated recoverable ounces of silver and gold contained in the heap by 1.6 million ounces and 10,000 ounces, respectively. In 1997, we revised our estimated recoveries for silver and gold to 59% and 89%, respectively, which increased the estimated recoverable ounces of silver and gold contained in the heap by 4.7 million ounces and 39,000 ounces, respectively. Finally, in 2003, we revised our estimated recoveries for silver to between 59% and 61.5% depending on the area being leached, and 93% for gold, which increased the estimated recoverable ounces of silver and gold contained in the heap by 1.8 million ounces and 41,000 ounces, respectively. The leach cycle at the Rochester Mine requires leaching to approximately the year 2011 for all recoverable metal to be recovered.57
52
If our estimate of ultimate recovery requires adjustment, the impact upon our inventory valuation and upon our income statement would be as follows:Positive/Negative
Change in Silver Recovery
Positive/Negative
Change in Gold Recovery
1%
2%
3%
1%
2%
3%
Quantity of recoverable ounces 1.7 million 3.4 million 5.1 million 12,900 25,800 38,700
Positive impact on future cost of production per silver equivalent ounce for increases in recovery rates $1.06 $1.83 $2.43 $0.42 $0.79 $1.13
Negative impact on future cost of production per silver equivalent ounce for decreases in recovery rates $1.51 $3.87 $8.03 $0.48 $1.03 $1.66
Positive/Negative Positive/Negative Change in Silver Recovery Change in Gold Recovery 1% 2% 3% 1% 2% 3% Quantity of recoverable ounces 1.7 million 3.5 million 5.2 million 13,240 26,480 39,720 Positive impact on future cost of production per silver equivalent ounce for increases in recovery rates $ 1.68 $ 2.78 $ 3.55 $ 0.82 $ 1.49 $ 2.04 Negative impact on future cost of production per silver equivalent ounce for decreases in recovery rates $ (2.93 ) $ (9.30 ) $ (33.77 ) $ (1.04 ) $ (2.38 ) $ (4.21 )
Inventories of ore on leach pads are valued based upon actual production costs incurred to produce and place such ore on the leach pad, adjusted for the effects on monthly production of costs of abnormal production levels, less costs allocated to minerals recovered through the leach process. The costs consist of those production activities occurring at the mine site and include the costs, including depreciation, associated with mining, crushing and precipitation circuits. In addition, refining is provided by a third party refiner to place the metal extracted from the leach pad in a saleable form. These additional costs are considered in the valuation of inventory.Reclamation and remediation costs.Reclamation and remediation costs are based principally on legal and regulatory requirements. Management estimates costs associated with reclamation of mining properties as well as remediation cost for inactive properties. The Company follows SFAS No. 143, “Accounting for Asset Retirement Obligations”, which addresses financial accounting and reporting for obligations associated with the retirement of tangible long-lived assets and the associated asset retirement costs. The standard applies to legal obligations associated with the retirement of long-lived assets that result from the acquisition, construction, development and normal use of the asset. SFAS No. 143 requires that the fair value of a liability for an asset retirement obligation be recognized in the period in which it is incurred if a reasonable estimate of fair value can be made. The fair value of the liability is added to the carrying amount of the associated asset and this additional carrying amount is depreciated over the life of the asset. An accretion cost, representing the increase over time in the present value of the liability, is recorded each period in depreciation, depletion and amortization expense. As reclamation work is performed or liabilities are otherwise settled, the recorded amount of the liability is reduced. Future remediation costs for inactive mines are accrued based on management’s best estimate at the end of each period of the undiscounted costs expected to be incurred at the site. Such cost estimates include, where applicable, ongoing care and maintenance and monitoring costs. Changes in estimates are reflected in earnings in the period an estimate is revised.Operating Statistics and Ore Reserve Estimates The Company’s total production from continuing operations in 20062007 was 11.5 million ounces of silver and 92,014 ounces of gold, compared to 12.8 million ounces of silver and 116,254 ounces of gold compared to 11.7 million ounces of silver and 133,945 ounces of gold in 2005.2006. Total estimated proven and probable reserves at December 31, 20062007 were approximately 216.5216.0 million ounces of silver and 1.5 million ounces of gold, compared to silver and gold ore reserves at December 31, 20052006 of approximately 221.4216.5 million ounces and 1.31.5 million ounces, respectively.58
53
The following table shows the estimated amounts of proven and probable ore reserves and mineralized material at the Company’s following Company locations at year-end 2006:Proven and Probable(1)
Mineralized Material
Tons (000’s)
Grade
Ag oz/t
Grade
Au oz/t
Ounces AG
(000’s)
Ounces AU
(000’s)
Tons (000’s)
Grade
Ag oz/t
Grade
Au oz/t
Rochester 3,720 0.66 0.007 2,436 26 15,235 0.94 0.007 Cerro Bayo 634 9.69 0.19 6,144 122 2,509 8.23 0.15 Mina Martha 99 61.33 0.09 6,084 9 112 42.91 0.05 San Bartolome 46,176 3.29 -- 151,882 -- 1,166 3.44 -- Kensington 4,419 -- 0.31 -- 1,352 4,320 -- 0.20 Endeavor(2) 21,385 1.50 -- 31,983 -- 9,370 3.00 -- Broken Hill(2) 12,908 1.40 -- 18,015 -- 10,872 3.82 --
Total tons 89,341 216,544 1,509 Summary by metal: Total tons
(000’s)
Ag oz/t
(Wt. Avg.)
Au oz/t
(Wt. Avg.)
Total tons
(000’s)
Ag oz/t
(Wt. Avg.)
Au oz/t
(Wt. Avg.)
Silver 84,922 2.55 -- 39,264 2.89 -- Gold 8,872 -- 0.17 22,176 -- 0.06
2007: Proven and Probable Ore Reserves(1) Mineralized Material Grade Grade Ounces Ag Ounces Au Grade Grade Tons (000’s) Ag oz/t Au oz/t (000’s) (000’s) Tons (000’s) Ag oz/t Au oz/t Rochester — — — — — 32,664 0.85 0.01 Cerro Bayo 782 9.26 0.14 7,234 112 2,865 9.28 0.14 Mina Martha 154 53.97 0.07 8,293 11 165 32.75 0.04 Endeavor(2) 19,731 1.52 — 29,926 — 12,291 2.44 — Broken Hill(2) 12,394 1.45 — 17,931 — 9,844 3.82 — San Bartolomé 42,043 3.64 — 153,003 — 15,816 2.21 — Kensington 4,419 — 0.31 — 1,352 4,320 — 0.20 Palmarejo — — — — — 33,852 4.44 0.05 Total tons 79,523 216,387 1,475
Ag oz/t Au oz/t Ag oz/t Au oz/t Summary by metal: Total tons (000’s) (Wt. Avg.) (Wt. Avg.) Total tons (000’s) (Wt. Avg.) (Wt. Avg.) Silver 75,104 2.88 — 107,495 2.91 — Gold 5,354 — 0.28 73,865 — 0.04
(1) Reserves usingUsing silver price of $8.00$11.00 and gold price of $475,$600, except for Endeavor which uses a $10.00$15.00 silver price, and Broken Hill which uses a $10.12 silver price, San Bartolome which uses a $6.00$13.50 silver price and Kensington which uses a gold price of $550.
(2) ReservesOre reserves are provided by the operator as of June 30, 2006,2007, the end of the operator’s most recent fiscal year. These totals do not include additions or depletions through December 31, 2006.2007.
The ore reserves at December 31, 20062007 may change with fluctuations in the price of gold and silver. The following table shows the estimated changes to ore reserves at mines operated by the Company at different pricing ranges.Proven and Probable Ore Reserve Sensitivity to Prices Per ounce Per ounce (000’s) (000’s) Silver Price Gold Price Tons (000’s) Ounces Ag Ounces Au Cerro Bayo $ 10 $ 550 625 6,235 97 $ 11 $ 600 782 7,234 112 $ 12 $ 650 839 7,739 117 $ 13 $ 600 895 8,126 120 Mina Martha $ 10 $ 550 148 8,200 10 $ 11 $ 600 154 8,293 11 $ 12 $ 650 160 8,377 11 $ 13 $ 700 164 8,434 11 San Bartolomé $ 10 36,967 142,060 — $ 11 42,043 153,003 — $ 12 48,331 165,413 — $ 13 52,783 173,135 — Kensington $ 510 4,102 — 1,294 $ 550 4,419 — 1,352 $ 600 4,594 — 1,380
59
Per ounce
Silver Price
Per ounce
Gold Price
Tons (000’s)
(000’s)
Ounces AG
(000’s)
Ounces AU
Rochester $8.00 $475 3,720 2,436 26 $9.50 $510 4,229 2,972 30 $11.25 $550 4,368 2,986 29 $12.00 $600 4,533 3,077 30 Cerro Bayo $8.00 $475 634 122 6 $9.50 $510 643 124 6 $11.25 $550 646 124 6 $12.00 $600 668 128 6 Mina Martha $8.00 $475 99 9 6 $9.50 $510 102 9 6 $11.25 $550 102 9 6 $12.00 $600 102 9 6 Kensington $475 3,710 1,220 $510 4,102 1,294 $550 4,419 1,352 $600 4,594 1,380
54
The following table presents production information by mine and consolidated sales information for the years ended December 31: 2007 2006 2005 Rochester Tons processed 5,060,678 10,399,416 9,327,180 Ore grade/Ag oz 0.65 0.74 0.91 Ore grade/Au oz 0.01 0.01 0.01 Recovery/Ag oz(A) 141.4% 65.9% 67.5% Recovery/Au oz(A) 167.6% 68.9% 76.2% Silver production ounces 4,614,780 5,113,504 5,720,489 Gold production ounces 50,408 71,891 70,298 Cash cost/oz $ 1.52 $ 2.80 $ 4.82 Total cost/oz $ 3.82 $ 5.84 $ 6.66 Cerro Bayo Tons milled 387,378 428,346 403,695 Ore grade/Ag oz 4.68 5.76 7.52 Ore grade/Au oz 0.11 0.10 0.16 Recovery/Ag oz 94.4% 94.5% 94.7% Recovery/Au oz 92.2% 93.0% 92.8% Silver production ounces 1,709,830 2,331,060 2,875,047 Gold production ounces 37,479 40,923 61,058 Cash cost/oz $ 8.22 $ 3.04 $ 0.54 Total cost/oz $ 11.82 $ 5.46 $ 2.30 Martha Mine Tons milled 37,047 35,843 35,293 Ore grade/Ag oz 78.10 79.93 62.53 Ore grade/Au oz 0.12 0.10 0.08 Recovery/Ag oz 95.0% 94.7% 94.9% Recovery/Au oz 92.7% 92.5% 92.9% Silver production ounces 2,748,705 2,712,846 2,093,464 Gold production ounces 4,127 3,440 2,589 Cash cost/oz $ 6.27 $ 4.88 $ 4.60 Total cost/oz $ 6.78 $ 5.36 $ 5.01 Endeavor(B) Tons milled 1,146,857 750,115 463,129 Ore grade/Ag oz 1.40 1.01 1.52 Recovery/Ag oz 48.0% 63.5% 45.0% Silver production ounces 772,609 481,991 316,169 Cash cost/oz $ 2.67 $ 2.85 $ 2.05 Total cost/oz $ 3.65 $ 3.87 $ 3.35 Broken Hill(B) Tons milled 1,646,203 2,288,355 667,140 Ore grade/Ag oz 1.19 1.28 1.31 Recovery/Ag oz 83.6% 74.2% 75.4% Silver production ounces 1,642,205 2,174,585 657,093 Cash cost/oz $ 3.18 $ 3.09 $ 2.72 Total cost/oz $ 5.04 $ 5.44 $ 5.47 CONSOLIDATED PRODUCTION TOTALS Silver ounces 11,488,129 12,813,986 11,662,262 Gold ounces 92,014 116,254 133,945 Cash cost per oz/silver $ 3.97 $ 3.33 $ 3.53 Total cost/oz $ 5.88 $ 5.53 $ 5.13 CONSOLIDATED SALES TOTALS(C) Silver ounces sold 11,506,560 12,841,634 12,579,634 Gold ounces sold 94,284 116,400 146,749 Realized price per silver ounce $ 13.59 $ 12.03 $ 7.47 Realized price per gold ounce $ 700 $ 623 $ 452
60
2006
2005
2004
Rochester Tons processed 10,399,416 9,327,180 12,435,346 Ore grade/Ag oz 0.74 0.91 0.74 Ore grade/Au oz 0.01 0.01 0.01 Recovery/Ag oz(A) 65.9 % 67.5 % 61.5 % Recovery/Au oz(A) 68.9 % 76.2 % 64.2 % Silver production ounces 5,113,504 5,720,489 5,669,074 Gold production ounces 71,891 70,298 69,456 Cash cost/oz $2.80 $4.82 $3.93 Total cost/oz $5.84 $6.66 $5.66 Cerro Bayo Tons milled 428,346 403,695 456,941 Ore grade/Ag oz 5.76 7.52 7.51 Ore grade/Au oz 0.10 0.16 0.14 Recovery/Ag oz 94.5 % 94.7 % 94.2 % Recovery/Au oz 93.0 % 92.8 % 91.8 % Silver production ounces 2,331,060 2,875,047 3,235,192 Gold production ounces 40,923 61,058 57,558 Cash cost/oz $3.04 $0.54 $1.01 Total cost/oz $5.46 $2.30 $2.43 Martha Mine Tons milled 35,843 35,293 30,276 Ore grade/Ag oz 79.93 62.53 59.94 Ore grade/Au oz 0.10 0.08 0.08 Recovery/Ag oz 94.7 % 94.9 % 94.2 % Recovery/Au oz 92.5 % 92.9 % 91.6 % Silver production ounces 2,712,846 2,093,464 1,709,069 Gold production ounces 3,440 2,589 2,318 Cash cost/oz $4.88 $4.60 $4.08 Total cost/oz $5.36 $5.01 $5.05 Endeavor(B) Tons milled 750,115 463,129 -- Ore grade/Ag oz 1.01 1.52 -- Recovery/Ag oz 63.5 % 45.0 % -- Silver production ounces 481,991 316,169 -- Cash cost/oz $2.85 $2.05 -- Total cost/oz $3.87 $3.35 -- Broken Hill(B) Tons milled 2,288,355 667,140 -- Ore grade/Ag oz 1.28 1.31 -- Recovery/Ag oz 74.2 % 75.4 % -- Silver production ounces 2,174,585 657,093 -- Cash cost/oz $3.09 $2.72 -- Total cost/oz $5.44 $5.47 -- CONSOLIDATED PRODUCTION TOTALS Silver ounces 12,813,986 11,662,262 10,613,335 Gold ounces 116,254 133,945 129,332 Cash cost per oz/silver $3.33 $3.53 $3.06 Total cost/oz $5.53 $5.13 $4.58 CONSOLIDATED SALES TOTALS(C) Silver ounces sold 12,841,634 12,579,634 9,669,283 Gold ounces sold 116,400 146,749 117,257 Realized price per silver ounce $12.03 $7.47 $6.72 Realized price per gold ounce $623 $452 $409
(A) The leach cycle at Rochester requires 5 to 10 years to recover gold and silver contained in the ore. The Company estimates the ultimate recovery to be approximately 61.5% for silver and 93% for gold. However, ultimate recoveries will not be known until leaching operations cease which is currently estimated forexpected to continue through 2011. Current recovery may vary significantly from ultimate recovery. See Critical Accounting Policies and Estimates –— Ore on Leach Pad. In August 2007, mining and crushing activities were terminated as ore reserves were fully mined.
55
(B) The Company acquired its interests in the Endeavor and Broken Hill mines in May 2005 and September 2005, respectively.
(C) Units sold at realized metal prices will not match reported metal sales due primarily to the effects on revenues of mark-to-market adjustments on embedded derivatives in the Company’s provisionally priced sales contracts.
“Cash Costs per Ounce” are calculated by dividing the cash costs computed for each of the Company’s mining properties for a specified period by the amount of gold ounces or silver ounces produced by that property during that same period. Management uses cash costs per ounce as a key indicator of the profitability of each of its mining properties. Gold and silver are sold and priced in the world financial markets on a USU.S. dollar per ounce basis.“Cash Costs” are costs directly related to the physical activities of producing silver and gold, and include mining, processing and other plant costs, third-party refining and smelting costs, marketing expense, on-site general and administrative costs, royalties, in-mine drilling expenditures that are related to production and other direct costs. Sales of by-product metals are deducted from the above in computing cash costs. Cash costs exclude depreciation, depletion and amortization, accretion, corporate general and administrative expense, exploration, interest, and pre-feasibility costs. Cash costs are calculated and presented using the “Gold Institute Production Cost Standard” applied consistently for all periods presented.Total cash costs per ounce is a non-GAAP measure and investors are cautioned not to place undue reliance on it and are urged to read all GAAP accounting disclosures presented in the consolidated financial statements and accompanying footnotes. In addition, see the reconciliation of “cash costs” to production costs under “Reconciliation of Non-GAAP Cash Costs to GAAP Production Costs” set forth below.Operating Statistics From Discontinued Operation The following table presents information for Coeur Silver Valley which was sold on June 1, 2006:Year Ended December 31, 2006
2005
2004
Silver Valley/Galena Tons milled 52,876 128,502 169,413 Ore grade/Silver oz 15.15 16.53 21.43 Recovery/Silver oz 96.0 % 97.0 % 97.0 % Silver production ounces 768,674 2,060,338 3,521,813 Cash cost/oz $9.75 $8.37 $5.46 Total cost/oz $10.64 $9.34 $6.02 Gold production 180 282 354
Year Ended December 31, 2006 2005 Silver Valley/Galena Tons milled 52,876 128,502 Ore grade/Silver oz 15.15 16.53 Recovery/Silver oz 96.0 % 97.0 % Silver production ounces 768,674 2,060,338 Cash cost/oz $ 9.75 $ 8.37 Total cost/oz $ 10.64 $ 9.34 Gold production 180 282
The production figures at the Galena mine reflect the five-month period ending May 31, 2006 and therefore are not comparable to the year ended December 31, 2005. Silver production during the period of Coeur’s ownership of the Galena mine in 2006 amounted to 768,674 ounces. Silver production for the year ended December 31, 2005 was 2,060,338 ounces. Total cash costs per ounce were $9.75 during the five-month period ending May 31, 2006. Total cash costs per ounce were $8.37 for the year ended December 31, 2005, respectively.2005. The lower production and higher costs per ounce for the periods presented are due to lower than expected production grades as mine operations adjusted to changing geologic ground conditions and ultimately the sale of Coeur Silver Valley on June 1, 2006.Reconciliation of Non-GAAP Cash Costs to GAAP Production Costs The tables below present reconciliations between non-GAAP cash costs per ounce to production costs applicable to sales including depreciation, depletion and amortization (GAAP).61
Total cash costs include all direct and indirect operating cash costs related directly to the physical activities of producing metals, including mining, processing and other plant costs, third-party refining and marketing expense, on-site general and administrative costs, royalties and mining production taxes, net of by-product revenues earned from all metals other than the primary metal produced at each unit. Total cash costs are a performance measure and provide management and investors with an indication of net cash flow, after consideration of the realized price received for production sold. Management also uses this measurement for the comparative monitoring of performance of our mining operations period-to-period from a cash flow perspective. “Total cash costs per ounce” is a measure developed by precious metals companies in an effort to provide a comparable standard, however, there can be no assurance that our reporting of this non-GAAP measure is similar to that reported by other mining companies.56
Production costs applicable to sales including depreciation, depletion and amortization, is the most comparable financial measure calculated in accordance with GAAP to total cash costs. The sum of the production costs applicable to sales and depreciation, depletion and amortization for our mines as set forth in the tables below is included in our Consolidated Statements of Operations and Comprehensive Income (Loss).Income.Year Ended December 31, 2007
(In thousands except ounces and per ounce costs) Rochester Cerro Bayo Martha Endeavor(1) Broken Hill(1) Total Production of silver (ounces) 4,614,780 1,709,830 2,748,705 772,609 1,642,205 11,488,129 Cash costs per ounce $ 1.52 $ 8.22 $ 6.27 $ 2.67 $ 3.18 $ 3.97 Total Cash Costs (Non-GAAP) $ 7,035 $ 14,055 $ 17,245 $ 2,064 $ 5,228 $ 45,627 Add/Subtract: Third party smelting costs — (3,603 ) (2,112 ) (1,347 ) (2,006 ) (9,068 ) By-product credit(2) 34,664 26,199 2,889 — — 63,752 Other adjustment 1,926 — — — — 1,926 Change in inventory 16,738 (1,701 ) (146 ) (172 ) 69 14,788 Depreciation, depletion and amortization 8,697 6,155 1,383 755 3,055 20,045 Production costs applicable to sales, including depreciation, depletion and amortization (GAAP) $ 69,060 $ 41,105 $ 19,259 $ 1,300 $ 6,346 $ 137,070
Year Ended December 31, 2006
(In thousands except ounces and per ounce costs) Rochester Cerro Bayo Martha Endeavor(1) Broken Hill(1) Total Production of silver (ounces) 5,113,504 2,331,060 2,712,846 481,991 2,174,585 12,813,986 Cash costs per ounce $ 2.80 $ 3.04 $ 4.88 $ 2.85 $ 3.09 $ 3.33 Total Cash Costs (Non-GAAP) $ 14,299 $ 7,089 $ 13,240 $ 1,373 $ 6,712 $ 42,713 Add/Subtract: Third party smelting costs — (3,475 ) (1,853 ) (948 ) (2,620 ) (8,896 ) By-product credit(2) 43,697 24,861 2,079 — — 70,637 Other adjustment 1,803 — — — — 1,803 Change in inventory (12,489 ) (1,105 ) (518 ) (39 ) 272 (13,879 ) Depreciation, depletion and amortization 13,745 5,638 1,297 490 5,120 26,290 Production costs applicable to sales, including depreciation, depletion and amortization (GAAP) $ 61,055 $ 33,008 $ 14,245 $ 876 $ 9,484 $ 118,668
62
YEAR ENDED DECEMBER 31, 2006 (In thousands except ounces and per ounce costs) Rochester
Cerro Bayo
Martha
Endeavor(1)
Broken Hill(1)
Total
Production of silver (ounces) 5,113,504 2,331,060 2,712,846 481,991 2,174,585 12,813,986 Cash costs per ounce $ 2.80 $ 3.04 $ 4.88 $ 2.85 $ 3.09 $ 3.33
Total cash costs (Non-GAAP) $ 14,299 $ 7,089 $ 13,240 $ 1,373 $ 6,712 $ 42,713 Add/Subtract: Third party smelting costs -- (3,475 ) (1,853 ) (948 ) (2,620 ) (8,896 ) By-product credit (2) 43,697 24,861 2,079 -- -- 70,637 Other adjustment 1,803 -- -- -- -- 1,803 Change in inventory (12,489 ) (1,105 ) (518 ) (39 ) 272 (13,879 ) Depreciation, depletion and amortization 15,548 5,638 1,297 490 5,120 28,093
Production costs applicable to sales, including depreciation, depletion and amortization (GAAP) $ 62,858 $ 33,008 $ 14,245 $ 876 $ 9,484 $ 120,471
Year Ended December 31, 2005
YEAR ENDED DECEMBER 31, 2005 (In thousands except ounces and per ounce costs) Rochester
Cerro Bayo
Martha
Endeavor(1)
Broken Hill(1)
Total
Production of silver (ounces) 5,720,489 2,875,047 2,093,464 316,169 657,093 11,662,262 Cash costs per ounce $ 4.82 $ 0.54 $ 4.60 $ 2.05 $ 2.72 $ 3.53
Total cash costs (Non-GAAP) $ 27,575 $ 1,542 $ 9,637 $ 648 $ 1,790 $ 41,192 Add/Subtract: Third party smelting costs -- (2,783 ) (1,165 ) (370 ) (570 ) (4,888 ) By-product credit (2) 31,601 27,114 1,152 -- -- 59,867 Other adjustment 140 -- -- -- -- 140 Change in inventory (14,769 ) 7,421 (328 ) -- (403 ) (8,079 ) Depreciation, depletion and amortization 10,542 5,064 843 411 1,807 18,667
Production costs applicable to sales, including depreciation, depletion and amortization (GAAP) $ 55,089 $ 38,358 $ 10,139 $ 689 $ 2,624 $ 106,899
57
YEAR ENDED DECEMBER 31, 2004 (In thousands except ounces and per ounce costs) Rochester
Cerro Bayo
Martha
Endeavor(1)
Broken Hill(1)
Total
Production of silver (ounces) 5,669,074 3,235,192 1,709,069 -- -- 10,613,335 Cash costs per ounce $ 3.93 $ 1.01 $ 4.08 -- -- $ 3.06
Total cash costs (Non-GAAP) $ 22,287 $ 3,253 $ 6,975 -- -- $ 32,515 Add/Subtract: Third party smelting costs -- (4,106 ) (887 ) -- -- (4,993 ) By-product credit (2) 28,646 23,845 951 -- -- 53,442 Other adjustment (403 ) 110 -- -- -- (293 ) Change in inventory (13,380 ) (3,212 ) (364 ) -- -- (16,956 ) Depreciation, depletion and amortization 9,827 4,588 1,652 -- -- 16,067
Production costs applicable to sales, including depreciation, depletion and amortization (GAAP) $ 46,977 $ 24,478 $ 8,327 -- -- $ 79,782
(In thousands except ounces and per ounce costs)
Rochester Cerro Bayo Martha Endeavor(1) Broken Hill(1) Total Production of silver (ounces) 5,720,489 2,875,047 2,093,464 316,169 657,093 11,662,262 Cash costs per ounce $ 4.82 $ 0.54 $ 4.60 $ 2.05 $ 2.72 $ 3.53 Total cash costs (Non-GAAP) $ 27,575 $ 1,542 $ 9,637 $ 648 $ 1,790 $ 41,192 Add/Subtract: Third party smelting costs — (2,783 ) (1,165 ) (370 ) (570 ) (4,888 ) By-product credit(2) 31,601 27,114 1,152 — — 59,867 Other adjustment 140 — — — — 140 Change in inventory (14,769 ) 7,421 (328 ) — (403 ) (8,079 ) Depreciation, depletion and amortization 10,402 5,064 843 411 1,807 18,527 Production costs applicable to sales, including depreciation, depletion and amortization (GAAP) $ 54,949 $ 38,358 $ 10,139 $ 689 $ 2,624 $ 106,759
The following tables present a reconciliation between non-GAAP cash costs per ounce to GAAP production costs applicable to sales reported in Discontinued Operations (see Note D):Coeur Silver Valley/Galena 2006(3)
2005
2004
Production of silver (ounces) 768,674 2,060,338 3,521,813 Cash costs per ounce $ 9.75 $ 8.37 $ 5.46
Total cash costs (Non-GAAP) $ 7,498 $ 17,248 $ 19,231 Add/Subtract: Third party smelting costs (1,464 ) (3,091 ) (5,117 ) By-product credit(2) 1,473 2,722 3,766 Change in inventory 726 (181 ) 757 Depreciation, depletion and amortization 681 1,996 1,967
Production costs applicable to sales, including depreciation, depletion and amortization (GAAP) $ 8,914 $ 18,694 $ 20,604
Coeur Silver Valley/Galena 2006(3) 2005 Production of silver (ounces) 768,674 2,060,338 Cash costs per ounce $ 9.75 $ 8.37 Total Cash Costs (Non-GAAP) $ 7,498 $ 17,248 Add/Subtract: Third party smelting costs (1,464 ) (3,091 ) By-product credit(2) 1,473 2,722 Change in inventory 726 (181 ) Depreciation, depletion and amortization 681 1,996 Production costs applicable to sales, including depreciation, depletion and amortization (GAAP) $ 8,914 $ 18,694
(1) The Company’s share of silver production at Endeavor and Broken Hill commenced in May 2005 and September 2005, respectively.
(2) By-product credits are based upon production units and the period’s average metal price for purposes of reporting cash costs per ounce.
(3) Amounts represent five months ended May 31, 2006.
Results of OperationsYear Ended December 31, 2007 Compared to Year Ended December 31, 2006Revenues Sales of metal from continuing operations in the year ended December 31, 2007 decreased by $1.3 million, or 1%, from the year ended December 31, 2006 to $215.3 million. The decrease in sales of metal was primarily due to a decrease in the quantity of silver and gold ounces sold during 2007, partially offset by increased metal prices realized. In 2007, the Company sold 11.6 million ounces of silver and 94,284 ounces of gold, compared to sales of 12.8 million ounces of silver and 116,400 ounces of gold in 2006. In the year ended December 31, 2007, the Company realized average silver and gold prices of $13.59 and $700, respectively, compared with realized average prices of $12.03 and $623, respectively, in the prior year.63
Included in revenues is the by-product revenue associated with by-product metal sales consisting of gold. In 2007, by-product revenues totaled $64.4 million compared to $68.8 million in 2006. The decrease is due to a decrease in the quantity of gold sold in 2007. The Company believes, based on the best estimates, that presentation of these revenue streams as by-products from its current operations will continue to be appropriate in the future. In the year ended December 31, 2007, the Company produced a total of 11.5 million ounces of silver and 92,014 ounces of gold compared to 12.8 million ounces of silver and 116,254 ounces of gold in 2006. The decrease in silver production in 2007, as compared to 2006, was primarily due to decreased production at the Rochester, Cerro Bayo and Broken Hill mines in 2007 as compared to 2006.Costs and Expenses Production costs applicable to sales from continuing operations for the year ended 2007 increased by $24.6 million, or 26.7%, from the same period of 2006 to $117.0 million. The increase in production costs applicable to sales for the year is primarily the result of higher costs per ounce allocated with the drawdown of heap leach inventory associated with historic ore production, which is recognized as expense as ounces are recovered from the leaching process and sold. In addition, the increase in production costs is attributable to higher costs of labor, fuel, power and other consumables at the Company’s other mine operations. In addition, during 2007, the Rochester mine recorded a $1.5 million expense associated with the cessation of mining and crushing activities and a $1.0 million expense associated with early termination of employees employed in mining and crushing activities. Depreciation and amortization decreased in the year ended December 31, 2007 by $5.8 million, or 21.6%, over the prior year, primarily due to decreased depreciation and depletion expense attributable to the Rochester mine due to the cessation of mining and crushing activities in August of 2007. Administrative and general expenses increased $4.5 million in 2007 compared to 2006 due primarily to compensation costs associated with the Company’s annual incentive plan, business development activities related to the Bolnisi and Palmarejo acquisitions and increases in other corporate expenses. Total exploration expenses were $11.9 million in 2007 compared to $9.5 million in 2006. Litigation settlement expenses decreased by $1.9 million in 2007 to $0.5 million. During 2006, the Company commenced payments pursuant to the Federal Natural Resource Settlement Decree dated May 14, 2001. Under the terms of the settlement, the Company was required to pay royalties on all of its domestic and foreign operating properties, up to a cumulative maximum of $3.0 million, amounting to a 2% net smelter royalty on silver production if the price of silver exceeds $6.50 per ounce, and a $5.00 per ounce royalty on gold production if the price of gold exceeds $325 per ounce. The royalty payment obligation commenced on May 14, 2006 and expires after May 14, 2021. The Company made its final payment to the U.S. government called for under the settlement agreement in the first quarter of 2007.Other Income and Expenses Interest and other income in the year ended December 31, 2007 decreased by $0.5 million compared with the year ended December 31, 2006. The increase was primarily due to an increase in gain on sale of assets of $1.9 million offset by a decrease in interest income due to lower levels of cash and short-term investments and lower interest rates earned on the Company’s cash, cash equivalents and short-term investments.64
Income Taxes For the year ended December 31, 2007, the Company recorded an income tax provision of approximately $14.9 million compared to $8.2 million in 2006. The following table summarizes the components of the Company’s income tax provision for the years ended December 31, 2007 and 2006: Year Ended December 31, 2007 2006 Current: United States — Alternative minimum tax $ (381 ) $ (900 ) United States — Foreign withholding (904 ) (713 ) Foreign — Argentina (6,590 ) (4,842 ) Foreign — Australia (4,898 ) (4,673 ) Deferred: Foreign — Argentina 172 65 Foreign — Australia (664 ) (93 ) Foreign — Chile (1,662 ) 2,930 Income tax provision $ (14,927 ) $ (8,226 )
In 2007, due to higher metal prices, the Company recognized a current provision in the U.S. and all foreign operating jurisdictions. Further, the Company accrued foreign withholding taxes of approximately $0.9 million on interest payable on inter-company loans from the U.S. Parent to the Argentina and Australia subsidiaries. Finally, the Company recognized a $2.2 million deferred tax provision in foreign jurisdictions for the recognition of the benefit of tax loss carryforwards in Chile net of the recognition of deferred taxes on taxable temporary differences in Argentina and Australia. During 2007, the Company recorded $1.1 million in income tax provisions resulting from its assessment of prior period tax contingencies across its various tax jurisdictions in connection with the adoption of FIN 48 effective January 1, 2007. In 2006, due to significantly higher metals prices, additional proven and probable reserves, and a full year of operation in Australia, the Company recognized a current provision in the U.S. and all foreign operating jurisdictions. Further, the Company accrued foreign withholding taxes of approximately $0.7 million on interest payable on inter-company loans from the U.S. Parent to the Argentina and Australia subsidiaries. Finally, the Company recognized an additional $2.9 million deferred tax benefit in Chile as anticipated metals prices and projections of future pre-tax income are sufficient to utilize the remaining net operating loss carry-forwards in Chile.Year Ended December 31, 2006 Compared to Year Ended December 31, 2005 Revenues Sales of metal from continuing operations in the year ended December 31, 2006 increased by $60.3 million, or 39%, over the year ended December 31, 2005 to $216.6 million. The increase in sales of metal was primarily attributable to increased metal prices realized, partially offset by a decrease in the quantity of ounces of gold sold during 2006 as compared to 2005. In 2006, the Company sold 12.8 million ounces of silver and 116,400 ounces of gold, compared to sales of 12.6 million ounces of silver and 146,749 ounces of gold in 2005. In the year ended December 31, 2006, the Company realized average silver and gold prices of $12.03 and $623, respectively, compared with realized average prices of $7.47 and $452, respectively, in the prior year.65
58
Included in revenues is the by-product revenue associated with by-product metal sales consisting of gold. In 2006, by-product revenues totaled $68.8 million compared to $64.4 million in 2005. The increase is due to an increase in realized prices for gold. The Company believes, based on the best estimates, that presentation of these revenue streams as by-products from its current operations will continue to be appropriate in the future. In the year ended December 31, 2006, the Company produced a total of 12.8 million ounces of silver and 116,254 ounces of gold compared to 11.7 million ounces of silver and 133,945 ounces of gold in 2005. The increase in silver production in 2006, as compared to 2005, was primarily due to higher silver production from the Martha mine and the silver production from the Endeavor and Broken Hill mines, in which the Company acquired certain silver production and reserves on May 23, 2005 and September 8, 2005, respectively, offset by decreased silver production at the Rochester and Cerro Bayo mines. Costs and Expenses The following table sets forth
Production costs applicable to sales from continuing operations, for the year ended December 31, 2006, versus yearincreased by $4.1 million, or 4.7%, from the same period of 2005 costs and expenses:to $92.4 million. The increase in production costs applicable to sales for the year is primarily the result of production costs associated with the Endeavor and Broken Hill mines, in which the Company acquired the silver production and reserves on May 23, 2005 and September 8, 2005, respectively.
Depreciation and amortization increased in the year ended December 31, 2006 by $7.9 million, or 42%, over the prior year, primarily due to the increase in depletion associated with the newly acquired Endeavor and Broken Hill mines, and at the Rochester mine as a result of changes in its ore reserve estimates. Administrative and general expenses decreased $1.3 million in the year ended December 31, 2006 compared to 2005 due primarily to a $1.4 million decrease in general corporate services and outside audit services related to financial reporting compliance activities, partially offset by a $0.1 million increase in holding costs on inactive properties. Total exploration expenses decreased $1.1 million in the year ended December 31, 2006 compared to 2005, primarily as a result of lower exploration activities at the Kensington, Cerro Bayo and Martha mines. Pre-development expense decreased $6.1 million due to the classification of the Kensington project as a development-stage property in third quarter of 2005.59
Litigation settlement expenses increased by $0.8 million in 2006 to $2.4 million. During 2006, the Company commenced payments pursuant to the Federal Natural Resource Settlement Decree dated May 14, 2001. Under the terms of the settlement, the Company is required to pay royalties on all of its domestic and foreign operating properties, up to a cumulative maximum of $3.0 million, amounting to a 2% net smelter royalty on silver production if the price of silver exceeds $6.50 per ounce, and a $5.00 per ounce royalty on gold production if the price of gold exceeds $325 per ounce. The royalty payment obligation commenced on May 14, 2006 and expires after May 14, 2021. As of December 31, 2006, $2.5 million (including discontinued operations) of the $3.0 million has been paid. It is expected that the remaining $0.5 million will be paid in the first half of 2007. During 2005, the Company recorded a litigation settlement of $1.6 million related to the Company’s settlement of the suit by Credit Suisse First Boston. See Note R — Litigation.66
Other Income and Expenses Interest and other income in the year ended December 31, 2006 increased by $11.5 million compared with the year ended December 31, 2005. The increase was primarily due to higher levels of invested cash and short-term investments on hand and higher interest rates earned on the Company’s cash, cash equivalents and short-term investments. Interest expense decreased $1.3 million in the year ended December 31, 2006 compared to 2005, due to increased capitalized interest expense associated with the higher capital expenditures at the Kensington and San BartolomeBartolomé development projects. Capitalized interest was $1.4 million in 2006 compared to $0.2 million in 2005. Income Taxes For the year ended December 31, 2006, the Company recorded an income tax provision of approximately $8.2 million compared to $1.5 million in 2005. The following table summarizes the components regarding the Company’s income tax (provision) benefit for the years ended December 31, 2006 and 2005:Year Ended December 31,
2006
2005
Current: United States - Alternative minimum tax $ (900 ) $ 212 United States - Foreign withholding (713 ) -- Foreign - Argentina (4,842 ) (66 ) Foreign - Australia (4,673 ) -- Deferred: Foreign - Argentina 65 929 Foreign - Australia (93 ) (404 ) Foreign - Chile 2,930 (2,154 )
Income tax benefit (provision) $ (8,226 ) $ (1,483 )
Year Ended December 31, 2006 2005 Current: United States — Alternative minimum tax $ (900 ) $ 212 United States — Foreign withholding (713 ) — Foreign — Argentina (4,842 ) (66 ) Foreign — Australia (4,673 ) — Deferred: Foreign — Argentina 65 929 Foreign — Australia (93 ) (404 ) Foreign — Chile 2,930 (2,154 ) Income tax provision $ (8,226 ) $ (1,483 )
In 2006, due to significantly higher metals prices, additional proven and probable reserves, and a full year of operation in Australia, the Company recognized a current provision in the USU.S. and all foreign operating jurisdictions. Further, the Company accrued foreign withholding taxes of approximately $0.7 million on interest payable on inter-company loans from the USU.S. Parent to the Argentina and Australia subsidiaries. Finally, the Company recognized an additional $2.9 million deferred tax benefit in Chile as anticipated metals prices and projections of future pre-tax income are sufficient to utilize the remaining net operating loss carry-forwards in Chile. In 2005, the Company recognized a $0.2 million current USU.S. benefit from the refund of prior year alternative minimum taxes, an estimated current provision in Argentina, and $0.9 million Argentina deferred tax benefit from the anticipated utilization of other deductible temporary differences. Further, the Company recognized a $0.4 million Australia deferred tax provision on originating temporary differences, and a $2.2 million Chile deferred tax provision related to the utilization of net operating loss carry-forwards for which deferred tax assets were previously recognized.60
Results of Discontinued Operations On June 1, 2006, the Company completed the sale of 100% of the shares of Coeur Silver Valley Inc. to U.S. Silver Corporation for $15 million in cash. Pursuant to FASSFAS 144, Accounting“Accounting for the Impairment or Disposal of Long-Lived Assets,” Coeur Silver Valley has been classified as an asset held for sale and reported in discontinued operations for the years ended December 31, 2006 and 2005. The Company recognized a gain of approximately $11.1 million on the sale in 2006.67
The following is a summary of the Company’s discontinued operations included in the consolidated statements of operations for the years ended December 31, 2006 and 2005 (in thousands):Year Ended December 31,
2006
2005
Sales of metal $ 11,223 $ 16,052 Production costs applicable to sales (8,233 ) (16,698 ) Depreciation and depletion (681 ) (1,996 ) Mining exploration (279 ) (1,361 ) Other (95 ) (192 )
Income (loss) from discontinued operations, net of taxes 1,935 (4,195 ) Gain on sale of net assets of discontinued operations 11,132 --
Net income (loss) for discontinued operations, net of taxes $ 13,067 $ (4,195 )
Year Ended December 31, 2005 Compared to Year Ended December 31, 2004
Year Ended December 31, 2006 2005 Sales of metal $ 11,223 $ 16,052 Production costs applicable to sales (8,233 ) (16,698 ) Depreciation and depletion (681 ) (1,996 ) Mining exploration (279 ) (1,361 ) Other (95 ) (192 ) Income (loss) from discontinued operations, net of taxes 1,935 (4,195 ) Gain on sale of net assets of discontinued operations 11,132 — Net income (loss) for discontinued operations, net of taxes $ 13,067 $ (4,195 )
Revenues Sales of metal in the year ended December 31, 2005 increased by $47.2 million, or 43%, over the year ended December 31, 2004 to $156.3 million. The increase in sales was primarily attributable to an increase in the quantity of silver and gold sold during 2005 and increased metal prices realized in 2005 as compared to 2004. In 2005, the Company sold 12.6 million ounces of silver and 146,749 ounces of gold, compared to sales of 9.7 million ounces of silver and 117,257 ounces of gold in 2004. In the year ended December 31, 2005, the Company realized average silver and gold prices of $7.47 and $452, respectively, compared with realized average prices of $6.72 and $409, respectively, in the prior year.
Included in revenues is the by-product revenue associated with by-product metal sales consisting of gold. In 2005, by-product revenues totaled $64.4 million compared to $45.9 million in 2004. The increase is primarily due to an increase in the quantity of gold sold and higher gold prices realized in 2005 compared to 2004. The Company believes, based on the best estimates, that presentation of these revenue streams as by-products from its current operations will continue to be appropriate in the future.
In the year ended December 31, 2005, the Company produced a total of 11.7 million ounces of silver and 133,945 ounces of gold compared to 10.6 million ounces of silver and 129,332 ounces of gold in 2004. The higher silver production in 2005, as compared to 2004, was primarily due higher silver production from the Rochester and Martha mines. In addition, on May 23, 2005, the Company acquired silver production and reserves contained at the Endeavor mine in Australia, which is owned and operated by Cobar Operations Pty. Limited, a subsidiary of CBH Resources Ltd. Coeur’s share of silver production there amounted to 316,169 ounces. On September 8, 2005, the Company acquired silver production and reserves contained at the Broken Hill mine in Australia, which is owned and operated by Perilya Broken Hill Ltd. Coeur’s share of silver production at that mine from September 8, 2005 to December 31, 2005 amounted to 657,093 ounces.
61
Costs and Expenses
The following table sets forth year 2005 versus year 2004 costs and expenses:
The increase in production costs applicable to sales for the year is primarily the result of higher diesel, utility and operating materials and supply costs at the Company’s mining operations and the Company’s operating costs associated with the Company’s newly acquired interests in the Endeavor and Broken Hill mines.
Depreciation and amortization increased in the year ended December 31, 2005 by $2.1 million, or 12%, over the prior year, primarily due to the increased depletion associated with the Company’s newly acquired interests in the Endeavor and Broken Hill mines.
Administrative and general expenses increased $3.1 million in the year ended December 31, 2005 compared to 2004 due primarily to higher outside audit services of $1.4 million related to financial reporting compliance activities, higher compensation costs of $0.7 million and $1.0 million in increased other general administration expenses.
Exploration expenses increased $2.5 million in the year ended December 31, 2005 compared to 2004, due to increased exploration activities at the Kensington, Cerro Bayo and Martha mines.
Pre-development expense decreased $5.4 million due to the classification of the San Bartolome and Kensington projects as development-stage properties in the fourth quarter of 2004 and the third quarter of 2005, respectively.
During 2005, the Company recorded a litigation settlement of $1.6 million related to the Company’s settlement of the suit by Credit Suisse First Boston. See Note R — Litigation.
Other Income and Expenses
Interest and other income in the year ended December 31, 2005 increased by $5.2 million compared with the year ended December 31, 2004 due to higher interest rates earned on the Company’s cash, cash equivalents and short-term investments. Interest expense decreased $0.3 million in the year ended December 31, 2005 compared to 2004, due to the fact that the Company began capitalizing a portion of its interest expense associated with the capitalization of development expenditures at the Kensington and San Bartolome development projects. Capitalized interest was $0.2 million in 2005 compared to $0.1 million in 2004.
62
Expenses of $15.7 million were incurred in 2004 in connection with the Company’s tender offer for outstanding shares of Wheaton River Minerals Ltd. That offer expired on September 30, 2004, with Coeur not purchasing any Wheaton shares tendered due to unsatisfied conditions of the offer. No such expenses were incurred in 2005.
Income Taxes
For the year ended December 31, 2005, the Company recorded an income tax provision of approximately $1.5 million compared to a tax benefit of approximately $5.8 million in 2004. The following table summarizes the components of the Company’s income tax provision (benefit) for the years 2005 and 2004:
Year Ended December 31,
2005
2004
Current: United States - Alternative minimum tax $ 212 $ 1,382 Foreign - Argentina (66 ) -- Deferred: Foreign - Argentina 929 -- Foreign - Australia (404 ) -- Foreign - Chile (2,154 ) 4,403
Income tax benefit (provision) $ (1,483 ) $ 5,785
In 2005, the Company recognized a $0.2 million current US benefit from the refund of prior year alternative minimum taxes, an estimated current provision in Argentina, and $0.9 million Argentina deferred tax benefit from the anticipated utilization of other deductible temporary differences. Further, the Company recognized a $0.4 million Australia deferred tax provision on originating temporary differences, and a $2.2 million Chile deferred tax provision related to the utilization of net operating loss carry-forwards for which deferred tax assets were previously recognized.
In 2004, the Company recognized a $1.4 million US current benefit associated with the reversal of a prior year tax accrual and a $4.4 million Chile deferred tax benefit associated with the anticipated utilization of net operating loss carry-forwards.
Results of Discontinued Operations
On June 1, 2006, the Company completed the sale of 100% of the shares of Coeur Silver Valley Inc. to U.S. Silver Corporation for $15 million in cash. Pursuant to FAS 144, Accounting for the Impairment or Disposal of Long-Lived Assets, Coeur Silver Valley has been classified as an asset held for sale and reported in discontinued operations for years ended December 31, 2005 and 2004. The Company recognized a gain of approximately $11.1 million on the sale in 2006.
The following is a summary of the Company’s discontinued operations included in the consolidated statements of operations for the years ended December 31, 2005 and 2004 (in thousands):
Year Ended December 31,
2005
2004
Sales of metal $ 16,052 $ 23,759 Production costs applicable to sales (16,698 ) (18,637 ) Depreciation and depletion (1,996 ) (1,967 ) Mining exploration (1,361 ) (1,620 ) Other (192 ) (357 )
Net income (loss) for discontinued operations $ (4,195 ) $ 1,178
63
Liquidity and Capital Resources
Working Capital; Cash and Cash Equivalents The Company’s working capital at December 31, 20062007 was approximately $383.1$152.4 million compared to $282.0$383.1 million at December 31, 2005.2006. The ratio of current assets to current liabilities was 2.4 to 1 at December 31, 2007 compared to 7.5 to 1 at December 31, 2006 compared to 7.1 to 1 at December 31, 2005.2006.
Net cash provided by operating activities in 20062007 was $91.2$40.1 million compared with net cash provided by (used in) operating activities of $91.2 million in 2006 and $6.7 million in 2005 and $(18.6) million in 2004.2005. The changes were primarily a result of the following:Year Ended December 31, 2006
2005
2004
(In thousands)
Cash collected from customers $ 212,102 $ 136,967 $ 109,383 Cash paid to suppliers, employees, etc (139,417 ) (134,321 ) (135,422 ) Interest received 17,674 9,620 4,585 Interest paid (921 ) (2,186 ) (1,507 ) Discontinued operations 1,792 (3,404 ) 4,379
Net cash provided by operating activities $ 91,230 $ 6,676 $ (18,582 )
Years Ended December 31, (In thousands) 2007 2006 2005 Cash collected from customers $ 220,055 $ 212,102 $ 136,967 Cash paid to suppliers, employees, etc. (195,377 ) (139,417 ) (134,321 ) Interest received 15,589 17,674 9,620 Interest paid (210 ) (921 ) (2,186 ) Discontinued operations — 1,792 (3,404 ) Net cash provided by operating activities $ 40,057 $ 91,230 $ 6,676
A total of $20.3$211.5 million was used in investing activities in 20062007 compared to $51.8$20.3 million used in 2005.2006. The decreaseincrease of $31.5$191.9 million used in investing activities is primarily due to an increase in capital expenditures related to the construction activities at the Kensington and San BartolomeBartolomé projects and the acquisition of silver reserves and production from the Endeavor and Broken Hill mines, partially offset by net proceeds from sales of short-term investments.68
Prior to December 31, 2006, the Company concluded that it was appropriate to classify its investments in auction rate securities as short-term investments. Previously such investments had been classified as cash and cash equivalents. Accordingly, we have revised the classification to report these investments as short-term investments on the consolidated balance sheets as of December 31, 2005 and December 31, 2004. The Company also made corresponding adjustments to the consolidated statements of cash flows for the periods ended December 31, 2005 and December 31, 2004 to reflect the gross purchases and sales of these investments as investing activities rather than as a component of cash and cash equivalents. As of December 31, 2005 and December 31, 2004, $159.7 million and $207.9 million respectively, of these investments were reclassified from cash and cash equivalents to short-term investment on the consolidated Balance Sheet. This reclassification had no effect on the total current assets, stockholders’ equity, net income (loss), net income (loss) per share, or on cash provided by (used in) operating activities.
The Company’s financing activities provided $144.9used $0.6 million of cash during 20062007 compared to $34.8net cash provided by financing activities of $144.9 million in 2005.2006. The increasedecrease is primarily due to the sale of 27.6 million shares of common stock during the first quarter of 2006. Cash and cash equivalents decreased by $172.0 million in 2007 compared to an increase of $215.8 million in 2006.
The Company believes its cash, cash equivalents and short-term investments and cash from operations will be adequate to meet its operating obligations during the next twelve months. Nevertheless,However, the Company may invest as much as approximately $398 million in capital activities in 2008 including development of San Bartolomé, Kensington and Palmarejo in addition to sustaining capital. The Company may elect to defer some capital investment activities or to secure additional capital to ensure it maintains sufficient liquidity. In addition, if the Company decides to pursue additional mineral interests or acquisitions, additional equity issuances or financing may be necessary. There can be no assurances that such financing will be available when or if needed. The Company estimates approximately $235$119.7 million will be spent during 20072008 on capital expenditures at its operating mines and development-stage properties.64
Acquisitions of Bolnisi and Palmarejo On December 21, 2007, the Company completed its acquisition of all the shares of Bolnisi Gold NL and Palmarejo Gold and Silver Corporation in exchange for a total of approximately 272 million shares of Coeur common stock, a total cash payment of approximately $1.1 million and the assumption of liabilities of $0.7 billion. Coeur issued 0.682 shares of Coeur common stock (or, at the election of the Bolnisi shareholder, CHESS Depositary Interests representing Coeur shares) and A$0.004 in cash (or approximately US$1.0 million in the aggregate) for each Bolnisi ordinary share, and 2.715 shares of Coeur common stock and C$0.004 in cash (or approximately US$0.1 million in the aggregate) for each Palmarejo common share. The total consideration paid amounted to $1.1 billion and the total liabilities assumed were $0.7 billion. Palmarejo is engaged in the exploration and development of silver and gold properties located in the State of Chihuahua in northern Mexico, and its principal silver and gold properties are collectively referred to as the “Palmarejo project.” The capital cost of the project, from the time the Company acquired it on December 21, 2007 to the commencement of commercial production, is currently estimated to be approximately $225 million. Based upon the original prefeasibility report, it is expected that the project will commence commercial production in the first half of 2009 and is expected to produce approximately 10 million ounces of silver and 110,000 ounces of gold annually at an average cash cost per silver ounce of ($1.40), including gold by-product credits. The Company is currently completing the final updated feasibility study, which is expected to be completed in the second quarter of 2008. No assurances can be made that the project will achieve its schedule and cost estimates discussed above. Capitalized Expenditures During 2006,2007, the Company expended $1.2$1.6 million at the Rochester mine, $10.0$11.3 million for continuing mine development at the Cerro Bayo and Mina Martha properties, $0.6mine, $16.4 million at the GalenaMartha mine, $0.6$2.1 million at the Endeavor mine, $0.2 million at the Broken Hill mine, $1.9 million for corporate and other activities, $14.6$100.2 million for the development of the San BartolomeBartolomé project and $121.5$92.3 million for construction and development activities at the Kensington project. During 2007,2008, the Company plans to expend approximately $0.3$0.7 million for investment activities at the Rochester mine, $11.1$9.5 million at Cerro Bayo, $2.9$2.7 million at Martha, $77.7$24.0 million at the Kensington development property, $119.4$100.7 million at the San BartolomeBartolomé development property, $24.0 million at the Palmarejo development property and $1.0$4.4 million for corporate and other activities. In addition, the Company expects to spendexpend approximately $22.7$26.3 million in 2007,2008 related to the remaining paymentobligation for the purchase of the Endeavor silver reserves.69
Debt and Capital Resources11 A summary of financing transactions for the years 2004 to 2006 is as follows:
/2004 Redemption4% Convertible Senior Notes
On February 11, 2004, the Company announced the redemption of the remaining outstanding $9.6
The $180.0 million principal amount of the Company’s 7 ¼% Convertible Subordinated11/4% Debentures due October 15, 2005. On March 11, 2004, the Company redeemed the remaining2024 outstanding $9.6 million principal amount of the 7 ¼% Debentures.2004 Issuance of 1 ¼% Convertible Senior Notes
On January 13, 2004 the Company completed its offering of $180 million aggregate principal amount of 1¼% Convertible Senior Notes due 2024 (“1¼% Notes”). The 1¼% Notesat December 31, 2007 are convertible into shares of Coeur common stock at a conversion ratethe option of approximately 131.5789 shares of Coeur common stock per $1,000 principal amount of Notes, representingthe holder on January 15, 2011, 2014, and 2019, unless previously redeemed, at a conversion price of $7.60 per share. Interestshare, subject to adjustment in certain events.
The Company is required to make semi-annual interest payments on the debentures. The debentures are redeemable at the option of the Company before January 18, 2011, if the closing price of the Company’s common stock over a specified number of trading days has exceeded 150% of the conversion price, and anytime thereafter. Before January 18, 2011, the redemption price is equal to 100% of the principal amount of the notes plus an amount equal to 8.75% of the principal amount of the notes, less the amount of any interest actually paid on the notes on or prior to the redemption date. The debentures have no other funding requirements until their maturity on January 15, 2024. The fair value of the debentures is determined by market transactions on or near December 31, 2007 and 2006, respectively. The fair value of the debentures, as of December 31, 2007 and 2006, was payable in cash$156.6 million and $163.8 million, respectively.Bridging Debt Facility On October 22, 2007, Bolnisi entered into a $20 million credit facility with Macquarie Bank Limited (“MBL”) to fund further exploration and development of the Palmarejo silver/gold project, surrounding exploration areas and for working capital purposes. The credit facility was extended to June 30, 2008 and bears interest at a variable rate (LIBOR) plus a margin of 2.45%. As of December 31, 2007, the Company has $20 million outstanding under the credit facility bearing an interest rate of 1¼% per annum beginning July 15, 2004.7.35%. Events of default under the credit facility include customary provisions for similar types of facilities.Bank Loan On August 30, 2007 (as amended on October 9, 2007), Palmarejo Gold entered into a temporary credit facility of $2.0 million secured by the Company’s investments in Asset Backed Commercial Paper, to fund working capital requirements. The credit facility has been extended through May 31, 2008. As of December 31, 2007, an amount of $1.7 million has been drawn on the facility, which bears interest at prime less 1.50%. The Company intendsis required to usereduce the proceedsamount of the offering for general corporate purposes, which may includeoutstanding credit facility with any proceeds received from the development of its Kensington gold project and its San Bartolome silver project, or the acquisition of precious metals properties or businesses. Construction commenced at the San Bartolome and Kensington projects on October 1, 2004 and July 1, 2005, respectively. The 1¼% Notes are general unsecured obligations, senior in right of payment to Coeur’s other indebtedness. The offering was made through an underwriting led by Deutsche Bank Securities. Offeringsale of the 1¼% Notes was made only by means of a prospectus under Coeur’s existing shelf registration statement, including the accompanying prospectus supplement relating to the 1¼% Notes.Asset Backed Commercial Paper.
Issuances of Common Stock During 2004, the Company completed a public offering of 26.6 million shares of common stock at a public offering price of $4.50 per share, which included 1.6 million shares purchased by the underwriter at the offering price to cover over allotment. The Company realized total net proceeds for the offering of $113.1 million after payment of the underwriters’ discount. Offering costs incurred were $6.7 million.
During 2005, the Company completed a public offering of 9.9 million shares of common stock at a public offering price of $3.70 per share. The Company realized total net proceeds for the offering of $35.9 million after payment of the underwriters’ discount. Offering costs incurred were $0.6 million.
65
During the first quarter of 2006, the Company completed a public offering of 27.6 million shares of common stock at a public offering price of $5.60 per share. The Company realized net proceeds of $146.2 million after payment of the underwriters’ discount and other offering costs. Offering costs incurred were $8.3 million. During 2005, the Company completed a public offering of 9.9 million shares of common stock at a public offering price of $3.70 per share. The Company realized total net proceeds for the offering of $35.9 million after payment of the underwriters’ discount. Offering costs incurred were $0.6 million.70
Contractual Obligations The following table summarizes our contractual obligations at December 31, 20062007 and the effect such obligations are expected to have on our liquidity and cash flow in future periods.Payments Due by Period
Contractual Obligations
Total
Less Than 1
Year
1-3
Years
3-5
Years
More Than 5
Years
Convertible debt(1) $ 180,000 $ -- $ -- $ -- $ 180,000 Interest on convertible debt 38,250 2,250 4,500 4,500 27,000 Operating lease(2) 380 380 -- -- -- Capital lease(3) 916 916 -- -- -- Kensington Trust(4) 839 345 494 -- -- Hyak Mining Lease 9,699 231 462 3,462 5,544 Phlahipo Lease with Comibol 15,270 2,121 9,825 3,324 -- TDA Grant(5) 546 546 -- -- -- Reclamation and mine closure(6) 51,778 4,962 4,498 6,437 35,881 Severance(7) 5,168 2,170 -- 1,183 1,815
Total $ 302,846 $ 13,921 $ 19,779 $ 18,906 $ 250,240
Payments Due by Period Less Than 3-5 More Than Contractual Obligations Total 1 Year 1- 3 Years Years 5 Years Convertible debt(1) $ 180,000 $ — $ — $ — $ 180,000 Interest on convertible debt 36,000 2,250 4,500 4,500 24,750 Capital lease(2) 39,196 11,554 15,731 11,911 — Kensington Trust(3) 459 385 74 — — Hyak Mining Lease 9,468 231 462 3,462 5,313 Plahipo mining lease with COMIBOL 28,680 4,972 23,708 — — Reclamation and mine closure(4) 57,387 4,183 9,518 11,157 32,529 Severance(5) 4,081 407 90 811 2,773 Macquarie Bank line of credit(6) 20,029 20,029 — — — National Bank of Canada line of credit(6) 1,728 1,728 — — — Endeavor payment 26,301 26,301 — — — Total $ 403,329 $ 72,040 $ 54,083 $ 31,841 $ 245,365
(1) The $180.0 million principal amount of 1 ¼%1/4% Debentures due 2024 outstanding at December 31, 20062007 are convertible into shares of common stock at the option of the holder on January 15, 2011, 2014 and 2019 unless previously redeemed at a conversion rate of approximately 131.5789 shares of Coeur common stock per $1,000 principal amount of Notes, representing a conversion price of $7.60 per share, subject to adjustment in certain events.
The Company is required to make semi-annual interest payments. The Debentures are redeemable at the option of the Company before January 18, 2011, if the closing price of the Company’s common stock over a specified number of trading days has exceeded 150% of the conversion price, and anytime thereafter. The Debentures have no other funding requirements until maturity on January 15, 2024.
(2) The Company has entered into various operating lease agreements which expire over a period of one year.
(3)The Company has entered into various capital lease agreements for commitments principally over the next year.
(4)(3)PurchasePurchased obligation for the Kensington property in Alaska.
(5)(4)The Company obtained a U.S. government grant to promote development in Bolivia. The amount received is expected to be reimbursed in 2007.
(6)Reclamation and mine closure amounts represent the Company’s estimate of the discounted cash flows ofassociated with its legal obligation to reclaim and remediate mining properties. This amount will increase over the passage of time for accretion of the obligation and will decrease as reclamation and remediation work is completed. Amounts shown on table are undiscounted.
(7)(5)Severance amounts represent a termination benefit program at the Rochester mine as the mine approaches the end of mine life and accrued benefits for government mandated severance at the Cerro Bayo Minemine and San BartolomeBartolomé project. (6) In connection with the Bolnisi and Palmarejo acquisition, the Company assumed a credit facility with Macquarie Bank of Australia and a line of credit loan with the National Bank of Canada.
Risk Factors; Forward-Looking Statements For information relating to important risks and uncertainties that could materially adversely affect the Company’s business, securities, financial condition or operating results, reference is made to the disclosure set forth under Item 1A above. In addition, because the preceding discussion includes numerous forward-looking statements relating to the Company, its results of operations and financial condition and business, reference is made to the information set forth above in Item 1 under the caption “Important Factors Relating to Forward-Looking Statements.”71
66
Environmental Compliance Expenditures For the years ended December 31, 2007, 2006, 2005, and 2004,2005, the Company expended $5.2 million, $5.6 million $4.9 million and $4.2$4.9 million, respectively, in connection with routine environmental compliance activities at its operating properties. Such activities include monitoring, earth moving, water treatment and re-vegetation activities. The Company estimates that environmental compliance expenditures during 20072008 will be approximately $4.0$5.0 million to obtain permit modifications and other regulatory authorizations. Future environmental expenditures will be determined by governmental regulations and the overall scope of the Company’s operating and development activities. The Company places a very high priority on its compliance with environmental regulations.Off-Balance Sheet Arrangements The Company has no off-balance sheet arrangements.67
Recent
Accounting Developments Recently Adopted Pronouncements with Delayed Effective Dates Income Taxes In June 2006, the FASB issued Interpretation No. 48, “Accounting for Uncertainty in Income Taxes”, (FIN 48)Taxes, an Interpretation of FASB Statement No. 109, “Accounting for Income Taxes”109” (FIN 48). FIN 48 prescribes a recognition threshold and measurement attribute for the financial statement recognition and measurement of a tax positions taken or expected to be taken in a tax return. FIN 48 requires that the Company recognize in its financial statements the impact of a tax position, if that tax position is more likely than not of being sustained on audit, based on the technical merits of the position. FIN 48 also provides guidance on derecognition, classification of interest and penalties, accounting in interim periods and disclosure. The provisions of FIN 48 arewere effective beginning January 1, 2007, with the cumulative effect of the change in accounting principle recorded as an adjustment to the opening balance of retained earnings. Currently, the2007. The adoption of FIN 48 isdid not expected to have a material effect on the Company’s financial position, results of operations ofor cash flows. The Company and its subsidiaries are subject to U.S. federal income tax as well as income tax of multiple state and foreign jurisdictions. The Company has substantially concluded all U.S. federal income tax matters for years through 1999. Federal income tax returns for 2000 through 2006 are subject to examination. The Company’s continuing practice is to recognize interest and/or penalties related to income tax matters in income tax expense. There were no significant accrued interest or penalties at December 31, 2007. Recently Issued PronouncementsFair Value Option In February 2007, the FASB issued FASB Statement No. 159, “The Fair Value Option for Financial Assets and Financial Liabilities” (“FAS 159”). FAS 159 permits entities to choose to measure many financial instruments and certain other items at fair value, with the objective of improving financial reporting by mitigating volatility in reported earnings caused by measuring related assets and liabilities differently without having to apply complex hedge accounting provisions. The provisions of FAS 159 are effective for the Company’s fiscal year ending December 31, 2008. The Company is currently evaluating the impact that the adoption of this statement will have on the Company’s consolidated financial position, results of operations and disclosures.72
Fair Value Measurements In September 2006, the FASB issued FASB Statement No. 157 “Fair Value Measurements” (FAS 157). FAS 157 defines fair value, establishes a framework for measuring fair value in generally accepted accounting principles, and expands disclosures about fair value measurements. The provisions of FAS 157 are effective for the Company’s fiscal year ending December 31, 2008. The Company is currently evaluating the impact of the adoption of this statement on the Company’s consolidated financial position, results of operations and disclosures.68
Recent DevelopmentsAccounting for Convertible Debt Instruments On September 5, 2007, the FASB published FASB Staff Position (“FSP”) No. APB 14-a, “Accounting for Convertible Debt Instruments That May Be Settled in Cash upon Conversion.” The proposed FSP applies to convertible debt instruments that, by their stated terms, may be settled in cash (or other assets) upon conversion, including partial cash settlement, unless the embedded conversion option is required to be separately accounted for as a derivative under SFAS 133. Convertible debt instruments within the scope of the proposed FSP are not addressed by the existing Accounting Principles Board (“APB”) Opinion No. 14. The proposed FSP would require that the liability and equity components of convertible debt instruments within the scope of the proposed FSP shall be separately accounted for in a manner that reflects the entity’s nonconvertible debt borrowing rate. This will require an allocation of the convertible debt proceeds between the liability component and the embedded conversion option (i.e., the equity component). The difference between the principal amount of the debt and the amount of the proceeds allocated to the liability component would be reported as a debt discount and subsequently amortized to earnings over the instrument’s expected life using the effective interest method. If the proposed FSP were to be adopted, the Company estimates that approximately $129.2 million of debt discount would be recorded and the effective interest rate on its 2024 11/4% notes would increase by approximately 9 percent for the non-cash amortization of the debt discount.Item 7A.Quantitative and Qualitative Disclosures About Market Risk The Company is exposed to various market risks as a part of its operations. In an effort to mitigate losses associated with these risks, the Company may, at times, enter into derivative financial instruments. These may take the form of forward sales contracts, foreign currency exchange contracts and interest rate swaps. The Company does not actively engage in the practice of trading derivative securitiesinstruments for profit. This discussion of the Company’s market risk assessments contains “forward looking statements” that contain risks and uncertainties. Actual results and actions could differ materially from those discussed below. The Company’s operating results are substantially dependent upon the world market prices of silver and gold. The Company has no control over silver and gold prices, which can fluctuate widely and are affected by numerous factors, such as supply and demand and investor sentiment. In order to mitigate some of the risk associated with these fluctuations, the Company will at times enter into forward sale contracts. The Company continually evaluates the potential benefits of engaging in these strategies based on current market conditions. The Company may be exposed to nonperformance by counterparties as a result of its hedging activities. This exposure would be limited to the amount that the spot price of the metal falls short of the contract price. The Company has historically sold silver and gold produced by our mines pursuant to forward contracts and at spot prices prevailing at the time of sale. Since 1999, the Company has not engaged in any silver hedging activities and is currently not engaged in any gold hedging activities. The Company enters into concentrate sales contracts with third-party smelters. The contracts, in general, provide for a provisional payment based upon provisional assays and quoted metal prices. The provisionally priced sales contracts contain an embedded derivative that is required to be separated from the host contract for accounting purposes. The host contract is the receivable from the sale of concentrates at the forward price at the time of sale. The embedded derivative, which is the final settlement price based on a future price, does not qualify for hedge accounting. These embedded derivatives are recorded as derivative assets (in Prepaid expenses and other), or derivative liabilities (in Accrued liabilities and other), on the balance sheet and are adjusted to fair value through earnings each period until the date of final settlement.73
At December 31, 2006,2007, the Company had outstanding receivables for provisionally priced sales of $74.5$61.2 million consisting of 4.63.3 million ounces of silver and 29,57720,775 ounces of gold, which had a fair value of approximately $75.6$63.8 million including the embedded derivative. For each one cent per ounce change in realized silver price, revenue would vary (plus or minus) approximately $45,700$33,300 and for each one dollar per ounce change in realized gold price, revenue would vary (plus or minus) approximately $29,600.$20,800.
The Company operates, or has mining interests, in several foreign countries, specifically Australia, Bolivia, Chile, and Argentina, which exposes it to risks associated with fluctuations in the exchange rates of the currencies involved. As part of its program to manage foreign currency risk, the Company enters into, from time to time, foreign currency forward exchange contracts. These contracts enable the Company to purchase a fixed amount of foreign currencies. Gains and losses on foreign exchange contracts that are related to firm commitments are designated and effective as hedges and are deferred and recognized in the same period as the related transaction. All other contracts that do not qualify as hedges are marked to market and the resulting gains or losses are recorded in income. The Company continually evaluates the potential benefits of entering into these contracts to mitigate foreign currency risk and proceeds when it believes that the exchange rates are most beneficial. During 2007 and 2006, the Company entered into forward foreign currency exchange contracts to reduce the foreign exchange risk associated with forecasted Chilean peso operating costs for 2007 and 2008 at its Cerro Bayo mine. The contracts entered into in 2007 require the Company to exchange U.S. dollars for Chilean pesos at a weighted average exchange rate of 531503 pesos to each U.S. dollar. At December 31, 2007 and 2006, the Company had foreign exchange contracts to exchangeof $9.0 million and $4.8 million in U.S. dollars, for Chilean pesos. Atrespectively. For the years ended December 31, 2007 and 2006, the Company recorded a realized gain (loss) of approximately $0.4 million and $(0.4) million, respectively, in connection with its foreign currency hedging program. As of December 31, 2007, the fair value of the foreign exchange contracts was a liability of $0.1 million.69
All of the Company’s long-term debt at December 31, 2006,2007, is fixed-rate based. The fair value of the Company’s long-term debt at December 31, 20062007 was $163.8$156.6 million. The fair value was estimated based upon bond market closing prices near the balance sheet date.Item 8.Financial Statements and Supplementary Data The financial statements required hereunder and contained herein are listed under Item 15(a)(1) below.Item 9.Changes in and Disagreements with Accountants on Accounting and Financial Disclosure Not applicable.Item 9A.Controls and Procedures(a) Disclosure Controls and Procedures The Company’s disclosure controls and procedures are designed to provide reasonable assurance that information required to be disclosed by it in its periodic reports filed with the Securities and Exchange Commission is recorded, processed, summarized and reported, within the time periods specified in the Commission’s rules and forms. Based on an evaluation of the Company’s disclosure controls and procedures conducted by the Company’s Chief Executive Officer and Chief Financial Officer, such officers concluded that the Company’s disclosure controls and procedures were effective at a reasonable assurance level as of December 31, 2006.2007.74
(b) Management’s Report on Internal Control Over Financial Reporting The management of the Company is responsible for establishing and maintaining adequate internal control over financial reporting. The Securities and Exchange Act of 1934 defines internal control over financial reporting in Rule 13a-15(f) and 15d-15(f) as a process designed by, or under the supervision of, the company’s principal executive and principal financial officers and effected by the company’s board of directors, management and other personnel, to provide reasonable assurance regarding the reliability of financial reporting and the preparation of financial statements for external purposes in accordance with generally accepted accounting principles and includes those policies and procedures that:• Pertain to the maintenance of records that in reasonable detail accurately and fairly reflect the transactions and dispositions of the assets of the company; • Provide reasonable assurance that transactions are recorded as necessary to permit preparation of financial statements in accordance with generally accepted accounting principles, and that receipts and expenditures of the company are being made only in accordance with authorizations of management and directors of the company; and • Provide reasonable assurance regarding prevention or timely detection of unauthorized acquisition, use or disposition of the company’s assets that could have a material effect on the consolidated financial statements.
Provide reasonable assurance that transactions are recorded as necessary to permit preparation of financial statements in accordance with generally accepted accounting principles, and that receipts and expenditures of the company are being made only in accordance with authorizations of management and directors of the company; and
Provide reasonable assurance regarding prevention or timely detection of unauthorized acquisition, use or disposition of the company’s assets that could have a material effect on the consolidated financial statements.
Because of its inherent limitations, internal control over financial reporting may not prevent or detect misstatements. Also, projections of any evaluation of effectiveness to future periods are subject to risk that controls may become inadequate because of changes in conditions, or that the degree of compliance with the policies or procedures may deteriorate.
70
The Company’s management assessed the effectiveness of the Company’s internal control over financial reporting as of December 31, 2006.2007. In making this assessment, the Company’s management used the criteria set forth by the Committee of Sponsoring Organizations of the Treadway Commission (COSO) inInternal Control-Integrated Framework. Based upon its assessment, management concluded that, as of December 31, 2006,2007, the Company’s internal control over financial reporting is effective based upon those criteria. Management’s
In accordance with SEC regulations, management’s above assessment of the effectiveness of internal control over financial reporting excludes Bolnisi Gold NL and Palmarejo Silver and Gold Corporation, which the Company acquired on December 21, 2007. The total assets of Bolnisi and Palmarejo at December 31, 2007, were approximately $1.8 billion of the Company’s total consolidated assets. The acquired businesses will be included in management’s assessment for the year ending December 31, 2008. The Company’s auditors, KPMG LLP (“KPMG”), have audited the Company’s internal control over financial reporting as of December 31, 2007, in accordance with the standards of the Public Company Accounting Oversight Board (United States), based on criteria established inInternal Control — Integrated Framework issued by the Committee of Sponsoring Organizations of the Treadway Commission (COSO). KPMG’s attestation report dated February 29, 2008 expressed an unqualified opinion on the effectiveness of the Company’s internal control over financial reporting as of December 31, 2006 has been audited by KPMG LLP, an independent registered public accounting firm, as stated2007. KPMG’s attestation report on the Company’s internal control over financial reporting is included in their report which appearsthe Company’s consolidated financial statements set forth elsewhere herein.75
(c) Changes in Internal Control Over Financial Reporting There have been no changes in our internal control over financial reporting during the most recently completed fiscal quarter that have materially affected, or are reasonably likely to materially affect, our internal control over financial reporting.Item 9B.Other Information Not applicable.Part IIIItem 10.Directors, Executive Officers and Corporate Governance Pursuant to General Instruction G(3) of Form 10-K, the information called for by this item regarding directors is hereby incorporated by reference from our definitive proxy statement or amendment hereto to be filed pursuant to Regulation 14A not later than 120 days after the end of the fiscal year covered by this report. Information regarding our executive officers is set forth under Item 4A of this Form 10-K.Item 11.Executive Compensation Pursuant to General Instruction G(3) of Form 10-K, the information called for by this item is hereby incorporated by reference from our definitive proxy statement or amendment hereto to be filed pursuant to Regulation 14A not later than 120 days after the end of the fiscal year covered by this report.Item 12.Security Ownership of Certain Beneficial Owners and Management and Related Stockholder Matters Pursuant to General Instruction G(3) of Form 10-K, the information called for by this item is hereby incorporated by reference from our definitive proxy statement or amendment hereto to be filed pursuant to Regulation 14A not later than 120 days after the end of the fiscal year covered by this report.Item 13.Certain Relationships and Related Transactions, and Director Independence Pursuant to General Instruction G(3) of Form 10-K, the information called for by this item is hereby incorporated by reference from our definitive proxy statement or amendment hereto to be filed pursuant to Regulation 14A not later than 120 days after the end of the fiscal year covered by this report.71
Item 14.Principal Accounting Fees and Services Pursuant to General Instruction G(3) of Form 10-K, the information called for by this item is hereby incorporated by reference from our definitive proxy statement or amendment hereto to be filed pursuant to Regulation 14A not later than 120 days after the end of the fiscal year covered by this report.76
Part IVItem 15.Exhibits and Financial Statement Schedules(a) The following financial statements are filed herewith:
(1) The following consolidated financial statements of Coeur d’Alene Mines Corporation and subsidiaries are included in Item 8:
Consolidated Balance Sheets -– December 31, 20062007 and 2005.2006.
Consolidated Statements of Operations and Comprehensive Income (Loss) -– Years Ended December 31, 2007, 2006 2005 and 20042005.
Consolidated Statements of Changes in Shareholders’ Equity for the Years Ended December 31, 2007, 2006 2005 and 2004.2005.
Consolidated Statements of Cash Flows for the Years Ended December 31, 2007, 2006 2005 and 2004.2005.
Notes to Consolidated Financial Statements.
(b) Exhibits: The following listed documents are filed as Exhibits to this report:
3(a)–2 (a) Merger Implementation Agreement dated May 3, 2007 by and among Coeur d’Alene Mines Corporation, Coeur d’Alene Mines Australia Pty Ltd, Coeur Sub Two, Inc. and Bolnisi Gold NL (Incorporated herein by reference to Exhibit 2.2 to the Registrant’s Form 8-K filed May 4, 2007.) 2 (b) Amending Agreement dated June 8, 2007 Relating to Merger Implementation Agreement dated May 3, 2007 by and among Coeur d’Alene Mines Corporation, Coeur d’Alene Mines Australia Pty Ltd, Coeur Sub Two, Inc. and Bolnisi Gold NL (Incorporated herein by reference to Exhibit 2.1 to the Registrant’s Current Report on Form 8-K filed June 8, 2007.) 2 (c) - Second Amending Agreement dated June 22, 2007 Relating to Merger Implementation Agreement dated May 3, 2007 by and among Coeur d’Alene Mines Corporation, Coeur d’Alene Mines Australia Pty Ltd, Coeur Sub Two, Inc. and Bolnisi Gold NL, as amended on June 8, 2007 (Incorporated herein by reference to Exhibit 2.1 to the Registrant’s Current Report on Form 8-K filed June 22, 2007.) 2 (d) - Deed Poll made by the Registrant in favor of Bolnisi shareholders dated May 3, 2007 (Incorporated herein by reference to Exhibit 2.3 to the Registrant’s Current Report on Form 8-K filed May 4, 2007.) 2 (e) - Conditional Extension dated September 24, 2007 to Merger Implementation Agreement dated May 3, 2007 by and among Coeur d’Alene Mines Corporation, Coeur d’Alene Mines Australia Pty Ltd, Coeur Sub Two, Inc. and Bolnisi Gold NL (Incorporated herein by reference to Exhibit 2.1 to the Registrant’s Current Report on Form 8-K filed September 25, 2007.)
77
2 (f) - Third Amending Agreement dated October 23, 2007 to Merger Implementation Agreement dated May 3, 2007 by and among Coeur d’Alene Mines Corporation, Coeur d’Alene Mines Australia Pty Ltd, Coeur Sub Two, Inc. and Bolnisi Gold NL (Incorporated herein by reference to Exhibit 2.1 to the Registrant’s Current Report on Form 8-K filed October 29, 2007.) 2 (g) - Fourth Amending Agreement dated December 5, 2007 to Merger Implementation Agreement dated May 3, 2007 by and among Coeur d’Alene Mines Corporation, Coeur d’Alene Mines Australia Pty Ltd, Coeur Sub Two, Inc. and Bolnisi Gold NL (Incorporated herein by reference to Exhibit 2.1 to the Registrant’s Current Report on Form 8-K filed December 10, 2007.) 2 (h) - Merger Implementation Agreement dated May 3, 2007 by and among Coeur d’Alene Mines Corporation and Palmarejo Silver and Gold Corporation (Incorporated herein by reference to Exhibit 2.1 to the Registrant’s Current Report on Form 8-K filed May 4, 2007.) 2 (i) - Extension dated September 24, 2007 to Merger Implementation Agreement dated May 3, 2007 by and between Coeur d’Alene Mines Corporation and Palmarejo Silver and Gold Corporation. (Incorporated herein by reference to Exhibit 2.2 to the Registrant’s Current Report on Form 8-K filed September 25, 2007.) 2 (j) - Amendment dated October 23, 2007 to Merger Implementation Agreement dated May 3, 2007 by and between Coeur d’Alene Mines Corporation and Palmarejo Silver and Gold Corporation (Incorporated herein by reference to Exhibit 2.2 to the Registrant’s Current Report on Form 8-K filed October 29, 2007.) 2 (k) - Second Amendment dated December 4, 2007 to Merger Implementation Agreement dated May 3, 2007 by and between Coeur d’Alene Mines Corporation and Palmarejo Silver and Gold Corporation (Incorporated herein by reference to Exhibit 2.2 to the Registrant’s Current Report on Form 8-K filed December 10, 2007.) 3 (a) - Articles of Incorporation of the Registrant and amendments thereto. (Incorporated herein by reference to Exhibit 3(a) to the Registrant’s Annual Report on Form 10-K for the year ended December 31, 1988.)
3(b)–3 (b) - Bylaws of the Registrant and amendments thereto. (Incorporated herein by reference to Exhibit 3.1 to the Registrant’s Current Report on Form 8-K dated August 30, 2004.)
3(c)–3 (c) - Certificate of Designations, Powers and Preferences of the Series B Junior Preferred Stock of the Registrant, as filed with Idaho Secretary of State on May 13, 1999. (Incorporated herein by reference to the Registrant’s Annual Report on Form 10-K for the year ended December 31, 2002.)
3(d)–3 (d) - Restated and Amended Articles of Incorporation of the Registrant as filed with the Secretary of State of the State of Idaho effective September 13, 1999. (Incorporated herein by reference to Exhibit 3 to the Registrant’s Quarterly Report on Form 10-Q for the quarter ended September 30, 1999.)
78
3(e)–3 (e) - Amendment to Restated and Amended Articles of Incorporation of the Registrant (Incorporated herein by reference to Exhibit 3.1 to the Registrant’s Quarterly Report on Form 10-Q for the quarter ended September 30, 2002.)
4(a)–3 (f) - Articles of Amendment, dated May 20, 2004, to the Restated and Amended Articles of Incorporation of the Registrant (Incorporated herein by reference to Exhibit 3.5 to the Form S-4 Registration Statement of Coeur d’ Alene Mines Holding Company and Coeur d’ Alene Canadian Acquisition Corporation filed on July 13, 2004 (file No. 333-117325).) 3 (g) - Certificate of Amendment to the Certificate of Designations, Powers and Preferences of the Series B Junior Preferred Stock of the Registrant, dated December 7, 2007. (Filed herewith.) 3 (h) - Amended and Restated Certificate of Designations, Powers and Preferences of the Series B Junior Preferred Stock of the Registrant, dated December 7, 2007. (Filed herewith.) 3 (i) - Articles of Amendment to the Restated and Amended Articles of Incorporation of the Registrant, dated December 7, 2007. (Filed herewith.) 3 (j) - Restated and Amended Articles of Incorporation of the Registrant, dated December 7, 2007. (Filed herewith.) 3 (k) - Bylaws of the Registrant, as amended effective July 16, 2007. (Incorporated herein by reference to Exhibit 3 to the Registrant’s Quarterly Report on Form 10-Q for the quarter ended September 30, 2007.) 4 (a) - Specimen certificate of the Registrant’s stock. (Incorporated herein by reference to Exhibit 4 to the Registrant’s Registration Statement on Form S-2 (File No. 2-84174).)
72
4(b)–4 (b) - Indenture dated as of January 13, 2004, by and between the Registrant and the Bank of New York relating to the Registrant’s 1 ¼%1/4% Convertible Senior Notes due 2024 (Incorporated herein by reference to Exhibit 4.1 to Registrant’s Current Report on Form 8-K dated January 7, 2004).2004.)
10(a)–10 (a) - Agreement, dated January 1, 1994, between Coeur-Rochester, Inc. and Johnson Matthey Inc. (Incorporated herein by reference to Exhibit 10(m) of the Registrant’s Annual Report on Form 10-K for the year ended December 31, 1993.)
10(b)–10 (b) - Master Equipment Lease No. 099-03566-01, dated as of December 28, 1988, between Idaho First National Bank and the Registrant. (Incorporated herein by reference to Exhibit 10(w) of the Registrant’s Annual Report on Form 10-K for the year ended December 31, 1988.)
10(c)–10 (c) - Master Equipment Lease No. 01893, dated as of December 28, 1988, between Cargill Leasing Corporation and the Registrant. (Incorporated herein by reference to Exhibit 10(x) of the Registrant’s Annual Report on Form 10-K for the year ended December 31, 1988.)
* Management contract or compensatory plan.
79
10(d)–10 (d) - Rights Agreement, dated as of May 11, 1999, between the Registrant and ChaseMellon Shareholder Services, L.L.C., as Rights Agent. (Incorporated herein by reference to Exhibit 1 to the Registrant’s Form 8-A relating to the registration of the Rights on the New York and Pacific Stock Exchanges.)
10(e)–10 (e) - Amended and Restated Profit Sharing Retirement Plan of the Registrant. (Incorporated herein by reference to Exhibit 10(ff) to the Registrant’s Annual Report on Form 10-K for the year ended December 31, 1993.) *
10(f)–10 (f) - 1993 Annual Incentive Plan and Long-Term Performance Share Plan of the Registrant. (Incorporated herein by reference to Exhibit 10(jj) to the Registrant’s Annual Report on Form 10-K for the year ended December 31, 1993.)*
10(g)–10 (g) - Lease Agreement, dated January 12, 1994, between First Security Bank of Idaho and Coeur Rochester, Inc. (Incorporated herein by reference to Exhibit 10(mm) to the Registrant’s Annual Report on Form 10-K for the year ended December 31, 1993.)
10(h)–401k10 (h) - 401(k) Plan of the Registrant. (Incorporated by reference to Exhibit 10 (pp) to the Registrants Annual Report on Form 10-K for the year ended December 31, 1994.)*
10(i)–10 (i) - Form of severance/change in control agreements entered into by the Registrant with each of its executive officers (James A. Sabala – January 13, 2003). (Incorporated by reference to Exhibit 10(hh) to the Registrant’s Annual Report on Form 10-K for the year ended December 31, 2001).*
10(j)–10 (j) - Employment Agreement, dated as of January 13, 2003, between the Registrant and James A. Sabala. (Incorporated by reference to Exhibit 10(jj) to Registrant’s Annual Report on Form 10-K for the period ended December 31, 2002).*
* Management contract or compensatory plan.
73
10(k)–10 (k) - 2003 Long-Term Incentive Plan of the Registrant. (Incorporated herein by reference to Appendix A to the Registrant’s definitive Proxy Statement on Schedule 14A filed with the SEC on April 21, 2003.) *
10(l)–10 (l) - Silver Sale and Purchase Agreement, dated April 7, 2005, between CDE Australia Pty. Limited and Cobar Operations Pty. Limited. (Portions of this exhibit have been omitted pursuant to a request for confidential treatment.) (Incorporated by reference to Exhibit 10.1 to the Registrant’s Quarterly Report on Form 10-Q for the quarter ended March 31, 2005.)
10(m)–10 (m) - 2005 Non-Employee Directors’ Equity Incentive Plan (Incorporated herein by reference to Appendix A to the Registrant’s proxy statement dated April 5, 2005).
* Management contract or compensatory plan.
80
10(n)–10 (n) - Amended and restated employment agreementRestated Employment Agreement and changeChange in control agreement,Control Agreement, effective July 1, 2005, between the Registrant and Donald J. Birak (Incorporated herein by reference to Exhibit 10.4 to the Registrant’s Quarterly Report on Form 10-Q for the quarter ended June 30, 2005).*
10(o)–10 (o) - Employment Agreement, dated as of September 17, 2002, between the Registrant and Dennis E. Wheeler (Incorporated herein by reference to Exhibit 10(z) to the Registrant’s Annual Report on Form 10-K for the year ended December 31, 2005).2005.)*
10(p)–10 (p) - Amended Mining Lease, effective as of August 5, 2005, between Hyak Mining Company, Inc. and Coeur Alaska, Inc. (Incorporated herein by reference to Exhibit 10.5 to the Registrant'sRegistrant’s Quarterly Report on Form 10-Q for the quarter ended June 30, 2005).
10(q)–10 (q) - Silver Sale Agreement, dated September 8, 2005, between the Registrant, Perilya Broken Hill Ltd and CDE Australia Pty. Ltd. (Portions of this exhibit have been omitted pursuant to a request for confidential treatment.) (Incorporated herein by reference to Exhibit 10.1 to the Registrant’s Quarterly Report on Form 10-Q for the quarter ended September 30, 2005).
10(r)–10 (r) - Employment agreementAgreement and changeChange in control agreement,Control Agreement, effective October 15, 2005, between the Registrant and James K. Duff. (Incorporated herein by reference to Exhibit 10.2 to the Registrant'sRegistrant’s Quarterly Report on Form 10-Q for the quarter ended September 30, 2005).*
10(s)–10 (s) - Form of Restricted Stock Agreement (Incorporated herein by reference to Exhibit 10.1 to the Registrant’s Current Report on Form 8-K dated February 15, 2005).*
10(t)–10 (t) - Form of Incentive Stock Option Agreement (Incorporated herein by reference to Exhibit 10.2 to the Registrant’s Current Report on Form 8-K dated February 15, 2005).*
10(u)–10 (u) - Form of Non-Qualified Stock Option Agreement (Incorporated herein by reference to Exhibit 10.3 to the Registrant’s Current Report on Form 8-K dated February 15, 2005).*
* Management contract or compensatory plan.
74
10(v)–10 (v) - First Amendment to Employment to Agreement, effective March 30, 2006, between the Registrant and Dennis E. Wheeler (Incorporated herein by reference to Exhibit 10(a) to the Registrant’s Quarterly Report on Form 10-Q for the quarter ended March 31, 2006).*
10(w)–10 (w) - Amended and Restated Silver Sale and Purchase Agreement, dated March 28, 2006, between CDE Australia Pty Limited and Cobar Operations Pty Limited (Portions of this exhibit have been omitted pursuant to a request for confidential treatment.) (Incorporated herein by reference to Exhibit 10(b) to the Registrant’s Quarterly Report on Form 10-Q for the quarter ended March 31, 2006).
* Management contract or compensatory plan.
81
10(x)–10 (x) - Employment Agreement, dated July 31, 2006, between the Registrant and Alan L. Wilder. (Incorporated herein by reference to Exhibit 10.1 to the Registrant’s Quarterly Report on Form 10-Q for the quarter ended June 30, 2006).2006.)*
10(y)–10 (y) - Amendment, dated July 31, 2006, to Employment Agreement between the Registrant and Donald J. Birak. (Incorporated herein by reference to Exhibit 10.2 to the Registrant’s Quarterly Report on Form 10-Q for the quarter ended June 30, 2006).2006.)*
10(z)–10 (z) - Amendment, dated July 31, 2006, to Employment Agreement between the Registrant and James K. Duff. (Incorporated herein by reference to Exhibit 10(z) to the Registrant’s Annual Report on Form 10-K for the year ended December 31, 2006.)* 10(aa) - Second Amendment to Employment Agreement, dated July 31, 2007, to employment agreement dated July 1, 2005, as amended on July 31, 2006, between the Registrant and Donald J. Birak (Incorporated herein by reference to Exhibit 10.1 to the Registrant’s Quarterly Report on Form 10-Q for the quarter ended June 30, 2007.)* 10(bb) - Second Amendment to Employment Agreement, dated May 2, 2007, between the Registrant and Dennis E. Wheeler (Incorporated herein by reference to Exhibit 10.1 to the Registrant’s Current Report on Form 8-K filed on May 7, 2007.)* 10(cc) - Supplemental Agreement in respect of the Amended and Restated Silver Sale and Purchase Agreement, dated January 29, 2008, between CDE Australia Pty Limited and Cobar Operations Pty Limited. (Filed herewith)herewith.) 10(dd) - Amended and Restated Employment Agreement and Change in Control Agreement, effective July 1, 2005, between the Registrant and Mitchell J. Krebs (Incorporated herein by reference to Exhibit 10.3 to the Registrant’s Quarterly Report on Form 10-Q for the quarter ended June 30, 2005).* 10(ee) - First Amendment to Employment Agreement, effective July 31, 2006, between the Registrant and Mitchell J. Krebs. (Filed herewith.)* 10(ff) - Second Amendment to Employment Agreement, effective July 31, 2007, between the Registrant and Mitchell J. Krebs. (Filed herewith.)* 10(gg) - Amended and Restated Employment Agreement and Change in Control Agreement, effective July 1, 2005, between the Registrant and Harry F. Cougher (Incorporated herein by reference to Exhibit 10.2 to the Registrant’s Quarterly Report on Form 10-Q for the quarter ended June 30, 2005).* 10(hh) - First Amendment to Employment Agreement, effective July 31, 2006, between the Registrant and Harry F. Cougher. (Filed herewith.)* 10(ii) - Employment Agreement, dated as of February 13, 2006, between CDE Australia Pty Ltd and Richard M. Weston. (Filed herewith.)*
* Management contract or compensatory plan.
82
10(jj) - First Amendment to Employment Agreement, effective as of July 31, 2006, between the Registrant and Richard M. Weston. (Filed herewith.)* 10(kk) - Second Amendment to Employment Agreement, effective as of July 31, 2007, between the Registrant and Richard M. Weston. (Filed herewith.)* 10(ll) - First Amendment to Employment Agreement, dated February 6, 2008, between the Registrant and Alan L. Wilder. (Filed herewith.)* 21 –- List of subsidiaries of the Registrant. (Filed herewith.)
23 –- Consent of KPMG LLP (Filed herewith.)
31.1 –- Certification of the CEO (Filed herewith.)
31.2 –- Certification of the CFO (Filed herewith.)
32.1 –- CEO Section 1350 Certification (Filed herewith.)
32.2 –- CFO Section 1350 Certification (Filed herewith.) 99 (a) - Option Deed dated May 3, 2007 by and between Coeur d’Alene Mines Corporation and Kenneth M. Phillips (Incorporated herein by reference to Exhibit 99.1(a) to the Registrant’s Current Report on Form 8-K filed May 4, 2007.) 99 (b) - Option Deed dated May 3, 2007 by and between Coeur d’Alene Mines Corporation and Altinova Nominees Pty Ltd (Incorporated herein by reference to Exhibit 99.1(b) to the Registrant’s Current Report on Form 8-K filed May 4, 2007.) 99 (c) - Option Deed dated May 3, 2007 by and between Coeur d’Alene Mines Corporation and Dragonlyn Pty Ltd (Incorporated herein by reference to Exhibit 99.1(c) to the Registrant’s Current Report on Form 8-K filed May 4, 2007.) 99 (d) - Option Deed dated May 3, 2007 by and between Coeur d’Alene Mines Corporation and Rosignol Consultants Pty Ltd (Incorporated herein by reference to Exhibit 99.1(d) to the Registrant’s Current Report on Form 8-K filed May 4, 2007.) 99 (e) - Option Deed dated May 3, 2007 by and between Coeur d’Alene Mines Corporation and Promin Mining Services Pty Limited (Incorporated herein by reference to Exhibit 99.1(e) to the Registrant’s Current Report on Form 8-K filed May 4, 2007.) 99 (f) - Option Deed dated May 3, 2007 by and between Coeur d’Alene Mines Corporation and Rosignol Pty Limited (Incorporated herein by reference to Exhibit 99.1(f) to the Registrant’s Current Report on Form 8-K filed May 4, 2007.) 99 (g) - Amendments dated September 24, 2007 to Option Deed dated May 3, 2007 by and between Coeur d’Alene Mines Corporation and Kenneth M. Phillips. (Incorporated herein by reference to Exhibit 99.1 to the Registrant’s Form 8-K filed September 25, 2007.)
* Management contract or compensatory plan.
83
99 (h) - Amendments dated September 24, 2007 to Option Deed dated May 3, 2007 by and between Coeur d’Alene Mines Corporation and Altinova Nominees Pty Ltd. (Incorporated herein by reference to Exhibit 99.2 to the Registrant’s Form 8-K filed September 25, 2007.) 99 (i) - Amendments dated September 24, 2007 to Option Deed dated May 3, 2007 by and between Coeur d’Alene Mines Corporation and Dragonlyn Pty Ltd. (Incorporated herein by reference to Exhibit 99.3 to the Registrant’s Form 8-K filed September 25, 2007.) 99 (j) - Amendments dated September 24, 2007 to Option Deed dated May 3, 2007 by and between Coeur d’Alene Mines Corporation and Rosignol Consultants Pty Ltd. (Incorporated herein by reference to Exhibit 99.4 to the Registrant’s Form 8-K filed September 25, 2007.) 99 (k) - Amendments dated September 24, 2007 to Option Deed dated May 3, 2007 by and between Coeur d’Alene Mines Corporation and Promin Mining Services Pty Ltd. (Incorporated herein by reference to Exhibit 99.5 to the Registrant’s Form 8-K filed September 25, 2007.) 99 (l) - Amendments dated September 24, 2007 to Option Deed dated May 3, 2007 by and between Coeur d’Alene Mines Corporation and Rosignol Consultants Pty Ltd. (Incorporated herein by reference to Exhibit 99.6 to the Registrant’s Form 8-K filed September 25, 2007.) 99 (m) - Amending Agreement dated October 23, 2007 relating to Option Deed dated May 3, 2007 by and between Coeur d’Alene Mines Corporation and Kenneth M. Phillips, as amended to date (Incorporated herein by reference to Exhibit 99.1 to the Registrant’s Current Report on Form 8-K filed October 29, 2007.) 99 (n) - Amending Agreement dated October 23, 2007 relating to Option Deed dated May 3, 2007 by and between Coeur d’Alene Mines Corporation and Altinova Nominees Pty Ltd, as amended to date (Incorporated herein by reference to Exhibit 99.2 to the Registrant’s Current Report on Form 8-K filed October 29, 2007.) 99 (o) - Amending Agreement dated October 23, 2007 relating to Option Deed dated May 3, 2007 by and between Coeur d’Alene Mines Corporation and Dragonlyn Pty Ltd, as amended to date (Incorporated herein by reference to Exhibit 99.3 to the Registrant’s Current Report on Form 8-K filed October 29, 2007.) 99 (p) - Amending Agreement dated October 23, 2007 relating to Option Deed dated May 3, 2007 by and between Coeur d’Alene Mines Corporation and Rosignol Consultants Pty Ltd, as amended to date (Incorporated herein by reference to Exhibit 99.4 to the Registrant’s Current Report on Form 8-K filed October 29, 2007.) 99 (q) - Amending Agreement dated October 23, 2007 relating to Option Deed dated May 3, 2007 by and between Coeur d’Alene Mines Corporation and Promin Mining Services Pty Limited, as amended to date (Incorporated herein by reference to Exhibit 99.5 to the Registrant’s Current Report on Form 8-K filed October 29, 2007.)
84
99 (r) - Amending Agreement dated October 23, 2007 relating to Option Deed dated May 3, 2007 by and between Coeur d’Alene Mines Corporation and Rosignol Pty Limited, as amended to date (Incorporated herein by reference to Exhibit 99.6 to the Registrant’s Current Report on Form 8-K filed October 29, 2007.)
(c) Independent auditors’ reports are included herein as follows:
Report of KPMG LLP as of December 31, 20062007 and for the years ended December 31, 2007, 2006 2005 and 2004.2005.
* Management or compensatory plan.
7585
SIGNATURES
SIGNATURES Pursuant to the requirements of Section 13 or 15(d) of the Securities Exchange Act of 1934, the registrant has duly caused this report to be signed on its behalf by the undersigned, thereunto duly authorized.Coeur d’Alene Mines Corporation
(Registrant)
(Registrant)
Date: February 22, 200729, 2008 By: /s/ Dennis E. Wheeler Dennis E. Wheeler (Chairman, (Chairman, President and Chief Executive Officer)
Pursuant to the requirements of the Securities Exchange Act of 1934, this report has been signed below by the following persons on behalf of the registrant and in the capacities and on the dates indicated./s/ Dennis E. Wheeler Chairman, President, Chief Executive Officer February 22, 200729, 2008 Dennis E. Wheeler and Director
/s/ James A. SabalaJames A. Sabala Executive Vice President February 22, 2007James A. Sabalaand Chief Financial Officer February 29, 2008
/s/ Tom T. AngelosTom T. Angelos Vice President, Controller February 22, 2007Tom T. Angelosand Chief Accounting Officer
/s/ Cecil D. AndrusDirectorFebruary 22, 200729, 2008 Cecil D. Andrus
/s/ James J. CurranDirectorFebruary 22, 2007James J. Curran Director February 29, 2008
/s/ Sebastian EdwardsSebastian Edwards Director February 29, 2008 /s/ Andrew D. Lundquist DirectorFebruary 22, 2007Andrew D. Lundquist Director February 29, 2008
/s/ Robert E. Mellor DirectorFebruary 22, 2007Robert E. Mellor Director February 29, 2008
/s/ John H. Robinson DirectorFebruary 22, 2007John H. Robinson Director February 29, 2008
/s/ J. Kenneth Thompson DirectorFebruary 22, 2007J. Kenneth Thompson Director February 29, 2008
/s/ Alex VitaleAlex Vitale Director February 22, 200729, 2008 Alex Vitale
/s/ Timothy R. WintererDirectorFebruary 22, 2007Timothy R. Winterer Director February 29, 2008
7686
ANNUAL REPORT ON FORM 10-KCONSOLIDATED FINANCIAL STATEMENTSYEAR ENDED DECEMBER 31, 20062007
COEUR D’ALENE MINES CORPORATIONCOEUR D’ALENE, IDAHOReports of Independent Registered Public Accounting Firm F-2 -– F-4
Consolidated Balance Sheets -– December 31, 20062007 and 20052006 F-5 -– F-6
Consolidated Statements of Operations and Comprehensive Income (Loss) for the Years Ended December 31, 2007, 2006 and
2005 and 2004 F-7
Consolidated Statements of Changes in Shareholders'Shareholders’ Equity for the Years Ended December 31, 2007, 2006 2005 and 20042005 F-8
Consolidated Statements of Cash Flows for the Years Ended December 31, 2007, 2006 2005 and 20042005 F-9
Notes to Consolidated Financial Statements F-10
F-1
Report of Independent Registered Public Accounting FirmThe Board of Directors and Shareholders
Coeur d’Alene Mines Corporation:We have audited the accompanying consolidated balance sheets of Coeur d’Alene Mines Corporation and subsidiaries as of December 31, 20062007 and 2005,2006, and the related consolidated statements of operations and comprehensive income, (loss),changes in shareholders’ equity, and cash flows for each of the years in the three-year period ended December 31, 2006.2007. These consolidated financial statements are the responsibility of the Company’s management. Our responsibility is to express an opinion on these consolidated financial statements based on our audits.We conducted our audits in accordance with the standards of the Public Company Accounting Oversight Board (United States). Those standards require that we plan and perform the audit to obtain reasonable assurance about whether the financial statements are free of material misstatement. An audit includes examining, on a test basis, evidence supporting the amounts and disclosures in the financial statements. An audit also includes assessing the accounting principles used and significant estimates made by management, as well as evaluating the overall financial statement presentation. We believe that our audits provide a reasonable basis for our opinion.In our opinion, the consolidated financial statements referred to above present fairly, in all material respects, the financial position of Coeur d’Alene Mines Corporation and subsidiaries as of December 31, 20062007 and 2005,2006, and the results of their operations and their cash flows for each of the years in the three-year period ended December 31, 2006,2007, in conformity with U.S. generally accepted accounting principles.As discussed in Note B to the Consolidated Financial Statements,consolidated financial statements, the Company has adopted Statement of Financial Accounting Standards No. 123 (revised 2004),Share-Based Payment, and Emerging Issues Task Force Issue No. 04-6,Accounting for Stripping Costs Incurred during Production in the Mining Industry, as of January 1, 2006.We also have audited, in accordance with the standards of the Public Company Accounting Oversight Board (United States), the effectiveness of Coeur d’Alene Mines Corporation’s internal control over financial reporting as of December 31, 2006,2007, based on criteria established inInternal Control-IntegratedControl — Integrated Framework issued by the Committee of Sponsoring Organizations of the Treadway Commission (COSO), and our report dated February 22, 200729, 2008 expressed an unqualified opinion on management’s assessmentthe effectiveness of and the effective operation of,Company’s internal control over financial reporting./s/
KPMG LLPBoise, Idaho
February 22, 2007
29, 2008F-2
Report of Independent Registered Public Accounting FirmThe Board of Directors and Shareholders
Coeur d’Alene Mines Corporation:We have audited management's assessment, included in the accompanying Management’s Report on Internal Control Over Financial Reporting, that Coeur d’Alene Mines Corporation maintained effectiveCorporation’s internal control over financial reporting as of December 31, 2006,2007, based on criteria established inInternal Control-IntegratedControl — Integrated Frameworkissued by the Committee of Sponsoring Organizations of the Treadway Commission (COSO).Coeur d’Alene Mines Corporation’s management is responsible for maintaining effective internal control over financial reporting and for its assessment of the effectiveness of internal control over financial reporting.reporting, included in the accompanying Management’s Report on Internal Control Over Financial Reporting. Our responsibility is to express an opinion on management’s assessment and an opinion on the effectiveness of the Company’s internal control over financial reporting based on our audit.We conducted our audit in accordance with the standards of the Public Company Accounting Oversight Board (United States). Those standards require that we plan and perform the audit to obtain reasonable assurance about whether effective internal control over financial reporting was maintained in all material respects. Our audit included obtaining an understanding of internal control over financial reporting, evaluating management’s assessment,assessing the risk that a material weakness exists, and testing and evaluating the design and operating effectiveness of internal control andbased on the assessed risk. Our audit also included performing such other procedures as we considered necessary in the circumstances. We believe that our audit provides a reasonable basis for our opinion.A company'scompany’s internal control over financial reporting is a process designed to provide reasonable assurance regarding the reliability of financial reporting and the preparation of financial statements for external purposes in accordance with generally accepted accounting principles. A company’s internal control over financial reporting includes those policies and procedures that (1) pertain to the maintenance of records that, in reasonable detail, accurately and fairly reflect the transactions and dispositions of the assets of the company; (2) provide reasonable assurance that transactions are recorded as necessary to permit preparation of financial statements in accordance with generally accepted accounting principles, and that receipts and expenditures of the company are being made only in accordance with authorizations of management and directors of the company; and (3) provide reasonable assurance regarding prevention or timely detection of unauthorized acquisition, use, or disposition of the company’s assets that could have a material effect on the financial statements.Because of its inherent limitations, internal control over financial reporting may not prevent or detect misstatements. Also, projections of any evaluation of effectiveness to future periods are subject to the risk that controls may become inadequate because of changes in conditions, or that the degree of compliance with the policies or procedures may deteriorate.In our opinion, management's assessment that Coeur d’Alene Mines Corporation maintained effective internal control over financial reporting as of December 31, 2006, is fairly stated, in all material respects, based on criteria established inInternal Control-Integrated Framework issued by the Committee of Sponsoring Organizations of the Treadway Commission (COSO). Also, in our opinion, Coeur d’Alene Mines Corporation maintained, in all material respects, effective internal control over financial reporting as of December 31, 2006,2007, based on criteria established inInternal Control-IntegratedControl — Integrated Frameworkissued by the Committee of Sponsoring Organizations of the Treadway Commission (COSO).Commission.The Company acquired Bolnisi Gold NL and Palmarejo Silver and Gold Corporation on December 21, 2007, and management excluded from its assessment of the effectiveness of the Company’s internal control over financial reporting as of December 31, 2007, Bolnisi Gold NL’s and Palmarejo Silver and Gold Corporation’s internal control over financial reporting associated with total assets of $1.8 billion and total revenues of nil, included in the consolidated financial statements of Coeur d’Alene Mines Corporation and subsidiaries as of and for the year ended December 31, 2007. Our audit of internal control over financial reporting of Coeur d’Alene Mines Corporation also excluded an evaluation of the internal control over financial reporting of Bolnisi Gold NL and Palmarejo Silver and Gold Corporation.F-3
We also have audited, in accordance with the standards of the Public Company Accounting Oversight Board (United States), the consolidated balance sheets of Coeur d’Alene Mines Corporation as of December 31, 20062007 and 2005,2006, and the related consolidated statements of operations and comprehensive income, (loss), shareholders’ equity, and cash flows for each of the years in the three-year period ended December 31, 2006,2007, and our report dated February 22, 200729, 2008 expressed an unqualified opinion on those consolidated financial statements./s/
KPMG LLPBoise, Idaho
February 22, 2007
29, 2008F-4
COEUR D’ALENE MINES CORPORATION AND SUBSIDIARIES
CONSOLIDATED BALANCE SHEETSDecember 31, 2006
2005
ASSETS (In Thousands)
CURRENT ASSETS Cash and cash equivalents $ 270,672 $ 54,896 Short-term investments 70,373 185,446 Receivables 43,233 27,986 Ore on leach pad 31,302 25,394 Metal and other inventory 16,341 12,807 Deferred tax assets 3,629 2,255 Prepaid expenses and other 6,047 4,707 Assets of discontinued operations held for sale -- 14,828
441,597 328,319
PROPERTY, PLANT AND EQUIPMENT Property, plant and equipment 132,315 105,107 Less accumulated depreciation (64,206 ) (57,929 )
68,109 47,178
MINING PROPERTIES Operational mining properties 130,447 121,441 Less accumulated depletion (116,361 ) (105,486 )
14,086 15,955
Mineral interests 72,201 72,201 Less accumulated depletion (7,828 ) (2,218 )
64,373 69,983
Non-producing and development properties 190,988 72,488
269,447 158,426
OTHER ASSETS Ore on leach pad, non-current portion 35,367 29,254 Restricted cash and cash equivalents 19,492 16,943 Debt issuance costs, net 5,151 5,454 Deferred tax assets 2,544 923 Other 7,919 8,319
70,473 60,893
TOTAL ASSETS $ 849,626 $ 594,816
December 31, 2007 2006 (In thousands) ASSETS CURRENT ASSETS Cash and cash equivalents $ 98,671 $ 270,672 Short-term investments 53,039 70,373 Receivables 56,121 43,233 Ore on leach pad 25,924 31,302 Metal and other inventory 18,918 16,341 Deferred tax assets 3,573 3,629 Prepaid expenses and other 7,821 6,047 264,067 441,597 PROPERTY, PLANT AND EQUIPMENT Property, plant and equipment 322,733 132,315 Less accumulated depreciation (69,937 ) (64,206 ) 252,796 68,109 MINING PROPERTIES Operational mining properties 143,324 130,447 Less accumulated depletion (124,401 ) (116,361 ) 18,923 14,086 Mineral interests 1,731,715 72,201 Less accumulated depletion (11,639 ) (7,828 ) 1,720,076 64,373 Non-producing and development properties 311,469 190,988 2,050,468 269,447 OTHER ASSETS Ore on leach pad, non-current portion 24,995 35,367 Restricted cash and cash equivalents 25,760 23,508 Debt issuance costs, net 4,848 5,151 Deferred tax assets 1,109 2,544 Other 27,651 3,903 84,363 70,473 TOTAL ASSETS $ 2,651,694 $ 849,626
The accompanying notes are an integral part of these consolidated financial statements.F-5
COEUR D’ALENE MINES CORPORATION AND SUBSIDIARIES
CONSOLIDATED BALANCE SHEETSDecember 31, 2006
2005
(In thousands except
share data) LIABILITIES AND SHAREHOLDERS’ EQUITY
CURRENT LIABILITIES Accounts payable $ 22,315 $ 17,189 Accrued liabilities and other 11,865 5,662 Accrued income taxes 10,317 66 Accrued payroll and related benefits 8,527 7,840 Accrued interest payable 1,031 1,031 Current portion of reclamation and mine closure 4,460 1,646 Liabilities of discontinued operations held for sale -- 12,908
58,515 46,342
LONG-TERM LIABILITIES 1 1/4% Convertible Senior Notes due January 2024 180,000 180,000 Reclamation and mine closure 27,226 23,048 Other long-term liabilities 2,891 3,873
210,117 206,921
COMMITMENTS AND CONTINGENCIES (See Notes I, J, L, M, N, O, P and R)
SHAREHOLDERS’ EQUITY Common Stock, par value $1.00 per share; authorized 500,000,000 shares, issued 279,054,344 and 250,961,353 shares in 2006 and 2005 (1,059,211 shares held in treasury) 279,054 250,961 Additional paid-in capital 777,798 656,977 Accumulated deficit (463,221 ) (551,357 ) Shares held in treasury (13,190 ) (13,190 ) Accumulated other comprehensive income (loss) 553 (1,838 )
580,994 341,553
TOTAL LIABILITIES AND SHAREHOLDERS’ EQUITY $ 849,626 $ 594,816
December 31, 2007 2006 (In thousands, except share data) LIABILITIES AND SHAREHOLDERS’ EQUITY CURRENT LIABILITIES Accounts payable $ 49,642 $ 22,315 Accrued liabilities and other 9,072 10,971 Accrued income taxes 7,547 10,317 Accrued payroll and related benefits 9,342 8,527 Accrued interest payable 1,060 1,031 Current portion of long-term debt and capital lease obligations 30,831 894 Current portion of reclamation and mine closure 4,183 4,460 111,677 58,515 LONG-TERM LIABILITIES 1 1/4% Convertible Senior Notes due January 2024 180,000 180,000 Reclamation and mine closure 30,629 27,226 Deferred income taxes 573,681 272 Obligations under capital leases 23,661 — Other long-term liabilities 4,679 2,619 812,650 210,117 COMMITMENTS AND CONTINGENCIES (See Notes I, J, M, N, O, P, Q and S) SHAREHOLDERS’ EQUITY Common Stock, par value $1.00 per share; authorized 750,000,000 shares in 2007 and 500,000,000 in 2006, issued 551,512,230 and 279,054,344 shares in 2007 and 2006 (1,059,211 shares held in treasury) 551,512 279,054 Additional paid-in capital 1,607,737 777,798 Accumulated deficit (419,331 ) (463,221 ) Shares held in treasury (13,190 ) (13,190 ) Accumulated other comprehensive income 639 553 1,727,367 580,994 TOTAL LIABILITIES AND SHAREHOLDERS’ EQUITY $ 2,651,694 $ 849,626
The accompanying notes are an integral part of these consolidated financial statements.
F-6
COEUR D’ALENE MINES CORPORATION AND SUBSIDIARIES
CONSOLIDATED STATEMENTS OF OPERATIONS AND COMPREHENSIVE INCOME (LOSS)Years Ended December 31, 2006
2005
2004
(In Thousands, except per share data)
REVENUES Sales of metal $ 216,573 $ 156,284 $ 109,047
COSTS AND EXPENSES Production costs applicable to sales 92,378 88,232 63,715 Depreciation and depletion 26,772 18,889 16,833 Administrative and general 19,369 20,624 17,499 Exploration 9,474 10,553 8,031 Pre-development -- 6,057 11,449 Litigation settlement 2,365 1,600 --
Total cost and expenses 150,358 145,955 117,527
OTHER INCOME AND EXPENSE Interest and other income 18,654 8,385 3,165 Interest expense, net of capitalized interest (1,224 ) (2,485 ) (2,831 ) Merger expenses -- -- (15,675 )
Total other income and expense 17,430 5,900 (15,341 )
Income (loss) from continuing operations before income taxes 83,645 16,229 (23,821 ) Income tax (provision) benefit (8,226 ) (1,483 ) 5,785
Income (loss) from continuing operations 75,419 14,746 (18,036 ) Income (loss) from discontinued operations, net of income taxes 1,935 (4,195 ) 1,178 Gain on sale of net assets of discontinued operations, net of income taxes 11,132 -- --
NET INCOME (LOSS) 88,486 10,551 (16,858 ) Other comprehensive income (loss) 2,391 447 (908 )
COMPREHENSIVE INCOME (LOSS) $ 90,877 $ 10,998 $ (17,766 )
BASIC AND DILUTED INCOME (LOSS) PER SHARE Basic income (loss) per share: Income (loss) from continuing operations $ 0.28 $ 0.06 $ (0.08 ) Income (loss) from discontinued operations 0.05 (0.02 ) --
Net income (loss) $ 0.33 $ 0.04 $ (0.08 )
Diluted income (loss) per share: Income (loss) from continuing operations $ 0.26 $ 0.06 $ (0.08 ) Income (loss) from discontinued operations 0.04 (0.02 ) --
Net income (loss) $ 0.30 $ 0.04 $ (0.08 )
Weighted average number of shares of common stock Basic 271,357 242,915 215,969 Diluted 296,082 243,683 215,969
Years Ended December 31, 2007 2006 2005 (In thousands, except per share data) REVENUES Sales of metal $ 215,319 $ 216,573 $ 156,284 COSTS AND EXPENSES Production costs applicable to sales 117,025 92,378 88,232 Depreciation and depletion 20,984 26,772 18,889 Administrative and general 23,875 19,369 20,624 Exploration 11,941 9,474 10,553 Litigation settlements 507 2,365 1,600 Pre-development — — 6,057 Total cost and expenses 174,332 150,358 145,955 Operating income 40,987 66,215 10,329 OTHER INCOME AND EXPENSE Interest and other income 18,195 18,654 8,385 Interest expense, net of capitalized interest (365 ) (1,224 ) (2,485 ) Total other income and expense 17,830 17,430 5,900 Income from continuing operations before income taxes 58,817 83,645 16,229 Income tax provision (14,927 ) (8,226 ) (1,483 ) Income from continuing operations 43,890 75,419 14,746 Income (loss) from discontinued operations, net of income taxes — 1,935 (4,195 ) Gain on sale of net assets of discontinued operations, net of income taxes — 11,132 — NET INCOME 43,890 88,486 10,551 Other comprehensive income 86 2,391 447 COMPREHENSIVE INCOME $ 43,976 $ 90,877 $ 10,998 BASIC AND DILUTED INCOME (LOSS) PER SHARE Basic income per share: Income from continuing operations $ 0.15 $ 0.28 $ 0.06 Income (loss) from discontinued operations — 0.05 (0.02 ) Net income $ 0.15 $ 0.33 $ 0.04 Diluted income per share: Income from continuing operations $ 0.14 $ 0.26 $ 0.06 Income (loss) from discontinued operations — 0.04 (0.02 ) Net income $ 0.14 $ 0.30 $ 0.04 Weighted average number of shares of common stock Basic 285,972 271,357 242,915 Diluted 310,524 296,082 243,683
The accompanying notes are an integral part of these consolidated financial statements.F-7
COEUR D’ALENE MINES CORPORATION AND SUBSIDIARIES
CONSOLIDATED STATEMENTS OF CHANGES IN SHAREHOLDERS’ EQUITYFor Years Ended December 31, 2006, 2005 and 2004
(In thousands except share data) Common
Stock
Shares
Common
Stock
$1 Par
Additional
Paid-In
Capital
Accumulated
Deficit
Shares
Held in
Treasury
Accumulated
Other
Comprehensive
Income (Loss)
Total
Balances at January 1, 2004 214,195 $ 214,195 $ 542,900 $ (545,050 ) $ (13,190 ) $ (1,377 ) $ 197,478 Net loss -- -- -- (16,858 ) -- -- (16,858 ) Unrealized losses on short-term investments and marketable securities -- -- -- -- -- (347 ) (347 ) Change in fair value of derivative hedging instruments, net of settlements -- -- -- -- -- (130 ) (130 ) Excess additional pension liability over unrecognized prior service cost -- -- -- -- -- (431 ) (431 ) Issuance of common stock 26,625 26,625 86,475 -- -- -- 113,100 Common stock issued under long-term incentive plans 208 208 432 -- -- -- 640 Other -- -- 2 -- -- -- 2
Balances at December 31, 2004 241,028 $ 241,028 $ 629,809 $ (561,908 ) $ (13,190 ) $ (2,285 ) $ 293,454 Net income -- -- -- 10,551 -- -- 10,551 Unrealized gain on short-term investments and marketable securities -- -- -- -- -- 853 853 Change in fair value of derivative hedging instruments, net of settlements -- -- -- -- -- (171 ) (171 ) Excess additional pension liability over unrecognized prior service cost -- -- -- -- -- (237 ) (237 ) Issuance of common stock 9,863 9,863 26,351 -- -- -- 36,214 Common stock issued under long-term incentive plans 70 70 817 -- -- -- 887 Foreign currency translation -- -- -- -- -- 2 2
Balances at December 31, 2005 250,961 $ 250,961 $ 656,977 $ (551,357 ) $ (13,190 ) $ (1,838 ) $ 341,553 Net income -- -- -- 88,486 -- -- 88,486 Cumulative effect of accounting change -- -- -- (350 ) -- -- (350 ) Unrealized gain on short-term investments and marketable securities -- -- -- -- -- 63 63 Change in fair value of cash flow hedging instruments, net of settlements -- -- -- -- -- 111 111 Elimination of excess additional pension liability over unrecognized prior service cost attributable to discontinued operations -- -- -- -- -- 2,219 2,219 Issuance of common stock 27,600 27,600 118,631 -- -- -- 146,231 Common stock issued under long-term incentive plans 493 493 2,190 -- -- -- 2,683 Foreign currency translation -- -- -- -- -- (2 ) (2 )
Balances at December 31, 2006 279,054 $ 279,054 $ 777,798 $ (463,221 ) $ (13,190 ) $ 553 $ 580,994
Years Ended December 31, 2007, 2006 and 2005 (In thousands, except share data) Accumulated Common Common Additional Shares Other Stock Stock Paid-In Accumulated Held in Comprehensive Shares $1 Par Capital Deficit Treasury Income (Loss) Total Balances at January 1, 2005 241,028 $ 241,028 $ 629,809 $ (561,908 ) $ (13,190 ) $ (2,285 ) $ 293,454 Net income — — — 10,551 — — 10,551 Unrealized gain on short-term investments and marketable securities — — — — — 853 853 Change in fair value of derivative hedging instruments, net of settlements — — — — — (171 ) (171 ) Excess additional pension liability over unrecognized prior service cost — — — — — (237 ) (237 ) Issuance of common stock 9,863 9,863 26,351 — — — 36,214 Common stock issued under long-term incentive plans, net 70 70 817 — — — 887 Foreign currency translation — — — — — 2 2 Balances at December 31, 2005 250,961 $ 250,961 $ 656,977 $ (551,357 ) $ (13,190 ) $ (1,838 ) $ 341,553 Net income — — — 88,486 — — 88,486 Cumulative effect of accounting change — — — (350 ) — — (350 ) Unrealized gain on short-term investments and marketable securities — — — — — 63 63 Change in fair value of cash flow hedging instruments, net of settlements — — — — — 111 111 Elimination of excess additional pension liability over unrecognized prior service cost attributable to discontinued operations — — — — — 2,219 2,219 Issuance of common stock 27,600 27,600 118,631 — — — 146,231 Common stock issued under long-term incentive plans, net 493 493 2,190 — — — 2,683 Foreign currency translation — — — — — (2 ) (2 ) Balances at December 31, 2006 279,054 $ 279,054 $ 777,798 $ (463,221 ) $ (13,190 ) $ 553 $ 580,994 Net income — — — 43,890 — — 43,890 Unrealized gain on short-term investments and marketable securities — — — — — 103 103 Change in fair value of cash flow hedging instruments, net of settlements — — — — — (23 ) (23 ) Issuance of common stock in Bolnisi/Palmarejo merger 271,969 271,969 826,061 — — — 1,098,030 Common stock issued under long-term incentive plans, net 489 489 3,878 — — — 4,367 Foreign currency translation — — — — — 6 6 Balances at December 31, 2007 551,512 $ 551,512 $ 1,607,737 $ (419,331 ) $ (13,190 ) $ 639 $ 1,727,367
The accompanying notes are an integral part of these consolidated financial statements.
F-8
COEUR D’ALENE MINES CORPORATION AND SUBSIDIARIES
CONSOLIDATED STATEMENTS OF CASH FLOWSYears Ended December 31, 2006
2005
2004
(In Thousands)
CASH FLOWS FROM OPERATING ACTIVITIES: Net income (loss) $ 88,486 $ 10,551 $ (16,858 ) Add (deduct) non-cash items: Depreciation and depletion 26,772 18,889 16,833 Deferred taxes (2,902 ) 1,629 (4,403 ) Unrealized (gain) loss on embedded derivatives 1,166 (2,052 ) (82 ) Share-based compensation 2,218 1,237 1,137 Amortization of debt issuance costs 303 303 408 Amortization of premium and/or discount on short-term investments, net 24 790 1,527 Other non-cash charges (313 ) 250 (16 ) Changes in operating assets and liabilities: Receivables (14,781 ) (19,571 ) (2,014 ) Prepaid expenses and other (599 ) (183 ) (517 ) Inventories (15,555 ) (8,308 ) (17,492 ) Accounts payable and accrued liabilities 17,686 2,349 (167 ) Discontinued operations (11,275 ) 792 3,062
CASH PROVIDED BY (USED IN) OPERATING ACTIVITIES 91,230 6,676 (18,582 )
CASH FLOWS FROM INVESTING ACTIVITIES: Purchases of short-term investments (317,743 ) (212,252 ) (343,019 ) Proceeds from sales of short-term investments 430,292 277,021 142,128 Capital expenditures (147,998 ) (113,290 ) (8,363 ) Other (328 ) 103 372 Discontinued operations 15,446 (3,346 ) (2,041 )
CASH USED IN INVESTING ACTIVITIES (20,331 ) (51,764 ) (210,923 )
CASH FLOWS FROM FINANCING ACTIVITIES: Repayment of long-term debt -- -- (9,561 ) Proceeds from issuance of common stock 154,560 36,493 119,803 Payments of common stock issuance costs (8,329 ) (557 ) (6,702 ) Proceeds from issuance of notes -- -- 180,000 Payments of debt issuance costs -- -- (6,089 ) Borrowings from bank on working capital facility -- -- 6,056 Payments to bank on working capital facility -- -- (8,422 ) Other (1,354 ) (1,170 ) (2,055 )
CASH PROVIDED BY FINANCING ACTIVITIES: 144,877 34,766 273,030
INCREASE (DECREASE) IN CASH AND CASH EQUIVALENTS 215,776 (10,322 ) 43,525
Cash and cash equivalents at beginning of period 54,896 65,218 21,693
Cash and cash equivalents at end of period 270,672 $ 54,896 $ 65,218
SUPPLEMENTAL DISCLOSURES OF CASH FLOW INFORMATION Cash paid for: Interest $ 2,334 $ 2,280 $ 1,572 Taxes $ 814 -- --
Years Ended December 31, 2007 2006 2005 (In thousands) CASH FLOWS FROM OPERATING ACTIVITIES: Net income $ 43,890 $ 88,486 $ 10,551 Add (deduct) non-cash items: Depreciation and depletion 20,984 26,772 18,889 Deferred taxes 2,154 (2,902 ) 1,629 Unrealized (gain) loss on embedded derivatives (1,462 ) 1,166 (2,052 ) Share-based compensation 3,448 2,218 1,237 Amortization of debt issuance costs 303 303 303 Amortization of premium and/or discount on short-term investments, net (6 ) 24 790 Gain on asset retirement obligation (871 ) (41 ) (215 ) Gain on foreign currency transactions (433 ) (147 ) 170 (Gain) loss of sales of assets (1,947 ) (237 ) 90 Other non-cash charges 616 112 205 Changes in operating assets and liabilities: Receivables (24,021 ) (14,781 ) (19,571 ) Prepaid expenses and other (4,065 ) (599 ) (183 ) Inventories 13,172 (15,555 ) (8,308 ) Accounts payable and accrued liabilities (11,705 ) 17,686 2,349 Discontinued operations — (11,275 ) 792 CASH PROVIDED BY OPERATING ACTIVITIES 40,057 91,230 6,676 CASH FLOWS FROM INVESTING ACTIVITIES: Purchases of short-term investments (167,346 ) (317,743 ) (212,252 ) Proceeds from sales of short-term investments 183,121 430,292 277,021 Capital expenditures (216,978 ) (147,998 ) (113,290 ) Merger related costs (13,727 ) — — Proceeds from sale of assets 3,270 314 289 Other 187 (642 ) (186 ) Discontinued operations — 15,446 (3,346 ) CASH USED IN INVESTING ACTIVITIES (211,473 ) (20,331 ) (51,764 ) CASH FLOWS FROM FINANCING ACTIVITIES: Proceeds from short-term borrowings 1,698 — — Repayment of long-term debt and capital leases (1,360 ) (1,448 ) (685 ) Proceeds from issuance of common stock — 154,560 36,493 Payments of common stock issuance costs (726 ) (8,329 ) (557 ) Other (197 ) 94 (485 ) CASH PROVIDED BY FINANCING ACTIVITIES: (585 ) 144,877 34,766 INCREASE (DECREASE) IN CASH AND CASH EQUIVALENTS (172,001 ) 215,776 (10,322 ) Cash and cash equivalents at beginning of period 270,672 54,896 65,218 Cash and cash equivalents at end of period $ 98,671 $ 270,672 $ 54,896 SUPPLEMENTAL DISCLOSURES OF CASH FLOW INFORMATION Cash paid for: Interest $ 2,283 $ 2,334 $ 2,280 Income taxes $ 11,994 $ 814 —
The accompanying notes are an integral part of these consolidated financial statements.F-9
COEUR D’ALENE MINES CORPORATION AND SUBSIDIARIES
NOTES TO CONSOLIDATED FINANCIAL STATEMENTS(Dollar amounts in thousands, unless otherwise specified)NOTE A — BUSINESS OF COEUR D’ALENE MINES CORPORATION Coeur d’Alene Mines Corporation and its subsidiaries (collectively, “Coeur” or the “Company”) is principally engaged in silver and gold mining and related activities including exploration, development, and mining at its properties located in the United States (Nevada and Alaska), South America (Chile, Argentina and Bolivia) and, Australia (New South Wales), Mexico (Chihuahua) and Africa (Tanzania).NOTE B — SUMMARY OF SIGNIFICANT ACCOUNTING POLICIES Principles of Consolidation: The consolidated financial statements include the wholly-owned subsidiaries of the Company, the most significant of which are Coeur Rochester, Inc., Coeur Silver Valley, Inc., Coeur Alaska, Inc., CDE Cerro Bayo Ltd., Coeur Argentina, CDE Australia and EmpressaEmpresa Minera Manquiri S.A., Bolnisi Gold NL and Palmarejo Silver and Gold Corporation. The consolidated financial statements also include all entities in which voting control of more than 50% is held by the Company. The Company has no investments in entities in which it has greater than 50% ownership interest accounted for using the equity method. Intercompany balances and transactions have been eliminated in consolidation. Investments in corporate joint ventures where the Company has ownership of 50% or less and funds its proportionate share of expenses are accounted for under the equity method. The Company has no investments in entities in which it has a greater than 20% ownership interest accounted for using the cost method. Revenue Recognition: Pursuant to guidance in Staff Accounting Bulletin (“SAB”) No. 104, “Revenue Recognition for Financial Statements”, revenue is recognized when persuasive evidence of an arrangement exists, delivery has occurred, the price is fixed or determinable, no obligations remain and collectibilitycollectability is probable. The passing of title to the customer is based on the terms of the sales contract. Product pricing is determined at the point revenue is recognized by reference to active and freely traded commodity markets, for example the London Bullion Market for both gold and silver, in an identical form to the product sold. Under our concentrate sales contracts with third-party smelters, final gold and silver prices are set on a specified future quotational period, typically one to three months, after the shipment date based on market metal prices. Revenues are recorded under these contracts at the time title passes to the buyer based on the forward price for the expected settlement period. The contracts, in general, provide for a provisional payment based upon provisional assays and quoted metal prices. Final settlement is based on the average applicable price for a specified future period, and generally occurs from three to six months after shipment. Final sales are settled using smelter weights, settlement assays (average of assays exchanged and/or umpire assay results) and are priced as specified in the smelter contract. The Company’s provisionally priced sales contain an embedded derivative that is required to be separated from the host contract for accounting purposes. The host contract is the receivable from the sale of concentrates measured at the forward price at the time of sale. The embedded derivative does not qualify for hedge accounting. The embedded derivative is recorded as a derivative asset, in prepaid expenses and other assets or as a derivative liability in accrued liabilities and other on the balance sheet and is adjusted to fair value through revenue each period until the date of final gold and silver settlement. The form of the material being sold, after deduction for smelting and refining is in an identical form to that sold on the London Bullion Market. The form of the product is metal in flotation concentrate, which is the final process for which the Company is responsible.F-10
The effects of forward sales contracts are reflected in revenue at the date the related precious metals are delivered or the contracts expire. Third party smelting and refining costs of $8.4 million, $9.1 million and $6.1 million in 2007, 2006 and $3.3 million in 2006, 2005, and 2004, respectively, are recorded as a reduction of revenue. At December 31, 2007, the Company had outstanding provisionally priced sales of $61.2 million consisting of 3.3 million ounces of silver and 20,775 ounces of gold, which had a fair value of approximately $63.8 million including the embedded derivative. For each one cent per ounce change in realized silver price, revenue would vary (plus or minus) approximately $33,300 and for each one dollar per ounce change in realized gold price, revenue would vary (plus or minus) approximately $20,800. At December 31, 2006, the Company had outstanding provisionally priced sales of $74.5 million, consisting of 4.6 million ounces of silver and 29,577 ounces of gold. For each one cent per ounce change in realized silver price, revenue would vary (plus or minus) approximately $45,700 and for each one dollar per ounce change in realized gold price, revenue would vary (plus or minus) approximately $29,600. At December 31, 2005, the Company had outstanding provisionally priced sales of $47.0 million, consisting of 3.5 million ounces of silver and 40,000 ounces of gold. For each one cent per ounce change in realized silver price, revenue would vary (plus or minus) approximately $35,400 and for each one dollar per ounce change in realized gold price, revenue would vary (plus or minus) approximately $40,000. Cash and Cash Equivalents: Cash and cash equivalents include all highly-liquid investments with a maturity of three months or less at the date of purchase. The Company minimizes its credit risk by investing its cash and cash equivalents with major international banks and financial institutions located principally in the United States and Chile with a minimum credit rating of A1 as defined by Standard & Poor’s. The Company’s management believes that no concentration of credit risk exists with respect to the investment of its cash and cash equivalents. Short-term Investments: Short-term investments principally consist of highly-liquid United States, foreign government and corporate securities and investment-grade auction rate securities, all classified as available-for-sale and reported at fair value with maturities that could range from three months to forty years. Unrealized gains and losses on these investments are recorded in accumulated other comprehensive lossincome as a separate component of shareholders’ equity. Any decline in market value considered to be other than temporary is recognized in determining net income/loss. Realized gains and losses from the sale of these investments are included in determining net income/loss. The Company maintains a pledge of collateral agreement to reserve $1.0 million against the investment portfolio to cover credit exposure related to ACH transactions. Prior to December 31, 2006, the Company classified its auction rate securities as cash and cash equivalents because the securities were highly liquid and the periods between interest rate resets generally did not exceed 90 days. During the fourth quarter of 2006, the Company determined that, pursuant to SFAS 95, “Statement of Cash Flows”, its auction securities cannot be classified as cash equivalents because their contractual maturities exceed 90 days. The Company classified its auction rate securities as of December 31, 2006 as short term investments.
The Company also corrected the classification in its 2005 and 2004 financial statement presentation by reclassifying $159.7 million and $207.9 million, respectively, of auction rate securities as of December 31, 2005 and December 31, 2004 from cash and cash equivalents to short-term investments. As a result, the following table shows the amounts, as originally presented in the Company’s Form 10-K, for the years ended December 31, 2005 and December 31, 2004 and the corrected 2005 and 2004 amounts as presented in its Form 10-K for the year ended December 31, 2006. This reclassification had no effect on total current assets, stockholders’ equity, net income (loss), net income (loss) per share or on cash provided by operating activities.
For the year ended December 31, 2005 As Previously
Reported
Adjustment
Corrected
(In Thousands) Cash and Cash Equivalents $ 214,616 $ (159,720 ) $ 54,896 Short-term Investments 25,726 159,720 185,446 Net Cash Used in Investing Activities (99,894 ) 48,130 (51,764 ) Decrease in Cash and Cash Equivalents (58,452 ) 48,130 (10,322 )
F-11
For the year ended December 31, 2004 As Previously
Reported
Adjustment
Corrected
(In Thousands) Cash and Cash Equivalents $ 273,068 $ (207,850 ) $ 65,218 Short-term Investments 48,993 207,850 256,843 Net Cash Used in Investing Activities (43,787 ) (167,136 ) (210,923 ) Decrease in Cash and Cash Equivalents 210,661 (167,136 ) 43,525
$66.7$50.9 million as of December 31, 2006.2007. Of this amount, $31.3$25.9 million is reported as a current asset and $35.4$25.0 million is reported as a non-current asset. The distinction between current and non-current is based upon the expected length of time necessary for the leaching process to remove the metals from the broken ore. The historical cost of the metal that is expected to be extracted within twelve months is classified as current and the historical cost of metals contained within the broken ore that will be extracted beyond twelve months is classified as non-current. Inventories of ore on leach pad are valued based on actual production costs incurred to produce and place ore on the leach pad, adjusted for effects on monthly production of costs of abnormal production levels, less costs allocated to minerals recovered through the leach process.F-11
The estimate of both the ultimate recovery expected over time and the quantity of metal that may be extracted relative to the time the leach process occurs requires the use of estimates which are inherently inaccurate since they rely upon laboratory testwork. Testwork consists of 60 day leach columns from which the Company projects metal recoveries up to five years in the future. The quantities of metal contained in the ore are based upon actual weights and assay analysis. The rate at which the leach process extracts gold and silver from the crushed ore is based upon laboratory column tests and actual experience occurring over approximately nineteen years of leach pad operations at the Rochester Mine. The assumptions used by the Company to measure metal content during each stage of the inventory conversion process includes estimated recovery rates based on laboratory testing and assaying. The Company periodically reviews its estimates compared to actual experience and revises its estimates when appropriate. The length of time necessary to achieve ultimate recoveries for silver and gold is currently estimated between 5 and 10 years.F-12
In August 2007, the Company terminated mining and crushing operations at the Rochester mine as ore reserves were fully mined. Residual heap leach activities are expected to continue through 2011.
Metal and Other Inventory: Inventories include concentrate ore, dorè, ore in stockpiles and operating materials and supplies. The classification of inventory is determined by the stage at which the ore is in the production process. Inventories of ore in stock piles are sampled for gold and silver content and are valued based on the lower of actual costs incurred or estimated net realizable value based upon the period ending prices of gold and silver. Material that does not contain a minimum quantity of gold and silver to cover estimated processing expense to recover the contained gold and silver is not classified as inventory and is assigned no value. All inventories are stated at the lower of cost or market, with cost being determined using a weighted average cost method. Concentrate and dorè inventory includes product at the mine site and product held by refineries and are also valued at lower of cost or market value. Metal inventory costs include direct labor, materials, depreciation, depletion and amortization as well as administrative overhead costs relating to mining activities. Property, Plant, and Equipment: Expenditures for new facilities, capital leases, new assets or expenditures that extend the useful lives of existing facilities are capitalized and depreciated using the straight-line method at rates sufficient to depreciate such costs over the shorter of estimated productive lives of such facilities or the useful life of the individual assets. Productive lives range from 7 to 31 years for buildings and improvements, 3 to 13 years for machinery and equipment and 3 to 7 years for furniture and fixtures. Certain mining equipment is depreciated using the units-of-production method based upon estimated total proven and probable reserves. Maintenance and repairs are expensed as incurred. Operational Mining Properties and Mine Development: Costs incurred to develop new properties are capitalized as incurred, where it has been determined that the property can be economically developed. At the Company’s surface mines, these costs include costs to further delineate the ore body. At the Company’s underground mines, these costs include the cost of building access ways, shaft sinking and access, lateral development, drift development, ramps and infrastructure development. All such costs are amortized using the units of production method over the estimated life of the ore body based on recoverable ounces to be mined from proven and probable reserves. Interest expense allocable to the cost of developing mining properties and to construct new facilities is capitalized until assets are ready for their intended use. Gains or losses from sales or retirements of assets are included in other income or expense. Costs incurred during the start-up phase of a mine are expensed as incurred. Ongoing mining expenditures on producing properties are charged against earnings as incurred. Major development expenditures incurred to increase production or extend the life of the mine are capitalized. Mineral exploration costs are expensed as incurred. Mineral Interests: Significant payments related to the acquisition of the land and mineral rights are capitalized as incurred. Prior to acquiring such land or mineral rights, the Company generally makes a preliminary evaluation to determine that the property has significant potential to develop an economic ore body. The time between initial acquisition and full evaluation of a property’s potential is variable and is determined by many factors including: location relative to existing infrastructure, the property’s stage of development, geological controls and metal prices. If a mineableminable ore body is discovered, such costs are amortized when production begins using the units-of-production method based on recoverable ounces to be mined from proven and probable reserves. If no mineableminable ore body is discovered, such costs are expensed in the period in which it is determined the property has no future economic value.F-12
Asset Impairment: The Company follows Statement of Financial Accounting Standard (“SFAS”) No. 144, “Accounting for the Impairment or Disposal of Long-Lived Assets,” to evaluate the recoverability of its assets. Management reviews and evaluates its long-lived assets for impairment when events and changes in circumstances indicate that the related carrying amounts of its assets may not be recoverable. Impairment is considered to exist if total estimated future cash flows or probability-weighted cash flows on an undiscounted basis, are less than the carrying amount of the assets, including property plant and equipment, mineral property, development property, and any deferred costs such as deferred stripping. An impairment loss is measured and recorded based on the difference between book value and discounted estimated future cash flows or the application of an expected present value technique to estimate fair value in the absence of a market price. Future cash flows include estimates of recoverable ounces, gold and silver prices (considering current and historical prices, price trends and related factors), production levels and capital, all based on life-of-mine plans and projections. Assumptions underlying future cash flow estimates are subject to risks and uncertainties. If the assets are impaired, a calculation of fair value is performed and if the fair value is lower than the carrying value of the assets, the assets are reduced to their fair market value. Any differences between significant assumptions and market conditions and/or the Company’s operating performance could have a material effect on the Company’s determination of ore reserves, or its ability to recover the carrying amounts of its long-lived assets resulting in impairment charges. In estimating future cash flows, assets are grouped at the lowest level for which there are identifiable cash flows that are largely independent of cash flows from other asset groups. Generally, in estimating future cash flows, all assets are grouped at a particular mine for which there is identifiable cash flow.F-13
Restricted Cash and Cash Equivalents: The Company, under the terms of its lease, self insurance, and bonding agreements with certain banks, lending institutions and regulatory agencies, is required to collateralize certain portions of the Company’s obligations. The Company has collateralized these obligations by assigning certificates of deposit that have maturity dates ranging from three months to a year, to the respective institutions or agency. At December 31, 20062007 and December 31, 2005,2006, the Company held certificates of deposit and cash under these agreements of $19.5$25.8 million and $16.9$23.5 million, respectively, restricted for this purpose. The ultimate timing for the release of the collateralized amounts is dependent on the timing and closure of each mine. In order to release the collateral, the Company must seek approval from certain government agencies responsible for monitoring the mine closure status. Collateral could also be released to the extent the Company was able to secure alternative financial assurance satisfactory to the regulatory agencies. The Company believes there is a reasonable probability that the collateral will remain in place beyond a twelve-month period and has therefore classified these investments as long-term. Deferred Stripping Costs: Effective January 1, 2006, the Company adopted Emerging Issues Task Force (“EITF”) Issue No. 04-06, “Accounting for Stripping Costs Incurred during Production in the Mining Industry.” EITF Issue No. 04-06 addresses the accounting for stripping costs incurred during the production phase of a mine and refers to these costs as variable production costs that should be included as a component of inventory to be recognized in costs applicable to sales in the same period as the revenue from the sale of inventory. The consensus requires application through recognition of a cumulative effect adjustment to opening retained earnings in the period of adoption, with no charge to current earnings for prior periods. The Company recorded a charge of approximately $0.4 million to retained earnings at January 1, 2006 to write off previously capitalized deferred stripping costs, as the cumulative effect of a change in accounting method.F-13
Reclamation and Remediation Costs: The Company follows SFAS No. 143, “Accounting for Asset Retirement Obligations”, which addresses financial accounting and reporting for obligations associated with the retirement of tangible long-lived assets and the associated asset retirement costs. The standard applies to legal obligations associated with the retirement of long-lived assets that result from the acquisition, construction, development and normal use of the asset. SFAS No. 143 requires that the fair value of a liability for an asset retirement obligation be recognized in the period in which it is incurred if a reasonable estimate of fair value can be made. The fair value of the liability is added to the carrying amount of the associated asset and this additional carrying amount is depreciated over the life of the asset. An accretion cost, representing the increase over time in the present value of the liability, is recorded each period in depreciation, depletion and amortization expense. As reclamation work is performed or liabilities are otherwise settled, the recorded amount of the liability is reduced. Future remediation costs for inactive mines are accrued based on management’s best estimate at the end of each period of the undiscounted costs expected to be incurred at the site. Such cost estimates include, where applicable, ongoing care and maintenance and monitoring costs. Changes in estimates are reflected in earnings in the period an estimate is revised.F-14
Foreign Currency: Substantially all assets and liabilities of foreign subsidiaries are translated at exchange rates in effect at the end of each period. Revenues and expenses are translated at the average exchange rate for the period. Foreign currency transaction gains and losses are included in the determination of net income. Derivative Financial Instruments: The Company accounts for derivative financial instruments in accordance with SFAS No. 133, “Accounting for Derivative Instruments and Hedging Activities,” (as amended by SFAS No. 137) and SFAS No. 138, “Accounting for Certain Derivative Instruments and Certain Hedging Activities.” These Statements require recognition of all derivatives as either assets or liabilities on the balance sheet and measurement of those instruments at fair value. Appropriate accounting for changes in the fair value of derivatives held is dependent on whether the derivative instrument is designated and qualifies as an accounting hedge and on the classification of the hedge transaction. For derivative instruments that are designated and qualify as cash flow hedges, the effective portions of changes in fair value of the derivative are recorded in other comprehensive income, (loss), and are recognized in the Consolidated Statement of Consolidated Operations when the hedged item affects net income (loss) for the period. Ineffective portions of changes in the fair value of cash flow hedges are recognized currently in earnings. Refer to Note NO – Derivative Financial Instruments and Fair Value of Financial Instruments. Stock-based Compensation Plans: Effective January 1, 2006, the Company began recording compensation expense associated with awards of equity instruments in accordance with Statement of Financial Accounting Standards (“SFAS”)SFAS No. 123(R), “Share-Based Payment”. Prior to January 1, 2006, the Company accounted for awards of equity instruments according to the provisions of SFAS No. 123, “Accounting for Stock-Based Compensation,” and related interpretations, and therefore no related compensation expense was recorded for awards granted with no intrinsic value. The Company adopted the modified prospective transition method provided for under SFAS No. 123(R), and, consequently, has not retroactively adjusted results from prior periods. Under this transition method, compensation cost associated with awards of equity instruments recognized during 2006 includes: 1) amortization related to the remaining unvested portion of all awards granted for the fiscal years 1995 to 2005, based on the grant date fair value, estimated in accordance with the original provisions of SFAS No. 123, “Accounting for Stock-Based Compensation”; and 2) amortization related to all equity instrument awards granted subsequent to December 31, 2005, based on the grant-date fair value estimated in accordance with the provisions of SFAS No. 123(R). The compensation costs are included in administrative and general expenses, productions costs and the cost of self-constructed property, plant and equipment as deemed appropriate.F-14
The compensation expense recognized in the Company’s consolidated financial statements for the years ended December 31, 2006, 2005 and 2004 for awards of equity instruments was $2.4 million, $1.2 million and $1.1 million, respectively. As of December 31, 2006, there was $1.8 million of total unrecognized compensation cost (net of estimated forfeitures) related to unvested stock options, restricted stock grants and performance share grants which is expected to be recognized over a weighted-average vesting period of 2.0 years.
The Company continues to estimate the fair value of each stock option award on the date of grant using the Black-Scholes option valuation model. The Company now estimates forfeitures of stock based awards based on historical data and adjusts the forfeiture rate periodically. The adjustment of the forfeiture rate will result in a cumulative adjustment in the period the forfeiture estimate is changed. During the year ended December 31, 2006, the Company recorded an adjustment of $0.1 million to reduce compensation expense for forfeited awards. Income Taxes: The Company computes income taxes in accordance with SFAS No. 109, “Accounting for Income Taxes.” SFAS No. 109 requires an asset and liability approach which results in the recognition of deferred tax liabilities and assets for the expected future tax consequences or benefits of temporary differences between the financial reporting basis and the tax basis of assets and liabilities, as well as operating loss and tax credit carryforwards, using enacted tax rates in effect in the years in which the differences are expected to reverse.F-15
In assessing the realizability of deferred tax assets, management considers whether it is more likely than not that some portion or all of theits deferred tax assets will not be realized. Management considers the scheduled reversal of deferred tax liabilities, projected future taxable income and tax planning strategies in making this assessment. A valuation allowance has been provided for the portion of the Company’s net deferred tax assets for which it is more likely than not that they will not be realized. The Company and its subsidiaries are subject to U.S. federal income tax as well as income tax of multiple state and foreign jurisdictions. The Company has substantially concluded all U.S. federal income tax matters for years through 1999. Federal income tax returns for 2000 through 2006 are subject to examination. The Company’s continuing practice is to recognize interest and/or penalties related to income tax matters in income tax expense. There were no significant accrued interest or penalties at December 31, 2007. Comprehensive Income (Loss):Income: Comprehensive income (loss) includes net income (loss) as well as changes in stockholders’ equity that result from transactions and events other than those with stockholders. Items of comprehensive income (loss) include the following:2006
2005
2004
Net income (loss) $ 88,486 $ 10,551 $ (16,858 ) Unrealized gain (loss) on marketable securities 63 853 (347 ) Change in fair value of cash flow hedges, net of 111 (169 ) (130 ) settlements Minimum pension liabilities 2,219 (237 ) (431 ) Other (2 ) -- --
$ 90,877 $ 10,998 $ (17,766 )
following (in thousands):
2007 2006 2005 Net income $ 43,890 $ 88,486 $ 10,551 Unrealized gain on short-term investments and marketable securities 103 63 853 Change in fair value of cash flow hedges, net of settlements (23 ) 111 (169 ) Minimum pension liabilities — 2,219 (237 ) Foreign currency translation 6 (2 ) — $ 43,976 $ 90,877 $ 10,998
Net Income (Loss) Per Share: The Company follows SFAS No. 128, “Earnings Per Share,” which requires the presentation of basic and diluted earnings per share. Basic earnings per share is computed by dividing net income (loss) available to common shareholders by the weighted average number of common shares outstanding during each period. Diluted earnings per share reflect the potential dilution that could occur if securities or other contracts to issue common stock were exercised or converted into common stock. The effect of potentially dilutive stock options and debentures outstanding in the years ending December 31, 2007, 2006 2005 and 20042005 are as follows:F-15
For the Year Ended
December 31, 2006
For the Year Ended
December 31, 2005
For the Year Ended
December 31, 2004
(In thousands except for EPS) Income
(Numerator)
Shares
(Denominator)
Per-Share
Amount
Income
(Numerator)
Shares
(Denominator)
Per-Share
Amount
Income
(Numerator)
Shares
(Denominator)
Per-Share
Amount
Basic EPS Income (loss) from continuing operations $ 75,419 271,357 $ 0.28 $ 14,746 242,915 $ 0.06 $ (18,036 ) 215,969 $ (0.08 ) Income (loss) from discontinued operations 13,067 271,357 0.05 (4,195 ) 242,915 (0.02 ) 1,178 215,969 --
Net income (loss) $ 88,486 271,357 $ 0.33 $ 10,551 242,915 $ 0.04 $ (16,858 ) 215,969 $ (0.08 ) Effect of Dilutive Securities Equity awards -- 1,041 -- -- 768 -- -- -- -- 1.25% convertible notes 1,117 23,684 -- -- -- -- -- -- -- Diluted EPS Income (loss) from continuing operations $ 76,536 296,082 0.26 $ 14,746 243,683 $ 0.06 $ (18,036 ) 215,969 $ (0.08 ) Income (loss) from discontinued operations 13,067 296,082 0.04 (4,195 ) 243,683 (0.02 ) 1,178 215,969 --
Net income (loss) $ 89,603 296,082 $ 0.30 $ 10,551 243,683 $ 0.04 $ (16,858 ) 215,969 $ (0.08 )
The following potentially dilutive shares have been excluded from earnings per share calculation as their effect is antidilutive:
December 31, 2006
December 31, 2005
December 31, 2004
Stock options -- -- 1,796,908 1.25% Notes Convertible at $7.06 per share -- 23,684,211 23,684,211
Total potentially dilutive shares -- 23,684,211 25,481,119
F-16
Year Ended Year Ended Year Ended December 31, 2007 December 31, 2006 December 31, 2005 Income Shares Per-Share Income Shares Per-Share Income Shares Per-Share (In thousands except for EPS) (Numerator) (Denominator) Amount (Numerator) (Denominator) Amount (Numerator) (Denominator) Amount Basic EPS Income from continuing operations $ 43,890 285,972 $ 0.15 $ 75,419 271,357 $ 0.28 $ 14,746 242,915 $ 0.06 Income from discontinued operations — 285,972 — 13,067 271,357 0.05 (4,195 ) 242,915 (0.02 ) Net income $ 43,890 285,972 $ 0.15 $ 88,486 271,357 $ 0.33 $ 10,551 242,915 $ 0.04 Effect of Dilutive Securities Equity awards — 868 — 1,041 — 768 1.25% convertible notes 297 23,684 1,117 23,684 — — Diluted EPS Income from continuing operations $ 44,187 310,524 0.14 $ 76,536 296,082 0.26 $ 14,746 243,683 $ 0.06 Income (loss) from discontinued operations — — 13,067 296,082 0.04 (4,195 ) 243,683 (0.02 ) Net income $ 44,187 310,524 $ 0.14 $ 89,603 296,082 $ 0.30 $ 10,551 243,683 $ 0.04
For the years ended 2007, 2006 2005 and 2004,2005, options to purchase 531,112, 322,653 876,192 and -0-876,192 shares of common stock at prices between $4.81 to $8.94, $6.66 to $15.15$15.19 and $3.92 to $17.94, respectively, were not included in the computation of diluted EPS because the exercise price of options was greater than the average market price of the common shares. The options, which expire between 20072008 to 2016,2017, are outstanding at December 31, 2006.2007. Potentially diluting shares totaling 23,684,211 shares attributed to the 1.25% convertible notes have been excluded from the earnings per share calculation for the year ended December 31, 2005 as their effect was anti-dilutive.
Debt Issuance Costs: Costs associated with the issuance of debt are included in other noncurrent assets and are amortized over the term of the related debt. Use of Estimates: The preparation of the Company’s consolidated financial statements in conformity with U.S. generally accepted accounting principles generally accepted in the United States of America(“GAAP”) requires management to make estimates and assumptions that affect the amounts reported in their consolidated financial statements and accompanying notes. The areas requiring the use of management’s estimates and assumptions relate to recoverable ounces from proven and probable reserves that are the basis of future cash flow estimates and units-of-production depreciation and amortization calculations; useful lives utilized for depreciation, depletion and amortization of future cash flows for long lived assets; estimates of recoverable gold and silver ounces in ore on leach pad; the amount and timing of reclamation and remediation costs; valuation allowanceallowances for deferred tax assets; and post-employment and other employee benefit liabilities. Reclassifications: Certain reclassifications of prior year balances have been made to conform to the current year presentation. These reclassifications had no impact on the Company’s consolidated financial position, results of operations or cash flows for the periods presented. The most significant reclassifications were to reclassify the balance sheet amounts and the income statement results from historical presentation to assets and liabilities of discontinued operations and toincome (loss) income from discontinued operations in the consolidated statements of operations for all periods presented.the years ended December 31, 2006 and 2005. The consolidated statements of cash flows have been reclassified for discontinued operations for allthe periods presented.ended December 31, 2006 and 2005. In addition, investments in auction rate securities have been reclassified from cash and cash equivalents to short-term investments on the consolidated balance sheet as of December 31, 2005. We also madeand corresponding adjustments were made to the consolidated statements of cash flows for all of the periods presented.ended December 31, 2006 and 2005.
Recent Accounting Pronouncements: In November 2004, FASB issued SFAS No. 151, “Inventory Costs,” which amends the guidance in ARB No. 43, Chapter 4, “Inventory Pricing,” to clarify the accounting for abnormal amounts of idle facility expense, freight, handling costs, and wasted material (spoilage). This Statement now requires that these items be recognized as current-period expenses regardless of whether they meet the criterion of “so abnormal” as previously stated in ARB No. 43, Chapter 5, “Intangible Assets”. In addition, this Statement requires that the allocation of fixed production overhead to costs of conversion be based on the normal capacity of the production facility. SFAS No. 151 is effective for inventory costs incurred during fiscal years beginning after June 15, 2005. The Company has performed a review of the provisions of the Statement and has determined that its current accounting practice is to recognize the costs attibuted to idle facilities as a current-period expense and, therefore adoption in 2006 did not impact the Company’s financial statements. In December 2004,February 2007, the FASB issued Statement No. 159, “The Fair Value Option for Financial Assets and Financial Liabilities” (“SFAS No. 123(R), “Share-Based Payments”, which revised159”). SFAS No. 123, “Accounting for Stock-Based Compensation”159 permits entities to choose to measure many financial instruments and superseded Accounting Principles Board (“APB”) Opinion 25, “Accounting for Stock Issued to Employees” and its related implementation guidance. SFAS No. 123(R) requires measurement and recording in the financial statements of the costs of employee services received in exchange for an award of equity instruments based on the grant-datecertain other items at fair value, with the objective of the award, recognized over the period during which an employee is requiredimproving financial reporting by mitigating volatility in reported earnings caused by measuring related assets and liabilities differently without having to provide services in exchange for such award.apply complex hedge accounting provisions. The Company adopted the provisions of SFAS No. 123(R) on January 1, 2006, using the modified prospective method. Accordingly, compensation expense was recognized for all newly granted awards and awards modified, repurchased, or cancelled after January 1, 2006. Compensation cost for the unvested portion of awards that were outstanding, as of January 1, 2006, is recognized ratably over the remaining vesting period. The compensation cost for the unvested portion of awards is based on the fair value at date of grant, adjusted for forfeitures, as determined pursuant to SFAS No. 123. The actual effect on net income and earnings per share in future periods will vary depending upon the number and fair value of options granted in future years compared to prior years. The adoption resulted in a charge to the Company’s statement of operations of $1.4 million in 2006 and did not impact the Company’s cash flow.
F-17
In March 2005, the Financial Accounting Standards Board (“FASB”) ratified Emerging Issues Task Force (“EITF#148;) Issue No. 04-06, “Accounting for Stripping Costs Incurred during Production in the Mining Industry.#148; EITF Issue No. 04-06 addresses the accounting for stripping costs incurred during the production phase of a mine and refers to these costs as variable production costs that should be included as a component of inventory to be recognized in costs applicable to sales in the same period as the revenue from the sale of inventory. The guidance in EITF Issue No. 04-06 was159 are effective for the Company in 2006. The guidance requires application through recognition of a cumulative effect adjustment to opening retained earnings in the period of adoption.Company’s fiscal year ending December 31, 2008. The Company adoptedis currently evaluating the impact that the adoption of this pronouncement as of January 1, 2006 and recorded a charge of approximately $0.4 million to write off deferred stripping costs, asstatement will have on the cumulative effect of a change in accounting method.
In May 2005, the FASB issued SFAS No. 154, “Accounting Changes and Error Corrections.” SFAS No. 154 established new standards on accounting for changes in accounting principles. SFAS No. 154 requires all such changes to be accounted for by retrospective application to the financial statements of prior periods unless prescribed otherwise or it is impracticable to do so. SFAS No. 154 is effective for accounting changes and error corrections made in fiscal years beginning after December 15, 2005. Adoption of SFAS No. 154 did not have a material impact on ourCompany’s consolidated financial position, results of operations or cash flows.and disclosures.
F-16
In September 2006, the FASB issued Statement No. 157 “Fair Value Measurements” (SFAS 157). SFAS 157 defines fair value, establishes a framework for measuring fair value in generally accepted accounting principles, and expands disclosures about fair value measurements. The provisions of SFAS 157 are effective for the Company’s fiscal year ending December 31, 2008. The Company is currently evaluating the impact of the adoption of this statement on the Company’s consolidated financial position, results of operations and disclosures. In June 2006, the FASB issued Interpretation No. 48, “Accounting for Uncertainty in Income Taxes”, (FIN 48)Taxes, an Interpretation of FASB Statement No. 109, “Accounting for Income Taxes”109” (FIN 48). FIN 48 prescribes a recognition threshold and measurement attribute for the financial statement recognition and measurement of tax positions taken or expected to be taken in a tax return. FIN 48 requires that the Company recognize in its financial statements the impact of a tax position, if that tax position is more likely than not of being sustained on audit, based on the technical merits of the position. FIN 48 also provides guidance on derecognition, classification of interest and penalties, accounting in interim periods and disclosure. The provisions of FIN 48 arewere effective beginning January 1, 2007, with the cumulative effect of the change in accounting principle recorded as an adjustment to the opening balance of retained earnings. Currently, the2007. The adoption of FIN 48 isdid not expected to have a material effect on the Company’s financial position, results of operations or cash flows.F-18
The Company and its subsidiaries are subject to U.S. federal income tax as well as income tax of multiple state and foreign jurisdictions. The Company has substantially concluded all U.S. federal income tax matters for years through 1999. Federal income tax returns for 2000 through 2006 are subject to examination. The Company’s continuing practice is to recognize interest and/or penalties related to income tax matters in income tax expense. There were no significant accrued interest or penalties at December 31, 2007.NOTE C — SHORT-TERM INVESTMENTSACQUISITIONS OF BOLNISI AND MARKETABLE SECURITIES ThePALMAREJO
On December 21, 2007, the Company classifiescompleted its investment securities as available-for-sale securities. Pursuant to SFAS 115, “Accountingacquisition of all the shares of Bolnisi Gold NL (“Bolnisi”) and Palmarejo Gold and Silver Corporation (“Palmarejo”) in exchange for Certain Investmentsa total of approximately 272 million shares of Coeur common stock, a total cash payment of approximately $1.1 million and assumption of liabilities of $0.7 billion. Coeur issued 0.682 shares of Coeur common stock (or, at the election of the Bolnisi shareholder, CHESS Depositary Interests representing Coeur shares) and A$0.004 in Debt and Equity Securities”, such securities are measured at fair market valuecash (or approximately US$1.0 million in the financial statements with unrealized gains or losses recordedaggregate) for each Bolnisi ordinary share, and 2.715 shares of Coeur common stock and C$0.004 in other comprehensive income (loss). Atcash (or approximately US$0.1 million in the time securitiesaggregate) for each Palmarejo common share. The transaction was accounted for as a purchase of assets and not as a business combination since Bolnisi and Palmarejo are sold or otherwise disposed of, gains or losses are includedconsidered to be in net income (loss).the development stage. The total consideration paid for the acquisition was as follows (in thousands): Consideration: Coeur stock issued (271,969,428 shares at $4.04) $ 1,098,757 Cash payments 1,102 Transaction advisory fees and other costs 16,621 Total purchase price 1,116,480 Current liabilities 54,946 Other long-term liabilities 23,642 Deferred income taxes 572,711 Total liabilities assumed 651,299 $ 1,767,779
F-17
The following is a summarysummarizes the estimated fair values of available-for-sale securities:Available-For-Sale Securities
Cost
Gross
Unrealized
Losses
Gross
Unrealized
Gains
Estimated
Fair
Value
As of December 31, 2006 U.S. Corporate $ 65,372 $ -- $ -- $ 65,372 U.S. Government 5,000 -- 1 5,001
Total debt securities 70,372 -- 1 70,373 Equity securities 99 1 622 720
70,471 1 623 71,093
As of December 31, 2005 Auction Rate Securities $ 159,720 $ -- $ -- $ 159,720 U.S. Corporate 23,893 51 -- 23,842 U.S. Government 1,891 7 -- 1,884
Total debt securities 185,504 58 -- 185,446 Equity securities 19 4 615 630
$ 185,523 $ 62 $ 615 $ 186,076
As of December 31, 2004 Auction Rate Securities $ 207,850 $ -- $ -- $ 207,850 U.S. Corporate 18,964 107 1 18,858 U.S. Government 29,062 205 -- 28,857 State/Municipal 1,285 7 -- 1,278
Total debt securities 257,161 319 1 256,843 Equity securities 20 3 17 34
$ 257,181 $ 322 $ 18 $ 256,877
Gross realized gains and losses are basedthe assets acquired on a carrying value (cost, net of discount or premium) of short-term investments sold or adjusted for other than temporary decline in market value. Short-term investments mature at various dates. There were no realized gains and/or losses for the years ended 2006, 2005 and 2004.
Prior to December 31, 2006, the Company concluded that it was appropriate to classify its investments in auction rate securities as short-term investments. Previously such investments had been classified as cash and cash equivalents. Accordingly, the Company revised the classification to report these investments as short-term investments on the consolidated balance sheets as of December 31, 2005 and December 31, 2004. The Company also made corresponding adjustments to the consolidated statements of cash flows for the periods ended December 31, 2005 and December 31, 2004 to reflect the gross purchases and sales of these investments as investing activities rather than as a component of cash and cash equivalents. As of December 31, 2005 and December 31, 2004, $159.7 million and $207.9 million respectively, of these investments were reclassified from cash and cash equivalents to short-term investment on the consolidated Balance Sheet. This reclassification had no effect on the total current assets, stockholders’ equity, net income (loss), net income (loss) per share or cash provided by (used in) operating activities.
F-19
21, 2007 (in thousands):
Fair value of assets acquired: Cash $ 3,996 Other current assets 3,789 Property, plant and equipment 97,519 Mineral interests 1,657,189 Other assets 5,286 Total assets acquired $ 1,767,779
NOTE D –— DISCONTINUED OPERATIONS AND ASSETS AND LIABILITIES HELD FOR SALE During the first quarter of 2006, the Company committed to a plan to sell Coeur Silver Valley Inc. (“CSV”), a wholly owned subsidiary of Coeur d’Alene Mines Corporation, that ownsowned and operatesoperated the Galena underground silver mine and adjoining properties in Northern Idaho. On April 10, 2006, the Company announced that it had entered into an agreement to sell 100% of the shares of CSV to U.S. Silver Corporation for $15 million in cash. On June 1, 2006, the Company completed the sale of 100% of CSV to U.S. Silver Corporation for a total of $15 million in cash plus a post-closing working capital adjustment of $1.1 million. The Company recorded, within discontinued operations, a gain of approximately $11.1 million in the year ended December 31, 2006. Pursuant to SFAS No. 144, “Accounting for the Impairment or Disposal of Long-Lived Assets,” CSV was classified as held for sale and the results of its operations reported in discontinued operations for all prior periods.beginning in the period ended June 30, 2006.
The following table details selected financial information included in the income (loss) from discontinued operations in the consolidated statements of operations for the years ended December 31, 2006 2005 and 20042005 (in thousands): Years ended December 31, 2006 2005 Sales of metal $ 11,223 $ 16,052 Production costs applicable to sales (8,233 ) (16,698 ) Depreciation and depletion (681 ) (1,996 ) Mining exploration (279 ) (1,361 ) Other (95 ) (192 ) Income (loss) from discontinued operations 1,935 (4,195 ) Gain on sale of net assets of discontinued operations 11,132 — Net income (loss) from discontinued operations $ 13,067 $ (4,195 )
F-18
2006
2005
2004
Sales of metal $ 11,223 $ 16,052 $ 23,759 Production costs applicable to sales (8,233 ) (16,698 ) (18,637 ) Depreciation and depletion (681 ) (1,996 ) (1,967 ) Mining exploration (279 ) (1,361 ) (1,620 ) Other (95 ) (192 ) (357 )
Income (loss) from discontinued operations 1,935 (4,195 ) 1,178 Gain on sale of net assets of discontinued operations 11,132 -- --
Net income (loss) from discontinued operations $ 13,067 $ (4,195 ) $ 1,178
NOTE E — INVESTMENTS AND OTHER MARKETABLE SECURITIES The major classes of assetsCompany classifies its investment securities as available-for-sale securities. Pursuant to SFAS 115, “Accounting for Certain Investments in Debt and liabilities of discontinued operations held for saleEquity Securities”, such securities are measured at fair market value in the consolidated balance sheet asfinancial statements with unrealized gains or losses recorded in other comprehensive income. At the time securities are sold or otherwise disposed of, gains or losses are included in net income. The following is a summary of available-for-sale securities (in thousands): Available-For-Sale Securities Gross Gross Estimated Unrealized Unrealized Fair Cost Losses Gains Value As of December 31, 2007 U.S. Corporate $ 2,000 $ — $ — $ 2,000 U.S. Government 51,031 — 8 51,039 Total debt securities 53,031 — 8 53,039 Equity securities 99 — 702 801 $ 53,130 $ — $ 710 $ 53,840 As of December 31, 2006 U.S. Corporate $ 65,372 $ — $ — $ 65,372 U.S. Government 5,000 — 1 5,001 Total debt securities 70,372 — 1 70,373 Equity securities 99 1 622 720 $ 70,471 $ 1 $ 623 $ 71,093
Gross realized gains and losses are based on a carrying value (cost, net of discount or premium) of short-term investments sold or adjusted for other than temporary decline in market value. Short-term investments mature at various dates. There were no realized gains and/or losses in 2007, 2006 and 2005.Asset-Backed Commercial Paper (“ABCP”) The Company acquired certain asset-backed securities in connection with the Bolnisi and Palmarejo acquisition. Palmarejo has investments in non-bank sponsored ABCP (before accounting for an impairment charge), of which $6.3 million is invested in Apsley Trust Class E and $0.5 million in Aurora Trust Class A. Since a certain percentage of the assets supporting the commercial paper was invested in U.S. sub-prime residual mortgage-backed securities, the Company recorded an impairment based on the best available market data for such investments at the date of acquisition. Consequently, the Company recorded these investments at their estimated fair value of $5.3 million for the ABCP held by Palmarejo. The fair value of the ABCP are determined based on the Company’s assessment of market conditions at the date of acquisition, no further impairments were deemed necessary at December 31, 2005 is as follows (in thousands):December 31, 2005
Assets Receivables $ 2,036 Prepaids 906 Inventory 2,561 Property, plant and equipment (net) 2,016 Operational mining properties, net 6,357 Other 952
Total assets of discontinued operations $ 14,828
Liabilities Accounts payable $ 747 Accrued liabilities 166 Accrued payroll and related benefits 578 Reclamation and mine closure 6,905 Defined benefit liabilities 2,588 Other non-current liabilities 1,924
Total liabilities of discontinued operations $ 12,908
F-20
2007. The fair value reported may change materially in subsequent periods.
NOTE EF — METAL AND OTHER INVENTORIES Inventories consist of the following:following (in thousands): December 31, 2007 2006 Concentrate and dorè inventory $ 11,221 $ 9,680 Supplies 7,697 6,661 Metal and other inventory $ 18,918 $ 16,341
F-19
December 31, 2006
2005
Concentrate and doré inventory $ 9,680 $ 7,835 Supplies 6,661 4,972
Metal and other inventory $ 16,341 $ 12,807
NOTE FG — PROPERTY, PLANT AND EQUIPMENT Property, plant and equipment consists of the following:December 31, 2006
2005
Land $ 1,112 $ 1,423 Building improvements 51,818 40,869 Machinery and equipment 77,040 60,470 Capitalized leases for machinery and equipment 2,345 2,345
132,315 105,107 Accumulated depreciation (64,206 ) (57,929 )
$ 68,109 $ 47,178
following (in thousands):
December 31, 2007 2006 Land $ 1,133 $ 1,112 Building improvements 130,795 51,818 Machinery and equipment 153,328 77,040 Capitalized leases for machinery and equipment 37,477 2,345 322,733 132,315 Accumulated depreciation (69,937 ) (64,206 ) $ 252,796 $ 68,109
The Company’s capital expenditures, excluding the acquisitions of Bolnisi and Palmarejo, were as follows:2006
2005
2004
Rochester $ 1,225 $ 1,197 $ 3,548 Cerro Bayo 7,555 2,731 2,451 Martha 2,481 2,108 689 San Bartolome 14,597 10,477 950 Kensington 121,552 44,201 83 Endeavor -- 15,410 -- Broken Hill -- 36,667 -- Other 588 499 642
Net asset additions $ 147,998 $ 113,290 $ 8,363
Discontinued Operations - Coeur Silver Valley $ 617 $ 3,537 $ 2,151
follows (in thousands):
Years ended December 31, 2007 2006 2005 Rochester $ 1,647 $ 1,225 $ 1,197 Cerro Bayo 11,330 7,555 2,731 Martha 16,444 2,481 2,108 San Bartolomé 100,169 16,805 11,089 Kensington 92,337 122,640 53,155 Endeavor 2,112 — 15,410 Broken Hill 213 — 36,667 Other 1,942 588 499 Net asset additions $ 226,194 $ 151,294 $ 122,856 Discontinued Operations — Coeur Silver Valley $ — $ 617 $ 3,537
At December 31, 2007, 2006 and 2005, and 2004, approximately $22.1 million, $12.9 million $9.6 million and $0,$9.6, respectively, of invoices for capital expenditures remained in accounts payable and for purposes of the consolidated cash flows were treated as non-cash transactions. In connection with the acquisition of Bolnisi and Palmarejo, the Company assumed certain liabilities related to capital leases. In December 2006, Bolnisi, through its Canadian subsidiary Palmarejo, entered into a 2-year lease agreement for a power station. Under the terms of the agreement, including an amendment in January 2007, the Company will pay a fixed monthly amount of $0.3 million, including interest calculated at the rate of LIBOR plus 2.5%, starting at the date that the construction of the equipment is completed. The Company has the option at the end of the agreement to purchase the equipment by paying a nominal amount. In June 2007, Palmarejo entered into a 5-year lease agreement for $30.6 million of mining equipment to be delivered to Palmarejo as the equipment becomes available from the supplier. Mining equipment with a cost of $30.1 million has been delivered as of December 31, 2007. The Company will pay a monthly amount varying between $0.6 million and $0.8 million during the 2008 period and a fixed monthly amount of $0.6 million thereafter, including interest calculated at the rate of LIBOR plus 3.65%. The Company has the option at the end of the agreement to purchase the equipment by paying a nominal amount.F-20
F-21
Minimum future lease payments under both capital and operating leases at December 31, 20062007 are as follows:Year Ending December 31, Capital
Leases
Operating
Leases
2007 $ 916 $ 380 2008 -- -- 2009 -- -- 2010 -- -- Thereafter -- --
916 $ 380
Less: Amount representing interest 22
$ 894
follows (in thousands):
Capital Year Ending December 31, Leases 2008 11,554 2009 8,976 2010 6,755 2011 6,755 Thereafter 5,156 Total minimum payments due 39,196 Less: Amount representing interest 6,432 Present value of net minimum lease payments 32,764 Less: Current maturities 9,103 $ 23,661
The Company has entered into various operating lease agreements which expire over the next year. Total rent expense charged to net income (loss) under these agreements was $1.7 million, $2.6 million and $3.5 million for 2007, 2006, and $4.2 million for 2006, 2005, 2004, respectively.NOTE GH — MINING PROPERTIESDecember 31, 2006
2005
Capitalized costs for mining properties, net of accumulated depletion consist of the following(A): Operational mining properties: Rochester Mine $ 4,445 $ 8,582 Cerro Bayo Mine 8,531 6,660 Martha Mine 1,110 713
Total operational mining properties 14,086 15,955
Mineral interests, net of accumulated depletion Endeavor Mine 14,508 14,998 Broken Hill Mine 29,740 34,860 San Bartolome(B) 20,125 20,125
Total mineral interests 64,373 69,983
Non-producing and developmental properties: Kensington(C) 170,458 62,517 San Bartolome(D) 20,388 9,829 Other 142 142
Total non-producing and developmental properties 190,988 72,488
Total mining properties $ 269,447 $ 158,426
December 31, 2007 2006 Capitalized costs for mining properties, net of accumulated depletion consist of the following (in thousands):(A) Operational mining properties: Rochester Mine $ — $ 4,445 Cerro Bayo Mine 17,091 8,531 Martha Mine 1,832 1,110 Total operational mining properties 18,923 14,086 Mineral interests, net of accumulated depletion Endeavor Mine 15,865 14,508 Broken Hill Mine 26,897 29,740 San Bartolomé(B) 20,125 20,125 Palmarejo(C) 1,657,189 — Total mineral interests 1,720,076 64,373 Non-producing and developmental properties: Kensington(D) 256,443 170,458 San Bartolomé(E) 54,884 20,388 Other 142 142 Total non-producing and developmental properties 311,469 190,988 Total mining properties $ 2,050,468 $ 269,447
(A) On June 1, 2006, the Company completed the sale of 100% of the shares of its wholly-owned subsidiary, Coeur Silver Valley Inc., to US Silver Corporation for $15 million in cash and additional consideration received of $1.1 million for working capital.
(B) Balance represents acquisition cost of mineral interest.
(C) On December 31, 2007, the Company completed its acquisition of all of the shares of Bolnisi and Palmarejo in exchange for a total of approximately 272 million shares of Coeur common stock and a total cash payment of approximately $1.1 million.The total consideration paid was $1.1 billion and assumed liabilities were $0.7 billion. (D) During the third quarter of 2005, the Company commenced construction activities at its Kensington property. The costs incurred subsequent to commencing construction were capitalized as developmental properties.
F-21
(D)(E)During the fourth quarter of 2004, the Company commenced construction activities at its San BartolomeBartolomé property. The costs incurred subsequent to commencing construction were capitalized as developmental properties.
F-22
Operational Mining Properties Rochester Mine: The Company has conducted operations at the Rochester Mine, located in Western Nevada, since September 1986. The mine utilizes the heap-leaching process to extract both silver and gold from ore mined using open pit methods. Rochester’s primary product is silver with gold produced as a by-product. Cerro Bayo Mine: The Cerro Bayo Mine is a gold and silver underground mine located in southern Chile. Commercial production commenced on April 18, 2002. Martha Mine: The Martha Mine is an underground silver mine located in Argentina, approximately 270 miles southeast of Coeur’s Cerro Bayo mine. Coeur acquired a 100% interest in the Martha mine in April 2002. In July 2002, Coeur commenced shipment of ore from the Martha mine to the Cerro Bayo facility for processing. In December 2007, the Company completed a 240 tonne per day flotation mill which produces a flotation concentrate.
Mineral Interests Endeavor Mine: On May 23, 2005, the Company acquired all of the silver production and reserves, up to a maximum 17.7 million payable ounces, contained at the Endeavor Mine in Australia, which is owned and operated by Cobar Operations Pty. Limited (“Cobar”), a wholly-owned subsidiary of CBH Resources Ltd. (“CBH”), for $39.1$43.8 million. The Company is entitled to all of the silver production and reserves up to a maximum of 17.7 million payable ounces. The Endeavor Mine is located 720 km northwest of Sydney in New South Wales and has been in production since 1983. Under the terms of the original agreement, CDE Australia, a wholly-owned subsidiary of Coeur, paid Cobar $15.1$15.4 million of cash at the closing. In addition, CDE Australia, subject to certain conditions, will pay Cobar approximately $23.7$26.3 million upon the receipt of a report confirming that the reserves at the Endeavor mine are equal to or greater than the reported ore reserves for 2004. Payment couldwill occur in 2007.2008. In addition to these upfront payments, pursuant to the original agreement, Coeur pays Cobar an operating cost contribution of $1.00 for each ounce of payable silver plus a further increment which was to begin when the silver price exceeds $5.23 per ounce. This further increment was to begin on the second anniversary of the agreement and would have been 50% of the amount by which the silver price exceeds $5.23 per ounce. A cost contribution of $0.25 per ounce is also payable by Coeur in respect of new ounces of proven and probable silver reserves as they are discovered. The Company has paid a cost contribution of approximately $2.1 million during 2007.
On March 28, 2006, CDE Australia Pty, Ltd. (CDE Australia), reached an agreement with CBH Resources Ltd. to modify the terms of the original silver purchase agreement. Under the modified terms, CDE Australia owns all silver production and reserves up to a total of 20.0 million payable ounces, up from 17.7 million payable ounces in the original agreement. Based on the most recent ore reserve report, the current ore reserve contains approximately 15.314.4 million payable ounces. To date, the Company has received 0.71.4 million payable ounces based on current metallurgical recovery and current smelter contract terms. Expansion of the ore reserve will be required to achieve the maximum payable ounces of silver production as set forth in the modified contract. The silver price-sharing provision is deferred until such time as Coeur has received approximately 2 million cumulative ounces of silver from the mine or June 2007, whichever is later. In addition, the silver price-sharing threshold increased to US$7.00 per ounce, from the previous level of US$5.23 per ounce.F-22
Broken Hill Mine:On September 8, 2005, the Company acquired all of the silver production and reserves, up to a maximum of 17.2 million payable ounces, contained at the Broken Hill mine in Australia, which is owned and operated by Perilya Broken Hill Ltd. (“PBH”) for $36.7$36.9 million. The Broken Hill Mine is located in New South Wales, Australia and is a zinc/lead/silver ore body. Pursuant to the Agreement, the transaction includes up to a maximum of approximately 24.5 million contained ounces (or 17.2 million payable ounces) of silver to be mined by PBH at Broken Hill on the Company’s behalf. In addition, CDE Australia will pay PBH an operating cost contribution of approximately US$2.00 for each ounce of payable silver under the terms of the Agreement and PBH may earn up to US$6.0 million of additional consideration by meeting certain silver production thresholds through 2014. No additional payments were made during 2007, 2006 or 2005.F-23
Non-Producing and Development Properties San Bartolome Project:Bartolomé: On September 9, 1999, the Company acquired EmpressaEmpresa Minera Manquiri (“Manquiri”). Manquiri’s principal asset is the San BartolomeBartolomé project, a silver exploration and development property located near the city of Potosi,Potosí, Bolivia. The San BartolomeBartolomé project consists of silver-bearing gravel deposits which lend themselves to simple surface mining methods. The mineral rights for the San BartolomeBartolomé project are held through long-term joint venture/lease agreements with several local independent mining co-operatives and the Bolivian State owned mining company, (“COMIBOL”). Production from San BartolomeBartolomé is subject to a royalty of 4% payable to the co-operatives and COMIBOL. During 2004, the Company completed an updated feasibility study, obtained all required permits and commenced construction of the San BartolomeBartolomé mine. The Company estimates the cost of constructiontotal capital costs (excluding political risk insurance premiums and capitalized interest) of theat San BartolomeBartolomé mine to be approximately $174 million.$220 million of which $129.2 million had been incurred as of December 31, 2007. During 2006,2007, the Company capitalized $14.6$100.2 million in connection with construction activities at San Bartolome.Bartolomé.
Kensington Project:Kensington: Kensington is a gold property located near Juneau, Alaska. The mine will be an underground gold mine accessed by a horizontal tunnel and will utilize conventional and mechanized underground mining methods. The ore will be processed in a flotation mill that produces a concentrate which will be sold to third party smelters. During 2006,2007, the Company capitalized $121.6$99.0 million in connection with construction activities at Kensington. The company estimatesCompany has expended approximately $269.7 million as of December 31, 2007.Palmarejo: Palmarejo is engaged in the exploration and development of silver and gold properties located in the State of Chihuahua in northern Mexico, and its principal silver and gold properties are collectively referred to as the “Palmarejo project.” The Palmarejo project is currently under development and is expected to commence commercial production in the first half of 2009. The total capital cost of contructionthe project, from the time the Company acquired it on December 21, 2007, is estimated to be approximatly $238approximately $225 million.Discontinued Operations Coeur Silver Valley (Galena) Mine: On June 1, 2006, the Company completed the sale of 100% of the shares of its wholly owned subsidiary Coeur Silver Valley, Inc. to U.S. Silver Corporation for $15 million in cash plus a post-closing working capital adjustment of $1.1 million.NOTE HI — LONG-TERM DEBT11/1 ¼%4% Debentures
The $180.0 million principal amount of 1 ¼%1/4% Debentures due 2024 outstanding at December 31, 20062007 are convertible into shares of common stock at the option of the holder on January 15, 2011, 2014, and 2019, unless previously redeemed, at a conversion price of $7.60 per share, subject to adjustment in certain events.F-23
The Company is required to make semi-annual interest payments on the debentures. The debentures are redeemable at the option of the Company before January 18, 2011, if the closing price of the Company’s common stock over a specified number of trading days has exceeded 150% of the conversion price, and anytime thereafter. Before January 18, 2011, the redemption price is equal to 100% of the principal amount of the notes plus an amount equal to 8.75% of the principal amount of the notes, less the amount of any interest actually paid on the notes on or prior to the redemption date. The debentures have no other funding requirements until their maturity on January 15, 2024.F-24
The fair value of the debentures is determined by market transactions on or near December 31, 20062007 and 2005,2006, respectively. The fair value of the debentures, as of December 31, 2007 and 2006, was $156.6 million and 2005, was $163.8 million, and $146.7 million, respectively. Total interest expense on debentures and notes for the year ended December 31, 2007, 2006, and 2005 and 2004 was $2.3 million, of which $2.3 million was capitalized as a cost of certain properties under development in 2007; $2.3 million, of which $1.4 million was capitalized as a cost of certain properties under development in 2006,2006; and $2.3 million, of which $0.2 million was capitalized as a cost of certain properties under development in 2005, and $2.9 million, of which $0.1 million was capitalized as a cost of certain properties under development in 2004, respectively. Interest paid was $2.3 million in 2006,2007, $2.3 million in 2005,2006, and $1.6$2.3 million in 2004.2005.
Bridging Debt Facility On October 22, 2007, Bolnisi entered into a $20 million credit facility with Macquarie Bank Limited to fund further exploration and development of the Palmarejo silver/gold project, surrounding exploration areas and for working capital purposes. The credit facility was extended to June 30, 2008 and bears interest at a variable rate (LIBOR) plus a margin of 2.45%. As of December 31, 2007, the Company has $20 million outstanding under the credit facility bearing an interest rate of 7.35%. Events of default under the credit facility include customary provisions for similar types of facilities.Bank Loan On August 30, 2007 (with amendment dated October 9, 2007), Palmarejo entered into a temporary credit facility of $2.0 million secured by the Company’s investments in Asset Backed Commercial Paper, to fund working capital requirements. The credit facility has been extended through May 31, 2008. As of December 31, 2007, an amount of $1.7 million has been drawn on the facility, which bears interest at prime less 1.50% and matures on May 31, 2008. The Company is required to reduce the amount of the outstanding credit facility with any proceeds received from the sale of the Asset Backed Commercial Paper.NOTE IJ — RECLAMATION AND REMEDIATION COSTS Reclamation and remediation costs are based principally on legal and regulatory requirements. Management estimates costs associated with reclamation of mining properties as well as remediation costs for inactive properties. The Company uses assumptions about future costs, mineral prices, mineral processing recovery rates, production levels and capital and reclamation costs. Such assumptions are based on the Company’s current mining plan and the best available information for making such estimates. On an ongoing basis, management evaluates its estimates and assumptions; however, actual amounts could differ from those based on such estimates and assumptions. The Asset Retirement Obligationasset retirement obligation is measured using the following factors: 1) Expected labor costs, 2) Allocated overhead and equipment charges, 3) Contractor markup, 4) Inflation adjustment, and 5) Market risk premium. The sum of all these costs is discounted, using the Company’s credit adjusted risk-free interest rate from the time we expect to pay the retirement obligation to the time we incur the obligation. The measurement objective is to determine the amount a third party would demand to assume the asset retirement obligation.F-24
Upon initial recognition of a liability for an asset retirement obligation, the Company capitalized the asset retirement cost as an increase in the carrying amount of the related long-lived asset. The Company depletes this amount using the units-of-production method. The Company is not required to re-measure the obligation at fair value each period, but the Company is required to evaluate the cash flow estimates at the end of each reporting period to determine whether the estimates continue to be appropriate. Upward revisions in the amount of undiscounted cash flows are discounted using a current credit-adjusted risk-free rate. Downward revisions are discounted using the credit-adjusted risk-free rate that existed when the original liability was recorded.recorded, or, if not readily determinable, at the weighted average discount rate used to record the liability.
At December 31, 2007 and 2006, $33.1 million and 2005, $29.9 million, and $23.5 million, respectively, werewas accrued for reclamation obligations related to currently producing and developmental mineral properties. In addition, the Company has accrued $1.8$1.7 million and $1.2$1.8 million, respectively, for reclamation obligations associated with former mining activities. These amounts are also included in reclamation and mine closure liabilities. In the fourth quarter of 2007, the Company reviewed its cash flow estimates for its asset retirement obligations. This resulted in a net increase to the asset retirement obligation of $3.4 million and a corresponding increase to the carrying amount of the asset to be retired. For the purpose of consolidated statement of cash flows, these amounts are non-cash transactions. The increase was due to additional reclamation required at the Company’s Cerro Bayo mine, Kensington project and San Bartolomé project. The increase was discounted using the Company’s current weighted average credit adjusted risk-free rate of 9.34%. In the fourth quarter of 2006, the Company reviewed its cash flow estimates for its asset retirement obligations. This resulted in a net increase to the asset retirement obligation of $6.1 million and a corresponding increase to the carrying amount of the asset to be retired. For the purpose of consolidated statement of cash flows, these amounts are non-cash transactions. The increase was due to additional reclamation required at the Company’s Rochester mine, Kensington and San Bartolome projects. The increase was discounted using the Company’s current weighted average credit adjusted risk-free rate of 7.6%. In the fourth quarter of 2005, the Company reviewed its cash flow estimates for its asset retirement obligations. This resulted in a net increase to the asset retirement obligation of $6.4 million and a corresponding increase to the carrying amount of the asset to be retired. For the purpose of consolidated statement of cash flows, these amounts are non-cash transactions. The increase was due to additional reclamation required as a result of the expansion of the Company’s Cerro Bayo mine and adjustments to future estimated costs at the Company’s Rochester mine, Kensington project and San BartolomeBartolomé project. The increase was discounted using the Company’s current weighted average credit adjusted risk-free rate of 7.79%7.6%.
F-25
The following is a description of the changes to the Company’s asset retirement obligations for the years ended December 31, 2007 and 2006 and 2005:(in thousands): Years Ended December 31, 2007 2006 Asset retirement obligation — January 1 $ 29,909 $ 23,524 Accretion 2,260 1,780 Additions 3,390 6,069 Changes in estimates (1,202 ) (507 ) Settlements (1,222 ) (957 ) Asset retirement obligation — December 31 $ 33,135 $ 29,909
F-25
Year Ended December 31, 2006
2005
(in thousands) Asset retirement obligation - January 1 $ 23,524 $ 16,921 Accretion 1,780 1,265 Additions 6,069 6,397 Changes in estimates (507 ) (74 ) Settlements (957 ) (985 )
Asset retirement obligation - December 31 $ 29,909 $ 23,524
NOTE JK — INCOME TAXESIncome (loss)
The components of income from continuing operations before income taxes iswere as follows:Year Ended December 31, 2006
2005
2004
(in thousands) United States $ 33,252 $ (5,576 ) $ (22,281 ) Foreign 50,393 21,805 (1,540 )
Total $ 83,645 $ 16,229 $ (23,821 )
follows (in thousands):
Years Ended December 31, 2007 2006 2005 United States $ 21,909 $ 33,252 $ (5,576 ) Foreign 36,908 50,393 21,805 Total $ 58,817 $ 83,645 $ 16,229
The components of the consolidated income tax (provision) benefitprovision from continuing operations were as follows:Years Ended December 31,
2006
2005
2004
Current: United States - Alternative minimum tax $ (900 ) $ 212 $ 1,382 United States - Foreign withholding (713 ) -- -- Foreign - Argentina (4,842 ) (66 ) -- Foreign - Australia (4,673 ) -- -- Deferred: Foreign - Argentina 65 929 -- Foreign - Australia (93 ) (404 ) -- Foreign - Chile 2,930 (2,154 ) 4,403
Income tax benefit (provision) $ (8,226 ) $ (1,483 ) $ 5,785
follows (in thousands):
Years Ended December 31, 2007 2006 2005 Current: United States — Alternative minimum tax $ (381 ) $ (900 ) $ 212 United States — Foreign withholding tax (904 ) (713 ) — Foreign — Argentina (6,590 ) (4,842 ) (66 ) Foreign — Australia (4,898 ) (4,673 ) — Deferred: Foreign — Argentina 172 65 929 Foreign — Australia (664 ) (93 ) (404 ) Foreign — Chile (1,662 ) 2,930 (2,154 ) Income tax provision $ (14,927 ) $ (8,226 ) $ (1,483 )
A reconciliation of the Company’s effective tax rate with the federal statutory tax rate for the periods indicated is as follows:Years Ended December 31 2006
2005
2004
Tax benefit (provision) from continuing operations $ (29,276 ) $ (5,680 ) $ 8,337 State tax benefit (provision) from continuing operations (2,509 ) (487 ) 715 Excess percentage depletion and related deductions 6,199 4,265 3,698 Change in valuation allowances 14,778 (5,555 ) (9,474 ) Effect of foreign earnings 4,744 4,744 1,346 US and foreign non-deductible expenses (1,059 ) 632 610 Foreign currency exchange rates -- 827 -- Other net (1,103 ) (229 ) 553
$ (8,226 ) $ (1,483 ) $ 5,785
Years Ended December 31 2007 2006 2005 Tax provision from continuing operations $ (20,600 ) $ (29,276 ) $ (5,680 ) State tax provision from continuing operations (1,766 ) (2,509 ) (487 ) Percentage depletion and related deductions 4,860 6,199 4,265 Change in valuation allowance 3,896 14,778 (5,555 ) U.S. and Foreign non-deductible expenses (663 ) (711 ) 632 Foreign tax rate differences 2,309 4,744 4,744 Foreign withholding taxes (904 ) (713 ) — Other, net (2,059 ) (738 ) 598 $ (14,927 ) $ (8,226 ) $ (1,483 )
F-26
As of December 31, 20062007 and 2005,2006, the significant components of the Company’s deferred tax assets and liabilities were as follows:Years Ended December 31, 2006
2005
Deferred tax liabilities: Property, plant and equipment , net $ 7,318 $ 7,665 Investments in foreign subsidiaries 9,761 471
17,079 8,136
Deferred tax assets: Mineral properties 62,284 66,664 Net operating loss carryforwards 68,794 88,130 Alternative minimum tax credit 2,479 1,246 carryforwards Investments in foreign subsidiaries 8,129 404 Capital loss carryforwards 12,864 5,672 Other 6,197 3,173
160,747 165,289 Valuation allowance (137,992 ) (154,379 )
22,755 10,910
Net deferred tax assets $ 5,676 $ 2,774
The Company has not had a strong earnings history which would be objective evidence as required by generally accepted accounting principles to recognize its net operating less carryforwards and other deductible temporary differences. It is likely that the alternative minimum tax will exceed the regular tax for the foreseeable future. Accordingly, the Company has recorded a valuation allowance of $138.0 million as of December 31, 2006, which includes a full valuation allowance against the $2.5 million minimum tax credit carryforward, which is available for an unlimited carryforward period to offset regular federal income tax in excess of the alternative minimum tax. The Company has reviewed its domestic and foreign deferred tax assets and, except for approximately $6.2 million deferred tax assets related to the Company’s Cerro Bayo and Martha mines, has not recognized the potential tax benefits in other jurisdictions because at this time management believes that the realization of such benefits in future periods does not meet the more likely than not criteria.follows (in thousands):
Years Ended December 31 2007 2006 Deferred tax liabilities: Mineral properties $ 552,007 $ — Investment in foreign subsidiaries 18,430 9,761 Property, plant and equipment, net 2,836 3,580 573,273 13,341 Deferred tax assets: Net operating loss carryforwards 111,996 80,869 Investment in foreign subsidiaries 16,331 8,129 Capital loss carryforwards 10,305 12,897 Asset retirement obligation 10,234 9,914 Unrealized foreign currency loss and other 8,651 — Accrued expenses 3,330 2,345 Alternative minimum tax credit carryforwards 2,520 2,139 Inventory 1,523 4,274 Mineral properties — 53,290 164,890 173,857 Valuation allowance (160,898 ) (154,840 ) 3,992 19,017 Net deferred tax assets (liabilities) $ (569,281 ) $ 5,676
The Company has evaluated the amount of taxable income and periods over which it must be earned to allow for realization of itsthe deferred tax assets. Based onupon this analysis, the Company determined it is more likely than not that over the next two years pretax book income in Chile and Argentina where the future tax rate is 17% and 35%, respectively, is sufficient for recognition of $6.2 million ofnet deferred tax assets.assets of $1.1 million and $3.5 million will be realized in Argentina and Chile, respectively. Thus, the Company has recorded valuation allowances as follows (in thousands): Years Ended December 31 2007 2006 U.S. $ 111,685 $ 122,101 Argentina 1,966 1,130 Australia 7,282 — Canada 8,220 — New Zealand 30,999 30,778 Chile and other 746 831 $ 160,898 $ 154,840
The Company monitorscontinues to monitor the valuation allowance each quarterquarterly, and makeswill make the appropriate adjustments as necessary. The Company adopted the provisions of FASB Interpretation No. 48, “Accounting for Uncertainty in Income Taxes,” (FIN 48) an interpretation of FASB Statement No. 109, “Accounting for Income Taxes” on January 1, 2007. FIN 48 clarifies the criteria that an individual tax position must satisfy for some or all of the benefits of that position to be recognized in a company’s financial statements. FIN 48 prescribes a recognition threshold of more likely than not, and a measurement attribute for all tax positions taken or expected to be taken on a tax return. The Company determined that FIN 48 had no impact on the financial statements, and as a result, did not record any cumulative effect adjustment related to the allowance as appropriate based primarily upon continued developmentadoption of anFIN 48.F-27
The Company files income tax returns in the US federal jurisdiction, various US states and in certain foreign jurisdictions. To the extent there are loss carryovers in any such jurisdictions, the statute of limitations generally remains open. The Company has previously determined the earnings historyfrom certain foreign jurisdictions were not indefinitely reinvested. Accordingly, the Company has recognized deferred taxes and projected future earnings.withholding taxes related to those jurisdictions where the subsidiary’s net equity determined for financial reporting purposes exceeds tax basis.
During the first quarter of 2006,2007, the Company incurred anotheran ownership change which generally limits the availability of existing tax attributes, including net operating loss carryforwards to reduce future taxable income. The Company will be limited from utilizing tax attributes to reduce future taxable income or tax liabilities. Therefore, the Company has the following tax attribute carryforwards as of December 31, 2006:U.S.
Chile
New Zealand
Other
Total
Regular net operating losses $86,004 $30,464 $93,267 $444 $210,179 Alternative minimum tax net operating losses 53,651 -- -- -- 53,651 Capital losses 33,853 -- -- -- 33,853 Alternative minimum tax credits 2,180 -- -- -- 2,180 Foreign tax credits 299 -- -- -- 299
2007 (in thousands):
New U.S. Chile Mexico Canada Australia Zealand Other Total Regular net operating losses $ 110,286 $ 22,110 $ 109,600 $ 5,653 $ 6,389 $ 93,936 $ 2,487 $ 350,461 Alternative minimum tax net operating losses 26,946 — — — — — — 26,946 Capital losses 19,339 — — — 9,855 — — 29,194 Alternative minimum tax credits 2,520 — — — — — — 2,520
The U.S. net operating losses expire in 2011from 2016 through 2025 and the Canada net operating losses expire from 2025 through 2027. The Mexico net operating losses expire in 2017 and 2018, while the foreign countryremaining net operating losses from the foreign jurisdictions have an indefinite carryforward period. The U.S. capital losses expire from 2008 through 2012 while the Australia capital losses generally have an indefinite carryforward period. The Company’s capital losses expire in 2007 through 2011; alternativeAlternative minimum tax credits have an indefinite carryforward period and the foreign tax credits generally expire in 2026.F-27
do not expire.
NOTE KL — SHAREHOLDERSSHAREHOLDER’S EQUITY On May 11, 1999, the Company’s shareholders adopted a new shareholder rights plan (the “Plan”). The Plan entitles each holder of the Company’s common stock to one right. Each right entitles the holder to purchase one one-hundredth of a share of newly authorized Series B Junior Preferred Stock at an exercise price of $100. The rights will not be distributed and become exercisable unless and until ten business days after a person acquires 20% of the outstanding common shares or commences an offer that would result in the ownership of 30% or more of the shares. Each right also carries the right to receive upon exercise that number of Coeur common shares which has a market value equal to two times the exercise price. Each preferred share issued is entitled to receive 100 times the dividend declared per share of common stock and 100 votes for each share of common stock and is entitled to 100 times the liquidation payment made per common share. The Board may elect to redeem the rights prior to their exercisability at a price of $0.01 per right. The new rights will expire on May 24, 2009, unless earlier redeemed or exchanged by the Company. Any preferred shares issued are not redeemable. At December 31, 20062007 and 2005,2006, there were a total of 277,995,133550,453,019 and 249,902,142277,995,133 rights outstanding, respectively, which was equal to the number of outstanding shares of common stock.Stock Issues During 2006
During the first quarter of 2006, the Company completed a public offering of 27.6 million shares of common stock at a public offering price of $5.60 per share. The Company realized net proceeds of $146.2 million after payment of the underwriters’ discount. Offering costs incurred were $8.3 million.Stock Issues During 2005
During the third quarter of 2005, the Company completed a public offering of 9.9 million shares of common stock at a public offering price of $3.70 per share. The Company realized total net proceeds from the offering, after payment of the underwriters’ discount, of approximately $35.9 million. Offering costs incurred were $0.6 million.F-28
Stock Issues During 2004
During the fourth quarter of 2004, the Company completed a public offering of 26.6 million shares of common stock at a public offering price of $4.50 per share, which included 1.6 million shares purchased by the underwriters at the offering price to cover over allotments. The Company realized total net proceeds from the offering, after payment of the underwriters’ discount, of approximately $113.1 million. Offering costs incurred were $6.7 million.
NOTE LM — STOCK-BASED COMPENSATION PLANS The Company has an Annual Incentive Plan, a Long-Term Incentive Plan (the “2003 Long-Term Incentive Plan”) and a Directors’ Plan (the “Directors’ Plan”). Total employee compensation expense charged to operations and capital projects under these Plans was $4.6$6.3 million, $3.9$4.7 million and $2.8$3.8 million for 2007, 2006 and 2005, and 2004, respectively. Annual Incentive Plan Under the Annual Incentive Plan, the Board of Directors may annually approve cash-based awards to the executive officers and key management employees based on certain Company and employee performance measures. Cash payments for 2007, 2006 2005 and 20042005 amounted to $2.6 million, $2.2 million and $2.7 million, and $2.0 million, respectively.F-28
1989 Long-Term Incentive Plan Under the 1989 Long-Term Incentive Plan, as amended by shareholders in 1995, the Company may grant non-qualified and incentive stock options that are exercisable at prices equal to the fair market value of the shares on the date of grant and vest cumulatively at an annual rate of one third during the three-year period following the date of grant. In addition to stock options, the Company’s 1989 Long-Term Incentive Plan provides for grants of stock appreciation rights (SAR’s)(SARs), restricted stock, restricted stock units, performance shares, performance units, cash based awards, and stock based awards. The number of shares authorized to be issued under this plan was 2.9 million shares. There were 0.6 million shares reserved for issuance under this plan at December 31, 20062007 for stock options previously awarded. No further awards will be made under this plan. 2003 Long-Term Incentive Plan The 2003 Long-Term Incentive Plan (the “LTIP”) was approved by our shareholders on May 20, 2003, and replaced our prior 1989 Long-Term Incentive Plan. Under the plan, we may grant nonqualified stock options, incentive stock options, stock appreciation rights (“SARs”), restricted stock, restricted stock units, performance shares, performance units, cash-based awards and other stock-based awards to our executive officers. The number of shares authorized for grant under this plan was 6.8 million shares. There were 6.25.8 million shares reserved for issuance under this plan at December 31, 2006.2007. Of the 6.25.8 million shares, 4.94.1 million shares can be issued for future grants. There are 1.01.3 million options and 0.20.4 million performance shares outstanding under these plans. Directors Plan On June 3, 2005, the Company’s shareholders approved the 2005 Non-Employee Directors’ Equity Incentive Plan and authorized 500,000 shares of common stock for issuance under the plan. During 2007 and 2006, 59,476 and 2005, 35,042 and 35,996 shares were issued in lieu of $0.2$0.3 million and $0.1$0.2 million, respectively, of Directors’ fees. At December 31, 2006, 0.4 million2007, 400,000 shares are reserved for issuance under this plan. Under the previous Directors’ plan, options were granted only in lieu of annual directors’ fees. For the year ended December 31, 2004, a total of 40,318 options had been granted in lieu of directors’ fees of $0.1 million. At December 31, 2006, 0.5 million2007, 500,000 shares are reserved for issuance under this plan for stock options previously awarded. No further grants will be made under this plan.F-29
As of December 31, 20062007 and 2005,2006, options to purchase 2,089,6502,281,595 shares and 2,218,6292,089,650 shares of common stock, respectively, were outstanding under the Long-Term and the Directors’ Plans described above. The options are exercisable at prices ranging from $0.74 to $17.94$8.94 per share. Stock options granted under the Company’s incentive plans vest over three years and are exercisable over a period not to exceed 10 years from the grant date. Exercise prices are equal to the fair market value of the shares on the date of the grant. The value of each option award is estimated on the date of the grant using the Black-Scholes option pricing model. Restricted stock is granted at the fair market value of the underlying shares on the date of grant and vest in equal installments annually over three years. Holders of the restricted stock are entitled to vote the shares and to receive any dividends declared on the shares. Performance shares also are granted at the fair market value of the underlying shares on the date of grant. Compensation costs ultimately recognized are equal to the grant date fair value. Vesting is contingent on meeting certain performance measuresmarket conditions based on relative total shareholder return. The performance shares vest at the end of the three-year service period. Performance shares granted underperiod if the plan assume that the performance measure will be achieved. If such performance measuresmarket conditions are not met, no furthermet. The existence of a market condition requires recognition of compensation cost regardless of whether the market condition is recognized and if determined improbable of achieving the performance measures any previously recognized compensation is reversed.F-29
ever satisfied.
Effective January 1, 2006, the Company began recording compensation expense associated with awards of equity instruments in accordance with Statement of Financial Accounting Standards (“SFAS”)SFAS No. 123(R), “Share-Based Payment”. Prior to January 1, 2006, the Company accounted for awards of equity instruments according to the provisions of SFAS No. 123 and related interpretations, and therefore no related compensation expense was recorded for awards granted with no intrinsic value. The Company adopted the modified prospective transition method provided for under SFAS No. 123(R), and, consequently, has not retroactively adjusted results fromfor prior periods. Under this transition method, compensation cost associated with awards of equity instruments recognized in 2006 includes: 1) amortization related to the remaining unvested portion of all awards granted for the fiscal years 1995 to 2005, based on the grant date fair value, estimated in accordance with the original provisions of SFAS No. 123, “Accounting for Stock-Based Compensation”; and 2) amortization related to all equity instruments awards granted subsequent to December 31, 2005, based on the grant-date fair value estimated in accordance with the provisions of SFAS No. 123(R). The compensation cost is included in administrative and general expenses, production costs and the cost of self-constructed property, plant and equipment as deemed appropriate. Prior to the Company’s adoption of SFAS No. 123(R), benefits of tax deduction in excess of recognized compensation costs were reported as operating cash flows. SFAS No. 123(R) requires excess tax benefits be reported as a financing cash inflow rather than as a reduction of taxes paid. There were no significant excess tax benefits for the years ended December 31, 2007, 2006 2005 and 2004.2005.
The compensation expense recognized in the Company’s consolidated financial statements for the year ended December 31, 2007, 2006 2005 and 20042005 for awards of equity instruments was $2.2$3.7 million, $2.5 million and $1.2 million, respectively, of which $0.2 million, $0.3 million, and $1.1$0 million, respectively.respectively, was capitalized as part of mine development activities. As of December 31, 2006,2007, there was $1.8$1.7 million of total unrecognized compensation cost (net of estimated forfeitures) related to unvested stock options, restricted stock grants and performance share grants which is expected to be recognized over a weighted-average vesting period of 2.0 years. The Company continues to estimate the fair value of each stock option award on the date of grant using the Black-Scholes option valuation model. The Company now estimates forfeitures of stock-based awards based on historical data and adjusts the forfeiture rate periodically. The adjustment of the forfeiture rate will result in a cumulative adjustment in the period the forfeiture estimate is changed. During the year ended December 31, 2006, the Company recorded an adjustment of $0.1 million to reduce compensation expense for forfeited awards.F-30
The impact of adopting SFAS No. 123(R) as of January 1, 2006 resulted in a decrease in net income of $1.4 million, or less than $0.01 per basic and diluted share for the year ended December 31, 2006. The impact of adoption excludes the amortization of restricted stock awards in the amount of $1.1 million for the year ended December 31, 2006. Compensation expense related to the amortization of restricted stock awards was recognized prior to the implementation of SFAS No. 123(R). Cash received from share options exercised under the Long-Term Incentive Plan for the years ended December 31, 2007, 2006 and 2005 and 2004 were $0.2 million, $0.8 million $0.1 million and $0.3$0.1 million, respectively, and is reflected as an other financing activity in the Company’s consolidated statements of cash flows. The adjustment of the forfeiture rate resulted in a cumulative adjustment in the period the forfeiture estimate is charged. During the year ended December 31, 2006, the Company recorded an adjustment of $0.1 million to reduce compensation expense for forfeiture awards.
The following pro-forma information, as required by SFAS No. 148, “Accounting for Stock-Based Compensation-Transition and Disclosure an amendment of FASB Statement No. 123,” is presented for comparative purposes and illustrates the effect on net income per common share for the periodsperiod presented as if the Company had applied the fair value recognition provisions of SFAS No. 123(R) to stock-based employee compensation prior to December 31, 2005.F-30
Year Ended December 31,
2005
2004
(in thousands except per share data)
Net income (loss) as reported $ 10,551 $ (16,858 ) Add: Stock-based employee compensation expense included in reported net income 1,237 1,137 Less: Stock-based employee compensation expense determined under fair value for all awards (2,316 ) (2,017 )
Net income (loss) - Pro forma $ 9,472 $ (17,738 )
Net income (loss) per share: Basic and diluted - As reported $ 0.04 $ (0.08 )
Basic and diluted - Pro forma $ 0.04 $ (0.08 )
Year Ended December 31, 2005 (in thousands, except per share data) Net income as reported $ 10,551 Add: Stock-based employee compensation expense included in reported net income 1,237 Less: Stock-based employee compensation expense determined under fair value for all awards (2,316 ) Net income — Pro forma $ 9,472 Net income per share: Basic and diluted — As reported $ 0.04 Basic and diluted — Pro forma $ 0.04
The weighted average fair value of stock options on the date of grant, and the assumptions used to estimate the fair value of the stock options using the Black-Scholes option valuation model were as follows:Year Ended December 31, 2006
2005
2004
Weighted average fair value of options granted $3.35 $2.53 $4.83 Expected volatility 68.5% 68.5% 75.7% Expected life 6 years 6 years 6 years Risk-free interest rate 4.6% 3.9% 3.3% Expected dividend yield 0.0% 0.0% 0.0%
Years Ended December 31, 2007 2006 2005 Weighted average fair value of options granted $ 2.35 $ 3.35 $ 2.53 Expected volatility 58.9 % 68.5 % 68.5 % Expected life 6 years 6 years 6 years Risk-free interest rate 4.5 % 4.6 % 3.9 % Expected dividend yield 0.0 % 0.0 % 0.0 %
The expected volatility of the option is determined using historical volatilities based on historical stock prices. The Company estimated the expected life of options granted using the midpoint between the vesting date and the original contractual term. The risk free rate was determined using the yield available on U.S. Treasury Zero-coupon issues with a remaining term equal to the expected life of the option. The Company has not paid dividends on its common stock since 1996.F-31
The following table summarizes stock option activity during the years ended December 31, 2004, 2005, 2006 and 2006:Shares
Weighted Average
Exercise Price
Stock options outstanding at December 31, 2003 1,650,054 $2.11 Granted 333,250 $6.95 Exercised (169,527 ) $1.69 Canceled/expired (16,869 ) $6.32
Stock options outstanding at December 31, 2004 1,796,908 $3.01 Granted 566,149 $3.92 Exercised (52,007 ) $1.61 Canceled/expired (92,421 ) $5.69
Stock options outstanding at December 31, 2005 2,218,629 $3.16 Granted 332,169 $5.14 Exercised (395,723 ) $1.99 Canceled/expired (65,425 ) $7.65
Stock options outstanding at December 31, 2006 2,089,650 $3.56
F-31
2007:
Weighted Average Shares Exercise Price Stock options outstanding at December 31, 2004 1,796,908 $ 3.01 Granted 566,149 $ 3.92 Exercised (52,007 ) $ 1.61 Cancelled/expired (92,421 ) $ 5.69 Stock options outstanding at December 31, 2005 2,218,629 $ 3.16 Granted 332,169 $ 5.14 Exercised (395,723 ) $ 1.99 Canceled/expired (65,425 ) $ 7.65 Stock options outstanding at December 31, 2006 2,089,650 $ 3.56 Granted 462,015 $ 3.99 Exercised (56,167 ) $ 3.29 Canceled/expired (213,903 ) $ 5.99 Stock options outstanding at December 31, 2007 2,281,595 $ 3.42
Options exercisable at December 31, 2007, 2006 and 2005 were for 1,598,685, 1,413,117, and 2004 were 1,413,117, 1,562,217 and 1,509,217,shares, respectively, with a weighted average exercise price of $3.06, $2.95 and $2.53, and $2.25, respectively. The following table summarizes information for options currently outstanding at December 31, 2006:Options Outstanding
Options Exercisable
Range of
Exercise
Price
Number
Outstanding
Weighted
Average
Exercise
Price
Weighted
Average
Remaining
Contractual
Life (Years)
Number
Exercisable
Weighted
Average
Exercise
Price
Weighted
Average
Remaining
Contractual
Life (Years)
$0.74 to $1.22 442,641 $0.80 4.77 442,641 $0.80 4.77 $1.23 to $1.85 336,525 $1.75 5.67 336,525 $1.75 5.67 $1.86 to $2.63 111,502 $2.10 5.90 111,502 $2.10 5.90 $2.64 to $3.92 537,089 $3.86 7.50 248,767 $3.78 6.77 $3.93 to $7.09 624,288 $6.00 7.96 236,077 $6.81 6.62 $7.10 to $17.94 37,605 $11.68 0.57 37,605 $11.68 0.57
2,089,650 $3.56 6.55 1,413,117 $2.95 5.62
2007:
Options Outstanding Options Exercisable Weighted Weighted Weighted Average Weighted Average Range of Average Remaining Average Remaining Exercise Number Exercise Contractual Number Exercise Contractual Price Outstanding Price Life (Years) Exercisable Price Life (Years) $0.74 to $1.22 442,641 $ 0.80 3.77 442,641 $ 0.80 3.77 $1.23 to $1.85 320,420 $ 1.75 4.67 320,420 $ 1.75 4.67 $1.86 to $2.63 111,502 $ 2.10 4.90 111,502 $ 2.10 4.90 $2.64 to $3.92 497,135 $ 3.85 6.45 362,061 $ 3.83 6.19 $3.93 to $5.14 661,175 $ 4.47 8.51 113,339 $ 5.06 6.72 $5.15 to $8.94 248,722 $ 7.19 5.60 248,722 $ 7.19 5.60 2,281,595 $ 3.42 6.11 1,598,685 $ 3.06 5.07
As of December 31, 2006,2007, the total future compensation cost related to non-vested options not yet recognized in the statement of income was $0.6$1.7 million and the weighted average period over which these awards are expected to be recognized was 2 years. The total intrinsic value of share options exercised during the year ended December 31, 2007, 2006 and 2005 and 2004 was $0.04 million, $1.6 million $0.1 million and $0.3$0.1 million, respectively. At December 31, 2006,2007, the total intrinsic value was $3.8$4.1 million and $3.5$3.6 million for stock options outstanding and exercisable, respectively.F-32
The following table summarizes restricted stock activity during the years ended December 31, 2004, 2005, 2006 and 2006:Number of
Shares
Weighted Average
Grant Date Fair
Value
Outstanding at December 31, 2003 1,115,000 $1.28 Granted 236,070 $6.39 Vested (371,673 ) $1.28 Forfeited (168,399 ) $2.09
Outstanding at December 31, 2004 810,998 $2.60 Granted 359,640 $3.94 Vested (433,623 ) $2.30 Forfeited (75,634 ) $4.58
Outstanding at December 31, 2005 661,381 $3.30 Granted 220,894 $5.14 Vested (445,025 ) $2.71 Forfeited (24,218 ) $4.83
Outstanding at December 31, 2006 413,032 $4.83
2007:
Weighted Number of Average Grant Shares Date Fair Value Outstanding at December 31, 2004 810,998 $ 2.60 Granted 359,640 $ 3.94 Vested (433,623 ) $ 2.30 Forfeited (75,634 ) $ 4.58 Outstanding at December 31, 2005 661,381 $ 3.30 Granted 220,894 $ 5.14 Vested (445,025 ) $ 2.71 Forfeited (24,218 ) $ 4.83 Outstanding at December 31, 2006 413,032 $ 4.83 Granted 497,990 $ 3.99 Vested (241,784 ) $ 4.82 Forfeited (66,043 ) $ 4.30 Outstanding at December 31, 2007 603,195 $ 4.20
The fair value of restricted stock is determined based on the closing stock price on the grant date. As of December 31, 2006,2007, there was $0.6 million of total unrecognized compensation cost related to restricted awards to be recognized over a weighted-averageweighted average period of 1.92.1 years.F-32
The following table summarizes performance shares activity during the year ended December 31, 2006:Number of
Shares
Weighted Average
Grant Date Fair
Value
Outstanding at December 31, 2005 -- $-- Granted 220,894 5.14 Exercised -- -- Forfeited (10,449 ) 5.14
Outstanding at December 31, 2006 210,445 $5.14
2007:
Weighted Number of Average Grant Shares Date Fair Value Outstanding at December 31, 2005 — $ — Granted 220,894 5.14 Exercised — — Forfeited (10,449 ) 5.14 Outstanding at December 31, 2006 210,445 $ 5.14 Granted 306,852 3.99 Exercised (30,298 ) 4.48 Forfeited (66,456 ) 4.47 Outstanding at December 31, 2007 420,543 $ 4.45
The fair value of performance shares is determined based on fair value modeling techniques that consider the closing price on the grant date.market and service conditions relevant for these grants. As of December 31, 2006,2007, there was $0.7 million of total unrecognized compensation cost related to performance shares to be recognized over a weighted average period of 2.11.9 years.NOTE M –N — DEFINED BENEFIT PENSION, POST-RETIREMENT MEDICAL BENEFIT, DEFINED CONTRIBUTION AND 401(k) PLANSOn
In June 2006, the Company completed the sale of 100% of the shares of its wholly owned subsidiary Coeur Silver Valley Inc. As a result, the liabilities were assumed by the purchaser and the Company has no longer maintainsfurther obligations related to the defined benefit plan and post retirement medical benefits plan summarized below.Defined Benefit Plan In connection with the acquisition of Coeur Silver Valley acquired in 1999, the Company was required to maintain non-contributory defined benefit pension plans covering substantially all employees. Benefits for salaried plans were based on salary and years of service. Hourly plans were based on negotiated benefits and years of service. The Company’s funding policy was to contribute annually the minimum amount prescribed, as specified by applicable regulations. Prior service costs and actuarial gains and losses were amortized over plan participants’ expected future period of service using the straight-line method.F-33
Actuarial Present Value of Projected Benefit Obligation: The actuarial present value of our projected benefit obligations was determined using the following assumptions:Factor 2005 2004 Discount Rate for Benefit Obligations 5.75% 6.0% Expected Return on Plan Assets 6.0% 6.0% Rate of Compensation Increases 5.0% 5.0%
Factor 2005 Discount Rate for Benefit Obligations 5.75 % Expected Return on Plan Assets 6.0 % Rate of Compensation Increases 5.0 %
Expected rate of return on plan assets: The expected rate of return on plan assets for purposes of the actuarial valuation was assumed to be 6% as of both December 31, 2005 and 2004.2005. The rate of return used was based on the plan’s experience and asset mix of the portfolio, as well as taking into consideration the fact that no lump sum distributions were paid from the plan. The plan had an expected return on plan assets of $0.3 million and $0.2 million for 2005 and 2004, respectively.2005. The actual return on plan assets was $0.2 million and $0.3 million for 2005 and 2004, respectively.2005. The discount rate was determined based on Moody’s Aaa bond rating.F-33
Plan assets and determination of fair value: The fair value of plan assets was determined using the market value of the investments held by the plan at December 31 of each year as quoted by public equity and bond markets. The asset mix iswas in accordance with the plan’s investment policy which allowed for 60% equity investments, 35% fixed income investments and 5% cash and cash equivalents. The investment portfolio for the funded portion of the obligation iswas held in a trust. The Company’s funding policy was to contribute amounts to the plan sufficient to meet the minimum funding requirements as set forth in the Employee Retirement Income Security Act of 1974 plus such additional tax deductible amounts as was advisable under the circumstances. The Company had funded $0.4 million through June 1, 2006 (the date of the Coeur Silver Valley sale), and $0.7 million and $0.7 million in 2005, and 2004, respectively, toward the obligation. The plan assets were invested principally in commingled stock funds, mutual funds and securities issued by the United States government. Pursuant to the plan’s investment policy, the plan adoptsadopted more specific investment directives from time to time. The plan’s actual portfolio at December 31, 2005 had 60% equity investments and 40% fixed income investments. Since the performance of each asset class of the portfolio within any measurement period impacted its relative weight in the portfolio, the actual percentage of each asset class in the portfolio may not have matched to the current directive. The expected long-term rates of return for each asset class within the portfolio, and therefore the portfolio weighted average, was based on an estimate of the return for each of the securities within an asset class, currently benchmarked at 10.0% for equity investments, 3.0% for fixed income investments and 2%2.0% for cash and cash equivalents. For each type of investment within the Trust’s portfolio structure, the Trustees evaluated both returns and the relationship between risk and return. The expectation was that each asset class would produce a superior risk-adjusted return over a market cycle.F-34
The following table shows the expected long term rates of return associated with each asset class:Asset Class
Actual Mix
Target Mix
Expected Long
Term Rates of
Return
Equity investments 60 % 60 % 10.00 % Fixed income investments 40 % 35 % 3.00 % Cash and cash equivalents 0 % 5 % 2.00 %
Weighted average 7.15 %
Expected Long Term Actual Target Rates of Asset Class Mix Mix Return Equity investments 60 % 60 % 10.00 % Fixed income investments 40 % 35 % 3.00 % Cash and cash equivalents 0 % 5 % 2.00 % Weighted average 7.15 %
The Trustees evaluated the level of volatility within the total Trust and each of its component investments. The Trustees set maximum volatility thresholds for each class of investment which consisted of 16% for equity investments, 7.25% for fixed income investments and 1% for cash and cash equivalents, with the total portfolio volatility expected to not exceed 11%. The Trustees then compared how these specific investments performed against other indexed funds and other managed portfolios with similar objectives. The specific criteria used to measure the performance was as follows: 1) A targeted 7-11% average annualized return based on long-term historical market data;
2) Expected returns over a market cycle that exceed the total portfolio indexed benchmark;
3) Volatility that was not substantially greater than the portfolio indexed benchmark volatility of 11%; and
4) Risk adjusted returns that were comparable with indexed benchmarks.
F-34
The components of net periodic benefit costs were as follows:follows (in thousands, except for discount rate): For the Year Ended December 31, 2005 Assumptions: Discount rate 5.75 % Components of net periodic benefit cost: Service cost $ 309 Interest cost 464 Expected return on plan assets (261 ) Amortization of prior service cost 59 Recognized actuarial loss 339 Net periodic benefit cost $ 910
F-35
For the Year Ended
December 31,
2006
2005
2004
Assumptions: Discount rate -- 5.75 % 6.0 % Components of net periodic benefit cost: Service cost -- $ 309 $ 319 Interest cost -- 464 412 Expected return on plan assets -- (261 ) (215 ) Amortization of prior service cost -- 59 56 Recognized actuarial loss -- 339 327
Net periodic benefit cost -- $ 910 $ 899
The change in benefit obligation and plan assets and a reconciliation of funded status were as follows:At December 31,
2006
2005
Change in benefit obligation Projected benefit obligation at beginning of year $ 8,405 $ 7,494 Service cost -- 309 Interest cost -- 464 Benefits paid (105 ) (217 ) Actuarial loss -- 355 Discontinued operations (8,300 ) --
Projected benefit obligation at end of year $ -- $ 8,405
Accumulated benefit obligation $ -- $ 6,606
Change in plan assets Fair value of plan assets at beginning of year $ 4,806 $ 4,098 Actual return on plan assets -- 205 Employer contributions 360 720 Benefits paid (105 ) (217 ) Discontinued operations (5,061 ) --
Fair value of plan assets at end of year $ -- $ 4,806
Reconciliation of funded status Funded status $ -- $ (3,599 ) Unrecognized actuarial loss -- 3,803 Unrecognized prior service cost -- 369
Net asset reflected in the consolidated balance sheet $ -- $ 573
Weighted average assumptions Discount rate -- 5.75 % Expected long-term rate of return on plan assets -- 6.0 % Rate of compensation increase -- 5.0 %
follows (in thousands):
At December 31, 2006 Change in benefit obligation Projected benefit obligation at beginning of year $ 8,405 Service cost — Interest cost — Benefits paid (105 ) Actuarial loss — Discontinued operations (8,300 ) Projected benefit obligation at end of year $ — Accumulated benefit obligation $ — Change in plan assets Fair value of plan assets at beginning of year $ 4,806 Actual return on plan assets — Employer contributions 360 Benefits paid (105 ) Discontinued operations (5,061 ) Fair value of plan assets at end of year $ — Reconciliation of funded status Funded status $ — Unrecognized actuarial loss — Unrecognized prior service cost — Net asset reflected in the consolidated balance sheet $ — Weighted average assumptions Discount rate — Expected long-term rate of return on plan assets — Rate of compensation increase —
Post Retirement Medical Benefits In connection with the acquisition of Coeur Silver Valley in 1999, the Company reimbursed Asarco, Inc. (prior owner) for certain healthcare benefits for retired employees and their dependents who retired before September 9, 1999. There were ten active hourly and salaried employees of Coeur Silver Valley and three inactive participants eligible under Asarco’s post-retirement medical benefits plan. These post-retirement medical benefits were self-insured by the plan’s prior sponsor. The actuarial present value of the post retirement benefit obligation iswas determined as of December 31 for each of the years presented.F-35
Actuarial Present Value of Projected Benefit Obligation: The discount rate was determined based on Moody’s Aaa Bond Rating as reported on the last business day of the plan year plus 0.50%. The Company amortized its unrecognized, unfunded accumulated post-retirement benefit obligation using a straight-line method over a 3.1-year period. The 3.1-year estimate was based on the average remaining service period of the active participants. Expected long-term rate of return on plan assets No assets arewere held in a trust for the post retirement health care plan; therefore, there iswas no expected long-term rate of return assumption. A “pay as you go” funding method was utilized for this plan. The Company contributed $0.01 million and $0.2 million to the plan as benefit payments for 2005 and 2004, respectively.2005.F-36
The following table sets forth the actuarial present value of postretirement medical benefit obligations and amounts recognized in the Company’s financial statements:At December 31,
2006
2005
(in thousands)
Assumptions: Discount rate -- 5.75 %
Change in benefit obligation Net benefit obligation at beginning of year $ 356 $ 1,973 Service cost -- 8 Interest cost -- 20 Prior service cost (credit) -- (387 ) Actuarial (gain) loss -- (1,248 ) Benefits paid -- (10 ) Discontinued operations (356 ) --
Net benefit obligation at end of year -- $ 356
Change in plan assets Assets at beginning of year $ -- $ -- Benefits paid -- (10 ) Contributions -- 10
Assets at end of year $ -- $ --
Reconciliation of funded status Funded status at end of year $ -- $ (356 ) Unrecognized net actuarial (gain) loss -- (815 ) Unrecognized prior service cost (credit) -- (262 )
Net amount recognized at end of year (recorded as accrued benefit cost in the accompanying balance sheet) $ -- $ (1,433 )
F-36
statements (in thousands, except for discount rate):
At December 31, 2006 2005 Assumptions: Discount rate — 5.75 % Change in benefit obligation Net benefit obligation at beginning of year $ 356 $ 1,973 Service cost — 8 Interest cost — 20 Prior service cost (credit) — (387 ) Actuarial (gain) loss — (1,248 ) Benefits paid — (10 ) Discontinued operations (356 ) — Net benefit obligation at end of year — $ 356 Change in plan assets Assets at beginning of year $ — $ — Benefits paid — (10 ) Contributions — 10 Assets at end of year $ — $ — Reconciliation of funded status Funded status at end of year $ — $ (356 ) Unrecognized net actuarial (gain) loss — (815 ) Unrecognized prior service cost (credit) — (262 ) Net amount recognized at end of year (recorded as accrued benefit cost in the accompanying balance sheet) $ — $ (1,433 )
The components of net periodic benefit costs were as follows:For the Year Ended December 31,
2006
2005
2004
(in thousands)
Assumptions: Discount rate -- 6.0 % 6.0 %
Components of net periodic benefit cost: Service cost -- $ 8 $ 17 Interest cost -- 20 116 Amortization of prior service cost -- (125 ) -- Amortization of actuarial gain -- (372 ) --
Net periodic pension cost (benefit) -- $ (469 ) $ 133
follows (in thousands, except for discount rate):
For the Year Ended December 31, 2006 2005 Assumptions: Discount rate — 6.0 % Components of net periodic benefit: Service cost — $ 8 Interest cost — 20 Amortization of prior service cost — (125 ) Amortization of actuarial gain — (372 ) Net periodic pension benefit — $ (469 )
During 2005, an adjustment was required to reflect a decreased liability of $1.6 million related to a reduction in plan participation. This adjustment resulted in an actuarial gain. The amortization of the prior service cost of $0.4 million and the unrealized actuarial gain of $1.2 million is greater than 10% of the benefit obligation which required the gain to be amortized over the average remaining service period of the active participants, estimated to be approximately 3.1 years. The amortization of the unrealized gain is included as a component on net periodic benefit cost. The Company also amortized the unrecognized actuarial gain over the same period.F-37
A 1% change in assumed medical trend rates would have had the following effects:(in thousands) 1% Increase
1% Decrease
2005
2004
2005
2004
Effect on total of service and interest cost components $ 2 $ 8 $ (2 ) $ (7 ) Effect on postretirement benefit obligation $ 22 $ 106 $ (19 ) $ (91 )
effects (in thousands):
1% 1% Increase Decrease 2005 2005 Effect on total of service and interest cost components $ 2 $ (2 ) Effect on postretirement benefit obligation $ 22 $ (19 )
Postretirement benefits included medical benefits for retirees and their dependents. In December 2003, The Medicare Prescription Drug, Improvement and Modernization Act of 2003 was enacted. Our accumulated postretirement benefit obligation and net periodic postretirement obligation do not reflect the effects that the requirements of this law since eligibility under this plan ends at age 65.Defined Contribution Plan The Company provides a noncontributory defined contribution retirement plan for all eligible U.S. employees. Total contributions charged to expense were $1.2$0.8 million, $0.9$1.2 million and $0.9 million for 2007, 2006 2005 and 2004,2005, respectively, which is based on a percentage of the salary of eligible employees.401(k) Plan The Company maintains a retirement savings plan (which qualifies under Section 401(k) of the U.S. Internal Revenue code) covering all eligible U.S. employees. Under the plan, employees may elect to contribute up to 100% of their cash compensation, subject to ERISA limitations. The Company is required to make matching cash contributions equal to 50% of the employees’ contribution, up to a maximum of 3% of the employees’ compensation. Contributions to the plan charged to operations were $0.6 million, $0.5$0.6 million and $0.5 million in 2007, 2006, and 2005, and 2004, respectively.F-37
NOTE NO — DERIVATIVE FINANCIAL INSTRUMENTS AND FAIR VALUE OF FINANCIAL INSTRUMENTS The Company enters into derivative instruments to manage the Company’s exposure to foreign currency exchange rates and market prices associated with changes in gold and silver commodity prices. The Company accounts for its derivative contracts in accordance with SFAS No. 133, “Accounting for Derivative Instruments and Hedging Activities.” Accordingly, unrealized gains and losses related to the change in fair market value of derivative contracts, which qualify and are designated as cash flow hedges, are recorded as other comprehensive income or loss and such amounts are recognized into earnings as the associated contracts are settled.Forward Foreign Exchange Contracts During 20062007 and 2005,2006, the Company entered into forward foreign currency exchange contracts to reduce the foreign exchange risk associated with forecasted Chilean peso operating costs for 2007 and 2008 at its Cerro Bayo mine. The contracts entered into in 20062007 require the Company to exchange U.S. dollars for Chilean pesos at a weighted average exchange rate of 531503 pesos to each U.S. dollar. At December 31, 20062007 and 2005,2006, the Company had foreign exchange contracts of $4.8$9.0 million and $7.2$4.8 million in U.S. dollars, respectively. For the years ended December 31, 20062007 and 2005,2006, the Company recorded a realized gain (loss) of approximately $(0.4)$0.4 million and $0.1$(0.4) million, respectively, in connection with its foreign currency hedging program. As of December 31, 2006,2007, the fair value of the foreign exchange contracts was a liability of $0.1 million. Change in gains (losses) accumulated in other comprehensive income (loss) for cash flow hedging contracts are as follows:follows (in thousands):F-38
December 31, 2006
2005
2004
(in thousands) Beginning balance $ (171 ) $ -- $ 131 Reclassification to earnings 379 (68 ) 8 Change in fair value (268 ) (103 ) (139 )
Ending balance $ (60 ) $ (171 ) $ --
December 31, 2007 2006 2005 Beginning balance $ (60 ) $ (171 ) $ — Reclassification to earnings (371 ) 379 (68 ) Change in fair value 349 (268 ) (103 ) Ending balance $ (82 ) $ (60 ) $ (171 )
Commodity Derivatives The Company has occasionally entered into forward metal sales contracts to manage the price risk onassociated with a portion of its cash flows against fluctuating gold prices. As of December 31, 2006,2007, the Company had no outstanding forward sales contracts for either gold or silver. For metal delivery contracts, the realized price pursuant to the contract is recognized when physical gold or silver is delivered in satisfaction of the contract. For the year ended December 31, 2004, the Company incurred realized hedging losses of $1.2 million.Concentrate Sales Contracts The Company enters into concentrate sales contracts with third-party smelters. The contracts, in general, provide for a provisional payment based upon provisional assays and quoted metal prices and the provisionally priced sales contain an embedded derivative that is required to be separated from the host contract for accounting purposes. The host contract is the receivable from the sale of concentrates at the forward price at the time of sale. The embedded derivative, which is the final settlement price based on a future price, does not qualify for hedge accounting. These embedded derivatives are recorded as derivative assets (in Prepaid expenses and other), or derivative liabilities (in Accrued liabilities and other), on the balance sheet and are adjusted to fair value through earnings each period until the date of final settlement.F-38
At December 31, 2007, the Company had outstanding provisionally priced sales of $61.2 million consisting of 3.3 million ounces of silver and 20,775 ounces of gold, which had a fair value of approximately $63.8 million including the embedded derivative. At December 31, 2006, the Company had outstanding receivables for provisionally priced sales of $74.5 million, consisting of 4.6 million ounces of silver and 29,577 ounces of gold, which had a fair market value of approximately $75.6 million including the embedded derivative. At December 31, 2005, the Company had outstanding receivables for provisionally priced sales of $47.0 million, consisting of 3.5 million ounces of silver and 40,000 ounces of gold, which had a fair market value of approximately $49.3 million including the embedded derivative.
Credit Risk The credit risk exposure related to any potential hedging activities is limited to the unrealized gains, if any, on outstanding contracts based on current market prices. To reduce counter-party credit exposure, the Company deals only with a group of large credit-worthy financial institutions and limits credit exposure to each. The Company does not anticipate non-performance by any of its counter parties. In addition, to allow for situations where positions may need to be revised, the Company deals only in markets that it considers highly liquid.NOTE OP — COMMITMENTS AND CONTINGENCIESLabor Union Contract The Company maintains two labor agreements in South America, consisting of a labor agreement with Syndicato de Trabajadores de Compañía Minera Cerro Bayo Ltd. at its Cerro Bayo mine in Chile and with Associacion Obrera Minera Argentina at its Martha mine in Argentina. The agreement at Cerro Bayo is effective from December 22, 200524, 2007 to December 21, 20072010 and the agreement at Mina Martha is effective from June 12, 2006 to June 1, 2008. Additionally certain employees at San Bartolomé are covered by a labor agreement that became effective October 11, 2008.2007; this Bolivian labor agreement does not have a fixed term. As of December 31, 2006,2007, the Company had approximately 20%44% of its worldwide labor force covered by collective bargaining agreements.F-39
Termination Benefits In September 2005, the Company established a one-time termination benefit program at the Rochester mine as the mine approaches the end of its mine life. The employees will be required to render service until they are terminated in order to be eligible for benefits. Approximately 80% of the workforce is expected to bewas severed by mid-2007,the end of the third quarter of 2007, while the remaining 20% are expected to stay on for residual leaching and reclamation activities. As of December 31, 2006,2007, the total amount expected to be incurred under this plan is approximately $3.4$4.7 million. The liability is recognized ratably over the minimum future service period. The amount accrued as of December 31, 2006 was $2.0 million and was charged to production costs. The following is a description of the changes to the Company’s termination benefits for the years ended December 31, 2007, 2006 and 2005 and 2004.Year Ended December 31, 2006
2005
2004
(in thousands) Beginning Balance $ 542 $ -- $ -- Accruals 1,803 542 -- Payments (386 ) -- --
Ending Balance $ 1,959 $ 542 $ --
(in thousands):
Year Ended December 31, 2007 2006 2005 Beginning Balance $ 1,959 $ 542 $ — Accruals 1,917 1,803 542 Payments (3,056 ) (386 ) — Ending Balance $ 820 $ 1,959 $ 542
NOTE PQ — SIGNIFICANT CUSTOMERS The Company markets its metals products and concentrates primarily to bullion trading banks and five third party smelters. These customers then sell the metals to end users for use in industry applications such as electronic circuitry, jewelry and silverware production and the manufacture and development of photographic film. Sales of metals to bullion trading banks amounted to approximately 47%, 45%47% and 59%45% of total metals sales in 2007, 2006 2005 and 2004,2005, respectively. Generally, the loss of a single bullion trading bank customer would not adversely affect the Company in view of the liquidity of the markets and availability of alternative trading banks.F-39
The Company currently markets its silver and gold concentrates to third party smelters in Japan, Mexico, Australia and Germany. Sales of metals concentrates to third party smelters amounted to approximately 53%, 55%53% and 41%55% of metals sales in 2007, 2006 2005 and 2004,2005, respectively. The loss of any one smelter customer could have a material adverse effect on the Company in the event of the possible unavailability of alternative smelters.NOTE QR — SEGMENT INFORMATION Operating segments are defined as components of an enterprise about which separate financial information is available that is evaluated regularly by the chief operating decision maker, or decision-making group, in deciding how to allocate resources and in assessing performance. The Company’s chief operating decision-making group is comprised of the Chief Executive Officer, Chief Financial Officer, the Senior Vice President of North American Operations and the President of South American Operations. The operating segments are managed separately because each segment represents a distinct use of Company resources which contribute to Company cash flows in its respective geographic area. The Company’s reportable operating segments include the Rochester, Cerro Bayo, Martha, San Bartolome,Bartolomé, Kensington, Palmarejo and CDE Australia (Endeavor and Broken Hill) mining properties. All operating segments are engaged in the discovery and/or mining of gold and silver and generate the majority of their revenues from the sale of these precious metal concentrates and/or refined precious metals. The Cerro Bayo and Martha mines sell precious metal concentrates, typically under long-term contracts, to a smelter located in Japan (Dowa Mining Ltd.), Mexico (Met-Mex Penoles) and Germany (Noordeutche)(Norddeutsche). Refined gold and silver produced by the Rochester mine is principally sold on a spot basis to precious metals trading banks such as Standard Bank and Mitsui. Concentrates produced at CDE Australia (Endeavor and Broken Hill mines) are sold to Zinifex,Nystar (formerly Zinifex), an Australia smelter. The Company’s exploration programs are included as other. The other segment also includes the corporate headquarters, elimination of intersegment transactions and other items necessary to reconcile to consolidated amounts.F-40
The accounting policies of the operating segments are the same as those described in the summary of significant accounting policies above. The Company evaluates performance and allocates resources based on profit or loss before interest, income taxes, depreciation and amortization, unusual and infrequent items, and extraordinary items. Revenues from silver sales were $151.0 million, $147.8 million and $91.9 million in 2007, 2006, and $63.1 million in 2006, 2005, and 2004, respectively. Revenues from gold sales were $64.3 million, $68.8 million and $64.4 million in 2007, 2006, and $45.9 million in 2006, 2005, and 2004, respectively. Financial information relating to the Company’s segments is as follows:Rochester
Mine
Cerro
Bayo Mine
Martha
Mine
Endeavor
Mine
Broken Hill
Mine
San
Bartolome
Project
Kensington
Project
Other
Total
2006
Total net sales and revenues $ 102,393 $ 50,293 $ 34,733 $ 5,363 $ 23,791 $ -- $ -- $ -- $ 216,573
Depreciation and depletion $ 13,745 $ 5,795 $ 1,313 $ 490 $ 5,120 $ -- $ -- $ 309 $ 26,772 Interest income -- 663 39 -- -- -- 8 17,276 17,986 Interest expense -- 84 -- -- -- -- -- 1,140 1,224 Litigation settlement -- -- -- -- -- -- -- (2,365 ) (2,365 ) Income tax (benefit) provision from continuing operations -- (2,930 ) 4,689 -- -- -- -- 6,500 8,259 Segment profit (loss) 55,109 22,652 17,290 4,977 �� 19,427 (6 ) (1,030 ) (4,413 ) 114,006
Segment assets (A) 87,423 49,428 11,596 14,508 29,740 59,080 207,745 10,326 469,846 Capital expenditures 1,225 7,555 2,481 -- -- 14,597 121,552 588 147,998
F-40
Rochester
Mine
Cerro
Bayo Mine
Martha
Mine
Endeavor
Mine
Broken Hill
Mine
San
Bartolome
Project
Kensington
Project
Other
Total
2005
Total net sales and revenues $ 69,636 $ 59,624 $ 20,606 $ 2,148 $ 4,270 $ -- $ -- $ -- $ 156,284
Depreciation and depletion $ 10,403 $ 5,064 $ 860 $ 411 $ 1,807 $ -- $ 35 $ 309 $ 18,889 Interest income -- 154 (1 ) -- -- -- -- 9,036 9,189 Interest expense -- 26 -- -- -- -- -- 2,459 2,485 Litigation settlement -- -- -- -- -- -- -- (1,600 ) (1,600 ) Income tax (benefit) provision from continuing operations -- 2,154 (863 ) -- -- -- -- 192 1,483 Segment profit (loss) 24,876 22,978 6,105 1,700 3,282 (119 ) (7,143 ) (12,476 ) 39,203
Segment assets (A) 82,806 45,474 6,291 14,999 34,860 32,687 80,653 7,982 305,752 Capital expenditures 1,197 2,731 2,108 15,410 36,667 10,477 44,201 499 113,290
Rochester
Mine
Cerro
Bayo Mine
Martha
Mine
Endeavor
Mine
Broken Hill
Mine
San
Bartolome
Project
Kensington
Project
Other
Total
2004
Total net sales and revenues $ 64,005 $ 35,267 $ 9,775 $ -- $ - $ -- $ -- $ -- $ 109,047
Depreciation and depletion $ 10,229 $ 4,588 $ 1,669 $ -- $ - $ 4 $ 52 $ 291 $ 16,833 Interest income -- 13 -- -- -- -- -- 3,626 3,639 Interest expense 1 123 -- -- -- -- -- 2,707 2,831 Loss on forward sales contracts -- -- -- -- -- -- -- (936 ) (936 ) Income tax (benefit) provision from continuing operations -- (4,403 ) -- -- -- -- -- (1,382 ) (5,785 ) Merger expenses -- -- -- -- -- -- -- 15,676 15,676 Segment profit (loss) 26,784 9,638 (387 ) -- -- (4,549 ) (7,347 ) (11,684 ) 12,455
Segment assets (A) 75,529 30,898 3,387 -- -- 21,304 25,833 5,813 162,764 Capital expenditures 3,548 2,451 689 -- -- 950 83 642 8,363
Notes:
follows (in thousands): Broken San Rochester Cerro Bayo Martha Endeavor Hill Bartolomé Kensington Palmarejo Mine Mine Mine Mine Mine Project Project Project Other Total December 31, 2007 Total net sales of metals $ 100,903 $ 47,794 $ 38,077 $ 7,943 $ 20,602 $ — $ — $ — $ — $ 215,319 Productions costs applicable to sales 60,364 35,594 17,231 545 3,292 — (1 ) — — 117,025 Depreciation and depletion 8,697 6,260 1,731 755 3,054 — — — 487 20,984 Exploration expense 361 2,908 4,418 — — — 619 — 3,635 11,941 Other operating expenses 62 113 38 — — — 38 — 24,131 24,382 Interest and other income 2,948 1,590 (303 ) — — — 85 — 13,875 18,195 Interest expense — 23 — — — — — — 342 365 Income tax (credit) expense — 1,662 6,418 — — — 20 — 6,827 14,927 Profit (loss) $ 34,367 $ 2,824 $ 7,938 $ 6,643 $ 14,256 $ — $ (591 ) $ — $ (21,547 ) $ 43,890 Segment assets(A) $ 62,848 $ 63,570 $ 25,799 $ 17,885 $ 29,391 $ 169,196 $ 301,730 $ 1,759,153 $ 7,470 $ 2,437,042 Capital expenditures $ 1,647 $ 11,330 $ 16,444 $ 2,112 $ 213 $ 100,169 $ 92,337 $ — $ 1,942 $ 226,194
Broken San Rochester Cerro Bayo Martha Endeavor Hill Bartolomé Kensington Mine Mine Mine Mine Mine Project Project Other Total December 31, 2006 Total net sales of metals $ 102,393 $ 50,293 $ 34,733 $ 5,363 $ 23,791 $ — $ — $ — $ 216,573 Productions costs applicable to sales 47,310 27,780 12,538 386 4,364 — — — 92,378 Depreciation and depletion 13,745 5,795 1,313 490 5,120 — — 309 26,772 Exploration expense — 2,639 2,904 — — — 936 2,995 9,474 Other operating expenses — 28 17 — — — 108 21,581 21,734 Interest and other income 25 809 13 — — (6 ) 13 17,800 18,654 Interest expense — 84 — — — — — 1,140 1,224 Income tax (credit) expense — (2,930 ) 4,777 — — — — 6,379 8,226 Profit (loss) $ 41,364 $ 17,707 $ 13,196 $ 4,487 $ 14,307 $ (6 ) $ (1,031 ) $ (14,605 ) $ 75,419 Segment assets(A) $ 87,371 $ 49,428 $ 11,508 $ 15,666 $ 32,894 $ 59,080 $ 207,745 $ 6,154 $ 469,846 Capital expenditures $ 1,225 $ 7,555 $ 2,481 $ — $ — $ 16,805 $ 122,640 $ 588 $ 151,294
Broken San Rochester Cerro Bayo Martha Endeavor Hill Bartolomé Kensington Mine Mine Mine Mine Mine Project Project Other Total December 31, 2005 Total net sales of metals $ 69,636 $ 59,624 $ 20,606 $ 2,148 $ 4,270 $ — $ — $ — $ 156,284 Productions costs applicable to sales 44,547 33,574 9,016 278 817 — — — 88,232 Depreciation and depletion 10,403 5,064 860 411 1,807 — 35 309 18,889 Exploration expense 169 4,812 2,976 — — 83 1,165 1,431 10,636 Other operating expenses 225 110 690 — — — 5,979 21,194 28,198 Interest and other income 181 224 (172 ) — — (36 ) — 8,188 8,385 Interest expense — 26 92 — — — — 2,367 2,485 Income tax (credit) expense — 2,154 (862 ) — — — — 191 1,483 Profit (loss) $ 14,473 $ 14,108 $ 7,662 $ 1,459 $ 1,646 $ (119 ) $ (7,179 ) $ (17,304 ) $ 14,746 Segment assets(A) $ 82,631 $ 45,474 $ 3,791 $ 15,152 $ 36,493 $ 32,687 $ 80,653 $ 8,871 $ 305,752 Capital expenditures $ 1,197 $ 2,731 $ 2,108 $ 15,410 $ 36,667 $ 11,089 $ 53,155 $ 499 $ 122,856
(A) Segment assets consist of receivables, prepaids, inventories, property, plant and equipment, and mining properties.
2006
2005
2004
Income (loss) Total segment profit $ 114,006 $ 39,203 $ 12,455 Depreciation and amortization (26,772 ) (18,889 ) (16,833 ) Interest expense (1,224 ) (2,485 ) (2,831 ) Other (2,365 ) (1,600 ) (16,612 )
Income (loss) from continuing operations before income taxes $ 83,645 $ 16,229 $ (23,821 )
Assets Total assets for reportable segments $ 469,846 $ 305,752 $ 162,764 Cash and cash equivalents 270,672 54,896 65,218 Short-term investments 70,373 185,446 256,843 Other assets 38,735 33,894 28,350 Assets held for sale -- 14,828 12,602
Total consolidated assets $ 849,626 $ 594,816 $ 525,777
F-41
Geographic Information 2006 Revenues
Long-Lived
Assets
United States $ 102,393 $ 218,236 Australia 29,154 44,253 Chile 50,293 20,295 Argentina 34,733 3,700 Bolivia -- 50,858 Other foreign countries -- 214
Total $ 216,573 $ 337,556
2005
United States $ 69,636 $ 101,338 Australia 6,418 49,860 Chile 59,624 19,407 Argentina 20,606 2,568 Bolivia -- 32,194 Other foreign countries -- 237
Total $ 156,284 $ 205,604
2004
United States $ 64,005 $ 54,306 Australia -- -- Chile 35,267 15,332 Argentina 9,775 1,050 Bolivia -- 21,103 Other foreign countries -- 144
Total $ 109,047 $ 91,935
(a)Includes property, plant and equipment and mineral properties.
2007 2006 2005 Assets Total assets for reportable segments $ 2,437,042 $ 469,846 $ 305,752 Cash and cash equivalents 98,671 270,672 54,896 Short-term investments 53,039 70,373 185,446 Other assets 62,942 38,735 33,894 Total assets held for sale — — 14,828 Total consolidated assets $ 2,651,694 $ 849,626 $ 594,816
Geographic Information Long-Lived Revenues Assets 2007 United States $ 100,903 $ 305,876 Australia 28,545 42,772 Chile 47,794 28,028 Argentina 38,077 18,640 Mexico — 1,756,042 Bolivia — 151,716 Other foreign countries — 190 Total $ 215,319 $ 2,303,264 2006 United States $ 102,393 $ 218,236 Australia 29,154 44,253 Chile 50,293 20,295 Argentina 34,733 3,700 Bolivia — 50,858 Other foreign countries — 214 Total $ 216,573 $ 337,556 2005 United States $ 69,636 $ 101,338 Australia 6,418 49,860 Chile 59,624 19,407 Argentina 20,606 2,568 Bolivia — 32,194 Other foreign countries — 237 Total $ 156,284 $ 205,604
NOTE RS — LITIGATIONFederal Natural Resources Action
On March 22, 1996, an action was filed in the United States District Court for the District of Idaho by the United States against various defendants, including the Company, asserting claims under CERCLA and the Clean Water Act for alleged damages to federal natural resources in the Coeur d’Alene River Basin of Northern Idaho. The damages are claimed to result from alleged releases of hazardous substances from mining activities conducted in the area since the late 1800s.
In May 2001, the Company and representatives of the U.S. Government, including the Environmental Protection Agency, the Department of Interior and the Department of Agriculture, reached an agreement to settle the lawsuit. The terms of settlement are set forth in a Consent Decree issued by the court. Pursuant to the terms of the Consent Decree, dated May 14, 2001, the Company has paid the U.S. Government a total of approximately $3.9 million, of which $3.3 million was paid in May 2001 and the remaining $0.6 million was paid in June 2001. In addition, the Company will (i) pay the United States 50% of any future recoveries from insurance companies for claims for defense and indemnification under general liability insurance policies in excess of $0.6 million, (ii) accomplish certain cleanup work on the Mineral Point property and Caladay property, and (iii) make a conveyance to the U.S. or the State of Idaho of certain real property to possibly be used as a waste repository. Finally, commencing five years after effectiveness of the settlement, the Company will be obligated to pay royalties on all of its domestic and foreign operating properties, up to a cumulative of $3 million, amounting to a 2% net smelter royalty on silver production if the price of silver exceeds $6.50 per ounce, and a $5.00 per ounce royalty on gold production if the price of gold exceeds $325 per ounce. The royalty payment obligation commenced on May 14, 2006 and expires May 14, 2021. As of December 31, 2006, $2.5 million (including discontinued operations) of the $3.0 million was paid. It is expected that the remaining $0.5 million will be paid in the first half of 2007.
F-42
States of Maine, Idaho Andand Colorado Superfund Sites Related to Callahan Mining Corporation During 1991, the Company acquired all of the outstanding common stock of Callahan Mining Corporation. During 2001, the United States Forest Service made a formal request for information regarding the Deadwood Mine Site located in central Idaho. Callahan Mining Corporation had operated at this site during the 1940‘s.1940’s. The Forest Service believes that some cleanup action is required at the location. However, Coeur d’Alene Mines Corporation did not acquire Callahan until 1991, more than 40 years after Callahan disposed of its interest in the Deadwood property. The Company did not make any decisions with respect to generation, transport or disposal of hazardous waste at the site. Therefore, it is believed that the Company is not liable for any cleanup, and if Callahan might be liable, it has no substantial assets with which to satisfy any such liability. To date, no claim has been made by the United States for any cleanup costs against either the Company or Callahan.F-42
During 2002, the EPA made a formal request for information regarding a Callahan mine site in the State of Maine. Callahan operated there in the late 1960‘s,1960’s, shut the operations down in the early 1970‘s1970’s and disposed of the property. The EPA contends that some cleanup action is warranted at the site, and listed it on the National Priorities List in late 2002. The Company believes that because it made no decisions with respect to generation, transport or disposal of hazardous waste at this location, it is not liable for any cleanup costs. If Callahan might have liability, it has no substantial assets with which to satisfy such liability. To date, no claim has been made for any cleanup costs against either the Company or Callahan. In January 2003, the U.S. Forest Service made a formal request for information regarding a Callahan mine site in the State of Colorado known as the Akron Mine Site. Callahan operated there in approximately the late 1930s through the 1940s, and to the Company’s knowledge, disposed of the property. The Company is not aware of what, if any, cleanup action the Forest Service is contemplating. However, the Company did not make decisions with respect to generation, transport or disposal of hazardous waste at this location, and therefore believes it is not liable for any cleanup costs. If Callahan might have liability, it has no substantial assets with which to satisfy such liability. To date, no claim has been made for any cleanup costs against either the Company or Callahan.Federal District Court of Alaska Permit Challenge On September 12, 2005 three environmental groups (“Plaintiffs”) filed a lawsuit in Federal District Court in Alaska against the U.S. Army Corps of Engineers (“Corps of Engineers”) and the U.S. Forest Service (“USFS”) seeking to invalidate the permit issued to Coeur Alaska, Inc. for the Company’s Kensington mine. The Plaintiffs claim the Clean Water Act (CWA)(“CWA”) Section 404 permit issued by the Corps of Engineers authorizing the deposition of mine tailings into Lower Slate Lake conflicts with the CWA and is thus illegal.CWA. They additionally claim the USFS’s approval of the Amended Plan of Operations is arbitrary and capricious because it relies on the 404 permit issued by the Corps of Engineers. On November 8, 2005, Following the Corps of Engineers filed a Motion for Voluntary Remand with the court to review the permit issued to the Company under the CWA Section 404 and requested that the court stay the legal proceeding filed by the plaintiffs pending the outcome of review. On November 12, 2005, the Federal District Court in Alaska granted theCourt’s remand of the Section 404 permit to the Corps of Engineers for further review. On November 22, 2005,review, the Corps of Engineers advised the Company that it was suspending the Section 404 permit pursuant to the Court’s remand to further review the permit.
On March 29, 2006, the Corps of Engineers reinstated the Company’s 404 permit. On April 6, 2006 thepermit on March 29, 2006. The lawsuit challenging the permit was re-opened andon April 6, 2006; Coeur Alaska Inc. filed its answer to the Amended ComplaintComplaint; and Motion to Intervene as a Defendant-Intervenor in the action. Two other parties,Coeur Alaska, the State of Alaska, and Goldbelt, Inc., a local native corporation, also filed Motions to Intervene as Defendant-Intervenors as supporters of the Kensington project as permitted. The Company, the State of Alaska and Goldbelt, Inc. were granted Defendant-Intervenor status and joinedto join the agencies in their defense of the permits as issued.
F-43
permit.
On August 4, 2006, the Federal District Court in Alaska dismissed the Plaintiffs’ challenge and upheld the Section 404 permit. On August 7, 2006 the Plaintiffs filed a Notice of Appeal of the decision to the Ninth Circuit Court of Appeals (“Ninth Circuit Court”) and on August 9, 2006 the Plaintiffs additionally filed a Motion for Injunction Pending Appeal with the Ninth Circuit Court. The Ninth Circuit Court granted a temporary injunction pending appeal on August 24, 2006, enjoining certain activities relating to the lake tailings facility. The On May 22, 2007 the Ninth Circuit Court further ordered an expedited briefing schedulereversed the District Court’s August 4, 2006 decision which had upheld the Company’s 404 permit and issued its opinion that remanded the case to the District Court with instructions to vacate the Company’s 404 permit as well as the USFS Record of Decision approving the general tailings disposal plan as well as the Goldbelt 404 permit to construct the Cascade Point Marine Facility. On August 20, 2007, Coeur Alaska filed a Petition for Rehearing En Banc with the Ninth Circuit Court, as did the State of Alaska and Goldbelt, Inc. The Department of Justice, on the meritsbehalf of the legal challenge. AsCorps of Engineers, and USFS additionally filed a limited Petition for Rehearing with the Ninth Circuit panel seeking reconsideration of the mandate of the May 22, 2007 panel decision. On October 13, 2006,29, 2007, the parties filed their briefs inNinth Circuit denied the Petitions for Rehearing En Banc. On November 14, 2007, the Ninth Circuit granted a stay of the mandate pending further appeal to the Supreme Court, and participated in an oral argument on December 4, 2006. There is no indicationsubject to the development of whena reclamation plan for the Circuit Court may rule on the merits of appeal.lake area. The Company is unableand the State of Alaska filed Petitions for Certiorari to the Supreme Court of the United States on January 28, 2008. The Company cannot now predict the outcome ofpotential for obtaining further appeal or if it will prevail upon appeal if one is granted.F-43
No assurance can be given as to whether or when regulatory permits and approvals granted to the litigation.Company may be further challenged, appealed or contested by third parties or issuing agencies, or as to whether the Company will place the Kensington project into commercial production.
This litigation has contributed to an increase in capital costs. While the Company cannot now predict with certainty the outcome of this litigation, it believes it willshould ultimately prevail in the defense of the awarded permits, inprevail. In the event that the Company does not prevail, it could be necessary to seek an alternate site for the tailings disposal facility. The Company is not aware ofhas identified an alternate site that couldwhich it believes can be permitted or would be economic. Therefore, it is possible that an adverse legal decision could renderand has submitted a modified plan to the project uneconomic and an asset impairment would be necessary. As a result ofUSFS. Based upon the increase in capital and operating costs at the Kensington project,Company’s current estimates, an impairment writedown could be necessary should the expectation of the long-term price for gold decrease below approximately $510$606 per ounce. As of December 31, 2006,2007, the Kensington project has a carrying value of $206the Kensington project’s long-lived assets was $298.2 million.NOTE ST — SUMMARY OF QUARTERLY FINANCIAL DATA (UNAUDITED) The following table sets forth a summary of the quarterly results of operations for the years ended December 31, 2007 and 2006 and 2005:First
Quarter
Second
Quarter
Third
Quarter
Fourth
Quarter
(In Thousands - Except Per Share Data)
2006: Sales of metal $ 44,854 $ 54,041 $ 50,606 $ 67,072
Income (loss) from continuing operations $ 13,726 $ 20,132 $ 18,378 $ 23,183 Income (loss) from discontinued operations 612 12,516 (27 ) (33 )
Net income (loss) $ 14,338 $ 32,648 $ 18,351 $ 23,150
Basic net income (loss) per share Income (loss) from continuing operations $ 0.06 $ 0.07 $ 0.07 $ 0.08 Income (loss) from discontinued operations -- 0.05 -- --
Net income (loss) $ 0.06 $ 0.12 $ 0.07 $ 0.08
Diluted net income (loss) per share Income (loss) from continuing operations $ 0.05 $ 0.07 $ 0.06 $ 0.08 Income (loss) from discontinued operations -- 0.04 -- --
Net income (loss) $ 0.05 $ 0.11 $ 0.06 $ 0.08
(in thousands — except for per share data): First Second Third Fourth Quarter Quarter Quarter Quarter 2007: Sales of metal $ 50,860 $ 51,664 $ 52,863 $ 59,931 Net income $ 14,018 $ 11,918 $ 3,635 $ 14,319 Basic net income per share $ 0.05 $ 0.04 $ 0.01 $ 0.05 Diluted net income per share $ 0.05 $ 0.04 $ 0.01 $ 0.04
First Second Third Fourth Quarter Quarter Quarter Quarter 2006: Sales of metal $ 44,854 $ 54,041 $ 50,606 $ 67,072 Income from continuing operations $ 13,726 $ 20,132 $ 18,378 $ 23,183 Income from discontinued operations 612 12,516 (27 ) (33 ) Net income $ 14,338 $ 32,648 $ 18,351 $ 23,150 Basic net income per share Income from continuing operations $ 0.06 $ 0.07 $ 0.07 $ 0.08 Income from discontinued operations — 0.05 — — Net income $ 0.06 $ 0.12 $ 0.07 $ 0.08 Diluted net income per share Income from continuing operations $ 0.05 $ 0.07 $ 0.06 $ 0.08 Income from discontinued operations — 0.04 — — Net income $ 0.05 $ 0.11 $ 0.06 $ 0.08
F-44
First
Quarter
Second
Quarter
Third
Quarter
Fourth
Quarter
(In Thousands - Except Per Share Data)
2005: Sales of metal $ 32,235 $ 33,504 $ 39,281 $ 51,264 Income (loss) from continuing operations $ (784 ) $ (529 ) $ 4,722 $ 11,337 Income (loss) from discontinued operations (361 ) (1,172 ) (1,269 ) (1,393 )
Net income (loss) $ (1,145 ) $ (1,701 ) $ 3,453 $ 9,944
Basic net income (loss) per share Income (loss) from continuing operations $ 0.00 $ 0.00 $ 0.02 $ 0.05 Income (loss) from discontinued operations -- (0.01 ) (0.01 ) (0.01 )
Net income (loss) $ 0.00 $ (0.01 ) $ 0.01 $ 0.04
Diluted net income (loss) per share Income (loss) from continuing operations $ 0.00 $ 0.00 $ 0.02 $ 0.04 Income (loss) from discontinued operations -- (0.01 ) (0.01 ) --
Net income (loss) $ 0.00 $ (0.01 ) $ 0.01 $ 0.04
NOTE U — SUBSEQUENT EVENTDuring February 2008, Cobar reported to the Company that the reserves at the Endeavor mine exceed those reported for 2004, thereby fulfilling the contractual condition discussed in Note H. Consequently, the Company expects to pay Cobar the additional $26.3 million on April 1, 2008 plus accrued interest at the rate of 7.5% per annum from January 24, 2008.F-45
AMONG COEUR D’ALENE MINES CORPORATION,
S&P 500 INDEX AND PEER GROUP INDEX
| Dec. 2001 | Dec. 2002 | Dec. 2003 | Dec. 2004 | Dec. 2005 | Dec. 2006 | |
| Coeur d’Alene Mines Corporation Common Stock | 100.00 | 240.03 | 722.58 | 491.30 | 500.09 | 618.85 |
| S&P 500 Index | 100.00 | 77.89 | 100.23 | 111.13 | 116.57 | 134.98 |
| Peer Group Index** | 100.00 | 168.54 | 195.38 | 197.34 | 239.99 | 336.52 |
| Dec. | Dec. | Dec. | Dec. | Dec. | Dec. | |||||||||||||||||||||||||||
| 2002 | 2003 | 2004 | 2005 | 2006 | 2007 | |||||||||||||||||||||||||||
| Coeur d’Alene Mines Corporation Common Stock | 100.00 | 301.04 | 204.68 | 208.34 | 257.82 | 257.29 | ||||||||||||||||||||||||||
| S&P 500 Index | 100.00 | 128.68 | 142.67 | 149.65 | 173.28 | 182.67 | ||||||||||||||||||||||||||
| Peer Group Index** | 100.00 | 123.37 | 117.98 | 155.14 | 221.81 | 266.80 | ||||||||||||||||||||||||||
| * | Total return assumes reinvestment of dividends. |
| ** | The issuers of common stock included in the peer group in 2007 are Agnico Eagle Mines, Goldcorp, Hecla Mining Co., IAM Gold, Kinross Gold Corp., Northgate Minerals, Pan American Silver Corp. and Stillwater Mining Co. (Bema Gold was dropped due to mergers and acquisitions, Centerra was dropped due to the fact that it no longer trades on any U.S. stock exchange and Yamana Gold was added.) The issuers of common stock included in the peer group in 2006 are Agnico Eagle Mines, Bema Gold, |
4752
Item 6.Selected Financial Data The following table summarizes certain selected consolidated financial data with respect to the Company and its subsidiaries and should be read in conjunction with the Consolidated Financial Statements and Notes thereto appearing elsewhere in this report. 2007 2006 2005 2004 2003 (In thousands, except per share data) Income Statement Data: Revenues: Sales of metal $ 215,319 $ 216,573 $ 156,284 $ 109,047 $ 93,620 Costs and expenses: Production costs applicable to sales 117,025 92,378 88,232 63,715 64,970 Depreciation and depletion 20,984 26,772 18,889 16,833 15,107 Administrative and general 23,875 19,369 20,624 17,499 12,264 Exploration 11,941 9,474 10,553 8,031 4,277 Litigation settlement 507 2,365 1,600 — — Pre-development — — 6,057 11,449 1,967 Other holding costs — — — — 4,478 Total costs and expenses 174,332 150,358 145,955 117,527 103,063 Operating income (loss) 40,987 66,215 10,329 (8,480 ) (9,443 ) Other income (expense) Interest and other income 18,195 18,654 8,385 3,165 2,064 Interest expense, net (365 ) (1,224 ) (2,485 ) (2,831 ) (12,851 ) Merger expenses — — — (15,675 ) — Loss on early retirement of debt — — — — (41,564 ) Total other income (expense) 17,830 17,430 5,900 (15,341 ) (52,351 ) Income (loss) from continuing operations before income taxes 58,817 83,645 16,229 (23,821 ) (61,794 ) Income tax (provision) benefit (14,927 ) (8,226 ) (1,483 ) 5,785 7 Income (loss) from continuing operations 43,890 75,419 14,746 (18,036 ) (61,787 ) Income (loss) from discontinued operations — 1,935 (4,195 ) 1,178 (2,139 ) Gain on sale of net assets of discontinued operation — 11,132 — — — Cumulative effect of accounting change — — — — (2,306 ) Net income (loss) $ 43,890 $ 88,486 $ 10,551 $ (16,858 ) $ (66,232 ) Other comprehensive income (loss) 86 2,391 447 (908 ) (556 ) Comprehensive income (loss) $ 43,976 $ 90,877 $ 10,998 $ (17,766 ) $ (66,788 ) Basic and Diluted Income (Loss) Per Share Data: Basic Income (Loss) Per Share: Income (loss) from continuing operations $ 0.15 $ 0.28 $ 0.06 $ (0.08 ) $ (0.37 ) Income (loss) from discontinued operations — 0.05 (0.02 ) 0.00 (0.01 ) Cumulative effect of accounting change — — — — (0.01 ) Net income (loss) $ 0.15 $ 0.33 $ 0.04 $ (0.08 ) $ (0.39 ) Diluted Income (Loss) Per Share: Income (loss) from continuing operations $ 0.14 $ 0.26 $ 0.06 $ (0.08 ) $ (0.37 ) Income (loss) from discontinued operations — 0.04 (0.02 ) 0.00 (0.01 ) Cumulative effect of accounting change — — — — (0.01 ) Net income (loss) $ 0.14 $ 0.30 $ 0.04 $ (0.08 ) $ (0.39 ) Weighted average number of shares of common stock Basic 285,972 271,357 242,915 215,969 168,186 Diluted 310,524 296,082 243,683 215,969 168,186 Balance Sheet Data:(1) Total assets $ 2,651,694 $ 849,626 $ 594,816 $ 525,777 $ 259,467 Working capital $ 152,390 $ 383,082 $ 281,977 $ 345,894 $ 96,994 Long-term liabilities $ 812,650 $ 210,117 $ 206,921 $ 198,873 $ 29,461 Shareholders’ equity $ 1,727,367 $ 580,994 $ 341,553 $ 293,454 $ 197,478
53
Income Statement Data: 2006
2005
2004
2003
2002
(In thousands except per share data)
Revenues: Sales of metal $ 216,573 $ 156,284 $ 109,047 $ 93,620 $ 67,117
Costs and expenses: Production costs applicable to sales 92,378 88,232 63,715 64,970 65,654 Depreciation and depletion 26,772 18,889 16,833 15,107 10,150 Administrative and general 19,369 20,624 17,499 12,264 8,806 Exploration 9,474 10,553 8,031 4,277 3,849 Pre-development -- 6,057 11,449 1,967 2,606 Other holding costs -- -- -- 4,478 3,608 Litigation settlement 2,365 1,600 -- -- --
Total costs and expenses 150,358 145,955 117,527 103,063 94,673
Other income (expense) Interest and other income 18,654 8,385 3,165 2,064 4,080 Interest expense, net (1,224 ) (2,485 ) (2,831 ) (12,851 ) (21,948 ) Merger expenses -- -- (15,675 ) -- -- Loss on early retirement of debt -- -- -- (41,564 ) (19,061 )
Total other income (expense) 17,430 5,900 (15,341 ) (52,351 ) (36,929 )
Income (loss) from continuing operations before income taxes 83,645 16,229 (23,821 ) (61,794 ) (64,485 ) Income tax (provision) benefit (8,226 ) (1,483 ) 5,785 7 --
Income(loss) from continuing operations 75,419 14,746 (18,036 ) (61,787 ) (64,485 ) Income (loss) from discontinued operations 1,935 (4,195 ) 1,178 (2,139 ) (16,334 ) Gain on sale of net assets of discontinued operation 11,132 -- -- -- -- Cumulative effect of accounting change -- -- -- (2,306 ) --
Net income (loss) $ 88,486 $ 10,551 $ (16,858 ) $ (66,232 ) $ (80,819 )
Other comprehensive income (loss) 2,391 447 (908 ) (556 ) (1,470 )
Comprehensive income (loss) $ 90,877 $ 10,998 $ (17,766 ) $ (66,788 ) $ (82,289 )
Basic and Diluted Income (Loss) Per Share Data: Basic Income (Loss) Per Share: Income (loss) from continuing operations $ 0.28 $ 0.06 $ (0.08 ) $ (0.37 ) $ (0.82 ) Income (loss) from discontinued operations 0.05 (0.02 ) 0.00 (0.01 ) (0.21 ) Cumulative effect of accounting change -- -- -- (0.01 ) --
Net income (loss) $ 0.33 $ 0.04 $ (0.08 ) $ (0.39 ) $ (1.03 )
Diluted Income (Loss) Per Share: Income (loss) from continuing operations $ 0.26 $ 0.06 $ (0.08 ) $ (0.37 ) $ (0.82 ) Income (loss) from discontinued operations 0.04 (0.02 ) 0.00 (0.01 ) (0.21 ) Cumulative effect of accounting change -- -- -- (0.01 ) --
Net income (loss) $ 0.30 $ 0.04 $ (0.08 ) $ (0.39 ) $ (1.03 )
Weighted average number of shares of common stock Basic 271,357 242,915 215,969 168,186 78,193
Diluted 296,082 243,683 215,969 168,186 78,193
| 2007 | 2006 | 2005 | 2004 | 2003 | ||||||||||||||||
| (In thousands, except per share data) | ||||||||||||||||||||
Income Statement Data: | ||||||||||||||||||||
| Revenues: | ||||||||||||||||||||
| Sales of metal | $ | 215,319 | $ | 216,573 | $ | 156,284 | $ | 109,047 | $ | 93,620 | ||||||||||
| Costs and expenses: | ||||||||||||||||||||
| Production costs applicable to sales | 117,025 | 92,378 | 88,232 | 63,715 | 64,970 | |||||||||||||||
| Depreciation and depletion | 20,984 | 26,772 | 18,889 | 16,833 | 15,107 | |||||||||||||||
| Administrative and general | 23,875 | 19,369 | 20,624 | 17,499 | 12,264 | |||||||||||||||
| Exploration | 11,941 | 9,474 | 10,553 | 8,031 | 4,277 | |||||||||||||||
| Litigation settlement | 507 | 2,365 | 1,600 | — | — | |||||||||||||||
| Pre-development | — | — | 6,057 | 11,449 | 1,967 | |||||||||||||||
| Other holding costs | — | — | — | — | 4,478 | |||||||||||||||
| Total costs and expenses | 174,332 | 150,358 | 145,955 | 117,527 | 103,063 | |||||||||||||||
| Operating income (loss) | 40,987 | 66,215 | 10,329 | (8,480 | ) | (9,443 | ) | |||||||||||||
| Other income (expense) | ||||||||||||||||||||
| Interest and other income | 18,195 | 18,654 | 8,385 | 3,165 | 2,064 | |||||||||||||||
| Interest expense, net | (365 | ) | (1,224 | ) | (2,485 | ) | (2,831 | ) | (12,851 | ) | ||||||||||
| Merger expenses | — | — | — | (15,675 | ) | — | ||||||||||||||
| Loss on early retirement of debt | — | — | — | — | (41,564 | ) | ||||||||||||||
| Total other income (expense) | 17,830 | 17,430 | 5,900 | (15,341 | ) | (52,351 | ) | |||||||||||||
| Income (loss) from continuing operations before income taxes | 58,817 | 83,645 | 16,229 | (23,821 | ) | (61,794 | ) | |||||||||||||
| Income tax (provision) benefit | (14,927 | ) | (8,226 | ) | (1,483 | ) | 5,785 | 7 | ||||||||||||
| Income (loss) from continuing operations | 43,890 | 75,419 | 14,746 | (18,036 | ) | (61,787 | ) | |||||||||||||
| Income (loss) from discontinued operations | — | 1,935 | (4,195 | ) | 1,178 | (2,139 | ) | |||||||||||||
| Gain on sale of net assets of discontinued operation | — | 11,132 | — | — | — | |||||||||||||||
| Cumulative effect of accounting change | — | — | — | — | (2,306 | ) | ||||||||||||||
| Net income (loss) | $ | 43,890 | $ | 88,486 | $ | 10,551 | $ | (16,858 | ) | $ | (66,232 | ) | ||||||||
| Other comprehensive income (loss) | 86 | 2,391 | 447 | (908 | ) | (556 | ) | |||||||||||||
| Comprehensive income (loss) | $ | 43,976 | $ | 90,877 | $ | 10,998 | $ | (17,766 | ) | $ | (66,788 | ) | ||||||||
Basic and Diluted Income (Loss) Per Share Data: | ||||||||||||||||||||
| Basic Income (Loss) Per Share: | ||||||||||||||||||||
| Income (loss) from continuing operations | $ | 0.15 | $ | 0.28 | $ | 0.06 | $ | (0.08 | ) | $ | (0.37 | ) | ||||||||
| Income (loss) from discontinued operations | — | 0.05 | (0.02 | ) | 0.00 | (0.01 | ) | |||||||||||||
| Cumulative effect of accounting change | — | — | — | — | (0.01 | ) | ||||||||||||||
| Net income (loss) | $ | 0.15 | $ | 0.33 | $ | 0.04 | $ | (0.08 | ) | $ | (0.39 | ) | ||||||||
| Diluted Income (Loss) Per Share: | ||||||||||||||||||||
| Income (loss) from continuing operations | $ | 0.14 | $ | 0.26 | $ | 0.06 | $ | (0.08 | ) | $ | (0.37 | ) | ||||||||
| Income (loss) from discontinued operations | — | 0.04 | (0.02 | ) | 0.00 | (0.01 | ) | |||||||||||||
| Cumulative effect of accounting change | — | — | — | — | (0.01 | ) | ||||||||||||||
| Net income (loss) | $ | 0.14 | $ | 0.30 | $ | 0.04 | $ | (0.08 | ) | $ | (0.39 | ) | ||||||||
| Weighted average number of shares of common stock | ||||||||||||||||||||
| Basic | 285,972 | 271,357 | 242,915 | 215,969 | 168,186 | |||||||||||||||
| Diluted | 310,524 | 296,082 | 243,683 | 215,969 | 168,186 | |||||||||||||||
Balance Sheet Data:(1) | ||||||||||||||||||||
| Total assets | $ | 2,651,694 | $ | 849,626 | $ | 594,816 | $ | 525,777 | $ | 259,467 | ||||||||||
| Working capital | $ | 152,390 | $ | 383,082 | $ | 281,977 | $ | 345,894 | $ | 96,994 | ||||||||||
| Long-term liabilities | $ | 812,650 | $ | 210,117 | $ | 206,921 | $ | 198,873 | $ | 29,461 | ||||||||||
| Shareholders’ equity | $ | 1,727,367 | $ | 580,994 | $ | 341,553 | $ | 293,454 | $ | 197,478 | ||||||||||
| Income Statement Data: | 2006 | 2005 | 2004 | 2003 | 2002 | ||||||||||||
|---|---|---|---|---|---|---|---|---|---|---|---|---|---|---|---|---|---|
| (In thousands except per share data) | |||||||||||||||||
Revenues: | |||||||||||||||||
| Sales of metal | $ | 216,573 | $ | 156,284 | $ | 109,047 | $ | 93,620 | $ | 67,117 | |||||||
| Costs and expenses: | |||||||||||||||||
| Production costs applicable to sales | 92,378 | 88,232 | 63,715 | 64,970 | 65,654 | ||||||||||||
| Depreciation and depletion | 26,772 | 18,889 | 16,833 | 15,107 | 10,150 | ||||||||||||
| Administrative and general | 19,369 | 20,624 | 17,499 | 12,264 | 8,806 | ||||||||||||
| Exploration | 9,474 | 10,553 | 8,031 | 4,277 | 3,849 | ||||||||||||
| Pre-development | -- | 6,057 | 11,449 | 1,967 | 2,606 | ||||||||||||
| Other holding costs | -- | -- | -- | 4,478 | 3,608 | ||||||||||||
| Litigation settlement | 2,365 | 1,600 | -- | -- | -- | ||||||||||||
| Total costs and expenses | 150,358 | 145,955 | 117,527 | 103,063 | 94,673 | ||||||||||||
Other income (expense) | |||||||||||||||||
| Interest and other income | 18,654 | 8,385 | 3,165 | 2,064 | 4,080 | ||||||||||||
| Interest expense, net | (1,224 | ) | (2,485 | ) | (2,831 | ) | (12,851 | ) | (21,948 | ) | |||||||
| Merger expenses | -- | -- | (15,675 | ) | -- | -- | |||||||||||
| Loss on early retirement of debt | -- | -- | -- | (41,564 | ) | (19,061 | ) | ||||||||||
| Total other income (expense) | 17,430 | 5,900 | (15,341 | ) | (52,351 | ) | (36,929 | ) | |||||||||
Income (loss) from continuing operations before | |||||||||||||||||
| income taxes | 83,645 | 16,229 | (23,821 | ) | (61,794 | ) | (64,485 | ) | |||||||||
| Income tax (provision) benefit | (8,226 | ) | (1,483 | ) | 5,785 | 7 | -- | ||||||||||
| Income(loss) from continuing operations | 75,419 | 14,746 | (18,036 | ) | (61,787 | ) | (64,485 | ) | |||||||||
| Income (loss) from discontinued operations | 1,935 | (4,195 | ) | 1,178 | (2,139 | ) | (16,334 | ) | |||||||||
| Gain on sale of net assets of discontinued operation | 11,132 | -- | -- | -- | -- | ||||||||||||
| Cumulative effect of accounting change | -- | -- | -- | (2,306 | ) | -- | |||||||||||
| Net income (loss) | $ | 88,486 | $ | 10,551 | $ | (16,858 | ) | $ | (66,232 | ) | $ | (80,819 | ) | ||||
Other comprehensive income (loss) | 2,391 | 447 | (908 | ) | (556 | ) | (1,470 | ) | |||||||||
| Comprehensive income (loss) | $ | 90,877 | $ | 10,998 | $ | (17,766 | ) | $ | (66,788 | ) | $ | (82,289 | ) | ||||
Basic and Diluted Income (Loss) Per Share Data: | |||||||||||||||||
| Basic Income (Loss) Per Share: | |||||||||||||||||
| Income (loss) from continuing operations | $ | 0.28 | $ | 0.06 | $ | (0.08 | ) | $ | (0.37 | ) | $ | (0.82 | ) | ||||
| Income (loss) from discontinued operations | 0.05 | (0.02 | ) | 0.00 | (0.01 | ) | (0.21 | ) | |||||||||
| Cumulative effect of accounting change | -- | -- | -- | (0.01 | ) | -- | |||||||||||
| Net income (loss) | $ | 0.33 | $ | 0.04 | $ | (0.08 | ) | $ | (0.39 | ) | $ | (1.03 | ) | ||||
| Diluted Income (Loss) Per Share: | |||||||||||||||||
| Income (loss) from continuing operations | $ | 0.26 | $ | 0.06 | $ | (0.08 | ) | $ | (0.37 | ) | $ | (0.82 | ) | ||||
| Income (loss) from discontinued operations | 0.04 | (0.02 | ) | 0.00 | (0.01 | ) | (0.21 | ) | |||||||||
| Cumulative effect of accounting change | -- | -- | -- | (0.01 | ) | -- | |||||||||||
| Net income (loss) | $ | 0.30 | $ | 0.04 | $ | (0.08 | ) | $ | (0.39 | ) | $ | (1.03 | ) | ||||
Weighted average number of shares of | |||||||||||||||||
| common stock | |||||||||||||||||
| Basic | 271,357 | 242,915 | 215,969 | 168,186 | 78,193 | ||||||||||||
| Diluted | 296,082 | 243,683 | 215,969 | 168,186 | 78,193 | ||||||||||||
| Balance Sheet Data: | 2006 | 2005 | 2004 | 2003 | 2002 | ||||||||||||
|---|---|---|---|---|---|---|---|---|---|---|---|---|---|---|---|---|---|
| (In thousands except per share data) | |||||||||||||||||
Total assets | $ | 849,626 | $ | 594,816 | $ | 525,777 | $ | 259,467 | $ | 173,491 | |||||||
| Working capital | $ | 383,082 | $ | 281,977 | $ | 345,894 | $ | 96,994 | $ | 2,661 | |||||||
| Long-term liabilities | $ | 210,117 | $ | 206,921 | $ | 198,873 | $ | 29,461 | $ | 81,200 | |||||||
| Shareholders' equity | $ | 580,994 | $ | 341,553 | $ | 293,454 | $ | 197,478 | $ | 47,687 | |||||||
| (1) | On December 21, 2007, the Company completed its acquisition of all the shares of Bolnisi and Palmarejo in exchange for a total of approximately 272 million shares of Coeur common stock and a total cash payment of approximately $1.1 million. The total consideration paid amounted to $1.1 billion and the total liabilities assumed were $0.7 billion. |
| Item 7. | Management’s Discussion and Analysis of Financial Condition and Results of Operations |
2007.
54
49
55
50
2005.
56
51
The Company has announced that it may consider the sale of the property during 2008.
57
52
| Positive/Negative Change in Silver Recovery | Positive/Negative Change in Gold Recovery | |||||||||||||||||||
|---|---|---|---|---|---|---|---|---|---|---|---|---|---|---|---|---|---|---|---|---|
| 1% | 2% | 3% | 1% | 2% | 3% | |||||||||||||||
| Quantity of recoverable | ||||||||||||||||||||
| ounces | 1.7 million | 3.4 million | 5.1 million | 12,900 | 25,800 | 38,700 | ||||||||||||||
Positive impact on | ||||||||||||||||||||
| future cost of | ||||||||||||||||||||
| production per silver | ||||||||||||||||||||
| equivalent ounce for | ||||||||||||||||||||
| increases in recovery rates | $1.06 | $1.83 | $2.43 | $0.42 | $0.79 | $1.13 | ||||||||||||||
Negative impact on | ||||||||||||||||||||
| future cost of | ||||||||||||||||||||
| production per silver | ||||||||||||||||||||
| equivalent ounce for | ||||||||||||||||||||
| decreases in recovery rates | $1.51 | $3.87 | $8.03 | $0.48 | $1.03 | $1.66 | ||||||||||||||
| Positive/Negative | Positive/Negative | |||||||||||||||||||||||
| Change in Silver Recovery | Change in Gold Recovery | |||||||||||||||||||||||
| 1% | 2% | 3% | 1% | 2% | 3% | |||||||||||||||||||
| Quantity of recoverable ounces | 1.7 million | 3.5 million | 5.2 million | 13,240 | 26,480 | 39,720 | ||||||||||||||||||
| Positive impact on future cost of production per silver equivalent ounce for increases in recovery rates | $ | 1.68 | $ | 2.78 | $ | 3.55 | $ | 0.82 | $ | 1.49 | $ | 2.04 | ||||||||||||
| Negative impact on future cost of production per silver equivalent ounce for decreases in recovery rates | $ | (2.93 | ) | $ | (9.30 | ) | $ | (33.77 | ) | $ | (1.04 | ) | $ | (2.38 | ) | $ | (4.21 | ) | ||||||
58
53
| Proven and Probable(1) | Mineralized Material | ||||||||||||||||
| Tons (000’s) | Grade Ag oz/t | Grade Au oz/t | Ounces AG (000’s) | Ounces AU (000’s) | Tons (000’s) | Grade Ag oz/t | Grade Au oz/t | ||||||||||
| Rochester | 3,720 | 0.66 | 0.007 | 2,436 | 26 | 15,235 | 0.94 | 0.007 | |||||||||
| Cerro Bayo | 634 | 9.69 | 0.19 | 6,144 | 122 | 2,509 | 8.23 | 0.15 | |||||||||
| Mina Martha | 99 | 61.33 | 0.09 | 6,084 | 9 | 112 | 42.91 | 0.05 | |||||||||
| San Bartolome | 46,176 | 3.29 | -- | 151,882 | -- | 1,166 | 3.44 | -- | |||||||||
| Kensington | 4,419 | -- | 0.31 | -- | 1,352 | 4,320 | -- | 0.20 | |||||||||
| Endeavor(2) | 21,385 | 1.50 | -- | 31,983 | -- | 9,370 | 3.00 | -- | |||||||||
| Broken Hill(2) | 12,908 | 1.40 | -- | 18,015 | -- | 10,872 | 3.82 | -- | |||||||||
| Total tons | 89,341 | 216,544 | 1,509 | ||||||||||||||
| Summary by metal: | Total tons (000’s) | Ag oz/t (Wt. Avg.) | Au oz/t (Wt. Avg.) | Total tons (000’s) | Ag oz/t (Wt. Avg.) | Au oz/t (Wt. Avg.) | |||||||||||
| Silver | 84,922 | 2.55 | -- | 39,264 | 2.89 | -- | |||||||||||
| Gold | 8,872 | -- | 0.17 | 22,176 | -- | 0.06 | |||||||||||
2007:
| Proven and Probable Ore Reserves(1) | Mineralized Material | |||||||||||||||||||||||||||||||
| Grade | Grade | Ounces Ag | Ounces Au | Grade | Grade | |||||||||||||||||||||||||||
| Tons (000’s) | Ag oz/t | Au oz/t | (000’s) | (000’s) | Tons (000’s) | Ag oz/t | Au oz/t | |||||||||||||||||||||||||
| Rochester | — | — | — | — | — | 32,664 | 0.85 | 0.01 | ||||||||||||||||||||||||
| Cerro Bayo | 782 | 9.26 | 0.14 | 7,234 | 112 | 2,865 | 9.28 | 0.14 | ||||||||||||||||||||||||
| Mina Martha | 154 | 53.97 | 0.07 | 8,293 | 11 | 165 | 32.75 | 0.04 | ||||||||||||||||||||||||
Endeavor(2) | 19,731 | 1.52 | — | 29,926 | — | 12,291 | 2.44 | — | ||||||||||||||||||||||||
Broken Hill(2) | 12,394 | 1.45 | — | 17,931 | — | 9,844 | 3.82 | — | ||||||||||||||||||||||||
| San Bartolomé | 42,043 | 3.64 | — | 153,003 | — | 15,816 | 2.21 | — | ||||||||||||||||||||||||
| Kensington | 4,419 | — | 0.31 | — | 1,352 | 4,320 | — | 0.20 | ||||||||||||||||||||||||
| Palmarejo | — | — | — | — | — | 33,852 | 4.44 | 0.05 | ||||||||||||||||||||||||
| Total tons | 79,523 | 216,387 | 1,475 | |||||||||||||||||||||||||||||
| Ag oz/t | Au oz/t | Ag oz/t | Au oz/t | |||||||||||||||||||||
| Summary by metal: | Total tons (000’s) | (Wt. Avg.) | (Wt. Avg.) | Total tons (000’s) | (Wt. Avg.) | (Wt. Avg.) | ||||||||||||||||||
| Silver | 75,104 | 2.88 | — | 107,495 | 2.91 | — | ||||||||||||||||||
| Gold | 5,354 | — | 0.28 | 73,865 | — | 0.04 | ||||||||||||||||||
| (1) | Using silver price of |
| (2) | Ore reserves are provided by the operator as of June 30, |
| Per ounce | Per ounce | (000’s) | (000’s) | |||||||||||||||||
| Silver Price | Gold Price | Tons (000’s) | Ounces Ag | Ounces Au | ||||||||||||||||
| Cerro Bayo | $ | 10 | $ | 550 | 625 | 6,235 | 97 | |||||||||||||
| $ | 11 | $ | 600 | 782 | 7,234 | 112 | ||||||||||||||
| $ | 12 | $ | 650 | 839 | 7,739 | 117 | ||||||||||||||
| $ | 13 | $ | 600 | 895 | 8,126 | 120 | ||||||||||||||
| Mina Martha | $ | 10 | $ | 550 | 148 | 8,200 | 10 | |||||||||||||
| $ | 11 | $ | 600 | 154 | 8,293 | 11 | ||||||||||||||
| $ | 12 | $ | 650 | 160 | 8,377 | 11 | ||||||||||||||
| $ | 13 | $ | 700 | 164 | 8,434 | 11 | ||||||||||||||
| San Bartolomé | $ | 10 | 36,967 | 142,060 | — | |||||||||||||||
| $ | 11 | 42,043 | 153,003 | — | ||||||||||||||||
| $ | 12 | 48,331 | 165,413 | — | ||||||||||||||||
| $ | 13 | 52,783 | 173,135 | — | ||||||||||||||||
| Kensington | $ | 510 | 4,102 | — | 1,294 | |||||||||||||||
| $ | 550 | 4,419 | — | 1,352 | ||||||||||||||||
| $ | 600 | 4,594 | — | 1,380 | ||||||||||||||||
59
| Per ounce Silver Price | Per ounce Gold Price | Tons (000’s) | (000’s) Ounces AG | (000’s) Ounces AU | |||||||
| Rochester | $8.00 | $475 | 3,720 | 2,436 | 26 | ||||||
| $9.50 | $510 | 4,229 | 2,972 | 30 | |||||||
| $11.25 | $550 | 4,368 | 2,986 | 29 | |||||||
| $12.00 | $600 | 4,533 | 3,077 | 30 | |||||||
| Cerro Bayo | $8.00 | $475 | 634 | 122 | 6 | ||||||
| $9.50 | $510 | 643 | 124 | 6 | |||||||
| $11.25 | $550 | 646 | 124 | 6 | |||||||
| $12.00 | $600 | 668 | 128 | 6 | |||||||
| Mina Martha | $8.00 | $475 | 99 | 9 | 6 | ||||||
| $9.50 | $510 | 102 | 9 | 6 | |||||||
| $11.25 | $550 | 102 | 9 | 6 | |||||||
| $12.00 | $600 | 102 | 9 | 6 | |||||||
| Kensington | $475 | 3,710 | 1,220 | ||||||||
| $510 | 4,102 | 1,294 | |||||||||
| $550 | 4,419 | 1,352 | |||||||||
| $600 | 4,594 | 1,380 | |||||||||
54
| 2007 | 2006 | 2005 | ||||||||||
Rochester | ||||||||||||
| Tons processed | 5,060,678 | 10,399,416 | 9,327,180 | |||||||||
| Ore grade/Ag oz | 0.65 | 0.74 | 0.91 | |||||||||
| Ore grade/Au oz | 0.01 | 0.01 | 0.01 | |||||||||
Recovery/Ag oz(A) | 141.4% | 65.9% | 67.5% | |||||||||
Recovery/Au oz(A) | 167.6% | 68.9% | 76.2% | |||||||||
| Silver production ounces | 4,614,780 | 5,113,504 | 5,720,489 | |||||||||
| Gold production ounces | 50,408 | 71,891 | 70,298 | |||||||||
| Cash cost/oz | $ | 1.52 | $ | 2.80 | $ | 4.82 | ||||||
| Total cost/oz | $ | 3.82 | $ | 5.84 | $ | 6.66 | ||||||
Cerro Bayo | ||||||||||||
| Tons milled | 387,378 | 428,346 | 403,695 | |||||||||
| Ore grade/Ag oz | 4.68 | 5.76 | 7.52 | |||||||||
| Ore grade/Au oz | 0.11 | 0.10 | 0.16 | |||||||||
| Recovery/Ag oz | 94.4% | 94.5% | 94.7% | |||||||||
| Recovery/Au oz | 92.2% | 93.0% | 92.8% | |||||||||
| Silver production ounces | 1,709,830 | 2,331,060 | 2,875,047 | |||||||||
| Gold production ounces | 37,479 | 40,923 | 61,058 | |||||||||
| Cash cost/oz | $ | 8.22 | $ | 3.04 | $ | 0.54 | ||||||
| Total cost/oz | $ | 11.82 | $ | 5.46 | $ | 2.30 | ||||||
Martha Mine | ||||||||||||
| Tons milled | 37,047 | 35,843 | 35,293 | |||||||||
| Ore grade/Ag oz | 78.10 | 79.93 | 62.53 | |||||||||
| Ore grade/Au oz | 0.12 | 0.10 | 0.08 | |||||||||
| Recovery/Ag oz | 95.0% | 94.7% | 94.9% | |||||||||
| Recovery/Au oz | 92.7% | 92.5% | 92.9% | |||||||||
| Silver production ounces | 2,748,705 | 2,712,846 | 2,093,464 | |||||||||
| Gold production ounces | 4,127 | 3,440 | 2,589 | |||||||||
| Cash cost/oz | $ | 6.27 | $ | 4.88 | $ | 4.60 | ||||||
| Total cost/oz | $ | 6.78 | $ | 5.36 | $ | 5.01 | ||||||
Endeavor(B) | ||||||||||||
| Tons milled | 1,146,857 | 750,115 | 463,129 | |||||||||
| Ore grade/Ag oz | 1.40 | 1.01 | 1.52 | |||||||||
| Recovery/Ag oz | 48.0% | 63.5% | 45.0% | |||||||||
| Silver production ounces | 772,609 | 481,991 | 316,169 | |||||||||
| Cash cost/oz | $ | 2.67 | $ | 2.85 | $ | 2.05 | ||||||
| Total cost/oz | $ | 3.65 | $ | 3.87 | $ | 3.35 | ||||||
Broken Hill(B) | ||||||||||||
| Tons milled | 1,646,203 | 2,288,355 | 667,140 | |||||||||
| Ore grade/Ag oz | 1.19 | 1.28 | 1.31 | |||||||||
| Recovery/Ag oz | 83.6% | 74.2% | 75.4% | |||||||||
| Silver production ounces | 1,642,205 | 2,174,585 | 657,093 | |||||||||
| Cash cost/oz | $ | 3.18 | $ | 3.09 | $ | 2.72 | ||||||
| Total cost/oz | $ | 5.04 | $ | 5.44 | $ | 5.47 | ||||||
CONSOLIDATED PRODUCTION TOTALS | ||||||||||||
| Silver ounces | 11,488,129 | 12,813,986 | 11,662,262 | |||||||||
| Gold ounces | 92,014 | 116,254 | 133,945 | |||||||||
| Cash cost per oz/silver | $ | 3.97 | $ | 3.33 | $ | 3.53 | ||||||
| Total cost/oz | $ | 5.88 | $ | 5.53 | $ | 5.13 | ||||||
CONSOLIDATED SALES TOTALS(C) | ||||||||||||
| Silver ounces sold | 11,506,560 | 12,841,634 | 12,579,634 | |||||||||
| Gold ounces sold | 94,284 | 116,400 | 146,749 | |||||||||
| Realized price per silver ounce | $ | 13.59 | $ | 12.03 | $ | 7.47 | ||||||
| Realized price per gold ounce | $ | 700 | $ | 623 | $ | 452 | ||||||
60
| 2006 | 2005 | 2004 | |||||
| Rochester | |||||||
| Tons processed | 10,399,416 | 9,327,180 | 12,435,346 | ||||
| Ore grade/Ag oz | 0.74 | 0.91 | 0.74 | ||||
| Ore grade/Au oz | 0.01 | 0.01 | 0.01 | ||||
| Recovery/Ag oz(A) | 65.9 | % | 67.5 | % | 61.5 | % | |
| Recovery/Au oz(A) | 68.9 | % | 76.2 | % | 64.2 | % | |
| Silver production ounces | 5,113,504 | 5,720,489 | 5,669,074 | ||||
| Gold production ounces | 71,891 | 70,298 | 69,456 | ||||
| Cash cost/oz | $2.80 | $4.82 | $3.93 | ||||
| Total cost/oz | $5.84 | $6.66 | $5.66 | ||||
| Cerro Bayo | |||||||
| Tons milled | 428,346 | 403,695 | 456,941 | ||||
| Ore grade/Ag oz | 5.76 | 7.52 | 7.51 | ||||
| Ore grade/Au oz | 0.10 | 0.16 | 0.14 | ||||
| Recovery/Ag oz | 94.5 | % | 94.7 | % | 94.2 | % | |
| Recovery/Au oz | 93.0 | % | 92.8 | % | 91.8 | % | |
| Silver production ounces | 2,331,060 | 2,875,047 | 3,235,192 | ||||
| Gold production ounces | 40,923 | 61,058 | 57,558 | ||||
| Cash cost/oz | $3.04 | $0.54 | $1.01 | ||||
| Total cost/oz | $5.46 | $2.30 | $2.43 | ||||
| Martha Mine | |||||||
| Tons milled | 35,843 | 35,293 | 30,276 | ||||
| Ore grade/Ag oz | 79.93 | 62.53 | 59.94 | ||||
| Ore grade/Au oz | 0.10 | 0.08 | 0.08 | ||||
| Recovery/Ag oz | 94.7 | % | 94.9 | % | 94.2 | % | |
| Recovery/Au oz | 92.5 | % | 92.9 | % | 91.6 | % | |
| Silver production ounces | 2,712,846 | 2,093,464 | 1,709,069 | ||||
| Gold production ounces | 3,440 | 2,589 | 2,318 | ||||
| Cash cost/oz | $4.88 | $4.60 | $4.08 | ||||
| Total cost/oz | $5.36 | $5.01 | $5.05 | ||||
| Endeavor(B) | |||||||
| Tons milled | 750,115 | 463,129 | -- | ||||
| Ore grade/Ag oz | 1.01 | 1.52 | -- | ||||
| Recovery/Ag oz | 63.5 | % | 45.0 | % | -- | ||
| Silver production ounces | 481,991 | 316,169 | -- | ||||
| Cash cost/oz | $2.85 | $2.05 | -- | ||||
| Total cost/oz | $3.87 | $3.35 | -- | ||||
| Broken Hill(B) | |||||||
| Tons milled | 2,288,355 | 667,140 | -- | ||||
| Ore grade/Ag oz | 1.28 | 1.31 | -- | ||||
| Recovery/Ag oz | 74.2 | % | 75.4 | % | -- | ||
| Silver production ounces | 2,174,585 | 657,093 | -- | ||||
| Cash cost/oz | $3.09 | $2.72 | -- | ||||
| Total cost/oz | $5.44 | $5.47 | -- | ||||
| CONSOLIDATED PRODUCTION TOTALS | |||||||
| Silver ounces | 12,813,986 | 11,662,262 | 10,613,335 | ||||
| Gold ounces | 116,254 | 133,945 | 129,332 | ||||
| Cash cost per oz/silver | $3.33 | $3.53 | $3.06 | ||||
| Total cost/oz | $5.53 | $5.13 | $4.58 | ||||
| CONSOLIDATED SALES TOTALS(C) | |||||||
| Silver ounces sold | 12,841,634 | 12,579,634 | 9,669,283 | ||||
| Gold ounces sold | 116,400 | 146,749 | 117,257 | ||||
| Realized price per silver ounce | $12.03 | $7.47 | $6.72 | ||||
| Realized price per gold ounce | $623 | $452 | $409 | ||||
| (A) | The leach cycle at Rochester requires 5 to 10 years to recover gold and silver contained in the ore. The Company estimates the ultimate recovery to be approximately 61.5% for silver and 93% for gold. However, ultimate recoveries will not be known until leaching operations cease which is currently |
55
| (B) | The Company acquired its interests in the Endeavor and Broken Hill mines in May 2005 and September 2005, respectively. |
| (C) | Units sold at realized metal prices will not match reported metal sales due primarily to the effects on revenues of mark-to-market adjustments on embedded derivatives in the Company’s provisionally priced sales contracts. |
| Year Ended December 31, | |||||||
| 2006 | 2005 | 2004 | |||||
| Silver Valley/Galena | |||||||
| Tons milled | 52,876 | 128,502 | 169,413 | ||||
| Ore grade/Silver oz | 15.15 | 16.53 | 21.43 | ||||
| Recovery/Silver oz | 96.0 | % | 97.0 | % | 97.0 | % | |
| Silver production ounces | 768,674 | 2,060,338 | 3,521,813 | ||||
| Cash cost/oz | $9.75 | $8.37 | $5.46 | ||||
| Total cost/oz | $10.64 | $9.34 | $6.02 | ||||
| Gold production | 180 | 282 | 354 | ||||
| Year Ended December 31, | ||||||||
| 2006 | 2005 | |||||||
Silver Valley/Galena | ||||||||
| Tons milled | 52,876 | 128,502 | ||||||
| Ore grade/Silver oz | 15.15 | 16.53 | ||||||
| Recovery/Silver oz | 96.0 | % | 97.0 | % | ||||
| Silver production ounces | 768,674 | 2,060,338 | ||||||
| Cash cost/oz | $ | 9.75 | $ | 8.37 | ||||
| Total cost/oz | $ | 10.64 | $ | 9.34 | ||||
| Gold production | 180 | 282 | ||||||
61
56
(In thousands except ounces and per ounce costs)
| Rochester | Cerro Bayo | Martha | Endeavor(1) | Broken Hill(1) | Total | |||||||||||||||||||
| Production of silver (ounces) | 4,614,780 | 1,709,830 | 2,748,705 | 772,609 | 1,642,205 | 11,488,129 | ||||||||||||||||||
| Cash costs per ounce | $ | 1.52 | $ | 8.22 | $ | 6.27 | $ | 2.67 | $ | 3.18 | $ | 3.97 | ||||||||||||
| Total Cash Costs (Non-GAAP) | $ | 7,035 | $ | 14,055 | $ | 17,245 | $ | 2,064 | $ | 5,228 | $ | 45,627 | ||||||||||||
| Add/Subtract: | ||||||||||||||||||||||||
| Third party smelting costs | — | (3,603 | ) | (2,112 | ) | (1,347 | ) | (2,006 | ) | (9,068 | ) | |||||||||||||
By-product credit(2) | 34,664 | 26,199 | 2,889 | — | — | 63,752 | ||||||||||||||||||
| Other adjustment | 1,926 | — | — | — | — | 1,926 | ||||||||||||||||||
| Change in inventory | 16,738 | (1,701 | ) | (146 | ) | (172 | ) | 69 | 14,788 | |||||||||||||||
| Depreciation, depletion and amortization | 8,697 | 6,155 | 1,383 | 755 | 3,055 | 20,045 | ||||||||||||||||||
| Production costs applicable to sales, including depreciation, depletion and amortization (GAAP) | $ | 69,060 | $ | 41,105 | $ | 19,259 | $ | 1,300 | $ | 6,346 | $ | 137,070 | ||||||||||||
(In thousands except ounces and per ounce costs)
| Rochester | Cerro Bayo | Martha | Endeavor(1) | Broken Hill(1) | Total | |||||||||||||||||||
| Production of silver (ounces) | 5,113,504 | 2,331,060 | 2,712,846 | 481,991 | 2,174,585 | 12,813,986 | ||||||||||||||||||
| Cash costs per ounce | $ | 2.80 | $ | 3.04 | $ | 4.88 | $ | 2.85 | $ | 3.09 | $ | 3.33 | ||||||||||||
| Total Cash Costs (Non-GAAP) | $ | 14,299 | $ | 7,089 | $ | 13,240 | $ | 1,373 | $ | 6,712 | $ | 42,713 | ||||||||||||
| Add/Subtract: | ||||||||||||||||||||||||
| Third party smelting costs | — | (3,475 | ) | (1,853 | ) | (948 | ) | (2,620 | ) | (8,896 | ) | |||||||||||||
By-product credit(2) | 43,697 | 24,861 | 2,079 | — | — | 70,637 | ||||||||||||||||||
| Other adjustment | 1,803 | — | — | — | — | 1,803 | ||||||||||||||||||
| Change in inventory | (12,489 | ) | (1,105 | ) | (518 | ) | (39 | ) | 272 | (13,879 | ) | |||||||||||||
| Depreciation, depletion and amortization | 13,745 | 5,638 | 1,297 | 490 | 5,120 | 26,290 | ||||||||||||||||||
| Production costs applicable to sales, including depreciation, depletion and amortization (GAAP) | $ | 61,055 | $ | 33,008 | $ | 14,245 | $ | 876 | $ | 9,484 | $ | 118,668 | ||||||||||||
62
| YEAR ENDED DECEMBER 31, 2006 | ||||||||||||||||||||
|---|---|---|---|---|---|---|---|---|---|---|---|---|---|---|---|---|---|---|---|---|
| (In thousands except ounces and per ounce costs) | ||||||||||||||||||||
| Rochester | Cerro Bayo | Martha | Endeavor(1) | Broken Hill(1) | Total | |||||||||||||||
Production of silver (ounces) | 5,113,504 | 2,331,060 | 2,712,846 | 481,991 | 2,174,585 | 12,813,986 | ||||||||||||||
| Cash costs per ounce | $ | 2.80 | $ | 3.04 | $ | 4.88 | $ | 2.85 | $ | 3.09 | $ | 3.33 | ||||||||
Total cash costs (Non-GAAP) | $ | 14,299 | $ | 7,089 | $ | 13,240 | $ | 1,373 | $ | 6,712 | $ | 42,713 | ||||||||
| Add/Subtract: | ||||||||||||||||||||
| Third party smelting costs | -- | (3,475 | ) | (1,853 | ) | (948 | ) | (2,620 | ) | (8,896 | ) | |||||||||
| By-product credit (2) | 43,697 | 24,861 | 2,079 | -- | -- | 70,637 | ||||||||||||||
| Other adjustment | 1,803 | -- | -- | -- | -- | 1,803 | ||||||||||||||
| Change in inventory | (12,489 | ) | (1,105 | ) | (518 | ) | (39 | ) | 272 | (13,879 | ) | |||||||||
| Depreciation, depletion and | ||||||||||||||||||||
| amortization | 15,548 | 5,638 | 1,297 | 490 | 5,120 | 28,093 | ||||||||||||||
Production costs applicable | ||||||||||||||||||||
| to sales, including | ||||||||||||||||||||
| depreciation, depletion | ||||||||||||||||||||
| and amortization (GAAP) | $ | 62,858 | $ | 33,008 | $ | 14,245 | $ | 876 | $ | 9,484 | $ | 120,471 | ||||||||
| YEAR ENDED DECEMBER 31, 2005 | ||||||||||||||||||||
|---|---|---|---|---|---|---|---|---|---|---|---|---|---|---|---|---|---|---|---|---|
| (In thousands except ounces and per ounce costs) | ||||||||||||||||||||
| Rochester | Cerro Bayo | Martha | Endeavor(1) | Broken Hill(1) | Total | |||||||||||||||
Production of silver (ounces) | 5,720,489 | 2,875,047 | 2,093,464 | 316,169 | 657,093 | 11,662,262 | ||||||||||||||
| Cash costs per ounce | $ | 4.82 | $ | 0.54 | $ | 4.60 | $ | 2.05 | $ | 2.72 | $ | 3.53 | ||||||||
Total cash costs (Non-GAAP) | $ | 27,575 | $ | 1,542 | $ | 9,637 | $ | 648 | $ | 1,790 | $ | 41,192 | ||||||||
| Add/Subtract: | ||||||||||||||||||||
| Third party smelting costs | -- | (2,783 | ) | (1,165 | ) | (370 | ) | (570 | ) | (4,888 | ) | |||||||||
| By-product credit (2) | 31,601 | 27,114 | 1,152 | -- | -- | 59,867 | ||||||||||||||
| Other adjustment | 140 | -- | -- | -- | -- | 140 | ||||||||||||||
| Change in inventory | (14,769 | ) | 7,421 | (328 | ) | -- | (403 | ) | (8,079 | ) | ||||||||||
| Depreciation, depletion and | ||||||||||||||||||||
| amortization | 10,542 | 5,064 | 843 | 411 | 1,807 | 18,667 | ||||||||||||||
Production costs applicable | ||||||||||||||||||||
| to sales, including | ||||||||||||||||||||
| depreciation, depletion | ||||||||||||||||||||
| and amortization (GAAP) | $ | 55,089 | $ | 38,358 | $ | 10,139 | $ | 689 | $ | 2,624 | $ | 106,899 | ||||||||
57
| YEAR ENDED DECEMBER 31, 2004 | ||||||||||||||||||||
|---|---|---|---|---|---|---|---|---|---|---|---|---|---|---|---|---|---|---|---|---|
| (In thousands except ounces and per ounce costs) | ||||||||||||||||||||
| Rochester | Cerro Bayo | Martha | Endeavor(1) | Broken Hill(1) | Total | |||||||||||||||
Production of silver (ounces) | 5,669,074 | 3,235,192 | 1,709,069 | -- | -- | 10,613,335 | ||||||||||||||
| Cash costs per ounce | $ | 3.93 | $ | 1.01 | $ | 4.08 | -- | -- | $ | 3.06 | ||||||||||
Total cash costs (Non-GAAP) | $ | 22,287 | $ | 3,253 | $ | 6,975 | -- | -- | $ | 32,515 | ||||||||||
| Add/Subtract: | ||||||||||||||||||||
| Third party smelting costs | -- | (4,106 | ) | (887 | ) | -- | -- | (4,993 | ) | |||||||||||
| By-product credit (2) | 28,646 | 23,845 | 951 | -- | -- | 53,442 | ||||||||||||||
| Other adjustment | (403 | ) | 110 | -- | -- | -- | (293 | ) | ||||||||||||
| Change in inventory | (13,380 | ) | (3,212 | ) | (364 | ) | -- | -- | (16,956 | ) | ||||||||||
| Depreciation, depletion and | ||||||||||||||||||||
| amortization | 9,827 | 4,588 | 1,652 | -- | -- | 16,067 | ||||||||||||||
Production costs applicable | ||||||||||||||||||||
| to sales, including | ||||||||||||||||||||
| depreciation, depletion | ||||||||||||||||||||
| and amortization (GAAP) | $ | 46,977 | $ | 24,478 | $ | 8,327 | -- | -- | $ | 79,782 | ||||||||||
(In thousands except ounces and per ounce costs)
| Rochester | Cerro Bayo | Martha | Endeavor(1) | Broken Hill(1) | Total | |||||||||||||||||||
| Production of silver (ounces) | 5,720,489 | 2,875,047 | 2,093,464 | 316,169 | 657,093 | 11,662,262 | ||||||||||||||||||
| Cash costs per ounce | $ | 4.82 | $ | 0.54 | $ | 4.60 | $ | 2.05 | $ | 2.72 | $ | 3.53 | ||||||||||||
| Total cash costs (Non-GAAP) | $ | 27,575 | $ | 1,542 | $ | 9,637 | $ | 648 | $ | 1,790 | $ | 41,192 | ||||||||||||
| Add/Subtract: | ||||||||||||||||||||||||
| Third party smelting costs | — | (2,783 | ) | (1,165 | ) | (370 | ) | (570 | ) | (4,888 | ) | |||||||||||||
By-product credit(2) | 31,601 | 27,114 | 1,152 | — | — | 59,867 | ||||||||||||||||||
| Other adjustment | 140 | — | — | — | — | 140 | ||||||||||||||||||
| Change in inventory | (14,769 | ) | 7,421 | (328 | ) | — | (403 | ) | (8,079 | ) | ||||||||||||||
| Depreciation, depletion and amortization | 10,402 | 5,064 | 843 | 411 | 1,807 | 18,527 | ||||||||||||||||||
| Production costs applicable to sales, including depreciation, depletion and amortization (GAAP) | $ | 54,949 | $ | 38,358 | $ | 10,139 | $ | 689 | $ | 2,624 | $ | 106,759 | ||||||||||||
| Coeur Silver Valley/Galena | |||||||||||
| 2006(3) | 2005 | 2004 | |||||||||
| Production of silver (ounces) | 768,674 | 2,060,338 | 3,521,813 | ||||||||
| Cash costs per ounce | $ | 9.75 | $ | 8.37 | $ | 5.46 | |||||
Total cash costs (Non-GAAP) | $ | 7,498 | $ | 17,248 | $ | 19,231 | |||||
| Add/Subtract: | |||||||||||
| Third party smelting costs | (1,464 | ) | (3,091 | ) | (5,117 | ) | |||||
| By-product credit(2) | 1,473 | 2,722 | 3,766 | ||||||||
| Change in inventory | 726 | (181 | ) | 757 | |||||||
| Depreciation, depletion and | |||||||||||
| amortization | 681 | 1,996 | 1,967 | ||||||||
Production costs applicable to | |||||||||||
| sales, including depreciation, | |||||||||||
| depletion and amortization (GAAP) | $ | 8,914 | $ | 18,694 | $ | 20,604 | |||||
| Coeur Silver Valley/Galena | 2006(3) | 2005 | ||||||
| Production of silver (ounces) | 768,674 | 2,060,338 | ||||||
| Cash costs per ounce | $ | 9.75 | $ | 8.37 | ||||
| Total Cash Costs (Non-GAAP) | $ | 7,498 | $ | 17,248 | ||||
| Add/Subtract: | ||||||||
| Third party smelting costs | (1,464 | ) | (3,091 | ) | ||||
By-product credit(2) | 1,473 | 2,722 | ||||||
| Change in inventory | 726 | (181 | ) | |||||
| Depreciation, depletion and amortization | 681 | 1,996 | ||||||
| Production costs applicable to sales, including depreciation, depletion and amortization (GAAP) | $ | 8,914 | $ | 18,694 | ||||
| (1) | The Company’s share of silver production at Endeavor and Broken Hill commenced in May 2005 and September 2005, respectively. |
| (2) | By-product credits are based upon production units and the period’s average metal price for purposes of reporting cash costs per ounce. |
| (3) | Amounts represent five months ended May 31, 2006. |
Results of OperationsYear Ended December 31, 2007 Compared to Year Ended December 31, 2006Revenues Sales of metal from continuing operations in the year ended December 31, 2007 decreased by $1.3 million, or 1%, from the year ended December 31, 2006 to $215.3 million. The decrease in sales of metal was primarily due to a decrease in the quantity of silver and gold ounces sold during 2007, partially offset by increased metal prices realized. In 2007, the Company sold 11.6 million ounces of silver and 94,284 ounces of gold, compared to sales of 12.8 million ounces of silver and 116,400 ounces of gold in 2006. In the year ended December 31, 2007, the Company realized average silver and gold prices of $13.59 and $700, respectively, compared with realized average prices of $12.03 and $623, respectively, in the prior year.63
64
| Year Ended December 31, | ||||||||
| 2007 | 2006 | |||||||
| Current: | ||||||||
| United States — Alternative minimum tax | $ | (381 | ) | $ | (900 | ) | ||
| United States — Foreign withholding | (904 | ) | (713 | ) | ||||
| Foreign — Argentina | (6,590 | ) | (4,842 | ) | ||||
| Foreign — Australia | (4,898 | ) | (4,673 | ) | ||||
| Deferred: | ||||||||
| Foreign — Argentina | 172 | 65 | ||||||
| Foreign — Australia | (664 | ) | (93 | ) | ||||
| Foreign — Chile | (1,662 | ) | 2,930 | |||||
| Income tax provision | $ | (14,927 | ) | $ | (8,226 | ) | ||
65
58
The following table sets forth
to $92.4 million. The increase in production costs applicable to sales for the year is primarily the result of production costs associated with the Endeavor and Broken Hill mines, in which the Company acquired the silver production and reserves on May 23, 2005 and September 8, 2005, respectively.
59
66
| Year Ended December 31, | ||||||||
| 2006 | 2005 | |||||||
| Current: | ||||||||
| United States - Alternative minimum tax | $ | (900 | ) | $ | 212 | |||
| United States - Foreign withholding | (713 | ) | -- | |||||
| Foreign - Argentina | (4,842 | ) | (66 | ) | ||||
| Foreign - Australia | (4,673 | ) | -- | |||||
| Deferred: | ||||||||
| Foreign - Argentina | 65 | 929 | ||||||
| Foreign - Australia | (93 | ) | (404 | ) | ||||
| Foreign - Chile | 2,930 | (2,154 | ) | |||||
| Income tax benefit (provision) | $ | (8,226 | ) | $ | (1,483 | ) | ||
| Year Ended December 31, | ||||||||
| 2006 | 2005 | |||||||
| Current: | ||||||||
| United States — Alternative minimum tax | $ | (900 | ) | $ | 212 | |||
| United States — Foreign withholding | (713 | ) | — | |||||
| Foreign — Argentina | (4,842 | ) | (66 | ) | ||||
| Foreign — Australia | (4,673 | ) | — | |||||
| Deferred: | ||||||||
| Foreign — Argentina | 65 | 929 | ||||||
| Foreign — Australia | (93 | ) | (404 | ) | ||||
| Foreign — Chile | 2,930 | (2,154 | ) | |||||
| Income tax provision | $ | (8,226 | ) | $ | (1,483 | ) | ||
60
67
| Year Ended December 31, | ||||||||
| 2006 | 2005 | |||||||
| Sales of metal | $ | 11,223 | $ | 16,052 | ||||
| Production costs applicable to sales | (8,233 | ) | (16,698 | ) | ||||
| Depreciation and depletion | (681 | ) | (1,996 | ) | ||||
| Mining exploration | (279 | ) | (1,361 | ) | ||||
| Other | (95 | ) | (192 | ) | ||||
| Income (loss) from discontinued operations, net of taxes | 1,935 | (4,195 | ) | |||||
| Gain on sale of net assets of discontinued operations | 11,132 | -- | ||||||
| Net income (loss) for discontinued operations, net of taxes | $ | 13,067 | $ | (4,195 | ) | |||
Year Ended December 31, 2005 Compared to Year Ended December 31, 2004
| Year Ended December 31, | ||||||||
| 2006 | 2005 | |||||||
| Sales of metal | $ | 11,223 | $ | 16,052 | ||||
| Production costs applicable to sales | (8,233 | ) | (16,698 | ) | ||||
| Depreciation and depletion | (681 | ) | (1,996 | ) | ||||
| Mining exploration | (279 | ) | (1,361 | ) | ||||
| Other | (95 | ) | (192 | ) | ||||
| Income (loss) from discontinued operations, net of taxes | 1,935 | (4,195 | ) | |||||
| Gain on sale of net assets of discontinued operations | 11,132 | — | ||||||
| Net income (loss) for discontinued operations, net of taxes | $ | 13,067 | $ | (4,195 | ) | |||
Sales of metal in the year ended December 31, 2005 increased by $47.2 million, or 43%, over the year ended December 31, 2004 to $156.3 million. The increase in sales was primarily attributable to an increase in the quantity of silver and gold sold during 2005 and increased metal prices realized in 2005 as compared to 2004. In 2005, the Company sold 12.6 million ounces of silver and 146,749 ounces of gold, compared to sales of 9.7 million ounces of silver and 117,257 ounces of gold in 2004. In the year ended December 31, 2005, the Company realized average silver and gold prices of $7.47 and $452, respectively, compared with realized average prices of $6.72 and $409, respectively, in the prior year.
Included in revenues is the by-product revenue associated with by-product metal sales consisting of gold. In 2005, by-product revenues totaled $64.4 million compared to $45.9 million in 2004. The increase is primarily due to an increase in the quantity of gold sold and higher gold prices realized in 2005 compared to 2004. The Company believes, based on the best estimates, that presentation of these revenue streams as by-products from its current operations will continue to be appropriate in the future.
In the year ended December 31, 2005, the Company produced a total of 11.7 million ounces of silver and 133,945 ounces of gold compared to 10.6 million ounces of silver and 129,332 ounces of gold in 2004. The higher silver production in 2005, as compared to 2004, was primarily due higher silver production from the Rochester and Martha mines. In addition, on May 23, 2005, the Company acquired silver production and reserves contained at the Endeavor mine in Australia, which is owned and operated by Cobar Operations Pty. Limited, a subsidiary of CBH Resources Ltd. Coeur’s share of silver production there amounted to 316,169 ounces. On September 8, 2005, the Company acquired silver production and reserves contained at the Broken Hill mine in Australia, which is owned and operated by Perilya Broken Hill Ltd. Coeur’s share of silver production at that mine from September 8, 2005 to December 31, 2005 amounted to 657,093 ounces.
61
Costs and Expenses
The following table sets forth year 2005 versus year 2004 costs and expenses:
The increase in production costs applicable to sales for the year is primarily the result of higher diesel, utility and operating materials and supply costs at the Company’s mining operations and the Company’s operating costs associated with the Company’s newly acquired interests in the Endeavor and Broken Hill mines.
Depreciation and amortization increased in the year ended December 31, 2005 by $2.1 million, or 12%, over the prior year, primarily due to the increased depletion associated with the Company’s newly acquired interests in the Endeavor and Broken Hill mines.
Administrative and general expenses increased $3.1 million in the year ended December 31, 2005 compared to 2004 due primarily to higher outside audit services of $1.4 million related to financial reporting compliance activities, higher compensation costs of $0.7 million and $1.0 million in increased other general administration expenses.
Exploration expenses increased $2.5 million in the year ended December 31, 2005 compared to 2004, due to increased exploration activities at the Kensington, Cerro Bayo and Martha mines.
Pre-development expense decreased $5.4 million due to the classification of the San Bartolome and Kensington projects as development-stage properties in the fourth quarter of 2004 and the third quarter of 2005, respectively.
During 2005, the Company recorded a litigation settlement of $1.6 million related to the Company’s settlement of the suit by Credit Suisse First Boston. See Note R — Litigation.
Other Income and Expenses
Interest and other income in the year ended December 31, 2005 increased by $5.2 million compared with the year ended December 31, 2004 due to higher interest rates earned on the Company’s cash, cash equivalents and short-term investments. Interest expense decreased $0.3 million in the year ended December 31, 2005 compared to 2004, due to the fact that the Company began capitalizing a portion of its interest expense associated with the capitalization of development expenditures at the Kensington and San Bartolome development projects. Capitalized interest was $0.2 million in 2005 compared to $0.1 million in 2004.
62
Expenses of $15.7 million were incurred in 2004 in connection with the Company’s tender offer for outstanding shares of Wheaton River Minerals Ltd. That offer expired on September 30, 2004, with Coeur not purchasing any Wheaton shares tendered due to unsatisfied conditions of the offer. No such expenses were incurred in 2005.
Income Taxes
For the year ended December 31, 2005, the Company recorded an income tax provision of approximately $1.5 million compared to a tax benefit of approximately $5.8 million in 2004. The following table summarizes the components of the Company’s income tax provision (benefit) for the years 2005 and 2004:
| Year Ended December 31, | ||||||||
| 2005 | 2004 | |||||||
| Current: | ||||||||
| United States - Alternative minimum tax | $ | 212 | $ | 1,382 | ||||
| Foreign - Argentina | (66 | ) | -- | |||||
| Deferred: | ||||||||
| Foreign - Argentina | 929 | -- | ||||||
| Foreign - Australia | (404 | ) | -- | |||||
| Foreign - Chile | (2,154 | ) | 4,403 | |||||
| Income tax benefit (provision) | $ | (1,483 | ) | $ | 5,785 | |||
In 2005, the Company recognized a $0.2 million current US benefit from the refund of prior year alternative minimum taxes, an estimated current provision in Argentina, and $0.9 million Argentina deferred tax benefit from the anticipated utilization of other deductible temporary differences. Further, the Company recognized a $0.4 million Australia deferred tax provision on originating temporary differences, and a $2.2 million Chile deferred tax provision related to the utilization of net operating loss carry-forwards for which deferred tax assets were previously recognized.
In 2004, the Company recognized a $1.4 million US current benefit associated with the reversal of a prior year tax accrual and a $4.4 million Chile deferred tax benefit associated with the anticipated utilization of net operating loss carry-forwards.
Results of Discontinued Operations
On June 1, 2006, the Company completed the sale of 100% of the shares of Coeur Silver Valley Inc. to U.S. Silver Corporation for $15 million in cash. Pursuant to FAS 144, Accounting for the Impairment or Disposal of Long-Lived Assets, Coeur Silver Valley has been classified as an asset held for sale and reported in discontinued operations for years ended December 31, 2005 and 2004. The Company recognized a gain of approximately $11.1 million on the sale in 2006.
The following is a summary of the Company’s discontinued operations included in the consolidated statements of operations for the years ended December 31, 2005 and 2004 (in thousands):
| Year Ended December 31, | ||||||||
| 2005 | 2004 | |||||||
| Sales of metal | $ | 16,052 | $ | 23,759 | ||||
| Production costs applicable to sales | (16,698 | ) | (18,637 | ) | ||||
| Depreciation and depletion | (1,996 | ) | (1,967 | ) | ||||
| Mining exploration | (1,361 | ) | (1,620 | ) | ||||
| Other | (192 | ) | (357 | ) | ||||
| Net income (loss) for discontinued operations | $ | (4,195 | ) | $ | 1,178 | |||
63
Liquidity and Capital Resources
2006.
| Year Ended December 31, | |||||||||||
| 2006 | 2005 | 2004 | |||||||||
| (In thousands) | |||||||||||
Cash collected from customers | $ | 212,102 | $ | 136,967 | $ | 109,383 | |||||
| Cash paid to suppliers, employees, etc | (139,417 | ) | (134,321 | ) | (135,422 | ) | |||||
| Interest received | 17,674 | 9,620 | 4,585 | ||||||||
| Interest paid | (921 | ) | (2,186 | ) | (1,507 | ) | |||||
| Discontinued operations | 1,792 | (3,404 | ) | 4,379 | |||||||
| Net cash provided by operating activities | $ | 91,230 | $ | 6,676 | $ | (18,582 | ) | ||||
| Years Ended December 31, | ||||||||||||
| (In thousands) | 2007 | 2006 | 2005 | |||||||||
| Cash collected from customers | $ | 220,055 | $ | 212,102 | $ | 136,967 | ||||||
| Cash paid to suppliers, employees, etc. | (195,377 | ) | (139,417 | ) | (134,321 | ) | ||||||
| Interest received | 15,589 | 17,674 | 9,620 | |||||||||
| Interest paid | (210 | ) | (921 | ) | (2,186 | ) | ||||||
| Discontinued operations | — | 1,792 | (3,404 | ) | ||||||||
| Net cash provided by operating activities | $ | 40,057 | $ | 91,230 | $ | 6,676 | ||||||
68
Prior to December 31, 2006, the Company concluded that it was appropriate to classify its investments in auction rate securities as short-term investments. Previously such investments had been classified as cash and cash equivalents. Accordingly, we have revised the classification to report these investments as short-term investments on the consolidated balance sheets as of December 31, 2005 and December 31, 2004. The Company also made corresponding adjustments to the consolidated statements of cash flows for the periods ended December 31, 2005 and December 31, 2004 to reflect the gross purchases and sales of these investments as investing activities rather than as a component of cash and cash equivalents. As of December 31, 2005 and December 31, 2004, $159.7 million and $207.9 million respectively, of these investments were reclassified from cash and cash equivalents to short-term investment on the consolidated Balance Sheet. This reclassification had no effect on the total current assets, stockholders’ equity, net income (loss), net income (loss) per share, or on cash provided by (used in) operating activities.
Cash and cash equivalents decreased by $172.0 million in 2007 compared to an increase of $215.8 million in 2006.
64
69
A summary of financing transactions for the years 2004 to 2006 is as follows:
/2004 Redemption4% Convertible Senior Notes
On February 11, 2004, the Company announced the redemption of the remaining outstanding $9.6
2004 Issuance of 1 ¼% Convertible Senior Notes
On January 13, 2004 the Company completed its offering of $180 million aggregate principal amount of 1¼% Convertible Senior Notes due 2024 (“1¼% Notes”). The 1¼% Notesat December 31, 2007 are convertible into shares of Coeur common stock at a conversion ratethe option of approximately 131.5789 shares of Coeur common stock per $1,000 principal amount of Notes, representingthe holder on January 15, 2011, 2014, and 2019, unless previously redeemed, at a conversion price of $7.60 per share. Interestshare, subject to adjustment in certain events.
Asset Backed Commercial Paper.
During 2004, the Company completed a public offering of 26.6 million shares of common stock at a public offering price of $4.50 per share, which included 1.6 million shares purchased by the underwriter at the offering price to cover over allotment. The Company realized total net proceeds for the offering of $113.1 million after payment of the underwriters’ discount. Offering costs incurred were $6.7 million.
During 2005, the Company completed a public offering of 9.9 million shares of common stock at a public offering price of $3.70 per share. The Company realized total net proceeds for the offering of $35.9 million after payment of the underwriters’ discount. Offering costs incurred were $0.6 million.
65
70
| Payments Due by Period | |||||||||||||||||
| Contractual Obligations | Total | Less Than 1 Year | 1-3 Years | 3-5 Years | More Than 5 Years | ||||||||||||
| Convertible debt(1) | $ | 180,000 | $ | -- | $ | -- | $ | -- | $ | 180,000 | |||||||
| Interest on convertible debt | 38,250 | 2,250 | 4,500 | 4,500 | 27,000 | ||||||||||||
| Operating lease(2) | 380 | 380 | -- | -- | -- | ||||||||||||
| Capital lease(3) | 916 | 916 | -- | -- | -- | ||||||||||||
| Kensington Trust(4) | 839 | 345 | 494 | -- | -- | ||||||||||||
| Hyak Mining Lease | 9,699 | 231 | 462 | 3,462 | 5,544 | ||||||||||||
| Phlahipo Lease with Comibol | 15,270 | 2,121 | 9,825 | 3,324 | -- | ||||||||||||
| TDA Grant(5) | 546 | 546 | -- | -- | -- | ||||||||||||
| Reclamation and mine closure(6) | 51,778 | 4,962 | 4,498 | 6,437 | 35,881 | ||||||||||||
| Severance(7) | 5,168 | 2,170 | -- | 1,183 | 1,815 | ||||||||||||
| Total | $ | 302,846 | $ | 13,921 | $ | 19,779 | $ | 18,906 | $ | 250,240 | |||||||
| Payments Due by Period | ||||||||||||||||||||
| Less Than | 3-5 | More Than | ||||||||||||||||||
| Contractual Obligations | Total | 1 Year | 1- 3 Years | Years | 5 Years | |||||||||||||||
Convertible debt(1) | $ | 180,000 | $ | — | $ | — | $ | — | $ | 180,000 | ||||||||||
| Interest on convertible debt | 36,000 | 2,250 | 4,500 | 4,500 | 24,750 | |||||||||||||||
Capital lease(2) | 39,196 | 11,554 | 15,731 | 11,911 | — | |||||||||||||||
Kensington Trust(3) | 459 | 385 | 74 | — | — | |||||||||||||||
| Hyak Mining Lease | 9,468 | 231 | 462 | 3,462 | 5,313 | |||||||||||||||
| Plahipo mining lease with COMIBOL | 28,680 | 4,972 | 23,708 | — | — | |||||||||||||||
Reclamation and mine closure(4) | 57,387 | 4,183 | 9,518 | 11,157 | 32,529 | |||||||||||||||
Severance(5) | 4,081 | 407 | 90 | 811 | 2,773 | |||||||||||||||
Macquarie Bank line of credit(6) | 20,029 | 20,029 | — | — | — | |||||||||||||||
National Bank of Canada line of credit(6) | 1,728 | 1,728 | — | — | — | |||||||||||||||
| Endeavor payment | 26,301 | 26,301 | — | — | — | |||||||||||||||
| Total | $ | 403,329 | $ | 72,040 | $ | 54,083 | $ | 31,841 | $ | 245,365 | ||||||||||
| (1) | The $180.0 million principal amount of 1 |
| The Company is required to make semi-annual interest payments. The Debentures are redeemable at the option of the Company before January 18, 2011, if the closing price of the Company’s common stock over a specified number of trading days has exceeded 150% of the conversion price, and anytime thereafter. The Debentures have no other funding requirements until maturity on January 15, 2024. |
| (2) |
| The Company has entered into various capital lease agreements for commitments principally over the next year. |
| Purchased obligation for the Kensington property in Alaska. |
| Reclamation and mine closure amounts represent the Company’s estimate of the |
| Severance amounts represent a termination benefit program at the Rochester mine as the mine approaches the end of mine life and accrued benefits for government mandated severance at the Cerro Bayo | ||
| (6) | In connection with the Bolnisi and Palmarejo acquisition, the Company assumed a credit facility with Macquarie Bank of Australia and a line of credit loan with the National Bank of Canada. |
Risk Factors; Forward-Looking Statements For information relating to important risks and uncertainties that could materially adversely affect the Company’s business, securities, financial condition or operating results, reference is made to the disclosure set forth under Item 1A above. In addition, because the preceding discussion includes numerous forward-looking statements relating to the Company, its results of operations and financial condition and business, reference is made to the information set forth above in Item 1 under the caption “Important Factors Relating to Forward-Looking Statements.”71
66
Environmental Compliance Expenditures For the years ended December 31, 2007, 2006, 2005, and 2004,2005, the Company expended $5.2 million, $5.6 million $4.9 million and $4.2$4.9 million, respectively, in connection with routine environmental compliance activities at its operating properties. Such activities include monitoring, earth moving, water treatment and re-vegetation activities. The Company estimates that environmental compliance expenditures during 20072008 will be approximately $4.0$5.0 million to obtain permit modifications and other regulatory authorizations. Future environmental expenditures will be determined by governmental regulations and the overall scope of the Company’s operating and development activities. The Company places a very high priority on its compliance with environmental regulations.Off-Balance Sheet Arrangements The Company has no off-balance sheet arrangements.67
Recent
Accounting Developments Recently Adopted Pronouncements with Delayed Effective Dates Income Taxes In June 2006, the FASB issued Interpretation No. 48, “Accounting for Uncertainty in Income Taxes”, (FIN 48)Taxes, an Interpretation of FASB Statement No. 109, “Accounting for Income Taxes”109” (FIN 48). FIN 48 prescribes a recognition threshold and measurement attribute for the financial statement recognition and measurement of a tax positions taken or expected to be taken in a tax return. FIN 48 requires that the Company recognize in its financial statements the impact of a tax position, if that tax position is more likely than not of being sustained on audit, based on the technical merits of the position. FIN 48 also provides guidance on derecognition, classification of interest and penalties, accounting in interim periods and disclosure. The provisions of FIN 48 arewere effective beginning January 1, 2007, with the cumulative effect of the change in accounting principle recorded as an adjustment to the opening balance of retained earnings. Currently, the2007. The adoption of FIN 48 isdid not expected to have a material effect on the Company’s financial position, results of operations ofor cash flows. The Company and its subsidiaries are subject to U.S. federal income tax as well as income tax of multiple state and foreign jurisdictions. The Company has substantially concluded all U.S. federal income tax matters for years through 1999. Federal income tax returns for 2000 through 2006 are subject to examination. The Company’s continuing practice is to recognize interest and/or penalties related to income tax matters in income tax expense. There were no significant accrued interest or penalties at December 31, 2007. Recently Issued PronouncementsFair Value Option In February 2007, the FASB issued FASB Statement No. 159, “The Fair Value Option for Financial Assets and Financial Liabilities” (“FAS 159”). FAS 159 permits entities to choose to measure many financial instruments and certain other items at fair value, with the objective of improving financial reporting by mitigating volatility in reported earnings caused by measuring related assets and liabilities differently without having to apply complex hedge accounting provisions. The provisions of FAS 159 are effective for the Company’s fiscal year ending December 31, 2008. The Company is currently evaluating the impact that the adoption of this statement will have on the Company’s consolidated financial position, results of operations and disclosures.72
Fair Value Measurements In September 2006, the FASB issued FASB Statement No. 157 “Fair Value Measurements” (FAS 157). FAS 157 defines fair value, establishes a framework for measuring fair value in generally accepted accounting principles, and expands disclosures about fair value measurements. The provisions of FAS 157 are effective for the Company’s fiscal year ending December 31, 2008. The Company is currently evaluating the impact of the adoption of this statement on the Company’s consolidated financial position, results of operations and disclosures.68
Recent DevelopmentsAccounting for Convertible Debt Instruments On September 5, 2007, the FASB published FASB Staff Position (“FSP”) No. APB 14-a, “Accounting for Convertible Debt Instruments That May Be Settled in Cash upon Conversion.” The proposed FSP applies to convertible debt instruments that, by their stated terms, may be settled in cash (or other assets) upon conversion, including partial cash settlement, unless the embedded conversion option is required to be separately accounted for as a derivative under SFAS 133. Convertible debt instruments within the scope of the proposed FSP are not addressed by the existing Accounting Principles Board (“APB”) Opinion No. 14. The proposed FSP would require that the liability and equity components of convertible debt instruments within the scope of the proposed FSP shall be separately accounted for in a manner that reflects the entity’s nonconvertible debt borrowing rate. This will require an allocation of the convertible debt proceeds between the liability component and the embedded conversion option (i.e., the equity component). The difference between the principal amount of the debt and the amount of the proceeds allocated to the liability component would be reported as a debt discount and subsequently amortized to earnings over the instrument’s expected life using the effective interest method. If the proposed FSP were to be adopted, the Company estimates that approximately $129.2 million of debt discount would be recorded and the effective interest rate on its 2024 11/4% notes would increase by approximately 9 percent for the non-cash amortization of the debt discount.Item 7A.Quantitative and Qualitative Disclosures About Market Risk The Company is exposed to various market risks as a part of its operations. In an effort to mitigate losses associated with these risks, the Company may, at times, enter into derivative financial instruments. These may take the form of forward sales contracts, foreign currency exchange contracts and interest rate swaps. The Company does not actively engage in the practice of trading derivative securitiesinstruments for profit. This discussion of the Company’s market risk assessments contains “forward looking statements” that contain risks and uncertainties. Actual results and actions could differ materially from those discussed below. The Company’s operating results are substantially dependent upon the world market prices of silver and gold. The Company has no control over silver and gold prices, which can fluctuate widely and are affected by numerous factors, such as supply and demand and investor sentiment. In order to mitigate some of the risk associated with these fluctuations, the Company will at times enter into forward sale contracts. The Company continually evaluates the potential benefits of engaging in these strategies based on current market conditions. The Company may be exposed to nonperformance by counterparties as a result of its hedging activities. This exposure would be limited to the amount that the spot price of the metal falls short of the contract price. The Company has historically sold silver and gold produced by our mines pursuant to forward contracts and at spot prices prevailing at the time of sale. Since 1999, the Company has not engaged in any silver hedging activities and is currently not engaged in any gold hedging activities. The Company enters into concentrate sales contracts with third-party smelters. The contracts, in general, provide for a provisional payment based upon provisional assays and quoted metal prices. The provisionally priced sales contracts contain an embedded derivative that is required to be separated from the host contract for accounting purposes. The host contract is the receivable from the sale of concentrates at the forward price at the time of sale. The embedded derivative, which is the final settlement price based on a future price, does not qualify for hedge accounting. These embedded derivatives are recorded as derivative assets (in Prepaid expenses and other), or derivative liabilities (in Accrued liabilities and other), on the balance sheet and are adjusted to fair value through earnings each period until the date of final settlement.73
At December 31, 2006,2007, the Company had outstanding receivables for provisionally priced sales of $74.5$61.2 million consisting of 4.63.3 million ounces of silver and 29,57720,775 ounces of gold, which had a fair value of approximately $75.6$63.8 million including the embedded derivative. For each one cent per ounce change in realized silver price, revenue would vary (plus or minus) approximately $45,700$33,300 and for each one dollar per ounce change in realized gold price, revenue would vary (plus or minus) approximately $29,600.$20,800.
The Company operates, or has mining interests, in several foreign countries, specifically Australia, Bolivia, Chile, and Argentina, which exposes it to risks associated with fluctuations in the exchange rates of the currencies involved. As part of its program to manage foreign currency risk, the Company enters into, from time to time, foreign currency forward exchange contracts. These contracts enable the Company to purchase a fixed amount of foreign currencies. Gains and losses on foreign exchange contracts that are related to firm commitments are designated and effective as hedges and are deferred and recognized in the same period as the related transaction. All other contracts that do not qualify as hedges are marked to market and the resulting gains or losses are recorded in income. The Company continually evaluates the potential benefits of entering into these contracts to mitigate foreign currency risk and proceeds when it believes that the exchange rates are most beneficial. During 2007 and 2006, the Company entered into forward foreign currency exchange contracts to reduce the foreign exchange risk associated with forecasted Chilean peso operating costs for 2007 and 2008 at its Cerro Bayo mine. The contracts entered into in 2007 require the Company to exchange U.S. dollars for Chilean pesos at a weighted average exchange rate of 531503 pesos to each U.S. dollar. At December 31, 2007 and 2006, the Company had foreign exchange contracts to exchangeof $9.0 million and $4.8 million in U.S. dollars, for Chilean pesos. Atrespectively. For the years ended December 31, 2007 and 2006, the Company recorded a realized gain (loss) of approximately $0.4 million and $(0.4) million, respectively, in connection with its foreign currency hedging program. As of December 31, 2007, the fair value of the foreign exchange contracts was a liability of $0.1 million.69
All of the Company’s long-term debt at December 31, 2006,2007, is fixed-rate based. The fair value of the Company’s long-term debt at December 31, 20062007 was $163.8$156.6 million. The fair value was estimated based upon bond market closing prices near the balance sheet date.Item 8.Financial Statements and Supplementary Data The financial statements required hereunder and contained herein are listed under Item 15(a)(1) below.Item 9.Changes in and Disagreements with Accountants on Accounting and Financial Disclosure Not applicable.Item 9A.Controls and Procedures(a) Disclosure Controls and Procedures The Company’s disclosure controls and procedures are designed to provide reasonable assurance that information required to be disclosed by it in its periodic reports filed with the Securities and Exchange Commission is recorded, processed, summarized and reported, within the time periods specified in the Commission’s rules and forms. Based on an evaluation of the Company’s disclosure controls and procedures conducted by the Company’s Chief Executive Officer and Chief Financial Officer, such officers concluded that the Company’s disclosure controls and procedures were effective at a reasonable assurance level as of December 31, 2006.2007.74
(b) Management’s Report on Internal Control Over Financial Reporting The management of the Company is responsible for establishing and maintaining adequate internal control over financial reporting. The Securities and Exchange Act of 1934 defines internal control over financial reporting in Rule 13a-15(f) and 15d-15(f) as a process designed by, or under the supervision of, the company’s principal executive and principal financial officers and effected by the company’s board of directors, management and other personnel, to provide reasonable assurance regarding the reliability of financial reporting and the preparation of financial statements for external purposes in accordance with generally accepted accounting principles and includes those policies and procedures that:• Pertain to the maintenance of records that in reasonable detail accurately and fairly reflect the transactions and dispositions of the assets of the company; • Provide reasonable assurance that transactions are recorded as necessary to permit preparation of financial statements in accordance with generally accepted accounting principles, and that receipts and expenditures of the company are being made only in accordance with authorizations of management and directors of the company; and • Provide reasonable assurance regarding prevention or timely detection of unauthorized acquisition, use or disposition of the company’s assets that could have a material effect on the consolidated financial statements.
Provide reasonable assurance that transactions are recorded as necessary to permit preparation of financial statements in accordance with generally accepted accounting principles, and that receipts and expenditures of the company are being made only in accordance with authorizations of management and directors of the company; and
Provide reasonable assurance regarding prevention or timely detection of unauthorized acquisition, use or disposition of the company’s assets that could have a material effect on the consolidated financial statements.
Because of its inherent limitations, internal control over financial reporting may not prevent or detect misstatements. Also, projections of any evaluation of effectiveness to future periods are subject to risk that controls may become inadequate because of changes in conditions, or that the degree of compliance with the policies or procedures may deteriorate.
70
The Company’s management assessed the effectiveness of the Company’s internal control over financial reporting as of December 31, 2006.2007. In making this assessment, the Company’s management used the criteria set forth by the Committee of Sponsoring Organizations of the Treadway Commission (COSO) inInternal Control-Integrated Framework. Based upon its assessment, management concluded that, as of December 31, 2006,2007, the Company’s internal control over financial reporting is effective based upon those criteria. Management’s
In accordance with SEC regulations, management’s above assessment of the effectiveness of internal control over financial reporting excludes Bolnisi Gold NL and Palmarejo Silver and Gold Corporation, which the Company acquired on December 21, 2007. The total assets of Bolnisi and Palmarejo at December 31, 2007, were approximately $1.8 billion of the Company’s total consolidated assets. The acquired businesses will be included in management’s assessment for the year ending December 31, 2008. The Company’s auditors, KPMG LLP (“KPMG”), have audited the Company’s internal control over financial reporting as of December 31, 2007, in accordance with the standards of the Public Company Accounting Oversight Board (United States), based on criteria established inInternal Control — Integrated Framework issued by the Committee of Sponsoring Organizations of the Treadway Commission (COSO). KPMG’s attestation report dated February 29, 2008 expressed an unqualified opinion on the effectiveness of the Company’s internal control over financial reporting as of December 31, 2006 has been audited by KPMG LLP, an independent registered public accounting firm, as stated2007. KPMG’s attestation report on the Company’s internal control over financial reporting is included in their report which appearsthe Company’s consolidated financial statements set forth elsewhere herein.75
(c) Changes in Internal Control Over Financial Reporting There have been no changes in our internal control over financial reporting during the most recently completed fiscal quarter that have materially affected, or are reasonably likely to materially affect, our internal control over financial reporting.Item 9B.Other Information Not applicable.Part IIIItem 10.Directors, Executive Officers and Corporate Governance Pursuant to General Instruction G(3) of Form 10-K, the information called for by this item regarding directors is hereby incorporated by reference from our definitive proxy statement or amendment hereto to be filed pursuant to Regulation 14A not later than 120 days after the end of the fiscal year covered by this report. Information regarding our executive officers is set forth under Item 4A of this Form 10-K.Item 11.Executive Compensation Pursuant to General Instruction G(3) of Form 10-K, the information called for by this item is hereby incorporated by reference from our definitive proxy statement or amendment hereto to be filed pursuant to Regulation 14A not later than 120 days after the end of the fiscal year covered by this report.Item 12.Security Ownership of Certain Beneficial Owners and Management and Related Stockholder Matters Pursuant to General Instruction G(3) of Form 10-K, the information called for by this item is hereby incorporated by reference from our definitive proxy statement or amendment hereto to be filed pursuant to Regulation 14A not later than 120 days after the end of the fiscal year covered by this report.Item 13.Certain Relationships and Related Transactions, and Director Independence Pursuant to General Instruction G(3) of Form 10-K, the information called for by this item is hereby incorporated by reference from our definitive proxy statement or amendment hereto to be filed pursuant to Regulation 14A not later than 120 days after the end of the fiscal year covered by this report.71
Item 14.Principal Accounting Fees and Services Pursuant to General Instruction G(3) of Form 10-K, the information called for by this item is hereby incorporated by reference from our definitive proxy statement or amendment hereto to be filed pursuant to Regulation 14A not later than 120 days after the end of the fiscal year covered by this report.76
Part IVItem 15.Exhibits and Financial Statement Schedules(a) The following financial statements are filed herewith:
(1) The following consolidated financial statements of Coeur d’Alene Mines Corporation and subsidiaries are included in Item 8:
Consolidated Balance Sheets -– December 31, 20062007 and 2005.2006.
Consolidated Statements of Operations and Comprehensive Income (Loss) -– Years Ended December 31, 2007, 2006 2005 and 20042005.
Consolidated Statements of Changes in Shareholders’ Equity for the Years Ended December 31, 2007, 2006 2005 and 2004.2005.
Consolidated Statements of Cash Flows for the Years Ended December 31, 2007, 2006 2005 and 2004.2005.
Notes to Consolidated Financial Statements.
(b) Exhibits: The following listed documents are filed as Exhibits to this report:
3(a)–2 (a) Merger Implementation Agreement dated May 3, 2007 by and among Coeur d’Alene Mines Corporation, Coeur d’Alene Mines Australia Pty Ltd, Coeur Sub Two, Inc. and Bolnisi Gold NL (Incorporated herein by reference to Exhibit 2.2 to the Registrant’s Form 8-K filed May 4, 2007.) 2 (b) Amending Agreement dated June 8, 2007 Relating to Merger Implementation Agreement dated May 3, 2007 by and among Coeur d’Alene Mines Corporation, Coeur d’Alene Mines Australia Pty Ltd, Coeur Sub Two, Inc. and Bolnisi Gold NL (Incorporated herein by reference to Exhibit 2.1 to the Registrant’s Current Report on Form 8-K filed June 8, 2007.) 2 (c) - Second Amending Agreement dated June 22, 2007 Relating to Merger Implementation Agreement dated May 3, 2007 by and among Coeur d’Alene Mines Corporation, Coeur d’Alene Mines Australia Pty Ltd, Coeur Sub Two, Inc. and Bolnisi Gold NL, as amended on June 8, 2007 (Incorporated herein by reference to Exhibit 2.1 to the Registrant’s Current Report on Form 8-K filed June 22, 2007.) 2 (d) - Deed Poll made by the Registrant in favor of Bolnisi shareholders dated May 3, 2007 (Incorporated herein by reference to Exhibit 2.3 to the Registrant’s Current Report on Form 8-K filed May 4, 2007.) 2 (e) - Conditional Extension dated September 24, 2007 to Merger Implementation Agreement dated May 3, 2007 by and among Coeur d’Alene Mines Corporation, Coeur d’Alene Mines Australia Pty Ltd, Coeur Sub Two, Inc. and Bolnisi Gold NL (Incorporated herein by reference to Exhibit 2.1 to the Registrant’s Current Report on Form 8-K filed September 25, 2007.)
77
2 (f) - Third Amending Agreement dated October 23, 2007 to Merger Implementation Agreement dated May 3, 2007 by and among Coeur d’Alene Mines Corporation, Coeur d’Alene Mines Australia Pty Ltd, Coeur Sub Two, Inc. and Bolnisi Gold NL (Incorporated herein by reference to Exhibit 2.1 to the Registrant’s Current Report on Form 8-K filed October 29, 2007.) 2 (g) - Fourth Amending Agreement dated December 5, 2007 to Merger Implementation Agreement dated May 3, 2007 by and among Coeur d’Alene Mines Corporation, Coeur d’Alene Mines Australia Pty Ltd, Coeur Sub Two, Inc. and Bolnisi Gold NL (Incorporated herein by reference to Exhibit 2.1 to the Registrant’s Current Report on Form 8-K filed December 10, 2007.) 2 (h) - Merger Implementation Agreement dated May 3, 2007 by and among Coeur d’Alene Mines Corporation and Palmarejo Silver and Gold Corporation (Incorporated herein by reference to Exhibit 2.1 to the Registrant’s Current Report on Form 8-K filed May 4, 2007.) 2 (i) - Extension dated September 24, 2007 to Merger Implementation Agreement dated May 3, 2007 by and between Coeur d’Alene Mines Corporation and Palmarejo Silver and Gold Corporation. (Incorporated herein by reference to Exhibit 2.2 to the Registrant’s Current Report on Form 8-K filed September 25, 2007.) 2 (j) - Amendment dated October 23, 2007 to Merger Implementation Agreement dated May 3, 2007 by and between Coeur d’Alene Mines Corporation and Palmarejo Silver and Gold Corporation (Incorporated herein by reference to Exhibit 2.2 to the Registrant’s Current Report on Form 8-K filed October 29, 2007.) 2 (k) - Second Amendment dated December 4, 2007 to Merger Implementation Agreement dated May 3, 2007 by and between Coeur d’Alene Mines Corporation and Palmarejo Silver and Gold Corporation (Incorporated herein by reference to Exhibit 2.2 to the Registrant’s Current Report on Form 8-K filed December 10, 2007.) 3 (a) - Articles of Incorporation of the Registrant and amendments thereto. (Incorporated herein by reference to Exhibit 3(a) to the Registrant’s Annual Report on Form 10-K for the year ended December 31, 1988.)
3(b)–3 (b) - Bylaws of the Registrant and amendments thereto. (Incorporated herein by reference to Exhibit 3.1 to the Registrant’s Current Report on Form 8-K dated August 30, 2004.)
3(c)–3 (c) - Certificate of Designations, Powers and Preferences of the Series B Junior Preferred Stock of the Registrant, as filed with Idaho Secretary of State on May 13, 1999. (Incorporated herein by reference to the Registrant’s Annual Report on Form 10-K for the year ended December 31, 2002.)
3(d)–3 (d) - Restated and Amended Articles of Incorporation of the Registrant as filed with the Secretary of State of the State of Idaho effective September 13, 1999. (Incorporated herein by reference to Exhibit 3 to the Registrant’s Quarterly Report on Form 10-Q for the quarter ended September 30, 1999.)
78
3(e)–3 (e) - Amendment to Restated and Amended Articles of Incorporation of the Registrant (Incorporated herein by reference to Exhibit 3.1 to the Registrant’s Quarterly Report on Form 10-Q for the quarter ended September 30, 2002.)
4(a)–3 (f) - Articles of Amendment, dated May 20, 2004, to the Restated and Amended Articles of Incorporation of the Registrant (Incorporated herein by reference to Exhibit 3.5 to the Form S-4 Registration Statement of Coeur d’ Alene Mines Holding Company and Coeur d’ Alene Canadian Acquisition Corporation filed on July 13, 2004 (file No. 333-117325).) 3 (g) - Certificate of Amendment to the Certificate of Designations, Powers and Preferences of the Series B Junior Preferred Stock of the Registrant, dated December 7, 2007. (Filed herewith.) 3 (h) - Amended and Restated Certificate of Designations, Powers and Preferences of the Series B Junior Preferred Stock of the Registrant, dated December 7, 2007. (Filed herewith.) 3 (i) - Articles of Amendment to the Restated and Amended Articles of Incorporation of the Registrant, dated December 7, 2007. (Filed herewith.) 3 (j) - Restated and Amended Articles of Incorporation of the Registrant, dated December 7, 2007. (Filed herewith.) 3 (k) - Bylaws of the Registrant, as amended effective July 16, 2007. (Incorporated herein by reference to Exhibit 3 to the Registrant’s Quarterly Report on Form 10-Q for the quarter ended September 30, 2007.) 4 (a) - Specimen certificate of the Registrant’s stock. (Incorporated herein by reference to Exhibit 4 to the Registrant’s Registration Statement on Form S-2 (File No. 2-84174).)
72
4(b)–4 (b) - Indenture dated as of January 13, 2004, by and between the Registrant and the Bank of New York relating to the Registrant’s 1 ¼%1/4% Convertible Senior Notes due 2024 (Incorporated herein by reference to Exhibit 4.1 to Registrant’s Current Report on Form 8-K dated January 7, 2004).2004.)
10(a)–10 (a) - Agreement, dated January 1, 1994, between Coeur-Rochester, Inc. and Johnson Matthey Inc. (Incorporated herein by reference to Exhibit 10(m) of the Registrant’s Annual Report on Form 10-K for the year ended December 31, 1993.)
10(b)–10 (b) - Master Equipment Lease No. 099-03566-01, dated as of December 28, 1988, between Idaho First National Bank and the Registrant. (Incorporated herein by reference to Exhibit 10(w) of the Registrant’s Annual Report on Form 10-K for the year ended December 31, 1988.)
10(c)–10 (c) - Master Equipment Lease No. 01893, dated as of December 28, 1988, between Cargill Leasing Corporation and the Registrant. (Incorporated herein by reference to Exhibit 10(x) of the Registrant’s Annual Report on Form 10-K for the year ended December 31, 1988.)
* Management contract or compensatory plan.
79
10(d)–10 (d) - Rights Agreement, dated as of May 11, 1999, between the Registrant and ChaseMellon Shareholder Services, L.L.C., as Rights Agent. (Incorporated herein by reference to Exhibit 1 to the Registrant’s Form 8-A relating to the registration of the Rights on the New York and Pacific Stock Exchanges.)
10(e)–10 (e) - Amended and Restated Profit Sharing Retirement Plan of the Registrant. (Incorporated herein by reference to Exhibit 10(ff) to the Registrant’s Annual Report on Form 10-K for the year ended December 31, 1993.) *
10(f)–10 (f) - 1993 Annual Incentive Plan and Long-Term Performance Share Plan of the Registrant. (Incorporated herein by reference to Exhibit 10(jj) to the Registrant’s Annual Report on Form 10-K for the year ended December 31, 1993.)*
10(g)–10 (g) - Lease Agreement, dated January 12, 1994, between First Security Bank of Idaho and Coeur Rochester, Inc. (Incorporated herein by reference to Exhibit 10(mm) to the Registrant’s Annual Report on Form 10-K for the year ended December 31, 1993.)
10(h)–401k10 (h) - 401(k) Plan of the Registrant. (Incorporated by reference to Exhibit 10 (pp) to the Registrants Annual Report on Form 10-K for the year ended December 31, 1994.)*
10(i)–10 (i) - Form of severance/change in control agreements entered into by the Registrant with each of its executive officers (James A. Sabala – January 13, 2003). (Incorporated by reference to Exhibit 10(hh) to the Registrant’s Annual Report on Form 10-K for the year ended December 31, 2001).*
10(j)–10 (j) - Employment Agreement, dated as of January 13, 2003, between the Registrant and James A. Sabala. (Incorporated by reference to Exhibit 10(jj) to Registrant’s Annual Report on Form 10-K for the period ended December 31, 2002).*
* Management contract or compensatory plan.
73
10(k)–10 (k) - 2003 Long-Term Incentive Plan of the Registrant. (Incorporated herein by reference to Appendix A to the Registrant’s definitive Proxy Statement on Schedule 14A filed with the SEC on April 21, 2003.) *
10(l)–10 (l) - Silver Sale and Purchase Agreement, dated April 7, 2005, between CDE Australia Pty. Limited and Cobar Operations Pty. Limited. (Portions of this exhibit have been omitted pursuant to a request for confidential treatment.) (Incorporated by reference to Exhibit 10.1 to the Registrant’s Quarterly Report on Form 10-Q for the quarter ended March 31, 2005.)
10(m)–10 (m) - 2005 Non-Employee Directors’ Equity Incentive Plan (Incorporated herein by reference to Appendix A to the Registrant’s proxy statement dated April 5, 2005).
* Management contract or compensatory plan.
80
10(n)–10 (n) - Amended and restated employment agreementRestated Employment Agreement and changeChange in control agreement,Control Agreement, effective July 1, 2005, between the Registrant and Donald J. Birak (Incorporated herein by reference to Exhibit 10.4 to the Registrant’s Quarterly Report on Form 10-Q for the quarter ended June 30, 2005).*
10(o)–10 (o) - Employment Agreement, dated as of September 17, 2002, between the Registrant and Dennis E. Wheeler (Incorporated herein by reference to Exhibit 10(z) to the Registrant’s Annual Report on Form 10-K for the year ended December 31, 2005).2005.)*
10(p)–10 (p) - Amended Mining Lease, effective as of August 5, 2005, between Hyak Mining Company, Inc. and Coeur Alaska, Inc. (Incorporated herein by reference to Exhibit 10.5 to the Registrant'sRegistrant’s Quarterly Report on Form 10-Q for the quarter ended June 30, 2005).
10(q)–10 (q) - Silver Sale Agreement, dated September 8, 2005, between the Registrant, Perilya Broken Hill Ltd and CDE Australia Pty. Ltd. (Portions of this exhibit have been omitted pursuant to a request for confidential treatment.) (Incorporated herein by reference to Exhibit 10.1 to the Registrant’s Quarterly Report on Form 10-Q for the quarter ended September 30, 2005).
10(r)–10 (r) - Employment agreementAgreement and changeChange in control agreement,Control Agreement, effective October 15, 2005, between the Registrant and James K. Duff. (Incorporated herein by reference to Exhibit 10.2 to the Registrant'sRegistrant’s Quarterly Report on Form 10-Q for the quarter ended September 30, 2005).*
10(s)–10 (s) - Form of Restricted Stock Agreement (Incorporated herein by reference to Exhibit 10.1 to the Registrant’s Current Report on Form 8-K dated February 15, 2005).*
10(t)–10 (t) - Form of Incentive Stock Option Agreement (Incorporated herein by reference to Exhibit 10.2 to the Registrant’s Current Report on Form 8-K dated February 15, 2005).*
10(u)–10 (u) - Form of Non-Qualified Stock Option Agreement (Incorporated herein by reference to Exhibit 10.3 to the Registrant’s Current Report on Form 8-K dated February 15, 2005).*
* Management contract or compensatory plan.
74
10(v)–10 (v) - First Amendment to Employment to Agreement, effective March 30, 2006, between the Registrant and Dennis E. Wheeler (Incorporated herein by reference to Exhibit 10(a) to the Registrant’s Quarterly Report on Form 10-Q for the quarter ended March 31, 2006).*
10(w)–10 (w) - Amended and Restated Silver Sale and Purchase Agreement, dated March 28, 2006, between CDE Australia Pty Limited and Cobar Operations Pty Limited (Portions of this exhibit have been omitted pursuant to a request for confidential treatment.) (Incorporated herein by reference to Exhibit 10(b) to the Registrant’s Quarterly Report on Form 10-Q for the quarter ended March 31, 2006).
* Management contract or compensatory plan.
81
10(x)–10 (x) - Employment Agreement, dated July 31, 2006, between the Registrant and Alan L. Wilder. (Incorporated herein by reference to Exhibit 10.1 to the Registrant’s Quarterly Report on Form 10-Q for the quarter ended June 30, 2006).2006.)*
10(y)–10 (y) - Amendment, dated July 31, 2006, to Employment Agreement between the Registrant and Donald J. Birak. (Incorporated herein by reference to Exhibit 10.2 to the Registrant’s Quarterly Report on Form 10-Q for the quarter ended June 30, 2006).2006.)*
10(z)–10 (z) - Amendment, dated July 31, 2006, to Employment Agreement between the Registrant and James K. Duff. (Incorporated herein by reference to Exhibit 10(z) to the Registrant’s Annual Report on Form 10-K for the year ended December 31, 2006.)* 10(aa) - Second Amendment to Employment Agreement, dated July 31, 2007, to employment agreement dated July 1, 2005, as amended on July 31, 2006, between the Registrant and Donald J. Birak (Incorporated herein by reference to Exhibit 10.1 to the Registrant’s Quarterly Report on Form 10-Q for the quarter ended June 30, 2007.)* 10(bb) - Second Amendment to Employment Agreement, dated May 2, 2007, between the Registrant and Dennis E. Wheeler (Incorporated herein by reference to Exhibit 10.1 to the Registrant’s Current Report on Form 8-K filed on May 7, 2007.)* 10(cc) - Supplemental Agreement in respect of the Amended and Restated Silver Sale and Purchase Agreement, dated January 29, 2008, between CDE Australia Pty Limited and Cobar Operations Pty Limited. (Filed herewith)herewith.) 10(dd) - Amended and Restated Employment Agreement and Change in Control Agreement, effective July 1, 2005, between the Registrant and Mitchell J. Krebs (Incorporated herein by reference to Exhibit 10.3 to the Registrant’s Quarterly Report on Form 10-Q for the quarter ended June 30, 2005).* 10(ee) - First Amendment to Employment Agreement, effective July 31, 2006, between the Registrant and Mitchell J. Krebs. (Filed herewith.)* 10(ff) - Second Amendment to Employment Agreement, effective July 31, 2007, between the Registrant and Mitchell J. Krebs. (Filed herewith.)* 10(gg) - Amended and Restated Employment Agreement and Change in Control Agreement, effective July 1, 2005, between the Registrant and Harry F. Cougher (Incorporated herein by reference to Exhibit 10.2 to the Registrant’s Quarterly Report on Form 10-Q for the quarter ended June 30, 2005).* 10(hh) - First Amendment to Employment Agreement, effective July 31, 2006, between the Registrant and Harry F. Cougher. (Filed herewith.)* 10(ii) - Employment Agreement, dated as of February 13, 2006, between CDE Australia Pty Ltd and Richard M. Weston. (Filed herewith.)*
* Management contract or compensatory plan.
82
10(jj) - First Amendment to Employment Agreement, effective as of July 31, 2006, between the Registrant and Richard M. Weston. (Filed herewith.)* 10(kk) - Second Amendment to Employment Agreement, effective as of July 31, 2007, between the Registrant and Richard M. Weston. (Filed herewith.)* 10(ll) - First Amendment to Employment Agreement, dated February 6, 2008, between the Registrant and Alan L. Wilder. (Filed herewith.)* 21 –- List of subsidiaries of the Registrant. (Filed herewith.)
23 –- Consent of KPMG LLP (Filed herewith.)
31.1 –- Certification of the CEO (Filed herewith.)
31.2 –- Certification of the CFO (Filed herewith.)
32.1 –- CEO Section 1350 Certification (Filed herewith.)
32.2 –- CFO Section 1350 Certification (Filed herewith.) 99 (a) - Option Deed dated May 3, 2007 by and between Coeur d’Alene Mines Corporation and Kenneth M. Phillips (Incorporated herein by reference to Exhibit 99.1(a) to the Registrant’s Current Report on Form 8-K filed May 4, 2007.) 99 (b) - Option Deed dated May 3, 2007 by and between Coeur d’Alene Mines Corporation and Altinova Nominees Pty Ltd (Incorporated herein by reference to Exhibit 99.1(b) to the Registrant’s Current Report on Form 8-K filed May 4, 2007.) 99 (c) - Option Deed dated May 3, 2007 by and between Coeur d’Alene Mines Corporation and Dragonlyn Pty Ltd (Incorporated herein by reference to Exhibit 99.1(c) to the Registrant’s Current Report on Form 8-K filed May 4, 2007.) 99 (d) - Option Deed dated May 3, 2007 by and between Coeur d’Alene Mines Corporation and Rosignol Consultants Pty Ltd (Incorporated herein by reference to Exhibit 99.1(d) to the Registrant’s Current Report on Form 8-K filed May 4, 2007.) 99 (e) - Option Deed dated May 3, 2007 by and between Coeur d’Alene Mines Corporation and Promin Mining Services Pty Limited (Incorporated herein by reference to Exhibit 99.1(e) to the Registrant’s Current Report on Form 8-K filed May 4, 2007.) 99 (f) - Option Deed dated May 3, 2007 by and between Coeur d’Alene Mines Corporation and Rosignol Pty Limited (Incorporated herein by reference to Exhibit 99.1(f) to the Registrant’s Current Report on Form 8-K filed May 4, 2007.) 99 (g) - Amendments dated September 24, 2007 to Option Deed dated May 3, 2007 by and between Coeur d’Alene Mines Corporation and Kenneth M. Phillips. (Incorporated herein by reference to Exhibit 99.1 to the Registrant’s Form 8-K filed September 25, 2007.)
* Management contract or compensatory plan.
83
99 (h) - Amendments dated September 24, 2007 to Option Deed dated May 3, 2007 by and between Coeur d’Alene Mines Corporation and Altinova Nominees Pty Ltd. (Incorporated herein by reference to Exhibit 99.2 to the Registrant’s Form 8-K filed September 25, 2007.) 99 (i) - Amendments dated September 24, 2007 to Option Deed dated May 3, 2007 by and between Coeur d’Alene Mines Corporation and Dragonlyn Pty Ltd. (Incorporated herein by reference to Exhibit 99.3 to the Registrant’s Form 8-K filed September 25, 2007.) 99 (j) - Amendments dated September 24, 2007 to Option Deed dated May 3, 2007 by and between Coeur d’Alene Mines Corporation and Rosignol Consultants Pty Ltd. (Incorporated herein by reference to Exhibit 99.4 to the Registrant’s Form 8-K filed September 25, 2007.) 99 (k) - Amendments dated September 24, 2007 to Option Deed dated May 3, 2007 by and between Coeur d’Alene Mines Corporation and Promin Mining Services Pty Ltd. (Incorporated herein by reference to Exhibit 99.5 to the Registrant’s Form 8-K filed September 25, 2007.) 99 (l) - Amendments dated September 24, 2007 to Option Deed dated May 3, 2007 by and between Coeur d’Alene Mines Corporation and Rosignol Consultants Pty Ltd. (Incorporated herein by reference to Exhibit 99.6 to the Registrant’s Form 8-K filed September 25, 2007.) 99 (m) - Amending Agreement dated October 23, 2007 relating to Option Deed dated May 3, 2007 by and between Coeur d’Alene Mines Corporation and Kenneth M. Phillips, as amended to date (Incorporated herein by reference to Exhibit 99.1 to the Registrant’s Current Report on Form 8-K filed October 29, 2007.) 99 (n) - Amending Agreement dated October 23, 2007 relating to Option Deed dated May 3, 2007 by and between Coeur d’Alene Mines Corporation and Altinova Nominees Pty Ltd, as amended to date (Incorporated herein by reference to Exhibit 99.2 to the Registrant’s Current Report on Form 8-K filed October 29, 2007.) 99 (o) - Amending Agreement dated October 23, 2007 relating to Option Deed dated May 3, 2007 by and between Coeur d’Alene Mines Corporation and Dragonlyn Pty Ltd, as amended to date (Incorporated herein by reference to Exhibit 99.3 to the Registrant’s Current Report on Form 8-K filed October 29, 2007.) 99 (p) - Amending Agreement dated October 23, 2007 relating to Option Deed dated May 3, 2007 by and between Coeur d’Alene Mines Corporation and Rosignol Consultants Pty Ltd, as amended to date (Incorporated herein by reference to Exhibit 99.4 to the Registrant’s Current Report on Form 8-K filed October 29, 2007.) 99 (q) - Amending Agreement dated October 23, 2007 relating to Option Deed dated May 3, 2007 by and between Coeur d’Alene Mines Corporation and Promin Mining Services Pty Limited, as amended to date (Incorporated herein by reference to Exhibit 99.5 to the Registrant’s Current Report on Form 8-K filed October 29, 2007.)
84
99 (r) - Amending Agreement dated October 23, 2007 relating to Option Deed dated May 3, 2007 by and between Coeur d’Alene Mines Corporation and Rosignol Pty Limited, as amended to date (Incorporated herein by reference to Exhibit 99.6 to the Registrant’s Current Report on Form 8-K filed October 29, 2007.)
(c) Independent auditors’ reports are included herein as follows:
Report of KPMG LLP as of December 31, 20062007 and for the years ended December 31, 2007, 2006 2005 and 2004.2005.
* Management or compensatory plan.
7585
SIGNATURES
SIGNATURES Pursuant to the requirements of Section 13 or 15(d) of the Securities Exchange Act of 1934, the registrant has duly caused this report to be signed on its behalf by the undersigned, thereunto duly authorized.Coeur d’Alene Mines Corporation
(Registrant)
(Registrant)
Date: February 22, 200729, 2008 By: /s/ Dennis E. Wheeler Dennis E. Wheeler (Chairman, (Chairman, President and Chief Executive Officer)
Pursuant to the requirements of the Securities Exchange Act of 1934, this report has been signed below by the following persons on behalf of the registrant and in the capacities and on the dates indicated./s/ Dennis E. Wheeler Chairman, President, Chief Executive Officer February 22, 200729, 2008 Dennis E. Wheeler and Director
/s/ James A. SabalaJames A. Sabala Executive Vice President February 22, 2007James A. Sabalaand Chief Financial Officer February 29, 2008
/s/ Tom T. AngelosTom T. Angelos Vice President, Controller February 22, 2007Tom T. Angelosand Chief Accounting Officer
/s/ Cecil D. AndrusDirectorFebruary 22, 200729, 2008 Cecil D. Andrus
/s/ James J. CurranDirectorFebruary 22, 2007James J. Curran Director February 29, 2008
/s/ Sebastian EdwardsSebastian Edwards Director February 29, 2008 /s/ Andrew D. Lundquist DirectorFebruary 22, 2007Andrew D. Lundquist Director February 29, 2008
/s/ Robert E. Mellor DirectorFebruary 22, 2007Robert E. Mellor Director February 29, 2008
/s/ John H. Robinson DirectorFebruary 22, 2007John H. Robinson Director February 29, 2008
/s/ J. Kenneth Thompson DirectorFebruary 22, 2007J. Kenneth Thompson Director February 29, 2008
/s/ Alex VitaleAlex Vitale Director February 22, 200729, 2008 Alex Vitale
/s/ Timothy R. WintererDirectorFebruary 22, 2007Timothy R. Winterer Director February 29, 2008
7686
ANNUAL REPORT ON FORM 10-KCONSOLIDATED FINANCIAL STATEMENTSYEAR ENDED DECEMBER 31, 20062007
COEUR D’ALENE MINES CORPORATIONCOEUR D’ALENE, IDAHOReports of Independent Registered Public Accounting Firm F-2 -– F-4
Consolidated Balance Sheets -– December 31, 20062007 and 20052006 F-5 -– F-6
Consolidated Statements of Operations and Comprehensive Income (Loss) for the Years Ended December 31, 2007, 2006 and
2005 and 2004 F-7
Consolidated Statements of Changes in Shareholders'Shareholders’ Equity for the Years Ended December 31, 2007, 2006 2005 and 20042005 F-8
Consolidated Statements of Cash Flows for the Years Ended December 31, 2007, 2006 2005 and 20042005 F-9
Notes to Consolidated Financial Statements F-10
F-1
Report of Independent Registered Public Accounting FirmThe Board of Directors and Shareholders
Coeur d’Alene Mines Corporation:We have audited the accompanying consolidated balance sheets of Coeur d’Alene Mines Corporation and subsidiaries as of December 31, 20062007 and 2005,2006, and the related consolidated statements of operations and comprehensive income, (loss),changes in shareholders’ equity, and cash flows for each of the years in the three-year period ended December 31, 2006.2007. These consolidated financial statements are the responsibility of the Company’s management. Our responsibility is to express an opinion on these consolidated financial statements based on our audits.We conducted our audits in accordance with the standards of the Public Company Accounting Oversight Board (United States). Those standards require that we plan and perform the audit to obtain reasonable assurance about whether the financial statements are free of material misstatement. An audit includes examining, on a test basis, evidence supporting the amounts and disclosures in the financial statements. An audit also includes assessing the accounting principles used and significant estimates made by management, as well as evaluating the overall financial statement presentation. We believe that our audits provide a reasonable basis for our opinion.In our opinion, the consolidated financial statements referred to above present fairly, in all material respects, the financial position of Coeur d’Alene Mines Corporation and subsidiaries as of December 31, 20062007 and 2005,2006, and the results of their operations and their cash flows for each of the years in the three-year period ended December 31, 2006,2007, in conformity with U.S. generally accepted accounting principles.As discussed in Note B to the Consolidated Financial Statements,consolidated financial statements, the Company has adopted Statement of Financial Accounting Standards No. 123 (revised 2004),Share-Based Payment, and Emerging Issues Task Force Issue No. 04-6,Accounting for Stripping Costs Incurred during Production in the Mining Industry, as of January 1, 2006.We also have audited, in accordance with the standards of the Public Company Accounting Oversight Board (United States), the effectiveness of Coeur d’Alene Mines Corporation’s internal control over financial reporting as of December 31, 2006,2007, based on criteria established inInternal Control-IntegratedControl — Integrated Framework issued by the Committee of Sponsoring Organizations of the Treadway Commission (COSO), and our report dated February 22, 200729, 2008 expressed an unqualified opinion on management’s assessmentthe effectiveness of and the effective operation of,Company’s internal control over financial reporting./s/
KPMG LLPBoise, Idaho
February 22, 2007
29, 2008F-2
Report of Independent Registered Public Accounting FirmThe Board of Directors and Shareholders
Coeur d’Alene Mines Corporation:We have audited management's assessment, included in the accompanying Management’s Report on Internal Control Over Financial Reporting, that Coeur d’Alene Mines Corporation maintained effectiveCorporation’s internal control over financial reporting as of December 31, 2006,2007, based on criteria established inInternal Control-IntegratedControl — Integrated Frameworkissued by the Committee of Sponsoring Organizations of the Treadway Commission (COSO).Coeur d’Alene Mines Corporation’s management is responsible for maintaining effective internal control over financial reporting and for its assessment of the effectiveness of internal control over financial reporting.reporting, included in the accompanying Management’s Report on Internal Control Over Financial Reporting. Our responsibility is to express an opinion on management’s assessment and an opinion on the effectiveness of the Company’s internal control over financial reporting based on our audit.We conducted our audit in accordance with the standards of the Public Company Accounting Oversight Board (United States). Those standards require that we plan and perform the audit to obtain reasonable assurance about whether effective internal control over financial reporting was maintained in all material respects. Our audit included obtaining an understanding of internal control over financial reporting, evaluating management’s assessment,assessing the risk that a material weakness exists, and testing and evaluating the design and operating effectiveness of internal control andbased on the assessed risk. Our audit also included performing such other procedures as we considered necessary in the circumstances. We believe that our audit provides a reasonable basis for our opinion.A company'scompany’s internal control over financial reporting is a process designed to provide reasonable assurance regarding the reliability of financial reporting and the preparation of financial statements for external purposes in accordance with generally accepted accounting principles. A company’s internal control over financial reporting includes those policies and procedures that (1) pertain to the maintenance of records that, in reasonable detail, accurately and fairly reflect the transactions and dispositions of the assets of the company; (2) provide reasonable assurance that transactions are recorded as necessary to permit preparation of financial statements in accordance with generally accepted accounting principles, and that receipts and expenditures of the company are being made only in accordance with authorizations of management and directors of the company; and (3) provide reasonable assurance regarding prevention or timely detection of unauthorized acquisition, use, or disposition of the company’s assets that could have a material effect on the financial statements.Because of its inherent limitations, internal control over financial reporting may not prevent or detect misstatements. Also, projections of any evaluation of effectiveness to future periods are subject to the risk that controls may become inadequate because of changes in conditions, or that the degree of compliance with the policies or procedures may deteriorate.In our opinion, management's assessment that Coeur d’Alene Mines Corporation maintained effective internal control over financial reporting as of December 31, 2006, is fairly stated, in all material respects, based on criteria established inInternal Control-Integrated Framework issued by the Committee of Sponsoring Organizations of the Treadway Commission (COSO). Also, in our opinion, Coeur d’Alene Mines Corporation maintained, in all material respects, effective internal control over financial reporting as of December 31, 2006,2007, based on criteria established inInternal Control-IntegratedControl — Integrated Frameworkissued by the Committee of Sponsoring Organizations of the Treadway Commission (COSO).Commission.The Company acquired Bolnisi Gold NL and Palmarejo Silver and Gold Corporation on December 21, 2007, and management excluded from its assessment of the effectiveness of the Company’s internal control over financial reporting as of December 31, 2007, Bolnisi Gold NL’s and Palmarejo Silver and Gold Corporation’s internal control over financial reporting associated with total assets of $1.8 billion and total revenues of nil, included in the consolidated financial statements of Coeur d’Alene Mines Corporation and subsidiaries as of and for the year ended December 31, 2007. Our audit of internal control over financial reporting of Coeur d’Alene Mines Corporation also excluded an evaluation of the internal control over financial reporting of Bolnisi Gold NL and Palmarejo Silver and Gold Corporation.F-3
We also have audited, in accordance with the standards of the Public Company Accounting Oversight Board (United States), the consolidated balance sheets of Coeur d’Alene Mines Corporation as of December 31, 20062007 and 2005,2006, and the related consolidated statements of operations and comprehensive income, (loss), shareholders’ equity, and cash flows for each of the years in the three-year period ended December 31, 2006,2007, and our report dated February 22, 200729, 2008 expressed an unqualified opinion on those consolidated financial statements./s/
KPMG LLPBoise, Idaho
February 22, 2007
29, 2008F-4
COEUR D’ALENE MINES CORPORATION AND SUBSIDIARIES
CONSOLIDATED BALANCE SHEETSDecember 31, 2006
2005
ASSETS (In Thousands)
CURRENT ASSETS Cash and cash equivalents $ 270,672 $ 54,896 Short-term investments 70,373 185,446 Receivables 43,233 27,986 Ore on leach pad 31,302 25,394 Metal and other inventory 16,341 12,807 Deferred tax assets 3,629 2,255 Prepaid expenses and other 6,047 4,707 Assets of discontinued operations held for sale -- 14,828
441,597 328,319
PROPERTY, PLANT AND EQUIPMENT Property, plant and equipment 132,315 105,107 Less accumulated depreciation (64,206 ) (57,929 )
68,109 47,178
MINING PROPERTIES Operational mining properties 130,447 121,441 Less accumulated depletion (116,361 ) (105,486 )
14,086 15,955
Mineral interests 72,201 72,201 Less accumulated depletion (7,828 ) (2,218 )
64,373 69,983
Non-producing and development properties 190,988 72,488
269,447 158,426
OTHER ASSETS Ore on leach pad, non-current portion 35,367 29,254 Restricted cash and cash equivalents 19,492 16,943 Debt issuance costs, net 5,151 5,454 Deferred tax assets 2,544 923 Other 7,919 8,319
70,473 60,893
TOTAL ASSETS $ 849,626 $ 594,816
December 31, 2007 2006 (In thousands) ASSETS CURRENT ASSETS Cash and cash equivalents $ 98,671 $ 270,672 Short-term investments 53,039 70,373 Receivables 56,121 43,233 Ore on leach pad 25,924 31,302 Metal and other inventory 18,918 16,341 Deferred tax assets 3,573 3,629 Prepaid expenses and other 7,821 6,047 264,067 441,597 PROPERTY, PLANT AND EQUIPMENT Property, plant and equipment 322,733 132,315 Less accumulated depreciation (69,937 ) (64,206 ) 252,796 68,109 MINING PROPERTIES Operational mining properties 143,324 130,447 Less accumulated depletion (124,401 ) (116,361 ) 18,923 14,086 Mineral interests 1,731,715 72,201 Less accumulated depletion (11,639 ) (7,828 ) 1,720,076 64,373 Non-producing and development properties 311,469 190,988 2,050,468 269,447 OTHER ASSETS Ore on leach pad, non-current portion 24,995 35,367 Restricted cash and cash equivalents 25,760 23,508 Debt issuance costs, net 4,848 5,151 Deferred tax assets 1,109 2,544 Other 27,651 3,903 84,363 70,473 TOTAL ASSETS $ 2,651,694 $ 849,626
The accompanying notes are an integral part of these consolidated financial statements.F-5
COEUR D’ALENE MINES CORPORATION AND SUBSIDIARIES
CONSOLIDATED BALANCE SHEETSDecember 31, 2006
2005
(In thousands except
share data) LIABILITIES AND SHAREHOLDERS’ EQUITY
CURRENT LIABILITIES Accounts payable $ 22,315 $ 17,189 Accrued liabilities and other 11,865 5,662 Accrued income taxes 10,317 66 Accrued payroll and related benefits 8,527 7,840 Accrued interest payable 1,031 1,031 Current portion of reclamation and mine closure 4,460 1,646 Liabilities of discontinued operations held for sale -- 12,908
58,515 46,342
LONG-TERM LIABILITIES 1 1/4% Convertible Senior Notes due January 2024 180,000 180,000 Reclamation and mine closure 27,226 23,048 Other long-term liabilities 2,891 3,873
210,117 206,921
COMMITMENTS AND CONTINGENCIES (See Notes I, J, L, M, N, O, P and R)
SHAREHOLDERS’ EQUITY Common Stock, par value $1.00 per share; authorized 500,000,000 shares, issued 279,054,344 and 250,961,353 shares in 2006 and 2005 (1,059,211 shares held in treasury) 279,054 250,961 Additional paid-in capital 777,798 656,977 Accumulated deficit (463,221 ) (551,357 ) Shares held in treasury (13,190 ) (13,190 ) Accumulated other comprehensive income (loss) 553 (1,838 )
580,994 341,553
TOTAL LIABILITIES AND SHAREHOLDERS’ EQUITY $ 849,626 $ 594,816
December 31, 2007 2006 (In thousands, except share data) LIABILITIES AND SHAREHOLDERS’ EQUITY CURRENT LIABILITIES Accounts payable $ 49,642 $ 22,315 Accrued liabilities and other 9,072 10,971 Accrued income taxes 7,547 10,317 Accrued payroll and related benefits 9,342 8,527 Accrued interest payable 1,060 1,031 Current portion of long-term debt and capital lease obligations 30,831 894 Current portion of reclamation and mine closure 4,183 4,460 111,677 58,515 LONG-TERM LIABILITIES 1 1/4% Convertible Senior Notes due January 2024 180,000 180,000 Reclamation and mine closure 30,629 27,226 Deferred income taxes 573,681 272 Obligations under capital leases 23,661 — Other long-term liabilities 4,679 2,619 812,650 210,117 COMMITMENTS AND CONTINGENCIES (See Notes I, J, M, N, O, P, Q and S) SHAREHOLDERS’ EQUITY Common Stock, par value $1.00 per share; authorized 750,000,000 shares in 2007 and 500,000,000 in 2006, issued 551,512,230 and 279,054,344 shares in 2007 and 2006 (1,059,211 shares held in treasury) 551,512 279,054 Additional paid-in capital 1,607,737 777,798 Accumulated deficit (419,331 ) (463,221 ) Shares held in treasury (13,190 ) (13,190 ) Accumulated other comprehensive income 639 553 1,727,367 580,994 TOTAL LIABILITIES AND SHAREHOLDERS’ EQUITY $ 2,651,694 $ 849,626
The accompanying notes are an integral part of these consolidated financial statements.
F-6
COEUR D’ALENE MINES CORPORATION AND SUBSIDIARIES
CONSOLIDATED STATEMENTS OF OPERATIONS AND COMPREHENSIVE INCOME (LOSS)Years Ended December 31, 2006
2005
2004
(In Thousands, except per share data)
REVENUES Sales of metal $ 216,573 $ 156,284 $ 109,047
COSTS AND EXPENSES Production costs applicable to sales 92,378 88,232 63,715 Depreciation and depletion 26,772 18,889 16,833 Administrative and general 19,369 20,624 17,499 Exploration 9,474 10,553 8,031 Pre-development -- 6,057 11,449 Litigation settlement 2,365 1,600 --
Total cost and expenses 150,358 145,955 117,527
OTHER INCOME AND EXPENSE Interest and other income 18,654 8,385 3,165 Interest expense, net of capitalized interest (1,224 ) (2,485 ) (2,831 ) Merger expenses -- -- (15,675 )
Total other income and expense 17,430 5,900 (15,341 )
Income (loss) from continuing operations before income taxes 83,645 16,229 (23,821 ) Income tax (provision) benefit (8,226 ) (1,483 ) 5,785
Income (loss) from continuing operations 75,419 14,746 (18,036 ) Income (loss) from discontinued operations, net of income taxes 1,935 (4,195 ) 1,178 Gain on sale of net assets of discontinued operations, net of income taxes 11,132 -- --
NET INCOME (LOSS) 88,486 10,551 (16,858 ) Other comprehensive income (loss) 2,391 447 (908 )
COMPREHENSIVE INCOME (LOSS) $ 90,877 $ 10,998 $ (17,766 )
BASIC AND DILUTED INCOME (LOSS) PER SHARE Basic income (loss) per share: Income (loss) from continuing operations $ 0.28 $ 0.06 $ (0.08 ) Income (loss) from discontinued operations 0.05 (0.02 ) --
Net income (loss) $ 0.33 $ 0.04 $ (0.08 )
Diluted income (loss) per share: Income (loss) from continuing operations $ 0.26 $ 0.06 $ (0.08 ) Income (loss) from discontinued operations 0.04 (0.02 ) --
Net income (loss) $ 0.30 $ 0.04 $ (0.08 )
Weighted average number of shares of common stock Basic 271,357 242,915 215,969 Diluted 296,082 243,683 215,969
Years Ended December 31, 2007 2006 2005 (In thousands, except per share data) REVENUES Sales of metal $ 215,319 $ 216,573 $ 156,284 COSTS AND EXPENSES Production costs applicable to sales 117,025 92,378 88,232 Depreciation and depletion 20,984 26,772 18,889 Administrative and general 23,875 19,369 20,624 Exploration 11,941 9,474 10,553 Litigation settlements 507 2,365 1,600 Pre-development — — 6,057 Total cost and expenses 174,332 150,358 145,955 Operating income 40,987 66,215 10,329 OTHER INCOME AND EXPENSE Interest and other income 18,195 18,654 8,385 Interest expense, net of capitalized interest (365 ) (1,224 ) (2,485 ) Total other income and expense 17,830 17,430 5,900 Income from continuing operations before income taxes 58,817 83,645 16,229 Income tax provision (14,927 ) (8,226 ) (1,483 ) Income from continuing operations 43,890 75,419 14,746 Income (loss) from discontinued operations, net of income taxes — 1,935 (4,195 ) Gain on sale of net assets of discontinued operations, net of income taxes — 11,132 — NET INCOME 43,890 88,486 10,551 Other comprehensive income 86 2,391 447 COMPREHENSIVE INCOME $ 43,976 $ 90,877 $ 10,998 BASIC AND DILUTED INCOME (LOSS) PER SHARE Basic income per share: Income from continuing operations $ 0.15 $ 0.28 $ 0.06 Income (loss) from discontinued operations — 0.05 (0.02 ) Net income $ 0.15 $ 0.33 $ 0.04 Diluted income per share: Income from continuing operations $ 0.14 $ 0.26 $ 0.06 Income (loss) from discontinued operations — 0.04 (0.02 ) Net income $ 0.14 $ 0.30 $ 0.04 Weighted average number of shares of common stock Basic 285,972 271,357 242,915 Diluted 310,524 296,082 243,683
The accompanying notes are an integral part of these consolidated financial statements.F-7
COEUR D’ALENE MINES CORPORATION AND SUBSIDIARIES
CONSOLIDATED STATEMENTS OF CHANGES IN SHAREHOLDERS’ EQUITYFor Years Ended December 31, 2006, 2005 and 2004
(In thousands except share data) Common
Stock
Shares
Common
Stock
$1 Par
Additional
Paid-In
Capital
Accumulated
Deficit
Shares
Held in
Treasury
Accumulated
Other
Comprehensive
Income (Loss)
Total
Balances at January 1, 2004 214,195 $ 214,195 $ 542,900 $ (545,050 ) $ (13,190 ) $ (1,377 ) $ 197,478 Net loss -- -- -- (16,858 ) -- -- (16,858 ) Unrealized losses on short-term investments and marketable securities -- -- -- -- -- (347 ) (347 ) Change in fair value of derivative hedging instruments, net of settlements -- -- -- -- -- (130 ) (130 ) Excess additional pension liability over unrecognized prior service cost -- -- -- -- -- (431 ) (431 ) Issuance of common stock 26,625 26,625 86,475 -- -- -- 113,100 Common stock issued under long-term incentive plans 208 208 432 -- -- -- 640 Other -- -- 2 -- -- -- 2
Balances at December 31, 2004 241,028 $ 241,028 $ 629,809 $ (561,908 ) $ (13,190 ) $ (2,285 ) $ 293,454 Net income -- -- -- 10,551 -- -- 10,551 Unrealized gain on short-term investments and marketable securities -- -- -- -- -- 853 853 Change in fair value of derivative hedging instruments, net of settlements -- -- -- -- -- (171 ) (171 ) Excess additional pension liability over unrecognized prior service cost -- -- -- -- -- (237 ) (237 ) Issuance of common stock 9,863 9,863 26,351 -- -- -- 36,214 Common stock issued under long-term incentive plans 70 70 817 -- -- -- 887 Foreign currency translation -- -- -- -- -- 2 2
Balances at December 31, 2005 250,961 $ 250,961 $ 656,977 $ (551,357 ) $ (13,190 ) $ (1,838 ) $ 341,553 Net income -- -- -- 88,486 -- -- 88,486 Cumulative effect of accounting change -- -- -- (350 ) -- -- (350 ) Unrealized gain on short-term investments and marketable securities -- -- -- -- -- 63 63 Change in fair value of cash flow hedging instruments, net of settlements -- -- -- -- -- 111 111 Elimination of excess additional pension liability over unrecognized prior service cost attributable to discontinued operations -- -- -- -- -- 2,219 2,219 Issuance of common stock 27,600 27,600 118,631 -- -- -- 146,231 Common stock issued under long-term incentive plans 493 493 2,190 -- -- -- 2,683 Foreign currency translation -- -- -- -- -- (2 ) (2 )
Balances at December 31, 2006 279,054 $ 279,054 $ 777,798 $ (463,221 ) $ (13,190 ) $ 553 $ 580,994
Years Ended December 31, 2007, 2006 and 2005 (In thousands, except share data) Accumulated Common Common Additional Shares Other Stock Stock Paid-In Accumulated Held in Comprehensive Shares $1 Par Capital Deficit Treasury Income (Loss) Total Balances at January 1, 2005 241,028 $ 241,028 $ 629,809 $ (561,908 ) $ (13,190 ) $ (2,285 ) $ 293,454 Net income — — — 10,551 — — 10,551 Unrealized gain on short-term investments and marketable securities — — — — — 853 853 Change in fair value of derivative hedging instruments, net of settlements — — — — — (171 ) (171 ) Excess additional pension liability over unrecognized prior service cost — — — — — (237 ) (237 ) Issuance of common stock 9,863 9,863 26,351 — — — 36,214 Common stock issued under long-term incentive plans, net 70 70 817 — — — 887 Foreign currency translation — — — — — 2 2 Balances at December 31, 2005 250,961 $ 250,961 $ 656,977 $ (551,357 ) $ (13,190 ) $ (1,838 ) $ 341,553 Net income — — — 88,486 — — 88,486 Cumulative effect of accounting change — — — (350 ) — — (350 ) Unrealized gain on short-term investments and marketable securities — — — — — 63 63 Change in fair value of cash flow hedging instruments, net of settlements — — — — — 111 111 Elimination of excess additional pension liability over unrecognized prior service cost attributable to discontinued operations — — — — — 2,219 2,219 Issuance of common stock 27,600 27,600 118,631 — — — 146,231 Common stock issued under long-term incentive plans, net 493 493 2,190 — — — 2,683 Foreign currency translation — — — — — (2 ) (2 ) Balances at December 31, 2006 279,054 $ 279,054 $ 777,798 $ (463,221 ) $ (13,190 ) $ 553 $ 580,994 Net income — — — 43,890 — — 43,890 Unrealized gain on short-term investments and marketable securities — — — — — 103 103 Change in fair value of cash flow hedging instruments, net of settlements — — — — — (23 ) (23 ) Issuance of common stock in Bolnisi/Palmarejo merger 271,969 271,969 826,061 — — — 1,098,030 Common stock issued under long-term incentive plans, net 489 489 3,878 — — — 4,367 Foreign currency translation — — — — — 6 6 Balances at December 31, 2007 551,512 $ 551,512 $ 1,607,737 $ (419,331 ) $ (13,190 ) $ 639 $ 1,727,367
The accompanying notes are an integral part of these consolidated financial statements.
F-8
COEUR D’ALENE MINES CORPORATION AND SUBSIDIARIES
CONSOLIDATED STATEMENTS OF CASH FLOWSYears Ended December 31, 2006
2005
2004
(In Thousands)
CASH FLOWS FROM OPERATING ACTIVITIES: Net income (loss) $ 88,486 $ 10,551 $ (16,858 ) Add (deduct) non-cash items: Depreciation and depletion 26,772 18,889 16,833 Deferred taxes (2,902 ) 1,629 (4,403 ) Unrealized (gain) loss on embedded derivatives 1,166 (2,052 ) (82 ) Share-based compensation 2,218 1,237 1,137 Amortization of debt issuance costs 303 303 408 Amortization of premium and/or discount on short-term investments, net 24 790 1,527 Other non-cash charges (313 ) 250 (16 ) Changes in operating assets and liabilities: Receivables (14,781 ) (19,571 ) (2,014 ) Prepaid expenses and other (599 ) (183 ) (517 ) Inventories (15,555 ) (8,308 ) (17,492 ) Accounts payable and accrued liabilities 17,686 2,349 (167 ) Discontinued operations (11,275 ) 792 3,062
CASH PROVIDED BY (USED IN) OPERATING ACTIVITIES 91,230 6,676 (18,582 )
CASH FLOWS FROM INVESTING ACTIVITIES: Purchases of short-term investments (317,743 ) (212,252 ) (343,019 ) Proceeds from sales of short-term investments 430,292 277,021 142,128 Capital expenditures (147,998 ) (113,290 ) (8,363 ) Other (328 ) 103 372 Discontinued operations 15,446 (3,346 ) (2,041 )
CASH USED IN INVESTING ACTIVITIES (20,331 ) (51,764 ) (210,923 )
CASH FLOWS FROM FINANCING ACTIVITIES: Repayment of long-term debt -- -- (9,561 ) Proceeds from issuance of common stock 154,560 36,493 119,803 Payments of common stock issuance costs (8,329 ) (557 ) (6,702 ) Proceeds from issuance of notes -- -- 180,000 Payments of debt issuance costs -- -- (6,089 ) Borrowings from bank on working capital facility -- -- 6,056 Payments to bank on working capital facility -- -- (8,422 ) Other (1,354 ) (1,170 ) (2,055 )
CASH PROVIDED BY FINANCING ACTIVITIES: 144,877 34,766 273,030
INCREASE (DECREASE) IN CASH AND CASH EQUIVALENTS 215,776 (10,322 ) 43,525
Cash and cash equivalents at beginning of period 54,896 65,218 21,693
Cash and cash equivalents at end of period 270,672 $ 54,896 $ 65,218
SUPPLEMENTAL DISCLOSURES OF CASH FLOW INFORMATION Cash paid for: Interest $ 2,334 $ 2,280 $ 1,572 Taxes $ 814 -- --
Years Ended December 31, 2007 2006 2005 (In thousands) CASH FLOWS FROM OPERATING ACTIVITIES: Net income $ 43,890 $ 88,486 $ 10,551 Add (deduct) non-cash items: Depreciation and depletion 20,984 26,772 18,889 Deferred taxes 2,154 (2,902 ) 1,629 Unrealized (gain) loss on embedded derivatives (1,462 ) 1,166 (2,052 ) Share-based compensation 3,448 2,218 1,237 Amortization of debt issuance costs 303 303 303 Amortization of premium and/or discount on short-term investments, net (6 ) 24 790 Gain on asset retirement obligation (871 ) (41 ) (215 ) Gain on foreign currency transactions (433 ) (147 ) 170 (Gain) loss of sales of assets (1,947 ) (237 ) 90 Other non-cash charges 616 112 205 Changes in operating assets and liabilities: Receivables (24,021 ) (14,781 ) (19,571 ) Prepaid expenses and other (4,065 ) (599 ) (183 ) Inventories 13,172 (15,555 ) (8,308 ) Accounts payable and accrued liabilities (11,705 ) 17,686 2,349 Discontinued operations — (11,275 ) 792 CASH PROVIDED BY OPERATING ACTIVITIES 40,057 91,230 6,676 CASH FLOWS FROM INVESTING ACTIVITIES: Purchases of short-term investments (167,346 ) (317,743 ) (212,252 ) Proceeds from sales of short-term investments 183,121 430,292 277,021 Capital expenditures (216,978 ) (147,998 ) (113,290 ) Merger related costs (13,727 ) — — Proceeds from sale of assets 3,270 314 289 Other 187 (642 ) (186 ) Discontinued operations — 15,446 (3,346 ) CASH USED IN INVESTING ACTIVITIES (211,473 ) (20,331 ) (51,764 ) CASH FLOWS FROM FINANCING ACTIVITIES: Proceeds from short-term borrowings 1,698 — — Repayment of long-term debt and capital leases (1,360 ) (1,448 ) (685 ) Proceeds from issuance of common stock — 154,560 36,493 Payments of common stock issuance costs (726 ) (8,329 ) (557 ) Other (197 ) 94 (485 ) CASH PROVIDED BY FINANCING ACTIVITIES: (585 ) 144,877 34,766 INCREASE (DECREASE) IN CASH AND CASH EQUIVALENTS (172,001 ) 215,776 (10,322 ) Cash and cash equivalents at beginning of period 270,672 54,896 65,218 Cash and cash equivalents at end of period $ 98,671 $ 270,672 $ 54,896 SUPPLEMENTAL DISCLOSURES OF CASH FLOW INFORMATION Cash paid for: Interest $ 2,283 $ 2,334 $ 2,280 Income taxes $ 11,994 $ 814 —
The accompanying notes are an integral part of these consolidated financial statements.F-9
COEUR D’ALENE MINES CORPORATION AND SUBSIDIARIES
NOTES TO CONSOLIDATED FINANCIAL STATEMENTS(Dollar amounts in thousands, unless otherwise specified)NOTE A — BUSINESS OF COEUR D’ALENE MINES CORPORATION Coeur d’Alene Mines Corporation and its subsidiaries (collectively, “Coeur” or the “Company”) is principally engaged in silver and gold mining and related activities including exploration, development, and mining at its properties located in the United States (Nevada and Alaska), South America (Chile, Argentina and Bolivia) and, Australia (New South Wales), Mexico (Chihuahua) and Africa (Tanzania).NOTE B — SUMMARY OF SIGNIFICANT ACCOUNTING POLICIES Principles of Consolidation: The consolidated financial statements include the wholly-owned subsidiaries of the Company, the most significant of which are Coeur Rochester, Inc., Coeur Silver Valley, Inc., Coeur Alaska, Inc., CDE Cerro Bayo Ltd., Coeur Argentina, CDE Australia and EmpressaEmpresa Minera Manquiri S.A., Bolnisi Gold NL and Palmarejo Silver and Gold Corporation. The consolidated financial statements also include all entities in which voting control of more than 50% is held by the Company. The Company has no investments in entities in which it has greater than 50% ownership interest accounted for using the equity method. Intercompany balances and transactions have been eliminated in consolidation. Investments in corporate joint ventures where the Company has ownership of 50% or less and funds its proportionate share of expenses are accounted for under the equity method. The Company has no investments in entities in which it has a greater than 20% ownership interest accounted for using the cost method. Revenue Recognition: Pursuant to guidance in Staff Accounting Bulletin (“SAB”) No. 104, “Revenue Recognition for Financial Statements”, revenue is recognized when persuasive evidence of an arrangement exists, delivery has occurred, the price is fixed or determinable, no obligations remain and collectibilitycollectability is probable. The passing of title to the customer is based on the terms of the sales contract. Product pricing is determined at the point revenue is recognized by reference to active and freely traded commodity markets, for example the London Bullion Market for both gold and silver, in an identical form to the product sold. Under our concentrate sales contracts with third-party smelters, final gold and silver prices are set on a specified future quotational period, typically one to three months, after the shipment date based on market metal prices. Revenues are recorded under these contracts at the time title passes to the buyer based on the forward price for the expected settlement period. The contracts, in general, provide for a provisional payment based upon provisional assays and quoted metal prices. Final settlement is based on the average applicable price for a specified future period, and generally occurs from three to six months after shipment. Final sales are settled using smelter weights, settlement assays (average of assays exchanged and/or umpire assay results) and are priced as specified in the smelter contract. The Company’s provisionally priced sales contain an embedded derivative that is required to be separated from the host contract for accounting purposes. The host contract is the receivable from the sale of concentrates measured at the forward price at the time of sale. The embedded derivative does not qualify for hedge accounting. The embedded derivative is recorded as a derivative asset, in prepaid expenses and other assets or as a derivative liability in accrued liabilities and other on the balance sheet and is adjusted to fair value through revenue each period until the date of final gold and silver settlement. The form of the material being sold, after deduction for smelting and refining is in an identical form to that sold on the London Bullion Market. The form of the product is metal in flotation concentrate, which is the final process for which the Company is responsible.F-10
The effects of forward sales contracts are reflected in revenue at the date the related precious metals are delivered or the contracts expire. Third party smelting and refining costs of $8.4 million, $9.1 million and $6.1 million in 2007, 2006 and $3.3 million in 2006, 2005, and 2004, respectively, are recorded as a reduction of revenue. At December 31, 2007, the Company had outstanding provisionally priced sales of $61.2 million consisting of 3.3 million ounces of silver and 20,775 ounces of gold, which had a fair value of approximately $63.8 million including the embedded derivative. For each one cent per ounce change in realized silver price, revenue would vary (plus or minus) approximately $33,300 and for each one dollar per ounce change in realized gold price, revenue would vary (plus or minus) approximately $20,800. At December 31, 2006, the Company had outstanding provisionally priced sales of $74.5 million, consisting of 4.6 million ounces of silver and 29,577 ounces of gold. For each one cent per ounce change in realized silver price, revenue would vary (plus or minus) approximately $45,700 and for each one dollar per ounce change in realized gold price, revenue would vary (plus or minus) approximately $29,600. At December 31, 2005, the Company had outstanding provisionally priced sales of $47.0 million, consisting of 3.5 million ounces of silver and 40,000 ounces of gold. For each one cent per ounce change in realized silver price, revenue would vary (plus or minus) approximately $35,400 and for each one dollar per ounce change in realized gold price, revenue would vary (plus or minus) approximately $40,000. Cash and Cash Equivalents: Cash and cash equivalents include all highly-liquid investments with a maturity of three months or less at the date of purchase. The Company minimizes its credit risk by investing its cash and cash equivalents with major international banks and financial institutions located principally in the United States and Chile with a minimum credit rating of A1 as defined by Standard & Poor’s. The Company’s management believes that no concentration of credit risk exists with respect to the investment of its cash and cash equivalents. Short-term Investments: Short-term investments principally consist of highly-liquid United States, foreign government and corporate securities and investment-grade auction rate securities, all classified as available-for-sale and reported at fair value with maturities that could range from three months to forty years. Unrealized gains and losses on these investments are recorded in accumulated other comprehensive lossincome as a separate component of shareholders’ equity. Any decline in market value considered to be other than temporary is recognized in determining net income/loss. Realized gains and losses from the sale of these investments are included in determining net income/loss. The Company maintains a pledge of collateral agreement to reserve $1.0 million against the investment portfolio to cover credit exposure related to ACH transactions. Prior to December 31, 2006, the Company classified its auction rate securities as cash and cash equivalents because the securities were highly liquid and the periods between interest rate resets generally did not exceed 90 days. During the fourth quarter of 2006, the Company determined that, pursuant to SFAS 95, “Statement of Cash Flows”, its auction securities cannot be classified as cash equivalents because their contractual maturities exceed 90 days. The Company classified its auction rate securities as of December 31, 2006 as short term investments.
The Company also corrected the classification in its 2005 and 2004 financial statement presentation by reclassifying $159.7 million and $207.9 million, respectively, of auction rate securities as of December 31, 2005 and December 31, 2004 from cash and cash equivalents to short-term investments. As a result, the following table shows the amounts, as originally presented in the Company’s Form 10-K, for the years ended December 31, 2005 and December 31, 2004 and the corrected 2005 and 2004 amounts as presented in its Form 10-K for the year ended December 31, 2006. This reclassification had no effect on total current assets, stockholders’ equity, net income (loss), net income (loss) per share or on cash provided by operating activities.
For the year ended December 31, 2005 As Previously
Reported
Adjustment
Corrected
(In Thousands) Cash and Cash Equivalents $ 214,616 $ (159,720 ) $ 54,896 Short-term Investments 25,726 159,720 185,446 Net Cash Used in Investing Activities (99,894 ) 48,130 (51,764 ) Decrease in Cash and Cash Equivalents (58,452 ) 48,130 (10,322 )
F-11
For the year ended December 31, 2004 As Previously
Reported
Adjustment
Corrected
(In Thousands) Cash and Cash Equivalents $ 273,068 $ (207,850 ) $ 65,218 Short-term Investments 48,993 207,850 256,843 Net Cash Used in Investing Activities (43,787 ) (167,136 ) (210,923 ) Decrease in Cash and Cash Equivalents 210,661 (167,136 ) 43,525
$66.7$50.9 million as of December 31, 2006.2007. Of this amount, $31.3$25.9 million is reported as a current asset and $35.4$25.0 million is reported as a non-current asset. The distinction between current and non-current is based upon the expected length of time necessary for the leaching process to remove the metals from the broken ore. The historical cost of the metal that is expected to be extracted within twelve months is classified as current and the historical cost of metals contained within the broken ore that will be extracted beyond twelve months is classified as non-current. Inventories of ore on leach pad are valued based on actual production costs incurred to produce and place ore on the leach pad, adjusted for effects on monthly production of costs of abnormal production levels, less costs allocated to minerals recovered through the leach process.F-11
The estimate of both the ultimate recovery expected over time and the quantity of metal that may be extracted relative to the time the leach process occurs requires the use of estimates which are inherently inaccurate since they rely upon laboratory testwork. Testwork consists of 60 day leach columns from which the Company projects metal recoveries up to five years in the future. The quantities of metal contained in the ore are based upon actual weights and assay analysis. The rate at which the leach process extracts gold and silver from the crushed ore is based upon laboratory column tests and actual experience occurring over approximately nineteen years of leach pad operations at the Rochester Mine. The assumptions used by the Company to measure metal content during each stage of the inventory conversion process includes estimated recovery rates based on laboratory testing and assaying. The Company periodically reviews its estimates compared to actual experience and revises its estimates when appropriate. The length of time necessary to achieve ultimate recoveries for silver and gold is currently estimated between 5 and 10 years.F-12
In August 2007, the Company terminated mining and crushing operations at the Rochester mine as ore reserves were fully mined. Residual heap leach activities are expected to continue through 2011.
Metal and Other Inventory: Inventories include concentrate ore, dorè, ore in stockpiles and operating materials and supplies. The classification of inventory is determined by the stage at which the ore is in the production process. Inventories of ore in stock piles are sampled for gold and silver content and are valued based on the lower of actual costs incurred or estimated net realizable value based upon the period ending prices of gold and silver. Material that does not contain a minimum quantity of gold and silver to cover estimated processing expense to recover the contained gold and silver is not classified as inventory and is assigned no value. All inventories are stated at the lower of cost or market, with cost being determined using a weighted average cost method. Concentrate and dorè inventory includes product at the mine site and product held by refineries and are also valued at lower of cost or market value. Metal inventory costs include direct labor, materials, depreciation, depletion and amortization as well as administrative overhead costs relating to mining activities. Property, Plant, and Equipment: Expenditures for new facilities, capital leases, new assets or expenditures that extend the useful lives of existing facilities are capitalized and depreciated using the straight-line method at rates sufficient to depreciate such costs over the shorter of estimated productive lives of such facilities or the useful life of the individual assets. Productive lives range from 7 to 31 years for buildings and improvements, 3 to 13 years for machinery and equipment and 3 to 7 years for furniture and fixtures. Certain mining equipment is depreciated using the units-of-production method based upon estimated total proven and probable reserves. Maintenance and repairs are expensed as incurred. Operational Mining Properties and Mine Development: Costs incurred to develop new properties are capitalized as incurred, where it has been determined that the property can be economically developed. At the Company’s surface mines, these costs include costs to further delineate the ore body. At the Company’s underground mines, these costs include the cost of building access ways, shaft sinking and access, lateral development, drift development, ramps and infrastructure development. All such costs are amortized using the units of production method over the estimated life of the ore body based on recoverable ounces to be mined from proven and probable reserves. Interest expense allocable to the cost of developing mining properties and to construct new facilities is capitalized until assets are ready for their intended use. Gains or losses from sales or retirements of assets are included in other income or expense. Costs incurred during the start-up phase of a mine are expensed as incurred. Ongoing mining expenditures on producing properties are charged against earnings as incurred. Major development expenditures incurred to increase production or extend the life of the mine are capitalized. Mineral exploration costs are expensed as incurred. Mineral Interests: Significant payments related to the acquisition of the land and mineral rights are capitalized as incurred. Prior to acquiring such land or mineral rights, the Company generally makes a preliminary evaluation to determine that the property has significant potential to develop an economic ore body. The time between initial acquisition and full evaluation of a property’s potential is variable and is determined by many factors including: location relative to existing infrastructure, the property’s stage of development, geological controls and metal prices. If a mineableminable ore body is discovered, such costs are amortized when production begins using the units-of-production method based on recoverable ounces to be mined from proven and probable reserves. If no mineableminable ore body is discovered, such costs are expensed in the period in which it is determined the property has no future economic value.F-12
Asset Impairment: The Company follows Statement of Financial Accounting Standard (“SFAS”) No. 144, “Accounting for the Impairment or Disposal of Long-Lived Assets,” to evaluate the recoverability of its assets. Management reviews and evaluates its long-lived assets for impairment when events and changes in circumstances indicate that the related carrying amounts of its assets may not be recoverable. Impairment is considered to exist if total estimated future cash flows or probability-weighted cash flows on an undiscounted basis, are less than the carrying amount of the assets, including property plant and equipment, mineral property, development property, and any deferred costs such as deferred stripping. An impairment loss is measured and recorded based on the difference between book value and discounted estimated future cash flows or the application of an expected present value technique to estimate fair value in the absence of a market price. Future cash flows include estimates of recoverable ounces, gold and silver prices (considering current and historical prices, price trends and related factors), production levels and capital, all based on life-of-mine plans and projections. Assumptions underlying future cash flow estimates are subject to risks and uncertainties. If the assets are impaired, a calculation of fair value is performed and if the fair value is lower than the carrying value of the assets, the assets are reduced to their fair market value. Any differences between significant assumptions and market conditions and/or the Company’s operating performance could have a material effect on the Company’s determination of ore reserves, or its ability to recover the carrying amounts of its long-lived assets resulting in impairment charges. In estimating future cash flows, assets are grouped at the lowest level for which there are identifiable cash flows that are largely independent of cash flows from other asset groups. Generally, in estimating future cash flows, all assets are grouped at a particular mine for which there is identifiable cash flow.F-13
Restricted Cash and Cash Equivalents: The Company, under the terms of its lease, self insurance, and bonding agreements with certain banks, lending institutions and regulatory agencies, is required to collateralize certain portions of the Company’s obligations. The Company has collateralized these obligations by assigning certificates of deposit that have maturity dates ranging from three months to a year, to the respective institutions or agency. At December 31, 20062007 and December 31, 2005,2006, the Company held certificates of deposit and cash under these agreements of $19.5$25.8 million and $16.9$23.5 million, respectively, restricted for this purpose. The ultimate timing for the release of the collateralized amounts is dependent on the timing and closure of each mine. In order to release the collateral, the Company must seek approval from certain government agencies responsible for monitoring the mine closure status. Collateral could also be released to the extent the Company was able to secure alternative financial assurance satisfactory to the regulatory agencies. The Company believes there is a reasonable probability that the collateral will remain in place beyond a twelve-month period and has therefore classified these investments as long-term. Deferred Stripping Costs: Effective January 1, 2006, the Company adopted Emerging Issues Task Force (“EITF”) Issue No. 04-06, “Accounting for Stripping Costs Incurred during Production in the Mining Industry.” EITF Issue No. 04-06 addresses the accounting for stripping costs incurred during the production phase of a mine and refers to these costs as variable production costs that should be included as a component of inventory to be recognized in costs applicable to sales in the same period as the revenue from the sale of inventory. The consensus requires application through recognition of a cumulative effect adjustment to opening retained earnings in the period of adoption, with no charge to current earnings for prior periods. The Company recorded a charge of approximately $0.4 million to retained earnings at January 1, 2006 to write off previously capitalized deferred stripping costs, as the cumulative effect of a change in accounting method.F-13
Reclamation and Remediation Costs: The Company follows SFAS No. 143, “Accounting for Asset Retirement Obligations”, which addresses financial accounting and reporting for obligations associated with the retirement of tangible long-lived assets and the associated asset retirement costs. The standard applies to legal obligations associated with the retirement of long-lived assets that result from the acquisition, construction, development and normal use of the asset. SFAS No. 143 requires that the fair value of a liability for an asset retirement obligation be recognized in the period in which it is incurred if a reasonable estimate of fair value can be made. The fair value of the liability is added to the carrying amount of the associated asset and this additional carrying amount is depreciated over the life of the asset. An accretion cost, representing the increase over time in the present value of the liability, is recorded each period in depreciation, depletion and amortization expense. As reclamation work is performed or liabilities are otherwise settled, the recorded amount of the liability is reduced. Future remediation costs for inactive mines are accrued based on management’s best estimate at the end of each period of the undiscounted costs expected to be incurred at the site. Such cost estimates include, where applicable, ongoing care and maintenance and monitoring costs. Changes in estimates are reflected in earnings in the period an estimate is revised.F-14
Foreign Currency: Substantially all assets and liabilities of foreign subsidiaries are translated at exchange rates in effect at the end of each period. Revenues and expenses are translated at the average exchange rate for the period. Foreign currency transaction gains and losses are included in the determination of net income. Derivative Financial Instruments: The Company accounts for derivative financial instruments in accordance with SFAS No. 133, “Accounting for Derivative Instruments and Hedging Activities,” (as amended by SFAS No. 137) and SFAS No. 138, “Accounting for Certain Derivative Instruments and Certain Hedging Activities.” These Statements require recognition of all derivatives as either assets or liabilities on the balance sheet and measurement of those instruments at fair value. Appropriate accounting for changes in the fair value of derivatives held is dependent on whether the derivative instrument is designated and qualifies as an accounting hedge and on the classification of the hedge transaction. For derivative instruments that are designated and qualify as cash flow hedges, the effective portions of changes in fair value of the derivative are recorded in other comprehensive income, (loss), and are recognized in the Consolidated Statement of Consolidated Operations when the hedged item affects net income (loss) for the period. Ineffective portions of changes in the fair value of cash flow hedges are recognized currently in earnings. Refer to Note NO – Derivative Financial Instruments and Fair Value of Financial Instruments. Stock-based Compensation Plans: Effective January 1, 2006, the Company began recording compensation expense associated with awards of equity instruments in accordance with Statement of Financial Accounting Standards (“SFAS”)SFAS No. 123(R), “Share-Based Payment”. Prior to January 1, 2006, the Company accounted for awards of equity instruments according to the provisions of SFAS No. 123, “Accounting for Stock-Based Compensation,” and related interpretations, and therefore no related compensation expense was recorded for awards granted with no intrinsic value. The Company adopted the modified prospective transition method provided for under SFAS No. 123(R), and, consequently, has not retroactively adjusted results from prior periods. Under this transition method, compensation cost associated with awards of equity instruments recognized during 2006 includes: 1) amortization related to the remaining unvested portion of all awards granted for the fiscal years 1995 to 2005, based on the grant date fair value, estimated in accordance with the original provisions of SFAS No. 123, “Accounting for Stock-Based Compensation”; and 2) amortization related to all equity instrument awards granted subsequent to December 31, 2005, based on the grant-date fair value estimated in accordance with the provisions of SFAS No. 123(R). The compensation costs are included in administrative and general expenses, productions costs and the cost of self-constructed property, plant and equipment as deemed appropriate.F-14
The compensation expense recognized in the Company’s consolidated financial statements for the years ended December 31, 2006, 2005 and 2004 for awards of equity instruments was $2.4 million, $1.2 million and $1.1 million, respectively. As of December 31, 2006, there was $1.8 million of total unrecognized compensation cost (net of estimated forfeitures) related to unvested stock options, restricted stock grants and performance share grants which is expected to be recognized over a weighted-average vesting period of 2.0 years.
The Company continues to estimate the fair value of each stock option award on the date of grant using the Black-Scholes option valuation model. The Company now estimates forfeitures of stock based awards based on historical data and adjusts the forfeiture rate periodically. The adjustment of the forfeiture rate will result in a cumulative adjustment in the period the forfeiture estimate is changed. During the year ended December 31, 2006, the Company recorded an adjustment of $0.1 million to reduce compensation expense for forfeited awards. Income Taxes: The Company computes income taxes in accordance with SFAS No. 109, “Accounting for Income Taxes.” SFAS No. 109 requires an asset and liability approach which results in the recognition of deferred tax liabilities and assets for the expected future tax consequences or benefits of temporary differences between the financial reporting basis and the tax basis of assets and liabilities, as well as operating loss and tax credit carryforwards, using enacted tax rates in effect in the years in which the differences are expected to reverse.F-15
In assessing the realizability of deferred tax assets, management considers whether it is more likely than not that some portion or all of theits deferred tax assets will not be realized. Management considers the scheduled reversal of deferred tax liabilities, projected future taxable income and tax planning strategies in making this assessment. A valuation allowance has been provided for the portion of the Company’s net deferred tax assets for which it is more likely than not that they will not be realized. The Company and its subsidiaries are subject to U.S. federal income tax as well as income tax of multiple state and foreign jurisdictions. The Company has substantially concluded all U.S. federal income tax matters for years through 1999. Federal income tax returns for 2000 through 2006 are subject to examination. The Company’s continuing practice is to recognize interest and/or penalties related to income tax matters in income tax expense. There were no significant accrued interest or penalties at December 31, 2007. Comprehensive Income (Loss):Income: Comprehensive income (loss) includes net income (loss) as well as changes in stockholders’ equity that result from transactions and events other than those with stockholders. Items of comprehensive income (loss) include the following:2006
2005
2004
Net income (loss) $ 88,486 $ 10,551 $ (16,858 ) Unrealized gain (loss) on marketable securities 63 853 (347 ) Change in fair value of cash flow hedges, net of 111 (169 ) (130 ) settlements Minimum pension liabilities 2,219 (237 ) (431 ) Other (2 ) -- --
$ 90,877 $ 10,998 $ (17,766 )
following (in thousands):
2007 2006 2005 Net income $ 43,890 $ 88,486 $ 10,551 Unrealized gain on short-term investments and marketable securities 103 63 853 Change in fair value of cash flow hedges, net of settlements (23 ) 111 (169 ) Minimum pension liabilities — 2,219 (237 ) Foreign currency translation 6 (2 ) — $ 43,976 $ 90,877 $ 10,998
Net Income (Loss) Per Share: The Company follows SFAS No. 128, “Earnings Per Share,” which requires the presentation of basic and diluted earnings per share. Basic earnings per share is computed by dividing net income (loss) available to common shareholders by the weighted average number of common shares outstanding during each period. Diluted earnings per share reflect the potential dilution that could occur if securities or other contracts to issue common stock were exercised or converted into common stock. The effect of potentially dilutive stock options and debentures outstanding in the years ending December 31, 2007, 2006 2005 and 20042005 are as follows:F-15
For the Year Ended
December 31, 2006
For the Year Ended
December 31, 2005
For the Year Ended
December 31, 2004
(In thousands except for EPS) Income
(Numerator)
Shares
(Denominator)
Per-Share
Amount
Income
(Numerator)
Shares
(Denominator)
Per-Share
Amount
Income
(Numerator)
Shares
(Denominator)
Per-Share
Amount
Basic EPS Income (loss) from continuing operations $ 75,419 271,357 $ 0.28 $ 14,746 242,915 $ 0.06 $ (18,036 ) 215,969 $ (0.08 ) Income (loss) from discontinued operations 13,067 271,357 0.05 (4,195 ) 242,915 (0.02 ) 1,178 215,969 --
Net income (loss) $ 88,486 271,357 $ 0.33 $ 10,551 242,915 $ 0.04 $ (16,858 ) 215,969 $ (0.08 ) Effect of Dilutive Securities Equity awards -- 1,041 -- -- 768 -- -- -- -- 1.25% convertible notes 1,117 23,684 -- -- -- -- -- -- -- Diluted EPS Income (loss) from continuing operations $ 76,536 296,082 0.26 $ 14,746 243,683 $ 0.06 $ (18,036 ) 215,969 $ (0.08 ) Income (loss) from discontinued operations 13,067 296,082 0.04 (4,195 ) 243,683 (0.02 ) 1,178 215,969 --
Net income (loss) $ 89,603 296,082 $ 0.30 $ 10,551 243,683 $ 0.04 $ (16,858 ) 215,969 $ (0.08 )
The following potentially dilutive shares have been excluded from earnings per share calculation as their effect is antidilutive:
December 31, 2006
December 31, 2005
December 31, 2004
Stock options -- -- 1,796,908 1.25% Notes Convertible at $7.06 per share -- 23,684,211 23,684,211
Total potentially dilutive shares -- 23,684,211 25,481,119
F-16
Year Ended Year Ended Year Ended December 31, 2007 December 31, 2006 December 31, 2005 Income Shares Per-Share Income Shares Per-Share Income Shares Per-Share (In thousands except for EPS) (Numerator) (Denominator) Amount (Numerator) (Denominator) Amount (Numerator) (Denominator) Amount Basic EPS Income from continuing operations $ 43,890 285,972 $ 0.15 $ 75,419 271,357 $ 0.28 $ 14,746 242,915 $ 0.06 Income from discontinued operations — 285,972 — 13,067 271,357 0.05 (4,195 ) 242,915 (0.02 ) Net income $ 43,890 285,972 $ 0.15 $ 88,486 271,357 $ 0.33 $ 10,551 242,915 $ 0.04 Effect of Dilutive Securities Equity awards — 868 — 1,041 — 768 1.25% convertible notes 297 23,684 1,117 23,684 — — Diluted EPS Income from continuing operations $ 44,187 310,524 0.14 $ 76,536 296,082 0.26 $ 14,746 243,683 $ 0.06 Income (loss) from discontinued operations — — 13,067 296,082 0.04 (4,195 ) 243,683 (0.02 ) Net income $ 44,187 310,524 $ 0.14 $ 89,603 296,082 $ 0.30 $ 10,551 243,683 $ 0.04
For the years ended 2007, 2006 2005 and 2004,2005, options to purchase 531,112, 322,653 876,192 and -0-876,192 shares of common stock at prices between $4.81 to $8.94, $6.66 to $15.15$15.19 and $3.92 to $17.94, respectively, were not included in the computation of diluted EPS because the exercise price of options was greater than the average market price of the common shares. The options, which expire between 20072008 to 2016,2017, are outstanding at December 31, 2006.2007. Potentially diluting shares totaling 23,684,211 shares attributed to the 1.25% convertible notes have been excluded from the earnings per share calculation for the year ended December 31, 2005 as their effect was anti-dilutive.
Debt Issuance Costs: Costs associated with the issuance of debt are included in other noncurrent assets and are amortized over the term of the related debt. Use of Estimates: The preparation of the Company’s consolidated financial statements in conformity with U.S. generally accepted accounting principles generally accepted in the United States of America(“GAAP”) requires management to make estimates and assumptions that affect the amounts reported in their consolidated financial statements and accompanying notes. The areas requiring the use of management’s estimates and assumptions relate to recoverable ounces from proven and probable reserves that are the basis of future cash flow estimates and units-of-production depreciation and amortization calculations; useful lives utilized for depreciation, depletion and amortization of future cash flows for long lived assets; estimates of recoverable gold and silver ounces in ore on leach pad; the amount and timing of reclamation and remediation costs; valuation allowanceallowances for deferred tax assets; and post-employment and other employee benefit liabilities. Reclassifications: Certain reclassifications of prior year balances have been made to conform to the current year presentation. These reclassifications had no impact on the Company’s consolidated financial position, results of operations or cash flows for the periods presented. The most significant reclassifications were to reclassify the balance sheet amounts and the income statement results from historical presentation to assets and liabilities of discontinued operations and toincome (loss) income from discontinued operations in the consolidated statements of operations for all periods presented.the years ended December 31, 2006 and 2005. The consolidated statements of cash flows have been reclassified for discontinued operations for allthe periods presented.ended December 31, 2006 and 2005. In addition, investments in auction rate securities have been reclassified from cash and cash equivalents to short-term investments on the consolidated balance sheet as of December 31, 2005. We also madeand corresponding adjustments were made to the consolidated statements of cash flows for all of the periods presented.ended December 31, 2006 and 2005.
Recent Accounting Pronouncements: In November 2004, FASB issued SFAS No. 151, “Inventory Costs,” which amends the guidance in ARB No. 43, Chapter 4, “Inventory Pricing,” to clarify the accounting for abnormal amounts of idle facility expense, freight, handling costs, and wasted material (spoilage). This Statement now requires that these items be recognized as current-period expenses regardless of whether they meet the criterion of “so abnormal” as previously stated in ARB No. 43, Chapter 5, “Intangible Assets”. In addition, this Statement requires that the allocation of fixed production overhead to costs of conversion be based on the normal capacity of the production facility. SFAS No. 151 is effective for inventory costs incurred during fiscal years beginning after June 15, 2005. The Company has performed a review of the provisions of the Statement and has determined that its current accounting practice is to recognize the costs attibuted to idle facilities as a current-period expense and, therefore adoption in 2006 did not impact the Company’s financial statements. In December 2004,February 2007, the FASB issued Statement No. 159, “The Fair Value Option for Financial Assets and Financial Liabilities” (“SFAS No. 123(R), “Share-Based Payments”, which revised159”). SFAS No. 123, “Accounting for Stock-Based Compensation”159 permits entities to choose to measure many financial instruments and superseded Accounting Principles Board (“APB”) Opinion 25, “Accounting for Stock Issued to Employees” and its related implementation guidance. SFAS No. 123(R) requires measurement and recording in the financial statements of the costs of employee services received in exchange for an award of equity instruments based on the grant-datecertain other items at fair value, with the objective of the award, recognized over the period during which an employee is requiredimproving financial reporting by mitigating volatility in reported earnings caused by measuring related assets and liabilities differently without having to provide services in exchange for such award.apply complex hedge accounting provisions. The Company adopted the provisions of SFAS No. 123(R) on January 1, 2006, using the modified prospective method. Accordingly, compensation expense was recognized for all newly granted awards and awards modified, repurchased, or cancelled after January 1, 2006. Compensation cost for the unvested portion of awards that were outstanding, as of January 1, 2006, is recognized ratably over the remaining vesting period. The compensation cost for the unvested portion of awards is based on the fair value at date of grant, adjusted for forfeitures, as determined pursuant to SFAS No. 123. The actual effect on net income and earnings per share in future periods will vary depending upon the number and fair value of options granted in future years compared to prior years. The adoption resulted in a charge to the Company’s statement of operations of $1.4 million in 2006 and did not impact the Company’s cash flow.
F-17
In March 2005, the Financial Accounting Standards Board (“FASB”) ratified Emerging Issues Task Force (“EITF#148;) Issue No. 04-06, “Accounting for Stripping Costs Incurred during Production in the Mining Industry.#148; EITF Issue No. 04-06 addresses the accounting for stripping costs incurred during the production phase of a mine and refers to these costs as variable production costs that should be included as a component of inventory to be recognized in costs applicable to sales in the same period as the revenue from the sale of inventory. The guidance in EITF Issue No. 04-06 was159 are effective for the Company in 2006. The guidance requires application through recognition of a cumulative effect adjustment to opening retained earnings in the period of adoption.Company’s fiscal year ending December 31, 2008. The Company adoptedis currently evaluating the impact that the adoption of this pronouncement as of January 1, 2006 and recorded a charge of approximately $0.4 million to write off deferred stripping costs, asstatement will have on the cumulative effect of a change in accounting method.
In May 2005, the FASB issued SFAS No. 154, “Accounting Changes and Error Corrections.” SFAS No. 154 established new standards on accounting for changes in accounting principles. SFAS No. 154 requires all such changes to be accounted for by retrospective application to the financial statements of prior periods unless prescribed otherwise or it is impracticable to do so. SFAS No. 154 is effective for accounting changes and error corrections made in fiscal years beginning after December 15, 2005. Adoption of SFAS No. 154 did not have a material impact on ourCompany’s consolidated financial position, results of operations or cash flows.and disclosures.
F-16
In September 2006, the FASB issued Statement No. 157 “Fair Value Measurements” (SFAS 157). SFAS 157 defines fair value, establishes a framework for measuring fair value in generally accepted accounting principles, and expands disclosures about fair value measurements. The provisions of SFAS 157 are effective for the Company’s fiscal year ending December 31, 2008. The Company is currently evaluating the impact of the adoption of this statement on the Company’s consolidated financial position, results of operations and disclosures. In June 2006, the FASB issued Interpretation No. 48, “Accounting for Uncertainty in Income Taxes”, (FIN 48)Taxes, an Interpretation of FASB Statement No. 109, “Accounting for Income Taxes”109” (FIN 48). FIN 48 prescribes a recognition threshold and measurement attribute for the financial statement recognition and measurement of tax positions taken or expected to be taken in a tax return. FIN 48 requires that the Company recognize in its financial statements the impact of a tax position, if that tax position is more likely than not of being sustained on audit, based on the technical merits of the position. FIN 48 also provides guidance on derecognition, classification of interest and penalties, accounting in interim periods and disclosure. The provisions of FIN 48 arewere effective beginning January 1, 2007, with the cumulative effect of the change in accounting principle recorded as an adjustment to the opening balance of retained earnings. Currently, the2007. The adoption of FIN 48 isdid not expected to have a material effect on the Company’s financial position, results of operations or cash flows.F-18
The Company and its subsidiaries are subject to U.S. federal income tax as well as income tax of multiple state and foreign jurisdictions. The Company has substantially concluded all U.S. federal income tax matters for years through 1999. Federal income tax returns for 2000 through 2006 are subject to examination. The Company’s continuing practice is to recognize interest and/or penalties related to income tax matters in income tax expense. There were no significant accrued interest or penalties at December 31, 2007.NOTE C — SHORT-TERM INVESTMENTSACQUISITIONS OF BOLNISI AND MARKETABLE SECURITIES ThePALMAREJO
On December 21, 2007, the Company classifiescompleted its investment securities as available-for-sale securities. Pursuant to SFAS 115, “Accountingacquisition of all the shares of Bolnisi Gold NL (“Bolnisi”) and Palmarejo Gold and Silver Corporation (“Palmarejo”) in exchange for Certain Investmentsa total of approximately 272 million shares of Coeur common stock, a total cash payment of approximately $1.1 million and assumption of liabilities of $0.7 billion. Coeur issued 0.682 shares of Coeur common stock (or, at the election of the Bolnisi shareholder, CHESS Depositary Interests representing Coeur shares) and A$0.004 in Debt and Equity Securities”, such securities are measured at fair market valuecash (or approximately US$1.0 million in the financial statements with unrealized gains or losses recordedaggregate) for each Bolnisi ordinary share, and 2.715 shares of Coeur common stock and C$0.004 in other comprehensive income (loss). Atcash (or approximately US$0.1 million in the time securitiesaggregate) for each Palmarejo common share. The transaction was accounted for as a purchase of assets and not as a business combination since Bolnisi and Palmarejo are sold or otherwise disposed of, gains or losses are includedconsidered to be in net income (loss).the development stage. The total consideration paid for the acquisition was as follows (in thousands): Consideration: Coeur stock issued (271,969,428 shares at $4.04) $ 1,098,757 Cash payments 1,102 Transaction advisory fees and other costs 16,621 Total purchase price 1,116,480 Current liabilities 54,946 Other long-term liabilities 23,642 Deferred income taxes 572,711 Total liabilities assumed 651,299 $ 1,767,779
F-17
The following is a summarysummarizes the estimated fair values of available-for-sale securities:Available-For-Sale Securities
Cost
Gross
Unrealized
Losses
Gross
Unrealized
Gains
Estimated
Fair
Value
As of December 31, 2006 U.S. Corporate $ 65,372 $ -- $ -- $ 65,372 U.S. Government 5,000 -- 1 5,001
Total debt securities 70,372 -- 1 70,373 Equity securities 99 1 622 720
70,471 1 623 71,093
As of December 31, 2005 Auction Rate Securities $ 159,720 $ -- $ -- $ 159,720 U.S. Corporate 23,893 51 -- 23,842 U.S. Government 1,891 7 -- 1,884
Total debt securities 185,504 58 -- 185,446 Equity securities 19 4 615 630
$ 185,523 $ 62 $ 615 $ 186,076
As of December 31, 2004 Auction Rate Securities $ 207,850 $ -- $ -- $ 207,850 U.S. Corporate 18,964 107 1 18,858 U.S. Government 29,062 205 -- 28,857 State/Municipal 1,285 7 -- 1,278
Total debt securities 257,161 319 1 256,843 Equity securities 20 3 17 34
$ 257,181 $ 322 $ 18 $ 256,877
Gross realized gains and losses are basedthe assets acquired on a carrying value (cost, net of discount or premium) of short-term investments sold or adjusted for other than temporary decline in market value. Short-term investments mature at various dates. There were no realized gains and/or losses for the years ended 2006, 2005 and 2004.
Prior to December 31, 2006, the Company concluded that it was appropriate to classify its investments in auction rate securities as short-term investments. Previously such investments had been classified as cash and cash equivalents. Accordingly, the Company revised the classification to report these investments as short-term investments on the consolidated balance sheets as of December 31, 2005 and December 31, 2004. The Company also made corresponding adjustments to the consolidated statements of cash flows for the periods ended December 31, 2005 and December 31, 2004 to reflect the gross purchases and sales of these investments as investing activities rather than as a component of cash and cash equivalents. As of December 31, 2005 and December 31, 2004, $159.7 million and $207.9 million respectively, of these investments were reclassified from cash and cash equivalents to short-term investment on the consolidated Balance Sheet. This reclassification had no effect on the total current assets, stockholders’ equity, net income (loss), net income (loss) per share or cash provided by (used in) operating activities.
F-19
21, 2007 (in thousands):
Fair value of assets acquired: Cash $ 3,996 Other current assets 3,789 Property, plant and equipment 97,519 Mineral interests 1,657,189 Other assets 5,286 Total assets acquired $ 1,767,779
NOTE D –— DISCONTINUED OPERATIONS AND ASSETS AND LIABILITIES HELD FOR SALE During the first quarter of 2006, the Company committed to a plan to sell Coeur Silver Valley Inc. (“CSV”), a wholly owned subsidiary of Coeur d’Alene Mines Corporation, that ownsowned and operatesoperated the Galena underground silver mine and adjoining properties in Northern Idaho. On April 10, 2006, the Company announced that it had entered into an agreement to sell 100% of the shares of CSV to U.S. Silver Corporation for $15 million in cash. On June 1, 2006, the Company completed the sale of 100% of CSV to U.S. Silver Corporation for a total of $15 million in cash plus a post-closing working capital adjustment of $1.1 million. The Company recorded, within discontinued operations, a gain of approximately $11.1 million in the year ended December 31, 2006. Pursuant to SFAS No. 144, “Accounting for the Impairment or Disposal of Long-Lived Assets,” CSV was classified as held for sale and the results of its operations reported in discontinued operations for all prior periods.beginning in the period ended June 30, 2006.
The following table details selected financial information included in the income (loss) from discontinued operations in the consolidated statements of operations for the years ended December 31, 2006 2005 and 20042005 (in thousands): Years ended December 31, 2006 2005 Sales of metal $ 11,223 $ 16,052 Production costs applicable to sales (8,233 ) (16,698 ) Depreciation and depletion (681 ) (1,996 ) Mining exploration (279 ) (1,361 ) Other (95 ) (192 ) Income (loss) from discontinued operations 1,935 (4,195 ) Gain on sale of net assets of discontinued operations 11,132 — Net income (loss) from discontinued operations $ 13,067 $ (4,195 )
F-18
2006
2005
2004
Sales of metal $ 11,223 $ 16,052 $ 23,759 Production costs applicable to sales (8,233 ) (16,698 ) (18,637 ) Depreciation and depletion (681 ) (1,996 ) (1,967 ) Mining exploration (279 ) (1,361 ) (1,620 ) Other (95 ) (192 ) (357 )
Income (loss) from discontinued operations 1,935 (4,195 ) 1,178 Gain on sale of net assets of discontinued operations 11,132 -- --
Net income (loss) from discontinued operations $ 13,067 $ (4,195 ) $ 1,178
NOTE E — INVESTMENTS AND OTHER MARKETABLE SECURITIES The major classes of assetsCompany classifies its investment securities as available-for-sale securities. Pursuant to SFAS 115, “Accounting for Certain Investments in Debt and liabilities of discontinued operations held for saleEquity Securities”, such securities are measured at fair market value in the consolidated balance sheet asfinancial statements with unrealized gains or losses recorded in other comprehensive income. At the time securities are sold or otherwise disposed of, gains or losses are included in net income. The following is a summary of available-for-sale securities (in thousands): Available-For-Sale Securities Gross Gross Estimated Unrealized Unrealized Fair Cost Losses Gains Value As of December 31, 2007 U.S. Corporate $ 2,000 $ — $ — $ 2,000 U.S. Government 51,031 — 8 51,039 Total debt securities 53,031 — 8 53,039 Equity securities 99 — 702 801 $ 53,130 $ — $ 710 $ 53,840 As of December 31, 2006 U.S. Corporate $ 65,372 $ — $ — $ 65,372 U.S. Government 5,000 — 1 5,001 Total debt securities 70,372 — 1 70,373 Equity securities 99 1 622 720 $ 70,471 $ 1 $ 623 $ 71,093
Gross realized gains and losses are based on a carrying value (cost, net of discount or premium) of short-term investments sold or adjusted for other than temporary decline in market value. Short-term investments mature at various dates. There were no realized gains and/or losses in 2007, 2006 and 2005.Asset-Backed Commercial Paper (“ABCP”) The Company acquired certain asset-backed securities in connection with the Bolnisi and Palmarejo acquisition. Palmarejo has investments in non-bank sponsored ABCP (before accounting for an impairment charge), of which $6.3 million is invested in Apsley Trust Class E and $0.5 million in Aurora Trust Class A. Since a certain percentage of the assets supporting the commercial paper was invested in U.S. sub-prime residual mortgage-backed securities, the Company recorded an impairment based on the best available market data for such investments at the date of acquisition. Consequently, the Company recorded these investments at their estimated fair value of $5.3 million for the ABCP held by Palmarejo. The fair value of the ABCP are determined based on the Company’s assessment of market conditions at the date of acquisition, no further impairments were deemed necessary at December 31, 2005 is as follows (in thousands):December 31, 2005
Assets Receivables $ 2,036 Prepaids 906 Inventory 2,561 Property, plant and equipment (net) 2,016 Operational mining properties, net 6,357 Other 952
Total assets of discontinued operations $ 14,828
Liabilities Accounts payable $ 747 Accrued liabilities 166 Accrued payroll and related benefits 578 Reclamation and mine closure 6,905 Defined benefit liabilities 2,588 Other non-current liabilities 1,924
Total liabilities of discontinued operations $ 12,908
F-20
2007. The fair value reported may change materially in subsequent periods.
NOTE EF — METAL AND OTHER INVENTORIES Inventories consist of the following:following (in thousands): December 31, 2007 2006 Concentrate and dorè inventory $ 11,221 $ 9,680 Supplies 7,697 6,661 Metal and other inventory $ 18,918 $ 16,341
F-19
December 31, 2006
2005
Concentrate and doré inventory $ 9,680 $ 7,835 Supplies 6,661 4,972
Metal and other inventory $ 16,341 $ 12,807
NOTE FG — PROPERTY, PLANT AND EQUIPMENT Property, plant and equipment consists of the following:December 31, 2006
2005
Land $ 1,112 $ 1,423 Building improvements 51,818 40,869 Machinery and equipment 77,040 60,470 Capitalized leases for machinery and equipment 2,345 2,345
132,315 105,107 Accumulated depreciation (64,206 ) (57,929 )
$ 68,109 $ 47,178
following (in thousands):
December 31, 2007 2006 Land $ 1,133 $ 1,112 Building improvements 130,795 51,818 Machinery and equipment 153,328 77,040 Capitalized leases for machinery and equipment 37,477 2,345 322,733 132,315 Accumulated depreciation (69,937 ) (64,206 ) $ 252,796 $ 68,109
The Company’s capital expenditures, excluding the acquisitions of Bolnisi and Palmarejo, were as follows:2006
2005
2004
Rochester $ 1,225 $ 1,197 $ 3,548 Cerro Bayo 7,555 2,731 2,451 Martha 2,481 2,108 689 San Bartolome 14,597 10,477 950 Kensington 121,552 44,201 83 Endeavor -- 15,410 -- Broken Hill -- 36,667 -- Other 588 499 642
Net asset additions $ 147,998 $ 113,290 $ 8,363
Discontinued Operations - Coeur Silver Valley $ 617 $ 3,537 $ 2,151
follows (in thousands):
Years ended December 31, 2007 2006 2005 Rochester $ 1,647 $ 1,225 $ 1,197 Cerro Bayo 11,330 7,555 2,731 Martha 16,444 2,481 2,108 San Bartolomé 100,169 16,805 11,089 Kensington 92,337 122,640 53,155 Endeavor 2,112 — 15,410 Broken Hill 213 — 36,667 Other 1,942 588 499 Net asset additions $ 226,194 $ 151,294 $ 122,856 Discontinued Operations — Coeur Silver Valley $ — $ 617 $ 3,537
At December 31, 2007, 2006 and 2005, and 2004, approximately $22.1 million, $12.9 million $9.6 million and $0,$9.6, respectively, of invoices for capital expenditures remained in accounts payable and for purposes of the consolidated cash flows were treated as non-cash transactions. In connection with the acquisition of Bolnisi and Palmarejo, the Company assumed certain liabilities related to capital leases. In December 2006, Bolnisi, through its Canadian subsidiary Palmarejo, entered into a 2-year lease agreement for a power station. Under the terms of the agreement, including an amendment in January 2007, the Company will pay a fixed monthly amount of $0.3 million, including interest calculated at the rate of LIBOR plus 2.5%, starting at the date that the construction of the equipment is completed. The Company has the option at the end of the agreement to purchase the equipment by paying a nominal amount. In June 2007, Palmarejo entered into a 5-year lease agreement for $30.6 million of mining equipment to be delivered to Palmarejo as the equipment becomes available from the supplier. Mining equipment with a cost of $30.1 million has been delivered as of December 31, 2007. The Company will pay a monthly amount varying between $0.6 million and $0.8 million during the 2008 period and a fixed monthly amount of $0.6 million thereafter, including interest calculated at the rate of LIBOR plus 3.65%. The Company has the option at the end of the agreement to purchase the equipment by paying a nominal amount.F-20
F-21
Minimum future lease payments under both capital and operating leases at December 31, 20062007 are as follows:Year Ending December 31, Capital
Leases
Operating
Leases
2007 $ 916 $ 380 2008 -- -- 2009 -- -- 2010 -- -- Thereafter -- --
916 $ 380
Less: Amount representing interest 22
$ 894
follows (in thousands):
Capital Year Ending December 31, Leases 2008 11,554 2009 8,976 2010 6,755 2011 6,755 Thereafter 5,156 Total minimum payments due 39,196 Less: Amount representing interest 6,432 Present value of net minimum lease payments 32,764 Less: Current maturities 9,103 $ 23,661
The Company has entered into various operating lease agreements which expire over the next year. Total rent expense charged to net income (loss) under these agreements was $1.7 million, $2.6 million and $3.5 million for 2007, 2006, and $4.2 million for 2006, 2005, 2004, respectively.NOTE GH — MINING PROPERTIESDecember 31, 2006
2005
Capitalized costs for mining properties, net of accumulated depletion consist of the following(A): Operational mining properties: Rochester Mine $ 4,445 $ 8,582 Cerro Bayo Mine 8,531 6,660 Martha Mine 1,110 713
Total operational mining properties 14,086 15,955
Mineral interests, net of accumulated depletion Endeavor Mine 14,508 14,998 Broken Hill Mine 29,740 34,860 San Bartolome(B) 20,125 20,125
Total mineral interests 64,373 69,983
Non-producing and developmental properties: Kensington(C) 170,458 62,517 San Bartolome(D) 20,388 9,829 Other 142 142
Total non-producing and developmental properties 190,988 72,488
Total mining properties $ 269,447 $ 158,426
December 31, 2007 2006 Capitalized costs for mining properties, net of accumulated depletion consist of the following (in thousands):(A) Operational mining properties: Rochester Mine $ — $ 4,445 Cerro Bayo Mine 17,091 8,531 Martha Mine 1,832 1,110 Total operational mining properties 18,923 14,086 Mineral interests, net of accumulated depletion Endeavor Mine 15,865 14,508 Broken Hill Mine 26,897 29,740 San Bartolomé(B) 20,125 20,125 Palmarejo(C) 1,657,189 — Total mineral interests 1,720,076 64,373 Non-producing and developmental properties: Kensington(D) 256,443 170,458 San Bartolomé(E) 54,884 20,388 Other 142 142 Total non-producing and developmental properties 311,469 190,988 Total mining properties $ 2,050,468 $ 269,447
(A) On June 1, 2006, the Company completed the sale of 100% of the shares of its wholly-owned subsidiary, Coeur Silver Valley Inc., to US Silver Corporation for $15 million in cash and additional consideration received of $1.1 million for working capital.
(B) Balance represents acquisition cost of mineral interest.
(C) On December 31, 2007, the Company completed its acquisition of all of the shares of Bolnisi and Palmarejo in exchange for a total of approximately 272 million shares of Coeur common stock and a total cash payment of approximately $1.1 million.The total consideration paid was $1.1 billion and assumed liabilities were $0.7 billion. (D) During the third quarter of 2005, the Company commenced construction activities at its Kensington property. The costs incurred subsequent to commencing construction were capitalized as developmental properties.
F-21
(D)(E)During the fourth quarter of 2004, the Company commenced construction activities at its San BartolomeBartolomé property. The costs incurred subsequent to commencing construction were capitalized as developmental properties.
F-22
Operational Mining Properties Rochester Mine: The Company has conducted operations at the Rochester Mine, located in Western Nevada, since September 1986. The mine utilizes the heap-leaching process to extract both silver and gold from ore mined using open pit methods. Rochester’s primary product is silver with gold produced as a by-product. Cerro Bayo Mine: The Cerro Bayo Mine is a gold and silver underground mine located in southern Chile. Commercial production commenced on April 18, 2002. Martha Mine: The Martha Mine is an underground silver mine located in Argentina, approximately 270 miles southeast of Coeur’s Cerro Bayo mine. Coeur acquired a 100% interest in the Martha mine in April 2002. In July 2002, Coeur commenced shipment of ore from the Martha mine to the Cerro Bayo facility for processing. In December 2007, the Company completed a 240 tonne per day flotation mill which produces a flotation concentrate.
Mineral Interests Endeavor Mine: On May 23, 2005, the Company acquired all of the silver production and reserves, up to a maximum 17.7 million payable ounces, contained at the Endeavor Mine in Australia, which is owned and operated by Cobar Operations Pty. Limited (“Cobar”), a wholly-owned subsidiary of CBH Resources Ltd. (“CBH”), for $39.1$43.8 million. The Company is entitled to all of the silver production and reserves up to a maximum of 17.7 million payable ounces. The Endeavor Mine is located 720 km northwest of Sydney in New South Wales and has been in production since 1983. Under the terms of the original agreement, CDE Australia, a wholly-owned subsidiary of Coeur, paid Cobar $15.1$15.4 million of cash at the closing. In addition, CDE Australia, subject to certain conditions, will pay Cobar approximately $23.7$26.3 million upon the receipt of a report confirming that the reserves at the Endeavor mine are equal to or greater than the reported ore reserves for 2004. Payment couldwill occur in 2007.2008. In addition to these upfront payments, pursuant to the original agreement, Coeur pays Cobar an operating cost contribution of $1.00 for each ounce of payable silver plus a further increment which was to begin when the silver price exceeds $5.23 per ounce. This further increment was to begin on the second anniversary of the agreement and would have been 50% of the amount by which the silver price exceeds $5.23 per ounce. A cost contribution of $0.25 per ounce is also payable by Coeur in respect of new ounces of proven and probable silver reserves as they are discovered. The Company has paid a cost contribution of approximately $2.1 million during 2007.
On March 28, 2006, CDE Australia Pty, Ltd. (CDE Australia), reached an agreement with CBH Resources Ltd. to modify the terms of the original silver purchase agreement. Under the modified terms, CDE Australia owns all silver production and reserves up to a total of 20.0 million payable ounces, up from 17.7 million payable ounces in the original agreement. Based on the most recent ore reserve report, the current ore reserve contains approximately 15.314.4 million payable ounces. To date, the Company has received 0.71.4 million payable ounces based on current metallurgical recovery and current smelter contract terms. Expansion of the ore reserve will be required to achieve the maximum payable ounces of silver production as set forth in the modified contract. The silver price-sharing provision is deferred until such time as Coeur has received approximately 2 million cumulative ounces of silver from the mine or June 2007, whichever is later. In addition, the silver price-sharing threshold increased to US$7.00 per ounce, from the previous level of US$5.23 per ounce.F-22
Broken Hill Mine:On September 8, 2005, the Company acquired all of the silver production and reserves, up to a maximum of 17.2 million payable ounces, contained at the Broken Hill mine in Australia, which is owned and operated by Perilya Broken Hill Ltd. (“PBH”) for $36.7$36.9 million. The Broken Hill Mine is located in New South Wales, Australia and is a zinc/lead/silver ore body. Pursuant to the Agreement, the transaction includes up to a maximum of approximately 24.5 million contained ounces (or 17.2 million payable ounces) of silver to be mined by PBH at Broken Hill on the Company’s behalf. In addition, CDE Australia will pay PBH an operating cost contribution of approximately US$2.00 for each ounce of payable silver under the terms of the Agreement and PBH may earn up to US$6.0 million of additional consideration by meeting certain silver production thresholds through 2014. No additional payments were made during 2007, 2006 or 2005.F-23
Non-Producing and Development Properties San Bartolome Project:Bartolomé: On September 9, 1999, the Company acquired EmpressaEmpresa Minera Manquiri (“Manquiri”). Manquiri’s principal asset is the San BartolomeBartolomé project, a silver exploration and development property located near the city of Potosi,Potosí, Bolivia. The San BartolomeBartolomé project consists of silver-bearing gravel deposits which lend themselves to simple surface mining methods. The mineral rights for the San BartolomeBartolomé project are held through long-term joint venture/lease agreements with several local independent mining co-operatives and the Bolivian State owned mining company, (“COMIBOL”). Production from San BartolomeBartolomé is subject to a royalty of 4% payable to the co-operatives and COMIBOL. During 2004, the Company completed an updated feasibility study, obtained all required permits and commenced construction of the San BartolomeBartolomé mine. The Company estimates the cost of constructiontotal capital costs (excluding political risk insurance premiums and capitalized interest) of theat San BartolomeBartolomé mine to be approximately $174 million.$220 million of which $129.2 million had been incurred as of December 31, 2007. During 2006,2007, the Company capitalized $14.6$100.2 million in connection with construction activities at San Bartolome.Bartolomé.
Kensington Project:Kensington: Kensington is a gold property located near Juneau, Alaska. The mine will be an underground gold mine accessed by a horizontal tunnel and will utilize conventional and mechanized underground mining methods. The ore will be processed in a flotation mill that produces a concentrate which will be sold to third party smelters. During 2006,2007, the Company capitalized $121.6$99.0 million in connection with construction activities at Kensington. The company estimatesCompany has expended approximately $269.7 million as of December 31, 2007.Palmarejo: Palmarejo is engaged in the exploration and development of silver and gold properties located in the State of Chihuahua in northern Mexico, and its principal silver and gold properties are collectively referred to as the “Palmarejo project.” The Palmarejo project is currently under development and is expected to commence commercial production in the first half of 2009. The total capital cost of contructionthe project, from the time the Company acquired it on December 21, 2007, is estimated to be approximatly $238approximately $225 million.Discontinued Operations Coeur Silver Valley (Galena) Mine: On June 1, 2006, the Company completed the sale of 100% of the shares of its wholly owned subsidiary Coeur Silver Valley, Inc. to U.S. Silver Corporation for $15 million in cash plus a post-closing working capital adjustment of $1.1 million.NOTE HI — LONG-TERM DEBT11/1 ¼%4% Debentures
The $180.0 million principal amount of 1 ¼%1/4% Debentures due 2024 outstanding at December 31, 20062007 are convertible into shares of common stock at the option of the holder on January 15, 2011, 2014, and 2019, unless previously redeemed, at a conversion price of $7.60 per share, subject to adjustment in certain events.F-23
The Company is required to make semi-annual interest payments on the debentures. The debentures are redeemable at the option of the Company before January 18, 2011, if the closing price of the Company’s common stock over a specified number of trading days has exceeded 150% of the conversion price, and anytime thereafter. Before January 18, 2011, the redemption price is equal to 100% of the principal amount of the notes plus an amount equal to 8.75% of the principal amount of the notes, less the amount of any interest actually paid on the notes on or prior to the redemption date. The debentures have no other funding requirements until their maturity on January 15, 2024.F-24
The fair value of the debentures is determined by market transactions on or near December 31, 20062007 and 2005,2006, respectively. The fair value of the debentures, as of December 31, 2007 and 2006, was $156.6 million and 2005, was $163.8 million, and $146.7 million, respectively. Total interest expense on debentures and notes for the year ended December 31, 2007, 2006, and 2005 and 2004 was $2.3 million, of which $2.3 million was capitalized as a cost of certain properties under development in 2007; $2.3 million, of which $1.4 million was capitalized as a cost of certain properties under development in 2006,2006; and $2.3 million, of which $0.2 million was capitalized as a cost of certain properties under development in 2005, and $2.9 million, of which $0.1 million was capitalized as a cost of certain properties under development in 2004, respectively. Interest paid was $2.3 million in 2006,2007, $2.3 million in 2005,2006, and $1.6$2.3 million in 2004.2005.
Bridging Debt Facility On October 22, 2007, Bolnisi entered into a $20 million credit facility with Macquarie Bank Limited to fund further exploration and development of the Palmarejo silver/gold project, surrounding exploration areas and for working capital purposes. The credit facility was extended to June 30, 2008 and bears interest at a variable rate (LIBOR) plus a margin of 2.45%. As of December 31, 2007, the Company has $20 million outstanding under the credit facility bearing an interest rate of 7.35%. Events of default under the credit facility include customary provisions for similar types of facilities.Bank Loan On August 30, 2007 (with amendment dated October 9, 2007), Palmarejo entered into a temporary credit facility of $2.0 million secured by the Company’s investments in Asset Backed Commercial Paper, to fund working capital requirements. The credit facility has been extended through May 31, 2008. As of December 31, 2007, an amount of $1.7 million has been drawn on the facility, which bears interest at prime less 1.50% and matures on May 31, 2008. The Company is required to reduce the amount of the outstanding credit facility with any proceeds received from the sale of the Asset Backed Commercial Paper.NOTE IJ — RECLAMATION AND REMEDIATION COSTS Reclamation and remediation costs are based principally on legal and regulatory requirements. Management estimates costs associated with reclamation of mining properties as well as remediation costs for inactive properties. The Company uses assumptions about future costs, mineral prices, mineral processing recovery rates, production levels and capital and reclamation costs. Such assumptions are based on the Company’s current mining plan and the best available information for making such estimates. On an ongoing basis, management evaluates its estimates and assumptions; however, actual amounts could differ from those based on such estimates and assumptions. The Asset Retirement Obligationasset retirement obligation is measured using the following factors: 1) Expected labor costs, 2) Allocated overhead and equipment charges, 3) Contractor markup, 4) Inflation adjustment, and 5) Market risk premium. The sum of all these costs is discounted, using the Company’s credit adjusted risk-free interest rate from the time we expect to pay the retirement obligation to the time we incur the obligation. The measurement objective is to determine the amount a third party would demand to assume the asset retirement obligation.F-24
Upon initial recognition of a liability for an asset retirement obligation, the Company capitalized the asset retirement cost as an increase in the carrying amount of the related long-lived asset. The Company depletes this amount using the units-of-production method. The Company is not required to re-measure the obligation at fair value each period, but the Company is required to evaluate the cash flow estimates at the end of each reporting period to determine whether the estimates continue to be appropriate. Upward revisions in the amount of undiscounted cash flows are discounted using a current credit-adjusted risk-free rate. Downward revisions are discounted using the credit-adjusted risk-free rate that existed when the original liability was recorded.recorded, or, if not readily determinable, at the weighted average discount rate used to record the liability.
At December 31, 2007 and 2006, $33.1 million and 2005, $29.9 million, and $23.5 million, respectively, werewas accrued for reclamation obligations related to currently producing and developmental mineral properties. In addition, the Company has accrued $1.8$1.7 million and $1.2$1.8 million, respectively, for reclamation obligations associated with former mining activities. These amounts are also included in reclamation and mine closure liabilities. In the fourth quarter of 2007, the Company reviewed its cash flow estimates for its asset retirement obligations. This resulted in a net increase to the asset retirement obligation of $3.4 million and a corresponding increase to the carrying amount of the asset to be retired. For the purpose of consolidated statement of cash flows, these amounts are non-cash transactions. The increase was due to additional reclamation required at the Company’s Cerro Bayo mine, Kensington project and San Bartolomé project. The increase was discounted using the Company’s current weighted average credit adjusted risk-free rate of 9.34%. In the fourth quarter of 2006, the Company reviewed its cash flow estimates for its asset retirement obligations. This resulted in a net increase to the asset retirement obligation of $6.1 million and a corresponding increase to the carrying amount of the asset to be retired. For the purpose of consolidated statement of cash flows, these amounts are non-cash transactions. The increase was due to additional reclamation required at the Company’s Rochester mine, Kensington and San Bartolome projects. The increase was discounted using the Company’s current weighted average credit adjusted risk-free rate of 7.6%. In the fourth quarter of 2005, the Company reviewed its cash flow estimates for its asset retirement obligations. This resulted in a net increase to the asset retirement obligation of $6.4 million and a corresponding increase to the carrying amount of the asset to be retired. For the purpose of consolidated statement of cash flows, these amounts are non-cash transactions. The increase was due to additional reclamation required as a result of the expansion of the Company’s Cerro Bayo mine and adjustments to future estimated costs at the Company’s Rochester mine, Kensington project and San BartolomeBartolomé project. The increase was discounted using the Company’s current weighted average credit adjusted risk-free rate of 7.79%7.6%.
F-25
The following is a description of the changes to the Company’s asset retirement obligations for the years ended December 31, 2007 and 2006 and 2005:(in thousands): Years Ended December 31, 2007 2006 Asset retirement obligation — January 1 $ 29,909 $ 23,524 Accretion 2,260 1,780 Additions 3,390 6,069 Changes in estimates (1,202 ) (507 ) Settlements (1,222 ) (957 ) Asset retirement obligation — December 31 $ 33,135 $ 29,909
F-25
Year Ended December 31, 2006
2005
(in thousands) Asset retirement obligation - January 1 $ 23,524 $ 16,921 Accretion 1,780 1,265 Additions 6,069 6,397 Changes in estimates (507 ) (74 ) Settlements (957 ) (985 )
Asset retirement obligation - December 31 $ 29,909 $ 23,524
NOTE JK — INCOME TAXESIncome (loss)
The components of income from continuing operations before income taxes iswere as follows:Year Ended December 31, 2006
2005
2004
(in thousands) United States $ 33,252 $ (5,576 ) $ (22,281 ) Foreign 50,393 21,805 (1,540 )
Total $ 83,645 $ 16,229 $ (23,821 )
follows (in thousands):
Years Ended December 31, 2007 2006 2005 United States $ 21,909 $ 33,252 $ (5,576 ) Foreign 36,908 50,393 21,805 Total $ 58,817 $ 83,645 $ 16,229
The components of the consolidated income tax (provision) benefitprovision from continuing operations were as follows:Years Ended December 31,
2006
2005
2004
Current: United States - Alternative minimum tax $ (900 ) $ 212 $ 1,382 United States - Foreign withholding (713 ) -- -- Foreign - Argentina (4,842 ) (66 ) -- Foreign - Australia (4,673 ) -- -- Deferred: Foreign - Argentina 65 929 -- Foreign - Australia (93 ) (404 ) -- Foreign - Chile 2,930 (2,154 ) 4,403
Income tax benefit (provision) $ (8,226 ) $ (1,483 ) $ 5,785
follows (in thousands):
Years Ended December 31, 2007 2006 2005 Current: United States — Alternative minimum tax $ (381 ) $ (900 ) $ 212 United States — Foreign withholding tax (904 ) (713 ) — Foreign — Argentina (6,590 ) (4,842 ) (66 ) Foreign — Australia (4,898 ) (4,673 ) — Deferred: Foreign — Argentina 172 65 929 Foreign — Australia (664 ) (93 ) (404 ) Foreign — Chile (1,662 ) 2,930 (2,154 ) Income tax provision $ (14,927 ) $ (8,226 ) $ (1,483 )
A reconciliation of the Company’s effective tax rate with the federal statutory tax rate for the periods indicated is as follows:Years Ended December 31 2006
2005
2004
Tax benefit (provision) from continuing operations $ (29,276 ) $ (5,680 ) $ 8,337 State tax benefit (provision) from continuing operations (2,509 ) (487 ) 715 Excess percentage depletion and related deductions 6,199 4,265 3,698 Change in valuation allowances 14,778 (5,555 ) (9,474 ) Effect of foreign earnings 4,744 4,744 1,346 US and foreign non-deductible expenses (1,059 ) 632 610 Foreign currency exchange rates -- 827 -- Other net (1,103 ) (229 ) 553
$ (8,226 ) $ (1,483 ) $ 5,785
Years Ended December 31 2007 2006 2005 Tax provision from continuing operations $ (20,600 ) $ (29,276 ) $ (5,680 ) State tax provision from continuing operations (1,766 ) (2,509 ) (487 ) Percentage depletion and related deductions 4,860 6,199 4,265 Change in valuation allowance 3,896 14,778 (5,555 ) U.S. and Foreign non-deductible expenses (663 ) (711 ) 632 Foreign tax rate differences 2,309 4,744 4,744 Foreign withholding taxes (904 ) (713 ) — Other, net (2,059 ) (738 ) 598 $ (14,927 ) $ (8,226 ) $ (1,483 )
F-26
As of December 31, 20062007 and 2005,2006, the significant components of the Company’s deferred tax assets and liabilities were as follows:Years Ended December 31, 2006
2005
Deferred tax liabilities: Property, plant and equipment , net $ 7,318 $ 7,665 Investments in foreign subsidiaries 9,761 471
17,079 8,136
Deferred tax assets: Mineral properties 62,284 66,664 Net operating loss carryforwards 68,794 88,130 Alternative minimum tax credit 2,479 1,246 carryforwards Investments in foreign subsidiaries 8,129 404 Capital loss carryforwards 12,864 5,672 Other 6,197 3,173
160,747 165,289 Valuation allowance (137,992 ) (154,379 )
22,755 10,910
Net deferred tax assets $ 5,676 $ 2,774
The Company has not had a strong earnings history which would be objective evidence as required by generally accepted accounting principles to recognize its net operating less carryforwards and other deductible temporary differences. It is likely that the alternative minimum tax will exceed the regular tax for the foreseeable future. Accordingly, the Company has recorded a valuation allowance of $138.0 million as of December 31, 2006, which includes a full valuation allowance against the $2.5 million minimum tax credit carryforward, which is available for an unlimited carryforward period to offset regular federal income tax in excess of the alternative minimum tax. The Company has reviewed its domestic and foreign deferred tax assets and, except for approximately $6.2 million deferred tax assets related to the Company’s Cerro Bayo and Martha mines, has not recognized the potential tax benefits in other jurisdictions because at this time management believes that the realization of such benefits in future periods does not meet the more likely than not criteria.follows (in thousands):
Years Ended December 31 2007 2006 Deferred tax liabilities: Mineral properties $ 552,007 $ — Investment in foreign subsidiaries 18,430 9,761 Property, plant and equipment, net 2,836 3,580 573,273 13,341 Deferred tax assets: Net operating loss carryforwards 111,996 80,869 Investment in foreign subsidiaries 16,331 8,129 Capital loss carryforwards 10,305 12,897 Asset retirement obligation 10,234 9,914 Unrealized foreign currency loss and other 8,651 — Accrued expenses 3,330 2,345 Alternative minimum tax credit carryforwards 2,520 2,139 Inventory 1,523 4,274 Mineral properties — 53,290 164,890 173,857 Valuation allowance (160,898 ) (154,840 ) 3,992 19,017 Net deferred tax assets (liabilities) $ (569,281 ) $ 5,676
The Company has evaluated the amount of taxable income and periods over which it must be earned to allow for realization of itsthe deferred tax assets. Based onupon this analysis, the Company determined it is more likely than not that over the next two years pretax book income in Chile and Argentina where the future tax rate is 17% and 35%, respectively, is sufficient for recognition of $6.2 million ofnet deferred tax assets.assets of $1.1 million and $3.5 million will be realized in Argentina and Chile, respectively. Thus, the Company has recorded valuation allowances as follows (in thousands): Years Ended December 31 2007 2006 U.S. $ 111,685 $ 122,101 Argentina 1,966 1,130 Australia 7,282 — Canada 8,220 — New Zealand 30,999 30,778 Chile and other 746 831 $ 160,898 $ 154,840
The Company monitorscontinues to monitor the valuation allowance each quarterquarterly, and makeswill make the appropriate adjustments as necessary. The Company adopted the provisions of FASB Interpretation No. 48, “Accounting for Uncertainty in Income Taxes,” (FIN 48) an interpretation of FASB Statement No. 109, “Accounting for Income Taxes” on January 1, 2007. FIN 48 clarifies the criteria that an individual tax position must satisfy for some or all of the benefits of that position to be recognized in a company’s financial statements. FIN 48 prescribes a recognition threshold of more likely than not, and a measurement attribute for all tax positions taken or expected to be taken on a tax return. The Company determined that FIN 48 had no impact on the financial statements, and as a result, did not record any cumulative effect adjustment related to the allowance as appropriate based primarily upon continued developmentadoption of anFIN 48.F-27
The Company files income tax returns in the US federal jurisdiction, various US states and in certain foreign jurisdictions. To the extent there are loss carryovers in any such jurisdictions, the statute of limitations generally remains open. The Company has previously determined the earnings historyfrom certain foreign jurisdictions were not indefinitely reinvested. Accordingly, the Company has recognized deferred taxes and projected future earnings.withholding taxes related to those jurisdictions where the subsidiary’s net equity determined for financial reporting purposes exceeds tax basis.
During the first quarter of 2006,2007, the Company incurred anotheran ownership change which generally limits the availability of existing tax attributes, including net operating loss carryforwards to reduce future taxable income. The Company will be limited from utilizing tax attributes to reduce future taxable income or tax liabilities. Therefore, the Company has the following tax attribute carryforwards as of December 31, 2006:U.S.
Chile
New Zealand
Other
Total
Regular net operating losses $86,004 $30,464 $93,267 $444 $210,179 Alternative minimum tax net operating losses 53,651 -- -- -- 53,651 Capital losses 33,853 -- -- -- 33,853 Alternative minimum tax credits 2,180 -- -- -- 2,180 Foreign tax credits 299 -- -- -- 299
2007 (in thousands):
New U.S. Chile Mexico Canada Australia Zealand Other Total Regular net operating losses $ 110,286 $ 22,110 $ 109,600 $ 5,653 $ 6,389 $ 93,936 $ 2,487 $ 350,461 Alternative minimum tax net operating losses 26,946 — — — — — — 26,946 Capital losses 19,339 — — — 9,855 — — 29,194 Alternative minimum tax credits 2,520 — — — — — — 2,520
The U.S. net operating losses expire in 2011from 2016 through 2025 and the Canada net operating losses expire from 2025 through 2027. The Mexico net operating losses expire in 2017 and 2018, while the foreign countryremaining net operating losses from the foreign jurisdictions have an indefinite carryforward period. The U.S. capital losses expire from 2008 through 2012 while the Australia capital losses generally have an indefinite carryforward period. The Company’s capital losses expire in 2007 through 2011; alternativeAlternative minimum tax credits have an indefinite carryforward period and the foreign tax credits generally expire in 2026.F-27
do not expire.
NOTE KL — SHAREHOLDERSSHAREHOLDER’S EQUITY On May 11, 1999, the Company’s shareholders adopted a new shareholder rights plan (the “Plan”). The Plan entitles each holder of the Company’s common stock to one right. Each right entitles the holder to purchase one one-hundredth of a share of newly authorized Series B Junior Preferred Stock at an exercise price of $100. The rights will not be distributed and become exercisable unless and until ten business days after a person acquires 20% of the outstanding common shares or commences an offer that would result in the ownership of 30% or more of the shares. Each right also carries the right to receive upon exercise that number of Coeur common shares which has a market value equal to two times the exercise price. Each preferred share issued is entitled to receive 100 times the dividend declared per share of common stock and 100 votes for each share of common stock and is entitled to 100 times the liquidation payment made per common share. The Board may elect to redeem the rights prior to their exercisability at a price of $0.01 per right. The new rights will expire on May 24, 2009, unless earlier redeemed or exchanged by the Company. Any preferred shares issued are not redeemable. At December 31, 20062007 and 2005,2006, there were a total of 277,995,133550,453,019 and 249,902,142277,995,133 rights outstanding, respectively, which was equal to the number of outstanding shares of common stock.Stock Issues During 2006
During the first quarter of 2006, the Company completed a public offering of 27.6 million shares of common stock at a public offering price of $5.60 per share. The Company realized net proceeds of $146.2 million after payment of the underwriters’ discount. Offering costs incurred were $8.3 million.Stock Issues During 2005
During the third quarter of 2005, the Company completed a public offering of 9.9 million shares of common stock at a public offering price of $3.70 per share. The Company realized total net proceeds from the offering, after payment of the underwriters’ discount, of approximately $35.9 million. Offering costs incurred were $0.6 million.F-28
Stock Issues During 2004
During the fourth quarter of 2004, the Company completed a public offering of 26.6 million shares of common stock at a public offering price of $4.50 per share, which included 1.6 million shares purchased by the underwriters at the offering price to cover over allotments. The Company realized total net proceeds from the offering, after payment of the underwriters’ discount, of approximately $113.1 million. Offering costs incurred were $6.7 million.
NOTE LM — STOCK-BASED COMPENSATION PLANS The Company has an Annual Incentive Plan, a Long-Term Incentive Plan (the “2003 Long-Term Incentive Plan”) and a Directors’ Plan (the “Directors’ Plan”). Total employee compensation expense charged to operations and capital projects under these Plans was $4.6$6.3 million, $3.9$4.7 million and $2.8$3.8 million for 2007, 2006 and 2005, and 2004, respectively. Annual Incentive Plan Under the Annual Incentive Plan, the Board of Directors may annually approve cash-based awards to the executive officers and key management employees based on certain Company and employee performance measures. Cash payments for 2007, 2006 2005 and 20042005 amounted to $2.6 million, $2.2 million and $2.7 million, and $2.0 million, respectively.F-28
1989 Long-Term Incentive Plan Under the 1989 Long-Term Incentive Plan, as amended by shareholders in 1995, the Company may grant non-qualified and incentive stock options that are exercisable at prices equal to the fair market value of the shares on the date of grant and vest cumulatively at an annual rate of one third during the three-year period following the date of grant. In addition to stock options, the Company’s 1989 Long-Term Incentive Plan provides for grants of stock appreciation rights (SAR’s)(SARs), restricted stock, restricted stock units, performance shares, performance units, cash based awards, and stock based awards. The number of shares authorized to be issued under this plan was 2.9 million shares. There were 0.6 million shares reserved for issuance under this plan at December 31, 20062007 for stock options previously awarded. No further awards will be made under this plan. 2003 Long-Term Incentive Plan The 2003 Long-Term Incentive Plan (the “LTIP”) was approved by our shareholders on May 20, 2003, and replaced our prior 1989 Long-Term Incentive Plan. Under the plan, we may grant nonqualified stock options, incentive stock options, stock appreciation rights (“SARs”), restricted stock, restricted stock units, performance shares, performance units, cash-based awards and other stock-based awards to our executive officers. The number of shares authorized for grant under this plan was 6.8 million shares. There were 6.25.8 million shares reserved for issuance under this plan at December 31, 2006.2007. Of the 6.25.8 million shares, 4.94.1 million shares can be issued for future grants. There are 1.01.3 million options and 0.20.4 million performance shares outstanding under these plans. Directors Plan On June 3, 2005, the Company’s shareholders approved the 2005 Non-Employee Directors’ Equity Incentive Plan and authorized 500,000 shares of common stock for issuance under the plan. During 2007 and 2006, 59,476 and 2005, 35,042 and 35,996 shares were issued in lieu of $0.2$0.3 million and $0.1$0.2 million, respectively, of Directors’ fees. At December 31, 2006, 0.4 million2007, 400,000 shares are reserved for issuance under this plan. Under the previous Directors’ plan, options were granted only in lieu of annual directors’ fees. For the year ended December 31, 2004, a total of 40,318 options had been granted in lieu of directors’ fees of $0.1 million. At December 31, 2006, 0.5 million2007, 500,000 shares are reserved for issuance under this plan for stock options previously awarded. No further grants will be made under this plan.F-29
As of December 31, 20062007 and 2005,2006, options to purchase 2,089,6502,281,595 shares and 2,218,6292,089,650 shares of common stock, respectively, were outstanding under the Long-Term and the Directors’ Plans described above. The options are exercisable at prices ranging from $0.74 to $17.94$8.94 per share. Stock options granted under the Company’s incentive plans vest over three years and are exercisable over a period not to exceed 10 years from the grant date. Exercise prices are equal to the fair market value of the shares on the date of the grant. The value of each option award is estimated on the date of the grant using the Black-Scholes option pricing model. Restricted stock is granted at the fair market value of the underlying shares on the date of grant and vest in equal installments annually over three years. Holders of the restricted stock are entitled to vote the shares and to receive any dividends declared on the shares. Performance shares also are granted at the fair market value of the underlying shares on the date of grant. Compensation costs ultimately recognized are equal to the grant date fair value. Vesting is contingent on meeting certain performance measuresmarket conditions based on relative total shareholder return. The performance shares vest at the end of the three-year service period. Performance shares granted underperiod if the plan assume that the performance measure will be achieved. If such performance measuresmarket conditions are not met, no furthermet. The existence of a market condition requires recognition of compensation cost regardless of whether the market condition is recognized and if determined improbable of achieving the performance measures any previously recognized compensation is reversed.F-29
ever satisfied.
Effective January 1, 2006, the Company began recording compensation expense associated with awards of equity instruments in accordance with Statement of Financial Accounting Standards (“SFAS”)SFAS No. 123(R), “Share-Based Payment”. Prior to January 1, 2006, the Company accounted for awards of equity instruments according to the provisions of SFAS No. 123 and related interpretations, and therefore no related compensation expense was recorded for awards granted with no intrinsic value. The Company adopted the modified prospective transition method provided for under SFAS No. 123(R), and, consequently, has not retroactively adjusted results fromfor prior periods. Under this transition method, compensation cost associated with awards of equity instruments recognized in 2006 includes: 1) amortization related to the remaining unvested portion of all awards granted for the fiscal years 1995 to 2005, based on the grant date fair value, estimated in accordance with the original provisions of SFAS No. 123, “Accounting for Stock-Based Compensation”; and 2) amortization related to all equity instruments awards granted subsequent to December 31, 2005, based on the grant-date fair value estimated in accordance with the provisions of SFAS No. 123(R). The compensation cost is included in administrative and general expenses, production costs and the cost of self-constructed property, plant and equipment as deemed appropriate. Prior to the Company’s adoption of SFAS No. 123(R), benefits of tax deduction in excess of recognized compensation costs were reported as operating cash flows. SFAS No. 123(R) requires excess tax benefits be reported as a financing cash inflow rather than as a reduction of taxes paid. There were no significant excess tax benefits for the years ended December 31, 2007, 2006 2005 and 2004.2005.
The compensation expense recognized in the Company’s consolidated financial statements for the year ended December 31, 2007, 2006 2005 and 20042005 for awards of equity instruments was $2.2$3.7 million, $2.5 million and $1.2 million, respectively, of which $0.2 million, $0.3 million, and $1.1$0 million, respectively.respectively, was capitalized as part of mine development activities. As of December 31, 2006,2007, there was $1.8$1.7 million of total unrecognized compensation cost (net of estimated forfeitures) related to unvested stock options, restricted stock grants and performance share grants which is expected to be recognized over a weighted-average vesting period of 2.0 years. The Company continues to estimate the fair value of each stock option award on the date of grant using the Black-Scholes option valuation model. The Company now estimates forfeitures of stock-based awards based on historical data and adjusts the forfeiture rate periodically. The adjustment of the forfeiture rate will result in a cumulative adjustment in the period the forfeiture estimate is changed. During the year ended December 31, 2006, the Company recorded an adjustment of $0.1 million to reduce compensation expense for forfeited awards.F-30
The impact of adopting SFAS No. 123(R) as of January 1, 2006 resulted in a decrease in net income of $1.4 million, or less than $0.01 per basic and diluted share for the year ended December 31, 2006. The impact of adoption excludes the amortization of restricted stock awards in the amount of $1.1 million for the year ended December 31, 2006. Compensation expense related to the amortization of restricted stock awards was recognized prior to the implementation of SFAS No. 123(R). Cash received from share options exercised under the Long-Term Incentive Plan for the years ended December 31, 2007, 2006 and 2005 and 2004 were $0.2 million, $0.8 million $0.1 million and $0.3$0.1 million, respectively, and is reflected as an other financing activity in the Company’s consolidated statements of cash flows. The adjustment of the forfeiture rate resulted in a cumulative adjustment in the period the forfeiture estimate is charged. During the year ended December 31, 2006, the Company recorded an adjustment of $0.1 million to reduce compensation expense for forfeiture awards.
The following pro-forma information, as required by SFAS No. 148, “Accounting for Stock-Based Compensation-Transition and Disclosure an amendment of FASB Statement No. 123,” is presented for comparative purposes and illustrates the effect on net income per common share for the periodsperiod presented as if the Company had applied the fair value recognition provisions of SFAS No. 123(R) to stock-based employee compensation prior to December 31, 2005.F-30
Year Ended December 31,
2005
2004
(in thousands except per share data)
Net income (loss) as reported $ 10,551 $ (16,858 ) Add: Stock-based employee compensation expense included in reported net income 1,237 1,137 Less: Stock-based employee compensation expense determined under fair value for all awards (2,316 ) (2,017 )
Net income (loss) - Pro forma $ 9,472 $ (17,738 )
Net income (loss) per share: Basic and diluted - As reported $ 0.04 $ (0.08 )
Basic and diluted - Pro forma $ 0.04 $ (0.08 )
Year Ended December 31, 2005 (in thousands, except per share data) Net income as reported $ 10,551 Add: Stock-based employee compensation expense included in reported net income 1,237 Less: Stock-based employee compensation expense determined under fair value for all awards (2,316 ) Net income — Pro forma $ 9,472 Net income per share: Basic and diluted — As reported $ 0.04 Basic and diluted — Pro forma $ 0.04
The weighted average fair value of stock options on the date of grant, and the assumptions used to estimate the fair value of the stock options using the Black-Scholes option valuation model were as follows:Year Ended December 31, 2006
2005
2004
Weighted average fair value of options granted $3.35 $2.53 $4.83 Expected volatility 68.5% 68.5% 75.7% Expected life 6 years 6 years 6 years Risk-free interest rate 4.6% 3.9% 3.3% Expected dividend yield 0.0% 0.0% 0.0%
Years Ended December 31, 2007 2006 2005 Weighted average fair value of options granted $ 2.35 $ 3.35 $ 2.53 Expected volatility 58.9 % 68.5 % 68.5 % Expected life 6 years 6 years 6 years Risk-free interest rate 4.5 % 4.6 % 3.9 % Expected dividend yield 0.0 % 0.0 % 0.0 %
The expected volatility of the option is determined using historical volatilities based on historical stock prices. The Company estimated the expected life of options granted using the midpoint between the vesting date and the original contractual term. The risk free rate was determined using the yield available on U.S. Treasury Zero-coupon issues with a remaining term equal to the expected life of the option. The Company has not paid dividends on its common stock since 1996.F-31
The following table summarizes stock option activity during the years ended December 31, 2004, 2005, 2006 and 2006:Shares
Weighted Average
Exercise Price
Stock options outstanding at December 31, 2003 1,650,054 $2.11 Granted 333,250 $6.95 Exercised (169,527 ) $1.69 Canceled/expired (16,869 ) $6.32
Stock options outstanding at December 31, 2004 1,796,908 $3.01 Granted 566,149 $3.92 Exercised (52,007 ) $1.61 Canceled/expired (92,421 ) $5.69
Stock options outstanding at December 31, 2005 2,218,629 $3.16 Granted 332,169 $5.14 Exercised (395,723 ) $1.99 Canceled/expired (65,425 ) $7.65
Stock options outstanding at December 31, 2006 2,089,650 $3.56
F-31
2007:
Weighted Average Shares Exercise Price Stock options outstanding at December 31, 2004 1,796,908 $ 3.01 Granted 566,149 $ 3.92 Exercised (52,007 ) $ 1.61 Cancelled/expired (92,421 ) $ 5.69 Stock options outstanding at December 31, 2005 2,218,629 $ 3.16 Granted 332,169 $ 5.14 Exercised (395,723 ) $ 1.99 Canceled/expired (65,425 ) $ 7.65 Stock options outstanding at December 31, 2006 2,089,650 $ 3.56 Granted 462,015 $ 3.99 Exercised (56,167 ) $ 3.29 Canceled/expired (213,903 ) $ 5.99 Stock options outstanding at December 31, 2007 2,281,595 $ 3.42
Options exercisable at December 31, 2007, 2006 and 2005 were for 1,598,685, 1,413,117, and 2004 were 1,413,117, 1,562,217 and 1,509,217,shares, respectively, with a weighted average exercise price of $3.06, $2.95 and $2.53, and $2.25, respectively. The following table summarizes information for options currently outstanding at December 31, 2006:Options Outstanding
Options Exercisable
Range of
Exercise
Price
Number
Outstanding
Weighted
Average
Exercise
Price
Weighted
Average
Remaining
Contractual
Life (Years)
Number
Exercisable
Weighted
Average
Exercise
Price
Weighted
Average
Remaining
Contractual
Life (Years)
$0.74 to $1.22 442,641 $0.80 4.77 442,641 $0.80 4.77 $1.23 to $1.85 336,525 $1.75 5.67 336,525 $1.75 5.67 $1.86 to $2.63 111,502 $2.10 5.90 111,502 $2.10 5.90 $2.64 to $3.92 537,089 $3.86 7.50 248,767 $3.78 6.77 $3.93 to $7.09 624,288 $6.00 7.96 236,077 $6.81 6.62 $7.10 to $17.94 37,605 $11.68 0.57 37,605 $11.68 0.57
2,089,650 $3.56 6.55 1,413,117 $2.95 5.62
2007:
Options Outstanding Options Exercisable Weighted Weighted Weighted Average Weighted Average Range of Average Remaining Average Remaining Exercise Number Exercise Contractual Number Exercise Contractual Price Outstanding Price Life (Years) Exercisable Price Life (Years) $0.74 to $1.22 442,641 $ 0.80 3.77 442,641 $ 0.80 3.77 $1.23 to $1.85 320,420 $ 1.75 4.67 320,420 $ 1.75 4.67 $1.86 to $2.63 111,502 $ 2.10 4.90 111,502 $ 2.10 4.90 $2.64 to $3.92 497,135 $ 3.85 6.45 362,061 $ 3.83 6.19 $3.93 to $5.14 661,175 $ 4.47 8.51 113,339 $ 5.06 6.72 $5.15 to $8.94 248,722 $ 7.19 5.60 248,722 $ 7.19 5.60 2,281,595 $ 3.42 6.11 1,598,685 $ 3.06 5.07
As of December 31, 2006,2007, the total future compensation cost related to non-vested options not yet recognized in the statement of income was $0.6$1.7 million and the weighted average period over which these awards are expected to be recognized was 2 years. The total intrinsic value of share options exercised during the year ended December 31, 2007, 2006 and 2005 and 2004 was $0.04 million, $1.6 million $0.1 million and $0.3$0.1 million, respectively. At December 31, 2006,2007, the total intrinsic value was $3.8$4.1 million and $3.5$3.6 million for stock options outstanding and exercisable, respectively.F-32
The following table summarizes restricted stock activity during the years ended December 31, 2004, 2005, 2006 and 2006:Number of
Shares
Weighted Average
Grant Date Fair
Value
Outstanding at December 31, 2003 1,115,000 $1.28 Granted 236,070 $6.39 Vested (371,673 ) $1.28 Forfeited (168,399 ) $2.09
Outstanding at December 31, 2004 810,998 $2.60 Granted 359,640 $3.94 Vested (433,623 ) $2.30 Forfeited (75,634 ) $4.58
Outstanding at December 31, 2005 661,381 $3.30 Granted 220,894 $5.14 Vested (445,025 ) $2.71 Forfeited (24,218 ) $4.83
Outstanding at December 31, 2006 413,032 $4.83
2007:
Weighted Number of Average Grant Shares Date Fair Value Outstanding at December 31, 2004 810,998 $ 2.60 Granted 359,640 $ 3.94 Vested (433,623 ) $ 2.30 Forfeited (75,634 ) $ 4.58 Outstanding at December 31, 2005 661,381 $ 3.30 Granted 220,894 $ 5.14 Vested (445,025 ) $ 2.71 Forfeited (24,218 ) $ 4.83 Outstanding at December 31, 2006 413,032 $ 4.83 Granted 497,990 $ 3.99 Vested (241,784 ) $ 4.82 Forfeited (66,043 ) $ 4.30 Outstanding at December 31, 2007 603,195 $ 4.20
The fair value of restricted stock is determined based on the closing stock price on the grant date. As of December 31, 2006,2007, there was $0.6 million of total unrecognized compensation cost related to restricted awards to be recognized over a weighted-averageweighted average period of 1.92.1 years.F-32
The following table summarizes performance shares activity during the year ended December 31, 2006:Number of
Shares
Weighted Average
Grant Date Fair
Value
Outstanding at December 31, 2005 -- $-- Granted 220,894 5.14 Exercised -- -- Forfeited (10,449 ) 5.14
Outstanding at December 31, 2006 210,445 $5.14
2007:
Weighted Number of Average Grant Shares Date Fair Value Outstanding at December 31, 2005 — $ — Granted 220,894 5.14 Exercised — — Forfeited (10,449 ) 5.14 Outstanding at December 31, 2006 210,445 $ 5.14 Granted 306,852 3.99 Exercised (30,298 ) 4.48 Forfeited (66,456 ) 4.47 Outstanding at December 31, 2007 420,543 $ 4.45
The fair value of performance shares is determined based on fair value modeling techniques that consider the closing price on the grant date.market and service conditions relevant for these grants. As of December 31, 2006,2007, there was $0.7 million of total unrecognized compensation cost related to performance shares to be recognized over a weighted average period of 2.11.9 years.NOTE M –N — DEFINED BENEFIT PENSION, POST-RETIREMENT MEDICAL BENEFIT, DEFINED CONTRIBUTION AND 401(k) PLANSOn
In June 2006, the Company completed the sale of 100% of the shares of its wholly owned subsidiary Coeur Silver Valley Inc. As a result, the liabilities were assumed by the purchaser and the Company has no longer maintainsfurther obligations related to the defined benefit plan and post retirement medical benefits plan summarized below.Defined Benefit Plan In connection with the acquisition of Coeur Silver Valley acquired in 1999, the Company was required to maintain non-contributory defined benefit pension plans covering substantially all employees. Benefits for salaried plans were based on salary and years of service. Hourly plans were based on negotiated benefits and years of service. The Company’s funding policy was to contribute annually the minimum amount prescribed, as specified by applicable regulations. Prior service costs and actuarial gains and losses were amortized over plan participants’ expected future period of service using the straight-line method.F-33
Actuarial Present Value of Projected Benefit Obligation: The actuarial present value of our projected benefit obligations was determined using the following assumptions:Factor 2005 2004 Discount Rate for Benefit Obligations 5.75% 6.0% Expected Return on Plan Assets 6.0% 6.0% Rate of Compensation Increases 5.0% 5.0%
Factor 2005 Discount Rate for Benefit Obligations 5.75 % Expected Return on Plan Assets 6.0 % Rate of Compensation Increases 5.0 %
Expected rate of return on plan assets: The expected rate of return on plan assets for purposes of the actuarial valuation was assumed to be 6% as of both December 31, 2005 and 2004.2005. The rate of return used was based on the plan’s experience and asset mix of the portfolio, as well as taking into consideration the fact that no lump sum distributions were paid from the plan. The plan had an expected return on plan assets of $0.3 million and $0.2 million for 2005 and 2004, respectively.2005. The actual return on plan assets was $0.2 million and $0.3 million for 2005 and 2004, respectively.2005. The discount rate was determined based on Moody’s Aaa bond rating.F-33
Plan assets and determination of fair value: The fair value of plan assets was determined using the market value of the investments held by the plan at December 31 of each year as quoted by public equity and bond markets. The asset mix iswas in accordance with the plan’s investment policy which allowed for 60% equity investments, 35% fixed income investments and 5% cash and cash equivalents. The investment portfolio for the funded portion of the obligation iswas held in a trust. The Company’s funding policy was to contribute amounts to the plan sufficient to meet the minimum funding requirements as set forth in the Employee Retirement Income Security Act of 1974 plus such additional tax deductible amounts as was advisable under the circumstances. The Company had funded $0.4 million through June 1, 2006 (the date of the Coeur Silver Valley sale), and $0.7 million and $0.7 million in 2005, and 2004, respectively, toward the obligation. The plan assets were invested principally in commingled stock funds, mutual funds and securities issued by the United States government. Pursuant to the plan’s investment policy, the plan adoptsadopted more specific investment directives from time to time. The plan’s actual portfolio at December 31, 2005 had 60% equity investments and 40% fixed income investments. Since the performance of each asset class of the portfolio within any measurement period impacted its relative weight in the portfolio, the actual percentage of each asset class in the portfolio may not have matched to the current directive. The expected long-term rates of return for each asset class within the portfolio, and therefore the portfolio weighted average, was based on an estimate of the return for each of the securities within an asset class, currently benchmarked at 10.0% for equity investments, 3.0% for fixed income investments and 2%2.0% for cash and cash equivalents. For each type of investment within the Trust’s portfolio structure, the Trustees evaluated both returns and the relationship between risk and return. The expectation was that each asset class would produce a superior risk-adjusted return over a market cycle.F-34
The following table shows the expected long term rates of return associated with each asset class:Asset Class
Actual Mix
Target Mix
Expected Long
Term Rates of
Return
Equity investments 60 % 60 % 10.00 % Fixed income investments 40 % 35 % 3.00 % Cash and cash equivalents 0 % 5 % 2.00 %
Weighted average 7.15 %
Expected Long Term Actual Target Rates of Asset Class Mix Mix Return Equity investments 60 % 60 % 10.00 % Fixed income investments 40 % 35 % 3.00 % Cash and cash equivalents 0 % 5 % 2.00 % Weighted average 7.15 %
The Trustees evaluated the level of volatility within the total Trust and each of its component investments. The Trustees set maximum volatility thresholds for each class of investment which consisted of 16% for equity investments, 7.25% for fixed income investments and 1% for cash and cash equivalents, with the total portfolio volatility expected to not exceed 11%. The Trustees then compared how these specific investments performed against other indexed funds and other managed portfolios with similar objectives. The specific criteria used to measure the performance was as follows: 1) A targeted 7-11% average annualized return based on long-term historical market data;
2) Expected returns over a market cycle that exceed the total portfolio indexed benchmark;
3) Volatility that was not substantially greater than the portfolio indexed benchmark volatility of 11%; and
4) Risk adjusted returns that were comparable with indexed benchmarks.
F-34
The components of net periodic benefit costs were as follows:follows (in thousands, except for discount rate): For the Year Ended December 31, 2005 Assumptions: Discount rate 5.75 % Components of net periodic benefit cost: Service cost $ 309 Interest cost 464 Expected return on plan assets (261 ) Amortization of prior service cost 59 Recognized actuarial loss 339 Net periodic benefit cost $ 910
F-35
For the Year Ended
December 31,
2006
2005
2004
Assumptions: Discount rate -- 5.75 % 6.0 % Components of net periodic benefit cost: Service cost -- $ 309 $ 319 Interest cost -- 464 412 Expected return on plan assets -- (261 ) (215 ) Amortization of prior service cost -- 59 56 Recognized actuarial loss -- 339 327
Net periodic benefit cost -- $ 910 $ 899
The change in benefit obligation and plan assets and a reconciliation of funded status were as follows:At December 31,
2006
2005
Change in benefit obligation Projected benefit obligation at beginning of year $ 8,405 $ 7,494 Service cost -- 309 Interest cost -- 464 Benefits paid (105 ) (217 ) Actuarial loss -- 355 Discontinued operations (8,300 ) --
Projected benefit obligation at end of year $ -- $ 8,405
Accumulated benefit obligation $ -- $ 6,606
Change in plan assets Fair value of plan assets at beginning of year $ 4,806 $ 4,098 Actual return on plan assets -- 205 Employer contributions 360 720 Benefits paid (105 ) (217 ) Discontinued operations (5,061 ) --
Fair value of plan assets at end of year $ -- $ 4,806
Reconciliation of funded status Funded status $ -- $ (3,599 ) Unrecognized actuarial loss -- 3,803 Unrecognized prior service cost -- 369
Net asset reflected in the consolidated balance sheet $ -- $ 573
Weighted average assumptions Discount rate -- 5.75 % Expected long-term rate of return on plan assets -- 6.0 % Rate of compensation increase -- 5.0 %
follows (in thousands):
At December 31, 2006 Change in benefit obligation Projected benefit obligation at beginning of year $ 8,405 Service cost — Interest cost — Benefits paid (105 ) Actuarial loss — Discontinued operations (8,300 ) Projected benefit obligation at end of year $ — Accumulated benefit obligation $ — Change in plan assets Fair value of plan assets at beginning of year $ 4,806 Actual return on plan assets — Employer contributions 360 Benefits paid (105 ) Discontinued operations (5,061 ) Fair value of plan assets at end of year $ — Reconciliation of funded status Funded status $ — Unrecognized actuarial loss — Unrecognized prior service cost — Net asset reflected in the consolidated balance sheet $ — Weighted average assumptions Discount rate — Expected long-term rate of return on plan assets — Rate of compensation increase —
Post Retirement Medical Benefits In connection with the acquisition of Coeur Silver Valley in 1999, the Company reimbursed Asarco, Inc. (prior owner) for certain healthcare benefits for retired employees and their dependents who retired before September 9, 1999. There were ten active hourly and salaried employees of Coeur Silver Valley and three inactive participants eligible under Asarco’s post-retirement medical benefits plan. These post-retirement medical benefits were self-insured by the plan’s prior sponsor. The actuarial present value of the post retirement benefit obligation iswas determined as of December 31 for each of the years presented.F-35
Actuarial Present Value of Projected Benefit Obligation: The discount rate was determined based on Moody’s Aaa Bond Rating as reported on the last business day of the plan year plus 0.50%. The Company amortized its unrecognized, unfunded accumulated post-retirement benefit obligation using a straight-line method over a 3.1-year period. The 3.1-year estimate was based on the average remaining service period of the active participants. Expected long-term rate of return on plan assets No assets arewere held in a trust for the post retirement health care plan; therefore, there iswas no expected long-term rate of return assumption. A “pay as you go” funding method was utilized for this plan. The Company contributed $0.01 million and $0.2 million to the plan as benefit payments for 2005 and 2004, respectively.2005.F-36
The following table sets forth the actuarial present value of postretirement medical benefit obligations and amounts recognized in the Company’s financial statements:At December 31,
2006
2005
(in thousands)
Assumptions: Discount rate -- 5.75 %
Change in benefit obligation Net benefit obligation at beginning of year $ 356 $ 1,973 Service cost -- 8 Interest cost -- 20 Prior service cost (credit) -- (387 ) Actuarial (gain) loss -- (1,248 ) Benefits paid -- (10 ) Discontinued operations (356 ) --
Net benefit obligation at end of year -- $ 356
Change in plan assets Assets at beginning of year $ -- $ -- Benefits paid -- (10 ) Contributions -- 10
Assets at end of year $ -- $ --
Reconciliation of funded status Funded status at end of year $ -- $ (356 ) Unrecognized net actuarial (gain) loss -- (815 ) Unrecognized prior service cost (credit) -- (262 )
Net amount recognized at end of year (recorded as accrued benefit cost in the accompanying balance sheet) $ -- $ (1,433 )
F-36
statements (in thousands, except for discount rate):
At December 31, 2006 2005 Assumptions: Discount rate — 5.75 % Change in benefit obligation Net benefit obligation at beginning of year $ 356 $ 1,973 Service cost — 8 Interest cost — 20 Prior service cost (credit) — (387 ) Actuarial (gain) loss — (1,248 ) Benefits paid — (10 ) Discontinued operations (356 ) — Net benefit obligation at end of year — $ 356 Change in plan assets Assets at beginning of year $ — $ — Benefits paid — (10 ) Contributions — 10 Assets at end of year $ — $ — Reconciliation of funded status Funded status at end of year $ — $ (356 ) Unrecognized net actuarial (gain) loss — (815 ) Unrecognized prior service cost (credit) — (262 ) Net amount recognized at end of year (recorded as accrued benefit cost in the accompanying balance sheet) $ — $ (1,433 )
The components of net periodic benefit costs were as follows:For the Year Ended December 31,
2006
2005
2004
(in thousands)
Assumptions: Discount rate -- 6.0 % 6.0 %
Components of net periodic benefit cost: Service cost -- $ 8 $ 17 Interest cost -- 20 116 Amortization of prior service cost -- (125 ) -- Amortization of actuarial gain -- (372 ) --
Net periodic pension cost (benefit) -- $ (469 ) $ 133
follows (in thousands, except for discount rate):
For the Year Ended December 31, 2006 2005 Assumptions: Discount rate — 6.0 % Components of net periodic benefit: Service cost — $ 8 Interest cost — 20 Amortization of prior service cost — (125 ) Amortization of actuarial gain — (372 ) Net periodic pension benefit — $ (469 )
During 2005, an adjustment was required to reflect a decreased liability of $1.6 million related to a reduction in plan participation. This adjustment resulted in an actuarial gain. The amortization of the prior service cost of $0.4 million and the unrealized actuarial gain of $1.2 million is greater than 10% of the benefit obligation which required the gain to be amortized over the average remaining service period of the active participants, estimated to be approximately 3.1 years. The amortization of the unrealized gain is included as a component on net periodic benefit cost. The Company also amortized the unrecognized actuarial gain over the same period.F-37
A 1% change in assumed medical trend rates would have had the following effects:(in thousands) 1% Increase
1% Decrease
2005
2004
2005
2004
Effect on total of service and interest cost components $ 2 $ 8 $ (2 ) $ (7 ) Effect on postretirement benefit obligation $ 22 $ 106 $ (19 ) $ (91 )
effects (in thousands):
1% 1% Increase Decrease 2005 2005 Effect on total of service and interest cost components $ 2 $ (2 ) Effect on postretirement benefit obligation $ 22 $ (19 )
Postretirement benefits included medical benefits for retirees and their dependents. In December 2003, The Medicare Prescription Drug, Improvement and Modernization Act of 2003 was enacted. Our accumulated postretirement benefit obligation and net periodic postretirement obligation do not reflect the effects that the requirements of this law since eligibility under this plan ends at age 65.Defined Contribution Plan The Company provides a noncontributory defined contribution retirement plan for all eligible U.S. employees. Total contributions charged to expense were $1.2$0.8 million, $0.9$1.2 million and $0.9 million for 2007, 2006 2005 and 2004,2005, respectively, which is based on a percentage of the salary of eligible employees.401(k) Plan The Company maintains a retirement savings plan (which qualifies under Section 401(k) of the U.S. Internal Revenue code) covering all eligible U.S. employees. Under the plan, employees may elect to contribute up to 100% of their cash compensation, subject to ERISA limitations. The Company is required to make matching cash contributions equal to 50% of the employees’ contribution, up to a maximum of 3% of the employees’ compensation. Contributions to the plan charged to operations were $0.6 million, $0.5$0.6 million and $0.5 million in 2007, 2006, and 2005, and 2004, respectively.F-37
NOTE NO — DERIVATIVE FINANCIAL INSTRUMENTS AND FAIR VALUE OF FINANCIAL INSTRUMENTS The Company enters into derivative instruments to manage the Company’s exposure to foreign currency exchange rates and market prices associated with changes in gold and silver commodity prices. The Company accounts for its derivative contracts in accordance with SFAS No. 133, “Accounting for Derivative Instruments and Hedging Activities.” Accordingly, unrealized gains and losses related to the change in fair market value of derivative contracts, which qualify and are designated as cash flow hedges, are recorded as other comprehensive income or loss and such amounts are recognized into earnings as the associated contracts are settled.Forward Foreign Exchange Contracts During 20062007 and 2005,2006, the Company entered into forward foreign currency exchange contracts to reduce the foreign exchange risk associated with forecasted Chilean peso operating costs for 2007 and 2008 at its Cerro Bayo mine. The contracts entered into in 20062007 require the Company to exchange U.S. dollars for Chilean pesos at a weighted average exchange rate of 531503 pesos to each U.S. dollar. At December 31, 20062007 and 2005,2006, the Company had foreign exchange contracts of $4.8$9.0 million and $7.2$4.8 million in U.S. dollars, respectively. For the years ended December 31, 20062007 and 2005,2006, the Company recorded a realized gain (loss) of approximately $(0.4)$0.4 million and $0.1$(0.4) million, respectively, in connection with its foreign currency hedging program. As of December 31, 2006,2007, the fair value of the foreign exchange contracts was a liability of $0.1 million. Change in gains (losses) accumulated in other comprehensive income (loss) for cash flow hedging contracts are as follows:follows (in thousands):F-38
December 31, 2006
2005
2004
(in thousands) Beginning balance $ (171 ) $ -- $ 131 Reclassification to earnings 379 (68 ) 8 Change in fair value (268 ) (103 ) (139 )
Ending balance $ (60 ) $ (171 ) $ --
December 31, 2007 2006 2005 Beginning balance $ (60 ) $ (171 ) $ — Reclassification to earnings (371 ) 379 (68 ) Change in fair value 349 (268 ) (103 ) Ending balance $ (82 ) $ (60 ) $ (171 )
Commodity Derivatives The Company has occasionally entered into forward metal sales contracts to manage the price risk onassociated with a portion of its cash flows against fluctuating gold prices. As of December 31, 2006,2007, the Company had no outstanding forward sales contracts for either gold or silver. For metal delivery contracts, the realized price pursuant to the contract is recognized when physical gold or silver is delivered in satisfaction of the contract. For the year ended December 31, 2004, the Company incurred realized hedging losses of $1.2 million.Concentrate Sales Contracts The Company enters into concentrate sales contracts with third-party smelters. The contracts, in general, provide for a provisional payment based upon provisional assays and quoted metal prices and the provisionally priced sales contain an embedded derivative that is required to be separated from the host contract for accounting purposes. The host contract is the receivable from the sale of concentrates at the forward price at the time of sale. The embedded derivative, which is the final settlement price based on a future price, does not qualify for hedge accounting. These embedded derivatives are recorded as derivative assets (in Prepaid expenses and other), or derivative liabilities (in Accrued liabilities and other), on the balance sheet and are adjusted to fair value through earnings each period until the date of final settlement.F-38
At December 31, 2007, the Company had outstanding provisionally priced sales of $61.2 million consisting of 3.3 million ounces of silver and 20,775 ounces of gold, which had a fair value of approximately $63.8 million including the embedded derivative. At December 31, 2006, the Company had outstanding receivables for provisionally priced sales of $74.5 million, consisting of 4.6 million ounces of silver and 29,577 ounces of gold, which had a fair market value of approximately $75.6 million including the embedded derivative. At December 31, 2005, the Company had outstanding receivables for provisionally priced sales of $47.0 million, consisting of 3.5 million ounces of silver and 40,000 ounces of gold, which had a fair market value of approximately $49.3 million including the embedded derivative.
Credit Risk The credit risk exposure related to any potential hedging activities is limited to the unrealized gains, if any, on outstanding contracts based on current market prices. To reduce counter-party credit exposure, the Company deals only with a group of large credit-worthy financial institutions and limits credit exposure to each. The Company does not anticipate non-performance by any of its counter parties. In addition, to allow for situations where positions may need to be revised, the Company deals only in markets that it considers highly liquid.NOTE OP — COMMITMENTS AND CONTINGENCIESLabor Union Contract The Company maintains two labor agreements in South America, consisting of a labor agreement with Syndicato de Trabajadores de Compañía Minera Cerro Bayo Ltd. at its Cerro Bayo mine in Chile and with Associacion Obrera Minera Argentina at its Martha mine in Argentina. The agreement at Cerro Bayo is effective from December 22, 200524, 2007 to December 21, 20072010 and the agreement at Mina Martha is effective from June 12, 2006 to June 1, 2008. Additionally certain employees at San Bartolomé are covered by a labor agreement that became effective October 11, 2008.2007; this Bolivian labor agreement does not have a fixed term. As of December 31, 2006,2007, the Company had approximately 20%44% of its worldwide labor force covered by collective bargaining agreements.F-39
Termination Benefits In September 2005, the Company established a one-time termination benefit program at the Rochester mine as the mine approaches the end of its mine life. The employees will be required to render service until they are terminated in order to be eligible for benefits. Approximately 80% of the workforce is expected to bewas severed by mid-2007,the end of the third quarter of 2007, while the remaining 20% are expected to stay on for residual leaching and reclamation activities. As of December 31, 2006,2007, the total amount expected to be incurred under this plan is approximately $3.4$4.7 million. The liability is recognized ratably over the minimum future service period. The amount accrued as of December 31, 2006 was $2.0 million and was charged to production costs. The following is a description of the changes to the Company’s termination benefits for the years ended December 31, 2007, 2006 and 2005 and 2004.Year Ended December 31, 2006
2005
2004
(in thousands) Beginning Balance $ 542 $ -- $ -- Accruals 1,803 542 -- Payments (386 ) -- --
Ending Balance $ 1,959 $ 542 $ --
(in thousands):
Year Ended December 31, 2007 2006 2005 Beginning Balance $ 1,959 $ 542 $ — Accruals 1,917 1,803 542 Payments (3,056 ) (386 ) — Ending Balance $ 820 $ 1,959 $ 542
NOTE PQ — SIGNIFICANT CUSTOMERS The Company markets its metals products and concentrates primarily to bullion trading banks and five third party smelters. These customers then sell the metals to end users for use in industry applications such as electronic circuitry, jewelry and silverware production and the manufacture and development of photographic film. Sales of metals to bullion trading banks amounted to approximately 47%, 45%47% and 59%45% of total metals sales in 2007, 2006 2005 and 2004,2005, respectively. Generally, the loss of a single bullion trading bank customer would not adversely affect the Company in view of the liquidity of the markets and availability of alternative trading banks.F-39
The Company currently markets its silver and gold concentrates to third party smelters in Japan, Mexico, Australia and Germany. Sales of metals concentrates to third party smelters amounted to approximately 53%, 55%53% and 41%55% of metals sales in 2007, 2006 2005 and 2004,2005, respectively. The loss of any one smelter customer could have a material adverse effect on the Company in the event of the possible unavailability of alternative smelters.NOTE QR — SEGMENT INFORMATION Operating segments are defined as components of an enterprise about which separate financial information is available that is evaluated regularly by the chief operating decision maker, or decision-making group, in deciding how to allocate resources and in assessing performance. The Company’s chief operating decision-making group is comprised of the Chief Executive Officer, Chief Financial Officer, the Senior Vice President of North American Operations and the President of South American Operations. The operating segments are managed separately because each segment represents a distinct use of Company resources which contribute to Company cash flows in its respective geographic area. The Company’s reportable operating segments include the Rochester, Cerro Bayo, Martha, San Bartolome,Bartolomé, Kensington, Palmarejo and CDE Australia (Endeavor and Broken Hill) mining properties. All operating segments are engaged in the discovery and/or mining of gold and silver and generate the majority of their revenues from the sale of these precious metal concentrates and/or refined precious metals. The Cerro Bayo and Martha mines sell precious metal concentrates, typically under long-term contracts, to a smelter located in Japan (Dowa Mining Ltd.), Mexico (Met-Mex Penoles) and Germany (Noordeutche)(Norddeutsche). Refined gold and silver produced by the Rochester mine is principally sold on a spot basis to precious metals trading banks such as Standard Bank and Mitsui. Concentrates produced at CDE Australia (Endeavor and Broken Hill mines) are sold to Zinifex,Nystar (formerly Zinifex), an Australia smelter. The Company’s exploration programs are included as other. The other segment also includes the corporate headquarters, elimination of intersegment transactions and other items necessary to reconcile to consolidated amounts.F-40
The accounting policies of the operating segments are the same as those described in the summary of significant accounting policies above. The Company evaluates performance and allocates resources based on profit or loss before interest, income taxes, depreciation and amortization, unusual and infrequent items, and extraordinary items. Revenues from silver sales were $151.0 million, $147.8 million and $91.9 million in 2007, 2006, and $63.1 million in 2006, 2005, and 2004, respectively. Revenues from gold sales were $64.3 million, $68.8 million and $64.4 million in 2007, 2006, and $45.9 million in 2006, 2005, and 2004, respectively. Financial information relating to the Company’s segments is as follows:Rochester
Mine
Cerro
Bayo Mine
Martha
Mine
Endeavor
Mine
Broken Hill
Mine
San
Bartolome
Project
Kensington
Project
Other
Total
2006
Total net sales and revenues $ 102,393 $ 50,293 $ 34,733 $ 5,363 $ 23,791 $ -- $ -- $ -- $ 216,573
Depreciation and depletion $ 13,745 $ 5,795 $ 1,313 $ 490 $ 5,120 $ -- $ -- $ 309 $ 26,772 Interest income -- 663 39 -- -- -- 8 17,276 17,986 Interest expense -- 84 -- -- -- -- -- 1,140 1,224 Litigation settlement -- -- -- -- -- -- -- (2,365 ) (2,365 ) Income tax (benefit) provision from continuing operations -- (2,930 ) 4,689 -- -- -- -- 6,500 8,259 Segment profit (loss) 55,109 22,652 17,290 4,977 �� 19,427 (6 ) (1,030 ) (4,413 ) 114,006
Segment assets (A) 87,423 49,428 11,596 14,508 29,740 59,080 207,745 10,326 469,846 Capital expenditures 1,225 7,555 2,481 -- -- 14,597 121,552 588 147,998
F-40
Rochester
Mine
Cerro
Bayo Mine
Martha
Mine
Endeavor
Mine
Broken Hill
Mine
San
Bartolome
Project
Kensington
Project
Other
Total
2005
Total net sales and revenues $ 69,636 $ 59,624 $ 20,606 $ 2,148 $ 4,270 $ -- $ -- $ -- $ 156,284
Depreciation and depletion $ 10,403 $ 5,064 $ 860 $ 411 $ 1,807 $ -- $ 35 $ 309 $ 18,889 Interest income -- 154 (1 ) -- -- -- -- 9,036 9,189 Interest expense -- 26 -- -- -- -- -- 2,459 2,485 Litigation settlement -- -- -- -- -- -- -- (1,600 ) (1,600 ) Income tax (benefit) provision from continuing operations -- 2,154 (863 ) -- -- -- -- 192 1,483 Segment profit (loss) 24,876 22,978 6,105 1,700 3,282 (119 ) (7,143 ) (12,476 ) 39,203
Segment assets (A) 82,806 45,474 6,291 14,999 34,860 32,687 80,653 7,982 305,752 Capital expenditures 1,197 2,731 2,108 15,410 36,667 10,477 44,201 499 113,290
Rochester
Mine
Cerro
Bayo Mine
Martha
Mine
Endeavor
Mine
Broken Hill
Mine
San
Bartolome
Project
Kensington
Project
Other
Total
2004
Total net sales and revenues $ 64,005 $ 35,267 $ 9,775 $ -- $ - $ -- $ -- $ -- $ 109,047
Depreciation and depletion $ 10,229 $ 4,588 $ 1,669 $ -- $ - $ 4 $ 52 $ 291 $ 16,833 Interest income -- 13 -- -- -- -- -- 3,626 3,639 Interest expense 1 123 -- -- -- -- -- 2,707 2,831 Loss on forward sales contracts -- -- -- -- -- -- -- (936 ) (936 ) Income tax (benefit) provision from continuing operations -- (4,403 ) -- -- -- -- -- (1,382 ) (5,785 ) Merger expenses -- -- -- -- -- -- -- 15,676 15,676 Segment profit (loss) 26,784 9,638 (387 ) -- -- (4,549 ) (7,347 ) (11,684 ) 12,455
Segment assets (A) 75,529 30,898 3,387 -- -- 21,304 25,833 5,813 162,764 Capital expenditures 3,548 2,451 689 -- -- 950 83 642 8,363
Notes:
follows (in thousands): Broken San Rochester Cerro Bayo Martha Endeavor Hill Bartolomé Kensington Palmarejo Mine Mine Mine Mine Mine Project Project Project Other Total December 31, 2007 Total net sales of metals $ 100,903 $ 47,794 $ 38,077 $ 7,943 $ 20,602 $ — $ — $ — $ — $ 215,319 Productions costs applicable to sales 60,364 35,594 17,231 545 3,292 — (1 ) — — 117,025 Depreciation and depletion 8,697 6,260 1,731 755 3,054 — — — 487 20,984 Exploration expense 361 2,908 4,418 — — — 619 — 3,635 11,941 Other operating expenses 62 113 38 — — — 38 — 24,131 24,382 Interest and other income 2,948 1,590 (303 ) — — — 85 — 13,875 18,195 Interest expense — 23 — — — — — — 342 365 Income tax (credit) expense — 1,662 6,418 — — — 20 — 6,827 14,927 Profit (loss) $ 34,367 $ 2,824 $ 7,938 $ 6,643 $ 14,256 $ — $ (591 ) $ — $ (21,547 ) $ 43,890 Segment assets(A) $ 62,848 $ 63,570 $ 25,799 $ 17,885 $ 29,391 $ 169,196 $ 301,730 $ 1,759,153 $ 7,470 $ 2,437,042 Capital expenditures $ 1,647 $ 11,330 $ 16,444 $ 2,112 $ 213 $ 100,169 $ 92,337 $ — $ 1,942 $ 226,194
Broken San Rochester Cerro Bayo Martha Endeavor Hill Bartolomé Kensington Mine Mine Mine Mine Mine Project Project Other Total December 31, 2006 Total net sales of metals $ 102,393 $ 50,293 $ 34,733 $ 5,363 $ 23,791 $ — $ — $ — $ 216,573 Productions costs applicable to sales 47,310 27,780 12,538 386 4,364 — — — 92,378 Depreciation and depletion 13,745 5,795 1,313 490 5,120 — — 309 26,772 Exploration expense — 2,639 2,904 — — — 936 2,995 9,474 Other operating expenses — 28 17 — — — 108 21,581 21,734 Interest and other income 25 809 13 — — (6 ) 13 17,800 18,654 Interest expense — 84 — — — — — 1,140 1,224 Income tax (credit) expense — (2,930 ) 4,777 — — — — 6,379 8,226 Profit (loss) $ 41,364 $ 17,707 $ 13,196 $ 4,487 $ 14,307 $ (6 ) $ (1,031 ) $ (14,605 ) $ 75,419 Segment assets(A) $ 87,371 $ 49,428 $ 11,508 $ 15,666 $ 32,894 $ 59,080 $ 207,745 $ 6,154 $ 469,846 Capital expenditures $ 1,225 $ 7,555 $ 2,481 $ — $ — $ 16,805 $ 122,640 $ 588 $ 151,294
Broken San Rochester Cerro Bayo Martha Endeavor Hill Bartolomé Kensington Mine Mine Mine Mine Mine Project Project Other Total December 31, 2005 Total net sales of metals $ 69,636 $ 59,624 $ 20,606 $ 2,148 $ 4,270 $ — $ — $ — $ 156,284 Productions costs applicable to sales 44,547 33,574 9,016 278 817 — — — 88,232 Depreciation and depletion 10,403 5,064 860 411 1,807 — 35 309 18,889 Exploration expense 169 4,812 2,976 — — 83 1,165 1,431 10,636 Other operating expenses 225 110 690 — — — 5,979 21,194 28,198 Interest and other income 181 224 (172 ) — — (36 ) — 8,188 8,385 Interest expense — 26 92 — — — — 2,367 2,485 Income tax (credit) expense — 2,154 (862 ) — — — — 191 1,483 Profit (loss) $ 14,473 $ 14,108 $ 7,662 $ 1,459 $ 1,646 $ (119 ) $ (7,179 ) $ (17,304 ) $ 14,746 Segment assets(A) $ 82,631 $ 45,474 $ 3,791 $ 15,152 $ 36,493 $ 32,687 $ 80,653 $ 8,871 $ 305,752 Capital expenditures $ 1,197 $ 2,731 $ 2,108 $ 15,410 $ 36,667 $ 11,089 $ 53,155 $ 499 $ 122,856
(A) Segment assets consist of receivables, prepaids, inventories, property, plant and equipment, and mining properties.
2006
2005
2004
Income (loss) Total segment profit $ 114,006 $ 39,203 $ 12,455 Depreciation and amortization (26,772 ) (18,889 ) (16,833 ) Interest expense (1,224 ) (2,485 ) (2,831 ) Other (2,365 ) (1,600 ) (16,612 )
Income (loss) from continuing operations before income taxes $ 83,645 $ 16,229 $ (23,821 )
Assets Total assets for reportable segments $ 469,846 $ 305,752 $ 162,764 Cash and cash equivalents 270,672 54,896 65,218 Short-term investments 70,373 185,446 256,843 Other assets 38,735 33,894 28,350 Assets held for sale -- 14,828 12,602
Total consolidated assets $ 849,626 $ 594,816 $ 525,777
F-41
Geographic Information 2006 Revenues
Long-Lived
Assets
United States $ 102,393 $ 218,236 Australia 29,154 44,253 Chile 50,293 20,295 Argentina 34,733 3,700 Bolivia -- 50,858 Other foreign countries -- 214
Total $ 216,573 $ 337,556
2005
United States $ 69,636 $ 101,338 Australia 6,418 49,860 Chile 59,624 19,407 Argentina 20,606 2,568 Bolivia -- 32,194 Other foreign countries -- 237
Total $ 156,284 $ 205,604
2004
United States $ 64,005 $ 54,306 Australia -- -- Chile 35,267 15,332 Argentina 9,775 1,050 Bolivia -- 21,103 Other foreign countries -- 144
Total $ 109,047 $ 91,935
(a)Includes property, plant and equipment and mineral properties.
2007 2006 2005 Assets Total assets for reportable segments $ 2,437,042 $ 469,846 $ 305,752 Cash and cash equivalents 98,671 270,672 54,896 Short-term investments 53,039 70,373 185,446 Other assets 62,942 38,735 33,894 Total assets held for sale — — 14,828 Total consolidated assets $ 2,651,694 $ 849,626 $ 594,816
Geographic Information Long-Lived Revenues Assets 2007 United States $ 100,903 $ 305,876 Australia 28,545 42,772 Chile 47,794 28,028 Argentina 38,077 18,640 Mexico — 1,756,042 Bolivia — 151,716 Other foreign countries — 190 Total $ 215,319 $ 2,303,264 2006 United States $ 102,393 $ 218,236 Australia 29,154 44,253 Chile 50,293 20,295 Argentina 34,733 3,700 Bolivia — 50,858 Other foreign countries — 214 Total $ 216,573 $ 337,556 2005 United States $ 69,636 $ 101,338 Australia 6,418 49,860 Chile 59,624 19,407 Argentina 20,606 2,568 Bolivia — 32,194 Other foreign countries — 237 Total $ 156,284 $ 205,604
NOTE RS — LITIGATIONFederal Natural Resources Action
On March 22, 1996, an action was filed in the United States District Court for the District of Idaho by the United States against various defendants, including the Company, asserting claims under CERCLA and the Clean Water Act for alleged damages to federal natural resources in the Coeur d’Alene River Basin of Northern Idaho. The damages are claimed to result from alleged releases of hazardous substances from mining activities conducted in the area since the late 1800s.
In May 2001, the Company and representatives of the U.S. Government, including the Environmental Protection Agency, the Department of Interior and the Department of Agriculture, reached an agreement to settle the lawsuit. The terms of settlement are set forth in a Consent Decree issued by the court. Pursuant to the terms of the Consent Decree, dated May 14, 2001, the Company has paid the U.S. Government a total of approximately $3.9 million, of which $3.3 million was paid in May 2001 and the remaining $0.6 million was paid in June 2001. In addition, the Company will (i) pay the United States 50% of any future recoveries from insurance companies for claims for defense and indemnification under general liability insurance policies in excess of $0.6 million, (ii) accomplish certain cleanup work on the Mineral Point property and Caladay property, and (iii) make a conveyance to the U.S. or the State of Idaho of certain real property to possibly be used as a waste repository. Finally, commencing five years after effectiveness of the settlement, the Company will be obligated to pay royalties on all of its domestic and foreign operating properties, up to a cumulative of $3 million, amounting to a 2% net smelter royalty on silver production if the price of silver exceeds $6.50 per ounce, and a $5.00 per ounce royalty on gold production if the price of gold exceeds $325 per ounce. The royalty payment obligation commenced on May 14, 2006 and expires May 14, 2021. As of December 31, 2006, $2.5 million (including discontinued operations) of the $3.0 million was paid. It is expected that the remaining $0.5 million will be paid in the first half of 2007.
F-42
States of Maine, Idaho Andand Colorado Superfund Sites Related to Callahan Mining Corporation During 1991, the Company acquired all of the outstanding common stock of Callahan Mining Corporation. During 2001, the United States Forest Service made a formal request for information regarding the Deadwood Mine Site located in central Idaho. Callahan Mining Corporation had operated at this site during the 1940‘s.1940’s. The Forest Service believes that some cleanup action is required at the location. However, Coeur d’Alene Mines Corporation did not acquire Callahan until 1991, more than 40 years after Callahan disposed of its interest in the Deadwood property. The Company did not make any decisions with respect to generation, transport or disposal of hazardous waste at the site. Therefore, it is believed that the Company is not liable for any cleanup, and if Callahan might be liable, it has no substantial assets with which to satisfy any such liability. To date, no claim has been made by the United States for any cleanup costs against either the Company or Callahan.F-42
During 2002, the EPA made a formal request for information regarding a Callahan mine site in the State of Maine. Callahan operated there in the late 1960‘s,1960’s, shut the operations down in the early 1970‘s1970’s and disposed of the property. The EPA contends that some cleanup action is warranted at the site, and listed it on the National Priorities List in late 2002. The Company believes that because it made no decisions with respect to generation, transport or disposal of hazardous waste at this location, it is not liable for any cleanup costs. If Callahan might have liability, it has no substantial assets with which to satisfy such liability. To date, no claim has been made for any cleanup costs against either the Company or Callahan. In January 2003, the U.S. Forest Service made a formal request for information regarding a Callahan mine site in the State of Colorado known as the Akron Mine Site. Callahan operated there in approximately the late 1930s through the 1940s, and to the Company’s knowledge, disposed of the property. The Company is not aware of what, if any, cleanup action the Forest Service is contemplating. However, the Company did not make decisions with respect to generation, transport or disposal of hazardous waste at this location, and therefore believes it is not liable for any cleanup costs. If Callahan might have liability, it has no substantial assets with which to satisfy such liability. To date, no claim has been made for any cleanup costs against either the Company or Callahan.Federal District Court of Alaska Permit Challenge On September 12, 2005 three environmental groups (“Plaintiffs”) filed a lawsuit in Federal District Court in Alaska against the U.S. Army Corps of Engineers (“Corps of Engineers”) and the U.S. Forest Service (“USFS”) seeking to invalidate the permit issued to Coeur Alaska, Inc. for the Company’s Kensington mine. The Plaintiffs claim the Clean Water Act (CWA)(“CWA”) Section 404 permit issued by the Corps of Engineers authorizing the deposition of mine tailings into Lower Slate Lake conflicts with the CWA and is thus illegal.CWA. They additionally claim the USFS’s approval of the Amended Plan of Operations is arbitrary and capricious because it relies on the 404 permit issued by the Corps of Engineers. On November 8, 2005, Following the Corps of Engineers filed a Motion for Voluntary Remand with the court to review the permit issued to the Company under the CWA Section 404 and requested that the court stay the legal proceeding filed by the plaintiffs pending the outcome of review. On November 12, 2005, the Federal District Court in Alaska granted theCourt’s remand of the Section 404 permit to the Corps of Engineers for further review. On November 22, 2005,review, the Corps of Engineers advised the Company that it was suspending the Section 404 permit pursuant to the Court’s remand to further review the permit.
On March 29, 2006, the Corps of Engineers reinstated the Company’s 404 permit. On April 6, 2006 thepermit on March 29, 2006. The lawsuit challenging the permit was re-opened andon April 6, 2006; Coeur Alaska Inc. filed its answer to the Amended ComplaintComplaint; and Motion to Intervene as a Defendant-Intervenor in the action. Two other parties,Coeur Alaska, the State of Alaska, and Goldbelt, Inc., a local native corporation, also filed Motions to Intervene as Defendant-Intervenors as supporters of the Kensington project as permitted. The Company, the State of Alaska and Goldbelt, Inc. were granted Defendant-Intervenor status and joinedto join the agencies in their defense of the permits as issued.
F-43
permit.
On August 4, 2006, the Federal District Court in Alaska dismissed the Plaintiffs’ challenge and upheld the Section 404 permit. On August 7, 2006 the Plaintiffs filed a Notice of Appeal of the decision to the Ninth Circuit Court of Appeals (“Ninth Circuit Court”) and on August 9, 2006 the Plaintiffs additionally filed a Motion for Injunction Pending Appeal with the Ninth Circuit Court. The Ninth Circuit Court granted a temporary injunction pending appeal on August 24, 2006, enjoining certain activities relating to the lake tailings facility. The On May 22, 2007 the Ninth Circuit Court further ordered an expedited briefing schedulereversed the District Court’s August 4, 2006 decision which had upheld the Company’s 404 permit and issued its opinion that remanded the case to the District Court with instructions to vacate the Company’s 404 permit as well as the USFS Record of Decision approving the general tailings disposal plan as well as the Goldbelt 404 permit to construct the Cascade Point Marine Facility. On August 20, 2007, Coeur Alaska filed a Petition for Rehearing En Banc with the Ninth Circuit Court, as did the State of Alaska and Goldbelt, Inc. The Department of Justice, on the meritsbehalf of the legal challenge. AsCorps of Engineers, and USFS additionally filed a limited Petition for Rehearing with the Ninth Circuit panel seeking reconsideration of the mandate of the May 22, 2007 panel decision. On October 13, 2006,29, 2007, the parties filed their briefs inNinth Circuit denied the Petitions for Rehearing En Banc. On November 14, 2007, the Ninth Circuit granted a stay of the mandate pending further appeal to the Supreme Court, and participated in an oral argument on December 4, 2006. There is no indicationsubject to the development of whena reclamation plan for the Circuit Court may rule on the merits of appeal.lake area. The Company is unableand the State of Alaska filed Petitions for Certiorari to the Supreme Court of the United States on January 28, 2008. The Company cannot now predict the outcome ofpotential for obtaining further appeal or if it will prevail upon appeal if one is granted.F-43
No assurance can be given as to whether or when regulatory permits and approvals granted to the litigation.Company may be further challenged, appealed or contested by third parties or issuing agencies, or as to whether the Company will place the Kensington project into commercial production.
This litigation has contributed to an increase in capital costs. While the Company cannot now predict with certainty the outcome of this litigation, it believes it willshould ultimately prevail in the defense of the awarded permits, inprevail. In the event that the Company does not prevail, it could be necessary to seek an alternate site for the tailings disposal facility. The Company is not aware ofhas identified an alternate site that couldwhich it believes can be permitted or would be economic. Therefore, it is possible that an adverse legal decision could renderand has submitted a modified plan to the project uneconomic and an asset impairment would be necessary. As a result ofUSFS. Based upon the increase in capital and operating costs at the Kensington project,Company’s current estimates, an impairment writedown could be necessary should the expectation of the long-term price for gold decrease below approximately $510$606 per ounce. As of December 31, 2006,2007, the Kensington project has a carrying value of $206the Kensington project’s long-lived assets was $298.2 million.NOTE ST — SUMMARY OF QUARTERLY FINANCIAL DATA (UNAUDITED) The following table sets forth a summary of the quarterly results of operations for the years ended December 31, 2007 and 2006 and 2005:First
Quarter
Second
Quarter
Third
Quarter
Fourth
Quarter
(In Thousands - Except Per Share Data)
2006: Sales of metal $ 44,854 $ 54,041 $ 50,606 $ 67,072
Income (loss) from continuing operations $ 13,726 $ 20,132 $ 18,378 $ 23,183 Income (loss) from discontinued operations 612 12,516 (27 ) (33 )
Net income (loss) $ 14,338 $ 32,648 $ 18,351 $ 23,150
Basic net income (loss) per share Income (loss) from continuing operations $ 0.06 $ 0.07 $ 0.07 $ 0.08 Income (loss) from discontinued operations -- 0.05 -- --
Net income (loss) $ 0.06 $ 0.12 $ 0.07 $ 0.08
Diluted net income (loss) per share Income (loss) from continuing operations $ 0.05 $ 0.07 $ 0.06 $ 0.08 Income (loss) from discontinued operations -- 0.04 -- --
Net income (loss) $ 0.05 $ 0.11 $ 0.06 $ 0.08
(in thousands — except for per share data): First Second Third Fourth Quarter Quarter Quarter Quarter 2007: Sales of metal $ 50,860 $ 51,664 $ 52,863 $ 59,931 Net income $ 14,018 $ 11,918 $ 3,635 $ 14,319 Basic net income per share $ 0.05 $ 0.04 $ 0.01 $ 0.05 Diluted net income per share $ 0.05 $ 0.04 $ 0.01 $ 0.04
First Second Third Fourth Quarter Quarter Quarter Quarter 2006: Sales of metal $ 44,854 $ 54,041 $ 50,606 $ 67,072 Income from continuing operations $ 13,726 $ 20,132 $ 18,378 $ 23,183 Income from discontinued operations 612 12,516 (27 ) (33 ) Net income $ 14,338 $ 32,648 $ 18,351 $ 23,150 Basic net income per share Income from continuing operations $ 0.06 $ 0.07 $ 0.07 $ 0.08 Income from discontinued operations — 0.05 — — Net income $ 0.06 $ 0.12 $ 0.07 $ 0.08 Diluted net income per share Income from continuing operations $ 0.05 $ 0.07 $ 0.06 $ 0.08 Income from discontinued operations — 0.04 — — Net income $ 0.05 $ 0.11 $ 0.06 $ 0.08
F-44
First
Quarter
Second
Quarter
Third
Quarter
Fourth
Quarter
(In Thousands - Except Per Share Data)
2005: Sales of metal $ 32,235 $ 33,504 $ 39,281 $ 51,264 Income (loss) from continuing operations $ (784 ) $ (529 ) $ 4,722 $ 11,337 Income (loss) from discontinued operations (361 ) (1,172 ) (1,269 ) (1,393 )
Net income (loss) $ (1,145 ) $ (1,701 ) $ 3,453 $ 9,944
Basic net income (loss) per share Income (loss) from continuing operations $ 0.00 $ 0.00 $ 0.02 $ 0.05 Income (loss) from discontinued operations -- (0.01 ) (0.01 ) (0.01 )
Net income (loss) $ 0.00 $ (0.01 ) $ 0.01 $ 0.04
Diluted net income (loss) per share Income (loss) from continuing operations $ 0.00 $ 0.00 $ 0.02 $ 0.04 Income (loss) from discontinued operations -- (0.01 ) (0.01 ) --
Net income (loss) $ 0.00 $ (0.01 ) $ 0.01 $ 0.04
NOTE U — SUBSEQUENT EVENTDuring February 2008, Cobar reported to the Company that the reserves at the Endeavor mine exceed those reported for 2004, thereby fulfilling the contractual condition discussed in Note H. Consequently, the Company expects to pay Cobar the additional $26.3 million on April 1, 2008 plus accrued interest at the rate of 7.5% per annum from January 24, 2008.F-45
67
Recent
72
68
Item 7A.Quantitative and Qualitative Disclosures About Market Risk The Company is exposed to various market risks as a part of its operations. In an effort to mitigate losses associated with these risks, the Company may, at times, enter into derivative financial instruments. These may take the form of forward sales contracts, foreign currency exchange contracts and interest rate swaps. The Company does not actively engage in the practice of trading derivative securitiesinstruments for profit. This discussion of the Company’s market risk assessments contains “forward looking statements” that contain risks and uncertainties. Actual results and actions could differ materially from those discussed below. The Company’s operating results are substantially dependent upon the world market prices of silver and gold. The Company has no control over silver and gold prices, which can fluctuate widely and are affected by numerous factors, such as supply and demand and investor sentiment. In order to mitigate some of the risk associated with these fluctuations, the Company will at times enter into forward sale contracts. The Company continually evaluates the potential benefits of engaging in these strategies based on current market conditions. The Company may be exposed to nonperformance by counterparties as a result of its hedging activities. This exposure would be limited to the amount that the spot price of the metal falls short of the contract price. The Company has historically sold silver and gold produced by our mines pursuant to forward contracts and at spot prices prevailing at the time of sale. Since 1999, the Company has not engaged in any silver hedging activities and is currently not engaged in any gold hedging activities. The Company enters into concentrate sales contracts with third-party smelters. The contracts, in general, provide for a provisional payment based upon provisional assays and quoted metal prices. The provisionally priced sales contracts contain an embedded derivative that is required to be separated from the host contract for accounting purposes. The host contract is the receivable from the sale of concentrates at the forward price at the time of sale. The embedded derivative, which is the final settlement price based on a future price, does not qualify for hedge accounting. These embedded derivatives are recorded as derivative assets (in Prepaid expenses and other), or derivative liabilities (in Accrued liabilities and other), on the balance sheet and are adjusted to fair value through earnings each period until the date of final settlement.73
$20,800.
69
Item 8.Financial Statements and Supplementary Data The financial statements required hereunder and contained herein are listed under Item 15(a)(1) below.Item 9.Changes in and Disagreements with Accountants on Accounting and Financial Disclosure Not applicable.Item 9A.Controls and Procedures(a) Disclosure Controls and Procedures The Company’s disclosure controls and procedures are designed to provide reasonable assurance that information required to be disclosed by it in its periodic reports filed with the Securities and Exchange Commission is recorded, processed, summarized and reported, within the time periods specified in the Commission’s rules and forms. Based on an evaluation of the Company’s disclosure controls and procedures conducted by the Company’s Chief Executive Officer and Chief Financial Officer, such officers concluded that the Company’s disclosure controls and procedures were effective at a reasonable assurance level as of December 31, 2006.2007.74
Item 9A.Controls and Procedures(a) Disclosure Controls and Procedures The Company’s disclosure controls and procedures are designed to provide reasonable assurance that information required to be disclosed by it in its periodic reports filed with the Securities and Exchange Commission is recorded, processed, summarized and reported, within the time periods specified in the Commission’s rules and forms. Based on an evaluation of the Company’s disclosure controls and procedures conducted by the Company’s Chief Executive Officer and Chief Financial Officer, such officers concluded that the Company’s disclosure controls and procedures were effective at a reasonable assurance level as of December 31, 2006.2007.74
| • | Pertain to the maintenance of records that in reasonable detail accurately and fairly reflect the transactions and dispositions of the assets of the company; | ||
| • | Provide reasonable assurance that transactions are recorded as necessary to permit preparation of financial statements in accordance with generally accepted accounting principles, and that receipts and expenditures of the company are being made only in accordance with authorizations of management and directors of the company; and | ||
| • | Provide reasonable assurance regarding prevention or timely detection of unauthorized acquisition, use or disposition of the company’s assets that could have a material effect on the consolidated financial statements. |
Because of its inherent limitations, internal control over financial reporting may not prevent or detect misstatements. Also, projections of any evaluation of effectiveness to future periods are subject to risk that controls may become inadequate because of changes in conditions, or that the degree of compliance with the policies or procedures may deteriorate.
70
Management’s
Item 9B.Other Information Not applicable.Part IIIItem 10.Directors, Executive Officers and Corporate Governance Pursuant to General Instruction G(3) of Form 10-K, the information called for by this item regarding directors is hereby incorporated by reference from our definitive proxy statement or amendment hereto to be filed pursuant to Regulation 14A not later than 120 days after the end of the fiscal year covered by this report. Information regarding our executive officers is set forth under Item 4A of this Form 10-K.Item 11.Executive Compensation Pursuant to General Instruction G(3) of Form 10-K, the information called for by this item is hereby incorporated by reference from our definitive proxy statement or amendment hereto to be filed pursuant to Regulation 14A not later than 120 days after the end of the fiscal year covered by this report.Item 12.Security Ownership of Certain Beneficial Owners and Management and Related Stockholder Matters Pursuant to General Instruction G(3) of Form 10-K, the information called for by this item is hereby incorporated by reference from our definitive proxy statement or amendment hereto to be filed pursuant to Regulation 14A not later than 120 days after the end of the fiscal year covered by this report.Item 13.Certain Relationships and Related Transactions, and Director Independence Pursuant to General Instruction G(3) of Form 10-K, the information called for by this item is hereby incorporated by reference from our definitive proxy statement or amendment hereto to be filed pursuant to Regulation 14A not later than 120 days after the end of the fiscal year covered by this report.71
Item 14.Principal Accounting Fees and Services Pursuant to General Instruction G(3) of Form 10-K, the information called for by this item is hereby incorporated by reference from our definitive proxy statement or amendment hereto to be filed pursuant to Regulation 14A not later than 120 days after the end of the fiscal year covered by this report.76
Item 11.Executive Compensation Pursuant to General Instruction G(3) of Form 10-K, the information called for by this item is hereby incorporated by reference from our definitive proxy statement or amendment hereto to be filed pursuant to Regulation 14A not later than 120 days after the end of the fiscal year covered by this report.Item 12.Security Ownership of Certain Beneficial Owners and Management and Related Stockholder Matters Pursuant to General Instruction G(3) of Form 10-K, the information called for by this item is hereby incorporated by reference from our definitive proxy statement or amendment hereto to be filed pursuant to Regulation 14A not later than 120 days after the end of the fiscal year covered by this report.Item 13.Certain Relationships and Related Transactions, and Director Independence Pursuant to General Instruction G(3) of Form 10-K, the information called for by this item is hereby incorporated by reference from our definitive proxy statement or amendment hereto to be filed pursuant to Regulation 14A not later than 120 days after the end of the fiscal year covered by this report.71
Item 14.Principal Accounting Fees and Services Pursuant to General Instruction G(3) of Form 10-K, the information called for by this item is hereby incorporated by reference from our definitive proxy statement or amendment hereto to be filed pursuant to Regulation 14A not later than 120 days after the end of the fiscal year covered by this report.76
Item 13.Certain Relationships and Related Transactions, and Director Independence Pursuant to General Instruction G(3) of Form 10-K, the information called for by this item is hereby incorporated by reference from our definitive proxy statement or amendment hereto to be filed pursuant to Regulation 14A not later than 120 days after the end of the fiscal year covered by this report.71
Item 14.Principal Accounting Fees and Services Pursuant to General Instruction G(3) of Form 10-K, the information called for by this item is hereby incorporated by reference from our definitive proxy statement or amendment hereto to be filed pursuant to Regulation 14A not later than 120 days after the end of the fiscal year covered by this report.76
71
76
Item 15.Exhibits and Financial Statement Schedules(a) The following financial statements are filed herewith:
(1) The following consolidated financial statements of Coeur d’Alene Mines Corporation and subsidiaries are included in Item 8:
Consolidated Balance Sheets -– December 31, 20062007 and 2005.2006.
Consolidated Statements of Operations and Comprehensive Income (Loss) -– Years Ended December 31, 2007, 2006 2005 and 20042005.
Consolidated Statements of Changes in Shareholders’ Equity for the Years Ended December 31, 2007, 2006 2005 and 2004.2005.
Consolidated Statements of Cash Flows for the Years Ended December 31, 2007, 2006 2005 and 2004.2005.
Notes to Consolidated Financial Statements.
(b) Exhibits: The following listed documents are filed as Exhibits to this report:
3(a)–2 (a) Merger Implementation Agreement dated May 3, 2007 by and among Coeur d’Alene Mines Corporation, Coeur d’Alene Mines Australia Pty Ltd, Coeur Sub Two, Inc. and Bolnisi Gold NL (Incorporated herein by reference to Exhibit 2.2 to the Registrant’s Form 8-K filed May 4, 2007.) 2 (b) Amending Agreement dated June 8, 2007 Relating to Merger Implementation Agreement dated May 3, 2007 by and among Coeur d’Alene Mines Corporation, Coeur d’Alene Mines Australia Pty Ltd, Coeur Sub Two, Inc. and Bolnisi Gold NL (Incorporated herein by reference to Exhibit 2.1 to the Registrant’s Current Report on Form 8-K filed June 8, 2007.) 2 (c) - Second Amending Agreement dated June 22, 2007 Relating to Merger Implementation Agreement dated May 3, 2007 by and among Coeur d’Alene Mines Corporation, Coeur d’Alene Mines Australia Pty Ltd, Coeur Sub Two, Inc. and Bolnisi Gold NL, as amended on June 8, 2007 (Incorporated herein by reference to Exhibit 2.1 to the Registrant’s Current Report on Form 8-K filed June 22, 2007.) 2 (d) - Deed Poll made by the Registrant in favor of Bolnisi shareholders dated May 3, 2007 (Incorporated herein by reference to Exhibit 2.3 to the Registrant’s Current Report on Form 8-K filed May 4, 2007.) 2 (e) - Conditional Extension dated September 24, 2007 to Merger Implementation Agreement dated May 3, 2007 by and among Coeur d’Alene Mines Corporation, Coeur d’Alene Mines Australia Pty Ltd, Coeur Sub Two, Inc. and Bolnisi Gold NL (Incorporated herein by reference to Exhibit 2.1 to the Registrant’s Current Report on Form 8-K filed September 25, 2007.)
77
| (a) | The following financial statements are filed herewith: |
| (1) | The following consolidated financial statements of Coeur d’Alene Mines Corporation and subsidiaries are included in Item 8: |
| Consolidated Balance Sheets |
| Consolidated Statements of Operations and Comprehensive Income (Loss) |
| Consolidated Statements of Changes in Shareholders’ Equity for the Years Ended December 31, 2007, 2006 |
| Consolidated Statements of Cash Flows for the Years Ended December 31, 2007, 2006 |
| Notes to Consolidated Financial Statements. |
| (b) | Exhibits: The following listed documents are filed as Exhibits to this report: |
| 2 | (a) | Merger Implementation Agreement dated May 3, 2007 by and among Coeur d’Alene Mines Corporation, Coeur d’Alene Mines Australia Pty Ltd, Coeur Sub Two, Inc. and Bolnisi Gold NL (Incorporated herein by reference to Exhibit 2.2 to the Registrant’s Form 8-K filed May 4, 2007.) | ||||||
| 2 | (b) | Amending Agreement dated June 8, 2007 Relating to Merger Implementation Agreement dated May 3, 2007 by and among Coeur d’Alene Mines Corporation, Coeur d’Alene Mines Australia Pty Ltd, Coeur Sub Two, Inc. and Bolnisi Gold NL (Incorporated herein by reference to Exhibit 2.1 to the Registrant’s Current Report on Form 8-K filed June 8, 2007.) | ||||||
| 2 | (c) | - | Second Amending Agreement dated June 22, 2007 Relating to Merger Implementation Agreement dated May 3, 2007 by and among Coeur d’Alene Mines Corporation, Coeur d’Alene Mines Australia Pty Ltd, Coeur Sub Two, Inc. and Bolnisi Gold NL, as amended on June 8, 2007 (Incorporated herein by reference to Exhibit 2.1 to the Registrant’s Current Report on Form 8-K filed June 22, 2007.) | |||||
| 2 | (d) | - | Deed Poll made by the Registrant in favor of Bolnisi shareholders dated May 3, 2007 (Incorporated herein by reference to Exhibit 2.3 to the Registrant’s Current Report on Form 8-K filed May 4, 2007.) | |||||
| 2 | (e) | - | Conditional Extension dated September 24, 2007 to Merger Implementation Agreement dated May 3, 2007 by and among Coeur d’Alene Mines Corporation, Coeur d’Alene Mines Australia Pty Ltd, Coeur Sub Two, Inc. and Bolnisi Gold NL (Incorporated herein by reference to Exhibit 2.1 to the Registrant’s Current Report on Form 8-K filed September 25, 2007.) |
| 2 | (f) | - | Third Amending Agreement dated October 23, 2007 to Merger Implementation Agreement dated May 3, 2007 by and among Coeur d’Alene Mines Corporation, Coeur d’Alene Mines Australia Pty Ltd, Coeur Sub Two, Inc. and Bolnisi Gold NL (Incorporated herein by reference to Exhibit 2.1 to the Registrant’s Current Report on Form 8-K filed October 29, 2007.) | |||||
| 2 | (g) | - | Fourth Amending Agreement dated December 5, 2007 to Merger Implementation Agreement dated May 3, 2007 by and among Coeur d’Alene Mines Corporation, Coeur d’Alene Mines Australia Pty Ltd, Coeur Sub Two, Inc. and Bolnisi Gold NL (Incorporated herein by reference to Exhibit 2.1 to the Registrant’s Current Report on Form 8-K filed December 10, 2007.) | |||||
| 2 | (h) | - | Merger Implementation Agreement dated May 3, 2007 by and among Coeur d’Alene Mines Corporation and Palmarejo Silver and Gold Corporation (Incorporated herein by reference to Exhibit 2.1 to the Registrant’s Current Report on Form 8-K filed May 4, 2007.) | |||||
| 2 | (i) | - | Extension dated September 24, 2007 to Merger Implementation Agreement dated May 3, 2007 by and between Coeur d’Alene Mines Corporation and Palmarejo Silver and Gold Corporation. (Incorporated herein by reference to Exhibit 2.2 to the Registrant’s Current Report on Form 8-K filed September 25, 2007.) | |||||
| 2 | (j) | - | Amendment dated October 23, 2007 to Merger Implementation Agreement dated May 3, 2007 by and between Coeur d’Alene Mines Corporation and Palmarejo Silver and Gold Corporation (Incorporated herein by reference to Exhibit 2.2 to the Registrant’s Current Report on Form 8-K filed October 29, 2007.) | |||||
| 2 | (k) | - | Second Amendment dated December 4, 2007 to Merger Implementation Agreement dated May 3, 2007 by and between Coeur d’Alene Mines Corporation and Palmarejo Silver and Gold Corporation (Incorporated herein by reference to Exhibit 2.2 to the Registrant’s Current Report on Form 8-K filed December 10, 2007.) | |||||
| 3 | (a) | - | Articles of Incorporation of the Registrant and amendments thereto. (Incorporated herein by reference to Exhibit 3(a) to the Registrant’s Annual Report on Form 10-K for the year ended December 31, 1988.) |
| 3 | (b) | - | Bylaws of the Registrant and amendments thereto. (Incorporated herein by reference to Exhibit 3.1 to the Registrant’s Current Report on Form 8-K dated August 30, 2004.) |
| 3 | (c) | - | Certificate of Designations, Powers and Preferences of the Series B Junior Preferred Stock of the Registrant, as filed with Idaho Secretary of State on May 13, 1999. (Incorporated herein by reference to the Registrant’s Annual Report on Form 10-K for the year ended December 31, 2002.) |
| 3 | (d) | - | Restated and Amended Articles of Incorporation of the Registrant as filed with the Secretary of State of the State of Idaho effective September 13, 1999. (Incorporated herein by reference to Exhibit 3 to the Registrant’s Quarterly Report on Form 10-Q for the quarter ended September 30, 1999.) |
78
| 3 | (e) | - | Amendment to Restated and Amended Articles of Incorporation of the Registrant (Incorporated herein by reference to Exhibit 3.1 to the Registrant’s Quarterly Report on Form 10-Q for the quarter ended September 30, 2002.) |
| 3 | (f) | - | Articles of Amendment, dated May 20, 2004, to the Restated and Amended Articles of Incorporation of the Registrant (Incorporated herein by reference to Exhibit 3.5 to the Form S-4 Registration Statement of Coeur d’ Alene Mines Holding Company and Coeur d’ Alene Canadian Acquisition Corporation filed on July 13, 2004 (file No. 333-117325).) | |||||
| 3 | (g) | - | Certificate of Amendment to the Certificate of Designations, Powers and Preferences of the Series B Junior Preferred Stock of the Registrant, dated December 7, 2007. (Filed herewith.) | |||||
| 3 | (h) | - | Amended and Restated Certificate of Designations, Powers and Preferences of the Series B Junior Preferred Stock of the Registrant, dated December 7, 2007. (Filed herewith.) | |||||
| 3 | (i) | - | Articles of Amendment to the Restated and Amended Articles of Incorporation of the Registrant, dated December 7, 2007. (Filed herewith.) | |||||
| 3 | (j) | - | Restated and Amended Articles of Incorporation of the Registrant, dated December 7, 2007. (Filed herewith.) | |||||
| 3 | (k) | - | Bylaws of the Registrant, as amended effective July 16, 2007. (Incorporated herein by reference to Exhibit 3 to the Registrant’s Quarterly Report on Form 10-Q for the quarter ended September 30, 2007.) | |||||
| 4 | (a) | - | Specimen certificate of the Registrant’s stock. (Incorporated herein by reference to Exhibit 4 to the Registrant’s Registration Statement on Form S-2 (File No. 2-84174).) |
72
| 4 | (b) | - | Indenture dated as of January 13, 2004, by and between the Registrant and the Bank of New York relating to the Registrant’s 1 |
| 10 | (a) | - | Agreement, dated January 1, 1994, between Coeur-Rochester, Inc. and Johnson Matthey Inc. (Incorporated herein by reference to Exhibit 10(m) of the Registrant’s Annual Report on Form 10-K for the year ended December 31, 1993.) |
| 10 | (b) | - | Master Equipment Lease No. 099-03566-01, dated as of December 28, 1988, between Idaho First National Bank and the Registrant. (Incorporated herein by reference to Exhibit 10(w) of the Registrant’s Annual Report on Form 10-K for the year ended December 31, 1988.) |
| 10 | (c) | - | Master Equipment Lease No. 01893, dated as of December 28, 1988, between Cargill Leasing Corporation and the Registrant. (Incorporated herein by reference to Exhibit 10(x) of the Registrant’s Annual Report on Form 10-K for the year ended December 31, 1988.) |
| * | Management contract or compensatory plan. |
79
| 10 | (d) | - | Rights Agreement, dated as of May 11, 1999, between the Registrant and ChaseMellon Shareholder Services, L.L.C., as Rights Agent. (Incorporated herein by reference to Exhibit 1 to the Registrant’s Form 8-A relating to the registration of the Rights on the New York and Pacific Stock Exchanges.) |
| 10 | (e) | - | Amended and Restated Profit Sharing Retirement Plan of the Registrant. (Incorporated herein by reference to Exhibit 10(ff) to the Registrant’s Annual Report on Form 10-K for the year ended December 31, 1993.) * |
| 10 | (f) | - | 1993 Annual Incentive Plan and Long-Term Performance Share Plan of the Registrant. (Incorporated herein by reference to Exhibit 10(jj) to the Registrant’s Annual Report on Form 10-K for the year ended December 31, 1993.)* |
| 10 | (g) | - | Lease Agreement, dated January 12, 1994, between First Security Bank of Idaho and Coeur Rochester, Inc. (Incorporated herein by reference to Exhibit 10(mm) to the Registrant’s Annual Report on Form 10-K for the year ended December 31, 1993.) |
| 10 | (h) | - | 401(k) Plan of the Registrant. (Incorporated by reference to Exhibit 10 (pp) to the Registrants Annual Report on Form 10-K for the year ended December 31, 1994.)* |
| 10 | (i) | - | Form of severance/change in control agreements entered into by the Registrant with each of its executive officers (James A. Sabala – January 13, 2003). (Incorporated by reference to Exhibit 10(hh) to the Registrant’s Annual Report on Form 10-K for the year ended December 31, 2001).* |
| 10 | (j) | - | Employment Agreement, dated as of January 13, 2003, between the Registrant and James A. Sabala. (Incorporated by reference to Exhibit 10(jj) to Registrant’s Annual Report on Form 10-K for the period ended December 31, 2002).* |
73
| 10 | (k) | - | 2003 Long-Term Incentive Plan of the Registrant. (Incorporated herein by reference to Appendix A to the Registrant’s definitive Proxy Statement on Schedule 14A filed with the SEC on April 21, 2003.) * |
| 10 | (l) | - | Silver Sale and Purchase Agreement, dated April 7, 2005, between CDE Australia Pty. Limited and Cobar Operations Pty. Limited. (Portions of this exhibit have been omitted pursuant to a request for confidential treatment.) (Incorporated by reference to Exhibit 10.1 to the Registrant’s Quarterly Report on Form 10-Q for the quarter ended March 31, 2005.) |
| 10 | (m) | - | 2005 Non-Employee Directors’ Equity Incentive Plan (Incorporated herein by reference to Appendix A to the Registrant’s proxy statement dated April 5, 2005). |
| * | Management contract or compensatory plan. |
80
| 10 | (n) | - | Amended and |
| 10 | (o) | - | Employment Agreement, dated as of September 17, 2002, between the Registrant and Dennis E. Wheeler (Incorporated herein by reference to Exhibit 10(z) to the Registrant’s Annual Report on Form 10-K for the year ended December 31, |
| 10 | (p) | - | Amended Mining Lease, effective as of August 5, 2005, between Hyak Mining Company, Inc. and Coeur Alaska, Inc. (Incorporated herein by reference to Exhibit 10.5 to the |
| 10 | (q) | - | Silver Sale Agreement, dated September 8, 2005, between the Registrant, Perilya Broken Hill Ltd and CDE Australia Pty. Ltd. (Portions of this exhibit have been omitted pursuant to a request for confidential treatment.) (Incorporated herein by reference to Exhibit 10.1 to the Registrant’s Quarterly Report on Form 10-Q for the quarter ended September 30, 2005). |
| 10 | (r) | - | Employment |
| 10 | (s) | - | Form of Restricted Stock Agreement (Incorporated herein by reference to Exhibit 10.1 to the Registrant’s Current Report on Form 8-K dated February 15, 2005).* |
| 10 | (t) | - | Form of Incentive Stock Option Agreement (Incorporated herein by reference to Exhibit 10.2 to the Registrant’s Current Report on Form 8-K dated February 15, 2005).* |
| 10 | (u) | - | Form of Non-Qualified Stock Option Agreement (Incorporated herein by reference to Exhibit 10.3 to the Registrant’s Current Report on Form 8-K dated February 15, 2005).* |
74
| 10 | (v) | - | First Amendment to Employment to Agreement, effective March 30, 2006, between the Registrant and Dennis E. Wheeler (Incorporated herein by reference to Exhibit 10(a) to the Registrant’s Quarterly Report on Form 10-Q for the quarter ended March 31, 2006).* |
| 10 | (w) | - | Amended and Restated Silver Sale and Purchase Agreement, dated March 28, 2006, between CDE Australia Pty Limited and Cobar Operations Pty Limited (Portions of this exhibit have been omitted pursuant to a request for confidential treatment.) (Incorporated herein by reference to Exhibit 10(b) to the Registrant’s Quarterly Report on Form 10-Q for the quarter ended March 31, 2006). |
| * | Management contract or compensatory plan. |
81
| 10 | (x) | - | Employment Agreement, dated July 31, 2006, between the Registrant and Alan L. Wilder. (Incorporated herein by reference to Exhibit 10.1 to the Registrant’s Quarterly Report on Form 10-Q for the quarter ended June 30, |
| 10 | (y) | - | Amendment, dated July 31, 2006, to Employment Agreement between the Registrant and Donald J. Birak. (Incorporated herein by reference to Exhibit 10.2 to the Registrant’s Quarterly Report on Form 10-Q for the quarter ended June 30, |
| 10 | (z) | - | Amendment, dated July 31, 2006, to Employment Agreement between the Registrant and James K. Duff. (Incorporated herein by reference to Exhibit 10(z) to the Registrant’s Annual Report on Form 10-K for the year ended December 31, 2006.)* | |||||
| 10(aa) | - | Second Amendment to Employment Agreement, dated July 31, 2007, to employment agreement dated July 1, 2005, as amended on July 31, 2006, between the Registrant and Donald J. Birak (Incorporated herein by reference to Exhibit 10.1 to the Registrant’s Quarterly Report on Form 10-Q for the quarter ended June 30, 2007.)* | ||||||
| 10(bb) | - | Second Amendment to Employment Agreement, dated May 2, 2007, between the Registrant and Dennis E. Wheeler (Incorporated herein by reference to Exhibit 10.1 to the Registrant’s Current Report on Form 8-K filed on May 7, 2007.)* | ||||||
| 10(cc) | - | Supplemental Agreement in respect of the Amended and Restated Silver Sale and Purchase Agreement, dated January 29, 2008, between CDE Australia Pty Limited and Cobar Operations Pty Limited. (Filed | ||||||
| 10(dd) | - | Amended and Restated Employment Agreement and Change in Control Agreement, effective July 1, 2005, between the Registrant and Mitchell J. Krebs (Incorporated herein by reference to Exhibit 10.3 to the Registrant’s Quarterly Report on Form 10-Q for the quarter ended June 30, 2005).* | ||||||
| 10(ee) | - | First Amendment to Employment Agreement, effective July 31, 2006, between the Registrant and Mitchell J. Krebs. (Filed herewith.)* | ||||||
| 10(ff) | - | Second Amendment to Employment Agreement, effective July 31, 2007, between the Registrant and Mitchell J. Krebs. (Filed herewith.)* | ||||||
| 10(gg) | - | Amended and Restated Employment Agreement and Change in Control Agreement, effective July 1, 2005, between the Registrant and Harry F. Cougher (Incorporated herein by reference to Exhibit 10.2 to the Registrant’s Quarterly Report on Form 10-Q for the quarter ended June 30, 2005).* | ||||||
| 10(hh) | - | First Amendment to Employment Agreement, effective July 31, 2006, between the Registrant and Harry F. Cougher. (Filed herewith.)* | ||||||
| 10(ii) | - | Employment Agreement, dated as of February 13, 2006, between CDE Australia Pty Ltd and Richard M. Weston. (Filed herewith.)* | ||||||
| * | Management contract or compensatory plan. |
82
| 10(jj) | - | First Amendment to Employment Agreement, effective as of July 31, 2006, between the Registrant and Richard M. Weston. (Filed herewith.)* | ||||||
| 10(kk) | - | Second Amendment to Employment Agreement, effective as of July 31, 2007, between the Registrant and Richard M. Weston. (Filed herewith.)* | ||||||
| 10(ll) | - | First Amendment to Employment Agreement, dated February 6, 2008, between the Registrant and Alan L. Wilder. (Filed herewith.)* | ||||||
| 21 | - | List of subsidiaries of the Registrant. (Filed herewith.) | ||||||
| 23 | - | Consent of KPMG LLP (Filed herewith.) |
| 31.1 | - | Certification of the CEO (Filed herewith.) |
| 31.2 | - | Certification of the CFO (Filed herewith.) |
| 32.1 | - | CEO Section 1350 Certification (Filed herewith.) |
| 32.2 | - | CFO Section 1350 Certification (Filed herewith.) | ||||||
| 99 | (a) | - | Option Deed dated May 3, 2007 by and between Coeur d’Alene Mines Corporation and Kenneth M. Phillips (Incorporated herein by reference to Exhibit 99.1(a) to the Registrant’s Current Report on Form 8-K filed May 4, 2007.) | |||||
| 99 | (b) | - | Option Deed dated May 3, 2007 by and between Coeur d’Alene Mines Corporation and Altinova Nominees Pty Ltd (Incorporated herein by reference to Exhibit 99.1(b) to the Registrant’s Current Report on Form 8-K filed May 4, 2007.) | |||||
| 99 | (c) | - | Option Deed dated May 3, 2007 by and between Coeur d’Alene Mines Corporation and Dragonlyn Pty Ltd (Incorporated herein by reference to Exhibit 99.1(c) to the Registrant’s Current Report on Form 8-K filed May 4, 2007.) | |||||
| 99 | (d) | - | Option Deed dated May 3, 2007 by and between Coeur d’Alene Mines Corporation and Rosignol Consultants Pty Ltd (Incorporated herein by reference to Exhibit 99.1(d) to the Registrant’s Current Report on Form 8-K filed May 4, 2007.) | |||||
| 99 | (e) | - | Option Deed dated May 3, 2007 by and between Coeur d’Alene Mines Corporation and Promin Mining Services Pty Limited (Incorporated herein by reference to Exhibit 99.1(e) to the Registrant’s Current Report on Form 8-K filed May 4, 2007.) | |||||
| 99 | (f) | - | Option Deed dated May 3, 2007 by and between Coeur d’Alene Mines Corporation and Rosignol Pty Limited (Incorporated herein by reference to Exhibit 99.1(f) to the Registrant’s Current Report on Form 8-K filed May 4, 2007.) | |||||
| 99 | (g) | - | Amendments dated September 24, 2007 to Option Deed dated May 3, 2007 by and between Coeur d’Alene Mines Corporation and Kenneth M. Phillips. (Incorporated herein by reference to Exhibit 99.1 to the Registrant’s Form 8-K filed September 25, 2007.) |
| * | Management contract or compensatory plan. |
83
| 99 | (h) | - | Amendments dated September 24, 2007 to Option Deed dated May 3, 2007 by and between Coeur d’Alene Mines Corporation and Altinova Nominees Pty Ltd. (Incorporated herein by reference to Exhibit 99.2 to the Registrant’s Form 8-K filed September 25, 2007.) | |||||
| 99 | (i) | - | Amendments dated September 24, 2007 to Option Deed dated May 3, 2007 by and between Coeur d’Alene Mines Corporation and Dragonlyn Pty Ltd. (Incorporated herein by reference to Exhibit 99.3 to the Registrant’s Form 8-K filed September 25, 2007.) | |||||
| 99 | (j) | - | Amendments dated September 24, 2007 to Option Deed dated May 3, 2007 by and between Coeur d’Alene Mines Corporation and Rosignol Consultants Pty Ltd. (Incorporated herein by reference to Exhibit 99.4 to the Registrant’s Form 8-K filed September 25, 2007.) | |||||
| 99 | (k) | - | Amendments dated September 24, 2007 to Option Deed dated May 3, 2007 by and between Coeur d’Alene Mines Corporation and Promin Mining Services Pty Ltd. (Incorporated herein by reference to Exhibit 99.5 to the Registrant’s Form 8-K filed September 25, 2007.) | |||||
| 99 | (l) | - | Amendments dated September 24, 2007 to Option Deed dated May 3, 2007 by and between Coeur d’Alene Mines Corporation and Rosignol Consultants Pty Ltd. (Incorporated herein by reference to Exhibit 99.6 to the Registrant’s Form 8-K filed September 25, 2007.) | |||||
| 99 | (m) | - | Amending Agreement dated October 23, 2007 relating to Option Deed dated May 3, 2007 by and between Coeur d’Alene Mines Corporation and Kenneth M. Phillips, as amended to date (Incorporated herein by reference to Exhibit 99.1 to the Registrant’s Current Report on Form 8-K filed October 29, 2007.) | |||||
| 99 | (n) | - | Amending Agreement dated October 23, 2007 relating to Option Deed dated May 3, 2007 by and between Coeur d’Alene Mines Corporation and Altinova Nominees Pty Ltd, as amended to date (Incorporated herein by reference to Exhibit 99.2 to the Registrant’s Current Report on Form 8-K filed October 29, 2007.) | |||||
| 99 | (o) | - | Amending Agreement dated October 23, 2007 relating to Option Deed dated May 3, 2007 by and between Coeur d’Alene Mines Corporation and Dragonlyn Pty Ltd, as amended to date (Incorporated herein by reference to Exhibit 99.3 to the Registrant’s Current Report on Form 8-K filed October 29, 2007.) | |||||
| 99 | (p) | - | Amending Agreement dated October 23, 2007 relating to Option Deed dated May 3, 2007 by and between Coeur d’Alene Mines Corporation and Rosignol Consultants Pty Ltd, as amended to date (Incorporated herein by reference to Exhibit 99.4 to the Registrant’s Current Report on Form 8-K filed October 29, 2007.) | |||||
| 99 | (q) | - | Amending Agreement dated October 23, 2007 relating to Option Deed dated May 3, 2007 by and between Coeur d’Alene Mines Corporation and Promin Mining Services Pty Limited, as amended to date (Incorporated herein by reference to Exhibit 99.5 to the Registrant’s Current Report on Form 8-K filed October 29, 2007.) |
84
| 99 | (r) | - | Amending Agreement dated October 23, 2007 relating to Option Deed dated May 3, 2007 by and between Coeur d’Alene Mines Corporation and Rosignol Pty Limited, as amended to date (Incorporated herein by reference to Exhibit 99.6 to the Registrant’s Current Report on Form 8-K filed October 29, 2007.) |
| (c) | Independent auditors’ reports are included herein as follows: |
| Report of KPMG LLP as of December 31, |
7585
SIGNATURES
| Coeur d’Alene Mines Corporation (Registrant) | ||||
Date: February | By: | /s/ Dennis E. Wheeler | ||
| Dennis E. Wheeler | ||||
| | (Chairman, President and Chief Executive Officer) | |||
/s/ Dennis E. Wheeler | Chairman, President, Chief Executive Officer | February | ||
| Dennis E. Wheeler | and Director | |||
/s/ James A. SabalaJames A. Sabala | Executive Vice President | |||
| and Chief Financial Officer | February 29, 2008 | |||
/s/ Tom T. AngelosTom T. Angelos | Vice President, Controller | |||
| and Chief Accounting Officer | ||||
| February | ||||
/s/ James J. Curran | ||||
| James J. Curran | Director | February 29, 2008 | ||
/s/ Sebastian EdwardsSebastian Edwards | Director | February 29, 2008 | ||
/s/ Andrew D. Lundquist | ||||
| Andrew D. Lundquist | Director | February 29, 2008 | ||
/s/ Robert E. Mellor | ||||
| Robert E. Mellor | Director | February 29, 2008 | ||
/s/ John H. Robinson | ||||
| John H. Robinson | Director | February 29, 2008 | ||
/s/ J. Kenneth Thompson | ||||
| J. Kenneth Thompson | Director | February 29, 2008 | ||
/s/ Alex VitaleAlex Vitale | Director | February | ||
/s/ Timothy R. Winterer | ||||
| Timothy R. Winterer | Director | February 29, 2008 |
7686
2007
| Reports of Independent Registered Public Accounting Firm | F-2 | |
| Consolidated Balance Sheets | F-5 | |
| Consolidated Statements of Operations and Comprehensive Income | ||
| Ended December 31, 2007, 2006 and 2005 | F-7 | |
| Consolidated Statements of Changes in | ||
| the Years Ended December 31, 2007, 2006 | F-8 | |
| Consolidated Statements of Cash Flows for the Years Ended | ||
| December 31, 2007, 2006 | F-9 | |
| Notes to Consolidated Financial Statements | F-10 |
F-1
Report of Independent Registered Public Accounting FirmThe Board of Directors and Shareholders
Coeur d’Alene Mines Corporation:We have audited the accompanying consolidated balance sheets of Coeur d’Alene Mines Corporation and subsidiaries as of December 31, 20062007 and 2005,2006, and the related consolidated statements of operations and comprehensive income, (loss),changes in shareholders’ equity, and cash flows for each of the years in the three-year period ended December 31, 2006.2007. These consolidated financial statements are the responsibility of the Company’s management. Our responsibility is to express an opinion on these consolidated financial statements based on our audits.We conducted our audits in accordance with the standards of the Public Company Accounting Oversight Board (United States). Those standards require that we plan and perform the audit to obtain reasonable assurance about whether the financial statements are free of material misstatement. An audit includes examining, on a test basis, evidence supporting the amounts and disclosures in the financial statements. An audit also includes assessing the accounting principles used and significant estimates made by management, as well as evaluating the overall financial statement presentation. We believe that our audits provide a reasonable basis for our opinion.In our opinion, the consolidated financial statements referred to above present fairly, in all material respects, the financial position of Coeur d’Alene Mines Corporation and subsidiaries as of December 31, 20062007 and 2005,2006, and the results of their operations and their cash flows for each of the years in the three-year period ended December 31, 2006,2007, in conformity with U.S. generally accepted accounting principles.As discussed in Note B to the Consolidated Financial Statements,consolidated financial statements, the Company has adopted Statement of Financial Accounting Standards No. 123 (revised 2004),Share-Based Payment, and Emerging Issues Task Force Issue No. 04-6,Accounting for Stripping Costs Incurred during Production in the Mining Industry, as of January 1, 2006.We also have audited, in accordance with the standards of the Public Company Accounting Oversight Board (United States), the effectiveness of Coeur d’Alene Mines Corporation’s internal control over financial reporting as of December 31, 2006,2007, based on criteria established inInternal Control-IntegratedControl — Integrated Framework issued by the Committee of Sponsoring Organizations of the Treadway Commission (COSO), and our report dated February 22, 200729, 2008 expressed an unqualified opinion on management’s assessmentthe effectiveness of and the effective operation of,Company’s internal control over financial reporting./s/
KPMG LLPBoise, Idaho
February 22, 2007
29, 2008F-2
Report of Independent Registered Public Accounting FirmThe Board of Directors and Shareholders
Coeur d’Alene Mines Corporation:We have audited management's assessment, included in the accompanying Management’s Report on Internal Control Over Financial Reporting, that Coeur d’Alene Mines Corporation maintained effectiveCorporation’s internal control over financial reporting as of December 31, 2006,2007, based on criteria established inInternal Control-IntegratedControl — Integrated Frameworkissued by the Committee of Sponsoring Organizations of the Treadway Commission (COSO).Coeur d’Alene Mines Corporation’s management is responsible for maintaining effective internal control over financial reporting and for its assessment of the effectiveness of internal control over financial reporting.reporting, included in the accompanying Management’s Report on Internal Control Over Financial Reporting. Our responsibility is to express an opinion on management’s assessment and an opinion on the effectiveness of the Company’s internal control over financial reporting based on our audit.We conducted our audit in accordance with the standards of the Public Company Accounting Oversight Board (United States). Those standards require that we plan and perform the audit to obtain reasonable assurance about whether effective internal control over financial reporting was maintained in all material respects. Our audit included obtaining an understanding of internal control over financial reporting, evaluating management’s assessment,assessing the risk that a material weakness exists, and testing and evaluating the design and operating effectiveness of internal control andbased on the assessed risk. Our audit also included performing such other procedures as we considered necessary in the circumstances. We believe that our audit provides a reasonable basis for our opinion.A company'scompany’s internal control over financial reporting is a process designed to provide reasonable assurance regarding the reliability of financial reporting and the preparation of financial statements for external purposes in accordance with generally accepted accounting principles. A company’s internal control over financial reporting includes those policies and procedures that (1) pertain to the maintenance of records that, in reasonable detail, accurately and fairly reflect the transactions and dispositions of the assets of the company; (2) provide reasonable assurance that transactions are recorded as necessary to permit preparation of financial statements in accordance with generally accepted accounting principles, and that receipts and expenditures of the company are being made only in accordance with authorizations of management and directors of the company; and (3) provide reasonable assurance regarding prevention or timely detection of unauthorized acquisition, use, or disposition of the company’s assets that could have a material effect on the financial statements.Because of its inherent limitations, internal control over financial reporting may not prevent or detect misstatements. Also, projections of any evaluation of effectiveness to future periods are subject to the risk that controls may become inadequate because of changes in conditions, or that the degree of compliance with the policies or procedures may deteriorate.In our opinion, management's assessment that Coeur d’Alene Mines Corporation maintained effective internal control over financial reporting as of December 31, 2006, is fairly stated, in all material respects, based on criteria established inInternal Control-Integrated Framework issued by the Committee of Sponsoring Organizations of the Treadway Commission (COSO). Also, in our opinion, Coeur d’Alene Mines Corporation maintained, in all material respects, effective internal control over financial reporting as of December 31, 2006,2007, based on criteria established inInternal Control-IntegratedControl — Integrated Frameworkissued by the Committee of Sponsoring Organizations of the Treadway Commission (COSO).Commission.The Company acquired Bolnisi Gold NL and Palmarejo Silver and Gold Corporation on December 21, 2007, and management excluded from its assessment of the effectiveness of the Company’s internal control over financial reporting as of December 31, 2007, Bolnisi Gold NL’s and Palmarejo Silver and Gold Corporation’s internal control over financial reporting associated with total assets of $1.8 billion and total revenues of nil, included in the consolidated financial statements of Coeur d’Alene Mines Corporation and subsidiaries as of and for the year ended December 31, 2007. Our audit of internal control over financial reporting of Coeur d’Alene Mines Corporation also excluded an evaluation of the internal control over financial reporting of Bolnisi Gold NL and Palmarejo Silver and Gold Corporation.F-3
We also have audited, in accordance with the standards of the Public Company Accounting Oversight Board (United States), the consolidated balance sheets of Coeur d’Alene Mines Corporation as of December 31, 20062007 and 2005,2006, and the related consolidated statements of operations and comprehensive income, (loss), shareholders’ equity, and cash flows for each of the years in the three-year period ended December 31, 2006,2007, and our report dated February 22, 200729, 2008 expressed an unqualified opinion on those consolidated financial statements./s/
KPMG LLPBoise, Idaho
February 22, 2007
29, 2008F-4
COEUR D’ALENE MINES CORPORATION AND SUBSIDIARIES
CONSOLIDATED BALANCE SHEETSDecember 31, 2006
2005
ASSETS (In Thousands)
CURRENT ASSETS Cash and cash equivalents $ 270,672 $ 54,896 Short-term investments 70,373 185,446 Receivables 43,233 27,986 Ore on leach pad 31,302 25,394 Metal and other inventory 16,341 12,807 Deferred tax assets 3,629 2,255 Prepaid expenses and other 6,047 4,707 Assets of discontinued operations held for sale -- 14,828
441,597 328,319
PROPERTY, PLANT AND EQUIPMENT Property, plant and equipment 132,315 105,107 Less accumulated depreciation (64,206 ) (57,929 )
68,109 47,178
MINING PROPERTIES Operational mining properties 130,447 121,441 Less accumulated depletion (116,361 ) (105,486 )
14,086 15,955
Mineral interests 72,201 72,201 Less accumulated depletion (7,828 ) (2,218 )
64,373 69,983
Non-producing and development properties 190,988 72,488
269,447 158,426
OTHER ASSETS Ore on leach pad, non-current portion 35,367 29,254 Restricted cash and cash equivalents 19,492 16,943 Debt issuance costs, net 5,151 5,454 Deferred tax assets 2,544 923 Other 7,919 8,319
70,473 60,893
TOTAL ASSETS $ 849,626 $ 594,816
December 31, 2007 2006 (In thousands) ASSETS CURRENT ASSETS Cash and cash equivalents $ 98,671 $ 270,672 Short-term investments 53,039 70,373 Receivables 56,121 43,233 Ore on leach pad 25,924 31,302 Metal and other inventory 18,918 16,341 Deferred tax assets 3,573 3,629 Prepaid expenses and other 7,821 6,047 264,067 441,597 PROPERTY, PLANT AND EQUIPMENT Property, plant and equipment 322,733 132,315 Less accumulated depreciation (69,937 ) (64,206 ) 252,796 68,109 MINING PROPERTIES Operational mining properties 143,324 130,447 Less accumulated depletion (124,401 ) (116,361 ) 18,923 14,086 Mineral interests 1,731,715 72,201 Less accumulated depletion (11,639 ) (7,828 ) 1,720,076 64,373 Non-producing and development properties 311,469 190,988 2,050,468 269,447 OTHER ASSETS Ore on leach pad, non-current portion 24,995 35,367 Restricted cash and cash equivalents 25,760 23,508 Debt issuance costs, net 4,848 5,151 Deferred tax assets 1,109 2,544 Other 27,651 3,903 84,363 70,473 TOTAL ASSETS $ 2,651,694 $ 849,626
The accompanying notes are an integral part of these consolidated financial statements.F-5
COEUR D’ALENE MINES CORPORATION AND SUBSIDIARIES
CONSOLIDATED BALANCE SHEETSDecember 31, 2006
2005
(In thousands except
share data) LIABILITIES AND SHAREHOLDERS’ EQUITY
CURRENT LIABILITIES Accounts payable $ 22,315 $ 17,189 Accrued liabilities and other 11,865 5,662 Accrued income taxes 10,317 66 Accrued payroll and related benefits 8,527 7,840 Accrued interest payable 1,031 1,031 Current portion of reclamation and mine closure 4,460 1,646 Liabilities of discontinued operations held for sale -- 12,908
58,515 46,342
LONG-TERM LIABILITIES 1 1/4% Convertible Senior Notes due January 2024 180,000 180,000 Reclamation and mine closure 27,226 23,048 Other long-term liabilities 2,891 3,873
210,117 206,921
COMMITMENTS AND CONTINGENCIES (See Notes I, J, L, M, N, O, P and R)
SHAREHOLDERS’ EQUITY Common Stock, par value $1.00 per share; authorized 500,000,000 shares, issued 279,054,344 and 250,961,353 shares in 2006 and 2005 (1,059,211 shares held in treasury) 279,054 250,961 Additional paid-in capital 777,798 656,977 Accumulated deficit (463,221 ) (551,357 ) Shares held in treasury (13,190 ) (13,190 ) Accumulated other comprehensive income (loss) 553 (1,838 )
580,994 341,553
TOTAL LIABILITIES AND SHAREHOLDERS’ EQUITY $ 849,626 $ 594,816
December 31, 2007 2006 (In thousands, except share data) LIABILITIES AND SHAREHOLDERS’ EQUITY CURRENT LIABILITIES Accounts payable $ 49,642 $ 22,315 Accrued liabilities and other 9,072 10,971 Accrued income taxes 7,547 10,317 Accrued payroll and related benefits 9,342 8,527 Accrued interest payable 1,060 1,031 Current portion of long-term debt and capital lease obligations 30,831 894 Current portion of reclamation and mine closure 4,183 4,460 111,677 58,515 LONG-TERM LIABILITIES 1 1/4% Convertible Senior Notes due January 2024 180,000 180,000 Reclamation and mine closure 30,629 27,226 Deferred income taxes 573,681 272 Obligations under capital leases 23,661 — Other long-term liabilities 4,679 2,619 812,650 210,117 COMMITMENTS AND CONTINGENCIES (See Notes I, J, M, N, O, P, Q and S) SHAREHOLDERS’ EQUITY Common Stock, par value $1.00 per share; authorized 750,000,000 shares in 2007 and 500,000,000 in 2006, issued 551,512,230 and 279,054,344 shares in 2007 and 2006 (1,059,211 shares held in treasury) 551,512 279,054 Additional paid-in capital 1,607,737 777,798 Accumulated deficit (419,331 ) (463,221 ) Shares held in treasury (13,190 ) (13,190 ) Accumulated other comprehensive income 639 553 1,727,367 580,994 TOTAL LIABILITIES AND SHAREHOLDERS’ EQUITY $ 2,651,694 $ 849,626
The accompanying notes are an integral part of these consolidated financial statements.
F-6
COEUR D’ALENE MINES CORPORATION AND SUBSIDIARIES
CONSOLIDATED STATEMENTS OF OPERATIONS AND COMPREHENSIVE INCOME (LOSS)Years Ended December 31, 2006
2005
2004
(In Thousands, except per share data)
REVENUES Sales of metal $ 216,573 $ 156,284 $ 109,047
COSTS AND EXPENSES Production costs applicable to sales 92,378 88,232 63,715 Depreciation and depletion 26,772 18,889 16,833 Administrative and general 19,369 20,624 17,499 Exploration 9,474 10,553 8,031 Pre-development -- 6,057 11,449 Litigation settlement 2,365 1,600 --
Total cost and expenses 150,358 145,955 117,527
OTHER INCOME AND EXPENSE Interest and other income 18,654 8,385 3,165 Interest expense, net of capitalized interest (1,224 ) (2,485 ) (2,831 ) Merger expenses -- -- (15,675 )
Total other income and expense 17,430 5,900 (15,341 )
Income (loss) from continuing operations before income taxes 83,645 16,229 (23,821 ) Income tax (provision) benefit (8,226 ) (1,483 ) 5,785
Income (loss) from continuing operations 75,419 14,746 (18,036 ) Income (loss) from discontinued operations, net of income taxes 1,935 (4,195 ) 1,178 Gain on sale of net assets of discontinued operations, net of income taxes 11,132 -- --
NET INCOME (LOSS) 88,486 10,551 (16,858 ) Other comprehensive income (loss) 2,391 447 (908 )
COMPREHENSIVE INCOME (LOSS) $ 90,877 $ 10,998 $ (17,766 )
BASIC AND DILUTED INCOME (LOSS) PER SHARE Basic income (loss) per share: Income (loss) from continuing operations $ 0.28 $ 0.06 $ (0.08 ) Income (loss) from discontinued operations 0.05 (0.02 ) --
Net income (loss) $ 0.33 $ 0.04 $ (0.08 )
Diluted income (loss) per share: Income (loss) from continuing operations $ 0.26 $ 0.06 $ (0.08 ) Income (loss) from discontinued operations 0.04 (0.02 ) --
Net income (loss) $ 0.30 $ 0.04 $ (0.08 )
Weighted average number of shares of common stock Basic 271,357 242,915 215,969 Diluted 296,082 243,683 215,969
Years Ended December 31, 2007 2006 2005 (In thousands, except per share data) REVENUES Sales of metal $ 215,319 $ 216,573 $ 156,284 COSTS AND EXPENSES Production costs applicable to sales 117,025 92,378 88,232 Depreciation and depletion 20,984 26,772 18,889 Administrative and general 23,875 19,369 20,624 Exploration 11,941 9,474 10,553 Litigation settlements 507 2,365 1,600 Pre-development — — 6,057 Total cost and expenses 174,332 150,358 145,955 Operating income 40,987 66,215 10,329 OTHER INCOME AND EXPENSE Interest and other income 18,195 18,654 8,385 Interest expense, net of capitalized interest (365 ) (1,224 ) (2,485 ) Total other income and expense 17,830 17,430 5,900 Income from continuing operations before income taxes 58,817 83,645 16,229 Income tax provision (14,927 ) (8,226 ) (1,483 ) Income from continuing operations 43,890 75,419 14,746 Income (loss) from discontinued operations, net of income taxes — 1,935 (4,195 ) Gain on sale of net assets of discontinued operations, net of income taxes — 11,132 — NET INCOME 43,890 88,486 10,551 Other comprehensive income 86 2,391 447 COMPREHENSIVE INCOME $ 43,976 $ 90,877 $ 10,998 BASIC AND DILUTED INCOME (LOSS) PER SHARE Basic income per share: Income from continuing operations $ 0.15 $ 0.28 $ 0.06 Income (loss) from discontinued operations — 0.05 (0.02 ) Net income $ 0.15 $ 0.33 $ 0.04 Diluted income per share: Income from continuing operations $ 0.14 $ 0.26 $ 0.06 Income (loss) from discontinued operations — 0.04 (0.02 ) Net income $ 0.14 $ 0.30 $ 0.04 Weighted average number of shares of common stock Basic 285,972 271,357 242,915 Diluted 310,524 296,082 243,683
The accompanying notes are an integral part of these consolidated financial statements.F-7
COEUR D’ALENE MINES CORPORATION AND SUBSIDIARIES
CONSOLIDATED STATEMENTS OF CHANGES IN SHAREHOLDERS’ EQUITYFor Years Ended December 31, 2006, 2005 and 2004
(In thousands except share data) Common
Stock
Shares
Common
Stock
$1 Par
Additional
Paid-In
Capital
Accumulated
Deficit
Shares
Held in
Treasury
Accumulated
Other
Comprehensive
Income (Loss)
Total
Balances at January 1, 2004 214,195 $ 214,195 $ 542,900 $ (545,050 ) $ (13,190 ) $ (1,377 ) $ 197,478 Net loss -- -- -- (16,858 ) -- -- (16,858 ) Unrealized losses on short-term investments and marketable securities -- -- -- -- -- (347 ) (347 ) Change in fair value of derivative hedging instruments, net of settlements -- -- -- -- -- (130 ) (130 ) Excess additional pension liability over unrecognized prior service cost -- -- -- -- -- (431 ) (431 ) Issuance of common stock 26,625 26,625 86,475 -- -- -- 113,100 Common stock issued under long-term incentive plans 208 208 432 -- -- -- 640 Other -- -- 2 -- -- -- 2
Balances at December 31, 2004 241,028 $ 241,028 $ 629,809 $ (561,908 ) $ (13,190 ) $ (2,285 ) $ 293,454 Net income -- -- -- 10,551 -- -- 10,551 Unrealized gain on short-term investments and marketable securities -- -- -- -- -- 853 853 Change in fair value of derivative hedging instruments, net of settlements -- -- -- -- -- (171 ) (171 ) Excess additional pension liability over unrecognized prior service cost -- -- -- -- -- (237 ) (237 ) Issuance of common stock 9,863 9,863 26,351 -- -- -- 36,214 Common stock issued under long-term incentive plans 70 70 817 -- -- -- 887 Foreign currency translation -- -- -- -- -- 2 2
Balances at December 31, 2005 250,961 $ 250,961 $ 656,977 $ (551,357 ) $ (13,190 ) $ (1,838 ) $ 341,553 Net income -- -- -- 88,486 -- -- 88,486 Cumulative effect of accounting change -- -- -- (350 ) -- -- (350 ) Unrealized gain on short-term investments and marketable securities -- -- -- -- -- 63 63 Change in fair value of cash flow hedging instruments, net of settlements -- -- -- -- -- 111 111 Elimination of excess additional pension liability over unrecognized prior service cost attributable to discontinued operations -- -- -- -- -- 2,219 2,219 Issuance of common stock 27,600 27,600 118,631 -- -- -- 146,231 Common stock issued under long-term incentive plans 493 493 2,190 -- -- -- 2,683 Foreign currency translation -- -- -- -- -- (2 ) (2 )
Balances at December 31, 2006 279,054 $ 279,054 $ 777,798 $ (463,221 ) $ (13,190 ) $ 553 $ 580,994
Years Ended December 31, 2007, 2006 and 2005 (In thousands, except share data) Accumulated Common Common Additional Shares Other Stock Stock Paid-In Accumulated Held in Comprehensive Shares $1 Par Capital Deficit Treasury Income (Loss) Total Balances at January 1, 2005 241,028 $ 241,028 $ 629,809 $ (561,908 ) $ (13,190 ) $ (2,285 ) $ 293,454 Net income — — — 10,551 — — 10,551 Unrealized gain on short-term investments and marketable securities — — — — — 853 853 Change in fair value of derivative hedging instruments, net of settlements — — — — — (171 ) (171 ) Excess additional pension liability over unrecognized prior service cost — — — — — (237 ) (237 ) Issuance of common stock 9,863 9,863 26,351 — — — 36,214 Common stock issued under long-term incentive plans, net 70 70 817 — — — 887 Foreign currency translation — — — — — 2 2 Balances at December 31, 2005 250,961 $ 250,961 $ 656,977 $ (551,357 ) $ (13,190 ) $ (1,838 ) $ 341,553 Net income — — — 88,486 — — 88,486 Cumulative effect of accounting change — — — (350 ) — — (350 ) Unrealized gain on short-term investments and marketable securities — — — — — 63 63 Change in fair value of cash flow hedging instruments, net of settlements — — — — — 111 111 Elimination of excess additional pension liability over unrecognized prior service cost attributable to discontinued operations — — — — — 2,219 2,219 Issuance of common stock 27,600 27,600 118,631 — — — 146,231 Common stock issued under long-term incentive plans, net 493 493 2,190 — — — 2,683 Foreign currency translation — — — — — (2 ) (2 ) Balances at December 31, 2006 279,054 $ 279,054 $ 777,798 $ (463,221 ) $ (13,190 ) $ 553 $ 580,994 Net income — — — 43,890 — — 43,890 Unrealized gain on short-term investments and marketable securities — — — — — 103 103 Change in fair value of cash flow hedging instruments, net of settlements — — — — — (23 ) (23 ) Issuance of common stock in Bolnisi/Palmarejo merger 271,969 271,969 826,061 — — — 1,098,030 Common stock issued under long-term incentive plans, net 489 489 3,878 — — — 4,367 Foreign currency translation — — — — — 6 6 Balances at December 31, 2007 551,512 $ 551,512 $ 1,607,737 $ (419,331 ) $ (13,190 ) $ 639 $ 1,727,367
The accompanying notes are an integral part of these consolidated financial statements.
F-8
COEUR D’ALENE MINES CORPORATION AND SUBSIDIARIES
CONSOLIDATED STATEMENTS OF CASH FLOWSYears Ended December 31, 2006
2005
2004
(In Thousands)
CASH FLOWS FROM OPERATING ACTIVITIES: Net income (loss) $ 88,486 $ 10,551 $ (16,858 ) Add (deduct) non-cash items: Depreciation and depletion 26,772 18,889 16,833 Deferred taxes (2,902 ) 1,629 (4,403 ) Unrealized (gain) loss on embedded derivatives 1,166 (2,052 ) (82 ) Share-based compensation 2,218 1,237 1,137 Amortization of debt issuance costs 303 303 408 Amortization of premium and/or discount on short-term investments, net 24 790 1,527 Other non-cash charges (313 ) 250 (16 ) Changes in operating assets and liabilities: Receivables (14,781 ) (19,571 ) (2,014 ) Prepaid expenses and other (599 ) (183 ) (517 ) Inventories (15,555 ) (8,308 ) (17,492 ) Accounts payable and accrued liabilities 17,686 2,349 (167 ) Discontinued operations (11,275 ) 792 3,062
CASH PROVIDED BY (USED IN) OPERATING ACTIVITIES 91,230 6,676 (18,582 )
CASH FLOWS FROM INVESTING ACTIVITIES: Purchases of short-term investments (317,743 ) (212,252 ) (343,019 ) Proceeds from sales of short-term investments 430,292 277,021 142,128 Capital expenditures (147,998 ) (113,290 ) (8,363 ) Other (328 ) 103 372 Discontinued operations 15,446 (3,346 ) (2,041 )
CASH USED IN INVESTING ACTIVITIES (20,331 ) (51,764 ) (210,923 )
CASH FLOWS FROM FINANCING ACTIVITIES: Repayment of long-term debt -- -- (9,561 ) Proceeds from issuance of common stock 154,560 36,493 119,803 Payments of common stock issuance costs (8,329 ) (557 ) (6,702 ) Proceeds from issuance of notes -- -- 180,000 Payments of debt issuance costs -- -- (6,089 ) Borrowings from bank on working capital facility -- -- 6,056 Payments to bank on working capital facility -- -- (8,422 ) Other (1,354 ) (1,170 ) (2,055 )
CASH PROVIDED BY FINANCING ACTIVITIES: 144,877 34,766 273,030
INCREASE (DECREASE) IN CASH AND CASH EQUIVALENTS 215,776 (10,322 ) 43,525
Cash and cash equivalents at beginning of period 54,896 65,218 21,693
Cash and cash equivalents at end of period 270,672 $ 54,896 $ 65,218
SUPPLEMENTAL DISCLOSURES OF CASH FLOW INFORMATION Cash paid for: Interest $ 2,334 $ 2,280 $ 1,572 Taxes $ 814 -- --
Years Ended December 31, 2007 2006 2005 (In thousands) CASH FLOWS FROM OPERATING ACTIVITIES: Net income $ 43,890 $ 88,486 $ 10,551 Add (deduct) non-cash items: Depreciation and depletion 20,984 26,772 18,889 Deferred taxes 2,154 (2,902 ) 1,629 Unrealized (gain) loss on embedded derivatives (1,462 ) 1,166 (2,052 ) Share-based compensation 3,448 2,218 1,237 Amortization of debt issuance costs 303 303 303 Amortization of premium and/or discount on short-term investments, net (6 ) 24 790 Gain on asset retirement obligation (871 ) (41 ) (215 ) Gain on foreign currency transactions (433 ) (147 ) 170 (Gain) loss of sales of assets (1,947 ) (237 ) 90 Other non-cash charges 616 112 205 Changes in operating assets and liabilities: Receivables (24,021 ) (14,781 ) (19,571 ) Prepaid expenses and other (4,065 ) (599 ) (183 ) Inventories 13,172 (15,555 ) (8,308 ) Accounts payable and accrued liabilities (11,705 ) 17,686 2,349 Discontinued operations — (11,275 ) 792 CASH PROVIDED BY OPERATING ACTIVITIES 40,057 91,230 6,676 CASH FLOWS FROM INVESTING ACTIVITIES: Purchases of short-term investments (167,346 ) (317,743 ) (212,252 ) Proceeds from sales of short-term investments 183,121 430,292 277,021 Capital expenditures (216,978 ) (147,998 ) (113,290 ) Merger related costs (13,727 ) — — Proceeds from sale of assets 3,270 314 289 Other 187 (642 ) (186 ) Discontinued operations — 15,446 (3,346 ) CASH USED IN INVESTING ACTIVITIES (211,473 ) (20,331 ) (51,764 ) CASH FLOWS FROM FINANCING ACTIVITIES: Proceeds from short-term borrowings 1,698 — — Repayment of long-term debt and capital leases (1,360 ) (1,448 ) (685 ) Proceeds from issuance of common stock — 154,560 36,493 Payments of common stock issuance costs (726 ) (8,329 ) (557 ) Other (197 ) 94 (485 ) CASH PROVIDED BY FINANCING ACTIVITIES: (585 ) 144,877 34,766 INCREASE (DECREASE) IN CASH AND CASH EQUIVALENTS (172,001 ) 215,776 (10,322 ) Cash and cash equivalents at beginning of period 270,672 54,896 65,218 Cash and cash equivalents at end of period $ 98,671 $ 270,672 $ 54,896 SUPPLEMENTAL DISCLOSURES OF CASH FLOW INFORMATION Cash paid for: Interest $ 2,283 $ 2,334 $ 2,280 Income taxes $ 11,994 $ 814 —
The accompanying notes are an integral part of these consolidated financial statements.F-9
COEUR D’ALENE MINES CORPORATION AND SUBSIDIARIES
NOTES TO CONSOLIDATED FINANCIAL STATEMENTS(Dollar amounts in thousands, unless otherwise specified)NOTE A — BUSINESS OF COEUR D’ALENE MINES CORPORATION Coeur d’Alene Mines Corporation and its subsidiaries (collectively, “Coeur” or the “Company”) is principally engaged in silver and gold mining and related activities including exploration, development, and mining at its properties located in the United States (Nevada and Alaska), South America (Chile, Argentina and Bolivia) and, Australia (New South Wales), Mexico (Chihuahua) and Africa (Tanzania).NOTE B — SUMMARY OF SIGNIFICANT ACCOUNTING POLICIES Principles of Consolidation: The consolidated financial statements include the wholly-owned subsidiaries of the Company, the most significant of which are Coeur Rochester, Inc., Coeur Silver Valley, Inc., Coeur Alaska, Inc., CDE Cerro Bayo Ltd., Coeur Argentina, CDE Australia and EmpressaEmpresa Minera Manquiri S.A., Bolnisi Gold NL and Palmarejo Silver and Gold Corporation. The consolidated financial statements also include all entities in which voting control of more than 50% is held by the Company. The Company has no investments in entities in which it has greater than 50% ownership interest accounted for using the equity method. Intercompany balances and transactions have been eliminated in consolidation. Investments in corporate joint ventures where the Company has ownership of 50% or less and funds its proportionate share of expenses are accounted for under the equity method. The Company has no investments in entities in which it has a greater than 20% ownership interest accounted for using the cost method. Revenue Recognition: Pursuant to guidance in Staff Accounting Bulletin (“SAB”) No. 104, “Revenue Recognition for Financial Statements”, revenue is recognized when persuasive evidence of an arrangement exists, delivery has occurred, the price is fixed or determinable, no obligations remain and collectibilitycollectability is probable. The passing of title to the customer is based on the terms of the sales contract. Product pricing is determined at the point revenue is recognized by reference to active and freely traded commodity markets, for example the London Bullion Market for both gold and silver, in an identical form to the product sold. Under our concentrate sales contracts with third-party smelters, final gold and silver prices are set on a specified future quotational period, typically one to three months, after the shipment date based on market metal prices. Revenues are recorded under these contracts at the time title passes to the buyer based on the forward price for the expected settlement period. The contracts, in general, provide for a provisional payment based upon provisional assays and quoted metal prices. Final settlement is based on the average applicable price for a specified future period, and generally occurs from three to six months after shipment. Final sales are settled using smelter weights, settlement assays (average of assays exchanged and/or umpire assay results) and are priced as specified in the smelter contract. The Company’s provisionally priced sales contain an embedded derivative that is required to be separated from the host contract for accounting purposes. The host contract is the receivable from the sale of concentrates measured at the forward price at the time of sale. The embedded derivative does not qualify for hedge accounting. The embedded derivative is recorded as a derivative asset, in prepaid expenses and other assets or as a derivative liability in accrued liabilities and other on the balance sheet and is adjusted to fair value through revenue each period until the date of final gold and silver settlement. The form of the material being sold, after deduction for smelting and refining is in an identical form to that sold on the London Bullion Market. The form of the product is metal in flotation concentrate, which is the final process for which the Company is responsible.F-10
The effects of forward sales contracts are reflected in revenue at the date the related precious metals are delivered or the contracts expire. Third party smelting and refining costs of $8.4 million, $9.1 million and $6.1 million in 2007, 2006 and $3.3 million in 2006, 2005, and 2004, respectively, are recorded as a reduction of revenue. At December 31, 2007, the Company had outstanding provisionally priced sales of $61.2 million consisting of 3.3 million ounces of silver and 20,775 ounces of gold, which had a fair value of approximately $63.8 million including the embedded derivative. For each one cent per ounce change in realized silver price, revenue would vary (plus or minus) approximately $33,300 and for each one dollar per ounce change in realized gold price, revenue would vary (plus or minus) approximately $20,800. At December 31, 2006, the Company had outstanding provisionally priced sales of $74.5 million, consisting of 4.6 million ounces of silver and 29,577 ounces of gold. For each one cent per ounce change in realized silver price, revenue would vary (plus or minus) approximately $45,700 and for each one dollar per ounce change in realized gold price, revenue would vary (plus or minus) approximately $29,600. At December 31, 2005, the Company had outstanding provisionally priced sales of $47.0 million, consisting of 3.5 million ounces of silver and 40,000 ounces of gold. For each one cent per ounce change in realized silver price, revenue would vary (plus or minus) approximately $35,400 and for each one dollar per ounce change in realized gold price, revenue would vary (plus or minus) approximately $40,000. Cash and Cash Equivalents: Cash and cash equivalents include all highly-liquid investments with a maturity of three months or less at the date of purchase. The Company minimizes its credit risk by investing its cash and cash equivalents with major international banks and financial institutions located principally in the United States and Chile with a minimum credit rating of A1 as defined by Standard & Poor’s. The Company’s management believes that no concentration of credit risk exists with respect to the investment of its cash and cash equivalents. Short-term Investments: Short-term investments principally consist of highly-liquid United States, foreign government and corporate securities and investment-grade auction rate securities, all classified as available-for-sale and reported at fair value with maturities that could range from three months to forty years. Unrealized gains and losses on these investments are recorded in accumulated other comprehensive lossincome as a separate component of shareholders’ equity. Any decline in market value considered to be other than temporary is recognized in determining net income/loss. Realized gains and losses from the sale of these investments are included in determining net income/loss. The Company maintains a pledge of collateral agreement to reserve $1.0 million against the investment portfolio to cover credit exposure related to ACH transactions. Prior to December 31, 2006, the Company classified its auction rate securities as cash and cash equivalents because the securities were highly liquid and the periods between interest rate resets generally did not exceed 90 days. During the fourth quarter of 2006, the Company determined that, pursuant to SFAS 95, “Statement of Cash Flows”, its auction securities cannot be classified as cash equivalents because their contractual maturities exceed 90 days. The Company classified its auction rate securities as of December 31, 2006 as short term investments.
The Company also corrected the classification in its 2005 and 2004 financial statement presentation by reclassifying $159.7 million and $207.9 million, respectively, of auction rate securities as of December 31, 2005 and December 31, 2004 from cash and cash equivalents to short-term investments. As a result, the following table shows the amounts, as originally presented in the Company’s Form 10-K, for the years ended December 31, 2005 and December 31, 2004 and the corrected 2005 and 2004 amounts as presented in its Form 10-K for the year ended December 31, 2006. This reclassification had no effect on total current assets, stockholders’ equity, net income (loss), net income (loss) per share or on cash provided by operating activities.
For the year ended December 31, 2005 As Previously
Reported
Adjustment
Corrected
(In Thousands) Cash and Cash Equivalents $ 214,616 $ (159,720 ) $ 54,896 Short-term Investments 25,726 159,720 185,446 Net Cash Used in Investing Activities (99,894 ) 48,130 (51,764 ) Decrease in Cash and Cash Equivalents (58,452 ) 48,130 (10,322 )
F-11
For the year ended December 31, 2004 As Previously
Reported
Adjustment
Corrected
(In Thousands) Cash and Cash Equivalents $ 273,068 $ (207,850 ) $ 65,218 Short-term Investments 48,993 207,850 256,843 Net Cash Used in Investing Activities (43,787 ) (167,136 ) (210,923 ) Decrease in Cash and Cash Equivalents 210,661 (167,136 ) 43,525
$66.7$50.9 million as of December 31, 2006.2007. Of this amount, $31.3$25.9 million is reported as a current asset and $35.4$25.0 million is reported as a non-current asset. The distinction between current and non-current is based upon the expected length of time necessary for the leaching process to remove the metals from the broken ore. The historical cost of the metal that is expected to be extracted within twelve months is classified as current and the historical cost of metals contained within the broken ore that will be extracted beyond twelve months is classified as non-current. Inventories of ore on leach pad are valued based on actual production costs incurred to produce and place ore on the leach pad, adjusted for effects on monthly production of costs of abnormal production levels, less costs allocated to minerals recovered through the leach process.F-11
The estimate of both the ultimate recovery expected over time and the quantity of metal that may be extracted relative to the time the leach process occurs requires the use of estimates which are inherently inaccurate since they rely upon laboratory testwork. Testwork consists of 60 day leach columns from which the Company projects metal recoveries up to five years in the future. The quantities of metal contained in the ore are based upon actual weights and assay analysis. The rate at which the leach process extracts gold and silver from the crushed ore is based upon laboratory column tests and actual experience occurring over approximately nineteen years of leach pad operations at the Rochester Mine. The assumptions used by the Company to measure metal content during each stage of the inventory conversion process includes estimated recovery rates based on laboratory testing and assaying. The Company periodically reviews its estimates compared to actual experience and revises its estimates when appropriate. The length of time necessary to achieve ultimate recoveries for silver and gold is currently estimated between 5 and 10 years.F-12
In August 2007, the Company terminated mining and crushing operations at the Rochester mine as ore reserves were fully mined. Residual heap leach activities are expected to continue through 2011.
Metal and Other Inventory: Inventories include concentrate ore, dorè, ore in stockpiles and operating materials and supplies. The classification of inventory is determined by the stage at which the ore is in the production process. Inventories of ore in stock piles are sampled for gold and silver content and are valued based on the lower of actual costs incurred or estimated net realizable value based upon the period ending prices of gold and silver. Material that does not contain a minimum quantity of gold and silver to cover estimated processing expense to recover the contained gold and silver is not classified as inventory and is assigned no value. All inventories are stated at the lower of cost or market, with cost being determined using a weighted average cost method. Concentrate and dorè inventory includes product at the mine site and product held by refineries and are also valued at lower of cost or market value. Metal inventory costs include direct labor, materials, depreciation, depletion and amortization as well as administrative overhead costs relating to mining activities. Property, Plant, and Equipment: Expenditures for new facilities, capital leases, new assets or expenditures that extend the useful lives of existing facilities are capitalized and depreciated using the straight-line method at rates sufficient to depreciate such costs over the shorter of estimated productive lives of such facilities or the useful life of the individual assets. Productive lives range from 7 to 31 years for buildings and improvements, 3 to 13 years for machinery and equipment and 3 to 7 years for furniture and fixtures. Certain mining equipment is depreciated using the units-of-production method based upon estimated total proven and probable reserves. Maintenance and repairs are expensed as incurred. Operational Mining Properties and Mine Development: Costs incurred to develop new properties are capitalized as incurred, where it has been determined that the property can be economically developed. At the Company’s surface mines, these costs include costs to further delineate the ore body. At the Company’s underground mines, these costs include the cost of building access ways, shaft sinking and access, lateral development, drift development, ramps and infrastructure development. All such costs are amortized using the units of production method over the estimated life of the ore body based on recoverable ounces to be mined from proven and probable reserves. Interest expense allocable to the cost of developing mining properties and to construct new facilities is capitalized until assets are ready for their intended use. Gains or losses from sales or retirements of assets are included in other income or expense. Costs incurred during the start-up phase of a mine are expensed as incurred. Ongoing mining expenditures on producing properties are charged against earnings as incurred. Major development expenditures incurred to increase production or extend the life of the mine are capitalized. Mineral exploration costs are expensed as incurred. Mineral Interests: Significant payments related to the acquisition of the land and mineral rights are capitalized as incurred. Prior to acquiring such land or mineral rights, the Company generally makes a preliminary evaluation to determine that the property has significant potential to develop an economic ore body. The time between initial acquisition and full evaluation of a property’s potential is variable and is determined by many factors including: location relative to existing infrastructure, the property’s stage of development, geological controls and metal prices. If a mineableminable ore body is discovered, such costs are amortized when production begins using the units-of-production method based on recoverable ounces to be mined from proven and probable reserves. If no mineableminable ore body is discovered, such costs are expensed in the period in which it is determined the property has no future economic value.F-12
Asset Impairment: The Company follows Statement of Financial Accounting Standard (“SFAS”) No. 144, “Accounting for the Impairment or Disposal of Long-Lived Assets,” to evaluate the recoverability of its assets. Management reviews and evaluates its long-lived assets for impairment when events and changes in circumstances indicate that the related carrying amounts of its assets may not be recoverable. Impairment is considered to exist if total estimated future cash flows or probability-weighted cash flows on an undiscounted basis, are less than the carrying amount of the assets, including property plant and equipment, mineral property, development property, and any deferred costs such as deferred stripping. An impairment loss is measured and recorded based on the difference between book value and discounted estimated future cash flows or the application of an expected present value technique to estimate fair value in the absence of a market price. Future cash flows include estimates of recoverable ounces, gold and silver prices (considering current and historical prices, price trends and related factors), production levels and capital, all based on life-of-mine plans and projections. Assumptions underlying future cash flow estimates are subject to risks and uncertainties. If the assets are impaired, a calculation of fair value is performed and if the fair value is lower than the carrying value of the assets, the assets are reduced to their fair market value. Any differences between significant assumptions and market conditions and/or the Company’s operating performance could have a material effect on the Company’s determination of ore reserves, or its ability to recover the carrying amounts of its long-lived assets resulting in impairment charges. In estimating future cash flows, assets are grouped at the lowest level for which there are identifiable cash flows that are largely independent of cash flows from other asset groups. Generally, in estimating future cash flows, all assets are grouped at a particular mine for which there is identifiable cash flow.F-13
Restricted Cash and Cash Equivalents: The Company, under the terms of its lease, self insurance, and bonding agreements with certain banks, lending institutions and regulatory agencies, is required to collateralize certain portions of the Company’s obligations. The Company has collateralized these obligations by assigning certificates of deposit that have maturity dates ranging from three months to a year, to the respective institutions or agency. At December 31, 20062007 and December 31, 2005,2006, the Company held certificates of deposit and cash under these agreements of $19.5$25.8 million and $16.9$23.5 million, respectively, restricted for this purpose. The ultimate timing for the release of the collateralized amounts is dependent on the timing and closure of each mine. In order to release the collateral, the Company must seek approval from certain government agencies responsible for monitoring the mine closure status. Collateral could also be released to the extent the Company was able to secure alternative financial assurance satisfactory to the regulatory agencies. The Company believes there is a reasonable probability that the collateral will remain in place beyond a twelve-month period and has therefore classified these investments as long-term. Deferred Stripping Costs: Effective January 1, 2006, the Company adopted Emerging Issues Task Force (“EITF”) Issue No. 04-06, “Accounting for Stripping Costs Incurred during Production in the Mining Industry.” EITF Issue No. 04-06 addresses the accounting for stripping costs incurred during the production phase of a mine and refers to these costs as variable production costs that should be included as a component of inventory to be recognized in costs applicable to sales in the same period as the revenue from the sale of inventory. The consensus requires application through recognition of a cumulative effect adjustment to opening retained earnings in the period of adoption, with no charge to current earnings for prior periods. The Company recorded a charge of approximately $0.4 million to retained earnings at January 1, 2006 to write off previously capitalized deferred stripping costs, as the cumulative effect of a change in accounting method.F-13
Reclamation and Remediation Costs: The Company follows SFAS No. 143, “Accounting for Asset Retirement Obligations”, which addresses financial accounting and reporting for obligations associated with the retirement of tangible long-lived assets and the associated asset retirement costs. The standard applies to legal obligations associated with the retirement of long-lived assets that result from the acquisition, construction, development and normal use of the asset. SFAS No. 143 requires that the fair value of a liability for an asset retirement obligation be recognized in the period in which it is incurred if a reasonable estimate of fair value can be made. The fair value of the liability is added to the carrying amount of the associated asset and this additional carrying amount is depreciated over the life of the asset. An accretion cost, representing the increase over time in the present value of the liability, is recorded each period in depreciation, depletion and amortization expense. As reclamation work is performed or liabilities are otherwise settled, the recorded amount of the liability is reduced. Future remediation costs for inactive mines are accrued based on management’s best estimate at the end of each period of the undiscounted costs expected to be incurred at the site. Such cost estimates include, where applicable, ongoing care and maintenance and monitoring costs. Changes in estimates are reflected in earnings in the period an estimate is revised.F-14
Foreign Currency: Substantially all assets and liabilities of foreign subsidiaries are translated at exchange rates in effect at the end of each period. Revenues and expenses are translated at the average exchange rate for the period. Foreign currency transaction gains and losses are included in the determination of net income. Derivative Financial Instruments: The Company accounts for derivative financial instruments in accordance with SFAS No. 133, “Accounting for Derivative Instruments and Hedging Activities,” (as amended by SFAS No. 137) and SFAS No. 138, “Accounting for Certain Derivative Instruments and Certain Hedging Activities.” These Statements require recognition of all derivatives as either assets or liabilities on the balance sheet and measurement of those instruments at fair value. Appropriate accounting for changes in the fair value of derivatives held is dependent on whether the derivative instrument is designated and qualifies as an accounting hedge and on the classification of the hedge transaction. For derivative instruments that are designated and qualify as cash flow hedges, the effective portions of changes in fair value of the derivative are recorded in other comprehensive income, (loss), and are recognized in the Consolidated Statement of Consolidated Operations when the hedged item affects net income (loss) for the period. Ineffective portions of changes in the fair value of cash flow hedges are recognized currently in earnings. Refer to Note NO – Derivative Financial Instruments and Fair Value of Financial Instruments. Stock-based Compensation Plans: Effective January 1, 2006, the Company began recording compensation expense associated with awards of equity instruments in accordance with Statement of Financial Accounting Standards (“SFAS”)SFAS No. 123(R), “Share-Based Payment”. Prior to January 1, 2006, the Company accounted for awards of equity instruments according to the provisions of SFAS No. 123, “Accounting for Stock-Based Compensation,” and related interpretations, and therefore no related compensation expense was recorded for awards granted with no intrinsic value. The Company adopted the modified prospective transition method provided for under SFAS No. 123(R), and, consequently, has not retroactively adjusted results from prior periods. Under this transition method, compensation cost associated with awards of equity instruments recognized during 2006 includes: 1) amortization related to the remaining unvested portion of all awards granted for the fiscal years 1995 to 2005, based on the grant date fair value, estimated in accordance with the original provisions of SFAS No. 123, “Accounting for Stock-Based Compensation”; and 2) amortization related to all equity instrument awards granted subsequent to December 31, 2005, based on the grant-date fair value estimated in accordance with the provisions of SFAS No. 123(R). The compensation costs are included in administrative and general expenses, productions costs and the cost of self-constructed property, plant and equipment as deemed appropriate.F-14
The compensation expense recognized in the Company’s consolidated financial statements for the years ended December 31, 2006, 2005 and 2004 for awards of equity instruments was $2.4 million, $1.2 million and $1.1 million, respectively. As of December 31, 2006, there was $1.8 million of total unrecognized compensation cost (net of estimated forfeitures) related to unvested stock options, restricted stock grants and performance share grants which is expected to be recognized over a weighted-average vesting period of 2.0 years.
The Company continues to estimate the fair value of each stock option award on the date of grant using the Black-Scholes option valuation model. The Company now estimates forfeitures of stock based awards based on historical data and adjusts the forfeiture rate periodically. The adjustment of the forfeiture rate will result in a cumulative adjustment in the period the forfeiture estimate is changed. During the year ended December 31, 2006, the Company recorded an adjustment of $0.1 million to reduce compensation expense for forfeited awards. Income Taxes: The Company computes income taxes in accordance with SFAS No. 109, “Accounting for Income Taxes.” SFAS No. 109 requires an asset and liability approach which results in the recognition of deferred tax liabilities and assets for the expected future tax consequences or benefits of temporary differences between the financial reporting basis and the tax basis of assets and liabilities, as well as operating loss and tax credit carryforwards, using enacted tax rates in effect in the years in which the differences are expected to reverse.F-15
In assessing the realizability of deferred tax assets, management considers whether it is more likely than not that some portion or all of theits deferred tax assets will not be realized. Management considers the scheduled reversal of deferred tax liabilities, projected future taxable income and tax planning strategies in making this assessment. A valuation allowance has been provided for the portion of the Company’s net deferred tax assets for which it is more likely than not that they will not be realized. The Company and its subsidiaries are subject to U.S. federal income tax as well as income tax of multiple state and foreign jurisdictions. The Company has substantially concluded all U.S. federal income tax matters for years through 1999. Federal income tax returns for 2000 through 2006 are subject to examination. The Company’s continuing practice is to recognize interest and/or penalties related to income tax matters in income tax expense. There were no significant accrued interest or penalties at December 31, 2007. Comprehensive Income (Loss):Income: Comprehensive income (loss) includes net income (loss) as well as changes in stockholders’ equity that result from transactions and events other than those with stockholders. Items of comprehensive income (loss) include the following:2006
2005
2004
Net income (loss) $ 88,486 $ 10,551 $ (16,858 ) Unrealized gain (loss) on marketable securities 63 853 (347 ) Change in fair value of cash flow hedges, net of 111 (169 ) (130 ) settlements Minimum pension liabilities 2,219 (237 ) (431 ) Other (2 ) -- --
$ 90,877 $ 10,998 $ (17,766 )
following (in thousands):
2007 2006 2005 Net income $ 43,890 $ 88,486 $ 10,551 Unrealized gain on short-term investments and marketable securities 103 63 853 Change in fair value of cash flow hedges, net of settlements (23 ) 111 (169 ) Minimum pension liabilities — 2,219 (237 ) Foreign currency translation 6 (2 ) — $ 43,976 $ 90,877 $ 10,998
Net Income (Loss) Per Share: The Company follows SFAS No. 128, “Earnings Per Share,” which requires the presentation of basic and diluted earnings per share. Basic earnings per share is computed by dividing net income (loss) available to common shareholders by the weighted average number of common shares outstanding during each period. Diluted earnings per share reflect the potential dilution that could occur if securities or other contracts to issue common stock were exercised or converted into common stock. The effect of potentially dilutive stock options and debentures outstanding in the years ending December 31, 2007, 2006 2005 and 20042005 are as follows:F-15
For the Year Ended
December 31, 2006
For the Year Ended
December 31, 2005
For the Year Ended
December 31, 2004
(In thousands except for EPS) Income
(Numerator)
Shares
(Denominator)
Per-Share
Amount
Income
(Numerator)
Shares
(Denominator)
Per-Share
Amount
Income
(Numerator)
Shares
(Denominator)
Per-Share
Amount
Basic EPS Income (loss) from continuing operations $ 75,419 271,357 $ 0.28 $ 14,746 242,915 $ 0.06 $ (18,036 ) 215,969 $ (0.08 ) Income (loss) from discontinued operations 13,067 271,357 0.05 (4,195 ) 242,915 (0.02 ) 1,178 215,969 --
Net income (loss) $ 88,486 271,357 $ 0.33 $ 10,551 242,915 $ 0.04 $ (16,858 ) 215,969 $ (0.08 ) Effect of Dilutive Securities Equity awards -- 1,041 -- -- 768 -- -- -- -- 1.25% convertible notes 1,117 23,684 -- -- -- -- -- -- -- Diluted EPS Income (loss) from continuing operations $ 76,536 296,082 0.26 $ 14,746 243,683 $ 0.06 $ (18,036 ) 215,969 $ (0.08 ) Income (loss) from discontinued operations 13,067 296,082 0.04 (4,195 ) 243,683 (0.02 ) 1,178 215,969 --
Net income (loss) $ 89,603 296,082 $ 0.30 $ 10,551 243,683 $ 0.04 $ (16,858 ) 215,969 $ (0.08 )
The following potentially dilutive shares have been excluded from earnings per share calculation as their effect is antidilutive:
December 31, 2006
December 31, 2005
December 31, 2004
Stock options -- -- 1,796,908 1.25% Notes Convertible at $7.06 per share -- 23,684,211 23,684,211
Total potentially dilutive shares -- 23,684,211 25,481,119
F-16
Year Ended Year Ended Year Ended December 31, 2007 December 31, 2006 December 31, 2005 Income Shares Per-Share Income Shares Per-Share Income Shares Per-Share (In thousands except for EPS) (Numerator) (Denominator) Amount (Numerator) (Denominator) Amount (Numerator) (Denominator) Amount Basic EPS Income from continuing operations $ 43,890 285,972 $ 0.15 $ 75,419 271,357 $ 0.28 $ 14,746 242,915 $ 0.06 Income from discontinued operations — 285,972 — 13,067 271,357 0.05 (4,195 ) 242,915 (0.02 ) Net income $ 43,890 285,972 $ 0.15 $ 88,486 271,357 $ 0.33 $ 10,551 242,915 $ 0.04 Effect of Dilutive Securities Equity awards — 868 — 1,041 — 768 1.25% convertible notes 297 23,684 1,117 23,684 — — Diluted EPS Income from continuing operations $ 44,187 310,524 0.14 $ 76,536 296,082 0.26 $ 14,746 243,683 $ 0.06 Income (loss) from discontinued operations — — 13,067 296,082 0.04 (4,195 ) 243,683 (0.02 ) Net income $ 44,187 310,524 $ 0.14 $ 89,603 296,082 $ 0.30 $ 10,551 243,683 $ 0.04
For the years ended 2007, 2006 2005 and 2004,2005, options to purchase 531,112, 322,653 876,192 and -0-876,192 shares of common stock at prices between $4.81 to $8.94, $6.66 to $15.15$15.19 and $3.92 to $17.94, respectively, were not included in the computation of diluted EPS because the exercise price of options was greater than the average market price of the common shares. The options, which expire between 20072008 to 2016,2017, are outstanding at December 31, 2006.2007. Potentially diluting shares totaling 23,684,211 shares attributed to the 1.25% convertible notes have been excluded from the earnings per share calculation for the year ended December 31, 2005 as their effect was anti-dilutive.
Debt Issuance Costs: Costs associated with the issuance of debt are included in other noncurrent assets and are amortized over the term of the related debt. Use of Estimates: The preparation of the Company’s consolidated financial statements in conformity with U.S. generally accepted accounting principles generally accepted in the United States of America(“GAAP”) requires management to make estimates and assumptions that affect the amounts reported in their consolidated financial statements and accompanying notes. The areas requiring the use of management’s estimates and assumptions relate to recoverable ounces from proven and probable reserves that are the basis of future cash flow estimates and units-of-production depreciation and amortization calculations; useful lives utilized for depreciation, depletion and amortization of future cash flows for long lived assets; estimates of recoverable gold and silver ounces in ore on leach pad; the amount and timing of reclamation and remediation costs; valuation allowanceallowances for deferred tax assets; and post-employment and other employee benefit liabilities. Reclassifications: Certain reclassifications of prior year balances have been made to conform to the current year presentation. These reclassifications had no impact on the Company’s consolidated financial position, results of operations or cash flows for the periods presented. The most significant reclassifications were to reclassify the balance sheet amounts and the income statement results from historical presentation to assets and liabilities of discontinued operations and toincome (loss) income from discontinued operations in the consolidated statements of operations for all periods presented.the years ended December 31, 2006 and 2005. The consolidated statements of cash flows have been reclassified for discontinued operations for allthe periods presented.ended December 31, 2006 and 2005. In addition, investments in auction rate securities have been reclassified from cash and cash equivalents to short-term investments on the consolidated balance sheet as of December 31, 2005. We also madeand corresponding adjustments were made to the consolidated statements of cash flows for all of the periods presented.ended December 31, 2006 and 2005.
Recent Accounting Pronouncements: In November 2004, FASB issued SFAS No. 151, “Inventory Costs,” which amends the guidance in ARB No. 43, Chapter 4, “Inventory Pricing,” to clarify the accounting for abnormal amounts of idle facility expense, freight, handling costs, and wasted material (spoilage). This Statement now requires that these items be recognized as current-period expenses regardless of whether they meet the criterion of “so abnormal” as previously stated in ARB No. 43, Chapter 5, “Intangible Assets”. In addition, this Statement requires that the allocation of fixed production overhead to costs of conversion be based on the normal capacity of the production facility. SFAS No. 151 is effective for inventory costs incurred during fiscal years beginning after June 15, 2005. The Company has performed a review of the provisions of the Statement and has determined that its current accounting practice is to recognize the costs attibuted to idle facilities as a current-period expense and, therefore adoption in 2006 did not impact the Company’s financial statements. In December 2004,February 2007, the FASB issued Statement No. 159, “The Fair Value Option for Financial Assets and Financial Liabilities” (“SFAS No. 123(R), “Share-Based Payments”, which revised159”). SFAS No. 123, “Accounting for Stock-Based Compensation”159 permits entities to choose to measure many financial instruments and superseded Accounting Principles Board (“APB”) Opinion 25, “Accounting for Stock Issued to Employees” and its related implementation guidance. SFAS No. 123(R) requires measurement and recording in the financial statements of the costs of employee services received in exchange for an award of equity instruments based on the grant-datecertain other items at fair value, with the objective of the award, recognized over the period during which an employee is requiredimproving financial reporting by mitigating volatility in reported earnings caused by measuring related assets and liabilities differently without having to provide services in exchange for such award.apply complex hedge accounting provisions. The Company adopted the provisions of SFAS No. 123(R) on January 1, 2006, using the modified prospective method. Accordingly, compensation expense was recognized for all newly granted awards and awards modified, repurchased, or cancelled after January 1, 2006. Compensation cost for the unvested portion of awards that were outstanding, as of January 1, 2006, is recognized ratably over the remaining vesting period. The compensation cost for the unvested portion of awards is based on the fair value at date of grant, adjusted for forfeitures, as determined pursuant to SFAS No. 123. The actual effect on net income and earnings per share in future periods will vary depending upon the number and fair value of options granted in future years compared to prior years. The adoption resulted in a charge to the Company’s statement of operations of $1.4 million in 2006 and did not impact the Company’s cash flow.
F-17
In March 2005, the Financial Accounting Standards Board (“FASB”) ratified Emerging Issues Task Force (“EITF#148;) Issue No. 04-06, “Accounting for Stripping Costs Incurred during Production in the Mining Industry.#148; EITF Issue No. 04-06 addresses the accounting for stripping costs incurred during the production phase of a mine and refers to these costs as variable production costs that should be included as a component of inventory to be recognized in costs applicable to sales in the same period as the revenue from the sale of inventory. The guidance in EITF Issue No. 04-06 was159 are effective for the Company in 2006. The guidance requires application through recognition of a cumulative effect adjustment to opening retained earnings in the period of adoption.Company’s fiscal year ending December 31, 2008. The Company adoptedis currently evaluating the impact that the adoption of this pronouncement as of January 1, 2006 and recorded a charge of approximately $0.4 million to write off deferred stripping costs, asstatement will have on the cumulative effect of a change in accounting method.
In May 2005, the FASB issued SFAS No. 154, “Accounting Changes and Error Corrections.” SFAS No. 154 established new standards on accounting for changes in accounting principles. SFAS No. 154 requires all such changes to be accounted for by retrospective application to the financial statements of prior periods unless prescribed otherwise or it is impracticable to do so. SFAS No. 154 is effective for accounting changes and error corrections made in fiscal years beginning after December 15, 2005. Adoption of SFAS No. 154 did not have a material impact on ourCompany’s consolidated financial position, results of operations or cash flows.and disclosures.
F-16
In September 2006, the FASB issued Statement No. 157 “Fair Value Measurements” (SFAS 157). SFAS 157 defines fair value, establishes a framework for measuring fair value in generally accepted accounting principles, and expands disclosures about fair value measurements. The provisions of SFAS 157 are effective for the Company’s fiscal year ending December 31, 2008. The Company is currently evaluating the impact of the adoption of this statement on the Company’s consolidated financial position, results of operations and disclosures. In June 2006, the FASB issued Interpretation No. 48, “Accounting for Uncertainty in Income Taxes”, (FIN 48)Taxes, an Interpretation of FASB Statement No. 109, “Accounting for Income Taxes”109” (FIN 48). FIN 48 prescribes a recognition threshold and measurement attribute for the financial statement recognition and measurement of tax positions taken or expected to be taken in a tax return. FIN 48 requires that the Company recognize in its financial statements the impact of a tax position, if that tax position is more likely than not of being sustained on audit, based on the technical merits of the position. FIN 48 also provides guidance on derecognition, classification of interest and penalties, accounting in interim periods and disclosure. The provisions of FIN 48 arewere effective beginning January 1, 2007, with the cumulative effect of the change in accounting principle recorded as an adjustment to the opening balance of retained earnings. Currently, the2007. The adoption of FIN 48 isdid not expected to have a material effect on the Company’s financial position, results of operations or cash flows.F-18
The Company and its subsidiaries are subject to U.S. federal income tax as well as income tax of multiple state and foreign jurisdictions. The Company has substantially concluded all U.S. federal income tax matters for years through 1999. Federal income tax returns for 2000 through 2006 are subject to examination. The Company’s continuing practice is to recognize interest and/or penalties related to income tax matters in income tax expense. There were no significant accrued interest or penalties at December 31, 2007.NOTE C — SHORT-TERM INVESTMENTSACQUISITIONS OF BOLNISI AND MARKETABLE SECURITIES ThePALMAREJO
On December 21, 2007, the Company classifiescompleted its investment securities as available-for-sale securities. Pursuant to SFAS 115, “Accountingacquisition of all the shares of Bolnisi Gold NL (“Bolnisi”) and Palmarejo Gold and Silver Corporation (“Palmarejo”) in exchange for Certain Investmentsa total of approximately 272 million shares of Coeur common stock, a total cash payment of approximately $1.1 million and assumption of liabilities of $0.7 billion. Coeur issued 0.682 shares of Coeur common stock (or, at the election of the Bolnisi shareholder, CHESS Depositary Interests representing Coeur shares) and A$0.004 in Debt and Equity Securities”, such securities are measured at fair market valuecash (or approximately US$1.0 million in the financial statements with unrealized gains or losses recordedaggregate) for each Bolnisi ordinary share, and 2.715 shares of Coeur common stock and C$0.004 in other comprehensive income (loss). Atcash (or approximately US$0.1 million in the time securitiesaggregate) for each Palmarejo common share. The transaction was accounted for as a purchase of assets and not as a business combination since Bolnisi and Palmarejo are sold or otherwise disposed of, gains or losses are includedconsidered to be in net income (loss).the development stage. The total consideration paid for the acquisition was as follows (in thousands): Consideration: Coeur stock issued (271,969,428 shares at $4.04) $ 1,098,757 Cash payments 1,102 Transaction advisory fees and other costs 16,621 Total purchase price 1,116,480 Current liabilities 54,946 Other long-term liabilities 23,642 Deferred income taxes 572,711 Total liabilities assumed 651,299 $ 1,767,779
F-17
The following is a summarysummarizes the estimated fair values of available-for-sale securities:Available-For-Sale Securities
Cost
Gross
Unrealized
Losses
Gross
Unrealized
Gains
Estimated
Fair
Value
As of December 31, 2006 U.S. Corporate $ 65,372 $ -- $ -- $ 65,372 U.S. Government 5,000 -- 1 5,001
Total debt securities 70,372 -- 1 70,373 Equity securities 99 1 622 720
70,471 1 623 71,093
As of December 31, 2005 Auction Rate Securities $ 159,720 $ -- $ -- $ 159,720 U.S. Corporate 23,893 51 -- 23,842 U.S. Government 1,891 7 -- 1,884
Total debt securities 185,504 58 -- 185,446 Equity securities 19 4 615 630
$ 185,523 $ 62 $ 615 $ 186,076
As of December 31, 2004 Auction Rate Securities $ 207,850 $ -- $ -- $ 207,850 U.S. Corporate 18,964 107 1 18,858 U.S. Government 29,062 205 -- 28,857 State/Municipal 1,285 7 -- 1,278
Total debt securities 257,161 319 1 256,843 Equity securities 20 3 17 34
$ 257,181 $ 322 $ 18 $ 256,877
Gross realized gains and losses are basedthe assets acquired on a carrying value (cost, net of discount or premium) of short-term investments sold or adjusted for other than temporary decline in market value. Short-term investments mature at various dates. There were no realized gains and/or losses for the years ended 2006, 2005 and 2004.
Prior to December 31, 2006, the Company concluded that it was appropriate to classify its investments in auction rate securities as short-term investments. Previously such investments had been classified as cash and cash equivalents. Accordingly, the Company revised the classification to report these investments as short-term investments on the consolidated balance sheets as of December 31, 2005 and December 31, 2004. The Company also made corresponding adjustments to the consolidated statements of cash flows for the periods ended December 31, 2005 and December 31, 2004 to reflect the gross purchases and sales of these investments as investing activities rather than as a component of cash and cash equivalents. As of December 31, 2005 and December 31, 2004, $159.7 million and $207.9 million respectively, of these investments were reclassified from cash and cash equivalents to short-term investment on the consolidated Balance Sheet. This reclassification had no effect on the total current assets, stockholders’ equity, net income (loss), net income (loss) per share or cash provided by (used in) operating activities.
F-19
21, 2007 (in thousands):
Fair value of assets acquired: Cash $ 3,996 Other current assets 3,789 Property, plant and equipment 97,519 Mineral interests 1,657,189 Other assets 5,286 Total assets acquired $ 1,767,779
NOTE D –— DISCONTINUED OPERATIONS AND ASSETS AND LIABILITIES HELD FOR SALE During the first quarter of 2006, the Company committed to a plan to sell Coeur Silver Valley Inc. (“CSV”), a wholly owned subsidiary of Coeur d’Alene Mines Corporation, that ownsowned and operatesoperated the Galena underground silver mine and adjoining properties in Northern Idaho. On April 10, 2006, the Company announced that it had entered into an agreement to sell 100% of the shares of CSV to U.S. Silver Corporation for $15 million in cash. On June 1, 2006, the Company completed the sale of 100% of CSV to U.S. Silver Corporation for a total of $15 million in cash plus a post-closing working capital adjustment of $1.1 million. The Company recorded, within discontinued operations, a gain of approximately $11.1 million in the year ended December 31, 2006. Pursuant to SFAS No. 144, “Accounting for the Impairment or Disposal of Long-Lived Assets,” CSV was classified as held for sale and the results of its operations reported in discontinued operations for all prior periods.beginning in the period ended June 30, 2006.
The following table details selected financial information included in the income (loss) from discontinued operations in the consolidated statements of operations for the years ended December 31, 2006 2005 and 20042005 (in thousands): Years ended December 31, 2006 2005 Sales of metal $ 11,223 $ 16,052 Production costs applicable to sales (8,233 ) (16,698 ) Depreciation and depletion (681 ) (1,996 ) Mining exploration (279 ) (1,361 ) Other (95 ) (192 ) Income (loss) from discontinued operations 1,935 (4,195 ) Gain on sale of net assets of discontinued operations 11,132 — Net income (loss) from discontinued operations $ 13,067 $ (4,195 )
F-18
2006
2005
2004
Sales of metal $ 11,223 $ 16,052 $ 23,759 Production costs applicable to sales (8,233 ) (16,698 ) (18,637 ) Depreciation and depletion (681 ) (1,996 ) (1,967 ) Mining exploration (279 ) (1,361 ) (1,620 ) Other (95 ) (192 ) (357 )
Income (loss) from discontinued operations 1,935 (4,195 ) 1,178 Gain on sale of net assets of discontinued operations 11,132 -- --
Net income (loss) from discontinued operations $ 13,067 $ (4,195 ) $ 1,178
NOTE E — INVESTMENTS AND OTHER MARKETABLE SECURITIES The major classes of assetsCompany classifies its investment securities as available-for-sale securities. Pursuant to SFAS 115, “Accounting for Certain Investments in Debt and liabilities of discontinued operations held for saleEquity Securities”, such securities are measured at fair market value in the consolidated balance sheet asfinancial statements with unrealized gains or losses recorded in other comprehensive income. At the time securities are sold or otherwise disposed of, gains or losses are included in net income. The following is a summary of available-for-sale securities (in thousands): Available-For-Sale Securities Gross Gross Estimated Unrealized Unrealized Fair Cost Losses Gains Value As of December 31, 2007 U.S. Corporate $ 2,000 $ — $ — $ 2,000 U.S. Government 51,031 — 8 51,039 Total debt securities 53,031 — 8 53,039 Equity securities 99 — 702 801 $ 53,130 $ — $ 710 $ 53,840 As of December 31, 2006 U.S. Corporate $ 65,372 $ — $ — $ 65,372 U.S. Government 5,000 — 1 5,001 Total debt securities 70,372 — 1 70,373 Equity securities 99 1 622 720 $ 70,471 $ 1 $ 623 $ 71,093
Gross realized gains and losses are based on a carrying value (cost, net of discount or premium) of short-term investments sold or adjusted for other than temporary decline in market value. Short-term investments mature at various dates. There were no realized gains and/or losses in 2007, 2006 and 2005.Asset-Backed Commercial Paper (“ABCP”) The Company acquired certain asset-backed securities in connection with the Bolnisi and Palmarejo acquisition. Palmarejo has investments in non-bank sponsored ABCP (before accounting for an impairment charge), of which $6.3 million is invested in Apsley Trust Class E and $0.5 million in Aurora Trust Class A. Since a certain percentage of the assets supporting the commercial paper was invested in U.S. sub-prime residual mortgage-backed securities, the Company recorded an impairment based on the best available market data for such investments at the date of acquisition. Consequently, the Company recorded these investments at their estimated fair value of $5.3 million for the ABCP held by Palmarejo. The fair value of the ABCP are determined based on the Company’s assessment of market conditions at the date of acquisition, no further impairments were deemed necessary at December 31, 2005 is as follows (in thousands):December 31, 2005
Assets Receivables $ 2,036 Prepaids 906 Inventory 2,561 Property, plant and equipment (net) 2,016 Operational mining properties, net 6,357 Other 952
Total assets of discontinued operations $ 14,828
Liabilities Accounts payable $ 747 Accrued liabilities 166 Accrued payroll and related benefits 578 Reclamation and mine closure 6,905 Defined benefit liabilities 2,588 Other non-current liabilities 1,924
Total liabilities of discontinued operations $ 12,908
F-20
2007. The fair value reported may change materially in subsequent periods.
NOTE EF — METAL AND OTHER INVENTORIES Inventories consist of the following:following (in thousands): December 31, 2007 2006 Concentrate and dorè inventory $ 11,221 $ 9,680 Supplies 7,697 6,661 Metal and other inventory $ 18,918 $ 16,341
F-19
December 31, 2006
2005
Concentrate and doré inventory $ 9,680 $ 7,835 Supplies 6,661 4,972
Metal and other inventory $ 16,341 $ 12,807
NOTE FG — PROPERTY, PLANT AND EQUIPMENT Property, plant and equipment consists of the following:December 31, 2006
2005
Land $ 1,112 $ 1,423 Building improvements 51,818 40,869 Machinery and equipment 77,040 60,470 Capitalized leases for machinery and equipment 2,345 2,345
132,315 105,107 Accumulated depreciation (64,206 ) (57,929 )
$ 68,109 $ 47,178
following (in thousands):
December 31, 2007 2006 Land $ 1,133 $ 1,112 Building improvements 130,795 51,818 Machinery and equipment 153,328 77,040 Capitalized leases for machinery and equipment 37,477 2,345 322,733 132,315 Accumulated depreciation (69,937 ) (64,206 ) $ 252,796 $ 68,109
The Company’s capital expenditures, excluding the acquisitions of Bolnisi and Palmarejo, were as follows:2006
2005
2004
Rochester $ 1,225 $ 1,197 $ 3,548 Cerro Bayo 7,555 2,731 2,451 Martha 2,481 2,108 689 San Bartolome 14,597 10,477 950 Kensington 121,552 44,201 83 Endeavor -- 15,410 -- Broken Hill -- 36,667 -- Other 588 499 642
Net asset additions $ 147,998 $ 113,290 $ 8,363
Discontinued Operations - Coeur Silver Valley $ 617 $ 3,537 $ 2,151
follows (in thousands):
Years ended December 31, 2007 2006 2005 Rochester $ 1,647 $ 1,225 $ 1,197 Cerro Bayo 11,330 7,555 2,731 Martha 16,444 2,481 2,108 San Bartolomé 100,169 16,805 11,089 Kensington 92,337 122,640 53,155 Endeavor 2,112 — 15,410 Broken Hill 213 — 36,667 Other 1,942 588 499 Net asset additions $ 226,194 $ 151,294 $ 122,856 Discontinued Operations — Coeur Silver Valley $ — $ 617 $ 3,537
At December 31, 2007, 2006 and 2005, and 2004, approximately $22.1 million, $12.9 million $9.6 million and $0,$9.6, respectively, of invoices for capital expenditures remained in accounts payable and for purposes of the consolidated cash flows were treated as non-cash transactions. In connection with the acquisition of Bolnisi and Palmarejo, the Company assumed certain liabilities related to capital leases. In December 2006, Bolnisi, through its Canadian subsidiary Palmarejo, entered into a 2-year lease agreement for a power station. Under the terms of the agreement, including an amendment in January 2007, the Company will pay a fixed monthly amount of $0.3 million, including interest calculated at the rate of LIBOR plus 2.5%, starting at the date that the construction of the equipment is completed. The Company has the option at the end of the agreement to purchase the equipment by paying a nominal amount. In June 2007, Palmarejo entered into a 5-year lease agreement for $30.6 million of mining equipment to be delivered to Palmarejo as the equipment becomes available from the supplier. Mining equipment with a cost of $30.1 million has been delivered as of December 31, 2007. The Company will pay a monthly amount varying between $0.6 million and $0.8 million during the 2008 period and a fixed monthly amount of $0.6 million thereafter, including interest calculated at the rate of LIBOR plus 3.65%. The Company has the option at the end of the agreement to purchase the equipment by paying a nominal amount.F-20
F-21
Minimum future lease payments under both capital and operating leases at December 31, 20062007 are as follows:Year Ending December 31, Capital
Leases
Operating
Leases
2007 $ 916 $ 380 2008 -- -- 2009 -- -- 2010 -- -- Thereafter -- --
916 $ 380
Less: Amount representing interest 22
$ 894
follows (in thousands):
Capital Year Ending December 31, Leases 2008 11,554 2009 8,976 2010 6,755 2011 6,755 Thereafter 5,156 Total minimum payments due 39,196 Less: Amount representing interest 6,432 Present value of net minimum lease payments 32,764 Less: Current maturities 9,103 $ 23,661
The Company has entered into various operating lease agreements which expire over the next year. Total rent expense charged to net income (loss) under these agreements was $1.7 million, $2.6 million and $3.5 million for 2007, 2006, and $4.2 million for 2006, 2005, 2004, respectively.NOTE GH — MINING PROPERTIESDecember 31, 2006
2005
Capitalized costs for mining properties, net of accumulated depletion consist of the following(A): Operational mining properties: Rochester Mine $ 4,445 $ 8,582 Cerro Bayo Mine 8,531 6,660 Martha Mine 1,110 713
Total operational mining properties 14,086 15,955
Mineral interests, net of accumulated depletion Endeavor Mine 14,508 14,998 Broken Hill Mine 29,740 34,860 San Bartolome(B) 20,125 20,125
Total mineral interests 64,373 69,983
Non-producing and developmental properties: Kensington(C) 170,458 62,517 San Bartolome(D) 20,388 9,829 Other 142 142
Total non-producing and developmental properties 190,988 72,488
Total mining properties $ 269,447 $ 158,426
December 31, 2007 2006 Capitalized costs for mining properties, net of accumulated depletion consist of the following (in thousands):(A) Operational mining properties: Rochester Mine $ — $ 4,445 Cerro Bayo Mine 17,091 8,531 Martha Mine 1,832 1,110 Total operational mining properties 18,923 14,086 Mineral interests, net of accumulated depletion Endeavor Mine 15,865 14,508 Broken Hill Mine 26,897 29,740 San Bartolomé(B) 20,125 20,125 Palmarejo(C) 1,657,189 — Total mineral interests 1,720,076 64,373 Non-producing and developmental properties: Kensington(D) 256,443 170,458 San Bartolomé(E) 54,884 20,388 Other 142 142 Total non-producing and developmental properties 311,469 190,988 Total mining properties $ 2,050,468 $ 269,447
(A) On June 1, 2006, the Company completed the sale of 100% of the shares of its wholly-owned subsidiary, Coeur Silver Valley Inc., to US Silver Corporation for $15 million in cash and additional consideration received of $1.1 million for working capital.
(B) Balance represents acquisition cost of mineral interest.
(C) On December 31, 2007, the Company completed its acquisition of all of the shares of Bolnisi and Palmarejo in exchange for a total of approximately 272 million shares of Coeur common stock and a total cash payment of approximately $1.1 million.The total consideration paid was $1.1 billion and assumed liabilities were $0.7 billion. (D) During the third quarter of 2005, the Company commenced construction activities at its Kensington property. The costs incurred subsequent to commencing construction were capitalized as developmental properties.
F-21
(D)(E)During the fourth quarter of 2004, the Company commenced construction activities at its San BartolomeBartolomé property. The costs incurred subsequent to commencing construction were capitalized as developmental properties.
F-22
Operational Mining Properties Rochester Mine: The Company has conducted operations at the Rochester Mine, located in Western Nevada, since September 1986. The mine utilizes the heap-leaching process to extract both silver and gold from ore mined using open pit methods. Rochester’s primary product is silver with gold produced as a by-product. Cerro Bayo Mine: The Cerro Bayo Mine is a gold and silver underground mine located in southern Chile. Commercial production commenced on April 18, 2002. Martha Mine: The Martha Mine is an underground silver mine located in Argentina, approximately 270 miles southeast of Coeur’s Cerro Bayo mine. Coeur acquired a 100% interest in the Martha mine in April 2002. In July 2002, Coeur commenced shipment of ore from the Martha mine to the Cerro Bayo facility for processing. In December 2007, the Company completed a 240 tonne per day flotation mill which produces a flotation concentrate.
Mineral Interests Endeavor Mine: On May 23, 2005, the Company acquired all of the silver production and reserves, up to a maximum 17.7 million payable ounces, contained at the Endeavor Mine in Australia, which is owned and operated by Cobar Operations Pty. Limited (“Cobar”), a wholly-owned subsidiary of CBH Resources Ltd. (“CBH”), for $39.1$43.8 million. The Company is entitled to all of the silver production and reserves up to a maximum of 17.7 million payable ounces. The Endeavor Mine is located 720 km northwest of Sydney in New South Wales and has been in production since 1983. Under the terms of the original agreement, CDE Australia, a wholly-owned subsidiary of Coeur, paid Cobar $15.1$15.4 million of cash at the closing. In addition, CDE Australia, subject to certain conditions, will pay Cobar approximately $23.7$26.3 million upon the receipt of a report confirming that the reserves at the Endeavor mine are equal to or greater than the reported ore reserves for 2004. Payment couldwill occur in 2007.2008. In addition to these upfront payments, pursuant to the original agreement, Coeur pays Cobar an operating cost contribution of $1.00 for each ounce of payable silver plus a further increment which was to begin when the silver price exceeds $5.23 per ounce. This further increment was to begin on the second anniversary of the agreement and would have been 50% of the amount by which the silver price exceeds $5.23 per ounce. A cost contribution of $0.25 per ounce is also payable by Coeur in respect of new ounces of proven and probable silver reserves as they are discovered. The Company has paid a cost contribution of approximately $2.1 million during 2007.
On March 28, 2006, CDE Australia Pty, Ltd. (CDE Australia), reached an agreement with CBH Resources Ltd. to modify the terms of the original silver purchase agreement. Under the modified terms, CDE Australia owns all silver production and reserves up to a total of 20.0 million payable ounces, up from 17.7 million payable ounces in the original agreement. Based on the most recent ore reserve report, the current ore reserve contains approximately 15.314.4 million payable ounces. To date, the Company has received 0.71.4 million payable ounces based on current metallurgical recovery and current smelter contract terms. Expansion of the ore reserve will be required to achieve the maximum payable ounces of silver production as set forth in the modified contract. The silver price-sharing provision is deferred until such time as Coeur has received approximately 2 million cumulative ounces of silver from the mine or June 2007, whichever is later. In addition, the silver price-sharing threshold increased to US$7.00 per ounce, from the previous level of US$5.23 per ounce.F-22
Broken Hill Mine:On September 8, 2005, the Company acquired all of the silver production and reserves, up to a maximum of 17.2 million payable ounces, contained at the Broken Hill mine in Australia, which is owned and operated by Perilya Broken Hill Ltd. (“PBH”) for $36.7$36.9 million. The Broken Hill Mine is located in New South Wales, Australia and is a zinc/lead/silver ore body. Pursuant to the Agreement, the transaction includes up to a maximum of approximately 24.5 million contained ounces (or 17.2 million payable ounces) of silver to be mined by PBH at Broken Hill on the Company’s behalf. In addition, CDE Australia will pay PBH an operating cost contribution of approximately US$2.00 for each ounce of payable silver under the terms of the Agreement and PBH may earn up to US$6.0 million of additional consideration by meeting certain silver production thresholds through 2014. No additional payments were made during 2007, 2006 or 2005.F-23
Non-Producing and Development Properties San Bartolome Project:Bartolomé: On September 9, 1999, the Company acquired EmpressaEmpresa Minera Manquiri (“Manquiri”). Manquiri’s principal asset is the San BartolomeBartolomé project, a silver exploration and development property located near the city of Potosi,Potosí, Bolivia. The San BartolomeBartolomé project consists of silver-bearing gravel deposits which lend themselves to simple surface mining methods. The mineral rights for the San BartolomeBartolomé project are held through long-term joint venture/lease agreements with several local independent mining co-operatives and the Bolivian State owned mining company, (“COMIBOL”). Production from San BartolomeBartolomé is subject to a royalty of 4% payable to the co-operatives and COMIBOL. During 2004, the Company completed an updated feasibility study, obtained all required permits and commenced construction of the San BartolomeBartolomé mine. The Company estimates the cost of constructiontotal capital costs (excluding political risk insurance premiums and capitalized interest) of theat San BartolomeBartolomé mine to be approximately $174 million.$220 million of which $129.2 million had been incurred as of December 31, 2007. During 2006,2007, the Company capitalized $14.6$100.2 million in connection with construction activities at San Bartolome.Bartolomé.
Kensington Project:Kensington: Kensington is a gold property located near Juneau, Alaska. The mine will be an underground gold mine accessed by a horizontal tunnel and will utilize conventional and mechanized underground mining methods. The ore will be processed in a flotation mill that produces a concentrate which will be sold to third party smelters. During 2006,2007, the Company capitalized $121.6$99.0 million in connection with construction activities at Kensington. The company estimatesCompany has expended approximately $269.7 million as of December 31, 2007.Palmarejo: Palmarejo is engaged in the exploration and development of silver and gold properties located in the State of Chihuahua in northern Mexico, and its principal silver and gold properties are collectively referred to as the “Palmarejo project.” The Palmarejo project is currently under development and is expected to commence commercial production in the first half of 2009. The total capital cost of contructionthe project, from the time the Company acquired it on December 21, 2007, is estimated to be approximatly $238approximately $225 million.Discontinued Operations Coeur Silver Valley (Galena) Mine: On June 1, 2006, the Company completed the sale of 100% of the shares of its wholly owned subsidiary Coeur Silver Valley, Inc. to U.S. Silver Corporation for $15 million in cash plus a post-closing working capital adjustment of $1.1 million.NOTE HI — LONG-TERM DEBT11/1 ¼%4% Debentures
The $180.0 million principal amount of 1 ¼%1/4% Debentures due 2024 outstanding at December 31, 20062007 are convertible into shares of common stock at the option of the holder on January 15, 2011, 2014, and 2019, unless previously redeemed, at a conversion price of $7.60 per share, subject to adjustment in certain events.F-23
The Company is required to make semi-annual interest payments on the debentures. The debentures are redeemable at the option of the Company before January 18, 2011, if the closing price of the Company’s common stock over a specified number of trading days has exceeded 150% of the conversion price, and anytime thereafter. Before January 18, 2011, the redemption price is equal to 100% of the principal amount of the notes plus an amount equal to 8.75% of the principal amount of the notes, less the amount of any interest actually paid on the notes on or prior to the redemption date. The debentures have no other funding requirements until their maturity on January 15, 2024.F-24
The fair value of the debentures is determined by market transactions on or near December 31, 20062007 and 2005,2006, respectively. The fair value of the debentures, as of December 31, 2007 and 2006, was $156.6 million and 2005, was $163.8 million, and $146.7 million, respectively. Total interest expense on debentures and notes for the year ended December 31, 2007, 2006, and 2005 and 2004 was $2.3 million, of which $2.3 million was capitalized as a cost of certain properties under development in 2007; $2.3 million, of which $1.4 million was capitalized as a cost of certain properties under development in 2006,2006; and $2.3 million, of which $0.2 million was capitalized as a cost of certain properties under development in 2005, and $2.9 million, of which $0.1 million was capitalized as a cost of certain properties under development in 2004, respectively. Interest paid was $2.3 million in 2006,2007, $2.3 million in 2005,2006, and $1.6$2.3 million in 2004.2005.
Bridging Debt Facility On October 22, 2007, Bolnisi entered into a $20 million credit facility with Macquarie Bank Limited to fund further exploration and development of the Palmarejo silver/gold project, surrounding exploration areas and for working capital purposes. The credit facility was extended to June 30, 2008 and bears interest at a variable rate (LIBOR) plus a margin of 2.45%. As of December 31, 2007, the Company has $20 million outstanding under the credit facility bearing an interest rate of 7.35%. Events of default under the credit facility include customary provisions for similar types of facilities.Bank Loan On August 30, 2007 (with amendment dated October 9, 2007), Palmarejo entered into a temporary credit facility of $2.0 million secured by the Company’s investments in Asset Backed Commercial Paper, to fund working capital requirements. The credit facility has been extended through May 31, 2008. As of December 31, 2007, an amount of $1.7 million has been drawn on the facility, which bears interest at prime less 1.50% and matures on May 31, 2008. The Company is required to reduce the amount of the outstanding credit facility with any proceeds received from the sale of the Asset Backed Commercial Paper.NOTE IJ — RECLAMATION AND REMEDIATION COSTS Reclamation and remediation costs are based principally on legal and regulatory requirements. Management estimates costs associated with reclamation of mining properties as well as remediation costs for inactive properties. The Company uses assumptions about future costs, mineral prices, mineral processing recovery rates, production levels and capital and reclamation costs. Such assumptions are based on the Company’s current mining plan and the best available information for making such estimates. On an ongoing basis, management evaluates its estimates and assumptions; however, actual amounts could differ from those based on such estimates and assumptions. The Asset Retirement Obligationasset retirement obligation is measured using the following factors: 1) Expected labor costs, 2) Allocated overhead and equipment charges, 3) Contractor markup, 4) Inflation adjustment, and 5) Market risk premium. The sum of all these costs is discounted, using the Company’s credit adjusted risk-free interest rate from the time we expect to pay the retirement obligation to the time we incur the obligation. The measurement objective is to determine the amount a third party would demand to assume the asset retirement obligation.F-24
Upon initial recognition of a liability for an asset retirement obligation, the Company capitalized the asset retirement cost as an increase in the carrying amount of the related long-lived asset. The Company depletes this amount using the units-of-production method. The Company is not required to re-measure the obligation at fair value each period, but the Company is required to evaluate the cash flow estimates at the end of each reporting period to determine whether the estimates continue to be appropriate. Upward revisions in the amount of undiscounted cash flows are discounted using a current credit-adjusted risk-free rate. Downward revisions are discounted using the credit-adjusted risk-free rate that existed when the original liability was recorded.recorded, or, if not readily determinable, at the weighted average discount rate used to record the liability.
At December 31, 2007 and 2006, $33.1 million and 2005, $29.9 million, and $23.5 million, respectively, werewas accrued for reclamation obligations related to currently producing and developmental mineral properties. In addition, the Company has accrued $1.8$1.7 million and $1.2$1.8 million, respectively, for reclamation obligations associated with former mining activities. These amounts are also included in reclamation and mine closure liabilities. In the fourth quarter of 2007, the Company reviewed its cash flow estimates for its asset retirement obligations. This resulted in a net increase to the asset retirement obligation of $3.4 million and a corresponding increase to the carrying amount of the asset to be retired. For the purpose of consolidated statement of cash flows, these amounts are non-cash transactions. The increase was due to additional reclamation required at the Company’s Cerro Bayo mine, Kensington project and San Bartolomé project. The increase was discounted using the Company’s current weighted average credit adjusted risk-free rate of 9.34%. In the fourth quarter of 2006, the Company reviewed its cash flow estimates for its asset retirement obligations. This resulted in a net increase to the asset retirement obligation of $6.1 million and a corresponding increase to the carrying amount of the asset to be retired. For the purpose of consolidated statement of cash flows, these amounts are non-cash transactions. The increase was due to additional reclamation required at the Company’s Rochester mine, Kensington and San Bartolome projects. The increase was discounted using the Company’s current weighted average credit adjusted risk-free rate of 7.6%. In the fourth quarter of 2005, the Company reviewed its cash flow estimates for its asset retirement obligations. This resulted in a net increase to the asset retirement obligation of $6.4 million and a corresponding increase to the carrying amount of the asset to be retired. For the purpose of consolidated statement of cash flows, these amounts are non-cash transactions. The increase was due to additional reclamation required as a result of the expansion of the Company’s Cerro Bayo mine and adjustments to future estimated costs at the Company’s Rochester mine, Kensington project and San BartolomeBartolomé project. The increase was discounted using the Company’s current weighted average credit adjusted risk-free rate of 7.79%7.6%.
F-25
The following is a description of the changes to the Company’s asset retirement obligations for the years ended December 31, 2007 and 2006 and 2005:(in thousands): Years Ended December 31, 2007 2006 Asset retirement obligation — January 1 $ 29,909 $ 23,524 Accretion 2,260 1,780 Additions 3,390 6,069 Changes in estimates (1,202 ) (507 ) Settlements (1,222 ) (957 ) Asset retirement obligation — December 31 $ 33,135 $ 29,909
F-25
Year Ended December 31, 2006
2005
(in thousands) Asset retirement obligation - January 1 $ 23,524 $ 16,921 Accretion 1,780 1,265 Additions 6,069 6,397 Changes in estimates (507 ) (74 ) Settlements (957 ) (985 )
Asset retirement obligation - December 31 $ 29,909 $ 23,524
NOTE JK — INCOME TAXESIncome (loss)
The components of income from continuing operations before income taxes iswere as follows:Year Ended December 31, 2006
2005
2004
(in thousands) United States $ 33,252 $ (5,576 ) $ (22,281 ) Foreign 50,393 21,805 (1,540 )
Total $ 83,645 $ 16,229 $ (23,821 )
follows (in thousands):
Years Ended December 31, 2007 2006 2005 United States $ 21,909 $ 33,252 $ (5,576 ) Foreign 36,908 50,393 21,805 Total $ 58,817 $ 83,645 $ 16,229
The components of the consolidated income tax (provision) benefitprovision from continuing operations were as follows:Years Ended December 31,
2006
2005
2004
Current: United States - Alternative minimum tax $ (900 ) $ 212 $ 1,382 United States - Foreign withholding (713 ) -- -- Foreign - Argentina (4,842 ) (66 ) -- Foreign - Australia (4,673 ) -- -- Deferred: Foreign - Argentina 65 929 -- Foreign - Australia (93 ) (404 ) -- Foreign - Chile 2,930 (2,154 ) 4,403
Income tax benefit (provision) $ (8,226 ) $ (1,483 ) $ 5,785
follows (in thousands):
Years Ended December 31, 2007 2006 2005 Current: United States — Alternative minimum tax $ (381 ) $ (900 ) $ 212 United States — Foreign withholding tax (904 ) (713 ) — Foreign — Argentina (6,590 ) (4,842 ) (66 ) Foreign — Australia (4,898 ) (4,673 ) — Deferred: Foreign — Argentina 172 65 929 Foreign — Australia (664 ) (93 ) (404 ) Foreign — Chile (1,662 ) 2,930 (2,154 ) Income tax provision $ (14,927 ) $ (8,226 ) $ (1,483 )
A reconciliation of the Company’s effective tax rate with the federal statutory tax rate for the periods indicated is as follows:Years Ended December 31 2006
2005
2004
Tax benefit (provision) from continuing operations $ (29,276 ) $ (5,680 ) $ 8,337 State tax benefit (provision) from continuing operations (2,509 ) (487 ) 715 Excess percentage depletion and related deductions 6,199 4,265 3,698 Change in valuation allowances 14,778 (5,555 ) (9,474 ) Effect of foreign earnings 4,744 4,744 1,346 US and foreign non-deductible expenses (1,059 ) 632 610 Foreign currency exchange rates -- 827 -- Other net (1,103 ) (229 ) 553
$ (8,226 ) $ (1,483 ) $ 5,785
Years Ended December 31 2007 2006 2005 Tax provision from continuing operations $ (20,600 ) $ (29,276 ) $ (5,680 ) State tax provision from continuing operations (1,766 ) (2,509 ) (487 ) Percentage depletion and related deductions 4,860 6,199 4,265 Change in valuation allowance 3,896 14,778 (5,555 ) U.S. and Foreign non-deductible expenses (663 ) (711 ) 632 Foreign tax rate differences 2,309 4,744 4,744 Foreign withholding taxes (904 ) (713 ) — Other, net (2,059 ) (738 ) 598 $ (14,927 ) $ (8,226 ) $ (1,483 )
F-26
As of December 31, 20062007 and 2005,2006, the significant components of the Company’s deferred tax assets and liabilities were as follows:Years Ended December 31, 2006
2005
Deferred tax liabilities: Property, plant and equipment , net $ 7,318 $ 7,665 Investments in foreign subsidiaries 9,761 471
17,079 8,136
Deferred tax assets: Mineral properties 62,284 66,664 Net operating loss carryforwards 68,794 88,130 Alternative minimum tax credit 2,479 1,246 carryforwards Investments in foreign subsidiaries 8,129 404 Capital loss carryforwards 12,864 5,672 Other 6,197 3,173
160,747 165,289 Valuation allowance (137,992 ) (154,379 )
22,755 10,910
Net deferred tax assets $ 5,676 $ 2,774
The Company has not had a strong earnings history which would be objective evidence as required by generally accepted accounting principles to recognize its net operating less carryforwards and other deductible temporary differences. It is likely that the alternative minimum tax will exceed the regular tax for the foreseeable future. Accordingly, the Company has recorded a valuation allowance of $138.0 million as of December 31, 2006, which includes a full valuation allowance against the $2.5 million minimum tax credit carryforward, which is available for an unlimited carryforward period to offset regular federal income tax in excess of the alternative minimum tax. The Company has reviewed its domestic and foreign deferred tax assets and, except for approximately $6.2 million deferred tax assets related to the Company’s Cerro Bayo and Martha mines, has not recognized the potential tax benefits in other jurisdictions because at this time management believes that the realization of such benefits in future periods does not meet the more likely than not criteria.follows (in thousands):
Years Ended December 31 2007 2006 Deferred tax liabilities: Mineral properties $ 552,007 $ — Investment in foreign subsidiaries 18,430 9,761 Property, plant and equipment, net 2,836 3,580 573,273 13,341 Deferred tax assets: Net operating loss carryforwards 111,996 80,869 Investment in foreign subsidiaries 16,331 8,129 Capital loss carryforwards 10,305 12,897 Asset retirement obligation 10,234 9,914 Unrealized foreign currency loss and other 8,651 — Accrued expenses 3,330 2,345 Alternative minimum tax credit carryforwards 2,520 2,139 Inventory 1,523 4,274 Mineral properties — 53,290 164,890 173,857 Valuation allowance (160,898 ) (154,840 ) 3,992 19,017 Net deferred tax assets (liabilities) $ (569,281 ) $ 5,676
The Company has evaluated the amount of taxable income and periods over which it must be earned to allow for realization of itsthe deferred tax assets. Based onupon this analysis, the Company determined it is more likely than not that over the next two years pretax book income in Chile and Argentina where the future tax rate is 17% and 35%, respectively, is sufficient for recognition of $6.2 million ofnet deferred tax assets.assets of $1.1 million and $3.5 million will be realized in Argentina and Chile, respectively. Thus, the Company has recorded valuation allowances as follows (in thousands): Years Ended December 31 2007 2006 U.S. $ 111,685 $ 122,101 Argentina 1,966 1,130 Australia 7,282 — Canada 8,220 — New Zealand 30,999 30,778 Chile and other 746 831 $ 160,898 $ 154,840
The Company monitorscontinues to monitor the valuation allowance each quarterquarterly, and makeswill make the appropriate adjustments as necessary. The Company adopted the provisions of FASB Interpretation No. 48, “Accounting for Uncertainty in Income Taxes,” (FIN 48) an interpretation of FASB Statement No. 109, “Accounting for Income Taxes” on January 1, 2007. FIN 48 clarifies the criteria that an individual tax position must satisfy for some or all of the benefits of that position to be recognized in a company’s financial statements. FIN 48 prescribes a recognition threshold of more likely than not, and a measurement attribute for all tax positions taken or expected to be taken on a tax return. The Company determined that FIN 48 had no impact on the financial statements, and as a result, did not record any cumulative effect adjustment related to the allowance as appropriate based primarily upon continued developmentadoption of anFIN 48.F-27
The Company files income tax returns in the US federal jurisdiction, various US states and in certain foreign jurisdictions. To the extent there are loss carryovers in any such jurisdictions, the statute of limitations generally remains open. The Company has previously determined the earnings historyfrom certain foreign jurisdictions were not indefinitely reinvested. Accordingly, the Company has recognized deferred taxes and projected future earnings.withholding taxes related to those jurisdictions where the subsidiary’s net equity determined for financial reporting purposes exceeds tax basis.
During the first quarter of 2006,2007, the Company incurred anotheran ownership change which generally limits the availability of existing tax attributes, including net operating loss carryforwards to reduce future taxable income. The Company will be limited from utilizing tax attributes to reduce future taxable income or tax liabilities. Therefore, the Company has the following tax attribute carryforwards as of December 31, 2006:U.S.
Chile
New Zealand
Other
Total
Regular net operating losses $86,004 $30,464 $93,267 $444 $210,179 Alternative minimum tax net operating losses 53,651 -- -- -- 53,651 Capital losses 33,853 -- -- -- 33,853 Alternative minimum tax credits 2,180 -- -- -- 2,180 Foreign tax credits 299 -- -- -- 299
2007 (in thousands):
New U.S. Chile Mexico Canada Australia Zealand Other Total Regular net operating losses $ 110,286 $ 22,110 $ 109,600 $ 5,653 $ 6,389 $ 93,936 $ 2,487 $ 350,461 Alternative minimum tax net operating losses 26,946 — — — — — — 26,946 Capital losses 19,339 — — — 9,855 — — 29,194 Alternative minimum tax credits 2,520 — — — — — — 2,520
The U.S. net operating losses expire in 2011from 2016 through 2025 and the Canada net operating losses expire from 2025 through 2027. The Mexico net operating losses expire in 2017 and 2018, while the foreign countryremaining net operating losses from the foreign jurisdictions have an indefinite carryforward period. The U.S. capital losses expire from 2008 through 2012 while the Australia capital losses generally have an indefinite carryforward period. The Company’s capital losses expire in 2007 through 2011; alternativeAlternative minimum tax credits have an indefinite carryforward period and the foreign tax credits generally expire in 2026.F-27
do not expire.
NOTE KL — SHAREHOLDERSSHAREHOLDER’S EQUITY On May 11, 1999, the Company’s shareholders adopted a new shareholder rights plan (the “Plan”). The Plan entitles each holder of the Company’s common stock to one right. Each right entitles the holder to purchase one one-hundredth of a share of newly authorized Series B Junior Preferred Stock at an exercise price of $100. The rights will not be distributed and become exercisable unless and until ten business days after a person acquires 20% of the outstanding common shares or commences an offer that would result in the ownership of 30% or more of the shares. Each right also carries the right to receive upon exercise that number of Coeur common shares which has a market value equal to two times the exercise price. Each preferred share issued is entitled to receive 100 times the dividend declared per share of common stock and 100 votes for each share of common stock and is entitled to 100 times the liquidation payment made per common share. The Board may elect to redeem the rights prior to their exercisability at a price of $0.01 per right. The new rights will expire on May 24, 2009, unless earlier redeemed or exchanged by the Company. Any preferred shares issued are not redeemable. At December 31, 20062007 and 2005,2006, there were a total of 277,995,133550,453,019 and 249,902,142277,995,133 rights outstanding, respectively, which was equal to the number of outstanding shares of common stock.Stock Issues During 2006
During the first quarter of 2006, the Company completed a public offering of 27.6 million shares of common stock at a public offering price of $5.60 per share. The Company realized net proceeds of $146.2 million after payment of the underwriters’ discount. Offering costs incurred were $8.3 million.Stock Issues During 2005
During the third quarter of 2005, the Company completed a public offering of 9.9 million shares of common stock at a public offering price of $3.70 per share. The Company realized total net proceeds from the offering, after payment of the underwriters’ discount, of approximately $35.9 million. Offering costs incurred were $0.6 million.F-28
Stock Issues During 2004
During the fourth quarter of 2004, the Company completed a public offering of 26.6 million shares of common stock at a public offering price of $4.50 per share, which included 1.6 million shares purchased by the underwriters at the offering price to cover over allotments. The Company realized total net proceeds from the offering, after payment of the underwriters’ discount, of approximately $113.1 million. Offering costs incurred were $6.7 million.
NOTE LM — STOCK-BASED COMPENSATION PLANS The Company has an Annual Incentive Plan, a Long-Term Incentive Plan (the “2003 Long-Term Incentive Plan”) and a Directors’ Plan (the “Directors’ Plan”). Total employee compensation expense charged to operations and capital projects under these Plans was $4.6$6.3 million, $3.9$4.7 million and $2.8$3.8 million for 2007, 2006 and 2005, and 2004, respectively. Annual Incentive Plan Under the Annual Incentive Plan, the Board of Directors may annually approve cash-based awards to the executive officers and key management employees based on certain Company and employee performance measures. Cash payments for 2007, 2006 2005 and 20042005 amounted to $2.6 million, $2.2 million and $2.7 million, and $2.0 million, respectively.F-28
1989 Long-Term Incentive Plan Under the 1989 Long-Term Incentive Plan, as amended by shareholders in 1995, the Company may grant non-qualified and incentive stock options that are exercisable at prices equal to the fair market value of the shares on the date of grant and vest cumulatively at an annual rate of one third during the three-year period following the date of grant. In addition to stock options, the Company’s 1989 Long-Term Incentive Plan provides for grants of stock appreciation rights (SAR’s)(SARs), restricted stock, restricted stock units, performance shares, performance units, cash based awards, and stock based awards. The number of shares authorized to be issued under this plan was 2.9 million shares. There were 0.6 million shares reserved for issuance under this plan at December 31, 20062007 for stock options previously awarded. No further awards will be made under this plan. 2003 Long-Term Incentive Plan The 2003 Long-Term Incentive Plan (the “LTIP”) was approved by our shareholders on May 20, 2003, and replaced our prior 1989 Long-Term Incentive Plan. Under the plan, we may grant nonqualified stock options, incentive stock options, stock appreciation rights (“SARs”), restricted stock, restricted stock units, performance shares, performance units, cash-based awards and other stock-based awards to our executive officers. The number of shares authorized for grant under this plan was 6.8 million shares. There were 6.25.8 million shares reserved for issuance under this plan at December 31, 2006.2007. Of the 6.25.8 million shares, 4.94.1 million shares can be issued for future grants. There are 1.01.3 million options and 0.20.4 million performance shares outstanding under these plans. Directors Plan On June 3, 2005, the Company’s shareholders approved the 2005 Non-Employee Directors’ Equity Incentive Plan and authorized 500,000 shares of common stock for issuance under the plan. During 2007 and 2006, 59,476 and 2005, 35,042 and 35,996 shares were issued in lieu of $0.2$0.3 million and $0.1$0.2 million, respectively, of Directors’ fees. At December 31, 2006, 0.4 million2007, 400,000 shares are reserved for issuance under this plan. Under the previous Directors’ plan, options were granted only in lieu of annual directors’ fees. For the year ended December 31, 2004, a total of 40,318 options had been granted in lieu of directors’ fees of $0.1 million. At December 31, 2006, 0.5 million2007, 500,000 shares are reserved for issuance under this plan for stock options previously awarded. No further grants will be made under this plan.F-29
As of December 31, 20062007 and 2005,2006, options to purchase 2,089,6502,281,595 shares and 2,218,6292,089,650 shares of common stock, respectively, were outstanding under the Long-Term and the Directors’ Plans described above. The options are exercisable at prices ranging from $0.74 to $17.94$8.94 per share. Stock options granted under the Company’s incentive plans vest over three years and are exercisable over a period not to exceed 10 years from the grant date. Exercise prices are equal to the fair market value of the shares on the date of the grant. The value of each option award is estimated on the date of the grant using the Black-Scholes option pricing model. Restricted stock is granted at the fair market value of the underlying shares on the date of grant and vest in equal installments annually over three years. Holders of the restricted stock are entitled to vote the shares and to receive any dividends declared on the shares. Performance shares also are granted at the fair market value of the underlying shares on the date of grant. Compensation costs ultimately recognized are equal to the grant date fair value. Vesting is contingent on meeting certain performance measuresmarket conditions based on relative total shareholder return. The performance shares vest at the end of the three-year service period. Performance shares granted underperiod if the plan assume that the performance measure will be achieved. If such performance measuresmarket conditions are not met, no furthermet. The existence of a market condition requires recognition of compensation cost regardless of whether the market condition is recognized and if determined improbable of achieving the performance measures any previously recognized compensation is reversed.F-29
ever satisfied.
Effective January 1, 2006, the Company began recording compensation expense associated with awards of equity instruments in accordance with Statement of Financial Accounting Standards (“SFAS”)SFAS No. 123(R), “Share-Based Payment”. Prior to January 1, 2006, the Company accounted for awards of equity instruments according to the provisions of SFAS No. 123 and related interpretations, and therefore no related compensation expense was recorded for awards granted with no intrinsic value. The Company adopted the modified prospective transition method provided for under SFAS No. 123(R), and, consequently, has not retroactively adjusted results fromfor prior periods. Under this transition method, compensation cost associated with awards of equity instruments recognized in 2006 includes: 1) amortization related to the remaining unvested portion of all awards granted for the fiscal years 1995 to 2005, based on the grant date fair value, estimated in accordance with the original provisions of SFAS No. 123, “Accounting for Stock-Based Compensation”; and 2) amortization related to all equity instruments awards granted subsequent to December 31, 2005, based on the grant-date fair value estimated in accordance with the provisions of SFAS No. 123(R). The compensation cost is included in administrative and general expenses, production costs and the cost of self-constructed property, plant and equipment as deemed appropriate. Prior to the Company’s adoption of SFAS No. 123(R), benefits of tax deduction in excess of recognized compensation costs were reported as operating cash flows. SFAS No. 123(R) requires excess tax benefits be reported as a financing cash inflow rather than as a reduction of taxes paid. There were no significant excess tax benefits for the years ended December 31, 2007, 2006 2005 and 2004.2005.
The compensation expense recognized in the Company’s consolidated financial statements for the year ended December 31, 2007, 2006 2005 and 20042005 for awards of equity instruments was $2.2$3.7 million, $2.5 million and $1.2 million, respectively, of which $0.2 million, $0.3 million, and $1.1$0 million, respectively.respectively, was capitalized as part of mine development activities. As of December 31, 2006,2007, there was $1.8$1.7 million of total unrecognized compensation cost (net of estimated forfeitures) related to unvested stock options, restricted stock grants and performance share grants which is expected to be recognized over a weighted-average vesting period of 2.0 years. The Company continues to estimate the fair value of each stock option award on the date of grant using the Black-Scholes option valuation model. The Company now estimates forfeitures of stock-based awards based on historical data and adjusts the forfeiture rate periodically. The adjustment of the forfeiture rate will result in a cumulative adjustment in the period the forfeiture estimate is changed. During the year ended December 31, 2006, the Company recorded an adjustment of $0.1 million to reduce compensation expense for forfeited awards.F-30
The impact of adopting SFAS No. 123(R) as of January 1, 2006 resulted in a decrease in net income of $1.4 million, or less than $0.01 per basic and diluted share for the year ended December 31, 2006. The impact of adoption excludes the amortization of restricted stock awards in the amount of $1.1 million for the year ended December 31, 2006. Compensation expense related to the amortization of restricted stock awards was recognized prior to the implementation of SFAS No. 123(R). Cash received from share options exercised under the Long-Term Incentive Plan for the years ended December 31, 2007, 2006 and 2005 and 2004 were $0.2 million, $0.8 million $0.1 million and $0.3$0.1 million, respectively, and is reflected as an other financing activity in the Company’s consolidated statements of cash flows. The adjustment of the forfeiture rate resulted in a cumulative adjustment in the period the forfeiture estimate is charged. During the year ended December 31, 2006, the Company recorded an adjustment of $0.1 million to reduce compensation expense for forfeiture awards.
The following pro-forma information, as required by SFAS No. 148, “Accounting for Stock-Based Compensation-Transition and Disclosure an amendment of FASB Statement No. 123,” is presented for comparative purposes and illustrates the effect on net income per common share for the periodsperiod presented as if the Company had applied the fair value recognition provisions of SFAS No. 123(R) to stock-based employee compensation prior to December 31, 2005.F-30
Year Ended December 31,
2005
2004
(in thousands except per share data)
Net income (loss) as reported $ 10,551 $ (16,858 ) Add: Stock-based employee compensation expense included in reported net income 1,237 1,137 Less: Stock-based employee compensation expense determined under fair value for all awards (2,316 ) (2,017 )
Net income (loss) - Pro forma $ 9,472 $ (17,738 )
Net income (loss) per share: Basic and diluted - As reported $ 0.04 $ (0.08 )
Basic and diluted - Pro forma $ 0.04 $ (0.08 )
Year Ended December 31, 2005 (in thousands, except per share data) Net income as reported $ 10,551 Add: Stock-based employee compensation expense included in reported net income 1,237 Less: Stock-based employee compensation expense determined under fair value for all awards (2,316 ) Net income — Pro forma $ 9,472 Net income per share: Basic and diluted — As reported $ 0.04 Basic and diluted — Pro forma $ 0.04
The weighted average fair value of stock options on the date of grant, and the assumptions used to estimate the fair value of the stock options using the Black-Scholes option valuation model were as follows:Year Ended December 31, 2006
2005
2004
Weighted average fair value of options granted $3.35 $2.53 $4.83 Expected volatility 68.5% 68.5% 75.7% Expected life 6 years 6 years 6 years Risk-free interest rate 4.6% 3.9% 3.3% Expected dividend yield 0.0% 0.0% 0.0%
Years Ended December 31, 2007 2006 2005 Weighted average fair value of options granted $ 2.35 $ 3.35 $ 2.53 Expected volatility 58.9 % 68.5 % 68.5 % Expected life 6 years 6 years 6 years Risk-free interest rate 4.5 % 4.6 % 3.9 % Expected dividend yield 0.0 % 0.0 % 0.0 %
The expected volatility of the option is determined using historical volatilities based on historical stock prices. The Company estimated the expected life of options granted using the midpoint between the vesting date and the original contractual term. The risk free rate was determined using the yield available on U.S. Treasury Zero-coupon issues with a remaining term equal to the expected life of the option. The Company has not paid dividends on its common stock since 1996.F-31
The following table summarizes stock option activity during the years ended December 31, 2004, 2005, 2006 and 2006:Shares
Weighted Average
Exercise Price
Stock options outstanding at December 31, 2003 1,650,054 $2.11 Granted 333,250 $6.95 Exercised (169,527 ) $1.69 Canceled/expired (16,869 ) $6.32
Stock options outstanding at December 31, 2004 1,796,908 $3.01 Granted 566,149 $3.92 Exercised (52,007 ) $1.61 Canceled/expired (92,421 ) $5.69
Stock options outstanding at December 31, 2005 2,218,629 $3.16 Granted 332,169 $5.14 Exercised (395,723 ) $1.99 Canceled/expired (65,425 ) $7.65
Stock options outstanding at December 31, 2006 2,089,650 $3.56
F-31
2007:
Weighted Average Shares Exercise Price Stock options outstanding at December 31, 2004 1,796,908 $ 3.01 Granted 566,149 $ 3.92 Exercised (52,007 ) $ 1.61 Cancelled/expired (92,421 ) $ 5.69 Stock options outstanding at December 31, 2005 2,218,629 $ 3.16 Granted 332,169 $ 5.14 Exercised (395,723 ) $ 1.99 Canceled/expired (65,425 ) $ 7.65 Stock options outstanding at December 31, 2006 2,089,650 $ 3.56 Granted 462,015 $ 3.99 Exercised (56,167 ) $ 3.29 Canceled/expired (213,903 ) $ 5.99 Stock options outstanding at December 31, 2007 2,281,595 $ 3.42
Options exercisable at December 31, 2007, 2006 and 2005 were for 1,598,685, 1,413,117, and 2004 were 1,413,117, 1,562,217 and 1,509,217,shares, respectively, with a weighted average exercise price of $3.06, $2.95 and $2.53, and $2.25, respectively. The following table summarizes information for options currently outstanding at December 31, 2006:Options Outstanding
Options Exercisable
Range of
Exercise
Price
Number
Outstanding
Weighted
Average
Exercise
Price
Weighted
Average
Remaining
Contractual
Life (Years)
Number
Exercisable
Weighted
Average
Exercise
Price
Weighted
Average
Remaining
Contractual
Life (Years)
$0.74 to $1.22 442,641 $0.80 4.77 442,641 $0.80 4.77 $1.23 to $1.85 336,525 $1.75 5.67 336,525 $1.75 5.67 $1.86 to $2.63 111,502 $2.10 5.90 111,502 $2.10 5.90 $2.64 to $3.92 537,089 $3.86 7.50 248,767 $3.78 6.77 $3.93 to $7.09 624,288 $6.00 7.96 236,077 $6.81 6.62 $7.10 to $17.94 37,605 $11.68 0.57 37,605 $11.68 0.57
2,089,650 $3.56 6.55 1,413,117 $2.95 5.62
2007:
Options Outstanding Options Exercisable Weighted Weighted Weighted Average Weighted Average Range of Average Remaining Average Remaining Exercise Number Exercise Contractual Number Exercise Contractual Price Outstanding Price Life (Years) Exercisable Price Life (Years) $0.74 to $1.22 442,641 $ 0.80 3.77 442,641 $ 0.80 3.77 $1.23 to $1.85 320,420 $ 1.75 4.67 320,420 $ 1.75 4.67 $1.86 to $2.63 111,502 $ 2.10 4.90 111,502 $ 2.10 4.90 $2.64 to $3.92 497,135 $ 3.85 6.45 362,061 $ 3.83 6.19 $3.93 to $5.14 661,175 $ 4.47 8.51 113,339 $ 5.06 6.72 $5.15 to $8.94 248,722 $ 7.19 5.60 248,722 $ 7.19 5.60 2,281,595 $ 3.42 6.11 1,598,685 $ 3.06 5.07
As of December 31, 2006,2007, the total future compensation cost related to non-vested options not yet recognized in the statement of income was $0.6$1.7 million and the weighted average period over which these awards are expected to be recognized was 2 years. The total intrinsic value of share options exercised during the year ended December 31, 2007, 2006 and 2005 and 2004 was $0.04 million, $1.6 million $0.1 million and $0.3$0.1 million, respectively. At December 31, 2006,2007, the total intrinsic value was $3.8$4.1 million and $3.5$3.6 million for stock options outstanding and exercisable, respectively.F-32
The following table summarizes restricted stock activity during the years ended December 31, 2004, 2005, 2006 and 2006:Number of
Shares
Weighted Average
Grant Date Fair
Value
Outstanding at December 31, 2003 1,115,000 $1.28 Granted 236,070 $6.39 Vested (371,673 ) $1.28 Forfeited (168,399 ) $2.09
Outstanding at December 31, 2004 810,998 $2.60 Granted 359,640 $3.94 Vested (433,623 ) $2.30 Forfeited (75,634 ) $4.58
Outstanding at December 31, 2005 661,381 $3.30 Granted 220,894 $5.14 Vested (445,025 ) $2.71 Forfeited (24,218 ) $4.83
Outstanding at December 31, 2006 413,032 $4.83
2007:
Weighted Number of Average Grant Shares Date Fair Value Outstanding at December 31, 2004 810,998 $ 2.60 Granted 359,640 $ 3.94 Vested (433,623 ) $ 2.30 Forfeited (75,634 ) $ 4.58 Outstanding at December 31, 2005 661,381 $ 3.30 Granted 220,894 $ 5.14 Vested (445,025 ) $ 2.71 Forfeited (24,218 ) $ 4.83 Outstanding at December 31, 2006 413,032 $ 4.83 Granted 497,990 $ 3.99 Vested (241,784 ) $ 4.82 Forfeited (66,043 ) $ 4.30 Outstanding at December 31, 2007 603,195 $ 4.20
The fair value of restricted stock is determined based on the closing stock price on the grant date. As of December 31, 2006,2007, there was $0.6 million of total unrecognized compensation cost related to restricted awards to be recognized over a weighted-averageweighted average period of 1.92.1 years.F-32
The following table summarizes performance shares activity during the year ended December 31, 2006:Number of
Shares
Weighted Average
Grant Date Fair
Value
Outstanding at December 31, 2005 -- $-- Granted 220,894 5.14 Exercised -- -- Forfeited (10,449 ) 5.14
Outstanding at December 31, 2006 210,445 $5.14
2007:
Weighted Number of Average Grant Shares Date Fair Value Outstanding at December 31, 2005 — $ — Granted 220,894 5.14 Exercised — — Forfeited (10,449 ) 5.14 Outstanding at December 31, 2006 210,445 $ 5.14 Granted 306,852 3.99 Exercised (30,298 ) 4.48 Forfeited (66,456 ) 4.47 Outstanding at December 31, 2007 420,543 $ 4.45
The fair value of performance shares is determined based on fair value modeling techniques that consider the closing price on the grant date.market and service conditions relevant for these grants. As of December 31, 2006,2007, there was $0.7 million of total unrecognized compensation cost related to performance shares to be recognized over a weighted average period of 2.11.9 years.NOTE M –N — DEFINED BENEFIT PENSION, POST-RETIREMENT MEDICAL BENEFIT, DEFINED CONTRIBUTION AND 401(k) PLANSOn
In June 2006, the Company completed the sale of 100% of the shares of its wholly owned subsidiary Coeur Silver Valley Inc. As a result, the liabilities were assumed by the purchaser and the Company has no longer maintainsfurther obligations related to the defined benefit plan and post retirement medical benefits plan summarized below.Defined Benefit Plan In connection with the acquisition of Coeur Silver Valley acquired in 1999, the Company was required to maintain non-contributory defined benefit pension plans covering substantially all employees. Benefits for salaried plans were based on salary and years of service. Hourly plans were based on negotiated benefits and years of service. The Company’s funding policy was to contribute annually the minimum amount prescribed, as specified by applicable regulations. Prior service costs and actuarial gains and losses were amortized over plan participants’ expected future period of service using the straight-line method.F-33
Actuarial Present Value of Projected Benefit Obligation: The actuarial present value of our projected benefit obligations was determined using the following assumptions:Factor 2005 2004 Discount Rate for Benefit Obligations 5.75% 6.0% Expected Return on Plan Assets 6.0% 6.0% Rate of Compensation Increases 5.0% 5.0%
Factor 2005 Discount Rate for Benefit Obligations 5.75 % Expected Return on Plan Assets 6.0 % Rate of Compensation Increases 5.0 %
Expected rate of return on plan assets: The expected rate of return on plan assets for purposes of the actuarial valuation was assumed to be 6% as of both December 31, 2005 and 2004.2005. The rate of return used was based on the plan’s experience and asset mix of the portfolio, as well as taking into consideration the fact that no lump sum distributions were paid from the plan. The plan had an expected return on plan assets of $0.3 million and $0.2 million for 2005 and 2004, respectively.2005. The actual return on plan assets was $0.2 million and $0.3 million for 2005 and 2004, respectively.2005. The discount rate was determined based on Moody’s Aaa bond rating.F-33
Plan assets and determination of fair value: The fair value of plan assets was determined using the market value of the investments held by the plan at December 31 of each year as quoted by public equity and bond markets. The asset mix iswas in accordance with the plan’s investment policy which allowed for 60% equity investments, 35% fixed income investments and 5% cash and cash equivalents. The investment portfolio for the funded portion of the obligation iswas held in a trust. The Company’s funding policy was to contribute amounts to the plan sufficient to meet the minimum funding requirements as set forth in the Employee Retirement Income Security Act of 1974 plus such additional tax deductible amounts as was advisable under the circumstances. The Company had funded $0.4 million through June 1, 2006 (the date of the Coeur Silver Valley sale), and $0.7 million and $0.7 million in 2005, and 2004, respectively, toward the obligation. The plan assets were invested principally in commingled stock funds, mutual funds and securities issued by the United States government. Pursuant to the plan’s investment policy, the plan adoptsadopted more specific investment directives from time to time. The plan’s actual portfolio at December 31, 2005 had 60% equity investments and 40% fixed income investments. Since the performance of each asset class of the portfolio within any measurement period impacted its relative weight in the portfolio, the actual percentage of each asset class in the portfolio may not have matched to the current directive. The expected long-term rates of return for each asset class within the portfolio, and therefore the portfolio weighted average, was based on an estimate of the return for each of the securities within an asset class, currently benchmarked at 10.0% for equity investments, 3.0% for fixed income investments and 2%2.0% for cash and cash equivalents. For each type of investment within the Trust’s portfolio structure, the Trustees evaluated both returns and the relationship between risk and return. The expectation was that each asset class would produce a superior risk-adjusted return over a market cycle.F-34
The following table shows the expected long term rates of return associated with each asset class:Asset Class
Actual Mix
Target Mix
Expected Long
Term Rates of
Return
Equity investments 60 % 60 % 10.00 % Fixed income investments 40 % 35 % 3.00 % Cash and cash equivalents 0 % 5 % 2.00 %
Weighted average 7.15 %
Expected Long Term Actual Target Rates of Asset Class Mix Mix Return Equity investments 60 % 60 % 10.00 % Fixed income investments 40 % 35 % 3.00 % Cash and cash equivalents 0 % 5 % 2.00 % Weighted average 7.15 %
The Trustees evaluated the level of volatility within the total Trust and each of its component investments. The Trustees set maximum volatility thresholds for each class of investment which consisted of 16% for equity investments, 7.25% for fixed income investments and 1% for cash and cash equivalents, with the total portfolio volatility expected to not exceed 11%. The Trustees then compared how these specific investments performed against other indexed funds and other managed portfolios with similar objectives. The specific criteria used to measure the performance was as follows: 1) A targeted 7-11% average annualized return based on long-term historical market data;
2) Expected returns over a market cycle that exceed the total portfolio indexed benchmark;
3) Volatility that was not substantially greater than the portfolio indexed benchmark volatility of 11%; and
4) Risk adjusted returns that were comparable with indexed benchmarks.
F-34
The components of net periodic benefit costs were as follows:follows (in thousands, except for discount rate): For the Year Ended December 31, 2005 Assumptions: Discount rate 5.75 % Components of net periodic benefit cost: Service cost $ 309 Interest cost 464 Expected return on plan assets (261 ) Amortization of prior service cost 59 Recognized actuarial loss 339 Net periodic benefit cost $ 910
F-35
For the Year Ended
December 31,
2006
2005
2004
Assumptions: Discount rate -- 5.75 % 6.0 % Components of net periodic benefit cost: Service cost -- $ 309 $ 319 Interest cost -- 464 412 Expected return on plan assets -- (261 ) (215 ) Amortization of prior service cost -- 59 56 Recognized actuarial loss -- 339 327
Net periodic benefit cost -- $ 910 $ 899
The change in benefit obligation and plan assets and a reconciliation of funded status were as follows:At December 31,
2006
2005
Change in benefit obligation Projected benefit obligation at beginning of year $ 8,405 $ 7,494 Service cost -- 309 Interest cost -- 464 Benefits paid (105 ) (217 ) Actuarial loss -- 355 Discontinued operations (8,300 ) --
Projected benefit obligation at end of year $ -- $ 8,405
Accumulated benefit obligation $ -- $ 6,606
Change in plan assets Fair value of plan assets at beginning of year $ 4,806 $ 4,098 Actual return on plan assets -- 205 Employer contributions 360 720 Benefits paid (105 ) (217 ) Discontinued operations (5,061 ) --
Fair value of plan assets at end of year $ -- $ 4,806
Reconciliation of funded status Funded status $ -- $ (3,599 ) Unrecognized actuarial loss -- 3,803 Unrecognized prior service cost -- 369
Net asset reflected in the consolidated balance sheet $ -- $ 573
Weighted average assumptions Discount rate -- 5.75 % Expected long-term rate of return on plan assets -- 6.0 % Rate of compensation increase -- 5.0 %
follows (in thousands):
At December 31, 2006 Change in benefit obligation Projected benefit obligation at beginning of year $ 8,405 Service cost — Interest cost — Benefits paid (105 ) Actuarial loss — Discontinued operations (8,300 ) Projected benefit obligation at end of year $ — Accumulated benefit obligation $ — Change in plan assets Fair value of plan assets at beginning of year $ 4,806 Actual return on plan assets — Employer contributions 360 Benefits paid (105 ) Discontinued operations (5,061 ) Fair value of plan assets at end of year $ — Reconciliation of funded status Funded status $ — Unrecognized actuarial loss — Unrecognized prior service cost — Net asset reflected in the consolidated balance sheet $ — Weighted average assumptions Discount rate — Expected long-term rate of return on plan assets — Rate of compensation increase —
Post Retirement Medical Benefits In connection with the acquisition of Coeur Silver Valley in 1999, the Company reimbursed Asarco, Inc. (prior owner) for certain healthcare benefits for retired employees and their dependents who retired before September 9, 1999. There were ten active hourly and salaried employees of Coeur Silver Valley and three inactive participants eligible under Asarco’s post-retirement medical benefits plan. These post-retirement medical benefits were self-insured by the plan’s prior sponsor. The actuarial present value of the post retirement benefit obligation iswas determined as of December 31 for each of the years presented.F-35
Actuarial Present Value of Projected Benefit Obligation: The discount rate was determined based on Moody’s Aaa Bond Rating as reported on the last business day of the plan year plus 0.50%. The Company amortized its unrecognized, unfunded accumulated post-retirement benefit obligation using a straight-line method over a 3.1-year period. The 3.1-year estimate was based on the average remaining service period of the active participants. Expected long-term rate of return on plan assets No assets arewere held in a trust for the post retirement health care plan; therefore, there iswas no expected long-term rate of return assumption. A “pay as you go” funding method was utilized for this plan. The Company contributed $0.01 million and $0.2 million to the plan as benefit payments for 2005 and 2004, respectively.2005.F-36
The following table sets forth the actuarial present value of postretirement medical benefit obligations and amounts recognized in the Company’s financial statements:At December 31,
2006
2005
(in thousands)
Assumptions: Discount rate -- 5.75 %
Change in benefit obligation Net benefit obligation at beginning of year $ 356 $ 1,973 Service cost -- 8 Interest cost -- 20 Prior service cost (credit) -- (387 ) Actuarial (gain) loss -- (1,248 ) Benefits paid -- (10 ) Discontinued operations (356 ) --
Net benefit obligation at end of year -- $ 356
Change in plan assets Assets at beginning of year $ -- $ -- Benefits paid -- (10 ) Contributions -- 10
Assets at end of year $ -- $ --
Reconciliation of funded status Funded status at end of year $ -- $ (356 ) Unrecognized net actuarial (gain) loss -- (815 ) Unrecognized prior service cost (credit) -- (262 )
Net amount recognized at end of year (recorded as accrued benefit cost in the accompanying balance sheet) $ -- $ (1,433 )
F-36
statements (in thousands, except for discount rate):
At December 31, 2006 2005 Assumptions: Discount rate — 5.75 % Change in benefit obligation Net benefit obligation at beginning of year $ 356 $ 1,973 Service cost — 8 Interest cost — 20 Prior service cost (credit) — (387 ) Actuarial (gain) loss — (1,248 ) Benefits paid — (10 ) Discontinued operations (356 ) — Net benefit obligation at end of year — $ 356 Change in plan assets Assets at beginning of year $ — $ — Benefits paid — (10 ) Contributions — 10 Assets at end of year $ — $ — Reconciliation of funded status Funded status at end of year $ — $ (356 ) Unrecognized net actuarial (gain) loss — (815 ) Unrecognized prior service cost (credit) — (262 ) Net amount recognized at end of year (recorded as accrued benefit cost in the accompanying balance sheet) $ — $ (1,433 )
The components of net periodic benefit costs were as follows:For the Year Ended December 31,
2006
2005
2004
(in thousands)
Assumptions: Discount rate -- 6.0 % 6.0 %
Components of net periodic benefit cost: Service cost -- $ 8 $ 17 Interest cost -- 20 116 Amortization of prior service cost -- (125 ) -- Amortization of actuarial gain -- (372 ) --
Net periodic pension cost (benefit) -- $ (469 ) $ 133
follows (in thousands, except for discount rate):
For the Year Ended December 31, 2006 2005 Assumptions: Discount rate — 6.0 % Components of net periodic benefit: Service cost — $ 8 Interest cost — 20 Amortization of prior service cost — (125 ) Amortization of actuarial gain — (372 ) Net periodic pension benefit — $ (469 )
During 2005, an adjustment was required to reflect a decreased liability of $1.6 million related to a reduction in plan participation. This adjustment resulted in an actuarial gain. The amortization of the prior service cost of $0.4 million and the unrealized actuarial gain of $1.2 million is greater than 10% of the benefit obligation which required the gain to be amortized over the average remaining service period of the active participants, estimated to be approximately 3.1 years. The amortization of the unrealized gain is included as a component on net periodic benefit cost. The Company also amortized the unrecognized actuarial gain over the same period.F-37
A 1% change in assumed medical trend rates would have had the following effects:(in thousands) 1% Increase
1% Decrease
2005
2004
2005
2004
Effect on total of service and interest cost components $ 2 $ 8 $ (2 ) $ (7 ) Effect on postretirement benefit obligation $ 22 $ 106 $ (19 ) $ (91 )
effects (in thousands):
1% 1% Increase Decrease 2005 2005 Effect on total of service and interest cost components $ 2 $ (2 ) Effect on postretirement benefit obligation $ 22 $ (19 )
Postretirement benefits included medical benefits for retirees and their dependents. In December 2003, The Medicare Prescription Drug, Improvement and Modernization Act of 2003 was enacted. Our accumulated postretirement benefit obligation and net periodic postretirement obligation do not reflect the effects that the requirements of this law since eligibility under this plan ends at age 65.Defined Contribution Plan The Company provides a noncontributory defined contribution retirement plan for all eligible U.S. employees. Total contributions charged to expense were $1.2$0.8 million, $0.9$1.2 million and $0.9 million for 2007, 2006 2005 and 2004,2005, respectively, which is based on a percentage of the salary of eligible employees.401(k) Plan The Company maintains a retirement savings plan (which qualifies under Section 401(k) of the U.S. Internal Revenue code) covering all eligible U.S. employees. Under the plan, employees may elect to contribute up to 100% of their cash compensation, subject to ERISA limitations. The Company is required to make matching cash contributions equal to 50% of the employees’ contribution, up to a maximum of 3% of the employees’ compensation. Contributions to the plan charged to operations were $0.6 million, $0.5$0.6 million and $0.5 million in 2007, 2006, and 2005, and 2004, respectively.F-37
NOTE NO — DERIVATIVE FINANCIAL INSTRUMENTS AND FAIR VALUE OF FINANCIAL INSTRUMENTS The Company enters into derivative instruments to manage the Company’s exposure to foreign currency exchange rates and market prices associated with changes in gold and silver commodity prices. The Company accounts for its derivative contracts in accordance with SFAS No. 133, “Accounting for Derivative Instruments and Hedging Activities.” Accordingly, unrealized gains and losses related to the change in fair market value of derivative contracts, which qualify and are designated as cash flow hedges, are recorded as other comprehensive income or loss and such amounts are recognized into earnings as the associated contracts are settled.Forward Foreign Exchange Contracts During 20062007 and 2005,2006, the Company entered into forward foreign currency exchange contracts to reduce the foreign exchange risk associated with forecasted Chilean peso operating costs for 2007 and 2008 at its Cerro Bayo mine. The contracts entered into in 20062007 require the Company to exchange U.S. dollars for Chilean pesos at a weighted average exchange rate of 531503 pesos to each U.S. dollar. At December 31, 20062007 and 2005,2006, the Company had foreign exchange contracts of $4.8$9.0 million and $7.2$4.8 million in U.S. dollars, respectively. For the years ended December 31, 20062007 and 2005,2006, the Company recorded a realized gain (loss) of approximately $(0.4)$0.4 million and $0.1$(0.4) million, respectively, in connection with its foreign currency hedging program. As of December 31, 2006,2007, the fair value of the foreign exchange contracts was a liability of $0.1 million. Change in gains (losses) accumulated in other comprehensive income (loss) for cash flow hedging contracts are as follows:follows (in thousands):F-38
December 31, 2006
2005
2004
(in thousands) Beginning balance $ (171 ) $ -- $ 131 Reclassification to earnings 379 (68 ) 8 Change in fair value (268 ) (103 ) (139 )
Ending balance $ (60 ) $ (171 ) $ --
December 31, 2007 2006 2005 Beginning balance $ (60 ) $ (171 ) $ — Reclassification to earnings (371 ) 379 (68 ) Change in fair value 349 (268 ) (103 ) Ending balance $ (82 ) $ (60 ) $ (171 )
Commodity Derivatives The Company has occasionally entered into forward metal sales contracts to manage the price risk onassociated with a portion of its cash flows against fluctuating gold prices. As of December 31, 2006,2007, the Company had no outstanding forward sales contracts for either gold or silver. For metal delivery contracts, the realized price pursuant to the contract is recognized when physical gold or silver is delivered in satisfaction of the contract. For the year ended December 31, 2004, the Company incurred realized hedging losses of $1.2 million.Concentrate Sales Contracts The Company enters into concentrate sales contracts with third-party smelters. The contracts, in general, provide for a provisional payment based upon provisional assays and quoted metal prices and the provisionally priced sales contain an embedded derivative that is required to be separated from the host contract for accounting purposes. The host contract is the receivable from the sale of concentrates at the forward price at the time of sale. The embedded derivative, which is the final settlement price based on a future price, does not qualify for hedge accounting. These embedded derivatives are recorded as derivative assets (in Prepaid expenses and other), or derivative liabilities (in Accrued liabilities and other), on the balance sheet and are adjusted to fair value through earnings each period until the date of final settlement.F-38
At December 31, 2007, the Company had outstanding provisionally priced sales of $61.2 million consisting of 3.3 million ounces of silver and 20,775 ounces of gold, which had a fair value of approximately $63.8 million including the embedded derivative. At December 31, 2006, the Company had outstanding receivables for provisionally priced sales of $74.5 million, consisting of 4.6 million ounces of silver and 29,577 ounces of gold, which had a fair market value of approximately $75.6 million including the embedded derivative. At December 31, 2005, the Company had outstanding receivables for provisionally priced sales of $47.0 million, consisting of 3.5 million ounces of silver and 40,000 ounces of gold, which had a fair market value of approximately $49.3 million including the embedded derivative.
Credit Risk The credit risk exposure related to any potential hedging activities is limited to the unrealized gains, if any, on outstanding contracts based on current market prices. To reduce counter-party credit exposure, the Company deals only with a group of large credit-worthy financial institutions and limits credit exposure to each. The Company does not anticipate non-performance by any of its counter parties. In addition, to allow for situations where positions may need to be revised, the Company deals only in markets that it considers highly liquid.NOTE OP — COMMITMENTS AND CONTINGENCIESLabor Union Contract The Company maintains two labor agreements in South America, consisting of a labor agreement with Syndicato de Trabajadores de Compañía Minera Cerro Bayo Ltd. at its Cerro Bayo mine in Chile and with Associacion Obrera Minera Argentina at its Martha mine in Argentina. The agreement at Cerro Bayo is effective from December 22, 200524, 2007 to December 21, 20072010 and the agreement at Mina Martha is effective from June 12, 2006 to June 1, 2008. Additionally certain employees at San Bartolomé are covered by a labor agreement that became effective October 11, 2008.2007; this Bolivian labor agreement does not have a fixed term. As of December 31, 2006,2007, the Company had approximately 20%44% of its worldwide labor force covered by collective bargaining agreements.F-39
Termination Benefits In September 2005, the Company established a one-time termination benefit program at the Rochester mine as the mine approaches the end of its mine life. The employees will be required to render service until they are terminated in order to be eligible for benefits. Approximately 80% of the workforce is expected to bewas severed by mid-2007,the end of the third quarter of 2007, while the remaining 20% are expected to stay on for residual leaching and reclamation activities. As of December 31, 2006,2007, the total amount expected to be incurred under this plan is approximately $3.4$4.7 million. The liability is recognized ratably over the minimum future service period. The amount accrued as of December 31, 2006 was $2.0 million and was charged to production costs. The following is a description of the changes to the Company’s termination benefits for the years ended December 31, 2007, 2006 and 2005 and 2004.Year Ended December 31, 2006
2005
2004
(in thousands) Beginning Balance $ 542 $ -- $ -- Accruals 1,803 542 -- Payments (386 ) -- --
Ending Balance $ 1,959 $ 542 $ --
(in thousands):
Year Ended December 31, 2007 2006 2005 Beginning Balance $ 1,959 $ 542 $ — Accruals 1,917 1,803 542 Payments (3,056 ) (386 ) — Ending Balance $ 820 $ 1,959 $ 542
NOTE PQ — SIGNIFICANT CUSTOMERS The Company markets its metals products and concentrates primarily to bullion trading banks and five third party smelters. These customers then sell the metals to end users for use in industry applications such as electronic circuitry, jewelry and silverware production and the manufacture and development of photographic film. Sales of metals to bullion trading banks amounted to approximately 47%, 45%47% and 59%45% of total metals sales in 2007, 2006 2005 and 2004,2005, respectively. Generally, the loss of a single bullion trading bank customer would not adversely affect the Company in view of the liquidity of the markets and availability of alternative trading banks.F-39
The Company currently markets its silver and gold concentrates to third party smelters in Japan, Mexico, Australia and Germany. Sales of metals concentrates to third party smelters amounted to approximately 53%, 55%53% and 41%55% of metals sales in 2007, 2006 2005 and 2004,2005, respectively. The loss of any one smelter customer could have a material adverse effect on the Company in the event of the possible unavailability of alternative smelters.NOTE QR — SEGMENT INFORMATION Operating segments are defined as components of an enterprise about which separate financial information is available that is evaluated regularly by the chief operating decision maker, or decision-making group, in deciding how to allocate resources and in assessing performance. The Company’s chief operating decision-making group is comprised of the Chief Executive Officer, Chief Financial Officer, the Senior Vice President of North American Operations and the President of South American Operations. The operating segments are managed separately because each segment represents a distinct use of Company resources which contribute to Company cash flows in its respective geographic area. The Company’s reportable operating segments include the Rochester, Cerro Bayo, Martha, San Bartolome,Bartolomé, Kensington, Palmarejo and CDE Australia (Endeavor and Broken Hill) mining properties. All operating segments are engaged in the discovery and/or mining of gold and silver and generate the majority of their revenues from the sale of these precious metal concentrates and/or refined precious metals. The Cerro Bayo and Martha mines sell precious metal concentrates, typically under long-term contracts, to a smelter located in Japan (Dowa Mining Ltd.), Mexico (Met-Mex Penoles) and Germany (Noordeutche)(Norddeutsche). Refined gold and silver produced by the Rochester mine is principally sold on a spot basis to precious metals trading banks such as Standard Bank and Mitsui. Concentrates produced at CDE Australia (Endeavor and Broken Hill mines) are sold to Zinifex,Nystar (formerly Zinifex), an Australia smelter. The Company’s exploration programs are included as other. The other segment also includes the corporate headquarters, elimination of intersegment transactions and other items necessary to reconcile to consolidated amounts.F-40
The accounting policies of the operating segments are the same as those described in the summary of significant accounting policies above. The Company evaluates performance and allocates resources based on profit or loss before interest, income taxes, depreciation and amortization, unusual and infrequent items, and extraordinary items. Revenues from silver sales were $151.0 million, $147.8 million and $91.9 million in 2007, 2006, and $63.1 million in 2006, 2005, and 2004, respectively. Revenues from gold sales were $64.3 million, $68.8 million and $64.4 million in 2007, 2006, and $45.9 million in 2006, 2005, and 2004, respectively. Financial information relating to the Company’s segments is as follows:Rochester
Mine
Cerro
Bayo Mine
Martha
Mine
Endeavor
Mine
Broken Hill
Mine
San
Bartolome
Project
Kensington
Project
Other
Total
2006
Total net sales and revenues $ 102,393 $ 50,293 $ 34,733 $ 5,363 $ 23,791 $ -- $ -- $ -- $ 216,573
Depreciation and depletion $ 13,745 $ 5,795 $ 1,313 $ 490 $ 5,120 $ -- $ -- $ 309 $ 26,772 Interest income -- 663 39 -- -- -- 8 17,276 17,986 Interest expense -- 84 -- -- -- -- -- 1,140 1,224 Litigation settlement -- -- -- -- -- -- -- (2,365 ) (2,365 ) Income tax (benefit) provision from continuing operations -- (2,930 ) 4,689 -- -- -- -- 6,500 8,259 Segment profit (loss) 55,109 22,652 17,290 4,977 �� 19,427 (6 ) (1,030 ) (4,413 ) 114,006
Segment assets (A) 87,423 49,428 11,596 14,508 29,740 59,080 207,745 10,326 469,846 Capital expenditures 1,225 7,555 2,481 -- -- 14,597 121,552 588 147,998
F-40
Rochester
Mine
Cerro
Bayo Mine
Martha
Mine
Endeavor
Mine
Broken Hill
Mine
San
Bartolome
Project
Kensington
Project
Other
Total
2005
Total net sales and revenues $ 69,636 $ 59,624 $ 20,606 $ 2,148 $ 4,270 $ -- $ -- $ -- $ 156,284
Depreciation and depletion $ 10,403 $ 5,064 $ 860 $ 411 $ 1,807 $ -- $ 35 $ 309 $ 18,889 Interest income -- 154 (1 ) -- -- -- -- 9,036 9,189 Interest expense -- 26 -- -- -- -- -- 2,459 2,485 Litigation settlement -- -- -- -- -- -- -- (1,600 ) (1,600 ) Income tax (benefit) provision from continuing operations -- 2,154 (863 ) -- -- -- -- 192 1,483 Segment profit (loss) 24,876 22,978 6,105 1,700 3,282 (119 ) (7,143 ) (12,476 ) 39,203
Segment assets (A) 82,806 45,474 6,291 14,999 34,860 32,687 80,653 7,982 305,752 Capital expenditures 1,197 2,731 2,108 15,410 36,667 10,477 44,201 499 113,290
Rochester
Mine
Cerro
Bayo Mine
Martha
Mine
Endeavor
Mine
Broken Hill
Mine
San
Bartolome
Project
Kensington
Project
Other
Total
2004
Total net sales and revenues $ 64,005 $ 35,267 $ 9,775 $ -- $ - $ -- $ -- $ -- $ 109,047
Depreciation and depletion $ 10,229 $ 4,588 $ 1,669 $ -- $ - $ 4 $ 52 $ 291 $ 16,833 Interest income -- 13 -- -- -- -- -- 3,626 3,639 Interest expense 1 123 -- -- -- -- -- 2,707 2,831 Loss on forward sales contracts -- -- -- -- -- -- -- (936 ) (936 ) Income tax (benefit) provision from continuing operations -- (4,403 ) -- -- -- -- -- (1,382 ) (5,785 ) Merger expenses -- -- -- -- -- -- -- 15,676 15,676 Segment profit (loss) 26,784 9,638 (387 ) -- -- (4,549 ) (7,347 ) (11,684 ) 12,455
Segment assets (A) 75,529 30,898 3,387 -- -- 21,304 25,833 5,813 162,764 Capital expenditures 3,548 2,451 689 -- -- 950 83 642 8,363
Notes:
follows (in thousands): Broken San Rochester Cerro Bayo Martha Endeavor Hill Bartolomé Kensington Palmarejo Mine Mine Mine Mine Mine Project Project Project Other Total December 31, 2007 Total net sales of metals $ 100,903 $ 47,794 $ 38,077 $ 7,943 $ 20,602 $ — $ — $ — $ — $ 215,319 Productions costs applicable to sales 60,364 35,594 17,231 545 3,292 — (1 ) — — 117,025 Depreciation and depletion 8,697 6,260 1,731 755 3,054 — — — 487 20,984 Exploration expense 361 2,908 4,418 — — — 619 — 3,635 11,941 Other operating expenses 62 113 38 — — — 38 — 24,131 24,382 Interest and other income 2,948 1,590 (303 ) — — — 85 — 13,875 18,195 Interest expense — 23 — — — — — — 342 365 Income tax (credit) expense — 1,662 6,418 — — — 20 — 6,827 14,927 Profit (loss) $ 34,367 $ 2,824 $ 7,938 $ 6,643 $ 14,256 $ — $ (591 ) $ — $ (21,547 ) $ 43,890 Segment assets(A) $ 62,848 $ 63,570 $ 25,799 $ 17,885 $ 29,391 $ 169,196 $ 301,730 $ 1,759,153 $ 7,470 $ 2,437,042 Capital expenditures $ 1,647 $ 11,330 $ 16,444 $ 2,112 $ 213 $ 100,169 $ 92,337 $ — $ 1,942 $ 226,194
Broken San Rochester Cerro Bayo Martha Endeavor Hill Bartolomé Kensington Mine Mine Mine Mine Mine Project Project Other Total December 31, 2006 Total net sales of metals $ 102,393 $ 50,293 $ 34,733 $ 5,363 $ 23,791 $ — $ — $ — $ 216,573 Productions costs applicable to sales 47,310 27,780 12,538 386 4,364 — — — 92,378 Depreciation and depletion 13,745 5,795 1,313 490 5,120 — — 309 26,772 Exploration expense — 2,639 2,904 — — — 936 2,995 9,474 Other operating expenses — 28 17 — — — 108 21,581 21,734 Interest and other income 25 809 13 — — (6 ) 13 17,800 18,654 Interest expense — 84 — — — — — 1,140 1,224 Income tax (credit) expense — (2,930 ) 4,777 — — — — 6,379 8,226 Profit (loss) $ 41,364 $ 17,707 $ 13,196 $ 4,487 $ 14,307 $ (6 ) $ (1,031 ) $ (14,605 ) $ 75,419 Segment assets(A) $ 87,371 $ 49,428 $ 11,508 $ 15,666 $ 32,894 $ 59,080 $ 207,745 $ 6,154 $ 469,846 Capital expenditures $ 1,225 $ 7,555 $ 2,481 $ — $ — $ 16,805 $ 122,640 $ 588 $ 151,294
Broken San Rochester Cerro Bayo Martha Endeavor Hill Bartolomé Kensington Mine Mine Mine Mine Mine Project Project Other Total December 31, 2005 Total net sales of metals $ 69,636 $ 59,624 $ 20,606 $ 2,148 $ 4,270 $ — $ — $ — $ 156,284 Productions costs applicable to sales 44,547 33,574 9,016 278 817 — — — 88,232 Depreciation and depletion 10,403 5,064 860 411 1,807 — 35 309 18,889 Exploration expense 169 4,812 2,976 — — 83 1,165 1,431 10,636 Other operating expenses 225 110 690 — — — 5,979 21,194 28,198 Interest and other income 181 224 (172 ) — — (36 ) — 8,188 8,385 Interest expense — 26 92 — — — — 2,367 2,485 Income tax (credit) expense — 2,154 (862 ) — — — — 191 1,483 Profit (loss) $ 14,473 $ 14,108 $ 7,662 $ 1,459 $ 1,646 $ (119 ) $ (7,179 ) $ (17,304 ) $ 14,746 Segment assets(A) $ 82,631 $ 45,474 $ 3,791 $ 15,152 $ 36,493 $ 32,687 $ 80,653 $ 8,871 $ 305,752 Capital expenditures $ 1,197 $ 2,731 $ 2,108 $ 15,410 $ 36,667 $ 11,089 $ 53,155 $ 499 $ 122,856
(A) Segment assets consist of receivables, prepaids, inventories, property, plant and equipment, and mining properties.
2006
2005
2004
Income (loss) Total segment profit $ 114,006 $ 39,203 $ 12,455 Depreciation and amortization (26,772 ) (18,889 ) (16,833 ) Interest expense (1,224 ) (2,485 ) (2,831 ) Other (2,365 ) (1,600 ) (16,612 )
Income (loss) from continuing operations before income taxes $ 83,645 $ 16,229 $ (23,821 )
Assets Total assets for reportable segments $ 469,846 $ 305,752 $ 162,764 Cash and cash equivalents 270,672 54,896 65,218 Short-term investments 70,373 185,446 256,843 Other assets 38,735 33,894 28,350 Assets held for sale -- 14,828 12,602
Total consolidated assets $ 849,626 $ 594,816 $ 525,777
F-41
Geographic Information 2006 Revenues
Long-Lived
Assets
United States $ 102,393 $ 218,236 Australia 29,154 44,253 Chile 50,293 20,295 Argentina 34,733 3,700 Bolivia -- 50,858 Other foreign countries -- 214
Total $ 216,573 $ 337,556
2005
United States $ 69,636 $ 101,338 Australia 6,418 49,860 Chile 59,624 19,407 Argentina 20,606 2,568 Bolivia -- 32,194 Other foreign countries -- 237
Total $ 156,284 $ 205,604
2004
United States $ 64,005 $ 54,306 Australia -- -- Chile 35,267 15,332 Argentina 9,775 1,050 Bolivia -- 21,103 Other foreign countries -- 144
Total $ 109,047 $ 91,935
(a)Includes property, plant and equipment and mineral properties.
2007 2006 2005 Assets Total assets for reportable segments $ 2,437,042 $ 469,846 $ 305,752 Cash and cash equivalents 98,671 270,672 54,896 Short-term investments 53,039 70,373 185,446 Other assets 62,942 38,735 33,894 Total assets held for sale — — 14,828 Total consolidated assets $ 2,651,694 $ 849,626 $ 594,816
Geographic Information Long-Lived Revenues Assets 2007 United States $ 100,903 $ 305,876 Australia 28,545 42,772 Chile 47,794 28,028 Argentina 38,077 18,640 Mexico — 1,756,042 Bolivia — 151,716 Other foreign countries — 190 Total $ 215,319 $ 2,303,264 2006 United States $ 102,393 $ 218,236 Australia 29,154 44,253 Chile 50,293 20,295 Argentina 34,733 3,700 Bolivia — 50,858 Other foreign countries — 214 Total $ 216,573 $ 337,556 2005 United States $ 69,636 $ 101,338 Australia 6,418 49,860 Chile 59,624 19,407 Argentina 20,606 2,568 Bolivia — 32,194 Other foreign countries — 237 Total $ 156,284 $ 205,604
NOTE RS — LITIGATIONFederal Natural Resources Action
On March 22, 1996, an action was filed in the United States District Court for the District of Idaho by the United States against various defendants, including the Company, asserting claims under CERCLA and the Clean Water Act for alleged damages to federal natural resources in the Coeur d’Alene River Basin of Northern Idaho. The damages are claimed to result from alleged releases of hazardous substances from mining activities conducted in the area since the late 1800s.
In May 2001, the Company and representatives of the U.S. Government, including the Environmental Protection Agency, the Department of Interior and the Department of Agriculture, reached an agreement to settle the lawsuit. The terms of settlement are set forth in a Consent Decree issued by the court. Pursuant to the terms of the Consent Decree, dated May 14, 2001, the Company has paid the U.S. Government a total of approximately $3.9 million, of which $3.3 million was paid in May 2001 and the remaining $0.6 million was paid in June 2001. In addition, the Company will (i) pay the United States 50% of any future recoveries from insurance companies for claims for defense and indemnification under general liability insurance policies in excess of $0.6 million, (ii) accomplish certain cleanup work on the Mineral Point property and Caladay property, and (iii) make a conveyance to the U.S. or the State of Idaho of certain real property to possibly be used as a waste repository. Finally, commencing five years after effectiveness of the settlement, the Company will be obligated to pay royalties on all of its domestic and foreign operating properties, up to a cumulative of $3 million, amounting to a 2% net smelter royalty on silver production if the price of silver exceeds $6.50 per ounce, and a $5.00 per ounce royalty on gold production if the price of gold exceeds $325 per ounce. The royalty payment obligation commenced on May 14, 2006 and expires May 14, 2021. As of December 31, 2006, $2.5 million (including discontinued operations) of the $3.0 million was paid. It is expected that the remaining $0.5 million will be paid in the first half of 2007.
F-42
States of Maine, Idaho Andand Colorado Superfund Sites Related to Callahan Mining Corporation During 1991, the Company acquired all of the outstanding common stock of Callahan Mining Corporation. During 2001, the United States Forest Service made a formal request for information regarding the Deadwood Mine Site located in central Idaho. Callahan Mining Corporation had operated at this site during the 1940‘s.1940’s. The Forest Service believes that some cleanup action is required at the location. However, Coeur d’Alene Mines Corporation did not acquire Callahan until 1991, more than 40 years after Callahan disposed of its interest in the Deadwood property. The Company did not make any decisions with respect to generation, transport or disposal of hazardous waste at the site. Therefore, it is believed that the Company is not liable for any cleanup, and if Callahan might be liable, it has no substantial assets with which to satisfy any such liability. To date, no claim has been made by the United States for any cleanup costs against either the Company or Callahan.F-42
During 2002, the EPA made a formal request for information regarding a Callahan mine site in the State of Maine. Callahan operated there in the late 1960‘s,1960’s, shut the operations down in the early 1970‘s1970’s and disposed of the property. The EPA contends that some cleanup action is warranted at the site, and listed it on the National Priorities List in late 2002. The Company believes that because it made no decisions with respect to generation, transport or disposal of hazardous waste at this location, it is not liable for any cleanup costs. If Callahan might have liability, it has no substantial assets with which to satisfy such liability. To date, no claim has been made for any cleanup costs against either the Company or Callahan. In January 2003, the U.S. Forest Service made a formal request for information regarding a Callahan mine site in the State of Colorado known as the Akron Mine Site. Callahan operated there in approximately the late 1930s through the 1940s, and to the Company’s knowledge, disposed of the property. The Company is not aware of what, if any, cleanup action the Forest Service is contemplating. However, the Company did not make decisions with respect to generation, transport or disposal of hazardous waste at this location, and therefore believes it is not liable for any cleanup costs. If Callahan might have liability, it has no substantial assets with which to satisfy such liability. To date, no claim has been made for any cleanup costs against either the Company or Callahan.Federal District Court of Alaska Permit Challenge On September 12, 2005 three environmental groups (“Plaintiffs”) filed a lawsuit in Federal District Court in Alaska against the U.S. Army Corps of Engineers (“Corps of Engineers”) and the U.S. Forest Service (“USFS”) seeking to invalidate the permit issued to Coeur Alaska, Inc. for the Company’s Kensington mine. The Plaintiffs claim the Clean Water Act (CWA)(“CWA”) Section 404 permit issued by the Corps of Engineers authorizing the deposition of mine tailings into Lower Slate Lake conflicts with the CWA and is thus illegal.CWA. They additionally claim the USFS’s approval of the Amended Plan of Operations is arbitrary and capricious because it relies on the 404 permit issued by the Corps of Engineers. On November 8, 2005, Following the Corps of Engineers filed a Motion for Voluntary Remand with the court to review the permit issued to the Company under the CWA Section 404 and requested that the court stay the legal proceeding filed by the plaintiffs pending the outcome of review. On November 12, 2005, the Federal District Court in Alaska granted theCourt’s remand of the Section 404 permit to the Corps of Engineers for further review. On November 22, 2005,review, the Corps of Engineers advised the Company that it was suspending the Section 404 permit pursuant to the Court’s remand to further review the permit.
On March 29, 2006, the Corps of Engineers reinstated the Company’s 404 permit. On April 6, 2006 thepermit on March 29, 2006. The lawsuit challenging the permit was re-opened andon April 6, 2006; Coeur Alaska Inc. filed its answer to the Amended ComplaintComplaint; and Motion to Intervene as a Defendant-Intervenor in the action. Two other parties,Coeur Alaska, the State of Alaska, and Goldbelt, Inc., a local native corporation, also filed Motions to Intervene as Defendant-Intervenors as supporters of the Kensington project as permitted. The Company, the State of Alaska and Goldbelt, Inc. were granted Defendant-Intervenor status and joinedto join the agencies in their defense of the permits as issued.
F-43
permit.
On August 4, 2006, the Federal District Court in Alaska dismissed the Plaintiffs’ challenge and upheld the Section 404 permit. On August 7, 2006 the Plaintiffs filed a Notice of Appeal of the decision to the Ninth Circuit Court of Appeals (“Ninth Circuit Court”) and on August 9, 2006 the Plaintiffs additionally filed a Motion for Injunction Pending Appeal with the Ninth Circuit Court. The Ninth Circuit Court granted a temporary injunction pending appeal on August 24, 2006, enjoining certain activities relating to the lake tailings facility. The On May 22, 2007 the Ninth Circuit Court further ordered an expedited briefing schedulereversed the District Court’s August 4, 2006 decision which had upheld the Company’s 404 permit and issued its opinion that remanded the case to the District Court with instructions to vacate the Company’s 404 permit as well as the USFS Record of Decision approving the general tailings disposal plan as well as the Goldbelt 404 permit to construct the Cascade Point Marine Facility. On August 20, 2007, Coeur Alaska filed a Petition for Rehearing En Banc with the Ninth Circuit Court, as did the State of Alaska and Goldbelt, Inc. The Department of Justice, on the meritsbehalf of the legal challenge. AsCorps of Engineers, and USFS additionally filed a limited Petition for Rehearing with the Ninth Circuit panel seeking reconsideration of the mandate of the May 22, 2007 panel decision. On October 13, 2006,29, 2007, the parties filed their briefs inNinth Circuit denied the Petitions for Rehearing En Banc. On November 14, 2007, the Ninth Circuit granted a stay of the mandate pending further appeal to the Supreme Court, and participated in an oral argument on December 4, 2006. There is no indicationsubject to the development of whena reclamation plan for the Circuit Court may rule on the merits of appeal.lake area. The Company is unableand the State of Alaska filed Petitions for Certiorari to the Supreme Court of the United States on January 28, 2008. The Company cannot now predict the outcome ofpotential for obtaining further appeal or if it will prevail upon appeal if one is granted.F-43
No assurance can be given as to whether or when regulatory permits and approvals granted to the litigation.Company may be further challenged, appealed or contested by third parties or issuing agencies, or as to whether the Company will place the Kensington project into commercial production.
This litigation has contributed to an increase in capital costs. While the Company cannot now predict with certainty the outcome of this litigation, it believes it willshould ultimately prevail in the defense of the awarded permits, inprevail. In the event that the Company does not prevail, it could be necessary to seek an alternate site for the tailings disposal facility. The Company is not aware ofhas identified an alternate site that couldwhich it believes can be permitted or would be economic. Therefore, it is possible that an adverse legal decision could renderand has submitted a modified plan to the project uneconomic and an asset impairment would be necessary. As a result ofUSFS. Based upon the increase in capital and operating costs at the Kensington project,Company’s current estimates, an impairment writedown could be necessary should the expectation of the long-term price for gold decrease below approximately $510$606 per ounce. As of December 31, 2006,2007, the Kensington project has a carrying value of $206the Kensington project’s long-lived assets was $298.2 million.NOTE ST — SUMMARY OF QUARTERLY FINANCIAL DATA (UNAUDITED) The following table sets forth a summary of the quarterly results of operations for the years ended December 31, 2007 and 2006 and 2005:First
Quarter
Second
Quarter
Third
Quarter
Fourth
Quarter
(In Thousands - Except Per Share Data)
2006: Sales of metal $ 44,854 $ 54,041 $ 50,606 $ 67,072
Income (loss) from continuing operations $ 13,726 $ 20,132 $ 18,378 $ 23,183 Income (loss) from discontinued operations 612 12,516 (27 ) (33 )
Net income (loss) $ 14,338 $ 32,648 $ 18,351 $ 23,150
Basic net income (loss) per share Income (loss) from continuing operations $ 0.06 $ 0.07 $ 0.07 $ 0.08 Income (loss) from discontinued operations -- 0.05 -- --
Net income (loss) $ 0.06 $ 0.12 $ 0.07 $ 0.08
Diluted net income (loss) per share Income (loss) from continuing operations $ 0.05 $ 0.07 $ 0.06 $ 0.08 Income (loss) from discontinued operations -- 0.04 -- --
Net income (loss) $ 0.05 $ 0.11 $ 0.06 $ 0.08
(in thousands — except for per share data): First Second Third Fourth Quarter Quarter Quarter Quarter 2007: Sales of metal $ 50,860 $ 51,664 $ 52,863 $ 59,931 Net income $ 14,018 $ 11,918 $ 3,635 $ 14,319 Basic net income per share $ 0.05 $ 0.04 $ 0.01 $ 0.05 Diluted net income per share $ 0.05 $ 0.04 $ 0.01 $ 0.04
First Second Third Fourth Quarter Quarter Quarter Quarter 2006: Sales of metal $ 44,854 $ 54,041 $ 50,606 $ 67,072 Income from continuing operations $ 13,726 $ 20,132 $ 18,378 $ 23,183 Income from discontinued operations 612 12,516 (27 ) (33 ) Net income $ 14,338 $ 32,648 $ 18,351 $ 23,150 Basic net income per share Income from continuing operations $ 0.06 $ 0.07 $ 0.07 $ 0.08 Income from discontinued operations — 0.05 — — Net income $ 0.06 $ 0.12 $ 0.07 $ 0.08 Diluted net income per share Income from continuing operations $ 0.05 $ 0.07 $ 0.06 $ 0.08 Income from discontinued operations — 0.04 — — Net income $ 0.05 $ 0.11 $ 0.06 $ 0.08
F-44
First
Quarter
Second
Quarter
Third
Quarter
Fourth
Quarter
(In Thousands - Except Per Share Data)
2005: Sales of metal $ 32,235 $ 33,504 $ 39,281 $ 51,264 Income (loss) from continuing operations $ (784 ) $ (529 ) $ 4,722 $ 11,337 Income (loss) from discontinued operations (361 ) (1,172 ) (1,269 ) (1,393 )
Net income (loss) $ (1,145 ) $ (1,701 ) $ 3,453 $ 9,944
Basic net income (loss) per share Income (loss) from continuing operations $ 0.00 $ 0.00 $ 0.02 $ 0.05 Income (loss) from discontinued operations -- (0.01 ) (0.01 ) (0.01 )
Net income (loss) $ 0.00 $ (0.01 ) $ 0.01 $ 0.04
Diluted net income (loss) per share Income (loss) from continuing operations $ 0.00 $ 0.00 $ 0.02 $ 0.04 Income (loss) from discontinued operations -- (0.01 ) (0.01 ) --
Net income (loss) $ 0.00 $ (0.01 ) $ 0.01 $ 0.04
NOTE U — SUBSEQUENT EVENTDuring February 2008, Cobar reported to the Company that the reserves at the Endeavor mine exceed those reported for 2004, thereby fulfilling the contractual condition discussed in Note H. Consequently, the Company expects to pay Cobar the additional $26.3 million on April 1, 2008 plus accrued interest at the rate of 7.5% per annum from January 24, 2008.F-45
Coeur d’Alene Mines Corporation:
/s/
February
29, 2008
F-2
Coeur d’Alene Mines Corporation:
F-3
/s/
February
29, 2008
F-4
CONSOLIDATED BALANCE SHEETS
| December 31, | ||||||||
| 2006 | 2005 | |||||||
| ASSETS | (In Thousands) | |||||||
CURRENT ASSETS | ||||||||
| Cash and cash equivalents | $ | 270,672 | $ | 54,896 | ||||
| Short-term investments | 70,373 | 185,446 | ||||||
| Receivables | 43,233 | 27,986 | ||||||
| Ore on leach pad | 31,302 | 25,394 | ||||||
| Metal and other inventory | 16,341 | 12,807 | ||||||
| Deferred tax assets | 3,629 | 2,255 | ||||||
| Prepaid expenses and other | 6,047 | 4,707 | ||||||
| Assets of discontinued operations held for sale | -- | 14,828 | ||||||
| 441,597 | 328,319 | |||||||
PROPERTY, PLANT AND EQUIPMENT | ||||||||
| Property, plant and equipment | 132,315 | 105,107 | ||||||
| Less accumulated depreciation | (64,206 | ) | (57,929 | ) | ||||
| 68,109 | 47,178 | |||||||
MINING PROPERTIES | ||||||||
| Operational mining properties | 130,447 | 121,441 | ||||||
| Less accumulated depletion | (116,361 | ) | (105,486 | ) | ||||
| 14,086 | 15,955 | |||||||
Mineral interests | 72,201 | 72,201 | ||||||
| Less accumulated depletion | (7,828 | ) | (2,218 | ) | ||||
| 64,373 | 69,983 | |||||||
Non-producing and development properties | 190,988 | 72,488 | ||||||
| 269,447 | 158,426 | |||||||
OTHER ASSETS | ||||||||
| Ore on leach pad, non-current portion | 35,367 | 29,254 | ||||||
| Restricted cash and cash equivalents | 19,492 | 16,943 | ||||||
| Debt issuance costs, net | 5,151 | 5,454 | ||||||
| Deferred tax assets | 2,544 | 923 | ||||||
| Other | 7,919 | 8,319 | ||||||
| 70,473 | 60,893 | |||||||
| TOTAL ASSETS | $ | 849,626 | $ | 594,816 | ||||
| December 31, | ||||||||
| 2007 | 2006 | |||||||
| (In thousands) | ||||||||
| ASSETS | ||||||||
| CURRENT ASSETS | ||||||||
| Cash and cash equivalents | $ | 98,671 | $ | 270,672 | ||||
| Short-term investments | 53,039 | 70,373 | ||||||
| Receivables | 56,121 | 43,233 | ||||||
| Ore on leach pad | 25,924 | 31,302 | ||||||
| Metal and other inventory | 18,918 | 16,341 | ||||||
| Deferred tax assets | 3,573 | 3,629 | ||||||
| Prepaid expenses and other | 7,821 | 6,047 | ||||||
| 264,067 | 441,597 | |||||||
| PROPERTY, PLANT AND EQUIPMENT | ||||||||
| Property, plant and equipment | 322,733 | 132,315 | ||||||
| Less accumulated depreciation | (69,937 | ) | (64,206 | ) | ||||
| 252,796 | 68,109 | |||||||
| MINING PROPERTIES | ||||||||
| Operational mining properties | 143,324 | 130,447 | ||||||
| Less accumulated depletion | (124,401 | ) | (116,361 | ) | ||||
| 18,923 | 14,086 | |||||||
| Mineral interests | 1,731,715 | 72,201 | ||||||
| Less accumulated depletion | (11,639 | ) | (7,828 | ) | ||||
| 1,720,076 | 64,373 | |||||||
| Non-producing and development properties | 311,469 | 190,988 | ||||||
| 2,050,468 | 269,447 | |||||||
| OTHER ASSETS | ||||||||
| Ore on leach pad, non-current portion | 24,995 | 35,367 | ||||||
| Restricted cash and cash equivalents | 25,760 | 23,508 | ||||||
| Debt issuance costs, net | 4,848 | 5,151 | ||||||
| Deferred tax assets | 1,109 | 2,544 | ||||||
| Other | 27,651 | 3,903 | ||||||
| 84,363 | 70,473 | |||||||
| TOTAL ASSETS | $ | 2,651,694 | $ | 849,626 | ||||
F-5
CONSOLIDATED BALANCE SHEETS
| December 31, | ||||||||
| 2006 | 2005 | |||||||
| (In thousands except share data) | ||||||||
| LIABILITIES AND SHAREHOLDERS’ EQUITY | ||||||||
CURRENT LIABILITIES | ||||||||
| Accounts payable | $ | 22,315 | $ | 17,189 | ||||
| Accrued liabilities and other | 11,865 | 5,662 | ||||||
| Accrued income taxes | 10,317 | 66 | ||||||
| Accrued payroll and related benefits | 8,527 | 7,840 | ||||||
| Accrued interest payable | 1,031 | 1,031 | ||||||
| Current portion of reclamation and mine closure | 4,460 | 1,646 | ||||||
| Liabilities of discontinued operations held for sale | -- | 12,908 | ||||||
| 58,515 | 46,342 | |||||||
LONG-TERM LIABILITIES | ||||||||
| 1 1/4% Convertible Senior Notes due January 2024 | 180,000 | 180,000 | ||||||
| Reclamation and mine closure | 27,226 | 23,048 | ||||||
| Other long-term liabilities | 2,891 | 3,873 | ||||||
| 210,117 | 206,921 | |||||||
COMMITMENTS AND CONTINGENCIES | ||||||||
| (See Notes I, J, L, M, N, O, P and R) | ||||||||
SHAREHOLDERS’ EQUITY | ||||||||
| Common Stock, par value $1.00 per share; authorized 500,000,000 | ||||||||
| shares, issued 279,054,344 and 250,961,353 shares in 2006 and 2005 | ||||||||
| (1,059,211 shares held in treasury) | 279,054 | 250,961 | ||||||
| Additional paid-in capital | 777,798 | 656,977 | ||||||
| Accumulated deficit | (463,221 | ) | (551,357 | ) | ||||
| Shares held in treasury | (13,190 | ) | (13,190 | ) | ||||
| Accumulated other comprehensive income (loss) | 553 | (1,838 | ) | |||||
| 580,994 | 341,553 | |||||||
| TOTAL LIABILITIES AND SHAREHOLDERS’ EQUITY | $ | 849,626 | $ | 594,816 | ||||
| December 31, | ||||||||
| 2007 | 2006 | |||||||
| (In thousands, except | ||||||||
| share data) | ||||||||
| LIABILITIES AND SHAREHOLDERS’ EQUITY | ||||||||
| CURRENT LIABILITIES | ||||||||
| Accounts payable | $ | 49,642 | $ | 22,315 | ||||
| Accrued liabilities and other | 9,072 | 10,971 | ||||||
| Accrued income taxes | 7,547 | 10,317 | ||||||
| Accrued payroll and related benefits | 9,342 | 8,527 | ||||||
| Accrued interest payable | 1,060 | 1,031 | ||||||
| Current portion of long-term debt and capital lease obligations | 30,831 | 894 | ||||||
| Current portion of reclamation and mine closure | 4,183 | 4,460 | ||||||
| 111,677 | 58,515 | |||||||
| LONG-TERM LIABILITIES | ||||||||
| 1 1/4% Convertible Senior Notes due January 2024 | 180,000 | 180,000 | ||||||
| Reclamation and mine closure | 30,629 | 27,226 | ||||||
| Deferred income taxes | 573,681 | 272 | ||||||
| Obligations under capital leases | 23,661 | — | ||||||
| Other long-term liabilities | 4,679 | 2,619 | ||||||
| 812,650 | 210,117 | |||||||
| COMMITMENTS AND CONTINGENCIES | ||||||||
| (See Notes I, J, M, N, O, P, Q and S) | ||||||||
| SHAREHOLDERS’ EQUITY | ||||||||
| Common Stock, par value $1.00 per share; authorized 750,000,000 shares in 2007 and 500,000,000 in 2006, issued 551,512,230 and 279,054,344 shares in 2007 and 2006 (1,059,211 shares held in treasury) | 551,512 | 279,054 | ||||||
| Additional paid-in capital | 1,607,737 | 777,798 | ||||||
| Accumulated deficit | (419,331 | ) | (463,221 | ) | ||||
| Shares held in treasury | (13,190 | ) | (13,190 | ) | ||||
| Accumulated other comprehensive income | 639 | 553 | ||||||
| 1,727,367 | 580,994 | |||||||
| TOTAL LIABILITIES AND SHAREHOLDERS’ EQUITY | $ | 2,651,694 | $ | 849,626 | ||||
F-6
CONSOLIDATED STATEMENTS OF OPERATIONS AND COMPREHENSIVE INCOME
| Years Ended December 31, | |||||||||||
| 2006 | 2005 | 2004 | |||||||||
| (In Thousands, except per share data) | |||||||||||
REVENUES | |||||||||||
| Sales of metal | $ | 216,573 | $ | 156,284 | $ | 109,047 | |||||
COSTS AND EXPENSES | |||||||||||
| Production costs applicable to sales | 92,378 | 88,232 | 63,715 | ||||||||
| Depreciation and depletion | 26,772 | 18,889 | 16,833 | ||||||||
| Administrative and general | 19,369 | 20,624 | 17,499 | ||||||||
| Exploration | 9,474 | 10,553 | 8,031 | ||||||||
| Pre-development | -- | 6,057 | 11,449 | ||||||||
| Litigation settlement | 2,365 | 1,600 | -- | ||||||||
| Total cost and expenses | 150,358 | 145,955 | 117,527 | ||||||||
OTHER INCOME AND EXPENSE | |||||||||||
| Interest and other income | 18,654 | 8,385 | 3,165 | ||||||||
| Interest expense, net of capitalized interest | (1,224 | ) | (2,485 | ) | (2,831 | ) | |||||
| Merger expenses | -- | -- | (15,675 | ) | |||||||
| Total other income and expense | 17,430 | 5,900 | (15,341 | ) | |||||||
Income (loss) from continuing operations before income taxes | 83,645 | 16,229 | (23,821 | ) | |||||||
| Income tax (provision) benefit | (8,226 | ) | (1,483 | ) | 5,785 | ||||||
Income (loss) from continuing operations | 75,419 | 14,746 | (18,036 | ) | |||||||
| Income (loss) from discontinued operations, net of income taxes | 1,935 | (4,195 | ) | 1,178 | |||||||
| Gain on sale of net assets of discontinued operations, net of income | |||||||||||
| taxes | 11,132 | -- | -- | ||||||||
NET INCOME (LOSS) | 88,486 | 10,551 | (16,858 | ) | |||||||
| Other comprehensive income (loss) | 2,391 | 447 | (908 | ) | |||||||
COMPREHENSIVE INCOME (LOSS) | $ | 90,877 | $ | 10,998 | $ | (17,766 | ) | ||||
BASIC AND DILUTED INCOME (LOSS) PER SHARE | |||||||||||
| Basic income (loss) per share: | |||||||||||
| Income (loss) from continuing operations | $ | 0.28 | $ | 0.06 | $ | (0.08 | ) | ||||
| Income (loss) from discontinued operations | 0.05 | (0.02 | ) | -- | |||||||
| Net income (loss) | $ | 0.33 | $ | 0.04 | $ | (0.08 | ) | ||||
Diluted income (loss) per share: | |||||||||||
| Income (loss) from continuing operations | $ | 0.26 | $ | 0.06 | $ | (0.08 | ) | ||||
| Income (loss) from discontinued operations | 0.04 | (0.02 | ) | -- | |||||||
| Net income (loss) | $ | 0.30 | $ | 0.04 | $ | (0.08 | ) | ||||
Weighted average number of shares of common stock | |||||||||||
| Basic | 271,357 | 242,915 | 215,969 | ||||||||
| Diluted | 296,082 | 243,683 | 215,969 | ||||||||
| Years Ended December 31, | ||||||||||||
| 2007 | 2006 | 2005 | ||||||||||
| (In thousands, except per share data) | ||||||||||||
| REVENUES | ||||||||||||
| Sales of metal | $ | 215,319 | $ | 216,573 | $ | 156,284 | ||||||
| COSTS AND EXPENSES | ||||||||||||
| Production costs applicable to sales | 117,025 | 92,378 | 88,232 | |||||||||
| Depreciation and depletion | 20,984 | 26,772 | 18,889 | |||||||||
| Administrative and general | 23,875 | 19,369 | 20,624 | |||||||||
| Exploration | 11,941 | 9,474 | 10,553 | |||||||||
| Litigation settlements | 507 | 2,365 | 1,600 | |||||||||
| Pre-development | — | — | 6,057 | |||||||||
| Total cost and expenses | 174,332 | 150,358 | 145,955 | |||||||||
| Operating income | 40,987 | 66,215 | 10,329 | |||||||||
| OTHER INCOME AND EXPENSE | ||||||||||||
| Interest and other income | 18,195 | 18,654 | 8,385 | |||||||||
| Interest expense, net of capitalized interest | (365 | ) | (1,224 | ) | (2,485 | ) | ||||||
| Total other income and expense | 17,830 | 17,430 | 5,900 | |||||||||
| Income from continuing operations before income taxes | 58,817 | 83,645 | 16,229 | |||||||||
| Income tax provision | (14,927 | ) | (8,226 | ) | (1,483 | ) | ||||||
| Income from continuing operations | 43,890 | 75,419 | 14,746 | |||||||||
| Income (loss) from discontinued operations, net of income taxes | — | 1,935 | (4,195 | ) | ||||||||
| Gain on sale of net assets of discontinued operations, net of income taxes | — | 11,132 | — | |||||||||
| NET INCOME | 43,890 | 88,486 | 10,551 | |||||||||
| Other comprehensive income | 86 | 2,391 | 447 | |||||||||
| COMPREHENSIVE INCOME | $ | 43,976 | $ | 90,877 | $ | 10,998 | ||||||
| BASIC AND DILUTED INCOME (LOSS) PER SHARE | ||||||||||||
| Basic income per share: | ||||||||||||
| Income from continuing operations | $ | 0.15 | $ | 0.28 | $ | 0.06 | ||||||
| Income (loss) from discontinued operations | — | 0.05 | (0.02 | ) | ||||||||
| Net income | $ | 0.15 | $ | 0.33 | $ | 0.04 | ||||||
| Diluted income per share: | ||||||||||||
| Income from continuing operations | $ | 0.14 | $ | 0.26 | $ | 0.06 | ||||||
| Income (loss) from discontinued operations | — | 0.04 | (0.02 | ) | ||||||||
| Net income | $ | 0.14 | $ | 0.30 | $ | 0.04 | ||||||
| Weighted average number of shares of common stock | ||||||||||||
| Basic | 285,972 | 271,357 | 242,915 | |||||||||
| Diluted | 310,524 | 296,082 | 243,683 | |||||||||
F-7
CONSOLIDATED STATEMENTS OF CHANGES IN SHAREHOLDERS’ EQUITY
| For Years Ended December 31, 2006, 2005 and 2004 (In thousands except share data) | |||||||||||||||||||||||
| Common Stock Shares | Common Stock $1 Par | Additional Paid-In Capital | Accumulated Deficit | Shares Held in Treasury | Accumulated Other Comprehensive Income (Loss) | Total | |||||||||||||||||
| Balances at January 1, 2004 | 214,195 | $ | 214,195 | $ | 542,900 | $ | (545,050 | ) | $ | (13,190 | ) | $ | (1,377 | ) | $ | 197,478 | |||||||
| Net loss | -- | -- | -- | (16,858 | ) | -- | -- | (16,858 | ) | ||||||||||||||
| Unrealized losses on short-term | |||||||||||||||||||||||
| investments and marketable | |||||||||||||||||||||||
| securities | -- | -- | -- | -- | -- | (347 | ) | (347 | ) | ||||||||||||||
| Change in fair value of derivative | |||||||||||||||||||||||
| hedging instruments, net of | |||||||||||||||||||||||
| settlements | -- | -- | -- | -- | -- | (130 | ) | (130 | ) | ||||||||||||||
| Excess additional pension liability | |||||||||||||||||||||||
| over unrecognized prior service cost | -- | -- | -- | -- | -- | (431 | ) | (431 | ) | ||||||||||||||
| Issuance of common stock | 26,625 | 26,625 | 86,475 | -- | -- | -- | 113,100 | ||||||||||||||||
| Common stock issued under long-term | |||||||||||||||||||||||
| incentive plans | 208 | 208 | 432 | -- | -- | -- | 640 | ||||||||||||||||
| Other | -- | -- | 2 | -- | -- | -- | 2 | ||||||||||||||||
| Balances at December 31, 2004 | 241,028 | $ | 241,028 | $ | 629,809 | $ | (561,908 | ) | $ | (13,190 | ) | $ | (2,285 | ) | $ | 293,454 | |||||||
| Net income | -- | -- | -- | 10,551 | -- | -- | 10,551 | ||||||||||||||||
| Unrealized gain on short-term | |||||||||||||||||||||||
| investments and marketable | |||||||||||||||||||||||
| securities | -- | -- | -- | -- | -- | 853 | 853 | ||||||||||||||||
| Change in fair value of derivative | |||||||||||||||||||||||
| hedging instruments, net of | |||||||||||||||||||||||
| settlements | -- | -- | -- | -- | -- | (171 | ) | (171 | ) | ||||||||||||||
| Excess additional pension liability | |||||||||||||||||||||||
| over unrecognized prior service cost | -- | -- | -- | -- | -- | (237 | ) | (237 | ) | ||||||||||||||
| Issuance of common stock | 9,863 | 9,863 | 26,351 | -- | -- | -- | 36,214 | ||||||||||||||||
| Common stock issued under long-term | |||||||||||||||||||||||
| incentive plans | 70 | 70 | 817 | -- | -- | -- | 887 | ||||||||||||||||
| Foreign currency translation | -- | -- | -- | -- | -- | 2 | 2 | ||||||||||||||||
| Balances at December 31, 2005 | 250,961 | $ | 250,961 | $ | 656,977 | $ | (551,357 | ) | $ | (13,190 | ) | $ | (1,838 | ) | $ | 341,553 | |||||||
| Net income | -- | -- | -- | 88,486 | -- | -- | 88,486 | ||||||||||||||||
| Cumulative effect of accounting change | -- | -- | -- | (350 | ) | -- | -- | (350 | ) | ||||||||||||||
| Unrealized gain on short-term | |||||||||||||||||||||||
| investments and marketable | |||||||||||||||||||||||
| securities | -- | -- | -- | -- | -- | 63 | 63 | ||||||||||||||||
| Change in fair value of cash flow | |||||||||||||||||||||||
| hedging instruments, net of | |||||||||||||||||||||||
| settlements | -- | -- | -- | -- | -- | 111 | 111 | ||||||||||||||||
| Elimination of excess additional | |||||||||||||||||||||||
| pension liability over unrecognized | |||||||||||||||||||||||
| prior service cost attributable to | |||||||||||||||||||||||
| discontinued operations | -- | -- | -- | -- | -- | 2,219 | 2,219 | ||||||||||||||||
| Issuance of common stock | 27,600 | 27,600 | 118,631 | -- | -- | -- | 146,231 | ||||||||||||||||
| Common stock issued under long-term | |||||||||||||||||||||||
| incentive plans | 493 | 493 | 2,190 | -- | -- | -- | 2,683 | ||||||||||||||||
| Foreign currency translation | -- | -- | -- | -- | -- | (2 | ) | (2 | ) | ||||||||||||||
| Balances at December 31, 2006 | 279,054 | $ | 279,054 | $ | 777,798 | $ | (463,221 | ) | $ | (13,190 | ) | $ | 553 | $ | 580,994 | ||||||||
| Years Ended December 31, 2007, 2006 and 2005 | ||||||||||||||||||||||||||||
| (In thousands, except share data) | ||||||||||||||||||||||||||||
| Accumulated | ||||||||||||||||||||||||||||
| Common | Common | Additional | Shares | Other | ||||||||||||||||||||||||
| Stock | Stock | Paid-In | Accumulated | Held in | Comprehensive | |||||||||||||||||||||||
| Shares | $1 Par | Capital | Deficit | Treasury | Income (Loss) | Total | ||||||||||||||||||||||
Balances at January 1, 2005 | 241,028 | $ | 241,028 | $ | 629,809 | $ | (561,908 | ) | $ | (13,190 | ) | $ | (2,285 | ) | $ | 293,454 | ||||||||||||
| Net income | — | — | — | 10,551 | — | — | 10,551 | |||||||||||||||||||||
| Unrealized gain on short-term investments and marketable securities | — | — | — | — | — | 853 | 853 | |||||||||||||||||||||
| Change in fair value of derivative hedging instruments, net of settlements | — | — | — | — | — | (171 | ) | (171 | ) | |||||||||||||||||||
| Excess additional pension liability over unrecognized prior service cost | — | — | — | — | — | (237 | ) | (237 | ) | |||||||||||||||||||
| Issuance of common stock | 9,863 | 9,863 | 26,351 | — | — | — | 36,214 | |||||||||||||||||||||
| Common stock issued under long-term incentive plans, net | 70 | 70 | 817 | — | — | — | 887 | |||||||||||||||||||||
| Foreign currency translation | — | — | — | — | — | 2 | 2 | |||||||||||||||||||||
Balances at December 31, 2005 | 250,961 | $ | 250,961 | $ | 656,977 | $ | (551,357 | ) | $ | (13,190 | ) | $ | (1,838 | ) | $ | 341,553 | ||||||||||||
| Net income | — | — | — | 88,486 | — | — | 88,486 | |||||||||||||||||||||
| Cumulative effect of accounting change | — | — | — | (350 | ) | — | — | (350 | ) | |||||||||||||||||||
| Unrealized gain on short-term investments and marketable securities | — | — | — | — | — | 63 | 63 | |||||||||||||||||||||
| Change in fair value of cash flow hedging instruments, net of settlements | — | — | — | — | — | 111 | 111 | |||||||||||||||||||||
| Elimination of excess additional pension liability over unrecognized prior service cost attributable to discontinued operations | — | — | — | — | — | 2,219 | 2,219 | |||||||||||||||||||||
| Issuance of common stock | 27,600 | 27,600 | 118,631 | — | — | — | 146,231 | |||||||||||||||||||||
| Common stock issued under long-term incentive plans, net | 493 | 493 | 2,190 | — | — | — | 2,683 | |||||||||||||||||||||
| Foreign currency translation | — | — | — | — | — | (2 | ) | (2 | ) | |||||||||||||||||||
Balances at December 31, 2006 | 279,054 | $ | 279,054 | $ | 777,798 | $ | (463,221 | ) | $ | (13,190 | ) | $ | 553 | $ | 580,994 | |||||||||||||
| Net income | — | — | — | 43,890 | — | — | 43,890 | |||||||||||||||||||||
| Unrealized gain on short-term investments and marketable securities | — | — | — | — | — | 103 | 103 | |||||||||||||||||||||
| Change in fair value of cash flow hedging instruments, net of settlements | — | — | — | — | — | (23 | ) | (23 | ) | |||||||||||||||||||
| Issuance of common stock in Bolnisi/Palmarejo merger | 271,969 | 271,969 | 826,061 | — | — | — | 1,098,030 | |||||||||||||||||||||
| Common stock issued under long-term incentive plans, net | 489 | 489 | 3,878 | — | — | — | 4,367 | |||||||||||||||||||||
| Foreign currency translation | — | — | — | — | — | 6 | 6 | |||||||||||||||||||||
Balances at December 31, 2007 | 551,512 | $ | 551,512 | $ | 1,607,737 | $ | (419,331 | ) | $ | (13,190 | ) | $ | 639 | $ | 1,727,367 | |||||||||||||
F-8
CONSOLIDATED STATEMENTS OF CASH FLOWS
| Years Ended December 31, | |||||||||||
| 2006 | 2005 | 2004 | |||||||||
| (In Thousands) | |||||||||||
CASH FLOWS FROM OPERATING ACTIVITIES: | |||||||||||
| Net income (loss) | $ | 88,486 | $ | 10,551 | $ | (16,858 | ) | ||||
| Add (deduct) non-cash items: | |||||||||||
| Depreciation and depletion | 26,772 | 18,889 | 16,833 | ||||||||
| Deferred taxes | (2,902 | ) | 1,629 | (4,403 | ) | ||||||
| Unrealized (gain) loss on embedded derivatives | 1,166 | (2,052 | ) | (82 | ) | ||||||
| Share-based compensation | 2,218 | 1,237 | 1,137 | ||||||||
| Amortization of debt issuance costs | 303 | 303 | 408 | ||||||||
| Amortization of premium and/or discount on short-term | |||||||||||
| investments, net | 24 | 790 | 1,527 | ||||||||
| Other non-cash charges | (313 | ) | 250 | (16 | ) | ||||||
| Changes in operating assets and liabilities: | |||||||||||
| Receivables | (14,781 | ) | (19,571 | ) | (2,014 | ) | |||||
| Prepaid expenses and other | (599 | ) | (183 | ) | (517 | ) | |||||
| Inventories | (15,555 | ) | (8,308 | ) | (17,492 | ) | |||||
| Accounts payable and accrued liabilities | 17,686 | 2,349 | (167 | ) | |||||||
| Discontinued operations | (11,275 | ) | 792 | 3,062 | |||||||
| CASH PROVIDED BY (USED IN) OPERATING ACTIVITIES | 91,230 | 6,676 | (18,582 | ) | |||||||
CASH FLOWS FROM INVESTING ACTIVITIES: | |||||||||||
| Purchases of short-term investments | (317,743 | ) | (212,252 | ) | (343,019 | ) | |||||
| Proceeds from sales of short-term investments | 430,292 | 277,021 | 142,128 | ||||||||
| Capital expenditures | (147,998 | ) | (113,290 | ) | (8,363 | ) | |||||
| Other | (328 | ) | 103 | 372 | |||||||
| Discontinued operations | 15,446 | (3,346 | ) | (2,041 | ) | ||||||
| CASH USED IN INVESTING ACTIVITIES | (20,331 | ) | (51,764 | ) | (210,923 | ) | |||||
CASH FLOWS FROM FINANCING ACTIVITIES: | |||||||||||
| Repayment of long-term debt | -- | -- | (9,561 | ) | |||||||
| Proceeds from issuance of common stock | 154,560 | 36,493 | 119,803 | ||||||||
| Payments of common stock issuance costs | (8,329 | ) | (557 | ) | (6,702 | ) | |||||
| Proceeds from issuance of notes | -- | -- | 180,000 | ||||||||
| Payments of debt issuance costs | -- | -- | (6,089 | ) | |||||||
| Borrowings from bank on working capital facility | -- | -- | 6,056 | ||||||||
| Payments to bank on working capital facility | -- | -- | (8,422 | ) | |||||||
| Other | (1,354 | ) | (1,170 | ) | (2,055 | ) | |||||
| CASH PROVIDED BY FINANCING ACTIVITIES: | 144,877 | 34,766 | 273,030 | ||||||||
INCREASE (DECREASE) IN CASH AND CASH EQUIVALENTS | 215,776 | (10,322 | ) | 43,525 | |||||||
Cash and cash equivalents at beginning of period | 54,896 | 65,218 | 21,693 | ||||||||
| Cash and cash equivalents at end of period | 270,672 | $ | 54,896 | $ | 65,218 | ||||||
SUPPLEMENTAL DISCLOSURES OF CASH FLOW INFORMATION | |||||||||||
| Cash paid for: | |||||||||||
| Interest | $ | 2,334 | $ | 2,280 | $ | 1,572 | |||||
| Taxes | $ | 814 | -- | -- | |||||||
| Years Ended December 31, | ||||||||||||
| 2007 | 2006 | 2005 | ||||||||||
| (In thousands) | ||||||||||||
| CASH FLOWS FROM OPERATING ACTIVITIES: | ||||||||||||
| Net income | $ | 43,890 | $ | 88,486 | $ | 10,551 | ||||||
| Add (deduct) non-cash items: | ||||||||||||
| Depreciation and depletion | 20,984 | 26,772 | 18,889 | |||||||||
| Deferred taxes | 2,154 | (2,902 | ) | 1,629 | ||||||||
| Unrealized (gain) loss on embedded derivatives | (1,462 | ) | 1,166 | (2,052 | ) | |||||||
| Share-based compensation | 3,448 | 2,218 | 1,237 | |||||||||
| Amortization of debt issuance costs | 303 | 303 | 303 | |||||||||
| Amortization of premium and/or discount on short-term investments, net | (6 | ) | 24 | 790 | ||||||||
| Gain on asset retirement obligation | (871 | ) | (41 | ) | (215 | ) | ||||||
| Gain on foreign currency transactions | (433 | ) | (147 | ) | 170 | |||||||
| (Gain) loss of sales of assets | (1,947 | ) | (237 | ) | 90 | |||||||
| Other non-cash charges | 616 | 112 | 205 | |||||||||
| Changes in operating assets and liabilities: | ||||||||||||
| Receivables | (24,021 | ) | (14,781 | ) | (19,571 | ) | ||||||
| Prepaid expenses and other | (4,065 | ) | (599 | ) | (183 | ) | ||||||
| Inventories | 13,172 | (15,555 | ) | (8,308 | ) | |||||||
| Accounts payable and accrued liabilities | (11,705 | ) | 17,686 | 2,349 | ||||||||
| Discontinued operations | — | (11,275 | ) | 792 | ||||||||
| CASH PROVIDED BY OPERATING ACTIVITIES | 40,057 | 91,230 | 6,676 | |||||||||
| CASH FLOWS FROM INVESTING ACTIVITIES: | ||||||||||||
| Purchases of short-term investments | (167,346 | ) | (317,743 | ) | (212,252 | ) | ||||||
| Proceeds from sales of short-term investments | 183,121 | 430,292 | 277,021 | |||||||||
| Capital expenditures | (216,978 | ) | (147,998 | ) | (113,290 | ) | ||||||
| Merger related costs | (13,727 | ) | — | — | ||||||||
| Proceeds from sale of assets | 3,270 | 314 | 289 | |||||||||
| Other | 187 | (642 | ) | (186 | ) | |||||||
| Discontinued operations | — | 15,446 | (3,346 | ) | ||||||||
| CASH USED IN INVESTING ACTIVITIES | (211,473 | ) | (20,331 | ) | (51,764 | ) | ||||||
| CASH FLOWS FROM FINANCING ACTIVITIES: | ||||||||||||
| Proceeds from short-term borrowings | 1,698 | — | — | |||||||||
| Repayment of long-term debt and capital leases | (1,360 | ) | (1,448 | ) | (685 | ) | ||||||
| Proceeds from issuance of common stock | — | 154,560 | 36,493 | |||||||||
| Payments of common stock issuance costs | (726 | ) | (8,329 | ) | (557 | ) | ||||||
| Other | (197 | ) | 94 | (485 | ) | |||||||
| CASH PROVIDED BY FINANCING ACTIVITIES: | (585 | ) | 144,877 | 34,766 | ||||||||
| INCREASE (DECREASE) IN CASH AND CASH EQUIVALENTS | (172,001 | ) | 215,776 | (10,322 | ) | |||||||
| Cash and cash equivalents at beginning of period | 270,672 | 54,896 | 65,218 | |||||||||
| Cash and cash equivalents at end of period | $ | 98,671 | $ | 270,672 | $ | 54,896 | ||||||
| SUPPLEMENTAL DISCLOSURES OF CASH FLOW INFORMATION | ||||||||||||
| Cash paid for: | ||||||||||||
| Interest | $ | 2,283 | $ | 2,334 | $ | 2,280 | ||||||
| Income taxes | $ | 11,994 | $ | 814 | — | |||||||
F-9
COEUR D’ALENE MINES CORPORATION AND SUBSIDIARIES
NOTES TO CONSOLIDATED FINANCIAL STATEMENTS(Dollar amounts in thousands, unless otherwise specified)NOTE A — BUSINESS OF COEUR D’ALENE MINES CORPORATION Coeur d’Alene Mines Corporation and its subsidiaries (collectively, “Coeur” or the “Company”) is principally engaged in silver and gold mining and related activities including exploration, development, and mining at its properties located in the United States (Nevada and Alaska), South America (Chile, Argentina and Bolivia) and, Australia (New South Wales), Mexico (Chihuahua) and Africa (Tanzania).NOTE B — SUMMARY OF SIGNIFICANT ACCOUNTING POLICIES Principles of Consolidation: The consolidated financial statements include the wholly-owned subsidiaries of the Company, the most significant of which are Coeur Rochester, Inc., Coeur Silver Valley, Inc., Coeur Alaska, Inc., CDE Cerro Bayo Ltd., Coeur Argentina, CDE Australia and EmpressaEmpresa Minera Manquiri S.A., Bolnisi Gold NL and Palmarejo Silver and Gold Corporation. The consolidated financial statements also include all entities in which voting control of more than 50% is held by the Company. The Company has no investments in entities in which it has greater than 50% ownership interest accounted for using the equity method. Intercompany balances and transactions have been eliminated in consolidation. Investments in corporate joint ventures where the Company has ownership of 50% or less and funds its proportionate share of expenses are accounted for under the equity method. The Company has no investments in entities in which it has a greater than 20% ownership interest accounted for using the cost method. Revenue Recognition: Pursuant to guidance in Staff Accounting Bulletin (“SAB”) No. 104, “Revenue Recognition for Financial Statements”, revenue is recognized when persuasive evidence of an arrangement exists, delivery has occurred, the price is fixed or determinable, no obligations remain and collectibilitycollectability is probable. The passing of title to the customer is based on the terms of the sales contract. Product pricing is determined at the point revenue is recognized by reference to active and freely traded commodity markets, for example the London Bullion Market for both gold and silver, in an identical form to the product sold. Under our concentrate sales contracts with third-party smelters, final gold and silver prices are set on a specified future quotational period, typically one to three months, after the shipment date based on market metal prices. Revenues are recorded under these contracts at the time title passes to the buyer based on the forward price for the expected settlement period. The contracts, in general, provide for a provisional payment based upon provisional assays and quoted metal prices. Final settlement is based on the average applicable price for a specified future period, and generally occurs from three to six months after shipment. Final sales are settled using smelter weights, settlement assays (average of assays exchanged and/or umpire assay results) and are priced as specified in the smelter contract. The Company’s provisionally priced sales contain an embedded derivative that is required to be separated from the host contract for accounting purposes. The host contract is the receivable from the sale of concentrates measured at the forward price at the time of sale. The embedded derivative does not qualify for hedge accounting. The embedded derivative is recorded as a derivative asset, in prepaid expenses and other assets or as a derivative liability in accrued liabilities and other on the balance sheet and is adjusted to fair value through revenue each period until the date of final gold and silver settlement. The form of the material being sold, after deduction for smelting and refining is in an identical form to that sold on the London Bullion Market. The form of the product is metal in flotation concentrate, which is the final process for which the Company is responsible.F-10
The effects of forward sales contracts are reflected in revenue at the date the related precious metals are delivered or the contracts expire. Third party smelting and refining costs of $8.4 million, $9.1 million and $6.1 million in 2007, 2006 and $3.3 million in 2006, 2005, and 2004, respectively, are recorded as a reduction of revenue. At December 31, 2007, the Company had outstanding provisionally priced sales of $61.2 million consisting of 3.3 million ounces of silver and 20,775 ounces of gold, which had a fair value of approximately $63.8 million including the embedded derivative. For each one cent per ounce change in realized silver price, revenue would vary (plus or minus) approximately $33,300 and for each one dollar per ounce change in realized gold price, revenue would vary (plus or minus) approximately $20,800. At December 31, 2006, the Company had outstanding provisionally priced sales of $74.5 million, consisting of 4.6 million ounces of silver and 29,577 ounces of gold. For each one cent per ounce change in realized silver price, revenue would vary (plus or minus) approximately $45,700 and for each one dollar per ounce change in realized gold price, revenue would vary (plus or minus) approximately $29,600. At December 31, 2005, the Company had outstanding provisionally priced sales of $47.0 million, consisting of 3.5 million ounces of silver and 40,000 ounces of gold. For each one cent per ounce change in realized silver price, revenue would vary (plus or minus) approximately $35,400 and for each one dollar per ounce change in realized gold price, revenue would vary (plus or minus) approximately $40,000. Cash and Cash Equivalents: Cash and cash equivalents include all highly-liquid investments with a maturity of three months or less at the date of purchase. The Company minimizes its credit risk by investing its cash and cash equivalents with major international banks and financial institutions located principally in the United States and Chile with a minimum credit rating of A1 as defined by Standard & Poor’s. The Company’s management believes that no concentration of credit risk exists with respect to the investment of its cash and cash equivalents. Short-term Investments: Short-term investments principally consist of highly-liquid United States, foreign government and corporate securities and investment-grade auction rate securities, all classified as available-for-sale and reported at fair value with maturities that could range from three months to forty years. Unrealized gains and losses on these investments are recorded in accumulated other comprehensive lossincome as a separate component of shareholders’ equity. Any decline in market value considered to be other than temporary is recognized in determining net income/loss. Realized gains and losses from the sale of these investments are included in determining net income/loss. The Company maintains a pledge of collateral agreement to reserve $1.0 million against the investment portfolio to cover credit exposure related to ACH transactions. Prior to December 31, 2006, the Company classified its auction rate securities as cash and cash equivalents because the securities were highly liquid and the periods between interest rate resets generally did not exceed 90 days. During the fourth quarter of 2006, the Company determined that, pursuant to SFAS 95, “Statement of Cash Flows”, its auction securities cannot be classified as cash equivalents because their contractual maturities exceed 90 days. The Company classified its auction rate securities as of December 31, 2006 as short term investments.
The Company also corrected the classification in its 2005 and 2004 financial statement presentation by reclassifying $159.7 million and $207.9 million, respectively, of auction rate securities as of December 31, 2005 and December 31, 2004 from cash and cash equivalents to short-term investments. As a result, the following table shows the amounts, as originally presented in the Company’s Form 10-K, for the years ended December 31, 2005 and December 31, 2004 and the corrected 2005 and 2004 amounts as presented in its Form 10-K for the year ended December 31, 2006. This reclassification had no effect on total current assets, stockholders’ equity, net income (loss), net income (loss) per share or on cash provided by operating activities.
For the year ended December 31, 2005 As Previously
Reported
Adjustment
Corrected
(In Thousands) Cash and Cash Equivalents $ 214,616 $ (159,720 ) $ 54,896 Short-term Investments 25,726 159,720 185,446 Net Cash Used in Investing Activities (99,894 ) 48,130 (51,764 ) Decrease in Cash and Cash Equivalents (58,452 ) 48,130 (10,322 )
F-11
For the year ended December 31, 2004 As Previously
Reported
Adjustment
Corrected
(In Thousands) Cash and Cash Equivalents $ 273,068 $ (207,850 ) $ 65,218 Short-term Investments 48,993 207,850 256,843 Net Cash Used in Investing Activities (43,787 ) (167,136 ) (210,923 ) Decrease in Cash and Cash Equivalents 210,661 (167,136 ) 43,525
$66.7$50.9 million as of December 31, 2006.2007. Of this amount, $31.3$25.9 million is reported as a current asset and $35.4$25.0 million is reported as a non-current asset. The distinction between current and non-current is based upon the expected length of time necessary for the leaching process to remove the metals from the broken ore. The historical cost of the metal that is expected to be extracted within twelve months is classified as current and the historical cost of metals contained within the broken ore that will be extracted beyond twelve months is classified as non-current. Inventories of ore on leach pad are valued based on actual production costs incurred to produce and place ore on the leach pad, adjusted for effects on monthly production of costs of abnormal production levels, less costs allocated to minerals recovered through the leach process.F-11
The estimate of both the ultimate recovery expected over time and the quantity of metal that may be extracted relative to the time the leach process occurs requires the use of estimates which are inherently inaccurate since they rely upon laboratory testwork. Testwork consists of 60 day leach columns from which the Company projects metal recoveries up to five years in the future. The quantities of metal contained in the ore are based upon actual weights and assay analysis. The rate at which the leach process extracts gold and silver from the crushed ore is based upon laboratory column tests and actual experience occurring over approximately nineteen years of leach pad operations at the Rochester Mine. The assumptions used by the Company to measure metal content during each stage of the inventory conversion process includes estimated recovery rates based on laboratory testing and assaying. The Company periodically reviews its estimates compared to actual experience and revises its estimates when appropriate. The length of time necessary to achieve ultimate recoveries for silver and gold is currently estimated between 5 and 10 years.F-12
In August 2007, the Company terminated mining and crushing operations at the Rochester mine as ore reserves were fully mined. Residual heap leach activities are expected to continue through 2011.
Metal and Other Inventory: Inventories include concentrate ore, dorè, ore in stockpiles and operating materials and supplies. The classification of inventory is determined by the stage at which the ore is in the production process. Inventories of ore in stock piles are sampled for gold and silver content and are valued based on the lower of actual costs incurred or estimated net realizable value based upon the period ending prices of gold and silver. Material that does not contain a minimum quantity of gold and silver to cover estimated processing expense to recover the contained gold and silver is not classified as inventory and is assigned no value. All inventories are stated at the lower of cost or market, with cost being determined using a weighted average cost method. Concentrate and dorè inventory includes product at the mine site and product held by refineries and are also valued at lower of cost or market value. Metal inventory costs include direct labor, materials, depreciation, depletion and amortization as well as administrative overhead costs relating to mining activities. Property, Plant, and Equipment: Expenditures for new facilities, capital leases, new assets or expenditures that extend the useful lives of existing facilities are capitalized and depreciated using the straight-line method at rates sufficient to depreciate such costs over the shorter of estimated productive lives of such facilities or the useful life of the individual assets. Productive lives range from 7 to 31 years for buildings and improvements, 3 to 13 years for machinery and equipment and 3 to 7 years for furniture and fixtures. Certain mining equipment is depreciated using the units-of-production method based upon estimated total proven and probable reserves. Maintenance and repairs are expensed as incurred. Operational Mining Properties and Mine Development: Costs incurred to develop new properties are capitalized as incurred, where it has been determined that the property can be economically developed. At the Company’s surface mines, these costs include costs to further delineate the ore body. At the Company’s underground mines, these costs include the cost of building access ways, shaft sinking and access, lateral development, drift development, ramps and infrastructure development. All such costs are amortized using the units of production method over the estimated life of the ore body based on recoverable ounces to be mined from proven and probable reserves. Interest expense allocable to the cost of developing mining properties and to construct new facilities is capitalized until assets are ready for their intended use. Gains or losses from sales or retirements of assets are included in other income or expense. Costs incurred during the start-up phase of a mine are expensed as incurred. Ongoing mining expenditures on producing properties are charged against earnings as incurred. Major development expenditures incurred to increase production or extend the life of the mine are capitalized. Mineral exploration costs are expensed as incurred. Mineral Interests: Significant payments related to the acquisition of the land and mineral rights are capitalized as incurred. Prior to acquiring such land or mineral rights, the Company generally makes a preliminary evaluation to determine that the property has significant potential to develop an economic ore body. The time between initial acquisition and full evaluation of a property’s potential is variable and is determined by many factors including: location relative to existing infrastructure, the property’s stage of development, geological controls and metal prices. If a mineableminable ore body is discovered, such costs are amortized when production begins using the units-of-production method based on recoverable ounces to be mined from proven and probable reserves. If no mineableminable ore body is discovered, such costs are expensed in the period in which it is determined the property has no future economic value.F-12
Asset Impairment: The Company follows Statement of Financial Accounting Standard (“SFAS”) No. 144, “Accounting for the Impairment or Disposal of Long-Lived Assets,” to evaluate the recoverability of its assets. Management reviews and evaluates its long-lived assets for impairment when events and changes in circumstances indicate that the related carrying amounts of its assets may not be recoverable. Impairment is considered to exist if total estimated future cash flows or probability-weighted cash flows on an undiscounted basis, are less than the carrying amount of the assets, including property plant and equipment, mineral property, development property, and any deferred costs such as deferred stripping. An impairment loss is measured and recorded based on the difference between book value and discounted estimated future cash flows or the application of an expected present value technique to estimate fair value in the absence of a market price. Future cash flows include estimates of recoverable ounces, gold and silver prices (considering current and historical prices, price trends and related factors), production levels and capital, all based on life-of-mine plans and projections. Assumptions underlying future cash flow estimates are subject to risks and uncertainties. If the assets are impaired, a calculation of fair value is performed and if the fair value is lower than the carrying value of the assets, the assets are reduced to their fair market value. Any differences between significant assumptions and market conditions and/or the Company’s operating performance could have a material effect on the Company’s determination of ore reserves, or its ability to recover the carrying amounts of its long-lived assets resulting in impairment charges. In estimating future cash flows, assets are grouped at the lowest level for which there are identifiable cash flows that are largely independent of cash flows from other asset groups. Generally, in estimating future cash flows, all assets are grouped at a particular mine for which there is identifiable cash flow.F-13
Restricted Cash and Cash Equivalents: The Company, under the terms of its lease, self insurance, and bonding agreements with certain banks, lending institutions and regulatory agencies, is required to collateralize certain portions of the Company’s obligations. The Company has collateralized these obligations by assigning certificates of deposit that have maturity dates ranging from three months to a year, to the respective institutions or agency. At December 31, 20062007 and December 31, 2005,2006, the Company held certificates of deposit and cash under these agreements of $19.5$25.8 million and $16.9$23.5 million, respectively, restricted for this purpose. The ultimate timing for the release of the collateralized amounts is dependent on the timing and closure of each mine. In order to release the collateral, the Company must seek approval from certain government agencies responsible for monitoring the mine closure status. Collateral could also be released to the extent the Company was able to secure alternative financial assurance satisfactory to the regulatory agencies. The Company believes there is a reasonable probability that the collateral will remain in place beyond a twelve-month period and has therefore classified these investments as long-term. Deferred Stripping Costs: Effective January 1, 2006, the Company adopted Emerging Issues Task Force (“EITF”) Issue No. 04-06, “Accounting for Stripping Costs Incurred during Production in the Mining Industry.” EITF Issue No. 04-06 addresses the accounting for stripping costs incurred during the production phase of a mine and refers to these costs as variable production costs that should be included as a component of inventory to be recognized in costs applicable to sales in the same period as the revenue from the sale of inventory. The consensus requires application through recognition of a cumulative effect adjustment to opening retained earnings in the period of adoption, with no charge to current earnings for prior periods. The Company recorded a charge of approximately $0.4 million to retained earnings at January 1, 2006 to write off previously capitalized deferred stripping costs, as the cumulative effect of a change in accounting method.F-13
Reclamation and Remediation Costs: The Company follows SFAS No. 143, “Accounting for Asset Retirement Obligations”, which addresses financial accounting and reporting for obligations associated with the retirement of tangible long-lived assets and the associated asset retirement costs. The standard applies to legal obligations associated with the retirement of long-lived assets that result from the acquisition, construction, development and normal use of the asset. SFAS No. 143 requires that the fair value of a liability for an asset retirement obligation be recognized in the period in which it is incurred if a reasonable estimate of fair value can be made. The fair value of the liability is added to the carrying amount of the associated asset and this additional carrying amount is depreciated over the life of the asset. An accretion cost, representing the increase over time in the present value of the liability, is recorded each period in depreciation, depletion and amortization expense. As reclamation work is performed or liabilities are otherwise settled, the recorded amount of the liability is reduced. Future remediation costs for inactive mines are accrued based on management’s best estimate at the end of each period of the undiscounted costs expected to be incurred at the site. Such cost estimates include, where applicable, ongoing care and maintenance and monitoring costs. Changes in estimates are reflected in earnings in the period an estimate is revised.F-14
Foreign Currency: Substantially all assets and liabilities of foreign subsidiaries are translated at exchange rates in effect at the end of each period. Revenues and expenses are translated at the average exchange rate for the period. Foreign currency transaction gains and losses are included in the determination of net income. Derivative Financial Instruments: The Company accounts for derivative financial instruments in accordance with SFAS No. 133, “Accounting for Derivative Instruments and Hedging Activities,” (as amended by SFAS No. 137) and SFAS No. 138, “Accounting for Certain Derivative Instruments and Certain Hedging Activities.” These Statements require recognition of all derivatives as either assets or liabilities on the balance sheet and measurement of those instruments at fair value. Appropriate accounting for changes in the fair value of derivatives held is dependent on whether the derivative instrument is designated and qualifies as an accounting hedge and on the classification of the hedge transaction. For derivative instruments that are designated and qualify as cash flow hedges, the effective portions of changes in fair value of the derivative are recorded in other comprehensive income, (loss), and are recognized in the Consolidated Statement of Consolidated Operations when the hedged item affects net income (loss) for the period. Ineffective portions of changes in the fair value of cash flow hedges are recognized currently in earnings. Refer to Note NO – Derivative Financial Instruments and Fair Value of Financial Instruments. Stock-based Compensation Plans: Effective January 1, 2006, the Company began recording compensation expense associated with awards of equity instruments in accordance with Statement of Financial Accounting Standards (“SFAS”)SFAS No. 123(R), “Share-Based Payment”. Prior to January 1, 2006, the Company accounted for awards of equity instruments according to the provisions of SFAS No. 123, “Accounting for Stock-Based Compensation,” and related interpretations, and therefore no related compensation expense was recorded for awards granted with no intrinsic value. The Company adopted the modified prospective transition method provided for under SFAS No. 123(R), and, consequently, has not retroactively adjusted results from prior periods. Under this transition method, compensation cost associated with awards of equity instruments recognized during 2006 includes: 1) amortization related to the remaining unvested portion of all awards granted for the fiscal years 1995 to 2005, based on the grant date fair value, estimated in accordance with the original provisions of SFAS No. 123, “Accounting for Stock-Based Compensation”; and 2) amortization related to all equity instrument awards granted subsequent to December 31, 2005, based on the grant-date fair value estimated in accordance with the provisions of SFAS No. 123(R). The compensation costs are included in administrative and general expenses, productions costs and the cost of self-constructed property, plant and equipment as deemed appropriate.F-14
The compensation expense recognized in the Company’s consolidated financial statements for the years ended December 31, 2006, 2005 and 2004 for awards of equity instruments was $2.4 million, $1.2 million and $1.1 million, respectively. As of December 31, 2006, there was $1.8 million of total unrecognized compensation cost (net of estimated forfeitures) related to unvested stock options, restricted stock grants and performance share grants which is expected to be recognized over a weighted-average vesting period of 2.0 years.
The Company continues to estimate the fair value of each stock option award on the date of grant using the Black-Scholes option valuation model. The Company now estimates forfeitures of stock based awards based on historical data and adjusts the forfeiture rate periodically. The adjustment of the forfeiture rate will result in a cumulative adjustment in the period the forfeiture estimate is changed. During the year ended December 31, 2006, the Company recorded an adjustment of $0.1 million to reduce compensation expense for forfeited awards. Income Taxes: The Company computes income taxes in accordance with SFAS No. 109, “Accounting for Income Taxes.” SFAS No. 109 requires an asset and liability approach which results in the recognition of deferred tax liabilities and assets for the expected future tax consequences or benefits of temporary differences between the financial reporting basis and the tax basis of assets and liabilities, as well as operating loss and tax credit carryforwards, using enacted tax rates in effect in the years in which the differences are expected to reverse.F-15
In assessing the realizability of deferred tax assets, management considers whether it is more likely than not that some portion or all of theits deferred tax assets will not be realized. Management considers the scheduled reversal of deferred tax liabilities, projected future taxable income and tax planning strategies in making this assessment. A valuation allowance has been provided for the portion of the Company’s net deferred tax assets for which it is more likely than not that they will not be realized. The Company and its subsidiaries are subject to U.S. federal income tax as well as income tax of multiple state and foreign jurisdictions. The Company has substantially concluded all U.S. federal income tax matters for years through 1999. Federal income tax returns for 2000 through 2006 are subject to examination. The Company’s continuing practice is to recognize interest and/or penalties related to income tax matters in income tax expense. There were no significant accrued interest or penalties at December 31, 2007. Comprehensive Income (Loss):Income: Comprehensive income (loss) includes net income (loss) as well as changes in stockholders’ equity that result from transactions and events other than those with stockholders. Items of comprehensive income (loss) include the following:2006
2005
2004
Net income (loss) $ 88,486 $ 10,551 $ (16,858 ) Unrealized gain (loss) on marketable securities 63 853 (347 ) Change in fair value of cash flow hedges, net of 111 (169 ) (130 ) settlements Minimum pension liabilities 2,219 (237 ) (431 ) Other (2 ) -- --
$ 90,877 $ 10,998 $ (17,766 )
following (in thousands):
2007 2006 2005 Net income $ 43,890 $ 88,486 $ 10,551 Unrealized gain on short-term investments and marketable securities 103 63 853 Change in fair value of cash flow hedges, net of settlements (23 ) 111 (169 ) Minimum pension liabilities — 2,219 (237 ) Foreign currency translation 6 (2 ) — $ 43,976 $ 90,877 $ 10,998
Net Income (Loss) Per Share: The Company follows SFAS No. 128, “Earnings Per Share,” which requires the presentation of basic and diluted earnings per share. Basic earnings per share is computed by dividing net income (loss) available to common shareholders by the weighted average number of common shares outstanding during each period. Diluted earnings per share reflect the potential dilution that could occur if securities or other contracts to issue common stock were exercised or converted into common stock. The effect of potentially dilutive stock options and debentures outstanding in the years ending December 31, 2007, 2006 2005 and 20042005 are as follows:F-15
For the Year Ended
December 31, 2006
For the Year Ended
December 31, 2005
For the Year Ended
December 31, 2004
(In thousands except for EPS) Income
(Numerator)
Shares
(Denominator)
Per-Share
Amount
Income
(Numerator)
Shares
(Denominator)
Per-Share
Amount
Income
(Numerator)
Shares
(Denominator)
Per-Share
Amount
Basic EPS Income (loss) from continuing operations $ 75,419 271,357 $ 0.28 $ 14,746 242,915 $ 0.06 $ (18,036 ) 215,969 $ (0.08 ) Income (loss) from discontinued operations 13,067 271,357 0.05 (4,195 ) 242,915 (0.02 ) 1,178 215,969 --
Net income (loss) $ 88,486 271,357 $ 0.33 $ 10,551 242,915 $ 0.04 $ (16,858 ) 215,969 $ (0.08 ) Effect of Dilutive Securities Equity awards -- 1,041 -- -- 768 -- -- -- -- 1.25% convertible notes 1,117 23,684 -- -- -- -- -- -- -- Diluted EPS Income (loss) from continuing operations $ 76,536 296,082 0.26 $ 14,746 243,683 $ 0.06 $ (18,036 ) 215,969 $ (0.08 ) Income (loss) from discontinued operations 13,067 296,082 0.04 (4,195 ) 243,683 (0.02 ) 1,178 215,969 --
Net income (loss) $ 89,603 296,082 $ 0.30 $ 10,551 243,683 $ 0.04 $ (16,858 ) 215,969 $ (0.08 )
The following potentially dilutive shares have been excluded from earnings per share calculation as their effect is antidilutive:
December 31, 2006
December 31, 2005
December 31, 2004
Stock options -- -- 1,796,908 1.25% Notes Convertible at $7.06 per share -- 23,684,211 23,684,211
Total potentially dilutive shares -- 23,684,211 25,481,119
F-16
Year Ended Year Ended Year Ended December 31, 2007 December 31, 2006 December 31, 2005 Income Shares Per-Share Income Shares Per-Share Income Shares Per-Share (In thousands except for EPS) (Numerator) (Denominator) Amount (Numerator) (Denominator) Amount (Numerator) (Denominator) Amount Basic EPS Income from continuing operations $ 43,890 285,972 $ 0.15 $ 75,419 271,357 $ 0.28 $ 14,746 242,915 $ 0.06 Income from discontinued operations — 285,972 — 13,067 271,357 0.05 (4,195 ) 242,915 (0.02 ) Net income $ 43,890 285,972 $ 0.15 $ 88,486 271,357 $ 0.33 $ 10,551 242,915 $ 0.04 Effect of Dilutive Securities Equity awards — 868 — 1,041 — 768 1.25% convertible notes 297 23,684 1,117 23,684 — — Diluted EPS Income from continuing operations $ 44,187 310,524 0.14 $ 76,536 296,082 0.26 $ 14,746 243,683 $ 0.06 Income (loss) from discontinued operations — — 13,067 296,082 0.04 (4,195 ) 243,683 (0.02 ) Net income $ 44,187 310,524 $ 0.14 $ 89,603 296,082 $ 0.30 $ 10,551 243,683 $ 0.04
For the years ended 2007, 2006 2005 and 2004,2005, options to purchase 531,112, 322,653 876,192 and -0-876,192 shares of common stock at prices between $4.81 to $8.94, $6.66 to $15.15$15.19 and $3.92 to $17.94, respectively, were not included in the computation of diluted EPS because the exercise price of options was greater than the average market price of the common shares. The options, which expire between 20072008 to 2016,2017, are outstanding at December 31, 2006.2007. Potentially diluting shares totaling 23,684,211 shares attributed to the 1.25% convertible notes have been excluded from the earnings per share calculation for the year ended December 31, 2005 as their effect was anti-dilutive.
Debt Issuance Costs: Costs associated with the issuance of debt are included in other noncurrent assets and are amortized over the term of the related debt. Use of Estimates: The preparation of the Company’s consolidated financial statements in conformity with U.S. generally accepted accounting principles generally accepted in the United States of America(“GAAP”) requires management to make estimates and assumptions that affect the amounts reported in their consolidated financial statements and accompanying notes. The areas requiring the use of management’s estimates and assumptions relate to recoverable ounces from proven and probable reserves that are the basis of future cash flow estimates and units-of-production depreciation and amortization calculations; useful lives utilized for depreciation, depletion and amortization of future cash flows for long lived assets; estimates of recoverable gold and silver ounces in ore on leach pad; the amount and timing of reclamation and remediation costs; valuation allowanceallowances for deferred tax assets; and post-employment and other employee benefit liabilities. Reclassifications: Certain reclassifications of prior year balances have been made to conform to the current year presentation. These reclassifications had no impact on the Company’s consolidated financial position, results of operations or cash flows for the periods presented. The most significant reclassifications were to reclassify the balance sheet amounts and the income statement results from historical presentation to assets and liabilities of discontinued operations and toincome (loss) income from discontinued operations in the consolidated statements of operations for all periods presented.the years ended December 31, 2006 and 2005. The consolidated statements of cash flows have been reclassified for discontinued operations for allthe periods presented.ended December 31, 2006 and 2005. In addition, investments in auction rate securities have been reclassified from cash and cash equivalents to short-term investments on the consolidated balance sheet as of December 31, 2005. We also madeand corresponding adjustments were made to the consolidated statements of cash flows for all of the periods presented.ended December 31, 2006 and 2005.
Recent Accounting Pronouncements: In November 2004, FASB issued SFAS No. 151, “Inventory Costs,” which amends the guidance in ARB No. 43, Chapter 4, “Inventory Pricing,” to clarify the accounting for abnormal amounts of idle facility expense, freight, handling costs, and wasted material (spoilage). This Statement now requires that these items be recognized as current-period expenses regardless of whether they meet the criterion of “so abnormal” as previously stated in ARB No. 43, Chapter 5, “Intangible Assets”. In addition, this Statement requires that the allocation of fixed production overhead to costs of conversion be based on the normal capacity of the production facility. SFAS No. 151 is effective for inventory costs incurred during fiscal years beginning after June 15, 2005. The Company has performed a review of the provisions of the Statement and has determined that its current accounting practice is to recognize the costs attibuted to idle facilities as a current-period expense and, therefore adoption in 2006 did not impact the Company’s financial statements. In December 2004,February 2007, the FASB issued Statement No. 159, “The Fair Value Option for Financial Assets and Financial Liabilities” (“SFAS No. 123(R), “Share-Based Payments”, which revised159”). SFAS No. 123, “Accounting for Stock-Based Compensation”159 permits entities to choose to measure many financial instruments and superseded Accounting Principles Board (“APB”) Opinion 25, “Accounting for Stock Issued to Employees” and its related implementation guidance. SFAS No. 123(R) requires measurement and recording in the financial statements of the costs of employee services received in exchange for an award of equity instruments based on the grant-datecertain other items at fair value, with the objective of the award, recognized over the period during which an employee is requiredimproving financial reporting by mitigating volatility in reported earnings caused by measuring related assets and liabilities differently without having to provide services in exchange for such award.apply complex hedge accounting provisions. The Company adopted the provisions of SFAS No. 123(R) on January 1, 2006, using the modified prospective method. Accordingly, compensation expense was recognized for all newly granted awards and awards modified, repurchased, or cancelled after January 1, 2006. Compensation cost for the unvested portion of awards that were outstanding, as of January 1, 2006, is recognized ratably over the remaining vesting period. The compensation cost for the unvested portion of awards is based on the fair value at date of grant, adjusted for forfeitures, as determined pursuant to SFAS No. 123. The actual effect on net income and earnings per share in future periods will vary depending upon the number and fair value of options granted in future years compared to prior years. The adoption resulted in a charge to the Company’s statement of operations of $1.4 million in 2006 and did not impact the Company’s cash flow.
F-17
In March 2005, the Financial Accounting Standards Board (“FASB”) ratified Emerging Issues Task Force (“EITF#148;) Issue No. 04-06, “Accounting for Stripping Costs Incurred during Production in the Mining Industry.#148; EITF Issue No. 04-06 addresses the accounting for stripping costs incurred during the production phase of a mine and refers to these costs as variable production costs that should be included as a component of inventory to be recognized in costs applicable to sales in the same period as the revenue from the sale of inventory. The guidance in EITF Issue No. 04-06 was159 are effective for the Company in 2006. The guidance requires application through recognition of a cumulative effect adjustment to opening retained earnings in the period of adoption.Company’s fiscal year ending December 31, 2008. The Company adoptedis currently evaluating the impact that the adoption of this pronouncement as of January 1, 2006 and recorded a charge of approximately $0.4 million to write off deferred stripping costs, asstatement will have on the cumulative effect of a change in accounting method.
In May 2005, the FASB issued SFAS No. 154, “Accounting Changes and Error Corrections.” SFAS No. 154 established new standards on accounting for changes in accounting principles. SFAS No. 154 requires all such changes to be accounted for by retrospective application to the financial statements of prior periods unless prescribed otherwise or it is impracticable to do so. SFAS No. 154 is effective for accounting changes and error corrections made in fiscal years beginning after December 15, 2005. Adoption of SFAS No. 154 did not have a material impact on ourCompany’s consolidated financial position, results of operations or cash flows.and disclosures.
F-16
In September 2006, the FASB issued Statement No. 157 “Fair Value Measurements” (SFAS 157). SFAS 157 defines fair value, establishes a framework for measuring fair value in generally accepted accounting principles, and expands disclosures about fair value measurements. The provisions of SFAS 157 are effective for the Company’s fiscal year ending December 31, 2008. The Company is currently evaluating the impact of the adoption of this statement on the Company’s consolidated financial position, results of operations and disclosures. In June 2006, the FASB issued Interpretation No. 48, “Accounting for Uncertainty in Income Taxes”, (FIN 48)Taxes, an Interpretation of FASB Statement No. 109, “Accounting for Income Taxes”109” (FIN 48). FIN 48 prescribes a recognition threshold and measurement attribute for the financial statement recognition and measurement of tax positions taken or expected to be taken in a tax return. FIN 48 requires that the Company recognize in its financial statements the impact of a tax position, if that tax position is more likely than not of being sustained on audit, based on the technical merits of the position. FIN 48 also provides guidance on derecognition, classification of interest and penalties, accounting in interim periods and disclosure. The provisions of FIN 48 arewere effective beginning January 1, 2007, with the cumulative effect of the change in accounting principle recorded as an adjustment to the opening balance of retained earnings. Currently, the2007. The adoption of FIN 48 isdid not expected to have a material effect on the Company’s financial position, results of operations or cash flows.F-18
The Company and its subsidiaries are subject to U.S. federal income tax as well as income tax of multiple state and foreign jurisdictions. The Company has substantially concluded all U.S. federal income tax matters for years through 1999. Federal income tax returns for 2000 through 2006 are subject to examination. The Company’s continuing practice is to recognize interest and/or penalties related to income tax matters in income tax expense. There were no significant accrued interest or penalties at December 31, 2007.NOTE C — SHORT-TERM INVESTMENTSACQUISITIONS OF BOLNISI AND MARKETABLE SECURITIES ThePALMAREJO
On December 21, 2007, the Company classifiescompleted its investment securities as available-for-sale securities. Pursuant to SFAS 115, “Accountingacquisition of all the shares of Bolnisi Gold NL (“Bolnisi”) and Palmarejo Gold and Silver Corporation (“Palmarejo”) in exchange for Certain Investmentsa total of approximately 272 million shares of Coeur common stock, a total cash payment of approximately $1.1 million and assumption of liabilities of $0.7 billion. Coeur issued 0.682 shares of Coeur common stock (or, at the election of the Bolnisi shareholder, CHESS Depositary Interests representing Coeur shares) and A$0.004 in Debt and Equity Securities”, such securities are measured at fair market valuecash (or approximately US$1.0 million in the financial statements with unrealized gains or losses recordedaggregate) for each Bolnisi ordinary share, and 2.715 shares of Coeur common stock and C$0.004 in other comprehensive income (loss). Atcash (or approximately US$0.1 million in the time securitiesaggregate) for each Palmarejo common share. The transaction was accounted for as a purchase of assets and not as a business combination since Bolnisi and Palmarejo are sold or otherwise disposed of, gains or losses are includedconsidered to be in net income (loss).the development stage. The total consideration paid for the acquisition was as follows (in thousands): Consideration: Coeur stock issued (271,969,428 shares at $4.04) $ 1,098,757 Cash payments 1,102 Transaction advisory fees and other costs 16,621 Total purchase price 1,116,480 Current liabilities 54,946 Other long-term liabilities 23,642 Deferred income taxes 572,711 Total liabilities assumed 651,299 $ 1,767,779
F-17
The following is a summarysummarizes the estimated fair values of available-for-sale securities:Available-For-Sale Securities
Cost
Gross
Unrealized
Losses
Gross
Unrealized
Gains
Estimated
Fair
Value
As of December 31, 2006 U.S. Corporate $ 65,372 $ -- $ -- $ 65,372 U.S. Government 5,000 -- 1 5,001
Total debt securities 70,372 -- 1 70,373 Equity securities 99 1 622 720
70,471 1 623 71,093
As of December 31, 2005 Auction Rate Securities $ 159,720 $ -- $ -- $ 159,720 U.S. Corporate 23,893 51 -- 23,842 U.S. Government 1,891 7 -- 1,884
Total debt securities 185,504 58 -- 185,446 Equity securities 19 4 615 630
$ 185,523 $ 62 $ 615 $ 186,076
As of December 31, 2004 Auction Rate Securities $ 207,850 $ -- $ -- $ 207,850 U.S. Corporate 18,964 107 1 18,858 U.S. Government 29,062 205 -- 28,857 State/Municipal 1,285 7 -- 1,278
Total debt securities 257,161 319 1 256,843 Equity securities 20 3 17 34
$ 257,181 $ 322 $ 18 $ 256,877
Gross realized gains and losses are basedthe assets acquired on a carrying value (cost, net of discount or premium) of short-term investments sold or adjusted for other than temporary decline in market value. Short-term investments mature at various dates. There were no realized gains and/or losses for the years ended 2006, 2005 and 2004.
Prior to December 31, 2006, the Company concluded that it was appropriate to classify its investments in auction rate securities as short-term investments. Previously such investments had been classified as cash and cash equivalents. Accordingly, the Company revised the classification to report these investments as short-term investments on the consolidated balance sheets as of December 31, 2005 and December 31, 2004. The Company also made corresponding adjustments to the consolidated statements of cash flows for the periods ended December 31, 2005 and December 31, 2004 to reflect the gross purchases and sales of these investments as investing activities rather than as a component of cash and cash equivalents. As of December 31, 2005 and December 31, 2004, $159.7 million and $207.9 million respectively, of these investments were reclassified from cash and cash equivalents to short-term investment on the consolidated Balance Sheet. This reclassification had no effect on the total current assets, stockholders’ equity, net income (loss), net income (loss) per share or cash provided by (used in) operating activities.
F-19
21, 2007 (in thousands):
Fair value of assets acquired: Cash $ 3,996 Other current assets 3,789 Property, plant and equipment 97,519 Mineral interests 1,657,189 Other assets 5,286 Total assets acquired $ 1,767,779
NOTE D –— DISCONTINUED OPERATIONS AND ASSETS AND LIABILITIES HELD FOR SALE During the first quarter of 2006, the Company committed to a plan to sell Coeur Silver Valley Inc. (“CSV”), a wholly owned subsidiary of Coeur d’Alene Mines Corporation, that ownsowned and operatesoperated the Galena underground silver mine and adjoining properties in Northern Idaho. On April 10, 2006, the Company announced that it had entered into an agreement to sell 100% of the shares of CSV to U.S. Silver Corporation for $15 million in cash. On June 1, 2006, the Company completed the sale of 100% of CSV to U.S. Silver Corporation for a total of $15 million in cash plus a post-closing working capital adjustment of $1.1 million. The Company recorded, within discontinued operations, a gain of approximately $11.1 million in the year ended December 31, 2006. Pursuant to SFAS No. 144, “Accounting for the Impairment or Disposal of Long-Lived Assets,” CSV was classified as held for sale and the results of its operations reported in discontinued operations for all prior periods.beginning in the period ended June 30, 2006.
The following table details selected financial information included in the income (loss) from discontinued operations in the consolidated statements of operations for the years ended December 31, 2006 2005 and 20042005 (in thousands): Years ended December 31, 2006 2005 Sales of metal $ 11,223 $ 16,052 Production costs applicable to sales (8,233 ) (16,698 ) Depreciation and depletion (681 ) (1,996 ) Mining exploration (279 ) (1,361 ) Other (95 ) (192 ) Income (loss) from discontinued operations 1,935 (4,195 ) Gain on sale of net assets of discontinued operations 11,132 — Net income (loss) from discontinued operations $ 13,067 $ (4,195 )
F-18
2006
2005
2004
Sales of metal $ 11,223 $ 16,052 $ 23,759 Production costs applicable to sales (8,233 ) (16,698 ) (18,637 ) Depreciation and depletion (681 ) (1,996 ) (1,967 ) Mining exploration (279 ) (1,361 ) (1,620 ) Other (95 ) (192 ) (357 )
Income (loss) from discontinued operations 1,935 (4,195 ) 1,178 Gain on sale of net assets of discontinued operations 11,132 -- --
Net income (loss) from discontinued operations $ 13,067 $ (4,195 ) $ 1,178
NOTE E — INVESTMENTS AND OTHER MARKETABLE SECURITIES The major classes of assetsCompany classifies its investment securities as available-for-sale securities. Pursuant to SFAS 115, “Accounting for Certain Investments in Debt and liabilities of discontinued operations held for saleEquity Securities”, such securities are measured at fair market value in the consolidated balance sheet asfinancial statements with unrealized gains or losses recorded in other comprehensive income. At the time securities are sold or otherwise disposed of, gains or losses are included in net income. The following is a summary of available-for-sale securities (in thousands): Available-For-Sale Securities Gross Gross Estimated Unrealized Unrealized Fair Cost Losses Gains Value As of December 31, 2007 U.S. Corporate $ 2,000 $ — $ — $ 2,000 U.S. Government 51,031 — 8 51,039 Total debt securities 53,031 — 8 53,039 Equity securities 99 — 702 801 $ 53,130 $ — $ 710 $ 53,840 As of December 31, 2006 U.S. Corporate $ 65,372 $ — $ — $ 65,372 U.S. Government 5,000 — 1 5,001 Total debt securities 70,372 — 1 70,373 Equity securities 99 1 622 720 $ 70,471 $ 1 $ 623 $ 71,093
Gross realized gains and losses are based on a carrying value (cost, net of discount or premium) of short-term investments sold or adjusted for other than temporary decline in market value. Short-term investments mature at various dates. There were no realized gains and/or losses in 2007, 2006 and 2005.Asset-Backed Commercial Paper (“ABCP”) The Company acquired certain asset-backed securities in connection with the Bolnisi and Palmarejo acquisition. Palmarejo has investments in non-bank sponsored ABCP (before accounting for an impairment charge), of which $6.3 million is invested in Apsley Trust Class E and $0.5 million in Aurora Trust Class A. Since a certain percentage of the assets supporting the commercial paper was invested in U.S. sub-prime residual mortgage-backed securities, the Company recorded an impairment based on the best available market data for such investments at the date of acquisition. Consequently, the Company recorded these investments at their estimated fair value of $5.3 million for the ABCP held by Palmarejo. The fair value of the ABCP are determined based on the Company’s assessment of market conditions at the date of acquisition, no further impairments were deemed necessary at December 31, 2005 is as follows (in thousands):December 31, 2005
Assets Receivables $ 2,036 Prepaids 906 Inventory 2,561 Property, plant and equipment (net) 2,016 Operational mining properties, net 6,357 Other 952
Total assets of discontinued operations $ 14,828
Liabilities Accounts payable $ 747 Accrued liabilities 166 Accrued payroll and related benefits 578 Reclamation and mine closure 6,905 Defined benefit liabilities 2,588 Other non-current liabilities 1,924
Total liabilities of discontinued operations $ 12,908
F-20
2007. The fair value reported may change materially in subsequent periods.
NOTE EF — METAL AND OTHER INVENTORIES Inventories consist of the following:following (in thousands): December 31, 2007 2006 Concentrate and dorè inventory $ 11,221 $ 9,680 Supplies 7,697 6,661 Metal and other inventory $ 18,918 $ 16,341
F-19
December 31, 2006
2005
Concentrate and doré inventory $ 9,680 $ 7,835 Supplies 6,661 4,972
Metal and other inventory $ 16,341 $ 12,807
NOTE FG — PROPERTY, PLANT AND EQUIPMENT Property, plant and equipment consists of the following:December 31, 2006
2005
Land $ 1,112 $ 1,423 Building improvements 51,818 40,869 Machinery and equipment 77,040 60,470 Capitalized leases for machinery and equipment 2,345 2,345
132,315 105,107 Accumulated depreciation (64,206 ) (57,929 )
$ 68,109 $ 47,178
following (in thousands):
December 31, 2007 2006 Land $ 1,133 $ 1,112 Building improvements 130,795 51,818 Machinery and equipment 153,328 77,040 Capitalized leases for machinery and equipment 37,477 2,345 322,733 132,315 Accumulated depreciation (69,937 ) (64,206 ) $ 252,796 $ 68,109
The Company’s capital expenditures, excluding the acquisitions of Bolnisi and Palmarejo, were as follows:2006
2005
2004
Rochester $ 1,225 $ 1,197 $ 3,548 Cerro Bayo 7,555 2,731 2,451 Martha 2,481 2,108 689 San Bartolome 14,597 10,477 950 Kensington 121,552 44,201 83 Endeavor -- 15,410 -- Broken Hill -- 36,667 -- Other 588 499 642
Net asset additions $ 147,998 $ 113,290 $ 8,363
Discontinued Operations - Coeur Silver Valley $ 617 $ 3,537 $ 2,151
follows (in thousands):
Years ended December 31, 2007 2006 2005 Rochester $ 1,647 $ 1,225 $ 1,197 Cerro Bayo 11,330 7,555 2,731 Martha 16,444 2,481 2,108 San Bartolomé 100,169 16,805 11,089 Kensington 92,337 122,640 53,155 Endeavor 2,112 — 15,410 Broken Hill 213 — 36,667 Other 1,942 588 499 Net asset additions $ 226,194 $ 151,294 $ 122,856 Discontinued Operations — Coeur Silver Valley $ — $ 617 $ 3,537
At December 31, 2007, 2006 and 2005, and 2004, approximately $22.1 million, $12.9 million $9.6 million and $0,$9.6, respectively, of invoices for capital expenditures remained in accounts payable and for purposes of the consolidated cash flows were treated as non-cash transactions. In connection with the acquisition of Bolnisi and Palmarejo, the Company assumed certain liabilities related to capital leases. In December 2006, Bolnisi, through its Canadian subsidiary Palmarejo, entered into a 2-year lease agreement for a power station. Under the terms of the agreement, including an amendment in January 2007, the Company will pay a fixed monthly amount of $0.3 million, including interest calculated at the rate of LIBOR plus 2.5%, starting at the date that the construction of the equipment is completed. The Company has the option at the end of the agreement to purchase the equipment by paying a nominal amount. In June 2007, Palmarejo entered into a 5-year lease agreement for $30.6 million of mining equipment to be delivered to Palmarejo as the equipment becomes available from the supplier. Mining equipment with a cost of $30.1 million has been delivered as of December 31, 2007. The Company will pay a monthly amount varying between $0.6 million and $0.8 million during the 2008 period and a fixed monthly amount of $0.6 million thereafter, including interest calculated at the rate of LIBOR plus 3.65%. The Company has the option at the end of the agreement to purchase the equipment by paying a nominal amount.F-20
F-21
Minimum future lease payments under both capital and operating leases at December 31, 20062007 are as follows:Year Ending December 31, Capital
Leases
Operating
Leases
2007 $ 916 $ 380 2008 -- -- 2009 -- -- 2010 -- -- Thereafter -- --
916 $ 380
Less: Amount representing interest 22
$ 894
follows (in thousands):
Capital Year Ending December 31, Leases 2008 11,554 2009 8,976 2010 6,755 2011 6,755 Thereafter 5,156 Total minimum payments due 39,196 Less: Amount representing interest 6,432 Present value of net minimum lease payments 32,764 Less: Current maturities 9,103 $ 23,661
The Company has entered into various operating lease agreements which expire over the next year. Total rent expense charged to net income (loss) under these agreements was $1.7 million, $2.6 million and $3.5 million for 2007, 2006, and $4.2 million for 2006, 2005, 2004, respectively.NOTE GH — MINING PROPERTIESDecember 31, 2006
2005
Capitalized costs for mining properties, net of accumulated depletion consist of the following(A): Operational mining properties: Rochester Mine $ 4,445 $ 8,582 Cerro Bayo Mine 8,531 6,660 Martha Mine 1,110 713
Total operational mining properties 14,086 15,955
Mineral interests, net of accumulated depletion Endeavor Mine 14,508 14,998 Broken Hill Mine 29,740 34,860 San Bartolome(B) 20,125 20,125
Total mineral interests 64,373 69,983
Non-producing and developmental properties: Kensington(C) 170,458 62,517 San Bartolome(D) 20,388 9,829 Other 142 142
Total non-producing and developmental properties 190,988 72,488
Total mining properties $ 269,447 $ 158,426
December 31, 2007 2006 Capitalized costs for mining properties, net of accumulated depletion consist of the following (in thousands):(A) Operational mining properties: Rochester Mine $ — $ 4,445 Cerro Bayo Mine 17,091 8,531 Martha Mine 1,832 1,110 Total operational mining properties 18,923 14,086 Mineral interests, net of accumulated depletion Endeavor Mine 15,865 14,508 Broken Hill Mine 26,897 29,740 San Bartolomé(B) 20,125 20,125 Palmarejo(C) 1,657,189 — Total mineral interests 1,720,076 64,373 Non-producing and developmental properties: Kensington(D) 256,443 170,458 San Bartolomé(E) 54,884 20,388 Other 142 142 Total non-producing and developmental properties 311,469 190,988 Total mining properties $ 2,050,468 $ 269,447
(A) On June 1, 2006, the Company completed the sale of 100% of the shares of its wholly-owned subsidiary, Coeur Silver Valley Inc., to US Silver Corporation for $15 million in cash and additional consideration received of $1.1 million for working capital.
(B) Balance represents acquisition cost of mineral interest.
(C) On December 31, 2007, the Company completed its acquisition of all of the shares of Bolnisi and Palmarejo in exchange for a total of approximately 272 million shares of Coeur common stock and a total cash payment of approximately $1.1 million.The total consideration paid was $1.1 billion and assumed liabilities were $0.7 billion. (D) During the third quarter of 2005, the Company commenced construction activities at its Kensington property. The costs incurred subsequent to commencing construction were capitalized as developmental properties.
F-21
(D)(E)During the fourth quarter of 2004, the Company commenced construction activities at its San BartolomeBartolomé property. The costs incurred subsequent to commencing construction were capitalized as developmental properties.
F-22
Operational Mining Properties Rochester Mine: The Company has conducted operations at the Rochester Mine, located in Western Nevada, since September 1986. The mine utilizes the heap-leaching process to extract both silver and gold from ore mined using open pit methods. Rochester’s primary product is silver with gold produced as a by-product. Cerro Bayo Mine: The Cerro Bayo Mine is a gold and silver underground mine located in southern Chile. Commercial production commenced on April 18, 2002. Martha Mine: The Martha Mine is an underground silver mine located in Argentina, approximately 270 miles southeast of Coeur’s Cerro Bayo mine. Coeur acquired a 100% interest in the Martha mine in April 2002. In July 2002, Coeur commenced shipment of ore from the Martha mine to the Cerro Bayo facility for processing. In December 2007, the Company completed a 240 tonne per day flotation mill which produces a flotation concentrate.
Mineral Interests Endeavor Mine: On May 23, 2005, the Company acquired all of the silver production and reserves, up to a maximum 17.7 million payable ounces, contained at the Endeavor Mine in Australia, which is owned and operated by Cobar Operations Pty. Limited (“Cobar”), a wholly-owned subsidiary of CBH Resources Ltd. (“CBH”), for $39.1$43.8 million. The Company is entitled to all of the silver production and reserves up to a maximum of 17.7 million payable ounces. The Endeavor Mine is located 720 km northwest of Sydney in New South Wales and has been in production since 1983. Under the terms of the original agreement, CDE Australia, a wholly-owned subsidiary of Coeur, paid Cobar $15.1$15.4 million of cash at the closing. In addition, CDE Australia, subject to certain conditions, will pay Cobar approximately $23.7$26.3 million upon the receipt of a report confirming that the reserves at the Endeavor mine are equal to or greater than the reported ore reserves for 2004. Payment couldwill occur in 2007.2008. In addition to these upfront payments, pursuant to the original agreement, Coeur pays Cobar an operating cost contribution of $1.00 for each ounce of payable silver plus a further increment which was to begin when the silver price exceeds $5.23 per ounce. This further increment was to begin on the second anniversary of the agreement and would have been 50% of the amount by which the silver price exceeds $5.23 per ounce. A cost contribution of $0.25 per ounce is also payable by Coeur in respect of new ounces of proven and probable silver reserves as they are discovered. The Company has paid a cost contribution of approximately $2.1 million during 2007.
On March 28, 2006, CDE Australia Pty, Ltd. (CDE Australia), reached an agreement with CBH Resources Ltd. to modify the terms of the original silver purchase agreement. Under the modified terms, CDE Australia owns all silver production and reserves up to a total of 20.0 million payable ounces, up from 17.7 million payable ounces in the original agreement. Based on the most recent ore reserve report, the current ore reserve contains approximately 15.314.4 million payable ounces. To date, the Company has received 0.71.4 million payable ounces based on current metallurgical recovery and current smelter contract terms. Expansion of the ore reserve will be required to achieve the maximum payable ounces of silver production as set forth in the modified contract. The silver price-sharing provision is deferred until such time as Coeur has received approximately 2 million cumulative ounces of silver from the mine or June 2007, whichever is later. In addition, the silver price-sharing threshold increased to US$7.00 per ounce, from the previous level of US$5.23 per ounce.F-22
Broken Hill Mine:On September 8, 2005, the Company acquired all of the silver production and reserves, up to a maximum of 17.2 million payable ounces, contained at the Broken Hill mine in Australia, which is owned and operated by Perilya Broken Hill Ltd. (“PBH”) for $36.7$36.9 million. The Broken Hill Mine is located in New South Wales, Australia and is a zinc/lead/silver ore body. Pursuant to the Agreement, the transaction includes up to a maximum of approximately 24.5 million contained ounces (or 17.2 million payable ounces) of silver to be mined by PBH at Broken Hill on the Company’s behalf. In addition, CDE Australia will pay PBH an operating cost contribution of approximately US$2.00 for each ounce of payable silver under the terms of the Agreement and PBH may earn up to US$6.0 million of additional consideration by meeting certain silver production thresholds through 2014. No additional payments were made during 2007, 2006 or 2005.F-23
Non-Producing and Development Properties San Bartolome Project:Bartolomé: On September 9, 1999, the Company acquired EmpressaEmpresa Minera Manquiri (“Manquiri”). Manquiri’s principal asset is the San BartolomeBartolomé project, a silver exploration and development property located near the city of Potosi,Potosí, Bolivia. The San BartolomeBartolomé project consists of silver-bearing gravel deposits which lend themselves to simple surface mining methods. The mineral rights for the San BartolomeBartolomé project are held through long-term joint venture/lease agreements with several local independent mining co-operatives and the Bolivian State owned mining company, (“COMIBOL”). Production from San BartolomeBartolomé is subject to a royalty of 4% payable to the co-operatives and COMIBOL. During 2004, the Company completed an updated feasibility study, obtained all required permits and commenced construction of the San BartolomeBartolomé mine. The Company estimates the cost of constructiontotal capital costs (excluding political risk insurance premiums and capitalized interest) of theat San BartolomeBartolomé mine to be approximately $174 million.$220 million of which $129.2 million had been incurred as of December 31, 2007. During 2006,2007, the Company capitalized $14.6$100.2 million in connection with construction activities at San Bartolome.Bartolomé.
Kensington Project:Kensington: Kensington is a gold property located near Juneau, Alaska. The mine will be an underground gold mine accessed by a horizontal tunnel and will utilize conventional and mechanized underground mining methods. The ore will be processed in a flotation mill that produces a concentrate which will be sold to third party smelters. During 2006,2007, the Company capitalized $121.6$99.0 million in connection with construction activities at Kensington. The company estimatesCompany has expended approximately $269.7 million as of December 31, 2007.Palmarejo: Palmarejo is engaged in the exploration and development of silver and gold properties located in the State of Chihuahua in northern Mexico, and its principal silver and gold properties are collectively referred to as the “Palmarejo project.” The Palmarejo project is currently under development and is expected to commence commercial production in the first half of 2009. The total capital cost of contructionthe project, from the time the Company acquired it on December 21, 2007, is estimated to be approximatly $238approximately $225 million.Discontinued Operations Coeur Silver Valley (Galena) Mine: On June 1, 2006, the Company completed the sale of 100% of the shares of its wholly owned subsidiary Coeur Silver Valley, Inc. to U.S. Silver Corporation for $15 million in cash plus a post-closing working capital adjustment of $1.1 million.NOTE HI — LONG-TERM DEBT11/1 ¼%4% Debentures
The $180.0 million principal amount of 1 ¼%1/4% Debentures due 2024 outstanding at December 31, 20062007 are convertible into shares of common stock at the option of the holder on January 15, 2011, 2014, and 2019, unless previously redeemed, at a conversion price of $7.60 per share, subject to adjustment in certain events.F-23
The Company is required to make semi-annual interest payments on the debentures. The debentures are redeemable at the option of the Company before January 18, 2011, if the closing price of the Company’s common stock over a specified number of trading days has exceeded 150% of the conversion price, and anytime thereafter. Before January 18, 2011, the redemption price is equal to 100% of the principal amount of the notes plus an amount equal to 8.75% of the principal amount of the notes, less the amount of any interest actually paid on the notes on or prior to the redemption date. The debentures have no other funding requirements until their maturity on January 15, 2024.F-24
The fair value of the debentures is determined by market transactions on or near December 31, 20062007 and 2005,2006, respectively. The fair value of the debentures, as of December 31, 2007 and 2006, was $156.6 million and 2005, was $163.8 million, and $146.7 million, respectively. Total interest expense on debentures and notes for the year ended December 31, 2007, 2006, and 2005 and 2004 was $2.3 million, of which $2.3 million was capitalized as a cost of certain properties under development in 2007; $2.3 million, of which $1.4 million was capitalized as a cost of certain properties under development in 2006,2006; and $2.3 million, of which $0.2 million was capitalized as a cost of certain properties under development in 2005, and $2.9 million, of which $0.1 million was capitalized as a cost of certain properties under development in 2004, respectively. Interest paid was $2.3 million in 2006,2007, $2.3 million in 2005,2006, and $1.6$2.3 million in 2004.2005.
Bridging Debt Facility On October 22, 2007, Bolnisi entered into a $20 million credit facility with Macquarie Bank Limited to fund further exploration and development of the Palmarejo silver/gold project, surrounding exploration areas and for working capital purposes. The credit facility was extended to June 30, 2008 and bears interest at a variable rate (LIBOR) plus a margin of 2.45%. As of December 31, 2007, the Company has $20 million outstanding under the credit facility bearing an interest rate of 7.35%. Events of default under the credit facility include customary provisions for similar types of facilities.Bank Loan On August 30, 2007 (with amendment dated October 9, 2007), Palmarejo entered into a temporary credit facility of $2.0 million secured by the Company’s investments in Asset Backed Commercial Paper, to fund working capital requirements. The credit facility has been extended through May 31, 2008. As of December 31, 2007, an amount of $1.7 million has been drawn on the facility, which bears interest at prime less 1.50% and matures on May 31, 2008. The Company is required to reduce the amount of the outstanding credit facility with any proceeds received from the sale of the Asset Backed Commercial Paper.NOTE IJ — RECLAMATION AND REMEDIATION COSTS Reclamation and remediation costs are based principally on legal and regulatory requirements. Management estimates costs associated with reclamation of mining properties as well as remediation costs for inactive properties. The Company uses assumptions about future costs, mineral prices, mineral processing recovery rates, production levels and capital and reclamation costs. Such assumptions are based on the Company’s current mining plan and the best available information for making such estimates. On an ongoing basis, management evaluates its estimates and assumptions; however, actual amounts could differ from those based on such estimates and assumptions. The Asset Retirement Obligationasset retirement obligation is measured using the following factors: 1) Expected labor costs, 2) Allocated overhead and equipment charges, 3) Contractor markup, 4) Inflation adjustment, and 5) Market risk premium. The sum of all these costs is discounted, using the Company’s credit adjusted risk-free interest rate from the time we expect to pay the retirement obligation to the time we incur the obligation. The measurement objective is to determine the amount a third party would demand to assume the asset retirement obligation.F-24
Upon initial recognition of a liability for an asset retirement obligation, the Company capitalized the asset retirement cost as an increase in the carrying amount of the related long-lived asset. The Company depletes this amount using the units-of-production method. The Company is not required to re-measure the obligation at fair value each period, but the Company is required to evaluate the cash flow estimates at the end of each reporting period to determine whether the estimates continue to be appropriate. Upward revisions in the amount of undiscounted cash flows are discounted using a current credit-adjusted risk-free rate. Downward revisions are discounted using the credit-adjusted risk-free rate that existed when the original liability was recorded.recorded, or, if not readily determinable, at the weighted average discount rate used to record the liability.
At December 31, 2007 and 2006, $33.1 million and 2005, $29.9 million, and $23.5 million, respectively, werewas accrued for reclamation obligations related to currently producing and developmental mineral properties. In addition, the Company has accrued $1.8$1.7 million and $1.2$1.8 million, respectively, for reclamation obligations associated with former mining activities. These amounts are also included in reclamation and mine closure liabilities. In the fourth quarter of 2007, the Company reviewed its cash flow estimates for its asset retirement obligations. This resulted in a net increase to the asset retirement obligation of $3.4 million and a corresponding increase to the carrying amount of the asset to be retired. For the purpose of consolidated statement of cash flows, these amounts are non-cash transactions. The increase was due to additional reclamation required at the Company’s Cerro Bayo mine, Kensington project and San Bartolomé project. The increase was discounted using the Company’s current weighted average credit adjusted risk-free rate of 9.34%. In the fourth quarter of 2006, the Company reviewed its cash flow estimates for its asset retirement obligations. This resulted in a net increase to the asset retirement obligation of $6.1 million and a corresponding increase to the carrying amount of the asset to be retired. For the purpose of consolidated statement of cash flows, these amounts are non-cash transactions. The increase was due to additional reclamation required at the Company’s Rochester mine, Kensington and San Bartolome projects. The increase was discounted using the Company’s current weighted average credit adjusted risk-free rate of 7.6%. In the fourth quarter of 2005, the Company reviewed its cash flow estimates for its asset retirement obligations. This resulted in a net increase to the asset retirement obligation of $6.4 million and a corresponding increase to the carrying amount of the asset to be retired. For the purpose of consolidated statement of cash flows, these amounts are non-cash transactions. The increase was due to additional reclamation required as a result of the expansion of the Company’s Cerro Bayo mine and adjustments to future estimated costs at the Company’s Rochester mine, Kensington project and San BartolomeBartolomé project. The increase was discounted using the Company’s current weighted average credit adjusted risk-free rate of 7.79%7.6%.
F-25
The following is a description of the changes to the Company’s asset retirement obligations for the years ended December 31, 2007 and 2006 and 2005:(in thousands): Years Ended December 31, 2007 2006 Asset retirement obligation — January 1 $ 29,909 $ 23,524 Accretion 2,260 1,780 Additions 3,390 6,069 Changes in estimates (1,202 ) (507 ) Settlements (1,222 ) (957 ) Asset retirement obligation — December 31 $ 33,135 $ 29,909
F-25
Year Ended December 31, 2006
2005
(in thousands) Asset retirement obligation - January 1 $ 23,524 $ 16,921 Accretion 1,780 1,265 Additions 6,069 6,397 Changes in estimates (507 ) (74 ) Settlements (957 ) (985 )
Asset retirement obligation - December 31 $ 29,909 $ 23,524
NOTE JK — INCOME TAXESIncome (loss)
The components of income from continuing operations before income taxes iswere as follows:Year Ended December 31, 2006
2005
2004
(in thousands) United States $ 33,252 $ (5,576 ) $ (22,281 ) Foreign 50,393 21,805 (1,540 )
Total $ 83,645 $ 16,229 $ (23,821 )
follows (in thousands):
Years Ended December 31, 2007 2006 2005 United States $ 21,909 $ 33,252 $ (5,576 ) Foreign 36,908 50,393 21,805 Total $ 58,817 $ 83,645 $ 16,229
The components of the consolidated income tax (provision) benefitprovision from continuing operations were as follows:Years Ended December 31,
2006
2005
2004
Current: United States - Alternative minimum tax $ (900 ) $ 212 $ 1,382 United States - Foreign withholding (713 ) -- -- Foreign - Argentina (4,842 ) (66 ) -- Foreign - Australia (4,673 ) -- -- Deferred: Foreign - Argentina 65 929 -- Foreign - Australia (93 ) (404 ) -- Foreign - Chile 2,930 (2,154 ) 4,403
Income tax benefit (provision) $ (8,226 ) $ (1,483 ) $ 5,785
follows (in thousands):
Years Ended December 31, 2007 2006 2005 Current: United States — Alternative minimum tax $ (381 ) $ (900 ) $ 212 United States — Foreign withholding tax (904 ) (713 ) — Foreign — Argentina (6,590 ) (4,842 ) (66 ) Foreign — Australia (4,898 ) (4,673 ) — Deferred: Foreign — Argentina 172 65 929 Foreign — Australia (664 ) (93 ) (404 ) Foreign — Chile (1,662 ) 2,930 (2,154 ) Income tax provision $ (14,927 ) $ (8,226 ) $ (1,483 )
A reconciliation of the Company’s effective tax rate with the federal statutory tax rate for the periods indicated is as follows:Years Ended December 31 2006
2005
2004
Tax benefit (provision) from continuing operations $ (29,276 ) $ (5,680 ) $ 8,337 State tax benefit (provision) from continuing operations (2,509 ) (487 ) 715 Excess percentage depletion and related deductions 6,199 4,265 3,698 Change in valuation allowances 14,778 (5,555 ) (9,474 ) Effect of foreign earnings 4,744 4,744 1,346 US and foreign non-deductible expenses (1,059 ) 632 610 Foreign currency exchange rates -- 827 -- Other net (1,103 ) (229 ) 553
$ (8,226 ) $ (1,483 ) $ 5,785
Years Ended December 31 2007 2006 2005 Tax provision from continuing operations $ (20,600 ) $ (29,276 ) $ (5,680 ) State tax provision from continuing operations (1,766 ) (2,509 ) (487 ) Percentage depletion and related deductions 4,860 6,199 4,265 Change in valuation allowance 3,896 14,778 (5,555 ) U.S. and Foreign non-deductible expenses (663 ) (711 ) 632 Foreign tax rate differences 2,309 4,744 4,744 Foreign withholding taxes (904 ) (713 ) — Other, net (2,059 ) (738 ) 598 $ (14,927 ) $ (8,226 ) $ (1,483 )
F-26
As of December 31, 20062007 and 2005,2006, the significant components of the Company’s deferred tax assets and liabilities were as follows:Years Ended December 31, 2006
2005
Deferred tax liabilities: Property, plant and equipment , net $ 7,318 $ 7,665 Investments in foreign subsidiaries 9,761 471
17,079 8,136
Deferred tax assets: Mineral properties 62,284 66,664 Net operating loss carryforwards 68,794 88,130 Alternative minimum tax credit 2,479 1,246 carryforwards Investments in foreign subsidiaries 8,129 404 Capital loss carryforwards 12,864 5,672 Other 6,197 3,173
160,747 165,289 Valuation allowance (137,992 ) (154,379 )
22,755 10,910
Net deferred tax assets $ 5,676 $ 2,774
The Company has not had a strong earnings history which would be objective evidence as required by generally accepted accounting principles to recognize its net operating less carryforwards and other deductible temporary differences. It is likely that the alternative minimum tax will exceed the regular tax for the foreseeable future. Accordingly, the Company has recorded a valuation allowance of $138.0 million as of December 31, 2006, which includes a full valuation allowance against the $2.5 million minimum tax credit carryforward, which is available for an unlimited carryforward period to offset regular federal income tax in excess of the alternative minimum tax. The Company has reviewed its domestic and foreign deferred tax assets and, except for approximately $6.2 million deferred tax assets related to the Company’s Cerro Bayo and Martha mines, has not recognized the potential tax benefits in other jurisdictions because at this time management believes that the realization of such benefits in future periods does not meet the more likely than not criteria.follows (in thousands):
Years Ended December 31 2007 2006 Deferred tax liabilities: Mineral properties $ 552,007 $ — Investment in foreign subsidiaries 18,430 9,761 Property, plant and equipment, net 2,836 3,580 573,273 13,341 Deferred tax assets: Net operating loss carryforwards 111,996 80,869 Investment in foreign subsidiaries 16,331 8,129 Capital loss carryforwards 10,305 12,897 Asset retirement obligation 10,234 9,914 Unrealized foreign currency loss and other 8,651 — Accrued expenses 3,330 2,345 Alternative minimum tax credit carryforwards 2,520 2,139 Inventory 1,523 4,274 Mineral properties — 53,290 164,890 173,857 Valuation allowance (160,898 ) (154,840 ) 3,992 19,017 Net deferred tax assets (liabilities) $ (569,281 ) $ 5,676
The Company has evaluated the amount of taxable income and periods over which it must be earned to allow for realization of itsthe deferred tax assets. Based onupon this analysis, the Company determined it is more likely than not that over the next two years pretax book income in Chile and Argentina where the future tax rate is 17% and 35%, respectively, is sufficient for recognition of $6.2 million ofnet deferred tax assets.assets of $1.1 million and $3.5 million will be realized in Argentina and Chile, respectively. Thus, the Company has recorded valuation allowances as follows (in thousands): Years Ended December 31 2007 2006 U.S. $ 111,685 $ 122,101 Argentina 1,966 1,130 Australia 7,282 — Canada 8,220 — New Zealand 30,999 30,778 Chile and other 746 831 $ 160,898 $ 154,840
The Company monitorscontinues to monitor the valuation allowance each quarterquarterly, and makeswill make the appropriate adjustments as necessary. The Company adopted the provisions of FASB Interpretation No. 48, “Accounting for Uncertainty in Income Taxes,” (FIN 48) an interpretation of FASB Statement No. 109, “Accounting for Income Taxes” on January 1, 2007. FIN 48 clarifies the criteria that an individual tax position must satisfy for some or all of the benefits of that position to be recognized in a company’s financial statements. FIN 48 prescribes a recognition threshold of more likely than not, and a measurement attribute for all tax positions taken or expected to be taken on a tax return. The Company determined that FIN 48 had no impact on the financial statements, and as a result, did not record any cumulative effect adjustment related to the allowance as appropriate based primarily upon continued developmentadoption of anFIN 48.F-27
The Company files income tax returns in the US federal jurisdiction, various US states and in certain foreign jurisdictions. To the extent there are loss carryovers in any such jurisdictions, the statute of limitations generally remains open. The Company has previously determined the earnings historyfrom certain foreign jurisdictions were not indefinitely reinvested. Accordingly, the Company has recognized deferred taxes and projected future earnings.withholding taxes related to those jurisdictions where the subsidiary’s net equity determined for financial reporting purposes exceeds tax basis.
During the first quarter of 2006,2007, the Company incurred anotheran ownership change which generally limits the availability of existing tax attributes, including net operating loss carryforwards to reduce future taxable income. The Company will be limited from utilizing tax attributes to reduce future taxable income or tax liabilities. Therefore, the Company has the following tax attribute carryforwards as of December 31, 2006:U.S.
Chile
New Zealand
Other
Total
Regular net operating losses $86,004 $30,464 $93,267 $444 $210,179 Alternative minimum tax net operating losses 53,651 -- -- -- 53,651 Capital losses 33,853 -- -- -- 33,853 Alternative minimum tax credits 2,180 -- -- -- 2,180 Foreign tax credits 299 -- -- -- 299
2007 (in thousands):
New U.S. Chile Mexico Canada Australia Zealand Other Total Regular net operating losses $ 110,286 $ 22,110 $ 109,600 $ 5,653 $ 6,389 $ 93,936 $ 2,487 $ 350,461 Alternative minimum tax net operating losses 26,946 — — — — — — 26,946 Capital losses 19,339 — — — 9,855 — — 29,194 Alternative minimum tax credits 2,520 — — — — — — 2,520
The U.S. net operating losses expire in 2011from 2016 through 2025 and the Canada net operating losses expire from 2025 through 2027. The Mexico net operating losses expire in 2017 and 2018, while the foreign countryremaining net operating losses from the foreign jurisdictions have an indefinite carryforward period. The U.S. capital losses expire from 2008 through 2012 while the Australia capital losses generally have an indefinite carryforward period. The Company’s capital losses expire in 2007 through 2011; alternativeAlternative minimum tax credits have an indefinite carryforward period and the foreign tax credits generally expire in 2026.F-27
do not expire.
NOTE KL — SHAREHOLDERSSHAREHOLDER’S EQUITY On May 11, 1999, the Company’s shareholders adopted a new shareholder rights plan (the “Plan”). The Plan entitles each holder of the Company’s common stock to one right. Each right entitles the holder to purchase one one-hundredth of a share of newly authorized Series B Junior Preferred Stock at an exercise price of $100. The rights will not be distributed and become exercisable unless and until ten business days after a person acquires 20% of the outstanding common shares or commences an offer that would result in the ownership of 30% or more of the shares. Each right also carries the right to receive upon exercise that number of Coeur common shares which has a market value equal to two times the exercise price. Each preferred share issued is entitled to receive 100 times the dividend declared per share of common stock and 100 votes for each share of common stock and is entitled to 100 times the liquidation payment made per common share. The Board may elect to redeem the rights prior to their exercisability at a price of $0.01 per right. The new rights will expire on May 24, 2009, unless earlier redeemed or exchanged by the Company. Any preferred shares issued are not redeemable. At December 31, 20062007 and 2005,2006, there were a total of 277,995,133550,453,019 and 249,902,142277,995,133 rights outstanding, respectively, which was equal to the number of outstanding shares of common stock.Stock Issues During 2006
During the first quarter of 2006, the Company completed a public offering of 27.6 million shares of common stock at a public offering price of $5.60 per share. The Company realized net proceeds of $146.2 million after payment of the underwriters’ discount. Offering costs incurred were $8.3 million.Stock Issues During 2005
During the third quarter of 2005, the Company completed a public offering of 9.9 million shares of common stock at a public offering price of $3.70 per share. The Company realized total net proceeds from the offering, after payment of the underwriters’ discount, of approximately $35.9 million. Offering costs incurred were $0.6 million.F-28
Stock Issues During 2004
During the fourth quarter of 2004, the Company completed a public offering of 26.6 million shares of common stock at a public offering price of $4.50 per share, which included 1.6 million shares purchased by the underwriters at the offering price to cover over allotments. The Company realized total net proceeds from the offering, after payment of the underwriters’ discount, of approximately $113.1 million. Offering costs incurred were $6.7 million.
NOTE LM — STOCK-BASED COMPENSATION PLANS The Company has an Annual Incentive Plan, a Long-Term Incentive Plan (the “2003 Long-Term Incentive Plan”) and a Directors’ Plan (the “Directors’ Plan”). Total employee compensation expense charged to operations and capital projects under these Plans was $4.6$6.3 million, $3.9$4.7 million and $2.8$3.8 million for 2007, 2006 and 2005, and 2004, respectively. Annual Incentive Plan Under the Annual Incentive Plan, the Board of Directors may annually approve cash-based awards to the executive officers and key management employees based on certain Company and employee performance measures. Cash payments for 2007, 2006 2005 and 20042005 amounted to $2.6 million, $2.2 million and $2.7 million, and $2.0 million, respectively.F-28
1989 Long-Term Incentive Plan Under the 1989 Long-Term Incentive Plan, as amended by shareholders in 1995, the Company may grant non-qualified and incentive stock options that are exercisable at prices equal to the fair market value of the shares on the date of grant and vest cumulatively at an annual rate of one third during the three-year period following the date of grant. In addition to stock options, the Company’s 1989 Long-Term Incentive Plan provides for grants of stock appreciation rights (SAR’s)(SARs), restricted stock, restricted stock units, performance shares, performance units, cash based awards, and stock based awards. The number of shares authorized to be issued under this plan was 2.9 million shares. There were 0.6 million shares reserved for issuance under this plan at December 31, 20062007 for stock options previously awarded. No further awards will be made under this plan. 2003 Long-Term Incentive Plan The 2003 Long-Term Incentive Plan (the “LTIP”) was approved by our shareholders on May 20, 2003, and replaced our prior 1989 Long-Term Incentive Plan. Under the plan, we may grant nonqualified stock options, incentive stock options, stock appreciation rights (“SARs”), restricted stock, restricted stock units, performance shares, performance units, cash-based awards and other stock-based awards to our executive officers. The number of shares authorized for grant under this plan was 6.8 million shares. There were 6.25.8 million shares reserved for issuance under this plan at December 31, 2006.2007. Of the 6.25.8 million shares, 4.94.1 million shares can be issued for future grants. There are 1.01.3 million options and 0.20.4 million performance shares outstanding under these plans. Directors Plan On June 3, 2005, the Company’s shareholders approved the 2005 Non-Employee Directors’ Equity Incentive Plan and authorized 500,000 shares of common stock for issuance under the plan. During 2007 and 2006, 59,476 and 2005, 35,042 and 35,996 shares were issued in lieu of $0.2$0.3 million and $0.1$0.2 million, respectively, of Directors’ fees. At December 31, 2006, 0.4 million2007, 400,000 shares are reserved for issuance under this plan. Under the previous Directors’ plan, options were granted only in lieu of annual directors’ fees. For the year ended December 31, 2004, a total of 40,318 options had been granted in lieu of directors’ fees of $0.1 million. At December 31, 2006, 0.5 million2007, 500,000 shares are reserved for issuance under this plan for stock options previously awarded. No further grants will be made under this plan.F-29
As of December 31, 20062007 and 2005,2006, options to purchase 2,089,6502,281,595 shares and 2,218,6292,089,650 shares of common stock, respectively, were outstanding under the Long-Term and the Directors’ Plans described above. The options are exercisable at prices ranging from $0.74 to $17.94$8.94 per share. Stock options granted under the Company’s incentive plans vest over three years and are exercisable over a period not to exceed 10 years from the grant date. Exercise prices are equal to the fair market value of the shares on the date of the grant. The value of each option award is estimated on the date of the grant using the Black-Scholes option pricing model. Restricted stock is granted at the fair market value of the underlying shares on the date of grant and vest in equal installments annually over three years. Holders of the restricted stock are entitled to vote the shares and to receive any dividends declared on the shares. Performance shares also are granted at the fair market value of the underlying shares on the date of grant. Compensation costs ultimately recognized are equal to the grant date fair value. Vesting is contingent on meeting certain performance measuresmarket conditions based on relative total shareholder return. The performance shares vest at the end of the three-year service period. Performance shares granted underperiod if the plan assume that the performance measure will be achieved. If such performance measuresmarket conditions are not met, no furthermet. The existence of a market condition requires recognition of compensation cost regardless of whether the market condition is recognized and if determined improbable of achieving the performance measures any previously recognized compensation is reversed.F-29
ever satisfied.
Effective January 1, 2006, the Company began recording compensation expense associated with awards of equity instruments in accordance with Statement of Financial Accounting Standards (“SFAS”)SFAS No. 123(R), “Share-Based Payment”. Prior to January 1, 2006, the Company accounted for awards of equity instruments according to the provisions of SFAS No. 123 and related interpretations, and therefore no related compensation expense was recorded for awards granted with no intrinsic value. The Company adopted the modified prospective transition method provided for under SFAS No. 123(R), and, consequently, has not retroactively adjusted results fromfor prior periods. Under this transition method, compensation cost associated with awards of equity instruments recognized in 2006 includes: 1) amortization related to the remaining unvested portion of all awards granted for the fiscal years 1995 to 2005, based on the grant date fair value, estimated in accordance with the original provisions of SFAS No. 123, “Accounting for Stock-Based Compensation”; and 2) amortization related to all equity instruments awards granted subsequent to December 31, 2005, based on the grant-date fair value estimated in accordance with the provisions of SFAS No. 123(R). The compensation cost is included in administrative and general expenses, production costs and the cost of self-constructed property, plant and equipment as deemed appropriate. Prior to the Company’s adoption of SFAS No. 123(R), benefits of tax deduction in excess of recognized compensation costs were reported as operating cash flows. SFAS No. 123(R) requires excess tax benefits be reported as a financing cash inflow rather than as a reduction of taxes paid. There were no significant excess tax benefits for the years ended December 31, 2007, 2006 2005 and 2004.2005.
The compensation expense recognized in the Company’s consolidated financial statements for the year ended December 31, 2007, 2006 2005 and 20042005 for awards of equity instruments was $2.2$3.7 million, $2.5 million and $1.2 million, respectively, of which $0.2 million, $0.3 million, and $1.1$0 million, respectively.respectively, was capitalized as part of mine development activities. As of December 31, 2006,2007, there was $1.8$1.7 million of total unrecognized compensation cost (net of estimated forfeitures) related to unvested stock options, restricted stock grants and performance share grants which is expected to be recognized over a weighted-average vesting period of 2.0 years. The Company continues to estimate the fair value of each stock option award on the date of grant using the Black-Scholes option valuation model. The Company now estimates forfeitures of stock-based awards based on historical data and adjusts the forfeiture rate periodically. The adjustment of the forfeiture rate will result in a cumulative adjustment in the period the forfeiture estimate is changed. During the year ended December 31, 2006, the Company recorded an adjustment of $0.1 million to reduce compensation expense for forfeited awards.F-30
The impact of adopting SFAS No. 123(R) as of January 1, 2006 resulted in a decrease in net income of $1.4 million, or less than $0.01 per basic and diluted share for the year ended December 31, 2006. The impact of adoption excludes the amortization of restricted stock awards in the amount of $1.1 million for the year ended December 31, 2006. Compensation expense related to the amortization of restricted stock awards was recognized prior to the implementation of SFAS No. 123(R). Cash received from share options exercised under the Long-Term Incentive Plan for the years ended December 31, 2007, 2006 and 2005 and 2004 were $0.2 million, $0.8 million $0.1 million and $0.3$0.1 million, respectively, and is reflected as an other financing activity in the Company’s consolidated statements of cash flows. The adjustment of the forfeiture rate resulted in a cumulative adjustment in the period the forfeiture estimate is charged. During the year ended December 31, 2006, the Company recorded an adjustment of $0.1 million to reduce compensation expense for forfeiture awards.
The following pro-forma information, as required by SFAS No. 148, “Accounting for Stock-Based Compensation-Transition and Disclosure an amendment of FASB Statement No. 123,” is presented for comparative purposes and illustrates the effect on net income per common share for the periodsperiod presented as if the Company had applied the fair value recognition provisions of SFAS No. 123(R) to stock-based employee compensation prior to December 31, 2005.F-30
Year Ended December 31,
2005
2004
(in thousands except per share data)
Net income (loss) as reported $ 10,551 $ (16,858 ) Add: Stock-based employee compensation expense included in reported net income 1,237 1,137 Less: Stock-based employee compensation expense determined under fair value for all awards (2,316 ) (2,017 )
Net income (loss) - Pro forma $ 9,472 $ (17,738 )
Net income (loss) per share: Basic and diluted - As reported $ 0.04 $ (0.08 )
Basic and diluted - Pro forma $ 0.04 $ (0.08 )
Year Ended December 31, 2005 (in thousands, except per share data) Net income as reported $ 10,551 Add: Stock-based employee compensation expense included in reported net income 1,237 Less: Stock-based employee compensation expense determined under fair value for all awards (2,316 ) Net income — Pro forma $ 9,472 Net income per share: Basic and diluted — As reported $ 0.04 Basic and diluted — Pro forma $ 0.04
The weighted average fair value of stock options on the date of grant, and the assumptions used to estimate the fair value of the stock options using the Black-Scholes option valuation model were as follows:Year Ended December 31, 2006
2005
2004
Weighted average fair value of options granted $3.35 $2.53 $4.83 Expected volatility 68.5% 68.5% 75.7% Expected life 6 years 6 years 6 years Risk-free interest rate 4.6% 3.9% 3.3% Expected dividend yield 0.0% 0.0% 0.0%
Years Ended December 31, 2007 2006 2005 Weighted average fair value of options granted $ 2.35 $ 3.35 $ 2.53 Expected volatility 58.9 % 68.5 % 68.5 % Expected life 6 years 6 years 6 years Risk-free interest rate 4.5 % 4.6 % 3.9 % Expected dividend yield 0.0 % 0.0 % 0.0 %
The expected volatility of the option is determined using historical volatilities based on historical stock prices. The Company estimated the expected life of options granted using the midpoint between the vesting date and the original contractual term. The risk free rate was determined using the yield available on U.S. Treasury Zero-coupon issues with a remaining term equal to the expected life of the option. The Company has not paid dividends on its common stock since 1996.F-31
The following table summarizes stock option activity during the years ended December 31, 2004, 2005, 2006 and 2006:Shares
Weighted Average
Exercise Price
Stock options outstanding at December 31, 2003 1,650,054 $2.11 Granted 333,250 $6.95 Exercised (169,527 ) $1.69 Canceled/expired (16,869 ) $6.32
Stock options outstanding at December 31, 2004 1,796,908 $3.01 Granted 566,149 $3.92 Exercised (52,007 ) $1.61 Canceled/expired (92,421 ) $5.69
Stock options outstanding at December 31, 2005 2,218,629 $3.16 Granted 332,169 $5.14 Exercised (395,723 ) $1.99 Canceled/expired (65,425 ) $7.65
Stock options outstanding at December 31, 2006 2,089,650 $3.56
F-31
2007:
Weighted Average Shares Exercise Price Stock options outstanding at December 31, 2004 1,796,908 $ 3.01 Granted 566,149 $ 3.92 Exercised (52,007 ) $ 1.61 Cancelled/expired (92,421 ) $ 5.69 Stock options outstanding at December 31, 2005 2,218,629 $ 3.16 Granted 332,169 $ 5.14 Exercised (395,723 ) $ 1.99 Canceled/expired (65,425 ) $ 7.65 Stock options outstanding at December 31, 2006 2,089,650 $ 3.56 Granted 462,015 $ 3.99 Exercised (56,167 ) $ 3.29 Canceled/expired (213,903 ) $ 5.99 Stock options outstanding at December 31, 2007 2,281,595 $ 3.42
Options exercisable at December 31, 2007, 2006 and 2005 were for 1,598,685, 1,413,117, and 2004 were 1,413,117, 1,562,217 and 1,509,217,shares, respectively, with a weighted average exercise price of $3.06, $2.95 and $2.53, and $2.25, respectively. The following table summarizes information for options currently outstanding at December 31, 2006:Options Outstanding
Options Exercisable
Range of
Exercise
Price
Number
Outstanding
Weighted
Average
Exercise
Price
Weighted
Average
Remaining
Contractual
Life (Years)
Number
Exercisable
Weighted
Average
Exercise
Price
Weighted
Average
Remaining
Contractual
Life (Years)
$0.74 to $1.22 442,641 $0.80 4.77 442,641 $0.80 4.77 $1.23 to $1.85 336,525 $1.75 5.67 336,525 $1.75 5.67 $1.86 to $2.63 111,502 $2.10 5.90 111,502 $2.10 5.90 $2.64 to $3.92 537,089 $3.86 7.50 248,767 $3.78 6.77 $3.93 to $7.09 624,288 $6.00 7.96 236,077 $6.81 6.62 $7.10 to $17.94 37,605 $11.68 0.57 37,605 $11.68 0.57
2,089,650 $3.56 6.55 1,413,117 $2.95 5.62
2007:
Options Outstanding Options Exercisable Weighted Weighted Weighted Average Weighted Average Range of Average Remaining Average Remaining Exercise Number Exercise Contractual Number Exercise Contractual Price Outstanding Price Life (Years) Exercisable Price Life (Years) $0.74 to $1.22 442,641 $ 0.80 3.77 442,641 $ 0.80 3.77 $1.23 to $1.85 320,420 $ 1.75 4.67 320,420 $ 1.75 4.67 $1.86 to $2.63 111,502 $ 2.10 4.90 111,502 $ 2.10 4.90 $2.64 to $3.92 497,135 $ 3.85 6.45 362,061 $ 3.83 6.19 $3.93 to $5.14 661,175 $ 4.47 8.51 113,339 $ 5.06 6.72 $5.15 to $8.94 248,722 $ 7.19 5.60 248,722 $ 7.19 5.60 2,281,595 $ 3.42 6.11 1,598,685 $ 3.06 5.07
As of December 31, 2006,2007, the total future compensation cost related to non-vested options not yet recognized in the statement of income was $0.6$1.7 million and the weighted average period over which these awards are expected to be recognized was 2 years. The total intrinsic value of share options exercised during the year ended December 31, 2007, 2006 and 2005 and 2004 was $0.04 million, $1.6 million $0.1 million and $0.3$0.1 million, respectively. At December 31, 2006,2007, the total intrinsic value was $3.8$4.1 million and $3.5$3.6 million for stock options outstanding and exercisable, respectively.F-32
The following table summarizes restricted stock activity during the years ended December 31, 2004, 2005, 2006 and 2006:Number of
Shares
Weighted Average
Grant Date Fair
Value
Outstanding at December 31, 2003 1,115,000 $1.28 Granted 236,070 $6.39 Vested (371,673 ) $1.28 Forfeited (168,399 ) $2.09
Outstanding at December 31, 2004 810,998 $2.60 Granted 359,640 $3.94 Vested (433,623 ) $2.30 Forfeited (75,634 ) $4.58
Outstanding at December 31, 2005 661,381 $3.30 Granted 220,894 $5.14 Vested (445,025 ) $2.71 Forfeited (24,218 ) $4.83
Outstanding at December 31, 2006 413,032 $4.83
2007:
Weighted Number of Average Grant Shares Date Fair Value Outstanding at December 31, 2004 810,998 $ 2.60 Granted 359,640 $ 3.94 Vested (433,623 ) $ 2.30 Forfeited (75,634 ) $ 4.58 Outstanding at December 31, 2005 661,381 $ 3.30 Granted 220,894 $ 5.14 Vested (445,025 ) $ 2.71 Forfeited (24,218 ) $ 4.83 Outstanding at December 31, 2006 413,032 $ 4.83 Granted 497,990 $ 3.99 Vested (241,784 ) $ 4.82 Forfeited (66,043 ) $ 4.30 Outstanding at December 31, 2007 603,195 $ 4.20
The fair value of restricted stock is determined based on the closing stock price on the grant date. As of December 31, 2006,2007, there was $0.6 million of total unrecognized compensation cost related to restricted awards to be recognized over a weighted-averageweighted average period of 1.92.1 years.F-32
The following table summarizes performance shares activity during the year ended December 31, 2006:Number of
Shares
Weighted Average
Grant Date Fair
Value
Outstanding at December 31, 2005 -- $-- Granted 220,894 5.14 Exercised -- -- Forfeited (10,449 ) 5.14
Outstanding at December 31, 2006 210,445 $5.14
2007:
Weighted Number of Average Grant Shares Date Fair Value Outstanding at December 31, 2005 — $ — Granted 220,894 5.14 Exercised — — Forfeited (10,449 ) 5.14 Outstanding at December 31, 2006 210,445 $ 5.14 Granted 306,852 3.99 Exercised (30,298 ) 4.48 Forfeited (66,456 ) 4.47 Outstanding at December 31, 2007 420,543 $ 4.45
The fair value of performance shares is determined based on fair value modeling techniques that consider the closing price on the grant date.market and service conditions relevant for these grants. As of December 31, 2006,2007, there was $0.7 million of total unrecognized compensation cost related to performance shares to be recognized over a weighted average period of 2.11.9 years.NOTE M –N — DEFINED BENEFIT PENSION, POST-RETIREMENT MEDICAL BENEFIT, DEFINED CONTRIBUTION AND 401(k) PLANSOn
In June 2006, the Company completed the sale of 100% of the shares of its wholly owned subsidiary Coeur Silver Valley Inc. As a result, the liabilities were assumed by the purchaser and the Company has no longer maintainsfurther obligations related to the defined benefit plan and post retirement medical benefits plan summarized below.Defined Benefit Plan In connection with the acquisition of Coeur Silver Valley acquired in 1999, the Company was required to maintain non-contributory defined benefit pension plans covering substantially all employees. Benefits for salaried plans were based on salary and years of service. Hourly plans were based on negotiated benefits and years of service. The Company’s funding policy was to contribute annually the minimum amount prescribed, as specified by applicable regulations. Prior service costs and actuarial gains and losses were amortized over plan participants’ expected future period of service using the straight-line method.F-33
Actuarial Present Value of Projected Benefit Obligation: The actuarial present value of our projected benefit obligations was determined using the following assumptions:Factor 2005 2004 Discount Rate for Benefit Obligations 5.75% 6.0% Expected Return on Plan Assets 6.0% 6.0% Rate of Compensation Increases 5.0% 5.0%
Factor 2005 Discount Rate for Benefit Obligations 5.75 % Expected Return on Plan Assets 6.0 % Rate of Compensation Increases 5.0 %
Expected rate of return on plan assets: The expected rate of return on plan assets for purposes of the actuarial valuation was assumed to be 6% as of both December 31, 2005 and 2004.2005. The rate of return used was based on the plan’s experience and asset mix of the portfolio, as well as taking into consideration the fact that no lump sum distributions were paid from the plan. The plan had an expected return on plan assets of $0.3 million and $0.2 million for 2005 and 2004, respectively.2005. The actual return on plan assets was $0.2 million and $0.3 million for 2005 and 2004, respectively.2005. The discount rate was determined based on Moody’s Aaa bond rating.F-33
Plan assets and determination of fair value: The fair value of plan assets was determined using the market value of the investments held by the plan at December 31 of each year as quoted by public equity and bond markets. The asset mix iswas in accordance with the plan’s investment policy which allowed for 60% equity investments, 35% fixed income investments and 5% cash and cash equivalents. The investment portfolio for the funded portion of the obligation iswas held in a trust. The Company’s funding policy was to contribute amounts to the plan sufficient to meet the minimum funding requirements as set forth in the Employee Retirement Income Security Act of 1974 plus such additional tax deductible amounts as was advisable under the circumstances. The Company had funded $0.4 million through June 1, 2006 (the date of the Coeur Silver Valley sale), and $0.7 million and $0.7 million in 2005, and 2004, respectively, toward the obligation. The plan assets were invested principally in commingled stock funds, mutual funds and securities issued by the United States government. Pursuant to the plan’s investment policy, the plan adoptsadopted more specific investment directives from time to time. The plan’s actual portfolio at December 31, 2005 had 60% equity investments and 40% fixed income investments. Since the performance of each asset class of the portfolio within any measurement period impacted its relative weight in the portfolio, the actual percentage of each asset class in the portfolio may not have matched to the current directive. The expected long-term rates of return for each asset class within the portfolio, and therefore the portfolio weighted average, was based on an estimate of the return for each of the securities within an asset class, currently benchmarked at 10.0% for equity investments, 3.0% for fixed income investments and 2%2.0% for cash and cash equivalents. For each type of investment within the Trust’s portfolio structure, the Trustees evaluated both returns and the relationship between risk and return. The expectation was that each asset class would produce a superior risk-adjusted return over a market cycle.F-34
The following table shows the expected long term rates of return associated with each asset class:Asset Class
Actual Mix
Target Mix
Expected Long
Term Rates of
Return
Equity investments 60 % 60 % 10.00 % Fixed income investments 40 % 35 % 3.00 % Cash and cash equivalents 0 % 5 % 2.00 %
Weighted average 7.15 %
Expected Long Term Actual Target Rates of Asset Class Mix Mix Return Equity investments 60 % 60 % 10.00 % Fixed income investments 40 % 35 % 3.00 % Cash and cash equivalents 0 % 5 % 2.00 % Weighted average 7.15 %
The Trustees evaluated the level of volatility within the total Trust and each of its component investments. The Trustees set maximum volatility thresholds for each class of investment which consisted of 16% for equity investments, 7.25% for fixed income investments and 1% for cash and cash equivalents, with the total portfolio volatility expected to not exceed 11%. The Trustees then compared how these specific investments performed against other indexed funds and other managed portfolios with similar objectives. The specific criteria used to measure the performance was as follows: 1) A targeted 7-11% average annualized return based on long-term historical market data;
2) Expected returns over a market cycle that exceed the total portfolio indexed benchmark;
3) Volatility that was not substantially greater than the portfolio indexed benchmark volatility of 11%; and
4) Risk adjusted returns that were comparable with indexed benchmarks.
F-34
The components of net periodic benefit costs were as follows:follows (in thousands, except for discount rate): For the Year Ended December 31, 2005 Assumptions: Discount rate 5.75 % Components of net periodic benefit cost: Service cost $ 309 Interest cost 464 Expected return on plan assets (261 ) Amortization of prior service cost 59 Recognized actuarial loss 339 Net periodic benefit cost $ 910
F-35
For the Year Ended
December 31,
2006
2005
2004
Assumptions: Discount rate -- 5.75 % 6.0 % Components of net periodic benefit cost: Service cost -- $ 309 $ 319 Interest cost -- 464 412 Expected return on plan assets -- (261 ) (215 ) Amortization of prior service cost -- 59 56 Recognized actuarial loss -- 339 327
Net periodic benefit cost -- $ 910 $ 899
The change in benefit obligation and plan assets and a reconciliation of funded status were as follows:At December 31,
2006
2005
Change in benefit obligation Projected benefit obligation at beginning of year $ 8,405 $ 7,494 Service cost -- 309 Interest cost -- 464 Benefits paid (105 ) (217 ) Actuarial loss -- 355 Discontinued operations (8,300 ) --
Projected benefit obligation at end of year $ -- $ 8,405
Accumulated benefit obligation $ -- $ 6,606
Change in plan assets Fair value of plan assets at beginning of year $ 4,806 $ 4,098 Actual return on plan assets -- 205 Employer contributions 360 720 Benefits paid (105 ) (217 ) Discontinued operations (5,061 ) --
Fair value of plan assets at end of year $ -- $ 4,806
Reconciliation of funded status Funded status $ -- $ (3,599 ) Unrecognized actuarial loss -- 3,803 Unrecognized prior service cost -- 369
Net asset reflected in the consolidated balance sheet $ -- $ 573
Weighted average assumptions Discount rate -- 5.75 % Expected long-term rate of return on plan assets -- 6.0 % Rate of compensation increase -- 5.0 %
follows (in thousands):
At December 31, 2006 Change in benefit obligation Projected benefit obligation at beginning of year $ 8,405 Service cost — Interest cost — Benefits paid (105 ) Actuarial loss — Discontinued operations (8,300 ) Projected benefit obligation at end of year $ — Accumulated benefit obligation $ — Change in plan assets Fair value of plan assets at beginning of year $ 4,806 Actual return on plan assets — Employer contributions 360 Benefits paid (105 ) Discontinued operations (5,061 ) Fair value of plan assets at end of year $ — Reconciliation of funded status Funded status $ — Unrecognized actuarial loss — Unrecognized prior service cost — Net asset reflected in the consolidated balance sheet $ — Weighted average assumptions Discount rate — Expected long-term rate of return on plan assets — Rate of compensation increase —
Post Retirement Medical Benefits In connection with the acquisition of Coeur Silver Valley in 1999, the Company reimbursed Asarco, Inc. (prior owner) for certain healthcare benefits for retired employees and their dependents who retired before September 9, 1999. There were ten active hourly and salaried employees of Coeur Silver Valley and three inactive participants eligible under Asarco’s post-retirement medical benefits plan. These post-retirement medical benefits were self-insured by the plan’s prior sponsor. The actuarial present value of the post retirement benefit obligation iswas determined as of December 31 for each of the years presented.F-35
Actuarial Present Value of Projected Benefit Obligation: The discount rate was determined based on Moody’s Aaa Bond Rating as reported on the last business day of the plan year plus 0.50%. The Company amortized its unrecognized, unfunded accumulated post-retirement benefit obligation using a straight-line method over a 3.1-year period. The 3.1-year estimate was based on the average remaining service period of the active participants. Expected long-term rate of return on plan assets No assets arewere held in a trust for the post retirement health care plan; therefore, there iswas no expected long-term rate of return assumption. A “pay as you go” funding method was utilized for this plan. The Company contributed $0.01 million and $0.2 million to the plan as benefit payments for 2005 and 2004, respectively.2005.F-36
The following table sets forth the actuarial present value of postretirement medical benefit obligations and amounts recognized in the Company’s financial statements:At December 31,
2006
2005
(in thousands)
Assumptions: Discount rate -- 5.75 %
Change in benefit obligation Net benefit obligation at beginning of year $ 356 $ 1,973 Service cost -- 8 Interest cost -- 20 Prior service cost (credit) -- (387 ) Actuarial (gain) loss -- (1,248 ) Benefits paid -- (10 ) Discontinued operations (356 ) --
Net benefit obligation at end of year -- $ 356
Change in plan assets Assets at beginning of year $ -- $ -- Benefits paid -- (10 ) Contributions -- 10
Assets at end of year $ -- $ --
Reconciliation of funded status Funded status at end of year $ -- $ (356 ) Unrecognized net actuarial (gain) loss -- (815 ) Unrecognized prior service cost (credit) -- (262 )
Net amount recognized at end of year (recorded as accrued benefit cost in the accompanying balance sheet) $ -- $ (1,433 )
F-36
statements (in thousands, except for discount rate):
At December 31, 2006 2005 Assumptions: Discount rate — 5.75 % Change in benefit obligation Net benefit obligation at beginning of year $ 356 $ 1,973 Service cost — 8 Interest cost — 20 Prior service cost (credit) — (387 ) Actuarial (gain) loss — (1,248 ) Benefits paid — (10 ) Discontinued operations (356 ) — Net benefit obligation at end of year — $ 356 Change in plan assets Assets at beginning of year $ — $ — Benefits paid — (10 ) Contributions — 10 Assets at end of year $ — $ — Reconciliation of funded status Funded status at end of year $ — $ (356 ) Unrecognized net actuarial (gain) loss — (815 ) Unrecognized prior service cost (credit) — (262 ) Net amount recognized at end of year (recorded as accrued benefit cost in the accompanying balance sheet) $ — $ (1,433 )
The components of net periodic benefit costs were as follows:For the Year Ended December 31,
2006
2005
2004
(in thousands)
Assumptions: Discount rate -- 6.0 % 6.0 %
Components of net periodic benefit cost: Service cost -- $ 8 $ 17 Interest cost -- 20 116 Amortization of prior service cost -- (125 ) -- Amortization of actuarial gain -- (372 ) --
Net periodic pension cost (benefit) -- $ (469 ) $ 133
follows (in thousands, except for discount rate):
For the Year Ended December 31, 2006 2005 Assumptions: Discount rate — 6.0 % Components of net periodic benefit: Service cost — $ 8 Interest cost — 20 Amortization of prior service cost — (125 ) Amortization of actuarial gain — (372 ) Net periodic pension benefit — $ (469 )
During 2005, an adjustment was required to reflect a decreased liability of $1.6 million related to a reduction in plan participation. This adjustment resulted in an actuarial gain. The amortization of the prior service cost of $0.4 million and the unrealized actuarial gain of $1.2 million is greater than 10% of the benefit obligation which required the gain to be amortized over the average remaining service period of the active participants, estimated to be approximately 3.1 years. The amortization of the unrealized gain is included as a component on net periodic benefit cost. The Company also amortized the unrecognized actuarial gain over the same period.F-37
A 1% change in assumed medical trend rates would have had the following effects:(in thousands) 1% Increase
1% Decrease
2005
2004
2005
2004
Effect on total of service and interest cost components $ 2 $ 8 $ (2 ) $ (7 ) Effect on postretirement benefit obligation $ 22 $ 106 $ (19 ) $ (91 )
effects (in thousands):
1% 1% Increase Decrease 2005 2005 Effect on total of service and interest cost components $ 2 $ (2 ) Effect on postretirement benefit obligation $ 22 $ (19 )
Postretirement benefits included medical benefits for retirees and their dependents. In December 2003, The Medicare Prescription Drug, Improvement and Modernization Act of 2003 was enacted. Our accumulated postretirement benefit obligation and net periodic postretirement obligation do not reflect the effects that the requirements of this law since eligibility under this plan ends at age 65.Defined Contribution Plan The Company provides a noncontributory defined contribution retirement plan for all eligible U.S. employees. Total contributions charged to expense were $1.2$0.8 million, $0.9$1.2 million and $0.9 million for 2007, 2006 2005 and 2004,2005, respectively, which is based on a percentage of the salary of eligible employees.401(k) Plan The Company maintains a retirement savings plan (which qualifies under Section 401(k) of the U.S. Internal Revenue code) covering all eligible U.S. employees. Under the plan, employees may elect to contribute up to 100% of their cash compensation, subject to ERISA limitations. The Company is required to make matching cash contributions equal to 50% of the employees’ contribution, up to a maximum of 3% of the employees’ compensation. Contributions to the plan charged to operations were $0.6 million, $0.5$0.6 million and $0.5 million in 2007, 2006, and 2005, and 2004, respectively.F-37
NOTE NO — DERIVATIVE FINANCIAL INSTRUMENTS AND FAIR VALUE OF FINANCIAL INSTRUMENTS The Company enters into derivative instruments to manage the Company’s exposure to foreign currency exchange rates and market prices associated with changes in gold and silver commodity prices. The Company accounts for its derivative contracts in accordance with SFAS No. 133, “Accounting for Derivative Instruments and Hedging Activities.” Accordingly, unrealized gains and losses related to the change in fair market value of derivative contracts, which qualify and are designated as cash flow hedges, are recorded as other comprehensive income or loss and such amounts are recognized into earnings as the associated contracts are settled.Forward Foreign Exchange Contracts During 20062007 and 2005,2006, the Company entered into forward foreign currency exchange contracts to reduce the foreign exchange risk associated with forecasted Chilean peso operating costs for 2007 and 2008 at its Cerro Bayo mine. The contracts entered into in 20062007 require the Company to exchange U.S. dollars for Chilean pesos at a weighted average exchange rate of 531503 pesos to each U.S. dollar. At December 31, 20062007 and 2005,2006, the Company had foreign exchange contracts of $4.8$9.0 million and $7.2$4.8 million in U.S. dollars, respectively. For the years ended December 31, 20062007 and 2005,2006, the Company recorded a realized gain (loss) of approximately $(0.4)$0.4 million and $0.1$(0.4) million, respectively, in connection with its foreign currency hedging program. As of December 31, 2006,2007, the fair value of the foreign exchange contracts was a liability of $0.1 million. Change in gains (losses) accumulated in other comprehensive income (loss) for cash flow hedging contracts are as follows:follows (in thousands):F-38
December 31, 2006
2005
2004
(in thousands) Beginning balance $ (171 ) $ -- $ 131 Reclassification to earnings 379 (68 ) 8 Change in fair value (268 ) (103 ) (139 )
Ending balance $ (60 ) $ (171 ) $ --
December 31, 2007 2006 2005 Beginning balance $ (60 ) $ (171 ) $ — Reclassification to earnings (371 ) 379 (68 ) Change in fair value 349 (268 ) (103 ) Ending balance $ (82 ) $ (60 ) $ (171 )
Commodity Derivatives The Company has occasionally entered into forward metal sales contracts to manage the price risk onassociated with a portion of its cash flows against fluctuating gold prices. As of December 31, 2006,2007, the Company had no outstanding forward sales contracts for either gold or silver. For metal delivery contracts, the realized price pursuant to the contract is recognized when physical gold or silver is delivered in satisfaction of the contract. For the year ended December 31, 2004, the Company incurred realized hedging losses of $1.2 million.Concentrate Sales Contracts The Company enters into concentrate sales contracts with third-party smelters. The contracts, in general, provide for a provisional payment based upon provisional assays and quoted metal prices and the provisionally priced sales contain an embedded derivative that is required to be separated from the host contract for accounting purposes. The host contract is the receivable from the sale of concentrates at the forward price at the time of sale. The embedded derivative, which is the final settlement price based on a future price, does not qualify for hedge accounting. These embedded derivatives are recorded as derivative assets (in Prepaid expenses and other), or derivative liabilities (in Accrued liabilities and other), on the balance sheet and are adjusted to fair value through earnings each period until the date of final settlement.F-38
At December 31, 2007, the Company had outstanding provisionally priced sales of $61.2 million consisting of 3.3 million ounces of silver and 20,775 ounces of gold, which had a fair value of approximately $63.8 million including the embedded derivative. At December 31, 2006, the Company had outstanding receivables for provisionally priced sales of $74.5 million, consisting of 4.6 million ounces of silver and 29,577 ounces of gold, which had a fair market value of approximately $75.6 million including the embedded derivative. At December 31, 2005, the Company had outstanding receivables for provisionally priced sales of $47.0 million, consisting of 3.5 million ounces of silver and 40,000 ounces of gold, which had a fair market value of approximately $49.3 million including the embedded derivative.
Credit Risk The credit risk exposure related to any potential hedging activities is limited to the unrealized gains, if any, on outstanding contracts based on current market prices. To reduce counter-party credit exposure, the Company deals only with a group of large credit-worthy financial institutions and limits credit exposure to each. The Company does not anticipate non-performance by any of its counter parties. In addition, to allow for situations where positions may need to be revised, the Company deals only in markets that it considers highly liquid.NOTE OP — COMMITMENTS AND CONTINGENCIESLabor Union Contract The Company maintains two labor agreements in South America, consisting of a labor agreement with Syndicato de Trabajadores de Compañía Minera Cerro Bayo Ltd. at its Cerro Bayo mine in Chile and with Associacion Obrera Minera Argentina at its Martha mine in Argentina. The agreement at Cerro Bayo is effective from December 22, 200524, 2007 to December 21, 20072010 and the agreement at Mina Martha is effective from June 12, 2006 to June 1, 2008. Additionally certain employees at San Bartolomé are covered by a labor agreement that became effective October 11, 2008.2007; this Bolivian labor agreement does not have a fixed term. As of December 31, 2006,2007, the Company had approximately 20%44% of its worldwide labor force covered by collective bargaining agreements.F-39
Termination Benefits In September 2005, the Company established a one-time termination benefit program at the Rochester mine as the mine approaches the end of its mine life. The employees will be required to render service until they are terminated in order to be eligible for benefits. Approximately 80% of the workforce is expected to bewas severed by mid-2007,the end of the third quarter of 2007, while the remaining 20% are expected to stay on for residual leaching and reclamation activities. As of December 31, 2006,2007, the total amount expected to be incurred under this plan is approximately $3.4$4.7 million. The liability is recognized ratably over the minimum future service period. The amount accrued as of December 31, 2006 was $2.0 million and was charged to production costs. The following is a description of the changes to the Company’s termination benefits for the years ended December 31, 2007, 2006 and 2005 and 2004.Year Ended December 31, 2006
2005
2004
(in thousands) Beginning Balance $ 542 $ -- $ -- Accruals 1,803 542 -- Payments (386 ) -- --
Ending Balance $ 1,959 $ 542 $ --
(in thousands):
Year Ended December 31, 2007 2006 2005 Beginning Balance $ 1,959 $ 542 $ — Accruals 1,917 1,803 542 Payments (3,056 ) (386 ) — Ending Balance $ 820 $ 1,959 $ 542
NOTE PQ — SIGNIFICANT CUSTOMERS The Company markets its metals products and concentrates primarily to bullion trading banks and five third party smelters. These customers then sell the metals to end users for use in industry applications such as electronic circuitry, jewelry and silverware production and the manufacture and development of photographic film. Sales of metals to bullion trading banks amounted to approximately 47%, 45%47% and 59%45% of total metals sales in 2007, 2006 2005 and 2004,2005, respectively. Generally, the loss of a single bullion trading bank customer would not adversely affect the Company in view of the liquidity of the markets and availability of alternative trading banks.F-39
The Company currently markets its silver and gold concentrates to third party smelters in Japan, Mexico, Australia and Germany. Sales of metals concentrates to third party smelters amounted to approximately 53%, 55%53% and 41%55% of metals sales in 2007, 2006 2005 and 2004,2005, respectively. The loss of any one smelter customer could have a material adverse effect on the Company in the event of the possible unavailability of alternative smelters.NOTE QR — SEGMENT INFORMATION Operating segments are defined as components of an enterprise about which separate financial information is available that is evaluated regularly by the chief operating decision maker, or decision-making group, in deciding how to allocate resources and in assessing performance. The Company’s chief operating decision-making group is comprised of the Chief Executive Officer, Chief Financial Officer, the Senior Vice President of North American Operations and the President of South American Operations. The operating segments are managed separately because each segment represents a distinct use of Company resources which contribute to Company cash flows in its respective geographic area. The Company’s reportable operating segments include the Rochester, Cerro Bayo, Martha, San Bartolome,Bartolomé, Kensington, Palmarejo and CDE Australia (Endeavor and Broken Hill) mining properties. All operating segments are engaged in the discovery and/or mining of gold and silver and generate the majority of their revenues from the sale of these precious metal concentrates and/or refined precious metals. The Cerro Bayo and Martha mines sell precious metal concentrates, typically under long-term contracts, to a smelter located in Japan (Dowa Mining Ltd.), Mexico (Met-Mex Penoles) and Germany (Noordeutche)(Norddeutsche). Refined gold and silver produced by the Rochester mine is principally sold on a spot basis to precious metals trading banks such as Standard Bank and Mitsui. Concentrates produced at CDE Australia (Endeavor and Broken Hill mines) are sold to Zinifex,Nystar (formerly Zinifex), an Australia smelter. The Company’s exploration programs are included as other. The other segment also includes the corporate headquarters, elimination of intersegment transactions and other items necessary to reconcile to consolidated amounts.F-40
The accounting policies of the operating segments are the same as those described in the summary of significant accounting policies above. The Company evaluates performance and allocates resources based on profit or loss before interest, income taxes, depreciation and amortization, unusual and infrequent items, and extraordinary items. Revenues from silver sales were $151.0 million, $147.8 million and $91.9 million in 2007, 2006, and $63.1 million in 2006, 2005, and 2004, respectively. Revenues from gold sales were $64.3 million, $68.8 million and $64.4 million in 2007, 2006, and $45.9 million in 2006, 2005, and 2004, respectively. Financial information relating to the Company’s segments is as follows:Rochester
Mine
Cerro
Bayo Mine
Martha
Mine
Endeavor
Mine
Broken Hill
Mine
San
Bartolome
Project
Kensington
Project
Other
Total
2006
Total net sales and revenues $ 102,393 $ 50,293 $ 34,733 $ 5,363 $ 23,791 $ -- $ -- $ -- $ 216,573
Depreciation and depletion $ 13,745 $ 5,795 $ 1,313 $ 490 $ 5,120 $ -- $ -- $ 309 $ 26,772 Interest income -- 663 39 -- -- -- 8 17,276 17,986 Interest expense -- 84 -- -- -- -- -- 1,140 1,224 Litigation settlement -- -- -- -- -- -- -- (2,365 ) (2,365 ) Income tax (benefit) provision from continuing operations -- (2,930 ) 4,689 -- -- -- -- 6,500 8,259 Segment profit (loss) 55,109 22,652 17,290 4,977 �� 19,427 (6 ) (1,030 ) (4,413 ) 114,006
Segment assets (A) 87,423 49,428 11,596 14,508 29,740 59,080 207,745 10,326 469,846 Capital expenditures 1,225 7,555 2,481 -- -- 14,597 121,552 588 147,998
F-40
Rochester
Mine
Cerro
Bayo Mine
Martha
Mine
Endeavor
Mine
Broken Hill
Mine
San
Bartolome
Project
Kensington
Project
Other
Total
2005
Total net sales and revenues $ 69,636 $ 59,624 $ 20,606 $ 2,148 $ 4,270 $ -- $ -- $ -- $ 156,284
Depreciation and depletion $ 10,403 $ 5,064 $ 860 $ 411 $ 1,807 $ -- $ 35 $ 309 $ 18,889 Interest income -- 154 (1 ) -- -- -- -- 9,036 9,189 Interest expense -- 26 -- -- -- -- -- 2,459 2,485 Litigation settlement -- -- -- -- -- -- -- (1,600 ) (1,600 ) Income tax (benefit) provision from continuing operations -- 2,154 (863 ) -- -- -- -- 192 1,483 Segment profit (loss) 24,876 22,978 6,105 1,700 3,282 (119 ) (7,143 ) (12,476 ) 39,203
Segment assets (A) 82,806 45,474 6,291 14,999 34,860 32,687 80,653 7,982 305,752 Capital expenditures 1,197 2,731 2,108 15,410 36,667 10,477 44,201 499 113,290
Rochester
Mine
Cerro
Bayo Mine
Martha
Mine
Endeavor
Mine
Broken Hill
Mine
San
Bartolome
Project
Kensington
Project
Other
Total
2004
Total net sales and revenues $ 64,005 $ 35,267 $ 9,775 $ -- $ - $ -- $ -- $ -- $ 109,047
Depreciation and depletion $ 10,229 $ 4,588 $ 1,669 $ -- $ - $ 4 $ 52 $ 291 $ 16,833 Interest income -- 13 -- -- -- -- -- 3,626 3,639 Interest expense 1 123 -- -- -- -- -- 2,707 2,831 Loss on forward sales contracts -- -- -- -- -- -- -- (936 ) (936 ) Income tax (benefit) provision from continuing operations -- (4,403 ) -- -- -- -- -- (1,382 ) (5,785 ) Merger expenses -- -- -- -- -- -- -- 15,676 15,676 Segment profit (loss) 26,784 9,638 (387 ) -- -- (4,549 ) (7,347 ) (11,684 ) 12,455
Segment assets (A) 75,529 30,898 3,387 -- -- 21,304 25,833 5,813 162,764 Capital expenditures 3,548 2,451 689 -- -- 950 83 642 8,363
Notes:
follows (in thousands): Broken San Rochester Cerro Bayo Martha Endeavor Hill Bartolomé Kensington Palmarejo Mine Mine Mine Mine Mine Project Project Project Other Total December 31, 2007 Total net sales of metals $ 100,903 $ 47,794 $ 38,077 $ 7,943 $ 20,602 $ — $ — $ — $ — $ 215,319 Productions costs applicable to sales 60,364 35,594 17,231 545 3,292 — (1 ) — — 117,025 Depreciation and depletion 8,697 6,260 1,731 755 3,054 — — — 487 20,984 Exploration expense 361 2,908 4,418 — — — 619 — 3,635 11,941 Other operating expenses 62 113 38 — — — 38 — 24,131 24,382 Interest and other income 2,948 1,590 (303 ) — — — 85 — 13,875 18,195 Interest expense — 23 — — — — — — 342 365 Income tax (credit) expense — 1,662 6,418 — — — 20 — 6,827 14,927 Profit (loss) $ 34,367 $ 2,824 $ 7,938 $ 6,643 $ 14,256 $ — $ (591 ) $ — $ (21,547 ) $ 43,890 Segment assets(A) $ 62,848 $ 63,570 $ 25,799 $ 17,885 $ 29,391 $ 169,196 $ 301,730 $ 1,759,153 $ 7,470 $ 2,437,042 Capital expenditures $ 1,647 $ 11,330 $ 16,444 $ 2,112 $ 213 $ 100,169 $ 92,337 $ — $ 1,942 $ 226,194
Broken San Rochester Cerro Bayo Martha Endeavor Hill Bartolomé Kensington Mine Mine Mine Mine Mine Project Project Other Total December 31, 2006 Total net sales of metals $ 102,393 $ 50,293 $ 34,733 $ 5,363 $ 23,791 $ — $ — $ — $ 216,573 Productions costs applicable to sales 47,310 27,780 12,538 386 4,364 — — — 92,378 Depreciation and depletion 13,745 5,795 1,313 490 5,120 — — 309 26,772 Exploration expense — 2,639 2,904 — — — 936 2,995 9,474 Other operating expenses — 28 17 — — — 108 21,581 21,734 Interest and other income 25 809 13 — — (6 ) 13 17,800 18,654 Interest expense — 84 — — — — — 1,140 1,224 Income tax (credit) expense — (2,930 ) 4,777 — — — — 6,379 8,226 Profit (loss) $ 41,364 $ 17,707 $ 13,196 $ 4,487 $ 14,307 $ (6 ) $ (1,031 ) $ (14,605 ) $ 75,419 Segment assets(A) $ 87,371 $ 49,428 $ 11,508 $ 15,666 $ 32,894 $ 59,080 $ 207,745 $ 6,154 $ 469,846 Capital expenditures $ 1,225 $ 7,555 $ 2,481 $ — $ — $ 16,805 $ 122,640 $ 588 $ 151,294
Broken San Rochester Cerro Bayo Martha Endeavor Hill Bartolomé Kensington Mine Mine Mine Mine Mine Project Project Other Total December 31, 2005 Total net sales of metals $ 69,636 $ 59,624 $ 20,606 $ 2,148 $ 4,270 $ — $ — $ — $ 156,284 Productions costs applicable to sales 44,547 33,574 9,016 278 817 — — — 88,232 Depreciation and depletion 10,403 5,064 860 411 1,807 — 35 309 18,889 Exploration expense 169 4,812 2,976 — — 83 1,165 1,431 10,636 Other operating expenses 225 110 690 — — — 5,979 21,194 28,198 Interest and other income 181 224 (172 ) — — (36 ) — 8,188 8,385 Interest expense — 26 92 — — — — 2,367 2,485 Income tax (credit) expense — 2,154 (862 ) — — — — 191 1,483 Profit (loss) $ 14,473 $ 14,108 $ 7,662 $ 1,459 $ 1,646 $ (119 ) $ (7,179 ) $ (17,304 ) $ 14,746 Segment assets(A) $ 82,631 $ 45,474 $ 3,791 $ 15,152 $ 36,493 $ 32,687 $ 80,653 $ 8,871 $ 305,752 Capital expenditures $ 1,197 $ 2,731 $ 2,108 $ 15,410 $ 36,667 $ 11,089 $ 53,155 $ 499 $ 122,856
(A) Segment assets consist of receivables, prepaids, inventories, property, plant and equipment, and mining properties.
2006
2005
2004
Income (loss) Total segment profit $ 114,006 $ 39,203 $ 12,455 Depreciation and amortization (26,772 ) (18,889 ) (16,833 ) Interest expense (1,224 ) (2,485 ) (2,831 ) Other (2,365 ) (1,600 ) (16,612 )
Income (loss) from continuing operations before income taxes $ 83,645 $ 16,229 $ (23,821 )
Assets Total assets for reportable segments $ 469,846 $ 305,752 $ 162,764 Cash and cash equivalents 270,672 54,896 65,218 Short-term investments 70,373 185,446 256,843 Other assets 38,735 33,894 28,350 Assets held for sale -- 14,828 12,602
Total consolidated assets $ 849,626 $ 594,816 $ 525,777
F-41
Geographic Information 2006 Revenues
Long-Lived
Assets
United States $ 102,393 $ 218,236 Australia 29,154 44,253 Chile 50,293 20,295 Argentina 34,733 3,700 Bolivia -- 50,858 Other foreign countries -- 214
Total $ 216,573 $ 337,556
2005
United States $ 69,636 $ 101,338 Australia 6,418 49,860 Chile 59,624 19,407 Argentina 20,606 2,568 Bolivia -- 32,194 Other foreign countries -- 237
Total $ 156,284 $ 205,604
2004
United States $ 64,005 $ 54,306 Australia -- -- Chile 35,267 15,332 Argentina 9,775 1,050 Bolivia -- 21,103 Other foreign countries -- 144
Total $ 109,047 $ 91,935
(a)Includes property, plant and equipment and mineral properties.
2007 2006 2005 Assets Total assets for reportable segments $ 2,437,042 $ 469,846 $ 305,752 Cash and cash equivalents 98,671 270,672 54,896 Short-term investments 53,039 70,373 185,446 Other assets 62,942 38,735 33,894 Total assets held for sale — — 14,828 Total consolidated assets $ 2,651,694 $ 849,626 $ 594,816
Geographic Information Long-Lived Revenues Assets 2007 United States $ 100,903 $ 305,876 Australia 28,545 42,772 Chile 47,794 28,028 Argentina 38,077 18,640 Mexico — 1,756,042 Bolivia — 151,716 Other foreign countries — 190 Total $ 215,319 $ 2,303,264 2006 United States $ 102,393 $ 218,236 Australia 29,154 44,253 Chile 50,293 20,295 Argentina 34,733 3,700 Bolivia — 50,858 Other foreign countries — 214 Total $ 216,573 $ 337,556 2005 United States $ 69,636 $ 101,338 Australia 6,418 49,860 Chile 59,624 19,407 Argentina 20,606 2,568 Bolivia — 32,194 Other foreign countries — 237 Total $ 156,284 $ 205,604
NOTE RS — LITIGATIONFederal Natural Resources Action
On March 22, 1996, an action was filed in the United States District Court for the District of Idaho by the United States against various defendants, including the Company, asserting claims under CERCLA and the Clean Water Act for alleged damages to federal natural resources in the Coeur d’Alene River Basin of Northern Idaho. The damages are claimed to result from alleged releases of hazardous substances from mining activities conducted in the area since the late 1800s.
In May 2001, the Company and representatives of the U.S. Government, including the Environmental Protection Agency, the Department of Interior and the Department of Agriculture, reached an agreement to settle the lawsuit. The terms of settlement are set forth in a Consent Decree issued by the court. Pursuant to the terms of the Consent Decree, dated May 14, 2001, the Company has paid the U.S. Government a total of approximately $3.9 million, of which $3.3 million was paid in May 2001 and the remaining $0.6 million was paid in June 2001. In addition, the Company will (i) pay the United States 50% of any future recoveries from insurance companies for claims for defense and indemnification under general liability insurance policies in excess of $0.6 million, (ii) accomplish certain cleanup work on the Mineral Point property and Caladay property, and (iii) make a conveyance to the U.S. or the State of Idaho of certain real property to possibly be used as a waste repository. Finally, commencing five years after effectiveness of the settlement, the Company will be obligated to pay royalties on all of its domestic and foreign operating properties, up to a cumulative of $3 million, amounting to a 2% net smelter royalty on silver production if the price of silver exceeds $6.50 per ounce, and a $5.00 per ounce royalty on gold production if the price of gold exceeds $325 per ounce. The royalty payment obligation commenced on May 14, 2006 and expires May 14, 2021. As of December 31, 2006, $2.5 million (including discontinued operations) of the $3.0 million was paid. It is expected that the remaining $0.5 million will be paid in the first half of 2007.
F-42
States of Maine, Idaho Andand Colorado Superfund Sites Related to Callahan Mining Corporation During 1991, the Company acquired all of the outstanding common stock of Callahan Mining Corporation. During 2001, the United States Forest Service made a formal request for information regarding the Deadwood Mine Site located in central Idaho. Callahan Mining Corporation had operated at this site during the 1940‘s.1940’s. The Forest Service believes that some cleanup action is required at the location. However, Coeur d’Alene Mines Corporation did not acquire Callahan until 1991, more than 40 years after Callahan disposed of its interest in the Deadwood property. The Company did not make any decisions with respect to generation, transport or disposal of hazardous waste at the site. Therefore, it is believed that the Company is not liable for any cleanup, and if Callahan might be liable, it has no substantial assets with which to satisfy any such liability. To date, no claim has been made by the United States for any cleanup costs against either the Company or Callahan.F-42
During 2002, the EPA made a formal request for information regarding a Callahan mine site in the State of Maine. Callahan operated there in the late 1960‘s,1960’s, shut the operations down in the early 1970‘s1970’s and disposed of the property. The EPA contends that some cleanup action is warranted at the site, and listed it on the National Priorities List in late 2002. The Company believes that because it made no decisions with respect to generation, transport or disposal of hazardous waste at this location, it is not liable for any cleanup costs. If Callahan might have liability, it has no substantial assets with which to satisfy such liability. To date, no claim has been made for any cleanup costs against either the Company or Callahan. In January 2003, the U.S. Forest Service made a formal request for information regarding a Callahan mine site in the State of Colorado known as the Akron Mine Site. Callahan operated there in approximately the late 1930s through the 1940s, and to the Company’s knowledge, disposed of the property. The Company is not aware of what, if any, cleanup action the Forest Service is contemplating. However, the Company did not make decisions with respect to generation, transport or disposal of hazardous waste at this location, and therefore believes it is not liable for any cleanup costs. If Callahan might have liability, it has no substantial assets with which to satisfy such liability. To date, no claim has been made for any cleanup costs against either the Company or Callahan.Federal District Court of Alaska Permit Challenge On September 12, 2005 three environmental groups (“Plaintiffs”) filed a lawsuit in Federal District Court in Alaska against the U.S. Army Corps of Engineers (“Corps of Engineers”) and the U.S. Forest Service (“USFS”) seeking to invalidate the permit issued to Coeur Alaska, Inc. for the Company’s Kensington mine. The Plaintiffs claim the Clean Water Act (CWA)(“CWA”) Section 404 permit issued by the Corps of Engineers authorizing the deposition of mine tailings into Lower Slate Lake conflicts with the CWA and is thus illegal.CWA. They additionally claim the USFS’s approval of the Amended Plan of Operations is arbitrary and capricious because it relies on the 404 permit issued by the Corps of Engineers. On November 8, 2005, Following the Corps of Engineers filed a Motion for Voluntary Remand with the court to review the permit issued to the Company under the CWA Section 404 and requested that the court stay the legal proceeding filed by the plaintiffs pending the outcome of review. On November 12, 2005, the Federal District Court in Alaska granted theCourt’s remand of the Section 404 permit to the Corps of Engineers for further review. On November 22, 2005,review, the Corps of Engineers advised the Company that it was suspending the Section 404 permit pursuant to the Court’s remand to further review the permit.
On March 29, 2006, the Corps of Engineers reinstated the Company’s 404 permit. On April 6, 2006 thepermit on March 29, 2006. The lawsuit challenging the permit was re-opened andon April 6, 2006; Coeur Alaska Inc. filed its answer to the Amended ComplaintComplaint; and Motion to Intervene as a Defendant-Intervenor in the action. Two other parties,Coeur Alaska, the State of Alaska, and Goldbelt, Inc., a local native corporation, also filed Motions to Intervene as Defendant-Intervenors as supporters of the Kensington project as permitted. The Company, the State of Alaska and Goldbelt, Inc. were granted Defendant-Intervenor status and joinedto join the agencies in their defense of the permits as issued.
F-43
permit.
On August 4, 2006, the Federal District Court in Alaska dismissed the Plaintiffs’ challenge and upheld the Section 404 permit. On August 7, 2006 the Plaintiffs filed a Notice of Appeal of the decision to the Ninth Circuit Court of Appeals (“Ninth Circuit Court”) and on August 9, 2006 the Plaintiffs additionally filed a Motion for Injunction Pending Appeal with the Ninth Circuit Court. The Ninth Circuit Court granted a temporary injunction pending appeal on August 24, 2006, enjoining certain activities relating to the lake tailings facility. The On May 22, 2007 the Ninth Circuit Court further ordered an expedited briefing schedulereversed the District Court’s August 4, 2006 decision which had upheld the Company’s 404 permit and issued its opinion that remanded the case to the District Court with instructions to vacate the Company’s 404 permit as well as the USFS Record of Decision approving the general tailings disposal plan as well as the Goldbelt 404 permit to construct the Cascade Point Marine Facility. On August 20, 2007, Coeur Alaska filed a Petition for Rehearing En Banc with the Ninth Circuit Court, as did the State of Alaska and Goldbelt, Inc. The Department of Justice, on the meritsbehalf of the legal challenge. AsCorps of Engineers, and USFS additionally filed a limited Petition for Rehearing with the Ninth Circuit panel seeking reconsideration of the mandate of the May 22, 2007 panel decision. On October 13, 2006,29, 2007, the parties filed their briefs inNinth Circuit denied the Petitions for Rehearing En Banc. On November 14, 2007, the Ninth Circuit granted a stay of the mandate pending further appeal to the Supreme Court, and participated in an oral argument on December 4, 2006. There is no indicationsubject to the development of whena reclamation plan for the Circuit Court may rule on the merits of appeal.lake area. The Company is unableand the State of Alaska filed Petitions for Certiorari to the Supreme Court of the United States on January 28, 2008. The Company cannot now predict the outcome ofpotential for obtaining further appeal or if it will prevail upon appeal if one is granted.F-43
No assurance can be given as to whether or when regulatory permits and approvals granted to the litigation.Company may be further challenged, appealed or contested by third parties or issuing agencies, or as to whether the Company will place the Kensington project into commercial production.
This litigation has contributed to an increase in capital costs. While the Company cannot now predict with certainty the outcome of this litigation, it believes it willshould ultimately prevail in the defense of the awarded permits, inprevail. In the event that the Company does not prevail, it could be necessary to seek an alternate site for the tailings disposal facility. The Company is not aware ofhas identified an alternate site that couldwhich it believes can be permitted or would be economic. Therefore, it is possible that an adverse legal decision could renderand has submitted a modified plan to the project uneconomic and an asset impairment would be necessary. As a result ofUSFS. Based upon the increase in capital and operating costs at the Kensington project,Company’s current estimates, an impairment writedown could be necessary should the expectation of the long-term price for gold decrease below approximately $510$606 per ounce. As of December 31, 2006,2007, the Kensington project has a carrying value of $206the Kensington project’s long-lived assets was $298.2 million.NOTE ST — SUMMARY OF QUARTERLY FINANCIAL DATA (UNAUDITED) The following table sets forth a summary of the quarterly results of operations for the years ended December 31, 2007 and 2006 and 2005:First
Quarter
Second
Quarter
Third
Quarter
Fourth
Quarter
(In Thousands - Except Per Share Data)
2006: Sales of metal $ 44,854 $ 54,041 $ 50,606 $ 67,072
Income (loss) from continuing operations $ 13,726 $ 20,132 $ 18,378 $ 23,183 Income (loss) from discontinued operations 612 12,516 (27 ) (33 )
Net income (loss) $ 14,338 $ 32,648 $ 18,351 $ 23,150
Basic net income (loss) per share Income (loss) from continuing operations $ 0.06 $ 0.07 $ 0.07 $ 0.08 Income (loss) from discontinued operations -- 0.05 -- --
Net income (loss) $ 0.06 $ 0.12 $ 0.07 $ 0.08
Diluted net income (loss) per share Income (loss) from continuing operations $ 0.05 $ 0.07 $ 0.06 $ 0.08 Income (loss) from discontinued operations -- 0.04 -- --
Net income (loss) $ 0.05 $ 0.11 $ 0.06 $ 0.08
(in thousands — except for per share data): First Second Third Fourth Quarter Quarter Quarter Quarter 2007: Sales of metal $ 50,860 $ 51,664 $ 52,863 $ 59,931 Net income $ 14,018 $ 11,918 $ 3,635 $ 14,319 Basic net income per share $ 0.05 $ 0.04 $ 0.01 $ 0.05 Diluted net income per share $ 0.05 $ 0.04 $ 0.01 $ 0.04
First Second Third Fourth Quarter Quarter Quarter Quarter 2006: Sales of metal $ 44,854 $ 54,041 $ 50,606 $ 67,072 Income from continuing operations $ 13,726 $ 20,132 $ 18,378 $ 23,183 Income from discontinued operations 612 12,516 (27 ) (33 ) Net income $ 14,338 $ 32,648 $ 18,351 $ 23,150 Basic net income per share Income from continuing operations $ 0.06 $ 0.07 $ 0.07 $ 0.08 Income from discontinued operations — 0.05 — — Net income $ 0.06 $ 0.12 $ 0.07 $ 0.08 Diluted net income per share Income from continuing operations $ 0.05 $ 0.07 $ 0.06 $ 0.08 Income from discontinued operations — 0.04 — — Net income $ 0.05 $ 0.11 $ 0.06 $ 0.08
F-44
First
Quarter
Second
Quarter
Third
Quarter
Fourth
Quarter
(In Thousands - Except Per Share Data)
2005: Sales of metal $ 32,235 $ 33,504 $ 39,281 $ 51,264 Income (loss) from continuing operations $ (784 ) $ (529 ) $ 4,722 $ 11,337 Income (loss) from discontinued operations (361 ) (1,172 ) (1,269 ) (1,393 )
Net income (loss) $ (1,145 ) $ (1,701 ) $ 3,453 $ 9,944
Basic net income (loss) per share Income (loss) from continuing operations $ 0.00 $ 0.00 $ 0.02 $ 0.05 Income (loss) from discontinued operations -- (0.01 ) (0.01 ) (0.01 )
Net income (loss) $ 0.00 $ (0.01 ) $ 0.01 $ 0.04
Diluted net income (loss) per share Income (loss) from continuing operations $ 0.00 $ 0.00 $ 0.02 $ 0.04 Income (loss) from discontinued operations -- (0.01 ) (0.01 ) --
Net income (loss) $ 0.00 $ (0.01 ) $ 0.01 $ 0.04
NOTE U — SUBSEQUENT EVENTDuring February 2008, Cobar reported to the Company that the reserves at the Endeavor mine exceed those reported for 2004, thereby fulfilling the contractual condition discussed in Note H. Consequently, the Company expects to pay Cobar the additional $26.3 million on April 1, 2008 plus accrued interest at the rate of 7.5% per annum from January 24, 2008.F-45
NOTES TO CONSOLIDATED FINANCIAL STATEMENTS
F-10
Prior to December 31, 2006, the Company classified its auction rate securities as cash and cash equivalents because the securities were highly liquid and the periods between interest rate resets generally did not exceed 90 days. During the fourth quarter of 2006, the Company determined that, pursuant to SFAS 95, “Statement of Cash Flows”, its auction securities cannot be classified as cash equivalents because their contractual maturities exceed 90 days. The Company classified its auction rate securities as of December 31, 2006 as short term investments.
The Company also corrected the classification in its 2005 and 2004 financial statement presentation by reclassifying $159.7 million and $207.9 million, respectively, of auction rate securities as of December 31, 2005 and December 31, 2004 from cash and cash equivalents to short-term investments. As a result, the following table shows the amounts, as originally presented in the Company’s Form 10-K, for the years ended December 31, 2005 and December 31, 2004 and the corrected 2005 and 2004 amounts as presented in its Form 10-K for the year ended December 31, 2006. This reclassification had no effect on total current assets, stockholders’ equity, net income (loss), net income (loss) per share or on cash provided by operating activities.
| For the year ended December 31, 2005 | As Previously Reported | Adjustment | Corrected | ||||||||
| (In Thousands) | |||||||||||
| Cash and Cash Equivalents | $ | 214,616 | $ | (159,720 | ) | $ | 54,896 | ||||
| Short-term Investments | 25,726 | 159,720 | 185,446 | ||||||||
| Net Cash Used in Investing Activities | (99,894 | ) | 48,130 | (51,764 | ) | ||||||
| Decrease in Cash and Cash Equivalents | (58,452 | ) | 48,130 | (10,322 | ) | ||||||
F-11
| For the year ended December 31, 2004 | As Previously Reported | Adjustment | Corrected | ||||||||
| (In Thousands) | |||||||||||
| Cash and Cash Equivalents | $ | 273,068 | $ | (207,850 | ) | $ | 65,218 | ||||
| Short-term Investments | 48,993 | 207,850 | 256,843 | ||||||||
| Net Cash Used in Investing Activities | (43,787 | ) | (167,136 | ) | (210,923 | ) | |||||
| Decrease in Cash and Cash Equivalents | 210,661 | (167,136 | ) | 43,525 | |||||||
F-11
F-12
In August 2007, the Company terminated mining and crushing operations at the Rochester mine as ore reserves were fully mined. Residual heap leach activities are expected to continue through 2011.
F-12
F-13
F-13
F-14
F-14
F-15
| 2006 | 2005 | 2004 | |||||||||
| Net income (loss) | $ | 88,486 | $ | 10,551 | $ | (16,858 | ) | ||||
| Unrealized gain (loss) on marketable securities | 63 | 853 | (347 | ) | |||||||
| Change in fair value of cash flow hedges, net of | 111 | (169 | ) | (130 | ) | ||||||
| settlements | |||||||||||
| Minimum pension liabilities | 2,219 | (237 | ) | (431 | ) | ||||||
| Other | (2 | ) | -- | -- | |||||||
| $ | 90,877 | $ | 10,998 | $ | (17,766 | ) | |||||
following (in thousands):
| 2007 | 2006 | 2005 | ||||||||||
| Net income | $ | 43,890 | $ | 88,486 | $ | 10,551 | ||||||
| Unrealized gain on short-term investments and marketable securities | 103 | 63 | 853 | |||||||||
| Change in fair value of cash flow hedges, net of settlements | (23 | ) | 111 | (169 | ) | |||||||
| Minimum pension liabilities | — | 2,219 | (237 | ) | ||||||||
| Foreign currency translation | 6 | (2 | ) | — | ||||||||
| $ | 43,976 | $ | 90,877 | $ | 10,998 | |||||||
F-15
| For the Year Ended December 31, 2006 | For the Year Ended December 31, 2005 | For the Year Ended December 31, 2004 | |||||||||||||||||||||||||||
| (In thousands except for EPS) | Income (Numerator) | Shares (Denominator) | Per-Share Amount | Income (Numerator) | Shares (Denominator) | Per-Share Amount | Income (Numerator) | Shares (Denominator) | Per-Share Amount | ||||||||||||||||||||
Basic EPS | |||||||||||||||||||||||||||||
| Income (loss) from | |||||||||||||||||||||||||||||
| continuing operations | $ | 75,419 | 271,357 | $ | 0.28 | $ | 14,746 | 242,915 | $ | 0.06 | $ | (18,036 | ) | 215,969 | $ | (0.08 | ) | ||||||||||||
| Income (loss) from discontinued | |||||||||||||||||||||||||||||
| operations | 13,067 | 271,357 | 0.05 | (4,195 | ) | 242,915 | (0.02 | ) | 1,178 | 215,969 | -- | ||||||||||||||||||
| Net income (loss) | $ | 88,486 | 271,357 | $ | 0.33 | $ | 10,551 | 242,915 | $ | 0.04 | $ | (16,858 | ) | 215,969 | $ | (0.08 | ) | ||||||||||||
| Effect of Dilutive Securities | |||||||||||||||||||||||||||||
| Equity awards | -- | 1,041 | -- | -- | 768 | -- | -- | -- | -- | ||||||||||||||||||||
| 1.25% convertible notes | 1,117 | 23,684 | -- | -- | -- | -- | -- | -- | -- | ||||||||||||||||||||
| Diluted EPS | |||||||||||||||||||||||||||||
| Income (loss) from | |||||||||||||||||||||||||||||
| continuing operations | $ | 76,536 | 296,082 | 0.26 | $ | 14,746 | 243,683 | $ | 0.06 | $ | (18,036 | ) | 215,969 | $ | (0.08 | ) | |||||||||||||
| Income (loss) from | |||||||||||||||||||||||||||||
| discontinued operations | 13,067 | 296,082 | 0.04 | (4,195 | ) | 243,683 | (0.02 | ) | 1,178 | 215,969 | -- | ||||||||||||||||||
| Net income (loss) | $ | 89,603 | 296,082 | $ | 0.30 | $ | 10,551 | 243,683 | $ | 0.04 | $ | (16,858 | ) | 215,969 | $ | (0.08 | ) | ||||||||||||
| December 31, 2006 | December 31, 2005 | December 31, 2004 | |||||||||
| Stock options | -- | -- | 1,796,908 | ||||||||
| 1.25% Notes | |||||||||||
| Convertible at $7.06 per share | -- | 23,684,211 | 23,684,211 | ||||||||
| Total potentially dilutive shares | -- | 23,684,211 | 25,481,119 | ||||||||
| Year Ended | Year Ended | Year Ended | ||||||||||||||||||||||||||||||||||
| December 31, 2007 | December 31, 2006 | December 31, 2005 | ||||||||||||||||||||||||||||||||||
| Income | Shares | Per-Share | Income | Shares | Per-Share | Income | Shares | Per-Share | ||||||||||||||||||||||||||||
| (In thousands except for EPS) | (Numerator) | (Denominator) | Amount | (Numerator) | (Denominator) | Amount | (Numerator) | (Denominator) | Amount | |||||||||||||||||||||||||||
Basic EPS | ||||||||||||||||||||||||||||||||||||
| Income from continuing operations | $ | 43,890 | 285,972 | $ | 0.15 | $ | 75,419 | 271,357 | $ | 0.28 | $ | 14,746 | 242,915 | $ | 0.06 | |||||||||||||||||||||
| Income from discontinued operations | — | 285,972 | — | 13,067 | 271,357 | 0.05 | (4,195 | ) | 242,915 | (0.02 | ) | |||||||||||||||||||||||||
| Net income | $ | 43,890 | 285,972 | $ | 0.15 | $ | 88,486 | 271,357 | $ | 0.33 | $ | 10,551 | 242,915 | $ | 0.04 | |||||||||||||||||||||
Effect of Dilutive Securities | ||||||||||||||||||||||||||||||||||||
| Equity awards | — | 868 | — | 1,041 | — | 768 | ||||||||||||||||||||||||||||||
| 1.25% convertible notes | 297 | 23,684 | 1,117 | 23,684 | — | — | ||||||||||||||||||||||||||||||
Diluted EPS | ||||||||||||||||||||||||||||||||||||
| Income from continuing operations | $ | 44,187 | 310,524 | 0.14 | $ | 76,536 | 296,082 | 0.26 | $ | 14,746 | 243,683 | $ | 0.06 | |||||||||||||||||||||||
| Income (loss) from discontinued operations | — | — | 13,067 | 296,082 | 0.04 | (4,195 | ) | 243,683 | (0.02 | ) | ||||||||||||||||||||||||||
| Net income | $ | 44,187 | 310,524 | $ | 0.14 | $ | 89,603 | 296,082 | $ | 0.30 | $ | 10,551 | 243,683 | $ | 0.04 | |||||||||||||||||||||
2007. Potentially diluting shares totaling 23,684,211 shares attributed to the 1.25% convertible notes have been excluded from the earnings per share calculation for the year ended December 31, 2005 as their effect was anti-dilutive.
ended December 31, 2006 and 2005.
In December 2004,February 2007, the FASB issued Statement No. 159, “The Fair Value Option for Financial Assets and Financial Liabilities” (“SFAS No. 123(R), “Share-Based Payments”, which revised159”). SFAS No. 123, “Accounting for Stock-Based Compensation”159 permits entities to choose to measure many financial instruments and superseded Accounting Principles Board (“APB”) Opinion 25, “Accounting for Stock Issued to Employees” and its related implementation guidance. SFAS No. 123(R) requires measurement and recording in the financial statements of the costs of employee services received in exchange for an award of equity instruments based on the grant-datecertain other items at fair value, with the objective of the award, recognized over the period during which an employee is requiredimproving financial reporting by mitigating volatility in reported earnings caused by measuring related assets and liabilities differently without having to provide services in exchange for such award.apply complex hedge accounting provisions. The Company adopted the provisions of SFAS No. 123(R) on January 1, 2006, using the modified prospective method. Accordingly, compensation expense was recognized for all newly granted awards and awards modified, repurchased, or cancelled after January 1, 2006. Compensation cost for the unvested portion of awards that were outstanding, as of January 1, 2006, is recognized ratably over the remaining vesting period. The compensation cost for the unvested portion of awards is based on the fair value at date of grant, adjusted for forfeitures, as determined pursuant to SFAS No. 123. The actual effect on net income and earnings per share in future periods will vary depending upon the number and fair value of options granted in future years compared to prior years. The adoption resulted in a charge to the Company’s statement of operations of $1.4 million in 2006 and did not impact the Company’s cash flow.
F-17
In March 2005, the Financial Accounting Standards Board (“FASB”) ratified Emerging Issues Task Force (“EITF#148;) Issue No. 04-06, “Accounting for Stripping Costs Incurred during Production in the Mining Industry.#148; EITF Issue No. 04-06 addresses the accounting for stripping costs incurred during the production phase of a mine and refers to these costs as variable production costs that should be included as a component of inventory to be recognized in costs applicable to sales in the same period as the revenue from the sale of inventory. The guidance in EITF Issue No. 04-06 was159 are effective for the Company in 2006. The guidance requires application through recognition of a cumulative effect adjustment to opening retained earnings in the period of adoption.Company’s fiscal year ending December 31, 2008. The Company adoptedis currently evaluating the impact that the adoption of this pronouncement as of January 1, 2006 and recorded a charge of approximately $0.4 million to write off deferred stripping costs, asstatement will have on the cumulative effect of a change in accounting method.
In May 2005, the FASB issued SFAS No. 154, “Accounting Changes and Error Corrections.” SFAS No. 154 established new standards on accounting for changes in accounting principles. SFAS No. 154 requires all such changes to be accounted for by retrospective application to the financial statements of prior periods unless prescribed otherwise or it is impracticable to do so. SFAS No. 154 is effective for accounting changes and error corrections made in fiscal years beginning after December 15, 2005. Adoption of SFAS No. 154 did not have a material impact on ourCompany’s consolidated financial position, results of operations or cash flows.and disclosures.
F-16
F-18
ThePALMAREJO
| Consideration: | ||||
| Coeur stock issued (271,969,428 shares at $4.04) | $ | 1,098,757 | ||
| Cash payments | 1,102 | |||
| Transaction advisory fees and other costs | 16,621 | |||
| Total purchase price | 1,116,480 | |||
| Current liabilities | 54,946 | |||
| Other long-term liabilities | 23,642 | |||
| Deferred income taxes | 572,711 | |||
| Total liabilities assumed | 651,299 | |||
| $ | 1,767,779 | |||
F-17
| Available-For-Sale Securities | ||||||||||||||
| Cost | Gross Unrealized Losses | Gross Unrealized Gains | Estimated Fair Value | |||||||||||
| As of December 31, 2006 | ||||||||||||||
| U.S. Corporate | $ | 65,372 | $ | -- | $ | -- | $ | 65,372 | ||||||
| U.S. Government | 5,000 | -- | 1 | 5,001 | ||||||||||
| Total debt securities | 70,372 | -- | 1 | 70,373 | ||||||||||
| Equity securities | 99 | 1 | 622 | 720 | ||||||||||
| 70,471 | 1 | 623 | 71,093 | |||||||||||
As of December 31, 2005 | ||||||||||||||
| Auction Rate Securities | $ | 159,720 | $ | -- | $ | -- | $ | 159,720 | ||||||
| U.S. Corporate | 23,893 | 51 | -- | 23,842 | ||||||||||
| U.S. Government | 1,891 | 7 | -- | 1,884 | ||||||||||
| Total debt securities | 185,504 | 58 | -- | 185,446 | ||||||||||
| Equity securities | 19 | 4 | 615 | 630 | ||||||||||
| $ | 185,523 | $ | 62 | $ | 615 | $ | 186,076 | |||||||
As of December 31, 2004 | ||||||||||||||
| Auction Rate Securities | $ | 207,850 | $ | -- | $ | -- | $ | 207,850 | ||||||
| U.S. Corporate | 18,964 | 107 | 1 | 18,858 | ||||||||||
| U.S. Government | 29,062 | 205 | -- | 28,857 | ||||||||||
| State/Municipal | 1,285 | 7 | -- | 1,278 | ||||||||||
| Total debt securities | 257,161 | 319 | 1 | 256,843 | ||||||||||
| Equity securities | 20 | 3 | 17 | 34 | ||||||||||
| $ | 257,181 | $ | 322 | $ | 18 | $ | 256,877 | |||||||
Gross realized gains and losses are basedthe assets acquired on a carrying value (cost, net of discount or premium) of short-term investments sold or adjusted for other than temporary decline in market value. Short-term investments mature at various dates. There were no realized gains and/or losses for the years ended 2006, 2005 and 2004.
Prior to December 31, 2006, the Company concluded that it was appropriate to classify its investments in auction rate securities as short-term investments. Previously such investments had been classified as cash and cash equivalents. Accordingly, the Company revised the classification to report these investments as short-term investments on the consolidated balance sheets as of December 31, 2005 and December 31, 2004. The Company also made corresponding adjustments to the consolidated statements of cash flows for the periods ended December 31, 2005 and December 31, 2004 to reflect the gross purchases and sales of these investments as investing activities rather than as a component of cash and cash equivalents. As of December 31, 2005 and December 31, 2004, $159.7 million and $207.9 million respectively, of these investments were reclassified from cash and cash equivalents to short-term investment on the consolidated Balance Sheet. This reclassification had no effect on the total current assets, stockholders’ equity, net income (loss), net income (loss) per share or cash provided by (used in) operating activities.
F-19
21, 2007 (in thousands):
| Fair value of assets acquired: | ||||
| Cash | $ | 3,996 | ||
| Other current assets | 3,789 | |||
| Property, plant and equipment | 97,519 | |||
| Mineral interests | 1,657,189 | |||
| Other assets | 5,286 | |||
| Total assets acquired | $ | 1,767,779 | ||
beginning in the period ended June 30, 2006.
| Years ended December 31, | ||||||||
| 2006 | 2005 | |||||||
| Sales of metal | $ | 11,223 | $ | 16,052 | ||||
| Production costs applicable to sales | (8,233 | ) | (16,698 | ) | ||||
| Depreciation and depletion | (681 | ) | (1,996 | ) | ||||
| Mining exploration | (279 | ) | (1,361 | ) | ||||
| Other | (95 | ) | (192 | ) | ||||
| Income (loss) from discontinued operations | 1,935 | (4,195 | ) | |||||
| Gain on sale of net assets of discontinued operations | 11,132 | — | ||||||
| Net income (loss) from discontinued operations | $ | 13,067 | $ | (4,195 | ) | |||
F-18
| 2006 | 2005 | 2004 | |||||||||
| Sales of metal | $ | 11,223 | $ | 16,052 | $ | 23,759 | |||||
| Production costs applicable to sales | (8,233 | ) | (16,698 | ) | (18,637 | ) | |||||
| Depreciation and depletion | (681 | ) | (1,996 | ) | (1,967 | ) | |||||
| Mining exploration | (279 | ) | (1,361 | ) | (1,620 | ) | |||||
| Other | (95 | ) | (192 | ) | (357 | ) | |||||
| Income (loss) from discontinued operations | 1,935 | (4,195 | ) | 1,178 | |||||||
| Gain on sale of net assets of discontinued operations | 11,132 | -- | -- | ||||||||
| Net income (loss) from discontinued operations | $ | 13,067 | $ | (4,195 | ) | $ | 1,178 | ||||
| Available-For-Sale Securities | ||||||||||||||||
| Gross | Gross | Estimated | ||||||||||||||
| Unrealized | Unrealized | Fair | ||||||||||||||
| Cost | Losses | Gains | Value | |||||||||||||
| As of December 31, 2007 | ||||||||||||||||
| U.S. Corporate | $ | 2,000 | $ | — | $ | — | $ | 2,000 | ||||||||
| U.S. Government | 51,031 | — | 8 | 51,039 | ||||||||||||
| Total debt securities | 53,031 | — | 8 | 53,039 | ||||||||||||
| Equity securities | 99 | — | 702 | 801 | ||||||||||||
| $ | 53,130 | $ | — | $ | 710 | $ | 53,840 | |||||||||
| As of December 31, 2006 | ||||||||||||||||
| U.S. Corporate | $ | 65,372 | $ | — | $ | — | $ | 65,372 | ||||||||
| U.S. Government | 5,000 | — | 1 | 5,001 | ||||||||||||
| Total debt securities | 70,372 | — | 1 | 70,373 | ||||||||||||
| Equity securities | 99 | 1 | 622 | 720 | ||||||||||||
| $ | 70,471 | $ | 1 | $ | 623 | $ | 71,093 | |||||||||
| December 31, 2005 | |||||
| Assets | |||||
| Receivables | $ | 2,036 | |||
| Prepaids | 906 | ||||
| Inventory | 2,561 | ||||
| Property, plant and equipment (net) | 2,016 | ||||
| Operational mining properties, net | 6,357 | ||||
| Other | 952 | ||||
| Total assets of discontinued operations | $ | 14,828 | |||
Liabilities | |||||
| Accounts payable | $ | 747 | |||
| Accrued liabilities | 166 | ||||
| Accrued payroll and related benefits | 578 | ||||
| Reclamation and mine closure | 6,905 | ||||
| Defined benefit liabilities | 2,588 | ||||
| Other non-current liabilities | 1,924 | ||||
| Total liabilities of discontinued operations | $ | 12,908 | |||
F-20
2007. The fair value reported may change materially in subsequent periods.
| December 31, | ||||||||
| 2007 | 2006 | |||||||
| Concentrate and dorè inventory | $ | 11,221 | $ | 9,680 | ||||
| Supplies | 7,697 | 6,661 | ||||||
| Metal and other inventory | $ | 18,918 | $ | 16,341 | ||||
F-19
| December 31, | ||||||||
| 2006 | 2005 | |||||||
| Concentrate and doré inventory | $ | 9,680 | $ | 7,835 | ||||
| Supplies | 6,661 | 4,972 | ||||||
| Metal and other inventory | $ | 16,341 | $ | 12,807 | ||||
| December 31, | ||||||||
| 2006 | 2005 | |||||||
| Land | $ | 1,112 | $ | 1,423 | ||||
| Building improvements | 51,818 | 40,869 | ||||||
| Machinery and equipment | 77,040 | 60,470 | ||||||
| Capitalized leases for machinery and | ||||||||
| equipment | 2,345 | 2,345 | ||||||
| 132,315 | 105,107 | |||||||
| Accumulated depreciation | (64,206 | ) | (57,929 | ) | ||||
| $ | 68,109 | $ | 47,178 | |||||
following (in thousands):
| December 31, | ||||||||
| 2007 | 2006 | |||||||
| Land | $ | 1,133 | $ | 1,112 | ||||
| Building improvements | 130,795 | 51,818 | ||||||
| Machinery and equipment | 153,328 | 77,040 | ||||||
| Capitalized leases for machinery and equipment | 37,477 | 2,345 | ||||||
| 322,733 | 132,315 | |||||||
| Accumulated depreciation | (69,937 | ) | (64,206 | ) | ||||
| $ | 252,796 | $ | 68,109 | |||||
| 2006 | 2005 | 2004 | |||||||||
| Rochester | $ | 1,225 | $ | 1,197 | $ | 3,548 | |||||
| Cerro Bayo | 7,555 | 2,731 | 2,451 | ||||||||
| Martha | 2,481 | 2,108 | 689 | ||||||||
| San Bartolome | 14,597 | 10,477 | 950 | ||||||||
| Kensington | 121,552 | 44,201 | 83 | ||||||||
| Endeavor | -- | 15,410 | -- | ||||||||
| Broken Hill | -- | 36,667 | -- | ||||||||
| Other | 588 | 499 | 642 | ||||||||
| Net asset additions | $ | 147,998 | $ | 113,290 | $ | 8,363 | |||||
Discontinued Operations - Coeur Silver Valley | $ | 617 | $ | 3,537 | $ | 2,151 | |||||
follows (in thousands):
| Years ended December 31, | ||||||||||||
| 2007 | 2006 | 2005 | ||||||||||
| Rochester | $ | 1,647 | $ | 1,225 | $ | 1,197 | ||||||
| Cerro Bayo | 11,330 | 7,555 | 2,731 | |||||||||
| Martha | 16,444 | 2,481 | 2,108 | |||||||||
| San Bartolomé | 100,169 | 16,805 | 11,089 | |||||||||
| Kensington | 92,337 | 122,640 | 53,155 | |||||||||
| Endeavor | 2,112 | — | 15,410 | |||||||||
| Broken Hill | 213 | — | 36,667 | |||||||||
| Other | 1,942 | 588 | 499 | |||||||||
| Net asset additions | $ | 226,194 | $ | 151,294 | $ | 122,856 | ||||||
| Discontinued Operations — Coeur Silver Valley | $ | — | $ | 617 | $ | 3,537 | ||||||
F-20
| Year Ending December 31, | Capital Leases | Operating Leases | ||||||
| 2007 | $ | 916 | $ | 380 | ||||
| 2008 | -- | -- | ||||||
| 2009 | -- | -- | ||||||
| 2010 | -- | -- | ||||||
| Thereafter | -- | -- | ||||||
| 916 | $ | 380 | ||||||
| Less: Amount representing interest | 22 | |||||||
| $ | 894 | |||||||
follows (in thousands):
| Capital | ||||
| Year Ending December 31, | Leases | |||
| 2008 | 11,554 | |||
| 2009 | 8,976 | |||
| 2010 | 6,755 | |||
| 2011 | 6,755 | |||
| Thereafter | 5,156 | |||
| Total minimum payments due | 39,196 | |||
| Less: Amount representing interest | 6,432 | |||
| Present value of net minimum lease payments | 32,764 | |||
| Less: Current maturities | 9,103 | |||
| $ | 23,661 | |||
| December 31, | ||||||||
| 2006 | 2005 | |||||||
| Capitalized costs for mining properties, net of accumulated depletion | ||||||||
| consist of the following(A): | ||||||||
| Operational mining properties: | ||||||||
| Rochester Mine | $ | 4,445 | $ | 8,582 | ||||
| Cerro Bayo Mine | 8,531 | 6,660 | ||||||
| Martha Mine | 1,110 | 713 | ||||||
| Total operational mining properties | 14,086 | 15,955 | ||||||
Mineral interests, net of accumulated depletion | ||||||||
| Endeavor Mine | 14,508 | 14,998 | ||||||
| Broken Hill Mine | 29,740 | 34,860 | ||||||
| San Bartolome(B) | 20,125 | 20,125 | ||||||
| Total mineral interests | 64,373 | 69,983 | ||||||
Non-producing and developmental properties: | ||||||||
| Kensington(C) | 170,458 | 62,517 | ||||||
| San Bartolome(D) | 20,388 | 9,829 | ||||||
| Other | 142 | 142 | ||||||
| Total non-producing and developmental properties | 190,988 | 72,488 | ||||||
| Total mining properties | $ | 269,447 | $ | 158,426 | ||||
| December 31, | ||||||||
| 2007 | 2006 | |||||||
Capitalized costs for mining properties, net of accumulated depletion consist of the following (in thousands):(A) | ||||||||
| Operational mining properties: | ||||||||
| Rochester Mine | $ | — | $ | 4,445 | ||||
| Cerro Bayo Mine | 17,091 | 8,531 | ||||||
| Martha Mine | 1,832 | 1,110 | ||||||
| Total operational mining properties | 18,923 | 14,086 | ||||||
| Mineral interests, net of accumulated depletion | ||||||||
| Endeavor Mine | 15,865 | 14,508 | ||||||
| Broken Hill Mine | 26,897 | 29,740 | ||||||
San Bartolomé(B) | 20,125 | 20,125 | ||||||
Palmarejo(C) | 1,657,189 | — | ||||||
| Total mineral interests | 1,720,076 | 64,373 | ||||||
| Non-producing and developmental properties: | ||||||||
Kensington(D) | 256,443 | 170,458 | ||||||
San Bartolomé(E) | 54,884 | 20,388 | ||||||
| Other | 142 | 142 | ||||||
| Total non-producing and developmental properties | 311,469 | 190,988 | ||||||
| Total mining properties | $ | 2,050,468 | $ | 269,447 | ||||
| (A) | On June 1, 2006, the Company completed the sale of 100% of the shares of its wholly-owned subsidiary, Coeur Silver Valley Inc., to US Silver Corporation for $15 million in cash and additional consideration received of $1.1 million for working capital. |
| (B) | Balance represents acquisition cost of mineral interest. |
| (C) | On December 31, 2007, the Company completed its acquisition of all of the shares of Bolnisi and Palmarejo in exchange for a total of approximately 272 million shares of Coeur common stock and a total cash payment of approximately $1.1 million.The total consideration paid was $1.1 billion and assumed liabilities were $0.7 billion. | |
| (D) | During the third quarter of 2005, the Company commenced construction activities at its Kensington property. The costs incurred subsequent to commencing construction were capitalized as developmental properties. |
F-21
| During the fourth quarter of 2004, the Company commenced construction activities at its San |
F-22
Operational Mining Properties Rochester Mine: The Company has conducted operations at the Rochester Mine, located in Western Nevada, since September 1986. The mine utilizes the heap-leaching process to extract both silver and gold from ore mined using open pit methods. Rochester’s primary product is silver with gold produced as a by-product. Cerro Bayo Mine: The Cerro Bayo Mine is a gold and silver underground mine located in southern Chile. Commercial production commenced on April 18, 2002. Martha Mine: The Martha Mine is an underground silver mine located in Argentina, approximately 270 miles southeast of Coeur’s Cerro Bayo mine. Coeur acquired a 100% interest in the Martha mine in April 2002. In July 2002, Coeur commenced shipment of ore from the Martha mine to the Cerro Bayo facility for processing. In December 2007, the Company completed a 240 tonne per day flotation mill which produces a flotation concentrate.
Mineral Interests Endeavor Mine: On May 23, 2005, the Company acquired all of the silver production and reserves, up to a maximum 17.7 million payable ounces, contained at the Endeavor Mine in Australia, which is owned and operated by Cobar Operations Pty. Limited (“Cobar”), a wholly-owned subsidiary of CBH Resources Ltd. (“CBH”), for $39.1$43.8 million. The Company is entitled to all of the silver production and reserves up to a maximum of 17.7 million payable ounces. The Endeavor Mine is located 720 km northwest of Sydney in New South Wales and has been in production since 1983. Under the terms of the original agreement, CDE Australia, a wholly-owned subsidiary of Coeur, paid Cobar $15.1$15.4 million of cash at the closing. In addition, CDE Australia, subject to certain conditions, will pay Cobar approximately $23.7$26.3 million upon the receipt of a report confirming that the reserves at the Endeavor mine are equal to or greater than the reported ore reserves for 2004. Payment couldwill occur in 2007.2008. In addition to these upfront payments, pursuant to the original agreement, Coeur pays Cobar an operating cost contribution of $1.00 for each ounce of payable silver plus a further increment which was to begin when the silver price exceeds $5.23 per ounce. This further increment was to begin on the second anniversary of the agreement and would have been 50% of the amount by which the silver price exceeds $5.23 per ounce. A cost contribution of $0.25 per ounce is also payable by Coeur in respect of new ounces of proven and probable silver reserves as they are discovered. The Company has paid a cost contribution of approximately $2.1 million during 2007.
On March 28, 2006, CDE Australia Pty, Ltd. (CDE Australia), reached an agreement with CBH Resources Ltd. to modify the terms of the original silver purchase agreement. Under the modified terms, CDE Australia owns all silver production and reserves up to a total of 20.0 million payable ounces, up from 17.7 million payable ounces in the original agreement. Based on the most recent ore reserve report, the current ore reserve contains approximately 15.314.4 million payable ounces. To date, the Company has received 0.71.4 million payable ounces based on current metallurgical recovery and current smelter contract terms. Expansion of the ore reserve will be required to achieve the maximum payable ounces of silver production as set forth in the modified contract. The silver price-sharing provision is deferred until such time as Coeur has received approximately 2 million cumulative ounces of silver from the mine or June 2007, whichever is later. In addition, the silver price-sharing threshold increased to US$7.00 per ounce, from the previous level of US$5.23 per ounce.F-22
In December 2007, the Company completed a 240 tonne per day flotation mill which produces a flotation concentrate.
The Company has paid a cost contribution of approximately $2.1 million during 2007.
F-23
Bartolomé.
/1 ¼%4% Debentures
F-23
F-24
2005.
F-24
recorded, or, if not readily determinable, at the weighted average discount rate used to record the liability.
In the fourth quarter of 2005, the Company reviewed its cash flow estimates for its asset retirement obligations. This resulted in a net increase to the asset retirement obligation of $6.4 million and a corresponding increase to the carrying amount of the asset to be retired. For the purpose of consolidated statement of cash flows, these amounts are non-cash transactions. The increase was due to additional reclamation required as a result of the expansion of the Company’s Cerro Bayo mine and adjustments to future estimated costs at the Company’s Rochester mine, Kensington project and San BartolomeBartolomé project. The increase was discounted using the Company’s current weighted average credit adjusted risk-free rate of 7.79%7.6%.
F-25
| Years Ended December 31, | ||||||||
| 2007 | 2006 | |||||||
| Asset retirement obligation — January 1 | $ | 29,909 | $ | 23,524 | ||||
| Accretion | 2,260 | 1,780 | ||||||
| Additions | 3,390 | 6,069 | ||||||
| Changes in estimates | (1,202 | ) | (507 | ) | ||||
| Settlements | (1,222 | ) | (957 | ) | ||||
| Asset retirement obligation — December 31 | $ | 33,135 | $ | 29,909 | ||||
F-25
| Year Ended December 31, | ||||||||
| 2006 | 2005 | |||||||
| (in thousands) | ||||||||
| Asset retirement obligation - January 1 | $ | 23,524 | $ | 16,921 | ||||
| Accretion | 1,780 | 1,265 | ||||||
| Additions | 6,069 | 6,397 | ||||||
| Changes in estimates | (507 | ) | (74 | ) | ||||
| Settlements | (957 | ) | (985 | ) | ||||
| Asset retirement obligation - December 31 | $ | 29,909 | $ | 23,524 | ||||
Income (loss)
| Year Ended December 31, | |||||||||||
| 2006 | 2005 | 2004 | |||||||||
| (in thousands) | |||||||||||
| United States | $ | 33,252 | $ | (5,576 | ) | $ | (22,281 | ) | |||
| Foreign | 50,393 | 21,805 | (1,540 | ) | |||||||
| Total | $ | 83,645 | $ | 16,229 | $ | (23,821 | ) | ||||
follows (in thousands):
| Years Ended December 31, | ||||||||||||
| 2007 | 2006 | 2005 | ||||||||||
| United States | $ | 21,909 | $ | 33,252 | $ | (5,576 | ) | |||||
| Foreign | 36,908 | 50,393 | 21,805 | |||||||||
| Total | $ | 58,817 | $ | 83,645 | $ | 16,229 | ||||||
| Years Ended December 31, | |||||||||||
| 2006 | 2005 | 2004 | |||||||||
| Current: | |||||||||||
| United States - Alternative minimum tax | $ | (900 | ) | $ | 212 | $ | 1,382 | ||||
| United States - Foreign withholding | (713 | ) | -- | -- | |||||||
| Foreign - Argentina | (4,842 | ) | (66 | ) | -- | ||||||
| Foreign - Australia | (4,673 | ) | -- | -- | |||||||
| Deferred: | |||||||||||
| Foreign - Argentina | 65 | 929 | -- | ||||||||
| Foreign - Australia | (93 | ) | (404 | ) | -- | ||||||
| Foreign - Chile | 2,930 | (2,154 | ) | 4,403 | |||||||
| Income tax benefit (provision) | $ | (8,226 | ) | $ | (1,483 | ) | $ | 5,785 | |||
follows (in thousands):
| Years Ended December 31, | ||||||||||||
| 2007 | 2006 | 2005 | ||||||||||
| Current: | ||||||||||||
| United States — Alternative minimum tax | $ | (381 | ) | $ | (900 | ) | $ | 212 | ||||
| United States — Foreign withholding tax | (904 | ) | (713 | ) | — | |||||||
| Foreign — Argentina | (6,590 | ) | (4,842 | ) | (66 | ) | ||||||
| Foreign — Australia | (4,898 | ) | (4,673 | ) | — | |||||||
| Deferred: | ||||||||||||
| Foreign — Argentina | 172 | 65 | 929 | |||||||||
| Foreign — Australia | (664 | ) | (93 | ) | (404 | ) | ||||||
| Foreign — Chile | (1,662 | ) | 2,930 | (2,154 | ) | |||||||
| Income tax provision | $ | (14,927 | ) | $ | (8,226 | ) | $ | (1,483 | ) | |||
| Years Ended December 31 | |||||||||||
| 2006 | 2005 | 2004 | |||||||||
| Tax benefit (provision) from continuing operations | $ | (29,276 | ) | $ | (5,680 | ) | $ | 8,337 | |||
| State tax benefit (provision) from continuing operations | (2,509 | ) | (487 | ) | 715 | ||||||
| Excess percentage depletion and related deductions | 6,199 | 4,265 | 3,698 | ||||||||
| Change in valuation allowances | 14,778 | (5,555 | ) | (9,474 | ) | ||||||
| Effect of foreign earnings | 4,744 | 4,744 | 1,346 | ||||||||
| US and foreign non-deductible expenses | (1,059 | ) | 632 | 610 | |||||||
| Foreign currency exchange rates | -- | 827 | -- | ||||||||
| Other net | (1,103 | ) | (229 | ) | 553 | ||||||
| $ | (8,226 | ) | $ | (1,483 | ) | $ | 5,785 | ||||
| Years Ended December 31 | ||||||||||||
| 2007 | 2006 | 2005 | ||||||||||
| Tax provision from continuing operations | $ | (20,600 | ) | $ | (29,276 | ) | $ | (5,680 | ) | |||
| State tax provision from continuing operations | (1,766 | ) | (2,509 | ) | (487 | ) | ||||||
| Percentage depletion and related deductions | 4,860 | 6,199 | 4,265 | |||||||||
| Change in valuation allowance | 3,896 | 14,778 | (5,555 | ) | ||||||||
| U.S. and Foreign non-deductible expenses | (663 | ) | (711 | ) | 632 | |||||||
| Foreign tax rate differences | 2,309 | 4,744 | 4,744 | |||||||||
| Foreign withholding taxes | (904 | ) | (713 | ) | — | |||||||
| Other, net | (2,059 | ) | (738 | ) | 598 | |||||||
| $ | (14,927 | ) | $ | (8,226 | ) | $ | (1,483 | ) | ||||
F-26
| Years Ended December 31, | ||||||||
| 2006 | 2005 | |||||||
Deferred tax liabilities: | ||||||||
| Property, plant and equipment , net | $ | 7,318 | $ | 7,665 | ||||
| Investments in foreign subsidiaries | 9,761 | 471 | ||||||
| 17,079 | 8,136 | |||||||
Deferred tax assets: | ||||||||
| Mineral properties | 62,284 | 66,664 | ||||||
| Net operating loss carryforwards | 68,794 | 88,130 | ||||||
| Alternative minimum tax credit | 2,479 | 1,246 | ||||||
| carryforwards | ||||||||
| Investments in foreign subsidiaries | 8,129 | 404 | ||||||
| Capital loss carryforwards | 12,864 | 5,672 | ||||||
| Other | 6,197 | 3,173 | ||||||
| 160,747 | 165,289 | |||||||
| Valuation allowance | (137,992 | ) | (154,379 | ) | ||||
| 22,755 | 10,910 | |||||||
| Net deferred tax assets | $ | 5,676 | $ | 2,774 | ||||
The Company has not had a strong earnings history which would be objective evidence as required by generally accepted accounting principles to recognize its net operating less carryforwards and other deductible temporary differences. It is likely that the alternative minimum tax will exceed the regular tax for the foreseeable future. Accordingly, the Company has recorded a valuation allowance of $138.0 million as of December 31, 2006, which includes a full valuation allowance against the $2.5 million minimum tax credit carryforward, which is available for an unlimited carryforward period to offset regular federal income tax in excess of the alternative minimum tax. The Company has reviewed its domestic and foreign deferred tax assets and, except for approximately $6.2 million deferred tax assets related to the Company’s Cerro Bayo and Martha mines, has not recognized the potential tax benefits in other jurisdictions because at this time management believes that the realization of such benefits in future periods does not meet the more likely than not criteria.follows (in thousands):
| Years Ended December 31 | ||||||||
| 2007 | 2006 | |||||||
| Deferred tax liabilities: | ||||||||
| Mineral properties | $ | 552,007 | $ | — | ||||
| Investment in foreign subsidiaries | 18,430 | 9,761 | ||||||
| Property, plant and equipment, net | 2,836 | 3,580 | ||||||
| 573,273 | 13,341 | |||||||
| Deferred tax assets: | ||||||||
| Net operating loss carryforwards | 111,996 | 80,869 | ||||||
| Investment in foreign subsidiaries | 16,331 | 8,129 | ||||||
| Capital loss carryforwards | 10,305 | 12,897 | ||||||
| Asset retirement obligation | 10,234 | 9,914 | ||||||
| Unrealized foreign currency loss and other | 8,651 | — | ||||||
| Accrued expenses | 3,330 | 2,345 | ||||||
| Alternative minimum tax credit carryforwards | 2,520 | 2,139 | ||||||
| Inventory | 1,523 | 4,274 | ||||||
| Mineral properties | — | 53,290 | ||||||
| 164,890 | 173,857 | |||||||
| Valuation allowance | (160,898 | ) | (154,840 | ) | ||||
| 3,992 | 19,017 | |||||||
| Net deferred tax assets (liabilities) | $ | (569,281 | ) | $ | 5,676 | |||
| Years Ended December 31 | ||||||||
| 2007 | 2006 | |||||||
| U.S. | $ | 111,685 | $ | 122,101 | ||||
| Argentina | 1,966 | 1,130 | ||||||
| Australia | 7,282 | — | ||||||
| Canada | 8,220 | — | ||||||
| New Zealand | 30,999 | 30,778 | ||||||
| Chile and other | 746 | 831 | ||||||
| $ | 160,898 | $ | 154,840 | |||||
F-27
withholding taxes related to those jurisdictions where the subsidiary’s net equity determined for financial reporting purposes exceeds tax basis.
| U.S. | Chile | New Zealand | Other | Total | |||||||
| Regular net operating losses | $86,004 | $30,464 | $93,267 | $444 | $210,179 | ||||||
| Alternative minimum tax net | |||||||||||
| operating losses | 53,651 | -- | -- | -- | 53,651 | ||||||
| Capital losses | 33,853 | -- | -- | -- | 33,853 | ||||||
| Alternative minimum tax credits | 2,180 | -- | -- | -- | 2,180 | ||||||
| Foreign tax credits | 299 | -- | -- | -- | 299 | ||||||
2007 (in thousands):
| New | ||||||||||||||||||||||||||||||||
| U.S. | Chile | Mexico | Canada | Australia | Zealand | Other | Total | |||||||||||||||||||||||||
| Regular net operating losses | $ | 110,286 | $ | 22,110 | $ | 109,600 | $ | 5,653 | $ | 6,389 | $ | 93,936 | $ | 2,487 | $ | 350,461 | ||||||||||||||||
| Alternative minimum tax net operating losses | 26,946 | — | — | — | — | — | — | 26,946 | ||||||||||||||||||||||||
| Capital losses | 19,339 | — | — | — | 9,855 | — | — | 29,194 | ||||||||||||||||||||||||
| Alternative minimum tax credits | 2,520 | — | — | — | — | — | — | 2,520 | ||||||||||||||||||||||||
F-27
do not expire.
Stock Issues During 2006
Stock Issues During 2005
F-28
Stock Issues During 2004
F-28
F-29
F-29
ever satisfied.
2005.
F-30
The adjustment of the forfeiture rate resulted in a cumulative adjustment in the period the forfeiture estimate is charged. During the year ended December 31, 2006, the Company recorded an adjustment of $0.1 million to reduce compensation expense for forfeiture awards.
F-30
| Year Ended December 31, | ||||||||
| 2005 | 2004 | |||||||
| (in thousands except per share data) | ||||||||
Net income (loss) as reported | $ | 10,551 | $ | (16,858 | ) | |||
| Add: Stock-based employee compensation | ||||||||
| expense included in reported net income | 1,237 | 1,137 | ||||||
| Less: Stock-based employee compensation | ||||||||
| expense determined under fair value for | ||||||||
| all awards | (2,316 | ) | (2,017 | ) | ||||
| Net income (loss) - Pro forma | $ | 9,472 | $ | (17,738 | ) | |||
Net income (loss) per share: | ||||||||
| Basic and diluted - As reported | $ | 0.04 | $ | (0.08 | ) | |||
| Basic and diluted - Pro forma | $ | 0.04 | $ | (0.08 | ) | |||
| Year Ended | ||||
| December 31, 2005 | ||||
| (in thousands, except per share data) | ||||
| Net income as reported | $ | 10,551 | ||
| Add: Stock-based employee compensation expense included in reported net income | 1,237 | |||
| Less: Stock-based employee compensation expense determined under fair value for all awards | (2,316 | ) | ||
| Net income — Pro forma | $ | 9,472 | ||
| Net income per share: | ||||
| Basic and diluted — As reported | $ | 0.04 | ||
| Basic and diluted — Pro forma | $ | 0.04 | ||
| Year Ended December 31, | ||||||||||
| 2006 | 2005 | 2004 | ||||||||
| Weighted average fair value of options granted | $3.35 | $2.53 | $4.83 | |||||||
| Expected volatility | 68.5% | 68.5% | 75.7% | |||||||
| Expected life | 6 years | 6 years | 6 years | |||||||
| Risk-free interest rate | 4.6% | 3.9% | 3.3% | |||||||
| Expected dividend yield | 0.0% | 0.0% | 0.0% | |||||||
| Years Ended December 31, | ||||||||||||
| 2007 | 2006 | 2005 | ||||||||||
| Weighted average fair value of options granted | $ | 2.35 | $ | 3.35 | $ | 2.53 | ||||||
| Expected volatility | 58.9 | % | 68.5 | % | 68.5 | % | ||||||
| Expected life | 6 years | 6 years | 6 years | |||||||||
| Risk-free interest rate | 4.5 | % | 4.6 | % | 3.9 | % | ||||||
| Expected dividend yield | 0.0 | % | 0.0 | % | 0.0 | % | ||||||
F-31
| Shares | Weighted Average Exercise Price | ||||
| Stock options outstanding at December 31, 2003 | 1,650,054 | $2.11 | |||
| Granted | 333,250 | $6.95 | |||
| Exercised | (169,527 | ) | $1.69 | ||
| Canceled/expired | (16,869 | ) | $6.32 | ||
| Stock options outstanding at December 31, 2004 | 1,796,908 | $3.01 | |||
| Granted | 566,149 | $3.92 | |||
| Exercised | (52,007 | ) | $1.61 | ||
| Canceled/expired | (92,421 | ) | $5.69 | ||
| Stock options outstanding at December 31, 2005 | 2,218,629 | $3.16 | |||
| Granted | 332,169 | $5.14 | |||
| Exercised | (395,723 | ) | $1.99 | ||
| Canceled/expired | (65,425 | ) | $7.65 | ||
| Stock options outstanding at December 31, 2006 | 2,089,650 | $3.56 | |||
F-31
2007:
| Weighted Average | ||||||||
| Shares | Exercise Price | |||||||
| Stock options outstanding at December 31, 2004 | 1,796,908 | $ | 3.01 | |||||
| Granted | 566,149 | $ | 3.92 | |||||
| Exercised | (52,007 | ) | $ | 1.61 | ||||
| Cancelled/expired | (92,421 | ) | $ | 5.69 | ||||
| Stock options outstanding at December 31, 2005 | 2,218,629 | $ | 3.16 | |||||
| Granted | 332,169 | $ | 5.14 | |||||
| Exercised | (395,723 | ) | $ | 1.99 | ||||
| Canceled/expired | (65,425 | ) | $ | 7.65 | ||||
| Stock options outstanding at December 31, 2006 | 2,089,650 | $ | 3.56 | |||||
| Granted | 462,015 | $ | 3.99 | |||||
| Exercised | (56,167 | ) | $ | 3.29 | ||||
| Canceled/expired | (213,903 | ) | $ | 5.99 | ||||
| Stock options outstanding at December 31, 2007 | 2,281,595 | $ | 3.42 | |||||
| Options Outstanding | Options Exercisable | ||||||||||||
| Range of Exercise Price | Number Outstanding | Weighted Average Exercise Price | Weighted Average Remaining Contractual Life (Years) | Number Exercisable | Weighted Average Exercise Price | Weighted Average Remaining Contractual Life (Years) | |||||||
| $0.74 to $1.22 | 442,641 | $0.80 | 4.77 | 442,641 | $0.80 | 4.77 | |||||||
| $1.23 to $1.85 | 336,525 | $1.75 | 5.67 | 336,525 | $1.75 | 5.67 | |||||||
| $1.86 to $2.63 | 111,502 | $2.10 | 5.90 | 111,502 | $2.10 | 5.90 | |||||||
| $2.64 to $3.92 | 537,089 | $3.86 | 7.50 | 248,767 | $3.78 | 6.77 | |||||||
| $3.93 to $7.09 | 624,288 | $6.00 | 7.96 | 236,077 | $6.81 | 6.62 | |||||||
| $7.10 to $17.94 | 37,605 | $11.68 | 0.57 | 37,605 | $11.68 | 0.57 | |||||||
| 2,089,650 | $3.56 | 6.55 | 1,413,117 | $2.95 | 5.62 | ||||||||
2007:
| Options Outstanding | Options Exercisable | |||||||||||||||||||||||
| Weighted | Weighted | |||||||||||||||||||||||
| Weighted | Average | Weighted | Average | |||||||||||||||||||||
| Range of | Average | Remaining | Average | Remaining | ||||||||||||||||||||
| Exercise | Number | Exercise | Contractual | Number | Exercise | Contractual | ||||||||||||||||||
| Price | Outstanding | Price | Life (Years) | Exercisable | Price | Life (Years) | ||||||||||||||||||
| $0.74 to $1.22 | 442,641 | $ | 0.80 | 3.77 | 442,641 | $ | 0.80 | 3.77 | ||||||||||||||||
| $1.23 to $1.85 | 320,420 | $ | 1.75 | 4.67 | 320,420 | $ | 1.75 | 4.67 | ||||||||||||||||
| $1.86 to $2.63 | 111,502 | $ | 2.10 | 4.90 | 111,502 | $ | 2.10 | 4.90 | ||||||||||||||||
| $2.64 to $3.92 | 497,135 | $ | 3.85 | 6.45 | 362,061 | $ | 3.83 | 6.19 | ||||||||||||||||
| $3.93 to $5.14 | 661,175 | $ | 4.47 | 8.51 | 113,339 | $ | 5.06 | 6.72 | ||||||||||||||||
| $5.15 to $8.94 | 248,722 | $ | 7.19 | 5.60 | 248,722 | $ | 7.19 | 5.60 | ||||||||||||||||
| 2,281,595 | $ | 3.42 | 6.11 | 1,598,685 | $ | 3.06 | 5.07 | |||||||||||||||||
F-32
| Number of Shares | Weighted Average Grant Date Fair Value | ||||
| Outstanding at December 31, 2003 | 1,115,000 | $1.28 | |||
| Granted | 236,070 | $6.39 | |||
| Vested | (371,673 | ) | $1.28 | ||
| Forfeited | (168,399 | ) | $2.09 | ||
| Outstanding at December 31, 2004 | 810,998 | $2.60 | |||
| Granted | 359,640 | $3.94 | |||
| Vested | (433,623 | ) | $2.30 | ||
| Forfeited | (75,634 | ) | $4.58 | ||
| Outstanding at December 31, 2005 | 661,381 | $3.30 | |||
| Granted | 220,894 | $5.14 | |||
| Vested | (445,025 | ) | $2.71 | ||
| Forfeited | (24,218 | ) | $4.83 | ||
| Outstanding at December 31, 2006 | 413,032 | $4.83 | |||
2007:
| Weighted | ||||||||
| Number of | Average Grant | |||||||
| Shares | Date Fair Value | |||||||
| Outstanding at December 31, 2004 | 810,998 | $ | 2.60 | |||||
| Granted | 359,640 | $ | 3.94 | |||||
| Vested | (433,623 | ) | $ | 2.30 | ||||
| Forfeited | (75,634 | ) | $ | 4.58 | ||||
| Outstanding at December 31, 2005 | 661,381 | $ | 3.30 | |||||
| Granted | 220,894 | $ | 5.14 | |||||
| Vested | (445,025 | ) | $ | 2.71 | ||||
| Forfeited | (24,218 | ) | $ | 4.83 | ||||
| Outstanding at December 31, 2006 | 413,032 | $ | 4.83 | |||||
| Granted | 497,990 | $ | 3.99 | |||||
| Vested | (241,784 | ) | $ | 4.82 | ||||
| Forfeited | (66,043 | ) | $ | 4.30 | ||||
| Outstanding at December 31, 2007 | 603,195 | $ | 4.20 | |||||
F-32
| Number of Shares | Weighted Average Grant Date Fair Value | ||||
| Outstanding at December 31, 2005 | -- | $-- | |||
| Granted | 220,894 | 5.14 | |||
| Exercised | -- | -- | |||
| Forfeited | (10,449 | ) | 5.14 | ||
| Outstanding at December 31, 2006 | 210,445 | $5.14 | |||
2007:
| Weighted | ||||||||
| Number of | Average Grant | |||||||
| Shares | Date Fair Value | |||||||
| Outstanding at December 31, 2005 | — | $ | — | |||||
| Granted | 220,894 | 5.14 | ||||||
| Exercised | — | — | ||||||
| Forfeited | (10,449 | ) | 5.14 | |||||
| Outstanding at December 31, 2006 | 210,445 | $ | 5.14 | |||||
| Granted | 306,852 | 3.99 | ||||||
| Exercised | (30,298 | ) | 4.48 | |||||
| Forfeited | (66,456 | ) | 4.47 | |||||
| Outstanding at December 31, 2007 | 420,543 | $ | 4.45 | |||||
On
F-33
| Factor | 2005 | 2004 |
| Discount Rate for Benefit Obligations | 5.75% | 6.0% |
| Expected Return on Plan Assets | 6.0% | 6.0% |
| Rate of Compensation Increases | 5.0% | 5.0% |
| Factor | 2005 | |||
| Discount Rate for Benefit Obligations | 5.75 | % | ||
| Expected Return on Plan Assets | 6.0 | % | ||
| Rate of Compensation Increases | 5.0 | % | ||
F-33
F-34
| Asset Class | Actual Mix | Target Mix | Expected Long Term Rates of Return | ||||
| Equity investments | 60 | % | 60 | % | 10.00 | % | |
| Fixed income investments | 40 | % | 35 | % | 3.00 | % | |
| Cash and cash equivalents | 0 | % | 5 | % | 2.00 | % | |
| Weighted average | 7.15 | % | |||||
| Expected | ||||||||||||
| Long Term | ||||||||||||
| Actual | Target | Rates of | ||||||||||
| Asset Class | Mix | Mix | Return | |||||||||
| Equity investments | 60 | % | 60 | % | 10.00 | % | ||||||
| Fixed income investments | 40 | % | 35 | % | 3.00 | % | ||||||
| Cash and cash equivalents | 0 | % | 5 | % | 2.00 | % | ||||||
| Weighted average | 7.15 | % | ||||||||||
| 1) | A targeted 7-11% average annualized return based on long-term historical market data; |
| 2) | Expected returns over a market cycle that exceed the total portfolio indexed benchmark; |
| 3) | Volatility that was not substantially greater than the portfolio indexed benchmark volatility of 11%; and |
| 4) | Risk adjusted returns that were comparable with indexed benchmarks. |
F-34
| For the Year Ended | ||||
| December 31, | ||||
| 2005 | ||||
| Assumptions: | ||||
| Discount rate | 5.75 | % | ||
| Components of net periodic benefit cost: | ||||
| Service cost | $ | 309 | ||
| Interest cost | 464 | |||
| Expected return on plan assets | (261 | ) | ||
| Amortization of prior service cost | 59 | |||
| Recognized actuarial loss | 339 | |||
| Net periodic benefit cost | $ | 910 | ||
F-35
| For the Year Ended December 31, | |||||||||||
| 2006 | 2005 | 2004 | |||||||||
| Assumptions: | |||||||||||
| Discount rate | -- | 5.75 | % | 6.0 | % | ||||||
| Components of net periodic benefit cost: | |||||||||||
| Service cost | -- | $ | 309 | $ | 319 | ||||||
| Interest cost | -- | 464 | 412 | ||||||||
| Expected return on plan assets | -- | (261 | ) | (215 | ) | ||||||
| Amortization of prior service cost | -- | 59 | 56 | ||||||||
| Recognized actuarial loss | -- | 339 | 327 | ||||||||
| Net periodic benefit cost | -- | $ | 910 | $ | 899 | ||||||
| At December 31, | ||||||||
| 2006 | 2005 | |||||||
| Change in benefit obligation | ||||||||
| Projected benefit obligation at beginning of year | $ | 8,405 | $ | 7,494 | ||||
| Service cost | -- | 309 | ||||||
| Interest cost | -- | 464 | ||||||
| Benefits paid | (105 | ) | (217 | ) | ||||
| Actuarial loss | -- | 355 | ||||||
| Discontinued operations | (8,300 | ) | -- | |||||
| Projected benefit obligation at end of year | $ | -- | $ | 8,405 | ||||
| Accumulated benefit obligation | $ | -- | $ | 6,606 | ||||
Change in plan assets | ||||||||
| Fair value of plan assets at beginning of year | $ | 4,806 | $ | 4,098 | ||||
| Actual return on plan assets | -- | 205 | ||||||
| Employer contributions | 360 | 720 | ||||||
| Benefits paid | (105 | ) | (217 | ) | ||||
| Discontinued operations | (5,061 | ) | -- | |||||
| Fair value of plan assets at end of year | $ | -- | $ | 4,806 | ||||
Reconciliation of funded status | ||||||||
| Funded status | $ | -- | $ | (3,599 | ) | |||
| Unrecognized actuarial loss | -- | 3,803 | ||||||
| Unrecognized prior service cost | -- | 369 | ||||||
| Net asset reflected in the consolidated balance sheet | $ | -- | $ | 573 | ||||
Weighted average assumptions | ||||||||
| Discount rate | -- | 5.75 | % | |||||
| Expected long-term rate of return on plan assets | -- | 6.0 | % | |||||
| Rate of compensation increase | -- | 5.0 | % | |||||
follows (in thousands):
| At December 31, | ||||
| 2006 | ||||
Change in benefit obligation | ||||
| Projected benefit obligation at beginning of year | $ | 8,405 | ||
| Service cost | — | |||
| Interest cost | — | |||
| Benefits paid | (105 | ) | ||
| Actuarial loss | — | |||
| Discontinued operations | (8,300 | ) | ||
| Projected benefit obligation at end of year | $ | — | ||
| Accumulated benefit obligation | $ | — | ||
Change in plan assets | ||||
| Fair value of plan assets at beginning of year | $ | 4,806 | ||
| Actual return on plan assets | — | |||
| Employer contributions | 360 | |||
| Benefits paid | (105 | ) | ||
| Discontinued operations | (5,061 | ) | ||
| Fair value of plan assets at end of year | $ | — | ||
Reconciliation of funded status | ||||
| Funded status | $ | — | ||
| Unrecognized actuarial loss | — | |||
| Unrecognized prior service cost | — | |||
| Net asset reflected in the consolidated balance sheet | $ | — | ||
Weighted average assumptions | ||||
| Discount rate | — | |||
| Expected long-term rate of return on plan assets | — | |||
| Rate of compensation increase | — | |||
F-35
F-36
| At December 31, | ||||||||
| 2006 | 2005 | |||||||
| (in thousands) | ||||||||
Assumptions: | ||||||||
| Discount rate | -- | 5.75 | % | |||||
Change in benefit obligation | ||||||||
| Net benefit obligation at beginning of year | $ | 356 | $ | 1,973 | ||||
| Service cost | -- | 8 | ||||||
| Interest cost | -- | 20 | ||||||
| Prior service cost (credit) | -- | (387 | ) | |||||
| Actuarial (gain) loss | -- | (1,248 | ) | |||||
| Benefits paid | -- | (10 | ) | |||||
| Discontinued operations | (356 | ) | -- | |||||
| Net benefit obligation at end of year | -- | $ | 356 | |||||
Change in plan assets | ||||||||
| Assets at beginning of year | $ | -- | $ | -- | ||||
| Benefits paid | -- | (10 | ) | |||||
| Contributions | -- | 10 | ||||||
| Assets at end of year | $ | -- | $ | -- | ||||
Reconciliation of funded status | ||||||||
| Funded status at end of year | $ | -- | $ | (356 | ) | |||
| Unrecognized net actuarial (gain) loss | -- | (815 | ) | |||||
| Unrecognized prior service cost (credit) | -- | (262 | ) | |||||
| Net amount recognized at end of year (recorded | ||||||||
| as accrued benefit cost in the accompanying | ||||||||
| balance sheet) | $ | -- | $ | (1,433 | ) | |||
F-36
statements (in thousands, except for discount rate):
| At December 31, | ||||||||
| 2006 | 2005 | |||||||
Assumptions: | ||||||||
| Discount rate | — | 5.75 | % | |||||
Change in benefit obligation | ||||||||
| Net benefit obligation at beginning of year | $ | 356 | $ | 1,973 | ||||
| Service cost | — | 8 | ||||||
| Interest cost | — | 20 | ||||||
| Prior service cost (credit) | — | (387 | ) | |||||
| Actuarial (gain) loss | — | (1,248 | ) | |||||
| Benefits paid | — | (10 | ) | |||||
| Discontinued operations | (356 | ) | — | |||||
| Net benefit obligation at end of year | — | $ | 356 | |||||
Change in plan assets | ||||||||
| Assets at beginning of year | $ | — | $ | — | ||||
| Benefits paid | — | (10 | ) | |||||
| Contributions | — | 10 | ||||||
| Assets at end of year | $ | — | $ | — | ||||
Reconciliation of funded status | ||||||||
| Funded status at end of year | $ | — | $ | (356 | ) | |||
| Unrecognized net actuarial (gain) loss | — | (815 | ) | |||||
| Unrecognized prior service cost (credit) | — | (262 | ) | |||||
| Net amount recognized at end of year (recorded as accrued benefit cost in the accompanying balance sheet) | $ | — | $ | (1,433 | ) | |||
| For the Year Ended December 31, | |||||||||||
| 2006 | 2005 | 2004 | |||||||||
| (in thousands) | |||||||||||
Assumptions: | |||||||||||
| Discount rate | -- | 6.0 | % | 6.0 | % | ||||||
Components of net periodic benefit cost: | |||||||||||
| Service cost | -- | $ | 8 | $ | 17 | ||||||
| Interest cost | -- | 20 | 116 | ||||||||
| Amortization of prior service cost | -- | (125 | ) | -- | |||||||
| Amortization of actuarial gain | -- | (372 | ) | -- | |||||||
| Net periodic pension cost (benefit) | -- | $ | (469 | ) | $ | 133 | |||||
follows (in thousands, except for discount rate):
| For the Year Ended | ||||||||
| December 31, | ||||||||
| 2006 | 2005 | |||||||
Assumptions: | ||||||||
| Discount rate | — | 6.0 | % | |||||
Components of net periodic benefit: | ||||||||
| Service cost | — | $ | 8 | |||||
| Interest cost | — | 20 | ||||||
| Amortization of prior service cost | — | (125 | ) | |||||
| Amortization of actuarial gain | — | (372 | ) | |||||
| Net periodic pension benefit | — | $ | (469 | ) | ||||
F-37
| (in thousands) | ||||||||||||||
| 1% Increase | 1% Decrease | |||||||||||||
| 2005 | 2004 | 2005 | 2004 | |||||||||||
| Effect on total of service and interest cost components | $ | 2 | $ | 8 | $ | (2 | ) | $ | (7 | ) | ||||
| Effect on postretirement benefit obligation | $ | 22 | $ | 106 | $ | (19 | ) | $ | (91 | ) | ||||
effects (in thousands):
| 1% | 1% | |||||||
| Increase | Decrease | |||||||
| 2005 | 2005 | |||||||
| Effect on total of service and interest cost components | $ | 2 | $ | (2 | ) | |||
| Effect on postretirement benefit obligation | $ | 22 | $ | (19 | ) | |||
F-37
F-38
| December 31, | |||||||||||
| 2006 | 2005 | 2004 | |||||||||
| (in thousands) | |||||||||||
| Beginning balance | $ | (171 | ) | $ | -- | $ | 131 | ||||
| Reclassification to earnings | 379 | (68 | ) | 8 | |||||||
| Change in fair value | (268 | ) | (103 | ) | (139 | ) | |||||
| Ending balance | $ | (60 | ) | $ | (171 | ) | $ | -- | |||
| December 31, | ||||||||||||
| 2007 | 2006 | 2005 | ||||||||||
| Beginning balance | $ | (60 | ) | $ | (171 | ) | $ | — | ||||
| Reclassification to earnings | (371 | ) | 379 | (68 | ) | |||||||
| Change in fair value | 349 | (268 | ) | (103 | ) | |||||||
| Ending balance | $ | (82 | ) | $ | (60 | ) | $ | (171 | ) | |||
F-38
At December 31, 2005, the Company had outstanding receivables for provisionally priced sales of $47.0 million, consisting of 3.5 million ounces of silver and 40,000 ounces of gold, which had a fair market value of approximately $49.3 million including the embedded derivative.
F-39
| Year Ended December 31, | |||||||||||
| 2006 | 2005 | 2004 | |||||||||
| (in thousands) | |||||||||||
| Beginning Balance | $ | 542 | $ | -- | $ | -- | |||||
| Accruals | 1,803 | 542 | -- | ||||||||
| Payments | (386 | ) | -- | -- | |||||||
| Ending Balance | $ | 1,959 | $ | 542 | $ | -- | |||||
(in thousands):
| Year Ended December 31, | ||||||||||||
| 2007 | 2006 | 2005 | ||||||||||
| Beginning Balance | $ | 1,959 | $ | 542 | $ | — | ||||||
| Accruals | 1,917 | 1,803 | 542 | |||||||||
| Payments | (3,056 | ) | (386 | ) | — | |||||||
| Ending Balance | $ | 820 | $ | 1,959 | $ | 542 | ||||||
F-39
F-40
| Rochester Mine | Cerro Bayo Mine | Martha Mine | Endeavor Mine | Broken Hill Mine | San Bartolome Project | Kensington Project | Other | Total | |||||||||||||||||||||
|---|---|---|---|---|---|---|---|---|---|---|---|---|---|---|---|---|---|---|---|---|---|---|---|---|---|---|---|---|---|
| 2006 | |||||||||||||||||||||||||||||
Total net sales and revenues | $ | 102,393 | $ | 50,293 | $ | 34,733 | $ | 5,363 | $ | 23,791 | $ | -- | $ | -- | $ | -- | $ | 216,573 | |||||||||||
| Depreciation and depletion | $ | 13,745 | $ | 5,795 | $ | 1,313 | $ | 490 | $ | 5,120 | $ | -- | $ | -- | $ | 309 | $ | 26,772 | |||||||||||
| Interest income | -- | 663 | 39 | -- | -- | -- | 8 | 17,276 | 17,986 | ||||||||||||||||||||
| Interest expense | -- | 84 | -- | -- | -- | -- | -- | 1,140 | 1,224 | ||||||||||||||||||||
| Litigation settlement | -- | -- | -- | -- | -- | -- | -- | (2,365 | ) | (2,365 | ) | ||||||||||||||||||
| Income tax (benefit) | |||||||||||||||||||||||||||||
| provision from | |||||||||||||||||||||||||||||
| continuing operations | -- | (2,930 | ) | 4,689 | -- | -- | -- | -- | 6,500 | 8,259 | |||||||||||||||||||
| Segment profit (loss) | 55,109 | 22,652 | 17,290 | 4,977 | �� | 19,427 | (6 | ) | (1,030 | ) | (4,413 | ) | 114,006 | ||||||||||||||||
Segment assets (A) | 87,423 | 49,428 | 11,596 | 14,508 | 29,740 | 59,080 | 207,745 | 10,326 | 469,846 | ||||||||||||||||||||
| Capital expenditures | 1,225 | 7,555 | 2,481 | -- | -- | 14,597 | 121,552 | 588 | 147,998 | ||||||||||||||||||||
F-40
| Rochester Mine | Cerro Bayo Mine | Martha Mine | Endeavor Mine | Broken Hill Mine | San Bartolome Project | Kensington Project | Other | Total | |||||||||||||||||||||
|---|---|---|---|---|---|---|---|---|---|---|---|---|---|---|---|---|---|---|---|---|---|---|---|---|---|---|---|---|---|
| 2005 | |||||||||||||||||||||||||||||
Total net sales and revenues | $ | 69,636 | $ | 59,624 | $ | 20,606 | $ | 2,148 | $ | 4,270 | $ | -- | $ | -- | $ | -- | $ | 156,284 | |||||||||||
| Depreciation and depletion | $ | 10,403 | $ | 5,064 | $ | 860 | $ | 411 | $ | 1,807 | $ | -- | $ | 35 | $ | 309 | $ | 18,889 | |||||||||||
| Interest income | -- | 154 | (1 | ) | -- | -- | -- | -- | 9,036 | 9,189 | |||||||||||||||||||
| Interest expense | -- | 26 | -- | -- | -- | -- | -- | 2,459 | 2,485 | ||||||||||||||||||||
| Litigation settlement | -- | -- | -- | -- | -- | -- | -- | (1,600 | ) | (1,600 | ) | ||||||||||||||||||
| Income tax (benefit) | |||||||||||||||||||||||||||||
| provision from | |||||||||||||||||||||||||||||
| continuing operations | -- | 2,154 | (863 | ) | -- | -- | -- | -- | 192 | 1,483 | |||||||||||||||||||
| Segment profit (loss) | 24,876 | 22,978 | 6,105 | 1,700 | 3,282 | (119 | ) | (7,143 | ) | (12,476 | ) | 39,203 | |||||||||||||||||
Segment assets (A) | 82,806 | 45,474 | 6,291 | 14,999 | 34,860 | 32,687 | 80,653 | 7,982 | 305,752 | ||||||||||||||||||||
| Capital expenditures | 1,197 | 2,731 | 2,108 | 15,410 | 36,667 | 10,477 | 44,201 | 499 | 113,290 | ||||||||||||||||||||
| Rochester Mine | Cerro Bayo Mine | Martha Mine | Endeavor Mine | Broken Hill Mine | San Bartolome Project | Kensington Project | Other | Total | |||||||||||||||||||||
|---|---|---|---|---|---|---|---|---|---|---|---|---|---|---|---|---|---|---|---|---|---|---|---|---|---|---|---|---|---|
| 2004 | |||||||||||||||||||||||||||||
Total net sales and revenues | $ | 64,005 | $ | 35,267 | $ | 9,775 | $ | -- | $ | - | $ | -- | $ | -- | $ | -- | $ | 109,047 | |||||||||||
| Depreciation and depletion | $ | 10,229 | $ | 4,588 | $ | 1,669 | $ | -- | $ | - | $ | 4 | $ | 52 | $ | 291 | $ | 16,833 | |||||||||||
| Interest income | -- | 13 | -- | -- | -- | -- | -- | 3,626 | 3,639 | ||||||||||||||||||||
| Interest expense | 1 | 123 | -- | -- | -- | -- | -- | 2,707 | 2,831 | ||||||||||||||||||||
| Loss on forward sales | |||||||||||||||||||||||||||||
| contracts | -- | -- | -- | -- | -- | -- | -- | (936 | ) | (936 | ) | ||||||||||||||||||
| Income tax (benefit) | |||||||||||||||||||||||||||||
| provision from continuing | |||||||||||||||||||||||||||||
| operations | -- | (4,403 | ) | -- | -- | -- | -- | -- | (1,382 | ) | (5,785 | ) | |||||||||||||||||
| Merger expenses | -- | -- | -- | -- | -- | -- | -- | 15,676 | 15,676 | ||||||||||||||||||||
| Segment profit (loss) | 26,784 | 9,638 | (387 | ) | -- | -- | (4,549 | ) | (7,347 | ) | (11,684 | ) | 12,455 | ||||||||||||||||
Segment assets (A) | 75,529 | 30,898 | 3,387 | -- | -- | 21,304 | 25,833 | 5,813 | 162,764 | ||||||||||||||||||||
| Capital expenditures | 3,548 | 2,451 | 689 | -- | -- | 950 | 83 | 642 | 8,363 | ||||||||||||||||||||
Notes:
| Broken | San | |||||||||||||||||||||||||||||||||||||||
| Rochester | Cerro Bayo | Martha | Endeavor | Hill | Bartolomé | Kensington | Palmarejo | |||||||||||||||||||||||||||||||||
| Mine | Mine | Mine | Mine | Mine | Project | Project | Project | Other | Total | |||||||||||||||||||||||||||||||
December 31, 2007 | ||||||||||||||||||||||||||||||||||||||||
| Total net sales of metals | $ | 100,903 | $ | 47,794 | $ | 38,077 | $ | 7,943 | $ | 20,602 | $ | — | $ | — | $ | — | $ | — | $ | 215,319 | ||||||||||||||||||||
| Productions costs applicable to sales | 60,364 | 35,594 | 17,231 | 545 | 3,292 | — | (1 | ) | — | — | 117,025 | |||||||||||||||||||||||||||||
| Depreciation and depletion | 8,697 | 6,260 | 1,731 | 755 | 3,054 | — | — | — | 487 | 20,984 | ||||||||||||||||||||||||||||||
| Exploration expense | 361 | 2,908 | 4,418 | — | — | — | 619 | — | 3,635 | 11,941 | ||||||||||||||||||||||||||||||
| Other operating expenses | 62 | 113 | 38 | — | — | — | 38 | — | 24,131 | 24,382 | ||||||||||||||||||||||||||||||
| Interest and other income | 2,948 | 1,590 | (303 | ) | — | — | — | 85 | — | 13,875 | 18,195 | |||||||||||||||||||||||||||||
| Interest expense | — | 23 | — | — | — | — | — | — | 342 | 365 | ||||||||||||||||||||||||||||||
| Income tax (credit) expense | — | 1,662 | 6,418 | — | — | — | 20 | — | 6,827 | 14,927 | ||||||||||||||||||||||||||||||
| Profit (loss) | $ | 34,367 | $ | 2,824 | $ | 7,938 | $ | 6,643 | $ | 14,256 | $ | — | $ | (591 | ) | $ | — | $ | (21,547 | ) | $ | 43,890 | ||||||||||||||||||
Segment assets(A) | $ | 62,848 | $ | 63,570 | $ | 25,799 | $ | 17,885 | $ | 29,391 | $ | 169,196 | $ | 301,730 | $ | 1,759,153 | $ | 7,470 | $ | 2,437,042 | ||||||||||||||||||||
| Capital expenditures | $ | 1,647 | $ | 11,330 | $ | 16,444 | $ | 2,112 | $ | 213 | $ | 100,169 | $ | 92,337 | $ | — | $ | 1,942 | $ | 226,194 | ||||||||||||||||||||
| Broken | San | |||||||||||||||||||||||||||||||||||
| Rochester | Cerro Bayo | Martha | Endeavor | Hill | Bartolomé | Kensington | ||||||||||||||||||||||||||||||
| Mine | Mine | Mine | Mine | Mine | Project | Project | Other | Total | ||||||||||||||||||||||||||||
December 31, 2006 | ||||||||||||||||||||||||||||||||||||
| Total net sales of metals | $ | 102,393 | $ | 50,293 | $ | 34,733 | $ | 5,363 | $ | 23,791 | $ | — | $ | — | $ | — | $ | 216,573 | ||||||||||||||||||
| Productions costs applicable to sales | 47,310 | 27,780 | 12,538 | 386 | 4,364 | — | — | — | 92,378 | |||||||||||||||||||||||||||
| Depreciation and depletion | 13,745 | 5,795 | 1,313 | 490 | 5,120 | — | — | 309 | 26,772 | |||||||||||||||||||||||||||
| Exploration expense | — | 2,639 | 2,904 | — | — | — | 936 | 2,995 | 9,474 | |||||||||||||||||||||||||||
| Other operating expenses | — | 28 | 17 | — | — | — | 108 | 21,581 | 21,734 | |||||||||||||||||||||||||||
| Interest and other income | 25 | 809 | 13 | — | — | (6 | ) | 13 | 17,800 | 18,654 | ||||||||||||||||||||||||||
| Interest expense | — | 84 | — | — | — | — | — | 1,140 | 1,224 | |||||||||||||||||||||||||||
| Income tax (credit) expense | — | (2,930 | ) | 4,777 | — | — | — | — | 6,379 | 8,226 | ||||||||||||||||||||||||||
| Profit (loss) | $ | 41,364 | $ | 17,707 | $ | 13,196 | $ | 4,487 | $ | 14,307 | $ | (6 | ) | $ | (1,031 | ) | $ | (14,605 | ) | $ | 75,419 | |||||||||||||||
Segment assets(A) | $ | 87,371 | $ | 49,428 | $ | 11,508 | $ | 15,666 | $ | 32,894 | $ | 59,080 | $ | 207,745 | $ | 6,154 | $ | 469,846 | ||||||||||||||||||
| Capital expenditures | $ | 1,225 | $ | 7,555 | $ | 2,481 | $ | — | $ | — | $ | 16,805 | $ | 122,640 | $ | 588 | $ | 151,294 | ||||||||||||||||||
| Broken | San | |||||||||||||||||||||||||||||||||||
| Rochester | Cerro Bayo | Martha | Endeavor | Hill | Bartolomé | Kensington | ||||||||||||||||||||||||||||||
| Mine | Mine | Mine | Mine | Mine | Project | Project | Other | Total | ||||||||||||||||||||||||||||
December 31, 2005 | ||||||||||||||||||||||||||||||||||||
| Total net sales of metals | $ | 69,636 | $ | 59,624 | $ | 20,606 | $ | 2,148 | $ | 4,270 | $ | — | $ | — | $ | — | $ | 156,284 | ||||||||||||||||||
| Productions costs applicable to sales | 44,547 | 33,574 | 9,016 | 278 | 817 | — | — | — | 88,232 | |||||||||||||||||||||||||||
| Depreciation and depletion | 10,403 | 5,064 | 860 | 411 | 1,807 | — | 35 | 309 | 18,889 | |||||||||||||||||||||||||||
| Exploration expense | 169 | 4,812 | 2,976 | — | — | 83 | 1,165 | 1,431 | 10,636 | |||||||||||||||||||||||||||
| Other operating expenses | 225 | 110 | 690 | — | — | — | 5,979 | 21,194 | 28,198 | |||||||||||||||||||||||||||
| Interest and other income | 181 | 224 | (172 | ) | — | — | (36 | ) | — | 8,188 | 8,385 | |||||||||||||||||||||||||
| Interest expense | — | 26 | 92 | — | — | — | — | 2,367 | 2,485 | |||||||||||||||||||||||||||
| Income tax (credit) expense | — | 2,154 | (862 | ) | — | — | — | — | 191 | 1,483 | ||||||||||||||||||||||||||
| Profit (loss) | $ | 14,473 | $ | 14,108 | $ | 7,662 | $ | 1,459 | $ | 1,646 | $ | (119 | ) | $ | (7,179 | ) | $ | (17,304 | ) | $ | 14,746 | |||||||||||||||
Segment assets(A) | $ | 82,631 | $ | 45,474 | $ | 3,791 | $ | 15,152 | $ | 36,493 | $ | 32,687 | $ | 80,653 | $ | 8,871 | $ | 305,752 | ||||||||||||||||||
| Capital expenditures | $ | 1,197 | $ | 2,731 | $ | 2,108 | $ | 15,410 | $ | 36,667 | $ | 11,089 | $ | 53,155 | $ | 499 | $ | 122,856 | ||||||||||||||||||
| (A) | Segment assets consist of receivables, prepaids, inventories, property, plant and equipment, and mining properties. |
| 2006 | 2005 | 2004 | |||||||||
Income (loss) | |||||||||||
| Total segment profit | $ | 114,006 | $ | 39,203 | $ | 12,455 | |||||
| Depreciation and amortization | (26,772 | ) | (18,889 | ) | (16,833 | ) | |||||
| Interest expense | (1,224 | ) | (2,485 | ) | (2,831 | ) | |||||
| Other | (2,365 | ) | (1,600 | ) | (16,612 | ) | |||||
| Income (loss) from continuing | |||||||||||
| operations before income taxes | $ | 83,645 | $ | 16,229 | $ | (23,821 | ) | ||||
Assets | |||||||||||
| Total assets for reportable segments | $ | 469,846 | $ | 305,752 | $ | 162,764 | |||||
| Cash and cash equivalents | 270,672 | 54,896 | 65,218 | ||||||||
| Short-term investments | 70,373 | 185,446 | 256,843 | ||||||||
| Other assets | 38,735 | 33,894 | 28,350 | ||||||||
| Assets held for sale | -- | 14,828 | 12,602 | ||||||||
| Total consolidated assets | $ | 849,626 | $ | 594,816 | $ | 525,777 | |||||
F-41
| Geographic Information | ||||||||
| 2006 | Revenues | Long-Lived Assets | ||||||
|---|---|---|---|---|---|---|---|---|
| United States | $ | 102,393 | $ | 218,236 | ||||
| Australia | 29,154 | 44,253 | ||||||
| Chile | 50,293 | 20,295 | ||||||
| Argentina | 34,733 | 3,700 | ||||||
| Bolivia | -- | 50,858 | ||||||
| Other foreign countries | -- | 214 | ||||||
| Total | $ | 216,573 | $ | 337,556 | ||||
2005 | ||||||||
United States | $ | 69,636 | $ | 101,338 | ||||
| Australia | 6,418 | 49,860 | ||||||
| Chile | 59,624 | 19,407 | ||||||
| Argentina | 20,606 | 2,568 | ||||||
| Bolivia | -- | 32,194 | ||||||
| Other foreign countries | -- | 237 | ||||||
| Total | $ | 156,284 | $ | 205,604 | ||||
2004 | ||||||||
United States | $ | 64,005 | $ | 54,306 | ||||
| Australia | -- | -- | ||||||
| Chile | 35,267 | 15,332 | ||||||
| Argentina | 9,775 | 1,050 | ||||||
| Bolivia | -- | 21,103 | ||||||
| Other foreign countries | -- | 144 | ||||||
| Total | $ | 109,047 | $ | 91,935 | ||||
2007 2006 2005 Assets Total assets for reportable segments $ 2,437,042 $ 469,846 $ 305,752 Cash and cash equivalents 98,671 270,672 54,896 Short-term investments 53,039 70,373 185,446 Other assets 62,942 38,735 33,894 Total assets held for sale — — 14,828 Total consolidated assets $ 2,651,694 $ 849,626 $ 594,816
Geographic Information Long-Lived Revenues Assets 2007 United States $ 100,903 $ 305,876 Australia 28,545 42,772 Chile 47,794 28,028 Argentina 38,077 18,640 Mexico — 1,756,042 Bolivia — 151,716 Other foreign countries — 190 Total $ 215,319 $ 2,303,264 2006 United States $ 102,393 $ 218,236 Australia 29,154 44,253 Chile 50,293 20,295 Argentina 34,733 3,700 Bolivia — 50,858 Other foreign countries — 214 Total $ 216,573 $ 337,556 2005 United States $ 69,636 $ 101,338 Australia 6,418 49,860 Chile 59,624 19,407 Argentina 20,606 2,568 Bolivia — 32,194 Other foreign countries — 237 Total $ 156,284 $ 205,604
NOTE RS — LITIGATIONFederal Natural Resources Action
On March 22, 1996, an action was filed in the United States District Court for the District of Idaho by the United States against various defendants, including the Company, asserting claims under CERCLA and the Clean Water Act for alleged damages to federal natural resources in the Coeur d’Alene River Basin of Northern Idaho. The damages are claimed to result from alleged releases of hazardous substances from mining activities conducted in the area since the late 1800s.
In May 2001, the Company and representatives of the U.S. Government, including the Environmental Protection Agency, the Department of Interior and the Department of Agriculture, reached an agreement to settle the lawsuit. The terms of settlement are set forth in a Consent Decree issued by the court. Pursuant to the terms of the Consent Decree, dated May 14, 2001, the Company has paid the U.S. Government a total of approximately $3.9 million, of which $3.3 million was paid in May 2001 and the remaining $0.6 million was paid in June 2001. In addition, the Company will (i) pay the United States 50% of any future recoveries from insurance companies for claims for defense and indemnification under general liability insurance policies in excess of $0.6 million, (ii) accomplish certain cleanup work on the Mineral Point property and Caladay property, and (iii) make a conveyance to the U.S. or the State of Idaho of certain real property to possibly be used as a waste repository. Finally, commencing five years after effectiveness of the settlement, the Company will be obligated to pay royalties on all of its domestic and foreign operating properties, up to a cumulative of $3 million, amounting to a 2% net smelter royalty on silver production if the price of silver exceeds $6.50 per ounce, and a $5.00 per ounce royalty on gold production if the price of gold exceeds $325 per ounce. The royalty payment obligation commenced on May 14, 2006 and expires May 14, 2021. As of December 31, 2006, $2.5 million (including discontinued operations) of the $3.0 million was paid. It is expected that the remaining $0.5 million will be paid in the first half of 2007.
F-42
States of Maine, Idaho Andand Colorado Superfund Sites Related to Callahan Mining Corporation During 1991, the Company acquired all of the outstanding common stock of Callahan Mining Corporation. During 2001, the United States Forest Service made a formal request for information regarding the Deadwood Mine Site located in central Idaho. Callahan Mining Corporation had operated at this site during the 1940‘s.1940’s. The Forest Service believes that some cleanup action is required at the location. However, Coeur d’Alene Mines Corporation did not acquire Callahan until 1991, more than 40 years after Callahan disposed of its interest in the Deadwood property. The Company did not make any decisions with respect to generation, transport or disposal of hazardous waste at the site. Therefore, it is believed that the Company is not liable for any cleanup, and if Callahan might be liable, it has no substantial assets with which to satisfy any such liability. To date, no claim has been made by the United States for any cleanup costs against either the Company or Callahan.F-42
During 2002, the EPA made a formal request for information regarding a Callahan mine site in the State of Maine. Callahan operated there in the late 1960‘s,1960’s, shut the operations down in the early 1970‘s1970’s and disposed of the property. The EPA contends that some cleanup action is warranted at the site, and listed it on the National Priorities List in late 2002. The Company believes that because it made no decisions with respect to generation, transport or disposal of hazardous waste at this location, it is not liable for any cleanup costs. If Callahan might have liability, it has no substantial assets with which to satisfy such liability. To date, no claim has been made for any cleanup costs against either the Company or Callahan. In January 2003, the U.S. Forest Service made a formal request for information regarding a Callahan mine site in the State of Colorado known as the Akron Mine Site. Callahan operated there in approximately the late 1930s through the 1940s, and to the Company’s knowledge, disposed of the property. The Company is not aware of what, if any, cleanup action the Forest Service is contemplating. However, the Company did not make decisions with respect to generation, transport or disposal of hazardous waste at this location, and therefore believes it is not liable for any cleanup costs. If Callahan might have liability, it has no substantial assets with which to satisfy such liability. To date, no claim has been made for any cleanup costs against either the Company or Callahan.Federal District Court of Alaska Permit Challenge On September 12, 2005 three environmental groups (“Plaintiffs”) filed a lawsuit in Federal District Court in Alaska against the U.S. Army Corps of Engineers (“Corps of Engineers”) and the U.S. Forest Service (“USFS”) seeking to invalidate the permit issued to Coeur Alaska, Inc. for the Company’s Kensington mine. The Plaintiffs claim the Clean Water Act (CWA)(“CWA”) Section 404 permit issued by the Corps of Engineers authorizing the deposition of mine tailings into Lower Slate Lake conflicts with the CWA and is thus illegal.CWA. They additionally claim the USFS’s approval of the Amended Plan of Operations is arbitrary and capricious because it relies on the 404 permit issued by the Corps of Engineers. On November 8, 2005, Following the Corps of Engineers filed a Motion for Voluntary Remand with the court to review the permit issued to the Company under the CWA Section 404 and requested that the court stay the legal proceeding filed by the plaintiffs pending the outcome of review. On November 12, 2005, the Federal District Court in Alaska granted theCourt’s remand of the Section 404 permit to the Corps of Engineers for further review. On November 22, 2005,review, the Corps of Engineers advised the Company that it was suspending the Section 404 permit pursuant to the Court’s remand to further review the permit.
On March 29, 2006, the Corps of Engineers reinstated the Company’s 404 permit. On April 6, 2006 thepermit on March 29, 2006. The lawsuit challenging the permit was re-opened andon April 6, 2006; Coeur Alaska Inc. filed its answer to the Amended ComplaintComplaint; and Motion to Intervene as a Defendant-Intervenor in the action. Two other parties,Coeur Alaska, the State of Alaska, and Goldbelt, Inc., a local native corporation, also filed Motions to Intervene as Defendant-Intervenors as supporters of the Kensington project as permitted. The Company, the State of Alaska and Goldbelt, Inc. were granted Defendant-Intervenor status and joinedto join the agencies in their defense of the permits as issued.
F-43
permit.
On August 4, 2006, the Federal District Court in Alaska dismissed the Plaintiffs’ challenge and upheld the Section 404 permit. On August 7, 2006 the Plaintiffs filed a Notice of Appeal of the decision to the Ninth Circuit Court of Appeals (“Ninth Circuit Court”) and on August 9, 2006 the Plaintiffs additionally filed a Motion for Injunction Pending Appeal with the Ninth Circuit Court. The Ninth Circuit Court granted a temporary injunction pending appeal on August 24, 2006, enjoining certain activities relating to the lake tailings facility. The On May 22, 2007 the Ninth Circuit Court further ordered an expedited briefing schedulereversed the District Court’s August 4, 2006 decision which had upheld the Company’s 404 permit and issued its opinion that remanded the case to the District Court with instructions to vacate the Company’s 404 permit as well as the USFS Record of Decision approving the general tailings disposal plan as well as the Goldbelt 404 permit to construct the Cascade Point Marine Facility. On August 20, 2007, Coeur Alaska filed a Petition for Rehearing En Banc with the Ninth Circuit Court, as did the State of Alaska and Goldbelt, Inc. The Department of Justice, on the meritsbehalf of the legal challenge. AsCorps of Engineers, and USFS additionally filed a limited Petition for Rehearing with the Ninth Circuit panel seeking reconsideration of the mandate of the May 22, 2007 panel decision. On October 13, 2006,29, 2007, the parties filed their briefs inNinth Circuit denied the Petitions for Rehearing En Banc. On November 14, 2007, the Ninth Circuit granted a stay of the mandate pending further appeal to the Supreme Court, and participated in an oral argument on December 4, 2006. There is no indicationsubject to the development of whena reclamation plan for the Circuit Court may rule on the merits of appeal.lake area. The Company is unableand the State of Alaska filed Petitions for Certiorari to the Supreme Court of the United States on January 28, 2008. The Company cannot now predict the outcome ofpotential for obtaining further appeal or if it will prevail upon appeal if one is granted.F-43
No assurance can be given as to whether or when regulatory permits and approvals granted to the litigation.Company may be further challenged, appealed or contested by third parties or issuing agencies, or as to whether the Company will place the Kensington project into commercial production.
This litigation has contributed to an increase in capital costs. While the Company cannot now predict with certainty the outcome of this litigation, it believes it willshould ultimately prevail in the defense of the awarded permits, inprevail. In the event that the Company does not prevail, it could be necessary to seek an alternate site for the tailings disposal facility. The Company is not aware ofhas identified an alternate site that couldwhich it believes can be permitted or would be economic. Therefore, it is possible that an adverse legal decision could renderand has submitted a modified plan to the project uneconomic and an asset impairment would be necessary. As a result ofUSFS. Based upon the increase in capital and operating costs at the Kensington project,Company’s current estimates, an impairment writedown could be necessary should the expectation of the long-term price for gold decrease below approximately $510$606 per ounce. As of December 31, 2006,2007, the Kensington project has a carrying value of $206the Kensington project’s long-lived assets was $298.2 million.NOTE ST — SUMMARY OF QUARTERLY FINANCIAL DATA (UNAUDITED) The following table sets forth a summary of the quarterly results of operations for the years ended December 31, 2007 and 2006 and 2005:First
Quarter
Second
Quarter
Third
Quarter
Fourth
Quarter
(In Thousands - Except Per Share Data)
2006: Sales of metal $ 44,854 $ 54,041 $ 50,606 $ 67,072
Income (loss) from continuing operations $ 13,726 $ 20,132 $ 18,378 $ 23,183 Income (loss) from discontinued operations 612 12,516 (27 ) (33 )
Net income (loss) $ 14,338 $ 32,648 $ 18,351 $ 23,150
Basic net income (loss) per share Income (loss) from continuing operations $ 0.06 $ 0.07 $ 0.07 $ 0.08 Income (loss) from discontinued operations -- 0.05 -- --
Net income (loss) $ 0.06 $ 0.12 $ 0.07 $ 0.08
Diluted net income (loss) per share Income (loss) from continuing operations $ 0.05 $ 0.07 $ 0.06 $ 0.08 Income (loss) from discontinued operations -- 0.04 -- --
Net income (loss) $ 0.05 $ 0.11 $ 0.06 $ 0.08
(in thousands — except for per share data): First Second Third Fourth Quarter Quarter Quarter Quarter 2007: Sales of metal $ 50,860 $ 51,664 $ 52,863 $ 59,931 Net income $ 14,018 $ 11,918 $ 3,635 $ 14,319 Basic net income per share $ 0.05 $ 0.04 $ 0.01 $ 0.05 Diluted net income per share $ 0.05 $ 0.04 $ 0.01 $ 0.04
First Second Third Fourth Quarter Quarter Quarter Quarter 2006: Sales of metal $ 44,854 $ 54,041 $ 50,606 $ 67,072 Income from continuing operations $ 13,726 $ 20,132 $ 18,378 $ 23,183 Income from discontinued operations 612 12,516 (27 ) (33 ) Net income $ 14,338 $ 32,648 $ 18,351 $ 23,150 Basic net income per share Income from continuing operations $ 0.06 $ 0.07 $ 0.07 $ 0.08 Income from discontinued operations — 0.05 — — Net income $ 0.06 $ 0.12 $ 0.07 $ 0.08 Diluted net income per share Income from continuing operations $ 0.05 $ 0.07 $ 0.06 $ 0.08 Income from discontinued operations — 0.04 — — Net income $ 0.05 $ 0.11 $ 0.06 $ 0.08
F-44
First
Quarter
Second
Quarter
Third
Quarter
Fourth
Quarter
(In Thousands - Except Per Share Data)
2005: Sales of metal $ 32,235 $ 33,504 $ 39,281 $ 51,264 Income (loss) from continuing operations $ (784 ) $ (529 ) $ 4,722 $ 11,337 Income (loss) from discontinued operations (361 ) (1,172 ) (1,269 ) (1,393 )
Net income (loss) $ (1,145 ) $ (1,701 ) $ 3,453 $ 9,944
Basic net income (loss) per share Income (loss) from continuing operations $ 0.00 $ 0.00 $ 0.02 $ 0.05 Income (loss) from discontinued operations -- (0.01 ) (0.01 ) (0.01 )
Net income (loss) $ 0.00 $ (0.01 ) $ 0.01 $ 0.04
Diluted net income (loss) per share Income (loss) from continuing operations $ 0.00 $ 0.00 $ 0.02 $ 0.04 Income (loss) from discontinued operations -- (0.01 ) (0.01 ) --
Net income (loss) $ 0.00 $ (0.01 ) $ 0.01 $ 0.04
NOTE U — SUBSEQUENT EVENTDuring February 2008, Cobar reported to the Company that the reserves at the Endeavor mine exceed those reported for 2004, thereby fulfilling the contractual condition discussed in Note H. Consequently, the Company expects to pay Cobar the additional $26.3 million on April 1, 2008 plus accrued interest at the rate of 7.5% per annum from January 24, 2008.F-45
| 2007 | 2006 | 2005 | ||||||||||
| Assets | ||||||||||||
| Total assets for reportable segments | $ | 2,437,042 | $ | 469,846 | $ | 305,752 | ||||||
| Cash and cash equivalents | 98,671 | 270,672 | 54,896 | |||||||||
| Short-term investments | 53,039 | 70,373 | 185,446 | |||||||||
| Other assets | 62,942 | 38,735 | 33,894 | |||||||||
| Total assets held for sale | — | — | 14,828 | |||||||||
| Total consolidated assets | $ | 2,651,694 | $ | 849,626 | $ | 594,816 | ||||||
| Long-Lived | ||||||||
| Revenues | Assets | |||||||
2007 | ||||||||
| United States | $ | 100,903 | $ | 305,876 | ||||
| Australia | 28,545 | 42,772 | ||||||
| Chile | 47,794 | 28,028 | ||||||
| Argentina | 38,077 | 18,640 | ||||||
| Mexico | — | 1,756,042 | ||||||
| Bolivia | — | 151,716 | ||||||
| Other foreign countries | — | 190 | ||||||
| Total | $ | 215,319 | $ | 2,303,264 | ||||
2006 | ||||||||
| United States | $ | 102,393 | $ | 218,236 | ||||
| Australia | 29,154 | 44,253 | ||||||
| Chile | 50,293 | 20,295 | ||||||
| Argentina | 34,733 | 3,700 | ||||||
| Bolivia | — | 50,858 | ||||||
| Other foreign countries | — | 214 | ||||||
| Total | $ | 216,573 | $ | 337,556 | ||||
2005 | ||||||||
| United States | $ | 69,636 | $ | 101,338 | ||||
| Australia | 6,418 | 49,860 | ||||||
| Chile | 59,624 | 19,407 | ||||||
| Argentina | 20,606 | 2,568 | ||||||
| Bolivia | — | 32,194 | ||||||
| Other foreign countries | — | 237 | ||||||
| Total | $ | 156,284 | $ | 205,604 | ||||
Federal Natural Resources Action
On March 22, 1996, an action was filed in the United States District Court for the District of Idaho by the United States against various defendants, including the Company, asserting claims under CERCLA and the Clean Water Act for alleged damages to federal natural resources in the Coeur d’Alene River Basin of Northern Idaho. The damages are claimed to result from alleged releases of hazardous substances from mining activities conducted in the area since the late 1800s.
In May 2001, the Company and representatives of the U.S. Government, including the Environmental Protection Agency, the Department of Interior and the Department of Agriculture, reached an agreement to settle the lawsuit. The terms of settlement are set forth in a Consent Decree issued by the court. Pursuant to the terms of the Consent Decree, dated May 14, 2001, the Company has paid the U.S. Government a total of approximately $3.9 million, of which $3.3 million was paid in May 2001 and the remaining $0.6 million was paid in June 2001. In addition, the Company will (i) pay the United States 50% of any future recoveries from insurance companies for claims for defense and indemnification under general liability insurance policies in excess of $0.6 million, (ii) accomplish certain cleanup work on the Mineral Point property and Caladay property, and (iii) make a conveyance to the U.S. or the State of Idaho of certain real property to possibly be used as a waste repository. Finally, commencing five years after effectiveness of the settlement, the Company will be obligated to pay royalties on all of its domestic and foreign operating properties, up to a cumulative of $3 million, amounting to a 2% net smelter royalty on silver production if the price of silver exceeds $6.50 per ounce, and a $5.00 per ounce royalty on gold production if the price of gold exceeds $325 per ounce. The royalty payment obligation commenced on May 14, 2006 and expires May 14, 2021. As of December 31, 2006, $2.5 million (including discontinued operations) of the $3.0 million was paid. It is expected that the remaining $0.5 million will be paid in the first half of 2007.
F-42
F-42
On November 8, 2005, Following the Corps of Engineers filed a Motion for Voluntary Remand with the court to review the permit issued to the Company under the CWA Section 404 and requested that the court stay the legal proceeding filed by the plaintiffs pending the outcome of review. On November 12, 2005, the Federal District Court in Alaska granted theCourt’s remand of the Section 404 permit to the Corps of Engineers for further review. On November 22, 2005,review, the Corps of Engineers advised the Company that it was suspending the Section 404 permit pursuant to the Court’s remand to further review the permit.
On March 29, 2006, the Corps of Engineers reinstated the Company’s 404 permit. On April 6, 2006 thepermit on March 29, 2006. The lawsuit challenging the permit was re-opened andon April 6, 2006; Coeur Alaska Inc. filed its answer to the Amended ComplaintComplaint; and Motion to Intervene as a Defendant-Intervenor in the action. Two other parties,Coeur Alaska, the State of Alaska, and Goldbelt, Inc., a local native corporation, also filed Motions to Intervene as Defendant-Intervenors as supporters of the Kensington project as permitted. The Company, the State of Alaska and Goldbelt, Inc. were granted Defendant-Intervenor status and joinedto join the agencies in their defense of the permits as issued.
F-43
permit.
F-43
Company may be further challenged, appealed or contested by third parties or issuing agencies, or as to whether the Company will place the Kensington project into commercial production.
| First Quarter | Second Quarter | Third Quarter | Fourth Quarter | |||||||||||
| (In Thousands - Except Per Share Data) | ||||||||||||||
2006: | ||||||||||||||
| Sales of metal | $ | 44,854 | $ | 54,041 | $ | 50,606 | $ | 67,072 | ||||||
Income (loss) from continuing operations | $ | 13,726 | $ | 20,132 | $ | 18,378 | $ | 23,183 | ||||||
| Income (loss) from discontinued operations | 612 | 12,516 | (27 | ) | (33 | ) | ||||||||
| Net income (loss) | $ | 14,338 | $ | 32,648 | $ | 18,351 | $ | 23,150 | ||||||
Basic net income (loss) per share | ||||||||||||||
| Income (loss) from continuing operations | $ | 0.06 | $ | 0.07 | $ | 0.07 | $ | 0.08 | ||||||
| Income (loss) from discontinued operations | -- | 0.05 | -- | -- | ||||||||||
| Net income (loss) | $ | 0.06 | $ | 0.12 | $ | 0.07 | $ | 0.08 | ||||||
Diluted net income (loss) per share | ||||||||||||||
| Income (loss) from continuing operations | $ | 0.05 | $ | 0.07 | $ | 0.06 | $ | 0.08 | ||||||
| Income (loss) from discontinued operations | -- | 0.04 | -- | -- | ||||||||||
| Net income (loss) | $ | 0.05 | $ | 0.11 | $ | 0.06 | $ | 0.08 | ||||||
(in thousands — except for per share data):
| First | Second | Third | Fourth | |||||||||||||
| Quarter | Quarter | Quarter | Quarter | |||||||||||||
| 2007: | ||||||||||||||||
| Sales of metal | $ | 50,860 | $ | 51,664 | $ | 52,863 | $ | 59,931 | ||||||||
| Net income | $ | 14,018 | $ | 11,918 | $ | 3,635 | $ | 14,319 | ||||||||
| Basic net income per share | $ | 0.05 | $ | 0.04 | $ | 0.01 | $ | 0.05 | ||||||||
| Diluted net income per share | $ | 0.05 | $ | 0.04 | $ | 0.01 | $ | 0.04 | ||||||||
| First | Second | Third | Fourth | |||||||||||||
| Quarter | Quarter | Quarter | Quarter | |||||||||||||
| 2006: | ||||||||||||||||
| Sales of metal | $ | 44,854 | $ | 54,041 | $ | 50,606 | $ | 67,072 | ||||||||
| Income from continuing operations | $ | 13,726 | $ | 20,132 | $ | 18,378 | $ | 23,183 | ||||||||
| Income from discontinued operations | 612 | 12,516 | (27 | ) | (33 | ) | ||||||||||
| Net income | $ | 14,338 | $ | 32,648 | $ | 18,351 | $ | 23,150 | ||||||||
| Basic net income per share | ||||||||||||||||
| Income from continuing operations | $ | 0.06 | $ | 0.07 | $ | 0.07 | $ | 0.08 | ||||||||
| Income from discontinued operations | — | 0.05 | — | — | ||||||||||||
| Net income | $ | 0.06 | $ | 0.12 | $ | 0.07 | $ | 0.08 | ||||||||
| Diluted net income per share | ||||||||||||||||
| Income from continuing operations | $ | 0.05 | $ | 0.07 | $ | 0.06 | $ | 0.08 | ||||||||
| Income from discontinued operations | — | 0.04 | — | — | ||||||||||||
| Net income | $ | 0.05 | $ | 0.11 | $ | 0.06 | $ | 0.08 | ||||||||
F-44
| First Quarter | Second Quarter | Third Quarter | Fourth Quarter | |||||||||||
| (In Thousands - Except Per Share Data) | ||||||||||||||
2005: | ||||||||||||||
| Sales of metal | $ | 32,235 | $ | 33,504 | $ | 39,281 | $ | 51,264 | ||||||
| Income (loss) from continuing operations | $ | (784 | ) | $ | (529 | ) | $ | 4,722 | $ | 11,337 | ||||
| Income (loss) from discontinued operations | (361 | ) | (1,172 | ) | (1,269 | ) | (1,393 | ) | ||||||
| Net income (loss) | $ | (1,145 | ) | $ | (1,701 | ) | $ | 3,453 | $ | 9,944 | ||||
Basic net income (loss) per share | ||||||||||||||
| Income (loss) from continuing operations | $ | 0.00 | $ | 0.00 | $ | 0.02 | $ | 0.05 | ||||||
| Income (loss) from discontinued operations | -- | (0.01 | ) | (0.01 | ) | (0.01 | ) | |||||||
| Net income (loss) | $ | 0.00 | $ | (0.01 | ) | $ | 0.01 | $ | 0.04 | |||||
Diluted net income (loss) per share | ||||||||||||||
| Income (loss) from continuing operations | $ | 0.00 | $ | 0.00 | $ | 0.02 | $ | 0.04 | ||||||
| Income (loss) from discontinued operations | -- | (0.01 | ) | (0.01 | ) | -- | ||||||||
| Net income (loss) | $ | 0.00 | $ | (0.01 | ) | $ | 0.01 | $ | 0.04 | |||||
F-45