UNITED STATES
SECURITIES AND EXCHANGE COMMISSIONWashington,
WASHINGTON, D.C. 20549
FORM 10-K
Annual report pursuant to Section 13 of theSecurities Exchange Act of 1934 for(Mark One)
| x | ANNUAL REPORT PURSUANT TO SECTION 13 OR 15(d) OF THE SECURITIES EXCHANGE ACT OF 1934 |
For the fiscal year ended May 31, 200727, 2010
| ¨ | TRANSITION REPORT PURSUANT TO SECTION 13 OR 15(d) OF THE SECURITIES EXCHANGE ACT OF 1934 |
For the transition period from to
Commission File Number 1-12604
THE MARCUS CORPORATION
(Exact name of registrant as specified in its charter)
| Wisconsin | 39-1139844 | |
| (State or other jurisdiction of incorporation or organization) | (I.R.S. Employer Identification No.) | |
| 100 East Wisconsin Avenue, Milwaukee, Wisconsin | 53202-4125 | |
| (Address of principal executive offices) | (Zip Code) | |
Registrant’s telephone number, including area code: (414) 905-1000
A Wisconsin corporationIRS Employer Identification No. 39-1139844Commission File No. 1-12609
We have one class of securitiesSecurities registered pursuant to Section 12(b) of the Act: our Common Stock, $1 par value, which is registered on the New York Stock Exchange.
We do not have any securities
Title of Each Class | Name of Each Exchange on Which Registered | |
| Common stock, $1.00 par value | New York Stock Exchange |
Securities registered pursuant to Section 12(g) of the Act.Act: None
We are notIndicate by check mark if the registrant is a well-known seasoned issuer, (asas defined in ruleRule 405 of the Securities Act).Act. Yes ¨ No x
We areIndicate by check mark if the registrant is not required to file reports pursuant to Section 13 or Section 15(d) of the Act. We haveYes ¨ No x
Indicate by check mark whether the registrant (1) has filed all reports required to be filed by Section 13 or 15(d) of the Securities Exchange Act of 1934 during the preceding 12 months (or for such shorter period that the registrant was required to file such reports), and have(2) has been subject to such filing requirements for the past 90 days. Yes x No ¨
DisclosureIndicate by check mark whether the registrant has submitted electronically and posted on its corporate Website, if any, every Interactive Data File required to be submitted and posted pursuant to Rule 405 of Regulation S-T (§ 232.405 of this chapter) during the preceding 12 months (or for such shorter period that the registrant was required to submit and post such files). Yes ¨No ¨
Indicate by check mark if disclosure of delinquent filers pursuant to Item 405 of Regulation S-K (§ 229.405 of this chapter) is not contained herein, and will not be contained, to the best of registrant’s knowledge, in our definitive proxy statementor information statements incorporated by reference in Part III of this Form 10-K or any amendment to this Form 10-K.¨
We areIndicate by check mark whether the registrant is a large accelerated filer, an accelerated filer, (as defineda non-accelerated filer, or a smaller reporting company. See the definitions of “large accelerated filer,” “accelerated filer” and “smaller reporting company” in Rule 12b-2 of the Act).Exchange Act. (Check one):
We are
Large accelerated filer ¨ | Accelerated filer x | Non-accelerated filer ¨ | Smaller reporting company¨ | |||
(Do not check if a smaller reporting company) | ||||||
Indicate by check mark whether the registrant is a shell company (as defined in Rule 12b-2 of the Exchange Act). Yes ¨ No x
The aggregate market value of the votingregistrant’s common equity held by non-affiliates as of November 23, 200626, 2009 was $522,367,369.71.approximately $256,000,000. This value includes all shares of our Common Stock,the registrant’s common stock, except for treasury shares and shares beneficially owned by ourthe registrant’s directors and executive officers listed in Part I below.
AsIndicate the number of shares outstanding of each of the issuer’s classes of common stock, as of the latest practicable date.
Common stock outstanding at August 10, 2007, there were 21,539,284 shares of our Common Stock, $1 par value, and 8,889,588 shares of our 5, 2010—20,769,509
Class B Common Stock, $1 par value, outstanding.common stock outstanding at August 5, 2010—8,854,179
Portions of ourthe registrant’s definitive Proxy Statement for our 2007its 2010 annual meeting of shareholders, which will be filed with the Commission under Regulation 14A within 120 days after the end of our fiscal year, will be incorporated by reference into Part III to the extent indicated therein upon such filing.
PART I
Special Note Regarding Forward-Looking Statements
Certain matters discussed in this Annual Report on Form 10-K and the accompanying annual report to shareholders, particularly in the Shareholders’ Letter and Management’s Discussion and Analysis, are “forward-looking statements” intended to qualify for the safe harbors from liability established by the Private Securities Litigation Reform Act of 1995. These forward-looking statements may generally be identified as such because the context of such statements will include words such as we “believe,” “anticipate,” “expect” or words of similar import. Similarly, statements that describe our future plans, objectives or goals are also forward-looking statements. Such forward-looking statements are subject to certain risks and uncertainties that couldwhich may cause results to differ materially from those expected, including, but not limited to, the following: (1) the availability, in terms of both quantity and audience appeal, of motion pictures for our theatre division, as well as other industry dynamics such as the maintenance of a suitable window between the date such motion pictures are released in theatres and the date they are released to other distribution channels; (2) the effects of increasing depreciation expenses, reduced operating profits during major property renovations, and preopening and start-up costs due to the capital intensive nature of our businesses; (3) the effects of adverse economic conditions in our markets, particularly with respect to our hotels and resorts division; (4) the effects of adverse weather conditions, particularly during the winter in the Midwest and in our other markets; (5) the effects on our occupancy and room rates from the relative industry supply of available rooms at comparable lodging facilities in our markets; (6) the effects of competitive conditions in our markets; (7) our ability to identify properties to acquire, develop and/or manage and continuing availability of funds for such development; and (8) the adverse impact on business and consumer spending on travel, leisure and entertainment resulting from terrorist attacks in the United States, the United States’ responses thereto and subsequent hostilities; and (9) the successful integration of the Cinema Entertainment Corporation theatres into our theatre circuit.hostilities. Shareholders, potential investors and other readers are urged to consider these factors carefully in evaluating the forward-looking statements and are cautioned not to place undue reliance on such forward-looking statements. The forward-looking statements made herein are made only as of the date of this Form 10-K and we undertake no obligation to publicly update such forward-looking statements to reflect subsequent events or circumstances.
Item 1. Business.
General
We are engaged primarily in two business segments: movie theatres and hotels and resorts.
As of May 31, 2007,27, 2010, our theatre operations included 5054 movie theatres with 608668 screens throughout Wisconsin, Ohio, Illinois, Minnesota, North Dakota, Nebraska and Iowa, including two movie theatres with 2011 screens in IllinoisWisconsin and WisconsinNebraska owned by third parties but managed by us. We also operate a family entertainment center,Funset Boulevard, that is adjacent to one of our theatres in Appleton, Wisconsin. We are currently the 6th largest theatre circuit in the United States.
As of May 31, 2007,27, 2010, our hotels and resorts operations included eight8 owned and operated hotels and resorts in Wisconsin, Missouri, Illinois and Oklahoma. We also manage twelve11 hotels, resorts and other properties for third parties in Wisconsin, Minnesota, Ohio, Texas, Arizona, Missouri, Nevada and California. As of May 27, 2010, we owned or managed nearly 5,200 hotel and resort rooms.
Both of these business segments are discussed in detail below. For information regarding the revenues, operating income or loss, assets and certain other financial information of these segments for the last three fiscal years, please see our Consolidated Financial Statements and the accompanying Note 11 in Part II below.
Strategic Plans
Please see our discussion under “Current Plans” in Item 7 – 7—Management’s Discussion and Analysis of Financial Condition and Results of Operations.
2
Theatre Operations
At the end of fiscal 2007,2010, we owned or operated 5054 movie theatre locations with a total of 608668 screens in Wisconsin, Illinois, Minnesota, Ohio, North Dakota, Nebraska and Iowa for an average of 12.212.4 screens per location, compared to an average of 11.212.5 and 12.1 screens per location at the end of fiscal 20062009 and 2005.2008, respectively. Included in the fiscal 2007 totals2010 total are two theatres with 2011 screens that we manage for other owners. Included in theWe managed one theatre with 6 screens for another owner during fiscal 20062009 and 2005 totals are four theatres with 40 screens that we managed for other owners.fiscal 2008. Our 4852 company-owned facilities include 2832 megaplex theatres (12 or more screens), representing 72%75% of our total screens, 19 multiplex theatres (two to 11 screens) and one single-screen theatre. At fiscal year-end, we operated 585647 first-run screens, 2011 of which are operated under management contracts, and 2321 budget-oriented screens.
On November 17, 2006,In May 2009, we opened our circuit’s 13thUltraScreen® at our newly-renovated North Shore Cinema in Mequon, Wisconsin. In addition, in November 2009, we opened the new 12-screenMarcus Midtown Cinema at Midtown Crossing in Omaha, Nebraska. We are managing this unique upscale four-level, five-screen entertainment destination for the owner, Mutual of Omaha. This theatre offers our exclusiveCineDineSM in-theatre dining concept in Green Bay,all five auditoriums and also featuresZaffiro’s pizza. The theatre also features two sophisticated cocktail lounges, meeting and event space and a full catering service. The initial response to this distinctive new theatre has been positive.
We continue to review opportunities to build additional new locations and recently purchased land in Sun Prairie, Wisconsin and ourwith plans to build a new 13-screen theatre to replace the existing Eastgate Theatre in Sturtevant/Racine,Madison, Wisconsin. TheWe currently own land in six different communities that may be used for new theatres in Green Bay and Sturtevant/Racine, Wisconsin replaced older existing facilitiesat a future date. We also will continue to offer moviegoers the latest technology and amenities. In addition, on May 4, 2007, we opened our new flagship theatre, The Marcus Majestic of Brookfield, in Brookfield, Wisconsin. The Majestic replaced two smaller existing theatres with 17 screens in the same market and features 16 stadium-style auditoriums, including two 72-feet-wideUltraScreens®, and a multi-use auditorium called the AT&T Palladium, fully equipped for live performances, meetings, broadcast concerts and sporting events and regular screenings of first-run movies, with an attached kitchen from which we offer a full menu. The Majestic also has two cafes – one serving branded pizza and another serving branded coffee, ice cream and chocolates.consider additional potential acquisitions as opportunities arise.
On April 19, 2007, we completed the acquisition of 11 multi-screen movie theatres owned and/or leased by Cinema Entertainment Corp. in portions of Minnesota, Wisconsin, North Dakota and Iowa. The acquisition added 122 screens to our theatre operations. Additionally, we plan to add up to three new 72-foot-wideUltraScreens® to existing theatres during the next year, as well as expand our food and beverage offerings at several existing locations.
Revenues for the theatre business, and the motion picture industry in general, are heavily dependent on the general audience appeal of available films, together with studio marketing, advertising and support campaigns, factors over which we have no control. ThreeConsistent with prior years in which blockbusters accounted for a significant portion of our total box office, our top 15 performing films accounted for 42% of our fiscal 2007 films produced2010 box office receipts in excess of $3 million for our circuit, compared to two films that reached that amount32% during fiscal 2006.2009. The following five fiscal 20072010 films accounted for approximately 20% of our total box office and produced the mostgreatest box office receipts for our circuit:PiratesAvatar,Transformers: Revenge of the Caribbean: Dead Man’s ChestFallen,Spider-Man 3Harry Potter and the Half-Blood Prince,Night at the Museum,Shrek the ThirdThe Blind Side andCarsThe Twilight Saga: New Moon.
We obtain our films from several national motion picture production and distribution companies and are not dependent on any single motion picture supplier. Our booking, advertising, concession purchases and promotional activities are handled centrally by our administrative staff. Including our own theatres, we currently are providing film buying, booking and other related services for 837 screens in seven states.
We strive to provide our movie patrons with high-quality picture and sound presentation in clean, comfortable, attractive and contemporary theatre environments. Substantially all of our movie theatre complexes feature either digital sound, Dolby or other stereo sound systems; acoustical ceilings; side wall insulation; engineered drapery folds to eliminate sound imbalance, reverberation and distortion; tiled floors; loge seats; cup-holder chair-arms; and computer-controlled heating, air conditioning and ventilation. We offer stadium seating, a tiered seating system that permits unobstructed viewing, at approximately 90% of our first-run screens. Computerized box offices permit all of our movie theatres to sell tickets in advance. Our theatres are accessible to persons with disabilities and provide wireless headphones for hearing-impaired moviegoers. Other amenities at certain theatres include THX auditoriums, which allow customers to hear the softest and loudest sounds, and touch-screen, computerized, self-service ticket kiosks, which simplify advance ticket purchases. We own a minority interest in MovieTickets.com, a joint venture of movie and entertainment companies that was created to sell movie tickets over the internet and represents a large majority of the top 50 market theatre screens throughout the United States and Canada. As a result of our association with MovieTickets.com, moviegoers can buy tickets to movies at any of our first-run theatres via the internet and print them at home.
3
We are currently testingIn fiscal 2010, we continued our installation of Digital 3D Cinema technology, with the installation of 33 digital cinema hardware and software3D systems in our theatres, including the installation of 3D systems at eight of our signatureUltraScreens that we have branded asUltraScreen XL3D. As of May 27, 2010, we offer digital 3D systems at 60 screens at 43 of our theatre locations in seven states. There are currently nearly 30 3D films scheduled for release during fiscal 2011, compared to 15 digital 3D films played in our theatres during fiscal 2010.
An anticipated broad roll-out of digital cinema into our theatres, as well as the rest of the industry, was delayed during fiscal 2010 due to the increased difficulties of proposed third-party implementers to obtain the necessary financing during the current economic climate. During the latter half of fiscal 2010, progress was made regarding financing and system pricing and an expected industry-wide roll-out is now expected to occur over the course of several years. We currently expect to expandbegin a broader roll-out of digital projection technology in our testingcircuit beginning in fiscal 2011. The actual costs that we may incur when such a roll-out begins are yet to be determined, but it is our expectation that the majority of the costs would be paid for by the film studios through the payment of virtual print fees to us or a selected digital cinema implementation partner. Our goals from digital cinema include digital 3D technology. Digital cinema may be able to deliverdelivering an improved film presentation to our customers, increase ourguests, increasing scheduling flexibility, and provide an opportunityas well as maximizing the opportunities for alternate programming in our auditoriums other than movies, but the reliability of the hardware and software and the potential costs associatedthat may be available with this new technology are yet to be determined. Upon completion of successful testing and the determination of a suitable financing methodology (all film studios have indicated that they will participate in the financing of the new technology implementation), we would anticipate a broader roll-out of digital cinema to our theatres in the future.technology.
We sell food and beverage concessions in all of our movie theatres. We believe that a wide variety of food and beverage items, properly merchandised, increases concession revenue per patron. Although popcorn and soda remain the traditional favorites with moviegoers, we continue to upgrade our available concessions by offering varied choices. For example, some of our theatres offer hot dogs, pizza, ice cream, pretzel bites, frozen yogurt, coffee, mineral water and juices. We have recentlyalso added self-serve soft drinks to many of our theatres. In recent years, we have added branded pizza (Zaffiro’s) and branded coffee, ice cream and chocolates – as well as an expanded concessionHot Zonethat serves pizza, hamburgers, wraps, sandwiches and other hot appetizers – to selected theatres. Certain of our theatres have also introducedTake Fivecocktail lounges and a multi-use “dinner-theatre” concept we have branded asCineDineSM, fully equipped for live performances, meetings, broadcast concerts and sporting events and regular screenings of first-run movies, with an attached kitchen from which we offer a full menu. Our new Marcus Midtown Cinema at Midtown Crossing in Omaha, Nebraska, offers our exclusiveCineDineSM in-theatre dining concept in all five auditoriums, featuresZaffiro’s pizza and also offers two sophisticated cocktail lounges, meeting and event space and a full catering service. Our newly remodeled North Shore Cinema in Mequon, Wisconsin now includes a cocktail lounge, aHot Zone and a separate full-serviceZaffiro’s Pizzeria and Bar. The initial response to our new food and beverage offerings at the Majesticthese theatres has been positive and we are currently exploring opportunitiescontinue to duplicate and/or expand onrefine these existing food and beverage strategiesopportunities so as to determine whether they may be profitably duplicated at several of our existing theatres.additional locations in the future.
We have a variety of ancillary revenue sources in our theatres, with the largest related to the sale of pre-show and lobby advertising.advertising (through our advertising provider, Screenvision). Additional ancillary revenues can come from corporate and group meeting sales, sponsorships, and alternate auditorium uses.uses and naming rights. In addition, we are a party to a digital network affiliate agreement with National CineMedia, LLC for the presentation of live and pre-recorded in-theatre events in 24 of our locations in multiple markets. The expanded programming, which has included live performances of the Metropolitan Opera, as well as sports, music and other events, has been well received by our customers and has the ability of providing revenue during our theatres’ slower periods. We continue to pursue additional strategies to increase our ancillary revenue sources.
We also own a family entertainment center,Funset Boulevard, adjacent to our 14-screen movie theatre in Appleton, Wisconsin.Funset Boulevard features a 40,000 square foot Hollywood-themed indoor amusement facility that includes a restaurant, party room, laser tag center, virtual reality games, arcade, outdoor miniature golf course and batting cages.
4
Hotels and Resorts Operations
Owned and Operated Hotels and Resorts
The Pfister Hotel
We own and operate the Pfister Hotel, which is located in downtown Milwaukee, Wisconsin. The Pfister Hotel is a full service luxury hotel and has 307 guest rooms (including 82 luxury suites and 176 tower rooms), threetwo restaurants, three cocktail lounges and a 275-car parking ramp. The Pfister also has 24,000 square feet of banquet and convention facilities. The Pfister’s banquet and meeting rooms accommodate up to 3,000 people and the hotel features two large ballrooms, including one of the largest ballrooms in the Milwaukee metropolitan area, with banquet seating for 1,200 people. A portion of the Pfister’s first-floor space is leased for use by retail tenants. In fiscal 2007,2010, the Pfister Hotel earned its 3134stth consecutive four-diamond award from the American Automobile Association. The Pfister is also a member of Preferred Hotels and Resorts Worldwide Association, an organization of independent luxury hotels and resorts, and the Association of Historic Hotels of America. We have addedThe hotel has a new signature restaurant to this hotel named the Mason Street Grill, (replacing an existing restaurant) and we recently addedas well as a newstate-of-the-art spa and salon. Renovations to guest rooms, meeting spaces and the parking garage are also planned at this hotel.
The Hilton Milwaukee City Center
We own and operate the 729-room Hilton Milwaukee City Center. Several aspects of Hilton’s franchise program have benefited this hotel, including Hilton’s international centralized reservation and marketing system, advertising cooperatives and frequent stay programs. The Hilton Milwaukee City Center also features Paradise Landing, an indoor water park and family fun center that features water slides, swimming pools, a sand beach, lounge and restaurant. The hotel also has two cocktail lounges, two restaurants and an 870-car parking ramp. We recently completed major renovations to this hotel’s guestrooms, corridors and main lobby.
4
Hilton Madison at Monona Terrace
We own and operate the 240-room Hilton Madison at Monona Terrace in Madison, Wisconsin. The Hilton Madison, which also benefits from the aspects of Hilton’s franchise program noted above, is connected by skywalk to the Monona Terrace Community and Convention Center, has four meeting rooms totaling 2,400 square feet, an indoor swimming pool, a fitness center, a lounge and a restaurant.
The Grand Geneva Resort & Spa
We own and operate the Grand Geneva Resort & Spa in Lake Geneva, Wisconsin, which is the largest convention resort in Wisconsin. This full-facility destination resort is located on 1,300 acres and includes 355 guest rooms, over 60,000 square feet of banquet, meeting and exhibit space, (including approximately 12,000 square feet added during the past year), over 13,000 square feet of ballroom space, three specialty restaurants, two cocktail lounges, two championship golf courses, several ski-hills,ski hills, two indoor and five outdoor tennis courts, three swimming pools, a spa and fitness complex, horse stables and an on-site airport. In fiscal 2007,2010, the Grand Geneva Resort & Spa earned its 9th12th consecutive four-diamond award from the American Automobile Association. We are currently reviewing plans for a guest room renovation andrecently completed a major renovation ofto this hotel’s exterior pool, WELL Spa, and guest rooms, including the outdoor pool complex.
Through fiscal 2006, we managed and sold units of a vacation ownership development, the Marcus Vacation Club, that is adjacent to the Grand Geneva Resort & Spa. The development includes 62 timeshare units and a timeshare sales center. In early fiscal 2007, we sold the remaining inventory in this development to Orange Lake Resort & Country Club of Orlando, Florida, but will continue to provide hospitality management services for the property, including check-in, housekeeping and maintenance.hotel’s luxury suites.
Hotel Phillips
We own and operate the Hotel Phillips, a 217-room hotel in Kansas City, Missouri. After purchasing and completely restoring this landmark hotel, we reopened it in September 2001. The Hotel Phillips has conference rooms totaling 5,600 square feet of meeting space, a 2,300 square foot ballroom, a restaurant and a lounge.
InterContinental Milwaukee
We own and operate the InterContinental Milwaukee in Milwaukee, Wisconsin. The InterContinental Milwaukee has 220 rooms, 12,000 square feet of flexible banquet and meeting space, on-site parking, a fitness center, a restaurant and a lounge and is located in the heart of Milwaukee’s theatre and financial district.
5
Skirvin Hilton
We are the principal equity partner and operator of the Skirvin Hilton hotel in Oklahoma City, Oklahoma, the oldest hotel in Oklahoma. This historic hotel has 225 rooms, including 20 one-bedroom suites and one Presidential Suite. The Skirvin Hilton benefits from the aspects of Hilton’s franchise program noted above and has a restaurant, lounge, fitness center, indoor swimming pool, business center and approximately 18,500 square feet of meeting space.
Four Points by Sheraton Chicago Downtown/Magnificent Mile
We own andPursuant to a long-term lease, we operate the Four Points by Sheraton Chicago Downtown/Magnificent Mile, a 226-room (including 130 suites) hotel in Chicago, Illinois. The Four Points by Sheraton Chicago Downtown/Magnificent Mile has affordable, well-appointed guest rooms and suites, 3,000 square feet of high-tech meeting rooms, an indoor swimming pool and fitness room and an on-site parking facility. The hotel leases space to onetwo area restaurant and plans to lease space to up to two additional area restaurants or retail outlets.restaurants.
InterContinental Milwaukee
We own and operate the InterContinental Milwaukee in Milwaukee, Wisconsin. Formerly the Wyndham Milwaukee Center, this hotel recently underwent a major renovation and rebranding to the upscale InterContinental brand. The InterContinental Milwaukee has 220 rooms, 12,000 square feet of flexible banquet and meeting space, on-site parking, a restaurant and two lounges and is located in the heart of Milwaukee’s theatre and financial district.
Skirvin Hilton
We are the principal equity partner and operator of the Skirvin Hilton hotel in Oklahoma City, Oklahoma, the oldest hotel in Oklahoma. This historic hotel has 225 rooms, including 20 one-bedroom suites and one Presidential Suite, and was renovated and reopened on February 26, 2007 by a public-private joint venture. The Skirvin Hilton will benefit from the aspects of Hilton’s franchise program noted above and has a restaurant, lounge, fitness center, indoor swimming pool, business center and approximately 18,500 square feet of meeting space.
5
Managed Hotels, Resorts and Other Properties
We also manage hotels, resorts and other properties for third parties, typically under long-term management agreements. Revenues from these management contracts may include both base management fees, often in the form of a fixed percentage of defined revenues, and incentive management fees, typically calculated based upon defined profit performance. We may also earn fees for technical and preopening services before a property opens, as well as for on-going accounting and technology services.
We manage the Crowne Plaza-Northstar Hotel in Minneapolis, Minnesota. The Crowne Plaza-Northstar Hotel is located in downtown Minneapolis and has 226 guest rooms, 13 meeting rooms, 6,370 square feet of ballroom and convention space, a restaurant, a cocktail lounge and an exercise facility.
We manage the Hotel Mead in Wisconsin Rapids, Wisconsin. The Hotel Mead has 157 guest rooms, ten meeting rooms totaling 14,000 square feet of meeting space, two cocktail lounges, two restaurants and an indoor pool with a sauna and whirlpool. The Hotel Mead is expected to be sold during fiscal 2008, at which point we would likely cease managing the hotel.
We manage Beverly Garland’s Holiday Inn in North Hollywood, California. The Beverly Garland has 257 guest rooms, including 12 suites, meeting space for up to 600, including an amphitheater and ballroom, an outdoor swimming pool and lighted tennis courts. The mission-style hotel is located on seven acres near Universal Studios.
We also provide hospitality management services, including check-in, housekeeping and maintenance, for a vacation ownership development adjacent to the Grand Geneva Resort & Spa owned by Orange Lake Resort & Country Club of Orlando, Florida. The development includes 62 timeshare units and a timeshare sales center.
We manage the Hilton Garden Inn Houston NW/Chateau in Houston, Texas. The Hilton Garden Inn has 171 guest rooms, a ballroom, a restaurant, a fitness center, a convenience mart and a swimming pool. The hotel is a part of Chateau Court, a 13-acre, European-style mixed-use development that also includes retail space and an office village.
We manage and own a 15% minority equity interest in the Sheraton Madison Hotel in Madison, Wisconsin. The Sheraton Madison features 237 rooms and suites, an indoor heated swimming pool, whirlpool, fitness center, a restaurant, lounge and 18,000 square feet of meeting space. It is adjacent to the Alliant Energy Center, which includes more than 150,000 square feet of exhibit space, and is located approximately 1.5 miles from the Monona Terrace Convention Center, the city’s convention center facility.
We manage and own a 15% minority equity interest in the Westin Columbus in Columbus, Ohio. The Westin Columbus is a AAA four-diamond full-service historic hotel that currently includes 186 rooms and suites and offers more than 12,000 square feet of meeting, banquet and ballroom space, a restaurant and a cocktail
6
lounge. The hotel is located in the heart of the downtown business district and is connected to the Southern Theatre, a historically restored performing arts theater. In fiscal 2009, a substantial renovation of the guest rooms and public space of this property was completed.
We manage Xona Resort Suites, a four-star destination resort in Scottsdale, Arizona, offering 431 suites, four swimming pools, three whirlpools, a fitness center, a 24-hour concierge and 7,600 square feet of meeting space. The resort recently completed a multi-million dollar renovation of its public space, restaurant and grounds.
We manage the Sheraton Clayton Plaza Hotel in St. Louis, Missouri, which offers 257 rooms and suites, an indoor swimming pool, a fitness facility, and a business center. A multi-million dollar renovation of the public space and guest rooms of the hotel was recently completed.
We manage the new Hilton Minneapolis/Bloomington in Bloomington, Minnesota. This “business class” hotel, which opened on January 26, 2008, offers 256 rooms, an indoor swimming pool, a club level, a fitness center, a business center and 9,100 square feet of meeting space.
We also manage two condominium-hotels under long-term management contracts. Revenues from these management contracts are larger than typical management contracts because, under an agreed-upon rental pool arrangement, room revenues are shared at a defined percentage with individual condominium owners. In addition, we own all of the common areas of these facilities, including any restaurants, lounges, spas and gift shops, and keep all of the revenues from these outlets.
We manage the Timber Ridge Lodge, an indoor/outdoor waterpark and condominium complex in Lake Geneva, Wisconsin. The Timber Ridge Lodge is a 225-unit condominium hotel on the same campus as our Grand Geneva Resort & Spa. The Timber Ridge Lodge has meeting rooms totaling 3,640 square feet, a general store, a restaurant-cafe, a snack bar and lounge, a state-of-the-art fitness center and an entertainment arcade.
We manage the Hilton Garden Inn Houston NW/Chateau in Houston, Texas. The Hilton Garden Inn has 171 guest rooms, a ballroom, a restaurant, a fitness center, a convenience mart and a swimming pool. The hotel is a part of Chateau Court, a 13-acre, European-style mixed-use development that also includes retail space and an office village.
We manage the Platinum Hotel & Spa, a condominium hotel in Las Vegas, Nevada just off the Las Vegas Strip. DevelopedStrip, and opened in October 2006 by a joint venture that we originally owned a 50% interest in, we now own 100% of the hotel’s public space (with all condominium units to be ultimately individually-owned). In addition to earning a management fee equal to a share of room revenue when any of thespace. The Platinum Hotel & Spa has 255 one and two-bedroom suites are rented, we have the opportunity to earn revenues from thesuites. This non-gaming, non-smoking hotel also has an on-site restaurant, lounge, spa and 8,440 square feet of meeting space at this non-gaming, non-smoking hotel.
In February 2007, we formed a joint venture to acquire the Sheraton Madison Hotel in Madison, Wisconsin.space. We own a 15% minority interest in16 previously unsold condominium units at the joint venturePlatinum and will manage the hotel and oversee a major renovation of the property. The hotel features 237 rooms and suites, an indoor heated swimming pool, whirlpool, fitness center and 18,000 square feet of meeting space. It is adjacent to the Alliant Energy Center, which boasts more than 150,000 square feet of exhibit space, and is located approximately 1.5 miles from the Monona Terrace Convention Center, the city’s convention center facility.
We manage the Westin Columbus in Columbus, Ohio. Formerly a company-owned hotel, in April 2007 we sold the Westin Columbus into a joint venture with Waterton Tactical Real Estate Fund I, a discretionaryanticipate selling these units when Las Vegas real estate fund sponsored by Chicago-based Waterton Commercial, LLC. We own a 15% minority interest in the joint venture and will continue to operate and manage the hotel. The Westin Columbus is a AAA four-diamond full-service historic hotel that currently includes 186 rooms and suites and offers more than 12,000 square feet of meeting, banquet and ballroom space, a restaurant and a cocktail lounge. The hotel is located in the heart of the downtown business district and is connected to the Southern Theatre, a historically restored performing arts theater. This property will undergo a substantial renovation during our fiscal 2008.market conditions improve.
6
In fiscal 2007, we also signed agreements to operate four additional properties for other owners. We now manage Brynwood Country Club in Milwaukee, Wisconsin. Brynwood has an 18-hole golf course, four tennis courts, a fitness center, swimming pool and banquet facilities. We also now manage Resort Suites, a four-star destination resort in Scottsdale, Arizona, offering 483 suites, four swimming pools, three whirlpools, a fitness center, a 24-hour concierge and 7,600 square feet of meeting space. Plans for renovations of and modifications to this property are under development. In February 2007, we signed an agreement to manage the Sheraton Clayton Plaza Hotel in St. Louis, Missouri, which offers 257 rooms and suites, an indoor swimming pool, a fitness facility, and a business center. The hotel will undergo a multi-million dollar renovation beginning later in 2007. Finally, we were selected to manage an under-construction Hilton Hotel in Bloomington, Minnesota. The hotel, scheduled to open in January of 2008, will offer 256 rooms, an indoor swimming pool, a club level, a fitness center, a business center and 9,100 square feet of meeting space.
Both of our businesses experience intense competition from national, regional and local chain and franchise operations, some of which have substantially greater financial and marketing resources than we have. Most of our facilities are located in close proximity to competing facilities.
Our movie theatres compete with large national movie theatre operators, such as AMC Entertainment, Cinemark, Regal Cinemas and Carmike Cinemas, as well as with a wide array of smaller first-run exhibitors. Movie exhibitors also generally compete with the home video, pay-per-view and cable television markets. We believe that such ancillary markets have assisted the growth of the movie theatre industry by encouraging the production of first-run movies released for initial movie theatre exhibition, which has historically established the demand for such movies in these ancillary markets.
Our hotels and resorts compete with the hotels and resorts operated by Hyatt Corporation, Marriott Corporation, Ramada Inns, Holiday Inns and others, along with other regional and local hotels and resorts.
We believe that the principal factors of competition in both of our businesses, in varying degrees, are the price and quality of the product, quality and location of our facilities and customer service. We believe that we are well positioned to compete on the basis of these factors.
7
Seasonality
Historically, our first fiscal quarter has produced the strongest operating results because this period coincides with the typical summer seasonality of the movie theatre industry and the summer strength of our lodging business. Our third fiscal quarter has historically produced the weakest operating results in our hotels and resorts division primarily due to the effects of reduced travel during the winter months. Our third fiscal quarter for our theatre division has historically been our second strongest quarter but is heavily dependent upon the quantity and quality of films released during the Thanksgiving to Christmas holiday period.
Environmental Regulation
We do not expect federal,Federal, state orand local environmental legislation to havehas not had a material effect on our capital expenditures, earnings or competitive position. However, our activities in acquiring and selling real estate for business development purposes have been complicated by the continued emphasis that our personnel must place on properly analyzing real estate sites for potential environmental problems. This circumstance has resulted in, and is expected to continue to result in, greater time and increased costs involved in acquiring and selling properties associated with our various businesses.
7
As of the end of fiscal 2007,2010, we had approximately 6,8006,200 employees, approximately one-half44% of whom were employed on a part-time basis. A number of our (1) hotel employeesprojectionists in Milwaukee, Wisconsin are covered by a collective bargaining agreement that expired on May 30, 2007 and are operating under the terms of the old agreement on a day-to-day basis; (2) projectionists at the Crowne Plaza Northstar in Minneapolis, MinnesotaChicago locations are covered by a collective bargaining agreement that expires on April 30, 2010; (2) operating engineers in the Hilton Milwaukee City Center and Pfister Hotel are covered by collective bargaining agreements that expired on December 31, 2006 and April 30, 2007, respectively, and have been extended on a day-to-day basis during on-going negotiations;July 7, 2011; (3) a number of our hotel employees inat the Hilton Milwaukee City Center and the Pfister Hotel are covered by a collective bargaining agreement that expires on February 14, 2013; (4) operating engineers at the Sheraton Clayton Plaza Hotel are covered by a collective bargaining agreement that expires on November 30, 2010; (5) hotel employees at the Sheraton Clayton Plaza Hotel are covered by a collective bargaining agreement that expires on December 14, 2010; (6) operating engineers at the Hilton Milwaukee City Center and Pfister Hotel are covered by collective bargaining agreements that expire on December 31, 2010 and April 30, 2011, respectively; (7) hotel employees at the Crowne Plaza Northstar in Minneapolis, Minnesota are covered by a collective bargaining agreement that expired on June 15, 2009; (4)30, 2010 and are operating under the terms of the old agreement on a day-to-day basis; (8) painters at the Sheraton Clayton Plaza Hotel are covered by a collective bargaining agreement that expires on August 31, 2010; (9) projectionists in Omaha, Nebraska are covered by a collective bargaining agreement that expires on March 31, 2011; (10) projectionists in Madison, Wisconsin are covered by a collective bargaining agreement that expires on April 5, 2012; and (11) painters in the Hilton Milwaukee City Center and the Pfister Hotel are covered by a collective bargaining agreement that expires on May 31, 2008; (5) projectionists at a Chicago, Illinois theatre that we manage for a third party2013.
As of the end of fiscal 2010, approximately 11% of our employees are covered by a collective bargaining agreement, that expires on October 20, 2008; (6) projectionists at other Chicago locationsof which 2% are covered by a collective bargainingan agreement that expires on December 31, 2008; (7) projectionists in Madison, Wisconsin are covered by a collective bargaining agreement that expires on April 2, 2008; (8) projectionists in Milwaukee, Wisconsin are covered by a collective bargaining agreement that expires on May 30, 2008; (9) a number of hotel employees at the Sheraton Clayton Plaza Hotel that we manage for a third party are covered by a collective bargaining agreement that expires on December 14, 2009; (10) operating engineers at the Sheraton Clayton Plaza Hotel are covered by a collective bargaining agreement that expires on November 30, 2009; and (11) painters at the Sheraton Clayton Plaza Hotel are covered by a collective bargaining agreement that expires on August 31, 2010.will expire within one year.
Web Site Information and Other Access to Corporate Documents
Our corporate web site is www.marcuscorp.com. All of our Form 10-Ks, Form 10-Qs and Form 8-Ks, and amendments thereto, are available on this web site as soon as practicable after they have been filed with the SEC. We are not including the information contained on our website as part of, or incorporating it by reference into, this Annual Report. In addition, our corporate governance guidelines and the charters for our Audit Committee, Compensation Committee and Corporate Governance and Nominating Committee are available on our web site. If you would like us to mail you a copy of our corporate governance guidelines or a committee charter, please contact Thomas F. Kissinger, Vice President, General Counsel and Secretary, The Marcus Corporation, 100 East Wisconsin Avenue, Suite 1900, Milwaukee, Wisconsin 53202-4125.
8
Item 1A. Risk Factors.
The following risk factors and other information included in this Annual Report on Form 10-K should be carefully considered. The risks and uncertainties described below are not the only ones we face. Additional risks and uncertainties not presently known to us or that we currently deem immaterial also may impair our business operations. If any of the following risks occur, our business, financial condition, operating results, and cash flows could be materially adversely affected.
The Lack of Both the Quantity and Audience Appeal of Motion Pictures May Adversely Affect Our Financial Results.
The financial results of our movie theatre business and the motion picture industry in general are heavily dependent on the general audience appeal of available films, together with studio marketing, advertising and support campaigns, factors over which we have no control. The relative success of our movie theatre business will continue to be largely dependent upon the quantity and audience appeal of films made available by the movie studios and other producers. Poor performance of films, a disruption in the production of films due to events such as a strike by actors, writers or directors, or a reduction in the marketing efforts of the film distributors to promote their films could have an adverse impact on our business and results of operations. Also, our quarterly results of operations are significantly dependent on the quantity and audience appeal of films that we exhibit during each quarter. As a result, our quarterly results may be unpredictable and somewhat volatile.
8A Deterioration in Relationships with Film Distributors Could Adversely Affect Our Ability to Obtain Commercially Successful Films.
We rely on the film distributors for the motion pictures shown in our theatres. Our business depends to a significant degree on maintaining good relationships with these distributors. Deterioration in our relationships with any of the major film distributors could adversely affect our access to commercially successful films and adversely affect our business and results of operations. Because the distribution of motion pictures is in large part regulated by federal and state antitrust laws and has been the subject of numerous antitrust cases, we cannot ensure a supply of motion pictures by entering into long-term arrangements with major distributors. Rather, we must compete for licenses on a film-by-film and theatre-by-theatre basis and are required to negotiate licenses for each film and for each theatre individually.
Our Financial Results May be Adversely Impacted by Unique Factors Affecting the Theatre Exhibition Industry, Such as the Shrinking Video Release Window, the Increasing Piracy of Feature Films and the Increasing Use of Alternative Film Distribution Channels and Other Competing Forms of Entertainment.
Over the last decade, the average video release window, which represents the time that elapses from the date of a film’s theatrical release to the date a film is available on video or DVD, has decreased from approximately six months to less than four and one-half months. Some studios have recently expressed a desire to have a shorter window for a select number of films that might be released during traditionally slower seasons of the year. There have also been discussions recently regarding the possibility of a new shorter premium-priced video on-demand window. We cannot assure you that this release window, which is determined by the film studios, will not shrink further, which could have an adverse impact on our movie theatre business and results of operations.
Piracy of motion pictures is prevalent in many parts of the world. Technological advances allowing the unauthorized dissemination of motion pictures increase the threat of piracy by making it easier to create, transmit and distribute high quality unauthorized copies of such motion pictures. The proliferation of unauthorized copies and piracy of motion pictures may have an adverse effect on our movie theatre business and results of operations.
We face competition for movie theatre patrons from a number of alternative motion picture distribution channels, such as DVD, network, cable and satellite television, video on-demand, pay-per-view television and downloading utilizing the internet. We also compete with other forms of entertainment competing for our
9
patrons’ leisure time and disposable income such as concerts, amusement parks, sporting events, home entertainment systems, video games and portable entertainment devices such as the iPod®iPod®. An increase in popularity of these alternative film distribution channels and competing forms of entertainment may have an adverse effect on our movie theatre business and results of operations.
Industry-wide Conversion to Digital Cinema May Increase Our Costs.
The theatre industry is in the process of conversion from film-based media to digital-based media. There are a variety of constituencies associated with this anticipated change that may significantly impact industry participants, including content providers, distributors, equipment providers and exhibitors. While content providers and distributors have indicated they would bear substantially all of the costs of this change, there can be no assurance that we will have access to adequate capital to finance the conversion costs associated with this potential change, nor can there be any assurance that we will not see an increase in related operating costs of the new media that would adversely affect our results of operations. There is also a risk that if we, or other exhibitors, do not proceed with a conversion to digital cinema on a timely basis, the film distributors could reduce the amount they are willing to contribute towards the conversion costs in the future or, less likely, choose to not provide film product at some point.
The Relative Industry Supply of Available Rooms at Comparable Lodging Facilities May Adversely Affect Our Financial Results.
Historically, a material increase in the supply of new hotel rooms in a market can destabilize that market and cause existing hotels to experience decreasing occupancy, room rates and profitability. If such over-supply occurs in one or more of our major markets, we may experience an adverse effect on our hotels and resorts business and results of operations.
If the Amount of Sales Made Through Third-Party Internet Travel Intermediaries Increases Significantly, Consumer Loyalty to Our Hotels Could Decrease and Our Revenues Could Fall.
We expect to derive most of our business from traditional channels of distribution. However, consumers now use internet travel intermediaries regularly. Some of these intermediaries are attempting to increase the importance of price and general indicators of quality (such as “four-star downtown hotel”) at the expense of brand/hotel identification. These agencies hope that consumers will eventually develop brand loyalties to their reservation system rather than to our hotels. If the amount of sales made through internet travel intermediaries increases significantly and consumers develop stronger loyalties to these intermediaries rather than to our hotels, we may experience an adverse effect on our hotels and resorts business and results of operations.
Our Businesses are Heavily Capital Intensive and Preopening and Start-Up Costs and Increasing Depreciation Expenses May Adversely Affect Our Financial Results.
Both our movie theatre and hotels and resorts businesses are heavily capital intensive. Purchasing properties and buildings, constructing buildings, renovating and remodeling buildings and investing in joint venture projects all require substantial upfront cash investments before these properties, facilities and joint ventures can generate sufficient revenues to pay for the upfront costs and positively contribute to our profitability. In addition, many growth opportunities, particularly for our hotels and resorts division, require lengthy development periods during which significant capital is committed and preopening costs and early start-up losses are incurred. We expense these preopening and start-up costs currently. As a result, our results of operations may be adversely affected by our significant levels of capital investments. Additionally, to the extent we capitalize our capital expenditures, our depreciation expenses may increase, thereby adversely affecting our results of operations.
Adverse Economic Conditions in Our Markets May Adversely Affect Our Financial Results.
Downturns or adverse economic conditions affecting the United States economy generally, and particularly downturns or adverse economic conditions in the Midwest and in our other markets, adversely affect our results
10
of operations, particularly with respect to our hotels and resorts division. Poor economic conditions can significantly adversely affect the business and group travel customers, which are the largest customer segments for our hotels and resorts division. Specific economic conditions that may directly impact travel, including financial instability of air carriers and increases in gas and other fuel prices, may adversely affect our results of operations. Additionally, although our theatre business has historically performed well during economic downturns as consumers seek less expensive forms of out-of-home entertainment, a significant reduction in consumer confidence or disposable income in general may temporarily affect the demand for motion pictures or severely impact the motion picture production industry, which, in turn, may adversely affect our results of operations.
9Adverse Economic Conditions, Including Disruptions in the Financial Markets, May Adversely Affect Our Ability to Obtain Financing on Reasonable and Acceptable Terms, if at All, and Impact Our Ability to Achieve Certain of Our Growth Objectives.
We expect that we will require additional financing over time, the amount of which will depend upon a number of factors, including the number of theatres and hotels and resorts we acquire and/or develop, the amount of capital required to refurbish and improve existing properties, the amount of existing indebtedness that requires repayment in a given year and the cash flow generated by our businesses. Downturns or adverse economic conditions affecting the United States economy generally, and the United States stock and credit markets specifically, may adversely impact our ability to obtain additional short-term and long-term financing on reasonable terms or at all, which would negatively impact our liquidity and financial condition. As a result, a prolonged downturn in the stock or credit markets would also limit our ability to achieve our growth objectives.
Adverse Weather Conditions, Particularly During the Winter in the Midwest and in Our Other Markets, May Adversely Affect Our Financial Results.
Poor weather conditions adversely affect business and leisure travel plans, which directly impacts our hotels and resorts division. In addition, theatre attendance on any given day may be negatively impacted by adverse weather conditions. In particular, adverse weather during peak movie-going weekends or holiday time periods may negatively affect our results of operations. Adverse winter weather conditions may also increase our snow removal and other maintenance costs in both of our divisions.
Each of Our Business Segments and Properties Experience Ongoing Intense Competition.
In each of our businesses we experience intense competition from national, regional and local chain and franchise operations, some of which have substantially greater financial and marketing resources than we have. Most of our facilities are located in close proximity to other facilities which compete directly with ours. The motion picture exhibition industry is fragmented and highly competitive with no significant barriers to entry. Theatres operated by national and regional circuits and by small independent exhibitors compete with our theatres, particularly with respect to film licensing, attracting patrons and developing new theatre sites. Moviegoers are generally not brand conscious and usually choose a theatre based on its location, the films showing there and its amenities. With respect to our hotels and resorts division, our ability to remain competitive and to attract and retain business and leisure travelers depends on our success in distinguishing the quality, value and efficiency of our lodging products and services from those offered by others. If we are unable to compete successfully in either of our divisions, this could adversely affect our results of operations.
Our Ability to Identify Suitable Properties to Acquire, Develop and Manage Will Directly Impact Our Ability to Achieve Certain of Our Growth Objectives.
A portion of our ability to successfully achieve our growth objectives in both our theatre and hotels and resorts divisions is dependent upon our ability to successfully identify suitable properties to acquire, develop and manage. Failure to successfully identify, acquire and develop suitable and successful locations for new lodging properties and theatres will substantially limit our ability to achieve these important growth objectives.
11
Investing Through Partnerships or Joint Ventures Decreases Our Ability to Manage Risk.
In addition to acquiring or developing hotels and resorts or entering into management contracts to operate hotels and resorts for other owners, we have from time to time invested, and expect to continue to invest, as a joint venturer. Joint venturers may have shared control or disproportionate control over the operation of the joint venture assets. Therefore, joint venture investments may involve risks such as the possibility that the co-venturer in an investment might become bankrupt or not have the financial resources to meet its obligations, or have economic or business interests or goals that are inconsistent with our business interests or goals, or be in a position to take action contrary to our instructions or requests or contrary to our policies or objectives. Consequently, actions by a co-venturer might subject hotels and resorts owned by the joint venture to additional risk. Further, we may be unable to take action without the approval of our joint venture partners. Alternatively, our joint venture partners could take actions binding on the joint venture without our consent.
Our Properties are Subject to Risks Relating to Acts of God, Terrorist Activity and War and Any Such Event May Adversely Affect our Financial Results.
Acts of God, natural disasters, war (including the potential for war), terrorist activity (including threats of terrorist activity), epidemics (such as SARs, bird flu and birdswine flu), travel-related accidents, as well as political unrest and other forms of civil strife and geopolitical uncertainty may adversely affect the lodging and movie exhibition industries and our results of operations. Terrorism incidents, such as the events of September 11, 2001, and wars, such as the Iraq war, significantly impact business and leisure travel and consequently demand for hotel rooms. In addition, inadequate preparedness, contingency planning, insurance coverage or recovery capability in relation to a major incident or crisis may prevent operational continuity and consequently impact the reputation of our businesses.
10
Historically, our first fiscal quarter has produced our strongest operating results because this period coincides with the typically strong summer performance of the movie theatre industry and the summer strength of our lodging business. Our third fiscal quarter has historically produced our weakest operating results in our hotels and resorts division, primarily due to the affects of reduced travel during the winter months. Our third fiscal quarter for our theatre division has historically been our second strongest quarter but is heavily dependent upon the quantity and quality of films released during the Thanksgiving to Christmas holiday period.
Item 1B. Unresolved Staff Comments.
None.
None.
12
Item 2. Properties.
We own the real estate of a substantial portion of our facilities, including, as of May 31, 2007,27, 2010, the Pfister Hotel, the Hilton Milwaukee City Center, the Hilton Madison at Monona Terrace, the Grand Geneva Resort & Spa, the Hotel Phillips, the InterContinental Milwaukee, the Skirvin Hilton and the majority of our theatres. We lease the remainder of our facilities. As of May 31, 2007,27, 2010, we also managed twelvetwo hotels for joint ventures in which we have an interest and nine hotels, resorts and other properties and two theatres that are owned by third parties. Additionally, we own properties acquired for the future construction and operation of new facilities.facilities and we have an interest in a joint venture hotel managed by a third party. All of our properties are suitably maintained and adequately utilized to cover the respective business segment served.
Our owned, leased and managed properties are summarized, as of May 31, 2007,27, 2010, in the following table:
| Business Segment | Total Number of Facilities in Operation | Owned(1) | Leased from Unrelated Parties(2) | Managed for Related Parties | Managed for Unrelated Parties(2) |
|---|---|---|---|---|---|
| Theatres: | |||||
| Movie Theatres | 50 | 40 | 8 | 0 | 2 |
| Family Entertainment Center | 1 | 1 | 0 | 0 | 0 |
| Hotels and Resorts: | |||||
| Hotels | 16 | 6 | 1 | 2 | 7 |
| Resorts | 2 | 1 | 0 | 0 | 1 |
| Other Properties | 2 | 0 | 0 | 0 | 2 |
| Limited-Service Lodging: | |||||
| Baymont Inns & Suites | 2 | 0 | 0 | 2 | 0 |
| Total | 73 | 48 | 9 | 4 | 12 |
| Business Segment | Total Number of Facilities in Operation | Owned(1) | Leased Parties(2) | Managed Parties | Managed Parties(2) | |||||
Theatres: | ||||||||||
Movie Theatres | 54 | 44 | 8 | 0 | 2 | |||||
Family Entertainment Center | 1 | 1 | 0 | 0 | 0 | |||||
Hotels and Resorts: | ||||||||||
Hotels | 16 | 6 | 1 | 2 | 7 | |||||
Resorts | 2 | 1 | 0 | 0 | 1 | |||||
Other Properties | 1 | 0 | 0 | 0 | 1 | |||||
Total | 74 | 52 | 9 | 2 | 11 | |||||
| (1) |
| (2) | The eight theatres leased from unrelated parties have |
Certain of the above individual properties or facilities are subject to purchase money or construction mortgages or commercial lease financing arrangements, but we do not consider these encumbrances, individually or in the aggregate, to be material.
Over 90%All of our operating property leases expire on various dates after the end of fiscal 20082011 (assuming we exercise all of our renewal and extension options).
11Item 3. Legal Proceedings.
We do not believe that any pending legal proceedings involving us are material toGoodman, et al. v. Platinum Condominium Development, LLC, Case No. 09-CV-957 (D. Nev.). As reported in our business. No legal proceeding required to be disclosed under this itemQuarterly Report on Form 10-Q for the period ended February 25, 2010, on December 5, 2008, a class action complaint was terminated duringfiled in the fourth quarterEighth Judicial District Court of fiscal 2007.
No matters were submitted to a voteNevada for Clark County against Platinum Condominium Development, LLC (“Platinum LLC”), one of our shareholders duringsubsidiaries. On April 30, 2009, Platinum LLC was served with a summons and a copy of an amended complaint. The amended complaint also named another one of our subsidiaries, Marcus Management Las Vegas, LLC (“Marcus Management LV”), as a defendant. Subsequently, Platinum LLC and Marcus Management LV removed the fourth quartercase to the United States District Court for the District of fiscal 2007.Nevada, where it is currently pending. The amended complaint in Goodman seeks an unspecified amount of damages and alleges violations of federal and Nevada law, and that Platinum LLC and Marcus Management LV made various representations in connection with the Platinum Hotel & Spa development in Las Vegas, Nevada. On June 29, 2009, both Platinum LLC and Marcus Management LV moved to dismiss the amended complaint in its entirety. On March 29, 2010, the District of Nevada granted in part and denied in part the motion to dismiss, and dismissed most of the claims against Platinum LLC and Marcus Management LV without prejudice. On April 28, 2010, Goodman filed a second amended complaint, which Platinum LLC and Marcus Management LV have answered, in part, and moved to dismiss, in part. The parties are currently briefing the motion to dismiss.
13
Baroi, et al. v. Platinum Condominium Development, LLC, Case No. 09-CV-671 (D. Nev.) andBenson, et al. v. Platinum Condominium Development, LLC,et al., Case No. 09-CV-1301 (D. Nev.). As we reported in our Quarterly Report on Form 10-Q for the period ended February 25, 2010, on March 27, 2009, another complaint was filed in the Eighth Judicial District Court of Nevada for Clark County against Platinum LLC, which Platinum LLC subsequently removed to the United States District Court for the District of Nevada. On May 29, 2009, plaintiffs in Baroi amended their complaint and named Marcus Management LV, as well as two of our other subsidiaries, Marcus Development, LLC (“Marcus Development”) and Marcus Hotels, Inc. (“Marcus Hotels”), as additional defendants. On July 2, 2009, Marcus Management LV, Marcus Development, and Marcus Hotels moved to dismiss the amended complaint. That motion was granted, without prejudice, and with leave to amend.
In addition, as we reported in our Quarterly Report on Form 10-Q for the period ended February 25, 2010, on July 17, 2009, the Benson action was filed in the United States District Court for the District of Nevada, and the complaint made allegations similar to those of the Baroi action. The Benson action also named Platinum LLC, Marcus Management LV, Marcus Development and Marcus Hotels as defendants.
Subsequent to the District of Nevada’s order in Baroi granting the motion to dismiss of Marcus Management LV, Marcus Development, and Marcus Hotels, the plaintiffs in Baroi and Benson agreed to consolidate the two actions. On January 25, 2010, the plaintiffs filed a consolidated amended complaint against Platinum LLC, Marcus Management LV, and Marcus Hotels. Plaintiffs did not name Marcus Development as a defendant. The consolidated amended complaint seeks declaratory relief and an unspecified amount of damages, and alleges violations of Nevada law and that the defendants made various representations in connection with the Platinum Hotel & Spa development in Las Vegas, Nevada. On March 16, 2010, the defendants responded to the consolidated amended complaint. Marcus Management LV answered the consolidated amended complaint, and Platinum LLC answered it in part and moved to dismiss it in part. Marcus Hotels moved to dismiss the complaint in its entirety. The defendants’ motions to dismiss are currently pending before the District of Nevada.
Platinum LLC, Marcus Management LV, and Marcus Hotels believe the allegations against all of the defendants in these lawsuits are without merit and they intend to vigorously defend against them. Since these matters are in the preliminary stages, we are unable to predict the scope or outcome or quantify their eventual impact, if any, on us. At this time, we are also unable to estimate associated expenses or possible losses.
Item 4. Reserved.
14
EXECUTIVE OFFICERS OF COMPANY
Each of our executive officers is identified below together with information about each officer’s age, position and employment history for at least the past five years:
| Name | Position | Age | ||||
Stephen H. Marcus | Chairman of the Board | 75 | ||||
Gregory S. Marcus | President and Chief Executive Officer | 45 | ||||
Bruce J. Olson | Senior Vice President and President of Marcus Theatres Corporation | 60 | ||||
Thomas F. Kissinger | Vice President, General Counsel and Secretary | 50 | ||||
Douglas A. Neis | Chief Financial Officer and Treasurer | 51 | ||||
William J. Otto | President and Chief Operating Officer of Marcus Hotels, Inc. | |||||
Stephen H. Marcus has been our Chairman of the Board since December 1991 and1991. He served as our President and Chief Executive Officer sincefrom December 1988.1988 to January 2009 and as our President from December 1988 until January 2008. Mr. Marcus has worked at the Companyour company for 4547 years.
Gregory S. Marcus joined our company in March 1992 as Director of Property Management/Corporate Development. He was promoted in 1999 to our Senior Vice President – Corporate Development and became an executive officer in July 2005. He has served as our President since January 2008 and was elected our Chief Executive Officer in January 2009. He was elected to serve on our Board of Directors in October 2005. He is the son of Stephen H. Marcus, our Chairman of the Board.
Bruce J. Olson joined the Companyour company in 1974. Mr. Olson served as the Executive Vice President and Chief Operating Officer of Marcus Theatres Corporation from August 1978 until October 1988, at which time he was appointed President of that corporation.subsidiary. Mr. Olson also served as our Vice President-Administration and Planning from September 1987 until July 1991. In July 1991, he was appointed as our Group Vice President and in October 2004, he was promoted to Senior Vice President. He was elected to serve on our Board of Directors in April 1996.
Thomas F. Kissinger joined the Companyour company in August 1993 as our Secretary and Director of Legal Affairs. In August 1995, he was promoted to our General Counsel and Secretary and in October 2004, he was promoted to Vice President, General Counsel and Secretary. Prior to August 1993, Mr. Kissinger was associated with the law firm of Foley & Lardner LLP for five years.
Douglas A. Neis joined the Companyour company in February 1986 as Controller of the Marcus Theatres division and in November 1987, he was promoted to Controller of Marcus Restaurants. In July 1991, Mr. Neis was appointed Vice President of Planning and Administration for Marcus Restaurants. In September 1994, Mr. Neis was also named as our Director of Technology and in September 1995 he was elected as our Corporate Controller. In September 1996, Mr. Neis was promoted to our Chief Financial Officer and Treasurer.
William J. Otto joined the Companyour company in 1993 as the Senior Vice President of Operations of Marcus Hotels, Inc. In 1996, Mr. Otto was promoted to Senior Vice President and Chief Operating Officer of Marcus Hotels, Inc. and in April 2001 he was further promoted to President and Chief Operating Officer of Marcus Hotels, Inc.
Gregory S. Marcus joined the Company in March 1992 as Director of Property Management/Corporate Development. He was promoted in 1999 to Senior Vice President – Corporate Development and became an executive officer of the Company in July 2005. He was elected to serve on our Board of Directors in October 2005.
12
Our executive officers are generally elected annually by theour Board of Directors after the annual meeting of shareholders. Each executive officer holds office until his successor has been duly qualified and elected or until his earlier death, resignation or removal.
15
PART II
| Item 5. | Market for the Company’s Common Equity, Related Shareholder Matters and Issuer Repurchases of Equity Securities. |
(a) Stock Performance Graph
The following information under the caption “Stock Performance Graph” in this Item 5 of this Annual Report on Form 10-K is not deemed to be “soliciting material” or to be “filed”” with the SEC or subject to Regulation 14A or 14C under the Securities Exchange Act of 1934 or to the liabilities of Section 18 of the Securities and Exchange Act of 1934 and will not be deemed to be incorporated by reference into any filing under the Securities Act of 1933 or the Securities Exchange Act of 1934, except to the extent we specifically incorporate it by reference into such a filing.
Set forth below is a graph comparing the annual percentage change during our last five fiscal years in our cumulative total shareholder return (stock price appreciation on a dividend reinvested basis) of our Common Shares compared to: (1)to the cumulative total return ofof: (1) a composite peer group index selected by us and (2) companies included in the Russell 2000 Index. The composite peer group index is comprised of a hotels and resorts index we selected that includes Choicethe Dow Jones U.S. Hotels International, Inc., Four Seasons Hotels Inc., John Q. Hammons Hotels Inc., Lodgian Inc., Orient Express Hotels, Ltd., Sonesta International Hotels Corp. and Red Lions Corporation (formerly WestCoast Hospitality Corp.)Index (weighted 50%) and a theatre index we selected that includes Regal Cinemas and Carmike Cinemas (weighted 50%). Loews Cineplex Entertainment Corp., which was previously included in our peer group for the theatre index, was acquired by a private company and no longer has a class of stock that is publicly traded. As a result, Loews Cineplex is no longer included in our peer group for the theatre index. Additionally, John Q. Hammons, which was taken private, is reflected only through September 18, 2005.
The indices within the composite peer group index are weighted to approximate the relative annual revenue contributions of each of our continuing business segments to our total annual revenues in ourover the past several fiscal 2007.years. The shareholder returns of the companies included in the hotels and resorts index and theatre index are weighted based on each company’s relative market capitalization as of the beginning of the presented periods.
Source: FactSet Data Systems, Inc.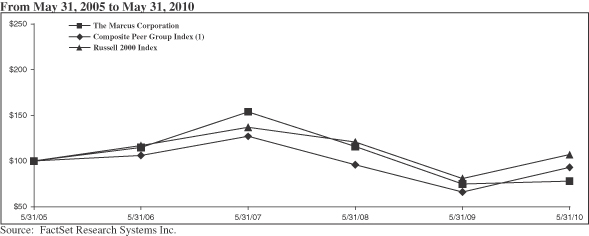
13
| 5/31/02 | 5/31/03 | 5/31/04 | 5/31/05 | 5/31/06 | 5/31/07 | |
|---|---|---|---|---|---|---|
| The Marcus Corporation | $100 | $97 | $115 | $158 | $181 | $244 |
| Composite Peer Group Index(1) | 100 | 90 | 126 | 168 | 192 | 236 |
| Russell 2000 Index | 100 | 90 | 117 | 127 | 148 | 174 |
| 5/31/05 | 5/31/06 | 5/31/07 | 5/31/08 | 5/31/09 | 5/31/10 | |||||||||||||
The Marcus Corporation | $ | 100 | $ | 115 | $ | 154 | $ | 116 | $ | 75 | $ | 78 | ||||||
Composite Peer Group Index(1) | 100 | 106 | 127 | 96 | 66 | 93 | ||||||||||||
Russell 2000 Index | 100 | 117 | 137 | 121 | 81 | 107 | ||||||||||||
| (1) | Equal Weighted 50.0% for the |
16
(b) Market Information
Our Common Stock, $1 par value, is listed and traded on the New York Stock Exchange under the ticker symbol “MCS.” Our Class B Common Stock, $1 par value, is neither listed nor traded on any exchange. During the first and second quarterseach quarter of fiscal 2006, we paid a dividend of $0.055 per share of our Common Stock2009 and $0.05 per share of our Class B Common Stock. During the third and fourth quarters of fiscal 2006, and the first and second quarters of fiscal 2007, we paid a dividend of $0.075 per share of our Common Stock and $0.06818 per share of our Class B Common Stock. During the third and fourth quarters of fiscal 2007,2010, we paid a dividend of $0.085 per share ofon our Common Stock and $0.07727 per share ofon our Class B Common Stock. The following table lists the high and low sale prices of our Common Stock for the periods indicated.indicated (NYSE trading information only).
| Fiscal 2007 | 1st Quarter | 2nd Quarter | 3rd Quarter | 4th Quarter |
|---|---|---|---|---|
| High | $21.68 | $26.10 | $26.31 | $24.17 |
| Low | $17.15 | $19.30 | $22.52 | $20.18 |
Fiscal 2006 | 1st Quarter | 2nd Quarter | 3rd Quarter | 4th Quarter |
| High | $15.73 | $18.34 | $18.95 | $19.99 |
| Low | $12.18 | $11.35 | $14.05 | $15.20 |
| Fiscal 2010 | 1st Quarter | 2nd Quarter | 3rd Quarter | 4th Quarter | ||||||||
High | $ | 14.35 | $ | 14.25 | $ | 13.50 | $ | 14.00 | ||||
Low | $ | 9.54 | $ | 11.14 | $ | 10.04 | $ | 10.03 | ||||
| Fiscal 2009 | 1st Quarter | 2nd Quarter | 3rd Quarter | 4th Quarter | ||||||||
High | $ | 19.51 | $ | 20.00 | $ | 16.78 | $ | 13.57 | ||||
Low | $ | 13.07 | $ | 8.92 | $ | 7.37 | $ | 6.45 | ||||
On August 6, 2007,5, 2010, there were 2,1851,653 shareholders of record of our Common Stock and 5145 shareholders of record of our Class B Common Stock.
(c) Stock Repurchases
As of May 31, 2007,27, 2010, our Board of Directors had authorized the repurchase of up to 4.76.7 million shares of our outstanding Common Stock. Pursuant to this board authorization,Under these authorizations, we may repurchase shares of our Common Stock from time to time in the open market, pursuant to privately negotiated transactions or otherwise. The repurchased shares are held in our treasury pending potential future issuance in connection with employee benefit, option or stock ownership plans or other general corporate purposes. Pursuant to this board authorization,Under these authorizations, we have repurchased approximately 3.64.5 million shares of Common Stock as of May 31, 2007. This board authorization does27, 2010. These authorizations do not have an expiration date.
The following table sets forth information with respect to purchases made by us or on our behalf of our Common Stock during the periods indicated. All of these repurchases were made in the open market and pursuant to the publicly announced repurchase authorization described above.
| Period | Total Number of Shares Purchased | Average Price Paid per Share | Total Number of Shares Purchased as Part of Publicly Announced Programs | Maximum Number of Shares that May Yet be Purchased Under the Plans or Programs |
|---|---|---|---|---|
| February 23 - March 22 | -- | -- | -- | 1,307,357 |
| March 23 - April 22 | 35,900 | $21.87 | 35,900 | 1,271,457 |
| April 23 - May 31 | 124,031 | 21.95 | 124,031 | 1,147,426 |
| Total | 159,931 | $21.94 | 159,931 | 1,147,426 |
14
| Period | Total Number of Shares Purchased | Average Price Paid per Share | Total Number of Shares Purchased as Part of Publicly Announced Programs | Maximum Number of Shares that May Yet be Purchased Under the Plans or Programs | |||||
February 26 – March 27 | — | $ | — | — | 2,273,155 | ||||
March 28 – April 27 | 405 | $ | 13.60 | 405 | 2,272,750 | ||||
April 28 – May 27 | 43,654 | $ | 10.80 | 43,654 | 2,229,096 | ||||
Total | 44,059 | $ | 10.83 | 44,059 | 2,229,096 | ||||
17
Item 6. Selected Financial Data.
Five-Year Financial Summary2007 2006 2005 2004 2003 Operating Results (in thousands) Revenues(1) $ 327,631 289,244 267,058 269,221 255,414 Earnings from continuing operations(1) $ 33,927 22,468 19,578 18,562 14,851 Net earnings $ 33,297 28,271 99,221 24,611 20,556 Common Stock Data(2) Earnings per common share - continuing operations(1) $ 1.10 .73 .64 .62 .50 Net earnings per common share $ 1.08 .91 3.25 .82 .70 Cash dividends per common share(3) $ .32 7.26 .22 .22 .22 Weighted average shares outstanding (in thousands) 30,807 30,939 30,526 29,850 29,549 Book value per share $ 10.51 9.87 16.27 13.20 12.54 Financial Position (in thousands) Total assets $ 698,383 587,234 787,499 749,811 755,457 Long-term debt(4) $ 199,425 123,110 170,888 207,282 203,307 Shareholders’ equity $ 319,509 301,323 493,661 393,723 369,900 Capital expenditures and acquisitions $ 186,752 75,532 63,431 50,915 26,004 Financial Ratios Current ratio(4) .47 .73 4.18 2.96 .40 Debt/capitalization ratio(4) .45 .37 .28 .37 .43 Return on average shareholders’ equity 10.7 % 7.1 % 22.4 % 6.4 % 5.7 %
| F2010 | F2009 | F2008 | F2007 | F2006 | ||||||||||||
Operating Results (in thousands) | ||||||||||||||||
Revenues(1) | $ | 379,069 | 383,496 | 371,075 | 327,631 | 289,244 | ||||||||||
Earnings from continuing operations(1) | $ | 16,115 | 17,200 | 20,486 | 33,927 | 22,468 | ||||||||||
Net earnings | $ | 16,115 | 17,200 | 20,486 | 33,297 | 28,271 | ||||||||||
Common Stock Data(2) | ||||||||||||||||
Earnings per common share—continuing operations(1) | $ | .54 | .58 | .68 | 1.10 | .73 | ||||||||||
Net earnings per common share | $ | .54 | .58 | .68 | 1.08 | .91 | ||||||||||
Cash dividends per common share(3) | $ | .34 | .34 | .34 | .32 | 7.26 | ||||||||||
Weighted average shares outstanding (in thousands) | 29,910 | 29,819 | 30,230 | 30,807 | 30,939 | |||||||||||
Book value per share | $ | 11.23 | 10.98 | 10.69 | 10.51 | 9.87 | ||||||||||
Financial Position (in thousands) | ||||||||||||||||
Total assets | $ | 704,411 | 711,523 | 721,648 | 698,383 | 587,234 | ||||||||||
Long-term debt | $ | 196,833 | 240,943 | 252,992 | 199,425 | 123,110 | ||||||||||
Shareholders’ equity | $ | 335,796 | 327,440 | 317,493 | 319,509 | 301,323 | ||||||||||
Capital expenditures and acquisitions | $ | 25,082 | 35,741 | 64,937 | 186,752 | 75,532 | ||||||||||
Financial Ratios | ||||||||||||||||
Current ratio | .35 | .37 | .53 | .47 | .73 | |||||||||||
Debt/capitalization ratio | .41 | .44 | .47 | .45 | .37 | |||||||||||
Return on average shareholders’ equity | 4.9 | % | 5.3 | % | 6.4 | % | 10.7 | % | 7.1 | % | ||||||
| (1) |
| (2) | All per share and shares outstanding data is on a diluted basis. Earnings per share data is calculated on our Common Stock using the |
| (3) | Includes $7.00 per share special dividend paid during fiscal 2006. |
15Item 7.Management’s Discussion and Analysis of Financial Condition and Results of Operations.
Results of Operations
General
We report our consolidated and individual segment results of operations on a 52-or-53-week fiscal year ending on the last Thursday in May. Fiscal 2007 was a 53-week year2010, fiscal 2009 and fiscal 2006 and 20052008 were 52-week years. Fiscal 20082011 will also be a 52-week year.
We divide our fiscal year into three 13-week quarters and a final quarter consisting of 13 or 14 weeks. Our primary operations are reported in two business segments: theatres and hotels and resorts. As a result of the sale of substantially all of the assets of our limited-service lodging division during fiscal 2005, we have presented the limited-service lodging business segment as discontinued operations in the accompanying financial statements and in this discussion. As a result of our sale in June 2006 of the remaining inventory of real estate and development costs associated with our vacation ownership development adjacent to the Grand Geneva Resort and our sale of the Miramonte Resort during fiscal 2005, we have also presented these assets and related results of operations, previously included in our hotels and resorts segment, as part of our discontinued operations in the accompanying financial statements and in this discussion. Prior year results have been restated to conform to the current year presentation.
During the second quarter of fiscal 2007, we acquired the ownership interest of a partner in our Las Vegas Platinum Hotel joint venture, increasing our ownership of the property’s public space to 90%. The total purchase price was $10.0 million, including approximately $6.2 million of prepaid development fees. As a result of this transaction, effective October 31, 2006, the assets and liabilities of the Platinum Hotel, as well as the results of its operations, are now reported in our consolidated results. Prior to October 31, the joint venture was accounted for using the equity method of accounting. We acquired the remaining 10% of this joint venture during the second half of fiscal 2007 for $1.0 million.
Historically, our first fiscal quarter has produced the strongest operating results because this period coincides with the typical summer seasonality of the movie theatre industry and the summer strength of the lodging business. Our third fiscal quarter has historically produced the weakest operating results in our hotels and resorts division primarily due to the effects of reduced travel during the winter months. Our third fiscal quarter for our theatre division has historically been our second strongest quarter, but is heavily dependent upon the quantity and quality of films released during the Thanksgiving to Christmas holiday period.
18
Consolidated Financial Comparisons
The following table sets forth revenues, operating income, other income (expense), earnings from continuing operations, earnings (losses) from discontinued operations, net earnings and net earnings per common share for the past three fiscal years (in millions, except for per share and percentage change data):
| Change F07 v. F06 | Change F06 v. F05 | ||||||||||||||||||||||
|---|---|---|---|---|---|---|---|---|---|---|---|---|---|---|---|---|---|---|---|---|---|---|---|
| 2007 | 2006 | Amt. | Pct. | 2005 | Amt. | Pct. | |||||||||||||||||
| Revenues | $ | 327.6 | $ | 289.2 | $ | 38.4 | 13.3 | % | $ | 267.1 | $ | 22.1 | 8.3 | % | |||||||||
| Operating income | 41.1 | 39.5 | 1.6 | 4.0 | % | 38.9 | 0.6 | 1.6 | % | ||||||||||||||
| Other income (expense) | 2.4 | (6.7 | ) | 9.1 | 135.5 | % | (7.6 | ) | 0.9 | 12.3 | % | ||||||||||||
| Earnings from | |||||||||||||||||||||||
| continuing operations | 33.9 | 22.5 | 11.4 | 51.0 | % | 19.6 | 2.9 | 14.8 | % | ||||||||||||||
| Earnings (losses) from | |||||||||||||||||||||||
| discontinued operations | (0.6 | ) | 5.8 | (6.4 | ) | -110.9 | % | 79.6 | (73.8 | ) | -92.7 | % | |||||||||||
| Net earnings | 33.3 | 28.3 | 5.0 | 17.8 | % | 99.2 | (70.9 | ) | -71.5 | % | |||||||||||||
| Earnings per common share - | |||||||||||||||||||||||
| Diluted: | |||||||||||||||||||||||
| Continuing operations | $ | 1.10 | $ | .73 | $ | .37 | 50.7 | % | $ | .64 | $ | .09 | 14.1 | % | |||||||||
| Net earnings per common share | 1.08 | .91 | .17 | 18.7 | % | 3.25 | (2.34 | ) | -72.0 | % | |||||||||||||
16
| Change F10 v. F09 | Change F09 v. F08 | ||||||||||||||||||||||||
| F2010 | F2009 | Amt. | Pct. | F2008 | Amt. | Pct. | |||||||||||||||||||
Revenues | $ | 379.1 | $ | 383.5 | $ | (4.4 | ) | -1.2 | % | $ | 371.1 | $ | 12.4 | 3.3% | |||||||||||
Operating income | 36.2 | 43.4 | (7.2 | ) | -16.6 | % | 47.7 | (4.3 | ) | -9.0% | |||||||||||||||
Other income (expense) | (11.0 | ) | (16.0 | ) | 5.0 | 31.5 | % | (14.0 | ) | (2.0 | ) | -14.5% | |||||||||||||
Net earnings | $ | 16.1 | $ | 17.2 | $ | (1.1 | ) | -6.3 | % | $ | 20.5 | $ | (3.3 | ) | -16.0% | ||||||||||
Net earnings per common share—diluted | $ | 0.54 | $ | 0.58 | $ | (0.04 | ) | -6.9 | % | $ | 0.68 | $ | (0.10 | ) | -14.7% | ||||||||||
Fiscal 20072010 versus Fiscal 20062009
An increase inOur revenues, operating income (earnings before other income/expense and income taxes) and net earnings for fiscal 2010 decreased compared to the prior year due entirely to reduced operating results from our hotels and resorts division. Fiscal 2010 revenues and operating income from bothin our theatre division and ourincreased compared to last year, partially offsetting the hotels and resorts division contributedresults, due in part to our improved operating results during fiscal 2007 compared to the prior year. Theatre division operating results were favorably impacted by new screens and a strongerstrong slate of movies during our fiscal first and fourth quarters compared to the same quarters last year.films. Operating results from our hotels and resorts division increased slightly during fiscal 2007continued to be negatively impacted by reduced business spending on travel due to the current economic environment, resulting in lower average daily rates and reduced year-to-date occupancies compared to the prior year despiteyear. A reduction in our interest expense favorably impacted our net earnings during fiscal 2010 compared to the prior year. Comparisons to last year’s results were also favorably impacted by significant preopeningunusual investment losses and start-up operating losses related to several of our new hotels. Our additional 53rd week of operations benefited both of our operating divisions and contributed approximately $9.5 million in revenues and $2.9 million in operating income to our fourth quarter and fiscal 2007 results.
Increased gains on disposition of property, equipment and other assets reduced interest expenseduring fiscal 2009 totaling approximately $0.07 per diluted common share.
Our fiscal 2010 operating results also benefited from a change in estimate related to our deferred gift card revenue. We introduced a gift card program in our theatre division several years ago and equity lossessubsequently expanded it to our hotels and resorts division. With very little history as to redemption patterns, we had been taking a very conservative approach to our deferred gift card liability. During our fiscal 2010 third quarter, we determined that we had enough historical gift card redemption data available to support a change in estimate of our gift card liability. Accordingly, gift card breakage income will now be recognized based upon our historical redemption patterns and will represent the gift card balances for which we believe customer redemption is remote.
As a result of this change in estimate, we reported cumulative gift card breakage income of $3.0 million (pre-tax) during our fiscal 2010 third quarter, of which approximately $2.4 million (pre-tax), or approximately $0.05 per diluted common share, related to fiscal years 2009 and earlier. Our theatre division benefited the most from unconsolidated joint venturesthis change in estimate, recognizing $2.5 million of gift card breakage income during our fiscal 2010 third quarter, of which $2.0 million related to fiscal years 2009 and earlier. Based upon recent redemption levels, we currently estimate our future annual breakage to be in the $600,000-$700,000 range. If gift card sales continue to increase in the future, our annual breakage income also is expected to increase.
Our fiscal 2010 operating results were also significantly impacted by a one-time pension withdrawal liability in our theatre division of $1.4 million (pre-tax) and a significantly lowernon-cash impairment charge in our hotels and resorts division of $2.6 million (pre-tax), both reported during our fiscal 2010 second quarter. Together, these two adjustments negatively impacted our fiscal 2010 operating income tax rate contributed to a significant increase in earnings from continuing operations during fiscal 2007, offsetting reduced investment income. Our overallby approximately $4.0 million and our net earnings increased during fiscal 2007 compared to the prior year despite last year’s gains on the disposition of the previously noted discontinued operations.per diluted common share by $0.08.
We recognized investment income of $3.1 million$607,000 during fiscal 2007,2010, representing a decreasean increase of $4.8$1.4 million or 60.4%, compared to investment incomelosses of $7.9 million$780,000 during the prior year. Investment income includeshas historically included interest earned on cash, cash equivalents cash held by intermediaries and notes receivable, including notes related to prior sales of timeshare
19
units in our hotels and resorts division. Our fiscal 2007 cash balances were substantially lower than the prior year due to the impact of our $214.6 million special dividend paid on February 24, 2006, the first day of our fiscal 2006 fourth quarter, resultingThe significant increase in reduced investment income during fiscal 2007 compared to2010 was primarily the result of two unusual investment losses reported during the prior year. DueDuring fiscal 2009, we recognized a $1.3 million pre-tax investment loss on securities held whose decline in fair value we deemed to our expectationsbe other than temporary. In addition, we reported an approximately $660,000 pre-tax investment loss during fiscal 2009 related to a former Baymont Inns & Suites joint venture that owns real estate that had declined in value because of commercial real estate market conditions. Since we have a very limited amount of these types of investments, we do not believe that our notes receivable from timeshare sales will continueexposure to decline (we are no longer selling timeshare unitsadditional losses related to securities investments and our current notes are being paid off over time) and our average cash balancesjoint ventures is significant. We do not expect a significant variation in investment income during fiscal 2008 will likely be less than fiscal 2007, we expect our fiscal 2008 investment income to be less than fiscal 2007. Our cash and cash equivalents totaled $12.0 million at the end of our fiscal year,2011 compared to $34.5 million at the end of fiscal 2006. The majority of our cash was invested in federal tax-exempt short-term financial instruments during the year.2010.
Our interest expense totaled $13.9$11.2 million for fiscal 2007,2010, representing a decrease of approximately $500,000,$2.8 million, or 3.3%19.5%, compared to fiscal 20062009 interest expense of $14.4$14.0 million. The decrease in interest expense was primarily the result of making scheduled payments onreduced borrowings and lower short-term interest rates during fiscal 2010. We were able to fund our long-termfiscal 2010 capital expenditures out of operating cash flow, eliminating the need for additional incremental debt during the year. We expectBarring an event that would require significantly more borrowings during fiscal 2011 than currently planned (such as an acquisition or significant share repurchases), and assuming short-term interest rates remain at or near current levels for the majority of the year, we currently believe our interest expense may increase by approximately $2.5-$3.0 millionwill not significantly change during fiscal 2008 as a result of increased net borrowings related2011 compared to our fiscal 2007 fourth quarter theatre acquisition.2010. Current maturities of long-term debt on our balance sheet as of May 31, 200727, 2010 included a $25.5$25.2 million mortgage note related to our Chicago hotel with a maturity date in December 2007.February 2011. We currently anticipate extending the maturity date of all or most of this note, which would result in the majority of this amount being reclassified as long-term debt.
Our continuing operations recognizedWe reported a small net gainsloss on disposition of property, equipment and other assets of $14.5 million$25,000 during fiscal 2007,2010, compared to similar gains from continuing operationsnet losses of $1.7 million$814,000 during fiscal 2006. The2009. During fiscal 20072009, we incurred a loss of approximately $1.1 million related to an adjustment of prior pro-rated gains included gains related torecorded on the sale of four former restaurant properties, several parcels of land andcondominium units at our Platinum Hotel & Spa in Las Vegas, Nevada. We have classified the Westin Columbus hotel (toremaining 16 units that have yet to be sold (which continue to be rented to guests) as a joint venture in whichlong-term asset on our balance sheet, as we retained a minority interest). We also reported a significant gain of approximately $5.1 millioncurrently do not expect to sell these units during fiscal 2007 related to2011.
Excluding the unusual adjustment described above, the remaining fiscal 2009 gain on disposition of property, equipment and other assets was primarily the result of the sale of an outlot on a theatre in Waukesha, Wisconsin, that was replaced by a new theatre in nearby Brookfield, Wisconsin.land parcel. The timing of our periodic sales of property and equipment results in variations each year in the gains or losses that we report on disposition of property and equipment each year.equipment. We anticipate the potential for additional disposition gains from periodic additional sales of non-core property and equipment withduring fiscal 2011 and beyond. In particular, we have the potential for additional dispositionto report significant gains sometime during fiscal 2008, including the potential for another significant gainnext several years from the intended sale of a valuable former theatre parcel in Brookfield, Wisconsin and the potential sale of an existing theatre parcel in Madison, Wisconsin that was also replaced by ourwe are intending to replace with a new theatre.
Our fiscal 2007 gains on disposition of property, equipment and other assets also included a gain of approximately $5.9 million related to the sale of condominium units at our Las Vegas Platinum Hotel. As of May 31, 2007, we closed on sales of approximately 93% of the 255 available condominium units, with the majority of the remaining unit sales expected to close during fiscal 2008. We currently anticipate reporting a total gain on disposition of these assets of approximately $6.4 million after all condominium sales have been completed.
17
As noted earlier in this discussion, as a result of acquiring an additional equity interest in Platinum Condominium Development, LLC, the joint venture that developed our luxury condominium hotel in Las Vegas, Nevada, on October 31, 2006, results from our Platinum Hotel venture are now included in our consolidated financial statements and are no longer included in net equity losses from unconsolidated joint ventures. We reported net equity losses from unconsolidated joint ventures of approximately $1.4 million$337,000 during fiscal 20072010 compared to $1.9 millionlosses of $476,000 during the prior year. Losses during both years were primarily the result of preopening costsfiscal 2010 and 2009 included losses from our previous 50% ownership interest in the Platinum Hotel joint venture. These losses will not be repeated during fiscal 2008. During our fiscal 2007 fourth quarter, we made investments in two hotel joint ventures that are accounted for under thein which we have a 15% ownership interest and our remaining Baymont 50% joint venture. We currently do not expect significant variations in net equity method and may result in equity earningsgains or losses from unconsolidated joint ventures during fiscal 2008.2011 compared to fiscal 2010.
We reported income tax expense on continuing operations for fiscal 20072010 of $9.6$9.1 million, a decrease of approximately $800,000,$1.1 million, or 8.1%10.5%, compared to fiscal 2006.2009 income tax expense of $10.2 million. Our effective income tax rate for continuing operations during fiscal 20072010 was 22.0%36.1%, significantlyslightly lower than our fiscal 20062009 effective rate of 31.7% and our historical 39-40% range.37.1%. This lower rate was primarily due to investmentsa decrease in federal tax-exempt short-term financial instruments and, more significantly, due toour liability for unrecognized tax benefits as a result of a lapse of the impactapplicable statute of federal and state historic tax credits generated upon the opening of our Oklahoma City Skirvin Hilton hotel project. These historic tax credits reduced ourlimitations during fiscal 2007 income tax expense by approximately $7.8 million.2010. We currently anticipate that our fiscal 20082011 effective income tax rate will return to ourits historical range.
Net earnings during fiscal 2007 included an after-tax loss from discontinued operationsrange of $500,000, compared to an after-tax loss from discontinued operations38-40%, excluding any further lapses of $1.9 millionany statutes of limitations during the prior year. Net earnings for fiscal 2007year or potential changes in federal and 2006 also included after-tax gains (losses) on sale of discontinued operations of approximately $(100,000) and $7.7 million, respectively. A detailed discussion of these items is included in the Discontinued Operations section. state tax rates.
20
Weighted-average shares outstanding were 30.829.9 million during fiscal 20072010 and 30.929.8 million during fiscal 2006.2009. All per share data is presented on a diluted basis.
Fiscal 20062009 versus Fiscal 20052008
An increaseRevenues increased in our theatre division during fiscal 2009 compared to the prior year, offsetting decreases in revenues and operating income from our hotels and resorts divisiondivision. Our total operating income decreased during fiscal 2006 offset a decrease in revenues and2009 compared to the prior year, with significantly improved operating incomeresults from our theatre division compared tooffset by reduced operating results from our hotels and resorts division. Theatre division operating results were favorably impacted by new screens acquired during the prior year.fourth quarter of fiscal 2008 and an overall stronger slate of film product. In addition, theatres have historically performed well during recessionary time periods. Operating results from our hotels and resorts division benefited from the addition of two new hotels as well as improved performance from our existing properties, partially offset by combined start-up and pre-opening costs associated with ongoing development projects. Theatre division operating results were negatively impacted by reduced occupancy rates and average daily rates resulting from reduced business and consumer spending on travel and leisure due to the economic environment. Significant unusual investment losses and losses on disposition of property, equipment and other assets, partially offset by reduced interest expense and a particularly weak first quarter slateslightly lower income tax rate, also contributed to a decrease in net earnings during fiscal 2009 compared to the prior year.
We recognized investment losses of movies$780,000 during fiscal 2009, representing a decrease of $2.3 million compared to investment income of $1.5 million during the prior year. The significant decrease in investment income during fiscal 2009 was primarily the result of two unusual investment losses reported during the year. We recognized a $1.3 million pre-tax investment loss on securities held whose decline in fair value we deemed to be other than temporary and we reported an approximately $660,000 pre-tax investment loss during fiscal 2009 related to a former Baymont Inns & Suites joint venture that owns real estate that had declined in value.
The remaining decrease in investment income during fiscal 2009 compared to the prior year aswas primarily the division’s operating resultsresult of reduced interest earned on our cash balances and our timeshare notes receivable during the last three quarters of fiscal 2006 improved2009. Interest on our fiscal 2009 cash balances was lower due to slightly lower cash balances and lower interest rates compared to the last three quarters of fiscal 2005. Increased investment incomeprior year and reduced interest expense contributed to an overall increase in earningson our notes receivable from continuing operations during fiscal 2006, offsetting reduced gains on disposition of property and equipment and increased equity losses from unconsolidated joint ventures. Our overall net earnings decreased significantly during fiscal 2006 due to the prior year’s significant gains on the dispositiontimeshare sales were lower because of the previously noted discontinued operations.
We recognized investment incomedecrease in the principal balances of $7.9 million during fiscal 2006, representing an increase of $1.7 million, or 27.1%, compared to investment income of $6.2 million during the prior year. Our fiscal 2006 increasenotes as they were being paid off over time in investment income was the result of interest earned on proceeds received from the sale of our limited-service lodging division in September 2004.accordance with their terms. Our cash and cash equivalents totaled $34.5$6.8 million at the end of our fiscal year, but was as high as $292.72009, compared to $13.4 million as ofat the end of our fiscal 2006 third quarter. The majority of our cash was invested in federal tax-exempt short-term financial instruments.2008.
18
We paid a special cash dividend of $7.00 per share on February 24, 2006, the first day of our fiscal 2006 fourth quarter. The special dividend returned to our shareholders approximately $214.6 million of the proceeds received from the sale of the limited-service lodging division. As a result, our investment income was reduced in our fiscal 2006 fourth quarter. We also increased our regular quarterly dividend by 36% to $.075 per share of common stock.
Our interest expense totaled $14.4$14.0 million for fiscal 2006,2009, representing a decrease of $500,000,approximately $1.2 million, or 3.2%7.9%, compared to fiscal 20052008 interest expense of $14.9$15.2 million. The decrease in interest expense was primarily the result of making scheduled payments onreduced borrowings and lower short-term interest rates during fiscal 2009. We were able to fund our long-termfiscal 2009 capital expenditures out of operating cash flow, eliminating the need for additional incremental debt during the year.
Our continuing operationsWe recognized net gainslosses on disposition of property, equipment and other assets of $1.7 million$814,000 during fiscal 2006,2009, compared to similar gains from continuing operations of $2.2 million$83,000 during fiscal 2005.2008. During fiscal 2009, we incurred a loss of approximately $1.1 million related to an adjustment of prior pro-rated gains recorded on the sale of condominium units at our Platinum Hotel & Spa in Las Vegas, Nevada. With approximately 94% of the units sold, prior gains were recorded on a “percentage of completion” method based upon estimated total proceeds once all 255 units were sold. As a result of the then-current economic environment and its impact on Las Vegas real estate values, we lowered our estimated total proceeds which we expected to receive when the remaining 16 units are sold. Our pro-rated gain on sale of the previous units was reduced accordingly.
Excluding the unusual adjustment described above, the remaining fiscal 2009 gain on disposition of property, equipment and other assets was primarily the result of the sale of an outlot on a theatre land parcel. The fiscal 2006 net2008 gain was primarily the result of the sale of one of our first quarter sales of a theatre outlot and real estate development in Appleton, Wisconsin and a strip shopping center developed by alast two remaining Baymont Inn joint venture on land adjacent to our theatre in Delafield, Wisconsin. These gains were partially offset by fourth quarter losses related to the closing of a restaurant in our Pfister Hotel and the replacement of certain hotel assets.ventures.
During fiscal 2006, we
21
We reported net equity losses from unconsolidated joint ventures of $1.9 million,$476,000 during fiscal 2009 compared to net equity losses of $1.1 million$411,000 during the prior fiscal year. Losses during fiscal 2006 were primarily the result of pre-opening costs2009 and 2008 included losses from our then 50%two hotel joint ventures in which we have a 15% ownership interest in Platinum Condominium Development, LLC, which developed a luxury condominiumand our remaining Baymont 50% joint venture. The slightly increased net losses were due to the challenging environment for hotel in Las Vegas, Nevada, and operating losses from our former minority ownership interest in Cinema Screen Media, a cinema advertising company that provided pre-show entertainment on our screens.operations.
We reported income tax expense on continuing operations for fiscal 20062009 of $10.4$10.2 million, a decrease of $1.3approximately $3.0 million, or 11.3%23.1%, compared to fiscal 2005.2008 income tax expense of $13.2 million. Our effective income tax rate for continuing operations during fiscal 20062009 was 31.7%37.1%, significantly lower than our fiscal 20052008 effective rate of 37.5%39.2%. This lower rate was primarily due to a decrease in our liability for unrecognized tax benefits as a result of a lapse of the previously described investments in federal tax-exempt short-term financial instruments.
Net earningsapplicable statute of limitations during fiscal 2006 included an after-tax loss from discontinued operations of $1.9 million, compared to after-tax income from discontinued operations of $1.3 million during the prior year. Net earnings for fiscal 2006 and 2005 also included after-tax gains on sale of discontinued operations of $7.7 million and $78.3 million, respectively. A detailed discussion of these items is included in the Discontinued Operations section. 2009.
Weighted-average shares outstanding were 30.929.8 million during fiscal 20062009 and 30.530.2 million during fiscal 2005.2008.
Current Plans
Our aggregate capital expenditures, acquisitions and purchases of interests in joint ventures were approximately $198$25 million during fiscal 20072010 compared to $77 million and $68$36 million during the prior two years, respectively.fiscal 2009 and $65 million during fiscal 2008. We currently anticipate that our fiscal 20082011 capital expenditures, including potential purchases of interests in joint ventures (but excluding any other potential acquisitions) may be in the $60-$40-$8060 million range. We will, however, continue to monitor our operating results and economic and industry conditions so that we respond appropriately.may adjust our plans accordingly.
Our current strategic plans may include the following goals and strategies:
| • | After opening three new theatres |
| • | During fiscal 2010, an increasing portion of our |
An anticipated broad roll-out of digital cinema into our theatres, as well as the rest of the industry, was delayed during fiscal 2010 due to the increased difficulties of proposed third-party implementers to obtain the necessary financing during the current economic climate. During the latter half of fiscal 2010, progress was made regarding financing and system pricing and an expected industry-wide roll-out is now expected to occur over the course of several years. We currently expect to begin a broader roll-out of digital projection
22
technology in our circuit beginning in fiscal 2011. The actual costs that we may incur when such a roll-out begins are yet to be determined, but it is our expectation that the majority of the costs would be paid for by the film studios through the payment of virtual print fees to us or a selected digital cinema implementation partner. Our goals from digital cinema include delivering an improved film presentation to our guests, increasing scheduling flexibility, as well as maximizing the opportunities for alternate programming that may be available with this technology. |
| • | We continue to explore opportunities to further enhance our food and beverage |
19
In addition to the growth strategies described above, our theatre division continues to focus on several strategies that will attemptare designed to further improve the profitability of our existing theatres. These strategies include plans to expand ancillary theatre revenues, such as pre-show and lobby advertising (thru our advertising provider, Screenvision) and additional corporate and group sales, sponsorships and alternate auditorium uses, we areuses. We also preparingcontinue to have a non-exclusive digital network affiliate agreement with National CineMedia, LLC for the anticipated introductionpresentation of digital projection technologylive and pre-recorded in-theatre events in 24 of our theatres. We continue to test digital cinema hardware and software and expect to expand our testing to include digital 3D technology,locations in multiple markets. The expanded programming, which many in our industry believe may have a significant positive impact on future movie-going. Once we have completed testing and are satisfied that a suitable financing methodology has been determined (all film studios have generally committed to participating inincluded live performances of the financing of this new technology implementation), we anticipate a broader roll-out of digital cinema into our theatres. Our potential goals include delivering an improved film presentation to our guests, increasing our scheduling flexibility,Metropolitan Opera, as well as maximizingsports, music and other events, continues to be well received by our customers and should benefit our future operating results by providing revenue during our theatres’ slower times.
Although the opportunities for alternate programming that may be available to us with this technology.
Unlike theatre assets, whereby the majority of the return on investment comes from the annual cash flow generated by operations, a portion of the return on a hotel investment is derived by effective portfolio management, which includes determining the proper branding strategy for a given asset and the proper level of investment and upgrades necessary, as well as identifying an effective divestiture strategy for the asset when appropriate. Our past hotel investments have been very opportunistic as we sold a company-owned hotel (the Columbus Westin) to a joint venture formed with Waterton.have acquired assets at
23
favorable terms and then improved the properties and operations in order to create value. Depending upon market conditions, we will periodically evaluate existing or future individual hotel assets in order to determine whether a divestiture strategy may be appropriate for that asset. We do not currently anticipate divesting any particular hotel assets during fiscal 2011. |
Our plans for our hotels and resorts division also include continued reinvestment in our existing properties in order to maintain and increase their value. During fiscal 2007,2009, we renovated and repositionedbegan a major guest room renovation at the WyndhamHilton Milwaukee City Center, and converted it to the luxury InterContinental brand. We also completed a 12,000 square foot conference center expansion at our Grand Geneva Resort and added a new spa and featured restaurant at our flagship Pfister Hotel. Our fiscal 2008 plans include a parking garage restoration and guest room and meeting space renovation at the Pfister Hotel, as well as a guest room renovation and pool and spa update at our Grand Geneva Resort. Both of these projects have now been completed. We believe that proceeding with these projects at a time when occupancies were lower and thus less disruptive, put these two important properties in a position to capitalize on an improvement in macroeconomic conditions. Our fiscal 20082011 hotels and resorts capital expenditures, for these and other projects, includingwhich will include additional reinvestments in our existing assets as well as possible equity investments in new projects, may be up to approximately $35$20-$30 million.
In addition to $45 million.the growth strategies described above, our hotels and resorts division continues to focus on several strategies that are designed to further improve the division’s profitability. These include human resource and cost improvement strategies designed to achieve operational excellence and improved operating margins. We expect these aforementioned development projectshave also invested in sales, revenue management and investments in existing assets, plus anticipated improvements at our core properties,internet marketing strategies to provide potential earnings growth opportunities during fiscal 2008 and beyond.further drive increased profitability.
20
In addition to operational and growth strategies in our operating divisions, we continue to seek additional opportunities to enhance shareholder value, including strategies related to dividend policy, share repurchases and asset divestitures. During fiscal 2006,2010, we returned a substantial portion of the proceeds from the sale of our limited-service lodging division to our shareholders in the form of a $7.00 per share special dividend. We also increasedmaintained our regular quarterly cash dividend by 36% to $.075at $0.085 per share of common stock in fiscal 2006 and by another 13% to $.085 per share during fiscal 2007. During fiscal 2007 and 2006, wedespite the difficult economic environment. We also have repurchased approximately 411,000 and 313,000383,000 shares respectively, of our common stock during fiscal 2010 and early fiscal 2011 in conjunction with the exercise of stock options and the purchase of shares in the open market and the exercise of stock options under anour existing board authorization. Early in our fiscal 2007 first quarter, we sold our remaining inventory of real estate and development costs associated with our vacation ownership development adjacent to the Grand Geneva Resort at a small gain, exiting a business that had contributed operating losses during each of the last two years.stock repurchase authorizations. We will also continue to evaluate opportunities to sell real estate when appropriate, benefiting from the underlying value of our real estate assets. In addition to the previously mentioned potential sale of anothera valuable former theatre parcel in Brookfield, Wisconsin and an existing theatre in Madison, Wisconsin, we will evaluate opportunities to sell additional out-parcels at our new theatre developments in Green Bay and Sturtevant, Wisconsin in addition to other non-operating, non-performing real estate in our portfolio.
The actual number, mix and timing of potential future new facilities and expansions and/or divestitures will depend, in large part, on industry and economic conditions, our financial performance and available capital, the competitive environment, evolving customer needs and trends and the potential availability of attractive acquisition and investment opportunities. It is likely that our growth goals will continue to evolve and change in response to these and other factors, and there can be no assurance that these current goals will be achieved. Each of our goals and strategies are subject to the various risk factors discussed earlier in ourthis Annual Report on Form 10-K.
21
24
Theatres
Our oldest and most profitable division is our theatre division. The theatre division contributed 47.8%59.1% of our consolidated revenues from continuing operations and 68.6%96.9% of our consolidated operating income, excluding corporate items, during fiscal 2007.2010, compared to 56.1% and 81.8%, respectively, during fiscal 2009 and 48.8% and 62.1%, respectively, during fiscal 2008. The theatre division operates motion picture theatres in Wisconsin, Illinois, Ohio, Minnesota, Iowa, and North Dakota and Nebraska and a family entertainment center in Wisconsin. The following tables set forth revenues, operating income, operating margin, screens and theatre locations for the last three fiscal years:
| Change F07 v. F06 | Change F06 v. F05 | ||||||||||||||||||||||
|---|---|---|---|---|---|---|---|---|---|---|---|---|---|---|---|---|---|---|---|---|---|---|---|
| 2007 | 2006 | Amt. | Pct. | 2005 | Amt. | Pct. | |||||||||||||||||
| (in millions, except percentages) | |||||||||||||||||||||||
| Revenues | $ | 156.5 | $ | 146.0 | $ | 10.5 | 7.2 | % | $ | 149.1 | $ | (3.1 | ) | -2.1 | % | ||||||||
| Operating income | 34.6 | 32.5 | 2.1 | 6.4 | % | 34.8 | (2.3 | ) | -6.6 | % | |||||||||||||
| Operating margin | 22.1 | % | 22.2 | % | 23.3 | % | |||||||||||||||||
| Number of screens and locations at fiscal year-end(1)(2) | 2007 | 2006 | 2005 | ||||||||
|---|---|---|---|---|---|---|---|---|---|---|---|
| Theatre screens | 608 | 504 | 504 | ||||||||
| Theatre locations | 50 | 45 | 45 | ||||||||
| Average screens per location | 12.2 | 11.2 | 11.2 | ||||||||
| Change F10 v. F09 | Change F09 v. F08 | |||||||||||||||||||||||
| F2010 | F2009 | Amt. | Pct. | F2008 | Amt. | Pct. | ||||||||||||||||||
| (in millions, except percentages) | ||||||||||||||||||||||||
Revenues | $ | 224.1 | $ | 215.3 | $ | 8.8 | 4.1 | % | $ | 181.1 | $ | 34.2 | 18.9 | % | ||||||||||
Operating income | $ | 44.7 | $ | 43.7 | $ | 1.0 | 2.5 | % | $ | 35.3 | $ | 8.4 | 23.6 | % | ||||||||||
Operating margin | 20.0 | % | 20.3 | % | 19.5 | % | ||||||||||||||||||
| Number of screens and locations at fiscal year-end(1)(2) | F2010 | F2009 | F2008 | |||||||||||||||||||||
Theatre screens |
| 668 | 663 | 678 | ||||||||||||||||||||
Theatre locations |
| 54 | 53 | 56 | ||||||||||||||||||||
Average screens per location |
| 12.4 | 12.5 | 12.1 | ||||||||||||||||||||
| (1) | Includes |
| (2) | Includes |
The following table further breaks down the components of revenues for the theatre division for the last three fiscal years:
| Change F07 v. F06 | Change F06 v. F05 | ||||||||||||||||||||||
|---|---|---|---|---|---|---|---|---|---|---|---|---|---|---|---|---|---|---|---|---|---|---|---|
| 2007 | 2006 | Amt. | Pct. | 2005 | Amt. | Pct. | |||||||||||||||||
| (in millions, except percentages) | |||||||||||||||||||||||
| Box office revenues | $ | 98.2 | $ | 93.4 | $ | 4.8 | 5.1 | % | $ | 96.2 | $ | (2.8 | ) | -2.8 | % | ||||||||
| Concession revenues | 49.0 | 45.5 | 3.5 | 7.7 | % | 45.8 | (0.3 | ) | -0.6% | ||||||||||||||
| Other revenues | 9.3 | 7.1 | 2.2 | 30.9 | % | 7.1 | -- | -- | |||||||||||||||
| Total revenues | $ | 156.5 | $ | 146.0 | $ | 10.5 | 7.2 | % | $ | 149.1 | $ | (3.1 | ) | -2.1 | % | ||||||||
| Change F10 v. F09 | Change F09 v. F08 | |||||||||||||||||||||
| F2010 | F2009 | Amt. | Pct. | F2008 | Amt. | Pct. | ||||||||||||||||
| (in millions, except percentages) | ||||||||||||||||||||||
Box office revenues | $ | 142.7 | $ | 137.3 | $ | 5.4 | 3.9 | % | $ | 114.7 | $ | 22.6 | 19.7 | % | ||||||||
Concession revenues | 67.8 | 67.9 | (0.1 | ) | -0.1 | % | 56.9 | 11.0 | 19.4 | % | ||||||||||||
Other revenues | 13.6 | 10.1 | 3.5 | 35.3 | % | 9.5 | 0.6 | 5.6 | % | |||||||||||||
Total revenues | $ | 224.1 | $ | 215.3 | $ | 8.8 | 4.1 | % | $ | 181.1 | $ | 34.2 | 18.9 | % | ||||||||
Fiscal 20072010 versus Fiscal 20062009
TheOur record theatre division fiscal 2010 operating results benefited from the previously described gift card breakage income and an increase in our average ticket price, offsetting a one-time pension withdrawal liability and a decrease in total theatre division revenues and operating incomeattendance at comparable theatres of 3.0% during fiscal 2007 compared to the prior year was due to a strong film slate during our fiscal first and fourth quarters, new screens added during the year and the additional week of operations included in our fiscal 2007 results. The additional week of operations, which included the traditionally strong Memorial Day holiday weekend, contributed approximately $5.3 million and $2.1 million, respectively, to our theatre division revenues and operating income during fiscal 2007, excluding the theatres acquired during our fiscal 2007 fourth quarter.
On April 19, 2007, we acquired 11 owned and/or leased movie theatres with 122 screens in Minnesota, Wisconsin, North Dakota and Iowa from Cinema Entertainment Corporation (CEC) and related parties for a purchase price of approximately $75.7 million. The assets purchased consisted primarily of land, buildings, leasehold improvements, equipment and goodwill and the transaction was funded by using available cash-on-hand and drawing from our current credit facility. We expect that the acquisition will be accretive to both fiscal 2008 earnings and cash flow. The CEC theatres contributed approximately $3.5 million and $650,000, respectively, to our theatre division revenues and operating income for the six weeks that we owned them during fiscal 2007, including the additional week of operations during our fiscal year.
22
Total theatre attendance increased 5.0% during fiscal 20072010 compared to the prior year. Fiscal 2007The comparable theatre decrease in attendance at our comparable theatres increased approximately 1.3%, including the additional weekoccurred primarily during two distinct periods of operations, but decreased approximately 1.7% excluding the additional week, compared to the prior year. As noted earlier, a stronger slate of movies during our fiscal 2007year—a three-week period from mid-July to early August corresponding with the first three weeks of last year’s top film,The Dark Knight, and fourth quarters offset a weaker fall and holiday periodduring the final two months of our fiscal year when the film line-up. A particularly strong May 2007 that included the opening of three blockbuster film sequels to theSpider-Man, Shrek andPirates of the Caribbean movie franchises contributed to very strong fourth quarter theatre operating results.product did not perform as well as prior year’s films.
Revenues for the theatre business and the motion picture industry in general are heavily dependent on the general audience appeal of available films, together with studio marketing, advertising and support campaigns and the maintenance of the current “windows” between the date a film is released in theatres and the date a motion picture is released to other channels, including video on-demand and DVD. These are factors over which we have no control. Excluding a relatively small number of changes in the number of competitive screens in our markets, weWe believe that the most significant factor contributing to variations in attendance during fiscal 20072010, as in other years, was the quantity and quality of film product released during the respective quarters compared to the films released during the same quarters last year. Additional
25
Blockbusters (generally defined in the industry as films that gross more than $100 million nationally) accounted for an increased portion of our total box office during fiscal 2010, with our top 15 performing films accounting for 42% of our fiscal 2010 box office receipts compared to 32% during fiscal 2009. The higher percentage related to blockbuster movies was due in large part to the fact that our top film,Avatar, became the highest grossing film of all time. The following five top performing fiscal 2010 films accounted for nearly 20% of our total box office and produced the greatest box office receipts for our circuit:Avatar,Transformers: Revenge of the Fallen, Harry Potter and the Half-Blood Prince, The Blind Sideand The Twilight Saga: New Moon. The quantity of films shown in our theatres declined slightly during fiscal 2010. We played 168 films (including 15 digital 3D films) and 41 alternate content attractions at our theatres during fiscal 2010 compared to 183 films (including eight digital 3D films) and 31 alternate content attractions during fiscal 2009. Based upon projected film and alternate content availability, we currently estimate that we may again experience a slight decline in the number of films and attractions on our screens during fiscal 2011 compared to fiscal 2010. There are currently nearly 30 digital 3D films scheduled to be released during our fiscal 2011, including potential hits such asMegamind, Harry Potter and the Deathly Hallows, Tangled, The Chronicles of Narnia: the Voyage of the Dawn Treader, Yogi Bearand Tron. Generally, a decrease in the quantity of films reduces the potential for more blockbusters in any given year, but an increase in the quantity of 3D films increases the potential for a higher average ticket price.
During fiscal 2010, our average ticket price increased 7.7% compared to the prior year, attributable primarily to selected price increases and premium pricing for our digital 3D andUltraScreen® attractions. Changes in film product mix did not have a significant impact on our average ticket price during fiscal 2010 (adult-oriented and R-rated films result in a higher average ticket price). With attendance at comparable theatres down during fiscal 2010 compared to the prior year, this increase in average ticket price was the sole factor resulting in our increased box office revenues during fiscal 2010 compared to the prior year.
Our average concession sales per person increased 3.6% during fiscal 2010 compared to the prior year. Pricing, concession product mix and film product mix are the three primary factors that impact our concession sales per person. Selected price increases and a change in concession product mix, including increased sales of higher priced non-traditional food and beverage items in our theatres, were the primary reasons for our increased average concession sales per person during fiscal 2010. Film product mix (for example, films that appeal to families and teenagers generally produce better than average concession sales) did not have a significant impact on our average concession sales per person during the full year, although it did cause minor fluctuations during individual quarters. Because attendance during fiscal 2010 decreased, this increase in average concession sales per person was the sole factor resulting in our increased concession revenues during fiscal 2010 compared to the prior year.
Our theatre division’s operating margin decreased to 20.0% during fiscal 2010, compared to 20.3% in fiscal 2009. The fact that a higher percentage of our box office was attributable to our highest grossing films contributed to higher film costs and reduced margins during fiscal 2010. Higher grossing “blockbuster” films historically have a higher film cost as a percentage of box office revenues than other films and therefore our operating margin decreases when a smaller number of high grossing films make up such a large percentage of our box office revenue. In addition, reduced attendance negatively impacts our operating margins, particularly as it relates to its impact on our high-margin concession revenues. On the other hand, other revenues, which include management fees, pre-show advertising income, family entertainment center revenues and gift card breakage income, increased during fiscal 2010 compared to the prior year due to the previously described change in estimate related to our gift card liability, favorably impacting our operating margin during fiscal 2010. We hope to increase our operating margin in our theatre division during fiscal 2011 by reducing our costs, including film costs, increasing our ancillary revenues and increasing our per-capita revenues.
As noted previously, our fiscal 2010 operating income and operating margin were negatively impacted by a one-time $1.4 million pre-tax adjustment for a pension withdrawal liability incurred during our fiscal 2010 second quarter. This non-recurring liability related to our decision to withdraw from an underfunded multi-
26
employer Chicago projectionist union pension plan. We had only a few active associates remaining in this union and we believed it was fiscally prudent to withdraw from this pension plan and lock in our portion of the unfunded liability existing using favorable August 2008 valuations (prior to the market downturn).
In November 2009, we opened the new Marcus Midtown Cinema at Midtown Crossing in Omaha, Nebraska. We are managing this unique upscale four-level, five-screen entertainment destination for the owner, Mutual of Omaha. This theatre offers our exclusiveCineDineSM in-theatre dining concept in all five auditoriums, another first for us, and also featuresZaffiro’s pizza. The theatre also features two sophisticated cocktail lounges, meeting and event space and a full catering service. The initial response to this distinctive new theatre has been positive. We also purchased an additional site for the development of a new theatre in Sun Prairie, Wisconsin, for approximately $4.5 million during our fiscal 2010 fourth quarter. A new theatre on this site will ultimately replace an existing theatre in Madison, Wisconsin. We did not close any theatres during fiscal 2010 and do not anticipate closing any theatres during fiscal 2011.
Box office receipts during the summer through the date of this filing have thus far decreased slightly compared to last year’s summer results. Strong performances from films such asKarate Kid, Toy Story 3 (3D),Grown Ups, The Twilight Saga: Eclipseand Inception have contributed to our early fiscal 2011 results.
Fiscal 2009 versus Fiscal 2008
The increase in theatre division revenues and operating income during fiscal 2009 compared to the prior year was due primarily to the results from the seven theatres and 83 screens that we acquired from Douglas Theatre Company and related parties during our fiscal 2008 fourth quarter, as well as a strong slate of films during fiscal 2009. Excluding the Douglas theatres, fiscal 2009 box office receipts increased 5.5% and concession revenues increased 4.3% compared to the prior year comparable theatres.
Total theatre attendance increased 14.4% during fiscal 2009 compared to the prior year. Excluding the Douglas theatres, fiscal 2009 attendance at our comparable theatres increased approximately 0.1% compared to the prior year. With good film product, movie theatres have historically performed well during difficult economic conditions, as evidenced by the fact that national theatre attendance increased during five of the last seven recessions. During fiscal 2009, our comparable theatre attendance decreased by 5.6% during our first quarter compared to the prior year (despite the impact of our largest grossing movie of the year,The Dark Knight) due to a weak August film slate and television viewership of the Olympics and the Democratic National Convention. As the economy worsened, our attendance improved, with comparable attendance up 3.0% during the last three quarters of fiscal 2009. Our fiscal 2009 third quarter was particularly strong, with an unusually large quantity of good performing films compared to the prior year, particularly during January and February.
We believe that the most significant factor contributing to variations in attendance during fiscal 2009, as in other years, was the quantity and quality of film product released during the respective quarters compared to the films released during the same quarters in the prior year. As mentioned above, an additional factor that is difficult to measure but which may have had some continuing impact on attendance during the last three quarters of fiscal 2007 include piracy and2009 was the ongoing impact of DVDs and home entertainment optionsthe recession on consumer spending choices. Increased average ticket prices can favorably impact box office revenues, butThe movie-going experience is a relatively inexpensive experience compared to other out-of-home entertainment options and has traditionally been viewed as an opportunity to escape from the daily challenges of life. With consumers generally traveling less during turbulent times, it is possible that our attendance benefitted from this environment during fiscal 2007, our average ticket price only increased 0.2% compared to the prior year, attributable primarily to selected regional price promotions and film product mix.2009.
Consistent with prior years in which blockbusters accounted for a significant portion of our total box office, our top 15 performing films accounted for 36%32% of our fiscal 2007 and 2006 box office receipts. Three fiscal 2007 films produced2009 box office receipts in excess of $3 million for our circuit, compared to two films that reached that amount for us35% during the prior year.fiscal 2008. The following five fiscal 20072009 films accounted for over 17%approximately 14% of our total box office and produced the mostgreatest box office receipts for our circuit:Pirates of the Caribbean: Dead Man’s ChestThe Dark Knight,Spider-Man 3Wall-E,Night at the MuseumHancock,Shrek the ThirdGran Torino andCarsTwilight. The quantity of films shown in our theatres increasedremained relatively constant during fiscal 2007, primarily due to an increase in film distributors and independent films.2009. We played 214 films and attractions (including 31 alternate content bookings and 8 digital 3D films) at our theatres during fiscal 20072009 compared to 189217 films and attractions during fiscal 2006. Based upon projected2008.
27
During fiscal 2009, our average ticket price increased 4.7% in total and 5.4% for comparable theatres compared to the prior year, attributable primarily to selected price increases and premium pricing for our digital 3D andUltraScreen attractions. During our fiscal 2009 fourth quarter, when our top performing film availability, we are currently estimating that we will showwasMonsters vs. Aliens (with over one-half of our box office receipts for this film attributable to our digital 3D showings), our average ticket price increased 7.6% in total and 8.3% for comparable theatres. Changes in film product mix did not have a similar number of filmssignificant impact on our screensaverage ticket price during fiscal 2008 as we did2009 (more adult-oriented and R-rated films result in a higher average ticket price). With attendance at comparable theatres up only slightly during fiscal 2007. Generally, an2009 compared to the prior year, this increase in average ticket price contributed approximately $6.1 million, or 98%, of our increased box office revenues for comparable theatres during fiscal 2009 compared to the quantity of films increases the potential for more blockbusters in any givenprior year.
Our average concession sales per person increased 2.4%4.2% in total and for comparable theatres during fiscal 20072009 compared to the prior year. PricingSelected price increases and filma slight change in concession product mix, areincluding increased sales of higher priced non-traditional food and beverage items in our theatres, were the two primary factors that impactreasons for our increased average ticket price and concession sales per person. Forperson during fiscal 2009. Film product mix (for example, on average, films that appeal to families and teenagers generally produce better than average concession sales butsales) did not have a lower average ticket price compared to more adult-orientated film product. During fiscal 2007,significant impact on our average concession sales per person during ourthe full year, although it did cause minor fluctuations during individual quarters. Since attendance during fiscal 2007 third quarter2009 only increased 0.7%slightly, this increase in average concession sales per person contributed $2.3 million, or 97%, of our increased concession revenues for comparable theatres during fiscal 2009 compared to the same period last year when our top films includedHarry Potter,King Kong andChronicles of Narnia, all of which generally attracted a younger audience.prior year.
Our theatre division’s operating margin decreased slightlyincreased to 22.1%20.3% during fiscal 2007,2009, compared to 22.2%19.5% in fiscal 2006,2008. Our fiscal 2009 operating margin increased primarily due in part to the impact of approximately $800,000 of preopening expenses related primarily to the opening ofincreased revenues at our Majestic theatre. In addition, our fiscal 2007 operating margin was negatively impacted by increased film rental costs, due primarily to the fact that our top films (which historically have higher film rental costscomparable theatres, particularly as a percentageresult of revenues) represented a higher percentage of our total box officeaverage ticket prices and average concession sales per person. Other revenues increased slightly during fiscal 2007. Other revenues, which include management fees, pre-show advertising income and family entertainment center revenues, increased during fiscal 20072009 compared to the prior year, also favorably impacting our operating margin. Increased pre-show and lobby advertising income, which included a final payment from our former screen advertising partner, Cinema Screen Media, and a one-time fee associated
We closed three leased theatres with the termination of our management contract for three theatres in Chicago, Illinois contributed to the increase in other revenues. We hope to increase our operating margins in our theatre division during fiscal 2008 by reducing our film costs, increasing our ancillary revenues and increasing our food and beverage revenues.
23
We opened three new locations with 4116 screens during fiscal 2007. A new 13-screen theatre, which includes anUltraScreen®, opened in November 2006 in Sturtevant, Wisconsin and replaced an existing five-screen owned theatre in Racine, Wisconsin that we closed in late September and an 8-screen leased theatre in Racine that we converted to a budget-oriented theatre. We also opened a new 12-screen theatre in November 2006 in Green Bay, Wisconsin which replaced an 8-screen leased theatre that we closed in the same market. In May 2007, we opened the previously described 16-screen Majestic theatre in Brookfield, Wisconsin, replacing2009, including two nearby theatres that had 17 screens. We also closed a 3-screen theatre in Milwaukee, Wisconsin, a single screen theatre in Cedarburg, Wisconsin and a 5-screen theatre in Madison, Wisconsin during our fiscal 2007fourth quarter, with minimal impact on our fiscal 20072009 operating results. The underlying leases had expired on two of these three locations. We also closed one screen at our North Shore Cinema in Mequon, Wisconsin during fiscal 2009 in order to make room for a full-serviceZaffiro’s restaurant.
Late in our fiscal 2009 second quarter, we opened our circuit’s 12thUltraScreen at our theatre in Orland Park, Illinois. Late in our fiscal 2009 fourth quarter, we opened our 13thUltraScreen at our newly renovated North Shore Cinema. The newUltraScreens provided a minor favorable impact of the new theatres on our fiscal 2007 operating results was also not significant, due to the timing of the openings in the fiscal year and the fact that the first year includes preopening expenses. We expect all three new theatres to favorably impact fiscal 20082009 operating results. We have identified two other theatresIn conjunction with 12 screens thatour Douglas acquisition, we may close duringalso purchased an additional site for the next year with minimal impact on operating results.
Box office receipts during the summer to-datedevelopment of a new theatre in LaVista, Nebraska, a growing suburb of Omaha, for comparable theatres have essentially matched last year’s strong summer results, despite the fact that our fiscal 2008 first quarter does not include the Memorial Day weekend. Strong performances from films such asPirates of the Caribbean:At World’s End,Fantastic 4:Rise of the Silver Surfer,Ratatouille,Transformers,Harry Potterand the Order of the Phoenix, The Simpsons Movie andThe Bourne Ultimatum have contributed to our early fiscal 2008 results.
The decrease in theatre division revenues, operating income and operating margin during fiscal 2006 compared to the prior year was entirely due to decreased overall attendance at our comparable theatres. Total theatre attendance decreased 4.5% during fiscal 2006 compared to the prior year. Our theatre division operating results were primarily impacted by an overall weak slate of moviesapproximately $4.4 million during our fiscal 20062009 first quarter, compared to a strong first quarter the prior year that included record Memorial Day and July 4th holiday weeks. Total theatre attendance decreased 13.7% during our fiscal 2006 first quarter compared to the prior year’s first quarter, significantly impacting our overall fiscal 2006 results due to the fact that the summer quarter has historically accounted for 35-40% of our total year divisional operating income. In fact, not one of our five highest grossing films during the fiscal 2006 first quarter –War of the Worlds,Star Wars: Episode III – Revenge of the Sith,Batman Begins,Madagascar, andCharlie & The Chocolate Factory – performed as well as any of the previous summer’s top three films,Spider-Man 2,Shrek 2 andHarry Potter and the Prisoner of Azkaban. However, attendance increased 2.4% during the second half of our fiscal 2006, with operating income increasing 5.2% during the same time period as the quality of the movies improved. Partially offsetting our reduced attendance was a 1.7% increase in our average ticket price during fiscal 2006 compared to the prior year, attributable primarily to modest price increases. Our average concession sales per person increased 4.2% during fiscal 2006 compared to the prior year.
Consistent with prior years in which blockbusters accounted for a significant portion of our total box office, our top 15 performing films accounted for 36% of our fiscal 2006 and 2005 box office receipts. Only two fiscal 2006 films produced box office receipts in excess of $3 million for our circuit, compared to five films that reached that amount for us during the prior year. The following five fiscal 2006 films accounted for over 15% of our total box office and produced the most box office receipts for our circuit:Harry Potter and the Goblet of Fire,Chronicles of Narnia: The Lion, The Witch and The Wardrobe,War of the Worlds,Star Wars: Episode III – Revenge of the Sith andWedding Crashers. The quantity of films remained fairly constant during fiscal 2006. We played 189 films at our theatres during fiscal 2006 compared to 188 during fiscal 2005.quarter.
Our theatre division’s operating margin decreased to 22.2% during fiscal 2006, compared to 23.3% in fiscal 2005, due in part to the impact of our fixed expenses on our decreased box office receipts. In addition, our fiscal 2006 operating margin was negatively impacted by a one-time charge of approximately $500,000 related to a minor restructuring of our administrative and theatre supervision organization and a one-time impairment charge of approximately $500,000 related to theatres scheduled to close during fiscal 2007. Our overall concession costs and film rental costs as a percentage of revenues decreased during fiscal 2006. Other revenues remained unchanged compared to the prior year.
2428
Hotels and Resorts
The hotels and resorts division contributed 51.9%40.6% of our consolidated revenues from continuing operations and 31.4%3.1% of our consolidated operating income, excluding corporate items, during fiscal 2007.2010, compared to 43.6% and 18.2%, respectively, during fiscal 2009 and 50.8% and 37.9%, respectively, during fiscal 2008. As of May 31, 2007,27, 2010, the hotels and resorts division owned and operated three full-service hotels in downtown Milwaukee, Wisconsin, a full-facility destination resort in Lake Geneva, Wisconsin and full-service hotels in Madison, Wisconsin, Kansas City, Missouri, Chicago, Illinois and Oklahoma City, Oklahoma. In addition, we managed 1211 hotels, resorts and other properties for other owners. Included in the 1211 managed properties managed for others are two hotels owned by joint ventures thatin which we have a minority interest in and two condominium hotels wherein which we own the public space. The following table sets forth revenues, operating income, operating margin and rooms data for the hotels and resorts division for the last three fiscal years (prior yearyears:
Change F10 v. F09 | Change F09 v. F08 | |||||||||||||||||||||||||
| F2010 | F2009 | Amt. | Pct. | F2008 | Amt. | Pct. | ||||||||||||||||||||
| (in millions, except percentages) | ||||||||||||||||||||||||||
Revenues | $ | 153.9 | $ | 167.1 | $ | (13.2 | ) | -7.9 | % | $ | 188.5 | $ | (21.4 | ) | -11.4 | % | ||||||||||
Operating income | $ | 1.4 | $ | 9.7 | $ | (8.3 | ) | -85.2 | % | $ | 21.6 | $ | (11.9 | ) | -55.0 | % | ||||||||||
Operating margin | 0.9 | % | 5.8 | % | 11.4 | % | ||||||||||||||||||||
| Available rooms at fiscal year-end | F2010 | F2009 | F2008 | |||||||||||||||||||||||
Company-owned |
| 2,520 | 2,520 | 2,520 | ||||||||||||||||||||||
Management contracts with joint ventures |
| 423 | 423 | 423 | ||||||||||||||||||||||
Management contracts with condominium hotels |
| 480 | 480 | 480 | ||||||||||||||||||||||
Management contracts with other owners |
| 1,717 | 1,769 | 1,769 | ||||||||||||||||||||||
Total available rooms |
| 5,140 | 5,192 | 5,192 | ||||||||||||||||||||||
Fiscal 2010 versus Fiscal 2009
Division revenues and operating income and operating margin have been restated to reflect the current presentation of the Miramonte Resort and Marcus Vacation Club timesharing operation as discontinued operations):
| Change F07 v. F06 | Change F06 v. F05 | ||||||||||||||||||||||
|---|---|---|---|---|---|---|---|---|---|---|---|---|---|---|---|---|---|---|---|---|---|---|---|
| 2007 | 2006 | Amt. | Pct. | 2005 | Amt. | Pct. | |||||||||||||||||
| (in millions, except percentages) | |||||||||||||||||||||||
| Revenues | $ | 169.9 | $ | 141.9 | $ | 28.0 | 19.7 | % | $ | 116.5 | $ | 25.4 | 21.8 | % | |||||||||
| Operating income | 15.8 | 15.6 | 0.2 | 1.1 | % | 12.7 | 2.9 | 23.3 | % | ||||||||||||||
| Operating margin | 9.3 | % | 11.0 | % | 10.9 | % | |||||||||||||||||
| Available rooms at fiscal year-end | 2007 | 2006 | 2005 | ||||||||
|---|---|---|---|---|---|---|---|---|---|---|---|
| Company-owned | 2,520 | 2,480 | 1,848 | ||||||||
| Management contracts with joint ventures | 423 | -- | -- | ||||||||
| Management contracts with condominium hotels | 480 | 225 | 225 | ||||||||
| Management contracts with other owners | 1,670 | 811 | 811 | ||||||||
| Total available rooms | 5,093 | 3,516 | 2,884 | ||||||||
Division revenues increaseddecreased during fiscal 20072010 compared to the prior year due to improved overall performance fromthe continued negative impact the current economic environment has had on demand, and in particular, group business travel. In addition, our comparable company-owned hotelsfiscal 2010 operating income was negatively impacted by two significant items related to our Platinum Hotel & Spa in Las Vegas, Nevada. We recognized a $2.6 million pre-tax non-cash impairment charge during fiscal 2010 related to our 16 remaining owned condominium hotel units at this property. The Las Vegas real estate market has been impacted significantly by the recessionary economic conditions and resorts, the additionmarket is currently saturated with unsold hotel condominium units, including a significant number that have recently been constructed. As a result, sales prices of two new company-owned hotels for portionssuch units have declined dramatically and we concluded that impairment indicators were present. The impairment charge reported during fiscal 2010 represents the difference between the carrying amount of the year, increased management fees from new contractsassets and shared revenues from a new condominium hotel opened duringour estimate of the year. Continued improvement in business travel and a particularly strong year for our downtown Chicago hotel contributed to our improved results. Our operating income increased despitecurrent fair value of these assets. We also incurred approximately $7.0$1.7 million in start-up operating losses, including $4.5legal expenses related to various legal proceedings associated with the Platinum Hotel & Spa. We anticipate incurring additional legal expenses of up to $1 million in preopening expenses associated primarily with our Oklahoma City Hilton Skirvin project, the new Las Vegas condominium hotel and the major renovation and rebranding of the InterContinental Milwaukee hotel. These projects also contributed to a lower operating margin during fiscal 2007 compared2011 related to the prior year. The additional week of operations contributed approximately $3.2 million and $570,000, respectively, to ourthese matters.
Decreases in hotels and resorts division revenues and operating income during fiscal 2007.
The division’s total revenue per available room, or RevPAR, for comparable company-owned properties (excluding2010 were partially offset by approximately $400,000 of the Columbus Westin, InterContinental Milwaukeepreviously described gift card breakage income related to fiscal years 2009 and Skirvin Hilton) increased 5.2%prior. In addition, comparisons to fiscal 2009 operating results were favorably impacted by the fact that we reported a $1.3 million charge to earnings during fiscal 2007 compared2009 for losses on funds advanced to owners of managed properties that experienced significant financial hardship as a result of the prior year. Ourreduced travel.
We have implemented numerous strategies to reduce costs during this difficult period in the hotel industry. Excluding the unusual items during fiscal 2010 and 2009 described above, our cost containment measures resulted in approximately 46% of our overall fiscal 2010 revenue decline flowing through to our operating income—a flow-through percentage that compares favorably with others in our industry.
29
The following table sets forth certain operating statistics, including our average occupancy percentage (number of occupied rooms as a percentage of available rooms) decreased 0.1 percentage points and, our average daily room rate, or ADR, increased 5.4%and our total revenue per available room, or RevPAR, for company-owned properties:
| Change F10 v. F09 | |||||||||||||||
| Operating Statistics(1) | F2010 | F2009 | Amt. | Pct. | |||||||||||
Occupancy percentage | 63.7 | % | 62.1 | % | 1.6 pts | 2.6 | % | ||||||||
ADR | $ | 128.93 | $ | 144.41 | $ | (15.48 | ) | -10.7 | % | ||||||
RevPAR | $ | 82.14 | $ | 89.74 | $ | (7.60 | ) | -8.5 | % | ||||||
| (1) | These operating statistics represent averages of eight distinct company-owned hotels and resorts, branded and unbranded, in different geographic markets with a wide range of individual hotel performance. The statistics are not necessarily representative of any particular hotel or resort. |
RevPAR decreased at all eight of our company-owned properties during fiscal 20072010 compared to the prior year. A strong resurgence in demand during our fiscal 2006 for these same properties. The relative lackfourth quarter resulted in an overall increase in our occupancy during fiscal 2010 compared to the prior year, with several of new hotel supply growth and continued strong business travel demand contributedour properties recently renovated performing particularly well during this period. We continue, however, to this ADR increase.experience significant downward pressure on our ADR. According to data received from Smith Travel Research and compiled by us in order to compare our fiscal year results, comparable “upper upscale” hotels throughout the United States experienced a similar decrease in RevPAR of 8.7% during our fiscal 2010. In general, industry data indicated that properties in major destination markets, properties that are perceived to operate near the luxury end of the hotel spectrum and properties with a greater reliance on group business, have experienced the largest declines in RevPAR during this extended period of economic turmoil.
The impact of the improved demand, as well as the fact that comparisons to the prior year were progressively easier, may be seen in the following fiscal 2010 quarterly trends in our operating statistics:
| Change F10 v. F09 | ||||||||
| 1st Qtr. | 2nd Qtr. | 3rd Qtr. | 4th Qtr. | |||||
Occupancy percentage | -8.8pts | -2.0pts | +1.6pts | +15.5pts | ||||
ADR | -11.1% | -12.2% | -8.9% | -6.2% | ||||
RevPAR | -21.1% | -15.0% | -5.8% | +19.3% | ||||
In order to better understand our fiscal 2010 results compared to pre-recessionary levels, however, the following table compares our fiscal 2010 quarterly operating statistics to fiscal 2008 results:
| Change F10 v. F08 | ||||||||
| 1st Qtr. | 2nd Qtr. | 3rd Qtr. | 4th Qtr. | |||||
Occupancy percentage | -9.6pts | -7.4pts | -4.7pts | +5.4pts | ||||
ADR | -11.1% | -11.6% | -10.8% | -15.0% | ||||
RevPAR | -22.0% | -20.7% | -18.5% | -8.2% | ||||
As indicated by the tables above, one of the biggest challenges facing our hotels and resorts division, and the industry as a whole, is the continued decline in ADR. Without a strong group business segment to fill blocks of rooms, we have had to aggressively seek occupancy with the more price sensitive leisure, government and contract customer segments. In addition, we are also booking more rooms on alternate internet channels, further driving down our ADR.
30
Hotel revenues have historically tracked very closely with traditional macroeconomic statistics such as the Gross Domestic Product (GDP). Although the current near-term outlook for this division’s performance remains uncertain in light of the current economic and employment environment, we were very encouraged by our fiscal 2010 fourth quarter results and the growing optimism in the marketplace that the industry will see further improvement during our fiscal 2011. The hotel business has historically been a very cyclical business and these cycles have had many consistent elements over the years. The first sign of recovery in past cycles has been a slow and steady increase in occupancy rates. Our fiscal 2010 third and fourth quarter increases in our occupancy rate, as well as similar increases reported by others in our industry, may be an indication that we are in this first phase of the recovery cycle. Historically, the cycle completes itself when ADR and margins return to pre-recession levels. What is unknown is how long it will take for ADR and margins to rebound. Due to the fact that the lead time for reservations from both the corporate transient and leisure customer is relatively short (often only one to two weeks) compared to historic norms, our ability to project future occupancies from these customers is very limited. In recent months, we have experienced some improvement in our group business booking pace, but we will likely continue to see ADR’s lower than those of comparable prior periods in the near term. We will continue to offer value packages to our guests in an effort to increase demand and we will attempt to shift market share away from alternate internet channels and towards our own booking channels.
If a future recovery unfolds similarly to recoveries from prior down cycles, it will likely take group business longer to return to “normal” levels, as companies typically take a very cautious approach on these expenditures before restoring their pre-recessionary budgets. Prior year comparisons, however, will likely continue to become more favorable in future periods. As a result, assuming economic conditions do not worsen, we believe that we may continue to report increases in our comparable RevPAR in the periods ahead. The fact that any improvement in RevPAR in the near term will likely be the result of increased occupancy, and not ADR, will likely imply that our operating margins will continue to be challenged, as our operating costs traditionally increase as occupancy increases. A potentially positive aspect of the current circumstances is the likelihood that supply growth will continue to be minimal in the near term, which may have a favorable impact on owners of existing hotels like us. We will continue to monitor the situation and adjust our sales focus and operating costs as needed.
Fiscal 2009 versus Fiscal 2008
Division revenues and operating income decreased during fiscal 2009 compared to the prior year due to the negative impact the recessionary environment had on all customer segments—group business, corporate transient and leisure. Food and beverage revenues at our hotels declined at a slightly higher pace than room revenues as customers also reduced the amount they spent during their stay. Comparisons to the prior year’s revenues and operating income were negatively impacted by the fact that, during fiscal 2008, we received a $900,000 development fee related to a hotel project for another owner to whom we provided assistance. In addition, fiscal 2009 operating results were negatively impacted by reduced management fees and a $1.3 million charge to earnings for potential losses on funds advanced to owners of managed properties that have experienced significant financial hardship as a result of the reduced travel.
The following table sets forth certain operating statistics, including our average occupancy percentage, our ADR, and RevPAR, for company-owned properties:
| Change F09 v. F08 | |||||||||||||||
| Operating Statistics(1) | F2009 | F2008 | Amt. | Pct. | |||||||||||
Occupancy percentage | 62.1 | % | 67.8 | % | -5.7 pts | -8.3 | % | ||||||||
ADR | $ | 144.41 | $ | 147.22 | $ | (2.81 | ) | -1.9 | % | ||||||
RevPAR | $ | 89.74 | $ | 99.79 | $ | (10.05 | ) | -10.1 | % | ||||||
| (1) | These operating statistics represent averages of eight distinct company-owned hotels and resorts, branded and unbranded, in different geographic markets with a wide range of individual hotel performance. The statistics are not necessarily representative of any particular hotel or resort. |
31
RevPAR decreased at seven of our eight company-owned properties during fiscal 2009 compared to the prior year. In addition to the one property with increased RevPAR during fiscal 2009, two other properties experienced RevPAR declines of only 2% or less. In general, owned and managed properties in major destination markets or with a greater reliance on group business experienced the largest declines in RevPAR during fiscal 2009. According to data received from Smith Travel Research and compiled by us in order to compare our fiscal year results, comparable upper upscale hotels throughout the United States experienced a similar increaseslightly higher decrease in RevPAR of 6.0%12.3% during our fiscal 2007.
25
Our Las Vegas condominium hotel project, the Platinum Hotel, opened in late October 2006. Start-up operating losses and preopening expenses, magnified by the fact that we were generally unable to rent a unit until after the condominium sale closed, negatively impacted our fiscal 2007 results. As manager of this hotel and now 100% owner of the public space (with all condominium units to be ultimately individually-owned), we expect the Platinum will contribute to revenues and operating income of our hotels and resorts division in several ways. In addition to earning a management fee equal to a share of room revenue, we are now reporting 100% of the revenues and profits (or losses) generated by the public space at this non-gaming, non-smoking hotel, including the restaurant, lounge, meeting space and spa.
Renovations of the historic Skirvin Hilton hotel were completed in late February and the 225-room property reopened during the first week of our fiscal 2007 fourth quarter, becoming our fifth historic hotel under management. As the principal equity partner in this complex public-private venture, the hotel is reported as a company-owned property and fiscal 2008 division revenues will be favorably impacted as a result. Our total equity investment in this venture was approximately $12.2 million, the majority of which is expected to be recouped from previously described federal and state historic tax credits related to this project. The remaining funds for this approximately $55 million project were provided by contributions from Oklahoma City, new markets tax credits and project-specific mortgage debt. Preopening costs from this project had a significant negative impact on our overall operating results during fiscal 2007. We expect this hotel to contribute positively to fiscal 2008 operating results.
In late April 2007, we sold the 186-room Westin Columbus hotel for $16.4 million, before transaction costs, into a joint venture formed by us and an entity sponsored by Chicago-based Waterton Commercial LLC. We own a 15% minority interest in the joint venture and will continue to manage the property under a long-term management agreement, as well as oversee a major, multi-million dollar renovation of the property. The sale of the Westin Columbus into a joint venture was contemplated when the property was initially acquired in May 2006. This hotel was included in our consolidated results for most of the fiscal year and contributed to our increased revenues and operating income during fiscal 2007. As a result of the sale, we will no longer include this hotel in our consolidated operating results and fiscal 2008 revenues and operating income will be slightly negatively impacted.
Six new management contracts were added during fiscal 2007. In June 2006, we agreed to provide hospitality management services to the new owner of our former vacation ownership development at Grand Geneva. In October 2006, we entered into an agreement to manage Brynwood Country Club in Milwaukee, Wisconsin and in November 2006, we assumed management of Resort Suites, a four-star 483-room destination resort in Scottsdale, Arizona owned by a subsidiary of Goldman Sachs. The new properties leverage our golf course and upscale resort management experience and should be excellent additions to our portfolio. In February 2007, we entered an agreement to manage the Sheraton Clayton Plaza Hotel St. Louis, a 257-room property in an upscale western suburb of St. Louis owned by another subsidiary of Goldman Sachs. We were also selected to manage an under-construction 256-room Hilton hotel in Bloomington, Minnesota, under a long-term contract with another owner. We are currently providing preopening and technical services for this project. The sixth contract added during fiscal 2007 is with another joint venture we formed with a fund sponsored by Waterton Commercial LLC to acquire the 237-room Sheraton Madison Hotel in Madison, Wisconsin. We also have a 15% minority interest in this joint venture and will manage the hotel and oversee a major renovation of the property. Although total revenues from an individual hotel management contract are significantly less than from an owned hotel, the operating margins are significantly higher2009, likely due to the fact that all direct costs of operating the property are borne by the ownerdifferent markets in which we operate.
The worsening effect of the property. Management contracts provide us with an opportunity to increase our total number of rooms managed without a significant investment, thereby increasing our returns on equity from this division.
We also recently completed several capital projects at existing hotels that should enhancerecession can be seen in the long-term value of these properties. A significant renovation and repositioning of the Wyndham Milwaukee Center, including converting to the luxury InterContinental brand, was completed during ourfollowing fiscal 2007 third quarter. The newly renovated lobby, ballroom, restaurant and bar opened late2009 quarterly trends in our second quarteroperating statistics:
| Change F09 v. F08 | ||||||||||||
| 1st Qtr. | 2nd Qtr. | 3rd Qtr. | 4th Qtr. | |||||||||
Occupancy percentage | -0.8 | pts | -5.4 | pts | -6.3 | pts | -10.1 | pts | ||||
ADR | 0.1 | % | 0.7 | % | -2.0 | % | -9.4 | % | ||||
RevPAR | -1.0 | % | -6.8 | % | -13.5 | % | -23.0 | % | ||||
Division operating income and a complete rooms renovation was completed in December 2006. As noted earlier, preopening expenses and start-up operating losses related to the repositioning of this hotel as a sophisticated, upscale property negatively impacted our fiscal 2007 results. Additional projects completedmargins declined during fiscal 2007 include a 12,000 square foot conference center expansion at the Grand Geneva Resort and a new featured restaurant, the Mason Street Grill, at our Pfister Hotel. Preopening expenses for this restaurant, which has received very positive reaction from customers, also had a negative impact on fiscal 2007 results. A new spa and salon opened at the Pfister in April 2007. A major garage restoration project and a meeting and banquet space renovation currently underway at the Pfister will likely have a slight negative impact on that hotel’s fiscal 2008 operating results.
26
The near-term outlook for the future performance of this division continues to appear promising. Our advanced bookings for the early months of fiscal 2008 have been strong. Favorable comparisons to fiscal 2007 operating results at our newest hotels that experienced significant preopening expenses and start-up operating losses should benefit our fiscal 2008 results from this division. Although there is an increased number of proposed new hotels in several of our markets, including Milwaukee, supply growth during fiscal 2008 appears to be minimal. Subject to economic conditions that historically can have a significant impact on hotel demand, we currently expect continued improvement in our division operating results during fiscal 2008.
Division revenues and operating income increased during fiscal 20062009 compared to the prior year due to improved overall performancethe aforementioned reduced revenues. Improved operating results from our five comparable company-owned hotels and resorts and the addition of three new company-owned hotels during the year. Continued improvementnewest hotel in business travel, particularly from the short-term transient business traveler, contributed to our improved results. Group business was inconsistent during fiscal 2006, particularly at our Grand Geneva Resort. The group business segment is very important to several of our properties, as this is a segment of our customer base that typically provides non-room revenues to our hotels and resorts which are a key to increasing profitability levels. Our operating income and operating margin increased despite over $500,000 in start-up and preopening costs associated with our Oklahoma City Hilton Skirvin project.
The division’s total RevPAR for comparable company-owned properties increased 6.8% during fiscal 2006 compared toonly partially offset the prior year. Our occupancy percentage increased 1.7 percentage points and our ADR increased 4.1% during fiscal 2006 compared to fiscal 2005. The relative lack of new hotel supply growth and continued improvementsignificant declines in business travel demand contributed to this ADR increase after several years of stagnant or declining ratesoperating income at our hotels and throughoutmost impacted by the economic downturn. We implemented numerous strategies to reduce costs during this difficult period in the hotel industry. According to data received from Smith Travel Research, comparable upper upscale hotels throughoutExcluding the United States experienced an increase in RevPAR of 9.1% during our fiscal 2006. Hotels located in the Midwest, where all of our comparable hotels reside, generally did not achieve as high year-over-year RevPAR increases as those on the East and West Coasts.
During the first week of fiscal 2006, we purchased the 220-room Wyndham Milwaukee Center hotel for a total cash purchase price of $23.6 million. We also opened another new hotel during the first week of fiscal 2006 — the Four Points by Sheraton Chicago Downtown/Magnificent Mile. Our operating results from this property contributed favorably to our year-over-year comparison to fiscal 2005, primarily due to significant preopening expenses incurred at this property during the fiscal 2005 fourth quarter. We added a third new company-owned hotel on May 2, 2006 when we purchased the historic Westin Columbus Hotel in downtown Columbus, Ohio for a total cash purchase price of $16.3 million.
In addition to normal maintenance projects at all of our properties, several significant improvements were made to our Grand Geneva Resort & Spa during fiscal 2006, including golf course improvements and a renovation of its front entrance and restaurants. We also expanded our internalpreviously described non-comparable development team during fiscal 2006 in order to help facilitate our future growth.
During fiscal 2005, we sold substantially all of the assets of our limited-service lodging division for approximately $415 million in cash, excluding transaction costs, andfee reported a significant after-tax gain of $74.7 million on sale of discontinued operations. At the time of the sale, a portion of the sales proceeds was held in escrow pending completion of certain customary transfer requirements on several locations. During fiscal 2006, the necessary transfer requirements for the six remaining escrowed locations were met and one of the three remaining joint venture properties was sold. As a result, additional after-tax gains on sale of discontinued operations of $7.8 million were recognized during fiscal 2006.
27
We have accounted for the results of our limited-service lodging division as discontinued operations in our consolidated financial statements for all years presented. The following table sets forth revenues, operating income (loss), income (loss) from discontinued operations and gain (loss) on sale of discontinued operations, net of applicable taxes, for our limited-service lodging division for the last three fiscal years:
| Change F07 v. F06 | Change F06 v. F05 | ||||||||||||||||||||||
|---|---|---|---|---|---|---|---|---|---|---|---|---|---|---|---|---|---|---|---|---|---|---|---|
| 2007 | 2006 | Amt. | Pct. | 2005 | Amt. | Pct. | |||||||||||||||||
| (in millions, except percentages) | |||||||||||||||||||||||
| Revenues | $ | 0.1 | $ | 0.6 | $ | (0.5 | ) | -80.5 | % | $ | 43.5 | $ | (42.9 | ) | -98.6 | % | |||||||
| Operating income (loss) | (0.2 | ) | (1.6 | ) | 1.4 | 90.1 | % | 5.7 | (7.3 | ) | -127.5 | % | |||||||||||
| Income (loss) from | |||||||||||||||||||||||
| discontinued operations | (0.5 | ) | (1.1 | ) | 0.6 | 57.1 | % | 3.0 | (4.1 | ) | -137.5 | % | |||||||||||
| (net of income taxes) | |||||||||||||||||||||||
| Gain (loss) on sale of | |||||||||||||||||||||||
| discontinued operations | (0.3 | ) | 7.8 | (8.1 | ) | -103.1 | % | 74.7 | (66.9 | ) | -89.6 | % | |||||||||||
| (net of income taxes) | |||||||||||||||||||||||
Our fiscal 2007 and 2006 operating results included results from the remaining joint venture Baymont Inns & Suites that were excluded from the sale and are now operating as Baymont franchises. We are actively exploring opportunities to sell the remaining two properties and, as a result, we continue to include their operating results in discontinued operations. Our fiscal 2006 loss from discontinued operations included a one-time charge to earnings related to the costs associated with exiting leased office space for our former limited-service lodging division. Our fiscal 2005 operating results included 14 weeks of operations prior to completion of the sale and various costs associated with exiting the business.
During fiscal 2005, we sold the Miramonte Resort for $28.7 million in cash, before transaction costs. As a result of this transaction, we reported an after-tax gain of $3.6 million during fiscal 2005. Settlement of a dispute with a contractor during fiscal 2006 resulted in a $90,000 after tax reduction in the reported gain. Operating results for the Miramonte Resort for fiscal 2005 included almost 27 weeks of operation prior to completion of the sale.
We have accounted for the results of the Miramonte Resort, which had previously been included in our hotels and resorts segment results, as discontinued operations in our consolidated financial statements for all years presented. The following table sets forth revenues, operating loss, loss from discontinued operations and gain (loss) on sale of discontinued operations, net of applicable taxes, for the Miramonte Resort for the last three fiscal years:
| Change F07 v. F06 | Change F06 v. F05 | ||||||||||||||||||||||
|---|---|---|---|---|---|---|---|---|---|---|---|---|---|---|---|---|---|---|---|---|---|---|---|
| 2007 | 2006 | Amt. | Pct. | 2005 | Amt. | Pct. | |||||||||||||||||
| (in millions, except percentages) | |||||||||||||||||||||||
| Revenues | $ | -- | $ | - | $ | - | -- | $ | 3.4 | $ | (3.4 | ) | -100.0 | % | |||||||||
| Operating loss | -- | (0.1 | ) | 0.1 | 100.0 | % | (2.2 | ) | 2.1 | 95.7 | % | ||||||||||||
| Loss from | |||||||||||||||||||||||
| discontinued operations | -- | (0.1 | ) | 0.1 | 100.0 | % | (1.3 | ) | 1.2 | 95.3 | % | ||||||||||||
| (net of income taxes) | |||||||||||||||||||||||
| Gain (loss) on sale of | |||||||||||||||||||||||
| discontinued operations | -- | (0.1 | ) | 0.1 | 100.0 | % | 3.6 | (3.7 | ) | -102.5 | % | ||||||||||||
| (net of income taxes) | |||||||||||||||||||||||
28
Early in our fiscal 2007 first2008 third quarter, we sold the remaining timeshare inventoryreserve for potential losses related to management contracts with other owners reported during fiscal 2009 and a one-time unfavorable adjustment to real estate taxes at our Chicago Four Points hotel during fiscal 2008, our cost containment measures resulted in approximately 49% of our Marcus Vacation Club at Grand Geneva vacation ownership developmentoverall fiscal 2009 revenue decline flowing through to Orange Lake Resort & Country Club of Orlando, Florida. The assets sold consisted primarily of real estate and development costs — Orange Lake acquired the remaining 34 units of the 136-unit Marcus Vacation Club property. Our hotels and resorts division will continue to provide hospitality management services for the property and continues to hold notes receivable from prior buyers of timeshare units, but will no longer be in the business of selling timeshare units.
We have accounted for the results of the Marcus Vacation Club, which had previously been includedour operating income—a flow-through percentage that generally compares favorably with others in our hotels and resorts segment results, as discontinued operations in our consolidated financial statements for all years presented. The following table sets forth revenues, operating loss, loss from discontinued operations and gain on sale of discontinued operations, net of applicable taxes, for the Marcus Vacation Club for the last three fiscal years:industry.
| Change F07 v. F06 | Change F06 v. F05 | ||||||||||||||||||||||
|---|---|---|---|---|---|---|---|---|---|---|---|---|---|---|---|---|---|---|---|---|---|---|---|
| 2007 | 2006 | Amt. | Pct. | 2005 | Amt. | Pct. | |||||||||||||||||
| (in millions, except percentages) | |||||||||||||||||||||||
| Revenues | $ | 4.0 | $ | 4.8 | $ | (0.8 | ) | -18.1 | % | $ | 5.6 | $ | (0.8 | ) | -14.4 | % | |||||||
| Operating loss | -- | (1.1 | ) | 1.1 | 97.0 | % | (0.6 | ) | (0.5 | ) | -93.8 | % | |||||||||||
| Loss from | |||||||||||||||||||||||
| discontinued operations | -- | (0.7 | ) | 0.7 | 97.2 | % | (0.3 | ) | (0.4 | ) | -113.0 | % | |||||||||||
| (net of income taxes) | |||||||||||||||||||||||
| Gain on sale of | |||||||||||||||||||||||
| discontinued operations | 0.1 | -- | 0.1 | N/A | -- | -- | -- | ||||||||||||||||
| (net of income taxes) | |||||||||||||||||||||||
Financial Condition
Liquidity and Capital Resources
Our movie theatre and hotels and resorts businesses each generate significant and relatively consistent daily amounts of cash, subject to previously noted seasonality, because each segment’s revenue is derived predominantly from consumer cash purchases. We believe that these relatively consistent and predictable cash sources, as well as the availability of $55$107 million of unused credit lines at fiscal 20072010 year-end, should be adequate to support the ongoing operational liquidity needs of our businesses during fiscal 2008.2011.
Our revolving credit agreement has three years remaining at very favorable terms (LIBOR plus 0.60% to 1.00%, based on our borrowing levels). The majority of our long-term debt consists of senior notes with limited annual maturities—$14.2 million and $16.4 million in fiscal 2011 and 2012, respectively. We currently have one mortgage note for $25.2 million that is due in fiscal 2011, but we anticipate successfully extending the maturity of that note during fiscal 2011. We are also in a very good position with our two primary financial covenants—as of May 27, 2010, our debt-to-capitalization ratio was 0.41 and our fixed charge coverage ratio was 4.1, compared to limitations of 0.55 and 3.0, respectively, as specified in our revolving credit agreement. We currently do not expect any covenant violations during fiscal 2011.
Fiscal 20072010 versus Fiscal 20062009
Net cash provided by operating activities totaled $64.9$52.7 million during fiscal 2007, an increase2010, a decrease of $25.3$16.7 million, or 24.1%, compared to $39.6$69.4 million during fiscal 2006.2009. The increasedecrease was due primarily to increased earnings (excluding gains from sales of property, equipment and other assets and gains from sale of discontinued operations) and deferred taxes, as well as favorableunfavorable timing in the collection of accounts and notes receivable, the payment of accounts payable and income taxes and
32
a decrease in deferred compensation and other, current assets, partially offset by unfavorablean increase in deferred income taxes and favorable timing in the payment of other accrued liabilities.compensation.
Net cash used in investing activities during fiscal 20072010 totaled $72.3$21.4 million compared to $20.5$35.4 million during fiscal 2006, an increase2009, a decrease of $51.8 million.$14.0 million or 39.6%. The increasedecrease in net cash used in investing activities was primarily the result of increaseddecreased capital expenditures and acquisitions, decreased cash received from intermediaries and increased purchasesthe return of additional interests in joint ventures, partially offset by increased cash proceeds from disposals of property, equipment and other assets and increasedsplit dollar life insurance policy premiums during fiscal 2010. We had minimal proceeds from the sale of condominium units. Our fiscal 2007 results included $95.7 million of net proceeds from the sale of condominium units at our Platinum Hotel in Las Vegas. Our fiscal 2006 results included $25.0 million of net proceeds from the disposal of our limited-service lodging division. In addition, fiscal 2006 results included $26.8 million of cash received from intermediaries related to net proceeds receivedassets during fiscal 2005 from the sale of the Miramonte Resort. Cash proceeds from the disposals of property, equipment2010 and other assets totaled $32.2 million and $6.9 million during fiscal 2007 and 2006, respectively. The2009.
Total cash proceeds received during fiscal 2007 were primarily the result of our sale of the Westin Columbus, a former theatre property, four former restaurant locations and several excess parcels of land. The cash proceeds received during fiscal 2006 were primarily the result of our sale of a non-operating real estate development, a former restaurant location and several excess parcels of land. In addition, during fiscal 2007 and 2006, we received $4.0 and $7.4 million, respectively, from Oklahoma City in conjunction with their contribution to the renovation of the Skirvin Hilton Hotel. The city’s total contribution of over $11 million was reported as a reduction to our property and equipment and will reduce future depreciation expense for this asset.
29
Total capital expenditures and acquisitions (including normal continuing capital maintenance projects) totaled $186.8$25.1 million during fiscal 2007, including our acquisition of the CEC theatres,2010 compared to $75.5$35.7 million of capital expenditures and acquisitions incurred in fiscal 2006 (including the acquisitions of the Wyndham Milwaukee Center and Westin Columbus).2009. We incurred approximately $70.6$15.6 million of capital expenditures during fiscal 20072010 in our hotels and resorts division, including costs associated with the Skirvinpreviously described renovations at our Hilton renovation, InterContinental Milwaukee renovation and projects at the Grand Geneva Resort and Pfister Hotel. In addition to the CEC acquisition for $75.7 million, weproperties. We incurred approximately $39.7$9.4 million of capital expenditures during fiscal 20072010 in our theatre division, including costs associated with a land purchase in Sun Prairie, Wisconsin, a major remodeling at our Coral Ridge, Iowa theatre and digital 3D projectors. During fiscal 2009, we incurred approximately $14.7 million of capital expenditures in our hotels and resorts division, including costs associated with the previously described renovations at our Hilton Milwaukee and Grand Geneva properties. We incurred approximately $20.9 million of capital expenditures during fiscal 2009 in our theatre division, including costs associated with the threetwo new theatresUltraScreens opened during the year. In addition to capital expenditures, we also incurred $11.1 million and $1.7 million, respectively, during fiscal 2007 and 2006year, a land purchase in connection with the purchase of interests in joint ventures, including our interests in the Platinum Hotel, the Sheraton MadisonNebraska, digital 3D projectors and the Columbus Westin. During fiscal 2006, we incurred $65.8 million of capital expenditures for our hotels and resorts division, the majority of which was related to our purchasesrenovation of the aforementioned two hotels, completion of our Chicago hotel construction and beginning of construction onNorth Shore Cinema (including the Oklahoma City hotel project. We also incurred fiscal 2006 capital expenditures of $8.4 million in our theatre division, including costs associated with a parking structure at one of our Chicago-area theatres. EstimatednewZaffiro’srestaurant). Our estimated current planned fiscal 20082011 capital expenditures, which may be in the $60-$40-$8060 million range (excluding potential acquisitions), are described in greater detail in the Current Plans section of this discussion.
Net cash used in financing activities in fiscal 20072010 totaled $15.1$29.0 million, a decrease of $11.7 million, or 28.7%, compared to $243.6$40.7 million induring fiscal 2006, with the decrease2009. The difference related primarily related to our $214.6 million special dividend paid during our fiscal 2006 fourth quarter.increased net proceeds from issuance of notes payable and long-term debt. During fiscal 2007,2010, we received $111.4$77.9 million of net proceeds from the issuance of notes payable and long-term debt, compared to $5.6$67.1 million during fiscal 2006. The2009. Fiscal 2010 and 2009 proceeds during fiscal 2007 were primarily from debt related to the Skirvin Hilton andresult of periodic short-term borrowings on commercial paper andunder our revolving credit facility used to finance the CEC theatre acquisition. Fiscal 2006 proceeds were from mortgage debt related to our downtown Chicago hotel.facility. We made total principal payments on notes payable and long-term debt of $111.3$96.8 million and $27.3$98.3 million during fiscal 20072010 and 2006,2009, respectively, representing mostly the payment of current maturities of senior notes and the payment of short-term commercial paper and revolving credit borrowings during both years and payment of construction loans on the Platinum Hotel of $81.9 during fiscal 2007.years. As a result, our total debt (including current maturities) increaseddecreased to $256.7$236.4 million at the close of fiscal 2007,2010, compared to $176.5$255.4 million at the end of fiscal 2006.2009. Our debt-capitalization ratio was 0.450.41 at May 31, 2007,27, 2010, compared to 0.370.44 at the prior fiscal year-end. Based upon our current expectations for fiscal 20082011 capital expenditure levels and excluding any potential asset sales proceeds,acquisitions, we anticipate our long-term debt total and debt-capitalization ratio will not change significantly during fiscal 2008.2011. Our actual long-term debt total and debt-capitalization ratio at the end of fiscal 20082011 will likely be dependent upon our actual operating results, capital expenditures, potential acquisitions, asset sales proceeds and equity transactions during the year.
During fiscal 2007,2010, we repurchased 411,00070,000 of our common shares for approximately $8.1 million$769,000 in conjunction with the exercise of stock options and the purchase of shares in the open market, compared to 313,00020,000 of common shares repurchased for approximately $6.5$324,000 during fiscal 2009 in conjunction with the exercise of stock options. We also repurchased an additional 313,000 of our common shares for approximately $3.4 million during the first weeks of our fiscal 2006. Our Board2011 first quarter. As a result, as of Directors has authorized the repurchasedate of up to 4.7this filing, approximately 1.9 million shares of our outstanding common stock. As of May 31, 2007, approximately 1.1 million shares remainedremain available under thisprior repurchase authorization.authorizations. Any additional repurchases are expected to be executed on the open market or in privately negotiated transactions depending upon a number of factors, including prevailing market conditions.
Fiscal 20062009 versus Fiscal 20052008
Net cash provided by operating activities totaled $39.6$69.4 million during fiscal 2006,2009, an increase of $52.6$11.6 million or 20.2%, compared to net cash used in operating activities of $13.0$57.8 million during fiscal 2005.2008. The increase was due primarily to $75.7 million in income taxes, including a reduction in deferred income taxes, during fiscal 2005 related principally to the gain on sale of discontinued operations, as well as a differencefavorable
33
timing in the timing of paymentspayment of accounts payable and taxes other than income, partially offset by unfavorable comparisons in collectionscollection of accounts and notes receivable and an increase in deferred compensation and other, current assets.partially offset by a decrease in deferred income taxes and unfavorable timing in the payment of accrued compensation.
30
Net cash used in investing activities during fiscal 20062009 totaled $20.5$35.4 million compared to net cash provided by investing activities of $302.4$60.2 million during fiscal 2005. Our fiscal 2005 results included $365.42008, a decrease of $24.8 million or 41.2%. The decrease in net cash used in investing activities was primarily the result of net proceeds from the disposal of our limited-service lodging division, compared to $25.0 million during fiscal 2006. In addition, fiscal 2005 results included $28.5 million of netdecreased acquisitions and a decrease in other assets, partially offset by an increase in capital expenditures and a decrease in cash received that was previously held by intermediaries. We had minimal proceeds from the sale of the Miramonte Resort, all of which was invested with intermediaries to facilitate potential tax deferral opportunities. Theassets during fiscal 2009 and 2008.
Total cash held by intermediaries was released shortly after year-end, a portion of which was used to purchase the Wyndham Milwaukee Center hotel. Cash proceeds from the disposals of other property and equipmentcapital expenditures (including normal continuing capital maintenance projects) totaled $6.9 million and $4.2$35.7 million during fiscal 2006 and 2005, respectively. The cash proceeds received during fiscal 2005 were primarily the result of our sale of two outlots on existing theatre land parcels, a four-screen theatre and an excess land parcel. In addition, during fiscal 2006, we received $7.4 million from Oklahoma City in conjunction with their contribution to the renovation of the Hilton Skirvin Hotel.
Total capital expenditures totaled $75.5 million during fiscal 2006, including the acquisitions of the Wyndham Milwaukee Center and Westin Columbus,2009 compared to $63.4$24.4 million of capital expenditures incurred in fiscal 2005.2008 (excluding our $40.5 million acquisition of the Douglas theatres). We incurred $65.8approximately $14.7 million of capital expenditures during fiscal 20062009 in our hotels and resorts division, compared to $21.5 million for this division during fiscal 2005. In addition, weincluding costs associated with the previously described renovations at our Hilton Milwaukee and Grand Geneva properties. We incurred $8.4approximately $20.9 million of capital expenditures during fiscal 20062009 in our theatre division, compared to $35.9including costs associated with the two newUltraScreens opened during the year, the land purchase in Nebraska, digital 3D projectors and the renovation of the North Shore Cinema (including the newZaffiro’srestaurant). During fiscal 2008, we incurred approximately $15.8 million of capital expenditures for our hotels and resorts division, including costs associated with renovations at our Pfister Hotel. Excluding the Douglas acquisition, we incurred fiscal 2008 capital expenditures of $8.5 million in our theatre division, during fiscal 2005. In addition to capital expenditures, we also incurred $1.7 million and $4.3 million, respectively, during fiscal 2006 and 2005 in connectionincluding costs associated with the purchase of interests in joint ventures.newUltraScreen opened during the year.
Net cash used in financing activities in fiscal 20062009 totaled $243.6$40.7 million, compared to $40.0net cash provided by financing activities of $3.8 million in fiscal 2005,2008, with the increasedifference primarily related to the $214.6 million special dividend paidincreased principal payments on notes payable and long-term debt and reduced net proceeds from issuance of notes payable and long-term debt, partially offset by reduced treasury stock transactions during our fiscal 2006 fourth quarter.2009. During fiscal 2006,2009, we received $5.6$67.1 million of net proceeds from the issuance of notes payable and long-term debt, compared to $13.6$75.5 million during fiscal 2005. The2008. Fiscal 2009 proceeds during both fiscal years were from mortgage debt related toprimarily the result of replacing existing commercial paper borrowings with borrowings under our downtown Chicago hotel.revolving credit facility. Fiscal 2008 proceeds were primarily the result of the issuance of $60 million of unsecured senior notes privately placed with four institutional lenders in April 2008. We made total principal payments on notes payable and long-term debt of $27.3$98.3 million and $53.7$47.3 million during fiscal 20062009 and 2005,2008, respectively, representing primarily the payment of current maturities of senior notes during both years and the aforementioned payment of borrowings on commercial paper and revolving credit facilities with the excess operating cash flow and sales proceeds availableborrowings during fiscal 2005.2009. As a result, our total debt (including current maturities) decreased to $176.5$255.4 million at the close of fiscal 2006,2009, compared to $196.7$284.9 million at the end of fiscal 2005.2008. Our debt-capitalization ratio was 0.370.44 at May 25, 2006,28, 2009, compared to 0.280.47 at the prior fiscal year-end.
During fiscal 2006,2009, we purchased 313,000repurchased 20,000 of our common shares for approximately $6.5$324,000 in conjunction with the exercise of stock options. This compares to 828,000 of common shares repurchased for approximately $14.3 million during fiscal 2008 in conjunction with the exercise of stock options and the purchase of shares in the open market, compared to 28,000 of common shares repurchased for approximately $518,000 during fiscal 2005.market.
31
34
Contractual Obligations
We have obligations and commitments to make future payments under debt and operating leases. The following schedule details these obligations at May 31, 200727, 2010 (in thousands):
| Payments Due by Period | |||||||||||||||||
|---|---|---|---|---|---|---|---|---|---|---|---|---|---|---|---|---|---|
| Total | Less Than 1 Year | 1-3 Years | 4-5 Years | After 5 Years | |||||||||||||
| Long-term debt | $ | 256,675 | $ | 57,250 | $ | 116,420 | $ | 28,570 | $ | 54,435 | |||||||
| Notes payable | 239 | 239 | -- | -- | -- | ||||||||||||
| Operating lease obligations | 90,808 | 3,521 | 7,240 | 7,163 | 72,884 | ||||||||||||
| Construction commitments | 7,075 | 7,075 | -- | -- | -- | ||||||||||||
| Total contractual obligations | $ | 354,797 | $ | 68,085 | $ | 123,660 | $ | 35,733 | $ | 127,319 | |||||||
| Payments Due by Period | |||||||||||||||
| Total | Less Than 1 Year | 1-3 Years | 4-5 Years | After 5 Years | |||||||||||
Long-term debt | $ | 236,443 | $ | 39,610 | $ | 122,428 | $ | 9,727 | $ | 64,678 | |||||
Notes payable | 221 | 221 | — | — | — | ||||||||||
Operating lease obligations | 142,904 | 7,073 | 14,066 | 13,308 | 108,457 | ||||||||||
Construction commitments | 3,395 | 3,395 | — | — | — | ||||||||||
Total contractual obligations | $ | 382,963 | $ | 50,299 | $ | 136,494 | $ | 23,035 | $ | 173,135 | |||||
Additional detail describing our long-term debt is included in Note 5 toof our consolidated financial statements.
As of May 31, 2007,27, 2010, we had no additional material purchase obligations other than those created in the ordinary course of business related to property and equipment, which generally have terms of less than 90 days. We also have long-term obligations related to our employee benefit plans, which are discussed in detail in Note 7 of our consolidated financial statements. We have not included uncertain tax obligations in the table of contractual obligations due to uncertainty as to the timing of any potential payments.
We guarantee debt of oura 50% unconsolidated joint ventures and other entities.venture. Our joint venture partnerspartner also guaranteeguarantees all or a portion of this same debt.
We have approximately sixthree and one-half years remaining on a ten and one-half year office lease. During fiscal 2006, the lease was amended in order to allow us to exit the leased office space for our former limited-service lodging division. To induce the landlord to amend the lease, we guaranteed the lease obligations of the new tenant of the relinquished space throughout the remaining term of the lease.
The following schedule details our guarantee obligations at May 31, 200727, 2010 (in thousands):
| Expiration by Period | |||||||||||||||||
|---|---|---|---|---|---|---|---|---|---|---|---|---|---|---|---|---|---|
| Total | Less Than 1 Year | 1-3 Years | 4-5 Years | After 5 Years | |||||||||||||
| Debt guarantee obligations | $ | 4,835 | $ | 1,650 | $ | 3,185 | $ | -- | $ | -- | |||||||
| Lease guarantee obligations | 2,854 | 408 | 846 | 887 | 713 | ||||||||||||
| Total guarantee obligations | $ | 7,689 | $ | 2,058 | $ | 4,031 | $ | 887 | $ | 713 | |||||||
| Expiration by Period | |||||||||||||||
| Total | Less Than 1 Year | 1-3 Years | 4-5 Years | After 5 Years | |||||||||||
Debt guarantee obligations | $ | 1,443 | $ | 1,443 | $ | — | $ | — | $ | — | |||||
Lease guarantee obligations | 1,600 | 438 | 918 | 244 | — | ||||||||||
Total guarantee obligations | $ | 3,043 | $ | 1,881 | $ | 918 | $ | 244 | $ | — | |||||
Quantitative and Qualitative Disclosures About Market Risk
We are exposed to market risk related to changes in interest rates and we manage our exposure to this market risk by monitoring available financing alternatives.
Variable interest rate debt outstanding as of May 31, 200727, 2010 was $95.9$68.7 million, carried an average interest rate of 6.1%1.3% and represented 37.4%29.1% of our total debt portfolio. Our earnings are affected by changes in short-term interest rates as a result of our borrowings under our revolving credit agreementsagreement, commercial paper and floating-rate mortgages.
Fixed interest rate debt totaled $160.8$167.7 million as of May 31, 2007,27, 2010, carried an average interest rate of 6.4%5.7% and represented 62.6%70.9% of our total debt portfolio. Fixed interest rate debt included the following: senior notes
35
bearing interest semiannually at fixed rates ranging from 6.66%5.89% to 7.93%, maturing in fiscal 20092012 through 2014;2020; and fixed rate mortgages and other debt instruments (including an effective interest rate swap agreement described below) bearing interest from 1.00% to 6.96%6.10%, maturing in 20102011 through 2036. The fair value of our long-term fixed interest rate debt is subject to interest rate risk. Generally, the fair market value of our fixed interest rate debt will increase as interest rates fall and decrease as interest rates rise. TheAs of May 27, 2010, the fair value of our $120.0$102.4 million of senior notes iswas approximately $122.4$97.8 million. Based upon the respective rate and prepayment provisions of our remaining fixed interest rate mortgage and unsecured term note at May 31, 2007,27, 2010, the carrying amounts of such debt approximates fair value.value as of such date.
32
The variable interest rate debt and fixed interest rate debt outstanding as of May 31, 200727, 2010 matures as follows (in thousands):
| 2008 | 2009 | 2010 | 2011 | 2012 | Thereafter | Total | |||||||||||||||||
|---|---|---|---|---|---|---|---|---|---|---|---|---|---|---|---|---|---|---|---|---|---|---|---|
| Variable interest rate | $ | 25,514 | $ | 70,359 | $ | -- | $ | -- | $ | -- | $ | -- | $ | 95,873 | |||||||||
| Fixed interest rate | 31,736 | 31,779 | 14,282 | 14,283 | 14,287 | 54,435 | 160,802 | ||||||||||||||||
| Total debt | $ | 57,250 | $ | 102,138 | $ | 14,282 | $ | 14,283 | $ | 14,287 | $ | 54,435 | $ | 256,675 | |||||||||
| F2011 | F2012 | F2013 | F2014 | F2015 | Thereafter | Total | |||||||||||||||
Variable interest rate | $ | — | $ | 750 | $ | 68,000 | $ | — | $ | — | $ | — | $ | 68,750 | |||||||
Fixed interest rate | 39,610 | 16,595 | 37,083 | 7,324 | 2,403 | 64,678 | 167,693 | ||||||||||||||
Total debt | $ | 39,610 | $ | 17,345 | $ | 105,083 | $ | 7,324 | $ | 2,403 | $ | 64,678 | $ | 236,443 | |||||||
We periodically enter into interest rate swap agreements to manage our exposure to interest rate changes. These swaps involve the exchange of fixed and variable interest rate payments without exchanging the notional principal amount. Payments or receipts on the agreements are recorded as adjustments to interest expense. We had noone outstanding interest rate swap agreementsagreement at May 31, 2007.27, 2010 covering $25.2 million of principal borrowing obligations, expiring on February 1, 2011. Under this swap agreement, we pay a defined fixed rate while receiving a defined variable rate based on LIBOR, effectively converting a $25.2 million variable rate mortgage note to a fixed rate. The swap agreement did not impact our fiscal 2010 earnings and we do not expect it to have any effect on fiscal 2011 earnings. On May 3, 2002,March 19, 2008, we terminated a swapan effective cash flow hedge agreement that had effectively converted $25covered $25.0 million of our borrowings under revolving credit agreements from floating-rate debtand required us to fixed-rate debt.pay interest at a defined fixed rate while receiving a defined variable rate based on LIBOR. The fair value of the swaphedge agreement on the date of the termination resulted in a liability of $2.8 million.$567,000 ($338,000 net of tax). The remaining loss in accumulated other comprehensive income at May 27, 2010 of $184,000$326,000 ($111,000194,000 net of tax), previously included in other comprehensive income, was will be reclassified into earnings as interest expense during fiscal 2006 in conjunction withthrough April 15, 2013, the endremaining life of the original lifehedge, as interest payments affect earnings. We expect to reclassify approximately $113,000 ($68,000 net of the hedge.tax) of loss into earnings during fiscal 2011.
Critical Accounting Policies and Estimates
Our discussion and analysis of our financial condition and results of operations are based upon our consolidated financial statements, which have been prepared in accordance with accounting principles generally accepted in the United States. The preparation of our financial statements requires us to make estimates and judgments that affect our reported amounts of assets, liabilities, revenues and expenses, and related disclosure of contingent assets and liabilities.
On an on-going basis, we evaluate our estimates including those related to bad debts, insurance reserves, carrying value of investments in long-lived assets, intangible assets, income taxes, pensions, and contingencies and litigation.associated with critical accounting policies. We base our estimates on historical experience and on various other assumptions that are believed to be reasonable under the circumstances, the results of which form the basis for making judgments about the carrying values of assets and liabilities that are not readily apparent from other sources. Actual results may differ from these estimates under different assumptions or conditions.
We believe the following critical accounting policies affect the most significant judgments and estimates used in the preparation of our consolidated financial statements.
We review long-lived assets, including fixed assets, goodwill, investments in joint ventures and receivables from joint ventures, for impairment at least annually, or whenever events or changes in circumstances
36
indicate that the carrying amount of any such asset may not be recoverable. In assessing the recoverability of these assets, we must make assumptions regarding the estimated future cash flows and other factors to determine the fair value of the respective assets. The estimate of cash flow is based upon, among other things, certain assumptions about expected future operating performance. Our estimates of undiscounted cash flow may differ from actual cash flow due to factors such as economic conditions, changes to our business model or changes in our operating performance. For long-lived assets other than goodwill, if the sum of the undiscounted estimated cash flows (excluding interest) is less than the current carrying value, we recognize an impairment loss, measured as the amount by which the carrying value exceeds the fair value of the asset. During fiscal 2010, we recorded a before-tax impairment charge of $2.6 million related to our 16 remaining owned condominium hotel units at our Platinum Hotel & Spa. During fiscal 2008, we recorded a before-tax impairment charge of $200,000 on fixed assets related to theatres scheduled to close during fiscal 2009. |
In assessing goodwill for impairment, we utilize a two-step approach. In the first step, we compare the fair value of each reporting unit to its carrying value. In the second step of the impairment test, any impairment loss is determined by comparing the implied fair value of goodwill to the recorded amount of goodwill. In assessing the fair value of the reporting unit, we utilize a market approach to determine the fair value of the respective assets.each reporting unit. The estimate ofmarket approach quantifies each reporting unit’s fair value based on revenue and/or earnings or cash flow is based upon, amongmultiples realized in similar industry transactions or multiples gathered from other things, certain assumptions about expected future operating performance. Our estimates of undiscounted cash flow may differ from actual cash flow due to factors such as economic conditions, changes to our business model or changes in our operating performance. If the sum of the undiscounted estimated cash flows (excluding interest) is less than the current carrying value, we recognize an impairment loss, measured as the amount by which the carrying value exceeds theexternal competitive data. The fair value of the asset. Duringour theatre reporting unit exceeded our carrying value for fiscal 2006, we recorded a before-tax reserve for bad debts on receivables from joint ventures of $278,0002010 and a before-tax impairment charge of $500,000 on fixed assets related to theatres scheduled to close during fiscal 2007.2009.
33
We pay income taxes based on tax statutes, regulations and case law of the various jurisdictions in which we operate. Judgment is required as to whether uncertain tax positions will be accepted by tax authorities. We are subject to tax audits in each of these jurisdictions, which couldmay result in changes to our estimated tax expense. The amount of these changes would vary by jurisdiction and would be recorded when probable and estimable. In calculating the provision for income taxes on an interim basis, we use an estimate of the annual effective tax rate based upon the facts and circumstances known at each interim period.
Accounting Changes
On December 16, 2004, theMay 30, 2008, we adopted Accounting Standards Codification (ASC) No. 820 (originally issued as Statement of Financial Accounting Standards Board (FASB) issued FASB Statement(SFAS) No. 123 (revised 2004)(SFAS157,Fair Value Measurements) as it relates to financial assets and liabilities. The impact of this adoption was not material to our financial statements. ASC No. 123R), “Share Based Payment,” which is a revision of SFAS No. 123, “Accounting820 became effective for Stock-Based Compensation.” SFAS No. 123(R) supersedes Accounting Principles Board (APB) Opinion No. 25, “Accounting for Stock Issued to Employees,”our nonfinancial assets and amends SFAS No. 95, “Statement of Cash Flows.” Generally, the approach in SFAS No. 123(R) is similar to the approach in SFAS No. 123. However, SFAS No. 123(R) requires all share-based payments to employees, including grants of employee stock options, to be recognized in the income statement based on their grant date fair values. Pro forma disclosure is no longer an alternative.
Prior to May 26, 2006, we accounted for stock-based compensation in accordance with APB Opinion No. 25. Accordingly, no compensation expense was recognized for stock options because all options granted had an exercise price equal to the market value of the underlying stock on the date of grant. As discussed in Note 6 of our consolidated financial statements, we began expensing the fair value of stock optionsliabilities on May 26, 2006,29, 2009, the beginningfirst day of our fiscal 2007 year, when we adopted SFAS2010. ASC No. 123(R)820 applies to other accounting pronouncements that require or permit fair value measurements, defines fair value based upon an exit price model, establishes a framework for measuring fair value, and expands the applicable disclosure requirements. ASC No. 820 indicates, among other things, that a fair value measurement assumes that a transaction to sell an asset or transfer a liability occurs in the principal market for the asset or liability or, in the absence of a principal market, the most advantageous market for the asset or liability.
ASC No. 820 establishes a fair value hierarchy for the pricing inputs used to measure fair value. Our assets and liabilities measured at fair value are classified in one of the following categories:
Level 1—Assets or liabilities for which fair value is based on quoted prices in active markets for identical instruments as of the reporting date. At May 27, 2010 and May 28, 2009, our $383,000 and $412,000, respectively, of available for sale securities were valued using Level 1 pricing inputs.
Level 2—The liability related to our interest rate hedge contract was based on valuation models for which pricing inputs were either directly or indirectly observable as of the modified prospective method. This transition method does notreporting date. The liability was $488,000 and $961,000 at May 27, 2010 and May 28, 2009, respectively.
Level 3—Assets or liabilities for which fair value is based on valuation models with significant unobservable pricing inputs and which result in the restatementuse of previouslymanagement estimates. At May 27, 2010 and May 28, 2009, none of our assets or liabilities were valued using Level 3 pricing inputs.
37
In December 2007, the FASB issued financial statements.
34
As a result of adoptingASC No. 805 (originally issued as SFAS No. 123(R) on May 26, 2006, our earnings from continuing operations before income taxes and net earnings141(R),Business Combinations), which establishes accounting standards for fiscal 2007 were loweracquisitions made by $1.1 million and $830,000, respectively, than if we had been allowed to continue to account for stock-based compensation under APB Opinion No. 25. We will continue to expense awards of non-vested stock over the vesting period of the awards based on the fair value of our common stock at the date of grant. At the end of fiscal 2007, total remaining unearned compensation related to non-vested stockCompany. This statement was approximately $941,000, which will be amortized over the weighted-average remaining service period of 8.8 years.
On May 26, 2006, we adopted SFAS No. 158, “Employers’ Accounting for Defined Benefit Pension and other Postretirement Plans,” which requires us to recognize previously unrecognized actuarial losses and prior service costs in the statement of financial position and to recognize future changes in these amounts in the year in which changes occur through comprehensive income. Additionally, we are required to measure the funded status of our plan as of the date of our year-end statement of financial position. The adoption of SFAS No. 158 had no effect on our consolidated statement of earnings for the year ended May 31, 2007, or for any prior period presented, and it will not affect our operating results in future periods.
In June 2006, the Financial Accounting Standards Board (FASB) issued FASB Interpretation No. 48 (FIN 48), “Accounting for Uncertainty in Income Taxes.” This interpretation prescribes a recognition threshold and measurement criteria for a tax position taken or expected to be taken in a tax return. The new standard will be effective for our first quarter ofus during fiscal 2008. Based upon our initial review, we do2010 and did not believe adoption of FIN 48 will have a materialan impact on our overall financial position.position or results of operation.
In December 2007, the FASB issued ASC No. 805 (originally issued as SFAS No. 160,Noncontrolling Interest in Consolidated Financial Statements), which establishes accounting and reporting standards for the noncontrolling interest in a subsidiary and for the deconsolidation of a subsidiary. This statement was effective for us during fiscal 2010 and did not have an impact on our overall financial position or results of operation.
In June 2009, the FASB issued ASC No. 810, (originally issued as SFAS No. 167,Amendment to FASB Interpretation No. 46(R)), which amends certain requirements of FASB Interpretation No. 46 (revised December 2003),Consolidation of Variable Interest Entities (VIE). The statement requires a qualitative rather than a quantitative analysis to determine the primary beneficiary of a VIE, requires continuous assessment of whether an enterprise is the primary beneficiary of a VIE and requires enhanced disclosures about an entity’s involvement with a VIE. This statement is effective for us in fiscal 2011 and we do not expect the adoption of this statement to have an impact on our overall financial position or results of operation.
Item 7A. Quantitative and Qualitative Disclosures About Market Risk.
The information required by this item is set forth in “Item 7. Management’s Discussion and Analysis of Financial Condition and Results of Operations – Operations—Quantitative and Qualitative Disclosures About Market Risk” above.
Item 8. Financial Statements and Supplementary Data.
MANAGEMENT’S REPORT ON INTERNAL CONTROL OVER FINANCIAL REPORTING
Our management is responsible for establishing and maintaining adequate internal control over financial reporting, as such term is defined in Rule 13a-15(f) of the Exchange Act. Under the supervision and with the participation of our management, including our principal executive officer and principal financial officer, we conducted an evaluation of the effectiveness of our internal control over financial reporting based on the framework in Internal Control – Control—Integrated Framework issued by the Committee of Sponsoring Organizations of the Treadway Commission. Based on our evaluation under the framework in Internal Control – Control—Integrated Framework, our management concluded that our internal control over financial reporting was effective as of May 31, 2007.27, 2010. The Company’s auditors, ErnstDeloitte & Young,Touche LLP, have issued an attestation report on management’s assessment of the Company’sour internal control over financial reporting. That attestation report is set forth immediately followingin this report.Item 8.
Gregory S. Marcus President and Chief Executive Officer | Douglas A. Neis | |
Chief Financial Officer and Treasurer | ||
35
38
REPORT OF INDEPENDENT REGISTERED PUBLIC ACCOUNTING FIRM
ON INTERNAL CONTROL OVER FINANCIAL REPORTING
TheTo the Board of Directors and Shareholders
Stockholders of theThe Marcus Corporation
We have audited management’s assessment, included in the accompanying Management’s Report on Internal Control over Financial Reporting, that The Marcus Corporation (the Company) maintained effective internal control over financial reporting of The Marcus Corporation (the “Company”) as of May 31, 2007,27, 2010, based on criteria established in Internal Control – Control—Integrated Framework issued by the Committee of Sponsoring Organizations of the Treadway Commission (the COSO criteria).Commission. The Company’s management is responsible for maintaining effective internal control over financial reporting and for its assessment of the effectiveness of internal control over financial reporting.reporting, included in the accompanying Management’s Report on Internal Control over Financial Reporting. Our responsibility is to express an opinion on management’s assessment and an opinion on the effectiveness of the Company’s internal control over financial reporting based on our audit.
We conducted our audit in accordance with the standards of the Public Company Accounting Oversight Board (United States). Those standards require that we plan and perform the audit to obtain reasonable assurance about whether effective internal control over financial reporting was maintained in all material respects. Our audit included obtaining an understanding of internal control over financial reporting, evaluating management’s assessment,assessing the risk that a material weakness exists, testing and evaluating the design and operating effectiveness of internal control based on the assessed risk, and performing such other procedures as we considered necessary in the circumstances. We believe that our audit provides a reasonable basis for our opinion.
A company’s internal control over financial reporting is a process designed by, or under the supervision of, the company’s principal executive and principal financial officers, or persons performing similar functions, and effected by the company’s board of directors, management, and other personnel to provide reasonable assurance regarding the reliability of financial reporting and the preparation of financial statements for external purposes in accordance with generally accepted accounting principles. A company’s internal control over financial reporting includes those policies and procedures that (1) pertain to the maintenance of records that, in reasonable detail, accurately and fairly reflect the transactions and dispositions of the assets of the company; (2) provide reasonable assurance that transactions are recorded as necessary to permit preparation of financial statements in accordance with generally accepted accounting principles, and that receipts and expenditures of the company are being made only in accordance with authorizations of management and directors of the company; and (3) provide reasonable assurance regarding prevention or timely detection of unauthorized acquisition, use, or disposition of the company’s assets that could have a material effect on the financial statements.
Because of itsthe inherent limitations of internal control over financial reporting, including the possibility of collusion or improper management override of controls, material misstatements due to error or fraud may not preventbe prevented or detect misstatements.detected on a timely basis. Also, projections of any evaluation of the effectiveness of the internal control over financial reporting to future periods are subject to the risk that the controls may become inadequate because of changes in conditions, or that the degree of compliance with the policies or procedures may deteriorate.
In our opinion, management’s assessment that the Company maintained effective internal control over financial reporting as of May 31, 2007, is fairly stated, in all material respects, based on the COSO criteria. Also, in our opinion, the Company maintained, in all material respects, effective internal control over financial reporting as of May 31, 2007,27, 2010, based on the COSO criteria.criteria established in Internal Control—Integrated Framework issued by the Committee of Sponsoring Organizations of the Treadway Commission.
We have also have audited, in accordance with the standards of the Public Company Accounting Oversight Board (United States), the consolidated balance sheets of The Marcus Corporationfinancial statements as of and for the year ended May 31, 2007 and May 25, 2006, and the related consolidated statements of earnings, shareholders’ equity and cash flows for each27, 2010 of the three years in the period ended May 31, 2007,Company and our report dated August 10, 20072010 expressed an unqualified opinion thereon.on those financial statements.
/s/ Ernst & Young LLP
Milwaukee, Wisconsin
August 10, 20072010
36
39
REPORT OF INDEPENDENT REGISTERED PUBLIC ACCOUNTING FIRM
TheTo the Board of Directors and Shareholders
Stockholders
of The Marcus Corporation
We have audited the accompanying consolidated balance sheets of The Marcus Corporation (the Company)“Company”) as of May 31, 200727, 2010 and May 25, 2006,28, 2009, and the related consolidated statements of earnings, shareholders’ equity, and cash flows for eachthe years then ended. These financial statements are the responsibility of the three yearsCompany’s management. Our responsibility is to express an opinion on the financial statements based on our audits.
We conducted our audits in accordance with the standards of the Public Company Accounting Oversight Board (United States). Those standards require that we plan and perform the audits to obtain reasonable assurance about whether the financial statements are free of material misstatement. An audit includes examining, on a test basis, evidence supporting the amounts and disclosures in the periodfinancial statements. An audit also includes assessing the accounting principles used and significant estimates made by management, as well as evaluating the overall financial statement presentation. We believe that our audits provide a reasonable basis for our opinions.
In our opinions, such consolidated financial statements present fairly, in all material respects, the financial position of the Company as of May 27, 2010 and May 28, 2009, and the results of their operations and their cash flows for the years then ended in conformity with accounting principles generally accepted in the United States of America.
We have also audited, in accordance with the standards of the Public Company Accounting Oversight Board (United States), the Company’s internal control over financial reporting as of May 27, 2010, based on the criteria established in Internal Control—Integrated Framework issued by the Committee of Sponsoring Organizations of the Treadway Commission and our report dated August 10, 2010 and expressed an unqualified opinion on the Company’s internal control over financial reporting.
Milwaukee, Wisconsin
August 10, 2010
40
REPORT OF INDEPENDENT REGISTERED PUBLIC ACCOUNTING FIRM
The Board of Directors and Shareholders
of The Marcus Corporation
We have audited the accompanying consolidated statements of earnings, shareholders’ equity, and cash flows of The Marcus Corporation for the year ended May 31, 2007.29, 2008. These financial statements are the responsibility of the Company’s management. Our responsibility is to express an opinion on these financial statements based on our audits.
We conducted our audits in accordance with the standards of the Public Company Accounting Oversight Board (United States). Those standards require that we plan and perform the audit to obtain reasonable assurance about whether the financial statements are free of material misstatement. An audit includes examining, on a test basis, evidence supporting the amounts and disclosures in the financial statements. An audit also includes assessing the accounting principles used and significant estimates made by management, as well as evaluating the overall financial statement presentation. We believe that our audits provide a reasonable basis for our opinion.
In our opinion, the financial statements referred to above present fairly, in all material respects, the consolidated financial position of the Company at May 31, 2007 and May 25, 2006, and the consolidated results of itsThe Marcus Corporation’s operations and its cash flows for each of the three years in the periodyear ended May 31, 2007,29, 2008, in conformity with U. S.U.S. generally accepted accounting principles.
As discussed in Note 6 to the consolidated financial statements, on May 26, 2006, the Company changed its method of accounting for share-based awards. Additionally, as discussed in Note 7 to the consolidated financial statements, onOn May 31, 2007, the Company changed its method of accounting for defined benefit pension plans.
We have also audited, in accordance with the standards of the Public Company Accounting Oversight Board (United States), the effectiveness of the Company’s internal control over financial reporting as of May 31, 2007, based on criteria established in Internal Control – Integrated Framework issued by the Committee of Sponsoring Organizations of the Treadway Commission and our report dated August 10, 2007 expressed an unqualified opinion thereon.
/s/ Ernst & Young LLP
Milwaukee, Wisconsin
August 10, 200711, 2008
37
41
THE MARCUS CORPORATION
CONSOLIDATED BALANCE SHEETS
(in thousands, except share and per share data)
| May 31, 2007 | May 25, 2006 | |||||||
|---|---|---|---|---|---|---|---|---|
| ASSETS | ||||||||
| CURRENT ASSETS: | ||||||||
| Cash and cash equivalents | $ | 12,018 | $ | 34,528 | ||||
| Cash held by intermediaries | 5,749 | 1,752 | ||||||
| Accounts and notes receivable, net of reserves(Note 4) | 16,224 | 14,306 | ||||||
| Receivables from joint ventures, net of reserves(Note 10) | 3,732 | 3,385 | ||||||
| Refundable income taxes | 5,939 | 216 | ||||||
| Deferred income taxes(Note 8) | 1,056 | 5,898 | ||||||
| Condominium units held for sale(Note 10) | 7,320 | -- | ||||||
| Other current assets(Note 4) | 6,340 | 11,273 | ||||||
| Assets of discontinued operations(Note 3) | 975 | 7,545 | ||||||
| Total current assets | 59,353 | 78,903 | ||||||
PROPERTY AND EQUIPMENT, net(Note 4) | 559,785 | 450,529 | ||||||
OTHER ASSETS: | ||||||||
| Investments in joint ventures(Note 10) | 1,868 | 7,487 | ||||||
| Goodwill | 37,805 | 11,196 | ||||||
| Other(Note 4) | 39,572 | 39,119 | ||||||
| Total other assets | 79,245 | 57,802 | ||||||
| Total assets | $ | 698,383 | $ | 587,234 | ||||
LIABILITIES AND SHAREHOLDERS’ EQUITY | ||||||||
| CURRENT LIABILITIES: | ||||||||
| Notes payable(Note 10) | $ | 239 | $ | 500 | ||||
| Accounts payable | 24,242 | 19,399 | ||||||
| Taxes other than income taxes | 11,215 | 11,064 | ||||||
| Accrued compensation | 6,720 | 7,444 | ||||||
| Other accrued liabilities(Note 4) | 24,746 | 15,137 | ||||||
| Current maturities of long-term debt(Note 5) | 57,250 | 53,402 | ||||||
| Liabilities of discontinued operations(Note 3) | 2,731 | 1,998 | ||||||
| Total current liabilities | 127,143 | 108,944 | ||||||
LONG-TERM DEBT(Note 5) | 199,425 | 123,110 | ||||||
DEFERRED INCOME TAXES(Note 8) | 29,376 | 27,946 | ||||||
DEFERRED COMPENSATION AND OTHER(Note 7) | 22,930 | 25,911 | ||||||
COMMITMENTS, LICENSE RIGHTS AND CONTINGENCIES(Note 9) | ||||||||
SHAREHOLDERS’ EQUITY(Note 6): | ||||||||
| Preferred Stock, $1 par; authorized 1,000,000 shares; none issued | -- | -- | ||||||
| Common Stock: | ||||||||
| Common Stock, $1 par; authorized 50,000,000 shares; issued | ||||||||
| 22,299,925 shares in 2007 and 22,235,822 shares in 2006 | 22,300 | 22,236 | ||||||
| Class B Common Stock, $1 par; authorized 33,000,000 shares; | ||||||||
| issued and outstanding 8,889,588 shares in 2007 and | ||||||||
| 8,953,691 shares in 2006 | 8,890 | 8,954 | ||||||
| Capital in excess of par | 46,438 | 45,911 | ||||||
| Retained earnings | 255,727 | 231,907 | ||||||
| Accumulated other comprehensive income (loss) | (1,515 | ) | 112 | |||||
| 331,840 | 309,120 | |||||||
Less unearned compensation on restricted stock | -- | (293 | ) | |||||
| Less cost of Common Stock in treasury | ||||||||
| (795,335 shares in 2007 and | ||||||||
| 646,544 shares in 2006 | (12,331 | ) | (7,504 | ) | ||||
| Total shareholders’ equity | 319,509 | 301,323 | ||||||
| Total liabilities and shareholders’ equity | $ | 698,383 | $ | 587,234 | ||||
| May 27, 2010 | May 28, 2009 | |||||||
ASSETS | ||||||||
CURRENT ASSETS: | ||||||||
Cash and cash equivalents | $ | 9,132 | $ | 6,796 | ||||
Accounts and notes receivable, net of reserves(Notes 4 and 10) | 9,323 | 12,433 | ||||||
Refundable income taxes | 6,820 | — | ||||||
Deferred income taxes(Note 8) | 2,708 | 3,139 | ||||||
Other current assets(Note 1) | 7,310 | 7,776 | ||||||
Total current assets | 35,293 | 30,144 | ||||||
PROPERTY AND EQUIPMENT, net(Note 4) | 585,989 | 595,556 | ||||||
OTHER ASSETS: | ||||||||
Investments in joint ventures(Note 10) | 1,322 | 1,391 | ||||||
Goodwill(Note 1) | 44,413 | 44,552 | ||||||
Condominium units(Note 3) | 3,479 | 5,912 | ||||||
Other(Note 4) | 33,915 | 33,968 | ||||||
Total other assets | 83,129 | 85,823 | ||||||
Total assets | $ | 704,411 | $ | 711,523 | ||||
LIABILITIES AND SHAREHOLDERS’ EQUITY | ||||||||
CURRENT LIABILITIES: | ||||||||
Notes payable(Note 10) | $ | 221 | $ | 229 | ||||
Accounts payable | 18,985 | 22,743 | ||||||
Income taxes | — | 796 | ||||||
Taxes other than income taxes | 12,589 | 13,015 | ||||||
Accrued compensation | 5,038 | 4,665 | ||||||
Other accrued liabilities | 24,533 | 24,540 | ||||||
Current maturities of long-term debt(Note 5) | 39,610 | 14,432 | ||||||
Total current liabilities | 100,976 | 80,420 | ||||||
LONG-TERM DEBT(Note 5) | 196,833 | 240,943 | ||||||
DEFERRED INCOME TAXES(Note 8) | 39,180 | 32,024 | ||||||
DEFERRED COMPENSATION AND OTHER(Note 7) | 31,626 | 30,696 | ||||||
COMMITMENTS, LICENSE RIGHTS AND CONTINGENCIES(Note 9) | ||||||||
SHAREHOLDERS’ EQUITY(Note 6): | ||||||||
Preferred Stock, $1 par; authorized 1,000,000 shares; none issued | — | — | ||||||
Common Stock: | ||||||||
Common Stock, $1 par; authorized 50,000,000 shares; issued 22,335,334 shares in 2010 and 22,329,978 shares in 2009 | 22,335 | 22,330 | ||||||
Class B Common Stock, $1 par; authorized 33,000,000 shares; issued and outstanding 8,854,179 shares in 2010 and 8,859,535 shares in 2009 | 8,855 | 8,860 | ||||||
Capital in excess of par | 48,664 | 47,649 | ||||||
Retained earnings | 279,869 | 273,637 | ||||||
Accumulated other comprehensive loss | (2,825 | ) | (2,781 | ) | ||||
| 356,898 | 349,695 | |||||||
Less cost of Common Stock in treasury (1,299,098 shares in 2010 and 1,364,585 shares in 2009) | (21,102 | ) | (22,255 | ) | ||||
Total shareholders’ equity | 335,796 | 327,440 | ||||||
Total liabilities and shareholders’ equity | $ | 704,411 | $ | 711,523 | ||||
See accompanying notes.
38
42
THE MARCUS CORPORATION
CONSOLIDATED STATEMENTS OF EARNINGS(in thousands, except per share data)
| Year ended | |||||||||||
|---|---|---|---|---|---|---|---|---|---|---|---|
| May 31, 2007 | May 25, 2006 | May 26, 2005 | |||||||||
| REVENUES: | |||||||||||
| Rooms and telephone | $ | 88,369 | $ | 75,871 | $ | 56,778 | |||||
| Theatre admissions | 98,184 | 93,429 | 96,157 | ||||||||
| Theatre concessions | 49,018 | 45,496 | 45,785 | ||||||||
| Food and beverage | 49,183 | 41,162 | 36,576 | ||||||||
| Other revenues | 42,877 | 33,286 | 31,762 | ||||||||
| Total revenues | 327,631 | 289,244 | 267,058 | ||||||||
COSTS AND EXPENSES: | |||||||||||
| Rooms and telephone | 32,949 | 27,852 | 22,726 | ||||||||
| Theatre operations | 81,085 | 73,527 | 75,560 | ||||||||
| Theatre concessions | 10,853 | 9,672 | 9,896 | ||||||||
| Food and beverage | 38,505 | 31,461 | 28,640 | ||||||||
| Advertising and marketing | 19,608 | 16,446 | 13,442 | ||||||||
| Administrative | 34,464 | 29,001 | 26,084 | ||||||||
| Depreciation and amortization | 26,913 | 26,131 | 24,503 | ||||||||
| Rent(Note 9) | 3,413 | 3,630 | 1,989 | ||||||||
| Property taxes | 9,473 | 10,395 | 8,145 | ||||||||
| Preopening expenses | 5,293 | 805 | 816 | ||||||||
| Other operating expenses | 23,936 | 20,784 | 16,355 | ||||||||
| Total costs and expenses | 286,492 | 249,704 | 228,156 | ||||||||
OPERATING INCOME | 41,139 | 39,540 | 38,902 | ||||||||
OTHER INCOME (EXPENSE): | |||||||||||
| Investment income | 3,110 | 7,863 | 6,187 | ||||||||
| Interest expense | (13,921 | ) | (14,397 | ) | (14,874 | ) | |||||
| Gain on disposition of property, equipment | |||||||||||
| and other assets | 14,541 | 1,749 | 2,195 | ||||||||
| Equity losses from unconsolidated joint ventures, | |||||||||||
| net(Note 10) | (1,366 | ) | (1,868 | ) | (1,090 | ) | |||||
| 2,364 | (6,653 | ) | (7,582 | ) | |||||||
EARNINGS FROM CONTINUING OPERATIONS BEFORE INCOME TAXES | 43,503 | 32,887 | 31,320 | ||||||||
| INCOME TAXES(Note 8) | 9,576 | 10,419 | 11,742 | ||||||||
| EARNINGS FROM CONTINUING OPERATIONS | 33,927 | 22,468 | 19,578 | ||||||||
See accompanying notes.
39
THE MARCUS CORPORATION
CONSOLIDATED STATEMENTS OF EARNINGS (continued)(in thousands, except per share data)
| Year ended | |||||||||||
|---|---|---|---|---|---|---|---|---|---|---|---|
| May 31, 2007 | May 25, 2006 | May 26, 2005 | |||||||||
| DISCONTINUED OPERATIONS(Note 3): | |||||||||||
| Income (loss) from discontinued operations, net of income | |||||||||||
| taxes (benefit) of $(365), $(960) and $858 in 2007, | |||||||||||
| 2006 and 2005, respectively | $ | (515 | ) | $ | (1,905 | ) | $ | 1,322 | |||
| Gain (loss) on sale of discontinued operations, net of | |||||||||||
| income taxes of $335, $3,885 and $50,856 in 2007, 2006 | |||||||||||
| and 2005, respectively | (115 | ) | 7,708 | 78,321 | |||||||
| EARNINGS (LOSSES) FROM DISCONTINUED OPERATIONS | (630 | ) | 5,803 | 79,643 | |||||||
| NET EARNINGS | $ | 33,297 | $ | 28,271 | $ | 99,221 | |||||
EARNINGS PER SHARE FROM CONTINUING OPERATIONS- BASIC: | |||||||||||
| Common Stock | $ | 1.15 | $ | 0.76 | $ | 0.67 | |||||
| Class B Common Stock | 1.04 | 0.68 | 0.60 | ||||||||
EARNINGS (LOSS) PER SHARE FROM DISCONTINUED OPERATIONS - BASIC: | |||||||||||
| Common Stock | $ | (0.02 | ) | $ | 0.20 | $ | 2.75 | ||||
| Class B Common Stock | (0.02 | ) | 0.18 | 2.42 | |||||||
NET EARNINGS PER SHARE - BASIC: | |||||||||||
| Common Stock | $ | 1.13 | $ | 0.96 | $ | 3.42 | |||||
| Class B Common Stock | 1.02 | 0.86 | 3.02 | ||||||||
EARNINGS PER SHARE FROM CONTINUING OPERATIONS- DILUTED: | |||||||||||
| Common Stock | $ | 1.10 | $ | 0.73 | $ | 0.64 | |||||
| Class B Common Stock | 1.03 | 0.67 | 0.59 | ||||||||
EARNINGS (LOSS) PER SHARE FROM DISCONTINUED OPERATIONS - DILUTED: | |||||||||||
| Common Stock | $ | (0.02 | ) | $ | 0.18 | $ | 2.61 | ||||
| Class B Common Stock | (0.02 | ) | 0.18 | 2.40 | |||||||
NET EARNINGS PER SHARE - DILUTED: | |||||||||||
| Common Stock | $ | 1.08 | $ | 0.91 | $ | 3.25 | |||||
| Class B Common Stock | 1.01 | 0.85 | 2.99 | ||||||||
See accompanying notes.
40
THE MARCUS CORPORATION
CONSOLIDATED STATEMENTS OF SHAREHOLDERS’ EQUITY
(in thousands, except per share data)
| Common Stock | Class B Common Stock | Capital In Excess of Par | Retained Earnings | Accumulated Other Comprehensive Income (Loss) | Unearned Compensation on Non-vested Stock | Treasury Stock | Total | |||||||||||||||||||
|---|---|---|---|---|---|---|---|---|---|---|---|---|---|---|---|---|---|---|---|---|---|---|---|---|---|---|
| BALANCES AT MAY 27, 2004 | $ | 21,866 | $ | 9,324 | $ | 42,952 | $ | 333,171 | $ | (289 | ) | $ | (630 | ) | $ | (12,671 | ) | $ | 393,723 | |||||||
| Cash dividends: | ||||||||||||||||||||||||||
| $.20 per share Class B Common Stock | -- | -- | -- | (1,831 | ) | -- | -- | -- | (1,831 | ) | ||||||||||||||||
| $.22 per share Common Stock | -- | -- | -- | (4,620 | ) | -- | -- | -- | (4,620 | ) | ||||||||||||||||
| Exercise of stock options | -- | -- | 1,885 | -- | -- | -- | 4,845 | 6,730 | ||||||||||||||||||
| Purchase of treasury stock | -- | -- | -- | -- | -- | -- | (518 | ) | (518 | ) | ||||||||||||||||
| Savings and profit-sharing contribution | -- | -- | 338 | -- | -- | -- | 221 | 559 | ||||||||||||||||||
| Reissuance of treasury stock | -- | -- | 134 | -- | -- | -- | 113 | 247 | ||||||||||||||||||
| Issuance of non-vested stock | -- | -- | 98 | -- | -- | -- | 75 | 173 | ||||||||||||||||||
| Amortization of unearned compensation on | ||||||||||||||||||||||||||
| non-vested stock | -- | -- | -- | -- | -- | 107 | -- | 107 | ||||||||||||||||||
| Cancellation of non-vested stock | -- | -- | (39 | ) | -- | -- | 110 | (71 | ) | -- | ||||||||||||||||
| Acceleration of stock option vesting period | -- | -- | 113 | -- | -- | -- | -- | 113 | ||||||||||||||||||
| Conversions of Class B Common Stock | 233 | (233 | ) | -- | -- | -- | -- | -- | -- | |||||||||||||||||
| Components of comprehensive income: | ||||||||||||||||||||||||||
| Net earnings | -- | -- | -- | 99,221 | -- | -- | -- | 99,221 | ||||||||||||||||||
| Change in unrealized gain on available for | ||||||||||||||||||||||||||
| sale investments, net of tax effect of $80 | -- | -- | -- | -- | (121 | ) | -- | -- | (121 | ) | ||||||||||||||||
| Amortization of loss on swap agreement, net | ||||||||||||||||||||||||||
| of tax effect of $173 (Note 5) | -- | -- | -- | -- | 259 | -- | -- | 259 | ||||||||||||||||||
| Minimum pension liability, net of tax | ||||||||||||||||||||||||||
| benefit of $250 | -- | -- | -- | -- | (381 | ) | -- | -- | (381 | ) | ||||||||||||||||
| Total comprehensive income | 98,978 | |||||||||||||||||||||||||
| BALANCES AT MAY 26, 2005 | 22,099 | 9,091 | 45,481 | 425,941 | (532 | ) | (413 | ) | (8,006 | ) | 493,661 | |||||||||||||||
| Cash dividends: | ||||||||||||||||||||||||||
| $.24 per share Class B Common Stock | -- | -- | -- | (2,137 | ) | -- | -- | -- | (2,137 | ) | ||||||||||||||||
| $.26 per share Common Stock | -- | -- | -- | (5,592 | ) | -- | -- | -- | (5,592 | ) | ||||||||||||||||
| $7.00 per share Class B and Common Stock | ||||||||||||||||||||||||||
| special dividend | -- | -- | -- | (214,576 | ) | -- | -- | -- | (214,576 | |||||||||||||||||
| Exercise of stock options | -- | -- | (19 | ) | -- | -- | -- | 6,507 | 6,488 | |||||||||||||||||
| Purchase of treasury stock | -- | -- | -- | -- | -- | -- | (6,492 | ) | ||||||||||||||||||
| Savings and profit-sharing contribution | -- | -- | 224 | -- | -- | -- | 292 | 516 | ||||||||||||||||||
| Reissuance of treasury stock | -- | -- | 127 | -- | -- | -- | 120 | 247 | ||||||||||||||||||
| Issuance of non-vested stock | -- | -- | 98 | -- | -- | -- | 75 | 173 | ||||||||||||||||||
| Amortization of unearned compensation on | ||||||||||||||||||||||||||
| non-vested stock | -- | -- | -- | -- | -- | 120 | -- | 120 | ||||||||||||||||||
| Conversions of Class B Common Stock | 137 | (137 | ) | -- | -- | -- | -- | -- | -- | |||||||||||||||||
| Components of comprehensive income: | ||||||||||||||||||||||||||
| Net earnings | -- | -- | -- | 28,271 | -- | -- | -- | 28,271 | ||||||||||||||||||
| Change in unrealized gain on available for | ||||||||||||||||||||||||||
| sale investments, net of tax effect of $63 | -- | -- | -- | -- | 93 | -- | -- | 93 | ||||||||||||||||||
| Amortization of loss on swap agreement, net | ||||||||||||||||||||||||||
| of tax effect of $73 (Note 5) | -- | -- | -- | -- | 111 | -- | -- | 111 | ||||||||||||||||||
| Minimum pension liability, net of tax effect | ||||||||||||||||||||||||||
| of $288 | -- | -- | -- | -- | 440 | -- | -- | 440 | ||||||||||||||||||
| Total comprehensive income | 28,915 | |||||||||||||||||||||||||
| BALANCES AT MAY 26, 2006 | 22,236 | 8,954 | 45,911 | 231,907 | 112 | (293 | ) | (7,504 | ) | 301,323 | ||||||||||||||||
| Cash dividends: | ||||||||||||||||||||||||||
| $.29 per share Class B Common Stock | -- | -- | -- | (2,599 | ) | -- | -- | -- | (2,599 | ) | ||||||||||||||||
| $.32 per share Common Stock | -- | -- | -- | (6,878 | ) | -- | -- | -- | (6,878 | ) | ||||||||||||||||
| Exercise of stock options | -- | -- | (671 | ) | -- | -- | -- | 2,735 | 2,064 | |||||||||||||||||
| Purchase of treasury stock | -- | -- | -- | -- | -- | -- | (8,117 | ) | (8,117 | ) | ||||||||||||||||
| Savings and profit-sharing contribution | -- | -- | 176 | -- | -- | -- | 273 | 449 | ||||||||||||||||||
| Reissuance of treasury stock | -- | -- | 112 | -- | -- | -- | 159 | 271 | ||||||||||||||||||
| Issuance of non-vested stock | -- | -- | (123 | ) | -- | -- | -- | 123 | -- | |||||||||||||||||
| Share-based compensation | -- | -- | 1,326 | -- | -- | -- | -- | 1,326 | ||||||||||||||||||
| Reclassification of unearned compensation on | ||||||||||||||||||||||||||
| non-vested stock | -- | -- | (293 | ) | -- | -- | 293 | -- | -- | |||||||||||||||||
| Conversions of Class B Common Stock | 64 | (64 | ) | -- | -- | -- | -- | -- | -- | |||||||||||||||||
| Components of comprehensive income: | ||||||||||||||||||||||||||
| Net earnings | -- | -- | -- | 33,297 | -- | -- | -- | 33,297 | ||||||||||||||||||
| Change in unrealized gain on available for | ||||||||||||||||||||||||||
| sale investments, net of tax effect of $78 | -- | -- | -- | -- | 117 | -- | -- | 117 | ||||||||||||||||||
| Minimum pension liability, net of tax effect | ||||||||||||||||||||||||||
| of $7 | -- | -- | -- | -- | 11 | -- | -- | 11 | ||||||||||||||||||
| Total comprehensive income | 33,425 | |||||||||||||||||||||||||
| Adjustment to initially apply SFAS No. 158, | ||||||||||||||||||||||||||
| net of taxes of $1,170 | -- | -- | -- | -- | (1,755 | ) | -- | -- | (1,755 | ) | ||||||||||||||||
| BALANCES AT MAY 31, 2007 | $ | 22,300 | $ | 8,890 | $ | 46,438 | $ | 255,727 | $ | (1,515 | ) | $ | -- | $ | (12,331 | ) | $ | 319,509 | ||||||||
| Year ended | ||||||||||||
| May 27, 2010 | May 28, 2009 | May 29, 2008 | ||||||||||
REVENUES: | ||||||||||||
Theatre admissions | $ | 142,675 | $ | 137,335 | $ | 114,703 | ||||||
Rooms | 77,512 | 84,673 | 94,077 | |||||||||
Theatre concessions | 67,837 | 67,881 | 56,849 | |||||||||
Food and beverage | 44,992 | 48,256 | 54,902 | |||||||||
Other revenues | 46,053 | 45,351 | 50,544 | |||||||||
Total revenues | 379,069 | 383,496 | 371,075 | |||||||||
COSTS AND EXPENSES: | ||||||||||||
Theatre operations | 121,631 | 112,921 | 95,694 | |||||||||
Rooms | 30,987 | 32,552 | 34,661 | |||||||||
Theatre concessions | 16,924 | 16,273 | 14,002 | |||||||||
Food and beverage | 35,645 | 38,441 | 42,918 | |||||||||
Advertising and marketing | 19,643 | 20,300 | 20,307 | |||||||||
Administrative | 36,836 | 38,716 | 37,007 | |||||||||
Depreciation and amortization | 32,312 | 32,228 | 31,259 | |||||||||
Rent(Note 9) | 7,895 | 7,744 | 5,145 | |||||||||
Property taxes | 13,469 | 15,185 | 14,124 | |||||||||
Other operating expenses | 24,949 | 25,737 | 28,060 | |||||||||
Impairment charge(Note 3) | 2,575 | — | 200 | |||||||||
Total costs and expenses | 342,866 | 340,097 | 323,377 | |||||||||
OPERATING INCOME | 36,203 | 43,399 | 47,698 | |||||||||
OTHER INCOME (EXPENSE): | ||||||||||||
Investment income (loss) | 607 | (780 | ) | 1,486 | ||||||||
Interest expense | (11,235 | ) | (13,963 | ) | (15,157 | ) | ||||||
Net gain (loss) on disposition of property, equipment and other assets | (25 | ) | (814 | ) | 83 | |||||||
Equity losses from unconsolidated joint ventures, net(Note 10) | (337 | ) | (476 | ) | (411 | ) | ||||||
| (10,990 | ) | (16,033 | ) | (13,999 | ) | |||||||
EARNINGS BEFORE INCOME TAXES | 25,213 | 27,366 | 33,699 | |||||||||
INCOME TAXES(Note 8) | 9,098 | 10,166 | 13,213 | |||||||||
NET EARNINGS | $ | 16,115 | $ | 17,200 | $ | 20,486 | ||||||
NET EARNINGS PER SHARE—BASIC: | ||||||||||||
Common Stock | $ | 0.56 | $ | 0.60 | $ | 0.70 | ||||||
Class B Common Stock | 0.50 | 0.54 | 0.64 | |||||||||
NET EARNINGS PER SHARE—DILUTED: | ||||||||||||
Common Stock | $ | 0.54 | $ | 0.58 | $ | 0.68 | ||||||
Class B Common Stock | 0.50 | 0.54 | 0.64 | |||||||||
See accompanying notes.
41
43
THE MARCUS CORPORATION
CONSOLIDATED STATEMENTS OF SHAREHOLDERS’ EQUITY
(in thousands, except per share data)
| Common Stock | Class B Common Stock | Capital in Excess of Par | Retained Earnings | Accumulated Income (Loss) | Treasury Stock | Total | |||||||||||||||||||||
BALANCES AT MAY 31, 2007 | $ | 22,300 | $ | 8,890 | $ | 46,438 | $ | 255,727 | $ | (1,515 | ) | $ | (12,331 | ) | $ | 319,509 | |||||||||||
Cash dividends: | |||||||||||||||||||||||||||
$.31 per share Class B Common Stock | — | — | — | (2,748 | ) | — | — | (2,748 | ) | ||||||||||||||||||
$.34 per share Common Stock | — | — | — | (7,189 | ) | — | — | (7,189 | ) | ||||||||||||||||||
Exercise of stock options | — | — | (375 | ) | — | — | 1,200 | 825 | |||||||||||||||||||
Purchase of treasury stock | — | — | — | — | — | (14,323 | ) | (14,323 | ) | ||||||||||||||||||
Savings and profit-sharing contribution | — | — | (3 | ) | — | — | 676 | 673 | |||||||||||||||||||
Reissuance of treasury stock | — | — | 42 | — | — | 213 | 255 | ||||||||||||||||||||
Issuance of non-vested stock | — | — | (87 | ) | — | — | 87 | — | |||||||||||||||||||
Share-based compensation | — | — | 1,215 | — | — | — | 1,215 | ||||||||||||||||||||
Other | — | — | 107 | — | — | — | 107 | ||||||||||||||||||||
Conversions of Class B Common Stock | 5 | (5 | ) | — | — | — | — | — | |||||||||||||||||||
Components of comprehensive income: | |||||||||||||||||||||||||||
Net earnings | — | — | — | 20,486 | — | — | 20,486 | ||||||||||||||||||||
Change in unrealized gain on available for sale investments, net of tax effect of $387 | — | — | — | — | (581 | ) | — | (581 | ) | ||||||||||||||||||
Pension adjustment, net of tax effect of $386 | — | — | — | — | (542 | ) | — | (542 | ) | ||||||||||||||||||
Loss on swap agreement, net of tax effect of $229 (Note 5) | — | — | — | — | (338 | ) | — | (338 | ) | ||||||||||||||||||
Amortization of loss on swap agreement, net of tax effect of $2(Note 5) | — | — | — | — | 3 | — | 3 | ||||||||||||||||||||
Change in fair value of interest rate swap, net of tax effect of $96 (Note 5) | — | — | — | — | 141 | — | 141 | ||||||||||||||||||||
Total comprehensive income | 19,169 | ||||||||||||||||||||||||||
BALANCES AT MAY 29, 2008 | 22,305 | 8,885 | 47,337 | 266,276 | (2,832 | ) | (24,478 | ) | 317,493 | ||||||||||||||||||
Cash dividends: | |||||||||||||||||||||||||||
$.31 per share Class B Common Stock | — | — | — | (2,743 | ) | — | — | (2,743 | ) | ||||||||||||||||||
$.34 per share Common Stock | — | — | — | (7,096 | ) | — | — | (7,096 | ) | ||||||||||||||||||
Exercise of stock options | — | — | (297 | ) | — | — | 781 | 484 | |||||||||||||||||||
Purchase of treasury stock | — | — | — | — | — | (324 | ) | (324 | ) | ||||||||||||||||||
Savings and profit-sharing contribution | — | — | (676 | ) | — | — | 1,354 | 678 | |||||||||||||||||||
Reissuance of treasury stock | — | — | (69 | ) | — | — | 295 | 226 | |||||||||||||||||||
Issuance of non-vested stock | — | — | (117 | ) | — | — | 117 | — | |||||||||||||||||||
Share-based compensation | — | — | 1,421 | — | — | — | 1,421 | ||||||||||||||||||||
Other | — | — | 50 | — | — | — | 50 | ||||||||||||||||||||
Conversions of Class B Common Stock | 25 | (25 | ) | — | — | — | — | — | |||||||||||||||||||
Components of comprehensive income: | |||||||||||||||||||||||||||
Net earnings | — | — | — | 17,200 | — | — | 17,200 | ||||||||||||||||||||
Change in unrealized gain on available for sale investments, net of tax effect of $294 | — | — | — | — | 441 | — | 441 | ||||||||||||||||||||
Pension adjustment, net of tax effect of $252 | — | — | — | — | 264 | — | 264 | ||||||||||||||||||||
Amortization of loss on swap agreement, net of tax effect of $50(Note 5) | — | — | — | — | 73 | — | 73 | ||||||||||||||||||||
Change in fair value of interest rate swap, net of tax effect of $472(Note 5) | — | — | — | — | (727 | ) | — | (727 | ) | ||||||||||||||||||
Total comprehensive income | 17,251 | ||||||||||||||||||||||||||
BALANCES AT MAY 28, 2009 | 22,330 | 8,860 | 47,649 | 273,637 | (2,781 | ) | (22,255 | ) | 327,440 | ||||||||||||||||||
Cash dividends: | |||||||||||||||||||||||||||
$.31 per share Class B Common Stock | — | — | — | (2,737 | ) | — | — | (2,737 | ) | ||||||||||||||||||
$.34 per share Common Stock | — | — | — | (7,146 | ) | — | — | (7,146 | ) | ||||||||||||||||||
Exercise of stock options | — | — | (209 | ) | — | — | 549 | 340 | |||||||||||||||||||
Purchase of treasury stock | — | — | — | — | — | (769 | ) | (769 | ) | ||||||||||||||||||
Savings and profit-sharing contribution | — | — | (160 | ) | — | — | 908 | 748 | |||||||||||||||||||
Reissuance of treasury stock | — | — | (67 | ) | — | — | 304 | 237 | |||||||||||||||||||
Issuance of non-vested stock | — | — | (161 | ) | — | — | 161 | — | |||||||||||||||||||
Share-based compensation | — | — | 1,607 | — | — | — | 1,607 | ||||||||||||||||||||
Other | — | — | 5 | — | — | — | 5 | ||||||||||||||||||||
Conversions of Class B Common Stock | 5 | (5 | ) | — | — | — | — | — | |||||||||||||||||||
Components of comprehensive income: | |||||||||||||||||||||||||||
Net earnings | — | — | — | 16,115 | — | — | 16,115 | ||||||||||||||||||||
Change in unrealized gain on available for sale investments, net of tax effect of $12 | — | — | — | — | (18 | ) | — | (18 | ) | ||||||||||||||||||
Pension adjustment, net of tax effect of $301 | — | — | — | — | (386 | ) | — | (386 | ) | ||||||||||||||||||
Amortization of loss on swap agreement, net of tax effect of $45(Note 5) | — | — | — | — | 68 | — | 68 | ||||||||||||||||||||
Change in fair value of interest rate swap, net of tax effect of $182(Note 5) | — | — | — | — | 292 | — | 292 | ||||||||||||||||||||
Total comprehensive income | 16,071 | ||||||||||||||||||||||||||
BALANCES AT MAY 27, 2010 | $ | 22,335 | $ | 8,855 | $ | 48,664 | $ | 279,869 | $ | (2,825 | ) | $ | (21,102 | ) | $ | 335,796 | |||||||||||
See accompanying notes.
44
THE MARCUS CORPORATION
CONSOLIDATED STATEMENTS OF CASH FLOWS
(in thousands)
| Year ended | |||||||||||
|---|---|---|---|---|---|---|---|---|---|---|---|
| May 31, 2007 | May 25, 2006 | May 26, 2005 | |||||||||
| OPERATING ACTIVITIES | |||||||||||
| Net earnings | $ | 33,297 | $ | 28,271 | $ | 99,221 | |||||
| Adjustments to reconcile net earnings to net cash provided by (used | |||||||||||
| in) operating activities: | |||||||||||
| Losses on loans to and investments in joint ventures | 1,770 | 1,974 | 1,566 | ||||||||
| Gain on disposition of property, equipment and other assets | (8,868 | ) | (1,749 | ) | (2,113 | ) | |||||
| Gain on sale of condominium units | (5,893 | ) | -- | -- | |||||||
| Gain on sale of limited-service lodging division | -- | (11,728 | ) | (123,283 | ) | ||||||
| Loss (gain) on sale of Miramonte Resort | -- | 135 | (5,894 | ) | |||||||
| Impairment of property and equipment | -- | 501 | -- | ||||||||
| Distributions from joint ventures | 184 | 373 | 6,638 | ||||||||
| Amortization of loss on swap agreement | -- | 184 | 432 | ||||||||
| Amortization of favorable lease right | (9 | ) | 676 | -- | |||||||
| Depreciation and amortization | 26,925 | 26,274 | 28,402 | ||||||||
| Stock compensation expense | 1,326 | 120 | 107 | ||||||||
| Deferred income taxes | 7,405 | (3,598 | ) | (15,159 | ) | ||||||
| Deferred compensation and other | 2,007 | 240 | 663 | ||||||||
| Contribution of the Company's stock to savings and | |||||||||||
| profit-sharing plan | 449 | 516 | 559 | ||||||||
| Changes in operating assets and liabilities: | |||||||||||
| Accounts and notes receivable | (445 | ) | (4,431 | ) | 1,555 | ||||||
| Real estate and development costs | 3,173 | 1,541 | 1,453 | ||||||||
| Condominium units held for sale | (692 | ) | -- | -- | |||||||
| Other current assets | 7,794 | (6,343 | ) | 707 | |||||||
| Accounts payable | 4,711 | 4,395 | (1,324 | ) | |||||||
| Income taxes | (3,643 | ) | 194 | (4,092 | ) | ||||||
| Taxes other than income taxes | 415 | 2,375 | (1,254 | ) | |||||||
| Accrued compensation | (724 | ) | 647 | (1,996 | ) | ||||||
| Other accrued liabilities | (4,326 | ) | (993 | ) | 820 | ||||||
| Total adjustments | 31,559 | 11,303 | (112,213 | ) | |||||||
| Net cash provided by (used in) operating activities | 64,856 | 39,574 | (12,992 | ) | |||||||
INVESTING ACTIVITIES | |||||||||||
| Capital expenditures | (111,102 | ) | (35,702 | ) | (63,431 | ) | |||||
| Purchase of theatres, net of cash acquired | (75,650 | ) | -- | -- | |||||||
| Purchase of hotels, net of cash acquired | -- | (39,830 | ) | -- | |||||||
| Net proceeds from disposals of property, equipment and other assets | 32,194 | 6,902 | 4,154 | ||||||||
| Net proceeds from sale of condominium units | 95,695 | -- | -- | ||||||||
| Net proceeds from sale of limited-service lodging division | -- | 24,979 | 365,447 | ||||||||
| Net proceeds from sale of Miramonte Resort | -- | -- | 28,503 | ||||||||
| Net proceeds received from (held by) intermediaries | (3,997 | ) | 26,800 | (28,552 | ) | ||||||
| Contributions received from Oklahoma City | 3,972 | 7,372 | -- | ||||||||
| Decrease (increase) in other assets | (1,996 | ) | (8,608 | ) | 446 | ||||||
| Purchase of interest in joint ventures | (11,057 | ) | (1,685 | ) | (4,276 | ) | |||||
| Cash received from (advanced to) joint ventures | (344 | ) | (684 | ) | 145 | ||||||
| Net cash provided by (used in) investing activities | (72,285 | ) | (20,456 | ) | 302,436 | ||||||
FINANCING ACTIVITIES | |||||||||||
| Debt transactions: | |||||||||||
| Net proceeds from issuance of notes payable and long-term debt | 111,448 | 5,558 | 13,550 | ||||||||
| Principal payments on notes payable and long-term debt | (111,270 | ) | (27,317 | ) | (53,746 | ) | |||||
| Equity transactions: | |||||||||||
| Treasury stock transactions, except for stock options | (7,846 | ) | (6,072 | ) | (98 | ) | |||||
| Exercise of stock options | 2,064 | 6,488 | 6,730 | ||||||||
| Dividends paid | (9,477 | ) | (222,305 | ) | (6,451 | ) | |||||
| Net cash used in financing activities | (15,081 | ) | (243,648 | ) | (40,015 | ) | |||||
| Net increase (decrease) in cash and cash equivalents | (22,510 | ) | (224,530 | ) | 249,429 | ||||||
| Cash and cash equivalents at beginning of year | 34,528 | 259,058 | 9,629 | ||||||||
| Cash and cash equivalents at end of year | $ | 12,018 | $ | 34,528 | $ | 259,058 | * | ||||
*Includes $1 of cash included in assets of discontinued operations
| Year ended | ||||||||||||
| May 27, 2010 | May 28, 2009 | May 29, 2008 | ||||||||||
OPERATING ACTIVITIES | ||||||||||||
Net earnings | $ | 16,115 | $ | 17,200 | $ | 20,486 | ||||||
Adjustments to reconcile net earnings to net cash provided by operating activities: | ||||||||||||
Losses on loans to and investments in joint ventures | 337 | 476 | 411 | |||||||||
Consolidation of joint venture | — | 659 | — | |||||||||
Loss (gain) on disposition of property, equipment and other assets | 428 | (304 | ) | (117 | ) | |||||||
Loss (gain) on sale of condominium units | (403 | ) | 1,118 | 34 | ||||||||
Loss on available for sale securities | — | 1,317 | — | |||||||||
Impairment charge | 2,575 | — | 200 | |||||||||
Distributions from joint ventures | — | — | 11 | |||||||||
Amortization of loss on swap agreement | 113 | 123 | 5 | |||||||||
Amortization of favorable lease right | 334 | 334 | 334 | |||||||||
Depreciation and amortization | 32,312 | 32,228 | 31,259 | |||||||||
Stock compensation expense | 1,607 | 1,421 | 1,215 | |||||||||
Deferred income taxes | 7,812 | (3,028 | ) | 2,260 | ||||||||
Deferred compensation and other | 634 | 4,051 | 2,125 | |||||||||
Contribution of the Company’s stock to savings and profit-sharing plan | 748 | 678 | 673 | |||||||||
Changes in operating assets and liabilities: | ||||||||||||
Accounts and notes receivable | (453 | ) | 4,907 | 1,136 | ||||||||
Condominium units | — | — | (70 | ) | ||||||||
Other current assets | 466 | 2,178 | (1,084 | ) | ||||||||
Accounts payable | (2,217 | ) | 3,823 | (7,299 | ) | |||||||
Income taxes | (7,611 | ) | 3,283 | 4,426 | ||||||||
Taxes other than income taxes | (426 | ) | 196 | 1,206 | ||||||||
Accrued compensation | 373 | (2,283 | ) | 228 | ||||||||
Other accrued liabilities | (4 | ) | 1,065 | 331 | ||||||||
Total adjustments | 36,625 | 52,242 | 37,284 | |||||||||
Net cash provided by operating activities | 52,740 | 69,442 | 57,770 | |||||||||
INVESTING ACTIVITIES | ||||||||||||
Capital expenditures | (25,082 | ) | (35,741 | ) | (24,437 | ) | ||||||
Purchase of theatres, net of cash acquired | — | — | (40,500 | ) | ||||||||
Proceeds from disposals of property, equipment and other assets | 766 | 1,408 | 38 | |||||||||
Proceeds from sale of condominium units | — | — | 409 | |||||||||
Proceeds received from intermediaries | — | — | 5,749 | |||||||||
Increase in condominium units and other assets | (893 | ) | (1,069 | ) | (1,187 | ) | ||||||
Premiums returned from split dollar life insurance policies | 3,820 | — | — | |||||||||
Purchase of interest and capital contribution in joint ventures | — | — | (35 | ) | ||||||||
Cash advanced to joint ventures | — | — | (223 | ) | ||||||||
Net cash used in investing activities | (21,389 | ) | (35,402 | ) | (60,186 | ) | ||||||
FINANCING ACTIVITIES | ||||||||||||
Debt transactions: | ||||||||||||
Proceeds from issuance of notes payable and long-term debt | 77,895 | 67,111 | 75,507 | |||||||||
Principal payments on notes payable and long-term debt | (96,835 | ) | (98,343 | ) | (47,280 | ) | ||||||
Debt issuance costs | — | — | (557 | ) | ||||||||
Payment on swap agreement termination | — | — | (567 | ) | ||||||||
Equity transactions: | ||||||||||||
Treasury stock transactions, except for stock options | (532 | ) | (98 | ) | (14,153 | ) | ||||||
Exercise of stock options | 340 | 484 | 825 | |||||||||
Dividends paid | (9,883 | ) | (9,838 | ) | (9,937 | ) | ||||||
Net cash provided by (used in) financing activities | (29,015 | ) | (40,684 | ) | 3,838 | |||||||
Net increase (decrease) in cash and cash equivalents | 2,336 | (6,644 | ) | 1,422 | ||||||||
Cash and cash equivalents at beginning of year | 6,796 | 13,440 | 12,018 | |||||||||
Cash and cash equivalents at end of year | $ | 9,132 | $ | 6,796 | $ | 13,440 | ||||||
See accompanying notes.
42
45
THE MARCUS CORPORATION
NOTES TO CONSOLIDATED FINANCIAL STATEMENTS
May 31, 200727, 2010
1. Description of Business and Summary of Significant Accounting Policies
Description of Business – —The Marcus Corporation and its subsidiaries (the Company) operate principally in two business segments:
Theatres: Operates multiscreen motion picture theatres in Wisconsin, Illinois, Ohio, Iowa, Minnesota, North Dakota and Nebraska and a family entertainment center in Wisconsin.
Hotels and Resorts: Owns and operates full service hotels and resorts in Wisconsin, Illinois, Oklahoma and Missouri and manages full service hotels, resorts and other properties in Wisconsin, Ohio, Minnesota, Texas, Arizona, Missouri, Nevada and California.
Principles of Consolidation – —The consolidated financial statements include the accounts of The Marcus Corporation and all of its subsidiaries.subsidiaries, including a 50% owned joint venture entity in which the Company has a controlling financial interest. Investments in affiliates which are 50% or less owned by the Company for which the Company exercises significant influence or for which the affiliate maintains separate equity accounts are accounted for on the equity method. All intercompany accounts and transactions have been eliminated in consolidation.
Fiscal Year – —The Company reports on a 52/53-week year ending the last Thursday of May. Fiscal 2007 wasAll segments had a 53-week52-week year in fiscal 2010, 2009 and fiscal 2006 and 2005 were 52-week years.2008.
Use of Estimates – —The preparation of financial statements in conformity with U.S. generally accepted accounting principles requires management to make estimates and assumptions that affect the amounts reported in the financial statements and accompanying notes. Actual results could differ from those estimates.
Cash Equivalents – —The Company considers all highly liquid investments with maturities of three months or less when purchased to be cash equivalents. Cash equivalents are carried at cost, which approximates fair value.
Fair Value Measurements—Certain financial assets and liabilities are recorded at fair value in the financial statements. Some are measured on a recurring basis while others are measured on a non-recurring basis. Financial Instruments – assets and liabilities measured on a recurring basis are those that are adjusted to fair value each time a financial statement in prepared. Financial assets and liabilities measured on a non-recurring basis are those that are adjusted to fair value when a significant event occurs. A fair value measurement assumes that a transaction to sell an asset or transfer a liability occurs in the principal market for the asset or liability or, in the absence of a principal market, the most advantageous market for the asset or liability.
The Company’s assets and liabilities measured at fair value are classified in one of the following categories:
Level 1—Assets or liabilities for which fair value is based on quoted prices in active markets for identical instruments as of the reporting date. At May 27, 2010 and May 28, 2009, the Company’s $383,000 and $412,000, respectively, of available for sale securities were valued using Level 1 pricing inputs.
Level 2—The liability related to the Company’s interest rate hedge contract was based on valuation models for which pricing inputs were either directly or indirectly observable as of the reporting date. The liability was $488,000 and $961,000 at May 27, 2010 and May 28, 2009, respectively.
Level 3—Assets or liabilities for which fair value is based on valuation models with significant unobservable pricing inputs and which result in the use of management estimates. At May 27, 2010 and May 28, 2009, none of the Company’s assets or liabilities were valued using Level 3 pricing inputs.
46
THE MARCUS CORPORATION
NOTES TO CONSOLIDATED FINANCIAL STATEMENTS (continued)
1. Description of Business and Summary of Significant Accounting Policies (continued)
The carrying value of the Company’s financial instruments (including cash and cash equivalents, cash held by intermediaries, accounts receivable, notes receivable, investments and accounts and notes payable) approximates fair value. The fair value of the Company’s $119,998,000$102,364,000 of senior notes is approximately $122,374,000$97,824,000 at May 31, 2007,27, 2010, determined based upon current market interest rates for financial instruments with a similar average remaining life. The carrying amounts of the Company’s remaining long-termlong term debt approximate their fair values.
Accounts and Notes Receivable – —The Company evaluates the collectibility of its accounts and notes receivable based on a number of factors. For larger accounts, an allowance for doubtful accounts is recorded based on the applicable parties’ ability and likelihood to pay based on management’s review of the facts. For all other accounts, the Company recognizes an allowance based on length of time the receivable is past due based on historical experience and industry practice.
43
THE MARCUS CORPORATION
NOTES TO CONSOLIDATED FINANCIAL STATEMENTS
Inventory—Inventories are stated at the lower of cost or market. Cost has been determined using the first-in, first-out method. Inventories of $2,062,000 and $2,119,000 as of May 31, 2007
1. Description of Business27, 2010 and Summary of Significant Accounting Policies (continued)May 28, 2009, respectively, were included in other current assets.
Long-Lived Assets – —The Company periodically considers whether indicators of impairment of long-lived assets held for use are present. If such indicators are present, the Company determines whether the sum of the estimated undiscounted future cash flows attributable to such assets is less than their carrying amounts. The Company recognizes any impairment losses based on the excess of the carrying amount of the assets over their fair value. For the purpose of determining fair value, defined as the amount at which an asset or group of assets could be bought or sold in a current transaction between willing parties, the Company utilizes currently available market valuations of similar assets in its respective industries, often expressed as a given multiple of operating cash flow. The Company evaluated the ongoing value of its property and equipment and other long-lived assets as of May 31, 2007,27, 2010, May 25, 2006,28, 2009, and May 26, 2005,29, 2008, and determined that there was no significant impact on the Company’s results of operations, other than a $501,000 before-taxthe impairment charge recordedcharges discussed in fiscal 2006 related to closed theatres.Note 3.
Goodwill – —The Company reviews goodwill for impairment annually or more frequently if certain indicators arise. The Company performed an annual impairment test as of the Company’s year-end date in fiscal 2007, 20062010, 2009 and 20052008 and deemed that no impairment loss was indicated.indicators existed. The Company has determined that its reporting units are its operating segments and all the Company’s goodwill, relates to its Theatres segment andwhich represents the excess of the acquisition cost over the fair value of the assets acquired.acquired, relates to its Theatres segment. A summary of the Company’s goodwill activity follows:
| May 27, 2010 | May 28, 2009 | |||||||
| (in thousands) | ||||||||
Balance at beginning of year | $ | 44,552 | $ | 44,325 | ||||
Adjustment to prior year theatre acquisition | — | 416 | ||||||
Deferred tax adjustment | (139 | ) | (189 | ) | ||||
Balance at end of year | $ | 44,413 | $ | 44,552 | ||||
Capitalization of Interest – —The Company capitalizes interest during construction periods by adding such interest to the cost of constructed assets. Interest of approximately $856,000$278,000, $127,000 and $835,000$62,000 was capitalized in fiscal 20072010, 2009 and 2005,2008, respectively. There was no interest capitalized in fiscal 2006.
Investments – —Available for sale securities are stated at fair market value, with unrealized gains and losses reported as a component of shareholders’ equity. The cost of securities sold is based upon the specific
47
THE MARCUS CORPORATION
NOTES TO CONSOLIDATED FINANCIAL STATEMENTS (continued)
1. Description of Business and Summary of Significant Accounting Policies (continued)
identification method. Realized gains and losses and declines in value judged to be other-than-temporary are included in investment income.income (loss). The Company evaluates securities for other-than-temporary impairment on a periodic basis and principally considers the type of security, the severity of the decline in fair value, and the duration of the decline in fair value in determining whether a security’s decline in fair value is other-than-temporary. In fiscal 2009, the Company recognized a $1,317,000 other-than-temporary investment loss on securities whose market value was substantially below cost which is included in investment income (loss) in the consolidated statements of earnings.
Revenue Recognition – —The Company recognizes revenue from its rooms as earned on the close of business each day. Revenues from theatre admissions, concessions and food and beverage sales are recognized at the time of sale. Revenues from advanced ticket and gift certificate sales are recorded as deferred revenue and are recognized when tickets or gift certificates are redeemed. The Company had deferred revenue of $11,316,000 and $12,255,000, which is included in other accrued liabilities as of May 27, 2010 and May 28, 2009, respectively. Gift card breakage income is recognized based upon historical redemption patterns and represents the balance of gift cards for which the Company believes the likelihood of redemption by the customer is remote. During Fiscal 2010, the Company determined that it had sufficient historical data to support a change in estimate related to its gift card liabilities and recognized $3,157,000 of gift card breakage income, of which $2,404,000 related to periods prior to fiscal 2010. Gift card breakage income is recorded in other revenues in the consolidated statements of earnings.
Other revenues include management fees for theatres and hotels under management agreements. The management fees are recognized as earned based on the terms of the agreements and include both base fees and incentive fees. Revenues do not include sales tax as the Company considers itself a pass-through conduit for collecting and remitting sales taxes.tax.
Advertising and Marketing Costs—The Company expenses all advertising and marketing costs as incurred.
44Workers Compensation and General Liability Claims—The Company records accruals for workers compensation and general liability claims in the period in which they are probable and reasonably estimable. The Company’s principal self-insurance programs include workers compensation and general liability where it self-insures up to a specified dollar amount. Claims exceeding this amount up to specified limits are covered by policies purchased from commercial insurers. The Company estimates the liability for the majority of the self-insured claims using its claim experience for the periods being valued.
Income Taxes—The Company recognizes deferred tax assets and liabilities based on the differences between the financial statement carrying amounts and the tax basis of assets and liabilities. Deferred tax assets represent items to be used as a tax deduction or credit in the future tax returns for which the Company has already properly recorded the tax benefit in the income statement. The Company regularly assesses the probability that the deferred tax asset balance will be recovered against future taxable income, taking into account such factors as earnings history, carryback and carryforward periods, and tax strategies. When the indications are that recovery is unlikely, a valuation allowance is established against the deferred tax asset, increasing income tax expense in the year that conclusion is made. See Note 8—Income Taxes.
48
THE MARCUS CORPORATION
NOTES TO CONSOLIDATED FINANCIAL STATEMENTS
May 31, 2007 (continued)
1. Description of Business and Summary of Significant Accounting Policies (continued)
Revenues from discontinued operations include, in part, sales from a vacation ownership development. Sale of vacation intervals were recognized on an accrual basis after a binding sales contract had been executed, a 10% minimum down payment received, the rescission period expired, construction was substantially complete, and certain minimum sales levels had been reached. Development costs, including construction costs, interest and other carrying costs, which were allocated based on relative sales values, are included in assets of discontinued operations in the accompanying consolidated balance sheets.
Advertising and Marketing Costs – The Company expenses all advertising and marketing costs as incurred.
Depreciation and Amortization – —Depreciation and amortization of property and equipment are provided using the straight-line method over the shorter of the following estimated useful lives or any related lease terms:
| Years | |||
Land improvements | 15 | ||
Buildings and improvements | 25 | ||
Leasehold improvements | 3 | ||
Furniture, fixtures and equipment | 3 |
Preopening Expenses – —Costs incurred prior to opening new or remodeled facilities are expensed as incurred.
Earning Per Share – —Net earnings per share (EPS) of Common Stock and Class B Common Stock is computed in accordance with Statement of Financial Accounting Standards (SFAS) No. 128,Earnings per Share (SFAS No. 128) using the two-classtwo class method. Under the provisions of SFAS No. 128, basicBasic net earnings per share is computed by dividing net earnings by the weighted-average number of common shares outstanding less any non-vested stock. Diluted net earnings per share is computed by dividing net earnings by the weighted-average number of common shares outstanding, adjusted for the effect of dilutive stock options and non-vested stock using the treasury method. Convertible Class B Common Stock is reflected on an if-converted basis. The computation of the diluted net earnings per share of Common Stock assumes the conversion of Class B Common Stock, while the diluted net earnings per share of Class B Common Stock does not assume the conversion of those shares.
Holders of Common Stock are entitled to cash dividends per share equal to 110% of all dividends declared and paid on each share of the Class B Common Stock. As such, and in accordance with Emerging Issues Task Force 03-06,Participating Securities and the Two-Class Method under FASB Statement No. 128(EITF 03-06), the undistributed earnings for each year are allocated based on the proportionate share of entitled cash dividends. Basic earnings per share for fiscal 2006 and 2005 have been presented in accordance with EITF 03-06 for comparative purposes. The computation of diluted net earnings per share of Common Stock assumes the conversion of Class B Common Stock and, as such, the undistributed earnings are equal to net earnings for that computation.
45
THE MARCUS CORPORATION
NOTES TO CONSOLIDATED FINANCIAL STATEMENTS
May 31, 2007
1. Description of Business and Summary of Significant Accounting Policies (continued)
The following table illustrates the computation of Common Stock and Class B Common Stock basic and diluted net earnings per share for earnings from continuing operations and provides a reconciliation of the number of weighted-average basic and diluted shares outstanding:
| Year ended | |||||||||||
|---|---|---|---|---|---|---|---|---|---|---|---|
| May 31, 2007 | May 25, 2006 | May 26, 2005 | |||||||||
| (in thousands, except per share data) | |||||||||||
| Numerator: | |||||||||||
| Earnings from continuing operations | $ | 33,927 | $ | 22,468 | $ | 19,578 | |||||
Denominator: | |||||||||||
| Denominator for basic EPS | 30,359 | 30,439 | 30,120 | ||||||||
| Effect of dilutive employee stock options and non-vested | |||||||||||
| restricted stock | 448 | 500 | 406 | ||||||||
| Denominator for diluted EPS | 30,807 | 30,939 | 30,526 | ||||||||
Earnings per share from continuing operations - Basic: | |||||||||||
| Common Stock | $ | 1.15 | $ | 0.76 | $ | 0.67 | |||||
| Class B Common Stock | $ | 1.04 | $ | 0.68 | $ | 0.60 | |||||
| Earnings per share from continuing operations - Diluted: | |||||||||||
| Common Stock | $ | 1.10 | $ | 0.73 | $ | 0.64 | |||||
| Class B Common Stock | $ | 1.03 | $ | 0.67 | $ | 0.59 | |||||
| Year ended | |||||||||
| May 27, 2010 | May 28, 2009 | May 29, 2008 | |||||||
| (in thousands, except per share data) | |||||||||
Numerator: | |||||||||
Net earnings | $ | 16,115 | $ | 17,200 | $ | 20,486 | |||
Denominator: | |||||||||
Denominator for basic EPS | 29,791 | 29,663 | 29,956 | ||||||
Effect of dilutive employee stock options and non-vested stock | 119 | 156 | 274 | ||||||
Denominator for diluted EPS | 29,910 | 29,819 | 30,230 | ||||||
Net earnings per share—Basic: | |||||||||
Common Stock | $ | 0.56 | $ | 0.60 | $ | 0.70 | |||
Class B Common Stock | $ | 0.50 | $ | 0.54 | $ | 0.64 | |||
Net earnings per share—Diluted: | |||||||||
Common Stock | $ | 0.54 | $ | 0.58 | $ | 0.68 | |||
Class B Common Stock | $ | 0.50 | $ | 0.54 | $ | 0.64 | |||
49
THE MARCUS CORPORATION
NOTES TO CONSOLIDATED FINANCIAL STATEMENTS (continued)
1. Description of Business and Summary of Significant Accounting Policies (continued)
Options to purchase 5,5001,288,141 shares, 7,778885,717 shares, and 6,416371,975 shares of common stock at prices ranging from $22.89$12.73 to $23.37, $16.24$14.07 to $17.73,$23.37, and $15.70$19.75 to $16.24$23.37 per share were outstanding at May 31, 2007,27, 2010, May 25, 2006,28, 2009, and May 26, 2005,29, 2008, respectively, but were not included in the computation of diluted EPS because the options’ exercise price was greater than the average market price of the common shares, and, therefore, the effect would be antidilutive.
Accumulated Other Comprehensive Income (Loss)Loss – —Accumulated other comprehensive income (loss)loss presented in the accompanying consolidated balance sheets consists of the following, all presented net of tax:
| May 31, 2007 | May 25, 2006 | |||||||
|---|---|---|---|---|---|---|---|---|
| (in thousands) | ||||||||
Unrealized gain on available for sale investments | $ | 240 | $ | 123 | ||||
| Minimum pension liability | -- | (11 | ) | |||||
| Net actuarial loss | (1,755 | ) | -- | |||||
| $ | (1,515 | ) | $ | 112 | ||||
| May 27, 2010 | May 28, 2009 | |||||||
| (in thousands) | ||||||||
Unrealized gain on available for sale investments | $ | 81 | $ | 99 | ||||
Unrecognized loss on terminated interest rate swap agreement | (194 | ) | (262 | ) | ||||
Unrealized loss on interest rate swap agreement | (293 | ) | (585 | ) | ||||
Net unrecognized actuarial loss | (2,419 | ) | (2,033 | ) | ||||
| $ | (2,825 | ) | $ | (2,781 | ) | |||
Concentration of Risk—As of May 27, 2010, 11% of the Company’s employees were covered by a collective bargaining agreement, of which 2% are covered by an agreement that will expire within one year.
New Accounting Pronouncements – —In June 2006,December 2007, the Financial Accounting Standards Board (FASB) issued FASB InterpretationAccounting Standards Codification (ASC) No. 48 (FIN 48)805, (originally issued as Statement of Financial Accounting Standards (SFAS) No. 141 (R),AccountingBusiness Combinations), which establishes accounting standards for Uncertainty in Income Taxes.acquisitions made by the Company. This interpretation prescribes a recognition threshold and measurement criteria for a tax position taken or expected to be taken in a tax return. The new standard will bestatement was effective for the Company in the first quarter of fiscal 2008. Based upon the Company’s initial review, the Company does2010 and did not believe adoption of FIN 48 will have a materialan impact on the Company’s overall financial position or results of operations.
In December 2007, the FASB issued ASC No. 810 (originally issued as SFAS No. 160,Noncontrolling Interests in Consolidated Financial Statements),which establishes accounting and reporting standards for the noncontrolling interest in a subsidiary and for the deconsolidation of a subsidiary. This statement was effective for the Company in fiscal 2010 and did not have an impact on the Company’s overall financial position or results of operations.
In June 2009, the FASB issued ASC No. 810 (originally issued as SFAS No. 167,Amendment to FASB Interpretation No. 46(R)), which amends certain requirements of FASB Interpretation No. 46 (revised December 2003),Consolidation of Variable Interest Entities (VIE). The statement requires a qualitative rather than quantitative analysis to determine the primary beneficiary of a VIE, requires continuous assessment of whether an enterprise is the primary beneficiary of a VIE and requires enhanced disclosures about an entity’s involvement with a VIE. This statement is effective for the Company in fiscal 2011 and the Company does not expect the adoption of this statement to have an impact on its overall financial position.
46
THE MARCUS CORPORATION
NOTES TO CONSOLIDATED FINANCIAL STATEMENTS
May 31, 2007
On April 19, 2007,3, 2008, the Company acquired 11seven owned and/or leased movie theatres for a total purchase price of $75,650,000,$40,500,000, net of cash acquired. The acquisition was accounted for using the purchase method of accounting. The net assets acquired consist primarily of land, buildings, leasehold improvements and equipment. The difference between the fair value of the net assets acquired and the purchase price was recorded as goodwill of $26,609,000, which$7,564,000. The $10,070,000 allocated to goodwill for income tax purposes is deductible for tax purposes over fifteen15 years. The
50
THE MARCUS CORPORATION
NOTES TO CONSOLIDATED FINANCIAL STATEMENTS (continued)
consolidated financial statements reflect the preliminaryfinal allocation of the purchase price to the assets acquired and liabilities assumed based on their respective fair values. From the date of acquisition,In fiscal 2008, the acquired theatres contributed approximately $3,500,000$4,131,000 and $650,000$456,000 to revenues and operating income, respectively, in fiscal 2007.respectively.
3. Discontinued OperationsImpairment Charges
On September 3, 2004,In Fiscal 2010, the Company sold substantially alldetermined that indicators of impairment of the assetscondominium units available for sale were evident as the Las Vegas real estate market has been significantly impacted by the recessionary economic conditions. As such, the Company evaluated the ongoing value of its limited-service lodging divisioncondominium units held for sale and determined that the fair value, measured using estimated sales prices of similar condominium units held for sale in the same market, or Level 2 pricing inputs, was less than their carrying value and recorded a total purchase price of $414,900,000 in cash. The purchase price includes approximately $19,000,000 of proceeds$2,575,000 pre-tax impairment loss.
In Fiscal 2008, the Company recorded a $200,000 pre-tax impairment charge related to the sale of four joint venture properties in the transaction. Net proceeds related to the Company from the sale were $390,426,000, net of transaction costs and include $24,979,000 in proceeds received during fiscal 2006 related to funds held in escrow pending completion of certain customary transfer requirements. Net proceeds exclude $10,297,000 of proceeds related to the sale of a joint venture property sold in a subsequent transaction.closed theatres.
The assets sold consisted primarily of land, buildings and equipment with a net book value of approximately $254,792,000, including goodwill with a net book value of approximately $551,000. The result of the transaction was a gain on sale of $82,545,000, net of income taxes of $52,466,000, including additional after tax gains of $7,798,000 recognized during fiscal 2006. In accordance with the provisions of SFAS No. 144,Accounting for the Impairment or Disposal of Long-Lived Assets (SFAS No. 144), the results of operations of the limited-service lodging division have been reported as discontinued operations in the consolidated statement of earnings for all periods presented. Limited-service lodging revenues for the years ended May 31, 2007, May 25, 2006 and May 26, 2005 were $102,000, $523,000 and $43,456,000, respectively. Operating income (loss) for the years ended May 31, 2007, May 25, 2006 and May 26, 2005 was $(166,000), $(1,679,000) and $5,719,000, respectively.
The Company incurred approximately $1,800,000 in one-time severance related costs during fiscal 2005, of which approximately $1,600,000 of these costs were paid out during fiscal 2005. The remaining costs were paid out during fiscal 2006. These one-time termination benefits are included in income (loss) from discontinued operations in the consolidated statement of earnings.
On December 1, 2004, the Company sold the Miramonte Resort for a total purchase price of approximately $28,700,000 in cash. Net proceeds to the Company from the sale were approximately $28,503,000, net of transaction costs. The assets sold consisted primarily of land, building and equipment with a net book value of approximately $22,744,000. The result of the transaction is a gain on sale of $3,484,000, which is net of income taxes of $2,275,000. In accordance with SFAS No. 144, the results of operations of the Miramonte, which have historically been included in the Hotels and Resorts segment financial results, have been reported as discontinued operations in the consolidated statement of earnings for all periods presented. Miramonte revenues for the year ended May 26, 2005 were $3,433,000. Miramonte’s operating loss for the years ended May 31, 2007, May 25, 2006 and May 26, 2005 was $25,000, $95,000 and $2,193,000, respectively.
47
THE MARCUS CORPORATION
NOTES TO CONSOLIDATED FINANCIAL STATEMENTS
May 31, 2007
On June 29, 2006, the Company sold the remaining timeshare inventory of its Marcus Vacation Club at Grand Geneva vacation ownership development. The assets sold consisted primarily of real estate and development costs. In accordance with SFAS No. 144, the results of operations of the Marcus Vacation Club, which have historically been included in the Hotels and Resorts segment financial results, have been reported as discontinued operations in the consolidated statement of earnings for all periods presented. Marcus Vacation Club revenues for the years ended May 31, 2007, May 25, 2006 and May 26, 2005 were $3,958,000, $4,835,000 and $5,649,000, respectively. Marcus Vacation Club’s operating loss for the years ended May 31, 2007, May 25, 2006 and May 26, 2005 was $33,000, $1,085,000 and $560,000, respectively.
The consolidated statements of cash flows include the cash flows from discontinued operations, effectively $0 for both fiscal 2007 and 2006 and $1,000 for fiscal 2005.
The components of the assets and liabilities of discontinued operations included in the consolidated balance sheets are as follows:
| May 31, 2007 | May 25, 2006 | |||||||
|---|---|---|---|---|---|---|---|---|
| (in thousands) | ||||||||
| Assets: | ||||||||
| Refundable income taxes | $ | 733 | $ | 2,812 | ||||
| Real estate and development costs | 24 | 3,444 | ||||||
| Other current assets | 203 | 144 | ||||||
| Net property and equipment | -- | 1,101 | ||||||
| Other assets | 15 | 44 | ||||||
| Assets of discontinued operations | $ | 975 | $ | 7,545 | ||||
Liabilities: | ||||||||
| Current liabilities | $ | 463 | $ | 343 | ||||
| Deferred income taxes | 222 | 172 | ||||||
| Other liabilities | 2,046 | 1,483 | ||||||
| Liabilities of discontinued operations | $ | 2,731 | $ | 1,998 | ||||
The composition of accounts and notes receivable is as follows:
| May 31, 2007 | May 25, 2006 | |||||||
|---|---|---|---|---|---|---|---|---|
| (in thousands) | ||||||||
Trade receivables, net of allowance of $138 and $453, respectively | $ | 6,866 | $ | 4,715 | ||||
| Current notes receivable for interval ownership | 1,174 | 1,406 | ||||||
| Other receivables | 8,184 | 8,185 | ||||||
| $ | 16,224 | $ | 14,306 | |||||
48
| May 27, 2010 | May 28, 2009 | |||||
| (in thousands) | ||||||
Trade receivables, net of allowances of $755 and $458, respectively | $ | 4,599 | $ | 3,610 | ||
Current notes receivable for interval ownership | 451 | 615 | ||||
Other receivables, net of allowances of $1,149 and $1,292, respectively | 4,273 | 8,208 | ||||
| $ | 9,323 | $ | 12,433 | |||
THE MARCUS CORPORATIONIn fiscal 2009, the Company recorded a $1,292,000 allowance for other receivables related to funds advanced to owners of managed properties.
NOTES TO CONSOLIDATED FINANCIAL STATEMENTS
May 31, 2007
The composition of property and equipment, which is stated at cost, is as follows:
| May 31, 2007 | May 25, 2006 | |||||||
|---|---|---|---|---|---|---|---|---|
| (in thousands) | ||||||||
| Land and improvements | $ | 68,732 | $ | 60,889 | ||||
| Buildings and improvements | 464,928 | 382,555 | ||||||
| Leasehold improvements | 57,309 | 39,682 | ||||||
| Furniture, fixtures and equipment | 197,593 | 167,687 | ||||||
| Construction in progress | 3,995 | 17,580 | ||||||
| 792,557 | 668,393 | |||||||
| Less accumulated depreciation and amortization | 232,772 | 217,864 | ||||||
| $ | 559,785 | $ | 450,529 | |||||
| May 27, 2010 | May 28, 2009 | |||||
| (in thousands) | ||||||
Land and improvements | $ | 92,761 | $ | 89,090 | ||
Buildings and improvements | 521,150 | 512,002 | ||||
Leasehold improvements | 61,276 | 60,423 | ||||
Furniture, fixtures and equipment | 218,347 | 210,684 | ||||
Construction in progress | 4,687 | 8,489 | ||||
| 898,221 | 880,688 | |||||
Less accumulated depreciation and amortization | 312,232 | 285,132 | ||||
| $ | 585,989 | $ | 595,556 | |||
51
THE MARCUS CORPORATION
NOTES TO CONSOLIDATED FINANCIAL STATEMENTS (continued)
4. Additional Balance Sheet Information (continued)
The composition of other assets is as follows:
| May 31, 2007 | May 25, 2006 | |||||||
|---|---|---|---|---|---|---|---|---|
| (in thousands) | ||||||||
| Favorable lease right | $ | 12,686 | $ | 12,677 | ||||
| Long-term notes receivable for interval ownership, net | 2,930 | 4,540 | ||||||
| Split dollar life insurance policies | 10,299 | 9,319 | ||||||
| Other assets | 13,657 | 12,583 | ||||||
| $ | 39,572 | $ | 39,119 | |||||
| May 27, 2010 | May 28, 2009 | |||||
| (in thousands) | ||||||
Favorable lease right | $ | 11,684 | $ | 12,018 | ||
Long-term notes receivable for interval ownership, net | 623 | 1,068 | ||||
Split dollar life insurance policies | 9,395 | 8,419 | ||||
Other assets | 12,213 | 12,463 | ||||
| $ | 33,915 | $ | 33,968 | |||
The Company’s long-term notes receivable for interval ownership are net of a reserve for uncollectible amounts of $945,000$161,000 and $1,206,000$269,000 as of May 31, 200727, 2010 and May 25, 2006,28, 2009, respectively. The notes bear fixed-rate interest between 6.0% and 15.90%15.9% over the seven-year or ten-year terms of the loans. The weighted-average rate of interest on outstanding notes receivable for interval ownership is 15.30%15.4%. The notes are collateralized by the underlying vacation intervals.
The Company has escrow depositsCompany’s favorable lease right is being amortized over the expected term of $722,000the underlying lease and $6,895,000, which are includedis expected to result in other current assets asamortization of May 31, 2007 and May 25, 2006, respectively. The Company also has deferred revenue$334,000 in each of $9,654,000 and $7,752,000, which is included in other accrued liabilities as of May 31, 2007 and May 25, 2006, respectively.
49
THE MARCUS CORPORATIONthe five succeeding fiscal years.
NOTES TO CONSOLIDATED FINANCIAL STATEMENTS
May 31, 2007
Long-term debt is summarized as follows:
| May 31, 2007 | May 25, 2006 | |||||||
|---|---|---|---|---|---|---|---|---|
| (in thousands, except payment data) | ||||||||
Mortgage notes | $ | 61,090 | $ | 25,139 | ||||
| Senior notes | 119,998 | 148,127 | ||||||
| Unsecured term note due February 2025, with monthly principal and | ||||||||
| interest payments of $39,110, bearing interest at 5.75% | 5,228 | 3,246 | ||||||
| Commercial paper | 46,359 | -- | ||||||
| Revolving credit agreement | 24,000 | -- | ||||||
| 256,675 | 176,512 | |||||||
| Less current maturities | 57,250 | 53,402 | ||||||
| $ | 199,425 | $ | 123,110 | |||||
| May 27, 2010 | May 28, 2009 | |||||
(in thousands, except payment data) | ||||||
Mortgage notes | $ | 61,419 | $ | 61,423 | ||
Senior notes | 102,364 | 116,597 | ||||
Unsecured term note due February 2025, with monthly principal and interest payments of $39,110, bearing interest at 5.75% | 4,660 | 4,855 | ||||
Commercial paper | — | 5,500 | ||||
Revolving credit agreement | 68,000 | 67,000 | ||||
| 236,443 | 255,375 | |||||
Less current maturities | 39,610 | 14,432 | ||||
| $ | 196,833 | $ | 240,943 | |||
The mortgage notes, both fixed rate and adjustable, bear interest from 1.0% to 7.32%6.1% at May 31, 2007,27, 2010, and mature in fiscal years 20082012 through 2036. The mortgage notes are secured by the related land, buildings and equipment.
The $119,998,000$102,364,000 of senior notes maturing in 20092012 through 20142020 require annual principal payments in varying installments and bear interest payable semiannuallysemi-annually at fixed rates ranging from 6.66%5.89% to 7.93%, with a weighted-average fixed rate of 7.21%6.64% and 6.70% at May 31, 2007.27, 2010 and May 28, 2009, respectively.
52
THE MARCUS CORPORATION
NOTES TO CONSOLIDATED FINANCIAL STATEMENTS (continued)
5. Long-Term Debt (continued)
The Company issueshas the ability to issue commercial paper through an agreement with two banks,a bank, up to a maximum of $65,000,000, which bears interest at 5.45% at May 31, 2007.$35,000,000. The agreements requireagreement requires the Company to maintain unused bank lines of credit at least equal to the principal amount of outstanding commercial paper.
At May 31, 2007,27, 2010, the Company had a credit line totaling $125,000,000$175,000,000 in place. There were borrowings of $24,000,000$68,000,000 outstanding on the line, of which $4,000,000 bears interest at the prime rate of 3.25% at May 27, 2010, and $64,000,000 bears interest at LIBOR plus a margin which adjusts based on the Company’s borrowing levels, effectively 6.175%1.175% at May 31, 2007.27, 2010. This agreement matures in April 20092013 and requires an annual facility fee of 0.175%0.20% on the total commitment. Based on borrowings and commercial paper outstanding, availability under the line at May 31, 200727, 2010 totaled $54,641,000.$107,000,000.
The Company has the ability and the intent to replace commercial paper borrowings with long-term borrowings under its credit facility. Accordingly, the Company has classifiedclassifies these borrowings at May 31, 2007 as long-term.
The Company’s loan agreements include, among other covenants, maintenance of certain financial ratios.
50
THE MARCUS CORPORATION
NOTES TO CONSOLIDATED FINANCIAL STATEMENTS
ratios, including a debt-to-capitalization ratio and a fixed charge coverage ratio. The Company is in compliance with all debt covenants at May 31, 200727, 2010.
Scheduled annual principal payments on long-term debt for the years subsequent to May 31, 200727, 2010 are:
| Fiscal Year | (in thousands) | ||||
2008 | $ | 57,250 | |||
| 2009 | 102,138 | ||||
| 2010 | 14,282 | ||||
| 2011 | 14,283 | ||||
| 2012 | 14,287 | ||||
| Thereafter | 54,435 | ||||
| $ | 256,675 | ||||
| Fiscal Year | (in thousands) | ||
2011 | $ | 39,610 | |
2012 | 17,345 | ||
2013 | 105,083 | ||
2014 | 7,324 | ||
2015 | 2,403 | ||
Thereafter | 64,678 | ||
| $ | 236,443 | ||
Interest paid, net of amounts capitalized, in fiscal 2007, 20062010, 2009, and 20052008 totaled $13,581,000, $14,245,000$11,181,000, $14,302,000, and $14,682,000,$15,026,000, respectively.
The Company has utilizedutilizes derivatives in the past principally to manage market risks and reduce its exposure resulting from fluctuations in interest rates. The Company formally documents all relationships between hedging instruments and hedged items, as well as its risk-management objectives and strategies for undertaking various hedge transactions. From June 1, 2001 to May 3, 2002, the
The Company hadentered into an interest rate swap agreement on February 1, 2008 covering $25,170,000 of floating rate debt, which expires February 1, 2011, and requires the Company to pay interest at a defined rate of 3.24% while receiving interest at a defined variable rate of one-month LIBOR (0.375% at May 27, 2010). The Company recognizes derivatives as either assets or liabilities on the balance sheet at fair value. The accounting for changes in the fair value (i.e., gains or losses) of a derivative instrument depends on whether it has been designated and qualifies as part of a hedging relationship and on the type of hedging relationship. Derivatives that do not qualify for hedge accounting must be adjusted to fair value through earnings. The Company’s interest rate swap agreement is considered effective and qualifies as a cash flow hedge. For derivatives that are designated and qualify as a cash flow hedge, the effective portion of the gain or loss on the derivative is reported
53
THE MARCUS CORPORATION
NOTES TO CONSOLIDATED FINANCIAL STATEMENTS (continued)
5. Long-Term Debt (continued)
as a component of accumulated other comprehensive loss and reclassified into earnings in the same period or periods during which the hedged transaction affects earnings. In fiscal 2010 and 2009 and from February 1, 2008 through May 29, 2008, the interest rate swap was considered effective and had no effect on earnings. The increase (decrease) in fair value of the interest rate swap of $474,000 ($292,000 net of tax), $(1,198,000) ($(726,000) net of tax) and $237,000 ($141,000 net of tax), is included in accumulated other comprehensive loss in fiscal 2010, 2009 and 2008, respectively. The Company does not expect the interest rate swap to have any effect on earnings within the next 12 months.
As of May 27, 2010 and May 28, 2009, the notional amount of the swap was $25,170,000. The fair value of the swap as of May 27, 2010 and May 28, 2009 was a liability of $488,000 and $961,000, respectively, and was included in other accrued liabilities at May 27, 2010 and other long-term liabilities at May 28, 2009.
On February 29, 2008, the Company also entered into an interest rate swap agreement covering $25,000,000 of floating rate debt, which required the Company to pay interest at a defined rate of 3.49% while receiving interest at a defined variable rate of three-month LIBOR. The interest rate swap agreement was considered effective and qualified as a cash flow hedge. On May 3, 2002,March 19, 2008, the Company terminated the swap, at which time cash flow hedge accounting ceased. The fair value of the swap on the date of termination was a liability of $2,791,000.$567,000 ($338,000 net of tax). In fiscal 20062010 and 2005,2009 and from March 19, 2008, through May 29, 2008, the Company reclassified $184,000$113,000 ($111,00068,000 net of tax), $123,000 ($73,000 net of tax) and $432,000$5,000 ($259,0003,000 net of tax), respectively, from accumulated other comprehensive income (loss)loss to interest expense.expense, respectively. The remaining loss at May 27, 2010 in accumulated other comprehensive loss will be reclassified into earnings as interest expense through April 15, 2013, the remaining life of the original hedge. The Company expects to reclassify approximately $113,000 ($68,000 net of tax) of loss into earnings within the next 12 months.
6. Shareholders’ Equity and Stock-Based Compensation
Shareholders may convert their shares of Class B Common Stock into shares of Common Stock at any time. Class B Common Stock shareholders are substantially restricted in their ability to transfer their Class B Common Stock. Holders of Common Stock are entitled to cash dividends per share equal to 110% of all dividends declared and paid on each share of the Class B Common Stock. Holders of Class B Common Stock are entitled to ten votes per share while holders of Common Stock are entitled to one vote per share on any matters brought before the shareholders of the Company. Liquidation rights are the same for both classes of stock.
On February 24, 2006, the Company paid a special cash dividend of $7.00 per share, returning to shareholders approximately $214,576,000 in proceeds resulting from the sale of the limited-service lodging division. In connection with the special dividend, and pursuant to the terms of the Company’s various stock option plans, certain adjustments were made to the stock options outstanding under the plans in order to avoid dilution of the intended benefits to existing optionees holding outstanding options under the plans which would otherwise result as a consequence of the special dividend. All stock option data prior to the special dividend date has been restated to reflect the adjustments.
51
THE MARCUS CORPORATION
NOTES TO CONSOLIDATED FINANCIAL STATEMENTS
May 31, 2007
Through May 31, 2007,27, 2010, the Company’s Board of Directors has approved the repurchase of up to 4,687,5006,687,500 shares of Common Stock to be held in treasury. The Company intends to reissue these shares upon the exercise of stock options and for savings and profit-sharing plan contributions. The Company purchased 410,696, 313,41670,081, 19,831, and 28,295828,418 shares pursuant to these authorizations during fiscal 2007, 20062010, 2009 and 2005,2008, respectively. At May 31, 2007,27, 2010, there were 1,147,4262,229,096 shares available for repurchase under these authorizations.
The Company’s Board of Directors has authorized the issuance of up to 750,000 shares of Common Stock for The Marcus Corporation Dividend Reinvestment and Associate Stock Purchase Plan. At May 31, 2007,27, 2010, there were 583,408544,826 shares available under this authorization.
Shareholders have approved the issuance of up to 3,437,500 shares of Common Stock under various equity incentive plans. Options granted under the plans to employees generally become exercisable 40% after two years, 60% after three years, 80% after four years and 100% after five years of the date of grant. The options generally expire ten years from the date of grant as long as the optionee is still employed with the Company.
54
THE MARCUS CORPORATION
NOTES TO CONSOLIDATED FINANCIAL STATEMENTS (continued)
6. Shareholders’ Equity and Stock-Based Compensation (continued)
Awarded shares of non-vested stock cumulatively vest either 25% after three years of the grant date, 50% after five years of the grant date, 75% after ten years of the grant date and 100% upon retirement, or 50% after three years of the grant date and 100% after five years of the grant date, depending on the date of grant. The non-vested stock may not be sold, transferred, pledged or assigned, except as provided by the vesting schedule included in the Company’s equity incentive plan. During the period of restriction, the holder of the non-vested stock has voting rights and is entitled to receive all dividends and other distributions paid with respect to the stock. Non-vested stock awards and shares issued upon option exercises are issued from previously acquired treasury shares. At May 31, 2007,27, 2010, there were 1,444,115713,519 shares available for grants of additional stock options, non-vested stock and other types of equity awards under the current plan.
The Company adopted SFAS No. 123(R), Share-Based Payment, on May 26, 2006. SFAS No. 123(R) requires stock-basedStock-based compensation, to beincluding stock options and non-vested stock awards, is expensed over the vesting period of the awards based on the grant date fair value. The Company elected to adopt SFAS No. 123(R) using the modified prospective transition method which does not result in the restatement of previously issued financial statements. The provisions of SFAS No. 123(R) apply to all awards granted or modified after the date of adoption. In addition, compensation expense must be recognized for the amortization of unvested stock option awards outstanding as of the date of adoption. Prior to May 26, 2006, the Company accounted for stock-based compensation in accordance with Accounting Principles Board Opinion (APB) No. 25,Accounting for Stock Issued to Employees. Accordingly, no compensation expense had been recognized for stock options because all options granted had an exercise price equal to the market value of the underlying stock on the date of grant.
52
THE MARCUS CORPORATION
NOTES TO CONSOLIDATED FINANCIAL STATEMENTS
May 31, 2007
The Company estimated the fair value of stock options using the Black-Scholes option pricing model with the following assumptions used for awards granted during fiscal 2007, 20062010, 2009 and 2005:2008:
| Year Ended May 31, 2007 | Year Ended May 25, 2006 | Year Ended May 26, 2005 | |
|---|---|---|---|
Risk-free interest rate | 5.0% | 4.2% | 3.5% |
| Dividend yield | 1.6% | 1.1% | 1.2% |
| Volatility | 37 - 41% | 39% | 43% |
| Expected life | 5 - 9 years | 5 years | 5 years |
| Year Ended May 27, 2010 | Year Ended May 28, 2009 | Year Ended May 29, 2008 | ||||
Risk-free interest rate | 2.2-3.5% | 3.9% | 4.6% | |||
Dividend yield | 2.7% | 1.9% | 1.5% | |||
Volatility | 49-59% | 38-41% | 33-41% | |||
Expected life | 4-9 years | 4-9 years | 4-9 years | |||
Total pre-tax stock-based compensation expense was $1,326,000$1,607,000, $1,421,000, and $1,215,000 in fiscal 20072010, 2009 and $121,000 in both fiscal 2006 and 2005. Total pre-tax stock-based compensation expense for fiscal 2006 and 2005 was entirely related to non-vested stock.2008, respectively.
As a result of adopting SFAS No. 123(R) on May 26, 2006, the Company’s fiscal 2007 earnings from continuing operations before income taxes and net earnings were $1,073,000 and $830,000 lower, respectively, than if the Company had continued to account for stock-based compensation under APB No. 25. For the fiscal year ended May 31, 2007, basic and diluted net earnings per common share were $0.02 and $0.03 lower, respectively, than if the Company had continued to account for stock-based compensation under APB No. 25.
The following table illustrates the pro forma effect on net earnings and earnings per common share if the Company had applied the fair value recognition provisions of SFAS No. 123 to stock-based compensation for fiscal 2006 and 2005:
| Year Ended May 25, 2006 | Year Ended May 26, 2005 | |||||||
|---|---|---|---|---|---|---|---|---|
| (in thousands, except per share data) | ||||||||
Net earnings, as reported | $ | 28,271 | $ | 99,221 | ||||
| Add: reported stock compensation expense, net of tax | 82 | 75 | ||||||
| Deduct: stock-based employee compensation expense determined | ||||||||
| under the fair value method, net of tax | (864 | ) | (1,025 | ) | ||||
| Pro forma net earnings | $ | 27,489 | $ | 98,271 | ||||
Earnings per common share: | ||||||||
| Basic - as reported | $ | 0.96 | $ | 3.42 | ||||
| Basic - pro forma | $ | 0.93 | $ | 3.39 | ||||
| Diluted - as reported | $ | 0.91 | $ | 3.25 | ||||
| Diluted - pro forma | $ | 0.89 | $ | 3.22 | ||||
53
THE MARCUS CORPORATION
NOTES TO CONSOLIDATED FINANCIAL STATEMENTS
May 31, 2007
A summary of the Company’s stock option activity and related information follows:
| May 31, 2007 | May 25, 2006 | May 26, 2005 | ||||||||||||||||||
|---|---|---|---|---|---|---|---|---|---|---|---|---|---|---|---|---|---|---|---|---|
| Options | Weighted- Average Exercise Price | Options | Weighted- Average Exercise Price | Options | Weighted- Average Exercise Price | |||||||||||||||
| (options in thousands) | ||||||||||||||||||||
Outstanding at beginning of year | 1,157 | $ | 11.22 | 1,661 | $ | 10.28 | 2,489 | $ | 9.85 | |||||||||||
| Granted | 195 | 19.86 | 227 | 14.16 | 212 | 12.82 | ||||||||||||||
| Exercised | (185 | ) | 10.70 | (662 | ) | 9.81 | (701 | ) | 9.60 | |||||||||||
| Forfeited | (30 | ) | 14.88 | (69 | ) | 11.71 | (339 | ) | 10.04 | |||||||||||
| Outstanding at end of year | 1,137 | $ | 12.69 | 1,157 | $ | 11.22 | 1,661 | $ | 10.28 | |||||||||||
| Exercisable at end of year | 548 | $ | 10.22 | 493 | $ | 9.90 | 833 | $ | 9.86 | |||||||||||
| Weighted-average fair value of | $8.09 | $5.22 | $4.92 | |||||||||||||||||
| options granted during year | ||||||||||||||||||||
| May 27, 2010 | May 28, 2009 | May 29, 2008 | ||||||||||||||||
| Options | Weighted- Average Exercise Price | Options | Weighted- Average Exercise Price | Options | Weighted- Average Exercise Price | |||||||||||||
| (options in thousands) | ||||||||||||||||||
Outstanding at beginning of year | 1,500 | $ | 14.37 | 1,250 | $ | 13.95 | 1,137 | $ | 12.69 | |||||||||
Granted | 298 | 13.31 | 327 | 15.54 | 212 | 20.06 | ||||||||||||
Exercised | (38 | ) | 8.92 | (48 | ) | 10.03 | (73 | ) | 11.29 | |||||||||
Forfeited | (30 | ) | 13.35 | (29 | ) | 16.44 | (26 | ) | 16.59 | |||||||||
Outstanding at end of year | 1,730 | $ | 14.33 | 1,500 | $ | 14.37 | 1,250 | $ | 13.95 | |||||||||
Exercisable at end of year | 907 | $ | 13.08 | 778 | $ | 11.82 | 662 | $ | 10.77 | |||||||||
Weighted-average fair value of options granted during year | $5.56 | $5.87 | $7.45 | |||||||||||||||
55
THE MARCUS CORPORATION
NOTES TO CONSOLIDATED FINANCIAL STATEMENTS (continued)
6. Shareholders’ Equity and Stock-Based Compensation (continued)
Exercise prices for options outstanding as of May 31, 200727, 2010 ranged from $7.71$8.02 to $23.37. The weighted-average remaining contractual life of those options is 6.15.8 years. The weighted-average remaining contractual life of options currently exercisable is 3.7 years. Additional information related to these options segregated by exercise price range is as follows:
| Exercise Price Range | ||||||||||||||
|---|---|---|---|---|---|---|---|---|---|---|---|---|---|---|
| $7.71 to $10.17 | $10.18 to $12.71 | $12.72 to $17.73 | $17.74 to $23.37 | |||||||||||
| (options in thousands) | ||||||||||||||
| Options outstanding | 298 | 291 | 362 | 186 | ||||||||||
| Weighted-average exercise price of options | ||||||||||||||
| outstanding | $ | 9.00 | $ | 10.75 | $ | 13.59 | $ | 19.86 | ||||||
| Weighted-average remaining contractual life of | ||||||||||||||
| options outstanding | 3.4 | 5.0 | 7.7 | 9.1 | ||||||||||
| Options exercisable | 297 | 181 | 66 | 4 | ||||||||||
| Weighted-average exercise price of options | ||||||||||||||
| exercisable | $ | 9.00 | $ | 10.87 | $ | 13.25 | $ | 23.24 | ||||||
| Exercise Price Range | |||||||||
$8.02 to $12.71 | $12.72 to $17.73 | $17.74 to $23.37 | |||||||
| (options in thousands) | |||||||||
Options outstanding | 441 | 934 | 355 | ||||||
Weighted-average exercise price of options outstanding | $ | 9.89 | $ | 14.22 | $ | 20.14 | |||
Weighted-average remaining contractual life of options outstanding | 1.8 | 7.3 | 6.7 | ||||||
Options exercisable | 441 | 288 | 178 | ||||||
Weighted-average exercise price of options exercisable | $ | 9.89 | $ | 13.63 | $ | 20.11 | |||
The intrinsic value of options outstanding at May 31, 200727, 2010 was $12,144,000,$550,000, and the intrinsic value of options exercisable at May 31, 200727, 2010 was $7,209,000.$550,000. The intrinsic value of options exercised was $2,246,000, $18,283,000$93,000, $291,000, and $3,221,000$2,299,000 during fiscal 2007, 20062010, 2009 and 2005,2008, respectively. As of May 31, 2007,27, 2010, total remaining unearned compensation cost related to stock options was $2,111,000,$3,160,000, which will be amortized to expense over the remaining weighted-average service period of five years.
54
THE MARCUS CORPORATION
NOTES TO CONSOLIDATED FINANCIAL STATEMENTS
May 31, 2007
Following is aA summary of the Company’s non-vested stock activity and related information for the fiscal year ended May 31, 2007:follows:
| Shares | Weighted-Average Fair Value | |||||||
|---|---|---|---|---|---|---|---|---|
| (shares in thousands) | ||||||||
Outstanding at May 26, 2006 | 59 | $ | 16.52 | |||||
| Granted | 44 | 20.26 | ||||||
| Vested | (14 | ) | 14.61 | |||||
| Forfeited | -- | -- | ||||||
| Outstanding at May 31, 2007 | 89 | $ | 18.71 | |||||
| May 27, 2010 | May 28, 2009 | |||||||||||
| Shares | Weighted-Average Fair Value | Shares | Weighted-Average Fair Value | |||||||||
| (shares in thousands) | ||||||||||||
Outstanding at beginning of year | 75 | $ | 19.07 | 87 | $ | 18.64 | ||||||
Granted | 22 | 10.36 | — | — | ||||||||
Vested | (24 | ) | 20.37 | (12 | ) | 15.84 | ||||||
Forfeited | — | — | — | — | ||||||||
Outstanding at end of year | 73 | $ | 12.87 | 75 | $ | 19.07 | ||||||
The Company previously had and will continue to expenseexpenses awards of non-vested stock based on the fair value of the Company’s common stock at the date of grant. As a result of adopting SFAS No. 123(R), unearned compensation on non-vested stock was reclassified into capital in excess of par on the date of adoption. As of May 31, 2007,27, 2010, total remaining unearned compensation related to non-vested stock was $941,000,$546,000, which will be amortized over the weighted-average remaining service period of 8.86.8 years.
7. Employee Benefit Plans
The Company has a qualified profit-sharing savings plan (401(k) plan) covering eligible employees. The 401(k) plan provides for a contribution of a minimum of 1% of defined compensation for all plan participants and matching of 25% of employee contributions up to 6% of defined compensation. In addition, the Company may make additional discretionary contributions. During fiscal 2007, 20062010, 2009 and 2005,2008, the 1% and the discretionary contributions were made with the Company’s common stock. The Company also sponsors unfunded, nonqualified, defined-benefit and deferred compensation plans. The Company’s unfunded, nonqualified defined-benefit plan was amended effective January 1, 2009 to include two components. The first component applies to certain participants and continues to provide the same nonqualified pension benefits as
56
THE MARCUS CORPORATION
NOTES TO CONSOLIDATED FINANCIAL STATEMENTS (continued)
7. Employee Benefit Plans (continued)
were provided prior to the amendment. The second component applies to all other participants and provides an account-based supplemental retirement benefit. Pension and profit-sharing expense related to continuing operations for all plans was $2,408,000, $2,243,000$2,921,000, $2,997,000, and $2,217,000$2,597,000 for fiscal 2007, 20062010, 2009 and 2005,2008, respectively.
On May 26, 2006, theThe Company adopted SFAS No. 158,Employers’ Accounting for Defined Benefit Pension and Other Postretirement Plans, which requires the Company to recognize previously unrecognizedrecognizes actuarial losses and prior service costs related to its defined benefit plan in the statement of financial position and to recognize futurerecognizes changes in these amounts in the year in which changes occur thoughthrough comprehensive income. Additionally, the Company is required to measure the funded status of its plan as of the date of its year-end statement of financial position.
55
THE MARCUS CORPORATION
NOTES TO CONSOLIDATED FINANCIAL STATEMENTS
May 31, 2007
The adoption of SFAS No. 158 had no effect on the Company’s consolidated statement of earnings for the year ended May 31, 2007, or for any prior period presented, and it will not affect the Company’s operating results in future periods. The incremental effects of adopting the provisions of SFAS No. 158 on the Company’s statement of financial position at May 31, 2007 are presented in the following table:
| At May 31, 2007 | |||||||||||
|---|---|---|---|---|---|---|---|---|---|---|---|
| Prior to Adopting SFAS No. 158 | Effect of Adopting SFAS No. 158 | As Reported | |||||||||
| (in thousands) | |||||||||||
Deferred income taxes, net | $ | 30,546 | $ | (1,170 | ) | $ | 29,376 | ||||
| Other accrued liabilities | 23,961 | 785 | 24,746 | ||||||||
| Deferred compensation and other | 20,790 | 2,140 | 22,930 | ||||||||
| Accumulated other comprehensive income | |||||||||||
| (loss) | 240 | (1,755 | ) | (1,515 | ) | ||||||
The status of the Company’s unfunded nonqualified, defined-benefit and account-based retirement plan based on the respective May 31, 200727, 2010 and May 25, 200628, 2009 measurement dates is as follows:
| May 31, 2007 | May 25, 2006 | |||||||
|---|---|---|---|---|---|---|---|---|
| (in thousands) | ||||||||
Change in benefit obligation: | ||||||||
| Net benefit obligation at beginning of year | $ | 16,896 | $ | 16,090 | ||||
| Service cost | 432 | 412 | ||||||
| Interest cost | 1,085 | 877 | ||||||
| Actuarial gain | (1,477 | ) | (239 | ) | ||||
| Benefits paid | (250 | ) | (244 | ) | ||||
| Net benefit obligation at end of year | $ | 16,686 | $ | 16,896 | ||||
Funded status at end of year | $ | (16,686 | ) | $ | (16,896 | ) | ||
| Unrecognized net actuarial loss | -- | 4,583 | ||||||
| Unrecognized prior service cost | -- | 5 | ||||||
| Other comprehensive income | 2,925 | -- | ||||||
| Net amount recognized at end of year | $ | (13,761 | ) | $ | (12,308 | ) | ||
Amounts recognized in the statement of financial position consist of: | ||||||||
| Current accrued benefit liability | $ | (785 | ) | $ | (250 | ) | ||
| Noncurrent accrued benefit liability | (15,901 | ) | (12,058 | ) | ||||
| Additional minimum liability | -- | (24 | ) | |||||
| Intangible asset | -- | 5 | ||||||
| Accumulated other comprehensive loss | 1,755 | 11 | ||||||
| Deferred tax asset | 1,170 | 8 | ||||||
| Net amount recognized at end of year | $ | (13,761 | ) | $ | (12,308 | ) | ||
56
May 27, 2010 | May 28, 2009 | |||||||
| (in thousands) | ||||||||
Change in benefit obligation: | ||||||||
Net benefit obligation at beginning of year | $ | 19,049 | $ | 18,848 | ||||
Service cost | 505 | 539 | ||||||
Interest cost | 1,264 | 1,229 | ||||||
Plan change | — | (1,256 | ) | |||||
Actuarial loss | 775 | 867 | ||||||
Benefits paid | (830 | ) | (1,178 | ) | ||||
Net benefit obligation at end of year | $ | 20,763 | $ | 19,049 | ||||
Funded status at end of year | $ | (20,763 | ) | $ | (19,049 | ) | ||
Unrecognized prior service credit | (1,145 | ) | (1,223 | ) | ||||
Unrecognized net actuarial loss | 5,171 | 4,561 | ||||||
Net amount recognized at end of year | $ | (16,737 | ) | $ | (15,711 | ) | ||
Amounts recognized in the statement of financial position consist of: | ||||||||
Current accrued benefit liability | $ | (820 | ) | $ | (823 | ) | ||
Noncurrent accrued benefit liability | (19,943 | ) | (18,226 | ) | ||||
Accumulated other comprehensive loss | 2,419 | 2,033 | ||||||
Deferred tax asset | 1,607 | 1,305 | ||||||
Net amount recognized at end of year | $ | (16,737 | ) | $ | (15,711 | ) | ||
| Year ended | |||||||||
| May 27, 2010 | May 28, 2009 | May 29, 2008 | |||||||
| (in thousands) | |||||||||
Net periodic pension cost: | |||||||||
Service cost | $ | 505 | $ | 539 | $ | 485 | |||
Interest cost | 1,264 | 1,229 | 1,024 | ||||||
Net amortization of prior service cost, transition obligation and actuarial loss | 88 | 128 | 69 | ||||||
| $ | 1,857 | $ | 1,896 | $ | 1,578 | ||||
57
THE MARCUS CORPORATION
NOTES TO CONSOLIDATED FINANCIAL STATEMENTS (continued)
May 31, 2007
| Year ended | |||||||||||
|---|---|---|---|---|---|---|---|---|---|---|---|
| May 31, 2007 | May 25, 2006 | May 26, 2005 | |||||||||
| (in thousands) | |||||||||||
Net periodic pension cost: | |||||||||||
| Service cost | $ | 432 | $ | 412 | $ | 369 | |||||
| Interest cost | 1,085 | 877 | 891 | ||||||||
| Net amortization of prior service cost, transition obligation | |||||||||||
| and actuarial loss | 186 | 184 | 198 | ||||||||
| $ | 1,703 | $ | 1,473 | $ | 1,458 | ||||||
The $1,755,000$2,419,000 loss, net of tax, included in accumulated other comprehensive income (loss)loss at May 31, 2007, is27, 2010, consists of the $3,107,000 net actuarial loss, net of tax, and the $688,000 unrecognized prior service credit, net of tax, which hashave not yet been recognized in the net periodic benefit cost.
The accumulated benefit obligation was $12,464,000$15,409,000 and $12,332,000$13,889,000 as of May 31, 200727, 2010 and May 25, 2006,28, 2009, respectively.
The pre-tax change in the benefit obligation recognized in other comprehensive loss during fiscal 2010 consisted of the current year net actuarial loss of $774,000, the amortization of the net actuarial loss of $165,000 and the amortization of the prior service credit of $78,000. The estimated amount that will be amortized from accumulated other comprehensive loss into net periodic benefit cost in fiscal 2010 is $108,000 and relates to the actuarial loss and the prior service credit.
The benefit obligations were determined using an assumed weighted-average discount rate of 6.10%5.70% in 2010 and 6.25%6.60% in 2007 and 2006, respectively,2009, and an annual salary rate increase of 5.0% for both years.
The net periodic benefit cost was determined using an assumed discount rate of 6.25%, 5.5%6.60% in fiscal 2010 and 6.5%2009 and 6.10% in 2007, 2006 and 2005, respectively,2008 and an annual salary rate increase of 5.0% for all three years.
Benefit payments expected to be paid subsequent to May 31, 200727, 2010 are:
| Fiscal Year | (in thousands) | ||||
| 2008 | $ | 785,439 | |||
| 2009 | 903,872 | ||||
| 2010 | 907,828 | ||||
| 2011 | 920,140 | ||||
| 2012 | 944,076 | ||||
| Years 2013 - 2017 | 5,280,197 | ||||
| Fiscal Year | (in thousands) | ||
2011 | $ | 820 | |
2012 | 810 | ||
2013 | 806 | ||
2014 | 806 | ||
2015 | 1,022 | ||
Years 2016 – 2020 | 5,348 | ||
8. Income Taxes
The Company recognizes deferred tax assets and liabilities based upon the expected future tax consequences of events that have been included in the financial statements or tax returns. Under the liability method, deferred tax assets and liabilities are determined based on the difference between the financial statement and tax basis of assets and liabilities using enacted tax rates for the year in which the differences are expected to reverse.
57
THE MARCUS CORPORATION
NOTES TO CONSOLIDATED FINANCIAL STATEMENTS
May 31, 2007
The components of the net deferred tax liability for continuing operations wereare as follows:
| May 31, 2007 | May 25, 2006 | |||||||
|---|---|---|---|---|---|---|---|---|
| (in thousands) | ||||||||
| Current deferred income tax assets: | ||||||||
| Accrued employee benefits | $ | 544 | $ | 5,413 | ||||
| Other accrued liabilities | 512 | 485 | ||||||
| Net current deferred tax assets | $ | 1,056 | $ | 5,898 | ||||
| Noncurrent deferred income tax (liabilities) assets: | ||||||||
| Depreciation and amortization | $ | (37,473 | ) | $ | (28,823 | ) | ||
| Accrued employee benefits | 8,161 | 741 | ||||||
| Other accrued liabilities | (64 | ) | 136 | |||||
| Net noncurrent deferred tax liabilities | $ | (29,376 | ) | $ | (27,946 | ) | ||
| May 27, 2010 | May 28, 2009 | |||||||
| (in thousands) | ||||||||
Current deferred income tax assets: | ||||||||
Depreciation and amortization | $ | — | $ | — | ||||
Accrued employee benefits | 597 | 578 | ||||||
Other | 2,111 | 2,561 | ||||||
Net current deferred tax assets | $ | 2,708 | $ | 3,139 | ||||
Noncurrent deferred income tax (liabilities) assets: | ||||||||
Depreciation and amortization | $ | (51,377 | ) | $ | (42,783 | ) | ||
Accrued employee benefits | 9,915 | 9,260 | ||||||
Other | 2,282 | 1,499 | ||||||
Net noncurrent deferred tax liabilities | $ | (39,180 | ) | $ | (32,024 | ) | ||
58
THE MARCUS CORPORATION
NOTES TO CONSOLIDATED FINANCIAL STATEMENTS (continued)
8. Income Taxes (continued)
Income tax expense for continuing operations consists of the following:
| Year ended | |||||||||||
|---|---|---|---|---|---|---|---|---|---|---|---|
| May 31, 2007 | May 25, 2006 | May 26, 2005 | |||||||||
| (in thousands) | |||||||||||
| Currently payable (refundable): | |||||||||||
| Federal | $ | 8,753 | $ | 7,871 | $ | 6,976 | |||||
| State | (1,244 | ) | 2,851 | 1,908 | |||||||
| Deferred: | |||||||||||
| Federal | 1,813 | (266 | ) | 2,507 | |||||||
| State | 254 | (37 | ) | 351 | |||||||
| $ | 9,576 | $ | 10,419 | $ | 11,742 | ||||||
Income tax expense is included in the accompanying consolidated statements of earnings as follows:
| Year ended | |||||||||||
|---|---|---|---|---|---|---|---|---|---|---|---|
| May 31, 2007 | May 25, 2006 | May 26, 2005 | |||||||||
| (in thousands) | |||||||||||
Continuing operations | $ | 9,576 | $ | 10,419 | $ | 11,742 | |||||
| Discontinued operations | (30 | ) | 2,925 | 51,714 | |||||||
| $ | 9,546 | $ | 13,344 | $ | 63,456 | ||||||
58
THE MARCUS CORPORATION
NOTES TO CONSOLIDATED FINANCIAL STATEMENTS
May 31, 2007
| Year ended | ||||||||||
| May 27, 2010 | May 28, 2009 | May 29, 2008 | ||||||||
| (in thousands) | ||||||||||
Current: | ||||||||||
Federal | $ | 86 | $ | 8,686 | $ | 10,298 | ||||
State | 1,373 | 2,767 | 2,471 | |||||||
Deferred: | ||||||||||
Federal | 6,982 | (635 | ) | 389 | ||||||
State | 657 | (652 | ) | 55 | ||||||
| $ | 9,098 | $ | 10,166 | $ | 13,213 | |||||
A reconciliation of the statutory federal tax rate to the effective tax rate for continuing operations follows:
| Year ended | |||||||||||
|---|---|---|---|---|---|---|---|---|---|---|---|
| May 31, 2007 | May 25, 2006 | May 26, 2005 | |||||||||
Statutory federal tax rate | 35.0 | % | 35.0 | % | 35.0 | % | |||||
| State income taxes, net of federal income tax benefit | 5.1 | 5.5 | 5.2 | ||||||||
| Federal tax exempt interest | (0.6 | ) | (5.9 | ) | (3.1 | ) | |||||
| Federal and state historic tax credits | (18.0 | ) | -- | -- | |||||||
| Other | 0.5 | (2.9 | ) | 0.4 | |||||||
| 22.0 | % | 31.7 | % | 37.5 | % | ||||||
| Year ended | |||||||||
| May 27, 2010 | May 28, 2009 | May 29, 2008 | |||||||
Statutory federal tax rate | 35.0 | % | 35.0 | % | 35.0 | % | |||
State income taxes, net of federal income tax benefit | 5.2 | 5.1 | 4.9 | ||||||
Unrecognized tax benefits and related interest | (4.2 | ) | (1.3 | ) | 0.2 | ||||
Other | 0.1 | (1.6 | ) | (0.9 | ) | ||||
| 36.1 | % | 37.2 | % | 39.2 | % | ||||
Income taxes paid, net of refunds received, in fiscal 2007,2010, 2009, and 2008 totaled $9,883,000, $6,293,000, and $10,674,000, respectively.
A reconciliation of the beginning and ending gross amounts of unrecognized tax benefit are as follows:
| Year Ended | |||||||||||
| May 27, 2010 | May 28, 2009 | May 29, 2008 | |||||||||
| (in thousands) | |||||||||||
Balance at beginning of year | $ | 4,118 | $ | 967 | $ | 930 | |||||
Increases due to: | |||||||||||
Tax positions taken in prior years | — | 3,778 | 37 | ||||||||
Tax positions taken in current year | — | — | — | ||||||||
Decreases due to: | |||||||||||
Tax positions taken in prior years | (1,437 | ) | — | — | |||||||
Settlements with taxing authorities | — | — | — | ||||||||
Lapse of applicable statute of limitations | (58 | ) | (627 | ) | — | ||||||
Balance at end of year | $ | 2,623 | $ | 4,118 | $ | 967 | |||||
The Company’s total unrecognized tax benefits that, if recognized, would affect the Company’s effective tax rate were $166,000, $1,511,000 and $889,000 as of May 27, 2010, May 28, 2009 and May 29, 2008,
59
THE MARCUS CORPORATION
NOTES TO CONSOLIDATED FINANCIAL STATEMENTS (continued)
8. Income Taxes (continued)
respectively. At May 27, 2010, the Company had accrued interest and penalties of $407,000 and $436,000, respectively, compared to accrued interest of $999,000 and no penalties at May 28, 2009. The Company classifies interest and penalties relating to income taxes as income tax expense. For the year ended May 27, 2010, $(344,000) of interest and $436,000 of penalties were recognized in the statement of earnings compared $712,000 of interest and no penalties for the year ended May 28, 2009 and $51,000 of interest and no penalties for the year ended May 29, 2008.
At May 27, 2010, examination of the Company’s consolidated federal income tax returns by the Internal Revenue Service (“IRS”) had concluded for the fiscal year 2006 and was substantially completed for the fiscal years 2007 and 2008. With certain exceptions, the Company’s state income tax returns are no longer subject to examination for the fiscal years 2005 totaled $4,796,000, $14,374,000 and $82,485,000, respectively.prior. At this time, the Company does not expect the results from any income tax audit to have a significant impact on the Company’s financial statements.
The Company does not expect its unrecognized tax benefits to significantly change over the next 12 months.
9. Commitments, License Rights and Contingencies
Lease Commitments – —The Company leases real estate under various noncancellable operating leases with an initial term greater than one year that contain multiple renewal options, exercisable at the Company’s option. The Company recognizes rent expense on a straight-line basis over the expected lease term, including cancelable option periods where failure to exercise such options would result in an economic penalty. Percentage rentals are based on the revenues at the specific rented property. Certain sublease agreements include buyout incentives. Rent expense charged to operations under these leases was as follows:
| Year ended | |||||||||||
|---|---|---|---|---|---|---|---|---|---|---|---|
| May 31, 2007 | May 25, 2006 | May 26, 2005 | |||||||||
| (in thousands) | |||||||||||
Fixed minimum rentals | $ | 2,957 | $ | 2,833 | $ | 1,866 | |||||
| Amortization of favorable lease right | 354 | 676 | -- | ||||||||
| Percentage rentals | 102 | 121 | 135 | ||||||||
| Sublease rental income | -- | -- | (12 | ) | |||||||
| $ | 3,413 | $ | 3,630 | $ | 1,989 | ||||||
59
THE MARCUS CORPORATION
NOTES TO CONSOLIDATED FINANCIAL STATEMENTS
May 31, 2007
| Year ended | |||||||||
| May 27, 2010 | May 28, 2009 | May 29, 2008 | |||||||
| (in thousands) | |||||||||
Fixed minimum rentals | $ | 7,488 | $ | 7,295 | $ | 4,738 | |||
Amortization of favorable lease right | 334 | 334 | 334 | ||||||
Percentage rentals | 73 | 115 | 73 | ||||||
| $ | 7,895 | $ | 7,744 | $ | 5,145 | ||||
Aggregate minimum rental commitments under long-term operating leases, assuming the exercise of certain lease options, are as follows at May 31, 2007:27, 2010:
| Fiscal Year | (in thousands) | ||||
2008 | $ | 3,521 | |||
| 2009 | 3,562 | ||||
| 2010 | 3,678 | ||||
| 2011 | 3,634 | ||||
| 2012 | 3,529 | ||||
| Thereafter | 72,884 | ||||
| $ | 90,808 | ||||
| Fiscal Year | (in thousands) | ||
2011 | $ | 7,073 | |
2012 | 7,018 | ||
2013 | 7,048 | ||
2014 | 6,735 | ||
2015 | 6,573 | ||
Thereafter | 108,457 | ||
| $ | 142,904 | ||
60
THE MARCUS CORPORATION
NOTES TO CONSOLIDATED FINANCIAL STATEMENTS (continued)
9. Commitments, License Rights and Contingencies (continued)
Commitments – —The Company has commitments for the completion of construction at various properties and the purchase of various properties totaling approximately $7,075,000$3,395,000 at May 31, 2007.27, 2010.
License Rights – —The Company has license rights to operate three hotels using the Hilton trademark, one hotel using the Four Points by Sheraton trademark and one hotel using the InterContinental trademark. Under the terms of the licenses, the Company is obligated to pay fees based on defined gross sales.
Contingencies – —The Company guarantees the debt of a joint ventures and other entitiesventure totaling $4,835,000$1,443,000 at May 31, 2007.27, 2010. The debt of the joint venturesventure is collateralized by the real estate, buildingsbuilding and improvements and all equipment of each joint venture.equipment. The Company does not anticipate these guaranteesthis guarantee to be payable.payable within the next fiscal year.
The Company has approximately sixthree and one half yearshalf-years remaining on a ten and one half-year office lease. On July 7, 2005, the lease was amended in order to exit leased office space for the Company’s former limited-service lodging division. To induce the landlord to amend the lease, the Company guaranteed the lease obligations of the new tenant of the relinquished space throughout the remaining term of the lease. The maximum amount of future payments the Company could be required to pay if the new tenant defaults on its lease obligations was approximately $2,854,000$1,600,000 as of May 31, 2007.27, 2010.
Subsidiaries of the Company are defendants in legal proceedings related to the Platinum Hotel & Spa in Las Vegas, Nevada. The Company believes the lawsuits are without merit and plans to vigorously defend against them. Since these matters are in the preliminary stages, the Company is unable to estimate the associated expenses or possible losses as of May 27, 2010.
10. Joint Venture Transactions
At May 31, 200727, 2010 and May 25, 2006,28, 2009, the Company held investments with aggregate carrying values of $1,868,000$1,322,000 and $7,487,000,$1,391,000, respectively, in several hotel joint ventures. The investmentsventures, which are accounted for under the equity method. Included in the May 25, 2006 investments in joint ventures total was a 50% ownership interest in Platinum Condominium Development, LLC, a joint venture that developed a condominium hotel in Las Vegas, Nevada, with a carrying value of $7,324,000.
60
THE MARCUS CORPORATION
NOTES TO CONSOLIDATED FINANCIAL STATEMENTS
May 31, 2007
During fiscal 2007, the Company acquired the ownership interests of its joint venture partners in Platinum Condominium Development, LLC, thus increasing the Company’s ownership of the property’s public space to 100%. The total purchase price was $11,000,000, including approximately $6,249,000 in prepaid development fees. As a result of these transactions, effective October 31, 2006, the assets and liabilities of the Platinum Hotel, as well as the results of its operations, are now reported in the Company’s consolidated results. Prior to October 31, 2006, the joint venture was accounted for using the equity method of accounting.
As a result of the purchase, the assets and liabilities, consisting primarily of condominium units held for sale, prepaid development fees, land, building and fixtures and other accrued liabilities are now reflected in the consolidated balance sheet. The consolidated financial statements reflect the preliminary allocation of the purchase price to the assets acquired and liabilities assumed, based on their respective fair value, which approximates the purchase price. Pro forma information is not required as the impact to the results of operations is not significant.
The costs of the condominium hotel development project attributable to the condominium units to be sold have been classified as assets held for sale in the consolidated balance sheet as of May 31, 2007.
The Company has receivables from discontinuedhotel joint ventures of $3,732,000 and $3,385,000$1,394,000 at May 31, 200727, 2010 and May 25, 2006,28, 2009, respectively. The Company earns interest on $3,732,000 and $3,298,000As of the net receivables at approximately prime to prime plus 1.5% at May 31, 200727, 2010 and May 25, 2006,28, 2009, the Company had an allowance against these receivables of $1,394,000 and $1,206,000, respectively.
Included in notes payable at May 31, 200727, 2010 and May 25, 200628, 2009 is $239,000$221,000 and $500,000,229,000, respectively, owed to discontinued joint ventures in connection with cash advanced to the Company. The Company pays interest on the cash advances based on the 90-day certificate of deposit rates.
61
THE MARCUS CORPORATION
NOTES TO CONSOLIDATED FINANCIAL STATEMENTS (continued)
11. Business Segment Information
The Company evaluates performance and allocates resources based on the operating income (loss) of each segment. The accounting policies of the reportable segments are the same as those described in the summary of significant accounting policies.
61
THE MARCUS CORPORATION
NOTES TO CONSOLIDATED FINANCIAL STATEMENTS
May 31, 2007
Following is a summary of business segment information for fiscal 20052008 through 2007:2010:
| Theatres | Hotels/ Resorts | Corporate Items | Continuing Operations Total | Discontinued Operations | Total | |||||||||||||||
|---|---|---|---|---|---|---|---|---|---|---|---|---|---|---|---|---|---|---|---|---|
| (in thousands) | ||||||||||||||||||||
Fiscal 2007 | ||||||||||||||||||||
| Revenues | $ | 156,451 | $ | 169,942 | $ | 1,238 | $ | 327,631 | $ | 4,060 | $ | 331,691 | ||||||||
| Operating income (loss) | 34,561 | 15,792 | (9,214 | ) | 41,139 | (224 | ) | 40,915 | ||||||||||||
| Depreciation and amortization | 11,826 | 14,336 | 751 | 26,913 | 12 | 26,925 | ||||||||||||||
| Equity losses from | ||||||||||||||||||||
| unconsolidated joint ventures | (149 | ) | (1,217 | ) | -- | (1,366 | ) | (367 | ) | (1,733 | ) | |||||||||
| Assets | 320,280 | 329,245 | 47,883 | 697,408 | 975 | 698,383 | ||||||||||||||
| Capital expenditures and | ||||||||||||||||||||
| acquisitions | 115,403 | 70,606 | 743 | 186,752 | -- | 186,752 | ||||||||||||||
Fiscal 2006 | ||||||||||||||||||||
| Revenues | $ | 145,990 | $ | 141,917 | $ | 1,337 | $ | 289,244 | $ | 5,358 | $ | 294,602 | ||||||||
| Operating income (loss) | 32,481 | 15,613 | (8,554 | ) | 39,540 | (2,859 | ) | 36,681 | ||||||||||||
| Depreciation and amortization | 12,372 | 12,632 | 1,127 | 26,131 | 143 | 26,274 | ||||||||||||||
| Equity losses from | ||||||||||||||||||||
| unconsolidated joint ventures | (985 | ) | (850 | ) | (33 | ) | (1,868 | ) | (106 | ) | (1,974 | ) | ||||||||
| Assets | 220,595 | 285,132 | 73,962 | 579,689 | 7,545 | 587,234 | ||||||||||||||
| Capital expenditures and | ||||||||||||||||||||
| acquisitions | 8,394 | 65,816 | 1,187 | 75,397 | 135 | 75,532 | ||||||||||||||
Fiscal 2005 | ||||||||||||||||||||
| Revenues | $ | 149,125 | $ | 116,532 | $ | 1,401 | $ | 267,058 | $ | 52,538 | $ | 319,596 | ||||||||
| Operating income (loss) | 34,791 | 12,658 | (8,547 | ) | 38,902 | 2,966 | 41,868 | |||||||||||||
| Depreciation and amortization | 12,148 | 10,955 | 1,400 | 24,503 | 3,899 | 28,402 | ||||||||||||||
| Equity earnings (losses) from | ||||||||||||||||||||
| unconsolidated joint ventures | (264 | ) | (863 | ) | 37 | (1,090 | ) | (477 | ) | (1,567 | ) | |||||||||
| Assets | 226,127 | 243,896 | 294,616 | 764,639 | 22,860 | 787,499 | ||||||||||||||
| Capital expenditures and | ||||||||||||||||||||
| acquisitions | 35,858 | 21,520 | 1,504 | 58,882 | 4,549 | 63,431 | ||||||||||||||
| Theatres | Hotels/ Resorts | Corporate Items | Total | ||||||||||
| (in thousands) | |||||||||||||
Fiscal 2010 | |||||||||||||
Revenues | $ | 224,102 | $ | 153,935 | $ | 1,032 | $ | 379,069 | |||||
Operating income (loss) | 44,741 | 1,438 | (9,976 | ) | 36,203 | ||||||||
Depreciation and amortization | 16,701 | 15,042 | 569 | 32,312 | |||||||||
Assets | 352,138 | 306,510 | 45,763 | 704,411 | |||||||||
Capital expenditures and acquisitions | 9,431 | 15,622 | 29 | 25,082 | |||||||||
Fiscal 2009 | |||||||||||||
Revenues | $ | 215,258 | $ | 167,055 | $ | 1,183 | $ | 383,496 | |||||
Operating income (loss) | 43,671 | 9,700 | (9,972 | ) | 43,399 | ||||||||
Depreciation and amortization | 16,431 | 15,148 | 649 | 32,228 | |||||||||
Assets | 359,232 | 306,467 | 45,824 | 711,523 | |||||||||
Capital expenditures and acquisitions | 20,924 | 14,680 | 137 | 35,741 | |||||||||
Fiscal 2008 | |||||||||||||
Revenues | $ | 181,058 | $ | 188,520 | $ | 1,497 | $ | 371,075 | |||||
Operating income (loss) | 35,334 | 21,556 | (9,192 | ) | 47,698 | ||||||||
Depreciation and amortization | 15,128 | 15,450 | 681 | 31,259 | |||||||||
Assets | 355,247 | 318,368 | 48,033 | 721,648 | |||||||||
Capital expenditures and acquisitions | 49,049 | 15,806 | 82 | 64,937 | |||||||||
Corporate items include amounts not allocable to the business segments. Corporate revenues consist principally of rent and the corporate operating loss includes general corporate expenses. Corporate information technology costs and accounting shared services costs are allocated to the business segments based upon several factors, including actual usage and segment revenues. Corporate assets primarily include cash and cash equivalents, investments, notes receivable, receivables from joint ventures and land held for development.
62
THE MARCUS CORPORATION
NOTES TO CONSOLIDATED FINANCIAL STATEMENTS (continued)
May 31, 2007
12. Unaudited Quarterly Financial Information(in thousands, except per share data)
| 13 Weeks Ended | 14 Weeks Ended | |||||||||||||
|---|---|---|---|---|---|---|---|---|---|---|---|---|---|---|
| Fiscal 2007 | August 24, 2006 | November 23, 2006 | February 22, 2007 | May 31, 2007 | ||||||||||
Revenues | $ | 93,407 | $ | 70,605 | $ | 71,418 | $ | 92,201 | ||||||
| Operating income | 21,182 | 8,467 | 1,853 | 9,637 | ||||||||||
| Net earnings | 13,707 | 10,091 | 4,028 | 5,471 | ||||||||||
| Net earnings per common share - diluted(1) | $ | 0.45 | $ | 0.33 | $ | 0.13 | $ | 0.18 | ||||||
| 13 Weeks Ended | ||||||||||||||
|---|---|---|---|---|---|---|---|---|---|---|---|---|---|---|
| Fiscal 2006 | August 25, 2005 | November 24, 2005 | February 23, 2006 | May 25, 2006 | ||||||||||
Revenues | $ | 86,245 | $ | 67,025 | $ | 68,751 | $ | 67,223 | ||||||
| Operating income | 18,487 | 8,299 | 5,637 | 7,117 | ||||||||||
| Net earnings | 15,489 | 5,044 | 4,723 | 3,015 | ||||||||||
| Net earnings per common share - diluted(1) | $ | 0.50 | $ | 0.16 | $ | 0.15 | $ | 0.10 | ||||||
(1) Calculated on our Common Stock using the two-class method.
13 Weeks Ended | |||||||||||||
| Fiscal 2010 | August 27, 2009 | November 26, 2009 | February 25, 2010 | May 27, 2010 | |||||||||
Revenues | $ | 110,153 | $ | 83,366 | $ | 96,444 | $ | 89,106 | |||||
Operating income | 18,975 | 1,967 | 8,044 | 7,217 | |||||||||
Net earnings (loss) | 10,218 | (323 | ) | 3,191 | 3,029 | ||||||||
Net earnings (loss) per common share—diluted | $ | 0.34 | $ | (0.01 | ) | $ | 0.11 | $ | 0.10 | ||||
13 Weeks Ended | ||||||||||||
| Fiscal 2009 | August 28, 2008 | November 27, 2008 | February 26, 2009 | May 28, 2009 | ||||||||
Revenues | $ | 120,371 | $ | 87,943 | $ | 91,011 | $ | 84,171 | ||||
Operating income | 23,947 | 8,342 | 6,178 | 4,932 | ||||||||
Net earnings | 12,433 | 896 | 1,663 | 2,208 | ||||||||
Net earnings per common share—diluted | $ | 0.42 | $ | 0.03 | $ | 0.06 | $ | 0.07 | ||||
63
Item 9. Changes in and Disagreements With Accountants on Accounting and Financial Disclosure.
None.
Item 9A. Controls and Procedures.
(a) Evaluation of disclosure controls and procedures.
Based on their evaluations, as of the end of the period covered by this Annual Report on Form 10-K, our principal executive officer and principal financial officer have concluded that our disclosure controls and procedures (as defined in Rules 13a-15(e) and 15d-15(e) under the Securities Exchange Act of 1934 (the “Exchange Act”)) are effective to ensure that information required to be disclosed by us in reports that we file or furnish under the Exchange Act is accumulated and communicated to our management and recorded, processed, summarized and reported within the time periods specified in Securities and Exchange Commission rules and forms.
(b) Management’s report on internal control over financial reporting.
The report of management required under this Item 9A is contained in the section titled “Item 8 – 8—Financial Statements and Supplementary Data” under the heading “Management’s Report on Internal Control over Financial Reporting.”
(c) Attestation Report of Independent Registered Public Accounting Firm.
The attestation report required under this Item 9A is contained in the section titled “Item 8 – 8—Financial Statements and Supplementary Data” under the heading “Report of Independent Registered Public Accounting Firm on Internal Control over Financial Reporting.”
(d) Changes in internal control over financial reporting.
There were no changes in our internal control over financial reporting identified in connection with the evaluation required by Rule 13a-15(b) of the Exchange Act during the fourth quarter of our fiscal 20072010 that has materially affected, or is reasonably likely to materially affect, our internal control over financial reporting.
PART III
Item 10. Directors, Executive Officers and Corporate Governance.
The information required by this item with respect to directors is incorporated herein by reference to the information pertaining thereto set forth under the caption entitled “Election of Directors” in the definitive Proxy Statement for our 20072010 Annual Meeting of Shareholders scheduled to be held on October 16, 200713, 2010 (our “Proxy Statement”). The information required with respect to executive officers appears at the end of Part I of this Form 10-K. The required information with respect to compliance with Section 16(a) of the Securities Exchange Act of 1934 by directors and executive officers is incorporated by reference to the information pertaining thereto set forth under the caption entitled “Section 16(a) Beneficial Ownership Reporting Compliance” in our Proxy Statement.
We have adopted a written code of conduct that applies to all of our directors, officers and employees, which is available on our corporate web site (www.marcuscorp.com). No amendments to our code of conduct, or waivers from our code of conduct with respect to any of our executive officers or directors have been made. If, in the future, we amend our code of conduct, or grant waivers from our code of conduct with respect to any of our executive officers or directors, we will make information regarding such amendments or waivers available on our corporate web site (www.marcuscorp.com) for a period of at least 12 months.
64
Item 11. Executive Compensation.
The information required by this item is incorporated herein by reference to the information pertaining thereto set forth under the caption entitled “Compensation Discussion and Analysis” in our Proxy Statement.
64Item 12. Security Ownership of Certain Beneficial Owners and Management and Related Shareholder Matters.
The following table lists certain information about our three stock option plans, our 1995 Equity Incentive Plan, our 1994 Nonemployee Director Stock Option Plan and our 2004 Equity Incentive Plan, all of which were approved by our shareholders:
| Number of securities to be issued upon the exercise of outstanding options | Weighted-average exercise price of outstanding options | Number of securities remaining available for future issuance under current equity compensation plan (excluding securities reflected in the first column) |
|---|---|---|
1,137,000 | $12.69 | 1,444,000 |
Number of securities to be issued upon the exercise of outstanding options | Weighted-average exercise price of outstanding options | Number of securities remaining available | ||
1,730,000 | $14.33 | 714,000 |
The other information required by this item is incorporated herein by reference to the information pertaining thereto set forth under the caption entitled “Stock Ownership of Management and Others” in our Proxy Statement.
Item 13. Certain Relationships and Related Transactions, and Director Independence.
The information required by this item, to the extent applicable, is incorporated herein by reference to the information pertaining thereto set forth under the caption entitled “Certain“Policies and Procedures Governing Related Person Transactions” in our Proxy Statement.
Item 14. Principal Accounting Fees and Services.
The information required by this item is incorporated by reference herein to the information pertaining thereto set forth under the caption “Other Matters” in our Proxy Statement.
PART IV
Item 15. Exhibits and Financial Statement Schedules.
(a)(1) Financial Statements.
The information required by this item is set forth in “Item 8 – Financial Statements and Supplementary Data” above.
(a)(2) Financial Statement Schedules.
All schedules are omitted because they are inapplicable, not required under the instructions or the financial information is included in the consolidated financial statements or notes thereto.
(a)(3) Exhibits.
The exhibits filed herewith or incorporated by reference herein are set forth on the attached Exhibit Index.*
| * | Exhibits to this Form 10-K will be furnished to shareholders upon advance payment of a fee of $0.25 per page, plus mailing expenses. Requests for copies should be addressed to Thomas F. Kissinger, Vice President, General Counsel and Secretary, The Marcus Corporation, 100 East Wisconsin Avenue, Suite 1900, Milwaukee, Wisconsin 53202-4125. |
65
*Exhibits to this Form 10-K will be furnished to shareholders upon advance payment of a fee of $0.25 per page, plus mailing expenses. Requests for copies should be addressed to Thomas F. Kissinger, Vice President, General Counsel and Secretary, The Marcus Corporation, 100 East Wisconsin Avenue, Suite 1900, Milwaukee, Wisconsin 53202-4125.SIGNATURES
65
Pursuant to the requirements of Section 13 of the Securities Exchange Act of 1934, the registrant has duly caused this report to be signed on its behalf by the undersigned, thereunto duly authorized.
| | THE MARCUS CORPORATION | |||||||
Date: August 10, 2010 | By: | /s/ Gregory S. Marcus | ||||||
| | ||||||||
Gregory S. Marcus, President and Chief Executive Officer | ||||||||
Pursuant to the requirements of the Securities Exchange Act of 1934, this report has been signed below by the following persons on behalf of us and in the capacities as of the date indicated above.
By: | /s/ | By: | /s/ Daniel F. McKeithan, Jr. | |||||
| Gregory S. Marcus, | Daniel F. McKeithan, Jr., Director | |||||||
By: | ||||||||
/s/ Douglas A. Neis | By: | /s/ Diane Marcus Gershowitz | ||||||
Douglas A. Neis, Chief Financial Officer and Treasurer (Principal Financial Officer and Accounting Officer) | Diane Marcus Gershowitz, Director | |||||||
By: | /s/ Stephen H. Marcus | By: | /s/ Timothy E. Hoeksema | |||||
Stephen H. Marcus, Chairman and | Timothy E. Hoeksema, Director | |||||||
By: | /s/ Philip L. Milstein | By: | /s/ Allan H. Selig | |||||
Philip L. Milstein, Director | Allan H. Selig, Director | |||||||
By: | /s/ Bronson J. Haase | By: | /s/ James D. Ericson | |||||
Bronson J. Haase, Director | James D. Ericson, Director | |||||||
By: | /s/ Bruce J. Olson | |||||||
Bruce J. Olson, Director | ||||||||
The most recent certifications by our Chief Executive Officer and Chief Financial Officer pursuant to Section 302 of the Sarbanes-Oxley Act of 2002 are filed as exhibits to the Form 10-K. We have also filed with the New York Stock Exchange the most recent Annual CEO Certification as required by Section 303A.12(a) of the New York Stock Exchange Listed Company Manual.
S-1
EXHIBIT INDEX
| 3.1 | Restated Articles of Incorporation. [Incorporated by reference to Exhibit 3.2 to our Quarterly Report on Form 10-Q for the quarterly period ended November 13, 1997.] | |
| 3.2 | Bylaws, as | |
| 4.1 | The Marcus Corporation Note Purchase Agreement dated October 25, 1996. [Incorporated by reference to Exhibit 4.1 to our Quarterly Report on Form 10-Q for the quarterly period ended November 14, 1996.] | |
| 4.2 | First Supplement to Note Purchase Agreements dated May 15, 1998. [Incorporated by reference to Exhibit 4.3 to our Annual Report on Form 10-K for the fiscal year ended May 28, 1998.] | |
| 4.3 | Second Supplement to Note Purchase Agreements dated May 7, 1999. [Incorporated by reference to Exhibit 4.4 to our Annual Report on Form 10-K for the fiscal year ended May 27, 1999.] | |
| 4.4 | Third Supplement to Note Purchase Agreements dated April 1, 2002. [Incorporated by reference to Exhibit 4.6 to our Quarterly Report on Form 10-Q for the quarterly period ended February 28, 2002.] | |
| 4.5 | ||
| 4.6 | Amended and Restated Credit Agreement dated April | |
| Other than as set forth in Exhibits 4.1, 4.2, 4.3, 4.4, 4.5 and | ||
| 10.1* | The Marcus Corporation 1995 Equity Incentive Plan, as amended. [Incorporated by reference to Exhibit 10.3 to our Current Report on Form 8-K dated October 5, 2006.] | |
| 10.2* | The Marcus Corporation 1994 Nonemployee Director Stock Option Plan, as amended. [Incorporated by reference to Exhibit 10.2 to our Current Report on Form 8-K dated October 5, 2006.] | |
| 10.3 | ||
| 10.4* | The Marcus Corporation 2004 Equity Incentive Plan, as amended. [Incorporated by reference to Exhibit | |
| 10.5* | Form of The Marcus Corporation 2004 Equity Incentive Plan Stock Option Award (Employees). [Incorporated by reference to Exhibit | |
E-1
| 10.6* | Form of The Marcus Corporation 2004 Equity Incentive Plan Stock Option Award (Non-Employee Directors). [Incorporated by reference to Exhibit | |
| 10.7* | Form of The Marcus Corporation Equity Incentive Plan Restricted Stock Agreement. [Incorporated by reference to Exhibit 10.6 to our Annual Report on Form 10-K for the fiscal year ended May 26, 2005.] | |
| 10.8* | The Marcus Corporation Variable Incentive Plan Terms, as amended. [Incorporated by reference to Exhibit 10.1 to our Current Report on Form 8-K dated July | |
| 10.9* | The Marcus Corporation Deferred Compensation Plan. [Incorporated by reference to Exhibit 10.8 to our Annual Report on Form 10-K for the fiscal year ended May 25, 2006.] | |
E-1
| 10.10* | The Marcus Corporation Retirement Income | |
| 10.11* | The Marcus Corporation Long-Term Incentive Plan Terms. [Incorporated by reference to Exhibit 10.10 to our Annual Report on Form 10-K for the fiscal year ended May | |
| 21 | Our subsidiaries as of May | |
| 23.1 | ||
| 23.2 | Consent of Ernst & Young LLP. | |
| 31.1 | Certification by the Chief Executive Officer pursuant to Section 302 of the Sarbanes-Oxley Act of 2002. | |
| 31.2 | Certification by the Chief Financial Officer pursuant to Section 302 of the Sarbanes-Oxley Act of 2002. | |
| 32 | Certification of Chief Executive Officer and Chief Financial Officer pursuant to 18 | |
| 99.1 | Administrative Services Agreement between Marcus Investments, LLC and The Marcus Corporation, as | |
| 99.2 | Proxy Statement for the | |
*This exhibit is a management contract or compensatory plan or arrangement required to be filed as an exhibit to this form pursuant to Item 14(c) of Form 10-K.
| * | This exhibit is a management contract or compensatory plan, contract or arrangement in which a director or named executive officer of the Company participated. |
E-2