Item 1.Business
Item 1. Business
1
Through its division known as The Governance Institute (“TGI”), NRC also offers subscription-based governance information and educational conferences designed to improve the effectiveness of hospital and health care systems by continually strengthening their healthcare boards, medical leadership, and management performance in the United States. TGI conducts timely conferences, produces publications, videos, white papers, and research studies, and tracks industry trends showcasing the best practices of healthcare boards across the country.
On May 30, 2006, the Company acquired substantially all of the assets of TGI Group, LLC, operating as TGI. TGI provides board members, executive management and physician leaders of hospitals and health systems with knowledge and solutions to successfully confront a wide array of strategic issues. The purchase price for TGI was $19.8 million in cash, plus the assumption of certain liabilities.
Information Services
The Qualisys System (“Qualisys”) is
The Company has developed NRC Picker subscription-based educational services asonline improvement tools, including a way of bridgingone-page report which provides a basis on which improvements can be made, shows healthcare organizations which service factors impact their customer group’s value and which have the gap between measurementgreatest impact on satisfaction levels, and improvement of patient-centered care. These products consist of the Symposium and the Patient-Centered Care Institute. The Symposium is an annual event which is dedicatedhow their performance in relationship to the improvement of the patient experience. Patient-Centered Care Institute is a membership-based product that enables members to participate in calls with industry experts, have access to experts, participate in monthly presentations and receive monthly journals or white papers, all of which focus on topics of improvement of the patient experience.
3
Market Guidethese key indicators changes over time.
Numerous marketing
4
5
| Name | Age | Position | ||
| Michael D. Hays | 55 | President, Chief Executive Officer and Director | ||
Patrick E. Beans | 52 | Vice President, Treasurer, Chief Financial Officer, | ||
| Secretary and Director |
Jona S. Raasch has served as President of The Governance Institute, a division of National Research Corporation, since May 2006. Prior to May 2006, Ms. Raasch held various positions with the Company since September 1988, most recently as Vice President and Chief Operations Officer from September 1997 to May 2006. Prior to joining the Company, Ms. Raasch held various positions with A.C. Nielsen Corporation.
Patrick E. Beans has served as Vice President, Treasurer, Chief Financial Officer, and Secretary and a director since 1997. He has served as the principal financial officer since he joined the Company in August 1994. From June 1993 until joining the Company, Mr. Beans was the finance director for the Central Interstate Low-Level Radioactive Waste Commission, a five-state compact developing a low-level radioactive waste disposal plan. From 1979 to 1988 and from June 1992 to June 1993, he practiced as a certified public accountant.
Item 1A.Risk Factors
| Item 1A. | Risk Factors |
6
We rely on a limited number of key clients, and a loss of one or more of these key clients will adversely affect our operating results.
We rely on a limited number of key clients for a substantial portion of our revenues. The Company’s ten largest clients accounted for 29%, 32%, and 40% of the Company’s total revenues in 2007, 2006 and 2005, respectively. The U.S. Department of Veterans Affairs accounted for 8%, 8% and 11% of total revenues in 2007, 2006 and 2005, respectively.
We cannot assure you that we will maintain our existing client base, maintain or increase the level of revenue or profits generated by our existing clients, or be able to attract new clients. Furthermore, the healthcare industry continues to undergo consolidation and we cannot assure you that such consolidation will not cause us to lose clients. The loss of one or more of our large clients or a significant reduction in business from such clients, regardless of the reason, will have a negative effect on our revenues and a corresponding effect on our operating and net income. See “Risk Factors — Because our clients are concentrated in the healthcare industry, we may be adversely affected by a business downturn or consolidation with respect to the healthcare industry.”
7
8
9
10
In addition, severalrevenue.
Item 1B.Unresolved Staff Comments
| Item 1B. | Unresolved Staff Comments |
Item 2.Properties
| Item 2. | Properties |
Item 3.Legal Proceedings
| Item 3. | Legal Proceedings |
Item 4.Submission of Matters to a Vote of Security Holders
No matters were submitted to a vote of the Company’s shareholders during the fourth quarter of the Company’s 2007 fiscal year.
11
PART IIItem 5.Market for the Registrant’s Common Equity, Related Stockholder Matters and Issuer Purchases of Equity Securities
The Company’s Common Stock, $.001 par value (“Common Stock”), is traded on the NASDAQ Global Market under the symbol “NRCI.” The following table sets forth the range of high and low sales prices for, and dividends declared on, the Common Stock for the period from January 1, 2006,2008, through December 31, 2007:High Low Dividends
Declared Per
Common Share
2006 Quarter Ended: March 31 $24.79 $17.00 $.10 June 30 $24.49 $21.30 $.10 September 30 $26.91 $21.47 $.10 December 31 $26.39 $21.85 $.10
2007 Quarter Ended: March 31 $24.24 $20.49 $.12 June 30 $27.00 $21.24 $.12 September 30 $26.50 $24.47 $.12 December 31 $28.00 $25.00 $.12
2009:
High Low DividendsDeclared PerCommon Share 2008 Quarter Ended: March 31 $ 27.94 $ 24.75 $ .14 June 30 $ 32.06 $ 25.14 $ .14 September 30 $ 35.58 $ 23.01 $ .14 December 31 $ 34.93 $ 19.00 $ .14 2009 Quarter Ended: March 31 $ 29.01 $ 19.48 $ .16 June 30 $ 28.10 $ 23.10 $ .16 September 30 $ 26.74 $ 23.55 $ .16 December 31 $ 25.30 $ 20.32 $ .16
On March 10, 2008,30, 2010, there were approximately 2319 shareholders of record, and approximately 550beneficial500 beneficial owners of the Common Stock.In March 2005, the Company announced the commencement of a quarterly cash dividend. Cash dividends of $3.3$4.3 million and $2.8$3.8 million in the aggregate were declared and paid during the twelve-month periods ended December 31, 20072009 and 20062008, respectively. The payment and amount of future dividends is at the discretion of the Company’s Board of Directors and will depend on the Company’s future earnings, financial condition, general business conditions and other factors.The table below summarizes the Company’s repurchases of its common stock during the three-month period ended December 31, 2007.Period Total
Number of
Shares
Purchased Average
Price Paid
Per Share Total Number
of Shares
Purchased as Part
of Publicly
Announced Plans
or Programs(1) Maximum Number of
Shares that May Yet Be
Purchased Under the Plans
or Programs
October 1 - October 31, 20070 $ 0 0 690,386
November 1 - November 30, 2007735 $27.12 735 689,651
December 1 - December 31, 20071,500 $27.05 1,500 688,151
Period Total Numberof SharesPurchased AveragePrice PaidPer Share Total Numberof SharesPurchased as Partof PubliclyAnnounced Plansor Programs(1) Maximum Number ofShares That May Yet BePurchased Under the Plans or Programs October 1 - October 31, 2009 — — — 289,275 November 1 - November 30, 2009 — — — 289,275 December 1 - December 31, 2009 210 $ 21.69 210 289,065
(1) In February 2006, the Company’s Board of Directors authorized a stock repurchase plan providing for the repurchase of an additional 750,000 shares. The plan has no expiration date.
12
Subsequent to December 31, 2007,
The following graph compares the Company has repurchased 263,013 shares ofcumulative 5-year total return provided shareholders on National Research Corporation's common stock at an approximate cost of $6.6 million and an average per share price of $24.91.12
The graph below compares the Company’s cumulative five-year total shareholder return on common stock withrelative to the cumulative total returns of the NASDAQ Composite Index and the Russell 2000 Index. The graph tracks the performanceAn investment of a $100 investment(with reinvestment of all dividends) is assumed to have been made in the Company’sour common stock and in each of the indexes (with the reinvestment of all dividends) fromon December 31, 2002, to2004, and its relative performance is tracked through December 31, 2007.
2009.
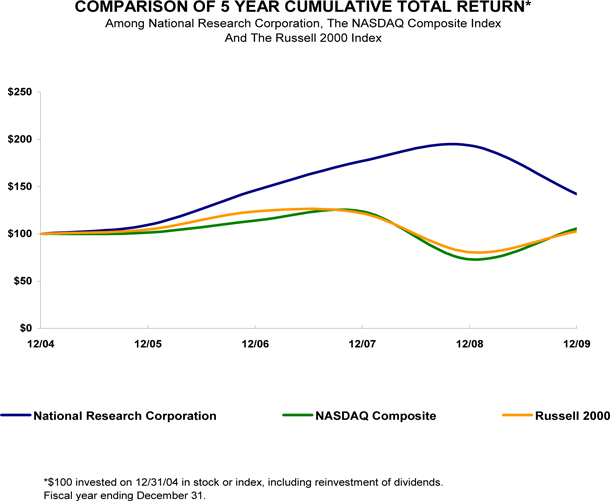
COMPARISON OF FIVE-YEAR CUMULATIVE TOTAL RETURN DATA
12/04 12/05 12/06 12/07 12/08 12/09 National Research Corporation 100.00 109.35 146.03 177.05 193.68 142.27 NASDAQ Composite 100.00 101.33 114.01 123.71 73.11 105.61 Russell 2000 100.00 104.55 123.76 121.82 80.66 102.58
The stock price performance included in this graph is not necessarily indicative of future stock price performance.performance.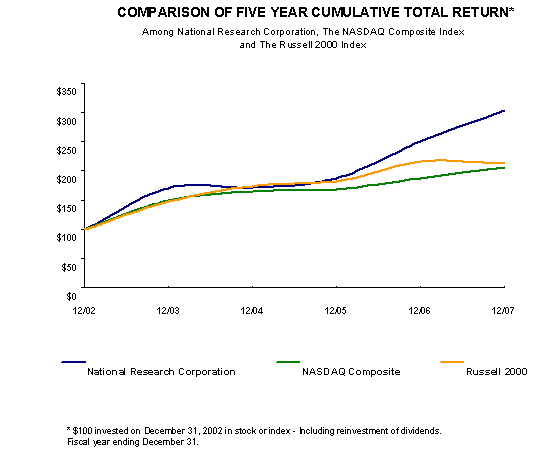
COMPARISON OF FIVE YEAR CUMULATIVE TOTAL RETURN DATA
12/02
12/03
12/04
12/05
12/06
12/07
National Research Corporation$100.00 $170.87 $171.30 $187.31 $250.14 $303.28
NASDAQ Composite$100.00 $149.75 $164.64 $168.60 $187.83 $205.22
Russell 2000$100.00 $147.25 $174.24 $182.18 $215.64 $212.26
13
Item 6.Selected Financial Data
Item 6. Selected Financial Data
The selected statement of income data for the years ended December 31, 2007, 20062009, 2008, and 2005,2007, and the selected balance sheet data at December 31, 20072009 and 2006,2008, are derived from, and are qualified by reference to, the audited consolidated financial statements of the Company included elsewhere in this Annual Report on Form 10-K. The selected statement of income data for the years ended December 31, 20042006 and 2003,2005, and the balance sheet data at December 31, 2005, 20042007, 2006, and 2003,2005, are derived from audited consolidated financial statements not included herein. The Company has made acquisitions and adopted SFAS No. 123RShared-Based Paymentbegan recognizing share-based compensation expense during the five years covered by the selected statement financial data. See Note 2 and Note 87 to the Company’sCompany's consolidated financial statements.Year Ended December 31,
2007
2006
2005
2004
2003
(In thousands, except per share data)
Statement of Income Data: Revenue $ 48,923 $ 43,771 $ 32,437 $ 29,683 $ 26,922 Operating expenses: Direct expenses 21,801 19,445 13,642 12,869 12,029 Selling, general and administrative 13,173 12,158 8,617 7,394 5,987 Depreciation and amortization 2,583 2,260 1,762 2,018 1,941
Total operating expenses 37,557 33,863 24,021 22,281 19,957 Operating income 11,366 9,908 8,416 7,402 6,965 Other income (expenses) (248 ) (402 ) 99 (119 ) (49 )
Income before income taxes 11,118 9,506 8,515 7,283 6,916 Provision for income taxes 4,278 3,622 3,279 2,732 2,532
Net income $ 6,840 $ 5,884 $ 5,236 $ 4,551 $ 4,384
Net income per share - basic $ 1.00 $ 0.86 $ 0.74 $ 0.63 $ 0.60
Net income per share - diluted $ 0.98 $ 0.85 $ 0.74 $ 0.63 $ 0.60
Dividends per share $ 0.48 $ 0.40 $ 0.32 $ -- $ --
Weighted average shares outstanding - basic 6,850 6,836 7,038 7,181 7,259 Weighted average shares outstanding - diluted 7,011 6,954 7,118 7,249 7,326
Year Ended December 31, 2009 2008 2007 2006 2005 (In thousands, except per share data) Statement of Income Data: Revenue $ 57,692 $ 51,013 $ 48,923 $ 43,771 $ 32,437 Operating expenses: Direct expenses 24,574 23,611 21,801 19,445 13,642 Selling, general and administrative 15,590 12,728 13,173 12,158 8,617 Depreciation and amortization 3,831 2,685 2,583 2,260 1,762 Total operating expenses 43,995 39,024 37,557 33,863 24,021 Operating income 13,697 11,989 11,366 9,908 8,416 Other income (expenses) (580 ) (6 ) (248 ) (402 ) 99 Income before income taxes 13,117 11,983 11,118 9,506 8,515 Provision for income taxes 4,626 4,538 4,278 3,622 3,279 Net income $ 8,491 $ 7,445 $ 6,840 $ 5,884 $ 5,236 Net income per share - basic $ 1.28 $ 1.11 $ 1.00 $ 0.86 $ 0.74 Net income per share - diluted $ 1.26 $ 1.09 $ 0.98 $ 0.85 $ 0.74 Dividends per share $ 0.64 $ 0.56 $ 0.48 $ 0.40 $ 0.32 Weighted average shares outstanding – basic 6,637 6,685 6,850 6,836 7,038 Weighted average shares outstanding – diluted 6,723 6,831 7,011 6,954 7,118 December 31, 2009 2008 2007 2006 2005 (In thousands) Balance Sheet Data: Working capital (deficit) $ (4,432 ) $ (10,650 ) $ (2,384 ) $ (1,482 ) $ 8,058 Total assets 72,499 72,145 61,869 61,532 44,675 Total debt, including current portion 7,719 12,954 2,993 11,093 1,471 Total shareholders’ equity $ 44,171 $ 38,598 $ 42,286 $ 36,751 $ 32,593
14
December 31,
2007
2006
2005
2004
2003
(In thousands)
Balance Sheet Data: Working capital $ (2,384 ) $ (1,482 ) $ 8,058 $ 19,434 $ 16,817 Total assets 61,869 61,532 44,675 47,954 �� 45,673 Total debt, including current portion 2,993 11,093 1,471 4,901 5,044 Total shareholders’ equity 42,286 36,751 32,593 35,018 32,424
14
Item 7.Management’s Discussion and Analysis of Financial Condition and Results of Operations
Item 7. Management’s Discussion and Analysis of Financial Condition and Results of Operations
OverviewThe Company believes it is a leading provider of ongoing survey-based performance measurement, analysis, tracking, improvement services and governance education to the healthcare industry in the United States and Canada. Since 1981, the Company has provided these services using traditional market research methodologies such as direct mail, telephone-basedtelephone, internet-based surveys, focus groups and in-person interviews. Since 2002, the current primary data collection methodology used is direct mail, but the Company still uses other methodologies for certain types of studies. The Company addresses the growing need of healthcare providers and payers to measure the care outcomes, specifically experience and health status of their patients and/or members, and provides information on governance issues. NRC develops tools that enable healthcare organizations to obtain performance measurement information necessary to comply with industry and regulatory standards, and to improve their business practices so that they can maximize new memberresident and/or patient attraction, experience, member retention and profitability. The Company believes that a driver of its growth and the growth of its industry will be the increase in demand for performance measurement, improvement and educational services as a result of more public reporting programs. The Company’s primary types of information services are performance tracking services, custom research, subscription-based educational and improvement services, and its Market Guide.Ticker.
AcquisitionsOn September 16, 2005,December 19, 2008, the Company acquired substantially all of the assets of Geriatric Health Systems, LLCMy InnerView, Inc. (“GHS”MIV”), a healthcare survey researchleading provider of quality and analytics firm based in California that specializes in measuring health status, health riskperformance improvement solutions to the senior care profession. MIV offers resident, family and memberemployee satisfaction for health plansmeasurement and improvement products to the long-term care, assisted and independent living markets in the United States. MIV works with over 8,000 senior care providers throughout the United States housing what the Company believes is the largest dataset of senior care satisfaction metrics in the nation. The purchase priceconsideration paid at closing for the acquisition was $4.0 millionMIV included payment of $11,500,000 in cash plus the assumptionand $440,000 of certain liabilities.On May 30, 2006,direct expenses capitalized as purchase price. The merger agreement under which the Company acquired substantially allMIV provided for contingent earn-out payments of which $581,000 of the assets2009 earn-out was included in this amount.
On April 1, 2008, approximately 10 customer contracts were purchased from SQ Strategies for $249,000. The recording of TGI Group, LLC, operating as TGI. TGI provides board members, executive managementthis asset purchase increased customer related intangibles by $260,000 and physician leaders of hospitals and health systems with knowledge and solutions to successfully confront a wide array of strategic issues. The purchase price for TGI was $19.8 million in cash, plus the assumption of certain liabilities.deferred revenue by $11,000.
Critical Accounting Policies and EstimatesThe preparation of financial statements requires management to make estimates and assumptions that affect amounts reported therein. The most significant of these areas involving difficult or complex judgments made by management with respect to the preparation of the Company’s consolidated financial statements for fiscal year 20072009 include:· Revenue recognition;
· Valuation of long-lived assets;
· Valuation of goodwill and identifiable intangible assets; and
· Income taxes.
15
Revenue recognition;Recognition
Valuation of long-lived assets;
Valuation of goodwill and identifiable intangible assets; and
Income taxes.
Revenue Recognition
The Company derives a majority of its operating revenuesrevenue from its annually renewable services, which include performance tracking services, subscription-based educational services and Market Guide.Ticker. The Company provides interim and annual performance tracking to its clients under annual client service contracts, although such contracts are generally cancelable on short or no notice without penalty. The Company provides subscription-based educational services to clients generally under annual service contracts over a twelve monthtwelve-month period and publishes healthcare market information for its clients through its Market GuideTicker. Starting in May 2008, the Company began providing Ticker subscription-based services to clients on a monthly basis generally over a twelve-month period, however, some Ticker subscriptions will continue to be sold and delivered on an annual basis. The Company also derives revenuesrevenue from its custom and other research projects.
15
The Company’s performance tracking services are performance tracking and improvement tools for gathering and analyzing data from survey respondents. Such services are provided pursuant to contracts which are generally renewable annually, and that provide for a customer specificcustomer-specific study which is conducted via a series of surveys and delivered via a series of updates or reports, the timing and frequency of which vary by contract (such as monthly or weekly). These contracts are generally cancelable on short or no notice without penalty and, since progress on these contracts can be tracked and regular updates and reports are made, clients are entitled to any work-in-process, but are obligated to pay for all services performed through cancellation. Typically, these contracts are fixed-fee arrangements andwith a portion of the project fee is billed in advance and the remainder is billed periodically over the duration of the project. The Company conducts custom research which measures and monitors market issues specific to individual healthcare organizations. The majority of the Company’s custom research is performed under contracts which provide for advance billing of 65% of the total project fee with the remainder due upon delivery. Revenue and direct expenses for the Company’s performance tracking services are recognized under the proportional performance method.Under the proportional performance method, the Company recognizes revenue based on output measures or key milestones such as survey set up,set-up, survey mailings, survey returns and reporting. The Company measures its progress based on the level of completion of these output measures and recognizes revenue accordingly. Management judgments and estimates must be made and used in connection with revenue recognized using the proportional performance method. If management made different judgments and estimates, then the amount and timing of revenue for any period could differ materially from the reported revenue.The Company recognizes subscription-based educational service revenuesrevenue over the period of time the service is provided. Generally, the subscription periods are for twelve months and revenue is recognized equally over the subscription period.The Company’s Market Guide serves as a stand-alone market information and competitive intelligence source, as well as a comparative performance database. Published
Ticker was published by NRC annually, thissolely on an annual basis from 1996 to September 2008. The Company recognizes revenue on Ticker contracts upon delivery to the principal customers. Revenue under some annual contracts which do not include monthly updates is fully recognized upon delivery, typically in the third quarter of the year. Starting in May 2008, the Company added subscription-based services, the revenue from which is generally recognized on a monthly basis over a twelve-month period. Until September 2008, the Company would defer costs of preparing the survey is a comprehensive consumer-based healthcare assessment. Market Guidedata for Ticker and expense these at the time the annual contract revenue was recognized. Starting in October 2008, these costs were expensed monthly. The Company generates additional revenue from incidental customers subsequent to the completion of each monthly edition. Revenue and costs for these subsequent services are recognized as the services are performed and completed. Ticker is generally provided pursuant to contracts that provide for the receipt of survey results that are customized to meet an individual client’s specific information needs. Typically, these contracts are not cancelable by clients, clients receive no rights in the comprehensive healthcare database which results from this survey, other than the right to use the customized reports purchased pursuant thereto, and amounts due for Market GuideTicker are billed prior to or at delivery. The Company recognizes revenue on Market Guide contracts upon delivery to the principal customers, typically in the third quarter
16
As a result of the year. The Company defers coststiming of preparing the survey data for Market Guide. These costs are primarily incremental external direct costs solely related to fulfilling the Company’s obligations under Market Guide contracts. The Company expenses these deferred costs at the time revenue is recognized. The Company monitors and assesses the recoverabilityrecognition of the deferred direct costs based on contracted revenue and whenever changes in circumstances warrant such assessment. The Company generates additional revenue from incidental customers subsequent to the completion of each edition. Revenue and costs for these subsequent services are recognized as the customization services are performed and completed. The profit margin earned on such revenue is generally higher than that earned on revenue realized from customers under contract at the time of delivery. As a result,associated with Ticker, the Company’s margins vary throughout the year. The Company’s revenue recognition policy for Market GuideTicker is not sensitive to significant estimates and judgments.16
Valuation of Long-Lived AssetsUnder the provisions of Statement of Financial Accounting Standards (“SFAS”) No. 144,Accounting for the Impairment or Disposal of Long-Lived Assets, the
The Company monitors events and changes in circumstances that may require the Company to review the carrying value of its long-lived assets. The Company assesses the recoverabilitywhether an impairment of its long-lived assets based on estimatedheld and used may have occurred using undiscounted future operating cash flows. Impairments, if they occur, are measured using the fair value of the assets. The assessment of the recoverability of long-lived assets willmay be adversely impacted if estimated future operating cash flows are not achieved.The Company assesses the impairment of long-lived assets whenever events or changes in circumstances indicate that the carrying value of such assets may not be recoverable. ManagementAmong others, management believes the following circumstances are important indicators of potential impairment of such assets and, as a result, may trigger an impairment review:Significant underperformance in comparison to historical or projected operating results;
Significant changes in the manner or use of acquired assets or the Company’s overall strategy;· Significant underperformance in comparison to historical or projected operating results;
Significant negative trends in the Company’s industry or the overall economy;
A significant decline in the market price for the Company’s common stock for a sustained period; and· Significant changes in the manner or use of acquired assets or the Company’s overall strategy;
The Company’s market capitalization falling below the book value of the Company’s net assets.
· Significant negative trends in the Company’s industry or the overall economy;
· A significant decline in the market price for the Company’s common stock for a sustained period; and
· The Company’s market capitalization falling below the book value of the Company’s net assets.
Valuation of Goodwill and Identifiable Intangible AssetsIntangible assets include customer relationships, trade name and goodwill. Goodwill represents the difference between the purchase price paid in acquisitions using the purchase method of accounting, and the fair value of the net assets acquired.The Company adopted the provisions of SFAS No. 142,Goodwill and Other Intangible Assets,indefinite-lived intangibles are assessed annually for impairment and as a result, the Company doesare not amortize goodwill.
amortized.
As of December 31, 2007,2009, the Company had net goodwill of $31.1$39.9 million. As of October 1 of each year (or more frequently as changes in circumstances indicate), the Company evaluates the estimated fair value of the Company’s goodwill. On these evaluation dates, to the extent that the carrying value of the net assets of the Company’s reporting unitunits having goodwill is greater than the estimated fair value, impairment charges will be recorded. The Company’s analysis has not resulted in fair value substantially exceeding its carrying value in four of the recognitionfive business units having goodwill. For the newest business unit, MIV, the estimated fair value did not substantially exceed its carrying value. This was due, in part, to the 2009 MIV revenues and operating margins being below original projections, but management believes that the performance is improving during the first part of an2010. No impairment loss has been recorded on goodwill in 2007, 20062009, 2008 or 2005.2007. The Company will continue to evaluate for impairment as unforeseen future events may impact the goodwill valuation.
Income TaxesThe Company uses the asset and liability method of accounting for income taxes. Under that method, deferred income tax assets and liabilities are recognized for the future tax consequences attributable to differences between the financial statement carrying amounts of existing assets and liabilities and their respective tax bases using enacted tax rates. The effect on deferred tax assets and liabilities of a change in tax rates is recognized in income in the period that includes the enactment date. Valuation allowances, if any, are established when necessary to reduce deferred tax assets to the amount that is more likely than not to be realized. Management judgment is required to determine the provision for income taxes and to determine whether deferred income taxes will be realized in full or in part.
17
Results of OperationsThe following table sets forth, for the periods indicated, selected financial information derived from the Company’s consolidated financial statements, expressed as a percentage of total revenue and the percentage change in such items versus the prior comparable period. The trends illustrated in the following table may not necessarily be indicative of future results. The discussion that follows the table should be read in conjunction with the Company’s consolidated financial statements.Percentage of Total Revenue
Year Ended December 31,
Percentage
Increase
2007
2006
2005
2007
over
2006
2006
over
2005
Revenues 100.0 % 100.0 % 100.0 % 11.8 % 34.9 % Operating expenses: Direct expenses 44.6 44.4 42.1 12.1 42.5 Selling, general and administrative 26.9 27.8 26.6 8.4 41.1 Depreciation and amortization 5.3 5.2 5.4 14.3 28.3
Total operating expenses 76.8 77.4 74.1 10.9 41.0
Operating income 23.2 % 22.6 % 25.9 % 14.7 % 17.7 %
Percentage of Total RevenueYear Ended December 31, PercentageIncrease (Decrease) 2009 2008 2007 2009over2008 2008over2007 Revenue 100.0 % 100.0 % 100.0 % 13.1 % 4.3 % Operating expenses: Direct expenses 42.6 46.3 44.6 4.1 8.3 Selling, general and administrative 27.0 25.0 26.9 22.5 (3.4 ) Depreciation and amortization 6.6 5.3 5.3 42.7 4.0 Total operating expenses 76.3 76.5 76.8 12.7 3.9 Operating income 23.7 % 23.5 % 23.2 % 14.2 % 5.5 %
Year Ended December 31, 2007,2009, Compared to Year Ended December 31, 20062008RevenueRevenue. Revenue increased 11.8%13.1% in 20072009 to $48.9$57.7 million from $43.8$51.0 million in 2006.2008. This was primarily due to increases in the scope of work from existing clients, the addition of new clients, and the acquisition of TGIMIV in May 2006, which generated $4.1 million more of revenue in 2007 compared to 2006.December 2008.
Direct expenses. Direct expenses increased 12.1%4.1% to $21.8$24.6 million in 20072009 from $19.4$23.6 million in 2006 primarily2008. The change was mainly due to increases in conferenceincreased costs of $990,000, postage of $421,000, fieldwork of $291,000, and printing of $241,000 to supportservicing the increasedadditional revenue from TGI, and new clients and growththe MIV business, partially offset by the reductions in costs of servicing decreased revenue in other areas of the scope of work from existing clients.Company. Direct expenses increaseddecreased as a percentage of total revenue to 44.6%42.6% in 20072009 from 44.4%46.3% in 2006. The Company expects 2008, primarily due to be within the Company’sMIV’s current business model of 43% to 45% ofwith direct expenses as a percentage of revenue.revenue lower than the other operating business units of the Company and growth in margin in the Ticker division.Selling, general and administrative expenses. Selling, general and administrative expenses increased 8.4%22.5% to $13.2$15.6 million in 20072009 from $12.2$12.7 million in 2006.2008. The change was primarily due to increases in salary and benefits and contracted services of $1,071,000. The salary increases were primarily attributedexpenses related to the MIV acquisition of TGI .and expansions in the sales force. Selling, general and administrative expenses decreased as a percentage of total revenues to 26.9% in 2007 from 27.8% in 2006. For 2007, the Company was outside its model of 23% to 25%increased as a percentage of revenue but is expecting to leverage against higher revenue27.0% in 2009 from 25.0% in 2008, mainly due to come within its model range for these expenses.sales expansion efforts in the latter portion of 2009 throughout the Company.Depreciation and amortization. Depreciation and amortization expenses increased 14.3%42.7% to $2.6$3.8 million in 20072009 from $2.3$2.7 million in 2006.2008. Depreciation and amortization increased as a percentage of revenue to 6.6% in 2009 from 5.3% in 2008. The increase was primarily due to the depreciation of the fixed assets and amortization of intangiblesintangible assets associated with the acquisition of TGI. Depreciation and amortization as a percentage of revenue increased slightly to 5.3% in 2007 from 5.2% in 2006. The Company expects 2008 annualized depreciation to be in the middle of the Company’s model of 4.5% to 6% as a percentage of revenue, given continued revenue growth.MIV.
18
Provision for income taxes. The provision for income taxes totaled $4.3$4.6 million (38.5%(35.3% effective tax rate) for 20072009 compared to $3.6$4.5 million (38.1%(37.9% effective tax rate) for 2006.2008. The effective tax rate was lower in 20062009 due to differencesincreases in research and development tax credits and state investment and growth act credits, and decreases in Canadian statutory income taxes.tax rates.18
Year Ended December 31, 2006,2008, Compared to Year Ended December 31, 20052007RevenueRevenue. Revenue increased 34.9%4.3% in 20062008 to $43.7$51.0 million from $32.4$48.9 million in 2005.2007. This was primarily due to increases in the scope of work from existing clients and the addition of new clients, including the acquisition of GHS’s health plan business and TGI, which generated $4 million and $3.5 million in revenue in 2006, respectively.clients.
Direct expenses. Direct expenses increased 42.5%8.3% to $19.4$23.6 million in 20062008 from $13.6$21.8 million in 2005.2007. The change was primarily due to servicing the 34.9%an increase in revenue including additional expensessalaries, benefits and travel of $1.2 million, the result of the change in the business model, and the allocation of responsibilities related to sales and servicing clients. In 2008, the GHS health planCompany divided its sales force into two groups, one focused only on bringing in prospective new clients and TGI businesses. It also included increases inthe second focused exclusively on servicing current clients. As a result, salaries, benefits and benefits of $1.8 million, postagetravel attributable to the group focused on current clients are now classified as direct expenses rather than selling, general and printing of $1.6 million, and fieldwork and other product costs of $1.8 million.administrative expenses. Direct expenses increased as a percentage of revenue to 44.4%46.3% in 20062008 from 42.1%44.6% in 2005 due to the mix of business during the period, including certain health plan projects which have higher direct expenses than the balance of the Company’s business.2007.Selling, general and administrative expenses. Selling, general and administrative expenses increased 41.1%decreased 3.4% to $12.1$12.7 million in 20062008 from $8.6$13.2 million in 2005.2007. The change was primarilylargely due to increasesthe 2008 change in salary, benefitsthe business model and commissionsthe allocation of $2.9 million and travel expenses of $494,000. These increases were primarily attributedresponsibilities related to sales and marketing expansion initiatives, additional expenses related to the GHS health plan and TGI businesses and additional compensation expense related to the application of Statement of Financial Accounting Standards No. 123R (“SFAS No. 123R”).servicing clients. Selling, general and administrative expenses increaseddecreased as a percentage of revenue to 27.8%25.0% in 20062008 from 26.6%26.9% in 2005.2007.Depreciation and amortization. Depreciation and amortization expenses increased 28.3%4.0% to $2.3$2.7 million in 20062008 from $1.8$2.6 million in 2005. The increase was primarily due to the amortization of intangibles associated with the acquisitions of GHS and TGI.2007. Depreciation and amortization expenses decreased slightly as a percentage of revenue to 5.2%remained at 5.3% in 2006 from 5.4% in 2005 due to increased revenue2008 and assets becoming fully depreciated.2007 respectively.Provision for income taxes. The provision for income taxes totaled $3.6$4.5 million (38.1%(37.9% effective tax rate) for 20062008 compared to $3.3$4.3 million (38.5% effective tax rate) for 2005.2007. The effective tax rate was lower in 20062008 due to differencesdecreases in stateprovincial income taxes.tax rates.Inflation and Changing PricesInflation and changing prices have not had a material impact on revenues or net income from continuing operations in the last three years.Liquidity and Capital ResourcesThe Company believes it has adequate capital resources and operating cash flow to meet its projected capital and debt maturity needs for the foreseeable future. Requirements for working capital, capital expenditures, and debt maturities will continue to be funded by operations and the Company’s borrowing arrangements.
Working CapitalThe Company had a working capital deficiency of $2.4$4.4 million on December 31, 2007,2009, as compared to a $1.5$10.7 million working capital deficiency on December 31, 2006. The change in working capital from 2007 to 2006 was mainly due to increases in accrued expenses and billings in excess of revenue earned, partially offset by a decrease in notes payable.2008. The decrease in notes payablethe working capital deficiency was primarily due to paying off the Company’s line of credit in 2007 and additional 2007 pay-downs on the term loan.2009 that had a balance of $3.9 million as of December 31, 2008. The increase in accrued expenses wasworking capital deficiency balance is primarily due to the movement from a long term liability to accrued expenses for the additional purchase price payment on the Smaller World Communications Inc. acquisition in 2003. The purchase agreement included two scheduled paymentsdeferred revenue balance of additional purchase price in 2006$11.9 million and 2008. In 2006$12.9 million as of December 31, 2009 and 2008, the Company made aggregate payments of $536,200 and $713,580 respectively, as a result of meeting certainrespectively.
19
The deferred revenue goals.19
Billings in excess of revenue earned increasedbalance is primarily due to timing of initial billings on new and renewal contracts. The Company typically invoices clients for performance tracking services and custom research projects before they have been completed. Billed amounts are recorded as billings in excess of revenue earned, or deferred revenue, on the Company’s consolidated financial statements, and are recognized as income when earned. In addition, when work is performed in advance of billing, the Company records this work as revenue earned in excess of billings, or unbilled revenue. Substantially all deferred revenue and all unbilled revenue will be earned and billed respectively, within 12 months of the respective period ends.
Capital ExpendituresCapital expenditures for the year ended December 31, 2007,2009, were $2.0$2.9 million. These expenditures consisted mainly consisted of computer software, computer hardware, and furniture and other equipment. The Company expects capital expenditure purchases in 2010, consisting primarily of computer software and building improvements.The Company has budgeted approximately $1.9 million for additional capital expenditures in 2008hardware and other equipment, to be funded through cash generated from operations. The Company expects that the additional capital expenditures during 2008 will be primarily for computer hardware and software, production equipment and furniture.
Debt and EquityAs of December 31, 2007, the Company’s debt totaled $3.0 million. This consisted of the balance remaining on the $12.5 million credit facility used to fund the TGI acquisition. During 2007, the Company paid off $2.4 million on the line of credit that was outstanding as of December 31, 2006, and made $5.7 million of installment and additional payments on the term note.
On May 26, 2006, the Company entered into a credit facility pursuant to which it borrowed $9.0 million under a term note and $3.5 million under a revolving credit note in order to partially finance the acquisition of TGI. The term note is payable pursuant towas refinanced on February 25, 2008, for the credit facility in 83 equal installmentsremaining balance of $106,000, with the balanceterm note of $1.6 million. The refinanced term note required payments of principal and interest payable on Mayin 17 monthly installments of $93,000, beginning March 31, 2013.2008, and ending August 31, 2009. Borrowings under the refinanced term note bearbore interest at aan annual rate of 7.21% per year. The revolving credit note provides a revolving credit facility that matures on July 31, 2008.5.14%. The Company expects to extendpaid off the term of the revolving line of credit for at least one year beyond the maturity date. note in October 2008.
The maximum aggregate amount available under the revolving credit facilitynote was originally $3.5 million, but an addendum to the revolving credit note dated March 26, 2008, changed the revolving credit note amount to $6.5 million. The revolving credit note was renewed in July 2009 to extend the term to July 31, 2010. The Company may borrow, repay and re-borrow amounts under the revolving credit note from time to time until its maturity on July 31, 2010. The maximum aggregate amount available under the revolving credit note is $3.5$6.5 million, subject to a borrowing base equal to 75% of the Company’s eligible accounts receivable. The Company may borrow, repay and re-borrow amounts under the revolving credit facility from time to time until its maturity on July 31, 2008. Borrowings under the revolving credit facilitynote bear interest at a variable rate equal to (1) prime (as defined in the credit facility) less 0.50% or (2) one-, two-, three-, six- or twelve-month LIBOR. Monthly installmentThe Company expects to extend the term of the revolving credit note for at least one year beyond the maturity date. If, however, the note cannot be extended, the Company believes it has adequate cash flows from operations to meet its debt and capital needs. As of December 31, 2009, the revolving credit note did not have a balance. According to borrowing base requirements, the Company had the capacity to borrow $4.2 million as of December 31, 2009.On December 19, 2008, the Company borrowed $9.0 million under a term note to partially finance the acquisition of MIV. The term note is payable in 35 equal installments of $97,000, with the balance of principal and interest payable in a balloon payment due on December 31, 2011. Borrowings under the term note bear interest at a rate of 5.2% per year. In 2009, the Company made principal payments, were madein addition to the monthly installments, on the term note in accordance with the credit facility and additional payments were made with no prepayment penalties.loan totaling $650,000.
The credit facilityterm note is secured by certain of the Company’s assets, including the Company’s land, building, accounts receivable and intangibles. The credit facilityterm note contains various restrictions and covenants applicable to the Company, including requirements that the Company maintain certain financial ratios at prescribed levels and restrictions on the ability of the Company to consolidate or merge, create liens, incur additional indebtedness or dispose of assets. As of December 31, 2007,2009, the Company was in compliance with these restrictions and covenants.The merger agreement under which the Company acquired MIV provided for contingent earn-out payments over three years based on growth in revenue and earnings. As of December 31, 2009, a contingent earn-out payment of $795,000 was accrued, which was then paid in February 2010. The Company currently projects that the earn-out for 2010 and 2011 could be $3.0 million and $1.0 million, respectfully to be funded through cash flow from operations.
20
Debt assumed through the MIV acquisition included $90,000 in capital leases. The capital leases are for production and mailing equipment meeting capitalization requirements where the lease term exceeds more than 75% of the estimated useful life. The equipment is being depreciated over the lease term of 4.25 years ending in 2011.
The Company had contractual obligations to make cash payments in the following amounts in the future as of December 31, 2007:Contractual Obligations
Total
Payments
Less than
One Year
One to
Three Years
Three to
Five Years
After
Five Years
Operating leases $ 937,412 $ 462,832 $ 474,579 $ -- $ --
Long-term debt 2,993,352 1,092,754 1,900,598 -- --
Total $ 3,930,764 $ 1,555,586 $ 2,375,177 $ -- $ --
20
2009:
Contractual Obligations TotalPayments Less thanOne Year One toThree Years Three toFive Years AfterFive Years (In thousands) Operating leases $ 1,600 $ 524 $ 1,066 $ 10 $ — Capital leases(1) 65 37 28 — — Uncertain tax positions(2) 78 — — — — Long-term debt(1) 8,376 1,162 7,214 — — Total $ 10,119 $ 1,723 $ 8,386 $ 10 $ —
(1) Includes interest(2) It is uncertain when the tax benefits will be settled.
The Company generally does not make unconditional, non-cancelable purchase commitments. The Company enters into purchase orders in the normal course of business, but these purchase obligations do not exceed one year.
Shareholders’ equity increased $5.5$5.6 million to $42.3$44.2 million in 20072009 from $36.8$38.6 million in 2006.2008. The increase was primarily reflecteddue to net income of $8.5 million, non-cash stock compensation expense of $619,000, and the exercisechange in cumulative translation adjustment of stock options. This was partially$775,000, offset by the paymentdividends paid of dividends and the purchase of treasury stock. During 2007, the Company paid $3.3 million in cash dividends and $241,000 for the purchase of treasury stock.$4.3 million.
Stock Repurchase ProgramIn February 2006, the Board of Directors of the Company authorized the repurchase of an additional 750,000 shares of common stock in the open market or in privately negotiated transactions. As of December 31, 2007,2009, the remaining shares that can be purchased are 688,151.289,065.
Off-Balance Sheet ObligationsThe Company has no significant off-balance sheet obligations other than the operating lease commitments disclosed in “Liquidity and Capital Resources.”Adoption of New Accounting PronouncementsIn February 2006, theJune 2009, FASB issued SFAS No. 155,the Accounting for Certain Hybrid Financial Instruments— An AmendmentStandards Codification™ (“Codification”) as the source of authoritative U.S. generally accepted accounting principles (“GAAP”) recognized by FASB Statements No. 133to be applied by nongovernmental entities. The Codification supersedes all then-existing non-SEC accounting and 140. SFAS No. 155 amends SFAS No. 133,Accounting for Derivative Instruments and Hedging Activities, and SFAS No. 140,Accounting for Transfer and Servicing of Financial Assets and Extinguishments of Liabilities, and eliminatesreporting standards. In accordance with the exemption from applying SFAS No. 133Codification, references to interestsaccounting literature in securitized financial assets so that similar itemsthis report are accounted forpresented in plain English. The Codification did not change GAAP, but reorganizes the same way.literature. The provisions of SFAS No. 155 areCodification is effective for all financial instruments acquired by a company orstatements issued after the beginning of its first fiscal year that beginsfor interim and annual periods ending after September 15, 2006.2009. The adoption of SFAS No. 155the Codification has not had no effectan impact on the consolidated financial statements.
21
Recent Accounting PronouncementsIn March 2006,September 2009, the FASB issued SFAS No. 156,Accountingnew guidance for Servicing of Financial Assets— An Amendment of FASB Statement No. 140. SFAS No. 156 amends SFAS No. 140,Accounting for Transfers and Servicing of Financial Assets and Extinguishments of Liabilities, and requires that all separately recognized servicing assets and servicing liabilities be initially measured at fair value, if practicable. The provisions of SFAS No. 156 are effective as of the beginning of a company’s first fiscal year that begins after September 15, 2006. The adoption of SFAS No. 156 had no effect on the consolidated financial statements.In June 2006, the FASB issued FASB Interpretation No. 48 (“FIN 48”),Accounting for Uncertainty in Income Taxes— An Interpretation of FASB Statement No. 109. FIN 48 prescribes arevenue recognition threshold and measurement process for recording in the financial statements uncertain tax positions taken or expected to be taken in a tax return. Additionally, this interpretation provides guidance on the derecognition, classification, accounting in interim periods and disclosure requirements for uncertain tax positions. The provisions of FIN 48 werewith multiple deliverables, which is effective for us on January 1, 2007. The adoption of FIN 48 had no effect on the consolidated financial statements.
In September 2006, the FASB issued SFAS No. 157,Fair Value Measurements. SFAS No. 157 defines fair value, establishes a framework for measuring fair valuerevenue arrangements entered into or materially modified in generally accepted accounting principles (GAAP), and expands disclosures about fair value measurements. The provisions of SFAS No. 157 are effective as of thefiscal years beginning of a company’s first fiscal year that begins after November 15, 2007. Management believes that adoption of SFAS No. 157 will not have a material effect on the consolidated financial statements.
21
In February 2008, the FASB issued FASB Staff Position (FSP) Financial Accounting Standard (FAS) 157-1,Application of FASB Statement No. 157 to FASB Statement No. 13 and Its Related Interpretive Accounting Pronouncements That Address Leasing Transactions, and FSP FAS 157-2,Effective Date of FASB Statement No. 157. FSP FAS 157-1 removes leasing from the scope of SFAS No. 157,Fair Value Measurements. FSP FAS 157-2 delays the effective date of SFAS No. 157 from 2008 to 2009 for all non-financial assets and non-financial liabilities, except those that are recognized or disclosed at fair value in the financial statements on a recurring basis (at least annually). Management believes that adoption of SFAS No. 157-1 and 157-2 will not have a material effect on the consolidated financial statements.
In February 2007, the FASB issued SFAS No. 159,The Fair Value Option for Financial Assets and Financial Liabilities,including an amendment of FASB Statement No. 115. This statement permits entities to choose to measure many financial instruments and certain other items at fair value. The provisions of SFAS No. 159 are effective as of the beginning of a company’s first fiscal year that begins after November 15, 2007. Management believes that adoption of SFAS No. 159 will not have a material effect on the consolidated financial statements.
In June 2007, the FASB ratified the consensus reached by the Emerging Issues Task Force (EITF) in EITF Issue No. 07-3,Accounting for Nonrefundable Advance Payments for Goods or Services Received for Use in Future Research and Development Activities (EITF 07-3), which requires that nonrefundable advance payments for goods or services that will be used or rendered for future research and development activities be deferred and amortized over the period that the goods are delivered or the related services are performed, subject to an assessment of recoverability. EITF 07-3 is effective as of the beginning of a company’s first fiscal year that begins after December 15, 2008. Management believes that adoption of EITF 07-3 will not have a material effect on the consolidated financial statements.
In December 2007, the FASB issued SFAS No. 141(R),Business Combinations (“SFAS 141(R)”), which replaces FAS 141. SFAS 141(R) establishes principles and requirements for how an acquirer in a business combination recognizes and measures in its financial statements the identifiable assets acquired, the liabilities assumed, and any controlling interest; recognizes and measures the goodwill acquired in the business combination or a gain from a bargain purchase; and determines what information to disclose to enable users of the financial statements to evaluate the nature and financial effects of the business combination. FAS 141(R) is to be applied prospectively to business combinations for which the acquisition date is on or after an entity’s fiscal yearJune 15, 2010, although early adoption is permitted. This guidance eliminates the residual method under the current guidance and replaces it with the “relative selling price” method when allocating revenue in a multiple deliverable arrangement. The selling price for each deliverable shall be determined using vendor-specific objective evidence of selling price, if it exists, otherwise third-party evidence of selling price. If neither exists for a deliverable, the vendor shall use its best estimate of the selling price for that begins after December 15, 2008.deliverable. After adoption, this guidance will also require expanded qualitative and quantitative disclosures. Management willcontinues to assess the impact of SFAS 141(R) if and when a future acquisition occurs.
this authoritative guidance.Item 7A.Quantitative and Qualitative Disclosure About Market Risk
Item 7A. Quantitative and Qualitative Disclosure About Market Risk
The impact of financialCompany’s primary market risk exposure is changes in foreign currency exchange rates and interest rates.The Company’s Canadian subsidiary uses as its functional currency the local currency of the country in which it operates. It translates its assets and liabilities into U.S. dollars at the exchange rate in effect at the balance sheet date. It translates its revenue and expenses at the average exchange rate during the period. The Company includes translation gains and losses in accumulated other comprehensive income (loss), a component of shareholders’ equity. Foreign currency translation gains or (losses) were $775,000, ($937,000), and $568,000 in 2009, 2008, and 2007, respectively. Gains and losses related to transactions denominated in a currency other than the functional currency of the countries in which the Company is not significant. operates and short-term intercompany accounts are included in other income (expense) in the consolidated statements of income.The Company’s primary financial marketinterest rate risk exposure consistsis related to interest expense from the Company’s revolving credit note with a variable interest rate. However, the revolving credit note had no balance as of December 31, 2009.The Company has limited interest rate risk related to interest income from the Company’s investments in United States government securitiesnotes with maturities of three years90 days or less.less at the purchase date for the security. The Company has investedclassified these as cash equivalents. The discounted notes bear interest at .041% and expects to continue to invest a substantial portion.091% annually. One of its excess cash in such securities. See Notethe notes matured on February 3, to2010, and payment was received for the Company’s consolidated financial statements. Generally, if the overall average return on such securities would have decreased .5% from the average return during the years ended December 31, 2007 and 2006, then the Company’s interest income and pre-tax income would have decreased approximately $8,000 and $19,000, respectively. These amounts were determined by considering the impact of a hypothetical change in interest rates on the Company’s interest income.full principal amount.
22
Item 8.Financial Statements and Supplementary Data
Item 8. Financial Statements and Supplementary Data
Quarterly Financial Data (Unaudited)The following table sets forth selected financial information for each of the eight quarters in the two-year period ended December 31, 2007.2009. This unaudited information has been prepared by the Company on the same basis as the consolidated financial statements and includes all normal recurring adjustments necessary to present fairly this information when read in conjunction with the Company’s audited consolidated financial statements and the notes thereto.(In thousands, except per share data)
Quarter Ended
Dec. 31,
2007
Sept 30,
2007
June 30,
2007
Mar. 31,
2007
Dec. 31,
2006
Sept 30,
2006
June 31,
2006
Mar. 31,
2006
Revenue $ 10,821 $ 13,952 $ 11,945 $ 12,205 $ 10,319 $ 13,313 $ 10,663 $ 9,476 Direct expenses 5,057 5,930 5,366 5,448 4,604 5,761 4,980 4,100 Selling, general and administrative 3,283 3,240 3,250 3,400 3,150 2,960 3,042 3,006 Depreciation and amortization 661 672 623 627 690 600 500 470
Operating income 1,820 4,110 2,706 2,730 1,875 3,992 2,141 1,900 Other income (expense) (25 ) (57 ) (30 ) (137 ) (224 ) (200 ) (36 ) 58 Provision for income taxes 686 1,558 1,035 999 645 1,450 786 741
Net income $ 1,109 $ 2,495 $ 1,641 $ 1,594 $ 1,006 $ 2,342 $ 1,319 $ 1,217
Net income per share - basic $ 0.16 $ 0.36 $ 0.24 $ 0.23 $ 0.15 $ 0.34 $ 0.19 $ 0.18 Net income per share - diluted $ 0.16 $ 0.36 $ 0.23 $ 0.23 $ 0.14 $ 0.34 $ 0.19 $ 0.18 Weighted average shares outstanding - basic 6,861 6,851 6,845 6,842 6,838 6,845 6,845 6,819 Weighted average shares outstanding - diluted 7,034 7,013 7,002 6,964 6,976 6,986 6,970 6,918
(In thousands, except per share data) Quarter Ended Dec. 31,2009 Sept 30,2009 June 30,2009 Mar. 31,2009 Dec. 31,2008 Sept 30,2008 June 30,2008 Mar. 31,2008 Revenue $ 13,841 $ 13,517 $ 13,594 $ 16,740 $ 12,189 $ 13,469 $ 11,901 $ 13,454 Direct expenses 5,548 5,446 6,304 7,276 5,766 6,598 5,320 5,927 Selling, general and administrative 4,042 3,872 3,697 3,979 2,768 3,053 3,348 3,559 Depreciation and amortization 929 901 891 1,110 682 661 676 666 Operating income 3,322 3,298 2,702 4,375 2,973 3,157 2,557 3,302 Other income (expense) (134 ) (166 ) (183 ) (97 ) 70 14 (58 ) (32 ) Provision for income taxes 951 1,138 910 1,627 1,148 1,205 918 1,267 Net income $ 2,237 $ 1,994 $ 1,609 $ 2,651 $ 1,895 $ 1,966 $ 1,581 $ 2,003 Net income per share – basic $ 0.34 $ 0.30 $ 0.24 $ 0.40 $ 0.29 $ 0.30 $ 0.24 $ 0.29 Net income per share – diluted $ 0.33 $ 0.30 $ 0.24 $ 0.39 $ 0.28 $ 0.29 $ 0.23 $ 0.29 Weighted average shares outstanding – basic 6,639 6,637 6,637 6,633 6,642 6,644 6,637 6,818 Weighted average shares outstanding – diluted 6,725 6,735 6,734 6,713 6,782 6,803 6,793 6,970
23
23
REPORT OF INDEPENDENT REGISTERED PUBLIC ACCOUNTING FIRMTo the Shareholders and Board of Directors
National Research Corporation:
We have audited the accompanying consolidated balance sheets of National Research Corporation and subsidiary (the Company) as of December 31, 20072009 and 2006,2008, and the related consolidated statements of income, shareholders’ equity and comprehensive income, and cash flows for each of the years in the three-year period ended December 31, 2007.2009. In connection with our audits of the consolidated financial statements, we have also audited the financial statement schedule listed in Item 15(a)(2) of this Form 10-K. These consolidated financial statements and financial statement schedule are the responsibility of the Company’s management. Our responsibility is to express an opinion on these consolidated financial statements and financial statement schedule based on our audits.
We conducted our audits in accordance with the standards of the Public Company Accounting Oversight Board (United States). Those standards require that we plan and perform the audit to obtain reasonable assurance about whether the financial statements are free of material misstatement. An audit includes examining, on a test basis, evidence supporting the amounts and disclosures in the financial statements. An audit also includes assessing the accounting principles used and significant estimates made by management, as well as evaluating the overall financial statement presentation. We believe that our audits provide a reasonable basis for our opinion.
In our opinion, the consolidated financial statements referred to above present fairly, in all material respects, the financial position of National Research Corporation and subsidiary as of December 31, 20072009 and 20062008, and the results of their operations and their cash flows for each of the years in the three-year period ended December 31, 2007,2009, in conformity with U.S. generally accepted accounting principles. Also, in our opinion, the related financial statement schedule, when considered in relation to the basic consolidated financial statements taken as a whole, presents fairly, in all material respects, the information set forth therein.As discussed in notes 1 and 8, the Company changed its method of recording stock-based compensation in 2006.
/s/ KPMG LLPLincoln, Nebraska
March 28, 200831, 2010
24
24
NATIONAL RESEARCH CORPORATION AND SUBSIDIARY
CONSOLIDATED BALANCE SHEETS AS OF(In thousands, except share amounts)
DECEMBER 31, 2007 AND 2006Assets 2007
2006
Current assets: Cash and cash equivalents $ 3,355,141 $ 876,360 Investments in marketable debt securities 99,497 1,110,104 Trade accounts receivable, less allowance for doubtful accounts of $70,212 and $44,302 in 2007 and 2006, respectively 6,378,914 6,733,595 Unbilled revenue 1,377,427 2,272,194 Prepaid expenses and other 1,068,446 1,058,017 Recoverable income taxes 272,219 898,264 Deferred income taxes 48,657 48,410
Total current assets 12,600,301 12,996,944
Net property and equipment 11,974,029 11,715,933 Intangible assets 5,615,910 6,473,644 Goodwill 31,051,202 30,014,337 Deferred income taxes 590,034 279,865 Other 37,317 51,268
Total assets $ 61,868,793 $ 61,531,991
Liabilities and Shareholders’ EquityCurrent liabilities: Current portion of note payable $ 1,092,754 $ 3,110,106 Accounts payable 1,106,317 1,152,657 Accrued wages, bonus and profit sharing 1,477,021 1,593,823 Accrued expenses 1,386,133 358,577 Billings in excess of revenue earned 9,921,763 8,263,692
Total current liabilities 14,983,988 14,478,855
Note payable, net of current portion 1,900,598 7,982,867 Deferred income taxes 2,697,774 2,267,688 Other long-term liabilities -- 52,068
Total liabilities 19,582,360 24,781,478
Shareholders’ equity: Common stock, $.001 par value; authorized 20,000,000 shares, issued 7,883,289 in 2007 and 7,837,848 in 2006, outstanding 6,926,442 in 2007 and 6,890,631 in 2006 7,883 7,838 Additional paid-in capital 23,508,717 21,819,709 Retained earnings 30,003,606 26,488,308 Accumulated other comprehensive income, net of taxes 931,655 359,025 Treasury stock, at cost; 956,847 shares in 2007 and 947,217 shares in 2006 (12,165,428 ) (11,924,367 )
Total shareholders’ equity 42,286,433 36,750,513
Total liabilities and shareholders’ equity $ 61,868,793 $ 61,531,991
2009 2008 Assets Current assets: Cash and cash equivalents $ 2,512 $ 1,109 Trade accounts receivable, less allowance for doubtful accounts of $279 and $241 in 2009 and 2008, respectively 5,214 6,531 Unbilled revenue 1,173 810 Prepaid expenses and other 1,864 1,300 Recoverable income taxes 803 574 Deferred income taxes 98 115 Total current assets 11,664 10,439 Net property and equipment 13,975 13,747 Intangible assets, net 6,883 8,056 Goodwill 39,924 39,276 Other 53 627 Total assets $ 72,499 $ 72,145 Liabilities and Shareholders’ Equity Current liabilities: Current portion of note payable $ 816 $ 4,581 Accounts payable 598 863 Accrued wages, bonus and profit sharing 1,926 1,375 Accrued expenses 848 1,344 Deferred revenue 11,907 12,926 Total current liabilities 16,095 21,089 Note payable, net of current portion 6,903 8,374 Deferred income taxes 5,126 4,084 Deferred revenue 204 — Total liabilities 28,328 33,547 Shareholders’ equity: Common stock, $.001 par value; authorized 20,000,000 shares, issued 8,018,044 in 2009 and 8,019,922 in 2008, outstanding 6,662,111 in 2009 and 6,667,517 in 2008 8 8 Additional paid-in capital 27,871 27,217 Retained earnings 37,905 33,677 Accumulated other comprehensive income (loss), net of taxes 769 (6 ) Treasury stock, at cost; 1,355,933 shares in 2009 and 1,352,405 shares in 2008 (22,382 ) (22,298 ) Total shareholders’ equity 44,171 38,598 Total liabilities and shareholders’ equity $ 72,499 $ 72,145
See accompanying notes to consolidated financial statements.
25
NATIONAL RESEARCH CORPORATION AND SUBSIDIARY
CONSOLIDATED STATEMENTS OF INCOME FOR THE(In thousands, except for per share amounts)
THREE YEARS ENDED DECEMBER 31, 20072007
2006
2005
Revenue $ 48,922,884 $ 43,771,455 $ 32,436,502
Operating expenses: Direct expenses 21,801,039 19,445,925 13,642,195 Selling, general and administrative 13,173,431 12,158,004 8,617,372 Depreciation and amortization 2,582,866 2,259,669 1,761,623
Total operating expenses 37,557,336 33,863,598 24,021,190
Operating income 11,365,548 9,907,857 8,415,312
Other income (expense): Interest income 138,702 171,273 488,120 Interest expense (483,135 ) (517,482 ) (379,464 ) Other, net 96,269 (55,893 ) (9,507 )
Total other income (expense) (248,164 ) (402,102 ) 99,149
Income before income taxes 11,117,384 9,505,755 8,514,461
Provision for income taxes 4,278,372 3,621,687 3,278,370
Net income $ 6,839,012 $ 5,884,068 $ 5,236,091
Net income per share - basic $ 1.00 $ 0.86 $ 0.74
Net income per share - diluted $ 0.98 $ 0.85 $ 0.74
2009 2008 2007 Revenue $ 57,692 $ 51,013 $ 48,923 Operating expenses: Direct expenses 24,574 23,611 21,801 Selling, general and administrative 15,590 12,728 13,174 Depreciation and amortization 3,831 2,685 2,583 Total operating expenses 43,995 39,024 37,558 Operating income 13,697 11,989 11,365 Other income (expense): Interest income 2 42 139 Interest expense (405 ) (139 ) (483 ) Other, net (177 ) 91 96 Total other expense (580 ) (6 ) (248 ) Income before income taxes 13,117 11,983 11,117 Provision for income taxes 4,626 4,538 4,278 Net income $ 8,491 $ 7,445 $ 6,839 Net income per share - basic $ 1.28 $ 1.11 $ 1.00 Net income per share - diluted $ 1.26 $ 1.09 $ 0.98 Weighted average shares and shares equivalent outstanding - basic 6,637 6,685 6,850 Weighted average shares and shares equivalent outstanding - diluted 6,723 6,831 7,011
See accompanying notes to consolidated financial statements.
26
26
NATIONAL RESEARCH CORPORATION AND SUBSIDIARY
CONSOLIDATED STATEMENTS OF SHAREHOLDERS’ EQUITY
AND COMPREHENSIVE INCOME AS OF AND FOR THE(In thousands except share and per share amounts)
THREE YEARS ENDED DECEMBER 31, 2007Common
Stock
Additional
Paid-in
Capital
Retained
Earnings
Unearned
Compensation
Accumulated
Other
Comprehensive
Income
Treasury
Stock
Total
Balances at December 31, 2004 $ 7,684 $ 19,345,569 $ 20,382,334 $ (182,354 ) $ 220,261 $ (4,755,837 ) $ 35,017,657
Purchase of 385,700 shares of treasury stock -- -- -- -- -- (5,932,475 ) (5,932,475 ) Issuance of 30,873 common shares for the exercise of stock options 31 253,846 -- -- -- -- 253,877 Tax benefit from the exercise of options -- 84,140 -- -- -- -- 84,140 Issuance of 25,692 restricted common shares, net of 2,036 cancelled 26 362,472 -- (362,498 ) -- -- -- Non-cash stock compensation expense -- -- -- 112,221 -- -- 112,221 Dividends declared of $0.32 per common share -- -- (2,258,128 ) -- -- -- (2,258,128 ) Comprehensive income Change in unrealized gain/(loss) on marketable securities net of tax -- -- -- -- 4,280 -- 4,280 Change in cumulative translation adjustment -- -- -- -- 75,828 -- 75,828 Net income -- -- 5,236,091 -- -- -- 5,236,091
Total comprehensive income -- -- 5,236,091 -- 80,108 -- 5,316,199
Balances at December 31, 2005 7,741 20,046,027 23,360,297 (432,631 ) 300,369 (10,688,312 ) 32,593,491
Purchase of 52,217 shares of treasury stock -- -- -- -- -- (1,236,055 ) (1,236,055 ) Issuance of 89,307 common shares for the exercise of stock options 89 926,102 -- -- -- -- 926,191 Tax benefit from the exercise of options -- 404,535 -- -- -- -- 404,535 Issuance of 13,218 restricted common shares, net of 5,250 cancelled 8 (8 ) -- -- -- -- -- Non-cash stock compensation expense -- 875,684 -- -- -- -- 875,684 Reclassify unearned compensation -- (432,631 ) -- 432,631 -- -- -- Dividends declared of $0.40 per common share -- -- (2,756,057 ) -- -- -- (2,756,057 ) Comprehensive income Change in unrealized gain/(loss) on marketable securities net of tax -- -- -- -- 67,436 -- 67,436 Change in cumulative translation adjustment -- -- -- -- (8,780 ) -- (8,780 ) Net income -- -- 5,884,068 -- -- -- 5,884,068
Total comprehensive income -- -- 5,884,068 -- 58,656 -- 5,942,724
Balances at December 31, 2006 7,838 21,819,709 26,488,308 -- 359,025 (11,924,367 ) 36,750,513
Purchase of 61,849 shares of treasury stock -- -- -- -- -- (241,061 ) (241,061 ) Issuance of 22,829 common shares for the exercise of stock options 22 337,764 -- -- -- -- 337,786 Tax benefit from the exercise of options -- 111,551 -- -- -- -- 111,551 Issuance of 32,115 restricted common shares, net of 9,109 cancelled 23 (23 ) -- -- -- -- -- Non-cash stock compensation expense -- 1,239,716 -- -- -- -- 1,239,716 Dividends declared of $0.48 per common share -- -- (3,323,714 ) -- -- -- (3,323,714 ) Comprehensive income Change in unrealized gain/(loss) on marketable securities net of tax -- -- -- -- 4,085 -- 4,085 Change in cumulative translation adjustment -- -- -- -- 568,545 -- 568,545 Net income -- -- 6,839,012 -- -- -- 6,839,012
Total comprehensive income -- -- 6,839,012 -- 572,630 -- 7,411,642
Balances at December 31, 2007 $ 7,883 $ 23,508,717 $ 30,003,606 $ -- $ 931,655 $ (12,165,428 ) $ 42,286,433
CommonStock AdditionalPaid-inCapital RetainedEarnings AccumulatedOtherComprehensiveIncome TreasuryStock Total Balances at December 31, 2006 8 21,820 26,488 359 (11,924 ) 36,751 Purchase of 61,849 shares of treasury stock — — — — (241 ) (241 ) Issuance of 22,829 common shares for the exercise of stock options — 338 — — — 338 Tax benefit from the exercise of options and vested restricted stock — 111 — — — 111 Issuance of 32,115 restricted common shares, net of 9,109 cancelled — — — — — — Non-cash stock compensation expense — 1,240 — — — 1,240 Dividends declared of $0.48 per common share — — (3,324 ) — — (3,324 ) Comprehensive income Change in unrealized gain/(loss) on marketable securities, net of tax — — — 4 — 4 Change in cumulative translation adjustment — — — 568 — 568 Net income — — 6,839 — — 6,839 Total comprehensive income 7,411 Balances at December 31, 2007 $ 8 $ 23,509 $ 30,003 $ 931 $ (12,165 ) $ 42,286, Purchase of 395,558 shares of treasury stock — — — — (10,133 ) (10,133 ) Issuance of 144,614 common shares for the exercise of stock options — 1,856 — — — 1,856 Tax benefit from the exercise of options and vested restricted stock — 836 — — — 836 Cancellation of 7,981 restricted common shares — — — — — — Non-cash stock compensation expense — 1,016 — — — 1,016 Dividends declared of $0.56 per common share — — (3,771 ) — — (3,771 ) Comprehensive income Change in cumulative translation adjustment — — — (937 ) — (937 ) Net Income 7,445 7,445 Total comprehensive income — — — — — 6,508 Balances at December 31, 2008 $ 8 $ 27,217 $ 33,677 $ (6 ) $ (22,298 ) $ 38,598 Purchase of 3,528 shares of treasury stock — — — — (84 ) (84 ) Issuance of 2,023 common shares for the exercise of stock options — 18 — — — 18 Tax benefit from the exercise of options and vested restricted stock — 17 — — — 17 Cancellation of 3,901 restricted common shares — — — — — — Non-cash stock compensation expense — 619 — — — 619 Dividends declared of $0.64 per common share — — (4,263 ) — — (4,263 ) Comprehensive income Change in cumulative translation adjustment — — — 775 — 775 Net income 8,491 8,491 Total comprehensive income — — — — — 9,266 Balances at December 31, 2009 $ 8 $ 27,871 $ 37,905 $ 769 $ (22,382 ) $ 44,171
See accompanying notes to consolidated financial statements.27
NATIONAL RESEARCH CORPORATION AND SUBSIDIARY
CONSOLIDATED STATEMENTS OF CASH FLOWS(In thousands)
FOR THE THREE YEARS ENDED DECEMBER 31, 20072007
2006
2005
Cash flows from operating activities: Net income $ 6,839,012 $ 5,884,068 $ 5,236,091 Adjustments to reconcile net income to net cash provided by operating activities: Depreciation and amortization 2,582,866 2,259,669 1,761,623 Deferred income taxes 117,046 99,135 264,049 Loss (gain) on sale of property and equipment (3,587 ) (50 ) 239 Loss (gain) on sale of other investments -- 47,616 (43 ) Tax benefit from exercise of stock options 31,245 63,005 84,140 Non-cash stock compensation expense 1,092,776 1,022,624 112,221 Change in assets and liabilities, net of effect of acquisitions: Trade accounts receivable 616,423 (884,575 ) (2,079,193 ) Unbilled revenue 900,397 (1,089,431 ) 29,026 Prepaid expenses and other 30,190 256,809 45,597 Accounts payable (73,154 ) 22,006 602,326 Accrued expenses, wages, bonus and profit sharing 329,845 (58,680 ) 328,718 Income taxes payable and recoverable 562,797 (714,293 ) 442,865 Billings in excess of revenue earned 1,540,258 (95,723 ) 1,360,425
Net cash provided by operating activities 14,566,114 6,812,180 8,188,084
Cash flows from investing activities: Purchases of property and equipment (1,956,204 ) (1,453,128 ) (1,088,172 ) Proceeds from sale of property and equipment 200 50 1,500 Acquisition, net of cash acquired and earn-out on acquisition -- (20,620,521 ) (4,459,198 ) Purchases of securities available-for-sale (2,990,012 ) (1,378,523 ) (19,453,522 ) Proceeds from the maturities of securities available-for-sale 4,007,262 9,784,215 25,353,137
Net cash provided by (used in) investing activities (938,754 ) (13,667,907 ) 353,745
Cash flows from financing activities: Proceeds from notes payable 375,000 14,795,000 -- Payments on notes payable (8,474,621 ) (5,173,310 ) (3,429,571 ) Proceeds from exercise of stock options 337,786 926,191 253,877 Tax benefit on exercise of stock options and vested restricted stock 80,306 341,530 -- Purchase of treasury stock (241,061 ) (1,236,055 ) (5,932,475 ) Payment of dividends on common stock (3,323,714 ) (2,756,057 ) (2,258,128 )
Net cash provided by (used in) financing activities (11,246,304 ) 6,897,299 (11,366,297 )
Effect of exchange rate changes on cash 97,726 (9,171 ) 20,734
Net increase (decrease) in cash and cash equivalents 2,478,782 32,401 (2,803,734 )
Cash and cash equivalents at beginning of period 876,360 843,959 3,647,693
Cash and cash equivalents at end of period $ 3,355,142 $ 876,360 $ 843,959
Supplemental disclosure of cash paid for: Interest expense $ 483,135 $ 600,719 $ 364,210 Income taxes $ 3,457,478 $ 3,839,192 $ 2,479,834
2009 2008 2007 Cash flows from operating activities: Net income $ 8,491 $ 7,445 $ 6,839 Adjustments to reconcile net income to net cash provided by operating activities: Depreciation and amortization 3,831 2,686 2,583 Deferred income taxes 1,733 430 117 Loss (gain) on sale of property and equipment 1 — (3 ) Tax benefit from exercise of stock options — 156 31 Non-cash stock compensation expense 619 1,016 1,093 Change in assets and liabilities, net of effect of acquisitions: Trade accounts receivable 1,396 637 616 Unbilled revenue (315 ) 603 900 Prepaid expenses and other (516 ) (155 ) 30 Accounts payable (278 ) (408 ) (73 ) Accrued expenses, wages, bonus and profit sharing (73 ) 6 330 Income taxes payable and recoverable (326 ) (249 ) 563 Deferred revenue (897 ) 3,008 1,540 Net cash provided by operating activities 13,666 15,175 14,566 Cash flows from investing activities: Purchases of property and equipment (2,909 ) (2,812 ) (1,956 ) Acquisition, net of cash acquired and earn-out on acquisition (93 ) (12,551 ) — Purchases of securities available-for-sale — — (2,990 ) Proceeds from the maturities of securities available-for-sale — 99 4,007 Net cash used in investing activities (3,002 ) (15,264 ) (939 ) Cash flows from financing activities: Proceeds from notes payable 4,916 18,564 375 Payments on notes payable (10,152 ) (8,952 ) (8,474 ) Proceeds from exercise of stock options 18 731 338 Tax benefit on exercise of stock options and vested restricted stock 17 680 80 Purchase of treasury stock (84 ) (9,007 ) (241 ) Payment of dividends on common stock (4,263 ) (3,771 ) (3,324 ) Net cash used in financing activities (9,548 ) (1,755 ) (11,246 ) Effect of exchange rate changes on cash 287 (402 ) 98 Net increase (decrease) in cash and cash equivalents 1,403 (2,246 ) 2,479 Cash and cash equivalents at beginning of period 1,109 3,355 876 Cash and cash equivalents at end of period $ 2,512 $ 1,109 $ 3,355 Supplemental disclosure of cash paid for: Interest expense $ 498 $ 122 $ 483 Income taxes $ 2,999 $ 3,502 $ 3,457
Supplemental disclosures of non-cash investing activities:
In connection with the Company’s acquisition of businesses in 2006 and 2005,Equity Incentive plans, certain optionees tendered to the Company acquired current assets of $730,804
previously owned shares to pay for the option strike price. The total non-cash stock options exercised was $0, $1.1 million and $53,046, respectively,$0 for the years ended December 31, 2009, 2008, and assumed current liabilities of $3,201,691 and $151,685,2007, respectively.
See accompanying notes to consolidated financial statements.
28
NATIONAL RESEARCH CORPORATION AND SUBSIDIARY
NOTES TO CONSOLIDATED FINANCIAL STATEMENTS(1) Summary of Significant Accounting Policies
Description of Business and Basis of PresentationNational Research Corporation (the “Company”) is a provider of ongoing survey-based performance measurement, analysis, tracking, improvement services and governance education to the healthcare industry in the United States and Canada. The Company provides market research services to hospitals and insurance companies on an unsecured credit basis. The Company’s ten largest clients accounted for 29%14%, 32%24%, and 40%29% of the Company’s total revenue in 2009, 2008, and 2007, 2006 and 2005, respectively. One client accounted for 8%, 8% and 11% of total revenue in 2007, 2006 and 2005, respectively. The Company operates in a single industry segment.Principles of ConsolidationThe consolidated financial statements include the accounts of the Company and its subsidiary. All significant intercompany transactions and balances have been eliminated in consolidation.Use of EstimatesThe preparation of financial statements in conformity with accounting principles generally accepted in the United States of America requires management to make certain estimates and assumptions that affect the reported amounts of assets and liabilities at the date of the financial statements and the reported amounts of revenue and expenses during the reporting period. Actual results could differ from those estimates.Translation of Foreign CurrenciesThe Company’s Canadian subsidiary uses as its functional currency the local currency of the country in which it operates. It translates its assets and liabilities into U.S. dollars at the exchange rate in effect at the balance sheet date. It translates its revenue and expenses at the average exchange rate during the period. The Company includes translation gains and losses in accumulated other comprehensive income (loss), a component of shareholders’ equity. Gains and losses related to transactions denominated in a currency other than the functional currency of the countries in which the Company operates and short-term intercompany accounts are included in other income (expense) in the consolidated statements of income.Revenue RecognitionThe Company derives a majority of its operating revenue from its annually renewable services, which include the performance tracking services, subscription-based educational services and Market Guide.subscription-based and annual contracts of Ticker. The Company provides interim and annual performance tracking to its clients under annual client service contracts, although such contracts are generally cancelable on short or no notice without penalty. The Company provides subscription-based educational services to clients generally under annual service contracts over a twelve-month period and publishes healthcare market information for its clients through its Market Guide generallyTicker on an annual or monthly basis. The Company also derives revenue from its custom and other research projects. Sales taxes collected from customers and remitted to governmental authorities are accounted for on a net basis and, therefore, are excluded from revenue in the consolidated statements of income.
29
The Company recognizes revenue from its performance tracking services and its custom and other research projects using the proportional performance method of accounting. These services typically include a series of surveys and deliverable reports in which the timing and frequency vary by contract. Progress on a contract can be tracked reliably, and customers are obligated to pay as services are performed. The Company recognizes revenue based on output measures or key milestones such as survey set up, survey mailings, survey returns and reporting. The Company measures its progress based on the level of completion of these output measures and recognizes the revenue related to output measures. Losses expected to be incurred, if any, on jobs in progress are charged to income as soon as such losses are known. Revenue earned on contracts in progress in excess of billings is classified as a current asset. Amounts billed in excess of revenue earned are classified as a current liability. Client projects are generally completed within a twelve-month period.29
The Company recognizes subscription-based educational service revenue over the period of time the service is provided. Generally, the subscription periods are for twelve months and revenue is recognized equally over the subscription period.The Company recognizes revenue on Market GuideTicker contracts upon its delivery to the principal customers. TheRevenue under some annual contracts which do not include monthly updates is fully recognized upon delivery, typically in the third quarter of the year. Starting in May 2008, the Company defersadded subscription-based services, the revenue from which is generally recognized on a monthly basis over a twelve-month period. Until September 2008, the Company deferred costs of preparing the survey data for Market Guide.Ticker and expensed these at the time the annual contract revenue was recognized. These costs are primarily incremental external direct costs solely related to fulfilling the Company’s obligations under Market GuideTicker contracts. The Company expensesBeginning in October 2008, these deferred costs at the time revenue is recognized. The Company monitors and assesses the recoverability of the deferred direct costs based on contracted revenue and whenever changes in circumstances warrant such assessment.are expensed monthly as incurred. The Company generates additional revenue from incidental customers subsequent to the completion of each monthly edition. Revenue and costs for these subsequent services are recognized as the customization services are performed and completed.Trade Accounts ReceivableTrade accounts receivable are recorded at the invoiced amount. The allowance for doubtful accounts is the Company’s best estimate of the amount of probable credit losses in the Company’s existing accounts receivable. The Company determines the allowance based on specific account analysis and on the Company’s historical write-off experience. The Company reviews the allowance for doubtful accounts monthly. Past due balances over 90 days and over a specified amount are reviewed individually for collectability and provisions are made for accounts not specifically reviewed. Account balances are charged off against the allowance after all means of collection have been exhausted and the potential for recovery is considered remote.
Property and EquipmentProperty and equipment is stated at cost. Major expenditures to purchase property or to substantially increase useful lives of property are capitalized. Maintenance, repairs and minor renewals are expensed as incurred. When assets are retired or otherwise disposed of, their costs and related accumulated depreciation are removed from the accounts and resulting gains or losses are included in income.For costs of software developed for internal use, the Company expenses computer software costs as incurred in the preliminary project stage, which involves the conceptual formulation, evaluation and selection of technology alternatives. Costs incurred related to the design, coding, installation and testing of software during the application project stage are capitalized. Costs for training and application maintenance are expensed as incurred. The Company has capitalized approximately $511,000, $803,000$450,000, $493,000 and $680,000,$511,000, of internal and external costs incurred for the development of internal use software for the years ended December 31, 2007, 20062009, 2008 and 2005,2007, respectively, with such costs classified as property and equipment.
30
The Company provides for depreciation and amortization of property and equipment using annual rates which are sufficient to amortize the cost of depreciable assets over their estimated useful lives. The Company uses the straight-line method of depreciation and amortization over estimated useful lives of five to ten years for furniture and fixtures,equipment, three to five years for computer equipment, three to five years for capitalized software, and fifteenten to forty years for the Company’s office building.building and related improvements.
Impairment of Long-Lived AssetsIn accordance with Statement of Financial Accounting Standards (“SFAS”) No. 144,Accounting for the Impairment or Disposal of Long-Lived Assets, the
The Company monitors events and changes in circumstances that may require the Company to review the carrying value of its long-lived assets. The Company assesses the recoverabilitywhether an impairment of its long-lived assets based on estimatedheld and used may have occurred using undiscounted future operating cash flows. Impairments, if they occur, are measured using the fair value of the assets. The assessment of the recoverability of long-lived assets willmay be adversely impacted if estimated future operating cash flows are not achieved.30
The Company assesses the impairment of long-lived assets whenever events or changes in circumstances indicate that the carrying value of such assets may not be recoverable. ManagementAmong others, management believes the following circumstances are important indicators of potential impairment of such assets and as a result may trigger an impairment review:Significant underperformance in comparison to historical or projected operating results;
Significant changes in the manner or use of acquired assets or the Company’s overall strategy;· Significant underperformance in comparison to historical or projected operating results;
Significant negative trends in the Company’s industry or the overall economy;
A significant decline in the market price for the Company’s common stock for a sustained period; and· Significant changes in the manner or use of acquired assets or the Company’s overall strategy;
The Company's market capitalization falling below the book value of the Company’s net assets.
· Significant negative trends in the Company’s industry or the overall economy;
· A significant decline in the market price for the Company’s common stock for a sustained period; and
· The Company’s market capitalization falling below the book value of the Company’s net assets.
Goodwill and Intangible AssetsIntangible assets include customer relationships, trade namenames and goodwill. Customer relationships are being amortized over periods of five to fifteen years. One of the trade names is being amortized over a period of ten years. The other trade name is indefinite lived. Goodwill represents the difference between the purchase price paid in acquisitions, using the purchase method of accounting, and the fair value of the net assets acquired.Goodwill and intangible assets acquired in a purchase business combination and determined to have an indefinite useful life are not amortized, but instead are tested for impairment at least annually in accordance with the provisions of SFAS No. 142,Goodwill and Other Intangible Assets.. Intangible assets with estimable useful lives are amortized over their respective estimated useful lives to their estimated residual values and reviewed for impairment in accordance with SFAS No. 144.impairment.All of the Company’s goodwill is allocated to onefive of its six reporting unit, the healthcare services business.units. As of December 31, 2007,2009, the Company has net goodwill of $31$39.9 million. As of October 1 of each year (or more frequently as changes in circumstances indicate), the Company evaluatestests goodwill for impairment using level 3 inputs as defined in the estimated fair value hierarchy. Refer to Note 1, Fair Value Measurements, for the definition of the Company’s goodwill.levels in the fair value hierarchy. The inputs used to calculate the fair value included the projected cash flows and a discount rate that the Company estimated would be used by a market participant in valuing these assets. On these evaluation dates, to the extent that the carrying value of the net assets of the Company’s reporting unitunits having goodwill is greater than the estimated fair value, impairment charges will be recorded. The Company’s analysis has not resulted in the recognition of an impairment loss on goodwill in 2007, 2006 or 2005.Investments in Marketable Debt Securities
All marketable debt securities held by the Company at December 31, 2007determined and 2006, were classified as available-for-sale and recorded at fair market value. Unrealized holding gains and losses, net of the related tax effect, on available-for-sale securities are reported as other comprehensive income or loss. Realized gains and losses from the sale of available-for-sale securities are determined on a specific-identification basis. Fair values are estimatedmeasured based on quoted market prices. Interest income is recognized when earned.
A decline in the marketestimated fair value of any available-for-sale security below cost that is deemedgoodwill as compared to be other-than-temporary results in a reduction inits carrying amount to fair value. The impairment is charged to earnings and a new cost basis for the security is established. To determine whether an impairment is other-than-temporary, the Company considers whether it has the ability and intent to hold the investment until a market price recovery and considers whether evidence indicating the cost of the investment is recoverable outweighs evidence to the contrary. Evidence considered in this assessment includes the reasons for the impairment, the
31
severity and duration of the impairment, changes in value subsequent to year-end, and forecasted performance of the investee. The Company’s analysis has not resulted in the recognition of an impairment loss on investments in 2007, 2006 or 2005.
Income TaxesThe Company uses the asset and liability method of accounting for income taxes. Under that method, deferred income tax assets and liabilities are recognized for the future tax consequences attributable to differences between the financial statement carrying amounts of existing assets and liabilities and their respective tax basis using enacted tax rates. The effect on deferred tax assets and liabilities of a change in tax rates is recognized in income in the period that includes the enactment date. Valuation allowances, if any, are established when necessary to reduce deferred tax assets to the amount that is more likely than not to be realized.Share-Based Compensation
Effective January 1, 2006, The Company uses the deferral method of accounting for its investment tax credits related to state tax incentives. During the years ended December 31, 2009, 2008 and 2007, the Company adopted SFAS No. 123Rrecorded income tax benefits relating to these tax credits of $189,000, $0, and $0.
The Company recognizes the effect of income tax positions only if those positions are more likely than not of being sustained. Recognized income tax positions are measured at the largest amount that is greater than 50% likely of being realized. Changes in recognition or measurement are reflected in the period in which the change in judgment occurs.The Company had an unrecognized tax benefit at December 31, 2009 of $541,000, excluding interest of $3,000 and no penalties. Of this amount $78,000 represents the net unrecognized tax benefits that, if recognized, would favorably impact the effective income tax rate. The Company accrues interest and penalties related to uncertain tax position in the statements of income as income tax expense. The Company is not subject to tax examinations for years prior to 2006 in the U.S. and 2005 in Canada.
Share-Based Payment (“SFAS No. 123R”) under the modified version of the prospective transition method. Under the modified prospective transition method,CompensationThe Company measures and recognizes compensation costexpense for all share-based payments. The compensation expense is recognized on or after the required effective date for the portion of the outstanding awards for which the requisite service has not yet been rendered, based on the grant dategrant-date fair value of those awards calculated under SFAS No. 123R for either recognition or pro forma disclosures.awards. All of the Company’s existing stock option awards and non-vested stock awards have been determined to be equity awards in accordance with SFAS No. 123R. There was no cumulative effect of initially adopting SFAS No. 123R.The Company currently intends that shares of common stock issued upon the exercise of options will be newly-issued shares. No share-based compensation costs were capitalized for the twelve-month periods ended December 31, 2007 and 2006. equity-classified awards.
Amounts recognized in the financial statements with respect to these plans under SFAS No. 123R are as follows:2007
2006
(in thousands) (in thousands) Amounts charged against income, $ 1,252 $ 1,023 before income tax benefit Amount of related income tax benefit 483 399
Total net income impact $ 769 $ 624
plans:
2009 2008 2007 (In thousands) Amounts charged against income, before income tax benefit $ 619 $ 1,016 $ 1,093 Amount of related income tax benefit 238 391 421 Total net income impact $ 381 $ 625 $ 672
Cash and Cash EquivalentsFor purposes of the statements of cash flows, the Company considers all highly liquid investments with original maturities of three months or less to be cash equivalents. Cash equivalents were $2.5 million consisting of U.S. government notes of $1.6 million and money market funds of $930,000 as of December 31, 2009, and $379,000 of money market funds as of December 31, 2008.
32
Fair Value MeasurementsThe Company’s valuation techniques are based on maximizing observable and unobservable inputs and minimizing the use of unobservable inputs when measuring fair value. Observable inputs reflect readily obtainable data from independent sources, while unobservable inputs reflect the Company’s market assumptions. The inputs are then classified into the following hierarchy: (1) Level 1 Inputs—quoted prices in active markets for identical assets and liabilities, (2) Level 2 Inputs—observable market-based inputs other than Level 1 inputs, such as quoted prices for similar assets or liabilities in active markets; quoted prices for similar or identical assets or liabilities in markets that are not active; or other inputs that are observable or can be corroborated by observable market data, (3) Level 3 Inputs—unobservable inputs.
As of December 31, 2007, cash equivalents were $194,000 consisting of money market funds.Fair Value of Financial Instruments
The carrying value of financial instruments included in2009, those assets and liabilities that are measured at fair value on a recurring basis consisted of the following:
Level 1 Level 2 Level 3 (In thousands) Money Market Funds $ 930 $ — $ — U.S. government notes — 1,560 — Total $ 930 $ 1,560 $ —
The Company believes that the carrying amounts of its other financial instruments, including cash, accounts payable and accrued expenses, approximate their fair value due to the short-term maturities of these instruments. All non-financial assets and liabilities that are not recognized or disclosed at fair value in the accompanying consolidated balance sheets approximates theirfinancial statements on a recurring basis, which includes goodwill and non-financial long lived assets, are measured at fair value.value in certain circumstances (for example, when there is evidence of impairment). As of December 31, 2009, there was no indication of impairment related to our non-financial assets and liabilities. Refer to Note 1, Goodwill and Intangible Assets, for further description of the inputs used to measure fair value of goodwill as part of our annual impairment test.
Earnings Per ShareNet income per share has been calculated and presented for “basic” and “diluted” per share data. Basic net income per share is computed by dividing net income by the weighted average number of common shares outstanding. Diluted income per share is computed by dividing net income by the weighted average number of common shares adjusted for the dilutive effects of options and restricted stock. At December 31, 2007, 20062009, 2008 and 2005,2007, the Company had 48,000,247,603, -0- and 9,43948,000 options, respectively, which have been excluded from the diluted net income per share computation because their exercise price exceeds the fair market value.32
The weighted average shares outstanding were calculated as follows:2007
2006
2005
Common stock 6,849,717 6,836,456 7,037,896 Dilutive effect of options 131,036 91,885 61,511 Dilutive effect of restricted stock 30,518 25,623 18,630
Weighted average shares used for dilutive per share information 7,011,271 6,953,964 7,118,037
2009 2008 2007 (In thousands) Common stock 6,637 6,685 6,850 Dilutive effect of options 74 131 131 Dilutive effect of restricted stock 12 15 30 Weighted average shares used for dilutive per share information 6,723 6,831 7,011
There are no reconciling items between the Company’s reported net income and net income used in the computation of basic and diluted income per share.Accumulated
33
Comprehensive IncomeComprehensive income consists of net income and other comprehensive income (loss). Other Comprehensive IncomeThe components ofcomprehensive income (loss) refers to revenue, expenses, gains and losses that are not included in net income, but rather are recorded directly in stockholder’s equity. For the years ended December 31, 2009 and 2008 accumulated other comprehensive income were(loss) was $769,000 and ($6,000), respectively, consisting solely of changes in the cumulative translation adjustment.
Segment Information
The Company has six operating segments that are aggregated into one reporting segment because they have similar economic characteristics and meet the other aggregation criteria within the authoritative guidance on disclosure about enterprise segments. The six operating segments are as follows:2007
2006
2005
(in thousands) Net income, as reported $ 6,839 $ 5,884 $ 5,236
Other comprehensive income: Unrealized gain (loss) from investments: Unrealized gains 7 112 3 Related tax (expense) benefit (3 ) (44 ) 1
Net 4 68 4 Foreign currency translation 569 (9 ) 76
Total other comprehensive income 573 59 80
Comprehensive income $ 7,412 $ 5,943 $ 5,316
NRC Picker U.S. and NRC Picker Canada, which each offer renewable performance tracking and improvement services, custom research, best practice improvement services, and a renewable syndicated service; Healthcare Market Guide (Ticker) offers stand-alone market information as well as a comparative performance database to allow the Company’s clients to assess their performance relative to the industry, to access best practice examples, and to utilize competitive information for marketing purposes; Payer Solutions offers functional disease-specific and health status measurement tools; The Governance Institute (TGI) offers subscription-based governance information and educational conferences designed to improve the effectiveness of hospital and healthcare systems by continually strengthening their healthcare boards, medical leadership, and management performance in the United States; and My InnerView (MIV) provides quality and performance improvement solutions to the senior care profession.
Adoption of New Accounting PronouncementsIn February 2006, theJune 2009, FASB issued SFAS No. 155,the Accounting for Certain Hybrid Financial Instruments— An AmendmentStandards Codification™ (“Codification”) as the source of authoritative U.S. generally accepted accounting principles (“GAAP”) recognized by FASB Statements No. 133to be applied by nongovernmental entities. The Codification supersedes all then-existing non-SEC accounting and 140. SFAS No. 155 amends SFAS No. 133,Accounting for Derivative Instruments and Hedging Activities, and SFAS No. 140,Accounting for Transfer and Servicing of Financial Assets and Extinguishments of Liabilities, and eliminatesreporting standards. In accordance with the exemption from applying SFAS No. 133Codification, references to interestsaccounting literature in securitized financial assets so that similar itemsthis report are accounted forpresented in plain English. The Codification did not change GAAP, but reorganizes the same way.literature. The provisions of SFAS No. 155 areCodification is effective for all financial instruments acquired by a company orstatements issued after the beginning of its first fiscal year that beginsfor interim and annual periods ending after September 15, 2006.2009. The adoption of SFAS No. 155the Codification has not had no effectan impact on the consolidated financial statements.Recent Accounting PronouncementsIn March 2006,September 2009, the FASB issued SFAS No. 156,Accountingnew guidance for Servicingrevenue recognition with multiple deliverables, which is effective for revenue arrangements entered into or materially modified in fiscal years beginning on or after June 15, 2010, although early adoption is permitted. This guidance eliminates the residual method under the current guidance and replaces it with the “relative selling price” method when allocating revenue in a multiple deliverable arrangement. The selling price for each deliverable shall be determined using vendor specific objective evidence of Financial Assets— An Amendmentselling price, if it exists, otherwise third-party evidence of FASB Statement No. 140. SFAS No. 156 amends SFAS No. 140,Accountingselling price. If neither exists for Transfers and Servicing of Financial Assets and Extinguishments of Liabilities, and requires that all separately recognized servicing assets and servicing liabilities be initially measured at fair value, if practicable. The provisions of SFAS No. 156 are effective asa deliverable, the vendor shall use its best estimate of the beginningselling price for that deliverable. After adoption, this guidance will also require expanded qualitative and quantitative disclosures. As of a company’s first fiscal year that begins after September 15, 2006. The adoption of SFAS No. 156 had no effect on the consolidated financial statements.In June 2006, the FASB issued FASB Interpretation No. 48 (“FIN 48”),Accounting for Uncertainty in Income Taxes— An Interpretation of FASB Statement No. 109. FIN 48 prescribes a recognition threshold and measurement process for recording in the financial statements uncertain tax positions taken or expected to be taken in a tax return. Additionally, this interpretation provides guidance on the derecognition, classification, accounting in interim periods and disclosure requirements for uncertain tax positions. The provisions of FIN 48 were effective for us on January 1, 2007. The adoption of FIN 48 had no effect on the consolidated financial statements.
33
In September 2006, the FASB issued SFAS No. 157,Fair Value Measurements. SFAS No. 157 defines fair value, establishes a framework for measuring fair value in generally accepted accounting principles (GAAP), and expands disclosures about fair value measurements. The provisions of SFAS No. 157 are effective as of the beginning of a company’s first fiscal year that begins after November 15, 2007. ManagementDecember 31, 2009, management believes that adoption of SFAS No. 157this new guidance will not have a material effect on the consolidated financial statements.
In February 2008, the FASB issued FASB Staff Position (FSP) Financial Accounting Standard (FAS) 157-1,Application of FASB Statement No. 157 to FASB Statement No. 13 and Its Related Interpretive Accounting Pronouncements That Address Leasing Transactions, and FSP FAS 157-2,Effective Date of FASB Statement No. 157. FSP FAS 157-1 removes leasing from the scope of SFAS No. 157,Fair Value Measurements. FSP FAS 157-2 delays the effective date of SFAS No. 157 from 2008 to 2009 for all non-financial assets and non-financial liabilities, except those that are recognized or disclosed at fair value in the financial statements on a recurring basis (at least annually). Management believes that adoption of SFAS No. 157-1 and 157-2 will not have a material effect on the consolidated financial statements.
In February 2007, the FASB issued SFAS No. 159,The Fair Value Option for Financial Assets and Financial Liabilities including an amendment of FASB Statement No. 115. This statement permits entities to choose to measure many financial instruments and certain other items at fair value. The provisions of SFAS No. 159 are effective as of the beginning of a company’s first fiscal year that begins after November 15, 2007. Management believes that adoption of SFAS No. 159 will not have a material effect on the consolidated financial statements.
In June 2007, the FASB ratified the consensus reached by the Emerging Issues Task Force (EITF) in EITF Issue No. 07-3,Accounting for Nonrefundable Advance Payments for Goods or Services Received for Use in Future Research and Development Activities (EITF 07-3), which requires that nonrefundable advance payments for goods or services that will be used or rendered for future research and development activities be deferred and amortized over the period that the goods are delivered or the related services are performed, subject to an assessment of recoverability. EITF 07-3 is effective as of the beginning of a company’s first fiscal year that begins after December 15, 2008. Management believes that adoption of EITF 07-3 will not have a material effect on the consolidated financial statements.
In December 2007, the FASB issued SFAS No. 141(R),Business Combinations (“SFAS 141(R)”), which replaces FAS 141. SFAS 141(R) establishes principles and requirements for how an acquirer in a business combination recognizes and measures in its financial statements the identifiable assets acquired, the liabilities assumed, and any controlling interest; recognizes and measures the goodwill acquired in the business combination or a gain from a bargain purchase; and determines what information to disclose to enable users of the financial statements to evaluate the nature and financial effects of the business combination. FAS 141(R) is to be applied prospectively to business combinations for which the acquisition date is on or after an entity’s fiscal year that begins after December 15, 2008. Management will assess the impact of SFAS 141(R) if and when a future acquisition occurs.
34
(2) Acquisitions
On May 30, 2006,December 19, 2008, the Company acquired substantially allMy InnerView, Inc. (“MIV”), a leading provider of the assets of TGI Group, LLC, operating as The Governance Institute (“TGI”). TGI provides board members, executive managementquality and physician leaders of hospitals and health systems with knowledge andperformance improvement solutions to successfully confront a wide array of strategic issues. TGI operations have been includedthe senior care profession. MIV offers resident, family and employee satisfaction measurement and improvement products to the long term-care, assisted and independent living markets in the United States. MIV works with over 8,000 senior care providers throughout the United States, housing what the Company believes is the largest dataset of senior care satisfaction metrics in the nation. The acquisition was completed in order to pursue the Company’s consolidated financial statements sincestrategy of expanding additional service offerings to the datehealthcare industry in the United States and Canada. This acquisition gives the Company a foundation upon which to expand in the senior care profession. The consideration paid at closing for MIV included a payment of acquisition. The purchase price for TGI was $19.8$11.5 million in cash plusand $440,000 of direct expenses capitalized as purchase price. The merger agreement under which the assumption of certain liabilities. The Company paid $17.8 million in cash to the seller at closingacquired MIV provided for contingent earn-out payments over three years based on revenue and $1.95 million into an escrow account. The escrow account was released twelve months fromoperating income increases.In connection with the acquisition date. Thethe Company recorded direct acquisition costs of $305,000.34
The Company has allocated the following amounts as its preliminary purchase price as follows,allocation, based on the estimated fair value of the assets acquired and liabilities assumed at the date of acquisition:
Fair Value
Current assets $ 730,804 Property and equipment 67,573 Customer relationships 2,694,000 Trade name 1,572,000 Goodwill 18,221,635
Total acquired assets 23,286,012 Less total liabilities assumed 3,201,691
Net assets acquired $ 20,084,321
Of the $22,487,635 of acquired intangible assets, $2,694,000 was assigned to customer relationships and $1,572,000 was assigned to a trade name.
Fair Value (In thousands) Current Assets $ 1,290 Property and equipment 846 Customer relationships 3,003 Goodwill 8,833 Other Long Term Assets 581 Total acquired assets 14,553 Less total liabilities 2,613 Net assets acquired $ 11,940
The excess of purchase price over the fair value of net assets acquired resulted in the Company recording $18,221,635$8.8 million of goodwill. The customer relationships acquired intangible asset is being amortized over a useful life of 10 years. The amortization of customer relationships the trade name and goodwill is expected to be deductiblenon-deductible for tax purposes.During the year ended December 31, 2009, the Company adjusted the initial purchase price allocation resulting in a net increase to goodwill of $240,000, which was due to additional contingent consideration earned of $795,000, deferred tax adjustments of $630,000, and allowance for doubtful accounts of $75,000.The following unaudited pro forma information for the Company has been prepared as if the acquisition of TGIMIV had occurred on January 1, 2006.2007. The information is based on the historical results of the separate companies and may not necessarily be indicative of the results that could have been achieved or of results that may occur in the future.2006
(In thousands,
except per share
amounts)
(Unaudited ) Revenue $ 46,812 Net income $ 6,274 Earnings per share - basic $ 0.92 Earnings per share - diluted $ 0.90
(3)Investments in Marketable Debt Securities
The Company’s investments in marketable securities are in marketablepro forma adjustments include the impact of depreciation and amortization of property and equipment and intangible assets acquired, interest expense on the acquisition debt, securities classified as obligations of U.S. government agencies. The amortized cost, gross unrealized holding gains and losses and fair valueincome tax benefits for tax effects of the Company’s investment in the obligations of U.S. government agencies as of December 31, 2007foregoing adjustments to depreciation, amortization and 2006, were as follows:
2007
2006
Amortized cost $ 99,714 $ 1,116,963 Gross unrealized holding gains 0 2,727 Gross unrealized holding losses (217 ) (9,586 )
Fair value $ 99,497 $ 1,110,104
35
In May 2006, the Company sold $5.6 million of marketable debt securities in advance of their scheduled maturities to partially fund the purchase of TGI. The Company recognized a loss of $46,000 on these securities sold in advance of their scheduled maturities. There were no sales of marketable debt securities in advance of scheduled maturities of available-for-sale marketable debt securities during 2007. The fair value and amortized cost of marketable debt securities at December 31, 2007, by contractual maturity, are shown below. Actual maturities may differ from the contractual maturities because borrowers may have the right to call or prepay obligations with or without call or prepayment penalties.
At December 31, 2007
Fair
Value
Amortized
Cost
Due after three months through one year $ -- $ -- Due after one year through five years 99,497 99,714
$ 99,497 $ 99,714
Gross unrealized losses on investment securities and the fair value of the related securities, aggregated by investment category and length of time that individual securities have been in a continuous unrealized loss position, at December 31, 2007, were as follows:
Less than 12 months
12 months or more
Total
Unrealized
Losses
Fair
Value
Unrealized
Losses
Fair
Value
Unrealized
Losses
Fair
Value
Available for Sale: Certificate of Deposit -- -- $ (217 ) $ 99,497 $ (217 ) $ 99,497
The contractual term of this investment does not permit the issuer to settle the security at a price less than the amortized cost of the investment. Because the Company has the ability and intent to hold this investment until a market price recovery or maturity, these investments are not considered other-than-temporarily impaired.
2008 2007 (In thousands, except per share amounts)(Unaudited) Revenue $ 58,008 $ 54,904 Net income $ 7,457 $ 6,586 Earnings per share - basic $ 1.12 $ 0.96 Earnings per share - diluted $ 1.09 $ 0.94
(4)(3)Property and Equipment
At December 31, 20072009 and 2006,2008, property and equipment consisted of the following:2007
2006
Furniture and equipment $ 2,350,644 $ 2,266,347 Computer equipment and software 12,788,061 11,312,691 Building 9,108,247 8,651,441 Land 425,000 425,000
24,671,952 22,655,479 Less accumulated depreciation and amortization 12,697,923 10,939,546
Net property and equipment $ 11,974,029 $ 11,715,933
36
2009 2008 (In thousands) Furniture and equipment $ 2,639 $ 2,536 Computer equipment and software 16,911 14,467 Building 9,130 9,108 Land 425 425 29,105 26,536 Less accumulated depreciation and amortization 15,130 12,789 Net property and equipment $ 13,975 $ 13,747
(5)(4)Goodwill and Intangible Assets
Goodwill and intangible assets consisted of the following at December 31, 20072009 and 2006:2007
2006
Goodwill $ 31,051,202 $ 30,014,337
Non-amortizing other intangible assets: Trade name 1,190,559 1,190,559 Amortizing other intangible assets: Customer related intangibles 4,922,275 4,870,497 Trade name 1,572,000 1,572,000
Total other intangible assets, 7,684,834 7,633,056 Less accumulated amortization 2,068,924 1,159,412
Other intangible assets, net $ 5,615,910 $ 6,473,644
2008:
2009 2008 (In thousands) Goodwill $ 39,924 $ 39,276 Non-amortizing other intangible assets: Trade name 1,191 1,191 Amortizing other intangible assets: Customer related intangibles 8,174 8,150 Trade name 1,572 1,572 Total other intangible assets, 10,937 10,913 Less accumulated amortization 4,054 2,857 Other intangible assets, net $ 6,883 $ 8,056
36
The following represents a summary of changes in the Company’s carrying amount of goodwill for the years ended December 31, 2009, 2008, and 2007: (In thousands) Balance as of December 31, 2006 $ 30,014 Smaller World additional payment for contingent consideration 652 Foreign currency translation 385 Balance as of December 31, 2007 $ 31,051 MIV acquisition 8,833 Foreign currency translation (608 ) Balance as of December 31, 2008 $ 39,276 Foreign currency translation 408 MIV deferred tax adjustments (630 ) MIV allowance for doubtful accounts 75 MIV contingent consideration earned 795 Balance as of December 31, 2009 $ 39,924
The merger agreement under which the Company acquired MIV provided for contingent earn-out payments over three years based on growth in revenue and earnings. As of December 31, 2009, a contingent earn-out payment of $795,000 was accrued, which was then paid in February 2010.During 2007, an additional payment was made to Smaller World Communications for contingent consideration in accordance with the purchase agreement. The purchase agreement included two scheduled payments of additional purchase price in 2006 and 2006:Balance as of January 1, 2006 $ 11,483,401 GHS adjustment - deferred taxes 257,001 TGI acquisition 18,221,635 Smaller World additional payment 52,068 Foreign currency translation 232
Balance as of December 31, 2006 $ 30,014,337 Smaller World additional payment 651,725 Foreign currency translation 385,140
Balance as of December 31, 2007 $ 31,051,202
2008 of $536,000 and $714,000 respectively, as a result of meeting certain revenue goals.
On April 1, 2008, approximately 10 customer contracts were purchased from SQ Strategies for $249,000. The change in the carrying amountrecording of goodwill andthis purchase increased customer related intangibles by $260,000 and deferred revenues by $11,000.Aggregate amortization expense for customer related intangibles and trade names for the year ended December 31, 2007, included the impact of the foreign currency translation and the additional purchase price for the Smaller World acquisition. Customer related intangibles consisted of customer relationships and surveys, which are being amortized over their estimated useful lives of five to fifteen years. Aggregate amortization expense for customer relationships/surveys for the year ended December 31, 2007,2009, was $864,000.$1.2 million. Estimated amortization expense for the next five years is: 2010—$1.2 million; 2011—$1.1 million; 2012—$836,000; 2013—$572,000; 2014—$543,000; thereafter $1.5 million.(5) Income TaxesFor the years ended December 31, 2009, 2008, — $805,000; 2009 — $795,000; 2010 — $795,000; 2011 — $766,000; 2012 — $470,000.and 2007, income before income taxes consists of the following: 2009 2008 2007 U.S. Operations $ 11,497 $ 10,406 $ 9,664 Foreign Operations 1,620 1,577 1,453 $ 13,117 $ 11,983 $ 11,117
37
37
(6)Income Taxes
Income tax expense consisted of the following components:Current
Deferred
Total
2007: Federal $ 2,971,325 $ 65,159 $ 3,036,484 Foreign 587,658 (20,870 ) 566,788 State 602,751 72,349 675,100
Total $ 4,161,734 $ 116,638 $ 4,278,372
2006: Federal $ 2,683,441 $ 109,575 $ 2,793,016 Foreign 234,340 (20,929 ) 213,411 State 604,718 10,542 615,260
Total $ 3,522,499 $ 99,188 $ 3,621,687
2005: Federal $ 2,231,717 $ 238,868 $ 2,470,585 Foreign 286,573 (18,894 ) 267,679 State 494,669 45,437 540,106
Total $ 3,012,959 $ 265,411 $ 3,278,370
Current Deferred Total 2009: Federal $ 2,433 $ 1,109 $ 3,542 Foreign 532 3 535 State (21 ) 570 549 Total $ 2,944 $ 1,682 $ 4,626 2008: Federal $ 2,963 $ 350 $ 3,313 Foreign 549 (5 ) 544 State 596 85 681 Total $ 4,108 $ 430 $ 4,538 2007: Federal $ 2,971 $ 65 $ 3,036 Foreign 588 (21 ) 567 State 603 72 675 Total $ 4,162 $ 116 $ 4,278
The difference between the Company’s income tax expense as reported in the accompanying consolidated financial statements and the income tax expense that which would be calculated applying the U.S. federal income tax rate of 34% on pretax income was as follows:2007
2006
2005
Expected federal income taxes $ 3,779,911 $ 3,231,957 $ 2,894,917 Foreign tax rate differential 30,966 23,492 30,674 State income taxes, net of federal benefit and credits 445,567 406,072 356,470 Tax credits and incentives (51,488 ) (36,938 ) (34,980 ) Other 73,416 (2,896 ) 31,289
Total $ 4,278,372 $ 3,621,687 $ 3,278,370
2009 2008 2007 Expected federal income taxes $ 4,460 $ 4,074 $ 3,780 Foreign tax rate differential (16 ) (8 ) 31 State income taxes, net of federal benefit and state tax credits 362 449 446 Federal tax credits (183 ) (51 ) (51 ) Uncertain tax positions 27 — — Valuation allowance 18 — — Other (42 ) 74 73 Total $ 4,626 $ 4,538 $ 4,278
38
38
Deferred tax assets and liabilities at December 31, 20072009 and 2006,2008, were comprised of the following:2007
2006
Deferred tax assets: Allowance for doubtful accounts $ 27,383 $ 17,278 Accrued expenses 204,280 186,523 Stock based compensation 827,523 389,530 Other -- 34,784
Gross deferred tax assets 1,059,186 628,115
Deferred tax liabilities: Prepaid expenses 164,652 147,635 Basis in property and equipment 985,066 1,109,895 Intangible assets 1,958,647 1,309,998 Other 9,904 -- Gross deferred tax liabilities 3,118,269 2,567,528
Net deferred tax liabilities $ (2,059,083 ) $ (1,939,413 )
The Company did not record a valuation allowance for its
2009 2008 Deferred tax assets: Allowance for doubtful accounts $ 105 $ 93 Accrued expenses 248 231 Share based compensation 1,034 892 Other — 83 Gross deferred tax assets 1,387 1,299 Less Valuation Allowance (47 ) — Deferred tax assets 1,340 1,299 Deferred tax liabilities: Prepaid expenses 188 243 Property and equipment 1,602 1,263 Intangible assets 4,282 3,762 Other 296 — Deferred tax liabilities 6,368 5,268 Net deferred tax liabilities $ (5,028 ) $ (3,969 )
In assessing the realizablility of deferred tax assets, because management believes thatthe Company considers whether it is more likely than not that some portion or all of the deferred tax assets will not be realized. The ultimate realization of deferred tax assets is dependent upon the generation of future taxable income during the periods in which those temporary differences become deductible. The Company considers projected future taxable income, carryback opportunities and tax planning strategies in making this assessment. Based upon the level of historical taxable income and projections for future taxable income over the periods which the deferred tax assets are deductible, the Company believes it is more likely than not that it will generate sufficient taxablerealize the benefits of these deductible differences, net of the valuation allowance recorded. The net impact on income tax expense related to fully realize these deferredchanges in the valuation allowance for 2009 and 2008 were $18,000 and $0, respectively. The current year change relates to increases to the valuation allowance for capital loss carryforwards.
The Company has capital loss carryforwards of $123,000 which will begin to expire in 2010. A total of $76,000 of the capital loss carryforwards relate to the pre-acquisition periods of acquired companies. The Company has provided a $47,000 valuation allowance against the tax benefits.benefit associated with the capital loss carryforwards.
The undistributed foreign earnings of the Company’s foreign subsidiary of approximately $2.4$4.1 million are considered to be indefinitely reinvested. Accordingly, no provision for U.S. federal and state income taxes or foreign withholding taxes have been provided for such undistributed earnings. It is impractical to determine the additional income tax liability, if any, associated with the repatriation of undistributed earnings.
Effective January 1, 2007, the Company adopted guidance regarding accounting for uncertainty in income taxes. This accounting standards adoption had no impact on the Company. The unrecognized tax benefit at December 31, 2009 was $541,000, excluding interest of $3,000 and no penalties. Of this amount $78,000 represents the net unrecognized tax benefits that, if recognized, would favorably impact the effective income tax rate.
The Company accrues interest and penalties related to uncertain tax position in the statements of income as income tax expense.
39
The Company believes it is reasonably possible that the total amount of unrecognized tax benefits will not decrease within the next 12 months.
The change in the unrecognized tax benefits for 2009 is as follows. There was no change in unrecognized tax benefits during 2008. (In thousands) Balance of unrecognized tax benefits at December 31, 2008 $ — Increases for tax positions established during prior years 509 Increases for tax positions established for the current period 32 Balance of unrecognized tax benefits at December 31, 2009 $ 541
The Company files a U.S. federal income tax return, various state jurisdictions and a Canada federal and provincial income tax return. The 2006 to 2009 U.S. federal and state returns remain open to examination. The 2005 to 2009 Canada federal and provincial income tax returns remain open to examination.
(7)(6)Notes Payable
Notes payable consisted of the following:2007
2006
Note payable to US Bank, interest 7.21% fixed rate, scheduled principal payment ranging from $88,000 - $94,000, final payment of interest and principal due May 31, 2013, secured by land, building, accounts receivable and intangibles 2,993,352 8,697,973 Credit facility with US Bank, subject to borrowing base of 75% of eligible accounts receivable, matures July 31, 2008, maximum available $3.5 million -- 2,395,000
Total Notes Payable 2,993,352 11,092,973 Less current portion 1,092,754 3,110,106
Note payable, net of current portion $ 1,900,598 $ 7,982,867
2009 2008 (In thousands) Note payable to US Bank, interest 5.2% fixed rate, 35 scheduled principal and interest payments of $97,000, final balloon payment of interest and principal due December 31, 2011, secured by land, building, accounts receivable and intangible assets. 7,659 9,000 Revolving credit note with US Bank, subject to borrowing base of 75% of eligible accounts receivable, matures July 31, 2010, maximum available $6.5 million — 3,850 Capital leases 60 90 Other debt — 15 Total notes payable 7,719 12,955 Less current portion 816 4,581 Note payable, net of current portion $ 6,903 $ 8,374
On May 26, 2006, the Company entered into a credit facility pursuant to which it borrowed $9.0 million under a term note and $3.5 million under a revolving credit note in order to partially finance the acquisition of TGI. The term note is payable pursuant towas refinanced on February 25, 2008, for the credit facility in 83 equal installmentsremaining balance of $106,000, with the balanceterm note of $1.6 million. The refinanced term note required payments of principal and interest payable on Mayin 17 monthly installments of $93,000 beginning March 31, 2013.2008, and ending August 31, 2009. Borrowings under the refinanced term note bearbore interest at aan annual rate of 7.21% per year.5.14%. The revolving creditCompany made additional payments and paid off the term note provides a revolving credit facility that matures on July 31,in October 2008.
The maximum aggregate amount available under the revolving credit facilitynote was originally $3.5 million, but an addendum to the revolving credit note dated March 26, 2008, changed the revolving credit note amount to $6.5 million. The revolving credit note was renewed in July 2009 to extend the term to July 31, 2010. The Company may borrow, repay and re-borrow amounts under the revolving credit note from time to time until its maturity on July 31, 2010. The maximum aggregate amount available under the revolving credit note is $3.5$6.5 million, subject to a borrowing base equal to 75% of the Company’s eligible accounts receivable. The Company may borrow, repay and reborrow amounts under the revolving credit facility from time to time until its maturity on July 31, 2008. Borrowings under the revolving credit facilitynote bear interest at a variable rate equal to (1) prime (as defined in the credit facility) less 0.50%, or (2) one-, two-, three-, six- or twelve-month LIBOR. As of December 31, 2007,2009, the revolving credit note did not have a balance. According to borrowing base requirements, the Company had no borrowings outstandingthe capacity to borrow $4.2 million as of December 31, 2009.
40
On December 19, 2008, the Company borrowed $9.0 million under a term note to partially finance the acquisition of MIV. The term note is payable in 35 equal installments of $97,000, with the balance of principal and interest payable in a balloon payment due on December 31, 2011. Borrowings under the revolving credit note. Monthly installmentterm note bear interest at a rate of 5.2% per year. In 2009, the Company made principal payments, were madein addition to the monthly installments, on the term note in accordance with the credit facility. Also, additional pay downs on the loan were made with no prepayment penalties.39
totaling $650,000.
The credit facilityterm note is secured by certain of the Company’s assets, including the Company’s land, building, accounts receivable and intangibles.intangible assets. The credit facilityterm note contains various restrictions and covenants applicable to the Company, including requirements that the Company maintain certain financial ratios at prescribed levels and restrictions on the ability of the Company to consolidate or merge, create liens, incur additional indebtedness or dispose of assets. As of December 31, 2009, the Company was in compliance with these restrictions and covenants.
Debt acquired through the MIV acquisition included $90,000 in capital leases. The capital leases are for production and mailing equipment meeting capitalization requirements where the lease term exceeds more than 75% of the estimated useful life. The equipment is being depreciated over the lease term of 4.25 years ending in 2011.The aggregate maturities of the note payable and credit facility for each of the five years subsequent to December 31, 2007,2009, are: 2008 — $1,093,000; 2009 — $1,174,000; 2010 — $726,000; 2011 — $0; and 2012 — $0. TotalPayments 2010 2011 2012 2013 2014 (In thousands) Notes payable $ 7,659 $ 783 $ 6,876 $ — $ — $ —
(8)(7)Stock Option PlansShare-Based Compensation
The Company measures and recognizes compensation expense for all share-based payments. The compensation expense is recognized based on the grant-date fair value of those awards. All of the Company’s existing stock option awards and non-vested stock awards have been determined to be equity–classified awards.In August 2001, the Board of Directors adopted, and on May 1, 2002, the Company’s shareholders approved, the National Research Corporation 2001 Equity Incentive Plan (“2001 Equity Incentive Plan”). The 2001 Equity Incentive Plan provides for the granting of stock options, stock appreciation rights, restricted stock, performance shares and other share-based awards and benefits up to an aggregate of 600,000 shares of the Company’s common stock. Options granted may be either nonqualified or incentive stock options. Options vest over one to five years following the date of grant and option terms are generally five to ten years following the date of grant. At December 31, 2007,2009, there were 51,33278,417 shares available for issuance pursuant to future grants under the 2001 Equity Incentive Plan. The Company has accounted for grants of 548,668521,583 options under the 2001 Equity Incentive Plan using the date of grant as the measurement date for financial accounting purposes.In May 2004, the Board of Directors adopted, and on May 5, 2005, the Company’s shareholders approved the
41
The National Research Corporation 2004 Director Plan (the “2004 Director Plan”). The 2004 Director Plan is a nonqualified plan that provides for the granting of options with respect to 250,000 shares of the Company’s common stock. The 2004 Director Plan provides for grants of nonqualified options to each director of the Company who is not employed by the Company. In May 2004,On the date of each such director was granted an optionannual meeting of shareholders of the Company, options to purchase 11,00012,000 shares of the Company’s common stock. On the date of each subsequent Annual Meeting of Shareholders of the Company, each such director, ifstock are granted to directors that are re-elected or retained as a director at such meeting, is granted an optionmeeting. On May 7, 2009, the Board of Directors amended the plan to purchase 12,000increase the number of shares of common stock authorized for issuance under the plan from 250,000 to 550,000 shares, subject to approval of the Company’s common stock.shareholders at the 2010 annual meeting of shareholders. The grants of options to directors on the date of the 2009 annual meeting of shareholders was also made subject to approval of the Company’s shareholders at the 2010 annual meeting of shareholders. Given the ownership by the CEO and grantor retained annuity trusts that he established in February 2010, approval will be perfunctory. Options vest one year following the date of grant and option terms are generally ten years following the date of grant, or three years in the case of termination of the outside director.director’s service. At December 31, 2007,2009, pending shareholder approval of the increased number of shares at the 2010 annual meeting of shareholders, there were 73,000will be 277,000 shares available for issuance pursuant to future grants under the 2004 Director Plan. The Company has accounted for grants of 177,000 options under the 2004 Director Plan using the date of grant as the measurement date for financial accounting purposes.
In February 2006, the Board of Directors adopted, and on May 4, 2006, the Company’s shareholders approved the National Research Corporation 2006 Equity Incentive Plan (the “2006 Equity Incentive Plan”). The 2006 Equity Incentive Plan provides for the granting of options, stock appreciation rights, restricted stock, performance shares and other share-based awards and benefits up to an aggregate of 600,000 shares of the Company’s common stock. Options granted may be either incentive stock options or nonqualified stock options. Vesting terms vary with each grant, and option terms are generally five to ten years. Options vest over one to five years following the date of grant and options terms are generally five to ten years following the date of grant. At December 31, 2007,2009, there were 533,542427,057 shares available for issuance pursuant to future grants under the 2006 Equity Incentive Plan. The Company has accounted for grants of 66,458172,943 options under the 2006 Equity Incentive Plan using the date of grant as the measurement date for financial accounting purposes.The Company granted options to purchase 131,382, 128,862102,739, 118,475 and 130,688131,382 shares of the Company’s common stock during the years ended December 31, 2007, 20062009, 2008 and 2005,2007, respectively. Options to purchase shares of common stock were granted with exercise prices equal to the fair value of the common stock on the date of grant. The fair value of stock options granted was estimated using a Black-Scholes valuation model with the following assumptions:40
2007
2006
2005
Expected dividend yield at date of grant1.76-1.92%1.77-1.86%1.90-2.25%Expected stock price volatility22.7-29.9%25.0-39.0%38.4-46.3%Risk-free interest rate4.54-4.59%4.41-4.90%3.60-4.17%Expected life of options (in years)4.00 to 6.004.00 to 6.003.75 to 6.00
2009 2008 2007 Expected dividend yield at date of grant 1.93-2.35% 1.87-2.11% 1.76-1.92% Expected stock price volatility 24.2 to 30.2% 21.1-24.2% 22.7-29.9% Risk-free interest rate 1.55% to2.15% 3.18% 4.54-4.59% Expected life of options (in years) 4.00 to 6.00 4.00 to 6.00 4.00 to 6.00
The risk-free interest rate assumptions were based on the U.S. Treasury yield curve in effect at the time of the grant. The expected volatility was based on historical monthly price changes of the Company’s stock based on the expected life of the options at the date of grant. The expected life of options is the average number of years the Company estimates that options will be outstanding. The Company considers groups of associates that have similar historical exercise behavior separately for valuation purposes.The following table summarizes stock option activity under the Company’s 2001 and 2006 Equity Incentive Plans and the 2004 Director Plan for the year ended December 31, 2006:Number of
Options
Weighted
Average
Exercise
Price
Weighted
Average
Remaining
Contractual
Terms (Years)
Aggregate
Intrinsic
Value
Outstanding at beginning of period 475,666 $15.16 -- -- Granted 131,382 $23.67 -- -- Exercised (22,829) $14.88 -- -- Canceled/expired (44,559) $17.57 -- --
Outstanding at end of period 539,660 $17.04 7.14 $5,374,462
Exercisable at end of period 116,341 $18.00 7.14 $1,047,602
2009:
42
Number of Options WeightedAverageExercise Price WeightedAverageRemainingContractualTerms (Years) AggregateIntrinsic Value(Inthousands) Outstanding at beginning of period 492,431 $ 20.77 — — Granted 102,739 $ 27.91 — — Exercised (2,023 ) $ 8.69 — — Canceled/expired (15,325 ) $ 21.73 — — Outstanding at end of period 577,822 $ 22.06 6.74 $ 1,221 Exercisable at end of period 265,959 $ 20.26 5.78 $ 855
The weighted average grant date fair value of stock options granted during the years ended December 31, 2009, 2008 and 2007, 2006was $5.72, $5.67 and 2005, was $6.39, $6.02 and $4.97, respectively. The total intrinsic value of stock options exercised during the years ended December 31, 2009, 2008 and 2007, 2006 and 2005, was $239,000, $1$28,000, $2.3 million and $211,000,$239,000, respectively. As of December 31, 2007,2009, the total unrecognized compensation cost related to non-vested stock option awards was approximately $1.1 million,$810,000, which was expected to be recognized over a weighted average period of 2.64 years.Cash received from stock options exercised for the years ended December 31, 2009, 2008 and 2007, 2006was $18,000, $1.9 million, and 2005, was $338,000, $926,000, and $254,000, respectively. The actual tax benefit realized for the tax deduction from stock options exercised was $92,000, $405,000$11,000, $743,000 and $84,000,$92,000, for the years ended December 31, 2009, 2008 and 2007, 2006respectively.During 2009, 2008 and 2005, respectively.During 2007, 2006 and 2005, the Company granted 32,115, 13,218-0-, -0- and 27,27832,115 non-vested shares of common stock under the 2001 Equity Incentive Plan. As of December 31, 2007,2009, the Company had 66,18321,956 non-vested shares of common stock outstanding under the plan.Plan. These shares vest over one to five years following the date of grant and holders thereof are entitled to receive dividends from the date of grant, whether or not vested. The fair value of the awards is calculated as the fair market value of the shares on the date of grant. The Company recognized $436,820, $168,466$178,000, $220,000 and $112,221$437,000 of non-cash compensation for the years ended December 31, 2007, 20062009, 2008 and 2005,2007, respectively, related to this non-vested stock.
41
The following table summarizes information regarding non-vested stock granted to associates under the 2001 Equity Incentive Plan for the year ended December 31, 2006.Shares
Outstanding
Weighted Average
Grant Date Fair Value
Per Share($)
Outstanding at beginning of period 49,720 $15.45 Granted 32,115 $23.54 Vested (6,543) $17.83 Forfeited (9,109) $11.00
Outstanding at end of period 66,183 $19.75
The total intrinsic value of non-vested stock awards vested during the years ended December 31, 2007, 2006 and 2005, was $167,000, $147,000 and $40,000, respectively. 2009:
SharesOutstanding Weighted AverageGrant Date FairValue Per Share Outstanding at beginning of period 36,502 $ 21.62 Granted — — Vested (10,645 ) $ 23.49 Forfeited (3,901 ) $ 16.15 Outstanding at end of period 21,956 $ 21.68
As of December 31, 2007,2009, the total unrecognized compensation cost related to non-vested stock awards was approximately $695,000$105,000 and is expected to be recognized over a weighted average period of 2.321.73 years.In periods prior to January 1, 2006, the Company applied the intrinsic value based method of APB Opinion No. 25,Accounting for Stock Issued to Employees, and related interpretations to account for its fixed-plan stock options. Under this method, no compensation expense was reflected in net income as all options granted had an exercise price equal to the fair value of common stock on the date of grant. The following table illustrates the effect on the Company’s net income and earnings per share for the year ended December 31, 2005, if compensation expense had been recorded in net income under the fair-value-based method in accordance SFAS No. 123R.
2005
(in thousands, except
per share amounts) Net income: As reported $ 5,236 Less: Total share-based compensation expense determined under the fair value method for all awards, net of tax (341 )
Pro forma $ 4,895
Earnings per share: Basic, as reported $ 0.74 Basic, pro forma $ 0.70 Diluted, as reported $ 0.74 Diluted, pro forma $ 0.69
(9)(8)Leases
The Company leases printing equipment and services in the United States, and office space in Canada, Wisconsin and California. The Company has recorded rent expense of $626,000, $607,000 and $475,000 $386,000in 2009, 2008 and $277,000 in 2007, 2006 and 2005, respectively. Minimum lease payments under noncancelablenon-cancelable operating leases and capital leases are:
43
Minimum lease payments TotalPayments 2010 2011 2012 2013 2014 (In thousands) Operating leases $ 1,600 $ 524 $ 459 $ 432 $ 175 $ 10 Capital leases 65 37 28 — — — Total $ 1,665 $ 561 $ 487 $ 432 $ 175 $ 10
The capital leases are for eachproduction and mailing equipment. Total minimum lease payments remaining are $65,000, with $5,000 representing interest as of December 31, 2009. The present value of the five years subsequent tofuture minimum lease payments are $60,000 less current maturities of $33,000. Long-term obligations under capital leases total $27,000 as of December 31, 2007 are: 2008 — $463,000; 2009 — $391,000; 2010 — $84,000; 2011 — $-0-; 2012 — $-0-.2009.(10)(9)Related Party
A Board member of the Company also serves as a director of the Picker Institute. The Company advanced $300,000 in each of 2004 and 2003 to the Picker Institute to fund designated research projectsprojects. The advance was fully used by December 31, 2008. $171,000 and $175,000 and $254,000 was expensed on research work during 2008 and 2007, and 2006, respectively. In addition,A Board member of the Company is a party to a support services agreementalso serves as an officer of Ameritas Life Insurance Corp. In connection with the Picker Institute underCompany’s regular assessment of its insurance-based associate benefits and the costs associated therewith, which is conducted by an independent insurance broker, in 2007 the Company conductsbegan purchasing dental insurance for certain of its associates from Ameritas Life Insurance Corp. and, in 2009, the annual NRC Picker Symposium. Under the support services agreement, the Picker Institute receives a portionCompany also began purchasing vision insurance for certain of the gross receiptsits associates from Ameritas Life Insurance Corp. The total value of each symposium, which amounted to approximately $15,000these purchases was $113,000, $79,000 and $65,000 in 2009, 2008 and 2007 $12,000 in 2006 and $15,000 in 2005.42
respectively.(11)(10)Associate Benefits
The Company sponsors a qualified 401(k) plan covering substantially all associates with no eligibility service requirement. Under the 401(k) plan, the Company matches 25% of the first 6% of compensation contributed by each associate. Employer contributions, which are discretionary, vest to participants at a rate of 20% per year. The Company contributed $151,000, $151,000 and $127,000 in 2009, 2008 and $124,000 in 2007, and 2006, respectively, as a matching percentage of associate 401(k) contributions. No contributions were made by the Company in 2005.(12)Subsequent Events
In February 2006, the Company’s Board of Directors authorized a stock repurchase plan providing for the repurchase of an additional 750,000 shares. The plan has no expiration date.
Subsequent to December 31, 2007, the Company has repurchased 263,013 shares of common stock at an approximate cost of $6.6 million and an average per share price of $24.91.
Item 9.Changes in and Disagreements with Accountants on Accounting and Financial Disclosure
Item 9. Changes in and Disagreements with Accountants on Accounting and Financial Disclosure
Not applicable.Item 9A.Controls and Procedures
Item 9A. Controls and Procedures
In accordance with Rule 13a-15(b) of the Securities Exchange Act of 1934 (the “Exchange Act”), the Company’s management evaluated, with the participation of the Company’s Chief Executive Officer and the Company’s Chief Financial Officer, the effectiveness of the design and operation of the Company’s disclosure controls and procedures (as defined in Rule 13a-15(e) and 15d-15(e) under the Exchange Act) as of December 31, 2007.2009. Based upon their evaluation of these disclosure controls and procedures, the Chief Executive Officer and the Chief Financial Officer concluded that the disclosure controls and procedures were effective as of December 31, 2007.2009.
44
The Company’s management is responsible for establishing and maintaining adequate internal control over financial reporting (as defined in Rule 13a-15(f) of the Exchange Act). The Company’s internal control over financial reporting is designed to provide reasonable assurance regarding the reliability of financial reporting and the preparation of financial statements for external purposes in accordance with generally accepted accounting principles. Because of its inherent limitations, however, internal control over financial reporting may not prevent or detect misstatements. Also, projections of any evaluation of effectiveness to future periods are subject to the risk that controls may become inadequate because of changes in conditions, or that the degree of compliance with the policies of procedures may deteriorate.The Company’s management, with the participation of the Company’s Chief Executive Officer and Chief Financial Officer, has evaluated the effectiveness of the Company’s internal control over financial reporting using the framework inInternal Control – Integrated Framework issued by the Committee of Sponsoring Organizations of the Treadway Commission. Based on such evaluation, the Company’s management concluded that the Company’s internal control over financial reporting was effective as of December 31, 2007.2009.There was no change in the Company’s internal control over financial reporting that occurred during the quarter ended December 31, 2007,2009, that has materially affected, or is reasonably likely to materially affect, the Company’s internal control over financial reporting.43
This annual report does not include an attestation report of the Company’s registered public accounting firm regarding internal control over financial reporting. Management’s report was not subject to attestation by the Company’s registered public accounting firm pursuant to temporary rules of the Securities and Exchange Commission that permit the Company to provide only management’s report in this annual report.Item 9B.Other Information
Item 9B. Other Information
The Company has no other information to report pursuant to this item.
45
44
PART IIIItem 10.Directors, Executive Officers and Corporate Governance
Item 10. Directors, Executive Officers and Corporate Governance
The information required by this Item with respect to directors and Section 16 compliance is included under the captions “Election of Directors” and “Section 16(a) Beneficial Ownership Reporting Compliance,” respectively, in the Company’s definitive Proxy Statement for its 20082010 Annual Meeting of Shareholders (“Proxy Statement”) and is hereby incorporated herein by reference. Information with respect to the executive officers of the Company appears in Item 1 of this Annual Report on Form 10-K. The information required by this Item with respect to audit committees and audit committee financial experts is included under the caption “Corporate Governance” in the Proxy Statement and is incorporated herein by reference.The Company has adopted a Code of Business Conduct and Ethics that applies to all of the Company’s associates, including the Company’s Chief Executive Officer, Chief Financial Officer, Controller and other persons performing similar functions. The Company has posted a copy of the Code of Business Conduct and Ethics on its website atwww.nationalresearch.com. The Company intends to satisfy the disclosure requirements under Item 5.05 of Form 8-K regarding amendments to, or waivers from, the Code of Business Conduct and Ethics by posting such information on its website atwww.nationalresearch.com. The Company is not including the information contained on its website as part of, or incorporating it by reference into, this report.Item 11.Executive Compensation
Item 11. Executive Compensation
The information required by this Item is included under the captions “Compensation Discussion and Analysis,” “Summary“2009 Summary Compensation Table,” “Grants of Plan-Based Awards in 2009,” “Outstanding Equity Awards at December 31, 2007,2009,” “Option Exercises and Stock Vested,” “Director“2009 Director Compensation” and “Compensation Committee Report” in the Proxy Statement and is hereby incorporated herein by reference.Item 12.Security Ownership of Certain Beneficial Owners and Management and Related Shareholder Matters
Item 12. Security Ownership of Certain Beneficial Owners and Management and Related Shareholder Matters
The information required by this Item with respect to security ownership of certain beneficial owners and management is included under the caption “Principal Shareholders” in the Proxy Statement and is hereby incorporated by reference.The following table sets forth information with respect to compensation plans under which equity securities of the Company are authorized for issuance as of December 31, 2007.Plan Category
Number of securities to be
issued upon the exercise of
outstanding options,
warrants and
rights
Weighted-average exercise
price of outstanding
options,
warrants and rights
Number of securities remaining
available for future issuance
under equity compensation
plans (excluding securities
reflected in the first column)
Equity compensation plans approved by security holders(1) 539,660 $17.04 657,874(2)
Equity compensation plans not approved by security holders -- -- --
Total539,660 $17.04 657,874
46
Plan Category Number of securities to be issued upon the exercise of outstanding options,warrants and rights Weighted-average exercise price ofoutstanding options, warrants and rights Number of securities remaining available for future issuance under equity compensation plans (excluding securities reflected in the first column) Equity compensation plans approved by security holders (1) 554,822 $ 21.80 505,474 (2) Equity compensation plans not approved by security holders 23,000 27.23 277,000 (3) Total 577,822 $ 22.06 782,474
(1) Includes the Company’s 2006 Equity Incentive Plan, 2004 Director Plan, and the 2001 Equity Incentive Plan.
(2) As of December 31, 2007,2009, the Company had authority to award up to 152,455161,854 additional shares of restricted Common Stock to participants under the 2001 Equity Incentive Plan, provided that the total of such shares awarded may not exceed the total number of shares remaining available for issuance under the 2001 Equity Incentive Plan, which totaled 51,33278,417 as of December 31, 2007.2009. Under the 2006 Equity Incentive Plan, the Company had authority to award up to 167,885 additional shares of restricted Common Stock.Stock to participants under the 2006 Equity Incentive Plan, provided that the total of such shares awarded may not exceed the total number of shares remaining available for issuance under the 2006 Equity Incentive Plan, which totaled 427,057 as of December 31, 2009.
45
Item 13.Certain Relationships and Related Transactions
(3) As of December 31, 2009, the Company had authority to award up to 277,000 additional shares of Common Stock to participants under the 2004 Directors Plan, subject to approval by the Company’s shareholders at the 2010 annual meeting of shareholders of the amendment to the plan adopted, on May 7, 2009 by the Board of Directors to increase the number of shares of common stock authorized for issuance under the plan from 250,000 to 550,000 shares. The Board of Directors conditioned the amendment, on the approval of the Company’s shareholders at the 2010 annual meeting of shareholders. The grants of options to directors on the date of the 2009 annual meeting of shareholders were also made subject to approval of the Company’s shareholders at the 2010 annual meeting of shareholders.
Item 13. Certain Relationships and Related Transactions, and Director Independence
The information required by this Item is included under the caption “Corporate Governance — Transactions with Related Persons”Governance—” in the Proxy Statement and is hereby incorporated by reference.Item 14.Principal Accountant Fees and Services
Item 14. Principal Accountant Fees and Services
The information required by this Item is included under the caption “Miscellaneous-Independent“Miscellaneous—Independent Registered Public Accounting Firm” in the Proxy Statement and is hereby incorporated by reference.
46
47
PART IVItem 15.Exhibits, Financial Statement Schedules
Item 15. Exhibits, Financial Statement Schedules (a) 1. Consolidated financial statements –- The consolidated financial statements listed in the accompanying index to the consolidated financial statements and financial statement schedule are filed as part of this Annual Report on Form 10-K.
2. Financial statement schedule –- The financial statement schedule listed in the accompanying index to the consolidated financial statements and financial statement schedule is filed as part of this Annual Report on Form 10-K.
3. Exhibits –- The exhibits listed in the accompanying exhibit index are filed as part of this Annual Report on Form 10-K.
48
NATIONAL RESEARCH CORPORATION AND SUBSIDIARYSCHEDULE II — VALUATION AND QUALIFYING ACCOUNTS
Balance atBeginning of Year MIVAcquisition Bad DebtExpense Write-offsNet ofRecoveries Balanceat Endof Year (In thousands) Allowance for doubtful accounts: Year Ended December 31, 2007 $ 44 $ — $ 29 $ 3 $ 70 Year Ended December 31, 2008 $ 70 $ 69 $ 168 $ 66 $ 241 Year Ended December 31, 2009 $ 241 $ 75 $ 138 $ 175 $ 279
47
SIGNATURES
Pursuant to the requirements
See accompanying report of Section 13 or 15(d) of the Securities Exchange Act of 1934, the Registrant has duly caused this report to be signed on its behalf by the undersigned, thereunto duly authorized, on this 28th day of March 2008.NATIONAL RESEARCH CORPORATION
By /s/ Michael D. Hays Michael D. Hays Chief Executive Officer
Pursuant to the requirements of the Securities Exchange Act of 1934, this report has been signed below by the following persons on behalf of the Registrant and in the capacities and on the dates indicated.
Signature
Title
Date
/s/ Michael D. HaysChief Executive Officer and Director (PrincipalMarch 28, 2008Michael D. HaysExecutive Officer)
/s/ Patrick E. BeansVice President, Treasurer, Secretary, ChiefMarch 28, 2008Patrick E. BeansFinancial Officer and Director (PrincipalFinancial and Accounting Officer)
/s/ Joseph W. CarmichaelPresident and DirectorMarch 28, 2008Joseph W. Carmichael
/s/ JoAnn M. MartinDirectorMarch 28, 2008JoAnn M. Martin
/s/ John N. NunnellyDirectorMarch 28, 2008John N. Nunnelly
/s/ Paul C. Schorr IIIDirectorMarch 28, 2008Paul C. Schorr III
/s/ Gail L. WardenDirectorMarch 28, 2008Gail L. Warden
independent registered public accounting firm.
48
49
INDEX TO CONSOLIDATED FINANCIAL STATEMENTS
AND FINANCIAL STATEMENT SCHEDULE
Page in this
Form 10-K
Report of Independent Registered Public Accounting Firm 24 Consolidated Balance Sheets as of December 31, 20072009 and 20062008 25 Consolidated Statements of Income for the Three Years Ended December 31, 20072009 26 Consolidated Statements of Shareholders’ Equity and Comprehensive Income as of and for the Three Years Ended December 31, 20072009 27 Consolidated Statements of Cash Flows for the Three Years Ended December 31, 20072009 28 Notes to Consolidated Financial Statements 29 Schedule II--II — Valuation and Qualifying Accounts 50 49
All other financial statement schedules are omitted since the required information is not present or is not present in amounts sufficient to require submission of the schedules, or because the information required is included in the consolidated financial statements and notes thereto.
49
50
NATIONAL RESEARCH CORPORATION AND SUBSIDIARY
SCHEDULE II — VALUATION AND QUALIFYING ACCOUNTS
Balance at
Beginning
of Year
Bad Debt
Expense
Write-offs
Net of
Recoveries
Balance
at End
of Year
Allowance for doubtful accounts: Year Ended December 31, 2005 $ 100,526 $ 2,657 $ -- $ 103,183 Year Ended December 31, 2006 $ 103,183 $ (58,881 ) $ -- $ 44,302 Year Ended December 31, 2007 $ 44,302 $ 28,510 $ 2,600 $ 70,212
See accompanying
SIGNATURESPursuant to the requirements of Section 13 or 15(d) of the Securities Exchange Act of 1934, the Registrant has duly caused this report to be signed on its behalf by the undersigned, thereunto duly authorized, on this 31st day of independent registered public accounting firm.March 2010.NATIONAL RESEARCH CORPORATION By /s/ Michael D. Hays Michael D. Hays President and Chief Executive Officer
Pursuant to the requirements of the Securities Exchange Act of 1934, this report has been signed below by the following persons on behalf of the Registrant and in the capacities and on the dates indicated.
50
Signature Title Date /s/ Michael D. Hays President, Chief Executive Officer and Director March 31, 2010 Michael D. Hays (Principal Executive Officer) /s/ Patrick E. Beans Vice President, Treasurer, Secretary, Chief March 31, 2010 Patrick E. Beans Financial Officer and Director (Principal Financial and Accounting Officer) /s/ JoAnn M. Martin Director March 31, 2010 JoAnn M. Martin /s/ John N. Nunnelly Director March 31, 2010 John N. Nunnelly /s/ Paul C. Schorr III Director March 31, 2010 Paul C. Schorr III /s/ Gail L. Warden Director March 31, 2010 Gail L. Warden
51
EXHIBIT INDEXExhibit
Number Exhibit Description
(3.1) Articles of Incorporation of National Research Corporation, as amended to date [Incorporated by reference to Exhibit (3.1) to National Research Corporation’s Registration Statement on Form S-1 (Registration No. 333-33273)]
(3.2) By-Laws of National Research Corporation, as amended to date [Incorporated by reference to Exhibit (3.2) to National Research Corporation’s Current Report on Form 8-K dated October 10, 2007May 8, 2009 (File No. 0-29466)]
(10.1)*(4.1) Installment or Single Payment Note, dated as of December 19, 2008, from National Research Corporation 1997 Equity Incentive Planto U.S. Bank National Association [Incorporated by reference to Exhibit (10.2)(4.1) to National Research Corporation’s Registration StatementCurrent Report on Form S-1 (Registration8-K dated December 19, 2008 (File No. 333-33273)0-294660)]
(10.2)(10.1)* National Research Corporation 2001 Equity Incentive Plan [Incorporated by reference to National Research Corporation'sCorporation’s Proxy Statement for the 2002 Annual Meeting of Shareholders, filed with the Securities and Exchange Commission on April 3, 2002 (File No. 0-29466)]
(10.3)(10.2)* National Research Corporation 2006 Equity Incentive Plan [Incorporated by reference to National Research Corporation'sCorporation’s Proxy Statement for the 2006 Annual Meeting of Shareholders, filed with the Securities and Exchange Commission on April 3, 2006 (File No. 0-29466)]
(10.4)(10.3)* National Research Corporation Director Stock Plan, as amended to date [Incorporated by reference to Exhibit (10.2) to National Research Corporation’s Annual Report on Form 10-K for the year ended December 31, 1997 (File No. 0-29466)]
(10.5)(10.4)* National Research Corporation 2004 Director Stock Plan [Incorporated by reference to National Research Corporation'sCorporation’s Proxy Statement for the 2005 Annual Meeting of Shareholders, filed with the Securities and Exchange Commission on April 4, 2005 (File No. 0-29466)]
(10.6)Asset Purchase Agreement, dated as of September 16, 2005, among National Research Corporation, Geriatric Health Systems, LLC, Health Services Benefit Administrators, Inc. and Peter Yedidia [Incorporated by reference to Exhibit 2.1 to National Research Corporation’s current Report of Form 8-K dated September 16, 2005 (File No. 0-29466)]
(10.7)(10.5)+Contract, dated January 23, 2002, between National Research Corporation and the Department of Veterans Affairs [Incorporated by reference to Exhibit (10.4) to National Research Corporation’s Annual Report on Form 10-K for the year ended December 31, 2001 (File No. 0-29466)]
(10.8)(10.6)* Form of Nonqualified Stock Option Agreement (for new associates) used in connection with the 2001 Equity Incentive Plan [Incorporated by reference to Exhibit 4.4 to National Research Corporation’s Registration Statement on Form S-8 (Registration No. 333-120530)]
(10.9)(10.7)* Form of Nonqualified Stock Option Agreement (for officers) used in connection with the 2001 Equity Incentive Plan [Incorporated by reference to Exhibit 4.5 to National Research Corporation’s Registration Statement on Form S-8 (Registration No. 333-120530)]
51
(10.10)(10.8)* Form of Restricted Stock Agreement for executive officers used in connection with the 2001 Equity Incentive Plan [Incorporated by reference to Exhibit 10.2 to National Research Corporation’s Current Report on Form 8-K dated March 19, 2005 (File No. 0-29466)]
(10.11)(10.9)* Form of Restricted Stock Agreement (one year vesting) used in connection with the 2001 Equity Incentive Plan [Incorporated by reference to Exhibit 4.6 to National Research Corporation’s Registration Statement on Form S-8 (Registration No. 333-120530)]
52
(10.12)ExhibitNumberExhibit Description (10.10)* Form of Restricted Stock Agreement (five year vesting) used in connection with the 2001 Equity Incentive Plan [Incorporated by reference to Exhibit 4.7 to National Research Corporation’s Registration Statement on Form S-8 (Registration No. 333-120530)]
(10.13)(10.11)* Restricted Stock Incentive Plan for Joseph W. Carmichael, as amended and restated, under the 2001 Equity Incentive Plan [Incorporated by reference to Exhibit 10.2 to National Research Corporation’s Current Report on Form 8-K dated March 3, 2006 (File No. 0-29466)]
(10.14)(10.12)* Director’s Compensation Summary [Incorporated by reference to Exhibit (10.1) to National Research Corporation’s QuarterlyAnnual Report on Form 10-Q for the quarter ended March 31, 2007 (File No. 0-29466)]
(10.15)(10.13)* Form of Nonqualified Stock Option Agreement used in connection with the 2006 Equity Incentive Plan [Incorporated by reference to Exhibit (10.14) to National Research Corporation’s Annual Report on Form 10-K for the year ended December 31, 20072006 (File No. 0-29466)]
(10.16)(10.14)* Form of Restricted Stock Agreement used in connection with the 2006 Equity Incentive Plan [Incorporated by reference to Exhibit (10.15) to National Research Corporation’s Annual Report on Form 10-K for the year ended December 31, 20072006 (File No. 0-29466)]
(23)(10.15) Merger Agreement, dated as of November 26, 2008, by and among National Research Corporation, NRC Acquisition, Inc., My Innerview, Inc., Neil L. Gulsvig and Janice L. Gulsvig [Incorporated by reference to Exhibit (2.1) to National Research Corporation’s Current Report on Form 8-K dated November 26, 2008 (File No. 0-29466)] (23.1) Consent of Independent Registered Public Accounting Firm
(31.1) Certification of the Chief Executive Officer pursuant to Section 302 of the Sarbanes-Oxley Act of 2002
(31.2) Certification of the Chief Financial Officer pursuant to Section 302 of the Sarbanes-Oxley Act of 2002
(32.1) Certification of Periodic Financial Report by the Chief Executive Officer and Chief Financial Officer pursuant to Section 906 of the Sarbanes-Oxley Act of 2002
(99.1) Proxy Statement for the 20082010 Annual Meeting of Shareholders, to be filed within 120 days of December 31, 20072009 [To be filed with the Securities and Exchange Commission under Regulation 14A within 120 days after December 31, 2007;2009; except to the extent specifically incorporated by reference, the Proxy Statement for the 20082010 Annual Meeting of Shareholders shall not be deemed to be filed with the Securities and Exchange Commission as part of this Annual Report on Form 10-K]
* A management contract or compensatory plan or arrangement.
+ Portions of this exhibit have been redacted and are subject to a confidential treatment request filed with the Secretary of the Securities and Exchange Commission pursuant to Rule 24b-2 under the Securities Exchange Act of 1934, as amended. The redacted material was filed separately with the Securities and Exchange Commission.
52
53
Item 5.Market for the Registrant’s Common Equity, Related Stockholder Matters and Issuer Purchases of Equity Securities
| High | Low | Dividends Declared Per Common Share | |
|---|---|---|---|
2006 Quarter Ended: | |||
| March 31 | $24.79 | $17.00 | $.10 |
| June 30 | $24.49 | $21.30 | $.10 |
| September 30 | $26.91 | $21.47 | $.10 |
| December 31 | $26.39 | $21.85 | $.10 |
2007 Quarter Ended: | |||
| March 31 | $24.24 | $20.49 | $.12 |
| June 30 | $27.00 | $21.24 | $.12 |
| September 30 | $26.50 | $24.47 | $.12 |
| December 31 | $28.00 | $25.00 | $.12 |
2009:
| High | Low | Dividends Declared Per Common Share | ||||||||||
| 2008 Quarter Ended: | ||||||||||||
| March 31 | $ | 27.94 | $ | 24.75 | $ | .14 | ||||||
| June 30 | $ | 32.06 | $ | 25.14 | $ | .14 | ||||||
| September 30 | $ | 35.58 | $ | 23.01 | $ | .14 | ||||||
| December 31 | $ | 34.93 | $ | 19.00 | $ | .14 | ||||||
| 2009 Quarter Ended: | ||||||||||||
| March 31 | $ | 29.01 | $ | 19.48 | $ | .16 | ||||||
| June 30 | $ | 28.10 | $ | 23.10 | $ | .16 | ||||||
| September 30 | $ | 26.74 | $ | 23.55 | $ | .16 | ||||||
| December 31 | $ | 25.30 | $ | 20.32 | $ | .16 | ||||||
| Period | Total Number of Shares Purchased | Average Price Paid Per Share | Total Number of Shares Purchased as Part of Publicly Announced Plans or Programs(1) | Maximum Number of Shares that May Yet Be Purchased Under the Plans or Programs |
|---|---|---|---|---|
October 1 - October 31, 2007 | 0 | $ 0 | 0 | 690,386 |
November 1 - November 30, 2007 | 735 | $27.12 | 735 | 689,651 |
December 1 - December 31, 2007 | 1,500 | $27.05 | 1,500 | 688,151 |
| Period | Total Number of Shares Purchased | Average Price Paid Per Share | Total Number of Shares Purchased as Part of Publicly Announced Plans or Programs(1) | Maximum Number of Shares That May Yet Be Purchased Under the Plans or Programs | ||||||||||||
| October 1 - October 31, 2009 | — | — | — | 289,275 | ||||||||||||
| November 1 - November 30, 2009 | — | — | — | 289,275 | ||||||||||||
| December 1 - December 31, 2009 | 210 | $ | 21.69 | 210 | 289,065 | |||||||||||
| (1) | In February 2006, the Company’s Board of Directors authorized a stock repurchase plan providing for the repurchase of an additional 750,000 shares. The plan has no expiration date. |
12
The graph below compares the Company’s cumulative five-year total shareholder return on common stock withrelative to the cumulative total returns of the NASDAQ Composite Index and the Russell 2000 Index. The graph tracks the performanceAn investment of a $100 investment(with reinvestment of all dividends) is assumed to have been made in the Company’sour common stock and in each of the indexes (with the reinvestment of all dividends) fromon December 31, 2002, to2004, and its relative performance is tracked through December 31, 2007.
2009.
| 12/04 | 12/05 | 12/06 | 12/07 | 12/08 | 12/09 | |||||||||||||||||||
| National Research Corporation | 100.00 | 109.35 | 146.03 | 177.05 | 193.68 | 142.27 | ||||||||||||||||||
| NASDAQ Composite | 100.00 | 101.33 | 114.01 | 123.71 | 73.11 | 105.61 | ||||||||||||||||||
| Russell 2000 | 100.00 | 104.55 | 123.76 | 121.82 | 80.66 | 102.58 |
COMPARISON OF FIVE YEAR CUMULATIVE TOTAL RETURN DATA
| 12/02 | 12/03 | 12/04 | 12/05 | 12/06 | 12/07 | |
|---|---|---|---|---|---|---|
National Research Corporation | $100.00 | $170.87 | $171.30 | $187.31 | $250.14 | $303.28 |
NASDAQ Composite | $100.00 | $149.75 | $164.64 | $168.60 | $187.83 | $205.22 |
Russell 2000 | $100.00 | $147.25 | $174.24 | $182.18 | $215.64 | $212.26 |
Item 6.Selected Financial Data
Item 6. Selected Financial Data
| Year Ended December 31, | |||||||||||||||||
|---|---|---|---|---|---|---|---|---|---|---|---|---|---|---|---|---|---|
| 2007 | 2006 | 2005 | 2004 | 2003 | |||||||||||||
| (In thousands, except per share data) | |||||||||||||||||
Statement of Income Data: | |||||||||||||||||
| Revenue | $ | 48,923 | $ | 43,771 | $ | 32,437 | $ | 29,683 | $ | 26,922 | |||||||
| Operating expenses: | |||||||||||||||||
| Direct expenses | 21,801 | 19,445 | 13,642 | 12,869 | 12,029 | ||||||||||||
| Selling, general and administrative | 13,173 | 12,158 | 8,617 | 7,394 | 5,987 | ||||||||||||
| Depreciation and amortization | 2,583 | 2,260 | 1,762 | 2,018 | 1,941 | ||||||||||||
| Total operating expenses | 37,557 | 33,863 | 24,021 | 22,281 | 19,957 | ||||||||||||
| Operating income | 11,366 | 9,908 | 8,416 | 7,402 | 6,965 | ||||||||||||
| Other income (expenses) | (248 | ) | (402 | ) | 99 | (119 | ) | (49 | ) | ||||||||
| Income before income taxes | 11,118 | 9,506 | 8,515 | 7,283 | 6,916 | ||||||||||||
| Provision for income taxes | 4,278 | 3,622 | 3,279 | 2,732 | 2,532 | ||||||||||||
| Net income | $ | 6,840 | $ | 5,884 | $ | 5,236 | $ | 4,551 | $ | 4,384 | |||||||
Net income per share - basic | $ | 1.00 | $ | 0.86 | $ | 0.74 | $ | 0.63 | $ | 0.60 | |||||||
| Net income per share - diluted | $ | 0.98 | $ | 0.85 | $ | 0.74 | $ | 0.63 | $ | 0.60 | |||||||
| Dividends per share | $ | 0.48 | $ | 0.40 | $ | 0.32 | $ | -- | $ | -- | |||||||
| Weighted average shares outstanding - basic | 6,850 | 6,836 | 7,038 | 7,181 | 7,259 | ||||||||||||
| Weighted average shares outstanding - diluted | 7,011 | 6,954 | 7,118 | 7,249 | 7,326 | ||||||||||||
| Year Ended December 31, | ||||||||||||||||||||
| 2009 | 2008 | 2007 | 2006 | 2005 | ||||||||||||||||
| (In thousands, except per share data) | ||||||||||||||||||||
| Statement of Income Data: | ||||||||||||||||||||
| Revenue | $ | 57,692 | $ | 51,013 | $ | 48,923 | $ | 43,771 | $ | 32,437 | ||||||||||
| Operating expenses: | ||||||||||||||||||||
| Direct expenses | 24,574 | 23,611 | 21,801 | 19,445 | 13,642 | |||||||||||||||
| Selling, general and administrative | 15,590 | 12,728 | 13,173 | 12,158 | 8,617 | |||||||||||||||
| Depreciation and amortization | 3,831 | 2,685 | 2,583 | 2,260 | 1,762 | |||||||||||||||
| Total operating expenses | 43,995 | 39,024 | 37,557 | 33,863 | 24,021 | |||||||||||||||
| Operating income | 13,697 | 11,989 | 11,366 | 9,908 | 8,416 | |||||||||||||||
| Other income (expenses) | (580 | ) | (6 | ) | (248 | ) | (402 | ) | 99 | |||||||||||
| Income before income taxes | 13,117 | 11,983 | 11,118 | 9,506 | 8,515 | |||||||||||||||
| Provision for income taxes | 4,626 | 4,538 | 4,278 | 3,622 | 3,279 | |||||||||||||||
| Net income | $ | 8,491 | $ | 7,445 | $ | 6,840 | $ | 5,884 | $ | 5,236 | ||||||||||
| Net income per share - basic | $ | 1.28 | $ | 1.11 | $ | 1.00 | $ | 0.86 | $ | 0.74 | ||||||||||
| Net income per share - diluted | $ | 1.26 | $ | 1.09 | $ | 0.98 | $ | 0.85 | $ | 0.74 | ||||||||||
| Dividends per share | $ | 0.64 | $ | 0.56 | $ | 0.48 | $ | 0.40 | $ | 0.32 | ||||||||||
| Weighted average shares outstanding – basic | 6,637 | 6,685 | 6,850 | 6,836 | 7,038 | |||||||||||||||
| Weighted average shares outstanding – diluted | 6,723 | 6,831 | 7,011 | 6,954 | 7,118 | |||||||||||||||
| December 31, | ||||||||||||||||||||
| 2009 | 2008 | 2007 | 2006 | 2005 | ||||||||||||||||
| (In thousands) | ||||||||||||||||||||
| Balance Sheet Data: | ||||||||||||||||||||
| Working capital (deficit) | $ | (4,432 | ) | $ | (10,650 | ) | $ | (2,384 | ) | $ | (1,482 | ) | $ | 8,058 | ||||||
| Total assets | 72,499 | 72,145 | 61,869 | 61,532 | 44,675 | |||||||||||||||
| Total debt, including current portion | 7,719 | 12,954 | 2,993 | 11,093 | 1,471 | |||||||||||||||
| Total shareholders’ equity | $ | 44,171 | $ | 38,598 | $ | 42,286 | $ | 36,751 | $ | 32,593 | ||||||||||
| December 31, | |||||||||||||||||
|---|---|---|---|---|---|---|---|---|---|---|---|---|---|---|---|---|---|
| 2007 | 2006 | 2005 | 2004 | 2003 | |||||||||||||
| (In thousands) | |||||||||||||||||
Balance Sheet Data: | |||||||||||||||||
| Working capital | $ | (2,384 | ) | $ | (1,482 | ) | $ | 8,058 | $ | 19,434 | $ | 16,817 | |||||
| Total assets | 61,869 | 61,532 | 44,675 | 47,954 | �� | 45,673 | |||||||||||
| Total debt, including current portion | 2,993 | 11,093 | 1,471 | 4,901 | 5,044 | ||||||||||||
| Total shareholders’ equity | 42,286 | 36,751 | 32,593 | 35,018 | 32,424 | ||||||||||||
Item 7.Management’s Discussion and Analysis of Financial Condition and Results of Operations
Item 7. Management’s Discussion and Analysis of Financial Condition and Results of Operations
Ticker.
On May 30, 2006,direct expenses capitalized as purchase price. The merger agreement under which the Company acquired substantially allMIV provided for contingent earn-out payments of which $581,000 of the assets2009 earn-out was included in this amount.
deferred revenue by $11,000.
| · | Revenue recognition; |
| · | Valuation of long-lived assets; |
| · | Valuation of goodwill and identifiable intangible assets; and |
| · | Income taxes. |
The Company’s Market Guide serves as a stand-alone market information and competitive intelligence source, as well as a comparative performance database. Published
16
Under the provisions of Statement of Financial Accounting Standards (“SFAS”) No. 144,Accounting for the Impairment or Disposal of Long-Lived Assets, the
| · | Significant underperformance in comparison to historical or projected operating results; |
| · | Significant changes in the manner or use of acquired assets or the Company’s overall strategy; |
| · | Significant negative trends in the Company’s industry or the overall economy; |
| · | A significant decline in the market price for the Company’s common stock for a sustained period; and |
| · | The Company’s market capitalization falling below the book value of the Company’s net assets. |
The Company adopted the provisions of SFAS No. 142,Goodwill and Other Intangible Assets,indefinite-lived intangibles are assessed annually for impairment and as a result, the Company doesare not amortize goodwill.
amortized.
2007. The Company will continue to evaluate for impairment as unforeseen future events may impact the goodwill valuation.
| Percentage of Total Revenue Year Ended December 31, | Percentage Increase | ||||||||||||||||
|---|---|---|---|---|---|---|---|---|---|---|---|---|---|---|---|---|---|
| 2007 | 2006 | 2005 | 2007 over 2006 | 2006 over 2005 | |||||||||||||
Revenues | 100.0 | % | 100.0 | % | 100.0 | % | 11.8 | % | 34.9 | % | |||||||
| Operating expenses: | |||||||||||||||||
| Direct expenses | 44.6 | 44.4 | 42.1 | 12.1 | 42.5 | ||||||||||||
| Selling, general and administrative | 26.9 | 27.8 | 26.6 | 8.4 | 41.1 | ||||||||||||
| Depreciation and amortization | 5.3 | 5.2 | 5.4 | 14.3 | 28.3 | ||||||||||||
| Total operating expenses | 76.8 | 77.4 | 74.1 | 10.9 | 41.0 | ||||||||||||
| Operating income | 23.2 | % | 22.6 | % | 25.9 | % | 14.7 | % | 17.7 | % | |||||||
Percentage of Total Revenue Year Ended December 31, | Percentage Increase (Decrease) | |||||||||||||||||||
| 2009 | 2008 | 2007 | 2009 over 2008 | 2008 over 2007 | ||||||||||||||||
| Revenue | 100.0 | % | 100.0 | % | 100.0 | % | 13.1 | % | 4.3 | % | ||||||||||
| Operating expenses: | ||||||||||||||||||||
| Direct expenses | 42.6 | 46.3 | 44.6 | 4.1 | 8.3 | |||||||||||||||
| Selling, general and administrative | 27.0 | 25.0 | 26.9 | 22.5 | (3.4 | ) | ||||||||||||||
| Depreciation and amortization | 6.6 | 5.3 | 5.3 | 42.7 | 4.0 | |||||||||||||||
| Total operating expenses | 76.3 | 76.5 | 76.8 | 12.7 | 3.9 | |||||||||||||||
| Operating income | 23.7 | % | 23.5 | % | 23.2 | % | 14.2 | % | 5.5 | % | ||||||||||
Revenue. Revenue increased 11.8%13.1% in 20072009 to $48.9$57.7 million from $43.8$51.0 million in 2006.2008. This was primarily due to increases in the scope of work from existing clients, the addition of new clients, and the acquisition of TGIMIV in May 2006, which generated $4.1 million more of revenue in 2007 compared to 2006.December 2008.
18
Revenue. Revenue increased 34.9%4.3% in 20062008 to $43.7$51.0 million from $32.4$48.9 million in 2005.2007. This was primarily due to increases in the scope of work from existing clients and the addition of new clients, including the acquisition of GHS’s health plan business and TGI, which generated $4 million and $3.5 million in revenue in 2006, respectively.clients.
19
Billings in excess of revenue earned increasedbalance is primarily due to timing of initial billings on new and renewal contracts. The Company typically invoices clients for performance tracking services and custom research projects before they have been completed. Billed amounts are recorded as billings in excess of revenue earned, or deferred revenue, on the Company’s consolidated financial statements, and are recognized as income when earned. In addition, when work is performed in advance of billing, the Company records this work as revenue earned in excess of billings, or unbilled revenue. Substantially all deferred revenue and all unbilled revenue will be earned and billed respectively, within 12 months of the respective period ends.
The Company has budgeted approximately $1.9 million for additional capital expenditures in 2008hardware and other equipment, to be funded through cash generated from operations. The Company expects that the additional capital expenditures during 2008 will be primarily for computer hardware and software, production equipment and furniture.
As of December 31, 2007, the Company’s debt totaled $3.0 million. This consisted of the balance remaining on the $12.5 million credit facility used to fund the TGI acquisition. During 2007, the Company paid off $2.4 million on the line of credit that was outstanding as of December 31, 2006, and made $5.7 million of installment and additional payments on the term note.
loan totaling $650,000.
| Contractual Obligations | Total Payments | Less than One Year | One to Three Years | Three to Five Years | After Five Years | ||||||||||||
|---|---|---|---|---|---|---|---|---|---|---|---|---|---|---|---|---|---|
Operating leases | $ | 937,412 | $ | 462,832 | $ | 474,579 | $ | -- | $ | -- | |||||||
Long-term debt | 2,993,352 | 1,092,754 | 1,900,598 | -- | -- | ||||||||||||
Total | $ | 3,930,764 | $ | 1,555,586 | $ | 2,375,177 | $ | -- | $ | -- | |||||||
20
2009:
| Contractual Obligations | Total Payments | Less than One Year | One to Three Years | Three to Five Years | After Five Years | |||||||||||||||
| (In thousands) | ||||||||||||||||||||
| Operating leases | $ | 1,600 | $ | 524 | $ | 1,066 | $ | 10 | $ | — | ||||||||||
Capital leases(1) | 65 | 37 | 28 | — | — | |||||||||||||||
Uncertain tax positions(2) | 78 | — | — | — | — | |||||||||||||||
Long-term debt(1) | 8,376 | 1,162 | 7,214 | — | — | |||||||||||||||
| Total | $ | 10,119 | $ | 1,723 | $ | 8,386 | $ | 10 | $ | — | ||||||||||
$4.3 million.
289,065.
In June 2006, the FASB issued FASB Interpretation No. 48 (“FIN 48”),Accounting for Uncertainty in Income Taxes— An Interpretation of FASB Statement No. 109. FIN 48 prescribes arevenue recognition threshold and measurement process for recording in the financial statements uncertain tax positions taken or expected to be taken in a tax return. Additionally, this interpretation provides guidance on the derecognition, classification, accounting in interim periods and disclosure requirements for uncertain tax positions. The provisions of FIN 48 werewith multiple deliverables, which is effective for us on January 1, 2007. The adoption of FIN 48 had no effect on the consolidated financial statements.
In September 2006, the FASB issued SFAS No. 157,Fair Value Measurements. SFAS No. 157 defines fair value, establishes a framework for measuring fair valuerevenue arrangements entered into or materially modified in generally accepted accounting principles (GAAP), and expands disclosures about fair value measurements. The provisions of SFAS No. 157 are effective as of thefiscal years beginning of a company’s first fiscal year that begins after November 15, 2007. Management believes that adoption of SFAS No. 157 will not have a material effect on the consolidated financial statements.
21
In February 2008, the FASB issued FASB Staff Position (FSP) Financial Accounting Standard (FAS) 157-1,Application of FASB Statement No. 157 to FASB Statement No. 13 and Its Related Interpretive Accounting Pronouncements That Address Leasing Transactions, and FSP FAS 157-2,Effective Date of FASB Statement No. 157. FSP FAS 157-1 removes leasing from the scope of SFAS No. 157,Fair Value Measurements. FSP FAS 157-2 delays the effective date of SFAS No. 157 from 2008 to 2009 for all non-financial assets and non-financial liabilities, except those that are recognized or disclosed at fair value in the financial statements on a recurring basis (at least annually). Management believes that adoption of SFAS No. 157-1 and 157-2 will not have a material effect on the consolidated financial statements.
In February 2007, the FASB issued SFAS No. 159,The Fair Value Option for Financial Assets and Financial Liabilities,including an amendment of FASB Statement No. 115. This statement permits entities to choose to measure many financial instruments and certain other items at fair value. The provisions of SFAS No. 159 are effective as of the beginning of a company’s first fiscal year that begins after November 15, 2007. Management believes that adoption of SFAS No. 159 will not have a material effect on the consolidated financial statements.
In June 2007, the FASB ratified the consensus reached by the Emerging Issues Task Force (EITF) in EITF Issue No. 07-3,Accounting for Nonrefundable Advance Payments for Goods or Services Received for Use in Future Research and Development Activities (EITF 07-3), which requires that nonrefundable advance payments for goods or services that will be used or rendered for future research and development activities be deferred and amortized over the period that the goods are delivered or the related services are performed, subject to an assessment of recoverability. EITF 07-3 is effective as of the beginning of a company’s first fiscal year that begins after December 15, 2008. Management believes that adoption of EITF 07-3 will not have a material effect on the consolidated financial statements.
In December 2007, the FASB issued SFAS No. 141(R),Business Combinations (“SFAS 141(R)”), which replaces FAS 141. SFAS 141(R) establishes principles and requirements for how an acquirer in a business combination recognizes and measures in its financial statements the identifiable assets acquired, the liabilities assumed, and any controlling interest; recognizes and measures the goodwill acquired in the business combination or a gain from a bargain purchase; and determines what information to disclose to enable users of the financial statements to evaluate the nature and financial effects of the business combination. FAS 141(R) is to be applied prospectively to business combinations for which the acquisition date is on or after an entity’s fiscal yearJune 15, 2010, although early adoption is permitted. This guidance eliminates the residual method under the current guidance and replaces it with the “relative selling price” method when allocating revenue in a multiple deliverable arrangement. The selling price for each deliverable shall be determined using vendor-specific objective evidence of selling price, if it exists, otherwise third-party evidence of selling price. If neither exists for a deliverable, the vendor shall use its best estimate of the selling price for that begins after December 15, 2008.deliverable. After adoption, this guidance will also require expanded qualitative and quantitative disclosures. Management willcontinues to assess the impact of SFAS 141(R) if and when a future acquisition occurs.
Item 7A.Quantitative and Qualitative Disclosure About Market Risk
| Item 7A. | Quantitative and Qualitative Disclosure About Market Risk |
full principal amount.
Item 8.Financial Statements and Supplementary Data
Item 8. Financial Statements and Supplementary Data
| (In thousands, except per share data) | ||||||||||||||||||||||||||
| Quarter Ended | ||||||||||||||||||||||||||
| Dec. 31, 2007 | Sept 30, 2007 | June 30, 2007 | Mar. 31, 2007 | Dec. 31, 2006 | Sept 30, 2006 | June 31, 2006 | Mar. 31, 2006 | |||||||||||||||||||
Revenue | $ | 10,821 | $ | 13,952 | $ | 11,945 | $ | 12,205 | $ | 10,319 | $ | 13,313 | $ | 10,663 | $ | 9,476 | ||||||||||
| Direct expenses | 5,057 | 5,930 | 5,366 | 5,448 | 4,604 | 5,761 | 4,980 | 4,100 | ||||||||||||||||||
| Selling, general and administrative | 3,283 | 3,240 | 3,250 | 3,400 | 3,150 | 2,960 | 3,042 | 3,006 | ||||||||||||||||||
| Depreciation and amortization | 661 | 672 | 623 | 627 | 690 | 600 | 500 | 470 | ||||||||||||||||||
| Operating income | 1,820 | 4,110 | 2,706 | 2,730 | 1,875 | 3,992 | 2,141 | 1,900 | ||||||||||||||||||
| Other income (expense) | (25 | ) | (57 | ) | (30 | ) | (137 | ) | (224 | ) | (200 | ) | (36 | ) | 58 | |||||||||||
| Provision for income taxes | 686 | 1,558 | 1,035 | 999 | 645 | 1,450 | 786 | 741 | ||||||||||||||||||
| Net income | $ | 1,109 | $ | 2,495 | $ | 1,641 | $ | 1,594 | $ | 1,006 | $ | 2,342 | $ | 1,319 | $ | 1,217 | ||||||||||
| Net income per share - basic | $ | 0.16 | $ | 0.36 | $ | 0.24 | $ | 0.23 | $ | 0.15 | $ | 0.34 | $ | 0.19 | $ | 0.18 | ||||||||||
| Net income per share - diluted | $ | 0.16 | $ | 0.36 | $ | 0.23 | $ | 0.23 | $ | 0.14 | $ | 0.34 | $ | 0.19 | $ | 0.18 | ||||||||||
| Weighted average shares outstanding - basic | 6,861 | 6,851 | 6,845 | 6,842 | 6,838 | 6,845 | 6,845 | 6,819 | ||||||||||||||||||
| Weighted average shares outstanding - diluted | 7,034 | 7,013 | 7,002 | 6,964 | 6,976 | 6,986 | 6,970 | 6,918 | ||||||||||||||||||
(In thousands, except per share data) | ||||||||||||||||||||||||||||||||
Quarter Ended | ||||||||||||||||||||||||||||||||
Dec. 31, 2009 | Sept 30, 2009 | June 30, 2009 | Mar. 31, 2009 | Dec. 31, 2008 | Sept 30, 2008 | June 30, 2008 | Mar. 31, 2008 | |||||||||||||||||||||||||
| Revenue | $ | 13,841 | $ | 13,517 | $ | 13,594 | $ | 16,740 | $ | 12,189 | $ | 13,469 | $ | 11,901 | $ | 13,454 | ||||||||||||||||
| Direct expenses | 5,548 | 5,446 | 6,304 | 7,276 | 5,766 | 6,598 | 5,320 | 5,927 | ||||||||||||||||||||||||
| Selling, general and administrative | 4,042 | 3,872 | 3,697 | 3,979 | 2,768 | 3,053 | 3,348 | 3,559 | ||||||||||||||||||||||||
| Depreciation and amortization | 929 | 901 | 891 | 1,110 | 682 | 661 | 676 | 666 | ||||||||||||||||||||||||
| Operating income | 3,322 | 3,298 | 2,702 | 4,375 | 2,973 | 3,157 | 2,557 | 3,302 | ||||||||||||||||||||||||
| Other income (expense) | (134 | ) | (166 | ) | (183 | ) | (97 | ) | 70 | 14 | (58 | ) | (32 | ) | ||||||||||||||||||
| Provision for income taxes | 951 | 1,138 | 910 | 1,627 | 1,148 | 1,205 | 918 | 1,267 | ||||||||||||||||||||||||
| Net income | $ | 2,237 | $ | 1,994 | $ | 1,609 | $ | 2,651 | $ | 1,895 | $ | 1,966 | $ | 1,581 | $ | 2,003 | ||||||||||||||||
| Net income per share – basic | $ | 0.34 | $ | 0.30 | $ | 0.24 | $ | 0.40 | $ | 0.29 | $ | 0.30 | $ | 0.24 | $ | 0.29 | ||||||||||||||||
| Net income per share – diluted | $ | 0.33 | $ | 0.30 | $ | 0.24 | $ | 0.39 | $ | 0.28 | $ | 0.29 | $ | 0.23 | $ | 0.29 | ||||||||||||||||
| Weighted average shares outstanding – basic | 6,639 | 6,637 | 6,637 | 6,633 | 6,642 | 6,644 | 6,637 | 6,818 | ||||||||||||||||||||||||
| Weighted average shares outstanding – diluted | 6,725 | 6,735 | 6,734 | 6,713 | 6,782 | 6,803 | 6,793 | 6,970 | ||||||||||||||||||||||||
23
REPORT OF INDEPENDENT REGISTERED PUBLIC ACCOUNTING FIRMTo the Shareholders and Board of Directors
National Research Corporation:
We have audited the accompanying consolidated balance sheets of National Research Corporation and subsidiary (the Company) as of December 31, 20072009 and 2006,2008, and the related consolidated statements of income, shareholders’ equity and comprehensive income, and cash flows for each of the years in the three-year period ended December 31, 2007.2009. In connection with our audits of the consolidated financial statements, we have also audited the financial statement schedule listed in Item 15(a)(2) of this Form 10-K. These consolidated financial statements and financial statement schedule are the responsibility of the Company’s management. Our responsibility is to express an opinion on these consolidated financial statements and financial statement schedule based on our audits.
We conducted our audits in accordance with the standards of the Public Company Accounting Oversight Board (United States). Those standards require that we plan and perform the audit to obtain reasonable assurance about whether the financial statements are free of material misstatement. An audit includes examining, on a test basis, evidence supporting the amounts and disclosures in the financial statements. An audit also includes assessing the accounting principles used and significant estimates made by management, as well as evaluating the overall financial statement presentation. We believe that our audits provide a reasonable basis for our opinion.
In our opinion, the consolidated financial statements referred to above present fairly, in all material respects, the financial position of National Research Corporation and subsidiary as of December 31, 20072009 and 20062008, and the results of their operations and their cash flows for each of the years in the three-year period ended December 31, 2007,2009, in conformity with U.S. generally accepted accounting principles. Also, in our opinion, the related financial statement schedule, when considered in relation to the basic consolidated financial statements taken as a whole, presents fairly, in all material respects, the information set forth therein.As discussed in notes 1 and 8, the Company changed its method of recording stock-based compensation in 2006.
/s/ KPMG LLPLincoln, Nebraska
March 28, 200831, 2010
24
24
NATIONAL RESEARCH CORPORATION AND SUBSIDIARY
CONSOLIDATED BALANCE SHEETS AS OF(In thousands, except share amounts)
DECEMBER 31, 2007 AND 2006Assets 2007
2006
Current assets: Cash and cash equivalents $ 3,355,141 $ 876,360 Investments in marketable debt securities 99,497 1,110,104 Trade accounts receivable, less allowance for doubtful accounts of $70,212 and $44,302 in 2007 and 2006, respectively 6,378,914 6,733,595 Unbilled revenue 1,377,427 2,272,194 Prepaid expenses and other 1,068,446 1,058,017 Recoverable income taxes 272,219 898,264 Deferred income taxes 48,657 48,410
Total current assets 12,600,301 12,996,944
Net property and equipment 11,974,029 11,715,933 Intangible assets 5,615,910 6,473,644 Goodwill 31,051,202 30,014,337 Deferred income taxes 590,034 279,865 Other 37,317 51,268
Total assets $ 61,868,793 $ 61,531,991
Liabilities and Shareholders’ EquityCurrent liabilities: Current portion of note payable $ 1,092,754 $ 3,110,106 Accounts payable 1,106,317 1,152,657 Accrued wages, bonus and profit sharing 1,477,021 1,593,823 Accrued expenses 1,386,133 358,577 Billings in excess of revenue earned 9,921,763 8,263,692
Total current liabilities 14,983,988 14,478,855
Note payable, net of current portion 1,900,598 7,982,867 Deferred income taxes 2,697,774 2,267,688 Other long-term liabilities -- 52,068
Total liabilities 19,582,360 24,781,478
Shareholders’ equity: Common stock, $.001 par value; authorized 20,000,000 shares, issued 7,883,289 in 2007 and 7,837,848 in 2006, outstanding 6,926,442 in 2007 and 6,890,631 in 2006 7,883 7,838 Additional paid-in capital 23,508,717 21,819,709 Retained earnings 30,003,606 26,488,308 Accumulated other comprehensive income, net of taxes 931,655 359,025 Treasury stock, at cost; 956,847 shares in 2007 and 947,217 shares in 2006 (12,165,428 ) (11,924,367 )
Total shareholders’ equity 42,286,433 36,750,513
Total liabilities and shareholders’ equity $ 61,868,793 $ 61,531,991
2009 2008 Assets Current assets: Cash and cash equivalents $ 2,512 $ 1,109 Trade accounts receivable, less allowance for doubtful accounts of $279 and $241 in 2009 and 2008, respectively 5,214 6,531 Unbilled revenue 1,173 810 Prepaid expenses and other 1,864 1,300 Recoverable income taxes 803 574 Deferred income taxes 98 115 Total current assets 11,664 10,439 Net property and equipment 13,975 13,747 Intangible assets, net 6,883 8,056 Goodwill 39,924 39,276 Other 53 627 Total assets $ 72,499 $ 72,145 Liabilities and Shareholders’ Equity Current liabilities: Current portion of note payable $ 816 $ 4,581 Accounts payable 598 863 Accrued wages, bonus and profit sharing 1,926 1,375 Accrued expenses 848 1,344 Deferred revenue 11,907 12,926 Total current liabilities 16,095 21,089 Note payable, net of current portion 6,903 8,374 Deferred income taxes 5,126 4,084 Deferred revenue 204 — Total liabilities 28,328 33,547 Shareholders’ equity: Common stock, $.001 par value; authorized 20,000,000 shares, issued 8,018,044 in 2009 and 8,019,922 in 2008, outstanding 6,662,111 in 2009 and 6,667,517 in 2008 8 8 Additional paid-in capital 27,871 27,217 Retained earnings 37,905 33,677 Accumulated other comprehensive income (loss), net of taxes 769 (6 ) Treasury stock, at cost; 1,355,933 shares in 2009 and 1,352,405 shares in 2008 (22,382 ) (22,298 ) Total shareholders’ equity 44,171 38,598 Total liabilities and shareholders’ equity $ 72,499 $ 72,145
See accompanying notes to consolidated financial statements.
25
NATIONAL RESEARCH CORPORATION AND SUBSIDIARY
CONSOLIDATED STATEMENTS OF INCOME FOR THE(In thousands, except for per share amounts)
THREE YEARS ENDED DECEMBER 31, 20072007
2006
2005
Revenue $ 48,922,884 $ 43,771,455 $ 32,436,502
Operating expenses: Direct expenses 21,801,039 19,445,925 13,642,195 Selling, general and administrative 13,173,431 12,158,004 8,617,372 Depreciation and amortization 2,582,866 2,259,669 1,761,623
Total operating expenses 37,557,336 33,863,598 24,021,190
Operating income 11,365,548 9,907,857 8,415,312
Other income (expense): Interest income 138,702 171,273 488,120 Interest expense (483,135 ) (517,482 ) (379,464 ) Other, net 96,269 (55,893 ) (9,507 )
Total other income (expense) (248,164 ) (402,102 ) 99,149
Income before income taxes 11,117,384 9,505,755 8,514,461
Provision for income taxes 4,278,372 3,621,687 3,278,370
Net income $ 6,839,012 $ 5,884,068 $ 5,236,091
Net income per share - basic $ 1.00 $ 0.86 $ 0.74
Net income per share - diluted $ 0.98 $ 0.85 $ 0.74
2009 2008 2007 Revenue $ 57,692 $ 51,013 $ 48,923 Operating expenses: Direct expenses 24,574 23,611 21,801 Selling, general and administrative 15,590 12,728 13,174 Depreciation and amortization 3,831 2,685 2,583 Total operating expenses 43,995 39,024 37,558 Operating income 13,697 11,989 11,365 Other income (expense): Interest income 2 42 139 Interest expense (405 ) (139 ) (483 ) Other, net (177 ) 91 96 Total other expense (580 ) (6 ) (248 ) Income before income taxes 13,117 11,983 11,117 Provision for income taxes 4,626 4,538 4,278 Net income $ 8,491 $ 7,445 $ 6,839 Net income per share - basic $ 1.28 $ 1.11 $ 1.00 Net income per share - diluted $ 1.26 $ 1.09 $ 0.98 Weighted average shares and shares equivalent outstanding - basic 6,637 6,685 6,850 Weighted average shares and shares equivalent outstanding - diluted 6,723 6,831 7,011
See accompanying notes to consolidated financial statements.
26
26
NATIONAL RESEARCH CORPORATION AND SUBSIDIARY
CONSOLIDATED STATEMENTS OF SHAREHOLDERS’ EQUITY
AND COMPREHENSIVE INCOME AS OF AND FOR THE(In thousands except share and per share amounts)
THREE YEARS ENDED DECEMBER 31, 2007Common
Stock
Additional
Paid-in
Capital
Retained
Earnings
Unearned
Compensation
Accumulated
Other
Comprehensive
Income
Treasury
Stock
Total
Balances at December 31, 2004 $ 7,684 $ 19,345,569 $ 20,382,334 $ (182,354 ) $ 220,261 $ (4,755,837 ) $ 35,017,657
Purchase of 385,700 shares of treasury stock -- -- -- -- -- (5,932,475 ) (5,932,475 ) Issuance of 30,873 common shares for the exercise of stock options 31 253,846 -- -- -- -- 253,877 Tax benefit from the exercise of options -- 84,140 -- -- -- -- 84,140 Issuance of 25,692 restricted common shares, net of 2,036 cancelled 26 362,472 -- (362,498 ) -- -- -- Non-cash stock compensation expense -- -- -- 112,221 -- -- 112,221 Dividends declared of $0.32 per common share -- -- (2,258,128 ) -- -- -- (2,258,128 ) Comprehensive income Change in unrealized gain/(loss) on marketable securities net of tax -- -- -- -- 4,280 -- 4,280 Change in cumulative translation adjustment -- -- -- -- 75,828 -- 75,828 Net income -- -- 5,236,091 -- -- -- 5,236,091
Total comprehensive income -- -- 5,236,091 -- 80,108 -- 5,316,199
Balances at December 31, 2005 7,741 20,046,027 23,360,297 (432,631 ) 300,369 (10,688,312 ) 32,593,491
Purchase of 52,217 shares of treasury stock -- -- -- -- -- (1,236,055 ) (1,236,055 ) Issuance of 89,307 common shares for the exercise of stock options 89 926,102 -- -- -- -- 926,191 Tax benefit from the exercise of options -- 404,535 -- -- -- -- 404,535 Issuance of 13,218 restricted common shares, net of 5,250 cancelled 8 (8 ) -- -- -- -- -- Non-cash stock compensation expense -- 875,684 -- -- -- -- 875,684 Reclassify unearned compensation -- (432,631 ) -- 432,631 -- -- -- Dividends declared of $0.40 per common share -- -- (2,756,057 ) -- -- -- (2,756,057 ) Comprehensive income Change in unrealized gain/(loss) on marketable securities net of tax -- -- -- -- 67,436 -- 67,436 Change in cumulative translation adjustment -- -- -- -- (8,780 ) -- (8,780 ) Net income -- -- 5,884,068 -- -- -- 5,884,068
Total comprehensive income -- -- 5,884,068 -- 58,656 -- 5,942,724
Balances at December 31, 2006 7,838 21,819,709 26,488,308 -- 359,025 (11,924,367 ) 36,750,513
Purchase of 61,849 shares of treasury stock -- -- -- -- -- (241,061 ) (241,061 ) Issuance of 22,829 common shares for the exercise of stock options 22 337,764 -- -- -- -- 337,786 Tax benefit from the exercise of options -- 111,551 -- -- -- -- 111,551 Issuance of 32,115 restricted common shares, net of 9,109 cancelled 23 (23 ) -- -- -- -- -- Non-cash stock compensation expense -- 1,239,716 -- -- -- -- 1,239,716 Dividends declared of $0.48 per common share -- -- (3,323,714 ) -- -- -- (3,323,714 ) Comprehensive income Change in unrealized gain/(loss) on marketable securities net of tax -- -- -- -- 4,085 -- 4,085 Change in cumulative translation adjustment -- -- -- -- 568,545 -- 568,545 Net income -- -- 6,839,012 -- -- -- 6,839,012
Total comprehensive income -- -- 6,839,012 -- 572,630 -- 7,411,642
Balances at December 31, 2007 $ 7,883 $ 23,508,717 $ 30,003,606 $ -- $ 931,655 $ (12,165,428 ) $ 42,286,433
CommonStock AdditionalPaid-inCapital RetainedEarnings AccumulatedOtherComprehensiveIncome TreasuryStock Total Balances at December 31, 2006 8 21,820 26,488 359 (11,924 ) 36,751 Purchase of 61,849 shares of treasury stock — — — — (241 ) (241 ) Issuance of 22,829 common shares for the exercise of stock options — 338 — — — 338 Tax benefit from the exercise of options and vested restricted stock — 111 — — — 111 Issuance of 32,115 restricted common shares, net of 9,109 cancelled — — — — — — Non-cash stock compensation expense — 1,240 — — — 1,240 Dividends declared of $0.48 per common share — — (3,324 ) — — (3,324 ) Comprehensive income Change in unrealized gain/(loss) on marketable securities, net of tax — — — 4 — 4 Change in cumulative translation adjustment — — — 568 — 568 Net income — — 6,839 — — 6,839 Total comprehensive income 7,411 Balances at December 31, 2007 $ 8 $ 23,509 $ 30,003 $ 931 $ (12,165 ) $ 42,286, Purchase of 395,558 shares of treasury stock — — — — (10,133 ) (10,133 ) Issuance of 144,614 common shares for the exercise of stock options — 1,856 — — — 1,856 Tax benefit from the exercise of options and vested restricted stock — 836 — — — 836 Cancellation of 7,981 restricted common shares — — — — — — Non-cash stock compensation expense — 1,016 — — — 1,016 Dividends declared of $0.56 per common share — — (3,771 ) — — (3,771 ) Comprehensive income Change in cumulative translation adjustment — — — (937 ) — (937 ) Net Income 7,445 7,445 Total comprehensive income — — — — — 6,508 Balances at December 31, 2008 $ 8 $ 27,217 $ 33,677 $ (6 ) $ (22,298 ) $ 38,598 Purchase of 3,528 shares of treasury stock — — — — (84 ) (84 ) Issuance of 2,023 common shares for the exercise of stock options — 18 — — — 18 Tax benefit from the exercise of options and vested restricted stock — 17 — — — 17 Cancellation of 3,901 restricted common shares — — — — — — Non-cash stock compensation expense — 619 — — — 619 Dividends declared of $0.64 per common share — — (4,263 ) — — (4,263 ) Comprehensive income Change in cumulative translation adjustment — — — 775 — 775 Net income 8,491 8,491 Total comprehensive income — — — — — 9,266 Balances at December 31, 2009 $ 8 $ 27,871 $ 37,905 $ 769 $ (22,382 ) $ 44,171
See accompanying notes to consolidated financial statements.27
NATIONAL RESEARCH CORPORATION AND SUBSIDIARY
CONSOLIDATED STATEMENTS OF CASH FLOWS(In thousands)
FOR THE THREE YEARS ENDED DECEMBER 31, 20072007
2006
2005
Cash flows from operating activities: Net income $ 6,839,012 $ 5,884,068 $ 5,236,091 Adjustments to reconcile net income to net cash provided by operating activities: Depreciation and amortization 2,582,866 2,259,669 1,761,623 Deferred income taxes 117,046 99,135 264,049 Loss (gain) on sale of property and equipment (3,587 ) (50 ) 239 Loss (gain) on sale of other investments -- 47,616 (43 ) Tax benefit from exercise of stock options 31,245 63,005 84,140 Non-cash stock compensation expense 1,092,776 1,022,624 112,221 Change in assets and liabilities, net of effect of acquisitions: Trade accounts receivable 616,423 (884,575 ) (2,079,193 ) Unbilled revenue 900,397 (1,089,431 ) 29,026 Prepaid expenses and other 30,190 256,809 45,597 Accounts payable (73,154 ) 22,006 602,326 Accrued expenses, wages, bonus and profit sharing 329,845 (58,680 ) 328,718 Income taxes payable and recoverable 562,797 (714,293 ) 442,865 Billings in excess of revenue earned 1,540,258 (95,723 ) 1,360,425
Net cash provided by operating activities 14,566,114 6,812,180 8,188,084
Cash flows from investing activities: Purchases of property and equipment (1,956,204 ) (1,453,128 ) (1,088,172 ) Proceeds from sale of property and equipment 200 50 1,500 Acquisition, net of cash acquired and earn-out on acquisition -- (20,620,521 ) (4,459,198 ) Purchases of securities available-for-sale (2,990,012 ) (1,378,523 ) (19,453,522 ) Proceeds from the maturities of securities available-for-sale 4,007,262 9,784,215 25,353,137
Net cash provided by (used in) investing activities (938,754 ) (13,667,907 ) 353,745
Cash flows from financing activities: Proceeds from notes payable 375,000 14,795,000 -- Payments on notes payable (8,474,621 ) (5,173,310 ) (3,429,571 ) Proceeds from exercise of stock options 337,786 926,191 253,877 Tax benefit on exercise of stock options and vested restricted stock 80,306 341,530 -- Purchase of treasury stock (241,061 ) (1,236,055 ) (5,932,475 ) Payment of dividends on common stock (3,323,714 ) (2,756,057 ) (2,258,128 )
Net cash provided by (used in) financing activities (11,246,304 ) 6,897,299 (11,366,297 )
Effect of exchange rate changes on cash 97,726 (9,171 ) 20,734
Net increase (decrease) in cash and cash equivalents 2,478,782 32,401 (2,803,734 )
Cash and cash equivalents at beginning of period 876,360 843,959 3,647,693
Cash and cash equivalents at end of period $ 3,355,142 $ 876,360 $ 843,959
Supplemental disclosure of cash paid for: Interest expense $ 483,135 $ 600,719 $ 364,210 Income taxes $ 3,457,478 $ 3,839,192 $ 2,479,834
2009 2008 2007 Cash flows from operating activities: Net income $ 8,491 $ 7,445 $ 6,839 Adjustments to reconcile net income to net cash provided by operating activities: Depreciation and amortization 3,831 2,686 2,583 Deferred income taxes 1,733 430 117 Loss (gain) on sale of property and equipment 1 — (3 ) Tax benefit from exercise of stock options — 156 31 Non-cash stock compensation expense 619 1,016 1,093 Change in assets and liabilities, net of effect of acquisitions: Trade accounts receivable 1,396 637 616 Unbilled revenue (315 ) 603 900 Prepaid expenses and other (516 ) (155 ) 30 Accounts payable (278 ) (408 ) (73 ) Accrued expenses, wages, bonus and profit sharing (73 ) 6 330 Income taxes payable and recoverable (326 ) (249 ) 563 Deferred revenue (897 ) 3,008 1,540 Net cash provided by operating activities 13,666 15,175 14,566 Cash flows from investing activities: Purchases of property and equipment (2,909 ) (2,812 ) (1,956 ) Acquisition, net of cash acquired and earn-out on acquisition (93 ) (12,551 ) — Purchases of securities available-for-sale — — (2,990 ) Proceeds from the maturities of securities available-for-sale — 99 4,007 Net cash used in investing activities (3,002 ) (15,264 ) (939 ) Cash flows from financing activities: Proceeds from notes payable 4,916 18,564 375 Payments on notes payable (10,152 ) (8,952 ) (8,474 ) Proceeds from exercise of stock options 18 731 338 Tax benefit on exercise of stock options and vested restricted stock 17 680 80 Purchase of treasury stock (84 ) (9,007 ) (241 ) Payment of dividends on common stock (4,263 ) (3,771 ) (3,324 ) Net cash used in financing activities (9,548 ) (1,755 ) (11,246 ) Effect of exchange rate changes on cash 287 (402 ) 98 Net increase (decrease) in cash and cash equivalents 1,403 (2,246 ) 2,479 Cash and cash equivalents at beginning of period 1,109 3,355 876 Cash and cash equivalents at end of period $ 2,512 $ 1,109 $ 3,355 Supplemental disclosure of cash paid for: Interest expense $ 498 $ 122 $ 483 Income taxes $ 2,999 $ 3,502 $ 3,457
Supplemental disclosures of non-cash investing activities:
In connection with the Company’s acquisition of businesses in 2006 and 2005,Equity Incentive plans, certain optionees tendered to the Company acquired current assets of $730,804
previously owned shares to pay for the option strike price. The total non-cash stock options exercised was $0, $1.1 million and $53,046, respectively,$0 for the years ended December 31, 2009, 2008, and assumed current liabilities of $3,201,691 and $151,685,2007, respectively.
See accompanying notes to consolidated financial statements.
28
NATIONAL RESEARCH CORPORATION AND SUBSIDIARY
NOTES TO CONSOLIDATED FINANCIAL STATEMENTS(1) Summary of Significant Accounting Policies
Description of Business and Basis of PresentationNational Research Corporation (the “Company”) is a provider of ongoing survey-based performance measurement, analysis, tracking, improvement services and governance education to the healthcare industry in the United States and Canada. The Company provides market research services to hospitals and insurance companies on an unsecured credit basis. The Company’s ten largest clients accounted for 29%14%, 32%24%, and 40%29% of the Company’s total revenue in 2009, 2008, and 2007, 2006 and 2005, respectively. One client accounted for 8%, 8% and 11% of total revenue in 2007, 2006 and 2005, respectively. The Company operates in a single industry segment.Principles of ConsolidationThe consolidated financial statements include the accounts of the Company and its subsidiary. All significant intercompany transactions and balances have been eliminated in consolidation.Use of EstimatesThe preparation of financial statements in conformity with accounting principles generally accepted in the United States of America requires management to make certain estimates and assumptions that affect the reported amounts of assets and liabilities at the date of the financial statements and the reported amounts of revenue and expenses during the reporting period. Actual results could differ from those estimates.Translation of Foreign CurrenciesThe Company’s Canadian subsidiary uses as its functional currency the local currency of the country in which it operates. It translates its assets and liabilities into U.S. dollars at the exchange rate in effect at the balance sheet date. It translates its revenue and expenses at the average exchange rate during the period. The Company includes translation gains and losses in accumulated other comprehensive income (loss), a component of shareholders’ equity. Gains and losses related to transactions denominated in a currency other than the functional currency of the countries in which the Company operates and short-term intercompany accounts are included in other income (expense) in the consolidated statements of income.Revenue RecognitionThe Company derives a majority of its operating revenue from its annually renewable services, which include the performance tracking services, subscription-based educational services and Market Guide.subscription-based and annual contracts of Ticker. The Company provides interim and annual performance tracking to its clients under annual client service contracts, although such contracts are generally cancelable on short or no notice without penalty. The Company provides subscription-based educational services to clients generally under annual service contracts over a twelve-month period and publishes healthcare market information for its clients through its Market Guide generallyTicker on an annual or monthly basis. The Company also derives revenue from its custom and other research projects. Sales taxes collected from customers and remitted to governmental authorities are accounted for on a net basis and, therefore, are excluded from revenue in the consolidated statements of income.
29
The Company recognizes revenue from its performance tracking services and its custom and other research projects using the proportional performance method of accounting. These services typically include a series of surveys and deliverable reports in which the timing and frequency vary by contract. Progress on a contract can be tracked reliably, and customers are obligated to pay as services are performed. The Company recognizes revenue based on output measures or key milestones such as survey set up, survey mailings, survey returns and reporting. The Company measures its progress based on the level of completion of these output measures and recognizes the revenue related to output measures. Losses expected to be incurred, if any, on jobs in progress are charged to income as soon as such losses are known. Revenue earned on contracts in progress in excess of billings is classified as a current asset. Amounts billed in excess of revenue earned are classified as a current liability. Client projects are generally completed within a twelve-month period.29
The Company recognizes subscription-based educational service revenue over the period of time the service is provided. Generally, the subscription periods are for twelve months and revenue is recognized equally over the subscription period.The Company recognizes revenue on Market GuideTicker contracts upon its delivery to the principal customers. TheRevenue under some annual contracts which do not include monthly updates is fully recognized upon delivery, typically in the third quarter of the year. Starting in May 2008, the Company defersadded subscription-based services, the revenue from which is generally recognized on a monthly basis over a twelve-month period. Until September 2008, the Company deferred costs of preparing the survey data for Market Guide.Ticker and expensed these at the time the annual contract revenue was recognized. These costs are primarily incremental external direct costs solely related to fulfilling the Company’s obligations under Market GuideTicker contracts. The Company expensesBeginning in October 2008, these deferred costs at the time revenue is recognized. The Company monitors and assesses the recoverability of the deferred direct costs based on contracted revenue and whenever changes in circumstances warrant such assessment.are expensed monthly as incurred. The Company generates additional revenue from incidental customers subsequent to the completion of each monthly edition. Revenue and costs for these subsequent services are recognized as the customization services are performed and completed.Trade Accounts ReceivableTrade accounts receivable are recorded at the invoiced amount. The allowance for doubtful accounts is the Company’s best estimate of the amount of probable credit losses in the Company’s existing accounts receivable. The Company determines the allowance based on specific account analysis and on the Company’s historical write-off experience. The Company reviews the allowance for doubtful accounts monthly. Past due balances over 90 days and over a specified amount are reviewed individually for collectability and provisions are made for accounts not specifically reviewed. Account balances are charged off against the allowance after all means of collection have been exhausted and the potential for recovery is considered remote.
Property and EquipmentProperty and equipment is stated at cost. Major expenditures to purchase property or to substantially increase useful lives of property are capitalized. Maintenance, repairs and minor renewals are expensed as incurred. When assets are retired or otherwise disposed of, their costs and related accumulated depreciation are removed from the accounts and resulting gains or losses are included in income.For costs of software developed for internal use, the Company expenses computer software costs as incurred in the preliminary project stage, which involves the conceptual formulation, evaluation and selection of technology alternatives. Costs incurred related to the design, coding, installation and testing of software during the application project stage are capitalized. Costs for training and application maintenance are expensed as incurred. The Company has capitalized approximately $511,000, $803,000$450,000, $493,000 and $680,000,$511,000, of internal and external costs incurred for the development of internal use software for the years ended December 31, 2007, 20062009, 2008 and 2005,2007, respectively, with such costs classified as property and equipment.
30
The Company provides for depreciation and amortization of property and equipment using annual rates which are sufficient to amortize the cost of depreciable assets over their estimated useful lives. The Company uses the straight-line method of depreciation and amortization over estimated useful lives of five to ten years for furniture and fixtures,equipment, three to five years for computer equipment, three to five years for capitalized software, and fifteenten to forty years for the Company’s office building.building and related improvements.
Impairment of Long-Lived AssetsIn accordance with Statement of Financial Accounting Standards (“SFAS”) No. 144,Accounting for the Impairment or Disposal of Long-Lived Assets, the
The Company monitors events and changes in circumstances that may require the Company to review the carrying value of its long-lived assets. The Company assesses the recoverabilitywhether an impairment of its long-lived assets based on estimatedheld and used may have occurred using undiscounted future operating cash flows. Impairments, if they occur, are measured using the fair value of the assets. The assessment of the recoverability of long-lived assets willmay be adversely impacted if estimated future operating cash flows are not achieved.30
The Company assesses the impairment of long-lived assets whenever events or changes in circumstances indicate that the carrying value of such assets may not be recoverable. ManagementAmong others, management believes the following circumstances are important indicators of potential impairment of such assets and as a result may trigger an impairment review:Significant underperformance in comparison to historical or projected operating results;
Significant changes in the manner or use of acquired assets or the Company’s overall strategy;· Significant underperformance in comparison to historical or projected operating results;
Significant negative trends in the Company’s industry or the overall economy;
A significant decline in the market price for the Company’s common stock for a sustained period; and· Significant changes in the manner or use of acquired assets or the Company’s overall strategy;
The Company's market capitalization falling below the book value of the Company’s net assets.
· Significant negative trends in the Company’s industry or the overall economy;
· A significant decline in the market price for the Company’s common stock for a sustained period; and
· The Company’s market capitalization falling below the book value of the Company’s net assets.
Goodwill and Intangible AssetsIntangible assets include customer relationships, trade namenames and goodwill. Customer relationships are being amortized over periods of five to fifteen years. One of the trade names is being amortized over a period of ten years. The other trade name is indefinite lived. Goodwill represents the difference between the purchase price paid in acquisitions, using the purchase method of accounting, and the fair value of the net assets acquired.Goodwill and intangible assets acquired in a purchase business combination and determined to have an indefinite useful life are not amortized, but instead are tested for impairment at least annually in accordance with the provisions of SFAS No. 142,Goodwill and Other Intangible Assets.. Intangible assets with estimable useful lives are amortized over their respective estimated useful lives to their estimated residual values and reviewed for impairment in accordance with SFAS No. 144.impairment.All of the Company’s goodwill is allocated to onefive of its six reporting unit, the healthcare services business.units. As of December 31, 2007,2009, the Company has net goodwill of $31$39.9 million. As of October 1 of each year (or more frequently as changes in circumstances indicate), the Company evaluatestests goodwill for impairment using level 3 inputs as defined in the estimated fair value hierarchy. Refer to Note 1, Fair Value Measurements, for the definition of the Company’s goodwill.levels in the fair value hierarchy. The inputs used to calculate the fair value included the projected cash flows and a discount rate that the Company estimated would be used by a market participant in valuing these assets. On these evaluation dates, to the extent that the carrying value of the net assets of the Company’s reporting unitunits having goodwill is greater than the estimated fair value, impairment charges will be recorded. The Company’s analysis has not resulted in the recognition of an impairment loss on goodwill in 2007, 2006 or 2005.Investments in Marketable Debt Securities
All marketable debt securities held by the Company at December 31, 2007determined and 2006, were classified as available-for-sale and recorded at fair market value. Unrealized holding gains and losses, net of the related tax effect, on available-for-sale securities are reported as other comprehensive income or loss. Realized gains and losses from the sale of available-for-sale securities are determined on a specific-identification basis. Fair values are estimatedmeasured based on quoted market prices. Interest income is recognized when earned.
A decline in the marketestimated fair value of any available-for-sale security below cost that is deemedgoodwill as compared to be other-than-temporary results in a reduction inits carrying amount to fair value. The impairment is charged to earnings and a new cost basis for the security is established. To determine whether an impairment is other-than-temporary, the Company considers whether it has the ability and intent to hold the investment until a market price recovery and considers whether evidence indicating the cost of the investment is recoverable outweighs evidence to the contrary. Evidence considered in this assessment includes the reasons for the impairment, the
31
severity and duration of the impairment, changes in value subsequent to year-end, and forecasted performance of the investee. The Company’s analysis has not resulted in the recognition of an impairment loss on investments in 2007, 2006 or 2005.
Income TaxesThe Company uses the asset and liability method of accounting for income taxes. Under that method, deferred income tax assets and liabilities are recognized for the future tax consequences attributable to differences between the financial statement carrying amounts of existing assets and liabilities and their respective tax basis using enacted tax rates. The effect on deferred tax assets and liabilities of a change in tax rates is recognized in income in the period that includes the enactment date. Valuation allowances, if any, are established when necessary to reduce deferred tax assets to the amount that is more likely than not to be realized.Share-Based Compensation
Effective January 1, 2006, The Company uses the deferral method of accounting for its investment tax credits related to state tax incentives. During the years ended December 31, 2009, 2008 and 2007, the Company adopted SFAS No. 123Rrecorded income tax benefits relating to these tax credits of $189,000, $0, and $0.
The Company recognizes the effect of income tax positions only if those positions are more likely than not of being sustained. Recognized income tax positions are measured at the largest amount that is greater than 50% likely of being realized. Changes in recognition or measurement are reflected in the period in which the change in judgment occurs.The Company had an unrecognized tax benefit at December 31, 2009 of $541,000, excluding interest of $3,000 and no penalties. Of this amount $78,000 represents the net unrecognized tax benefits that, if recognized, would favorably impact the effective income tax rate. The Company accrues interest and penalties related to uncertain tax position in the statements of income as income tax expense. The Company is not subject to tax examinations for years prior to 2006 in the U.S. and 2005 in Canada.
Share-Based Payment (“SFAS No. 123R”) under the modified version of the prospective transition method. Under the modified prospective transition method,CompensationThe Company measures and recognizes compensation costexpense for all share-based payments. The compensation expense is recognized on or after the required effective date for the portion of the outstanding awards for which the requisite service has not yet been rendered, based on the grant dategrant-date fair value of those awards calculated under SFAS No. 123R for either recognition or pro forma disclosures.awards. All of the Company’s existing stock option awards and non-vested stock awards have been determined to be equity awards in accordance with SFAS No. 123R. There was no cumulative effect of initially adopting SFAS No. 123R.The Company currently intends that shares of common stock issued upon the exercise of options will be newly-issued shares. No share-based compensation costs were capitalized for the twelve-month periods ended December 31, 2007 and 2006. equity-classified awards.
Amounts recognized in the financial statements with respect to these plans under SFAS No. 123R are as follows:2007
2006
(in thousands) (in thousands) Amounts charged against income, $ 1,252 $ 1,023 before income tax benefit Amount of related income tax benefit 483 399
Total net income impact $ 769 $ 624
plans:
2009 2008 2007 (In thousands) Amounts charged against income, before income tax benefit $ 619 $ 1,016 $ 1,093 Amount of related income tax benefit 238 391 421 Total net income impact $ 381 $ 625 $ 672
Cash and Cash EquivalentsFor purposes of the statements of cash flows, the Company considers all highly liquid investments with original maturities of three months or less to be cash equivalents. Cash equivalents were $2.5 million consisting of U.S. government notes of $1.6 million and money market funds of $930,000 as of December 31, 2009, and $379,000 of money market funds as of December 31, 2008.
32
Fair Value MeasurementsThe Company’s valuation techniques are based on maximizing observable and unobservable inputs and minimizing the use of unobservable inputs when measuring fair value. Observable inputs reflect readily obtainable data from independent sources, while unobservable inputs reflect the Company’s market assumptions. The inputs are then classified into the following hierarchy: (1) Level 1 Inputs—quoted prices in active markets for identical assets and liabilities, (2) Level 2 Inputs—observable market-based inputs other than Level 1 inputs, such as quoted prices for similar assets or liabilities in active markets; quoted prices for similar or identical assets or liabilities in markets that are not active; or other inputs that are observable or can be corroborated by observable market data, (3) Level 3 Inputs—unobservable inputs.
As of December 31, 2007, cash equivalents were $194,000 consisting of money market funds.Fair Value of Financial Instruments
The carrying value of financial instruments included in2009, those assets and liabilities that are measured at fair value on a recurring basis consisted of the following:
Level 1 Level 2 Level 3 (In thousands) Money Market Funds $ 930 $ — $ — U.S. government notes — 1,560 — Total $ 930 $ 1,560 $ —
The Company believes that the carrying amounts of its other financial instruments, including cash, accounts payable and accrued expenses, approximate their fair value due to the short-term maturities of these instruments. All non-financial assets and liabilities that are not recognized or disclosed at fair value in the accompanying consolidated balance sheets approximates theirfinancial statements on a recurring basis, which includes goodwill and non-financial long lived assets, are measured at fair value.value in certain circumstances (for example, when there is evidence of impairment). As of December 31, 2009, there was no indication of impairment related to our non-financial assets and liabilities. Refer to Note 1, Goodwill and Intangible Assets, for further description of the inputs used to measure fair value of goodwill as part of our annual impairment test.
Earnings Per ShareNet income per share has been calculated and presented for “basic” and “diluted” per share data. Basic net income per share is computed by dividing net income by the weighted average number of common shares outstanding. Diluted income per share is computed by dividing net income by the weighted average number of common shares adjusted for the dilutive effects of options and restricted stock. At December 31, 2007, 20062009, 2008 and 2005,2007, the Company had 48,000,247,603, -0- and 9,43948,000 options, respectively, which have been excluded from the diluted net income per share computation because their exercise price exceeds the fair market value.32
The weighted average shares outstanding were calculated as follows:2007
2006
2005
Common stock 6,849,717 6,836,456 7,037,896 Dilutive effect of options 131,036 91,885 61,511 Dilutive effect of restricted stock 30,518 25,623 18,630
Weighted average shares used for dilutive per share information 7,011,271 6,953,964 7,118,037
2009 2008 2007 (In thousands) Common stock 6,637 6,685 6,850 Dilutive effect of options 74 131 131 Dilutive effect of restricted stock 12 15 30 Weighted average shares used for dilutive per share information 6,723 6,831 7,011
There are no reconciling items between the Company’s reported net income and net income used in the computation of basic and diluted income per share.Accumulated
33
Comprehensive IncomeComprehensive income consists of net income and other comprehensive income (loss). Other Comprehensive IncomeThe components ofcomprehensive income (loss) refers to revenue, expenses, gains and losses that are not included in net income, but rather are recorded directly in stockholder’s equity. For the years ended December 31, 2009 and 2008 accumulated other comprehensive income were(loss) was $769,000 and ($6,000), respectively, consisting solely of changes in the cumulative translation adjustment.
Segment Information
The Company has six operating segments that are aggregated into one reporting segment because they have similar economic characteristics and meet the other aggregation criteria within the authoritative guidance on disclosure about enterprise segments. The six operating segments are as follows:2007
2006
2005
(in thousands) Net income, as reported $ 6,839 $ 5,884 $ 5,236
Other comprehensive income: Unrealized gain (loss) from investments: Unrealized gains 7 112 3 Related tax (expense) benefit (3 ) (44 ) 1
Net 4 68 4 Foreign currency translation 569 (9 ) 76
Total other comprehensive income 573 59 80
Comprehensive income $ 7,412 $ 5,943 $ 5,316
NRC Picker U.S. and NRC Picker Canada, which each offer renewable performance tracking and improvement services, custom research, best practice improvement services, and a renewable syndicated service; Healthcare Market Guide (Ticker) offers stand-alone market information as well as a comparative performance database to allow the Company’s clients to assess their performance relative to the industry, to access best practice examples, and to utilize competitive information for marketing purposes; Payer Solutions offers functional disease-specific and health status measurement tools; The Governance Institute (TGI) offers subscription-based governance information and educational conferences designed to improve the effectiveness of hospital and healthcare systems by continually strengthening their healthcare boards, medical leadership, and management performance in the United States; and My InnerView (MIV) provides quality and performance improvement solutions to the senior care profession.
Adoption of New Accounting PronouncementsIn February 2006, theJune 2009, FASB issued SFAS No. 155,the Accounting for Certain Hybrid Financial Instruments— An AmendmentStandards Codification™ (“Codification”) as the source of authoritative U.S. generally accepted accounting principles (“GAAP”) recognized by FASB Statements No. 133to be applied by nongovernmental entities. The Codification supersedes all then-existing non-SEC accounting and 140. SFAS No. 155 amends SFAS No. 133,Accounting for Derivative Instruments and Hedging Activities, and SFAS No. 140,Accounting for Transfer and Servicing of Financial Assets and Extinguishments of Liabilities, and eliminatesreporting standards. In accordance with the exemption from applying SFAS No. 133Codification, references to interestsaccounting literature in securitized financial assets so that similar itemsthis report are accounted forpresented in plain English. The Codification did not change GAAP, but reorganizes the same way.literature. The provisions of SFAS No. 155 areCodification is effective for all financial instruments acquired by a company orstatements issued after the beginning of its first fiscal year that beginsfor interim and annual periods ending after September 15, 2006.2009. The adoption of SFAS No. 155the Codification has not had no effectan impact on the consolidated financial statements.Recent Accounting PronouncementsIn March 2006,September 2009, the FASB issued SFAS No. 156,Accountingnew guidance for Servicingrevenue recognition with multiple deliverables, which is effective for revenue arrangements entered into or materially modified in fiscal years beginning on or after June 15, 2010, although early adoption is permitted. This guidance eliminates the residual method under the current guidance and replaces it with the “relative selling price” method when allocating revenue in a multiple deliverable arrangement. The selling price for each deliverable shall be determined using vendor specific objective evidence of Financial Assets— An Amendmentselling price, if it exists, otherwise third-party evidence of FASB Statement No. 140. SFAS No. 156 amends SFAS No. 140,Accountingselling price. If neither exists for Transfers and Servicing of Financial Assets and Extinguishments of Liabilities, and requires that all separately recognized servicing assets and servicing liabilities be initially measured at fair value, if practicable. The provisions of SFAS No. 156 are effective asa deliverable, the vendor shall use its best estimate of the beginningselling price for that deliverable. After adoption, this guidance will also require expanded qualitative and quantitative disclosures. As of a company’s first fiscal year that begins after September 15, 2006. The adoption of SFAS No. 156 had no effect on the consolidated financial statements.In June 2006, the FASB issued FASB Interpretation No. 48 (“FIN 48”),Accounting for Uncertainty in Income Taxes— An Interpretation of FASB Statement No. 109. FIN 48 prescribes a recognition threshold and measurement process for recording in the financial statements uncertain tax positions taken or expected to be taken in a tax return. Additionally, this interpretation provides guidance on the derecognition, classification, accounting in interim periods and disclosure requirements for uncertain tax positions. The provisions of FIN 48 were effective for us on January 1, 2007. The adoption of FIN 48 had no effect on the consolidated financial statements.
33
In September 2006, the FASB issued SFAS No. 157,Fair Value Measurements. SFAS No. 157 defines fair value, establishes a framework for measuring fair value in generally accepted accounting principles (GAAP), and expands disclosures about fair value measurements. The provisions of SFAS No. 157 are effective as of the beginning of a company’s first fiscal year that begins after November 15, 2007. ManagementDecember 31, 2009, management believes that adoption of SFAS No. 157this new guidance will not have a material effect on the consolidated financial statements.
In February 2008, the FASB issued FASB Staff Position (FSP) Financial Accounting Standard (FAS) 157-1,Application of FASB Statement No. 157 to FASB Statement No. 13 and Its Related Interpretive Accounting Pronouncements That Address Leasing Transactions, and FSP FAS 157-2,Effective Date of FASB Statement No. 157. FSP FAS 157-1 removes leasing from the scope of SFAS No. 157,Fair Value Measurements. FSP FAS 157-2 delays the effective date of SFAS No. 157 from 2008 to 2009 for all non-financial assets and non-financial liabilities, except those that are recognized or disclosed at fair value in the financial statements on a recurring basis (at least annually). Management believes that adoption of SFAS No. 157-1 and 157-2 will not have a material effect on the consolidated financial statements.
In February 2007, the FASB issued SFAS No. 159,The Fair Value Option for Financial Assets and Financial Liabilities including an amendment of FASB Statement No. 115. This statement permits entities to choose to measure many financial instruments and certain other items at fair value. The provisions of SFAS No. 159 are effective as of the beginning of a company’s first fiscal year that begins after November 15, 2007. Management believes that adoption of SFAS No. 159 will not have a material effect on the consolidated financial statements.
In June 2007, the FASB ratified the consensus reached by the Emerging Issues Task Force (EITF) in EITF Issue No. 07-3,Accounting for Nonrefundable Advance Payments for Goods or Services Received for Use in Future Research and Development Activities (EITF 07-3), which requires that nonrefundable advance payments for goods or services that will be used or rendered for future research and development activities be deferred and amortized over the period that the goods are delivered or the related services are performed, subject to an assessment of recoverability. EITF 07-3 is effective as of the beginning of a company’s first fiscal year that begins after December 15, 2008. Management believes that adoption of EITF 07-3 will not have a material effect on the consolidated financial statements.
In December 2007, the FASB issued SFAS No. 141(R),Business Combinations (“SFAS 141(R)”), which replaces FAS 141. SFAS 141(R) establishes principles and requirements for how an acquirer in a business combination recognizes and measures in its financial statements the identifiable assets acquired, the liabilities assumed, and any controlling interest; recognizes and measures the goodwill acquired in the business combination or a gain from a bargain purchase; and determines what information to disclose to enable users of the financial statements to evaluate the nature and financial effects of the business combination. FAS 141(R) is to be applied prospectively to business combinations for which the acquisition date is on or after an entity’s fiscal year that begins after December 15, 2008. Management will assess the impact of SFAS 141(R) if and when a future acquisition occurs.
34
(2) Acquisitions
On May 30, 2006,December 19, 2008, the Company acquired substantially allMy InnerView, Inc. (“MIV”), a leading provider of the assets of TGI Group, LLC, operating as The Governance Institute (“TGI”). TGI provides board members, executive managementquality and physician leaders of hospitals and health systems with knowledge andperformance improvement solutions to successfully confront a wide array of strategic issues. TGI operations have been includedthe senior care profession. MIV offers resident, family and employee satisfaction measurement and improvement products to the long term-care, assisted and independent living markets in the United States. MIV works with over 8,000 senior care providers throughout the United States, housing what the Company believes is the largest dataset of senior care satisfaction metrics in the nation. The acquisition was completed in order to pursue the Company’s consolidated financial statements sincestrategy of expanding additional service offerings to the datehealthcare industry in the United States and Canada. This acquisition gives the Company a foundation upon which to expand in the senior care profession. The consideration paid at closing for MIV included a payment of acquisition. The purchase price for TGI was $19.8$11.5 million in cash plusand $440,000 of direct expenses capitalized as purchase price. The merger agreement under which the assumption of certain liabilities. The Company paid $17.8 million in cash to the seller at closingacquired MIV provided for contingent earn-out payments over three years based on revenue and $1.95 million into an escrow account. The escrow account was released twelve months fromoperating income increases.In connection with the acquisition date. Thethe Company recorded direct acquisition costs of $305,000.34
The Company has allocated the following amounts as its preliminary purchase price as follows,allocation, based on the estimated fair value of the assets acquired and liabilities assumed at the date of acquisition:
Fair Value
Current assets $ 730,804 Property and equipment 67,573 Customer relationships 2,694,000 Trade name 1,572,000 Goodwill 18,221,635
Total acquired assets 23,286,012 Less total liabilities assumed 3,201,691
Net assets acquired $ 20,084,321
Of the $22,487,635 of acquired intangible assets, $2,694,000 was assigned to customer relationships and $1,572,000 was assigned to a trade name.
Fair Value (In thousands) Current Assets $ 1,290 Property and equipment 846 Customer relationships 3,003 Goodwill 8,833 Other Long Term Assets 581 Total acquired assets 14,553 Less total liabilities 2,613 Net assets acquired $ 11,940
The excess of purchase price over the fair value of net assets acquired resulted in the Company recording $18,221,635$8.8 million of goodwill. The customer relationships acquired intangible asset is being amortized over a useful life of 10 years. The amortization of customer relationships the trade name and goodwill is expected to be deductiblenon-deductible for tax purposes.During the year ended December 31, 2009, the Company adjusted the initial purchase price allocation resulting in a net increase to goodwill of $240,000, which was due to additional contingent consideration earned of $795,000, deferred tax adjustments of $630,000, and allowance for doubtful accounts of $75,000.The following unaudited pro forma information for the Company has been prepared as if the acquisition of TGIMIV had occurred on January 1, 2006.2007. The information is based on the historical results of the separate companies and may not necessarily be indicative of the results that could have been achieved or of results that may occur in the future.2006
(In thousands,
except per share
amounts)
(Unaudited ) Revenue $ 46,812 Net income $ 6,274 Earnings per share - basic $ 0.92 Earnings per share - diluted $ 0.90
(3)Investments in Marketable Debt Securities
The Company’s investments in marketable securities are in marketablepro forma adjustments include the impact of depreciation and amortization of property and equipment and intangible assets acquired, interest expense on the acquisition debt, securities classified as obligations of U.S. government agencies. The amortized cost, gross unrealized holding gains and losses and fair valueincome tax benefits for tax effects of the Company’s investment in the obligations of U.S. government agencies as of December 31, 2007foregoing adjustments to depreciation, amortization and 2006, were as follows:
2007
2006
Amortized cost $ 99,714 $ 1,116,963 Gross unrealized holding gains 0 2,727 Gross unrealized holding losses (217 ) (9,586 )
Fair value $ 99,497 $ 1,110,104
35
In May 2006, the Company sold $5.6 million of marketable debt securities in advance of their scheduled maturities to partially fund the purchase of TGI. The Company recognized a loss of $46,000 on these securities sold in advance of their scheduled maturities. There were no sales of marketable debt securities in advance of scheduled maturities of available-for-sale marketable debt securities during 2007. The fair value and amortized cost of marketable debt securities at December 31, 2007, by contractual maturity, are shown below. Actual maturities may differ from the contractual maturities because borrowers may have the right to call or prepay obligations with or without call or prepayment penalties.
At December 31, 2007
Fair
Value
Amortized
Cost
Due after three months through one year $ -- $ -- Due after one year through five years 99,497 99,714
$ 99,497 $ 99,714
Gross unrealized losses on investment securities and the fair value of the related securities, aggregated by investment category and length of time that individual securities have been in a continuous unrealized loss position, at December 31, 2007, were as follows:
Less than 12 months
12 months or more
Total
Unrealized
Losses
Fair
Value
Unrealized
Losses
Fair
Value
Unrealized
Losses
Fair
Value
Available for Sale: Certificate of Deposit -- -- $ (217 ) $ 99,497 $ (217 ) $ 99,497
The contractual term of this investment does not permit the issuer to settle the security at a price less than the amortized cost of the investment. Because the Company has the ability and intent to hold this investment until a market price recovery or maturity, these investments are not considered other-than-temporarily impaired.
2008 2007 (In thousands, except per share amounts)(Unaudited) Revenue $ 58,008 $ 54,904 Net income $ 7,457 $ 6,586 Earnings per share - basic $ 1.12 $ 0.96 Earnings per share - diluted $ 1.09 $ 0.94
(4)(3)Property and Equipment
At December 31, 20072009 and 2006,2008, property and equipment consisted of the following:2007
2006
Furniture and equipment $ 2,350,644 $ 2,266,347 Computer equipment and software 12,788,061 11,312,691 Building 9,108,247 8,651,441 Land 425,000 425,000
24,671,952 22,655,479 Less accumulated depreciation and amortization 12,697,923 10,939,546
Net property and equipment $ 11,974,029 $ 11,715,933
36
2009 2008 (In thousands) Furniture and equipment $ 2,639 $ 2,536 Computer equipment and software 16,911 14,467 Building 9,130 9,108 Land 425 425 29,105 26,536 Less accumulated depreciation and amortization 15,130 12,789 Net property and equipment $ 13,975 $ 13,747
(5)(4)Goodwill and Intangible Assets
Goodwill and intangible assets consisted of the following at December 31, 20072009 and 2006:2007
2006
Goodwill $ 31,051,202 $ 30,014,337
Non-amortizing other intangible assets: Trade name 1,190,559 1,190,559 Amortizing other intangible assets: Customer related intangibles 4,922,275 4,870,497 Trade name 1,572,000 1,572,000
Total other intangible assets, 7,684,834 7,633,056 Less accumulated amortization 2,068,924 1,159,412
Other intangible assets, net $ 5,615,910 $ 6,473,644
2008:
2009 2008 (In thousands) Goodwill $ 39,924 $ 39,276 Non-amortizing other intangible assets: Trade name 1,191 1,191 Amortizing other intangible assets: Customer related intangibles 8,174 8,150 Trade name 1,572 1,572 Total other intangible assets, 10,937 10,913 Less accumulated amortization 4,054 2,857 Other intangible assets, net $ 6,883 $ 8,056
36
The following represents a summary of changes in the Company’s carrying amount of goodwill for the years ended December 31, 2009, 2008, and 2007: (In thousands) Balance as of December 31, 2006 $ 30,014 Smaller World additional payment for contingent consideration 652 Foreign currency translation 385 Balance as of December 31, 2007 $ 31,051 MIV acquisition 8,833 Foreign currency translation (608 ) Balance as of December 31, 2008 $ 39,276 Foreign currency translation 408 MIV deferred tax adjustments (630 ) MIV allowance for doubtful accounts 75 MIV contingent consideration earned 795 Balance as of December 31, 2009 $ 39,924
The merger agreement under which the Company acquired MIV provided for contingent earn-out payments over three years based on growth in revenue and earnings. As of December 31, 2009, a contingent earn-out payment of $795,000 was accrued, which was then paid in February 2010.During 2007, an additional payment was made to Smaller World Communications for contingent consideration in accordance with the purchase agreement. The purchase agreement included two scheduled payments of additional purchase price in 2006 and 2006:Balance as of January 1, 2006 $ 11,483,401 GHS adjustment - deferred taxes 257,001 TGI acquisition 18,221,635 Smaller World additional payment 52,068 Foreign currency translation 232
Balance as of December 31, 2006 $ 30,014,337 Smaller World additional payment 651,725 Foreign currency translation 385,140
Balance as of December 31, 2007 $ 31,051,202
2008 of $536,000 and $714,000 respectively, as a result of meeting certain revenue goals.
On April 1, 2008, approximately 10 customer contracts were purchased from SQ Strategies for $249,000. The change in the carrying amountrecording of goodwill andthis purchase increased customer related intangibles by $260,000 and deferred revenues by $11,000.Aggregate amortization expense for customer related intangibles and trade names for the year ended December 31, 2007, included the impact of the foreign currency translation and the additional purchase price for the Smaller World acquisition. Customer related intangibles consisted of customer relationships and surveys, which are being amortized over their estimated useful lives of five to fifteen years. Aggregate amortization expense for customer relationships/surveys for the year ended December 31, 2007,2009, was $864,000.$1.2 million. Estimated amortization expense for the next five years is: 2010—$1.2 million; 2011—$1.1 million; 2012—$836,000; 2013—$572,000; 2014—$543,000; thereafter $1.5 million.(5) Income TaxesFor the years ended December 31, 2009, 2008, — $805,000; 2009 — $795,000; 2010 — $795,000; 2011 — $766,000; 2012 — $470,000.and 2007, income before income taxes consists of the following: 2009 2008 2007 U.S. Operations $ 11,497 $ 10,406 $ 9,664 Foreign Operations 1,620 1,577 1,453 $ 13,117 $ 11,983 $ 11,117
37
37
(6)Income Taxes
Income tax expense consisted of the following components:Current
Deferred
Total
2007: Federal $ 2,971,325 $ 65,159 $ 3,036,484 Foreign 587,658 (20,870 ) 566,788 State 602,751 72,349 675,100
Total $ 4,161,734 $ 116,638 $ 4,278,372
2006: Federal $ 2,683,441 $ 109,575 $ 2,793,016 Foreign 234,340 (20,929 ) 213,411 State 604,718 10,542 615,260
Total $ 3,522,499 $ 99,188 $ 3,621,687
2005: Federal $ 2,231,717 $ 238,868 $ 2,470,585 Foreign 286,573 (18,894 ) 267,679 State 494,669 45,437 540,106
Total $ 3,012,959 $ 265,411 $ 3,278,370
Current Deferred Total 2009: Federal $ 2,433 $ 1,109 $ 3,542 Foreign 532 3 535 State (21 ) 570 549 Total $ 2,944 $ 1,682 $ 4,626 2008: Federal $ 2,963 $ 350 $ 3,313 Foreign 549 (5 ) 544 State 596 85 681 Total $ 4,108 $ 430 $ 4,538 2007: Federal $ 2,971 $ 65 $ 3,036 Foreign 588 (21 ) 567 State 603 72 675 Total $ 4,162 $ 116 $ 4,278
The difference between the Company’s income tax expense as reported in the accompanying consolidated financial statements and the income tax expense that which would be calculated applying the U.S. federal income tax rate of 34% on pretax income was as follows:2007
2006
2005
Expected federal income taxes $ 3,779,911 $ 3,231,957 $ 2,894,917 Foreign tax rate differential 30,966 23,492 30,674 State income taxes, net of federal benefit and credits 445,567 406,072 356,470 Tax credits and incentives (51,488 ) (36,938 ) (34,980 ) Other 73,416 (2,896 ) 31,289
Total $ 4,278,372 $ 3,621,687 $ 3,278,370
2009 2008 2007 Expected federal income taxes $ 4,460 $ 4,074 $ 3,780 Foreign tax rate differential (16 ) (8 ) 31 State income taxes, net of federal benefit and state tax credits 362 449 446 Federal tax credits (183 ) (51 ) (51 ) Uncertain tax positions 27 — — Valuation allowance 18 — — Other (42 ) 74 73 Total $ 4,626 $ 4,538 $ 4,278
38
38
Deferred tax assets and liabilities at December 31, 20072009 and 2006,2008, were comprised of the following:2007
2006
Deferred tax assets: Allowance for doubtful accounts $ 27,383 $ 17,278 Accrued expenses 204,280 186,523 Stock based compensation 827,523 389,530 Other -- 34,784
Gross deferred tax assets 1,059,186 628,115
Deferred tax liabilities: Prepaid expenses 164,652 147,635 Basis in property and equipment 985,066 1,109,895 Intangible assets 1,958,647 1,309,998 Other 9,904 -- Gross deferred tax liabilities 3,118,269 2,567,528
Net deferred tax liabilities $ (2,059,083 ) $ (1,939,413 )
The Company did not record a valuation allowance for its
2009 2008 Deferred tax assets: Allowance for doubtful accounts $ 105 $ 93 Accrued expenses 248 231 Share based compensation 1,034 892 Other — 83 Gross deferred tax assets 1,387 1,299 Less Valuation Allowance (47 ) — Deferred tax assets 1,340 1,299 Deferred tax liabilities: Prepaid expenses 188 243 Property and equipment 1,602 1,263 Intangible assets 4,282 3,762 Other 296 — Deferred tax liabilities 6,368 5,268 Net deferred tax liabilities $ (5,028 ) $ (3,969 )
In assessing the realizablility of deferred tax assets, because management believes thatthe Company considers whether it is more likely than not that some portion or all of the deferred tax assets will not be realized. The ultimate realization of deferred tax assets is dependent upon the generation of future taxable income during the periods in which those temporary differences become deductible. The Company considers projected future taxable income, carryback opportunities and tax planning strategies in making this assessment. Based upon the level of historical taxable income and projections for future taxable income over the periods which the deferred tax assets are deductible, the Company believes it is more likely than not that it will generate sufficient taxablerealize the benefits of these deductible differences, net of the valuation allowance recorded. The net impact on income tax expense related to fully realize these deferredchanges in the valuation allowance for 2009 and 2008 were $18,000 and $0, respectively. The current year change relates to increases to the valuation allowance for capital loss carryforwards.
The Company has capital loss carryforwards of $123,000 which will begin to expire in 2010. A total of $76,000 of the capital loss carryforwards relate to the pre-acquisition periods of acquired companies. The Company has provided a $47,000 valuation allowance against the tax benefits.benefit associated with the capital loss carryforwards.
The undistributed foreign earnings of the Company’s foreign subsidiary of approximately $2.4$4.1 million are considered to be indefinitely reinvested. Accordingly, no provision for U.S. federal and state income taxes or foreign withholding taxes have been provided for such undistributed earnings. It is impractical to determine the additional income tax liability, if any, associated with the repatriation of undistributed earnings.
Effective January 1, 2007, the Company adopted guidance regarding accounting for uncertainty in income taxes. This accounting standards adoption had no impact on the Company. The unrecognized tax benefit at December 31, 2009 was $541,000, excluding interest of $3,000 and no penalties. Of this amount $78,000 represents the net unrecognized tax benefits that, if recognized, would favorably impact the effective income tax rate.
The Company accrues interest and penalties related to uncertain tax position in the statements of income as income tax expense.
39
The Company believes it is reasonably possible that the total amount of unrecognized tax benefits will not decrease within the next 12 months.
The change in the unrecognized tax benefits for 2009 is as follows. There was no change in unrecognized tax benefits during 2008. (In thousands) Balance of unrecognized tax benefits at December 31, 2008 $ — Increases for tax positions established during prior years 509 Increases for tax positions established for the current period 32 Balance of unrecognized tax benefits at December 31, 2009 $ 541
The Company files a U.S. federal income tax return, various state jurisdictions and a Canada federal and provincial income tax return. The 2006 to 2009 U.S. federal and state returns remain open to examination. The 2005 to 2009 Canada federal and provincial income tax returns remain open to examination.
(7)(6)Notes Payable
Notes payable consisted of the following:2007
2006
Note payable to US Bank, interest 7.21% fixed rate, scheduled principal payment ranging from $88,000 - $94,000, final payment of interest and principal due May 31, 2013, secured by land, building, accounts receivable and intangibles 2,993,352 8,697,973 Credit facility with US Bank, subject to borrowing base of 75% of eligible accounts receivable, matures July 31, 2008, maximum available $3.5 million -- 2,395,000
Total Notes Payable 2,993,352 11,092,973 Less current portion 1,092,754 3,110,106
Note payable, net of current portion $ 1,900,598 $ 7,982,867
2009 2008 (In thousands) Note payable to US Bank, interest 5.2% fixed rate, 35 scheduled principal and interest payments of $97,000, final balloon payment of interest and principal due December 31, 2011, secured by land, building, accounts receivable and intangible assets. 7,659 9,000 Revolving credit note with US Bank, subject to borrowing base of 75% of eligible accounts receivable, matures July 31, 2010, maximum available $6.5 million — 3,850 Capital leases 60 90 Other debt — 15 Total notes payable 7,719 12,955 Less current portion 816 4,581 Note payable, net of current portion $ 6,903 $ 8,374
On May 26, 2006, the Company entered into a credit facility pursuant to which it borrowed $9.0 million under a term note and $3.5 million under a revolving credit note in order to partially finance the acquisition of TGI. The term note is payable pursuant towas refinanced on February 25, 2008, for the credit facility in 83 equal installmentsremaining balance of $106,000, with the balanceterm note of $1.6 million. The refinanced term note required payments of principal and interest payable on Mayin 17 monthly installments of $93,000 beginning March 31, 2013.2008, and ending August 31, 2009. Borrowings under the refinanced term note bearbore interest at aan annual rate of 7.21% per year.5.14%. The revolving creditCompany made additional payments and paid off the term note provides a revolving credit facility that matures on July 31,in October 2008.
The maximum aggregate amount available under the revolving credit facilitynote was originally $3.5 million, but an addendum to the revolving credit note dated March 26, 2008, changed the revolving credit note amount to $6.5 million. The revolving credit note was renewed in July 2009 to extend the term to July 31, 2010. The Company may borrow, repay and re-borrow amounts under the revolving credit note from time to time until its maturity on July 31, 2010. The maximum aggregate amount available under the revolving credit note is $3.5$6.5 million, subject to a borrowing base equal to 75% of the Company’s eligible accounts receivable. The Company may borrow, repay and reborrow amounts under the revolving credit facility from time to time until its maturity on July 31, 2008. Borrowings under the revolving credit facilitynote bear interest at a variable rate equal to (1) prime (as defined in the credit facility) less 0.50%, or (2) one-, two-, three-, six- or twelve-month LIBOR. As of December 31, 2007,2009, the revolving credit note did not have a balance. According to borrowing base requirements, the Company had no borrowings outstandingthe capacity to borrow $4.2 million as of December 31, 2009.
40
On December 19, 2008, the Company borrowed $9.0 million under a term note to partially finance the acquisition of MIV. The term note is payable in 35 equal installments of $97,000, with the balance of principal and interest payable in a balloon payment due on December 31, 2011. Borrowings under the revolving credit note. Monthly installmentterm note bear interest at a rate of 5.2% per year. In 2009, the Company made principal payments, were madein addition to the monthly installments, on the term note in accordance with the credit facility. Also, additional pay downs on the loan were made with no prepayment penalties.39
totaling $650,000.
The credit facilityterm note is secured by certain of the Company’s assets, including the Company’s land, building, accounts receivable and intangibles.intangible assets. The credit facilityterm note contains various restrictions and covenants applicable to the Company, including requirements that the Company maintain certain financial ratios at prescribed levels and restrictions on the ability of the Company to consolidate or merge, create liens, incur additional indebtedness or dispose of assets. As of December 31, 2009, the Company was in compliance with these restrictions and covenants.
Debt acquired through the MIV acquisition included $90,000 in capital leases. The capital leases are for production and mailing equipment meeting capitalization requirements where the lease term exceeds more than 75% of the estimated useful life. The equipment is being depreciated over the lease term of 4.25 years ending in 2011.The aggregate maturities of the note payable and credit facility for each of the five years subsequent to December 31, 2007,2009, are: 2008 — $1,093,000; 2009 — $1,174,000; 2010 — $726,000; 2011 — $0; and 2012 — $0. TotalPayments 2010 2011 2012 2013 2014 (In thousands) Notes payable $ 7,659 $ 783 $ 6,876 $ — $ — $ —
(8)(7)Stock Option PlansShare-Based Compensation
The Company measures and recognizes compensation expense for all share-based payments. The compensation expense is recognized based on the grant-date fair value of those awards. All of the Company’s existing stock option awards and non-vested stock awards have been determined to be equity–classified awards.In August 2001, the Board of Directors adopted, and on May 1, 2002, the Company’s shareholders approved, the National Research Corporation 2001 Equity Incentive Plan (“2001 Equity Incentive Plan”). The 2001 Equity Incentive Plan provides for the granting of stock options, stock appreciation rights, restricted stock, performance shares and other share-based awards and benefits up to an aggregate of 600,000 shares of the Company’s common stock. Options granted may be either nonqualified or incentive stock options. Options vest over one to five years following the date of grant and option terms are generally five to ten years following the date of grant. At December 31, 2007,2009, there were 51,33278,417 shares available for issuance pursuant to future grants under the 2001 Equity Incentive Plan. The Company has accounted for grants of 548,668521,583 options under the 2001 Equity Incentive Plan using the date of grant as the measurement date for financial accounting purposes.In May 2004, the Board of Directors adopted, and on May 5, 2005, the Company’s shareholders approved the
41
The National Research Corporation 2004 Director Plan (the “2004 Director Plan”). The 2004 Director Plan is a nonqualified plan that provides for the granting of options with respect to 250,000 shares of the Company’s common stock. The 2004 Director Plan provides for grants of nonqualified options to each director of the Company who is not employed by the Company. In May 2004,On the date of each such director was granted an optionannual meeting of shareholders of the Company, options to purchase 11,00012,000 shares of the Company’s common stock. On the date of each subsequent Annual Meeting of Shareholders of the Company, each such director, ifstock are granted to directors that are re-elected or retained as a director at such meeting, is granted an optionmeeting. On May 7, 2009, the Board of Directors amended the plan to purchase 12,000increase the number of shares of common stock authorized for issuance under the plan from 250,000 to 550,000 shares, subject to approval of the Company’s common stock.shareholders at the 2010 annual meeting of shareholders. The grants of options to directors on the date of the 2009 annual meeting of shareholders was also made subject to approval of the Company’s shareholders at the 2010 annual meeting of shareholders. Given the ownership by the CEO and grantor retained annuity trusts that he established in February 2010, approval will be perfunctory. Options vest one year following the date of grant and option terms are generally ten years following the date of grant, or three years in the case of termination of the outside director.director’s service. At December 31, 2007,2009, pending shareholder approval of the increased number of shares at the 2010 annual meeting of shareholders, there were 73,000will be 277,000 shares available for issuance pursuant to future grants under the 2004 Director Plan. The Company has accounted for grants of 177,000 options under the 2004 Director Plan using the date of grant as the measurement date for financial accounting purposes.
In February 2006, the Board of Directors adopted, and on May 4, 2006, the Company’s shareholders approved the National Research Corporation 2006 Equity Incentive Plan (the “2006 Equity Incentive Plan”). The 2006 Equity Incentive Plan provides for the granting of options, stock appreciation rights, restricted stock, performance shares and other share-based awards and benefits up to an aggregate of 600,000 shares of the Company’s common stock. Options granted may be either incentive stock options or nonqualified stock options. Vesting terms vary with each grant, and option terms are generally five to ten years. Options vest over one to five years following the date of grant and options terms are generally five to ten years following the date of grant. At December 31, 2007,2009, there were 533,542427,057 shares available for issuance pursuant to future grants under the 2006 Equity Incentive Plan. The Company has accounted for grants of 66,458172,943 options under the 2006 Equity Incentive Plan using the date of grant as the measurement date for financial accounting purposes.The Company granted options to purchase 131,382, 128,862102,739, 118,475 and 130,688131,382 shares of the Company’s common stock during the years ended December 31, 2007, 20062009, 2008 and 2005,2007, respectively. Options to purchase shares of common stock were granted with exercise prices equal to the fair value of the common stock on the date of grant. The fair value of stock options granted was estimated using a Black-Scholes valuation model with the following assumptions:40
2007
2006
2005
Expected dividend yield at date of grant1.76-1.92%1.77-1.86%1.90-2.25%Expected stock price volatility22.7-29.9%25.0-39.0%38.4-46.3%Risk-free interest rate4.54-4.59%4.41-4.90%3.60-4.17%Expected life of options (in years)4.00 to 6.004.00 to 6.003.75 to 6.00
2009 2008 2007 Expected dividend yield at date of grant 1.93-2.35% 1.87-2.11% 1.76-1.92% Expected stock price volatility 24.2 to 30.2% 21.1-24.2% 22.7-29.9% Risk-free interest rate 1.55% to2.15% 3.18% 4.54-4.59% Expected life of options (in years) 4.00 to 6.00 4.00 to 6.00 4.00 to 6.00
The risk-free interest rate assumptions were based on the U.S. Treasury yield curve in effect at the time of the grant. The expected volatility was based on historical monthly price changes of the Company’s stock based on the expected life of the options at the date of grant. The expected life of options is the average number of years the Company estimates that options will be outstanding. The Company considers groups of associates that have similar historical exercise behavior separately for valuation purposes.The following table summarizes stock option activity under the Company’s 2001 and 2006 Equity Incentive Plans and the 2004 Director Plan for the year ended December 31, 2006:Number of
Options
Weighted
Average
Exercise
Price
Weighted
Average
Remaining
Contractual
Terms (Years)
Aggregate
Intrinsic
Value
Outstanding at beginning of period 475,666 $15.16 -- -- Granted 131,382 $23.67 -- -- Exercised (22,829) $14.88 -- -- Canceled/expired (44,559) $17.57 -- --
Outstanding at end of period 539,660 $17.04 7.14 $5,374,462
Exercisable at end of period 116,341 $18.00 7.14 $1,047,602
2009:
42
Number of Options WeightedAverageExercise Price WeightedAverageRemainingContractualTerms (Years) AggregateIntrinsic Value(Inthousands) Outstanding at beginning of period 492,431 $ 20.77 — — Granted 102,739 $ 27.91 — — Exercised (2,023 ) $ 8.69 — — Canceled/expired (15,325 ) $ 21.73 — — Outstanding at end of period 577,822 $ 22.06 6.74 $ 1,221 Exercisable at end of period 265,959 $ 20.26 5.78 $ 855
The weighted average grant date fair value of stock options granted during the years ended December 31, 2009, 2008 and 2007, 2006was $5.72, $5.67 and 2005, was $6.39, $6.02 and $4.97, respectively. The total intrinsic value of stock options exercised during the years ended December 31, 2009, 2008 and 2007, 2006 and 2005, was $239,000, $1$28,000, $2.3 million and $211,000,$239,000, respectively. As of December 31, 2007,2009, the total unrecognized compensation cost related to non-vested stock option awards was approximately $1.1 million,$810,000, which was expected to be recognized over a weighted average period of 2.64 years.Cash received from stock options exercised for the years ended December 31, 2009, 2008 and 2007, 2006was $18,000, $1.9 million, and 2005, was $338,000, $926,000, and $254,000, respectively. The actual tax benefit realized for the tax deduction from stock options exercised was $92,000, $405,000$11,000, $743,000 and $84,000,$92,000, for the years ended December 31, 2009, 2008 and 2007, 2006respectively.During 2009, 2008 and 2005, respectively.During 2007, 2006 and 2005, the Company granted 32,115, 13,218-0-, -0- and 27,27832,115 non-vested shares of common stock under the 2001 Equity Incentive Plan. As of December 31, 2007,2009, the Company had 66,18321,956 non-vested shares of common stock outstanding under the plan.Plan. These shares vest over one to five years following the date of grant and holders thereof are entitled to receive dividends from the date of grant, whether or not vested. The fair value of the awards is calculated as the fair market value of the shares on the date of grant. The Company recognized $436,820, $168,466$178,000, $220,000 and $112,221$437,000 of non-cash compensation for the years ended December 31, 2007, 20062009, 2008 and 2005,2007, respectively, related to this non-vested stock.
41
The following table summarizes information regarding non-vested stock granted to associates under the 2001 Equity Incentive Plan for the year ended December 31, 2006.Shares
Outstanding
Weighted Average
Grant Date Fair Value
Per Share($)
Outstanding at beginning of period 49,720 $15.45 Granted 32,115 $23.54 Vested (6,543) $17.83 Forfeited (9,109) $11.00
Outstanding at end of period 66,183 $19.75
The total intrinsic value of non-vested stock awards vested during the years ended December 31, 2007, 2006 and 2005, was $167,000, $147,000 and $40,000, respectively. 2009:
SharesOutstanding Weighted AverageGrant Date FairValue Per Share Outstanding at beginning of period 36,502 $ 21.62 Granted — — Vested (10,645 ) $ 23.49 Forfeited (3,901 ) $ 16.15 Outstanding at end of period 21,956 $ 21.68
As of December 31, 2007,2009, the total unrecognized compensation cost related to non-vested stock awards was approximately $695,000$105,000 and is expected to be recognized over a weighted average period of 2.321.73 years.In periods prior to January 1, 2006, the Company applied the intrinsic value based method of APB Opinion No. 25,Accounting for Stock Issued to Employees, and related interpretations to account for its fixed-plan stock options. Under this method, no compensation expense was reflected in net income as all options granted had an exercise price equal to the fair value of common stock on the date of grant. The following table illustrates the effect on the Company’s net income and earnings per share for the year ended December 31, 2005, if compensation expense had been recorded in net income under the fair-value-based method in accordance SFAS No. 123R.
2005
(in thousands, except
per share amounts) Net income: As reported $ 5,236 Less: Total share-based compensation expense determined under the fair value method for all awards, net of tax (341 )
Pro forma $ 4,895
Earnings per share: Basic, as reported $ 0.74 Basic, pro forma $ 0.70 Diluted, as reported $ 0.74 Diluted, pro forma $ 0.69
(9)(8)Leases
The Company leases printing equipment and services in the United States, and office space in Canada, Wisconsin and California. The Company has recorded rent expense of $626,000, $607,000 and $475,000 $386,000in 2009, 2008 and $277,000 in 2007, 2006 and 2005, respectively. Minimum lease payments under noncancelablenon-cancelable operating leases and capital leases are:
43
Minimum lease payments TotalPayments 2010 2011 2012 2013 2014 (In thousands) Operating leases $ 1,600 $ 524 $ 459 $ 432 $ 175 $ 10 Capital leases 65 37 28 — — — Total $ 1,665 $ 561 $ 487 $ 432 $ 175 $ 10
The capital leases are for eachproduction and mailing equipment. Total minimum lease payments remaining are $65,000, with $5,000 representing interest as of December 31, 2009. The present value of the five years subsequent tofuture minimum lease payments are $60,000 less current maturities of $33,000. Long-term obligations under capital leases total $27,000 as of December 31, 2007 are: 2008 — $463,000; 2009 — $391,000; 2010 — $84,000; 2011 — $-0-; 2012 — $-0-.2009.(10)(9)Related Party
A Board member of the Company also serves as a director of the Picker Institute. The Company advanced $300,000 in each of 2004 and 2003 to the Picker Institute to fund designated research projectsprojects. The advance was fully used by December 31, 2008. $171,000 and $175,000 and $254,000 was expensed on research work during 2008 and 2007, and 2006, respectively. In addition,A Board member of the Company is a party to a support services agreementalso serves as an officer of Ameritas Life Insurance Corp. In connection with the Picker Institute underCompany’s regular assessment of its insurance-based associate benefits and the costs associated therewith, which is conducted by an independent insurance broker, in 2007 the Company conductsbegan purchasing dental insurance for certain of its associates from Ameritas Life Insurance Corp. and, in 2009, the annual NRC Picker Symposium. Under the support services agreement, the Picker Institute receives a portionCompany also began purchasing vision insurance for certain of the gross receiptsits associates from Ameritas Life Insurance Corp. The total value of each symposium, which amounted to approximately $15,000these purchases was $113,000, $79,000 and $65,000 in 2009, 2008 and 2007 $12,000 in 2006 and $15,000 in 2005.42
respectively.(11)(10)Associate Benefits
The Company sponsors a qualified 401(k) plan covering substantially all associates with no eligibility service requirement. Under the 401(k) plan, the Company matches 25% of the first 6% of compensation contributed by each associate. Employer contributions, which are discretionary, vest to participants at a rate of 20% per year. The Company contributed $151,000, $151,000 and $127,000 in 2009, 2008 and $124,000 in 2007, and 2006, respectively, as a matching percentage of associate 401(k) contributions. No contributions were made by the Company in 2005.(12)Subsequent Events
In February 2006, the Company’s Board of Directors authorized a stock repurchase plan providing for the repurchase of an additional 750,000 shares. The plan has no expiration date.
Subsequent to December 31, 2007, the Company has repurchased 263,013 shares of common stock at an approximate cost of $6.6 million and an average per share price of $24.91.
Item 9.Changes in and Disagreements with Accountants on Accounting and Financial Disclosure
Item 9. Changes in and Disagreements with Accountants on Accounting and Financial Disclosure
Not applicable.Item 9A.Controls and Procedures
Item 9A. Controls and Procedures
In accordance with Rule 13a-15(b) of the Securities Exchange Act of 1934 (the “Exchange Act”), the Company’s management evaluated, with the participation of the Company’s Chief Executive Officer and the Company’s Chief Financial Officer, the effectiveness of the design and operation of the Company’s disclosure controls and procedures (as defined in Rule 13a-15(e) and 15d-15(e) under the Exchange Act) as of December 31, 2007.2009. Based upon their evaluation of these disclosure controls and procedures, the Chief Executive Officer and the Chief Financial Officer concluded that the disclosure controls and procedures were effective as of December 31, 2007.2009.
44
The Company’s management is responsible for establishing and maintaining adequate internal control over financial reporting (as defined in Rule 13a-15(f) of the Exchange Act). The Company’s internal control over financial reporting is designed to provide reasonable assurance regarding the reliability of financial reporting and the preparation of financial statements for external purposes in accordance with generally accepted accounting principles. Because of its inherent limitations, however, internal control over financial reporting may not prevent or detect misstatements. Also, projections of any evaluation of effectiveness to future periods are subject to the risk that controls may become inadequate because of changes in conditions, or that the degree of compliance with the policies of procedures may deteriorate.The Company’s management, with the participation of the Company’s Chief Executive Officer and Chief Financial Officer, has evaluated the effectiveness of the Company’s internal control over financial reporting using the framework inInternal Control – Integrated Framework issued by the Committee of Sponsoring Organizations of the Treadway Commission. Based on such evaluation, the Company’s management concluded that the Company’s internal control over financial reporting was effective as of December 31, 2007.2009.There was no change in the Company’s internal control over financial reporting that occurred during the quarter ended December 31, 2007,2009, that has materially affected, or is reasonably likely to materially affect, the Company’s internal control over financial reporting.43
This annual report does not include an attestation report of the Company’s registered public accounting firm regarding internal control over financial reporting. Management’s report was not subject to attestation by the Company’s registered public accounting firm pursuant to temporary rules of the Securities and Exchange Commission that permit the Company to provide only management’s report in this annual report.Item 9B.Other Information
Item 9B. Other Information
The Company has no other information to report pursuant to this item.
45
44
PART IIIItem 10.Directors, Executive Officers and Corporate Governance
Item 10. Directors, Executive Officers and Corporate Governance
The information required by this Item with respect to directors and Section 16 compliance is included under the captions “Election of Directors” and “Section 16(a) Beneficial Ownership Reporting Compliance,” respectively, in the Company’s definitive Proxy Statement for its 20082010 Annual Meeting of Shareholders (“Proxy Statement”) and is hereby incorporated herein by reference. Information with respect to the executive officers of the Company appears in Item 1 of this Annual Report on Form 10-K. The information required by this Item with respect to audit committees and audit committee financial experts is included under the caption “Corporate Governance” in the Proxy Statement and is incorporated herein by reference.The Company has adopted a Code of Business Conduct and Ethics that applies to all of the Company’s associates, including the Company’s Chief Executive Officer, Chief Financial Officer, Controller and other persons performing similar functions. The Company has posted a copy of the Code of Business Conduct and Ethics on its website atwww.nationalresearch.com. The Company intends to satisfy the disclosure requirements under Item 5.05 of Form 8-K regarding amendments to, or waivers from, the Code of Business Conduct and Ethics by posting such information on its website atwww.nationalresearch.com. The Company is not including the information contained on its website as part of, or incorporating it by reference into, this report.Item 11.Executive Compensation
Item 11. Executive Compensation
The information required by this Item is included under the captions “Compensation Discussion and Analysis,” “Summary“2009 Summary Compensation Table,” “Grants of Plan-Based Awards in 2009,” “Outstanding Equity Awards at December 31, 2007,2009,” “Option Exercises and Stock Vested,” “Director“2009 Director Compensation” and “Compensation Committee Report” in the Proxy Statement and is hereby incorporated herein by reference.Item 12.Security Ownership of Certain Beneficial Owners and Management and Related Shareholder Matters
Item 12. Security Ownership of Certain Beneficial Owners and Management and Related Shareholder Matters
The information required by this Item with respect to security ownership of certain beneficial owners and management is included under the caption “Principal Shareholders” in the Proxy Statement and is hereby incorporated by reference.The following table sets forth information with respect to compensation plans under which equity securities of the Company are authorized for issuance as of December 31, 2007.Plan Category
Number of securities to be
issued upon the exercise of
outstanding options,
warrants and
rights
Weighted-average exercise
price of outstanding
options,
warrants and rights
Number of securities remaining
available for future issuance
under equity compensation
plans (excluding securities
reflected in the first column)
Equity compensation plans approved by security holders(1) 539,660 $17.04 657,874(2)
Equity compensation plans not approved by security holders -- -- --
Total539,660 $17.04 657,874
46
Plan Category Number of securities to be issued upon the exercise of outstanding options,warrants and rights Weighted-average exercise price ofoutstanding options, warrants and rights Number of securities remaining available for future issuance under equity compensation plans (excluding securities reflected in the first column) Equity compensation plans approved by security holders (1) 554,822 $ 21.80 505,474 (2) Equity compensation plans not approved by security holders 23,000 27.23 277,000 (3) Total 577,822 $ 22.06 782,474
(1) Includes the Company’s 2006 Equity Incentive Plan, 2004 Director Plan, and the 2001 Equity Incentive Plan.
(2) As of December 31, 2007,2009, the Company had authority to award up to 152,455161,854 additional shares of restricted Common Stock to participants under the 2001 Equity Incentive Plan, provided that the total of such shares awarded may not exceed the total number of shares remaining available for issuance under the 2001 Equity Incentive Plan, which totaled 51,33278,417 as of December 31, 2007.2009. Under the 2006 Equity Incentive Plan, the Company had authority to award up to 167,885 additional shares of restricted Common Stock.Stock to participants under the 2006 Equity Incentive Plan, provided that the total of such shares awarded may not exceed the total number of shares remaining available for issuance under the 2006 Equity Incentive Plan, which totaled 427,057 as of December 31, 2009.
45
Item 13.Certain Relationships and Related Transactions
(3) As of December 31, 2009, the Company had authority to award up to 277,000 additional shares of Common Stock to participants under the 2004 Directors Plan, subject to approval by the Company’s shareholders at the 2010 annual meeting of shareholders of the amendment to the plan adopted, on May 7, 2009 by the Board of Directors to increase the number of shares of common stock authorized for issuance under the plan from 250,000 to 550,000 shares. The Board of Directors conditioned the amendment, on the approval of the Company’s shareholders at the 2010 annual meeting of shareholders. The grants of options to directors on the date of the 2009 annual meeting of shareholders were also made subject to approval of the Company’s shareholders at the 2010 annual meeting of shareholders.
Item 13. Certain Relationships and Related Transactions, and Director Independence
The information required by this Item is included under the caption “Corporate Governance — Transactions with Related Persons”Governance—” in the Proxy Statement and is hereby incorporated by reference.Item 14.Principal Accountant Fees and Services
Item 14. Principal Accountant Fees and Services
The information required by this Item is included under the caption “Miscellaneous-Independent“Miscellaneous—Independent Registered Public Accounting Firm” in the Proxy Statement and is hereby incorporated by reference.
46
47
PART IVItem 15.Exhibits, Financial Statement Schedules
Item 15. Exhibits, Financial Statement Schedules (a) 1. Consolidated financial statements –- The consolidated financial statements listed in the accompanying index to the consolidated financial statements and financial statement schedule are filed as part of this Annual Report on Form 10-K.
2. Financial statement schedule –- The financial statement schedule listed in the accompanying index to the consolidated financial statements and financial statement schedule is filed as part of this Annual Report on Form 10-K.
3. Exhibits –- The exhibits listed in the accompanying exhibit index are filed as part of this Annual Report on Form 10-K.
48
NATIONAL RESEARCH CORPORATION AND SUBSIDIARYSCHEDULE II — VALUATION AND QUALIFYING ACCOUNTS
Balance atBeginning of Year MIVAcquisition Bad DebtExpense Write-offsNet ofRecoveries Balanceat Endof Year (In thousands) Allowance for doubtful accounts: Year Ended December 31, 2007 $ 44 $ — $ 29 $ 3 $ 70 Year Ended December 31, 2008 $ 70 $ 69 $ 168 $ 66 $ 241 Year Ended December 31, 2009 $ 241 $ 75 $ 138 $ 175 $ 279
47
SIGNATURES
Pursuant to the requirements
See accompanying report of Section 13 or 15(d) of the Securities Exchange Act of 1934, the Registrant has duly caused this report to be signed on its behalf by the undersigned, thereunto duly authorized, on this 28th day of March 2008.NATIONAL RESEARCH CORPORATION
By /s/ Michael D. Hays Michael D. Hays Chief Executive Officer
Pursuant to the requirements of the Securities Exchange Act of 1934, this report has been signed below by the following persons on behalf of the Registrant and in the capacities and on the dates indicated.
Signature
Title
Date
/s/ Michael D. HaysChief Executive Officer and Director (PrincipalMarch 28, 2008Michael D. HaysExecutive Officer)
/s/ Patrick E. BeansVice President, Treasurer, Secretary, ChiefMarch 28, 2008Patrick E. BeansFinancial Officer and Director (PrincipalFinancial and Accounting Officer)
/s/ Joseph W. CarmichaelPresident and DirectorMarch 28, 2008Joseph W. Carmichael
/s/ JoAnn M. MartinDirectorMarch 28, 2008JoAnn M. Martin
/s/ John N. NunnellyDirectorMarch 28, 2008John N. Nunnelly
/s/ Paul C. Schorr IIIDirectorMarch 28, 2008Paul C. Schorr III
/s/ Gail L. WardenDirectorMarch 28, 2008Gail L. Warden
independent registered public accounting firm.
48
49
INDEX TO CONSOLIDATED FINANCIAL STATEMENTS
AND FINANCIAL STATEMENT SCHEDULE
Page in this
Form 10-K
Report of Independent Registered Public Accounting Firm 24 Consolidated Balance Sheets as of December 31, 20072009 and 20062008 25 Consolidated Statements of Income for the Three Years Ended December 31, 20072009 26 Consolidated Statements of Shareholders’ Equity and Comprehensive Income as of and for the Three Years Ended December 31, 20072009 27 Consolidated Statements of Cash Flows for the Three Years Ended December 31, 20072009 28 Notes to Consolidated Financial Statements 29 Schedule II--II — Valuation and Qualifying Accounts 50 49
All other financial statement schedules are omitted since the required information is not present or is not present in amounts sufficient to require submission of the schedules, or because the information required is included in the consolidated financial statements and notes thereto.
49
50
NATIONAL RESEARCH CORPORATION AND SUBSIDIARY
SCHEDULE II — VALUATION AND QUALIFYING ACCOUNTS
Balance at
Beginning
of Year
Bad Debt
Expense
Write-offs
Net of
Recoveries
Balance
at End
of Year
Allowance for doubtful accounts: Year Ended December 31, 2005 $ 100,526 $ 2,657 $ -- $ 103,183 Year Ended December 31, 2006 $ 103,183 $ (58,881 ) $ -- $ 44,302 Year Ended December 31, 2007 $ 44,302 $ 28,510 $ 2,600 $ 70,212
See accompanying
SIGNATURESPursuant to the requirements of Section 13 or 15(d) of the Securities Exchange Act of 1934, the Registrant has duly caused this report to be signed on its behalf by the undersigned, thereunto duly authorized, on this 31st day of independent registered public accounting firm.March 2010.NATIONAL RESEARCH CORPORATION By /s/ Michael D. Hays Michael D. Hays President and Chief Executive Officer
Pursuant to the requirements of the Securities Exchange Act of 1934, this report has been signed below by the following persons on behalf of the Registrant and in the capacities and on the dates indicated.
50
Signature Title Date /s/ Michael D. Hays President, Chief Executive Officer and Director March 31, 2010 Michael D. Hays (Principal Executive Officer) /s/ Patrick E. Beans Vice President, Treasurer, Secretary, Chief March 31, 2010 Patrick E. Beans Financial Officer and Director (Principal Financial and Accounting Officer) /s/ JoAnn M. Martin Director March 31, 2010 JoAnn M. Martin /s/ John N. Nunnelly Director March 31, 2010 John N. Nunnelly /s/ Paul C. Schorr III Director March 31, 2010 Paul C. Schorr III /s/ Gail L. Warden Director March 31, 2010 Gail L. Warden
51
EXHIBIT INDEXExhibit
Number Exhibit Description
(3.1) Articles of Incorporation of National Research Corporation, as amended to date [Incorporated by reference to Exhibit (3.1) to National Research Corporation’s Registration Statement on Form S-1 (Registration No. 333-33273)]
(3.2) By-Laws of National Research Corporation, as amended to date [Incorporated by reference to Exhibit (3.2) to National Research Corporation’s Current Report on Form 8-K dated October 10, 2007May 8, 2009 (File No. 0-29466)]
(10.1)*(4.1) Installment or Single Payment Note, dated as of December 19, 2008, from National Research Corporation 1997 Equity Incentive Planto U.S. Bank National Association [Incorporated by reference to Exhibit (10.2)(4.1) to National Research Corporation’s Registration StatementCurrent Report on Form S-1 (Registration8-K dated December 19, 2008 (File No. 333-33273)0-294660)]
(10.2)(10.1)* National Research Corporation 2001 Equity Incentive Plan [Incorporated by reference to National Research Corporation'sCorporation’s Proxy Statement for the 2002 Annual Meeting of Shareholders, filed with the Securities and Exchange Commission on April 3, 2002 (File No. 0-29466)]
(10.3)(10.2)* National Research Corporation 2006 Equity Incentive Plan [Incorporated by reference to National Research Corporation'sCorporation’s Proxy Statement for the 2006 Annual Meeting of Shareholders, filed with the Securities and Exchange Commission on April 3, 2006 (File No. 0-29466)]
(10.4)(10.3)* National Research Corporation Director Stock Plan, as amended to date [Incorporated by reference to Exhibit (10.2) to National Research Corporation’s Annual Report on Form 10-K for the year ended December 31, 1997 (File No. 0-29466)]
(10.5)(10.4)* National Research Corporation 2004 Director Stock Plan [Incorporated by reference to National Research Corporation'sCorporation’s Proxy Statement for the 2005 Annual Meeting of Shareholders, filed with the Securities and Exchange Commission on April 4, 2005 (File No. 0-29466)]
(10.6)Asset Purchase Agreement, dated as of September 16, 2005, among National Research Corporation, Geriatric Health Systems, LLC, Health Services Benefit Administrators, Inc. and Peter Yedidia [Incorporated by reference to Exhibit 2.1 to National Research Corporation’s current Report of Form 8-K dated September 16, 2005 (File No. 0-29466)]
(10.7)(10.5)+Contract, dated January 23, 2002, between National Research Corporation and the Department of Veterans Affairs [Incorporated by reference to Exhibit (10.4) to National Research Corporation’s Annual Report on Form 10-K for the year ended December 31, 2001 (File No. 0-29466)]
(10.8)(10.6)* Form of Nonqualified Stock Option Agreement (for new associates) used in connection with the 2001 Equity Incentive Plan [Incorporated by reference to Exhibit 4.4 to National Research Corporation’s Registration Statement on Form S-8 (Registration No. 333-120530)]
(10.9)(10.7)* Form of Nonqualified Stock Option Agreement (for officers) used in connection with the 2001 Equity Incentive Plan [Incorporated by reference to Exhibit 4.5 to National Research Corporation’s Registration Statement on Form S-8 (Registration No. 333-120530)]
51
(10.10)(10.8)* Form of Restricted Stock Agreement for executive officers used in connection with the 2001 Equity Incentive Plan [Incorporated by reference to Exhibit 10.2 to National Research Corporation’s Current Report on Form 8-K dated March 19, 2005 (File No. 0-29466)]
(10.11)(10.9)* Form of Restricted Stock Agreement (one year vesting) used in connection with the 2001 Equity Incentive Plan [Incorporated by reference to Exhibit 4.6 to National Research Corporation’s Registration Statement on Form S-8 (Registration No. 333-120530)]
52
(10.12)ExhibitNumberExhibit Description (10.10)* Form of Restricted Stock Agreement (five year vesting) used in connection with the 2001 Equity Incentive Plan [Incorporated by reference to Exhibit 4.7 to National Research Corporation’s Registration Statement on Form S-8 (Registration No. 333-120530)]
(10.13)(10.11)* Restricted Stock Incentive Plan for Joseph W. Carmichael, as amended and restated, under the 2001 Equity Incentive Plan [Incorporated by reference to Exhibit 10.2 to National Research Corporation’s Current Report on Form 8-K dated March 3, 2006 (File No. 0-29466)]
(10.14)(10.12)* Director’s Compensation Summary [Incorporated by reference to Exhibit (10.1) to National Research Corporation’s QuarterlyAnnual Report on Form 10-Q for the quarter ended March 31, 2007 (File No. 0-29466)]
(10.15)(10.13)* Form of Nonqualified Stock Option Agreement used in connection with the 2006 Equity Incentive Plan [Incorporated by reference to Exhibit (10.14) to National Research Corporation’s Annual Report on Form 10-K for the year ended December 31, 20072006 (File No. 0-29466)]
(10.16)(10.14)* Form of Restricted Stock Agreement used in connection with the 2006 Equity Incentive Plan [Incorporated by reference to Exhibit (10.15) to National Research Corporation’s Annual Report on Form 10-K for the year ended December 31, 20072006 (File No. 0-29466)]
(23)(10.15) Merger Agreement, dated as of November 26, 2008, by and among National Research Corporation, NRC Acquisition, Inc., My Innerview, Inc., Neil L. Gulsvig and Janice L. Gulsvig [Incorporated by reference to Exhibit (2.1) to National Research Corporation’s Current Report on Form 8-K dated November 26, 2008 (File No. 0-29466)] (23.1) Consent of Independent Registered Public Accounting Firm
(31.1) Certification of the Chief Executive Officer pursuant to Section 302 of the Sarbanes-Oxley Act of 2002
(31.2) Certification of the Chief Financial Officer pursuant to Section 302 of the Sarbanes-Oxley Act of 2002
(32.1) Certification of Periodic Financial Report by the Chief Executive Officer and Chief Financial Officer pursuant to Section 906 of the Sarbanes-Oxley Act of 2002
(99.1) Proxy Statement for the 20082010 Annual Meeting of Shareholders, to be filed within 120 days of December 31, 20072009 [To be filed with the Securities and Exchange Commission under Regulation 14A within 120 days after December 31, 2007;2009; except to the extent specifically incorporated by reference, the Proxy Statement for the 20082010 Annual Meeting of Shareholders shall not be deemed to be filed with the Securities and Exchange Commission as part of this Annual Report on Form 10-K]
* A management contract or compensatory plan or arrangement.
+ Portions of this exhibit have been redacted and are subject to a confidential treatment request filed with the Secretary of the Securities and Exchange Commission pursuant to Rule 24b-2 under the Securities Exchange Act of 1934, as amended. The redacted material was filed separately with the Securities and Exchange Commission.
52
53
As discussed in notes 1 and 8, the Company changed its method of recording stock-based compensation in 2006.
| Assets | 2007 | 2006 | ||||||
|---|---|---|---|---|---|---|---|---|
| Current assets: | ||||||||
| Cash and cash equivalents | $ | 3,355,141 | $ | 876,360 | ||||
| Investments in marketable debt securities | 99,497 | 1,110,104 | ||||||
| Trade accounts receivable, less allowance for doubtful accounts of $70,212 and $44,302 | ||||||||
| in 2007 and 2006, respectively | 6,378,914 | 6,733,595 | ||||||
| Unbilled revenue | 1,377,427 | 2,272,194 | ||||||
| Prepaid expenses and other | 1,068,446 | 1,058,017 | ||||||
| Recoverable income taxes | 272,219 | 898,264 | ||||||
| Deferred income taxes | 48,657 | 48,410 | ||||||
| Total current assets | 12,600,301 | 12,996,944 | ||||||
Net property and equipment | 11,974,029 | 11,715,933 | ||||||
| Intangible assets | 5,615,910 | 6,473,644 | ||||||
| Goodwill | 31,051,202 | 30,014,337 | ||||||
| Deferred income taxes | 590,034 | 279,865 | ||||||
| Other | 37,317 | 51,268 | ||||||
Total assets | $ | 61,868,793 | $ | 61,531,991 | ||||
Liabilities and Shareholders’ Equity | ||||||||
| Current liabilities: | ||||||||
| Current portion of note payable | $ | 1,092,754 | $ | 3,110,106 | ||||
| Accounts payable | 1,106,317 | 1,152,657 | ||||||
| Accrued wages, bonus and profit sharing | 1,477,021 | 1,593,823 | ||||||
| Accrued expenses | 1,386,133 | 358,577 | ||||||
| Billings in excess of revenue earned | 9,921,763 | 8,263,692 | ||||||
| Total current liabilities | 14,983,988 | 14,478,855 | ||||||
Note payable, net of current portion | 1,900,598 | 7,982,867 | ||||||
| Deferred income taxes | 2,697,774 | 2,267,688 | ||||||
| Other long-term liabilities | -- | 52,068 | ||||||
| Total liabilities | 19,582,360 | 24,781,478 | ||||||
Shareholders’ equity: | ||||||||
| Common stock, $.001 par value; authorized 20,000,000 shares, issued 7,883,289 in 2007 | ||||||||
| and 7,837,848 in 2006, outstanding 6,926,442 in 2007 and 6,890,631 in 2006 | 7,883 | 7,838 | ||||||
| Additional paid-in capital | 23,508,717 | 21,819,709 | ||||||
| Retained earnings | 30,003,606 | 26,488,308 | ||||||
| Accumulated other comprehensive income, net of taxes | 931,655 | 359,025 | ||||||
| Treasury stock, at cost; 956,847 shares in 2007 and 947,217 shares in 2006 | (12,165,428 | ) | (11,924,367 | ) | ||||
| Total shareholders’ equity | 42,286,433 | 36,750,513 | ||||||
Total liabilities and shareholders’ equity | $ | 61,868,793 | $ | 61,531,991 | ||||
| 2009 | 2008 | |||||||
| Assets | ||||||||
| Current assets: | ||||||||
| Cash and cash equivalents | $ | 2,512 | $ | 1,109 | ||||
| Trade accounts receivable, less allowance for doubtful accounts of $279 and $241 in 2009 and 2008, respectively | 5,214 | 6,531 | ||||||
| Unbilled revenue | 1,173 | 810 | ||||||
| Prepaid expenses and other | 1,864 | 1,300 | ||||||
| Recoverable income taxes | 803 | 574 | ||||||
| Deferred income taxes | 98 | 115 | ||||||
| Total current assets | 11,664 | 10,439 | ||||||
| Net property and equipment | 13,975 | 13,747 | ||||||
| Intangible assets, net | 6,883 | 8,056 | ||||||
| Goodwill | 39,924 | 39,276 | ||||||
| Other | 53 | 627 | ||||||
| Total assets | $ | 72,499 | $ | 72,145 | ||||
| Liabilities and Shareholders’ Equity | ||||||||
| Current liabilities: | ||||||||
| Current portion of note payable | $ | 816 | $ | 4,581 | ||||
| Accounts payable | 598 | 863 | ||||||
| Accrued wages, bonus and profit sharing | 1,926 | 1,375 | ||||||
| Accrued expenses | 848 | 1,344 | ||||||
| Deferred revenue | 11,907 | 12,926 | ||||||
| Total current liabilities | 16,095 | 21,089 | ||||||
| Note payable, net of current portion | 6,903 | 8,374 | ||||||
| Deferred income taxes | 5,126 | 4,084 | ||||||
| Deferred revenue | 204 | — | ||||||
| Total liabilities | 28,328 | 33,547 | ||||||
| Shareholders’ equity: | ||||||||
Common stock, $.001 par value; authorized 20,000,000 shares, issued 8,018,044 in 2009 and 8,019,922 in 2008, outstanding 6,662,111 in 2009 and 6,667,517 in 2008 | 8 | 8 | ||||||
| Additional paid-in capital | 27,871 | 27,217 | ||||||
| Retained earnings | 37,905 | 33,677 | ||||||
| Accumulated other comprehensive income (loss), net of taxes | 769 | (6 | ) | |||||
| Treasury stock, at cost; 1,355,933 shares in 2009 and 1,352,405 shares in 2008 | (22,382 | ) | (22,298 | ) | ||||
| Total shareholders’ equity | 44,171 | 38,598 | ||||||
| Total liabilities and shareholders’ equity | $ | 72,499 | $ | 72,145 | ||||
| 2007 | 2006 | 2005 | |||||||||
|---|---|---|---|---|---|---|---|---|---|---|---|
Revenue | $ | 48,922,884 | $ | 43,771,455 | $ | 32,436,502 | |||||
Operating expenses: | |||||||||||
| Direct expenses | 21,801,039 | 19,445,925 | 13,642,195 | ||||||||
| Selling, general and administrative | 13,173,431 | 12,158,004 | 8,617,372 | ||||||||
| Depreciation and amortization | 2,582,866 | 2,259,669 | 1,761,623 | ||||||||
| Total operating expenses | 37,557,336 | 33,863,598 | 24,021,190 | ||||||||
Operating income | 11,365,548 | 9,907,857 | 8,415,312 | ||||||||
Other income (expense): | |||||||||||
| Interest income | 138,702 | 171,273 | 488,120 | ||||||||
| Interest expense | (483,135 | ) | (517,482 | ) | (379,464 | ) | |||||
| Other, net | 96,269 | (55,893 | ) | (9,507 | ) | ||||||
Total other income (expense) | (248,164 | ) | (402,102 | ) | 99,149 | ||||||
Income before income taxes | 11,117,384 | 9,505,755 | 8,514,461 | ||||||||
Provision for income taxes | 4,278,372 | 3,621,687 | 3,278,370 | ||||||||
Net income | $ | 6,839,012 | $ | 5,884,068 | $ | 5,236,091 | |||||
Net income per share - basic | $ | 1.00 | $ | 0.86 | $ | 0.74 | |||||
| Net income per share - diluted | $ | 0.98 | $ | 0.85 | $ | 0.74 | |||||
| 2009 | 2008 | 2007 | ||||||||||
| Revenue | $ | 57,692 | $ | 51,013 | $ | 48,923 | ||||||
| Operating expenses: | ||||||||||||
| Direct expenses | 24,574 | 23,611 | 21,801 | |||||||||
| Selling, general and administrative | 15,590 | 12,728 | 13,174 | |||||||||
| Depreciation and amortization | 3,831 | 2,685 | 2,583 | |||||||||
| Total operating expenses | 43,995 | 39,024 | 37,558 | |||||||||
| Operating income | 13,697 | 11,989 | 11,365 | |||||||||
| Other income (expense): | ||||||||||||
| Interest income | 2 | 42 | 139 | |||||||||
| Interest expense | (405 | ) | (139 | ) | (483 | ) | ||||||
| Other, net | (177 | ) | 91 | 96 | ||||||||
| Total other expense | (580 | ) | (6 | ) | (248 | ) | ||||||
| Income before income taxes | 13,117 | 11,983 | 11,117 | |||||||||
| Provision for income taxes | 4,626 | 4,538 | 4,278 | |||||||||
| Net income | $ | 8,491 | $ | 7,445 | $ | 6,839 | ||||||
| Net income per share - basic | $ | 1.28 | $ | 1.11 | $ | 1.00 | ||||||
| Net income per share - diluted | $ | 1.26 | $ | 1.09 | $ | 0.98 | ||||||
| Weighted average shares and shares equivalent outstanding - basic | 6,637 | 6,685 | 6,850 | |||||||||
| Weighted average shares and shares equivalent outstanding - diluted | 6,723 | 6,831 | 7,011 | |||||||||
26
NATIONAL RESEARCH CORPORATION AND SUBSIDIARY
CONSOLIDATED STATEMENTS OF SHAREHOLDERS’ EQUITY
AND COMPREHENSIVE INCOME AS OF AND FOR THE(In thousands except share and per share amounts)
THREE YEARS ENDED DECEMBER 31, 2007Common
Stock
Additional
Paid-in
Capital
Retained
Earnings
Unearned
Compensation
Accumulated
Other
Comprehensive
Income
Treasury
Stock
Total
Balances at December 31, 2004 $ 7,684 $ 19,345,569 $ 20,382,334 $ (182,354 ) $ 220,261 $ (4,755,837 ) $ 35,017,657
Purchase of 385,700 shares of treasury stock -- -- -- -- -- (5,932,475 ) (5,932,475 ) Issuance of 30,873 common shares for the exercise of stock options 31 253,846 -- -- -- -- 253,877 Tax benefit from the exercise of options -- 84,140 -- -- -- -- 84,140 Issuance of 25,692 restricted common shares, net of 2,036 cancelled 26 362,472 -- (362,498 ) -- -- -- Non-cash stock compensation expense -- -- -- 112,221 -- -- 112,221 Dividends declared of $0.32 per common share -- -- (2,258,128 ) -- -- -- (2,258,128 ) Comprehensive income Change in unrealized gain/(loss) on marketable securities net of tax -- -- -- -- 4,280 -- 4,280 Change in cumulative translation adjustment -- -- -- -- 75,828 -- 75,828 Net income -- -- 5,236,091 -- -- -- 5,236,091
Total comprehensive income -- -- 5,236,091 -- 80,108 -- 5,316,199
Balances at December 31, 2005 7,741 20,046,027 23,360,297 (432,631 ) 300,369 (10,688,312 ) 32,593,491
Purchase of 52,217 shares of treasury stock -- -- -- -- -- (1,236,055 ) (1,236,055 ) Issuance of 89,307 common shares for the exercise of stock options 89 926,102 -- -- -- -- 926,191 Tax benefit from the exercise of options -- 404,535 -- -- -- -- 404,535 Issuance of 13,218 restricted common shares, net of 5,250 cancelled 8 (8 ) -- -- -- -- -- Non-cash stock compensation expense -- 875,684 -- -- -- -- 875,684 Reclassify unearned compensation -- (432,631 ) -- 432,631 -- -- -- Dividends declared of $0.40 per common share -- -- (2,756,057 ) -- -- -- (2,756,057 ) Comprehensive income Change in unrealized gain/(loss) on marketable securities net of tax -- -- -- -- 67,436 -- 67,436 Change in cumulative translation adjustment -- -- -- -- (8,780 ) -- (8,780 ) Net income -- -- 5,884,068 -- -- -- 5,884,068
Total comprehensive income -- -- 5,884,068 -- 58,656 -- 5,942,724
Balances at December 31, 2006 7,838 21,819,709 26,488,308 -- 359,025 (11,924,367 ) 36,750,513
Purchase of 61,849 shares of treasury stock -- -- -- -- -- (241,061 ) (241,061 ) Issuance of 22,829 common shares for the exercise of stock options 22 337,764 -- -- -- -- 337,786 Tax benefit from the exercise of options -- 111,551 -- -- -- -- 111,551 Issuance of 32,115 restricted common shares, net of 9,109 cancelled 23 (23 ) -- -- -- -- -- Non-cash stock compensation expense -- 1,239,716 -- -- -- -- 1,239,716 Dividends declared of $0.48 per common share -- -- (3,323,714 ) -- -- -- (3,323,714 ) Comprehensive income Change in unrealized gain/(loss) on marketable securities net of tax -- -- -- -- 4,085 -- 4,085 Change in cumulative translation adjustment -- -- -- -- 568,545 -- 568,545 Net income -- -- 6,839,012 -- -- -- 6,839,012
Total comprehensive income -- -- 6,839,012 -- 572,630 -- 7,411,642
Balances at December 31, 2007 $ 7,883 $ 23,508,717 $ 30,003,606 $ -- $ 931,655 $ (12,165,428 ) $ 42,286,433
CommonStock AdditionalPaid-inCapital RetainedEarnings AccumulatedOtherComprehensiveIncome TreasuryStock Total Balances at December 31, 2006 8 21,820 26,488 359 (11,924 ) 36,751 Purchase of 61,849 shares of treasury stock — — — — (241 ) (241 ) Issuance of 22,829 common shares for the exercise of stock options — 338 — — — 338 Tax benefit from the exercise of options and vested restricted stock — 111 — — — 111 Issuance of 32,115 restricted common shares, net of 9,109 cancelled — — — — — — Non-cash stock compensation expense — 1,240 — — — 1,240 Dividends declared of $0.48 per common share — — (3,324 ) — — (3,324 ) Comprehensive income Change in unrealized gain/(loss) on marketable securities, net of tax — — — 4 — 4 Change in cumulative translation adjustment — — — 568 — 568 Net income — — 6,839 — — 6,839 Total comprehensive income 7,411 Balances at December 31, 2007 $ 8 $ 23,509 $ 30,003 $ 931 $ (12,165 ) $ 42,286, Purchase of 395,558 shares of treasury stock — — — — (10,133 ) (10,133 ) Issuance of 144,614 common shares for the exercise of stock options — 1,856 — — — 1,856 Tax benefit from the exercise of options and vested restricted stock — 836 — — — 836 Cancellation of 7,981 restricted common shares — — — — — — Non-cash stock compensation expense — 1,016 — — — 1,016 Dividends declared of $0.56 per common share — — (3,771 ) — — (3,771 ) Comprehensive income Change in cumulative translation adjustment — — — (937 ) — (937 ) Net Income 7,445 7,445 Total comprehensive income — — — — — 6,508 Balances at December 31, 2008 $ 8 $ 27,217 $ 33,677 $ (6 ) $ (22,298 ) $ 38,598 Purchase of 3,528 shares of treasury stock — — — — (84 ) (84 ) Issuance of 2,023 common shares for the exercise of stock options — 18 — — — 18 Tax benefit from the exercise of options and vested restricted stock — 17 — — — 17 Cancellation of 3,901 restricted common shares — — — — — — Non-cash stock compensation expense — 619 — — — 619 Dividends declared of $0.64 per common share — — (4,263 ) — — (4,263 ) Comprehensive income Change in cumulative translation adjustment — — — 775 — 775 Net income 8,491 8,491 Total comprehensive income — — — — — 9,266 Balances at December 31, 2009 $ 8 $ 27,871 $ 37,905 $ 769 $ (22,382 ) $ 44,171
See accompanying notes to consolidated financial statements.27
NATIONAL RESEARCH CORPORATION AND SUBSIDIARY
CONSOLIDATED STATEMENTS OF CASH FLOWS(In thousands)
FOR THE THREE YEARS ENDED DECEMBER 31, 20072007
2006
2005
Cash flows from operating activities: Net income $ 6,839,012 $ 5,884,068 $ 5,236,091 Adjustments to reconcile net income to net cash provided by operating activities: Depreciation and amortization 2,582,866 2,259,669 1,761,623 Deferred income taxes 117,046 99,135 264,049 Loss (gain) on sale of property and equipment (3,587 ) (50 ) 239 Loss (gain) on sale of other investments -- 47,616 (43 ) Tax benefit from exercise of stock options 31,245 63,005 84,140 Non-cash stock compensation expense 1,092,776 1,022,624 112,221 Change in assets and liabilities, net of effect of acquisitions: Trade accounts receivable 616,423 (884,575 ) (2,079,193 ) Unbilled revenue 900,397 (1,089,431 ) 29,026 Prepaid expenses and other 30,190 256,809 45,597 Accounts payable (73,154 ) 22,006 602,326 Accrued expenses, wages, bonus and profit sharing 329,845 (58,680 ) 328,718 Income taxes payable and recoverable 562,797 (714,293 ) 442,865 Billings in excess of revenue earned 1,540,258 (95,723 ) 1,360,425
Net cash provided by operating activities 14,566,114 6,812,180 8,188,084
Cash flows from investing activities: Purchases of property and equipment (1,956,204 ) (1,453,128 ) (1,088,172 ) Proceeds from sale of property and equipment 200 50 1,500 Acquisition, net of cash acquired and earn-out on acquisition -- (20,620,521 ) (4,459,198 ) Purchases of securities available-for-sale (2,990,012 ) (1,378,523 ) (19,453,522 ) Proceeds from the maturities of securities available-for-sale 4,007,262 9,784,215 25,353,137
Net cash provided by (used in) investing activities (938,754 ) (13,667,907 ) 353,745
Cash flows from financing activities: Proceeds from notes payable 375,000 14,795,000 -- Payments on notes payable (8,474,621 ) (5,173,310 ) (3,429,571 ) Proceeds from exercise of stock options 337,786 926,191 253,877 Tax benefit on exercise of stock options and vested restricted stock 80,306 341,530 -- Purchase of treasury stock (241,061 ) (1,236,055 ) (5,932,475 ) Payment of dividends on common stock (3,323,714 ) (2,756,057 ) (2,258,128 )
Net cash provided by (used in) financing activities (11,246,304 ) 6,897,299 (11,366,297 )
Effect of exchange rate changes on cash 97,726 (9,171 ) 20,734
Net increase (decrease) in cash and cash equivalents 2,478,782 32,401 (2,803,734 )
Cash and cash equivalents at beginning of period 876,360 843,959 3,647,693
Cash and cash equivalents at end of period $ 3,355,142 $ 876,360 $ 843,959
Supplemental disclosure of cash paid for: Interest expense $ 483,135 $ 600,719 $ 364,210 Income taxes $ 3,457,478 $ 3,839,192 $ 2,479,834
2009 2008 2007 Cash flows from operating activities: Net income $ 8,491 $ 7,445 $ 6,839 Adjustments to reconcile net income to net cash provided by operating activities: Depreciation and amortization 3,831 2,686 2,583 Deferred income taxes 1,733 430 117 Loss (gain) on sale of property and equipment 1 — (3 ) Tax benefit from exercise of stock options — 156 31 Non-cash stock compensation expense 619 1,016 1,093 Change in assets and liabilities, net of effect of acquisitions: Trade accounts receivable 1,396 637 616 Unbilled revenue (315 ) 603 900 Prepaid expenses and other (516 ) (155 ) 30 Accounts payable (278 ) (408 ) (73 ) Accrued expenses, wages, bonus and profit sharing (73 ) 6 330 Income taxes payable and recoverable (326 ) (249 ) 563 Deferred revenue (897 ) 3,008 1,540 Net cash provided by operating activities 13,666 15,175 14,566 Cash flows from investing activities: Purchases of property and equipment (2,909 ) (2,812 ) (1,956 ) Acquisition, net of cash acquired and earn-out on acquisition (93 ) (12,551 ) — Purchases of securities available-for-sale — — (2,990 ) Proceeds from the maturities of securities available-for-sale — 99 4,007 Net cash used in investing activities (3,002 ) (15,264 ) (939 ) Cash flows from financing activities: Proceeds from notes payable 4,916 18,564 375 Payments on notes payable (10,152 ) (8,952 ) (8,474 ) Proceeds from exercise of stock options 18 731 338 Tax benefit on exercise of stock options and vested restricted stock 17 680 80 Purchase of treasury stock (84 ) (9,007 ) (241 ) Payment of dividends on common stock (4,263 ) (3,771 ) (3,324 ) Net cash used in financing activities (9,548 ) (1,755 ) (11,246 ) Effect of exchange rate changes on cash 287 (402 ) 98 Net increase (decrease) in cash and cash equivalents 1,403 (2,246 ) 2,479 Cash and cash equivalents at beginning of period 1,109 3,355 876 Cash and cash equivalents at end of period $ 2,512 $ 1,109 $ 3,355 Supplemental disclosure of cash paid for: Interest expense $ 498 $ 122 $ 483 Income taxes $ 2,999 $ 3,502 $ 3,457
Supplemental disclosures of non-cash investing activities:
In connection with the Company’s acquisition of businesses in 2006 and 2005,Equity Incentive plans, certain optionees tendered to the Company acquired current assets of $730,804
previously owned shares to pay for the option strike price. The total non-cash stock options exercised was $0, $1.1 million and $53,046, respectively,$0 for the years ended December 31, 2009, 2008, and assumed current liabilities of $3,201,691 and $151,685,2007, respectively.
See accompanying notes to consolidated financial statements.
28
NATIONAL RESEARCH CORPORATION AND SUBSIDIARY
NOTES TO CONSOLIDATED FINANCIAL STATEMENTS(1) Summary of Significant Accounting Policies
Description of Business and Basis of PresentationNational Research Corporation (the “Company”) is a provider of ongoing survey-based performance measurement, analysis, tracking, improvement services and governance education to the healthcare industry in the United States and Canada. The Company provides market research services to hospitals and insurance companies on an unsecured credit basis. The Company’s ten largest clients accounted for 29%14%, 32%24%, and 40%29% of the Company’s total revenue in 2009, 2008, and 2007, 2006 and 2005, respectively. One client accounted for 8%, 8% and 11% of total revenue in 2007, 2006 and 2005, respectively. The Company operates in a single industry segment.Principles of ConsolidationThe consolidated financial statements include the accounts of the Company and its subsidiary. All significant intercompany transactions and balances have been eliminated in consolidation.Use of EstimatesThe preparation of financial statements in conformity with accounting principles generally accepted in the United States of America requires management to make certain estimates and assumptions that affect the reported amounts of assets and liabilities at the date of the financial statements and the reported amounts of revenue and expenses during the reporting period. Actual results could differ from those estimates.Translation of Foreign CurrenciesThe Company’s Canadian subsidiary uses as its functional currency the local currency of the country in which it operates. It translates its assets and liabilities into U.S. dollars at the exchange rate in effect at the balance sheet date. It translates its revenue and expenses at the average exchange rate during the period. The Company includes translation gains and losses in accumulated other comprehensive income (loss), a component of shareholders’ equity. Gains and losses related to transactions denominated in a currency other than the functional currency of the countries in which the Company operates and short-term intercompany accounts are included in other income (expense) in the consolidated statements of income.Revenue RecognitionThe Company derives a majority of its operating revenue from its annually renewable services, which include the performance tracking services, subscription-based educational services and Market Guide.subscription-based and annual contracts of Ticker. The Company provides interim and annual performance tracking to its clients under annual client service contracts, although such contracts are generally cancelable on short or no notice without penalty. The Company provides subscription-based educational services to clients generally under annual service contracts over a twelve-month period and publishes healthcare market information for its clients through its Market Guide generallyTicker on an annual or monthly basis. The Company also derives revenue from its custom and other research projects. Sales taxes collected from customers and remitted to governmental authorities are accounted for on a net basis and, therefore, are excluded from revenue in the consolidated statements of income.
29
The Company recognizes revenue from its performance tracking services and its custom and other research projects using the proportional performance method of accounting. These services typically include a series of surveys and deliverable reports in which the timing and frequency vary by contract. Progress on a contract can be tracked reliably, and customers are obligated to pay as services are performed. The Company recognizes revenue based on output measures or key milestones such as survey set up, survey mailings, survey returns and reporting. The Company measures its progress based on the level of completion of these output measures and recognizes the revenue related to output measures. Losses expected to be incurred, if any, on jobs in progress are charged to income as soon as such losses are known. Revenue earned on contracts in progress in excess of billings is classified as a current asset. Amounts billed in excess of revenue earned are classified as a current liability. Client projects are generally completed within a twelve-month period.29
The Company recognizes subscription-based educational service revenue over the period of time the service is provided. Generally, the subscription periods are for twelve months and revenue is recognized equally over the subscription period.The Company recognizes revenue on Market GuideTicker contracts upon its delivery to the principal customers. TheRevenue under some annual contracts which do not include monthly updates is fully recognized upon delivery, typically in the third quarter of the year. Starting in May 2008, the Company defersadded subscription-based services, the revenue from which is generally recognized on a monthly basis over a twelve-month period. Until September 2008, the Company deferred costs of preparing the survey data for Market Guide.Ticker and expensed these at the time the annual contract revenue was recognized. These costs are primarily incremental external direct costs solely related to fulfilling the Company’s obligations under Market GuideTicker contracts. The Company expensesBeginning in October 2008, these deferred costs at the time revenue is recognized. The Company monitors and assesses the recoverability of the deferred direct costs based on contracted revenue and whenever changes in circumstances warrant such assessment.are expensed monthly as incurred. The Company generates additional revenue from incidental customers subsequent to the completion of each monthly edition. Revenue and costs for these subsequent services are recognized as the customization services are performed and completed.Trade Accounts ReceivableTrade accounts receivable are recorded at the invoiced amount. The allowance for doubtful accounts is the Company’s best estimate of the amount of probable credit losses in the Company’s existing accounts receivable. The Company determines the allowance based on specific account analysis and on the Company’s historical write-off experience. The Company reviews the allowance for doubtful accounts monthly. Past due balances over 90 days and over a specified amount are reviewed individually for collectability and provisions are made for accounts not specifically reviewed. Account balances are charged off against the allowance after all means of collection have been exhausted and the potential for recovery is considered remote.
Property and EquipmentProperty and equipment is stated at cost. Major expenditures to purchase property or to substantially increase useful lives of property are capitalized. Maintenance, repairs and minor renewals are expensed as incurred. When assets are retired or otherwise disposed of, their costs and related accumulated depreciation are removed from the accounts and resulting gains or losses are included in income.For costs of software developed for internal use, the Company expenses computer software costs as incurred in the preliminary project stage, which involves the conceptual formulation, evaluation and selection of technology alternatives. Costs incurred related to the design, coding, installation and testing of software during the application project stage are capitalized. Costs for training and application maintenance are expensed as incurred. The Company has capitalized approximately $511,000, $803,000$450,000, $493,000 and $680,000,$511,000, of internal and external costs incurred for the development of internal use software for the years ended December 31, 2007, 20062009, 2008 and 2005,2007, respectively, with such costs classified as property and equipment.
30
The Company provides for depreciation and amortization of property and equipment using annual rates which are sufficient to amortize the cost of depreciable assets over their estimated useful lives. The Company uses the straight-line method of depreciation and amortization over estimated useful lives of five to ten years for furniture and fixtures,equipment, three to five years for computer equipment, three to five years for capitalized software, and fifteenten to forty years for the Company’s office building.building and related improvements.
Impairment of Long-Lived AssetsIn accordance with Statement of Financial Accounting Standards (“SFAS”) No. 144,Accounting for the Impairment or Disposal of Long-Lived Assets, the
The Company monitors events and changes in circumstances that may require the Company to review the carrying value of its long-lived assets. The Company assesses the recoverabilitywhether an impairment of its long-lived assets based on estimatedheld and used may have occurred using undiscounted future operating cash flows. Impairments, if they occur, are measured using the fair value of the assets. The assessment of the recoverability of long-lived assets willmay be adversely impacted if estimated future operating cash flows are not achieved.30
The Company assesses the impairment of long-lived assets whenever events or changes in circumstances indicate that the carrying value of such assets may not be recoverable. ManagementAmong others, management believes the following circumstances are important indicators of potential impairment of such assets and as a result may trigger an impairment review:Significant underperformance in comparison to historical or projected operating results;
Significant changes in the manner or use of acquired assets or the Company’s overall strategy;· Significant underperformance in comparison to historical or projected operating results;
Significant negative trends in the Company’s industry or the overall economy;
A significant decline in the market price for the Company’s common stock for a sustained period; and· Significant changes in the manner or use of acquired assets or the Company’s overall strategy;
The Company's market capitalization falling below the book value of the Company’s net assets.
· Significant negative trends in the Company’s industry or the overall economy;
· A significant decline in the market price for the Company’s common stock for a sustained period; and
· The Company’s market capitalization falling below the book value of the Company’s net assets.
Goodwill and Intangible AssetsIntangible assets include customer relationships, trade namenames and goodwill. Customer relationships are being amortized over periods of five to fifteen years. One of the trade names is being amortized over a period of ten years. The other trade name is indefinite lived. Goodwill represents the difference between the purchase price paid in acquisitions, using the purchase method of accounting, and the fair value of the net assets acquired.Goodwill and intangible assets acquired in a purchase business combination and determined to have an indefinite useful life are not amortized, but instead are tested for impairment at least annually in accordance with the provisions of SFAS No. 142,Goodwill and Other Intangible Assets.. Intangible assets with estimable useful lives are amortized over their respective estimated useful lives to their estimated residual values and reviewed for impairment in accordance with SFAS No. 144.impairment.All of the Company’s goodwill is allocated to onefive of its six reporting unit, the healthcare services business.units. As of December 31, 2007,2009, the Company has net goodwill of $31$39.9 million. As of October 1 of each year (or more frequently as changes in circumstances indicate), the Company evaluatestests goodwill for impairment using level 3 inputs as defined in the estimated fair value hierarchy. Refer to Note 1, Fair Value Measurements, for the definition of the Company’s goodwill.levels in the fair value hierarchy. The inputs used to calculate the fair value included the projected cash flows and a discount rate that the Company estimated would be used by a market participant in valuing these assets. On these evaluation dates, to the extent that the carrying value of the net assets of the Company’s reporting unitunits having goodwill is greater than the estimated fair value, impairment charges will be recorded. The Company’s analysis has not resulted in the recognition of an impairment loss on goodwill in 2007, 2006 or 2005.Investments in Marketable Debt Securities
All marketable debt securities held by the Company at December 31, 2007determined and 2006, were classified as available-for-sale and recorded at fair market value. Unrealized holding gains and losses, net of the related tax effect, on available-for-sale securities are reported as other comprehensive income or loss. Realized gains and losses from the sale of available-for-sale securities are determined on a specific-identification basis. Fair values are estimatedmeasured based on quoted market prices. Interest income is recognized when earned.
A decline in the marketestimated fair value of any available-for-sale security below cost that is deemedgoodwill as compared to be other-than-temporary results in a reduction inits carrying amount to fair value. The impairment is charged to earnings and a new cost basis for the security is established. To determine whether an impairment is other-than-temporary, the Company considers whether it has the ability and intent to hold the investment until a market price recovery and considers whether evidence indicating the cost of the investment is recoverable outweighs evidence to the contrary. Evidence considered in this assessment includes the reasons for the impairment, the
31
severity and duration of the impairment, changes in value subsequent to year-end, and forecasted performance of the investee. The Company’s analysis has not resulted in the recognition of an impairment loss on investments in 2007, 2006 or 2005.
Income TaxesThe Company uses the asset and liability method of accounting for income taxes. Under that method, deferred income tax assets and liabilities are recognized for the future tax consequences attributable to differences between the financial statement carrying amounts of existing assets and liabilities and their respective tax basis using enacted tax rates. The effect on deferred tax assets and liabilities of a change in tax rates is recognized in income in the period that includes the enactment date. Valuation allowances, if any, are established when necessary to reduce deferred tax assets to the amount that is more likely than not to be realized.Share-Based Compensation
Effective January 1, 2006, The Company uses the deferral method of accounting for its investment tax credits related to state tax incentives. During the years ended December 31, 2009, 2008 and 2007, the Company adopted SFAS No. 123Rrecorded income tax benefits relating to these tax credits of $189,000, $0, and $0.
The Company recognizes the effect of income tax positions only if those positions are more likely than not of being sustained. Recognized income tax positions are measured at the largest amount that is greater than 50% likely of being realized. Changes in recognition or measurement are reflected in the period in which the change in judgment occurs.The Company had an unrecognized tax benefit at December 31, 2009 of $541,000, excluding interest of $3,000 and no penalties. Of this amount $78,000 represents the net unrecognized tax benefits that, if recognized, would favorably impact the effective income tax rate. The Company accrues interest and penalties related to uncertain tax position in the statements of income as income tax expense. The Company is not subject to tax examinations for years prior to 2006 in the U.S. and 2005 in Canada.
Share-Based Payment (“SFAS No. 123R”) under the modified version of the prospective transition method. Under the modified prospective transition method,CompensationThe Company measures and recognizes compensation costexpense for all share-based payments. The compensation expense is recognized on or after the required effective date for the portion of the outstanding awards for which the requisite service has not yet been rendered, based on the grant dategrant-date fair value of those awards calculated under SFAS No. 123R for either recognition or pro forma disclosures.awards. All of the Company’s existing stock option awards and non-vested stock awards have been determined to be equity awards in accordance with SFAS No. 123R. There was no cumulative effect of initially adopting SFAS No. 123R.The Company currently intends that shares of common stock issued upon the exercise of options will be newly-issued shares. No share-based compensation costs were capitalized for the twelve-month periods ended December 31, 2007 and 2006. equity-classified awards.
Amounts recognized in the financial statements with respect to these plans under SFAS No. 123R are as follows:2007
2006
(in thousands) (in thousands) Amounts charged against income, $ 1,252 $ 1,023 before income tax benefit Amount of related income tax benefit 483 399
Total net income impact $ 769 $ 624
plans:
2009 2008 2007 (In thousands) Amounts charged against income, before income tax benefit $ 619 $ 1,016 $ 1,093 Amount of related income tax benefit 238 391 421 Total net income impact $ 381 $ 625 $ 672
Cash and Cash EquivalentsFor purposes of the statements of cash flows, the Company considers all highly liquid investments with original maturities of three months or less to be cash equivalents. Cash equivalents were $2.5 million consisting of U.S. government notes of $1.6 million and money market funds of $930,000 as of December 31, 2009, and $379,000 of money market funds as of December 31, 2008.
32
Fair Value MeasurementsThe Company’s valuation techniques are based on maximizing observable and unobservable inputs and minimizing the use of unobservable inputs when measuring fair value. Observable inputs reflect readily obtainable data from independent sources, while unobservable inputs reflect the Company’s market assumptions. The inputs are then classified into the following hierarchy: (1) Level 1 Inputs—quoted prices in active markets for identical assets and liabilities, (2) Level 2 Inputs—observable market-based inputs other than Level 1 inputs, such as quoted prices for similar assets or liabilities in active markets; quoted prices for similar or identical assets or liabilities in markets that are not active; or other inputs that are observable or can be corroborated by observable market data, (3) Level 3 Inputs—unobservable inputs.
As of December 31, 2007, cash equivalents were $194,000 consisting of money market funds.Fair Value of Financial Instruments
The carrying value of financial instruments included in2009, those assets and liabilities that are measured at fair value on a recurring basis consisted of the following:
Level 1 Level 2 Level 3 (In thousands) Money Market Funds $ 930 $ — $ — U.S. government notes — 1,560 — Total $ 930 $ 1,560 $ —
The Company believes that the carrying amounts of its other financial instruments, including cash, accounts payable and accrued expenses, approximate their fair value due to the short-term maturities of these instruments. All non-financial assets and liabilities that are not recognized or disclosed at fair value in the accompanying consolidated balance sheets approximates theirfinancial statements on a recurring basis, which includes goodwill and non-financial long lived assets, are measured at fair value.value in certain circumstances (for example, when there is evidence of impairment). As of December 31, 2009, there was no indication of impairment related to our non-financial assets and liabilities. Refer to Note 1, Goodwill and Intangible Assets, for further description of the inputs used to measure fair value of goodwill as part of our annual impairment test.
Earnings Per ShareNet income per share has been calculated and presented for “basic” and “diluted” per share data. Basic net income per share is computed by dividing net income by the weighted average number of common shares outstanding. Diluted income per share is computed by dividing net income by the weighted average number of common shares adjusted for the dilutive effects of options and restricted stock. At December 31, 2007, 20062009, 2008 and 2005,2007, the Company had 48,000,247,603, -0- and 9,43948,000 options, respectively, which have been excluded from the diluted net income per share computation because their exercise price exceeds the fair market value.32
The weighted average shares outstanding were calculated as follows:2007
2006
2005
Common stock 6,849,717 6,836,456 7,037,896 Dilutive effect of options 131,036 91,885 61,511 Dilutive effect of restricted stock 30,518 25,623 18,630
Weighted average shares used for dilutive per share information 7,011,271 6,953,964 7,118,037
2009 2008 2007 (In thousands) Common stock 6,637 6,685 6,850 Dilutive effect of options 74 131 131 Dilutive effect of restricted stock 12 15 30 Weighted average shares used for dilutive per share information 6,723 6,831 7,011
There are no reconciling items between the Company’s reported net income and net income used in the computation of basic and diluted income per share.Accumulated
33
Comprehensive IncomeComprehensive income consists of net income and other comprehensive income (loss). Other Comprehensive IncomeThe components ofcomprehensive income (loss) refers to revenue, expenses, gains and losses that are not included in net income, but rather are recorded directly in stockholder’s equity. For the years ended December 31, 2009 and 2008 accumulated other comprehensive income were(loss) was $769,000 and ($6,000), respectively, consisting solely of changes in the cumulative translation adjustment.
Segment Information
The Company has six operating segments that are aggregated into one reporting segment because they have similar economic characteristics and meet the other aggregation criteria within the authoritative guidance on disclosure about enterprise segments. The six operating segments are as follows:2007
2006
2005
(in thousands) Net income, as reported $ 6,839 $ 5,884 $ 5,236
Other comprehensive income: Unrealized gain (loss) from investments: Unrealized gains 7 112 3 Related tax (expense) benefit (3 ) (44 ) 1
Net 4 68 4 Foreign currency translation 569 (9 ) 76
Total other comprehensive income 573 59 80
Comprehensive income $ 7,412 $ 5,943 $ 5,316
NRC Picker U.S. and NRC Picker Canada, which each offer renewable performance tracking and improvement services, custom research, best practice improvement services, and a renewable syndicated service; Healthcare Market Guide (Ticker) offers stand-alone market information as well as a comparative performance database to allow the Company’s clients to assess their performance relative to the industry, to access best practice examples, and to utilize competitive information for marketing purposes; Payer Solutions offers functional disease-specific and health status measurement tools; The Governance Institute (TGI) offers subscription-based governance information and educational conferences designed to improve the effectiveness of hospital and healthcare systems by continually strengthening their healthcare boards, medical leadership, and management performance in the United States; and My InnerView (MIV) provides quality and performance improvement solutions to the senior care profession.
Adoption of New Accounting PronouncementsIn February 2006, theJune 2009, FASB issued SFAS No. 155,the Accounting for Certain Hybrid Financial Instruments— An AmendmentStandards Codification™ (“Codification”) as the source of authoritative U.S. generally accepted accounting principles (“GAAP”) recognized by FASB Statements No. 133to be applied by nongovernmental entities. The Codification supersedes all then-existing non-SEC accounting and 140. SFAS No. 155 amends SFAS No. 133,Accounting for Derivative Instruments and Hedging Activities, and SFAS No. 140,Accounting for Transfer and Servicing of Financial Assets and Extinguishments of Liabilities, and eliminatesreporting standards. In accordance with the exemption from applying SFAS No. 133Codification, references to interestsaccounting literature in securitized financial assets so that similar itemsthis report are accounted forpresented in plain English. The Codification did not change GAAP, but reorganizes the same way.literature. The provisions of SFAS No. 155 areCodification is effective for all financial instruments acquired by a company orstatements issued after the beginning of its first fiscal year that beginsfor interim and annual periods ending after September 15, 2006.2009. The adoption of SFAS No. 155the Codification has not had no effectan impact on the consolidated financial statements.Recent Accounting PronouncementsIn March 2006,September 2009, the FASB issued SFAS No. 156,Accountingnew guidance for Servicingrevenue recognition with multiple deliverables, which is effective for revenue arrangements entered into or materially modified in fiscal years beginning on or after June 15, 2010, although early adoption is permitted. This guidance eliminates the residual method under the current guidance and replaces it with the “relative selling price” method when allocating revenue in a multiple deliverable arrangement. The selling price for each deliverable shall be determined using vendor specific objective evidence of Financial Assets— An Amendmentselling price, if it exists, otherwise third-party evidence of FASB Statement No. 140. SFAS No. 156 amends SFAS No. 140,Accountingselling price. If neither exists for Transfers and Servicing of Financial Assets and Extinguishments of Liabilities, and requires that all separately recognized servicing assets and servicing liabilities be initially measured at fair value, if practicable. The provisions of SFAS No. 156 are effective asa deliverable, the vendor shall use its best estimate of the beginningselling price for that deliverable. After adoption, this guidance will also require expanded qualitative and quantitative disclosures. As of a company’s first fiscal year that begins after September 15, 2006. The adoption of SFAS No. 156 had no effect on the consolidated financial statements.In June 2006, the FASB issued FASB Interpretation No. 48 (“FIN 48”),Accounting for Uncertainty in Income Taxes— An Interpretation of FASB Statement No. 109. FIN 48 prescribes a recognition threshold and measurement process for recording in the financial statements uncertain tax positions taken or expected to be taken in a tax return. Additionally, this interpretation provides guidance on the derecognition, classification, accounting in interim periods and disclosure requirements for uncertain tax positions. The provisions of FIN 48 were effective for us on January 1, 2007. The adoption of FIN 48 had no effect on the consolidated financial statements.
33
In September 2006, the FASB issued SFAS No. 157,Fair Value Measurements. SFAS No. 157 defines fair value, establishes a framework for measuring fair value in generally accepted accounting principles (GAAP), and expands disclosures about fair value measurements. The provisions of SFAS No. 157 are effective as of the beginning of a company’s first fiscal year that begins after November 15, 2007. ManagementDecember 31, 2009, management believes that adoption of SFAS No. 157this new guidance will not have a material effect on the consolidated financial statements.
In February 2008, the FASB issued FASB Staff Position (FSP) Financial Accounting Standard (FAS) 157-1,Application of FASB Statement No. 157 to FASB Statement No. 13 and Its Related Interpretive Accounting Pronouncements That Address Leasing Transactions, and FSP FAS 157-2,Effective Date of FASB Statement No. 157. FSP FAS 157-1 removes leasing from the scope of SFAS No. 157,Fair Value Measurements. FSP FAS 157-2 delays the effective date of SFAS No. 157 from 2008 to 2009 for all non-financial assets and non-financial liabilities, except those that are recognized or disclosed at fair value in the financial statements on a recurring basis (at least annually). Management believes that adoption of SFAS No. 157-1 and 157-2 will not have a material effect on the consolidated financial statements.
In February 2007, the FASB issued SFAS No. 159,The Fair Value Option for Financial Assets and Financial Liabilities including an amendment of FASB Statement No. 115. This statement permits entities to choose to measure many financial instruments and certain other items at fair value. The provisions of SFAS No. 159 are effective as of the beginning of a company’s first fiscal year that begins after November 15, 2007. Management believes that adoption of SFAS No. 159 will not have a material effect on the consolidated financial statements.
In June 2007, the FASB ratified the consensus reached by the Emerging Issues Task Force (EITF) in EITF Issue No. 07-3,Accounting for Nonrefundable Advance Payments for Goods or Services Received for Use in Future Research and Development Activities (EITF 07-3), which requires that nonrefundable advance payments for goods or services that will be used or rendered for future research and development activities be deferred and amortized over the period that the goods are delivered or the related services are performed, subject to an assessment of recoverability. EITF 07-3 is effective as of the beginning of a company’s first fiscal year that begins after December 15, 2008. Management believes that adoption of EITF 07-3 will not have a material effect on the consolidated financial statements.
In December 2007, the FASB issued SFAS No. 141(R),Business Combinations (“SFAS 141(R)”), which replaces FAS 141. SFAS 141(R) establishes principles and requirements for how an acquirer in a business combination recognizes and measures in its financial statements the identifiable assets acquired, the liabilities assumed, and any controlling interest; recognizes and measures the goodwill acquired in the business combination or a gain from a bargain purchase; and determines what information to disclose to enable users of the financial statements to evaluate the nature and financial effects of the business combination. FAS 141(R) is to be applied prospectively to business combinations for which the acquisition date is on or after an entity’s fiscal year that begins after December 15, 2008. Management will assess the impact of SFAS 141(R) if and when a future acquisition occurs.
34
(2) Acquisitions
On May 30, 2006,December 19, 2008, the Company acquired substantially allMy InnerView, Inc. (“MIV”), a leading provider of the assets of TGI Group, LLC, operating as The Governance Institute (“TGI”). TGI provides board members, executive managementquality and physician leaders of hospitals and health systems with knowledge andperformance improvement solutions to successfully confront a wide array of strategic issues. TGI operations have been includedthe senior care profession. MIV offers resident, family and employee satisfaction measurement and improvement products to the long term-care, assisted and independent living markets in the United States. MIV works with over 8,000 senior care providers throughout the United States, housing what the Company believes is the largest dataset of senior care satisfaction metrics in the nation. The acquisition was completed in order to pursue the Company’s consolidated financial statements sincestrategy of expanding additional service offerings to the datehealthcare industry in the United States and Canada. This acquisition gives the Company a foundation upon which to expand in the senior care profession. The consideration paid at closing for MIV included a payment of acquisition. The purchase price for TGI was $19.8$11.5 million in cash plusand $440,000 of direct expenses capitalized as purchase price. The merger agreement under which the assumption of certain liabilities. The Company paid $17.8 million in cash to the seller at closingacquired MIV provided for contingent earn-out payments over three years based on revenue and $1.95 million into an escrow account. The escrow account was released twelve months fromoperating income increases.In connection with the acquisition date. Thethe Company recorded direct acquisition costs of $305,000.34
The Company has allocated the following amounts as its preliminary purchase price as follows,allocation, based on the estimated fair value of the assets acquired and liabilities assumed at the date of acquisition:
Fair Value
Current assets $ 730,804 Property and equipment 67,573 Customer relationships 2,694,000 Trade name 1,572,000 Goodwill 18,221,635
Total acquired assets 23,286,012 Less total liabilities assumed 3,201,691
Net assets acquired $ 20,084,321
Of the $22,487,635 of acquired intangible assets, $2,694,000 was assigned to customer relationships and $1,572,000 was assigned to a trade name.
Fair Value (In thousands) Current Assets $ 1,290 Property and equipment 846 Customer relationships 3,003 Goodwill 8,833 Other Long Term Assets 581 Total acquired assets 14,553 Less total liabilities 2,613 Net assets acquired $ 11,940
The excess of purchase price over the fair value of net assets acquired resulted in the Company recording $18,221,635$8.8 million of goodwill. The customer relationships acquired intangible asset is being amortized over a useful life of 10 years. The amortization of customer relationships the trade name and goodwill is expected to be deductiblenon-deductible for tax purposes.During the year ended December 31, 2009, the Company adjusted the initial purchase price allocation resulting in a net increase to goodwill of $240,000, which was due to additional contingent consideration earned of $795,000, deferred tax adjustments of $630,000, and allowance for doubtful accounts of $75,000.The following unaudited pro forma information for the Company has been prepared as if the acquisition of TGIMIV had occurred on January 1, 2006.2007. The information is based on the historical results of the separate companies and may not necessarily be indicative of the results that could have been achieved or of results that may occur in the future.2006
(In thousands,
except per share
amounts)
(Unaudited ) Revenue $ 46,812 Net income $ 6,274 Earnings per share - basic $ 0.92 Earnings per share - diluted $ 0.90
(3)Investments in Marketable Debt Securities
The Company’s investments in marketable securities are in marketablepro forma adjustments include the impact of depreciation and amortization of property and equipment and intangible assets acquired, interest expense on the acquisition debt, securities classified as obligations of U.S. government agencies. The amortized cost, gross unrealized holding gains and losses and fair valueincome tax benefits for tax effects of the Company’s investment in the obligations of U.S. government agencies as of December 31, 2007foregoing adjustments to depreciation, amortization and 2006, were as follows:
2007
2006
Amortized cost $ 99,714 $ 1,116,963 Gross unrealized holding gains 0 2,727 Gross unrealized holding losses (217 ) (9,586 )
Fair value $ 99,497 $ 1,110,104
35
In May 2006, the Company sold $5.6 million of marketable debt securities in advance of their scheduled maturities to partially fund the purchase of TGI. The Company recognized a loss of $46,000 on these securities sold in advance of their scheduled maturities. There were no sales of marketable debt securities in advance of scheduled maturities of available-for-sale marketable debt securities during 2007. The fair value and amortized cost of marketable debt securities at December 31, 2007, by contractual maturity, are shown below. Actual maturities may differ from the contractual maturities because borrowers may have the right to call or prepay obligations with or without call or prepayment penalties.
At December 31, 2007
Fair
Value
Amortized
Cost
Due after three months through one year $ -- $ -- Due after one year through five years 99,497 99,714
$ 99,497 $ 99,714
Gross unrealized losses on investment securities and the fair value of the related securities, aggregated by investment category and length of time that individual securities have been in a continuous unrealized loss position, at December 31, 2007, were as follows:
Less than 12 months
12 months or more
Total
Unrealized
Losses
Fair
Value
Unrealized
Losses
Fair
Value
Unrealized
Losses
Fair
Value
Available for Sale: Certificate of Deposit -- -- $ (217 ) $ 99,497 $ (217 ) $ 99,497
The contractual term of this investment does not permit the issuer to settle the security at a price less than the amortized cost of the investment. Because the Company has the ability and intent to hold this investment until a market price recovery or maturity, these investments are not considered other-than-temporarily impaired.
2008 2007 (In thousands, except per share amounts)(Unaudited) Revenue $ 58,008 $ 54,904 Net income $ 7,457 $ 6,586 Earnings per share - basic $ 1.12 $ 0.96 Earnings per share - diluted $ 1.09 $ 0.94
(4)(3)Property and Equipment
At December 31, 20072009 and 2006,2008, property and equipment consisted of the following:2007
2006
Furniture and equipment $ 2,350,644 $ 2,266,347 Computer equipment and software 12,788,061 11,312,691 Building 9,108,247 8,651,441 Land 425,000 425,000
24,671,952 22,655,479 Less accumulated depreciation and amortization 12,697,923 10,939,546
Net property and equipment $ 11,974,029 $ 11,715,933
36
2009 2008 (In thousands) Furniture and equipment $ 2,639 $ 2,536 Computer equipment and software 16,911 14,467 Building 9,130 9,108 Land 425 425 29,105 26,536 Less accumulated depreciation and amortization 15,130 12,789 Net property and equipment $ 13,975 $ 13,747
(5)(4)Goodwill and Intangible Assets
Goodwill and intangible assets consisted of the following at December 31, 20072009 and 2006:2007
2006
Goodwill $ 31,051,202 $ 30,014,337
Non-amortizing other intangible assets: Trade name 1,190,559 1,190,559 Amortizing other intangible assets: Customer related intangibles 4,922,275 4,870,497 Trade name 1,572,000 1,572,000
Total other intangible assets, 7,684,834 7,633,056 Less accumulated amortization 2,068,924 1,159,412
Other intangible assets, net $ 5,615,910 $ 6,473,644
2008:
2009 2008 (In thousands) Goodwill $ 39,924 $ 39,276 Non-amortizing other intangible assets: Trade name 1,191 1,191 Amortizing other intangible assets: Customer related intangibles 8,174 8,150 Trade name 1,572 1,572 Total other intangible assets, 10,937 10,913 Less accumulated amortization 4,054 2,857 Other intangible assets, net $ 6,883 $ 8,056
36
The following represents a summary of changes in the Company’s carrying amount of goodwill for the years ended December 31, 2009, 2008, and 2007: (In thousands) Balance as of December 31, 2006 $ 30,014 Smaller World additional payment for contingent consideration 652 Foreign currency translation 385 Balance as of December 31, 2007 $ 31,051 MIV acquisition 8,833 Foreign currency translation (608 ) Balance as of December 31, 2008 $ 39,276 Foreign currency translation 408 MIV deferred tax adjustments (630 ) MIV allowance for doubtful accounts 75 MIV contingent consideration earned 795 Balance as of December 31, 2009 $ 39,924
The merger agreement under which the Company acquired MIV provided for contingent earn-out payments over three years based on growth in revenue and earnings. As of December 31, 2009, a contingent earn-out payment of $795,000 was accrued, which was then paid in February 2010.During 2007, an additional payment was made to Smaller World Communications for contingent consideration in accordance with the purchase agreement. The purchase agreement included two scheduled payments of additional purchase price in 2006 and 2006:Balance as of January 1, 2006 $ 11,483,401 GHS adjustment - deferred taxes 257,001 TGI acquisition 18,221,635 Smaller World additional payment 52,068 Foreign currency translation 232
Balance as of December 31, 2006 $ 30,014,337 Smaller World additional payment 651,725 Foreign currency translation 385,140
Balance as of December 31, 2007 $ 31,051,202
2008 of $536,000 and $714,000 respectively, as a result of meeting certain revenue goals.
On April 1, 2008, approximately 10 customer contracts were purchased from SQ Strategies for $249,000. The change in the carrying amountrecording of goodwill andthis purchase increased customer related intangibles by $260,000 and deferred revenues by $11,000.Aggregate amortization expense for customer related intangibles and trade names for the year ended December 31, 2007, included the impact of the foreign currency translation and the additional purchase price for the Smaller World acquisition. Customer related intangibles consisted of customer relationships and surveys, which are being amortized over their estimated useful lives of five to fifteen years. Aggregate amortization expense for customer relationships/surveys for the year ended December 31, 2007,2009, was $864,000.$1.2 million. Estimated amortization expense for the next five years is: 2010—$1.2 million; 2011—$1.1 million; 2012—$836,000; 2013—$572,000; 2014—$543,000; thereafter $1.5 million.(5) Income TaxesFor the years ended December 31, 2009, 2008, — $805,000; 2009 — $795,000; 2010 — $795,000; 2011 — $766,000; 2012 — $470,000.and 2007, income before income taxes consists of the following: 2009 2008 2007 U.S. Operations $ 11,497 $ 10,406 $ 9,664 Foreign Operations 1,620 1,577 1,453 $ 13,117 $ 11,983 $ 11,117
37
37
(6)Income Taxes
Income tax expense consisted of the following components:Current
Deferred
Total
2007: Federal $ 2,971,325 $ 65,159 $ 3,036,484 Foreign 587,658 (20,870 ) 566,788 State 602,751 72,349 675,100
Total $ 4,161,734 $ 116,638 $ 4,278,372
2006: Federal $ 2,683,441 $ 109,575 $ 2,793,016 Foreign 234,340 (20,929 ) 213,411 State 604,718 10,542 615,260
Total $ 3,522,499 $ 99,188 $ 3,621,687
2005: Federal $ 2,231,717 $ 238,868 $ 2,470,585 Foreign 286,573 (18,894 ) 267,679 State 494,669 45,437 540,106
Total $ 3,012,959 $ 265,411 $ 3,278,370
Current Deferred Total 2009: Federal $ 2,433 $ 1,109 $ 3,542 Foreign 532 3 535 State (21 ) 570 549 Total $ 2,944 $ 1,682 $ 4,626 2008: Federal $ 2,963 $ 350 $ 3,313 Foreign 549 (5 ) 544 State 596 85 681 Total $ 4,108 $ 430 $ 4,538 2007: Federal $ 2,971 $ 65 $ 3,036 Foreign 588 (21 ) 567 State 603 72 675 Total $ 4,162 $ 116 $ 4,278
The difference between the Company’s income tax expense as reported in the accompanying consolidated financial statements and the income tax expense that which would be calculated applying the U.S. federal income tax rate of 34% on pretax income was as follows:2007
2006
2005
Expected federal income taxes $ 3,779,911 $ 3,231,957 $ 2,894,917 Foreign tax rate differential 30,966 23,492 30,674 State income taxes, net of federal benefit and credits 445,567 406,072 356,470 Tax credits and incentives (51,488 ) (36,938 ) (34,980 ) Other 73,416 (2,896 ) 31,289
Total $ 4,278,372 $ 3,621,687 $ 3,278,370
2009 2008 2007 Expected federal income taxes $ 4,460 $ 4,074 $ 3,780 Foreign tax rate differential (16 ) (8 ) 31 State income taxes, net of federal benefit and state tax credits 362 449 446 Federal tax credits (183 ) (51 ) (51 ) Uncertain tax positions 27 — — Valuation allowance 18 — — Other (42 ) 74 73 Total $ 4,626 $ 4,538 $ 4,278
38
38
Deferred tax assets and liabilities at December 31, 20072009 and 2006,2008, were comprised of the following:2007
2006
Deferred tax assets: Allowance for doubtful accounts $ 27,383 $ 17,278 Accrued expenses 204,280 186,523 Stock based compensation 827,523 389,530 Other -- 34,784
Gross deferred tax assets 1,059,186 628,115
Deferred tax liabilities: Prepaid expenses 164,652 147,635 Basis in property and equipment 985,066 1,109,895 Intangible assets 1,958,647 1,309,998 Other 9,904 -- Gross deferred tax liabilities 3,118,269 2,567,528
Net deferred tax liabilities $ (2,059,083 ) $ (1,939,413 )
The Company did not record a valuation allowance for its
2009 2008 Deferred tax assets: Allowance for doubtful accounts $ 105 $ 93 Accrued expenses 248 231 Share based compensation 1,034 892 Other — 83 Gross deferred tax assets 1,387 1,299 Less Valuation Allowance (47 ) — Deferred tax assets 1,340 1,299 Deferred tax liabilities: Prepaid expenses 188 243 Property and equipment 1,602 1,263 Intangible assets 4,282 3,762 Other 296 — Deferred tax liabilities 6,368 5,268 Net deferred tax liabilities $ (5,028 ) $ (3,969 )
In assessing the realizablility of deferred tax assets, because management believes thatthe Company considers whether it is more likely than not that some portion or all of the deferred tax assets will not be realized. The ultimate realization of deferred tax assets is dependent upon the generation of future taxable income during the periods in which those temporary differences become deductible. The Company considers projected future taxable income, carryback opportunities and tax planning strategies in making this assessment. Based upon the level of historical taxable income and projections for future taxable income over the periods which the deferred tax assets are deductible, the Company believes it is more likely than not that it will generate sufficient taxablerealize the benefits of these deductible differences, net of the valuation allowance recorded. The net impact on income tax expense related to fully realize these deferredchanges in the valuation allowance for 2009 and 2008 were $18,000 and $0, respectively. The current year change relates to increases to the valuation allowance for capital loss carryforwards.
The Company has capital loss carryforwards of $123,000 which will begin to expire in 2010. A total of $76,000 of the capital loss carryforwards relate to the pre-acquisition periods of acquired companies. The Company has provided a $47,000 valuation allowance against the tax benefits.benefit associated with the capital loss carryforwards.
The undistributed foreign earnings of the Company’s foreign subsidiary of approximately $2.4$4.1 million are considered to be indefinitely reinvested. Accordingly, no provision for U.S. federal and state income taxes or foreign withholding taxes have been provided for such undistributed earnings. It is impractical to determine the additional income tax liability, if any, associated with the repatriation of undistributed earnings.
Effective January 1, 2007, the Company adopted guidance regarding accounting for uncertainty in income taxes. This accounting standards adoption had no impact on the Company. The unrecognized tax benefit at December 31, 2009 was $541,000, excluding interest of $3,000 and no penalties. Of this amount $78,000 represents the net unrecognized tax benefits that, if recognized, would favorably impact the effective income tax rate.
The Company accrues interest and penalties related to uncertain tax position in the statements of income as income tax expense.
39
The Company believes it is reasonably possible that the total amount of unrecognized tax benefits will not decrease within the next 12 months.
The change in the unrecognized tax benefits for 2009 is as follows. There was no change in unrecognized tax benefits during 2008. (In thousands) Balance of unrecognized tax benefits at December 31, 2008 $ — Increases for tax positions established during prior years 509 Increases for tax positions established for the current period 32 Balance of unrecognized tax benefits at December 31, 2009 $ 541
The Company files a U.S. federal income tax return, various state jurisdictions and a Canada federal and provincial income tax return. The 2006 to 2009 U.S. federal and state returns remain open to examination. The 2005 to 2009 Canada federal and provincial income tax returns remain open to examination.
(7)(6)Notes Payable
Notes payable consisted of the following:2007
2006
Note payable to US Bank, interest 7.21% fixed rate, scheduled principal payment ranging from $88,000 - $94,000, final payment of interest and principal due May 31, 2013, secured by land, building, accounts receivable and intangibles 2,993,352 8,697,973 Credit facility with US Bank, subject to borrowing base of 75% of eligible accounts receivable, matures July 31, 2008, maximum available $3.5 million -- 2,395,000
Total Notes Payable 2,993,352 11,092,973 Less current portion 1,092,754 3,110,106
Note payable, net of current portion $ 1,900,598 $ 7,982,867
2009 2008 (In thousands) Note payable to US Bank, interest 5.2% fixed rate, 35 scheduled principal and interest payments of $97,000, final balloon payment of interest and principal due December 31, 2011, secured by land, building, accounts receivable and intangible assets. 7,659 9,000 Revolving credit note with US Bank, subject to borrowing base of 75% of eligible accounts receivable, matures July 31, 2010, maximum available $6.5 million — 3,850 Capital leases 60 90 Other debt — 15 Total notes payable 7,719 12,955 Less current portion 816 4,581 Note payable, net of current portion $ 6,903 $ 8,374
On May 26, 2006, the Company entered into a credit facility pursuant to which it borrowed $9.0 million under a term note and $3.5 million under a revolving credit note in order to partially finance the acquisition of TGI. The term note is payable pursuant towas refinanced on February 25, 2008, for the credit facility in 83 equal installmentsremaining balance of $106,000, with the balanceterm note of $1.6 million. The refinanced term note required payments of principal and interest payable on Mayin 17 monthly installments of $93,000 beginning March 31, 2013.2008, and ending August 31, 2009. Borrowings under the refinanced term note bearbore interest at aan annual rate of 7.21% per year.5.14%. The revolving creditCompany made additional payments and paid off the term note provides a revolving credit facility that matures on July 31,in October 2008.
The maximum aggregate amount available under the revolving credit facilitynote was originally $3.5 million, but an addendum to the revolving credit note dated March 26, 2008, changed the revolving credit note amount to $6.5 million. The revolving credit note was renewed in July 2009 to extend the term to July 31, 2010. The Company may borrow, repay and re-borrow amounts under the revolving credit note from time to time until its maturity on July 31, 2010. The maximum aggregate amount available under the revolving credit note is $3.5$6.5 million, subject to a borrowing base equal to 75% of the Company’s eligible accounts receivable. The Company may borrow, repay and reborrow amounts under the revolving credit facility from time to time until its maturity on July 31, 2008. Borrowings under the revolving credit facilitynote bear interest at a variable rate equal to (1) prime (as defined in the credit facility) less 0.50%, or (2) one-, two-, three-, six- or twelve-month LIBOR. As of December 31, 2007,2009, the revolving credit note did not have a balance. According to borrowing base requirements, the Company had no borrowings outstandingthe capacity to borrow $4.2 million as of December 31, 2009.
40
On December 19, 2008, the Company borrowed $9.0 million under a term note to partially finance the acquisition of MIV. The term note is payable in 35 equal installments of $97,000, with the balance of principal and interest payable in a balloon payment due on December 31, 2011. Borrowings under the revolving credit note. Monthly installmentterm note bear interest at a rate of 5.2% per year. In 2009, the Company made principal payments, were madein addition to the monthly installments, on the term note in accordance with the credit facility. Also, additional pay downs on the loan were made with no prepayment penalties.39
totaling $650,000.
The credit facilityterm note is secured by certain of the Company’s assets, including the Company’s land, building, accounts receivable and intangibles.intangible assets. The credit facilityterm note contains various restrictions and covenants applicable to the Company, including requirements that the Company maintain certain financial ratios at prescribed levels and restrictions on the ability of the Company to consolidate or merge, create liens, incur additional indebtedness or dispose of assets. As of December 31, 2009, the Company was in compliance with these restrictions and covenants.
Debt acquired through the MIV acquisition included $90,000 in capital leases. The capital leases are for production and mailing equipment meeting capitalization requirements where the lease term exceeds more than 75% of the estimated useful life. The equipment is being depreciated over the lease term of 4.25 years ending in 2011.The aggregate maturities of the note payable and credit facility for each of the five years subsequent to December 31, 2007,2009, are: 2008 — $1,093,000; 2009 — $1,174,000; 2010 — $726,000; 2011 — $0; and 2012 — $0. TotalPayments 2010 2011 2012 2013 2014 (In thousands) Notes payable $ 7,659 $ 783 $ 6,876 $ — $ — $ —
(8)(7)Stock Option PlansShare-Based Compensation
The Company measures and recognizes compensation expense for all share-based payments. The compensation expense is recognized based on the grant-date fair value of those awards. All of the Company’s existing stock option awards and non-vested stock awards have been determined to be equity–classified awards.In August 2001, the Board of Directors adopted, and on May 1, 2002, the Company’s shareholders approved, the National Research Corporation 2001 Equity Incentive Plan (“2001 Equity Incentive Plan”). The 2001 Equity Incentive Plan provides for the granting of stock options, stock appreciation rights, restricted stock, performance shares and other share-based awards and benefits up to an aggregate of 600,000 shares of the Company’s common stock. Options granted may be either nonqualified or incentive stock options. Options vest over one to five years following the date of grant and option terms are generally five to ten years following the date of grant. At December 31, 2007,2009, there were 51,33278,417 shares available for issuance pursuant to future grants under the 2001 Equity Incentive Plan. The Company has accounted for grants of 548,668521,583 options under the 2001 Equity Incentive Plan using the date of grant as the measurement date for financial accounting purposes.In May 2004, the Board of Directors adopted, and on May 5, 2005, the Company’s shareholders approved the
41
The National Research Corporation 2004 Director Plan (the “2004 Director Plan”). The 2004 Director Plan is a nonqualified plan that provides for the granting of options with respect to 250,000 shares of the Company’s common stock. The 2004 Director Plan provides for grants of nonqualified options to each director of the Company who is not employed by the Company. In May 2004,On the date of each such director was granted an optionannual meeting of shareholders of the Company, options to purchase 11,00012,000 shares of the Company’s common stock. On the date of each subsequent Annual Meeting of Shareholders of the Company, each such director, ifstock are granted to directors that are re-elected or retained as a director at such meeting, is granted an optionmeeting. On May 7, 2009, the Board of Directors amended the plan to purchase 12,000increase the number of shares of common stock authorized for issuance under the plan from 250,000 to 550,000 shares, subject to approval of the Company’s common stock.shareholders at the 2010 annual meeting of shareholders. The grants of options to directors on the date of the 2009 annual meeting of shareholders was also made subject to approval of the Company’s shareholders at the 2010 annual meeting of shareholders. Given the ownership by the CEO and grantor retained annuity trusts that he established in February 2010, approval will be perfunctory. Options vest one year following the date of grant and option terms are generally ten years following the date of grant, or three years in the case of termination of the outside director.director’s service. At December 31, 2007,2009, pending shareholder approval of the increased number of shares at the 2010 annual meeting of shareholders, there were 73,000will be 277,000 shares available for issuance pursuant to future grants under the 2004 Director Plan. The Company has accounted for grants of 177,000 options under the 2004 Director Plan using the date of grant as the measurement date for financial accounting purposes.
In February 2006, the Board of Directors adopted, and on May 4, 2006, the Company’s shareholders approved the National Research Corporation 2006 Equity Incentive Plan (the “2006 Equity Incentive Plan”). The 2006 Equity Incentive Plan provides for the granting of options, stock appreciation rights, restricted stock, performance shares and other share-based awards and benefits up to an aggregate of 600,000 shares of the Company’s common stock. Options granted may be either incentive stock options or nonqualified stock options. Vesting terms vary with each grant, and option terms are generally five to ten years. Options vest over one to five years following the date of grant and options terms are generally five to ten years following the date of grant. At December 31, 2007,2009, there were 533,542427,057 shares available for issuance pursuant to future grants under the 2006 Equity Incentive Plan. The Company has accounted for grants of 66,458172,943 options under the 2006 Equity Incentive Plan using the date of grant as the measurement date for financial accounting purposes.The Company granted options to purchase 131,382, 128,862102,739, 118,475 and 130,688131,382 shares of the Company’s common stock during the years ended December 31, 2007, 20062009, 2008 and 2005,2007, respectively. Options to purchase shares of common stock were granted with exercise prices equal to the fair value of the common stock on the date of grant. The fair value of stock options granted was estimated using a Black-Scholes valuation model with the following assumptions:40
2007
2006
2005
Expected dividend yield at date of grant1.76-1.92%1.77-1.86%1.90-2.25%Expected stock price volatility22.7-29.9%25.0-39.0%38.4-46.3%Risk-free interest rate4.54-4.59%4.41-4.90%3.60-4.17%Expected life of options (in years)4.00 to 6.004.00 to 6.003.75 to 6.00
2009 2008 2007 Expected dividend yield at date of grant 1.93-2.35% 1.87-2.11% 1.76-1.92% Expected stock price volatility 24.2 to 30.2% 21.1-24.2% 22.7-29.9% Risk-free interest rate 1.55% to2.15% 3.18% 4.54-4.59% Expected life of options (in years) 4.00 to 6.00 4.00 to 6.00 4.00 to 6.00
The risk-free interest rate assumptions were based on the U.S. Treasury yield curve in effect at the time of the grant. The expected volatility was based on historical monthly price changes of the Company’s stock based on the expected life of the options at the date of grant. The expected life of options is the average number of years the Company estimates that options will be outstanding. The Company considers groups of associates that have similar historical exercise behavior separately for valuation purposes.The following table summarizes stock option activity under the Company’s 2001 and 2006 Equity Incentive Plans and the 2004 Director Plan for the year ended December 31, 2006:Number of
Options
Weighted
Average
Exercise
Price
Weighted
Average
Remaining
Contractual
Terms (Years)
Aggregate
Intrinsic
Value
Outstanding at beginning of period 475,666 $15.16 -- -- Granted 131,382 $23.67 -- -- Exercised (22,829) $14.88 -- -- Canceled/expired (44,559) $17.57 -- --
Outstanding at end of period 539,660 $17.04 7.14 $5,374,462
Exercisable at end of period 116,341 $18.00 7.14 $1,047,602
2009:
42
Number of Options WeightedAverageExercise Price WeightedAverageRemainingContractualTerms (Years) AggregateIntrinsic Value(Inthousands) Outstanding at beginning of period 492,431 $ 20.77 — — Granted 102,739 $ 27.91 — — Exercised (2,023 ) $ 8.69 — — Canceled/expired (15,325 ) $ 21.73 — — Outstanding at end of period 577,822 $ 22.06 6.74 $ 1,221 Exercisable at end of period 265,959 $ 20.26 5.78 $ 855
The weighted average grant date fair value of stock options granted during the years ended December 31, 2009, 2008 and 2007, 2006was $5.72, $5.67 and 2005, was $6.39, $6.02 and $4.97, respectively. The total intrinsic value of stock options exercised during the years ended December 31, 2009, 2008 and 2007, 2006 and 2005, was $239,000, $1$28,000, $2.3 million and $211,000,$239,000, respectively. As of December 31, 2007,2009, the total unrecognized compensation cost related to non-vested stock option awards was approximately $1.1 million,$810,000, which was expected to be recognized over a weighted average period of 2.64 years.Cash received from stock options exercised for the years ended December 31, 2009, 2008 and 2007, 2006was $18,000, $1.9 million, and 2005, was $338,000, $926,000, and $254,000, respectively. The actual tax benefit realized for the tax deduction from stock options exercised was $92,000, $405,000$11,000, $743,000 and $84,000,$92,000, for the years ended December 31, 2009, 2008 and 2007, 2006respectively.During 2009, 2008 and 2005, respectively.During 2007, 2006 and 2005, the Company granted 32,115, 13,218-0-, -0- and 27,27832,115 non-vested shares of common stock under the 2001 Equity Incentive Plan. As of December 31, 2007,2009, the Company had 66,18321,956 non-vested shares of common stock outstanding under the plan.Plan. These shares vest over one to five years following the date of grant and holders thereof are entitled to receive dividends from the date of grant, whether or not vested. The fair value of the awards is calculated as the fair market value of the shares on the date of grant. The Company recognized $436,820, $168,466$178,000, $220,000 and $112,221$437,000 of non-cash compensation for the years ended December 31, 2007, 20062009, 2008 and 2005,2007, respectively, related to this non-vested stock.
41
The following table summarizes information regarding non-vested stock granted to associates under the 2001 Equity Incentive Plan for the year ended December 31, 2006.Shares
Outstanding
Weighted Average
Grant Date Fair Value
Per Share($)
Outstanding at beginning of period 49,720 $15.45 Granted 32,115 $23.54 Vested (6,543) $17.83 Forfeited (9,109) $11.00
Outstanding at end of period 66,183 $19.75
The total intrinsic value of non-vested stock awards vested during the years ended December 31, 2007, 2006 and 2005, was $167,000, $147,000 and $40,000, respectively. 2009:
SharesOutstanding Weighted AverageGrant Date FairValue Per Share Outstanding at beginning of period 36,502 $ 21.62 Granted — — Vested (10,645 ) $ 23.49 Forfeited (3,901 ) $ 16.15 Outstanding at end of period 21,956 $ 21.68
As of December 31, 2007,2009, the total unrecognized compensation cost related to non-vested stock awards was approximately $695,000$105,000 and is expected to be recognized over a weighted average period of 2.321.73 years.In periods prior to January 1, 2006, the Company applied the intrinsic value based method of APB Opinion No. 25,Accounting for Stock Issued to Employees, and related interpretations to account for its fixed-plan stock options. Under this method, no compensation expense was reflected in net income as all options granted had an exercise price equal to the fair value of common stock on the date of grant. The following table illustrates the effect on the Company’s net income and earnings per share for the year ended December 31, 2005, if compensation expense had been recorded in net income under the fair-value-based method in accordance SFAS No. 123R.
2005
(in thousands, except
per share amounts) Net income: As reported $ 5,236 Less: Total share-based compensation expense determined under the fair value method for all awards, net of tax (341 )
Pro forma $ 4,895
Earnings per share: Basic, as reported $ 0.74 Basic, pro forma $ 0.70 Diluted, as reported $ 0.74 Diluted, pro forma $ 0.69
(9)(8)Leases
The Company leases printing equipment and services in the United States, and office space in Canada, Wisconsin and California. The Company has recorded rent expense of $626,000, $607,000 and $475,000 $386,000in 2009, 2008 and $277,000 in 2007, 2006 and 2005, respectively. Minimum lease payments under noncancelablenon-cancelable operating leases and capital leases are:
43
Minimum lease payments TotalPayments 2010 2011 2012 2013 2014 (In thousands) Operating leases $ 1,600 $ 524 $ 459 $ 432 $ 175 $ 10 Capital leases 65 37 28 — — — Total $ 1,665 $ 561 $ 487 $ 432 $ 175 $ 10
The capital leases are for eachproduction and mailing equipment. Total minimum lease payments remaining are $65,000, with $5,000 representing interest as of December 31, 2009. The present value of the five years subsequent tofuture minimum lease payments are $60,000 less current maturities of $33,000. Long-term obligations under capital leases total $27,000 as of December 31, 2007 are: 2008 — $463,000; 2009 — $391,000; 2010 — $84,000; 2011 — $-0-; 2012 — $-0-.2009.(10)(9)Related Party
A Board member of the Company also serves as a director of the Picker Institute. The Company advanced $300,000 in each of 2004 and 2003 to the Picker Institute to fund designated research projectsprojects. The advance was fully used by December 31, 2008. $171,000 and $175,000 and $254,000 was expensed on research work during 2008 and 2007, and 2006, respectively. In addition,A Board member of the Company is a party to a support services agreementalso serves as an officer of Ameritas Life Insurance Corp. In connection with the Picker Institute underCompany’s regular assessment of its insurance-based associate benefits and the costs associated therewith, which is conducted by an independent insurance broker, in 2007 the Company conductsbegan purchasing dental insurance for certain of its associates from Ameritas Life Insurance Corp. and, in 2009, the annual NRC Picker Symposium. Under the support services agreement, the Picker Institute receives a portionCompany also began purchasing vision insurance for certain of the gross receiptsits associates from Ameritas Life Insurance Corp. The total value of each symposium, which amounted to approximately $15,000these purchases was $113,000, $79,000 and $65,000 in 2009, 2008 and 2007 $12,000 in 2006 and $15,000 in 2005.42
respectively.(11)(10)Associate Benefits
The Company sponsors a qualified 401(k) plan covering substantially all associates with no eligibility service requirement. Under the 401(k) plan, the Company matches 25% of the first 6% of compensation contributed by each associate. Employer contributions, which are discretionary, vest to participants at a rate of 20% per year. The Company contributed $151,000, $151,000 and $127,000 in 2009, 2008 and $124,000 in 2007, and 2006, respectively, as a matching percentage of associate 401(k) contributions. No contributions were made by the Company in 2005.(12)Subsequent Events
In February 2006, the Company’s Board of Directors authorized a stock repurchase plan providing for the repurchase of an additional 750,000 shares. The plan has no expiration date.
Subsequent to December 31, 2007, the Company has repurchased 263,013 shares of common stock at an approximate cost of $6.6 million and an average per share price of $24.91.
Item 9.Changes in and Disagreements with Accountants on Accounting and Financial Disclosure
Item 9. Changes in and Disagreements with Accountants on Accounting and Financial Disclosure
Not applicable.Item 9A.Controls and Procedures
Item 9A. Controls and Procedures
In accordance with Rule 13a-15(b) of the Securities Exchange Act of 1934 (the “Exchange Act”), the Company’s management evaluated, with the participation of the Company’s Chief Executive Officer and the Company’s Chief Financial Officer, the effectiveness of the design and operation of the Company’s disclosure controls and procedures (as defined in Rule 13a-15(e) and 15d-15(e) under the Exchange Act) as of December 31, 2007.2009. Based upon their evaluation of these disclosure controls and procedures, the Chief Executive Officer and the Chief Financial Officer concluded that the disclosure controls and procedures were effective as of December 31, 2007.2009.
44
The Company’s management is responsible for establishing and maintaining adequate internal control over financial reporting (as defined in Rule 13a-15(f) of the Exchange Act). The Company’s internal control over financial reporting is designed to provide reasonable assurance regarding the reliability of financial reporting and the preparation of financial statements for external purposes in accordance with generally accepted accounting principles. Because of its inherent limitations, however, internal control over financial reporting may not prevent or detect misstatements. Also, projections of any evaluation of effectiveness to future periods are subject to the risk that controls may become inadequate because of changes in conditions, or that the degree of compliance with the policies of procedures may deteriorate.The Company’s management, with the participation of the Company’s Chief Executive Officer and Chief Financial Officer, has evaluated the effectiveness of the Company’s internal control over financial reporting using the framework inInternal Control – Integrated Framework issued by the Committee of Sponsoring Organizations of the Treadway Commission. Based on such evaluation, the Company’s management concluded that the Company’s internal control over financial reporting was effective as of December 31, 2007.2009.There was no change in the Company’s internal control over financial reporting that occurred during the quarter ended December 31, 2007,2009, that has materially affected, or is reasonably likely to materially affect, the Company’s internal control over financial reporting.43
This annual report does not include an attestation report of the Company’s registered public accounting firm regarding internal control over financial reporting. Management’s report was not subject to attestation by the Company’s registered public accounting firm pursuant to temporary rules of the Securities and Exchange Commission that permit the Company to provide only management’s report in this annual report.Item 9B.Other Information
Item 9B. Other Information
The Company has no other information to report pursuant to this item.
45
44
PART IIIItem 10.Directors, Executive Officers and Corporate Governance
Item 10. Directors, Executive Officers and Corporate Governance
The information required by this Item with respect to directors and Section 16 compliance is included under the captions “Election of Directors” and “Section 16(a) Beneficial Ownership Reporting Compliance,” respectively, in the Company’s definitive Proxy Statement for its 20082010 Annual Meeting of Shareholders (“Proxy Statement”) and is hereby incorporated herein by reference. Information with respect to the executive officers of the Company appears in Item 1 of this Annual Report on Form 10-K. The information required by this Item with respect to audit committees and audit committee financial experts is included under the caption “Corporate Governance” in the Proxy Statement and is incorporated herein by reference.The Company has adopted a Code of Business Conduct and Ethics that applies to all of the Company’s associates, including the Company’s Chief Executive Officer, Chief Financial Officer, Controller and other persons performing similar functions. The Company has posted a copy of the Code of Business Conduct and Ethics on its website atwww.nationalresearch.com. The Company intends to satisfy the disclosure requirements under Item 5.05 of Form 8-K regarding amendments to, or waivers from, the Code of Business Conduct and Ethics by posting such information on its website atwww.nationalresearch.com. The Company is not including the information contained on its website as part of, or incorporating it by reference into, this report.Item 11.Executive Compensation
Item 11. Executive Compensation
The information required by this Item is included under the captions “Compensation Discussion and Analysis,” “Summary“2009 Summary Compensation Table,” “Grants of Plan-Based Awards in 2009,” “Outstanding Equity Awards at December 31, 2007,2009,” “Option Exercises and Stock Vested,” “Director“2009 Director Compensation” and “Compensation Committee Report” in the Proxy Statement and is hereby incorporated herein by reference.Item 12.Security Ownership of Certain Beneficial Owners and Management and Related Shareholder Matters
Item 12. Security Ownership of Certain Beneficial Owners and Management and Related Shareholder Matters
The information required by this Item with respect to security ownership of certain beneficial owners and management is included under the caption “Principal Shareholders” in the Proxy Statement and is hereby incorporated by reference.The following table sets forth information with respect to compensation plans under which equity securities of the Company are authorized for issuance as of December 31, 2007.Plan Category
Number of securities to be
issued upon the exercise of
outstanding options,
warrants and
rights
Weighted-average exercise
price of outstanding
options,
warrants and rights
Number of securities remaining
available for future issuance
under equity compensation
plans (excluding securities
reflected in the first column)
Equity compensation plans approved by security holders(1) 539,660 $17.04 657,874(2)
Equity compensation plans not approved by security holders -- -- --
Total539,660 $17.04 657,874
46
Plan Category Number of securities to be issued upon the exercise of outstanding options,warrants and rights Weighted-average exercise price ofoutstanding options, warrants and rights Number of securities remaining available for future issuance under equity compensation plans (excluding securities reflected in the first column) Equity compensation plans approved by security holders (1) 554,822 $ 21.80 505,474 (2) Equity compensation plans not approved by security holders 23,000 27.23 277,000 (3) Total 577,822 $ 22.06 782,474
(1) Includes the Company’s 2006 Equity Incentive Plan, 2004 Director Plan, and the 2001 Equity Incentive Plan.
(2) As of December 31, 2007,2009, the Company had authority to award up to 152,455161,854 additional shares of restricted Common Stock to participants under the 2001 Equity Incentive Plan, provided that the total of such shares awarded may not exceed the total number of shares remaining available for issuance under the 2001 Equity Incentive Plan, which totaled 51,33278,417 as of December 31, 2007.2009. Under the 2006 Equity Incentive Plan, the Company had authority to award up to 167,885 additional shares of restricted Common Stock.Stock to participants under the 2006 Equity Incentive Plan, provided that the total of such shares awarded may not exceed the total number of shares remaining available for issuance under the 2006 Equity Incentive Plan, which totaled 427,057 as of December 31, 2009.
45
Item 13.Certain Relationships and Related Transactions
(3) As of December 31, 2009, the Company had authority to award up to 277,000 additional shares of Common Stock to participants under the 2004 Directors Plan, subject to approval by the Company’s shareholders at the 2010 annual meeting of shareholders of the amendment to the plan adopted, on May 7, 2009 by the Board of Directors to increase the number of shares of common stock authorized for issuance under the plan from 250,000 to 550,000 shares. The Board of Directors conditioned the amendment, on the approval of the Company’s shareholders at the 2010 annual meeting of shareholders. The grants of options to directors on the date of the 2009 annual meeting of shareholders were also made subject to approval of the Company’s shareholders at the 2010 annual meeting of shareholders.
Item 13. Certain Relationships and Related Transactions, and Director Independence
The information required by this Item is included under the caption “Corporate Governance — Transactions with Related Persons”Governance—” in the Proxy Statement and is hereby incorporated by reference.Item 14.Principal Accountant Fees and Services
Item 14. Principal Accountant Fees and Services
The information required by this Item is included under the caption “Miscellaneous-Independent“Miscellaneous—Independent Registered Public Accounting Firm” in the Proxy Statement and is hereby incorporated by reference.
46
47
PART IVItem 15.Exhibits, Financial Statement Schedules
Item 15. Exhibits, Financial Statement Schedules (a) 1. Consolidated financial statements –- The consolidated financial statements listed in the accompanying index to the consolidated financial statements and financial statement schedule are filed as part of this Annual Report on Form 10-K.
2. Financial statement schedule –- The financial statement schedule listed in the accompanying index to the consolidated financial statements and financial statement schedule is filed as part of this Annual Report on Form 10-K.
3. Exhibits –- The exhibits listed in the accompanying exhibit index are filed as part of this Annual Report on Form 10-K.
48
NATIONAL RESEARCH CORPORATION AND SUBSIDIARYSCHEDULE II — VALUATION AND QUALIFYING ACCOUNTS
Balance atBeginning of Year MIVAcquisition Bad DebtExpense Write-offsNet ofRecoveries Balanceat Endof Year (In thousands) Allowance for doubtful accounts: Year Ended December 31, 2007 $ 44 $ — $ 29 $ 3 $ 70 Year Ended December 31, 2008 $ 70 $ 69 $ 168 $ 66 $ 241 Year Ended December 31, 2009 $ 241 $ 75 $ 138 $ 175 $ 279
47
SIGNATURES
Pursuant to the requirements
See accompanying report of Section 13 or 15(d) of the Securities Exchange Act of 1934, the Registrant has duly caused this report to be signed on its behalf by the undersigned, thereunto duly authorized, on this 28th day of March 2008.NATIONAL RESEARCH CORPORATION
By /s/ Michael D. Hays Michael D. Hays Chief Executive Officer
Pursuant to the requirements of the Securities Exchange Act of 1934, this report has been signed below by the following persons on behalf of the Registrant and in the capacities and on the dates indicated.
Signature
Title
Date
/s/ Michael D. HaysChief Executive Officer and Director (PrincipalMarch 28, 2008Michael D. HaysExecutive Officer)
/s/ Patrick E. BeansVice President, Treasurer, Secretary, ChiefMarch 28, 2008Patrick E. BeansFinancial Officer and Director (PrincipalFinancial and Accounting Officer)
/s/ Joseph W. CarmichaelPresident and DirectorMarch 28, 2008Joseph W. Carmichael
/s/ JoAnn M. MartinDirectorMarch 28, 2008JoAnn M. Martin
/s/ John N. NunnellyDirectorMarch 28, 2008John N. Nunnelly
/s/ Paul C. Schorr IIIDirectorMarch 28, 2008Paul C. Schorr III
/s/ Gail L. WardenDirectorMarch 28, 2008Gail L. Warden
independent registered public accounting firm.
48
49
INDEX TO CONSOLIDATED FINANCIAL STATEMENTS
AND FINANCIAL STATEMENT SCHEDULE
Page in this
Form 10-K
Report of Independent Registered Public Accounting Firm 24 Consolidated Balance Sheets as of December 31, 20072009 and 20062008 25 Consolidated Statements of Income for the Three Years Ended December 31, 20072009 26 Consolidated Statements of Shareholders’ Equity and Comprehensive Income as of and for the Three Years Ended December 31, 20072009 27 Consolidated Statements of Cash Flows for the Three Years Ended December 31, 20072009 28 Notes to Consolidated Financial Statements 29 Schedule II--II — Valuation and Qualifying Accounts 50 49
All other financial statement schedules are omitted since the required information is not present or is not present in amounts sufficient to require submission of the schedules, or because the information required is included in the consolidated financial statements and notes thereto.
49
50
NATIONAL RESEARCH CORPORATION AND SUBSIDIARY
SCHEDULE II — VALUATION AND QUALIFYING ACCOUNTS
Balance at
Beginning
of Year
Bad Debt
Expense
Write-offs
Net of
Recoveries
Balance
at End
of Year
Allowance for doubtful accounts: Year Ended December 31, 2005 $ 100,526 $ 2,657 $ -- $ 103,183 Year Ended December 31, 2006 $ 103,183 $ (58,881 ) $ -- $ 44,302 Year Ended December 31, 2007 $ 44,302 $ 28,510 $ 2,600 $ 70,212
See accompanying
SIGNATURESPursuant to the requirements of Section 13 or 15(d) of the Securities Exchange Act of 1934, the Registrant has duly caused this report to be signed on its behalf by the undersigned, thereunto duly authorized, on this 31st day of independent registered public accounting firm.March 2010.NATIONAL RESEARCH CORPORATION By /s/ Michael D. Hays Michael D. Hays President and Chief Executive Officer
Pursuant to the requirements of the Securities Exchange Act of 1934, this report has been signed below by the following persons on behalf of the Registrant and in the capacities and on the dates indicated.
50
Signature Title Date /s/ Michael D. Hays President, Chief Executive Officer and Director March 31, 2010 Michael D. Hays (Principal Executive Officer) /s/ Patrick E. Beans Vice President, Treasurer, Secretary, Chief March 31, 2010 Patrick E. Beans Financial Officer and Director (Principal Financial and Accounting Officer) /s/ JoAnn M. Martin Director March 31, 2010 JoAnn M. Martin /s/ John N. Nunnelly Director March 31, 2010 John N. Nunnelly /s/ Paul C. Schorr III Director March 31, 2010 Paul C. Schorr III /s/ Gail L. Warden Director March 31, 2010 Gail L. Warden
51
EXHIBIT INDEXExhibit
Number Exhibit Description
(3.1) Articles of Incorporation of National Research Corporation, as amended to date [Incorporated by reference to Exhibit (3.1) to National Research Corporation’s Registration Statement on Form S-1 (Registration No. 333-33273)]
(3.2) By-Laws of National Research Corporation, as amended to date [Incorporated by reference to Exhibit (3.2) to National Research Corporation’s Current Report on Form 8-K dated October 10, 2007May 8, 2009 (File No. 0-29466)]
(10.1)*(4.1) Installment or Single Payment Note, dated as of December 19, 2008, from National Research Corporation 1997 Equity Incentive Planto U.S. Bank National Association [Incorporated by reference to Exhibit (10.2)(4.1) to National Research Corporation’s Registration StatementCurrent Report on Form S-1 (Registration8-K dated December 19, 2008 (File No. 333-33273)0-294660)]
(10.2)(10.1)* National Research Corporation 2001 Equity Incentive Plan [Incorporated by reference to National Research Corporation'sCorporation’s Proxy Statement for the 2002 Annual Meeting of Shareholders, filed with the Securities and Exchange Commission on April 3, 2002 (File No. 0-29466)]
(10.3)(10.2)* National Research Corporation 2006 Equity Incentive Plan [Incorporated by reference to National Research Corporation'sCorporation’s Proxy Statement for the 2006 Annual Meeting of Shareholders, filed with the Securities and Exchange Commission on April 3, 2006 (File No. 0-29466)]
(10.4)(10.3)* National Research Corporation Director Stock Plan, as amended to date [Incorporated by reference to Exhibit (10.2) to National Research Corporation’s Annual Report on Form 10-K for the year ended December 31, 1997 (File No. 0-29466)]
(10.5)(10.4)* National Research Corporation 2004 Director Stock Plan [Incorporated by reference to National Research Corporation'sCorporation’s Proxy Statement for the 2005 Annual Meeting of Shareholders, filed with the Securities and Exchange Commission on April 4, 2005 (File No. 0-29466)]
(10.6)Asset Purchase Agreement, dated as of September 16, 2005, among National Research Corporation, Geriatric Health Systems, LLC, Health Services Benefit Administrators, Inc. and Peter Yedidia [Incorporated by reference to Exhibit 2.1 to National Research Corporation’s current Report of Form 8-K dated September 16, 2005 (File No. 0-29466)]
(10.7)(10.5)+Contract, dated January 23, 2002, between National Research Corporation and the Department of Veterans Affairs [Incorporated by reference to Exhibit (10.4) to National Research Corporation’s Annual Report on Form 10-K for the year ended December 31, 2001 (File No. 0-29466)]
(10.8)(10.6)* Form of Nonqualified Stock Option Agreement (for new associates) used in connection with the 2001 Equity Incentive Plan [Incorporated by reference to Exhibit 4.4 to National Research Corporation’s Registration Statement on Form S-8 (Registration No. 333-120530)]
(10.9)(10.7)* Form of Nonqualified Stock Option Agreement (for officers) used in connection with the 2001 Equity Incentive Plan [Incorporated by reference to Exhibit 4.5 to National Research Corporation’s Registration Statement on Form S-8 (Registration No. 333-120530)]
51
(10.10)(10.8)* Form of Restricted Stock Agreement for executive officers used in connection with the 2001 Equity Incentive Plan [Incorporated by reference to Exhibit 10.2 to National Research Corporation’s Current Report on Form 8-K dated March 19, 2005 (File No. 0-29466)]
(10.11)(10.9)* Form of Restricted Stock Agreement (one year vesting) used in connection with the 2001 Equity Incentive Plan [Incorporated by reference to Exhibit 4.6 to National Research Corporation’s Registration Statement on Form S-8 (Registration No. 333-120530)]
52
(10.12)ExhibitNumberExhibit Description (10.10)* Form of Restricted Stock Agreement (five year vesting) used in connection with the 2001 Equity Incentive Plan [Incorporated by reference to Exhibit 4.7 to National Research Corporation’s Registration Statement on Form S-8 (Registration No. 333-120530)]
(10.13)(10.11)* Restricted Stock Incentive Plan for Joseph W. Carmichael, as amended and restated, under the 2001 Equity Incentive Plan [Incorporated by reference to Exhibit 10.2 to National Research Corporation’s Current Report on Form 8-K dated March 3, 2006 (File No. 0-29466)]
(10.14)(10.12)* Director’s Compensation Summary [Incorporated by reference to Exhibit (10.1) to National Research Corporation’s QuarterlyAnnual Report on Form 10-Q for the quarter ended March 31, 2007 (File No. 0-29466)]
(10.15)(10.13)* Form of Nonqualified Stock Option Agreement used in connection with the 2006 Equity Incentive Plan [Incorporated by reference to Exhibit (10.14) to National Research Corporation’s Annual Report on Form 10-K for the year ended December 31, 20072006 (File No. 0-29466)]
(10.16)(10.14)* Form of Restricted Stock Agreement used in connection with the 2006 Equity Incentive Plan [Incorporated by reference to Exhibit (10.15) to National Research Corporation’s Annual Report on Form 10-K for the year ended December 31, 20072006 (File No. 0-29466)]
(23)(10.15) Merger Agreement, dated as of November 26, 2008, by and among National Research Corporation, NRC Acquisition, Inc., My Innerview, Inc., Neil L. Gulsvig and Janice L. Gulsvig [Incorporated by reference to Exhibit (2.1) to National Research Corporation’s Current Report on Form 8-K dated November 26, 2008 (File No. 0-29466)] (23.1) Consent of Independent Registered Public Accounting Firm
(31.1) Certification of the Chief Executive Officer pursuant to Section 302 of the Sarbanes-Oxley Act of 2002
(31.2) Certification of the Chief Financial Officer pursuant to Section 302 of the Sarbanes-Oxley Act of 2002
(32.1) Certification of Periodic Financial Report by the Chief Executive Officer and Chief Financial Officer pursuant to Section 906 of the Sarbanes-Oxley Act of 2002
(99.1) Proxy Statement for the 20082010 Annual Meeting of Shareholders, to be filed within 120 days of December 31, 20072009 [To be filed with the Securities and Exchange Commission under Regulation 14A within 120 days after December 31, 2007;2009; except to the extent specifically incorporated by reference, the Proxy Statement for the 20082010 Annual Meeting of Shareholders shall not be deemed to be filed with the Securities and Exchange Commission as part of this Annual Report on Form 10-K]
* A management contract or compensatory plan or arrangement.
+ Portions of this exhibit have been redacted and are subject to a confidential treatment request filed with the Secretary of the Securities and Exchange Commission pursuant to Rule 24b-2 under the Securities Exchange Act of 1934, as amended. The redacted material was filed separately with the Securities and Exchange Commission.
52
53
| Common Stock | Additional Paid-in Capital | Retained Earnings | Unearned Compensation | Accumulated Other Comprehensive Income | Treasury Stock | Total | |||||||||||||||||
|---|---|---|---|---|---|---|---|---|---|---|---|---|---|---|---|---|---|---|---|---|---|---|---|
| Balances at December 31, 2004 | $ | 7,684 | $ | 19,345,569 | $ | 20,382,334 | $ | (182,354 | ) | $ | 220,261 | $ | (4,755,837 | ) | $ | 35,017,657 | |||||||
| Purchase of 385,700 shares of | |||||||||||||||||||||||
| treasury stock | -- | -- | -- | -- | -- | (5,932,475 | ) | (5,932,475 | ) | ||||||||||||||
| Issuance of 30,873 common shares | |||||||||||||||||||||||
| for the exercise of stock options | 31 | 253,846 | -- | -- | -- | -- | 253,877 | ||||||||||||||||
| Tax benefit from the exercise of | |||||||||||||||||||||||
| options | -- | 84,140 | -- | -- | -- | -- | 84,140 | ||||||||||||||||
| Issuance of 25,692 restricted | |||||||||||||||||||||||
| common shares, net of 2,036 | |||||||||||||||||||||||
| cancelled | 26 | 362,472 | -- | (362,498 | ) | -- | -- | -- | |||||||||||||||
| Non-cash stock | |||||||||||||||||||||||
| compensation expense | -- | -- | -- | 112,221 | -- | -- | 112,221 | ||||||||||||||||
| Dividends declared of $0.32 per | |||||||||||||||||||||||
| common share | -- | -- | (2,258,128 | ) | -- | -- | -- | (2,258,128 | ) | ||||||||||||||
| Comprehensive income | |||||||||||||||||||||||
| Change in unrealized gain/(loss) | |||||||||||||||||||||||
| on marketable securities net of | |||||||||||||||||||||||
| tax | -- | -- | -- | -- | 4,280 | -- | 4,280 | ||||||||||||||||
| Change in cumulative translation | |||||||||||||||||||||||
| adjustment | -- | -- | -- | -- | 75,828 | -- | 75,828 | ||||||||||||||||
| Net income | -- | -- | 5,236,091 | -- | -- | -- | 5,236,091 | ||||||||||||||||
| Total comprehensive income | -- | -- | 5,236,091 | -- | 80,108 | -- | 5,316,199 | ||||||||||||||||
| Balances at December 31, 2005 | 7,741 | 20,046,027 | 23,360,297 | (432,631 | ) | 300,369 | (10,688,312 | ) | 32,593,491 | ||||||||||||||
| Purchase of 52,217 shares of | |||||||||||||||||||||||
| treasury stock | -- | -- | -- | -- | -- | (1,236,055 | ) | (1,236,055 | ) | ||||||||||||||
| Issuance of 89,307 common shares | |||||||||||||||||||||||
| for the exercise of stock options | 89 | 926,102 | -- | -- | -- | -- | 926,191 | ||||||||||||||||
| Tax benefit from the exercise of | |||||||||||||||||||||||
| options | -- | 404,535 | -- | -- | -- | -- | 404,535 | ||||||||||||||||
| Issuance of 13,218 restricted | |||||||||||||||||||||||
| common shares, net of 5,250 | |||||||||||||||||||||||
| cancelled | 8 | (8 | ) | -- | -- | -- | -- | -- | |||||||||||||||
| Non-cash stock | |||||||||||||||||||||||
| compensation expense | -- | 875,684 | -- | -- | -- | -- | 875,684 | ||||||||||||||||
| Reclassify unearned compensation | -- | (432,631 | ) | -- | 432,631 | -- | -- | -- | |||||||||||||||
| Dividends declared of $0.40 per | |||||||||||||||||||||||
| common share | -- | -- | (2,756,057 | ) | -- | -- | -- | (2,756,057 | ) | ||||||||||||||
| Comprehensive income | |||||||||||||||||||||||
| Change in unrealized gain/(loss) | |||||||||||||||||||||||
| on marketable securities net of | |||||||||||||||||||||||
| tax | -- | -- | -- | -- | 67,436 | -- | 67,436 | ||||||||||||||||
| Change in cumulative translation | |||||||||||||||||||||||
| adjustment | -- | -- | -- | -- | (8,780 | ) | -- | (8,780 | ) | ||||||||||||||
| Net income | -- | -- | 5,884,068 | -- | -- | -- | 5,884,068 | ||||||||||||||||
| Total comprehensive income | -- | -- | 5,884,068 | -- | 58,656 | -- | 5,942,724 | ||||||||||||||||
| Balances at December 31, 2006 | 7,838 | 21,819,709 | 26,488,308 | -- | 359,025 | (11,924,367 | ) | 36,750,513 | |||||||||||||||
| Purchase of 61,849 shares of | |||||||||||||||||||||||
| treasury stock | -- | -- | -- | -- | -- | (241,061 | ) | (241,061 | ) | ||||||||||||||
| Issuance of 22,829 common shares | |||||||||||||||||||||||
| for the exercise of stock options | 22 | 337,764 | -- | -- | -- | -- | 337,786 | ||||||||||||||||
| Tax benefit from the exercise of | |||||||||||||||||||||||
| options | -- | 111,551 | -- | -- | -- | -- | 111,551 | ||||||||||||||||
| Issuance of 32,115 restricted | |||||||||||||||||||||||
| common shares, net of 9,109 | |||||||||||||||||||||||
| cancelled | 23 | (23 | ) | -- | -- | -- | -- | -- | |||||||||||||||
| Non-cash stock | |||||||||||||||||||||||
| compensation expense | -- | 1,239,716 | -- | -- | -- | -- | 1,239,716 | ||||||||||||||||
| Dividends declared of $0.48 per | |||||||||||||||||||||||
| common share | -- | -- | (3,323,714 | ) | -- | -- | -- | (3,323,714 | ) | ||||||||||||||
| Comprehensive income | |||||||||||||||||||||||
| Change in unrealized gain/(loss) | |||||||||||||||||||||||
| on marketable securities net of | |||||||||||||||||||||||
| tax | -- | -- | -- | -- | 4,085 | -- | 4,085 | ||||||||||||||||
| Change in cumulative translation | |||||||||||||||||||||||
| adjustment | -- | -- | -- | -- | 568,545 | -- | 568,545 | ||||||||||||||||
| Net income | -- | -- | 6,839,012 | -- | -- | -- | 6,839,012 | ||||||||||||||||
| Total comprehensive income | -- | -- | 6,839,012 | -- | 572,630 | -- | 7,411,642 | ||||||||||||||||
| Balances at December 31, 2007 | $ | 7,883 | $ | 23,508,717 | $ | 30,003,606 | $ | -- | $ | 931,655 | $ | (12,165,428 | ) | $ | 42,286,433 | ||||||||
Common Stock | Additional Paid-in Capital | Retained Earnings | Accumulated Other Comprehensive Income | Treasury Stock | Total | |||||||||||||||||||
| Balances at December 31, 2006 | 8 | 21,820 | 26,488 | 359 | (11,924 | ) | 36,751 | |||||||||||||||||
| Purchase of 61,849 shares of treasury stock | — | — | — | — | (241 | ) | (241 | ) | ||||||||||||||||
| Issuance of 22,829 common shares for the exercise of stock options | — | 338 | — | — | — | 338 | ||||||||||||||||||
| Tax benefit from the exercise of options and vested restricted stock | — | 111 | — | — | — | 111 | ||||||||||||||||||
| Issuance of 32,115 restricted common shares, net of 9,109 cancelled | — | — | — | — | — | — | ||||||||||||||||||
| Non-cash stock compensation expense | — | 1,240 | — | — | — | 1,240 | ||||||||||||||||||
| Dividends declared of $0.48 per common share | — | — | (3,324 | ) | — | — | (3,324 | ) | ||||||||||||||||
| Comprehensive income | ||||||||||||||||||||||||
| Change in unrealized gain/(loss) on marketable securities, net of tax | — | — | — | 4 | — | 4 | ||||||||||||||||||
| Change in cumulative translation adjustment | — | — | — | 568 | — | 568 | ||||||||||||||||||
| Net income | — | — | 6,839 | — | — | 6,839 | ||||||||||||||||||
| Total comprehensive income | 7,411 | |||||||||||||||||||||||
| Balances at December 31, 2007 | $ | 8 | $ | 23,509 | $ | 30,003 | $ | 931 | $ | (12,165 | ) | $ | 42,286, | |||||||||||
| Purchase of 395,558 shares of treasury stock | — | — | — | — | (10,133 | ) | (10,133 | ) | ||||||||||||||||
| Issuance of 144,614 common shares for the exercise of stock options | — | 1,856 | — | — | — | 1,856 | ||||||||||||||||||
| Tax benefit from the exercise of options and vested restricted stock | — | 836 | — | — | — | 836 | ||||||||||||||||||
| Cancellation of 7,981 restricted common shares | — | — | — | — | — | — | ||||||||||||||||||
| Non-cash stock compensation expense | — | 1,016 | — | — | — | 1,016 | ||||||||||||||||||
| Dividends declared of $0.56 per common share | — | — | (3,771 | ) | — | — | (3,771 | ) | ||||||||||||||||
| Comprehensive income | ||||||||||||||||||||||||
| Change in cumulative translation adjustment | — | — | — | (937 | ) | — | (937 | ) | ||||||||||||||||
| Net Income | 7,445 | 7,445 | ||||||||||||||||||||||
| Total comprehensive income | — | — | — | — | — | 6,508 | ||||||||||||||||||
| Balances at December 31, 2008 | $ | 8 | $ | 27,217 | $ | 33,677 | $ | (6 | ) | $ | (22,298 | ) | $ | 38,598 | ||||||||||
| Purchase of 3,528 shares of treasury stock | — | — | — | — | (84 | ) | (84 | ) | ||||||||||||||||
| Issuance of 2,023 common shares for the exercise of stock options | — | 18 | — | — | — | 18 | ||||||||||||||||||
| Tax benefit from the exercise of options and vested restricted stock | — | 17 | — | — | — | 17 | ||||||||||||||||||
| Cancellation of 3,901 restricted common shares | — | — | — | — | — | — | ||||||||||||||||||
| Non-cash stock compensation expense | — | 619 | — | — | — | 619 | ||||||||||||||||||
| Dividends declared of $0.64 per common share | — | — | (4,263 | ) | — | — | (4,263 | ) | ||||||||||||||||
| Comprehensive income | ||||||||||||||||||||||||
| Change in cumulative translation adjustment | — | — | — | 775 | — | 775 | ||||||||||||||||||
| Net income | 8,491 | 8,491 | ||||||||||||||||||||||
| Total comprehensive income | — | — | — | — | — | 9,266 | ||||||||||||||||||
| Balances at December 31, 2009 | $ | 8 | $ | 27,871 | $ | 37,905 | $ | 769 | $ | (22,382 | ) | $ | 44,171 | |||||||||||
| 2007 | 2006 | 2005 | |||||||||
|---|---|---|---|---|---|---|---|---|---|---|---|
| Cash flows from operating activities: | |||||||||||
| Net income | $ | 6,839,012 | $ | 5,884,068 | $ | 5,236,091 | |||||
| Adjustments to reconcile net income to net cash provided by | |||||||||||
| operating activities: | |||||||||||
| Depreciation and amortization | 2,582,866 | 2,259,669 | 1,761,623 | ||||||||
| Deferred income taxes | 117,046 | 99,135 | 264,049 | ||||||||
| Loss (gain) on sale of property and equipment | (3,587 | ) | (50 | ) | 239 | ||||||
| Loss (gain) on sale of other investments | -- | 47,616 | (43 | ) | |||||||
| Tax benefit from exercise of stock options | 31,245 | 63,005 | 84,140 | ||||||||
| Non-cash stock compensation expense | 1,092,776 | 1,022,624 | 112,221 | ||||||||
| Change in assets and liabilities, net of effect of | |||||||||||
| acquisitions: | |||||||||||
| Trade accounts receivable | 616,423 | (884,575 | ) | (2,079,193 | ) | ||||||
| Unbilled revenue | 900,397 | (1,089,431 | ) | 29,026 | |||||||
| Prepaid expenses and other | 30,190 | 256,809 | 45,597 | ||||||||
| Accounts payable | (73,154 | ) | 22,006 | 602,326 | |||||||
| Accrued expenses, wages, bonus and profit sharing | 329,845 | (58,680 | ) | 328,718 | |||||||
| Income taxes payable and recoverable | 562,797 | (714,293 | ) | 442,865 | |||||||
| Billings in excess of revenue earned | 1,540,258 | (95,723 | ) | 1,360,425 | |||||||
| Net cash provided by operating activities | 14,566,114 | 6,812,180 | 8,188,084 | ||||||||
Cash flows from investing activities: | |||||||||||
| Purchases of property and equipment | (1,956,204 | ) | (1,453,128 | ) | (1,088,172 | ) | |||||
| Proceeds from sale of property and equipment | 200 | 50 | 1,500 | ||||||||
| Acquisition, net of cash acquired and earn-out on acquisition | -- | (20,620,521 | ) | (4,459,198 | ) | ||||||
| Purchases of securities available-for-sale | (2,990,012 | ) | (1,378,523 | ) | (19,453,522 | ) | |||||
| Proceeds from the maturities of securities available-for-sale | 4,007,262 | 9,784,215 | 25,353,137 | ||||||||
| Net cash provided by (used in) investing activities | (938,754 | ) | (13,667,907 | ) | 353,745 | ||||||
Cash flows from financing activities: | |||||||||||
| Proceeds from notes payable | 375,000 | 14,795,000 | -- | ||||||||
| Payments on notes payable | (8,474,621 | ) | (5,173,310 | ) | (3,429,571 | ) | |||||
| Proceeds from exercise of stock options | 337,786 | 926,191 | 253,877 | ||||||||
| Tax benefit on exercise of stock options and vested | |||||||||||
| restricted stock | 80,306 | 341,530 | -- | ||||||||
| Purchase of treasury stock | (241,061 | ) | (1,236,055 | ) | (5,932,475 | ) | |||||
| Payment of dividends on common stock | (3,323,714 | ) | (2,756,057 | ) | (2,258,128 | ) | |||||
| Net cash provided by (used in) financing activities | (11,246,304 | ) | 6,897,299 | (11,366,297 | ) | ||||||
Effect of exchange rate changes on cash | 97,726 | (9,171 | ) | 20,734 | |||||||
Net increase (decrease) in cash and cash equivalents | 2,478,782 | 32,401 | (2,803,734 | ) | |||||||
Cash and cash equivalents at beginning of period | 876,360 | 843,959 | 3,647,693 | ||||||||
Cash and cash equivalents at end of period | $ | 3,355,142 | $ | 876,360 | $ | 843,959 | |||||
Supplemental disclosure of cash paid for: | |||||||||||
| Interest expense | $ | 483,135 | $ | 600,719 | $ | 364,210 | |||||
| Income taxes | $ | 3,457,478 | $ | 3,839,192 | $ | 2,479,834 | |||||
| 2009 | 2008 | 2007 | ||||||||||
| Cash flows from operating activities: | ||||||||||||
| Net income | $ | 8,491 | $ | 7,445 | $ | 6,839 | ||||||
| Adjustments to reconcile net income to net cash provided by operating activities: | ||||||||||||
| Depreciation and amortization | 3,831 | 2,686 | 2,583 | |||||||||
| Deferred income taxes | 1,733 | 430 | 117 | |||||||||
| Loss (gain) on sale of property and equipment | 1 | — | (3 | ) | ||||||||
| Tax benefit from exercise of stock options | — | 156 | 31 | |||||||||
| Non-cash stock compensation expense | 619 | 1,016 | 1,093 | |||||||||
| Change in assets and liabilities, net of effect of acquisitions: | ||||||||||||
| Trade accounts receivable | 1,396 | 637 | 616 | |||||||||
| Unbilled revenue | (315 | ) | 603 | 900 | ||||||||
| Prepaid expenses and other | (516 | ) | (155 | ) | 30 | |||||||
| Accounts payable | (278 | ) | (408 | ) | (73 | ) | ||||||
| Accrued expenses, wages, bonus and profit sharing | (73 | ) | 6 | 330 | ||||||||
| Income taxes payable and recoverable | (326 | ) | (249 | ) | 563 | |||||||
| Deferred revenue | (897 | ) | 3,008 | 1,540 | ||||||||
| Net cash provided by operating activities | 13,666 | 15,175 | 14,566 | |||||||||
| Cash flows from investing activities: | ||||||||||||
| Purchases of property and equipment | (2,909 | ) | (2,812 | ) | (1,956 | ) | ||||||
| Acquisition, net of cash acquired and earn-out on acquisition | (93 | ) | (12,551 | ) | — | |||||||
| Purchases of securities available-for-sale | — | — | (2,990 | ) | ||||||||
| Proceeds from the maturities of securities available-for-sale | — | 99 | 4,007 | |||||||||
| Net cash used in investing activities | (3,002 | ) | (15,264 | ) | (939 | ) | ||||||
| Cash flows from financing activities: | ||||||||||||
| Proceeds from notes payable | 4,916 | 18,564 | 375 | |||||||||
| Payments on notes payable | (10,152 | ) | (8,952 | ) | (8,474 | ) | ||||||
| Proceeds from exercise of stock options | 18 | 731 | 338 | |||||||||
| Tax benefit on exercise of stock options and vested restricted stock | 17 | 680 | 80 | |||||||||
| Purchase of treasury stock | (84 | ) | (9,007 | ) | (241 | ) | ||||||
| Payment of dividends on common stock | (4,263 | ) | (3,771 | ) | (3,324 | ) | ||||||
| Net cash used in financing activities | (9,548 | ) | (1,755 | ) | (11,246 | ) | ||||||
| Effect of exchange rate changes on cash | 287 | (402 | ) | 98 | ||||||||
| Net increase (decrease) in cash and cash equivalents | 1,403 | (2,246 | ) | 2,479 | ||||||||
| Cash and cash equivalents at beginning of period | 1,109 | 3,355 | 876 | |||||||||
| Cash and cash equivalents at end of period | $ | 2,512 | $ | 1,109 | $ | 3,355 | ||||||
| Supplemental disclosure of cash paid for: | ||||||||||||
| Interest expense | $ | 498 | $ | 122 | $ | 483 | ||||||
| Income taxes | $ | 2,999 | $ | 3,502 | $ | 3,457 | ||||||
previously owned shares to pay for the option strike price. The total non-cash stock options exercised was $0, $1.1 million and
| (1) | Summary of Significant Accounting Policies |
Sales taxes collected from customers and remitted to governmental authorities are accounted for on a net basis and, therefore, are excluded from revenue in the consolidated statements of income.
29
Past due balances over 90 days and over a specified amount are reviewed individually for collectability and provisions are made for accounts not specifically reviewed. Account balances are charged off against the allowance after all means of collection have been exhausted and the potential for recovery is considered remote.
building and related improvements.
In accordance with Statement of Financial Accounting Standards (“SFAS”) No. 144,Accounting for the Impairment or Disposal of Long-Lived Assets, the
30
| · | Significant underperformance in comparison to historical or projected operating results; |
| · | Significant changes in the manner or use of acquired assets or the Company’s overall strategy; |
| · | Significant negative trends in the Company’s industry or the overall economy; |
| · | A significant decline in the market price for the Company’s common stock for a sustained period; and |
| · | The Company’s market capitalization falling below the book value of the Company’s net assets. |
Investments in Marketable Debt Securities
All marketable debt securities held by the Company at December 31, 2007determined and 2006, were classified as available-for-sale and recorded at fair market value. Unrealized holding gains and losses, net of the related tax effect, on available-for-sale securities are reported as other comprehensive income or loss. Realized gains and losses from the sale of available-for-sale securities are determined on a specific-identification basis. Fair values are estimatedmeasured based on quoted market prices. Interest income is recognized when earned.
A decline in the marketestimated fair value of any available-for-sale security below cost that is deemedgoodwill as compared to be other-than-temporary results in a reduction inits carrying amount to fair value. The impairment is charged to earnings and a new cost basis for the security is established. To determine whether an impairment is other-than-temporary, the Company considers whether it has the ability and intent to hold the investment until a market price recovery and considers whether evidence indicating the cost of the investment is recoverable outweighs evidence to the contrary. Evidence considered in this assessment includes the reasons for the impairment, the
severity and duration of the impairment, changes in value subsequent to year-end, and forecasted performance of the investee. The Company’s analysis has not resulted in the recognition of an impairment loss on investments in 2007, 2006 or 2005.
Share-Based Compensation
Effective January 1, 2006, The Company uses the deferral method of accounting for its investment tax credits related to state tax incentives. During the years ended December 31, 2009, 2008 and 2007, the Company adopted SFAS No. 123Rrecorded income tax benefits relating to these tax credits of $189,000, $0, and $0.
The Company currently intends that shares of common stock issued upon the exercise of options will be newly-issued shares. No share-based compensation costs were capitalized for the twelve-month periods ended December 31, 2007 and 2006. equity-classified awards.
| 2007 | 2006 | |||||||
|---|---|---|---|---|---|---|---|---|
| (in thousands) | (in thousands) | |||||||
| Amounts charged against income, | $ | 1,252 | $ | 1,023 | ||||
| before income tax benefit | ||||||||
| Amount of related income tax benefit | 483 | 399 | ||||||
| Total net income impact | $ | 769 | $ | 624 | ||||
plans:
2009 | 2008 | 2007 | ||||||||||
| (In thousands) | ||||||||||||
| Amounts charged against income, before income tax benefit | $ | 619 | $ | 1,016 | $ | 1,093 | ||||||
| Amount of related income tax benefit | 238 | 391 | 421 | |||||||||
| Total net income impact | $ | 381 | $ | 625 | $ | 672 | ||||||
Fair Value of Financial Instruments
The carrying value of financial instruments included in2009, those assets and liabilities that are measured at fair value on a recurring basis consisted of the following:
| Level 1 | Level 2 | Level 3 | ||||||||||
| (In thousands) | ||||||||||||
| Money Market Funds | $ | 930 | $ | — | $ | — | ||||||
| U.S. government notes | — | 1,560 | — | |||||||||
| Total | $ | 930 | $ | 1,560 | $ | — | ||||||
value in certain circumstances (for example, when there is evidence of impairment). As of December 31, 2009, there was no indication of impairment related to our non-financial assets and liabilities. Refer to Note 1, Goodwill and Intangible Assets, for further description of the inputs used to measure fair value of goodwill as part of our annual impairment test.
32
| 2007 | 2006 | 2005 | |||||||||
|---|---|---|---|---|---|---|---|---|---|---|---|
| Common stock | 6,849,717 | 6,836,456 | 7,037,896 | ||||||||
| Dilutive effect of options | 131,036 | 91,885 | 61,511 | ||||||||
| Dilutive effect of restricted stock | 30,518 | 25,623 | 18,630 | ||||||||
| Weighted average shares used for dilutive per | |||||||||||
| share information | 7,011,271 | 6,953,964 | 7,118,037 | ||||||||
| 2009 | 2008 | 2007 | ||||||||||
| (In thousands) | ||||||||||||
| Common stock | 6,637 | 6,685 | 6,850 | |||||||||
| Dilutive effect of options | 74 | 131 | 131 | |||||||||
| Dilutive effect of restricted stock | 12 | 15 | 30 | |||||||||
| Weighted average shares used for dilutive per share information | 6,723 | 6,831 | 7,011 | |||||||||
Accumulated
The components ofcomprehensive income (loss) refers to revenue, expenses, gains and losses that are not included in net income, but rather are recorded directly in stockholder’s equity. For the years ended December 31, 2009 and 2008 accumulated other comprehensive income were(loss) was $769,000 and ($6,000), respectively, consisting solely of changes in the cumulative translation adjustment.
| 2007 | 2006 | 2005 | |||||||||
|---|---|---|---|---|---|---|---|---|---|---|---|
| (in thousands) | |||||||||||
| Net income, as reported | $ | 6,839 | $ | 5,884 | $ | 5,236 | |||||
Other comprehensive income: | |||||||||||
| Unrealized gain (loss) from investments: | |||||||||||
| Unrealized gains | 7 | 112 | 3 | ||||||||
| Related tax (expense) benefit | (3 | ) | (44 | ) | 1 | ||||||
| Net | 4 | 68 | 4 | ||||||||
| Foreign currency translation | 569 | (9 | ) | 76 | |||||||
| Total other comprehensive income | 573 | 59 | 80 | ||||||||
| Comprehensive income | $ | 7,412 | $ | 5,943 | $ | 5,316 | |||||
NRC Picker U.S. and NRC Picker Canada, which each offer renewable performance tracking and improvement services, custom research, best practice improvement services, and a renewable syndicated service; Healthcare Market Guide (Ticker) offers stand-alone market information as well as a comparative performance database to allow the Company’s clients to assess their performance relative to the industry, to access best practice examples, and to utilize competitive information for marketing purposes; Payer Solutions offers functional disease-specific and health status measurement tools; The Governance Institute (TGI) offers subscription-based governance information and educational conferences designed to improve the effectiveness of hospital and healthcare systems by continually strengthening their healthcare boards, medical leadership, and management performance in the United States; and My InnerView (MIV) provides quality and performance improvement solutions to the senior care profession.
In June 2006, the FASB issued FASB Interpretation No. 48 (“FIN 48”),Accounting for Uncertainty in Income Taxes— An Interpretation of FASB Statement No. 109. FIN 48 prescribes a recognition threshold and measurement process for recording in the financial statements uncertain tax positions taken or expected to be taken in a tax return. Additionally, this interpretation provides guidance on the derecognition, classification, accounting in interim periods and disclosure requirements for uncertain tax positions. The provisions of FIN 48 were effective for us on January 1, 2007. The adoption of FIN 48 had no effect on the consolidated financial statements.
33
In September 2006, the FASB issued SFAS No. 157,Fair Value Measurements. SFAS No. 157 defines fair value, establishes a framework for measuring fair value in generally accepted accounting principles (GAAP), and expands disclosures about fair value measurements. The provisions of SFAS No. 157 are effective as of the beginning of a company’s first fiscal year that begins after November 15, 2007. ManagementDecember 31, 2009, management believes that adoption of SFAS No. 157this new guidance will not have a material effect on the consolidated financial statements.
In February 2008, the FASB issued FASB Staff Position (FSP) Financial Accounting Standard (FAS) 157-1,Application of FASB Statement No. 157 to FASB Statement No. 13 and Its Related Interpretive Accounting Pronouncements That Address Leasing Transactions, and FSP FAS 157-2,Effective Date of FASB Statement No. 157. FSP FAS 157-1 removes leasing from the scope of SFAS No. 157,Fair Value Measurements. FSP FAS 157-2 delays the effective date of SFAS No. 157 from 2008 to 2009 for all non-financial assets and non-financial liabilities, except those that are recognized or disclosed at fair value in the financial statements on a recurring basis (at least annually). Management believes that adoption of SFAS No. 157-1 and 157-2 will not have a material effect on the consolidated financial statements.
In February 2007, the FASB issued SFAS No. 159,The Fair Value Option for Financial Assets and Financial Liabilities including an amendment of FASB Statement No. 115. This statement permits entities to choose to measure many financial instruments and certain other items at fair value. The provisions of SFAS No. 159 are effective as of the beginning of a company’s first fiscal year that begins after November 15, 2007. Management believes that adoption of SFAS No. 159 will not have a material effect on the consolidated financial statements.
In June 2007, the FASB ratified the consensus reached by the Emerging Issues Task Force (EITF) in EITF Issue No. 07-3,Accounting for Nonrefundable Advance Payments for Goods or Services Received for Use in Future Research and Development Activities (EITF 07-3), which requires that nonrefundable advance payments for goods or services that will be used or rendered for future research and development activities be deferred and amortized over the period that the goods are delivered or the related services are performed, subject to an assessment of recoverability. EITF 07-3 is effective as of the beginning of a company’s first fiscal year that begins after December 15, 2008. Management believes that adoption of EITF 07-3 will not have a material effect on the consolidated financial statements.
In December 2007, the FASB issued SFAS No. 141(R),Business Combinations (“SFAS 141(R)”), which replaces FAS 141. SFAS 141(R) establishes principles and requirements for how an acquirer in a business combination recognizes and measures in its financial statements the identifiable assets acquired, the liabilities assumed, and any controlling interest; recognizes and measures the goodwill acquired in the business combination or a gain from a bargain purchase; and determines what information to disclose to enable users of the financial statements to evaluate the nature and financial effects of the business combination. FAS 141(R) is to be applied prospectively to business combinations for which the acquisition date is on or after an entity’s fiscal year that begins after December 15, 2008. Management will assess the impact of SFAS 141(R) if and when a future acquisition occurs.
| (2) | Acquisitions |
34
The Company has allocated the following amounts as its preliminary purchase price as follows,allocation, based on the estimated fair value of the assets acquired and liabilities assumed at the date of acquisition:
| Fair Value | |||||
|---|---|---|---|---|---|
| Current assets | $ | 730,804 | |||
| Property and equipment | 67,573 | ||||
| Customer relationships | 2,694,000 | ||||
| Trade name | 1,572,000 | ||||
| Goodwill | 18,221,635 | ||||
| Total acquired assets | 23,286,012 | ||||
| Less total liabilities assumed | 3,201,691 | ||||
| Net assets acquired | $ | 20,084,321 | |||
Of the $22,487,635 of acquired intangible assets, $2,694,000 was assigned to customer relationships and $1,572,000 was assigned to a trade name.
| Fair Value | ||||
| (In thousands) | ||||
| Current Assets | $ | 1,290 | ||
| Property and equipment | 846 | |||
| Customer relationships | 3,003 | |||
| Goodwill | 8,833 | |||
| Other Long Term Assets | 581 | |||
| Total acquired assets | 14,553 | |||
| Less total liabilities | 2,613 | |||
| Net assets acquired | $ | 11,940 | ||
| 2006 | |||||
|---|---|---|---|---|---|
| (In thousands, except per share amounts) (Unaudited ) | |||||
| Revenue | $ | 46,812 | |||
| Net income | $ | 6,274 | |||
| Earnings per share - basic | $ | 0.92 | |||
| Earnings per share - diluted | $ | 0.90 | |||
The Company’s investments in marketable securities are in marketablepro forma adjustments include the impact of depreciation and amortization of property and equipment and intangible assets acquired, interest expense on the acquisition debt, securities classified as obligations of U.S. government agencies. The amortized cost, gross unrealized holding gains and losses and fair valueincome tax benefits for tax effects of the Company’s investment in the obligations of U.S. government agencies as of December 31, 2007foregoing adjustments to depreciation, amortization and 2006, were as follows:
| 2007 | 2006 | |||||||
|---|---|---|---|---|---|---|---|---|
Amortized cost | $ | 99,714 | $ | 1,116,963 | ||||
| Gross unrealized holding gains | 0 | 2,727 | ||||||
| Gross unrealized holding losses | (217 | ) | (9,586 | ) | ||||
| Fair value | $ | 99,497 | $ | 1,110,104 | ||||
In May 2006, the Company sold $5.6 million of marketable debt securities in advance of their scheduled maturities to partially fund the purchase of TGI. The Company recognized a loss of $46,000 on these securities sold in advance of their scheduled maturities. There were no sales of marketable debt securities in advance of scheduled maturities of available-for-sale marketable debt securities during 2007. The fair value and amortized cost of marketable debt securities at December 31, 2007, by contractual maturity, are shown below. Actual maturities may differ from the contractual maturities because borrowers may have the right to call or prepay obligations with or without call or prepayment penalties.
| At December 31, 2007 | ||||||||
|---|---|---|---|---|---|---|---|---|
| Fair Value | Amortized Cost | |||||||
Due after three months through one year | $ | -- | $ | -- | ||||
| Due after one year through five years | 99,497 | 99,714 | ||||||
| $ | 99,497 | $ | 99,714 | |||||
Gross unrealized losses on investment securities and the fair value of the related securities, aggregated by investment category and length of time that individual securities have been in a continuous unrealized loss position, at December 31, 2007, were as follows:
| Less than 12 months | 12 months or more | Total | ||||||||||||||||||
|---|---|---|---|---|---|---|---|---|---|---|---|---|---|---|---|---|---|---|---|---|
| Unrealized Losses | Fair Value | Unrealized Losses | Fair Value | Unrealized Losses | Fair Value | |||||||||||||||
| Available for Sale: | ||||||||||||||||||||
| Certificate of Deposit | -- | -- | $ | (217 | ) | $ | 99,497 | $ | (217 | ) | $ | 99,497 | ||||||||
The contractual term of this investment does not permit the issuer to settle the security at a price less than the amortized cost of the investment. Because the Company has the ability and intent to hold this investment until a market price recovery or maturity, these investments are not considered other-than-temporarily impaired.
| 2008 | 2007 | |||||||
(In thousands, except per share amounts) (Unaudited) | ||||||||
| Revenue | $ | 58,008 | $ | 54,904 | ||||
| Net income | $ | 7,457 | $ | 6,586 | ||||
| Earnings per share - basic | $ | 1.12 | $ | 0.96 | ||||
| Earnings per share - diluted | $ | 1.09 | $ | 0.94 | ||||
| Property and Equipment |
| 2007 | 2006 | |||||||
|---|---|---|---|---|---|---|---|---|
Furniture and equipment | $ | 2,350,644 | $ | 2,266,347 | ||||
| Computer equipment and software | 12,788,061 | 11,312,691 | ||||||
| Building | 9,108,247 | 8,651,441 | ||||||
| Land | 425,000 | 425,000 | ||||||
| 24,671,952 | 22,655,479 | |||||||
| Less accumulated depreciation and amortization | 12,697,923 | 10,939,546 | ||||||
| Net property and equipment | $ | 11,974,029 | $ | 11,715,933 | ||||
36
| 2009 | 2008 | |||||||
| (In thousands) | ||||||||
| Furniture and equipment | $ | 2,639 | $ | 2,536 | ||||
| Computer equipment and software | 16,911 | 14,467 | ||||||
| Building | 9,130 | 9,108 | ||||||
| Land | 425 | 425 | ||||||
| 29,105 | 26,536 | |||||||
| Less accumulated depreciation and amortization | 15,130 | 12,789 | ||||||
| Net property and equipment | $ | 13,975 | $ | 13,747 | ||||
| Goodwill and Intangible Assets |
| 2007 | 2006 | |||||||
|---|---|---|---|---|---|---|---|---|
Goodwill | $ | 31,051,202 | $ | 30,014,337 | ||||
Non-amortizing other intangible assets: | ||||||||
| Trade name | 1,190,559 | 1,190,559 | ||||||
| Amortizing other intangible assets: | ||||||||
| Customer related intangibles | 4,922,275 | 4,870,497 | ||||||
| Trade name | 1,572,000 | 1,572,000 | ||||||
| Total other intangible assets, | 7,684,834 | 7,633,056 | ||||||
| Less accumulated amortization | 2,068,924 | 1,159,412 | ||||||
| Other intangible assets, net | $ | 5,615,910 | $ | 6,473,644 | ||||
2008:
| 2009 | 2008 | |||||||
| (In thousands) | ||||||||
| Goodwill | $ | 39,924 | $ | 39,276 | ||||
| Non-amortizing other intangible assets: | ||||||||
| Trade name | 1,191 | 1,191 | ||||||
| Amortizing other intangible assets: | ||||||||
| Customer related intangibles | 8,174 | 8,150 | ||||||
| Trade name | 1,572 | 1,572 | ||||||
| Total other intangible assets, | 10,937 | 10,913 | ||||||
| Less accumulated amortization | 4,054 | 2,857 | ||||||
| Other intangible assets, net | $ | 6,883 | $ | 8,056 | ||||
| (In thousands) | ||||
| Balance as of December 31, 2006 | $ | 30,014 | ||
| Smaller World additional payment for contingent consideration | 652 | |||
| Foreign currency translation | 385 | |||
| Balance as of December 31, 2007 | $ | 31,051 | ||
| MIV acquisition | 8,833 | |||
| Foreign currency translation | (608 | ) | ||
| Balance as of December 31, 2008 | $ | 39,276 | ||
| Foreign currency translation | 408 | |||
| MIV deferred tax adjustments | (630 | ) | ||
| MIV allowance for doubtful accounts | 75 | |||
| MIV contingent consideration earned | 795 | |||
| Balance as of December 31, 2009 | $ | 39,924 | ||
| Balance as of January 1, 2006 | $ | 11,483,401 | |||
| GHS adjustment - deferred taxes | 257,001 | ||||
| TGI acquisition | 18,221,635 | ||||
| Smaller World additional payment | 52,068 | ||||
| Foreign currency translation | 232 | ||||
| Balance as of December 31, 2006 | $ | 30,014,337 | |||
| Smaller World additional payment | 651,725 | ||||
| Foreign currency translation | 385,140 | ||||
| Balance as of December 31, 2007 | $ | 31,051,202 | |||
2008 of $536,000 and $714,000 respectively, as a result of meeting certain revenue goals.
| 2009 | 2008 | 2007 | ||||||||||
| U.S. Operations | $ | 11,497 | $ | 10,406 | $ | 9,664 | ||||||
| Foreign Operations | 1,620 | 1,577 | 1,453 | |||||||||
| $ | 13,117 | $ | 11,983 | $ | 11,117 | |||||||
37
| Current | Deferred | Total | |||||||||
|---|---|---|---|---|---|---|---|---|---|---|---|
| 2007: | |||||||||||
| Federal | $ | 2,971,325 | $ | 65,159 | $ | 3,036,484 | |||||
| Foreign | 587,658 | (20,870 | ) | 566,788 | |||||||
| State | 602,751 | 72,349 | 675,100 | ||||||||
| Total | $ | 4,161,734 | $ | 116,638 | $ | 4,278,372 | |||||
2006: | |||||||||||
| Federal | $ | 2,683,441 | $ | 109,575 | $ | 2,793,016 | |||||
| Foreign | 234,340 | (20,929 | ) | 213,411 | |||||||
| State | 604,718 | 10,542 | 615,260 | ||||||||
| Total | $ | 3,522,499 | $ | 99,188 | $ | 3,621,687 | |||||
2005: | |||||||||||
| Federal | $ | 2,231,717 | $ | 238,868 | $ | 2,470,585 | |||||
| Foreign | 286,573 | (18,894 | ) | 267,679 | |||||||
| State | 494,669 | 45,437 | 540,106 | ||||||||
| Total | $ | 3,012,959 | $ | 265,411 | $ | 3,278,370 | |||||
| Current | Deferred | Total | ||||||||||
2009: | ||||||||||||
| Federal | $ | 2,433 | $ | 1,109 | $ | 3,542 | ||||||
| Foreign | 532 | 3 | 535 | |||||||||
| State | (21 | ) | 570 | 549 | ||||||||
| Total | $ | 2,944 | $ | 1,682 | $ | 4,626 | ||||||
2008: | ||||||||||||
| Federal | $ | 2,963 | $ | 350 | $ | 3,313 | ||||||
| Foreign | 549 | (5 | ) | 544 | ||||||||
| State | 596 | 85 | 681 | |||||||||
| Total | $ | 4,108 | $ | 430 | $ | 4,538 | ||||||
2007: | ||||||||||||
| Federal | $ | 2,971 | $ | 65 | $ | 3,036 | ||||||
| Foreign | 588 | (21 | ) | 567 | ||||||||
| State | 603 | 72 | 675 | |||||||||
| Total | $ | 4,162 | $ | 116 | $ | 4,278 | ||||||
| 2007 | 2006 | 2005 | |||||||||
|---|---|---|---|---|---|---|---|---|---|---|---|
Expected federal income taxes | $ | 3,779,911 | $ | 3,231,957 | $ | 2,894,917 | |||||
| Foreign tax rate differential | 30,966 | 23,492 | 30,674 | ||||||||
| State income taxes, net of federal benefit and credits | 445,567 | 406,072 | 356,470 | ||||||||
| Tax credits and incentives | (51,488 | ) | (36,938 | ) | (34,980 | ) | |||||
| Other | 73,416 | (2,896 | ) | 31,289 | |||||||
| Total | $ | 4,278,372 | $ | 3,621,687 | $ | 3,278,370 | |||||
| 2009 | 2008 | 2007 | ||||||||||
| Expected federal income taxes | $ | 4,460 | $ | 4,074 | $ | 3,780 | ||||||
| Foreign tax rate differential | (16 | ) | (8 | ) | 31 | |||||||
| State income taxes, net of federal benefit and state tax credits | 362 | 449 | 446 | |||||||||
| Federal tax credits | (183 | ) | (51 | ) | (51 | ) | ||||||
| Uncertain tax positions | 27 | — | — | |||||||||
| Valuation allowance | 18 | — | — | |||||||||
| Other | (42 | ) | 74 | 73 | ||||||||
| Total | $ | 4,626 | $ | 4,538 | $ | 4,278 | ||||||
38
| 2007 | 2006 | |||||||
|---|---|---|---|---|---|---|---|---|
| Deferred tax assets: | ||||||||
| Allowance for doubtful accounts | $ | 27,383 | $ | 17,278 | ||||
| Accrued expenses | 204,280 | 186,523 | ||||||
| Stock based compensation | 827,523 | 389,530 | ||||||
| Other | -- | 34,784 | ||||||
| Gross deferred tax assets | 1,059,186 | 628,115 | ||||||
Deferred tax liabilities: | ||||||||
| Prepaid expenses | 164,652 | 147,635 | ||||||
| Basis in property and equipment | 985,066 | 1,109,895 | ||||||
| Intangible assets | 1,958,647 | 1,309,998 | ||||||
| Other | ||||||||
| 9,904 | -- | |||||||
| Gross deferred tax liabilities | 3,118,269 | 2,567,528 | ||||||
| Net deferred tax liabilities | $ | (2,059,083 | ) | $ | (1,939,413 | ) | ||
The Company did not record a valuation allowance for its
| 2009 | 2008 | |||||||
| Deferred tax assets: | ||||||||
| Allowance for doubtful accounts | $ | 105 | $ | 93 | ||||
| Accrued expenses | 248 | 231 | ||||||
| Share based compensation | 1,034 | 892 | ||||||
| Other | — | 83 | ||||||
| Gross deferred tax assets | 1,387 | 1,299 | ||||||
| Less Valuation Allowance | (47 | ) | — | |||||
| Deferred tax assets | 1,340 | 1,299 | ||||||
| Deferred tax liabilities: | ||||||||
| Prepaid expenses | 188 | 243 | ||||||
| Property and equipment | 1,602 | 1,263 | ||||||
| Intangible assets | 4,282 | 3,762 | ||||||
| Other | 296 | — | ||||||
| Deferred tax liabilities | 6,368 | 5,268 | ||||||
| Net deferred tax liabilities | $ | (5,028 | ) | $ | (3,969 | ) | ||
benefit associated with the capital loss carryforwards.
| (In thousands) | ||||
| Balance of unrecognized tax benefits at December 31, 2008 | $ | — | ||
Increases for tax positions established during prior years | 509 | |||
| Increases for tax positions established for the current period | 32 | |||
| Balance of unrecognized tax benefits at December 31, 2009 | $ | 541 | ||
| Notes Payable |
| 2007 | 2006 | |||||||
|---|---|---|---|---|---|---|---|---|
| Note payable to US Bank, interest 7.21% fixed rate, | ||||||||
| scheduled principal payment ranging from $88,000 - $94,000, | ||||||||
| final payment of interest and principal due May 31, 2013, | ||||||||
| secured by land, building, accounts receivable and | ||||||||
| intangibles | 2,993,352 | 8,697,973 | ||||||
| Credit facility with US Bank, subject to borrowing base of 75% | ||||||||
| of eligible accounts receivable, matures July 31, 2008, | ||||||||
| maximum available $3.5 million | -- | 2,395,000 | ||||||
| Total Notes Payable | 2,993,352 | 11,092,973 | ||||||
| Less current portion | 1,092,754 | 3,110,106 | ||||||
| Note payable, net of current portion | $ | 1,900,598 | $ | 7,982,867 | ||||
| 2009 | 2008 | |||||||
| (In thousands) | ||||||||
| Note payable to US Bank, interest 5.2% fixed rate, 35 scheduled principal and interest payments of $97,000, final balloon payment of interest and principal due December 31, 2011, secured by land, building, accounts receivable and intangible assets. | 7,659 | 9,000 | ||||||
| Revolving credit note with US Bank, subject to borrowing base of 75% of eligible accounts receivable, matures July 31, 2010, maximum available $6.5 million | — | 3,850 | ||||||
| Capital leases | 60 | 90 | ||||||
| Other debt | — | 15 | ||||||
| Total notes payable | 7,719 | 12,955 | ||||||
| Less current portion | 816 | 4,581 | ||||||
| Note payable, net of current portion | $ | 6,903 | $ | 8,374 | ||||
39
totaling $650,000.
As of December 31, 2009, the Company was in compliance with these restrictions and covenants.
Total Payments | 2010 | 2011 | 2012 | 2013 | 2014 | |||||||||||||||||||
| (In thousands) | ||||||||||||||||||||||||
| Notes payable | $ | 7,659 | $ | 783 | $ | 6,876 | $ | — | $ | — | $ | — | ||||||||||||
In May 2004, the Board of Directors adopted, and on May 5, 2005, the Company’s shareholders approved the
40
| 2009 | 2008 | 2007 | ||||
| Expected dividend yield at date of grant | 1.93-2.35% | 1.87-2.11% | 1.76-1.92% | |||
| Expected stock price volatility | 24.2 to 30.2% | 21.1-24.2% | 22.7-29.9% | |||
| Risk-free interest rate | 1.55% to2.15% | 3.18% | 4.54-4.59% | |||
| Expected life of options (in years) | 4.00 to 6.00 | 4.00 to 6.00 | 4.00 to 6.00 |
| Number of Options | Weighted Average Exercise Price | Weighted Average Remaining Contractual Terms (Years) | Aggregate Intrinsic Value | |
|---|---|---|---|---|
| Outstanding at beginning of period | 475,666 | $15.16 | -- | -- |
| Granted | 131,382 | $23.67 | -- | -- |
| Exercised | (22,829) | $14.88 | -- | -- |
| Canceled/expired | (44,559) | $17.57 | -- | -- |
| Outstanding at end of period | 539,660 | $17.04 | 7.14 | $5,374,462 |
| Exercisable at end of period | 116,341 | $18.00 | 7.14 | $1,047,602 |
2009:
Number of Options | Weighted Average Exercise Price | Weighted Average Remaining Contractual Terms (Years) | Aggregate Intrinsic Value (In thousands) | |||||||||||||
| Outstanding at beginning of period | 492,431 | $ | 20.77 | — | — | |||||||||||
| Granted | 102,739 | $ | 27.91 | — | — | |||||||||||
| Exercised | (2,023 | ) | $ | 8.69 | — | — | ||||||||||
| Canceled/expired | (15,325 | ) | $ | 21.73 | — | — | ||||||||||
| Outstanding at end of period | 577,822 | $ | 22.06 | 6.74 | $ | 1,221 | ||||||||||
| Exercisable at end of period | 265,959 | $ | 20.26 | 5.78 | $ | 855 | ||||||||||
During 2007, 2006 and 2005, the Company granted 32,115, 13,218-0-, -0- and 27,27832,115 non-vested shares of common stock under the 2001 Equity Incentive Plan. As of December 31, 2007,2009, the Company had 66,18321,956 non-vested shares of common stock outstanding under the plan.Plan. These shares vest over one to five years following the date of grant and holders thereof are entitled to receive dividends from the date of grant, whether or not vested. The fair value of the awards is calculated as the fair market value of the shares on the date of grant. The Company recognized $436,820, $168,466$178,000, $220,000 and $112,221$437,000 of non-cash compensation for the years ended December 31, 2007, 20062009, 2008 and 2005,2007, respectively, related to this non-vested stock.
41
| Shares Outstanding | Weighted Average Grant Date Fair Value Per Share($) | |
|---|---|---|
| Outstanding at beginning of period | 49,720 | $15.45 |
| Granted | 32,115 | $23.54 |
| Vested | (6,543) | $17.83 |
| Forfeited | (9,109) | $11.00 |
| Outstanding at end of period | 66,183 | $19.75 |
The total intrinsic value of non-vested stock awards vested during the years ended December 31, 2007, 2006 and 2005, was $167,000, $147,000 and $40,000, respectively. 2009:
Shares Outstanding | Weighted Average Grant Date Fair Value Per Share | |||||||
| Outstanding at beginning of period | 36,502 | $ | 21.62 | |||||
| Granted | — | — | ||||||
| Vested | (10,645 | ) | $ | 23.49 | ||||
| Forfeited | (3,901 | ) | $ | 16.15 | ||||
| Outstanding at end of period | 21,956 | $ | 21.68 | |||||
In periods prior to January 1, 2006, the Company applied the intrinsic value based method of APB Opinion No. 25,Accounting for Stock Issued to Employees, and related interpretations to account for its fixed-plan stock options. Under this method, no compensation expense was reflected in net income as all options granted had an exercise price equal to the fair value of common stock on the date of grant. The following table illustrates the effect on the Company’s net income and earnings per share for the year ended December 31, 2005, if compensation expense had been recorded in net income under the fair-value-based method in accordance SFAS No. 123R.
| 2005 | |||||
|---|---|---|---|---|---|
| (in thousands, except per share amounts) | |||||
| Net income: | |||||
| As reported | $ | 5,236 | |||
| Less: Total share-based compensation expense determined | |||||
| under the fair value method for all awards, net | |||||
| of tax | (341 | ) | |||
| Pro forma | $ | 4,895 | |||
Earnings per share: | |||||
| Basic, as reported | $ | 0.74 | |||
| Basic, pro forma | $ | 0.70 | |||
| Diluted, as reported | $ | 0.74 | |||
| Diluted, pro forma | $ | 0.69 | |||
| Leases |
| Minimum lease payments | Total Payments | 2010 | 2011 | 2012 | 2013 | 2014 | ||||||||||||||||||
| (In thousands) | ||||||||||||||||||||||||
| Operating leases | $ | 1,600 | $ | 524 | $ | 459 | $ | 432 | $ | 175 | $ | 10 | ||||||||||||
| Capital leases | 65 | 37 | 28 | — | — | — | ||||||||||||||||||
| Total | $ | 1,665 | $ | 561 | $ | 487 | $ | 432 | $ | 175 | $ | 10 | ||||||||||||
| Related Party |
42
respectively.
| Associate Benefits |
In February 2006, the Company’s Board of Directors authorized a stock repurchase plan providing for the repurchase of an additional 750,000 shares. The plan has no expiration date.
Subsequent to December 31, 2007, the Company has repurchased 263,013 shares of common stock at an approximate cost of $6.6 million and an average per share price of $24.91.
Item 9.Changes in and Disagreements with Accountants on Accounting and Financial Disclosure
| Item 9. | Changes in and Disagreements with Accountants on Accounting and Financial Disclosure |
Item 9A.Controls and Procedures
| Item 9A. | Controls and Procedures |
2009.
43
Item 9B.Other Information
| Item 9B. | Other Information |
44
PART IIIItem 10.Directors, Executive Officers and Corporate Governance
Item 10. Directors, Executive Officers and Corporate Governance
The information required by this Item with respect to directors and Section 16 compliance is included under the captions “Election of Directors” and “Section 16(a) Beneficial Ownership Reporting Compliance,” respectively, in the Company’s definitive Proxy Statement for its 20082010 Annual Meeting of Shareholders (“Proxy Statement”) and is hereby incorporated herein by reference. Information with respect to the executive officers of the Company appears in Item 1 of this Annual Report on Form 10-K. The information required by this Item with respect to audit committees and audit committee financial experts is included under the caption “Corporate Governance” in the Proxy Statement and is incorporated herein by reference.The Company has adopted a Code of Business Conduct and Ethics that applies to all of the Company’s associates, including the Company’s Chief Executive Officer, Chief Financial Officer, Controller and other persons performing similar functions. The Company has posted a copy of the Code of Business Conduct and Ethics on its website atwww.nationalresearch.com. The Company intends to satisfy the disclosure requirements under Item 5.05 of Form 8-K regarding amendments to, or waivers from, the Code of Business Conduct and Ethics by posting such information on its website atwww.nationalresearch.com. The Company is not including the information contained on its website as part of, or incorporating it by reference into, this report.Item 11.Executive Compensation
Item 11. Executive Compensation
The information required by this Item is included under the captions “Compensation Discussion and Analysis,” “Summary“2009 Summary Compensation Table,” “Grants of Plan-Based Awards in 2009,” “Outstanding Equity Awards at December 31, 2007,2009,” “Option Exercises and Stock Vested,” “Director“2009 Director Compensation” and “Compensation Committee Report” in the Proxy Statement and is hereby incorporated herein by reference.Item 12.Security Ownership of Certain Beneficial Owners and Management and Related Shareholder Matters
Item 12. Security Ownership of Certain Beneficial Owners and Management and Related Shareholder Matters
The information required by this Item with respect to security ownership of certain beneficial owners and management is included under the caption “Principal Shareholders” in the Proxy Statement and is hereby incorporated by reference.The following table sets forth information with respect to compensation plans under which equity securities of the Company are authorized for issuance as of December 31, 2007.Plan Category
Number of securities to be
issued upon the exercise of
outstanding options,
warrants and
rights
Weighted-average exercise
price of outstanding
options,
warrants and rights
Number of securities remaining
available for future issuance
under equity compensation
plans (excluding securities
reflected in the first column)
Equity compensation plans approved by security holders(1) 539,660 $17.04 657,874(2)
Equity compensation plans not approved by security holders -- -- --
Total539,660 $17.04 657,874
46
Plan Category Number of securities to be issued upon the exercise of outstanding options,warrants and rights Weighted-average exercise price ofoutstanding options, warrants and rights Number of securities remaining available for future issuance under equity compensation plans (excluding securities reflected in the first column) Equity compensation plans approved by security holders (1) 554,822 $ 21.80 505,474 (2) Equity compensation plans not approved by security holders 23,000 27.23 277,000 (3) Total 577,822 $ 22.06 782,474
(1) Includes the Company’s 2006 Equity Incentive Plan, 2004 Director Plan, and the 2001 Equity Incentive Plan.
(2) As of December 31, 2007,2009, the Company had authority to award up to 152,455161,854 additional shares of restricted Common Stock to participants under the 2001 Equity Incentive Plan, provided that the total of such shares awarded may not exceed the total number of shares remaining available for issuance under the 2001 Equity Incentive Plan, which totaled 51,33278,417 as of December 31, 2007.2009. Under the 2006 Equity Incentive Plan, the Company had authority to award up to 167,885 additional shares of restricted Common Stock.Stock to participants under the 2006 Equity Incentive Plan, provided that the total of such shares awarded may not exceed the total number of shares remaining available for issuance under the 2006 Equity Incentive Plan, which totaled 427,057 as of December 31, 2009.
45
Item 13.Certain Relationships and Related Transactions
(3) As of December 31, 2009, the Company had authority to award up to 277,000 additional shares of Common Stock to participants under the 2004 Directors Plan, subject to approval by the Company’s shareholders at the 2010 annual meeting of shareholders of the amendment to the plan adopted, on May 7, 2009 by the Board of Directors to increase the number of shares of common stock authorized for issuance under the plan from 250,000 to 550,000 shares. The Board of Directors conditioned the amendment, on the approval of the Company’s shareholders at the 2010 annual meeting of shareholders. The grants of options to directors on the date of the 2009 annual meeting of shareholders were also made subject to approval of the Company’s shareholders at the 2010 annual meeting of shareholders.
Item 13. Certain Relationships and Related Transactions, and Director Independence
The information required by this Item is included under the caption “Corporate Governance — Transactions with Related Persons”Governance—” in the Proxy Statement and is hereby incorporated by reference.Item 14.Principal Accountant Fees and Services
Item 14. Principal Accountant Fees and Services
The information required by this Item is included under the caption “Miscellaneous-Independent“Miscellaneous—Independent Registered Public Accounting Firm” in the Proxy Statement and is hereby incorporated by reference.
46
47
PART IVItem 15.Exhibits, Financial Statement Schedules
Item 15. Exhibits, Financial Statement Schedules (a) 1. Consolidated financial statements –- The consolidated financial statements listed in the accompanying index to the consolidated financial statements and financial statement schedule are filed as part of this Annual Report on Form 10-K.
2. Financial statement schedule –- The financial statement schedule listed in the accompanying index to the consolidated financial statements and financial statement schedule is filed as part of this Annual Report on Form 10-K.
3. Exhibits –- The exhibits listed in the accompanying exhibit index are filed as part of this Annual Report on Form 10-K.
48
NATIONAL RESEARCH CORPORATION AND SUBSIDIARYSCHEDULE II — VALUATION AND QUALIFYING ACCOUNTS
Balance atBeginning of Year MIVAcquisition Bad DebtExpense Write-offsNet ofRecoveries Balanceat Endof Year (In thousands) Allowance for doubtful accounts: Year Ended December 31, 2007 $ 44 $ — $ 29 $ 3 $ 70 Year Ended December 31, 2008 $ 70 $ 69 $ 168 $ 66 $ 241 Year Ended December 31, 2009 $ 241 $ 75 $ 138 $ 175 $ 279
47
SIGNATURES
Pursuant to the requirements
See accompanying report of Section 13 or 15(d) of the Securities Exchange Act of 1934, the Registrant has duly caused this report to be signed on its behalf by the undersigned, thereunto duly authorized, on this 28th day of March 2008.NATIONAL RESEARCH CORPORATION
By /s/ Michael D. Hays Michael D. Hays Chief Executive Officer
Pursuant to the requirements of the Securities Exchange Act of 1934, this report has been signed below by the following persons on behalf of the Registrant and in the capacities and on the dates indicated.
Signature
Title
Date
/s/ Michael D. HaysChief Executive Officer and Director (PrincipalMarch 28, 2008Michael D. HaysExecutive Officer)
/s/ Patrick E. BeansVice President, Treasurer, Secretary, ChiefMarch 28, 2008Patrick E. BeansFinancial Officer and Director (PrincipalFinancial and Accounting Officer)
/s/ Joseph W. CarmichaelPresident and DirectorMarch 28, 2008Joseph W. Carmichael
/s/ JoAnn M. MartinDirectorMarch 28, 2008JoAnn M. Martin
/s/ John N. NunnellyDirectorMarch 28, 2008John N. Nunnelly
/s/ Paul C. Schorr IIIDirectorMarch 28, 2008Paul C. Schorr III
/s/ Gail L. WardenDirectorMarch 28, 2008Gail L. Warden
independent registered public accounting firm.
48
49
INDEX TO CONSOLIDATED FINANCIAL STATEMENTS
AND FINANCIAL STATEMENT SCHEDULE
Page in this
Form 10-K
Report of Independent Registered Public Accounting Firm 24 Consolidated Balance Sheets as of December 31, 20072009 and 20062008 25 Consolidated Statements of Income for the Three Years Ended December 31, 20072009 26 Consolidated Statements of Shareholders’ Equity and Comprehensive Income as of and for the Three Years Ended December 31, 20072009 27 Consolidated Statements of Cash Flows for the Three Years Ended December 31, 20072009 28 Notes to Consolidated Financial Statements 29 Schedule II--II — Valuation and Qualifying Accounts 50 49
All other financial statement schedules are omitted since the required information is not present or is not present in amounts sufficient to require submission of the schedules, or because the information required is included in the consolidated financial statements and notes thereto.
49
50
NATIONAL RESEARCH CORPORATION AND SUBSIDIARY
SCHEDULE II — VALUATION AND QUALIFYING ACCOUNTS
Balance at
Beginning
of Year
Bad Debt
Expense
Write-offs
Net of
Recoveries
Balance
at End
of Year
Allowance for doubtful accounts: Year Ended December 31, 2005 $ 100,526 $ 2,657 $ -- $ 103,183 Year Ended December 31, 2006 $ 103,183 $ (58,881 ) $ -- $ 44,302 Year Ended December 31, 2007 $ 44,302 $ 28,510 $ 2,600 $ 70,212
See accompanying
SIGNATURESPursuant to the requirements of Section 13 or 15(d) of the Securities Exchange Act of 1934, the Registrant has duly caused this report to be signed on its behalf by the undersigned, thereunto duly authorized, on this 31st day of independent registered public accounting firm.March 2010.NATIONAL RESEARCH CORPORATION By /s/ Michael D. Hays Michael D. Hays President and Chief Executive Officer
Pursuant to the requirements of the Securities Exchange Act of 1934, this report has been signed below by the following persons on behalf of the Registrant and in the capacities and on the dates indicated.
50
Signature Title Date /s/ Michael D. Hays President, Chief Executive Officer and Director March 31, 2010 Michael D. Hays (Principal Executive Officer) /s/ Patrick E. Beans Vice President, Treasurer, Secretary, Chief March 31, 2010 Patrick E. Beans Financial Officer and Director (Principal Financial and Accounting Officer) /s/ JoAnn M. Martin Director March 31, 2010 JoAnn M. Martin /s/ John N. Nunnelly Director March 31, 2010 John N. Nunnelly /s/ Paul C. Schorr III Director March 31, 2010 Paul C. Schorr III /s/ Gail L. Warden Director March 31, 2010 Gail L. Warden
51
EXHIBIT INDEXExhibit
Number Exhibit Description
(3.1) Articles of Incorporation of National Research Corporation, as amended to date [Incorporated by reference to Exhibit (3.1) to National Research Corporation’s Registration Statement on Form S-1 (Registration No. 333-33273)]
(3.2) By-Laws of National Research Corporation, as amended to date [Incorporated by reference to Exhibit (3.2) to National Research Corporation’s Current Report on Form 8-K dated October 10, 2007May 8, 2009 (File No. 0-29466)]
(10.1)*(4.1) Installment or Single Payment Note, dated as of December 19, 2008, from National Research Corporation 1997 Equity Incentive Planto U.S. Bank National Association [Incorporated by reference to Exhibit (10.2)(4.1) to National Research Corporation’s Registration StatementCurrent Report on Form S-1 (Registration8-K dated December 19, 2008 (File No. 333-33273)0-294660)]
(10.2)(10.1)* National Research Corporation 2001 Equity Incentive Plan [Incorporated by reference to National Research Corporation'sCorporation’s Proxy Statement for the 2002 Annual Meeting of Shareholders, filed with the Securities and Exchange Commission on April 3, 2002 (File No. 0-29466)]
(10.3)(10.2)* National Research Corporation 2006 Equity Incentive Plan [Incorporated by reference to National Research Corporation'sCorporation’s Proxy Statement for the 2006 Annual Meeting of Shareholders, filed with the Securities and Exchange Commission on April 3, 2006 (File No. 0-29466)]
(10.4)(10.3)* National Research Corporation Director Stock Plan, as amended to date [Incorporated by reference to Exhibit (10.2) to National Research Corporation’s Annual Report on Form 10-K for the year ended December 31, 1997 (File No. 0-29466)]
(10.5)(10.4)* National Research Corporation 2004 Director Stock Plan [Incorporated by reference to National Research Corporation'sCorporation’s Proxy Statement for the 2005 Annual Meeting of Shareholders, filed with the Securities and Exchange Commission on April 4, 2005 (File No. 0-29466)]
(10.6)Asset Purchase Agreement, dated as of September 16, 2005, among National Research Corporation, Geriatric Health Systems, LLC, Health Services Benefit Administrators, Inc. and Peter Yedidia [Incorporated by reference to Exhibit 2.1 to National Research Corporation’s current Report of Form 8-K dated September 16, 2005 (File No. 0-29466)]
(10.7)(10.5)+Contract, dated January 23, 2002, between National Research Corporation and the Department of Veterans Affairs [Incorporated by reference to Exhibit (10.4) to National Research Corporation’s Annual Report on Form 10-K for the year ended December 31, 2001 (File No. 0-29466)]
(10.8)(10.6)* Form of Nonqualified Stock Option Agreement (for new associates) used in connection with the 2001 Equity Incentive Plan [Incorporated by reference to Exhibit 4.4 to National Research Corporation’s Registration Statement on Form S-8 (Registration No. 333-120530)]
(10.9)(10.7)* Form of Nonqualified Stock Option Agreement (for officers) used in connection with the 2001 Equity Incentive Plan [Incorporated by reference to Exhibit 4.5 to National Research Corporation’s Registration Statement on Form S-8 (Registration No. 333-120530)]
51
(10.10)(10.8)* Form of Restricted Stock Agreement for executive officers used in connection with the 2001 Equity Incentive Plan [Incorporated by reference to Exhibit 10.2 to National Research Corporation’s Current Report on Form 8-K dated March 19, 2005 (File No. 0-29466)]
(10.11)(10.9)* Form of Restricted Stock Agreement (one year vesting) used in connection with the 2001 Equity Incentive Plan [Incorporated by reference to Exhibit 4.6 to National Research Corporation’s Registration Statement on Form S-8 (Registration No. 333-120530)]
52
(10.12)ExhibitNumberExhibit Description (10.10)* Form of Restricted Stock Agreement (five year vesting) used in connection with the 2001 Equity Incentive Plan [Incorporated by reference to Exhibit 4.7 to National Research Corporation’s Registration Statement on Form S-8 (Registration No. 333-120530)]
(10.13)(10.11)* Restricted Stock Incentive Plan for Joseph W. Carmichael, as amended and restated, under the 2001 Equity Incentive Plan [Incorporated by reference to Exhibit 10.2 to National Research Corporation’s Current Report on Form 8-K dated March 3, 2006 (File No. 0-29466)]
(10.14)(10.12)* Director’s Compensation Summary [Incorporated by reference to Exhibit (10.1) to National Research Corporation’s QuarterlyAnnual Report on Form 10-Q for the quarter ended March 31, 2007 (File No. 0-29466)]
(10.15)(10.13)* Form of Nonqualified Stock Option Agreement used in connection with the 2006 Equity Incentive Plan [Incorporated by reference to Exhibit (10.14) to National Research Corporation’s Annual Report on Form 10-K for the year ended December 31, 20072006 (File No. 0-29466)]
(10.16)(10.14)* Form of Restricted Stock Agreement used in connection with the 2006 Equity Incentive Plan [Incorporated by reference to Exhibit (10.15) to National Research Corporation’s Annual Report on Form 10-K for the year ended December 31, 20072006 (File No. 0-29466)]
(23)(10.15) Merger Agreement, dated as of November 26, 2008, by and among National Research Corporation, NRC Acquisition, Inc., My Innerview, Inc., Neil L. Gulsvig and Janice L. Gulsvig [Incorporated by reference to Exhibit (2.1) to National Research Corporation’s Current Report on Form 8-K dated November 26, 2008 (File No. 0-29466)] (23.1) Consent of Independent Registered Public Accounting Firm
(31.1) Certification of the Chief Executive Officer pursuant to Section 302 of the Sarbanes-Oxley Act of 2002
(31.2) Certification of the Chief Financial Officer pursuant to Section 302 of the Sarbanes-Oxley Act of 2002
(32.1) Certification of Periodic Financial Report by the Chief Executive Officer and Chief Financial Officer pursuant to Section 906 of the Sarbanes-Oxley Act of 2002
(99.1) Proxy Statement for the 20082010 Annual Meeting of Shareholders, to be filed within 120 days of December 31, 20072009 [To be filed with the Securities and Exchange Commission under Regulation 14A within 120 days after December 31, 2007;2009; except to the extent specifically incorporated by reference, the Proxy Statement for the 20082010 Annual Meeting of Shareholders shall not be deemed to be filed with the Securities and Exchange Commission as part of this Annual Report on Form 10-K]
* A management contract or compensatory plan or arrangement.
+ Portions of this exhibit have been redacted and are subject to a confidential treatment request filed with the Secretary of the Securities and Exchange Commission pursuant to Rule 24b-2 under the Securities Exchange Act of 1934, as amended. The redacted material was filed separately with the Securities and Exchange Commission.
52
53
Item 10.Directors, Executive Officers and Corporate Governance
| Item 10. | Directors, Executive Officers and Corporate Governance |
Item 11.Executive Compensation
| Item 11. | Executive Compensation |
Item 12.Security Ownership of Certain Beneficial Owners and Management and Related Shareholder Matters
| Item 12. | Security Ownership of Certain Beneficial Owners and Management and Related Shareholder Matters |
| Plan Category | Number of securities to be issued upon the exercise of outstanding options, warrants and rights | Weighted-average exercise price of outstanding options, warrants and rights | Number of securities remaining available for future issuance under equity compensation plans (excluding securities reflected in the first column) |
|---|---|---|---|
| Equity compensation plans | |||
| approved by security | |||
| holders(1) | 539,660 | $17.04 | 657,874(2) |
Equity compensation plans | |||
| not approved by security | |||
| holders | -- | -- | -- |
Total | 539,660 | $17.04 | 657,874 |
| Plan Category | Number of securities to be issued upon the exercise of outstanding options, warrants and rights | Weighted-average exercise price of outstanding options, warrants and rights | Number of securities remaining available for future issuance under equity compensation plans (excluding securities reflected in the first column) | |||||||||
Equity compensation plans approved by security holders (1) | 554,822 | $ | 21.80 | 505,474 | (2) | |||||||
| Equity compensation plans not approved by security holders | 23,000 | 27.23 | 277,000 | (3) | ||||||||
| Total | 577,822 | $ | 22.06 | 782,474 | ||||||||
| (1) | Includes the Company’s 2006 Equity Incentive Plan, 2004 Director Plan, and the 2001 Equity Incentive Plan. |
| (2) | As of December 31, |
45
Item 13.Certain Relationships and Related Transactions
| (3) | As of December 31, 2009, the Company had authority to award up to 277,000 additional shares of Common Stock to participants under the 2004 Directors Plan, subject to approval by the Company’s shareholders at the 2010 annual meeting of shareholders of the amendment to the plan adopted, on May 7, 2009 by the Board of Directors to increase the number of shares of common stock authorized for issuance under the plan from 250,000 to 550,000 shares. The Board of Directors conditioned the amendment, on the approval of the Company’s shareholders at the 2010 annual meeting of shareholders. The grants of options to directors on the date of the 2009 annual meeting of shareholders were also made subject to approval of the Company’s shareholders at the 2010 annual meeting of shareholders. |
| Item 13. | Certain Relationships and Related Transactions, and Director Independence |
Item 14.Principal Accountant Fees and Services
| Item 14. | Principal Accountant Fees and Services |
Item 15.Exhibits, Financial Statement Schedules
| Item 15. | Exhibits, Financial Statement Schedules | |
| (a) | 1. | Consolidated financial statements |
| 2. | Financial statement schedule |
| 3. | Exhibits |
Balance at Beginning of Year | MIV Acquisition | Bad Debt Expense | Write-offs Net of Recoveries | Balance at End of Year | ||||||||||||||||
| (In thousands) | ||||||||||||||||||||
| Allowance for doubtful accounts: | ||||||||||||||||||||
| Year Ended December 31, 2007 | $ | 44 | $ | — | $ | 29 | $ | 3 | $ | 70 | ||||||||||
| Year Ended December 31, 2008 | $ | 70 | $ | 69 | $ | 168 | $ | 66 | $ | 241 | ||||||||||
| Year Ended December 31, 2009 | $ | 241 | $ | 75 | $ | 138 | $ | 175 | $ | 279 | ||||||||||
47
SIGNATURES
Pursuant to the requirements
Pursuant to the requirements of the Securities Exchange Act of 1934, this report has been signed below by the following persons on behalf of the Registrant and in the capacities and on the dates indicated.
| Page in this | ||||
| Form 10-K | ||||
| Report of Independent Registered Public Accounting Firm | 24 | |||
| Consolidated Balance Sheets as of December 31, | 25 | |||
| Consolidated Statements of Income for the Three Years Ended December 31, | 26 | |||
| Consolidated Statements of Shareholders’ Equity and Comprehensive Income as of and for the Three | ||||
| Years Ended December 31, | 27 | |||
| Consolidated Statements of Cash Flows for the Three Years Ended December 31, | 28 | |||
| Notes to Consolidated Financial Statements | 29 | |||
| Schedule | 49 |
NATIONAL RESEARCH CORPORATION AND SUBSIDIARY
SCHEDULE II — VALUATION AND QUALIFYING ACCOUNTS
| Balance at Beginning of Year | Bad Debt Expense | Write-offs Net of Recoveries | Balance at End of Year | |||||||||||
|---|---|---|---|---|---|---|---|---|---|---|---|---|---|---|
Allowance for doubtful accounts: | ||||||||||||||
| Year Ended December 31, 2005 | $ | 100,526 | $ | 2,657 | $ | -- | $ | 103,183 | ||||||
| Year Ended December 31, 2006 | $ | 103,183 | $ | (58,881 | ) | $ | -- | $ | 44,302 | |||||
| Year Ended December 31, 2007 | $ | 44,302 | $ | 28,510 | $ | 2,600 | $ | 70,212 | ||||||
See accompanying
| NATIONAL RESEARCH CORPORATION | |
| By | /s/ Michael D. Hays |
| Michael D. Hays | |
| President and Chief Executive Officer | |
50
| Signature | Title | Date | ||
| /s/ Michael D. Hays | President, Chief Executive Officer and Director | March 31, 2010 | ||
| Michael D. Hays | (Principal Executive Officer) | |||
| /s/ Patrick E. Beans | Vice President, Treasurer, Secretary, Chief | March 31, 2010 | ||
| Patrick E. Beans | Financial Officer and Director (Principal Financial and Accounting Officer) | |||
| /s/ JoAnn M. Martin | Director | March 31, 2010 | ||
| JoAnn M. Martin | ||||
| /s/ John N. Nunnelly | Director | March 31, 2010 | ||
| John N. Nunnelly | ||||
| /s/ Paul C. Schorr III | Director | March 31, 2010 | ||
| Paul C. Schorr III | ||||
| /s/ Gail L. Warden | Director | March 31, 2010 | ||
| Gail L. Warden |
Exhibit Number | Exhibit Description |
| (3.1) | Articles of Incorporation of National Research Corporation, as amended to date [Incorporated by reference to Exhibit (3.1) to National Research Corporation’s Registration Statement on Form S-1 (Registration No. 333-33273)] |
| (3.2) | By-Laws of National Research Corporation, as amended to date [Incorporated by reference to Exhibit (3.2) to National Research Corporation’s Current Report on Form 8-K dated |
| (4.1) | Installment or Single Payment Note, dated as of December 19, 2008, from National Research Corporation |
| (10.1)* | National Research Corporation 2001 Equity Incentive Plan [Incorporated by reference to National Research |
| (10.2)* | National Research Corporation 2006 Equity Incentive Plan [Incorporated by reference to National Research |
| (10.3)* | National Research Corporation Director Stock Plan, as amended to date [Incorporated by reference to Exhibit (10.2) to National Research Corporation’s Annual Report on Form 10-K for the year ended December 31, 1997 (File No. 0-29466)] |
| (10.4)* | National Research Corporation 2004 Director Stock Plan [Incorporated by reference to National Research |
| Contract, dated January 23, 2002, between National Research Corporation and the Department of Veterans Affairs [Incorporated by reference to Exhibit (10.4) to National Research Corporation’s Annual Report on Form 10-K for the year ended December 31, 2001 (File No. 0-29466)] |
| (10.6)* | Form of Nonqualified Stock Option Agreement (for new associates) used in connection with the 2001 Equity Incentive Plan [Incorporated by reference to Exhibit 4.4 to National Research Corporation’s Registration Statement on Form S-8 (Registration No. 333-120530)] |
| (10.7)* | Form of Nonqualified Stock Option Agreement (for officers) used in connection with the 2001 Equity Incentive Plan [Incorporated by reference to Exhibit 4.5 to National Research Corporation’s Registration Statement on Form S-8 (Registration No. 333-120530)] |
51
| (10.8)* | Form of Restricted Stock Agreement for executive officers used in connection with the 2001 Equity Incentive Plan [Incorporated by reference to Exhibit 10.2 to National Research Corporation’s Current Report on Form 8-K dated March 19, 2005 (File No. 0-29466)] |
| (10.9)* | Form of Restricted Stock Agreement (one year vesting) used in connection with the 2001 Equity Incentive Plan [Incorporated by reference to Exhibit 4.6 to National Research Corporation’s Registration Statement on Form S-8 (Registration No. 333-120530)] |
Exhibit Number | Exhibit Description | |
| (10.10)* | Form of Restricted Stock Agreement (five year vesting) used in connection with the 2001 Equity Incentive Plan [Incorporated by reference to Exhibit 4.7 to National Research Corporation’s Registration Statement on Form S-8 (Registration No. 333-120530)] |
| (10.11)* | Restricted Stock Incentive Plan for Joseph W. Carmichael, as amended and restated, under the 2001 Equity Incentive Plan [Incorporated by reference to Exhibit 10.2 to National Research Corporation’s Current Report on Form 8-K dated March 3, 2006 (File No. 0-29466)] |
| (10.12)* | Director’s Compensation Summary [Incorporated by reference to Exhibit (10.1) to National Research Corporation’s |
| (10.13)* | Form of Nonqualified Stock Option Agreement used in connection with the 2006 Equity Incentive Plan [Incorporated by reference to Exhibit (10.14) to National Research Corporation’s Annual Report on Form 10-K for the year ended December 31, |
| (10.14)* | Form of Restricted Stock Agreement used in connection with the 2006 Equity Incentive Plan [Incorporated by reference to Exhibit (10.15) to National Research Corporation’s Annual Report on Form 10-K for the year ended December 31, |
| (10.15) | Merger Agreement, dated as of November 26, 2008, by and among National Research Corporation, NRC Acquisition, Inc., My Innerview, Inc., Neil L. Gulsvig and Janice L. Gulsvig [Incorporated by reference to Exhibit (2.1) to National Research Corporation’s Current Report on Form 8-K dated November 26, 2008 (File No. 0-29466)] | |
| (23.1) | Consent of Independent Registered Public Accounting Firm |
| (31.1) | Certification of the Chief Executive Officer pursuant to Section 302 of the Sarbanes-Oxley Act of 2002 |
| (31.2) | Certification of the Chief Financial Officer pursuant to Section 302 of the Sarbanes-Oxley Act of 2002 |
| (32.1) | Certification of Periodic Financial Report by the Chief Executive Officer and Chief Financial Officer pursuant to Section 906 of the Sarbanes-Oxley Act of 2002 |
| (99.1) | Proxy Statement for the |
| * | A management contract or compensatory plan or arrangement. |
| + | Portions of this exhibit have been redacted and are subject to a confidential treatment request filed with the Secretary of the Securities and Exchange Commission pursuant to Rule 24b-2 under the Securities Exchange Act of 1934, as amended. The redacted material was filed separately with the Securities and Exchange Commission. |