
|
|
| |
|
|
| |
OR | |
[ ] | |
|
|
| |
| Minnesota | 41-0572550 | |||
|
| |||
State or other jurisdiction of | (I.R.S. Employer | |||
incorporation or organization | Identification No.) |
| ||||
| ||||
(Address of principal executive offices) (Zip Code) | ||||
Name of exchange on which registered | ||||
Common Stock, par value $0.375 per share | New York Stock Exchange | |||
Preferred Share Purchase Rights | New York Stock Exchange |
Securities registered pursuant to Section 12(g) of the Act: None
Securities registered pursuant to Section 12(g) of the Act: None | ||||||||
| Indicate by check mark if the registrant is a well-known seasoned issuer, as defined by Rule 405 of the Securities Act. |
| ü |
| |||||
Indicate by check mark if the registrant is not required to file reports pursuant to Section 13 or Section 15(d) of the Act. |
| Yes |
| No | ||||
Indicate by check mark whether the registrant (1) has filed all reports required to be filed by Section 13 or 15(d) of the Securities Exchange Act of 1934 during the preceding 12 months | ||||||||
(or for such shorter period that the registrant was required to file such reports), and (2) has been subject to such filing requirements for the past 90 days. | ||||||||
Indicate by check mark if disclosure of delinquent filers pursuant to Item 405 of Regulation S-K is not contained herein, and will not be contained, to the best of registrant’s knowledge, in definitive proxy or information statements incorporated by reference in Part III of this Form 10-K or any amendment to this Form 10-K.x
Indicate by check mark whether the registrant is a large accelerated filer, an accelerated filer, a non-accelerated filer, or a smaller reporting company. See definitions of “large accelerated filer,” “accelerated filer” and “smaller reporting company” in Rule 12b-2 of the Exchange Act. (Check one):
| ü | Yes | No | ||||
Indicate by check mark if disclosure of delinquent filers pursuant to Item 405 of Regulation S-K is not contained herein, and will not be contained, to the best of registrant’s knowledge, in definitive proxy or information statements incorporated by reference in Part III of this Form 10-K or any amendment to this Form 10-K. [ ] | ||||||
| Indicate by check mark whether the registrant is a large accelerated filer, an accelerated filer, a non-accelerated filer, or a smaller reporting company. See definitions of “large accelerated filer,” "accelerated filer" and "smaller reporting company" in Rule 12b-2 of the Exchange Act. (Check one): | |||||||
| Large accelerated filer | Accelerated filer | ü |
|
| |||
| Non-accelerated filer |
| ||||||
reporting company) | Smaller reporting company | ||||||
Indicate by check mark whether the registrant is a shell company (as defined in Rule 12b-2 of the Act). | Yes | ü | No | |||||
| The aggregate market value of the voting and non-voting common equity held by non-affiliates as of June 30, 2008, was approximately $579,852,279. | ||||||||
| As of March 12, 2009, shares of Common Stock outstanding were 18,317,734. | ||||||||
The aggregate market value of the voting and non-voting common equity held by non-affiliates as of June 30, 2007, was approximately $678,347,147.
The number of shares outstanding of registrant’s only class of common stock on February 27, 2008 was 18,472,448.
| PART I | Page | ||
| Item 1 |
| |
3 | |||
Item 1A | 4 | ||
Item 1B | 6 | ||
Item 2 | 6 | ||
Item 3 | 6 | ||
Item 4 | 6 | ||
| PART II | |||
| Item 5 | 6 | ||
Item 6 | 8 | ||
Item 7 | 9 | ||
Item 7A |
| ||
Item 8 |
| ||
| |||
| |||
| |||
| |||
| |||
| |||
| |||
Item 9 |
| ||
Item 9A |
| ||
Item 9B |
| ||
| PART III | |||
| Item 10 |
| ||
Item 11 |
| ||
Item 12 |
| ||
Item 13 |
| ||
Item 14 |
| ||
Item 15 |
| ||
Products
Typical seasonality did not occur in the 2008 fourth quarter due to the deterioration of the worldwide economy and global credit crisis.
We fund our
December 31, 2007.
3
processes and new product applications. In 2008, 2007 and 2006, the Company spent $24.3 million, $23.9 million and $21.9 million on research and development, respectively.
2008.
If
Thecustomers chose to conserve their cash on hand in the fourth quarter of 2008 to ensure it was available for their essential business operations, thus delaying their purchases of our products. Although we believe that over time, customer spending on our products is not discretionary, we are unable to predict when an improvement in economic conditions will return to a level where our customers will increase their capital spending on products such as ours. Decreased demand for our products could result in decreased revenues, profitability and services is dependent uponcash flows and may impair our ability to maintain our operations and fund our obligations to others.
We may encounter difficulties obtaining raw materials or component parts needed to manufacture our products and the prices of these materials are subject to fluctuation.
Raw materials and commodity-based components. As a manufacturer, our sales and profitability are dependent upon availability and cost of raw materials, which are subject to price fluctuations, and thecustomers’ ability to control or pass on an increase in costs of raw materials to our customers. We purchase raw materials, such as steel, rubber, lead and petroleum-based resins and components containing these commodities for use in our manufacturing operations. The availability of these raw materials is subject to market forces beyond our control. Under normal circumstances, these materials are generally available on the open market from a variety of sources. From time to time, however, the prices and availability of these raw materials and components fluctuatepay amounts due to global market demands, which could impairus, resulting in increased bad debt expense. In addition, if our suppliers are not able to access credit necessary to maintain their operations, our ability to procure necessary materials, or increase the costfulfill customer orders could be negatively impacted, resulting in a loss of such materials. Inflationary and other increases in the costssales of these raw materials and components have occurred in the past and may recur from time to time, and our performance depends in part on our ability to incorporate changes in costs into the selling prices for our products.
Given the worldwide lead market conditions, we have experienced cost increases in our lead-based component parts. In addition, our freight costs associated with shipping and receiving product and sales and service vehicle fuel costs are impacted by fluctuations in the cost of oil and gas. We do not use derivative commodity instruments to manage our exposure to changes in commodity prices such as steel, oil, gas and lead. Any fluctuations in the supply or prices for any of these commodities could have a material adverse affect on our profit margins and financial condition.
Single-source supply. We depend on many suppliers for the necessary parts to manufacture our products. However, there are some components that are purchased from a single supplier due to price, quality, technology or other business constraints. These components cannot be quickly or inexpensively re-sourced to another supplier. If we are unable to purchase on acceptable terms or experience significant delays or quality issuesaccess credit in the deliverynormal course of these necessary parts or components from a particular vendorbusiness, we may not be able to maintain our operations. We successfully amended our primary credit facility during the first quarter of 2009 to help ensure our compliance with debt covenants throughout 2009. However, in order to amend this facility, we have agreed to new covenant compliance requirements, restrictions on certain payments, increased interest rate spreads, increased facility fees and we neededhave provided security interests on certain of our assets. In addition, our new debt covenants limit our acquisitions to locate a new suppliermaximum of $2.0 million for these partsthe 2009 fiscal year and components, shipments for products impactedthe amount of permitted acquisitions in fiscal years after 2009 will be limited according to our then current leverage ratio. Although we do not currently believe we will need additional funding sources, if we do need additional funding sources in the future, this could result in a significant adverse impact to our operating results and financial condition.
condition.
Our strategic plans include international expansion. Our failure to meet the challenges associated with international expansion could adversely impact our ability to grow our business and our financial condition.
We plan to continue international expansion of our sales and manufacturing operations, which will require significant management attention and financial resources. There are certain risks inherent in doing business in international markets. We must ensure compliance with the laws and regulations of foreign governmental and regulatory authorities of each country in which we conduct business. Our international operations could be adversely affected by changes in political and economic conditions, trade protection measures, restrictions on repatriation of earnings, or changes in regulatory requirements that restrict the sales of our products or increase our costs.
4
already established domestic markets,obtaining raw materials or certain cultural barriers. We may experience increased infrastructure costs including costs for legal, tax, accounting and information technology services. Failure ofcomponent parts needed to manufacture our products and the prices of these materials are subject to succeedfluctuation.
Our inability to achieve certain planned operational efficiencies may adverselythese commodities could have a material adverse affect on our strategic objectives, profit margins and financial condition.
Asproducts. However, there are some components that are purchased from a manufacturing and service company operating with facilities, inventories, and workforce, our operations have been, and may continuesingle supplier due to price, quality, technology or other business constraints. These components cannot be adversely affected by our abilityquickly or inexpensively re-sourced to control costs and achieve planned operational efficiencies. We continuously endeavor to lower our cost structure through various savings measures, including lower-cost sourcing alternatives and consolidation of higher-cost manufacturing facilities. In support of this effort, we launched several corporate priorities in 2006 that focus on leveraging our global cost structure through consolidating our global manufacturing footprint, expansion in China, global sourcing, creating a lean enterprise and continuous process improvement. In connection with the manufacturing footprint consolidation, we completed our Minnesota plant consolidation and sold our Maple Grove, Minnesota facility in 2007. Through these initiatives, we expect to reduce product costs and improve operating efficiencies over the next three to five years. Our operating results may be adversely affected ifanother supplier. If we are unable to find lower-cost sources for our materials, shift production from higher-cost facilities,purchase on acceptable terms or cost-effectively manage our existing manufacturing facilities.
We plan to continue our efforts to improve our performance throughexperience significant delays or quality issues in the adoption of lean manufacturing principles and focus on continous process improvement. It is our goal to become more efficient, better employ automation and thereby lower our operating costs. These initiatives will take some time to fully implement. Additionally, we may be unable to effectively complete the implementationdelivery of these initiativesnecessary parts or the impact of the initiatives maycomponents from a particular vendor and we need to locate a new supplier for these parts and components, shipments for products impacted could be less than expected,delayed, which could result in lower-than-expectedhave a material adverse affect on our business, financial results.
condition and results of operations.
We rely on trade secret, copyright, trademark and patent laws and contractual protections to protect our proprietary technology and other proprietary rights. Our competitors may attempt to copy our products or gain access to our trade secrets. Notwithstanding the precautions we take to protect our intellectual property rights, it is possibleproduct quality issues that third parties may illegally copy or otherwise obtain and use our proprietary technology without our consent. Any litigation concerning infringement could result in substantial cost to us and diversions of our resources, either of which could adversely affect our business. In some cases, thereoperating results or financial condition.
Our ability to effectively operate our Company could be adversely affected if we are unable to attract and retain key personnel and other highly skilled employees.
Our continued success will depend on, among other things, the skills and services of our executive officers and other key personnel. Our ability to attract and retain other highly qualified managerial, technical, manufacturing, research,market share, reduced sales, and marketing personnel also impacts our ability to effectively operate our Company. Our senior management are employed at will and we cannot assure you that we will be able to attract and hire suitable replacements for any of our key employees. We believe the loss of a key executive officer or other key employee could have an adverse affect on our business, results of operations and financial condition.
higher warranty expense.
5
Environmental compliance costs and liabilities could increase our expenseslitigation and adversely affect our financial condition.
Our manufacturing operations and our past and present ownership and operations of real property are subject to extensive and changing federal, state, and local environmental laws and regulations, as well as those of other countries pertaining to the handling or discharge of hazardous materials into the environment. We must conform our operations and properties to these laws and adapt to regulatory requirements in the countries in which we operate as these requirements change. We expectability to continue to incur costs to comply with environmental lawsprovide, or could increase the cost of providing, our products and regulations. We may also be identified as a responsible party and be subject to liability relating to any investigation and clean-upservices.
30, 2009.
| First | Second | Third | Fourth | ||||||||||
| 2008 | $ 31.88-45.41 |
| $ 24.90-40.48 |
|
|
| $ 15.33-33.26 | ||||||
| 2007 | $ 27.84-32.82 | $ 31.16-37.31 | $ 35.40-49.32 | ||||||||||
| $ |
|
|
|
|
|
|
| |||||
|
|
|
|
|
|
|
| 41.26-48.40 | |||||
|
|
|
|
|
|
|
|
|
|
|
|
|
|
|
For the Quarter |
|
| Total Number of |
|
| Average |
|
| Total Number of Shares |
|
| Maximum Number of |
|
October 1–31, 2007 |
|
| 70,200 |
| $ | 45.74 |
|
| 70,200 |
|
| 853,974 |
|
November 1–30, 2007 |
|
| 65,012 |
|
| 45.68 |
|
| 64,700 |
|
| 789,274 |
|
December 1–31, 2007 |
|
| 51,618 |
|
| 44.83 |
|
| 50,300 |
|
| 738,974 |
|
Total |
|
| 186,830 |
| $ | 45.47 |
|
| 185,200 |
|
| 738,974 |
|
| For the Quarter Ended 12/31/2008 | Total Number of Shares Purchased (1) | Average Price Paid Per Share | Total Number of Shares Purchased as Part of Publicly Announced Plans or Programs | Maximum Number of Shares that May Yet Be Purchased Under the Plans or Programs | ||||||||||||
| October 1–31, 2008 | 131 | $ | 29.18 | - | 288,874 | |||||||||||
| November 1–30, 2008 | 33 | 23.48 | - | 288,874 | ||||||||||||
| December 1–31, 2008 | 18,156 | 23.04 | - | 288,874 | ||||||||||||
| Total | 18,320 | $ | 23.08 | - | 288,874 | |||||||||||
COMPARE

|
|
|
|
|
|
|
|
|
|
|
|
|
|
|
|
|
|
|
|
|
|
| 2002 |
|
| 2003 |
|
| 2004 |
|
| 2005 |
|
| 2006 |
|
| 2007 |
|
Tennant Company |
|
| 100.00 |
|
| 135.87 |
|
| 126.47 |
|
| 169.55 |
|
| 192.53 |
|
| 297.88 |
|
Hemscott Group Index |
|
| 100.00 |
|
| 144.16 |
|
| 177.41 |
|
| 195.37 |
|
| 235.18 |
|
| 309.24 |
|
Hemscott Composite Index |
|
| 100.00 |
|
| 133.13 |
|
| 149.33 |
|
| 159.90 |
|
| 185.09 |
|
| 196.97 |
|
|
|
|
|
|
|
|
|
|
|
|
|
|
|
|
|
|
|
|
|
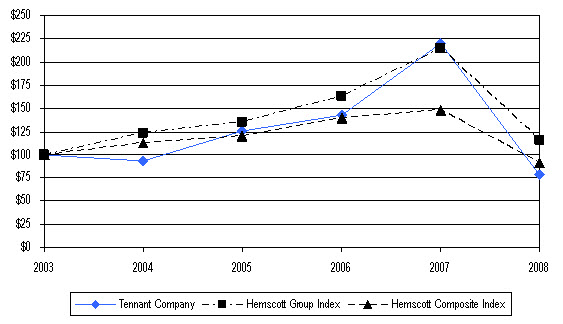
| 2003 | 2004 | 2005 | 2006 | 2007 | 2008 | |||||||||||||||||||
| Tennant Company | $ | 100.00 | $ | 93.57 | $ | 125.44 | $ | 142.44 | $ | 220.39 | $ | 78.27 | ||||||||||||
| Hemscott Group Index | 100.00 | 123.06 | 135.52 | 163.13 | 214.51 | 115.86 | ||||||||||||||||||
| Hemscott Composite Index | 100.00 | 112.17 | 120.11 | 139.03 | 147.95 | 91.72 | ||||||||||||||||||
| Years Ended December 31 | 2008 | 2007 | 2006 | 2005 | 2004 | ||||||||||||||||
| Year End Financial Results | |||||||||||||||||||||
| Net Sales | $ | 701,405 | 664,218 | 598,981 | 552,908 | 507,785 | |||||||||||||||
| Cost of Sales | $ | 415,155 | 385,234 | 347,402 | 318,044 | 305,277 | |||||||||||||||
| Gross Margin – % | 40.8 | 42.0 | 42.0 | 42.5 | 39.9 | ||||||||||||||||
| Research and Development Expense | $ | 24,296 | 23,869 | 21,939 | 19,351 | 17,198 | |||||||||||||||
| % of Net Sales | 3.5 | 3.6 | 3.7 | 3.5 | 3.4 | ||||||||||||||||
| Selling and Administrative Expense | $ | 243,385 | (1) | 200,270 | (2) | 189,676 | 180,676 | 164,003 | (3) | ||||||||||||
| % of Net Sales | 34.7 | 30.2 | 31.7 | 32.7 | 32.3 | ||||||||||||||||
| Profit from Operations | $ | 18,569 | (1) | 54,845 | (2) | 39,964 | 34,837 | 21,307 | (3) | ||||||||||||
| % of Net Sales | 2.6 | 8.3 | 6.7 | 6.3 | 4.2 | ||||||||||||||||
| Other Income (Expense) | $ | (994 | 2,867 | (2) | 3,338 | 157 | 72 | ||||||||||||||
| Income Tax Expense | $ | 6,951 | (1) | 17,845 | (2) | 13,493 | 12,058 | 7,999 | (3) | ||||||||||||
| % of Earnings Before Income Taxes | 39.6 | 30.9 | 31.2 | 34.5 | 37.4 | ||||||||||||||||
| Net Earnings | $ | 10,624 | (1) | 39,867 | (2) | 29,809 | 22,936 | 13,380 | (3) | ||||||||||||
| % of Net Sales | 1.5 | 6.0 | 5.0 | 4.2 | 2.6 | ||||||||||||||||
| Return on beginning Shareholders’ Equity – % | 4.2 | 17.4 | 15.4 | 13.2 | 8.1 | ||||||||||||||||
| Per Share Data | |||||||||||||||||||||
| Basic Net Earnings | $ | 0.58 | (1) | 2.14 | (2) | 1.61 | 1.27 | 0.74 | (3) | ||||||||||||
| Diluted Net Earnings | $ | 0.57 | (1) | 2.08 | (2) | 1.57 | 1.26 | 0.73 | (3) | ||||||||||||
| Cash Dividends | $ | 0.52 | 0.48 | 0.46 | 0.44 | 0.43 | |||||||||||||||
| Shareholders’ Equity (ending) | $ | 11.48 | 13.65 | 12.25 | 10.50 | 9.67 | |||||||||||||||
| Year-End Financial Position | |||||||||||||||||||||
| Cash and Cash Equivalents | $ | 29,285 | 33,092 | 31,021 | 41,287 | 16,837 | |||||||||||||||
| Total Current Assets | $ | 250,419 | 240,724 | 235,404 | 211,601 | 188,631 | |||||||||||||||
| Property, Plant and Equipment, Net | $ | 103,730 | 96,551 | 82,835 | 72,588 | 69,063 | |||||||||||||||
| Total Assets | $ | 456,604 | 382,070 | 354,250 | 311,472 | 285,792 | |||||||||||||||
| Total Current Liabilities | $ | 107,159 | 96,673 | 94,804 | 88,965 | 81,853 | |||||||||||||||
| Total Long-Term Liabilities | $ | 139,541 | 32,966 | 29,782 | 29,405 | 29,905 | |||||||||||||||
| Shareholders’ Equity | $ | 209,904 | 252,431 | 229,664 | 193,102 | 174,034 | |||||||||||||||
| Current Ratio | 2.3 | 2.5 | 2.5 | 2.4 | 2.5 | ||||||||||||||||
| Debt: | |||||||||||||||||||||
| Current | $ | 3,946 | 2,127 | 1,812 | 2,232 | 7,674 | |||||||||||||||
| Long-Term | $ | 91,393 | 2,470 | 1,907 | 1,608 | 1,029 | |||||||||||||||
| Debt-to-capital ratio | 31.2 | 1.8 | 1.6 | 1.9 | 4.8 | ||||||||||||||||
| Cash Flow Increase (Decrease) | |||||||||||||||||||||
| Net Cash Provided by (Used for) Operating Activities | $ | 37,546 | 39,640 | 40,319 | 44,237 | 36,697 | |||||||||||||||
| Net Cash Provided by (Used for) Investing Activities | $ | (101,979 | (10,357 | (45,959 | ) | (11,781 | ) | (32,062 | ) | ||||||||||||
| Net Cash Provided by (Used for) Financing Activities | $ | 62,075 | (26,679 | (4,876 | ) | (8,111 | ) | (12,130 | ) | ||||||||||||
| Other Data | |||||||||||||||||||||
| Interest Income | $ | 1,042 | 1,854 | 2,698 | 1,691 | 1,479 | |||||||||||||||
| Interest Expense | $ | 3,944 | 898 | 737 | 564 | 1,147 | |||||||||||||||
| Depreciation and Amortization | $ | 22,959 | 18,054 | 14,321 | 13,039 | 12,972 | |||||||||||||||
| Purchases of Property, Plant and Equipment | $ | 20,790 | 28,720 | 23,872 | 20,880 | 21,089 | |||||||||||||||
| Proceeds from Disposals of Property, Plant and Equipment | $ | 656 | 7,254 | 632 | 3,049 | 1,568 | |||||||||||||||
| Number of employees at year-end | 3,002 | 2,774 | 2,653 | 2,496 | 2,474 | ||||||||||||||||
| Diluted Weighted Average Shares Outstanding | 18,581,840 | 19,146,025 | 18,989,248 | 18,209,888 | 18,300,414 | ||||||||||||||||
| Closing share price at year-end | $ | 15.40 | 44.29 | 29.00 | 26.00 | 19.83 | |||||||||||||||
| Common stock price range during year | $ | 15.33-45.41 | 27.84-49.32 | 21.71–29.88 | 17.39-26.23 | 18.25-22.17 | |||||||||||||||
| Closing price/earnings ratio | 27.0 | 21.3 | 18.5 | 20.6 | 27.2 | ||||||||||||||||
|
|
|
|
|
|
|
|
|
|
|
|
|
Years Ended December 31 |
|
| 2007 |
| 2006 |
| 2005 |
| 2004 |
| 2003 |
|
Year End Financial Results |
|
|
|
|
|
|
|
|
|
|
|
|
Net sales |
| $ | 664,218 |
| 598,981 |
| 552,908 |
| 507,785 |
| 453,962 | (3) |
Cost of sales |
| $ | 385,234 |
| 347,402 |
| 318,044 |
| 305,277 |
| 272,285 | (3) |
Gross margin –% |
|
| 42.0 |
| 42.0 |
| 42.5 |
| 39.9 |
| 40.0 |
|
Research and development expenses |
| $ | 23,869 |
| 21,939 |
| 19,351 |
| 17,198 |
| 16,696 |
|
% of net sales |
|
| 3.6 |
| 3.7 |
| 3.5 |
| 3.4 |
| 3.7 |
|
Selling and administrative expenses |
| $ | 200,270 | (1) | 189,676 |
| 180,676 |
| 164,003 | (2) | 142,306 |
|
% of net sales |
|
| 30.2 |
| 31.7 |
| 32.7 |
| 32.3 |
| 31.3 |
|
Profit from operations |
| $ | 54,845 | (1) | 39,964 |
| 34,837 |
| 21,307 | (2) | 22,675 | (3) |
% of net sales |
|
| 8.3 |
| 6.7 |
| 6.3 |
| 4.2 |
| 5.0 |
|
Other income (expense) |
| $ | 2,867 | (1) | 3,338 |
| 157 |
| 72 |
| (192 | ) |
Income tax expense |
| $ | 17,845 | (1) | 13,493 |
| 12,058 |
| 7,999 |
| 8,328 |
|
% of earnings before income taxes |
|
| 30.9 |
| 31.2 |
| 34.5 |
| 37.4 |
| 37.0 |
|
Net earnings |
| $ | 39,867 | (1) | 29,809 |
| 22,936 |
| 13,380 | (2) | 14,155 | (3) |
% of net sales |
|
| 6.0 |
| 5.0 |
| 4.2 |
| 2.6 |
| 3.1 |
|
Return on beginning shareholders’ equity –% |
|
| 17.4 |
| 15.4 |
| 13.2 |
| 8.1 |
| 9.2 |
|
Per Share Data |
|
|
|
|
|
|
|
|
|
|
|
|
Basic net earnings |
| $ | 2.14 | (1) | 1.61 |
| 1.27 |
| 0.74 | (2) | 0.79 | (3) |
Diluted net earnings |
| $ | 2.08 | (1) | 1.57 |
| 1.26 |
| 0.73 | (2) | 0.78 | (3) |
Cash dividends |
| $ | 0.48 |
| 0.46 |
| 0.44 |
| 0.43 |
| 0.42 |
|
Shareholders’ equity (ending) |
| $ | 13.65 |
| 12.25 |
| 10.50 |
| 9.67 |
| 9.21 |
|
Year-End Financial Position |
|
|
|
|
|
|
|
|
|
|
|
|
Cash and cash equivalents |
| $ | 33,092 |
| 31,021 |
| 41,287 |
| 16,837 |
| 24,587 |
|
Total current assets |
| $ | 240,724 |
| 235,404 |
| 211,601 |
| 188,631 |
| 176,370 |
|
Property, plant and equipment, net |
| $ | 96,551 |
| 82,835 |
| 72,588 |
| 69,063 |
| 61,121 |
|
Total assets |
| $ | 382,070 |
| 354,250 |
| 311,472 |
| 285,792 |
| 258,873 |
|
Current liabilities excluding current debt |
| $ | 94,546 |
| 92,992 |
| 86,733 |
| 74,179 |
| 58,477 |
|
Current ratio excluding current debt |
|
| 2.5 |
| 2.5 |
| 2.4 |
| 2.5 |
| 3.0 |
|
Long-term liabilities excluding long-term debt |
| $ | 30,496 |
| 27,875 |
| 27,797 |
| 28,876 |
| 27,455 |
|
Debt: |
|
|
|
|
|
|
|
|
|
|
|
|
Current |
| $ | 2,127 |
| 1,812 |
| 2,232 |
| 7,674 |
| 1,030 |
|
Long-term |
| $ | 2,470 |
| 1,907 |
| 1,608 |
| 1,029 |
| 6,295 |
|
Total debt as% of total capital |
|
| 1.8 |
| 1.6 |
| 2.0 |
| 4.8 |
| 4.2 |
|
Shareholders’ equity |
| $ | 252,431 |
| 229,664 |
| 193,102 |
| 174,034 |
| 165,616 |
|
Cash Flow Increase (Decrease) |
|
|
|
|
|
|
|
|
|
|
|
|
Related to operating activities |
| $ | 39,640 |
| 40,319 |
| 44,237 |
| 36,697 |
| 30,470 |
|
Related to investing activities |
| $ | (10,357 | ) | (45,959 | ) | (11,781 | ) | (32,062 | ) | (6,391 | ) |
Related to financing activities |
| $ | (26,679 | ) | (4,876 | ) | (8,111 | ) | (12,130 | ) | (15,780 | ) |
Other Data |
|
|
|
|
|
|
|
|
|
|
|
|
Interest income |
| $ | 1,854 |
| 2,698 |
| 1,691 |
| 1,479 |
| 1,441 |
|
Interest expense |
| $ | 898 |
| 737 |
| 564 |
| 1,147 |
| 833 |
|
Depreciation and amortization expense |
| $ | 18,054 |
| 14,321 |
| 13,039 |
| 12,972 |
| 13,879 |
|
Acquisition of property, plant and equipment |
| $ | 28,720 |
| 23,872 |
| 20,880 |
| 21,089 |
| 10,483 |
|
Proceeds from disposals of property, plant and equipment |
| $ | 7,254 |
| 632 |
| 3,049 |
| 1,568 |
| 4,092 |
|
Number of employees at year-end |
|
| 2,774 |
| 2,653 |
| 2,496 |
| 2,474 |
| 2,351 |
|
Diluted average shares outstanding |
|
| 19,146,000 |
| 18,989,000 |
| 18,210,000 |
| 18,300,000 |
| 18,128,000 |
|
Closing share price at year-end |
| $ | 44.29 |
| 29.00 |
| 26.00 |
| 19.83 |
| 21.65 |
|
Common stock price range during year |
| $ | 27.84-49.32 |
| 21.71–29.88 |
| 17.39-26.23 |
| 18.25-22.17 |
| 14.50-22.90 |
|
Closing price/earnings ratio |
|
| 21.3 |
| 18.5 |
| 20.6 |
| 27.2 |
| 27.8 |
|
ITEM 7 – Management’s Discussion and Analysis of Financial Condition and Results of Operations
As previously disclosed, we completed the anticipated sale of our Maple Grove, Minnesota facility duringsignificant unit volume decline experienced in the fourth quarter of 2007. All operations previously residing2008. Selling and Administrative Expense (“S&A Expense”) increased 360 basis points as a percentage of Net Sales to 34.7% compared to 2007 due to the inclusion of a workforce reduction and other charges recognized in this facility were integrated into our other North American facilitiesthe fourth quarter of 2008 as well as S&A Expense incurred earlier in the year to enable greater efficiencies in conjunction with our manufacturing footprint consolidation initiative.
expand international market coverage and support new product launches.
Management approved a restructuring action during September 2007 in an effort to better match skill setscontracted positions and talent in evolving functional areas that are critical to successful execution of strategic priorities as discussed in Note 2 to the Consolidated Financial Statements. These actions impacted approximately 60 positions within a workforce of 2,700, or about two percentattrition will account for some of the employee base.eliminated positions and contribute to these annualized savings. The restructuring action resulted in the recognition of a pretax charge of $2.5 million or $0.09 per diluted share in 2007. These costs consistconsisted primarily of severance and outplacement benefits and recruitingservice expenses and arewas included within selling and administrative expensesS&A Expense in the Consolidated Statements of Earnings. These actions
Duringthe fair market value inventory step-up, the unfavorable movement in the foreign currency exchange rates related to a deal contingent non-speculative forward contract that we entered into which fixed the cash outlay in U.S. dollars for our Sociedade Alfa Ltda (“Alfa”) acquisition, as well as the increase in interest expense related to borrowing against our revolving credit facility during the year to fund our first quarter acquisitions.
| § | The inclusion of a $2.7 million ($0.09 per diluted share) net foreign currency gain in the third quarter of 2008 from settlement of forward contracts related to a British pound denominated loan. |
| § | A net benefit from discrete tax items, primarily related to U.S. federal tax settlements, added $0.07 per diluted share. |
| § | Legal settlement expenses of $0.06 per diluted share primarily related to the settlement of a claim filed in the second quarter by a terminated distributor in Brazil. |
| § | Expenses of $0.02 per diluted share related to curtailed acquisition initiatives. |
| § | A net gain of $0.2 million ($0.01 per diluted share) associated with the divestiture of assets related to the Centurion street sweeper product. |
During 2007, in support of these strategic initiatives, we incurred approximately $4.2 million of costs. As we exit 2007, our North American manufacturing footprint consolidation initiative is complete. Our China facility is manufacturing two products for local and worldwide distribution, with another product platform ready for production in early 2008.efficiencies. Our global sourcing initiative contributed over $4.0approximately $6 million in savings during 2007,2008, allowing us to maintain our gross marginessentially offset the impact of inflation in 20072008 despite experiencing rising material costs and investment in these initiatives.throughout the majority of the year. We also successfully doubledincreased the percentage of materials and components sourced from low-cost regions from approximately 7-8% in 2006 to 14% in 2007 to approximately 20% in 2008. Our footprint consolidation and lean initiatives contributed approximately $4 million in savings in 2008, in part from benefits of closing our Maple Grove, MN facility toward the end of 2007.
In October 2007, we Our new product launches in 2009 will focus on expanding the roll-out of ec-water. This game-changing technology will be introduced a breakthrough new cleaning technology,ech2oTMthat cleans using electrically activated tap water. We will begin global shipments of machines equipped withon five rider scrubbers in 2009 in addition to theech2otechnology, which will initially be available on six walk-behind scrubbers introduced during the second quarter of 2008. In addition, we expect to launch 6 to 7 new products in 2008 that will take us into new market space and further enhance our product portfolio.
Current challenges facing Tennant include cost increases for raw materials and other purchased components due to rising commodity costs which are mitigated by selling price increases and cost reduction activities. We expect to continue to see volatility in commodity prices driving increases in our cost of commodity-based components in 2008.
Lastly, ourclosely and conservatively manage the business.
|
|
|
|
|
|
|
|
|
|
|
|
|
|
|
|
|
|
|
|
|
|
| 2007 |
|
| % |
|
| 2006 |
|
| % |
|
| 2005 |
|
| % |
|
Net sales |
| $ | 664,218 |
|
| 100.0 |
| $ | 598,981 |
|
| 100.0 |
| $ | 552,908 |
|
| 100.0 |
|
Cost of sales |
|
| 385,234 |
|
| 58.0 |
|
| 347,402 |
|
| 58.0 |
|
| 318,044 |
|
| 57.5 |
|
Gross profit |
|
| 278,984 |
|
| 42.0 |
|
| 251,579 |
|
| 42.0 |
|
| 234,864 |
|
| 42.5 |
|
Research and |
|
|
|
|
|
|
|
|
|
|
|
|
|
|
|
|
|
|
|
development expenses |
|
| 23,869 |
|
| 3.6 |
|
| 21,939 |
|
| 3.7 |
|
| 19,351 |
|
| 3.5 |
|
Selling and |
|
|
|
|
|
|
|
|
|
|
|
|
|
|
|
|
|
|
|
administrative expenses |
|
| 206,242 |
|
| 31.1 |
|
| 189,676 |
|
| 31.7 |
|
| 180,676 |
|
| 32.7 |
|
Gain on sale of facility |
|
| (5,972 | ) |
| 0.9 |
|
| — |
|
| — |
|
| — |
|
| — |
|
Profit from operations |
|
| 54,845 |
|
| 8.3 |
|
| 39,964 |
|
| 6.7 |
|
| 34,837 |
|
| 6.3 |
|
Interest income |
|
| 1,854 |
|
| 0.3 |
|
| 2,698 |
|
| 0.5 |
|
| 1,691 |
|
| 0.3 |
|
Interest expense |
|
| (898 | ) |
| 0.1 |
|
| (737 | ) |
| 0.1 |
|
| (564 | ) |
| 0.1 |
|
Interest income, net |
|
| 956 |
|
| 0.1 |
|
| 1,961 |
|
| 0.3 |
|
| 1,127 |
|
| 0.2 |
|
Net foreign currency |
|
|
|
|
|
|
|
|
|
|
|
|
|
|
|
|
|
|
|
transaction gains |
|
| 39 |
|
| — |
|
| 516 |
|
| 0.1 |
|
| 8 |
|
| — |
|
ESOP income |
|
| 2,568 |
|
| 0.4 |
|
| 1,205 |
|
| 0.2 |
|
| 387 |
|
| 0.1 |
|
Other expense, net |
|
| (696 | ) |
| 0.1 |
|
| (344 | ) |
| 0.1 |
|
| (1,365 | ) |
| 0.2 |
|
Total other |
|
|
|
|
|
|
|
|
|
|
|
|
|
|
|
|
|
|
|
income (expense) |
|
| 1,911 |
|
| 0.3 |
|
| 1,377 |
|
| 0.2 |
|
| (970 | ) |
| 0.2 |
|
Profit before income taxes |
|
| 57,712 |
|
| 8.7 |
|
| 43,302 |
|
| 7.2 |
|
| 34,994 |
|
| 6.3 |
|
Income tax expense |
|
| 17,845 |
|
| 2.7 |
|
| 13,493 |
|
| 2.3 |
|
| 12,058 |
|
| 2.2 |
|
Net earnings |
| $ | 39,867 |
|
| 6.0 |
| $ | 29,809 |
|
| 5.0 |
| $ | 22,936 |
|
| 4.2 |
|
Earnings per diluted share |
| $ | 2.08 |
|
|
|
| $ | 1.57 |
|
|
|
| $ | 1.26 |
|
|
|
|
9
| 2008 | % | 2007 | % | 2006 | % | |||||||||||||||||||
| Net Sales | $ | 701,405 | 100.0 | $ | 664,218 | 100.0 | $ | 598,981 | 100.0 | |||||||||||||||
| Cost of Sales | 415,155 | 59.2 | 385,234 | 58.0 | 347,402 | 58.0 | ||||||||||||||||||
| Gross Profit | 286,250 | 40.8 | 278,984 | 42.0 | 251,579 | 42.0 | ||||||||||||||||||
| Operating Expense: | ||||||||||||||||||||||||
Research and Development Expense | 24,296 | 3.5 | 23,869 | 3.6 | 21,939 | 3.7 | ||||||||||||||||||
Selling and Administrative Expense | 243,614 | 34.7 | 206,242 | 31.1 | 189,676 | 31.7 | ||||||||||||||||||
| Gain on Sale of Facility | - | - | (5,972 | ) | (0.9 | ) | - | - | ||||||||||||||||
| Gain on Divestiture of Assets | (229 | ) | - | - | - | - | - | |||||||||||||||||
| Total Operating Expenses | 267,681 | 38.2 | 224,139 | 33.7 | 211,615 | 35.3 | ||||||||||||||||||
| Profit from Operations | 18,569 | 2.6 | 54,845 | 8.3 | 39,964 | 6.7 | ||||||||||||||||||
| Other Income (Expense): | ||||||||||||||||||||||||
| Interest Income | 1,042 | 0.1 | 1,854 | 0.3 | 2,698 | 0.5 | ||||||||||||||||||
| Interest Expense | (3,944 | ) | (0.6 | ) | (898 | ) | (0.1 | ) | (737 | ) | (0.1 | ) | ||||||||||||
Net Foreign Currency Transaction Gain (Loss) | 1,368 | 0.2 | 39 | - | 516 | 0.10 | ||||||||||||||||||
| ESOP Income | 2,219 | 0.3 | 2,568 | 0.4 | 1,205 | 0.2 | ||||||||||||||||||
| Other Income (Expense), Net | (1,679 | ) | (0.2 | ) | (696 | ) | (0.1 | ) | (344 | ) | (0.1 | ) | ||||||||||||
Total Other Income (Expense), Net | (994 | ) | (0.1 | ) | 2,867 | 0.4 | 3,338 | 0.6 | ||||||||||||||||
| Profit Before Income Taxes | 17,575 | 2.5 | 57,712 | 8.7 | 43,302 | 7.2 | ||||||||||||||||||
| Income Tax Expense | 6,951 | 1.0 | 17,845 | 2.7 | 13,493 | 2.3 | ||||||||||||||||||
| Net Earnings | $ | 10,624 | 1.5 | $ | 39,867 | 6.0 | $ | 29,809 | 5.0 | |||||||||||||||
| Earnings per Diluted Share | $ | 0.57 | $ | 2.08 | $ | 1.57 | ||||||||||||||||||
| § | Growth in Net Sales of 5.6% to $701.4 million, driven by 2008 acquisitions and increases in Other International. |
| § | A 120 basis point decline in Gross Margins to 40.8% as fixed manufacturing costs within our plants were not fully leveraged due to a significant equipment unit volume decline of $22.9 million experienced in the fourth quarter of 2008. |
| § | An increase in S&A Expense as a percentage of Net Sales of 360 basis points due to the inclusion of $19.8 million of expenses associated with the fourth quarter workforce reduction charge and other charges as well as expenses incurred earlier in the year to expand international market coverage and support new product launches. |
| § | The inclusion of a $2.7 million net foreign currency gain from settlement of forward contracts related to a British pound denominated loan. |
| § | A net benefit from discrete tax items, primarily related to U.S. federal tax settlements added $0.07 per diluted share. |
| § | A dilutive impact to Net Earnings related to our 2008 acquistions of $2.8 million. |
| § | |
| Growth in |
| § | |
| Holding margins flat with 2006 at 42.0%, despite higher material costs and investments in our footprint consolidation and China expansion initiatives. |
| § | |
| A decrease in S&A |
| § | |
| A gain of $6.0 million associated with the sale of our Maple Grove, Minnesota facility. |
| § | |
| A decrease in |
|
|
In 2006, net earnings increased 30.0% to $29.8 million, or $1.57 per diluted share. Net earnings were impacted by:
|
|
|
|
|
|
|
|
|
|
We use
were as follows:
| % Change | % Change | |||
| from 2007 | from 2006 | |||
| Organic Growth (Decline): | ||||
| Volume | (5%) | 3% | ||
| Price | 4% | 3% | ||
| (1%) | 6% | |||
| Foreign Currency | 2% | 3% | ||
| Acquisitions | 5% | 2% | ||
| Total | 6% | 11% | ||
| § | An organic decline of 1%, which includes a decline in base business volume, primarily within North America, partially offset by the net benefit from pricing actions taken during the year. |
| § | A favorable direct foreign currency exchange impact of 2%. |
| § | An increase of 5% in sales volume due to our March 28, 2008 acquisition of Alfa , our February 29, 2008 acquisition of Applied Sweepers, Ltd. (“Applied Sweepers”) and our February 1, 2007 acquisition of Floorep Limited (“Floorep”). |
| § | Organic growth in all geographic regions and all product categories. |
| § | A favorable direct foreign currency exchange impact of 3%. |
| § | An increase of 2% in sales volume due to our February 1, 2007 acquisition of Floorep. |
|
|
|
|
|
|
|
|
|
|
|
|
|
|
|
|
|
|
|
|
|
|
| 2007 |
|
| % |
|
| 2006 |
|
| % |
|
| 2005 |
|
| % |
|
North America |
| $ | 417,757 |
|
| 6.8 |
| $ | 391,309 |
|
| 5.7 |
| $ | 370,142 |
|
| 8.3 |
|
Europe |
|
| 172,708 |
|
| 17.0 |
|
| 147,657 |
|
| 16.3 |
|
| 126,913 |
|
| 10.4 |
|
Other |
|
|
|
|
|
|
|
|
|
|
|
|
|
|
|
|
|
|
|
International |
|
| 73,753 |
|
| 22.9 |
|
| 60,015 |
|
| 7.5 |
|
| 55,853 |
|
| 9.6 |
|
Total |
| $ | 664,218 |
|
| 10.9 |
| $ | 598,981 |
|
| 8.3 |
| $ | 552,908 |
|
| 8.9 |
|
| 2008 | % | 2007 | % | 2006 | % | |||||||||||||||||||
| North America | $ | 402,174 | (3.7 | ) | $ | 417,757 | 6.8 | $ | 391,309 | 5.7 | ||||||||||||||
Europe, Middle East and Africa | 217,594 | 18.8 | 183,188 | 17.6 | 155,710 | 16.9 | ||||||||||||||||||
Other International | 81,637 | 29.0 | 63,273 | 21.8 | 51,962 | 4.9 | ||||||||||||||||||
| Total | $ | 701,405 | 5.6 | $ | 664,218 | 10.9 | $ | 598,981 | 8.3 | |||||||||||||||
In 2006, North American net sales– EMEA Net Sales in 2008 increased 5.7%18.8% to $391.3 million compared with $370.1 million in 2005. Growth in net sales was driven by volume increases in all product categories and price increases. Organic growth accounted for the volume increases in service, parts and consumables sales, while the volume growth in equipment sales was primarily driven by the continued success of new products. Growth in specialty surface coatings also contributed to the increase in North America net sales as compared to 2005.
Europe– European net sales in 2007 increased 17.0% to $172.7$217.6 million compared to 2006 net sales2007 Net Sales of $147.7$183.2 million. Positive direct foreign currency exchange effects increased European net salesEMEA Net Sales by approximately 10%6% in 2008. Our Applied Sweepers acquisition contributed approximately 14% to EMEA’s 2008 Net Sales. EMEA’s organic base was essentially flat in 2008 when compared to 2007. Pricing increases and volume growth in emerging markets were offset by lower sales of equipment in the mature markets within Europe. The majority of the equipment unit volume decline occurred in the fourth quarter following the global credit crisis and a significant slowdown in these economies.
European net sales in 2006 increased 16.3% to $147.7 million compared to 2005 netincreases were partially offset by lower sales of $126.9equipment in the United Kingdom, one of our largest markets within the region.
Other International– 2008.
10
Other International net sales$1.2 million in 2006 increased 7.5% to $60.0 million over 2005 net salesexpense from the flow-through of $55.9 million. Growth in net sales was primarily driven by price increases, new product salesfair market value inventory step-up from our acquisitions of Applied Sweepers and expanded market coverage in China. Negative direct foreign currency exchange effects decreased net sales in other international markets by approximately 1% in 2006.
Alfa.
Gross profit marginMargin was 42.0% in 2007, the same as in 2006. Price increases and cost reduction actions in 2007 nearly offset higher costs for raw materials and purchased components such as the high battery costs experienced during the year driven by increases in the cost of lead.
Gross profit margin declined 0.5 percentage points to 42.0% in 2006 compared to 2005. Price increases taken earlier in the year and manufacturing cost reduction actions were not enough to offset higher material costs and expenses associated with the startup of our China facility and our manufacturing footprint consolidation.
As a percentage
S&A expenses increased by $9.0 million, or 5.0%, in 2006 compared to 2005. S&A expenses increased in part due to general inflationary cost increases including salaries & wages, medical, travel and fuel costs. Increases in sales incentives and warranty expenses driven primarily by growth in net sales and higher levels of marketing expenses for new product launches also contributed to the increase in S&A expenses over the prior year. Additional costs due to the inclusion of expensesAssets
$0.2 million.
– Interest income, netIncome was $1.0 million in 2008, a decrease of $0.8 million from 2007. The decrease between 2008 and 2007 reflects the impact of a decline in interest rates between periods on lower average cash levels.
Net Sales.
Total other income – Net Foreign Currency Transaction Gains increased $0.5$1.3 million between 20072008 and 2006.
Net2007. A $2.7 million net foreign currency gain from the settlement of forward contracts related to a British pound denominated loan was the most significant contributor to the change between years. This gain was partially offset by the $0.9 million unfavorable movement in the foreign currency exchange gainsrates related to a deal contingent non-speculative forward contract that we entered into that fixed the cash outlay in U.S. dollars for the Alfa acquisition in the first quarter of 2008. The remaining change was due to a net favorable impact from other foreign currency fluctuations between years.
an increase in discretionary contributions to Tennant’s charitable foundation.
The $2.3 million change in other income (expense), net between 2006 and 2005 was primarily due to contributions made to the Tennant Foundation during 2005 that were not repeated in 2006, increased ESOP income due to a higher average stock price in 2006 than 2005 and fluctuations in foreign currency exchange rates.
11
The third quarter ofas noted below.
1%.
– Cash and Cash Equivalents totaled $29.3 million at December 31, 2008, as compared to $33.1 million of Cash and Cash Equivalents as of December 31, 2007. We did not have any Short-Term Investments as of December 31, 2008 or 2007. Cash and Cash Equivalents held by our foreign subsidiaries totaled $14.6 million as of December 31, 2008 as compared to $3.8 million of Cash and Cash Equivalents held by our foreign subsidiaries as of December 31, 2007. Wherever possible, cash management is centralized and intercompany financing is used to provide working capital to subsidiaries as needed. Our current ratio was 2.3 and 2.5 as of December 31, 2008 and 2007, based on working capital of $143.3 million and $144.1 million, respectively.
As2008.
The fee for committed funds under the Credit Agreement rangeshas been amended twice, most recently in March of 2009. For a detailed description of the amendments, refer to page 14.
| 2008 | 2007 | 2006 | ||||||||||
| Operating Activities | $ | 37,546 | $ | 39,640 | $ | 40,319 | ||||||
| Investing Activities: | ||||||||||||
| Purchases of Property, Plant and Equipment, Net of Disposals | (20,134 | ) | (21,466 | ) | (23,240 | ) | ||||||
| Acquisitions of Businesses, Net of Cash Acquired | (81,845 | ) | (3,141 | ) | (8,469 | ) | ||||||
| Change in Short-Term Investments | - | 14,250 | (14,250 | ) | ||||||||
| Financing Activities | 62,075 | (26,679 | ) | (4,876 | ) | |||||||
| Effect of Exchange Rate Changes on Cash and Cash Equivalents | (1,449 | ) | (533 | ) | 250 | |||||||
| Net Increase (Decrease) in Cash and Cash Equivalents | $ | (3,807 | ) | $ | 2,071 | $ | (10,266 | ) | ||||
| 2008 | 2007 | 2006 | ||||
| DSO | 77 | 61 | 61 | |||
| DIOH | 101 | 83 | 82 |
certain other currencies. The facility is available for general corporate purposes, working capital needs, share repurchases and acquisitions. The Credit Agreement contains customary representations, warranties and covenants, including but not limited to covenants restricting our ability to incur indebtedness and liens and to merge or consolidate with another entity. Further, the Credit Agreement containsinitially contained a covenant requiring us to maintain an indebtedness to EBITDA ratio as of the end of each quarter of not greater than 3.5 to 1, and to maintain an EBITDA to interest expense ratio of no less than 3.5 to 1. The Credit Agreement also restricts us from paying dividends or repurchasing stock in an amount that exceeds $50.0 million during any fiscal year if, after giving effect to such payments, our leverage ratio would exceed 2.5 to 1. The company wasWe were in compliance with all such covenants atas of December 31, 2007.
In February 2008, we completed the acquisition of one foreign-based company and announced that we had signed a purchase agreement to acquire a second foreign-based company. We used a combination of available cash and the Credit Agreement to fund the acquisition that closed and intend to use a combination of available cash and the Credit Agreement to fund the other acquisition which has not yet closed.
2008.
Cash1.75% over the BoS base rate as calculated daily on the cleared account balance. This facility contains a covenant requiring us to maintain a total assets (excluding certain amounts) to borrowings ratio of 2.5 to 1 as of the end of each month and cash equivalents totaled $33.1 millionan EBIT to total interest ratio of 2 to 1 as of the end of each quarter. We were in compliance with all such covenants at December 31, 2007, down 26.9% from $45.3 million of cash, cash equivalents and short-term investments as of2008. There was no balance outstanding on this facility at December 31, 2006. We did not have any short-term investments as2008.
If the global economy deteriorates, it could have an unfavorable impact on the demand for our products and, as a result, our operating cash flow. We believe that the combination of internally generated funds, present capital resources and available financing sources are more than sufficient to meet our cash requirements for 2008.
12
– Our contractual cash obligations and commitments as of December 31, 2007,2008, are summarized by period due in the following table (in thousands):
|
|
|
|
|
|
|
|
|
|
|
|
|
|
|
|
|
|
| Total |
| Less |
| 1 - 3 |
| 3 - 5 |
| More |
| |||||
On-balance sheet obligations: |
|
|
|
|
|
|
|
|
|
|
|
|
|
|
|
|
Collateralized borrowings(1) |
| $ | — |
| $ | — |
| $ | — |
| $ | — |
| $ | — |
|
Capital leases |
|
| 3,451 |
|
| 1,536 |
|
| 1,903 |
|
| 12 |
|
| — |
|
Interest payments on capital leases |
|
| 136 |
|
| — |
|
| 135 |
|
| 1 |
|
| — |
|
Residual value guarantee(2) |
|
| 797 |
|
| 508 |
|
| 286 |
|
| 3 |
|
| — |
|
Retirement benefit plans(3) |
|
| 985 |
|
| 985 |
|
| — |
|
| — |
|
| — |
|
Deferred compensation arrangements(4) |
|
| 6,890 |
|
| 1,008 |
|
| 1,849 |
|
| 643 |
|
| 3,390 |
|
Other long-term employee benefits(5) |
|
| — |
|
| — |
|
| — |
|
| — |
|
| — |
|
Unrecognized tax benefits(6) |
|
| — |
|
| — |
|
| — |
|
| — |
|
| — |
|
Total on-balance sheet obligations |
| $ | 12,259 |
| $ | 4,037 |
| $ | 4,173 |
| $ | 659 |
| $ | 3,390 |
|
Off-balance sheet arrangements: |
|
|
|
|
|
|
|
|
|
|
|
|
|
|
|
|
Operating leases |
|
| 21,745 |
|
| 8,900 |
|
| 9,140 |
|
| 3,469 |
|
| 236 |
|
Purchase obligations |
|
| 47,479 |
|
| 47,479 |
|
| — |
|
| — |
|
| — |
|
Total off-balance sheet obligations |
| $ | 69,224 |
| $ | 56,379 |
| $ | 9,140 |
| $ | 3,469 |
| $ | 236 |
|
Total contractual obligations |
| $ | 81,483 |
| $ | 60,416 |
| $ | 13,313 |
| $ | 4,128 |
| $ | 3,626 |
|
| Total | Less Than 1 Year | 1 - 3 Years | 3 - 5 Years | More than 5 Years | ||||||||||||||||
Long-term debt obligations(1) | $ | 87,563 | $ | 17 | $ | 34 | $ | 87,512 | $ | - | ||||||||||
Collateralized borrowings(2) | 1,758 | 670 | 1,088 | - | - | |||||||||||||||
| Capital leases | 6,018 | 3,306 | 2,508 | 204 | - | |||||||||||||||
Interest payments on capital leases | 477 | 258 | 212 | 7 | - | |||||||||||||||
Residual value guarantees(3) | 900 | 535 | 362 | 3 | - | |||||||||||||||
Retirement benefit plans(4) | 1,093 | 1,093 | - | - | - | |||||||||||||||
Deferred compensation arrangements(5) | 7,043 | 956 | 1,388 | 511 | 4,188 | |||||||||||||||
Other long-term employee benefits(6) | - | - | - | - | - | |||||||||||||||
Unrecognized tax benefits(7) | - | - | - | - | - | |||||||||||||||
Operating leases(8) | 19,694 | 7,919 | 8,898 | 2,515 | 362 | |||||||||||||||
Purchase obligations(9) | 32,053 | 32,053 | - | - | - | |||||||||||||||
Total contractual obligations | $ | 156,599 | $ | 46,807 | $ | 14,490 | $ | 90,752 | $ | 4,550 | ||||||||||
(2)purchaser.
(3)
(4)
(5)
(6)
Off-balance Sheet Arrangements– Off-balance sheet arrangements
Statements. We have applied the provisions of EITFEmerging Issues Task Force (‘EITF”) Issue No. 01-8, “Determining Whether an Arrangement Contains a Lease,” and have determined that our agreement with our third-party logistics provider contains an operating lease under SFAS No. 13. As a result, we have included the future minimum lease payments related to the underlying building lease in our operating lease commitments in the contractual cash obligations and commitments table. In the event we elect to cancel the agreement with our third-party logistics provider prior to the contract expiration date we would be required to assume the underlying building lease for the remainder of its term.
Cash Requirements
Operating Activities– Cash provided by operating activities was $39.6 million in 2007, $40.3 million in 2006 and $44.2 million in 2005. In 2007, cash provided by operating activities was driven primarily by strong net earnings as well as an increase in net income taxes payable/prepaid, partially offset by a decrease in employee compensation and benefits and other accrued expenses. The decrease in employee compensation and benefits and other accrued expenses was primarily a result of decreases in performance-based compensation.
Cash flow from operations decreased $0.7 million in 2007 compared to 2006. This decrease was primarily driven by decreased income taxes payable/prepaid and decreased employee compensation and benefits and other accrued expenses.
In 2006, cash provided by operating activities was impacted by strong net earnings and an increase in non-cash share-based compensation expense, an increase in accounts payable, employee compensation and benefits and other accrued expenses. The increase in share-based compensation expense was primarily attributable to the inclusion of stock option expense under SFAS No. 123(R) in 2006 and an increase in expense associated with performance share and restricted stock awards. The increases in accounts payable, employee compensation and benefits and other accrued expenses were attributable to higher accruals for volume-based incentives and warranty, an increase in payroll
13
accruals as well as timing of payments. Partially offsetting these sources of cash were an increase in receivables driven by higher fourth quarter sales volumes and an increase in inventory. The increase in inventory was in support of new product launches and the addition of our manufacturing facility in China.
As discussed previously, two metrics used by management to evaluate how effectively we utilize our net assets are “Accounts Receivable Days Sales Outstanding” (DSO) and “Days Inventory on Hand” (DIOH), on a FIFO basis. These metrics for the years indicated were as follows (in days):
|
|
|
|
|
|
|
|
|
|
| 2007 |
|
| 2006 |
|
| 2005 |
|
|
| |||||||||
DSO | 61 |
|
| 61 |
|
| 61 |
|
|
DIOH | 83 |
|
| 82 |
|
| 82 |
|
|
DIOH increased one day in 2007 compared to 2006. This increase is mainly due to higher inventory levels at our foreign locations due to longer lead times and pipeline fill for new products. Inventory grew at the same pace as demand during 2006 as compared to 2005 resulting in no change in the DIOH.
Investing Activities – Net cash used in investing activities was $10.4 million in 2007, $46.0 million in 2006 and $11.8 million in 2005. The primary use of cash in investing activities during 2007 was capital expenditures and our acquisition of Floorep Limited. Sources of cash for 2007 investing activities include net sales of short-term investments, which generated $14.3 million in cash and proceeds from the sale of our Maple Grove, Minnesota facility. Capital expenditures were $28.7 million during 2007 compared to $23.9 million in 2006. Capital expenditures were $20.9 million in 2005. Capital expenditures in 2007 included continued investments in our footprint consolidation initiative, new product tooling and capital spending related to our global expansion initiatives. Capital expenditures in 2006 included continued expansion of our information systems capabilities and investments in new product tooling as well as capital spending in support of our China expansion initiative. Capital expenditures in 2005 included investments in new product tooling and expansion of our information system capabilities.
In 2008, capital expenditures are expected to approximate $25 to $29 million. Significant capital projects planned for 2008 include upgrades to our information technology systems and related infrastructure and investments in tooling in support of new products. In addition, we plan to invest in our corporate facilities to create a global center for research and development. Capital expenditures in 2008 are expected to be financed primarily with funds from operations.
Proceeds from dispositions of property, plant and equipment in 2005 include $1.5 million in proceeds from the sale of a distribution center in Holland, Michigan.
In July 2006, we acquired Hofmans Machinefabriek (“Hofmans”) for a purchase price of $8.6 million, subject to certain post-closing adjustments. The cost of the acquisition was paid for in cash with funds provided by operations.
In February 2007, we acquired Floorep Limited (“Floorep”), a distributor of cleaning equipment based in Scotland, for a purchase price of $3.6 million in cash, subject to certain post-closing adjustments. The results of Floorep’s operations have been included in the Consolidated Financial Statements since February 2, 2007, the date of acquisition.
Financing Activities – Net cash used in financing activities was $26.7 million in 2007, $4.9 million in 2006 and $8.1 million in 2005. In 2007, significant uses of cash included $29.0 million in repurchases of common stock related to our share repurchase program and $9.0 million of dividends paid. In 2006, significant uses of cash included $8.6 million of dividends paid and $5.3 million in repurchases of common stock related to our share repurchase program.
Proceeds from issuance of common stock generated $8.7 million in 2007 and $8.5 million in 2006. Proceeds in both years were driven by an increase in employees’ stock option exercises due to a higher average stock price and senior management transitions.
Our cash dividend payout increased for the 36th consecutive year to $0.48 per share in 2007, an increase of $0.02 per share over 2006.
In November 2004, an additional 400,000 shares were authorized under the share repurchase program approved by the Board of Directors in May 2001. In August 2006, the Board of Directors approved the adjustment of the number of shares then available for repurchase to reflect the impact of the two-for-one stock split, which increased the number of shares available for repurchase from approximately 281,000 immediately before the stock split to approximately 562,000. On May 3, 2007, the Board of Directors authorized the repurchase of 1,000,000 additional shares of our common stock.
Shares repurchased during 2007 approximated 735,900, with the average repurchase price of $39.34. Repurchases made in 2006 prior to the stock split on July 26, 2006 totaled approximately 61,000 shares at an average repurchase price of $46.36 or 122,000 shares at $23.18, post-split. Following the stock split, approximately 87,000 shares were repurchased at an average price of $27.96. Shares repurchased during 2005 approximated 92,000 on a post-split basis. With the average post-split repurchase price of $18.83.
At December 31, 2007, approximately 739,000 shares were authorized for repurchase.
New
In November 2006, the FASB released EITF No. 06-11, “Accounting for Income Tax Benefits of Dividends on Share-Based Payment Awards” (“EITF Issue No. 06-11”). EITF Issue No. 06-11 defines how an entity should recognize the income tax benefit received on dividends that are (a) paid to employees holding equity-classified nonvested shares, equity-classified nonvested share units, or equity-classified outstanding share options and (b) charged to retained earnings under SFAS No. 123 (revised 2004), “Share Based Payment” (“SFAS No. 123(R)”). The requirements are effective prospectively for fiscal years beginning after December 15, 2007. Wewe do not expect that the adoption of EITF No. 06-11FSP FAS 157-2 will have a materialan impact on our financial condition,position or results of operations or cash flows.
In February 2007, the FASB issued SFAS No. 159, “The Fair Value Option for Financial Assets and Financial Liabilities Including an Amendment of FASB Statement No. 115” (“SFAS No. 159”). SFAS No. 159 permits entities to choose to measure many financial instruments and certain other items at fair value. The objective is to improve financial reporting by providing entities with the opportunity to mitigate volatility in reported earnings without having to apply complex hedge accounting. The requirements are effective for fiscal years beginning after November 15, 2007. We do not expect the adoption of SFAS No. 159 will have a material impact on our financial condition, results of operations or cash flows.
operations.
14
Inventories. As of December 31, 2007,2008, we had $4.4$5.1 million reserved against inventories.
Inventories.
| · | |
| Geopolitical, economic and |
| · | Availability of credit in the open markets. |
| · | Effects of potential impairment write down of our intangible assets values. |
| · | |
|
|
|
|
|
|
| Successful integration of acquisitions, including ability to carry acquired goodwill at current values. |
| · | |
| Ability to achieve growth plans. |
| · | |
| Ability to achieve projections of future financial and operating results. |
| · | |
| Ability to achieve operational efficiencies, including synergistic and other benefits of acquisitions. |
| · | Fluctuations in the cost or availability of raw materials and purchased components. |
| Ability to |
| · | |
| Success and timing of new technologies and products. |
|
|
15
| · | Unforeseen product quality problems. |
|
|
| · | |
|
|
| Relative strength of the U.S. dollar, which affects the cost of our materials and products purchased and sold internationally. |
| · | Ability to effectively manage organizational changes, including workforce reductions. |
| · | Ability to achieve anticipated savings from our workforce reductions. |
| · | Ability to attract and retain key personnel. |
| Ability to acquire, retain and protect proprietary intellectual property rights. |
| · | Potential for increased competition in our business. |
| · | Changes in laws, including changes in accounting standards and taxation changes. |
|
|
|
|
��
2009.
MANAGEMENT’S REPORT ON INTERNAL CONTROLS OVER FINANCIAL REPORTING
Our management is responsible for establishing and maintaining adequate internal control over financial reporting, as such term is defined in Exchange Act Rule 13a-15(f). Under the supervision and with the participation of our management, including our principal executive officer and principal accounting and financial officer, we conducted an assessment of the effectiveness of our internal control over financial reporting based on the framework inInternal Control – Integrated Frameworkissued by the Committee of Sponsoring Organizations of the Treadway Commission. Based on our assessment under the framework inInternal Control – Integrated Framework(COSO), our management concluded that our internal control over financial reporting was effective as of December 31, 2007.
| ||
| ||
| ||
| ||
| ||
| ||
| ||
16
| |
| |
|
17
|
|
|
|
|
|
|
|
|
|
|
Years ended December 31 |
| 2007 |
| 2006 |
| 2005 |
| |||
Net sales |
| $ | 664,218 |
| $ | 598,981 |
| $ | 552,908 |
|
Cost of sales |
|
| 385,234 |
|
| 347,402 |
|
| 318,044 |
|
Gross profit |
|
| 278,984 |
|
| 251,579 |
|
| 234,864 |
|
Operating expense: |
|
|
|
|
|
|
|
|
|
|
Research and development expenses |
|
| 23,869 |
|
| 21,939 |
|
| 19,351 |
|
Selling and administrative expenses |
|
| 206,242 |
|
| 189,676 |
|
| 180,676 |
|
Gain on sale of facility |
|
| (5,972 | ) |
| — |
|
| — |
|
Total operating expenses |
|
| 224,139 |
|
| 211,615 |
|
| 200,027 |
|
Profit from operations |
|
| 54,845 |
|
| 39,964 |
|
| 34,837 |
|
Other income (expense): |
|
|
|
|
|
|
|
|
|
|
Interest income |
|
| 1,854 |
|
| 2,698 |
|
| 1,691 |
|
Interest expense |
|
| (898 | ) |
| (737 | ) |
| (564 | ) |
Net foreign currency transaction gains |
|
| 39 |
|
| 516 |
|
| 8 |
|
ESOP income |
|
| 2,568 |
|
| 1,205 |
|
| 387 |
|
Other income (expense), net |
|
| (696 | ) |
| (344 | ) |
| (1,365 | ) |
Total other income |
|
| 2,867 |
|
| 3,338 |
|
| 157 |
|
Profit before income taxes |
|
| 57,712 |
|
| 43,302 |
|
| 34,994 |
|
Income tax expense |
|
| 17,845 |
|
| 13,493 |
|
| 12,058 |
|
Net earnings |
| $ | 39,867 |
| $ | 29,809 |
| $ | 22,936 |
|
|
|
|
|
|
|
|
|
|
|
|
Earnings per share: |
|
|
|
|
|
|
|
|
|
|
Basic |
| $ | 2.14 |
| $ | 1.61 |
| $ | 1.27 |
|
Diluted |
| $ | 2.08 |
| $ | 1.57 |
| $ | 1.26 |
|
Weighted average shares outstanding: |
|
|
|
|
|
|
|
|
|
|
Basic |
|
| 18,641,000 |
|
| 18,561,000 |
|
| 18,024,000 |
|
Diluted |
|
| 19,146,000 |
|
| 18,989,000 |
|
| 18,210,000 |
|
See accompanying Notes to
| Years ended December 31 | 2008 | 2007 | 2006 | |||||||||
| Net Sales | $ | 701,405 | $ | 664,218 | $ | 598,981 | ||||||
| Cost of Sales | 415,155 | 385,234 | 347,402 | |||||||||
| Gross Profit | 286,250 | 278,984 | 251,579 | |||||||||
| Operating Expense: | ||||||||||||
| Research and Development Expense | 24,296 | 23,869 | 21,939 | |||||||||
| Selling and Administrative Expense | 243,614 | 206,242 | 189,676 | |||||||||
| Gain on Sale of Facility | - | (5,972 | ) | - | ||||||||
| Gain on Divestiture of Assets | (229 | ) | - | - | ||||||||
| Total Operating Expenses | 267,681 | 224,139 | 211,615 | |||||||||
| Profit from Operations | 18,569 | 54,845 | 39,964 | |||||||||
| Other Income (Expense): | ||||||||||||
| Interest Income | 1,042 | 1,854 | 2,698 | |||||||||
| Interest Expense | (3,944 | ) | (898 | ) | (737 | ) | ||||||
| Net Foreign Currency Transaction Gains (Losses) | 1,368 | 39 | 516 | |||||||||
| ESOP Income | 2,219 | 2,568 | 1,205 | |||||||||
| Other Income (Expense), Net | (1,679 | ) | (696 | ) | (344 | ) | ||||||
| Total Other Income (Expense), Net | (994 | ) | 2,867 | 3,338 | ||||||||
| Profit Before Income Taxes | 17,575 | 57,712 | 43,302 | |||||||||
| Income Tax Expense | 6,951 | 17,845 | 13,493 | |||||||||
| Net Earnings | $ | 10,624 | $ | 39,867 | $ | 29,809 | ||||||
| Earnings per Share: | ||||||||||||
| Basic | $ | 0.58 | $ | 2.14 | $ | 1.61 | ||||||
| Diluted | $ | 0.57 | $ | 2.08 | $ | 1.57 | ||||||
| Weighted Average Shares Outstanding: | ||||||||||||
| Basic | 18,303,137 | 18,640,882 | 18,561,533 | |||||||||
| Diluted | 18,581,840 | 19,146,025 | 18,989,248 | |||||||||
| Cash Dividends Declared per Common Share | $ | 0.52 | $ | 0.48 | $ | 0.46 | ||||||
| See accompanying Notes to Consolidated Financial Statements. | ||||||||||||
|
|
|
|
|
|
|
|
December 31 |
| 2007 |
| 2006 |
| ||
Assets |
|
|
|
|
|
|
|
CURRENT ASSETS |
|
|
|
|
|
|
|
Cash and cash equivalents |
| $ | 33,092 |
| $ | 31,021 |
|
Short-term investments |
|
| — |
|
| 14,250 |
|
Receivables: |
|
|
|
|
|
|
|
Trade, less allowances for doubtful accounts and returns ($3,264 in 2007 and $3,347 in 2006) |
|
| 126,520 |
|
| 115,146 |
|
Other, net |
|
| 971 |
|
| 1,180 |
|
Net receivables |
|
| 127,491 |
|
| 116,326 |
|
Inventories |
|
| 64,027 |
|
| 60,978 |
|
Prepaid expenses |
|
| 7,549 |
|
| 4,531 |
|
Deferred income taxes, current portion |
|
| 8,076 |
|
| 8,298 |
|
Other current assets |
|
| 489 |
|
| — |
|
Total current assets |
|
| 240,724 |
|
| 235,404 |
|
Property, plant and equipment |
|
| 263,643 |
|
| 244,283 |
|
Accumulated depreciation |
|
| (167,092 | ) |
| (161,448 | ) |
Property, plant and equipment, net |
|
| 96,551 |
|
| 82,835 |
|
Deferred income taxes, long-term portion |
|
| 2,670 |
|
| 1,574 |
|
Goodwill |
|
| 29,053 |
|
| 26,298 |
|
Intangible assets, net |
|
| 5,500 |
|
| 4,581 |
|
Other assets |
|
| 7,572 |
|
| 3,558 |
|
Total assets |
| $ | 382,070 |
| $ | 354,250 |
|
Liabilities and Shareholders’ Equity |
|
|
|
|
|
|
|
CURRENT LIABILITIES |
|
|
|
|
|
|
|
Current debt |
| $ | 2,127 |
| $ | 1,812 |
|
Accounts payable |
|
| 31,146 |
|
| 31,326 |
|
Employee compensation and benefits |
|
| 29,699 |
|
| 32,374 |
|
Income taxes payable |
|
| 2,391 |
|
| 710 |
|
Other current liabilities |
|
| 31,310 |
|
| 28,582 |
|
Total current liabilities |
|
| 96,673 |
|
| 94,804 |
|
LONG-TERM LIABILITIES |
|
|
|
|
|
|
|
Long-term debt |
|
| 2,470 |
|
| 1,907 |
|
Employee-related benefits |
|
| 23,615 |
|
| 27,081 |
|
Deferred income taxes, long-term portion |
|
| 752 |
|
| 794 |
|
Other liabilities |
|
| 6,129 |
|
| — |
|
Total long-term liabilities |
|
| 32,966 |
|
| 29,782 |
|
Total liabilities |
|
| 129,639 |
|
| 124,586 |
|
COMMITMENTS AND CONTINGENCIES (Note 12) |
|
|
|
|
|
|
|
SHAREHOLDERS’ EQUITY |
|
|
|
|
|
|
|
Preferred stock of $0.02 par value per share, authorized 1,000,000; none issued |
|
| — |
|
| — |
|
Common stock of $0.375 par value per share, authorized 60,000,000; issued and |
|
|
|
|
|
|
|
outstanding 18,499,458 shares in 2007 and 18,753,648 in 2006 |
|
| 6,937 |
|
| 7,045 |
|
Additional paid-in capital |
|
| 8,265 |
|
| 14,223 |
|
Retained earnings |
|
| 233,527 |
|
| 210,457 |
|
Accumulated other comprehensive income |
|
| 5,507 |
|
| 647 |
|
Receivable from ESOP |
|
| (1,805 | ) |
| (2,708 | ) |
Total shareholders’ equity |
|
| 252,431 |
|
| 229,664 |
|
Total liabilities and shareholders’ equity |
| $ | 382,070 |
| $ | 354,250 |
|
See accompanying Notes to Consolidated Financial Statements.
19
| December 31 | 2008 | 2007 | ||||||
| Assets | ||||||||
| CURRENT ASSETS | ||||||||
| Cash and Cash Equivalents | $ | 29,285 | $ | 33,092 | ||||
| Receivables: | ||||||||
| Trade, less Allowances for Doubtful Accounts and Returns ($7,319 in 2008 and $3,264 in 2007) | 120,331 | 126,520 | ||||||
| Other | 3,481 | 971 | ||||||
| Net Receivables | 123,812 | 127,491 | ||||||
| Inventories | 66,828 | 64,027 | ||||||
| Prepaid Expenses | 18,131 | 7,549 | ||||||
| Deferred Income Taxes, Current Portion | 12,048 | 8,076 | ||||||
| Other Current Assets | 315 | 489 | ||||||
| Total Current Assets | 250,419 | 240,724 | ||||||
| Property, Plant and Equipment | 278,812 | 263,643 | ||||||
| Accumulated Depreciation | (175,082 | ) | (167,092 | ) | ||||
| Property, Plant and Equipment, Net | 103,730 | 96,551 | ||||||
| Deferred Income Taxes, Long-Term Portion | 6,388 | 2,670 | ||||||
| Goodwill | 62,095 | 29,053 | ||||||
| Intangible Assets, Net | 28,741 | 5,500 | ||||||
| Other Assets | 5,231 | 7,572 | ||||||
| Total Assets | $ | 456,604 | $ | 382,070 | ||||
| Liabilities and Shareholders' Equity | ||||||||
| CURRENT LIABILITIES | ||||||||
| Current Debt | $ | 3,946 | $ | 2,127 | ||||
| Accounts Payable | 26,536 | 31,146 | ||||||
| Employee Compensation and Benefits | 23,334 | 29,699 | ||||||
| Income Taxes Payable | 3,154 | 2,391 | ||||||
| Other Current Liabilities | 50,189 | 31,310 | ||||||
| Total Current Liabilities | 107,159 | 96,673 | ||||||
| LONG-TERM LIABILITIES | ||||||||
| Long-Term Debt | 91,393 | 2,470 | ||||||
| Employee-Related Benefits | 29,059 | 23,615 | ||||||
| Deferred Income Taxes, Long-Term Portion | 11,671 | 752 | ||||||
| Other Liabilities | 7,418 | 6,129 | ||||||
| Total Long-Term Liabilities | 139,541 | 32,966 | ||||||
| Total Liabilities | 246,700 | 129,639 | ||||||
| COMMITMENTS AND CONTINGENCIES (Note 13) | ||||||||
| SHAREHOLDERS’ EQUITY | ||||||||
| Preferred Stock of $0.02 par value per share, 1,000,000 shares authorized; no shares issued or outstanding | - | - | ||||||
| Common Stock, $0.375 par value per share, 60,000,000 shares authorized; 18,284,746 | ||||||||
| and 18,499,458 issued and outstanding, respectively | 6,857 | 6,937 | ||||||
| Additional Paid-In Capital | 6,649 | 8,265 | ||||||
| Retained Earnings | 223,692 | 233,527 | ||||||
| Accumulated Other Comprehensive Income (Loss) | (26,391 | ) | 5,507 | |||||
| Receivable from ESOP | (903 | ) | (1,805 | ) | ||||
| Total Shareholders’ Equity | 209,904 | 252,431 | ||||||
| Total Liabilities and Shareholders’ Equity | $ | 456,604 | $ | 382,070 | ||||
| See accompanying Notes to Consolidated Financial Statements. | ||||||||
|
|
|
|
|
|
|
|
|
|
|
Years ended December 31 |
| 2007 |
| 2006 |
| 2005 |
| |||
CASH FLOWS RELATED TO OPERATING ACTIVITIES |
|
|
|
|
|
|
|
|
|
|
Net earnings |
| $ | 39,867 |
| $ | 29,809 |
| $ | 22,936 |
|
Adjustments to net earnings to arrive at operating cash flow: |
|
|
|
|
|
|
|
|
|
|
Depreciation |
|
| 16,901 |
|
| 13,711 |
|
| 12,950 |
|
Amortization |
|
| 1,153 |
|
| 610 |
|
| 89 |
|
Deferred tax (benefit) expense |
|
| (1,510 | ) |
| (70 | ) |
| (465 | ) |
Stock-based compensation expense |
|
| 2,886 |
|
| 3,521 |
|
| 2,015 |
|
ESOP expense |
|
| (659 | ) |
| 112 |
|
| 580 |
|
Tax benefit on ESOP and stock plans |
|
| 46 |
|
| 58 |
|
| 1,495 |
|
Provision for bad debts and returns |
|
| 1,690 |
|
| 532 |
|
| 1,021 |
|
Gain on sale of facility |
|
| (5,972 | ) |
| — |
|
| — |
|
Changes in operating assets and liabilities excluding the impact of acquisitions: |
|
|
|
|
|
|
|
|
|
|
Accounts receivable |
|
| (11,258 | ) |
| (9,790 | ) |
| (8,620 | ) |
Inventories |
|
| (82 | ) |
| (3,104 | ) |
| (59 | ) |
Accounts payable |
|
| (2,337 | ) |
| 3,308 |
|
| 3,397 |
|
Employee compensation and benefits and other accrued expenses |
|
| (4,069 | ) |
| 2,697 |
|
| 8,507 |
|
Income taxes payable/prepaid |
|
| 2,056 |
|
| (2,608 | ) |
| 221 |
|
Other current/noncurrent assets and liabilities |
|
| (2,131 | ) |
| (1,197 | ) |
| (1,883 | ) |
Other, net |
|
| 3,059 |
|
| 2,730 |
|
| 2,053 |
|
Net cash flows related to operating activities |
|
| 39,640 |
|
| 40,319 |
|
| 44,237 |
|
CASH FLOWS RELATED TO INVESTING ACTIVITIES |
|
|
|
|
|
|
|
|
|
|
Acquisition of property, plant and equipment |
|
| (28,720 | ) |
| (23,872 | ) |
| (20,880 | ) |
Proceeds from disposals of property, plant and equipment |
|
| 7,254 |
|
| 632 |
|
| 3,049 |
|
Acquisition of businesses, net of cash acquired, and intangible assets |
|
| (3,141 | ) |
| (8,469 | ) |
| — |
|
Purchases of short-term investments |
|
| (7,925 | ) |
| (14,250 | ) |
| — |
|
Sales of short-term investments |
|
| 22,175 |
|
| — |
|
| 6,050 |
|
Net cash flows related to investing activities |
|
| (10,357 | ) |
| (45,959 | ) |
| (11,781 | ) |
CASH FLOWS RELATED TO FINANCING ACTIVITIES |
|
|
|
|
|
|
|
|
|
|
Payments on capital leases |
|
| (2,505 | ) |
| (2,257 | ) |
| (885 | ) |
Payment of long-term debt |
|
| — |
|
| — |
|
| (5,000 | ) |
Proceeds from issuance of short-term debt |
|
| 205 |
|
| — |
|
| — |
|
Proceeds from issuance of common stock |
|
| 8,734 |
|
| 8,477 |
|
| 7,874 |
|
Tax benefit on stock plans |
|
| 3,255 |
|
| 1,334 |
|
| — |
|
Purchase of common stock |
|
| (28,951 | ) |
| (5,275 | ) |
| (3,471 | ) |
Dividends paid |
|
| (8,979 | ) |
| (8,574 | ) |
| (7,919 | ) |
Principal payment from ESOP |
|
| 1,562 |
|
| 1,419 |
|
| 1,290 |
|
Net cash flows related to financing activities |
|
| (26,679 | ) |
| (4,876 | ) |
| (8,111 | ) |
Effect of exchange rate changes on cash and cash equivalents |
|
| (533 | ) |
| 250 |
|
| 105 |
|
NET INCREASE (DECREASE) IN CASH AND CASH EQUIVALENTS |
|
| 2,071 |
|
| (10,266 | ) |
| 24,450 |
|
Cash and cash equivalents at beginning of year |
|
| 31,021 |
|
| 41,287 |
|
| 16,837 |
|
CASH AND CASH EQUIVALENTS AT END OF YEAR |
| $ | 33,092 |
| $ | 31,021 |
| $ | 41,287 |
|
SUPPLEMENTAL CASH FLOW INFORMATION |
|
|
|
|
|
|
|
|
|
|
Cash paid during the year for: |
|
|
|
|
|
|
|
|
|
|
Income taxes |
| $ | 14,543 |
| $ | 15,207 |
| $ | 9,076 |
|
Interest |
| $ | 479 |
| $ | 322 |
| $ | 638 |
|
Supplemental non-cash investing and financing activities: |
|
|
|
|
|
|
|
|
|
|
Capital expenditures funded through capital leases |
| $ | 2,441 |
| $ | 2,872 |
| $ | 2,553 |
|
Collateralized borrowings incurred for operating lease equipment |
| $ | 695 |
| $ | 427 |
| $ | 178 |
|
See accompanying Notes to
| Years ended December 31 | 2008 | 2007 | 2006 | |||||||||
| OPERATING ACTIVITIES | ||||||||||||
| Net Earnings | $ | 10,624 | $ | 39,867 | $ | 29,809 | ||||||
| Adjustments to Net Earnings to arrive at operating cash flow: | ||||||||||||
| Depreciation | 20,360 | 16,901 | 13,711 | |||||||||
| Amortization | 2,599 | 1,153 | 610 | |||||||||
| Deferred Tax (Benefit) Expense | (3,525 | ) | (1,510 | ) | (70 | ) | ||||||
| Stock-Based Compensation Expense (Benefit) | (1,227 | ) | 3,140 | 3,568 | ||||||||
| ESOP Expense | (498 | ) | (659 | ) | 112 | |||||||
| Tax Benefit on ESOP | 29 | 46 | 58 | |||||||||
| Allowance for Doubtful Accounts and Returns | 4,007 | 1,690 | 532 | |||||||||
| Gain on Sale of Facility | - | (5,972 | ) | - | ||||||||
| Other, Net | 7,623 | 3,059 | 2,730 | |||||||||
| Changes in Operating Assets and Liabilities, Excluding the Impact of Acquisitions: | ||||||||||||
| Accounts Receivable | 5,574 | (11,258 | ) | (9,790 | ) | |||||||
| Inventories | (3,311 | ) | (82 | ) | (3,104 | ) | ||||||
| Accounts Payable | (8,620 | ) | (2,337 | ) | 3,308 | |||||||
| Employee Compensation and Benefits and Other Accrued Expenses | 11,228 | (4,323 | ) | 2,650 | ||||||||
| Income Taxes Payable/Prepaid | (11,247 | ) | 2,056 | (2,608 | ) | |||||||
| Other Current/Noncurrent Assets and Liabilities | 3,930 | (2,131 | ) | (1,197 | ) | |||||||
| Net Cash Provided by (Used for) Operating Activities | 37,546 | 39,640 | 40,319 | |||||||||
| INVESTING ACTIVITIES | ||||||||||||
| Purchases of Property, Plant and Equipment | (20,790 | ) | (28,720 | ) | (23,872 | ) | ||||||
| Proceeds from Disposals of Property, Plant and Equipment | 656 | 7,254 | 632 | |||||||||
| Acquisition of Businesses, Net of Cash Acquired | (81,845 | ) | (3,141 | ) | (8,469 | ) | ||||||
| Purchases of Short-Term Investments | - | (7,925 | ) | (14,250 | ) | |||||||
| Sales of Short-Term Investments | - | 22,175 | - | |||||||||
| Net Cash Provided by (Used for) Investing Activities | (101,979 | ) | (10,357 | ) | (45,959 | ) | ||||||
| FINANCING ACTIVITIES | ||||||||||||
| Payments on Capital Leases | (4,495 | ) | (2,505 | ) | (2,257 | ) | ||||||
| Change in Short-Term Debt, Net | (1,039 | ) | 205 | - | ||||||||
| Payment of Long-Term Debt | (474 | ) | - | - | ||||||||
| Issuance of Long-Term Debt | 87,500 | - | - | |||||||||
| Purchases of Common Stock | (14,349 | ) | (28,951 | ) | (5,275 | ) | ||||||
| Proceeds from Issuances of Common Stock | 1,872 | 8,734 | 8,477 | |||||||||
| Tax Benefit on Stock Plans | 892 | 3,255 | 1,334 | |||||||||
| Dividends Paid | (9,551 | ) | (8,979 | ) | (8,574 | ) | ||||||
| Principal Payment from ESOP | 1,719 | 1,562 | 1,419 | |||||||||
| Net Cash Provided by (Used for) Financing Activities | 62,075 | (26,679 | ) | (4,876 | ) | |||||||
| Effect of Exchange Rate Changes on Cash and Cash Equivalents | (1,449 | ) | (533 | ) | 250 | |||||||
| NET INCREASE (DECREASE) IN CASH AND CASH EQUIVALENTS | (3,807 | ) | 2,071 | (10,266 | ) | |||||||
| Cash and Cash Equivalents at Beginning of Year | 33,092 | 31,021 | 41,287 | |||||||||
| CASH AND CASH EQUIVALENTS AT END OF YEAR | $ | 29,285 | $ | 33,092 | $ | 31,021 | ||||||
| SUPPLEMENTAL CASH FLOW INFORMATION | ||||||||||||
| Cash Paid During the Year for: | ||||||||||||
| Income Taxes | $ | 15,329 | $ | 14,543 | $ | 15,207 | ||||||
| Interest | $ | 3,615 | $ | 479 | $ | 322 | ||||||
| Supplemental Non-Cash Investing and Financing Activities: | ||||||||||||
| Capital Expenditures Funded Through Capital Leases | $ | 4,823 | $ | 2,441 | $ | 2,872 | ||||||
| Collateralized Borrowings Incurred for Operating Lease Equipment | $ | 1,758 | $ | 696 | $ | 427 | ||||||
| See accompanying Notes to Consolidated Financial Statements. | ||||||||||||
20
Consolidated Statements of Shareholders’ Equity and Comprehensive Income(Loss)
|
|
|
|
|
|
|
|
|
|
|
|
|
|
|
|
|
|
|
|
Years ended December 31 |
| 2007 |
| 2006 |
| 2005 |
| ||||||||||||
|
|
|
| ||||||||||||||||
|
| Shares |
| Amount |
| Shares(1) |
| Amount |
| Shares |
| Amount |
| ||||||
|
|
|
|
|
|
| |||||||||||||
COMMON STOCK |
|
|
|
|
|
|
|
|
|
|
|
|
|
|
|
|
|
|
|
Beginning balance |
|
| 18,753,648 |
| $ | 7,045 |
|
| 9,191,205 |
| $ | 3,459 |
|
| 9,003,209 |
| $ | 3,388 |
|
Stock split |
|
| — |
|
| — |
|
| 9,305,523 |
|
| 3,490 |
|
| — |
|
| — |
|
Issue stock for directors, employee benefit and stock plans |
|
| 481,710 |
|
| 168 |
|
| 410,541 |
|
| 154 |
|
| 280,185 |
|
| 105 |
|
Purchase of common stock |
|
| (735,900 | ) |
| (276 | ) |
| (153,621 | ) |
| (58 | )(1) |
| (92,189 | ) |
| (34 | ) |
Ending balance |
|
| 18,499,458 |
| $ | 6,937 |
|
| 18,753,648 |
| $ | 7,045 |
|
| 9,191,205 |
| $ | 3,459 |
|
ADDITIONAL PAID-IN CAPITAL |
|
|
|
|
|
|
|
|
|
|
|
|
|
|
|
|
|
|
|
Beginning balance |
|
|
|
| $ | 14,223 |
|
|
|
| $ | 6,963 |
|
|
|
| $ | 163 |
|
Stock split |
|
|
|
|
| — |
|
|
|
|
| (3,490 | ) |
|
|
|
| — |
|
Issue stock for directors, employee benefit plans |
|
|
|
|
| 8,661 |
|
|
|
|
| 9,939 |
|
|
|
|
| 6,633 |
|
Share-based compensation |
|
|
|
|
| 2,753 |
|
|
|
|
| 4,694 |
|
|
|
|
| — |
|
Tax benefit on stock plans |
|
|
|
|
| 3,255 |
|
|
|
|
| 1,334 |
|
|
|
|
| 1,423 |
|
Purchase of common stock |
|
|
|
|
| (28,675 | ) |
|
|
|
| (5,217 | )(1) |
|
|
|
| (1,256 | ) |
Reclassification to Retained Earnings |
|
|
|
|
| 8,048 |
|
|
|
|
| — |
|
|
|
|
| — |
|
Ending balance |
|
|
|
| $ | 8,265 |
|
|
|
| $ | 14,223 |
|
|
|
| $ | 6,963 |
|
RETAINED EARNINGS |
|
|
|
|
|
|
|
|
|
|
|
|
|
|
|
|
|
|
|
Beginning balance |
|
|
|
| $ | 210,457 |
|
|
|
| $ | 189,221 |
|
|
|
| $ | 174,132 |
|
Net earnings |
|
|
|
|
| 39,867 |
|
|
|
|
| 29,809 |
|
|
|
|
| 22,936 |
|
Dividends paid, $0.48, $0.46 and $0.44, |
|
|
|
|
| (8,979 | ) |
|
|
|
| (8,574 | ) |
|
|
|
| (7,919 | ) |
Issue stock for employee benefit plans and directors |
|
|
|
|
| — |
|
|
|
|
| — |
|
|
|
|
| 2,181 |
|
Purchase of common stock |
|
|
|
|
| — |
|
|
|
|
| — |
|
|
|
|
| (2,181 | ) |
Tax benefit on ESOP |
|
|
|
|
| 46 |
|
|
|
|
| 58 |
|
|
|
|
| 72 |
|
Adjustment related to SFAS No. 158 adoption |
|
|
|
|
| — |
|
|
|
|
| (57 | ) |
|
|
|
| — |
|
Adjustment related to FIN No. 48 adoption |
|
|
|
|
| 184 |
|
|
|
|
| — |
|
|
|
|
| — |
|
Reclassification from Additional Paid-in Capital |
|
|
|
|
| (8,048 | ) |
|
|
|
| — |
|
|
|
|
| — |
|
Ending balance |
|
|
|
| $ | 233,527 |
|
|
|
| $ | 210,457 |
|
|
|
| $ | 189,221 |
|
ACCUMULATED OTHER |
|
|
|
|
|
|
|
|
|
|
|
|
|
|
|
|
|
|
|
Beginning balance |
|
|
|
| $ | 647 |
|
|
|
| $ | (2,931 | ) |
|
|
| $ | 864 |
|
Foreign currency translation adjustments |
|
|
|
|
| 2,630 |
|
|
|
|
| 2,763 |
|
|
|
|
| (2,813 | ) |
Prior service costs |
|
|
|
|
| (13 | ) |
|
|
|
| — |
|
|
|
|
| — |
|
Transition (asset) obligation |
|
|
|
|
| (14 | ) |
|
|
|
| — |
|
|
|
|
| — |
|
Net actuarial (gain) loss |
|
|
|
|
| 2,257 |
|
|
|
|
| 815 |
|
|
|
|
| — |
|
Minimum pension liability |
|
|
|
|
| — |
|
|
|
|
| — |
|
|
|
|
| (982 | ) |
Ending balance |
|
|
|
| $ | 5,507 |
|
|
|
| $ | 647 |
|
|
|
| $ | (2,931 | ) |
RECEIVABLE FROM ESOP |
|
|
|
|
|
|
|
|
|
|
|
|
|
|
|
|
|
|
|
Beginning balance |
|
|
|
| $ | (2,708 | ) |
|
|
| $ | (3,610 | ) |
|
|
| $ | (4,513 | ) |
Principal payments |
|
|
|
|
| 1,562 |
|
|
|
|
| 1,419 |
|
|
|
|
| 1,290 |
|
Shares allocated |
|
|
|
|
| (659 | ) |
|
|
|
| (517 | ) |
|
|
|
| (387 | ) |
Ending balance |
|
|
|
| $ | (1,805 | ) |
|
|
| $ | (2,708 | ) |
|
|
| $ | (3,610 | ) |
Total shareholders’ equity |
|
|
|
| $ | 252,431 |
|
|
|
| $ | 229,664 |
|
|
|
| $ | 193,102 |
|
(2) Reconciliations of net earnings |
|
|
|
|
|
|
|
|
|
|
|
|
|
|
|
|
|
|
|
Net earnings |
|
|
|
| $ | 39,867 |
|
|
|
| $ | 29,809 |
|
|
|
| $ | 22,936 |
|
Foreign currency translation adjustments |
|
|
|
|
| 2,630 |
|
|
|
|
| 2,763 |
|
|
|
|
| (2,813 | ) |
Defined benefit pension plans, net of tax: |
|
|
|
|
|
|
|
|
|
|
|
|
|
|
|
|
|
|
|
Prior service costs |
|
|
|
|
| (13 | ) |
|
|
|
| 274 |
|
|
|
|
| — |
|
Transition (asset) obligation |
|
|
|
|
| (14 | ) |
|
|
|
| 40 |
|
|
|
|
| — |
|
Net actuarial (gain) loss |
|
|
|
|
| 2,257 |
|
|
|
|
| 501 |
|
|
|
|
| — |
|
Minimum pension liability |
|
|
|
|
| — |
|
|
|
|
| — |
|
|
|
|
| (982 | ) |
Comprehensive income |
|
|
|
| $ | 44,727 |
|
|
|
| $ | 33,387 |
|
|
|
| $ | 19,141 |
|
| Common Shares | Common Stock | Additional Paid-in Capital | Retained Earnings | Accumulated Other Comprehensive Income (Loss) | Receivable from ESOP | Total Shareholders' Equity | ||||||||||||||||||||||
| Balance, December 31, 2005 | 9,191,205 | $ | 3,459 | $ | 6,963 | $ | 189,221 | $ | (2,931 | ) | $ | (3,610 | ) | $ | 193,102 | |||||||||||||
| Net Earnings | - | - | - | 29,809 | - | - | 29,809 | |||||||||||||||||||||
| Foreign Currency Translation Adjustments | - | - | - | - | 2,763 | - | 2,763 | |||||||||||||||||||||
| Pension Adjustments | - | - | - | - | 815 | - | 815 | |||||||||||||||||||||
| Comprehensive Income (Loss) | 33,387 | |||||||||||||||||||||||||||
| Stock Split | 9,305,523 | 3,490 | (3,490 | ) | - | - | - | - | ||||||||||||||||||||
Issue Stock for Directors, Employee Benefit and Stock Plans | 410,541 | 154 | 9,939 | - | - | - | 10,093 | |||||||||||||||||||||
| Share-Based Compensation | - | - | 4,694 | - | - | - | 4,694 | |||||||||||||||||||||
| Dividends Paid, $0.46 per Common Share | - | - | - | (8,574 | ) | - | - | (8,574 | ) | |||||||||||||||||||
| Tax Benefit on Stock Plans | - | - | 1,334 | - | - | - | 1,334 | |||||||||||||||||||||
| Tax Benefit on ESOP | - | - | - | 58 | - | - | 58 | |||||||||||||||||||||
| Adjustment Related to SFAS No. 158 Adoption | - | - | - | (57 | ) | - | - | (57 | ) | |||||||||||||||||||
| Purchases of Common Stock | (153,621 | ) | (58 | )(1) | (5,217 | )(1) | - | - | - | (5,275 | ) | |||||||||||||||||
| Principal Payments from ESOP | - | - | - | - | - | 1,419 | 1,419 | |||||||||||||||||||||
| Shares Allocated | - | - | - | - | - | (517 | ) | (517 | ) | |||||||||||||||||||
| Balance, December 31, 2006 | 18,753,648 | $ | 7,045 | $ | 14,223 | $ | 210,457 | $ | 647 | $ | (2,708 | ) | $ | 229,664 | ||||||||||||||
| Net Earnings | - | - | - | 39,867 | - | - | 39,867 | |||||||||||||||||||||
| Foreign Currency Translation Adjustments | - | - | - | - | 2,630 | - | 2,630 | |||||||||||||||||||||
| Pension Adjustments | - | - | - | - | 2,230 | - | 2,230 | |||||||||||||||||||||
| Comprehensive Income (Loss) | 44,727 | |||||||||||||||||||||||||||
Issue Stock for Directors, Employee Benefit and Stock Plans | 481,710 | 168 | 8,661 | - | - | - | 8,829 | |||||||||||||||||||||
| Share-Based Compensation | - | - | 2,753 | - | - | - | 2,753 | |||||||||||||||||||||
| Dividends paid, $0.48 per Common Share | - | - | - | (8,979 | ) | - | - | (8,979 | ) | |||||||||||||||||||
| Tax Benefit on Stock Plans | - | - | 3,255 | - | - | - | 3,255 | |||||||||||||||||||||
| Tax Benefit on ESOP | - | - | - | 46 | - | - | 46 | |||||||||||||||||||||
| Adjustment Related to FIN 48 Adoption | - | - | - | 184 | - | - | 184 | |||||||||||||||||||||
| Purchases of Common Stock | (735,900 | ) | (276 | ) | (28,675 | ) | - | - | - | (28,951 | ) | |||||||||||||||||
| Principal Payments from ESOP | - | - | - | - | - | 1,562 | 1,562 | |||||||||||||||||||||
| Shares Allocated | - | - | - | - | - | (659 | ) | (659 | ) | |||||||||||||||||||
| Reclassification | - | - | 8,048 | (8,048 | ) | - | - | - | ||||||||||||||||||||
| Balance, December 31, 2007 | 18,499,458 | $ | 6,937 | $ | 8,265 | $ | 233,527 | $ | 5,507 | $ | (1,805 | ) | $ | 252,431 | ||||||||||||||
| Net Earnings | - | - | - | 10,624 | - | - | 10,624 | |||||||||||||||||||||
| Foreign Currency Translation Adjustments | - | - | - | - | (26,455 | ) | - | (26,455 | ) | |||||||||||||||||||
| Pension Adjustments | - | - | - | - | (5,443 | ) | - | (5,443 | ) | |||||||||||||||||||
| Comprehensive Income (Loss) | (21,274 | ) | ||||||||||||||||||||||||||
Issue Stock for Directors, Employee Benefit and Stock Plans | 235,388 | 89 | 1,498 | - | - | - | 1,587 | |||||||||||||||||||||
| Share-Based Compensation | - | - | (763 | ) | - | - | - | (763 | ) | |||||||||||||||||||
| Dividends paid, $0.52 per Common Share | - | - | - | (9,551 | ) | - | - | (9,551 | ) | |||||||||||||||||||
| Tax Benefit on Stock Plans | - | - | 892 | - | - | - | 892 | |||||||||||||||||||||
| Tax Benefit on ESOP | - | - | - | 29 | - | - | 29 | |||||||||||||||||||||
| Purchases of Common Stock | (450,100 | ) | (169 | ) | (14,180 | ) | - | - | - | (14,349 | ) | |||||||||||||||||
| Principal Payments from ESOP | - | - | - | - | - | 1,719 | 1,719 | |||||||||||||||||||||
| Shares Allocated | - | - | - | - | - | (817 | ) | (817 | ) | |||||||||||||||||||
| Reclassification | - | - | 10,937 | (10,937 | ) | - | - | - | ||||||||||||||||||||
| Balance, December 31, 2008 | 18,284,746 | $ | 6,857 | $ | 6,649 | $ | 223,692 | $ | (26,391 | ) | $ | (903 | ) | $ | 209,904 | |||||||||||||
The company had 30,000,000 authorized shares of common stock as of December 31, 2005.
21
| 1. | |
| Summary of Significant Accounting Policies and Other Related Data |
CASH AND CASH EQUIVALENTS– We consider all highly liquid investments with maturities of three months or less from the date of purchase to be cash equivalents.
22
NOTES TO THE CONSOLIDATED FINANCIAL STATEMENTS
(In thousands, except shares and per share data)
Prior to the adoption of SFAS No. 123(R) on January 1, 2006, we accounted for stock-based compensation using the intrinsic value method prescribed in Accounting Principles Board (“APB”) Opinion No. 25, “Accounting for Stock Issued to Employees.” As we adopted SFAS No. 123(R) using the modified prospective approach, prior period net earnings
The pro forma effects of recognizing the estimated fair value of stock-based compensation as previously calculated under SFAS No. 123 for the year ended December 31, 2005 is summarized below:Development
|
|
|
|
|
|
| 2005 |
| |
Net earnings – as reported |
| $ | 22,936 |
|
Add: |
|
|
|
|
| ||||
Share-based compensation expense determined under |
|
|
|
|
intrinsic value method included in net earnings, net of |
|
|
|
|
related tax effects |
|
| 913 |
|
Deduct: |
|
|
|
|
| ||||
Share-based employee compensation expense |
|
|
|
|
determined under fair value-based method, net of related |
|
|
|
|
tax effects |
|
| (2,130 | ) |
Pro forma net earnings |
| $ | 21,719 |
|
Basic earnings per share: |
|
|
|
|
As reported |
| $ | 1.27 |
|
Pro forma |
| $ | 1.21 |
|
Diluted earnings per share: |
|
|
|
|
As reported |
| $ | 1.26 |
|
Pro forma |
| $ | 1.19 |
|
RESEARCH AND DEVELOPMENT– Research and development costs are expensed as incurred.
NEWLY ADOPTED ACCOUNTING PRONOUNCEMENTS –
| 2. | Newly Adopted Accounting Pronouncements |
In June 2006, the FASB issued Interpretation No. 48,06-11, “Accounting for Uncertainty in Income Taxes”Tax Benefits of Dividends on Share-Based Payment Awards” (“FIN No. 48”). FIN No. 48 clarifies the accounting for income taxes by prescribing the minimum recognition threshold a tax position is required to meet before being recognized in the Consolidated Financial Statements. FIN 48 also provides guidance on derecognition, measurement, classification, interest and penalties, accounting in interim periods, disclosure and transition. We adopted FIN No. 48 asEITF
| 3. | |
| Management Actions |
| Severance, Early Retirement and Related Costs | ||||
| 2008 workforce reduction action | $ | 14,261 | ||
| Cash payments | (355 | ) | ||
| Foreign currency adjustments | 5 | |||
| December 31, 2008 balance | $ | 13,911 | ||
|
|
|
|
|
|
| Severance, Early |
| |
2007 restructuring action |
| $ | 2,194 |
|
Cash payments |
|
| (836 | ) |
Foreign currency adjustments |
|
| 31 |
|
December 31, 2007 balance |
| $ | 1,389 |
|
| Severance, Early Retirement and Related Costs | ||||
| 2007 restructuring action | $ | 2,194 | ||
| Cash payments | (836 | ) | ||
| Foreign currency adjustments | 31 | |||
| December 31, 2007 balance | $ | 1,389 | ||
| 2008 utilization: | ||||
| Cash payments | (1,303 | ) | ||
| Foreign currency adjustments | 5 | |||
| Change in estimate | (91 | ) | ||
| December 31, 2008 balance | $ | - | ||
| 4. | |
|
|
In February 2007,
| Net tangible assets acquired | $ | 3,314 | ||
| Identified intangible assets | 34,654 | |||
| Goodwill | 43,877 | |||
| Total purchase price, net of cash acquired | $ | 81,845 |
| 2008 | 2007 | |||||||
| Pro forma net sales | $ | 708,231 | $ | 711,451 | ||||
| Pro forma net earnings | 10,685 | 43,523 | ||||||
| Pro forma earnings per share: | ||||||||
| Basic | 0.58 | 2.38 | ||||||
| Diluted | 0.58 | 2.32 | ||||||
| Weighted average common shares outstanding: | ||||||||
| Basic | 18,303,137 | 18,640,882 | ||||||
| Diluted | 18,581,840 | 19,146,025 | ||||||
| 5. | |
| Inventories |
|
|
|
|
|
|
|
|
|
| 2007 |
| 2006 |
| ||
Inventories carried at LIFO: |
|
|
|
|
|
|
|
Finished goods |
| $ | 41,921 |
| $ | 36,513 |
|
Raw materials, production parts and work-in-process |
|
| 18,045 |
|
| 20,110 |
|
LIFO reserve |
|
| (27,858 | ) |
| (25,731 | ) |
Total LIFO inventories |
|
| 32,108 |
|
| 30,892 |
|
|
|
|
|
|
|
|
|
Inventories carried at FIFO: |
|
|
|
|
|
|
|
Finished goods |
|
| 22,369 |
|
| 21,387 |
|
Raw materials, production parts and work-in-process |
|
| 9,550 |
|
| 8,699 |
|
Total FIFO inventories |
|
| 31,919 |
|
| 30,086 |
|
|
|
|
|
|
|
|
|
Total inventories |
| $ | 64,027 |
| $ | 60,978 |
|
| 2008 | 2007 | |||||||
| Inventories carried at LIFO: | ||||||||
| Finished goods | $ | 52,289 | $ | 41,921 | ||||
Raw materials, production parts and work-in-process | 17,468 | 18045 | ||||||
| LIFO reserve | (32,481 | ) | (27,858 | ) | ||||
| Total LIFO inventories | 37,276 | 32,108 | ||||||
| Inventories carried at FIFO: | ||||||||
| Finished goods | 17,200 | 22,369 | ||||||
Raw materials, production parts and work-in-process | 12,352 | 9,550 | ||||||
| Total FIFO inventories | 29,552 | 31,919 | ||||||
| Total Inventories | $ | 66,828 | $ | 64,027 | ||||
| 6. | |
| Property, Plant and Equipment |
|
|
|
|
|
|
|
|
|
| 2007 |
| 2006 |
| ||
Land |
| $ | 4,432 |
| $ | 3,177 |
|
Buildings and improvements |
|
| 43,143 |
|
| 36,600 |
|
Machinery and equipment |
|
| 206,867 |
|
| 188,103 |
|
Work in progress |
|
| 9,201 |
|
| 16,403 |
|
Total property, plant and equipment |
|
| 263,643 |
|
| 244,283 |
|
Less accumulated depreciation |
|
| (167,092 | ) |
| (161,448 | ) |
Net property, plant and equipment |
|
| 96,551 |
|
| 82,835 |
|
| 2008 | 2007 | |||||||
| Land | $ | 4,416 | $ | 4,432 | ||||
| Buildings and improvements | 47,179 | 43,143 | ||||||
| Machinery and equipment | 221,814 | 206,867 | ||||||
| Work in progress | 5,403 | 9,201 | ||||||
Total Property, Plant and Equipment | 278,812 | 263,643 | ||||||
| Less: Accumulated Depreciation | (175,082 | ) | (167,092 | ) | ||||
Net Property, Plant and Equipment | $ | 103,730 | $ | 96,551 | ||||
|
|
$5,972.
|
|
|
|
|
|
|
|
|
| 2007 |
| 2006 |
| ||
Beginning balance |
| $ | 26,298 |
| $ | 22,253 |
|
Additions |
|
| 1,721 |
|
| 2,787 |
|
Foreign currency fluctuations |
|
| 1,034 |
|
| 1,258 |
|
Ending balance |
| $ | 29,053 |
| $ | 26,298 |
|
The balances of acquired intangible assets, excluding goodwill, as of December 31, are as follows:
|
|
|
|
|
|
|
|
|
|
|
|
|
|
|
| Customer |
| Trade |
| Technology |
| Total |
| ||||
Balance as of |
|
|
|
|
|
|
|
|
|
|
|
|
|
December 31, 2006 |
|
|
|
|
|
|
|
|
|
|
|
|
|
Original cost |
| $ | 3,147 |
| $ | 295 |
| $ | 1,900 |
| $ | 5,342 |
|
Accumulated |
|
|
|
|
|
|
|
|
|
|
|
|
|
amortization |
|
| (608 | ) |
| (233 | ) |
| (147 | ) |
| (988 | ) |
Foreign currency |
|
|
|
|
|
|
|
|
|
|
|
|
|
fluctuations |
|
| 235 |
|
| (15 | ) |
| 7 |
|
| 227 |
|
Carrying value |
| $ | 2,774 |
| $ | 47 |
| $ | 1,760 |
| $ | 4,581 |
|
Weighted-average |
|
|
|
|
|
|
|
|
|
|
|
|
|
original life (in years) |
|
| 14 |
|
| 4 |
|
| 10 |
|
|
|
|
|
|
|
| ||||||||||
|
|
|
|
|
|
|
|
|
|
|
|
|
|
Balance as of |
|
|
|
|
|
|
|
|
|
|
|
|
|
December 31, 2007 |
|
|
|
|
|
|
|
|
|
|
|
|
|
Original cost |
| $ | 3,961 |
| $ | 295 |
| $ | 1,900 |
| $ | 6,156 |
|
Accumulated |
|
|
|
|
|
|
|
|
|
|
|
|
|
amortization |
|
| (593 | ) |
| (295 | ) |
| (452 | ) | $ | (1,340 | ) |
Foreign currency |
|
|
|
|
|
|
|
|
|
|
|
|
|
fluctuations |
|
| 510 |
|
| — |
|
| 174 |
| $ | 684 |
|
Carrying value |
| $ | 3,878 |
| $ | — |
| $ | 1,622 |
| $ | 5,500 |
|
Weighted-average |
|
|
|
|
|
|
|
|
|
|
|
|
|
original life (in years) |
|
| 14 |
|
| 4 |
|
| 10 |
|
|
|
|
|
|
|
| ||||||||||
Amortization expense on intangible assets was $821, $675 and $165 for the years ended December 31, 2007, 2006, and 2005, respectively.
24
| 7. | Goodwill and Intangible Assets |
| 2008 | 2007 | |||||||
| Beginning balance | $ | 29,053 | $ | 26,298 | ||||
| Additions | 43,877 | 1,721 | ||||||
| Foreign currency fluctuations | (10,835 | ) | 1,034 | |||||
| Ending balance | $ | 62,095 | $ | 29,053 | ||||
| Customer | ||||||||||||||||
| Lists, Service | ||||||||||||||||
| Contracts and | Trade | |||||||||||||||
| Order Book | Name | Technology | Total | |||||||||||||
Balance as of December 31, 2008 | ||||||||||||||||
| Original cost | $ | 29,866 | $ | 6,659 | $ | 4,285 | $ | 40,810 | ||||||||
Accumulated amortization | (2,463 | ) | (573 | ) | (847 | ) | (3,883 | ) | ||||||||
Foreign currency fluctuations | (6,067 | ) | (1,633 | ) | (486 | ) | (8,186 | ) | ||||||||
| Carrying amount | $ | 21,336 | $ | 4,453 | $ | 2,952 | $ | 28,741 | ||||||||
Weighted-average original life (in years) | 14 | 3 | 12 | |||||||||||||
Balance as of December 31, 2007 | ||||||||||||||||
| Original cost | $ | 3,961 | $ | 295 | $ | 1,900 | $ | 6,156 | ||||||||
Accumulated amortization | (593 | ) | (295 | ) | (452 | ) | (1,340 | ) | ||||||||
Foreign currency fluctuations | 510 | - | 174 | 684 | ||||||||||||
| Carrying amount | $ | 3,878 | $ | - | $ | 1,622 | $ | 5,500 | ||||||||
Weighted-average original life (in years) | 14 | 4 | 10 | |||||||||||||
The additions to goodwill
per share data)
|
|
|
|
|
2008 |
| $ | 617 |
|
2009 |
|
| 552 |
|
2010 |
|
| 550 |
|
2011 |
|
| 548 |
|
2012 |
|
| 524 |
|
Thereafter |
|
| 2,709 |
|
Total |
| $ | 5,500 |
|
| 2009 | $ | 2,766 | ||
| 2010 | 2,766 | |||
| 2011 | 2,760 | |||
| 2012 | 2,762 | |||
| 2013 | 1,695 | |||
| Thereafter | 15,992 | |||
| Total | $ | 28,741 |
| 8. | |
|
|
| 2008 | 2007 | |||||||
| Short-term borrowings | ||||||||
| Bank borrowings | $ | - | $ | 205 | ||||
| Long-Term Debt | ||||||||
| Bank borrowings | 87,563 | - | ||||||
Collateralized borrowings | 1,758 | 696 | ||||||
Capital lease obligations | 6,018 | 3,696 | ||||||
| Total Long-Term Debt | 95,339 | 4,597 | ||||||
| Less: current portion | 3,946 | 2,127 | ||||||
| Long-term portion | $ | 91,393 | $ | 2,470 | ||||
|
|
|
|
|
|
|
|
|
|
|
|
|
|
|
|
|
|
| Maturity |
| Interest Rates |
| Outstanding |
| |||||||||
|
| Dates |
| 2007 |
| 2006 |
| 2007 |
| 2006 |
| |||||
Short term debt |
|
| 2008 |
|
| 6.21% |
|
| — |
| $ | 205 |
| $ | — |
|
Collateralized borrowings |
|
| 2008 - 2011 |
|
| 2.94% |
|
| 2.94 - 4.50% |
|
| 696 |
|
| 371 |
|
Capital lease obligations |
|
| 2008 - 2011 |
|
| 4.50 - 7.00% |
|
| 4.50 - 7.00% |
|
| 3,696 |
|
| 3,348 |
|
Total outstanding debt |
|
|
|
|
|
|
|
|
|
|
| 4,597 |
|
| 3,719 |
|
Less: current portion |
|
|
|
|
|
|
|
|
|
|
| 2,127 |
|
| 1,812 |
|
Long-term portion |
|
|
|
|
|
|
|
|
|
| $ | 2,470 |
| $ | 1,907 |
|
2008 and $205 in short-term borrowings at December 31, 2007. The aggregate maturities of our outstanding debt including capital lease obligations as ofweighted average interest rate on short-term borrowings at December 31, 2007 are as follows:
|
|
|
|
|
2008 |
| $ | 2,127 |
|
2009 |
|
| 1,747 |
|
2010 |
|
| 708 |
|
2011 |
|
| 15 |
|
2012 |
|
| — |
|
Thereafter |
|
| — |
|
Total |
| $ | 4,597 |
|
Collateralized borrowings represent deferred sales proceeds on certain leasing transactions with third-party leasing companies. These transactions are accounted for as borrowings in accordance with SFAS No. 13, with the related assets capitalized as property, plant and equipment and depreciated straight-line over the lease term.
Capital lease obligations outstanding are primarily related to sale-leaseback transactions with third-party leasing companies whereby we sell our manufactured equipment to the leasing company and lease it back. The equipment covered by these leases is rented to our customers over the lease term.
was 6.21%.
2008. The weighted average interest rate on outstanding borrowings at December 31, 2008 was 0.88%. Commitment fees on unused lines of credit for the year ended December 31, 2008 were $118.
The fee for committed funds under the Credit Agreement ranges from an annual rate of 0.08% to 0.225%, depending on our leverage ratio. Borrowings under the Credit Agreement generally bear interest at an annual rate of, at our option, either (i) between LIBOR plus 0.32% to LIBOR plus 1.025%, depending on our leverage ratio, or (ii) the higher of (A) the prime rate or (B) the federal funds rate plus 0.50%.
The Credit Agreement contains customary representations, warranties and covenants, including but not limited to covenants restricting our ability to incur indebtedness and liens and to merge or consolidate with another entity. Further, the Credit Agreement contains a covenant requiring us to maintain an indebtedness to EBITDA ratio as of the end of each quarter of not greater than 3.5 to 1, and to maintain an EBITDA to interest expense ratio of no less than 3.5 to 1. The Credit Agreement also restricts us from paying dividends or repurchasing stock in an amount that exceeds $50,000 during any fiscal year if, after giving effect to such payments, our leverage ratio would exceed 2.5 to 1. We were in compliance with all such covenants atas of December 31, 2007.
2008.
25
NOTES TO THE CONSOLIDATED FINANCIAL STATEMENTS
(In thousands, except shares2.5 to 1 as of the end of each month and per share data)an EBIT to total interest ratio of 2 to 1 as of the end of each quarter. We were in compliance with all such covenants at December 31, 2008. There was no balance outstanding on this facility at December 31, 2008.
| 2009 | $ | 4,252 | ||
| 2010 | 2,553 | |||
| 2011 | 1,290 | |||
| 2012 | 87,711 | |||
| 2013 | 10 | |||
| Thereafter | - | |||
| Total minimum obligations | $ | 95,816 | ||
| Less: amount representing interest | (477 | ) | ||
| Total | $ | 95,339 |
| 9. | Other Current Liabilities |
|
Other current liabilities at December 31, consisted of the following:
|
|
|
|
|
|
|
|
|
| 2007 |
| 2006 |
| ||
Taxes, other than income taxes |
| $ | 3,390 |
| $ | 3,224 |
|
Warranty |
|
| 6,950 |
|
| 6,868 |
|
Deferred revenue |
|
| 2,560 |
|
| 2,664 |
|
Rebates |
|
| 5,173 |
|
| 4,681 |
|
Other |
|
| 13,237 |
|
| 11,145 |
|
Total |
| $ | 31,310 |
| $ | 28,582 |
|
| 2008 | 2007 | |||||||
| Taxes, other than income taxes | $ | 2,936 | $ | 3,390 | ||||
| Warranty | 6,018 | 6,950 | ||||||
| Deferred revenue | 3,662 | 2,560 | ||||||
| Rebates | 5,014 | 5,173 | ||||||
| Restructuring | 13,911 | 1,389 | ||||||
| Miscellaneous accrued expenses | 10,465 | 7,467 | ||||||
| Other | 8,183 | 4,381 | ||||||
| Total | $ | 50,189 | $ | 31,310 | ||||
|
|
|
|
|
|
|
|
|
|
|
|
| 2007 |
| 2006 |
| 2005 |
| |||
Beginning balance |
| $ | 6,868 |
| $ | 6,146 |
| $ | 6,180 |
|
Additions charged to expense |
|
| 7,740 |
|
| 8,258 |
|
| 7,668 |
|
Changes in estimates |
|
| (45 | ) |
| 153 |
|
| (398 | ) |
Acquired reserves |
|
| — |
|
| 89 |
|
| — |
|
Foreign currency |
|
| 193 |
|
| 135 |
|
| (122 | ) |
Claims paid |
|
| (7,806 | ) |
| (7,913 | ) |
| (7,182 | ) |
Ending balance |
| $ | 6,950 |
| $ | 6,868 |
| $ | 6,146 |
|
| 2008 | 2007 | 2006 | ||||||||||
| Beginning balance | $ | 6,950 | $ | 6,868 | $ | 6,146 | ||||||
| Product warranty provision | 8,157 | 7,695 | 8,411 | |||||||||
| Acquired reserves | 192 | - | 89 | |||||||||
| Foreign currency | (88 | ) | 193 | 135 | ||||||||
| Claims paid | (9,193 | ) | (7,806 | ) | (7,913 | ) | ||||||
| Ending balance | $ | 6,018 | $ | 6,950 | $ | 6,868 | ||||||
| 10. | |
| Fair Value of Financial Instruments |
| § | Level 1: Observable inputs such as quoted prices (unadjusted) in active markets for identical assets or liabilities. |
| § | Level 2: Inputs other than quoted prices that are observable for the asset or liability, either directly or indirectly. These include quoted prices for similar assets or liabilities in active markets and quoted prices for identical or similar assets or liabilities in markets that are not active. |
| § | Level 3: Unobservable inputs that reflect the reporting entity’s own assumptions. |
| Fair value | Level 1 | Level 2 | Level 3 | |||||||||||||
| Assets: | ||||||||||||||||
| Cash and Cash Equivalents | $ | 29,285 | $ | 29,285 | $ | - | $ | - | ||||||||
Foreign currency forward exchange contracts | 346 | - | 346 | - | ||||||||||||
| Total Assets | $ | 29,631 | $ | 29,285 | $ | 346 | $ | - | ||||||||
| Liabilities: | ||||||||||||||||
| Long-Term Debt | 91,393 | - | 91,393 | - | ||||||||||||
| Total Liabilities | $ | 91,393 | $ | - | $ | 91,393 | $ | - | ||||||||
| 11. | |
| Retirement Benefit Plans |
2008.
2009.
|
|
|
|
|
|
|
|
|
| 2007 |
| 2006 |
| ||
Equity securities |
|
| 57 | % |
| 56 | % |
Debt securities |
|
| 39 | % |
| 40 | % |
Other |
|
| 4 | % |
| 4 | % |
Total |
|
| 100 | % |
| 100 | % |
| 2008 | 2007 | |||||||
| Equity securities | 49 | % | 57 | % | ||||
| Debt securities | 47 | % | 39 | % | ||||
| Other | 4 | % | 4 | % | ||||
| Total | 100 | % | 100 | % | ||||
26
NOTES TO THE CONSOLIDATED FINANCIAL STATEMENTS
(In thousands, except shares and per share data)
Weighted-average assumptions used to determine benefit obligations as of December 31 are as follows:
|
|
|
|
|
|
|
|
|
|
|
|
|
|
|
| Pension Benefits |
| Postretirement |
| ||||||||
|
| 2007 |
| 2006 |
| 2007 |
| 2006 |
| ||||
Discount rate |
| 6.42% |
| 5.77% |
| 6.60% |
| 6.00% |
| ||||
Rate of compensation increase |
| 4.16% |
| 4.11% |
| — |
| — |
| ||||
| Postretirement | ||||||||||||||||
| Pension Benefits | Medical Benefits | |||||||||||||||
| 2008 | 2007 | 2008 | 2007 | |||||||||||||
| Discount rate | 6.78 | % | 6.42 | % | 6.90 | % | 6.60 | % | ||||||||
| Rate of compensation increase | 4.07 | % | 4.16 | % | - | - | ||||||||||
|
|
|
|
|
|
|
|
|
|
|
|
|
|
|
| Pension Benefits |
| Postretirement |
| ||||||||
|
| 2007 |
| 2006 |
| 2007 |
| 2006 |
| ||||
Discount rate |
| 5.77% |
| 5.62% |
| 6.00% |
| 5.80% |
| ||||
Expected long-term rate of |
| ||||||||||||
return on plan assets |
| 8.19% |
| 8.24% |
| — |
| — |
| ||||
Rate of compensation increase |
| 4.11% |
| 4.05% |
| — |
| — |
| ||||
| Postretirement | ||||||||||||||||
| Pension Benefits | Medical Benefits | |||||||||||||||
| 2008 | 2007 | 2008 | 2007 | |||||||||||||
| Discount rate | 6.42 | % | 5.77 | % | 6.60 | % | 6.00 | % | ||||||||
Expected long-term rate of return on plan assets | 8.16 | % | 8.19 | % | - | - | ||||||||||
| Rate of compensation increase | 4.16 | % | 4.11 | % | - | - | ||||||||||
|
|
|
|
|
|
|
|
|
| 2007 |
| 2006 |
| ||
U.S. defined benefit plans |
| $ | 29,758 |
| $ | 28,539 |
|
U.K. Pension Plan |
|
| 7,801 |
|
| 8,615 |
|
German Pension Plan |
|
| 731 |
|
| 786 |
|
| 2008 | 2007 | |||||||
| U.S. defined benefit plans | $ | 30,154 | $ | 29,758 | ||||
| U.K. Pension Plan | 5,313 | 7,801 | ||||||
| German Pension Plan | 662 | 731 | ||||||
|
|
|
|
|
|
|
|
|
| 2007 |
| 2006 |
| ||
Projected benefit obligation |
| $ | 10,527 |
| $ | 11,475 |
|
Accumulated benefit obligation |
|
| 10,029 |
|
| 10,796 |
|
Fair value of plan assets |
|
| 7,356 |
|
| 6,755 |
|
| 2008 | 2007 | |||||||
| Projected benefit obligation | $ | 38,665 | $ | 10,527 | ||||
| Accumulated benefit obligation | 36,129 | 10,029 | ||||||
| Fair value of plan assets | 29,321 | 7,356 | ||||||
|
|
|
|
|
|
|
|
|
| 2007 |
| 2006 |
| ||
Healthcare cost trend rate assumption |
|
|
|
|
|
|
|
for the next year |
|
| 10.1 | % |
| 9.0 | % |
Rate to which the cost trend rate is |
|
|
|
|
|
|
|
assumed to decline (the ultimate trend rate) |
|
| 5.1 | % |
| 4.5 | % |
Year that the rate reaches the ultimate |
|
|
|
|
|
|
|
trend rate |
|
| 2028 |
|
| 2027 |
|
| 2008 | 2007 | |||||||
Healthcare cost trend rate assumption for the next year | 11.3 | % | 10.1 | % | ||||
Rate to which the cost trend rate is assumed to decline (the ultimate trend rate) | 5.0 | % | 5.1 | % | ||||
Year that the rate reaches the ultimate trend rate | 2029 | 2028 | ||||||
|
|
|
|
|
|
|
|
| |||||||
|
| 1-Percentage- |
| 1-Percentage- |
| ||||||||||
Effect on total of service |
|
|
|
|
|
|
| ||||||||
and interest cost components |
| $ | (74 | ) | $ | 86 |
| ||||||||
Effect on postretirement |
|
|
|
|
|
|
| ||||||||
benefit obligation |
| $ | (1,034 | ) | $ | 1,200 |
| ||||||||
27
| 1-Percentage- | 1-Percentage- | |||||||
| Point | Point | |||||||
| Decrease | Increase | |||||||
Effect on total of service and interest cost components | $ | (79 | ) | $ | 90 | |||
Effect on postretirement benefit obligation | $ | (972 | ) | $ | 1,116 | |||
|
|
|
|
|
|
|
|
|
|
|
|
|
|
|
| Pension Benefits |
| Postretirement Medical Benefits |
| ||||||||
|
|
| |||||||||||
|
| 2007 |
| 2006 |
| 2007 |
| 2006 |
| ||||
Change in benefit obligation: |
|
|
|
|
|
|
|
|
|
|
|
|
|
Benefit obligation at beginning of year |
| $ | 41,391 |
| $ | 40,628 |
| $ | 14,242 |
| $ | 15,027 |
|
Service cost |
|
| 1,014 |
|
| 1,039 |
|
| 142 |
|
| 152 |
|
Interest cost |
|
| 2,377 |
|
| 2,316 |
|
| 734 |
|
| 766 |
|
Plan participants’ contributions |
|
| 52 |
|
| 53 |
|
| — |
|
| — |
|
Plan amendments |
|
| — |
|
| — |
|
| — |
|
| (426 | ) |
Actuarial (gain) loss |
|
| (2,007 | ) |
| (551 | ) |
| (1,800 | ) |
| (305 | ) |
Foreign exchange |
|
| 220 |
|
| 938 |
|
| — |
|
| — |
|
Benefits paid |
|
| (1,675 | ) |
| (3,168 | ) |
| (555 | ) |
| (972 | ) |
Settlement loss |
|
| — |
|
| 136 |
|
| — |
|
| — |
|
Benefit obligation at end of year |
|
| 41,372 |
| $ | 41,391 |
| $ | 12,763 |
| $ | 14,242 |
|
Change in fair value of plan assets and net accrued liabilities: |
|
|
|
|
|
|
|
|
|
|
|
|
|
Fair value of plan assets at beginning of year |
| $ | 39,065 |
| $ | 35,730 |
| $ | — |
| $ | — |
|
Actual return on plan assets |
|
| 2,545 |
|
| 4,640 |
|
| — |
|
| — |
|
Employer contributions |
|
| 373 |
|
| 1,179 |
|
| 555 |
|
| 972 |
|
Plan participants’ contributions |
|
| 52 |
|
| 53 |
|
| — |
|
| — |
|
Foreign exchange |
|
| 96 |
|
| 631 |
|
| — |
|
| — |
|
Benefits paid |
|
| (1,675 | ) |
| (3,168 | ) |
| (555 | ) |
| (972 | ) |
Fair value of plan assets at end of year |
|
| 40,456 |
|
| 39,065 |
|
| — |
|
| — |
|
Funded status at end of year |
| $ | (916 | ) | $ | (2,326 | ) | $ | (12,763 | ) | $ | (14,242 | ) |
Amounts recognized in the consolidated balance sheets consisted of: |
|
|
|
|
|
|
|
|
|
|
|
|
|
Noncurrent assets |
| $ | 2,255 |
| $ | 2,394 |
| $ | — |
| $ | — |
|
Current liabilities |
|
| (169 | ) |
| (157 | ) |
| (816 | ) |
| (1,024 | ) |
Noncurrent liabilities |
|
| (3,002 | ) |
| (4,563 | ) |
| (11,947 | ) |
| (13,218 | ) |
Net accrued liability |
| $ | (916 | ) | $ | (2,326 | ) | $ | (12,763 | ) | $ | (14,242 | ) |
Amounts recognized in accumulated other comprehensive income consist of: |
|
|
|
|
|
|
|
|
|
|
|
|
|
Prior service cost |
| $ | 2,588 |
| $ | 3,150 |
| $ | (3,008 | ) | $ | (3,587 | ) |
Transition asset |
|
| (43 | ) |
| (65 | ) |
| — |
|
| — |
|
Net (gain) loss |
|
| (4,114 | ) |
| (2,499 | ) |
| 1,261 |
|
| 3,095 |
|
Accumulated other comprehensive income (loss) |
| $ | (1,569 | ) | $ | 586 |
| $ | (1,747 | ) | $ | (492 | ) |
28
| Pension Benefits | Postretirement Medical Benefits | |||||||||||||||
| 2008 | 2007 | 2008 | 2007 | |||||||||||||
| Change in benefit obligation: | ||||||||||||||||
| Benefit obligation at beginning of year | $ | 41,372 | $ | 41,391 | $ | 12,763 | $ | 14,242 | ||||||||
| Service cost | 895 | 1,014 | 128 | 142 | ||||||||||||
| Interest cost | 2,546 | 2,377 | 791 | 734 | ||||||||||||
| Plan participants' contributions | 35 | 52 | - | - | ||||||||||||
| Plan amendments | - | - | - | - | ||||||||||||
| Actuarial (gain) loss | (2,239 | ) | (2,007 | ) | (344 | ) | (1,800 | ) | ||||||||
| Foreign exchange | (2,073 | ) | 220 | - | - | |||||||||||
| Benefits paid | (1,871 | ) | (1,675 | ) | (858 | ) | (555 | ) | ||||||||
| Benefit obligation at end of year | $ | 38,665 | $ | 41,372 | $ | 12,480 | $ | 12,763 | ||||||||
| Change in fair value of plan assets and net accrued liabilities: | ||||||||||||||||
| Fair value of plan assets at beginning of year | $ | 40,456 | $ | 39,065 | $ | - | $ | - | ||||||||
| Actual return on plan assets | (7,835 | ) | 2,545 | - | - | |||||||||||
| Employer contributions | 432 | 373 | 858 | 555 | ||||||||||||
| Plan participants' contributions | 35 | 52 | - | - | ||||||||||||
| Foreign exchange | (1,896 | ) | 96 | - | - | |||||||||||
| Benefits paid | (1,871 | ) | (1,675 | ) | (858 | ) | (555 | ) | ||||||||
| Fair value of plan assets at end of year | 29,321 | 40,456 | - | - | ||||||||||||
| Funded status at end of year | $ | (9,344 | ) | $ | (916 | ) | $ | (12,480 | ) | $ | (12,763 | ) | ||||
| Amounts recognized in the consolidated balance sheets consisted of: | ||||||||||||||||
| Noncurrent assets | $ | - | $ | 2,255 | $ | - | $ | - | ||||||||
| Current liabilities | (166 | ) | (169 | ) | (927 | ) | (816 | ) | ||||||||
| Noncurrent liabilities | (9,178 | ) | (3,002 | ) | (11,553 | ) | (11,947 | ) | ||||||||
| Net accrued liability | $ | (9,344 | ) | $ | (916 | ) | $ | (12,480 | ) | $ | (12,763 | ) | ||||
| Amounts recognized in accumulated other comprehensive income consist of: | ||||||||||||||||
| Prior service cost | $ | 2,032 | $ | 2,588 | $ | (2,428 | ) | $ | (3,008 | ) | ||||||
| Transition asset | (20 | ) | (43 | ) | - | - | ||||||||||
| Net (gain) loss | 4,900 | (4,114 | ) | 919 | 1,261 | |||||||||||
| Accumulated other comprehensive income (loss) | $ | 6,912 | $ | (1,569 | ) | $ | (1,509 | ) | $ | (1,747 | ) | |||||
|
|
|
|
|
|
|
|
|
|
|
|
|
|
|
|
|
|
|
|
|
| Pension Benefits |
| Postretirement Medical Benefits |
| ||||||||||||||
|
|
| |||||||||||||||||
|
| 2007 |
| 2006 |
| 2005 |
| 2007 |
| 2006 |
| 2005 |
| ||||||
Service cost |
| $ | 1,014 |
| $ | 1,008 |
| $ | 1,129 |
| $ | 142 |
| $ | 152 |
| $ | 213 |
|
Interest cost |
|
| 2,377 |
|
| 2,252 |
|
| 2,113 |
|
| 734 |
|
| 766 |
|
| 839 |
|
Expected return on plan assets |
|
| (3,025 | ) |
| (2,943 | ) |
| (2,921 | ) |
| — |
|
| — |
|
| — |
|
Amortization actuarial (gain) loss |
|
| 88 |
|
| 71 |
|
| (155 | ) |
| 34 |
|
| 75 |
|
| 169 |
|
Amortization of transition obligation |
|
| (22 | ) |
| (22 | ) |
| (22 | ) |
| — |
|
| — |
|
| — |
|
Amortization of prior service cost |
|
| 562 |
|
| 567 |
|
| 570 |
|
| (580 | ) |
| (520 | ) |
| (520 | ) |
Settlement loss |
|
| — |
|
| 179 |
|
| — |
|
| — |
|
| — |
|
| — |
|
Foreign currency |
|
| 76 |
|
| 98 |
|
| (95 | ) |
| — |
|
| — |
|
| — |
|
Net periodic cost |
| $ | 1,070 |
| $ | 1,210 |
| $ | 619 |
| $ | 330 |
| $ | 473 |
| $ | 701 |
|
|
|
|
|
|
|
|
|
|
|
|
|
|
|
|
|
|
|
|
|
Changes in accumulated other comprehensive income: |
|
|
|
|
|
|
|
|
|
|
|
|
|
|
|
|
|
|
|
Incremental effect of adopting SFAS No. 158 |
|
| N/A |
| $ | (1,055 | ) |
| N/A |
|
| N/A |
| $ | (492 | ) |
| N/A |
|
Net (gain) loss |
|
| (1,527 | ) |
| 197 |
|
| N/A |
|
| (1,800 | ) |
| — |
|
| N/A |
|
Amortization of unrecognized prior service cost |
|
| (562 | ) |
| N/A |
|
| N/A |
|
| 580 |
|
| N/A |
|
| N/A |
|
Amortization of unrecognized prior transition (asset) obligation |
|
| 22 |
|
| N/A |
|
| N/A |
|
| — |
|
| N/A |
|
| N/A |
|
Amortization of unrecognized actuarial (gain) loss |
|
| (88 | ) |
| N/A |
|
| N/A |
|
| (34 | ) |
| N/A |
|
| N/A |
|
Total recognized in other comprehensive income |
| $ | (2,155 | ) | $ | (858 | ) |
| N/A |
| $ | (1,254 | ) | $ | (492 | ) |
| N/A |
|
Total recognized in net periodic benefit cost and other comprehensive income |
| $ | (1,085 | ) | $ | 352 |
|
| N/A |
| $ | (924 | ) | $ | (19 | ) |
| N/A |
|
|
|
|
|
|
|
|
|
|
|
|
|
|
|
|
|
|
|
|
|
| Pension Benefits | Postretirement Medical Benefits | |||||||||||||||||||||||
| 2008 | 2007 | 2006 | 2008 | 2007 | 2006 | |||||||||||||||||||
| Service cost | $ | 895 | $ | 1,014 | $ | 1,008 | $ | 128 | $ | 142 | $ | 152 | ||||||||||||
| Interest cost | 2,546 | 2,377 | 2,252 | 791 | 734 | 766 | ||||||||||||||||||
| Expected return on plan assets | (3,203 | ) | (3,025 | ) | (2,943 | ) | - | - | - | |||||||||||||||
| Amortization actuarial (gain) loss | (216 | ) | 88 | 71 | - | 34 | 75 | |||||||||||||||||
| Amortization of transition asset | (22 | ) | (22 | ) | (22 | ) | - | - | - | |||||||||||||||
| Amortization of prior service cost | 556 | 562 | 567 | (580 | ) | (580 | ) | (520 | ) | |||||||||||||||
| Settlement loss | - | - | 179 | - | - | - | ||||||||||||||||||
| Foreign currency | (183 | ) | 76 | 98 | - | - | - | |||||||||||||||||
| Net periodic cost | $ | 373 | $ | 1,070 | $ | 1,210 | $ | 339 | $ | 330 | $ | 473 | ||||||||||||
| Changes in accumulated other comprehensive income: | ||||||||||||||||||||||||
| Incremental effect of adopting SFAS No. 158 | N/A | N/A | $ | (1,055 | ) | N/A | N/A | $ | (492 | ) | ||||||||||||||
| Net (gain) loss | $ | 8,799 | $ | (1,527 | ) | 197 | $ | (343 | ) | $ | (1,800 | ) | - | |||||||||||
| Amortization of unrecognized prior service cost | (556 | ) | (562 | ) | N/A | 580 | 580 | N/A | ||||||||||||||||
| Amortization of unrecognized prior transition asset | 22 | 22 | N/A | - | - | N/A | ||||||||||||||||||
| Amortization of unrecognized actuarial (gain) loss | 216 | (88 | ) | N/A | - | (34 | ) | N/A | ||||||||||||||||
| Total recognized in other comprehensive income | $ | 8,481 | $ | (2,155 | ) | $ | (858 | ) | $ | 237 | $ | (1,254 | ) | $ | (492 | ) | ||||||||
Total recognized in net periodic benefit cost and other comprehensive income | $ | 8,854 | $ | (1,085 | ) | $ | 352 | $ | 576 | $ | (924 | ) | $ | (19 | ) | |||||||||
|
|
|
|
|
|
|
|
|
| Pension |
| Postretirement |
| ||
2008 |
| $ | 1,995 |
| $ | 816 |
|
2009 |
|
| 2,876 |
|
| 930 |
|
2010 |
|
| 2,194 |
|
| 956 |
|
2011 |
|
| 2,103 |
|
| 1,053 |
|
2012 |
|
| 2,686 |
|
| 1,136 |
|
2013 to 2017 |
|
| 18,285 |
|
| 6,163 |
|
Total |
|
| 30,139 |
|
| 11,054 |
|
| Postretirement | ||||||||
| Pension | Medical | |||||||
| Benefits | Benefits | |||||||
| 2009 | $ | 2,652 | $ | 927 | ||||
| 2010 | 2,140 | 1,061 | ||||||
| 2011 | 2,141 | 1,055 | ||||||
| 2012 | 2,460 | 1,149 | ||||||
| 2013 | 3,907 | 1,174 | ||||||
| 2014 to 2018 | 16,039 | 6,428 | ||||||
| Total | $ | 29,339 | $ | 11,794 | ||||
|
|
|
|
|
|
|
|
|
| Pension |
| Postretirement |
| ||
Net (gain) loss |
| $ | (220 | ) | $ | — |
|
Net transition obligation |
|
| (22 | ) |
| — |
|
Net prior service cost (credit) |
|
| 556 |
|
| (580 | ) |
29
| Postretirement | ||||||||
| Pension | Medical | |||||||
| Benefits | Benefits | |||||||
| Net (gain) loss | $ | (50 | ) | $ | - | |||
| Net transition obligation | (20 | ) | - | |||||
| Net prior service cost (credit) | 555 | (580 | ) | |||||
11. Common and Preferred Stock and Additional Paid-in Capital
| 12. | Common and Preferred Stock and Additional Paid-in Capital |
12. Commitment and Contingencies
| 13. | Commitment and Contingencies |
|
|
|
|
|
2008 |
| $ | 8,900 |
|
2009 |
|
| 5,467 |
|
2010 |
|
| 3,673 |
|
2011 |
|
| 2,153 |
|
2012 |
|
| 1,316 |
|
Thereafter |
|
| 236 |
|
Total |
| $ | 21,745 |
|
| 2009 | $ | 7,919 | ||
| 2010 | 5,556 | |||
| 2011 | 3,342 | |||
| 2012 | 2,088 | |||
| 2013 | 427 | |||
| Thereafter | 362 | |||
| Total | $ | 19,694 |
2008.
13. Income Taxes
Legal costs associated with such matters are expensed as incurred.
| 14. | Income Taxes |
|
|
|
|
|
|
|
|
|
|
|
|
| 2007 |
| 2006 |
| 2005 |
| |||
U.S. operations |
| $ | 50,561 |
| $ | 37,325 |
| $ | 28,660 |
|
Foreign operations |
|
| 7,151 |
|
| 5,977 |
|
| 6,334 |
|
Total |
| $ | 57,712 |
| $ | 43,302 |
| $ | 34,994 |
|
| 2008 | 2007 | 2006 | ||||||||||
| U.S. operations | $ | 14,858 | $ | 50,561 | $ | 37,325 | ||||||
| Foreign operations | 2,717 | 7,151 | 5,977 | |||||||||
| Total | $ | 17,575 | $ | 57,712 | $ | 43,302 | ||||||
|
|
|
|
|
|
|
|
|
|
|
|
| 2007 |
| 2006 |
| 2005 |
| |||
Current |
|
|
|
|
|
|
|
|
|
|
Federal |
| $ | 14,927 |
| $ | 11,345 |
| $ | 8,243 |
|
Foreign |
|
| 3,135 |
|
| 2,423 |
|
| 3,117 |
|
State |
|
| 1,305 |
|
| 436 |
|
| 1,129 |
|
|
| $ | 19,367 |
| $ | 14,204 |
| $ | 12,489 |
|
Deferred |
|
|
|
|
|
|
|
|
|
|
Federal |
| $ | 1,978 |
| $ | (458 | ) | $ | (108 | ) |
Foreign |
|
| (3,605 | ) |
| (200 | ) |
| (354 | ) |
State |
|
| 105 |
|
| (53 | ) |
| 31 |
|
|
| $ | (1,522 | ) | $ | (711 | ) | $ | (431 | ) |
Total |
|
|
|
|
|
|
|
|
|
|
Federal |
| $ | 16,905 |
| $ | 10,887 |
| $ | 8,135 |
|
Foreign |
|
| (470 | ) |
| 2,223 |
|
| 2,763 |
|
State |
|
| 1,410 |
|
| 383 |
|
| 1,160 |
|
|
| $ | 17,845 |
| $ | 13,493 |
| $ | 12,058 |
|
30
NOTES TO THE CONSOLIDATED FINANCIAL STATEMENTS
(In thousands, except shares and per share data)
| 2008 | 2007 | 2006 | ||||||||||
| Current: | ||||||||||||
| Federal | $ | 1,771 | $ | 14,927 | $ | 11,345 | ||||||
| Foreign | 4,155 | 3,135 | 2,423 | |||||||||
| State | 595 | 1,305 | 436 | |||||||||
| $ | 6,521 | $ | 19,367 | $ | 14,204 | |||||||
| Deferred: | ||||||||||||
| Federal | $ | 1,384 | $ | 1,978 | $ | (458 | ) | |||||
| Foreign | (1,201 | ) | (3,605 | ) | (200 | ) | ||||||
| State | 247 | 105 | (53 | ) | ||||||||
| $ | 430 | $ | (1,522 | ) | $ | (711 | ) | |||||
| Total: | ||||||||||||
| Federal | $ | 3,155 | $ | 16,905 | $ | 10,887 | ||||||
| Foreign | 2,954 | (470 | ) | 2,223 | ||||||||
| State | 842 | 1,410 | 383 | |||||||||
| $ | 6,951 | $ | 17,845 | $ | 13,493 | |||||||
permanently reinvested.
dollar.
|
|
|
|
|
|
|
|
|
|
|
|
| 2007 |
| 2006 |
| 2005 |
| |||
Tax at statutory rate |
|
| 35.0 | % |
| 35.0 | % |
| 35.0 | % |
Increases (decreases) in the tax rate from: |
|
|
|
|
|
|
|
|
|
|
State and local taxes, |
|
|
|
|
|
|
|
|
|
|
net of federal benefit |
|
| 1.8 |
|
| (0.2 | ) |
| 2.2 |
|
Effect of foreign operations |
|
| 0.5 |
|
| 0.6 |
|
| 4.0 |
|
Effect of changes in valuation allowances |
|
| (4.9 | ) |
| 0.4 |
|
| (2.7 | ) |
Effect of ETI and |
|
|
|
|
|
|
|
|
|
|
manufacturing deduction |
|
| (1.2 | ) |
| (2.5 | ) |
| (2.6 | ) |
Other, net |
|
| (0.3 | ) |
| (2.1 | ) |
| (1.4 | ) |
Effective income tax rate |
|
| 30.9 | % |
| 31.2 | % |
| 34.5 | % |
| 2008 | 2007 | 2006 | ||||||||||
| Tax at statutory rate | 35.0 | % | 35.0 | % | 35.0 | % | ||||||
| Increases (decreases) in the tax rate from: | ||||||||||||
State and local taxes, net of federal benefit | 4.6 | 1.8 | (0.2 | ) | ||||||||
| Effect of foreign operations | (0.7 | ) | 0.5 | 0.6 | ||||||||
| Effect of changes in valuation allowances | 6.3 | (4.9 | ) | 0.4 | ||||||||
Effect of ETI and manufacturing deduction | (3.3 | ) | (1.2 | ) | (2.5 | ) | ||||||
| Other, net | (2.3 | ) | (0.3 | ) | (2.1 | ) | ||||||
| Effective income tax rate | 39.6 | % | 30.9 | % | 31.2 | % | ||||||
|
|
|
|
|
|
|
|
|
|
|
|
|
|
|
|
|
| 2007 |
| 2006 |
| ||
Deferred tax assets: |
|
|
|
|
|
|
|
Inventories, principally due to |
|
|
|
|
|
|
|
additional costs inventoried for tax |
|
|
|
|
|
|
|
purposes and changes in inventory |
|
|
|
|
|
|
|
reserves |
| $ | 848 |
| $ | 854 |
|
Employee wages and benefits, |
|
|
|
|
|
|
|
principally due to accruals for |
|
|
|
|
|
|
|
financial reporting purposes |
|
| 13,062 |
|
| 14,366 |
|
Warranty reserves accrued for |
|
|
|
|
|
|
|
financial reporting purposes |
|
| 1,856 |
|
| 1,862 |
|
Accounts receivable, principally due |
|
|
|
|
|
|
|
and tax accounting method for |
|
|
|
|
|
|
|
equipment rentals |
|
| 658 |
|
| 643 |
|
Tax loss carryforwards |
|
| 13,106 |
|
| 11,034 |
|
Valuation allowance |
|
| (8,197 | ) |
| (11,034 | ) |
Other |
|
| 562 |
|
| 863 |
|
Total deferred tax assets |
| $ | 21,895 |
| $ | 18,588 |
|
Deferred tax liabilities: |
|
|
|
|
|
|
|
Property, plant and equipment, |
|
|
|
|
|
|
|
principally due to differences in |
|
|
|
|
|
|
|
depreciation and related gains |
| $ | 5,895 |
| $ | 3,621 |
|
Goodwill |
|
| 6,006 |
|
| 5,889 |
|
Total deferred tax liabilities |
| $ | 11,901 |
| $ | 9,510 |
|
Net deferred tax assets |
| $ | 9,994 |
| $ | 9,078 |
|
31:
| 2008 | 2007 | 2006 | ||||||||||
| Deferred tax assets: | ||||||||||||
Inventories, principally due to additional costs inventoried for tax purposes and changes in inventory reserves | $ | 1,509 | $ | 848 | $ | 854 | ||||||
Employee wages and benefits, principally due to accruals for financial reporting purposes | 16,557 | 13,062 | 14,366 | |||||||||
Warranty reserves accrued for financial reporting purposes | 1,947 | 1,856 | 1,862 | |||||||||
Accounts receivable, principally due to allowance for doubtful accounts and tax accounting method for equipment rentals | 1,151 | 658 | 643 | |||||||||
| Tax loss carryforwards | 13,860 | 13,106 | 11,034 | |||||||||
| Other | 836 | 562 | 863 | |||||||||
| Valuation allowance | (9,303 | ) | (8,197 | ) | (11,034 | ) | ||||||
| Total deferred tax assets | $ | 26,557 | $ | 21,895 | $ | 18,588 | ||||||
| Deferred tax liabilities: | ||||||||||||
Property, Plant and Equipment, principally due to differences in depreciation and related gains | $ | 7,714 | $ | 5,895 | $ | 3,621 | ||||||
| Goodwill and Intangible Assets | 12,078 | 6,006 | 5,889 | |||||||||
| Total deferred tax liabilities | $ | 19,792 | $ | 11,901 | $ | 9,510 | ||||||
| Net deferred tax assets | $ | 6,765 | $ | 9,994 | $ | 9,078 | ||||||
31
|
|
|
|
|
Balance at 1/1/07 |
| $ | 5,779 |
|
Increases/(decreases) as a result of |
|
|
|
|
tax positions taken during a prior period |
|
| — |
|
Increases/(decreases) as a result of |
|
|
|
|
tax positions taken during the current period |
|
| 548 |
|
Decreases for tax positions related to |
|
|
|
|
acquired entities during a prior period |
|
| — |
|
Decreases relating to settlements with taxing authorities |
|
| — |
|
Reductions as a result of a lapse |
|
|
|
|
of the applicable statute of limitations |
|
| (561 | ) |
Increases/(decreases) as a result of |
|
|
|
|
foreign currency fluctuations |
|
| 363 |
|
Balance at 12/31/07 |
| $ | 6,129 |
|
| Balance at 1/1/08 | $ | 6,129 | ||
Increases as a result of tax positions taken during a prior period | 536 | |||
Increases as a result of tax positions taken during the current period | 1,048 | |||
Increases for tax positions related to acquired entities during a prior period | 945 | |||
| Decreases relating to settlements with taxing authorities | (185 | ) | ||
Reductions as a result of a lapse of the applicable statute of limitations | (749 | ) | ||
Decreases as a result of foreign currency fluctuations | (400 | ) | ||
| Balance at 12/31/08 | $ | 7,324 |
We do not anticipate that total unrecognized tax benefits will change significantly within the next 12 months.
14. Stock-Based Compensation
current or prior periods.
| 15. | Stock-Based Compensation |
and the grant date, subject to the terms of our equity award policy.
| 2008 | 2007 | 2006 | ||||||||||
| Stock options and stock appreciation rights | $ | 218 | $ | 778 | $ | 1,066 | ||||||
| Restricted share awards | 878 | 1,144 | 772 | |||||||||
| Performance share awards | (2,086 | ) | 1,084 | 1,536 | ||||||||
| Share-based liabilities | (237 | ) | 134 | 194 | ||||||||
Total Stock-Based Compensation Expense (Benefit) | $ | (1,227 | ) | $ | 3,140 | $ | 3,568 | |||||
|
|
|
|
|
|
|
|
|
|
|
|
| 2007 |
| 2006 |
| 2005 |
| |||
Expected dividend yield |
|
| 1.3 - 1.8 | % |
| 1.8 - 2.1 | % |
| 2.2 - 2.3 | % |
Expected volatility |
|
| 26 - 35 | % |
| 22 - 75 | % |
| 24 - 30 | % |
Risk-free interest rate |
|
| 3.7 - 5.1 | % |
| 4.6 - 5.1 | % |
| 3.9 - 4.5 | % |
Expected life, in years |
|
| 1 - 9 |
|
| 2 - 9 |
|
| 6 - 7 |
|
Weighted-average |
|
|
|
|
|
|
|
|
|
|
expected volatility |
|
| 30 | % |
| 43 | % |
| 25 | % |
Weighted-average fair value |
| $ | 10.26 |
| $ | 10.01 |
| $ | 5.78 |
|
| 2008 | 2007 | 2006 | ||||||||||
| Expected volatility | 29 - 37 | % | 26 - 35 | % | 22 - 75 | % | ||||||
Weighted-average expected volatility | 30 | % | 30 | % | 43 | % | ||||||
| Expected dividend yield | 1.2 - 1.5 | % | 1.3 - 1.8 | % | 1.8 - 2.1 | % | ||||||
| Expected term, in years | 2 - 8 | 1 - 9 | 2 - 9 | |||||||||
| Risk-free interest rate | 1.8 - 3.5 | % | 3.7 - 5.1 | % | 4.6 - 5.1 | % | ||||||
32
NOTES TO THE CONSOLIDATED FINANCIAL STATEMENTS
(In thousands, except shares and per share data)
The total grant date fair value of stock options vested during the years ended December 31, 2007, 2006 and 2005 was $876, $1,418 and $3,133, respectively.
The weighted-average remaining contractual life for options outstanding and exercisable as of December 31, 2007, was four years. The aggregate intrinsic value of options outstanding and exercisable was $26,779 and $25,415, respectively. The total intrinsic value of stock options exercised during the years ended December 31, 2007, 2006 and 2005 was $8,370, $3,629 and $4,043, respectively.
Compensation expense related to stock options and SARs was $778 and $1,054, for the years ended December 31, 2007 and 2006, respectively. As of December 31, 2007, there was unrecognized compensation cost for unvested options and rights of $525 which is expected to be recognized during 2008, 2009 and 2010.
|
|
|
|
|
|
|
|
|
| Shares |
| Weighted- |
| ||
Outstanding at beginning of year |
|
| 1,543,000 |
| $ | 19.54 |
|
Granted |
|
| 29,000 |
|
| 32.30 |
|
Exercised |
|
| (465,300 | ) |
| 19.63 |
|
Forfeited |
|
| (1,000 | ) |
| 20.82 |
|
Expired |
|
| (23,200 | ) |
| 18.13 |
|
Outstanding at end of year |
|
| 1,082,500 |
| $ | 19.87 |
|
Exercisable at end of year |
|
| 1,007,200 |
| $ | 19.37 |
|
Restricted Share Awards
| Shares | Weighted-Average Exercise Price | |||||||
| Outstanding at beginning of year | 1,082,468 | $ | 19.87 | |||||
| Granted | 27,850 | 35.04 | ||||||
| Exercised | (116,823 | ) | 19.12 | |||||
| Forfeited | (8,999 | ) | 25.59 | |||||
| Expired | (33,305 | ) | 20.33 | |||||
| Outstanding at end of year | 951,191 | $ | 20.33 | |||||
| Exercisable at end of year | 913,837 | $ | 19.87 | |||||
|
|
|
|
|
|
|
|
|
| Unvested |
| Weighted- |
| ||
Unvested at beginning of year |
|
| 83,100 |
| $ | 25.56 |
|
Granted |
|
| 32,800 |
|
| 33.15 |
|
Vested |
|
| (17,600 | ) |
| 24.92 |
|
Forfeited |
|
| (7,200 | ) |
| 26.38 |
|
Unvested at end of year |
|
| 91,100 |
| $ | 28.35 |
|
options outstanding and exercisable as of December 31, 2008, was four years.
| Shares | Weighted-Average Grant Date Fair Value | |||||||
| Nonvested at beginning of year | 101,894 | $ | 26.54 | |||||
| Granted | 36,986 | 35.30 | ||||||
| Vested | (39,913 | ) | 27.43 | |||||
| Forfeited | (2,424 | ) | 34.30 | |||||
| Nonvested at end of year | 96,543 | $ | 29.33 | |||||
over a weighted-average period of three years.
predetermined financial performance targets to be probable.
33
NOTES TO THE CONSOLIDATED FINANCIAL STATEMENTS
(In thousands, except shares and per share data)
15. Employee Stock Ownership Plan
| 16. | Employee Stock Ownership Plan |
Retained Earnings.
|
|
|
|
|
|
|
|
|
|
|
|
| 2007 |
| 2006 |
| 2005 |
| |||
Cash contributions |
| $ | 1,530 |
| $ | 1,513 |
| $ | 1,498 |
|
Net benefit provided by ESOP |
|
| 2,568 |
|
| 1,205 |
|
| 387 |
|
Interest earned |
|
|
|
|
|
|
|
|
|
|
and received on loan |
|
| 520 |
|
| 663 |
|
| 792 |
|
Dividends |
|
| 486 |
|
| 523 |
|
| 559 |
|
| 2008 | 2007 | 2006 | ||||||||||
| Cash contributions | $ | 1,621 | $ | 1,530 | $ | 1,513 | ||||||
| Net benefit provided by ESOP | 2,219 | 2,568 | 1,205 | |||||||||
Interest earned and received on loan | 363 | 520 | 663 | |||||||||
| Dividends | 427 | 486 | 523 | |||||||||
$1,892.
|
|
|
|
|
|
|
|
|
|
|
|
| 2007 |
| 2006 |
| 2005 |
| |||
Allocated shares |
|
| 1,738,210 |
|
| 1,638,248 |
|
| 1,538,286 |
|
Unreleased shares |
|
| 199,922 |
|
| 299,884 |
|
| 399,846 |
|
Total ESOP shares |
|
| 1,938,132 |
|
| 1,938,132 |
|
| 1,938,132 |
|
16. Earnings Per Share Computations
| 2008 | 2007 | 2006 | ||||||||||
| Allocated shares | 1,838,171 | 1,738,210 | 1,638,248 | |||||||||
| Unreleased shares | 99,961 | 199,922 | 299,884 | |||||||||
| Total ESOP shares | 1,938,132 | 1,938,132 | 1,938,132 | |||||||||
| 17. | Earnings Per Share Computations |
|
|
|
|
|
|
|
|
|
|
|
|
| 2007 |
| 2006 |
| 2005 |
| |||
Numerator: |
|
|
|
|
|
|
|
|
|
|
Net Earnings |
| $ | 39,867 |
| $ | 29,809 |
| $ | 22,936 |
|
Denominator: |
|
|
|
|
|
|
|
|
|
|
Basic - weighted average |
|
|
|
|
|
|
|
|
|
|
outstanding shares |
|
| 18,641,000 |
|
| 18,561,000 |
|
| 18,024,000 |
|
Effect of dilutive securities: |
|
|
|
|
|
|
|
|
|
|
Employee stock options |
|
| 505,000 |
|
| 428,000 |
|
| 186,000 |
|
Diluted - weighted average |
|
|
|
|
|
|
|
|
|
|
outstanding shares |
|
| 19,146,000 |
|
| 18,989,000 |
|
| 18,210,000 |
|
Basic earnings per share |
| $ | 2.14 |
| $ | 1.61 |
| $ | 1.27 |
|
Diluted earnings per share |
| $ | 2.08 |
| $ | 1.57 |
| $ | 1.26 |
|
| 2008 | 2007 | 2006 | ||||||||||
| Numerator: | ||||||||||||
| Net Earnings | $ | 10,624 | $ | 39,867 | $ | 29,809 | ||||||
| Denominator: | ||||||||||||
Basic - Weighted Average Shares Outstanding | 18,303,137 | 18,640,882 | 18,561,533 | |||||||||
| Effect of dilutive securities: | ||||||||||||
| Employee stock options | 278,703 | 505,143 | 427,715 | |||||||||
Diluted - Weighted Average Shares Outstanding | 18,581,840 | 19,146,025 | 18,989,248 | |||||||||
| Basic Earnings per Share | $ | 0.58 | $ | 2.14 | $ | 1.61 | ||||||
| Diluted Earnings per Share | $ | 0.57 | $ | 2.08 | $ | 1.57 | ||||||
17. Segment Reporting
anti-dilutive.
| 18. | Segment Reporting |
|
|
|
|
|
|
|
|
|
|
|
|
| 2007 |
| 2006 |
| 2005 |
| |||
Net sales: |
|
|
|
|
|
|
|
|
|
|
North America |
| $ | 417,757 |
| $ | 391,309 |
| $ | 370,142 |
|
Europe |
|
| 172,708 |
|
| 147,657 |
|
| 126,913 |
|
Other International |
|
| 73,753 |
|
| 60,015 |
|
| 55,853 |
|
Total |
| $ | 664,218 |
| $ | 598,981 |
| $ | 552,908 |
|
|
|
|
|
|
|
|
|
|
| 2007 |
| 2006 |
| ||
Long-lived assets: |
|
|
|
|
|
|
|
North America |
| $ | 93,222 |
| $ | 85,829 |
|
Europe |
|
| 37,395 |
|
| 29,529 |
|
Other International |
|
| 4,062 |
|
| 1,914 |
|
Total |
| $ | 134,679 |
| $ | 117,272 |
|
| 2008 | 2007 | 2006 | ||||||||||
| Net Sales: | ||||||||||||
| North America | $ | 402,174 | $ | 417,757 | $ | 391,309 | ||||||
| Europe, Middle East and Africa | 217,594 | 183,188 | 155,710 | |||||||||
| Other International | 81,637 | 63,273 | 51,962 | |||||||||
| Total | $ | 701,405 | $ | 664,218 | $ | 598,981 | ||||||
| 2008 | 2007 | |||||||
| Long-lived assets: | ||||||||
| North America | $ | 99,022 | $ | 93,222 | ||||
| Europe, Middle East and Africa | 87,815 | 37,395 | ||||||
| Other International | 15,114 | 4,062 | ||||||
| Total | $ | 201,951 | $ | 134,679 | ||||
|
|
|
|
|
|
|
|
|
|
|
|
| 2007 |
| 2006 |
| 2005 |
| |||
Net sales: |
|
|
|
|
|
|
|
|
|
|
Equipment |
| $ | 393,270 |
| $ | 358,344 |
| $ | 332,421 |
|
Parts and consumables |
|
| 161,334 |
|
| 145,218 |
|
| 133,108 |
|
Service and other |
|
| 84,429 |
|
| 74,235 |
|
| 67,482 |
|
Specialty surface coatings |
|
| 25,185 |
|
| 21,184 |
|
| 19,897 |
|
Total |
| $ | 664,218 |
| $ | 598,981 |
| $ | 552,908 |
|
34
| 2008 | 2007 | 2006 | ||||||||||
| Net Sales: | ||||||||||||
| Equipment | $ | 411,765 | $ | 393,270 | $ | 358,344 | ||||||
| Parts and consumables | 168,699 | 161,334 | 145,218 | |||||||||
| Service and other | 97,292 | 84,429 | 74,235 | |||||||||
| Specialty surface coatings | 23,649 | 25,185 | 21,184 | |||||||||
| Total | $ | 701,405 | $ | 664,218 | $ | 598,981 | ||||||
| 19. | Consolidated Quarterly Data (Unaudited) |
| Net Sales | Gross Profit | |||||||||||||||
| Quarter | 2008 | 2007 | 2008 | 2007 | ||||||||||||
| First | $ | 168,600 | $ | 155,078 | $ | 69,640 | $ | 63,758 | ||||||||
| Second | 193,584 | 165,203 | 82,203 | 70,853 | ||||||||||||
| Third | 185,935 | 161,329 | 78,552 | 66,864 | ||||||||||||
| Fourth | 153,286 | 182,608 | 55,855 | 77,509 | ||||||||||||
| Year | $ | 701,405 | $ | 664,218 | $ | 286,250 | $ | 278,984 | ||||||||
| Basic | Diluted | |||||||||||||||||||||||
| Earnings (Loss) | Earnings (Loss) | |||||||||||||||||||||||
| Net Earnings (Loss) | per Share | per Share | ||||||||||||||||||||||
| Quarter | 2008 | 2007 | 2008 | 2007 | 2008 | 2007 | ||||||||||||||||||
| First | $ | 5,235 | $ | 5,851 | $ | 0.28 | $ | 0.31 | $ | 0.28 | $ | 0.31 | ||||||||||||
| Second | 8,292 | 10,454 | 0.45 | 0.56 | 0.44 | 0.55 | ||||||||||||||||||
| Third | 13,985 | 10,967 | 0.77 | 0.59 | 0.76 | 0.57 | ||||||||||||||||||
| Fourth | (16,888 | ) | 12,595 | (0.93 | ) | 0.68 | (0.92 | ) | 0.66 | |||||||||||||||
| Year | $ | 10,624 | $ | 39,867 | $ | 0.58 | (1) | $ | 2.14 | (1) | $ | 0.57 | $ | 2.08 | (1) | |||||||||
NOTES TO THE CONSOLIDATED FINANCIAL STATEMENTS
(In thousands, except shares and per share data)
18. Consolidated Quarterly Data
|
|
|
|
|
|
|
|
|
|
|
|
|
|
|
|
| Net Sales |
| Gross Profit |
|
| ||||||||
Quarter |
| 2007 |
| 2006 |
| 2007 |
| 2006 |
|
| ||||
First |
| $ | 155,078 |
| $ | 135,462 |
| $ | 63,758 |
| $ | 56,800 |
|
|
Second |
|
| 165,203 |
|
| 150,965 |
|
| 70,853 |
|
| 65,798 |
|
|
Third |
|
| 161,329 |
|
| 145,690 |
|
| 66,864 |
|
| 60,617 |
|
|
Fourth |
|
| 182,608 |
|
| 166,863 |
|
| 77,509 |
|
| 68,364 |
|
|
Year |
| $ | 664,218 |
| $ | 598,981 | (1) | $ | 278,984 |
| $ | 251,579 |
|
|
|
|
|
|
|
|
|
|
|
|
|
|
|
|
|
|
|
|
|
|
|
| Net Earnings |
| Basic Earnings |
| Diluted Earnings |
| ||||||||||||
Quarter |
| 2007 |
| 2006 |
| 2007 |
| 2006 |
| 2007 |
| 2006 |
| ||||||
First |
| $ | 5,851 |
| $ | 4,437 |
| $ | 0.31 |
| $ | 0.24 |
| $ | 0.31 |
| $ | 0.24 |
|
Second |
|
| 10,454 |
|
| 9,153 |
|
| 0.56 |
|
| 0.49 |
|
| 0.55 |
|
| 0.48 |
|
Third |
|
| 10,967 |
|
| 7,922 |
|
| 0.59 |
|
| 0.43 |
|
| 0.57 |
|
| 0.42 |
|
Fourth |
|
| 12,595 |
|
| 8,297 |
|
| 0.68 |
|
| 0.44 |
|
| 0.66 |
|
| 0.43 |
|
Year |
| $ | 39,867 |
| $ | 29,809 |
| $ | 2.14 |
| $ | 1.61 | (1) | $ | 2.08 | (1) | $ | 1.57 |
|
(1) The summation of quarterly data does not equate to the calculation for the full fiscal year as quarterly calculations are performed on a discrete basis.
19. Subsequent Events
On February 15,quarter.
| 20. | Related Party Transactions |
| 21. | Subsequent Events |
$110.
On February 22, 2008, we announced thatMarch 4, 2009 we entered into a purchase agreement with Sociedade Alfa Ltda., basedsecond amendment to the Credit Agreement as further discussed in Sao Paulo, Brazil. Sociedade Alfa Ltda. reported approximately $9,000 in sales revenues for 2007. This acquisition is expected to close in March or April 2008.
On February 29, 2008, we announced that we completed the acquisitionNote 8.
ITEM 9 – Changes in and Disagreements with Accountants on Accounting and Financial Disclosure
Management’s Report on Internal Controls over Financial Reporting
The report of management required under this item is contained in Item 8 of this Annual Report on Form 10-K.
Attestation Report of Independent Registered Public Accounting Firm
The attestation report required under this item is contained in Item 8 of this Annual Report on Form 10-K.
| /s/ H. Chris Killingstad | |
H. Chris Killingstad President and Chief Executive Officer | |
| /s/ Thomas Paulson | |
Thomas Paulson Chief Financial Officer (Principal Financial and Accounting Officer) |
Steven M. Coopersmith, Vice President, Global Marketing
Steven M. Coopersmith (44) joined Tennant in April 2003. From 2000 to 2003, he was the President of Dairy Marketing Alliance LLC, a joint venture between Land O’Lakes, Inc. and Dean Foods Company. Previously, he was Vice President of Product Development with United Healthcare. Before that, he was the Business Team Leader for Pillsbury’s line of refrigerated sweet baked goods. Earlier in his career, he managed new products for Reckitt & Coleman Inc.’s household product group. He began his marketing career at Unilever’s Lever Brothers Company, where he held a variety of positions culminating in Senior Manager of their All detergent franchise.
and Service
Michael W.
firm, which she joined in 1976.
36
28, 2008.
37
| A. | ||
| The following documents are filed as a part of this report: | |
| 1. | ||
| Financial Statements |
| 2. | ||
| ||
| Financial Statement Schedule | |
Schedule II – Valuation and Qualifying Accounts | ||
|
|
|
|
|
|
|
|
|
|
|
|
|
|
|
|
|
|
|
| Allowance for doubtful accounts and returns |
| Balance at |
| Additions |
| Additions |
| Deductions |
| Balance at |
| |||||
| |||||||||||||||||
| Year ended December 31, 2007 |
| $ | 3,347 |
| $ | 1,690 |
| $ | — |
| $ | 1,773 |
| $ | 3,264 |
|
| Year ended December 31, 2006 |
| $ | 4,756 |
| $ | 532 |
| $ | — |
| $ | 1,941 |
| $ | 3,347 |
|
| Year ended December 31, 2005 |
| $ | 5,143 |
| $ | 1,021 |
| $ | — |
| $ | 1,408 |
| $ | 4,756 |
|
| |
|
| 2008 | 2007 | 2006 | ||||||||||
| Balance at beginning of year | $ | 3,264 | $ | 3,347 | $ | 4,756 | ||||||
| Additions charged to costs and expenses | 4,083 | 1,622 | 451 | |||||||||
| Additions charged to other accounts | (76 | ) | 68 | 81 | ||||||||
Deductions from reserves (1) | 48 | (1,772 | ) | (1,941 | ) | |||||||
| Balance at end of year | $ | 7,319 | $ | 3,265 | $ | 3,347 | ||||||
As discussed in Note 1 to the consolidated financial statements, the Company adopted the provisions of Statement of Financial Accounting Standards No. 123R,Share-Based Payment, as of January 1, 2006 and Statement of Financial Accounting Standards No. 158,Employers’ Accounting for Defined Benefit Pension and Other Postretirement Plans, as of December 31, 2006, and FASB Interpretation No. 48,Accounting for Uncertainty in Income Taxes, as of January 1, 2007.
38
| 3. | Exhibits | ||||
|
| ||||
Item # | Description | Method of Filing | |||
Rider A: | |||||
| Share Purchase Agreement dated February 15, 2008 among the Sellers identified therein and Tennant Scotland Limited (excluding schedules and exhibits, which the Company agrees to furnish supplementally to the Securities and Exchange Commission upon request) | Incorporated by reference to Exhibit 2.1 to the Company's Form 8-K dated February 29, 2008. | |||
| 3i | Restated Articles of Incorporation | Incorporated by reference to Exhibit 3i to the Company’s report on | |||
| 3.1 | |||||
| Certificate of Designation | Incorporated by reference to Exhibit 3.1 to the Company's Form 10-K for the year ended December 31, 2006. | |||
| 3ii | Amended and Restated By-Laws | Incorporated by reference to Exhibit 3ii to the Company’s Form 10-K for the year ended December 31, | |||
| 4.1 | |||||
|
|
| |||
| Rights Agreement, dated as of November 10, 2006, between the Company and Wells Fargo Bank, N.A., as Rights Agent | Incorporated by reference to Exhibit 1 to Form 8-A dated November 14, 2006. | |||
| 10.1 | |||||
| Tennant Company Amended and Restated 1992 Stock Incentive Plan* | Incorporated by reference to Exhibit 4.4 to the Company’s Registration Statement No. 33-59054, Form S-8 dated March 2, 1993. | |||
| 10.2 | |||||
| Tennant Company 1995 Stock Incentive Plan* | Incorporated by reference to Exhibit 4.4 to the Company’s Registration Statement No. 33-62003, Form S-8, dated August 22, 1995. | |||
| 10.3 | |||||
| Tennant Company Restricted Stock Plan for Nonemployee Directors (as amended and restated effective May 6, 2004)* | Incorporated by reference to Exhibit 10.3 to the Company’s Form 10-K for the year ended December 31, 2005. | |||
| 10.4 | |||||
| Tennant Company Executive Nonqualified Deferred Compensation Plan, as restated effective January 1, 2005* |
| |||
|
| Incorporated by reference to Exhibit | |||
| 10.5 | Form of Management Agreement and Executive Employment Agreement* | Filed herewith electronically. | |||
| Schedule of parties to Management and Executive Employment Agreement |
| |||
| 10.7 | |||||
| Tennant Company Non-Employee Director Stock Option Plan (as amended and restated effective May 6, 2004)* | Incorporated by reference to Exhibit 10.6 to the Company’s Form 10-Q for the quarterly period ended June 30, 2004. | |||
| 10.8 | |||||
| Tennant Company 1998 Management Incentive Plan, as amended* | Incorporated by reference to Exhibit 99 to the Company’s Registration Statement No. 333-84372, Form S-8 dated March 15, 2002. | |||
| 10.9 | |||||
| Tennant Company Amended and Restated 1999 Stock Incentive Plan* | Incorporated by reference to Appendix A to the Company’s proxy statement for the 2006 Annual Meeting of Shareholders filed on March 15, 2006. | |||
| 10.10 | |||||
|
|
| |||
| Long-Term Incentive Plan 2007* | Incorporated by reference to Exhibit 10.12 to the Company’s Form 10-K for the year ended December 31, 2006. | |||
| 10.11 | |||||
|
| Incorporated by reference to Exhibit | |||
| 10.12 | Short-Term Incentive Plan 2008* | Incorporated by reference to Exhibit 10.3 to the Company’s Form 10-Q for the quarterly period ended March 31, 2008. | |||
| 10.13 | Deferred Stock Unit Agreement (awards prior to 2008)* | Incorporated by reference to Exhibit 10.14 to the Company's Form 10-K for the year ended December 31, 2006. | |||
| 10.14 | |||||
|
|
| |||
| Performance share award agreement for H. Chris Killingstad* | Incorporated by reference to Exhibit 10.18 to the Company’s Form 10-K for the year ended December 31, 2005. | |||
| 10.15 | |||||
| Services Agreement and Management Agreement between the Company and Karel Huijser* | Incorporated by reference to Exhibit 10.2 to the Company’s Form 10-Q for the quarterly period ended September 30, 2006. | |||
| 10.16 | Amendment No. 1 dated as of December 17, 2008 to Services Agreement and Management Agreement between the Company and Karel Huijser* | Filed herewith electronically. | |||
| Tennant Company 2007 Stock Incentive Plan* | Incorporated by reference to Appendix A to the Company’s proxy statement for the 2007 Annual Meeting of Shareholders filed on March 15, 2007. | |||
39
|
|
| ||||||
| Credit Agreement dated as of June 19, | Incorporated by reference to Exhibit 10.1 to the | ||||||
| 10.19 | ||||||||
| Deferred Stock Unit Agreement (awards in and after 2008)* |
| ||||||
| 10.20 | Amendment No. 1 dated as of February 21, 2008 to Credit Agreement dated as of June 19, 2007 | Incorporated by reference to Exhibit 10.1 to the Company's Form 10-Q for the quarterly period ended March 31, 2008. | ||||||
| Tennant Company 2009 Short-Term Incentive Plan* | Incorporated by reference to Appendix A to the Company's Proxy statement for the 2008 Annual Meeting of Shareholder's filed on March 14, 2008. | ||||||
| 10.22 | Amendment No. 2 to the Credit Agreement dated as of March 4, 2009 | Incorporated by reference to Exhibit 10.1 to the Company's Form 8-K dated March 10, 2009. | ||||||
| 21 | Subsidiaries of the Registrant | Filed herewith electronically. | ||||||
| 23.1 | Consent of KPMG, LLP Independent Registered Public Accounting Firm | |||||||
|
| Filed herewith electronically. | ||||||
| 31.1 | ||||||||
| Rule 13a-14(a)/15d-14(a) Certification of Chief Executive Officer | Filed herewith electronically. | ||||||
| 31.2 | ||||||||
| Rule 13a-14(a)/15d-14(a) Certification of Chief Financial Officer | Filed herewith electronically. | ||||||
| 32.1 | ||||||||
| Section 1350 | Filed herewith electronically. | ||||||
| 32.2 | Section 1350 Certification of Chief Financial Officer | |||||||
| ||||||||
40
| TENNANT COMPANY | ||||||
| ||||||
| By |
| /s/ H. Chris Killingstad | ||||
H. Chris Killingstad | ||||||
President, CEO and | ||||||
Board of Directors | ||||||
| Date | March | ||||
| By | ||||||||
| /s/ H. Chris Killingstad |
| By | /s/ James T. Hale | ||||
H. Chris Killingstad President, CEO and Board of Directors | James T. Hale Board of Directors | |||||||
| Date | March 13, 2009 | Date | March 13, 2009 | |||||
| By | /s/ Thomas Paulson | By | /s/ David Mathieson | |||||
|
| |||||||
|
| |||||||
| ||||||||
|
|
|
| |||||
|
Thomas Paulson |
|
| |||||
|
| |||||||
Chief Financial Officer |
| |||||||
(Principal Financial and Accounting Officer) | David Mathieson Board of Directors | |||||||
| Date | March 13, 2009 | Date | March 13, 2009 | |||||
|
|
|
| |||||
| By | /s/ William F. Austen | By | /s/ Edwin L. Russell | |||||
| William F. Austen Board of Directors | Edwin L. Russell Board of Directors | ||||||
| Date | March 13, 2009 | Date | March 13, 2009 | |||||
| By | /s/ Jeffrey A. Balagna |
| By | /s/ Stephen G. Shank | ||||
Jeffrey A. Balagna Board of Directors | Stephen G. Shank | |||||||
Board of Directors |
| |||||||
| Date | March 13, 2009 | Date | March 13, 2009 | |||||
|
|
|
| |||||
| /s/ |
| By | /s/ Steven A. Sonnenberg | ||||
Carol S. Eicher Board of Directors | ||||||||
| Steven A. Sonnenberg | |||||||
Board of Directors |
| |||||||
| Date | March 13, 2009 | Date | March 13, 2009 | |||||
|
|
|
| |||||
* The Directors signing this report represent a majority of the Board of Directors.
41