PART II | | | Item 5. | Market for the Registrant’s Common Equity, Related Stockholder Matters and Issuer Purchases of Equity Securities |
Share Investment Performance | | | Share Investment Performance
| | | | The following graph is based upon the SIC Code #251 Household Furniture Index as a peer group. It shows changes over the past five-year period in the value of $100 invested in: (1) Flexsteel’s common stock; (2) The NASDAQ Global Market; and (3) an industry peer group of the following: Bassett Furniture Ind., Chromcraft Revington Inc., Ethan Allen Interiors, Furniture Brands Intl., Hooker Furniture Corp., Interface Inc., Kimball International, La-Z-Boy Inc., Natuzzi S.P.A., and Stanley Furniture Inc. |
Five-Year Cumulative Total Returns
Value of $100 Investedinvested in: (1) Flexsteel’s common stock; (2) The NASDAQ Global Market; and (3) an industry peer group of the following: Bassett Furniture Ind., Chromcraft Revington Inc., Ethan Allen Interiors, Furniture Brands Intl., Hooker Furniture Corp., Kimball International, La-Z-Boy Inc., Natuzzi S.P.A., and Stanley Furniture Inc.
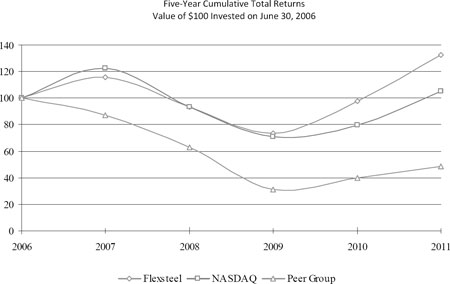
| | | | | | | | | | | | | | | | | | | | | | 2006 | | 2007 | | 2008 | | 2009 | | 2010 | | 2011 | | Flexsteel | | 100.00 | | | 115.82 | | | 93.64 | | | 73.16 | | | 97.88 | | | 132.62 | | | Peer Group | | 100.00 | | | 87.04 | | | 62.64 | | | 31.24 | | | 39.52 | | | 48.76 | | | NASDAQ | | 100.00 | | | 122.72 | | | 93.36 | | | 71.02 | | | 79.93 | | | 105.32 | | |
The NASDAQ Global Market is the principal market on which the Company’s common stock is traded. | | | | | | | | | | | | | | | | | | | | | | Sale Price of Common Stock * | | Cash Dividends
Per Share | | | | Fiscal 2011 | | Fiscal 2010 | | | | | High | | Low | | High | | Low | | Fiscal 2011 | | Fiscal 2010 | | First Quarter | | $ | 15.84 | | $ | 10.08 | | $ | 8.84 | | $ | 6.64 | | $ | 0.075 | | $ | 0.05 | | Second Quarter | | | 18.75 | | | 14.22 | | | 10.34 | | | 7.77 | | | 0.075 | | | 0.05 | | Third Quarter | | | 19.69 | | | 14.11 | | | 16.50 | | | 9.33 | | | 0.075 | | | 0.05 | | Fourth Quarter | | | 16.60 | | | 13.80 | | | 15.74 | | | 10.75 | | | 0.075 | | | 0.05 | |
* Reflects the market price as reported on The NASDAQ Global Market. The Company estimates there were approximately 1,600 holders of common stock of the Company as of June 30, 20042011. 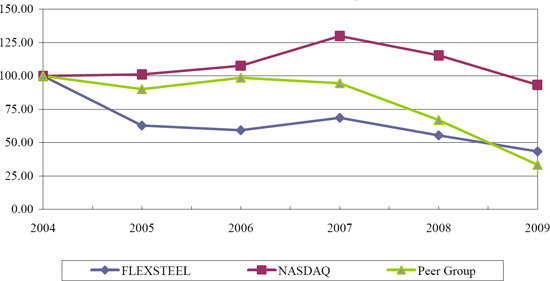
| | | | | | | | | | | | | | | | | | 2004 | | 2005 | | 2006 | | 2007 | | 2008 | | 2009 | | | Flexsteel | | 100.00 | | 62.81 | | 59.26 | | 68.64 | | 55.49 | | 43.36 | | | Peer Group | | 100.00 | | 90.14 | | 98.61 | | 94.53 | | 66.96 | | 33.43 | | | NASDAQ | | 100.00 | | 101.09 | | 107.64 | | 129.93 | | 115.40 | | 93.33 | | | | | | | | | | | | | | | | | | The NASDAQ Global Market is the principal market on which the Company’s common stock is traded. | |
| | | | | | | | | | | | | | | | | | | | | | | | Sale Price of Common Stock * | | Cash Dividends
Per Share | | | | | Fiscal 2009 | | Fiscal 2008 | | | | | | High | | Low | | High | | Low | | Fiscal 2009 | | Fiscal 2008 | | | First Quarter | | $ | 12.18 | | $ | 9.50 | | $ | 14.75 | | $ | 12.92 | | $ | 0.13 | | $ | 0.13 | | | Second Quarter | | | 10.99 | | | 6.68 | | | 14.86 | | | 11.60 | | | 0.13 | | | 0.13 | | | Third Quarter | | | 7.96 | | | 5.11 | | | 14.50 | | | 11.00 | | | 0.05 | | | 0.13 | | | Fourth Quarter | | | 9.00 | | | 4.98 | | | 13.98 | | | 11.01 | | | 0.05 | | | 0.13 | |
The payment of future cash dividends is within the discretion of our Board of Directors and will depend, among other factors, on our earnings, capital requirements and operating and financial condition. | | | * Reflects the market price as reported on The NASDAQ Global Market.
| | | | The Company estimates there were approximately 1,600 holders of common stock of the Company as of June 30, 2009.
| | | | There were no repurchases of the Company’s common stock during the quarter ended June 30, 2009.
|
| | Item 6. | Selected Financial Data |
The selected financial data presented below should be read in conjunction with the Company’s consolidated financial statements and notes thereto included in Item 8 of this Annual Report on Form 10-K and with “Management’s Discussion and Analysis of Financial Condition and Results of Operations” included in Item 7 of this Annual Report on Form 10-K. The selected consolidated statement of operations data of the Company is derived from the Company’s consolidated financial statements. Five-Year Review
(Amounts in thousands, except certain ratios and per share data) | | | | | | | | | | | | | | | | | | | | | | | | | | | | | | | | | | | 2009 | | 2008 | | 2007 | | 2006 | | 2005 | | | 2011 | | 2010 | | 2009 | | 2008 | | 2007 | | SUMMARY OF OPERATIONS | | | | | | | | | | | | | | | | | | | | | | | Net sales | | $ | 324,158 | | $ | 405,655 | | $ | 425,400 | | $ | 426,408 | | $ | 410,023 | | | $ | 339,426 | | $ | 326,466 | | $ | 324,158 | | $ | 405,655 | | $ | 425,400 | | Cost of goods sold | | 263,083 | | 327,165 | | 344,177 | | 345,068 | | 334,978 | | | 262,124 | | 251,685 | | 263,083 | | 327,165 | | 344,177 | | Operating (loss) income | | (2,272 | ) | | 7,596 | | 14,699 | | 8,561 | | 7,258 | | | Operating income (loss) | | | 15,864 | | 17,529 | | (2,272 | ) | | 7,596 | | 14,699 | | Interest and other income | | 661 | | 469 | | 1,277 | | 775 | | 628 | | | 343 | | 361 | | 661 | | 469 | | 1,277 | | Interest expense | | 969 | | 1,468 | | 1,491 | | 1,557 | | 990 | | | — | | 439 | | 968 | | 1,469 | | 1,491 | | (Loss) income before income taxes | | (2,579 | ) | | 6,596 | | 14,484 | | 7,778 | | 6,896 | | | Income tax (benefit) provision (5) | | (1,070 | ) | | 2,360 | | 5,150 | | 3,060 | | 1,990 | | | | | | | | | | | | | | | | Net (loss) income (1) (2) (3) (4) (5) | | (1,509 | ) | | 4,236 | | 9,334 | | 4,718 | | 4,906 | | | (Loss) earnings per common share: (1) (2) (3) (4) (5) | | | | | | | | | | | | | Income (loss) before income taxes | | | 16,207 | | 17,451 | | (2,579 | ) | | 6,596 | | 14,484 | | Income tax provision (benefit) | | | 5,790 | | 6,650 | | (1,070 | ) | | 2,360 | | 5,150 | | Net income (loss) (1) (2) (3) | | | 10,417 | | 10,801 | | (1,509 | ) | | 4,236 | | 9,334 | | Earnings (loss) per common share: (1) (2) (3) | | | | | | | | | | | | | Basic | | (0.23 | ) | | 0.64 | | 1.42 | | 0.72 | | 0.75 | | | 1.56 | | 1.63 | | (0.23 | ) | | 0.64 | | 1.42 | | Diluted | | (0.23 | ) | | 0.64 | | 1.42 | | 0.72 | | 0.74 | | | 1.50 | | 1.61 | | (0.23 | ) | | 0.64 | | 1.42 | | Cash dividends declared per common share | | $ | 0.36 | | $ | 0.52 | | $ | 0.52 | | $ | 0.52 | | $ | 0.52 | | | $ | 0.30 | | $ | 0.20 | | $ | 0.36 | | $ | 0.52 | | $ | 0.52 | | SELECTED DATA AS OF JUNE 30 | | | | | | | | | | | | | | | | | | | | | | | Average common shares outstanding: | | | | | | | | | | | | | | | | | | | | | | | Basic | | 6,576 | | 6,574 | | 6,568 | | 6,558 | | 6,531 | | | 6,693 | | 6,608 | | 6,576 | | 6,574 | | 6,568 | | Diluted | | 6,576 | | 6,611 | | 6,583 | | 6,577 | | 6,601 | | | 6,929 | | 6,697 | | 6,576 | | 6,611 | | 6,583 | | Total assets | | $ | 150,971 | | $ | 179,906 | | $ | 185,014 | | $ | 184,176 | | $ | 165,221 | | | $ | 164,677 | | $ | 157,670 | | $ | 150,971 | | $ | 179,906 | | $ | 185,014 | | Property, plant and equipment, net | | 23,298 | | 26,372 | | 28,168 | | 24,158 | | 26,141 | | | 21,387 | | 21,614 | | 23,298 | | 26,372 | | 28,168 | | Capital expenditures | | 1,203 | | 1,228 | | 10,839 | | 3,411 | | 3,347 | | | 2,573 | | 1,251 | | 1,203 | | 1,228 | | 10,839 | | Long-term debt | | — | | 20,811 | | 21,336 | | 21,846 | | 12,800 | | | — | | — | | — | | 20,811 | | 21,336 | | Working capital (current assets less current liabilities) | | 78,416 | | 100,920 | | 97,902 | | 95,551 | | 83,952 | | | 100,683 | | 90,800 | | 78,416 | | 100,920 | | 97,902 | | Shareholders’ equity | | $ | 106,998 | | $ | 112,752 | | $ | 112,679 | | $ | 106,066 | | $ | 103,361 | | | $ | 128,573 | | $ | 117,612 | | $ | 106,998 | | $ | 112,752 | | $ | 112,679 | | SELECTED RATIOS | | | | | | | | | | | | | | | | | | | | | | | Net (loss) income, as a percent of sales | | (0.5 | ) | | 1.0 | | 2.2 | | 1.1 | | 1.2 | | | Net income (loss), as a percent of sales | | | 3.1 | | 3.3 | | (0.5 | ) | | 1.0 | | 2.2 | | Current ratio | | 3.2 to 1 | | 3.5 to 1 | | 3.2 to 1 | | 2.9 to 1 | | 3.0 to 1 | | | 4.6 to 1 | | 3.9 to 1 | | 3.2 to 1 | | 3.5 to 1 | | 3.2 to 1 | | Return on ending shareholders’ equity, as a percent of sales | | (1.4 | ) | | 3.8 | | 8.3 | | 4.5 | | 4.8 | | | Return on ending shareholders’ equity | | | 8.1 | | 9.2 | | (1.4 | ) | | 3.8 | | 8.3 | | Average number of employees | | 1,600 | | 2,140 | | 2,290 | | 2,400 | | 2,460 | | | 1,320 | | 1,400 | | 1,600 | | 2,140 | | 2,290 | |
| | | (1) | (1)Fiscal 2011 net income and per share amounts include charges consisting of employee separation costs and inventory write down related to closing a manufacturing facility of $1.0 million (after tax) or $0.15 per share.
| (2) | Fiscal 2009 net loss and per share amounts reflect facility consolidation and other costs (after tax) of $1.5 million or $(0.23)$0.23 per share. | | | | | (2)(3)
| Fiscal 2007 net income and per share amounts reflect the net gain (after tax) on sale of building of approximately $2.5 million or $0.37 per share, the gain on life insurance of $0.6 million or $0.08 per share and the net gain (after tax) on the sale of vacant land of approximately $0.2 million or $0.04 per share. | | | | | (3)
| Fiscal 2009, 2008, 2007 and 2006 net (loss) income and per share amounts reflect the recording of stock-based compensation expense, as required by Statement of Financial Accounting Standard No. 123 (Revised), of $0.1 million, $0.1 million, $0.2 million and $0.4 million (after tax), respectively, or $0.02 per share, $0.02 per share, $0.04 per share and $0.06 per share, respectively.
| | | | | (4)
| Fiscal 2005 net income and per share amounts reflect a net gain (after tax) on the sale of facilities of approximately $0.5 million or $0.08 per share.
| | | | | (5)
| During Fiscal 2005, an examination by the Internal Revenue Service of the Company’s federal income tax returns for the fiscal years ended June 30, 2004 and 2005 was completed. Due to the favorable settlement results, the Company reduced its estimate of accrued tax liabilities by $0.7 million. The decrease resulted in an income tax rate of 30.6% for the fiscal year ended June 30, 2005.
|
| | Item 7. | Management’s Discussion and Analysis of Financial Condition and Results of Operations |
General The following analysis of the results of operations and financial condition of the Company should be read in conjunction with the consolidated financial statements and related notes included elsewhere in this Annual Report on Form 10-K. Critical Accounting Policies The discussion and analysis of the Company’s consolidated financial statements and results of operations are based on consolidated financial statements prepared in accordance with accounting principles generally accepted in the United States of America. Preparation of these consolidated financial statements requires the use of estimates and judgments that affect the reported results. The Company uses estimates based on the best information available in recording transactions and balances resulting from business operations. Estimates are used for such items as collectibility of trade accounts receivable and inventory valuation, depreciable lives, self-insurance programs, warranty costs and income taxes.valuation. Ultimate results may differ from these estimates under different assumptions or conditions. Allowance for doubtful accounts – the Company establishes an allowance for doubtful accounts through review of open accounts, and historical collection and allowances amounts. The allowance for doubtful accounts is intended to reduce trade accounts receivable to the amount that reasonably approximates their net realizable fair value due to their short-term nature.value. The amount ultimately realized from trade accounts receivable may differ from the amount estimated in the consolidated financial statements based on collection experience and actual returns and allowances.experience. Inventories – the Company values inventory at the lower of cost or market. A large portion of our finished goods inventory is made to order and many of our raw material parts are interchangeable between products. Management assesses the inventory on hand and if necessary writes down the obsolete or excess inventory to market. Revenue recognition – is upon delivery of product to our customer and when collectibility is reasonably assured. Delivery of product to our customer is evidenced through the shipping terms indicating when title and risk of loss is transferred. Our ordering process creates persuasive evidence of the sale arrangement and the sales amount is determined. The delivery of the goods to our customer completes the earnings process. Net sales consist of product sales and related delivery charge revenue, net of adjustments for returns and allowances. Shipping and handling costs are included in cost of goods sold. Recently Issued Accounting Pronouncements See Item 8. Note 1 to the Company’s Consolidated Financial Statements. Results of Operations The following table has been prepared as an aid in understanding the Company’s results of operations on a comparative basis for the fiscal years ended June 30, 2009, 20082011, 2010 and 2007.2009. Amounts presented are percentages of the Company’s net sales. | | | | | | | | | | | | | FOR THE YEARS ENDED JUNE 30, | | | | 2009 | | 2008 | | 2007 | | Net sales | | | 100.0 | % | | 100.0 | % | | 100.0 | % | Cost of goods sold | | | (81.2 | ) | | (80.7 | ) | | (80.9 | ) | Gross margin | | | 18.8 | | | 19.3 | | | 19.1 | | Selling, general and administrative | | | (18.8 | ) | | (17.5 | ) | | (16.7 | ) | Facility consolidation and other charges | | | (0.8 | ) | | — | | | — | | Gain on sale of land and building | | | — | | | — | | | 1.0 | | Operating (loss) income | | | (0.8 | ) | | 1.8 | | | 3.4 | | Other expense, net | | | 0.0 | | | (0.2 | ) | | 0.0 | | (Loss) income before income taxes | | | (0.8 | ) | | 1.6 | | | 3.4 | | Income tax benefit (provision) | | | 0.3 | | | (0.6 | ) | | (1.2 | ) | Net (loss) income | | | (0.5 | )% | | 1.0 | % | | 2.2 | % |
| | | | | | | | | | | | | FOR THE YEARS ENDED JUNE 30, | | | | 2011 | | 2010 | | 2009 | | Net sales | | | 100.0 | % | | 100.0 | % | | 100.0 | % | Cost of goods sold | | | (77.2 | ) | | (77.2 | ) | | (81.2 | ) | Gross margin | | | 22.8 | | | 22.8 | | | 18.8 | | Selling, general and administrative | | | (17.8 | ) | | (17.5 | ) | | (18.8 | ) | Facility consolidation and other charges | | | (0.3 | ) | | — | | | (0.8 | ) | Operating income (loss) | | | 4.7 | | | 5.3 | | | (0.8 | ) | Other income, net | | | 0.1 | | | 0.0 | | | 0.0 | | Income (loss) before income taxes | | | 4.8 | | | 5.3 | | | (0.8 | ) | Income tax (provision) benefit | | | (1.7 | ) | | (2.0 | ) | | 0.3 | | Net income (loss) | | | 3.1 | % | | 3.3 | % | | (0.5 | )% |
Fiscal 20092011 Compared to Fiscal 20082010 Net sales for the fiscal year ended June 30, 20092011 were $324.2$339.4 million compared to $405.7$326.5 million in the prior fiscal year, a decreasean increase of 20.1%4%. Residential net sales were $230.7 million compared to $258.1 million inFor the fiscal year ended June 30, 2008, a decrease of 10.6%. Commercial net sales were $77.2 million for the fiscal year ended June 30, 2009, a decrease of 15.6% from net sales of $91.5 million for the fiscal year ended June 30, 2008. Recreational vehicle net sales were $16.2 million for the fiscal year ended June 30, 2009, a decrease of 71.1% from $56.1 million for the fiscal year ended June 30, 2008. The recreational vehicle industry continues to be the hardest hit product category with the initial impact of high fuel costs compounded by credit tightening and lack of consumer confidence in the economy as a whole. Recreational vehicle industry published data indicates that motor home unit sales, the sector that encompasses the majority of our sales, are down nearly 80%. The commercial seating product category held up well early in our fiscal year, but fell considerably as the U. S. economy contracted and credit tightened. We believe that our2011, residential product category has performed reasonably well in relation to our competition. However, residential furniture remains a deferrable purchase item and is adversely impacted by tighter consumer credit, higher unemployment and low levels of consumer confidence.
Gross margin for the fiscal years ended June 30, 2009 and 2008 was 18.8% and 19.3%, respectively. The decrease in gross margin percentage for the year is primarily due to an approximate $2.0 million adjustment to realizable value on inventory and to a lesser extent to under-utilization of capacity on significantly lower sales volume. These factors were partially offset by a LIFO benefit increase of approximately $0.6 million.
Selling, general and administrative expenses were 18.8% and 17.5% of net sales for the fiscal years ended June 30, 2009 and 2008, respectively. The percentage increase in selling, general and administrative costs is primarily due to under-absorption of fixed costs on the lower sales volume and the lag time in reducing advertising and other sales support costs to the lower volume.
The Company recorded $2.6 million in facility consolidation and employee separation costs during fiscal year 2009. These costs related to consolidating manufacturing operations and workforce reductions to bring production capacity in line with current and expected demand for the Company’s products.
Interest expense decreased $0.5 million to $1.0 million for the fiscal year ended June 30, 2009 due to lower borrowings and interest rates.
Although the Company’s full year tax rate is typically in the 35% - 39% range, fiscal year ended June 30, 2009 reflects an effective income tax benefit rate of 41.5% due to losses or low level of earnings in various tax jurisdictions. The effective income tax expense rate was 35.8% for the fiscal year ended June 30, 2008.
The above factors resulted in net loss for the fiscal year ended June 30, 2009 of $1.5 million or $0.23 per share compared to net income of $4.2 million or $0.64 per share for the fiscal year ended June 30, 2008.
All earnings per share amounts are on a diluted basis.
Fiscal 2008 Compared to Fiscal 2007
Net sales for the fiscal year ended June 30, 2008 were $405.7 million compared to $425.4 million in the prior fiscal year, a decrease of 4.6%. Residential net sales were $258.1 million compared to $259.7$246.0 million infor the fiscal year ended June 30, 2007, a decrease2010, an increase of 0.6%4.9%. Commercial net sales were $91.5$81.3 million for the fiscal year ended June 30, 2008, a decrease2011, an increase of 8.1%1.1% from net sales of $80.5 million for the fiscal year ended June 30, 2007. Recreational vehicle net sales were $56.1 million2010.
Gross margin for the fiscalyears ended June 30, 2011 and 2010 was 22.8%. The gross margin for the year ended June 30, 2008, a decrease of 15.2% from2011, includes the fiscal year ended June 30, 2007. The fiscal year decline in all net sales categories is due to a generally soft market environment. Net income for the fiscal year ended June 30, 2008 was $4.2 million or $0.64 per share compared to $9.3 million or $1.42 per share in the fiscal year ended June 30, 2007. Results for the fiscal year ended June 30, 2007 were favorably impacted by three significant non-recurring events. The Company sold a commercial property, which resulted in a pre-tax gain of approximately $4.0 million, or $0.37 per share after tax. The Company recognized a pre-tax gain on the sale of vacant land of approximately $0.4 million or $0.04 per share after tax. These gains are reported as “Gain on sale of capital assets” in the Consolidated Statements of Operations. The Company also realized a non-taxable gain on life insurance of $0.6 million or $0.08 per share. This gain is included in “Interest and other income” in the Consolidated Statements of Operations.inventory write-down related to facility closing offset by operational improvements.
Gross margin for For the fiscal years ended June 30, 20082011 and 2007 was 19.3% and 19.1%, respectively.
Selling,2010, selling, general and administrative expenses were 17.5 %17.8% and 16.7%17.5% of net sales, for the fiscal years ended June 30, 2008 and 2007, respectively. The percentage increase for the year ended June 30, 2011 reflects higher legal and professional fees.
Operating income decreased by $1.7 million in selling, general and administrative costs comparedfiscal year 2011 in comparison to the prior year. During fiscal year 2011, the Company recorded pre-tax charges of $1.6 million related to closing a manufacturing facility. Of these pre-tax charges, employee separation and other closing costs of $1.0 million are reported as facility closing costs and an inventory write-down of $0.6 million is due primarily to higher marketing and sales support expenses and higher bad debt expensereported as cost of $1.1 million on reduced revenues on a year over year basis.goods sold. The effective income tax rate for the fiscal year ended June 30, 20082011 was 35.8%, reflecting lower net income35.7% compared to the prior year.38.1% for fiscal year 2010. The change in effective income tax rate was 35.6% for the fiscal year ended June 30, 2007. The 2007 rate was reduced by approximately 1.4%is primarily due to the non-taxable life insurance gain.change in provision for uncertain tax positions related to various state taxing jurisdictions, stock-based compensation and the benefit of the Domestic Manufacturing Deduction under Internal Revenue Code Section 199 (DMD), which provides a tax benefit on U.S. based manufacturing. The DMD tax benefit available in previous years was being phased in by statute and was therefore lower than the full DMD tax benefit for 2011. The above factors resulted in net income for the fiscal year ended June 30, 20082011 of $4.2$10.4 million or $0.64$1.50 per share compared to $9.3$10.8 million or $1.42$1.61 per share for thein fiscal year ended June 30, 2007.2010. All earnings per share amounts are on a diluted basis. Fiscal 2010 Compared to Fiscal 2009 Net sales for fiscal 2010 were $326.5 million compared to $324.2 million in the prior fiscal year, an increase of 1%. Residential net sales were $246.0 million compared to $230.7 million in fiscal 2009, an increase of 7%. Commercial net sales were $80.5 million for fiscal 2010, a decrease of 14% from net sales of $93.5 million for fiscal 2009. The Company’s operating income improved by $19.8 million in fiscal year 2010 in comparison to the prior year. The Company benefited from strategies implemented and actions taken during fiscal year 2009 including consolidation of manufacturing operations and workforce reductions that brought production capacity and fixed overhead more in line with current product demand. During the prior fiscal year, the Company recorded pre-tax charges of approximately $2.6 million related to facility consolidation and employee separation costs. Company-wide employment was reduced approximately 30% through plant closures and workforce reductions and remains at these reduced levels. These factors contributed significantly to gross margin improvements and selling, general and administrative expense reductions. Gross margin for fiscal year 2010 was 22.8% compared to 18.8% for the prior year period. The gross margin improvements for the year were greatly impacted by the operational changes discussed above. In addition, gross margin improved due to stability in material and product costs and lower ocean freight costs. For the fiscal years ended 2010 and 2009, selling, general and administrative expenses were 17.5% and 18.8% of net sales, respectively. These percentage improvements are due to the operational changes discussed above, as well as, lower bad debt and advertising costs. Interest expense decreased $0.6 million to $0.4 million for fiscal year 2010 due to lower borrowings. The effective tax rate for the fiscal year ended June 30, 2010 was 38.1%. The effective income tax benefit rate was 41.5% for fiscal year 2009 due to losses or low level of earnings in various tax jurisdictions. The above factors resulted in net income for the fiscal year ended June 30, 2010 of $10.8 million or $1.61 per share compared to a net loss of $1.5 million or $0.23 per share in fiscal 2009.
All earnings per share amounts are on a diluted basis. Liquidity and Capital Resources Net cash provided by operating activities Working capital (current assets less current liabilities) at June 30, 2011 was $17.3$100.7 million for fiscal year 2009as compared to $8.7$90.8 million in fiscal year 2008. Cash from operating activities was used primarily to reduce borrowings by $16.0 million and pay dividends of $2.9 million.at June 30, 2010. Significant changes in working capital from June 30, 20082010 to June 30, 20092011 included increased cash of $9.6 million and decreased accruals of $2.4 million offset by decreased accounts receivable of $12.5 million, decreased inventory of $11.9 million and decreased accounts payable of $4.8$4.3 million. The decrease in receivables is relateddue to timing of collections and lower shipment volume. Lower customer demand for our products reduced production levels and finished product purchases which resultedvolume in an inventory decrease. The decrease in accounts payable related to lower purchase volume based on current demand. The Company expects that due to the nature of our operations that there will be continuing fluctuations in accounts receivable, inventory, accounts payable, and cash flows from operations due to the following: (i) we purchase selected inventory items from offshore suppliers with long lead times and depending on the timing of the delivery of those orders inventory levels can be greatly impacted, and (ii) we have various customers that purchase large quantities of inventory periodically and the timing of those purchases can significantly impact inventory levels, accounts receivable, accounts payable and short-term borrowings. As discussed below the Company believes it has adequate financing arrangements and access to capital to absorb these fluctuations in operating cash flow.fourth fiscal quarter.
Net cash provided by investingoperating activities was $0.4 million in fiscal year 2009 compared to cash used in investing activities of $1.0 million in fiscal year 2008. Proceeds from the sale of investments were $1.5 million. Proceeds from the sale of capital assets were $0.7 million. Capital expenditures were $1.2$13.8 million for the fiscal year ended 2009.June 30, 2011 reflecting net income of $10.4 million, changes in operating assets and liabilities of $1.3 million and non-cash charges of $4.7 million. The change in net cash provided by operating activities of $19.1 million in fiscal year 2010 was comprised primarily of net income of $10.8 million, changes in operating assets and liabilities of $4.4 million and non-cash charges of $3.9 million. Depreciation and amortization expense was $3.7$2.7 million and $4.4$3.0 million for the fiscal years ended June 30, 20092011 and 2008,2010, respectively. Net cash used in investing activities was $2.7 million in fiscal year 2011 compared to cash used by investing activities of $1.6 million in fiscal year 2010. Net purchases of investments were $0.3 million. Capital expenditures were $2.6 million during fiscal year 2011. Net cash used in financing activities was $1.5 million in fiscal year 2011, primarily for the payment of dividends of $1.8 million, compared to $11.0 million in fiscal year 2010. For fiscal year 2010, the cash was used primarily to reduce borrowings by $10.0 million and pay dividends of $1.3 million. The Company expects that capital expenditures will be approximately $2.0$15.0 million in fiscal year 2010. Net cash used2012. The Company plans to invest approximately $12 million to construct, furnish and equip a corporate office building in financing activities was $18.8 million in fiscal year 2009 compared to $5.8 million in fiscal year 2008. Cash from operating activities was used to reduce borrowings by $16.0 millionDubuque, Iowa, and pay dividendsthe balance of $2.9 million. Borrowings were reduced by $2.4 millionthe expenditures on delivery and dividends paid were $3.4 million in fiscal year 2008.
manufacturing equipment. Management believes that the Company has adequate cash and credit arrangements to meet its operating and capital requirements for fiscal year 2010.2012, including the construction of a corporate office. In the opinion of management, the Company’s liquidity and credit resources provide it with the ability to react to opportunities as they arise, to pay quarterly dividends to its shareholders, and to purchase productive capital assets that enhance safety and improve operations. However, should the current economic conditions continue for an extended period of time or deteriorate significantly, we would further evaluate all uses of cash and credit facilities, including the payment of dividends and purchase of capital assets.
At June 30, 2009,2011, the Company has no long-term debt obligations and therefore, no contractual interest related to long-term debt.payments are included in the table below. The following table summarizes the Company’s contractual obligations at June 30, 20092011 and the effect these obligations are expected to have on the Company’s liquidity and cash flow in the future (in thousands): | | | | | | | | | | | | | | | | | | | Total | | Less than
1 Year | | 1 - 3
Years | | 3 - 5
Years | | More than
5 Years | | Notes payable | | $ | 10,000 | | $ | 10,000 | | $ | — | | $ | — | | $ | — | | Operating lease obligations | | | 5,775 | | | 2,022 | | | 3,110 | | | 643 | | | — | | Total contractual obligations | | $ | 15,775 | | $ | 12,022 | | $ | 3,110 | | $ | 643 | | $ | — | |
| | | | | | | | | | | | | | | | | | | Total | | Less than
1 Year | | 1 - 3
Years | | 3 - 5
Years | | More than
5 Years | | Operating lease obligations | | $ | 4,082 | | $ | 1,851 | | $ | 2,231 | | $ | — | | $ | — | |
Contractual obligations associated with the Company’s deferred compensation plans were excluded from the table above as the Company cannot predict when the events that trigger payment will occur. Total accumulated deferred compensation liabilities were $5.0$5.3 million at June 30, 2009.2011. At June 30, 20092011 the Company had no capital lease obligations, and no purchase obligations for raw materials or finished goods. The purchase price on all open purchase orders was fixed and denominated in U.S. dollars. Additionally, the Company has excluded the FIN 48tax contingency reserve from the above table, as the timing of payments, if any, cannot be reasonably estimated. Financing Arrangements See Note 76 to the Consolidated Financial Statements on page 23 of this Annual Report on Form 10-K.
Outlook We believe thathad modest gains in sales for the consolidation of manufacturing operations and workforce reductions thatcurrent year over the Company completed duringprior year partially due to a strong backlog entering the year. We enter fiscal year has brought production capacity2012 with lower backlogs and fixed overhead more in line with current and expected demand for our products. Company wide employment has been reduced approximately 30% over the pastanticipate that first quarter fiscal year through plant closures and workforce reductions related to business conditions. Demand for our products is dependent on factors2012 sales will be lower than first quarter fiscal year 2011. Macroeconomic conditions, such as, consumer confidence, affordablehigh unemployment, minimal job growth, a weak housing reasonably attainable financingmarket and an economy with low levels of unemployment and high levelsconsumer confidence continue to adversely impact our business. The macroeconomic environment tempers expectations of disposable income. These factors remain in depressed positions, and indications are that they will remain that way intop line growth through the near-term. We are not anticipating significant improvements in market conditions at this time, and are managing our business on that basis.
first part of fiscal year 2012. The commercial office industry is reporting improving order trends. While we expect that current business conditionshave benefited minimally from those improvements to date, we believe we will persistsee increased sales volume during fiscal year 2012. We anticipate increased orders for the remainder of calendarhospitality products during fiscal year 2009, we2012 resulting from pent up demand caused by delays in typical refurbishing cycles for hotel properties. We remain optimistic thatcommitted to our strategy ofcore strategies, which include a wide range of quality product offerings and price points to the residential recreational vehicle and commercial markets, combined with oura conservative approach to business will be rewarded when business conditions improve.business. We will maintain our focus on a strong balance sheet during these challenging economic times through emphasis on cash flow and improving profitability. We believe these core strategies are in the best interest of our shareholders. | | Item 7A. | Quantitative and Qualitative Disclosures About Market Risk |
General– Market risk represents the risk of changes in the value of a financial instrument, derivative or non-derivative, caused by fluctuations in interest rates, foreign exchange rates and equity prices. As discussed below, management of the Company does not believe that changes in these factors could cause material fluctuations in the Company’s results of operations or cash flows. The ability to import furniture products can be adversely affected by political issues in the countries where suppliers are located, disruptions associated with shipping distances and negotiations with port employees. Other risks related to furniture product importation include government imposition of regulations and/or quotas; duties and taxes on imports; and significant fluctuation in the value of the U.S. dollar against foreign currencies. Any of these factors could interrupt supply, increase costs and decrease earnings. Inflation – Increased operating costs are reflected in product or services pricing with any limitations on price increases determined by the marketplace. Inflation or other pricing pressures could impact raw material costs, labor costs and interest rates which are important components of costs for the Company and could have an adverse effect on our profitability, especially where increases in these costs exceed price increases on finished products. Foreign Currency Risk – During fiscal years 2009, 20082011, 2010 and 2007,2009, the Company did not have sales, purchases, or other expenses denominated in foreign currencies. As such, the Company is not directly exposed to market risk associated with currency exchange rates and prices. Interest Rate Risk –The Company’s primary market risk exposure with regard to financial instruments is changes in interest rates. At June 30, 2009, a hypothetical 100 basis point increase in short-term interest rates would decrease annual pre-tax earnings by approximately $50,000, assuming no change in the volume or composition of debt. As of June 30, 2009,2011, the Company has effectively fixed the interest rates at 5.0% on approximately $10.0 million of itsdoes not have any debt through the use of interest rate swaps, and the above estimated earnings reduction takes these swaps into account. On July 31, 2009, a $5.0 million swap matured. As of the date of this Annual Report on Form 10-K, the Company has effectively fixed its interest rate at 4.9% on approximately $5.0 million of its debt through the use of interest rate swaps. As of June 30, 2009 and 2008, the fair value of these swaps is a liability of approximately $0.3 million and is included in other long-term liabilities.
Tariffs – The Company has exposure to actions by governments, including tariffs. Tariffs are a possibility on any imported or exported products.
Inflation – Increased operating costs are reflected in product or services pricing with any limitations on price increases determined by the marketplace. The impact of inflation on the Company has not been significant during the past three years because of the relatively low rates of inflation experienced in the United States. Raw material costs, labor costs and interest rates are important components of costs for the Company. Inflation or other pricing pressures could impact any or all of these components, with a possible adverse effect on our profitability, especially where increases in these costs exceed price increases on finished products. In recent years, the Company has faced strong inflationary and other pricing pressures with respect to steel, fuel and health care costs, which have been partially mitigated by pricing adjustments.outstanding.
| | Item 8. | Financial Statements and Supplementary Data |
| | | | | | Page(s) | | Report of Independent Registered Public Accounting Firm | | 14 | Consolidated Balance Sheets at June 30, 2011 and 2010 | | 15 | | Consolidated Balance Sheets at June 30, 2009 and 2008
| | 16
| | Consolidated Statements of Operations for the Years Ended June 30, 2009, 2008,2011, 2010 and 20072009 | | 17
| 16 | Consolidated Statements of Changes in Shareholders’ Equity for the Years Ended June 30, 2009, 2008,2011, 2010 and 20072009 | | 18
| 17 | Consolidated Statements of Cash Flows for the Years Ended June 30, 2009, 2008,2011, 2010 and 20072009 | | 19
| 18 | Notes to Consolidated Financial Statements | | 20
| 19-28 |
REPORT OF INDEPENDENT REGISTERED PUBLIC ACCOUNTING FIRM To the ShareholdersBoard of Directors and Stockholders of Flexsteel Industries, Inc. We have audited the accompanying consolidated balance sheets of Flexsteel Industries, Inc. and subsidiaries (the “Company”) as of June 30, 20092011 and 2008,2010, and the related consolidated statements of income, stockholders’operations, changes in shareholders’ equity, and cash flows for each of the three years in the period ended June 30, 2009.2011. Our audits also included the financial statement schedule listed in the Index at Item 15. These financial statements and financial statement schedule are the responsibility of the Company’s management. Our responsibility is to express an opinion on the financial statements and financial statement schedule based on our audits. We conducted our audits in accordance with the standards of the Public Company Accounting Oversight Board (United States). Those standards require that we plan and perform the audit to obtain reasonable assurance about whether the financial statements are free of material misstatement. The Company is not required to have, nor were we engaged to perform, an audit of its internal control over financial reporting. Our audits included consideration of internal control over financial reporting as a basis for designing audit procedures that are appropriate in the circumstances, but not for the purpose of expressing an opinion on the effectiveness of the Company’s internal control over financial reporting. Accordingly, we express no such opinion. An audit also includes examining, on a test basis, evidence supporting the amounts and disclosures in the financial statements, assessing the accounting principles used and significant estimates made by management, as well as evaluating the overall financial statement presentation. We believe that our audits provide a reasonable basis for our opinion. In our opinion, such consolidated financial statements present fairly, in all material respects, the financial position of Flexsteel Industries, Inc. and subsidiaries atas of June 30, 20092011 and 2008,2010, and the results of their operations and their cash flows for each of the three years in the period ended June 30, 2009,2011, in conformity with accounting principles generally accepted in the United States of America. Also, in our opinion, such financial statement schedule, when considered in relation to the basic consolidated financial statements taken as a whole, presentpresents fairly, in all material respects, the information set forth therein. DELOITTE & TOUCHE LLP
Minneapolis, Minnesota
August 26, 2009
| | DELOITTE & TOUCHE LLP | | Minneapolis, Minnesota | | August 19, 2011 | |
| | | | | | | | FLEXSTEEL INDUSTRIES, INC. AND SUBSIDIARIES
Consolidated Balance Sheets | | | | | | | | | | | | | | | | | | JUNE 30, | | | | 2009 | | 2008 | | | ASSETS | | | | | | | | CURRENT ASSETS: | | | | | | | | Cash and cash equivalents | | $ | 1,713,717 | | $ | 2,841,323 | | Investments | | | — | | | 1,160,066 | | Trade receivables – less allowance for doubtful accounts: 2009, $1,760,000; 2008, $2,110,000 | | | 31,282,511 | | | 43,783,224 | | Inventories | | | 73,844,345 | | | 85,791,400 | | Deferred income taxes | | | 3,960,000 | | | 4,210,000 | | Other | | | 3,912,528 | | | 2,853,634 | | Total current assets | | | 114,713,101 | | | 140,639,647 | | NONCURRENT ASSETS: | | | | | | | | Property, plant and equipment, net | | | 23,297,643 | | | 26,372,392 | | Deferred income taxes | | | 2,145,187 | | | 1,392,187 | | Other assets | | | 10,815,052 | | | 11,501,992 | | TOTAL | | $ | 150,970,983 | | $ | 179,906,218 | | | | | | | | | | LIABILITIES AND SHAREHOLDERS’ EQUITY | | | | | | | | | | | | | | | | CURRENT LIABILITIES: | | | | | | | | Accounts payable – trade | | $ | 9,744,658 | | $ | 14,580,275 | | Notes payable and current maturities on long-term debt | | | 10,000,000 | | | 5,142,945 | | Accrued liabilities: | | | | | | | | Payroll and related items | | | 4,937,712 | | | 6,759,941 | | Insurance | | | 6,519,538 | | | 7,176,799 | | Other | | | 5,095,162 | | | 6,059,575 | | Total current liabilities | | | 36,297,070 | | | 39,719,535 | | LONG-TERM LIABILITIES: | | | | | | | | Long-term debt | | | — | | | 20,810,597 | | Deferred compensation | | | 4,991,435 | | | 5,343,545 | | Other liabilities | | | 2,684,914 | | | 1,280,154 | | Total liabilities | | | 43,973,419 | | | 67,153,831 | | | | | | | | | | COMMITMENTS AND CONTINGENCIES (Note 13) | | | | | | | | | | | | | | | | SHAREHOLDERS’ EQUITY: | | | | | | | | Cumulative preferred stock – $50 par value; authorized 60,000 shares; outstanding – none | | | | | | | | Undesignated (subordinated) stock – $1 par value; authorized 700,000 shares; outstanding – none | | | | | | | | Common stock – $1 par value; authorized 15,000,000 shares; outstanding 2009, 6,576,373 shares; 2008, 6,575,633 shares | | | 6,576,373 | | | 6,575,633 | | Additional paid-in capital | | | 4,369,263 | | | 4,255,996 | | Retained earnings | | | 97,815,822 | | | 101,692,431 | | Accumulated other comprehensive (loss) income | | | (1,763,894 | ) | | 228,327 | | Total shareholders’ equity | | | 106,997,564 | | | 112,752,387 | | TOTAL | | $ | 150,970,983 | | $ | 179,906,218 | |
| FLEXSTEEL INDUSTRIES, INC. AND SUBSIDIARIES | Consolidated Balance Sheets | (Amounts in thousands, except share and per share data) |
| | | | | | | | | | JUNE 30, | | | | 2011 | | 2010 | | | ASSETS | | | | | | | CURRENT ASSETS: | | | | | | | | Cash | | $ | 17,889 | | $ | 8,278 | | Trade receivables – less allowance for doubtful accounts: 2011, $2,000; 2010, $2,020 | | | 31,451 | | | 35,748 | | Inventories | | | 73,680 | | | 72,637 | | Deferred income taxes | | | 3,700 | | | 4,050 | | Other | | | 1,633 | | | 1,076 | | Total current assets | | | 128,353 | | | 121,789 | | NONCURRENT ASSETS: | | | | | | | | Property, plant and equipment, net | | | 21,387 | | | 21,614 | | Deferred income taxes | | | 2,560 | | | 3,010 | | Other assets | | | 12,377 | | | 11,257 | | TOTAL | | $ | 164,677 | | $ | 157,670 | | | | | | | | | | LIABILITIES AND SHAREHOLDERS’ EQUITY | | | | | | | | | | | | | | | | CURRENT LIABILITIES: | | | | | | | | Accounts payable – trade | | $ | 9,899 | | $ | 10,815 | | Accrued liabilities: | | | | | | | | Payroll and related items | | | 6,922 | | | 7,023 | | Insurance | | | 5,645 | | | 6,192 | | Other | | | 5,204 | | | 6,959 | | Total current liabilities | | | 27,670 | | | 30,989 | | LONG-TERM LIABILITIES: | | | | | | | | Deferred compensation | | | 5,270 | | | 5,096 | | Other liabilities | | | 3,164 | | | 3,973 | | Total liabilities | | | 36,104 | | | 40,058 | | | | | | | | | | COMMITMENTS AND CONTINGENCIES (Note 12) | | | | | | | | | | | | | | | | SHAREHOLDERS’ EQUITY: | | | | | | | | Cumulative preferred stock – $50 par value; authorized 60,000 shares; outstanding – none | | | | | | | | Undesignated (subordinated) stock – $1 par value; authorized 700,000 shares; outstanding – none | | | | | | | | Common stock – $1 par value; authorized 15,000,000 shares; outstanding 2011, 6,710,612 shares; 2010, 6,645,532 shares | | | 6,711 | | | 6,646 | | Additional paid-in capital | | | 6,698 | | | 5,425 | | Retained earnings | | | 115,699 | | | 107,293 | | Accumulated other comprehensive loss | | | (535 | ) | | (1,752 | ) | Total shareholders’ equity | | | 128,573 | | | 117,612 | | TOTAL | | $ | 164,677 | | $ | 157,670 | |
See accompanying Notes to Consolidated Financial Statements.
| FLEXSTEEL INDUSTRIES, INC. AND SUBSIDIARIESFLEXSTEEL INDUSTRIES, INC. AND SUBSIDIARIES
| Consolidated Statements of Operations | (Amounts in thousands, except per share data) |
Consolidated Statements of Operations | | | | | | | | | | | | | FOR THE YEARS ENDED JUNE 30, | | | | 2009 | | 2008 | | 2007 | | | | | | | | | | | | | NET SALES | | $ | 324,157,556 | | $ | 405,654,829 | | $ | 425,399,951 | | COST OF GOODS SOLD | | | (263,083,274 | ) | | (327,165,396 | ) | | (344,176,763 | ) | GROSS MARGIN | | | 61,074,282 | | | 78,489,433 | | | 81,223,188 | | SELLING, GENERAL AND ADMINISTRATIVE | | | (60,791,151 | ) | | (70,893,485 | ) | | (70,895,260 | ) | FACILITY CONSOLIDATION AND OTHER CHARGES | | | (2,554,771 | ) | | — | | | — | | GAIN ON SALE OF CAPITAL ASSETS | | | — | | | — | | | 4,370,712 | | OPERATING (LOSS) INCOME | | | (2,271,640 | ) | | 7,595,948 | | | 14,698,640 | | OTHER INCOME (EXPENSE): | | | | | | | | | | | Interest and other income | | | 661,058 | | | 468,933 | | | 1,276,857 | | Interest expense | | | (968,762 | ) | | (1,468,476 | ) | | (1,491,510 | ) | Total | | | (307,704 | ) | | (999,543 | ) | | (214,653 | ) | (LOSS) INCOME BEFORE INCOME TAXES | | | (2,579,344 | ) | | 6,596,405 | | | 14,483,987 | | INCOME TAX BENEFIT (PROVISION) | | | 1,070,000 | | | (2,360,000 | ) | | (5,150,000 | ) | NET (LOSS) INCOME | | $ | (1,509,344 | ) | $ | 4,236,405 | | $ | 9,333,987 | | | | | | | | | | | | | WEIGHTED AVERAGE NUMBER OF COMMON SHARES OUTSTANDING: | | | | | | | | | | | Basic | | | 6,576,373 | | | 6,573,999 | | | 6,567,522 | | Diluted | | | 6,576,373 | | | 6,611,136 | | | 6,582,558 | | | | | | | | | | | | | (LOSS) EARNINGS PER SHARE OF COMMON STOCK: | | | | | | | | | | | Basic | | $ | (0.23 | ) | $ | 0.64 | | $ | 1.42 | | Diluted | | $ | (0.23 | ) | $ | 0.64 | | $ | 1.42 | | | | | | | | | | | | | CASH DIVIDENDS DECLARED PER COMMON SHARE | | $ | 0.36 | | $ | 0.52 | | $ | 0.52 | | | | | | | | | | | | | See accompanying Notes to Consolidated Financial Statements. |
| | | | | | | | | | | | | | | | | FLEXSTEEL INDUSTRIES, INC. AND SUBSIDIARIES
Consolidated Statements of Changes in Shareholders’ Equity | | | | | | | | | | | | | | | | | | | | Total Par
Value of
Common
Shares ($1 Par) | | Additional
Paid-In
Capital | | Retained
Earnings | | Accumulated
Other
Comprehensive
(Loss) Income | | Total | | | | | | | | | | | | | | | | | | | Balance at July 1, 2006 | | $ | 6,563,750 | | $ | 3,670,152 | | $ | 95,065,832 | | $ | 766,112 | | $ | 106,065,846 | | Issuance of common stock: | | | | | | | | | | | | | | | | | Stock options exercised, net | | | 1,566 | | | 10,891 | | | — | | | — | | | 12,457 | | 401(k) plan shares | | | 5,151 | | | 58,413 | | | — | | | — | | | 63,564 | | Unrealized gain on available for sale investments, net of tax | | | — | | | — | | | — | | | 301,611 | | | 301,611 | | Stock-based compensation | | | — | | | 274,000 | | | — | | | — | | | 274,000 | | Interest rate swaps valuation adjustment, net of tax | | | — | | | — | | | — | | | (168,137 | ) | | (168,137 | ) | SFAS No. 87 minimum pension liability | | | — | | | — | | | — | | | 254,638 | | | 254,638 | | SFAS No. 158 transition adjustment | | | — | | | — | | | — | | | (44,093 | ) | | (44,093 | ) | Cash dividends declared | | | — | | | — | | | (3,415,242 | ) | | — | | | (3,415,242 | ) | Net income | | | — | | | — | | | 9,333,987 | | | — | | | 9,333,987 | | Balance at June 30, 2007 | | | 6,570,467 | | | 4,013,456 | | | 100,984,577 | | | 1,110,131 | | | 112,678,631 | | Adoption of FIN 48 | | | — | | | — | | | (110,000 | ) | | — | | | (110,000 | ) | Issuance of common stock: | | | | | | | | | | | | | | | | | Stock options exercised, net | | | 1,642 | | | 13,314 | | | — | | | — | | | 14,956 | | 401(k) plan shares | | | 3,524 | | | 43,226 | | | — | | | — | | | 46,750 | | Unrealized loss on available for sale investments, net of tax | | | — | | | — | | | — | | | (84,342 | ) | | (84,342 | ) | Stock-based compensation | | | — | | | 186,000 | | | — | | | — | | | 186,000 | | Interest rate swaps valuation adjustment, net of tax | | | — | | | — | | | — | | | (273,062 | ) | | (273,062 | ) | Minimum pension liability adjustment, net of tax | | | — | | | — | | | — | | | (524,400 | ) | | (524,400 | ) | Cash dividends declared | | | — | | | — | | | (3,418,551 | ) | | — | | | (3,418,551 | ) | Net income | | | — | | | — | | | 4,236,405 | | | — | | | 4,236,405 | | Balance at June 30, 2008 | | | 6,575,633 | | | 4,255,996 | | | 101,692,431 | | | 228,327 | | | 112,752,387 | | Issuance of common stock: | | | | | | | | | | | | | | | | | Stock options exercised, net | | | 740 | | | (733 | ) | | — | | | — | | | 7 | | Unrealized loss on available for sale investments, net of tax | | | — | | | — | | | — | | | (1,022,289 | ) | | (1,022,289 | ) | Stock-based compensation | | | — | | | 114,000 | | | — | | | — | | | 114,000 | | Interest rate swaps valuation adjustment, net of tax | | | — | | | — | | | — | | | (1,414 | ) | | (1,414 | ) | Minimum pension liability adjustment, net of tax | | | — | | | — | | | — | | | (968,518 | ) | | (968,518 | ) | Cash dividends declared | | | — | | | — | | | (2,367,265 | ) | | — | | | (2,367,265 | ) | Net loss | | | — | | | — | | | (1,509,344 | ) | | — | | | (1,509,344 | ) | Balance at June 30, 2009 | | $ | 6,576,373 | | $ | 4,369,263 | | $ | 97,815,822 | | $ | (1,763,894 | ) | $ | 106,997,564 | |
| | | | | | | | | | | | | FOR THE YEARS ENDED JUNE 30, | | | | 2011 | | 2010 | | 2009 | | | | | | | | | | | | | NET SALES | | $ | 339,426 | | $ | 326,466 | | $ | 324,158 | | COST OF GOODS SOLD | | | (262,124 | ) | | (251,685 | ) | | (263,083 | ) | GROSS MARGIN | | | 77,302 | | | 74,781 | | | 61,075 | | SELLING, GENERAL AND ADMINISTRATIVE | | | (60,422 | ) | | (57,252 | ) | | (60,792 | ) | FACILITY CLOSING COSTS | | | (1,016 | ) | | — | | | (2,555 | ) | OPERATING INCOME (LOSS) | | | 15,864 | | | 17,529 | | | (2,272 | ) | OTHER INCOME (EXPENSE): | | | | | | | | | | | Interest and other income | | | 343 | | | 361 | | | 661 | | Interest expense | | | — | | | (439 | ) | | (968 | ) | Total | | | 343 | | | (78 | ) | | (307 | ) | INCOME (LOSS) BEFORE INCOME TAXES | | | 16,207 | | | 17,451 | | | (2,579 | ) | INCOME TAX (PROVISION) BENEFIT | | | (5,790 | ) | | (6,650 | ) | | 1,070 | | NET INCOME (LOSS) | | $ | 10,417 | | $ | 10,801 | | $ | (1,509 | ) | | | | | | | | | | | | WEIGHTED AVERAGE NUMBER OF COMMON SHARES OUTSTANDING: | | | | | | | | | | | Basic | | | 6,693 | | | 6,608 | | | 6,576 | | Diluted | | | 6,929 | | | 6,697 | | | 6,576 | | | | | | | | | | | | | EARNINGS (LOSS) PER SHARE OF COMMON STOCK: | | | | | | | | | | | Basic | | $ | 1.56 | | $ | 1.63 | | $ | (0.23 | ) | Diluted | | $ | 1.50 | | $ | 1.61 | | $ | (0.23 | ) | | | | | | | | | | | | CASH DIVIDENDS DECLARED PER COMMON SHARE | | $ | 0.30 | | $ | 0.20 | | $ | 0.36 | |
See accompanying Notes to Consolidated Financial Statements.
FLEXSTEEL INDUSTRIES, INC. AND SUBSIDIARIES
Consolidated Statements of Cash Flows
| | | | | | | | | | | | | FOR THE YEARS ENDED JUNE 30, | | | | 2009 | | 2008 | | 2007 | | | | | | | | | | | | | OPERATING ACTIVITIES: | | | | | | | | | | | Net (loss) income | | $ | (1,509,344 | ) | $ | 4,236,405 | | $ | 9,333,987 | | Adjustments to reconcile net (loss) income to net cash provided by (used in) operating activities: | | | | | | | | | | | Depreciation and amortization | | | 3,733,353 | | | 4,437,903 | | | 5,270,651 | | Deferred income taxes | | | 449,296 | | | 349,294 | | | 1,464,664 | | Stock-based compensation expense | | | 114,000 | | | 186,000 | | | 274,000 | | Other non-cash, net | | | 14,048 | | | (88,309 | ) | | — | | Gain on disposition of capital assets | | | (251,909 | ) | | (49,180 | ) | | (4,407,682 | ) | Gain on sale of investments | | | (462,473 | ) | | — | | | — | | Impairment of long-lived assets | | | 137,638 | | | — | | | — | | Changes in operating assets and liabilities: | | | | | | | | | | | Trade receivables | | | 12,500,712 | | | 12,490,650 | | | (5,094,083 | ) | Inventories | | | 11,947,055 | | | (7,034,415 | ) | | 6,012,987 | | Other current assets | | | (781,872 | ) | | (655,486 | ) | | 255,076 | | Other assets | | | (287,869 | ) | | (292,485 | ) | | 57,919 | | Accounts payable – trade | | | (4,848,593 | ) | | (2,188,444 | ) | | (2,160,950 | ) | Accrued liabilities | | | (2,917,889 | ) | | (2,272,811 | ) | | (631,804 | ) | Other long-term liabilities | | | (177,938 | ) | | (197,497 | ) | | (411,588 | ) | Deferred compensation | | | (352,110 | ) | | (191,568 | ) | | 327,938 | | Net cash provided by operating activities | | | 17,306,105 | | | 8,730,057 | | | 10,291,115 | | | | | | | | | | | | | INVESTING ACTIVITIES: | | | | | | | | | | | Purchases of investments | | | (520,233 | ) | | (631,704 | ) | | (774,964 | ) | Proceeds from sales of investments | | | 1,460,320 | | | 762,783 | | | 476,840 | | Proceeds from sale of capital assets | | | 676,016 | | | 73,847 | | | 6,039,946 | | Capital expenditures | | | (1,202,993 | ) | | (1,227,863 | ) | | (10,839,479 | ) | Net cash provided by (used in) investing activities | | | 413,110 | | | (1,022,937 | ) | | (5,097,657 | ) | | | | | | | | | | | | FINANCING ACTIVITIES: | | | | | | | | | | | Proceeds from (repayments of) short-term borrowings, net | | | 4,857,055 | | | (1,912,683 | ) | | (2,470,729 | ) | Repayment of long-term borrowings | | | (20,810,597 | ) | | (500,186 | ) | | (475,889 | ) | Dividends paid | | | (2,893,279 | ) | | (3,414,960 | ) | | (3,414,369 | ) | Proceeds from issuance of common stock | | | — | | | 61,706 | | | 82,087 | | Net cash used in financing activities | | | (18,846,821 | ) | | (5,766,123 | ) | | (6,278,900 | ) | | | | | | | | | | | | (Decrease) increase in cash and cash equivalents | | | (1,127,606 | ) | | 1,940,997 | | | (1,085,442 | ) | Cash and cash equivalents at beginning of year | | | 2,841,323 | | | 900,326 | | | 1,985,768 | | Cash and cash equivalents at end of year | | $ | 1,713,717 | | $ | 2,841,323 | | $ | 900,326 | | | | | | | | | | | | | | | FOR THE YEARS ENDED JUNE 30, | | | | 2009 | | 2008 | | 2007 | | | | | | | | | | | | | SUPPLEMENTAL INFORMATION
CASH PAID DURING THE PERIOD FOR: | | | | | | | | | | | Interest | | $ | 979,000 | | $ | 1,473,000 | | $ | 1,517,000 | | Income taxes (refunded) paid | | $ | (62,000 | ) | $ | 3,205,000 | | $ | 3,551,000 | | | | | | | | | | | | |
| FLEXSTEEL INDUSTRIES, INC. AND SUBSIDIARIES | Consolidated Statements of Changes in Shareholders’ Equity | (Amounts in thousands) |
| | | | | | | | | | | | | | | | | | | Total Par
Value of
Common
Shares ($1 Par) | | Additional
Paid-In
Capital | | Retained
Earnings | | Accumulated
Other
Comprehensive
(Loss) Income | | Total | | | | | | | | | | | | | | | | | | | Balance at July 1, 2008 | | $ | 6,576 | | $ | 4,256 | | $ | 101,692 | | $ | 228 | | $ | 112,752 | | Unrealized loss on available for sale investments, net of tax | | | — | | | — | | | — | | | (1,022 | ) | | (1,022 | ) | Stock-based compensation | | | — | | | 114 | | | — | | | — | | | 114 | | Interest rate swaps valuation adjustment, net of tax | | | — | | | — | | | — | | | (1 | ) | | (1 | ) | Minimum pension liability adjustment, net of tax | | | — | | | — | | | — | | | (969 | ) | | (969 | ) | Cash dividends declared | | | — | | | — | | | (2,367 | ) | | — | | | (2,367 | ) | Net loss | | | — | | | — | | | (1,509 | ) | | — | | | (1,509 | ) | Balance at June 30, 2009 | | | 6,576 | | | 4,370 | | | 97,816 | | | (1,764 | ) | | 106,998 | | Issuance of common stock: | | | | | | | | | | | | | | | | | Stock options exercised, net | | | 70 | | | 274 | | | — | | | — | | | 344 | | Unrealized gain on available for sale investments, net of tax | | | — | | | — | | | — | | | 39 | | | 39 | | Long-term incentive compensation | | | — | | | 510 | | | — | | | — | | | 510 | | Stock-based compensation | | | — | | | 271 | | | — | | | — | | | 271 | | Interest rate swaps valuation adjustment, net of tax | | | — | | | — | | | — | | | 177 | | | 177 | | Minimum pension liability adjustment, net of tax | | | — | | | — | | | — | | | (204 | ) | | (204 | ) | Cash dividends declared | | | — | | | — | | | (1,324 | ) | | — | | | (1,324 | ) | Net income | | | — | | | — | | | 10,801 | | | — | | | 10,801 | | Balance at June 30, 2010 | | | 6,646 | | | 5,425 | | | 107,293 | | | (1,752 | ) | | 117,612 | | Issuance of common stock: | | | | | | | | | | | | | | | | | Stock options exercised, net | | | 65 | | | 259 | | | — | | | — | | | 324 | | Unrealized gain on available for sale investments, net of tax | | | — | | | — | | | — | | | 348 | | | 348 | | Long-term incentive compensation | | | — | | | 590 | | | — | | | — | | | 590 | | Stock-based compensation | | | — | | | 424 | | | — | | | — | | | 424 | | Minimum pension liability adjustment, net of tax | | | — | | | — | | | — | | | 869 | | | 869 | | Cash dividends declared | | | — | | | — | | | (2,011 | ) | | — | | | (2,011 | ) | Net income | | | — | | | — | | | 10,417 | | | — | | | 10,417 | | Balance at June 30, 2011 | | $ | 6,711 | | $ | 6,698 | | $ | 115,699 | | $ | (535 | ) | $ | 128,573 | |
See accompanying Notes to Consolidated Financial Statements.
| FLEXSTEEL INDUSTRIES, INC. AND SUBSIDIARIES | Consolidated Statements of Cash Flows | (Amounts in thousands) |
| | | | | | | | | | | | | FOR THE YEARS ENDED JUNE 30, | | | | 2011 | | 2010 | | 2009 | | | | | | | | | | | | | OPERATING ACTIVITIES: | | | | | | | | | | | Net income (loss) | | $ | 10,417 | | $ | 10,801 | | $ | (1,509 | ) | Adjustments to reconcile net income (loss) to net cash provided by (used in) operating activities: | | | | | | | | | | | Depreciation | | | 2,690 | | | 2,986 | | | 3,733 | | Deferred income taxes | | | 54 | | | (963 | ) | | 449 | | Stock-based compensation expense | | | 1,014 | | | 781 | | | 114 | | Provision for losses on accounts receivable | | | 870 | | | 920 | | | 1,240 | | Other non-cash, net | | | 224 | | | 218 | | | 14 | | Gain on disposition of capital assets | | | (185 | ) | | (9 | ) | | (252 | ) | Gain on sale of investments | | | — | | | — | | | (462 | ) | Impairment of long-lived assets | | | — | | | — | | | 138 | | Changes in operating assets and liabilities: | | | | | | | | | | | Trade receivables | | | 3,427 | | | (5,386 | ) | | 11,261 | | Inventories | | | (1,043 | ) | | 1,207 | | | 11,947 | | Other current assets | | | (557 | ) | | 2,837 | | | (781 | ) | Other assets | | | (270 | ) | | (18 | ) | | (288 | ) | Accounts payable – trade | | | (841 | ) | | 994 | | | (4,849 | ) | Accrued liabilities | | | (2,541 | ) | | 3,618 | | | (2,918 | ) | Other long-term liabilities | | | 367 | | | 1,028 | | | (178 | ) | Deferred compensation | | | 174 | | | 105 | | | (352 | ) | Net cash provided by operating activities | | | 13,800 | | | 19,119 | | | 17,307 | | | | | | | | | | | | | INVESTING ACTIVITIES: | | | | | | | | | | | Purchases of investments | | | (698 | ) | | (721 | ) | | (520 | ) | Proceeds from sales of investments | | | 410 | | | 359 | | | 1,460 | | Proceeds from sale of capital assets | | | 187 | | | 34 | | | 676 | | Capital expenditures | | | (2,573 | ) | | (1,251 | ) | | (1,203 | ) | Net cash (used in) provided by investing activities | | | (2,674 | ) | | (1,579 | ) | | 413 | | | | | | | | | | | | | FINANCING ACTIVITIES: | | | | | | | | | | | (Repayments of) proceeds from short-term borrowings, net | | | — | | | (10,000 | ) | | 4,857 | | Repayment of long-term borrowings | | | — | | | — | | | (20,811 | ) | Dividends paid | | | (1,839 | ) | | (1,320 | ) | | (2,893 | ) | Proceeds from issuance of common stock | | | 324 | | | 344 | | | — | | Net cash used in financing activities | | | (1,515 | ) | | (10,976 | ) | | (18,847 | ) | | | | | | | | | | | | Increase (decrease) in cash and cash equivalents | | | 9,611 | | | 6,564 | | | (1,127 | ) | Cash and cash equivalents at beginning of year | | | 8,278 | | | 1,714 | | | 2,841 | | Cash and cash equivalents at end of year | | $ | 17,889 | | $ | 8,278 | | $ | 1,714 | |
| | | | | | | | | | | | | FOR THE YEARS ENDED JUNE 30, | | | | 2011 | | 2010 | | 2009 | | SUPPLEMENTAL INFORMATION CASH PAID DURING THE PERIOD FOR: | | | | | | | | | | | Interest | | $ | — | | $ | 439 | | $ | 979 | | Income taxes paid (refunded) | | $ | 7,647 | | $ | 3,587 | | $ | (62 | ) |
FLEXSTEEL INDUSTRIES, INC. AND SUBSIDIARIESSee accompanying Notes to Consolidated Financial Statements.
| FLEXSTEEL INDUSTRIES, INC. AND SUBSIDIARIES | Notes to Consolidated Financial Statements |
| | 1. | SUMMARY OF SIGNIFICANT ACCOUNTING POLICIES | | | | DESCRIPTION OF BUSINESS – Flexsteel Industries, Inc. and subsidiaries (the “Company”) is one of the oldest and largest manufacturers, importers and marketers of residential recreational vehicle and commercial upholstered and wooden furniture products in the country.United States. The Company’s furniture products include a broad line of quality upholstered and wooden furniture for residential recreational vehicle and commercial use. Product offerings include a wide variety of upholstered and wood furniture such as sofas, loveseats, chairs, reclining and rocker-reclining chairs, swivel rockers, sofa beds, convertible bedding units, occasional tables, desks, dining tables and chairs, bedroom furniture and home and commercial office furniture. The Company has one active wholly-owned subsidiary: DMI Furniture, Inc. (“DMI”), which is a Louisville, Kentucky-based, manufacturer, importer and marketer of residential and commercial office furniture with manufacturing and warehouses in Indiana and manufacturing sources in Asia; DMI’s divisions are WYNWOOD, Homestyles and DMI Commercial Office Furniture. | | | | PRINCIPLES OF CONSOLIDATION – the consolidated financial statements include the accounts of Flexsteel Industries, Inc. and its wholly owned subsidiaries. All intercompany transactions and accounts have been eliminated in consolidation. | | | | USE OF ESTIMATES – the preparation of consolidated financial statements in conformity with accounting principles generally accepted in the United States of America requires management to make estimates and assumptions that affect the amounts reported in the consolidated financial statements and accompanying notes. Ultimate results could differ from those estimates. | | | | FAIR VALUE – Thethe Company’s cash, investments, accounts receivable, other current assets, accounts payable accrued liabilities, notes payable, interest rate swaps and othercertain accrued liabilities are carried at amounts which reasonably approximate their fair value due to their short-term nature. The Company’s notes payable are at variable interest rates that approximate market. The Company adopted Statement of Financial Accounting Standards (“SFAS”) No. 157, Fair Value Measurements, subject to the deferral provisions of FASB Staff Position 157-2,Effect Date of FASB Statement No. 157, as of July 1, 2008. SFAS 157 established a framework for measuringGenerally accepted accounting principles on fair value and expanded disclosures about fair value measurements. SFAS 157 applies to allmeasurement for certain financial assets and liabilities that are measured and reported on a fair value basis. This enables the reader of the financial statements to assess the inputs used to develop those measurements by establishing a hierarchy for ranking the quality and reliability of the information used to determine fair values. The statement requires that each asset and liability carried at fair value be classified into one of the following categories: Level 1: Quoted market prices in active markets for identical assets and liabilities; Level 2: Observable market based inputs or unobservable inputs that are corroborated by market data; or Level 3: Unobservable inputs that are not corroborated by market data. | | | | CASH EQUIVALENTS – The Company has not changed its valuation techniques in measuring the Company considers highly liquid investments with original maturitiesfair value of three months or less asany financial assets and liabilities during the equivalent of cash.period.
| | | | ALLOWANCE FOR DOUBTFUL ACCOUNTS – the Company establishes an allowance for doubtful accounts through review of open accounts, and historical collection and allowances amounts. The allowance for doubtful accounts is intended to reduce trade accounts receivable to the amount that reasonably approximates their net realizable fair value due to their short-term nature.value. The amount ultimately realized from trade accounts receivable may differ from the amount estimated in the consolidated financial statements based on collection experience and actual returns and allowances.experience. | | | | INVENTORIES – are stated at the lower of cost or market. Raw steel isSteel products are valued on the last-in, first-out (“LIFO”) method. Other inventories are valued on the first-in, first-out (“FIFO”) method. | | | | PROPERTY, PLANT AND EQUIPMENT – is stated at cost and depreciated using the straight-line method over the estimated useful lives of the assets. For internal use software, the Company’s policy is to capitalize external direct costs of materials and services, directly related internal payroll and payroll-related costs, and interest costs. These costs are amortized using the straight-line method over the useful lives. |
| | | VALUATION OF LONG–LIVED ASSETS – the Company periodically reviews the carrying value of long-lived assets and estimated depreciable or amortizable lives for continued appropriateness. This review is based upon projections of anticipated future cash flows and is performed whenever events or changes in circumstances indicate that asset carrying values may not be recoverable or that the estimated depreciable or amortizable lives may have changed. These evaluations could result in a change in estimated useful lives in future periods. During the first six months of fiscal year 2009, the Company reviewed its long-lived assets in connection with the commencement of facility consolidation activities and identified $0.1 million of impaired machinery and equipment assets. The asset impairment was recorded in the “Facility Consolidation and Other Charges” line in the Consolidated Statements of Operations. At June 30, 2009, no additional impairment of long-lived assets was identified. |
| | | WARRANTY – the Company estimates the amount of warranty claims on sold product that may be incurred based on current and historical data. The actual warranty expense could differ from the estimates made by the Company based on product performance. | | | | REVENUE RECOGNITION – is upon delivery of product to the Company’s customer and collectibility is reasonably assured. The Company’s ordering process creates persuasive evidence of the sale arrangement and the sales amount is determined. The delivery of the goods to the customer completes the earnings process. Net sales consist of product sales and related delivery charge revenue, net of adjustments for returns and allowances. Shipping and handling costs are included in cost of goods sold. | | | | ADVERTISING COSTS – are charged to selling, general and administrative expense in the periods incurred. The Company conducts no direct-response advertising programs and there are no assets related to advertising recorded on the consolidated balance sheet. Advertising expenditures, primarily shared customer advertising in which an identifiable benefit is received and national trade-advertising programs, were approximately $4.5 million, $4.6$4.1 million and $4.6$4.5 million in fiscal 2009, 20082011, 2010 and 2007,2009, respectively. | | | | DESIGN, RESEARCH AND DEVELOPMENT COSTS – are charged to selling, general and administrative expense in the periods incurred. Expenditures for design, research and development costs were approximately $2.7$2.2 million, $3.1$2.0 million and $3.3$2.7 million in fiscal 2011, 2010 and 2009, 2008 and 2007, respectively. | | | | DERIVATIVE INSTRUMENTS AND HEDGING ACTIVITIES – the Company utilizes interest rate swaps to hedge against adverse changes in interest rates relative to its variable rate debt. The notional principal amounts of the outstanding interest rate swaps totaled $10.0 million with a weighted average fixed rate of 5.0% at June 30, 2009. On July 31, 2009, a $5.0 million swap matured. Excluding the subsequently matured swap, the Company has effectively fixed its interest rate at 4.9% on approximately $5.0 million of its variable rate debt. The interest rate swaps are not utilized to take speculative positions. The Board of Directors established the Company’s policies with regards to activities involving derivative instruments. Management, along with the Board of Directors, periodically reviews those policies, along with the actual derivative related results. The Company recorded the fair market value of its interest rate swaps as cash flow hedges on its balance sheet and has marked them to fair value through other comprehensive (loss) income. The cumulative fair value of the swaps was a liability of approximately $0.3 million as of June 30, 2009 and 2008 and is reflected as other liabilities on the accompanying consolidated balance sheets. At each reporting period, the Company performs an assessment of hedge effectiveness by verifying and documenting whether the critical terms of the derivative instruments and the hedged items have changed during the period in review. All of the derivatives used by the Company in its risk management are highly effective hedges because all of the critical terms of the derivative instruments match those of the hedged item. The Company does not hold these derivative instruments for trade and does not plan to sell the instruments. The Company recognizes the fair value of the swap liability as a Level 2 valuation.
| | | | INSURANCE – the Company is self-insured for health care and most workers’ compensation up to predetermined amounts above which third party insurance applies. The Company purchases specific stop-loss insurance for individual health care claims in excess of $150,000 per plan year, with a $1.0 million individual lifetime maximum.year. For workers’ compensation the Company retains the first $350,000 per claim and purchases excess coverage up to the statutory limits for amounts in excess of the retention limit. Losses are accrued based upon the Company’s estimates of the aggregate liability for claims incurred using certain actuarial assumptions followed in the insurance industry and based on Company experience. The Company records these insurance accruals within the accrued liabilities insurance account on the consolidated balance sheets. | | | | INCOME TAXES – the Company accountsuses the liability method of accounting for income taxes in accordance with the provisions SFAS No. 109,Accounting for Income Taxes and evaluates uncertainties in income taxes in accordance with FIN 48,Accounting for Uncertainty in Income Taxes. In the preparation of the Company’s consolidated financial statements, management calculates income taxes. This includes estimating the Company’s current tax liability as well as assessing temporary differences resulting from different treatment of items for tax and book accounting purposes. These differences result inUnder this method, deferred tax assets and liabilities which are recordeddetermined based on differences between the balance sheet. Thesefinancial reporting and tax bases of assets and liabilities and are analyzed regularlymeasured using the enacted tax rates and management assesses the likelihoodlaws that deferred tax assets will be realizedin effect when the differences are expected to reverse. The Company recognizes in its financial statements the tax benefit from future taxable income.an uncertain tax position only if it is more likely than not that the tax position will be sustained on examination by the taxing authorities, based on the technical merits of the position. |
| | | EARNINGS (LOSS) EARNINGS PER SHARE – basic earnings (loss) earnings per share of common stock is based on the weighted-average number of common shares outstanding during each fiscal year. Diluted earnings per share of common stock includes the dilutive effect of potential common shares outstanding. The Company’s only potential common shares outstanding are stock options and shares associated with the long-term management incentive compensation plan, which resulted in a dilutive effect of 37,137236,082 shares and 15,03689,403 shares in fiscal 20082011 and 2007,2010, respectively. The Company calculates the dilutive effect of outstanding options using the treasury stock method. The Company calculates the dilutive effect of shares related to the long-term management incentive compensation plan based on the number of shares, if any, that would be issuable if the end of the fiscal year were the end of the contingency period. The dilutive effect of 42,539 shares of stock options is excluded in fiscal 2009 because the net loss caused the effect of the options to be anti-dilutive. Options to purchase 759,689424,150 shares, 567,411716,939 shares and 572,200759,689 shares of common stock were outstanding in fiscal 2009, 20082011, 2010 and 2007,2009, respectively, but were not included in the computation of diluted earnings per share as their exercise prices were greater than the average market price of the common shares. | | | | STOCK–BASED COMPENSATION –The Company utilizes the fair value recognition provisions of SFAS No. 123 “Accounting for Stock-Based Compensation” (revised 2004), “Share-Based Payment” (123(R)), requiring– the Company to recognizerecognizes compensation expense related to the fair valuecost of stock-based compensation. The modified prospective transition method was used as allowed under SFAS No. 123(R). Under this method, the stock-based compensation expense includes: (a) compensation expenseemployee services received in exchange for all stock-based compensation awards granted prior to, but not yet vested as of July 1, 2005,Company equity interests based on the grant dateaward’s fair value estimated in accordance withat the original provisionsdate of SFAS No. 123, “Accounting for Stock-Based Compensation”; and (b) compensation expense for all stock-based compensation awards granted subsequent to July 1, 2005, based on the grant date fair value estimated in accordance with the provisions of SFAS No. 123(R).grant. See Note 98 Stock-Based Compensation. | | | | ACCOUNTING DEVELOPMENTS – In September 2006,June 2011, the FASB issued Statementguidance on presentation of Financial Accounting Standards (“SFAS”) No. 157, Fair Value Measurements, which defines fair value, establishes a framework for measuring fair value,comprehensive income. The new guidance eliminates the current option to report other comprehensive income and expands disclosures about fair value measurements. The Company adopted SFAS No. 157 on July 1, 2008 for all assets and liabilities measured at fair value except for nonfinancial assets and nonfinancial liabilities measured at fair value on a nonrecurring basis, as permitted by FASB Staff Position No. 157-2,Effective Dateits components in the statement of FASB Statement No. 157. The adoption did not have a material impact on the Company’s financial statements. | | | | In February 2007, the FASB issued SFAS No. 159,The Fair Value Option for Financial Assets and Financial Liabilities (“SFAS No. 159”).SFAS No. 159 permits entities to choose to measure many financial assets and financial liabilities at fair value. Unrealized gains and losses on items for which the fair value option has been electedchanges in equity. Instead, an entity will be reportedrequired to present either a continuous statement of net income and other comprehensive income or in earnings. The provisions of SFAS No. 159 aretwo separate but consecutive statements. This guidance is effective asfor fiscal years, and interim periods within those years, beginning after December 15, 2011. Early adoption of the beginning of the Company’s 2009 fiscal year. The Company chose notnew guidance is permitted and full retrospective application is required. We will be required to adopt SFAS No. 159.this guidance beginning with our first quarter of fiscal 2013.
| | | | In March 2008, the Financial Accounting Standards Board (“FASB”) issued statement of Financial Accounting Standards No.161,Disclosures about Derivative Instruments and Hedging Activities (“SFAS No. 161”),which require additional disclosure related to derivative instruments and hedging activities. The provisions of SFAS No. 161 are effective as of the beginning of the Company’s 2010 fiscal year. Adoption of SFAS No. 161 will result in enhanced disclosure regarding the Company’s derivatives.
| | | | In May 2009, the FASB issued SFAS No. 165,Subsequent Events (“SFAS No. 165”),which provides guidance on management’s assessment of subsequent events. SFAS No. 165 clarifies that management must evaluate, as of each reporting period, events or transactions that occur after the balance sheet date through the date that the financial statements are issued or are available to be issued. In addition to current disclosure requirements, SFAS No. 165 also requires disclosure of the date through which subsequent events have been evaluated. For the fiscal year ended June 30, 2009, the Company evaluated subsequent events through August 26, 2009.
|
| | 2. | INVESTMENTS
| | | | At June 30, 2008, the Company had available-for-sale securities consisting of equity securities that were sold during fiscal year 2009. These securities were valued at current market value, with the resulting unrealized holding gains and losses excluded from earnings and reported, net of tax, as a separate component of shareholders’ equity until realized.
|
| | 3.
| INVENTORIES | | | | Inventories valued on a LIFO basis (steel) would have been approximately $2.2$1.9 million and $3.3$1.7 million higher at June 30, 20092011 and 2008,2010, respectively, if they had been valued on a FIFO basis. At June 30, 20092011 and 20082010 the total value of LIFO inventory was $1.8$1.5 million and $2.7$2.3 million, respectively. During the fiscal year 2009, inventory quantities for steel were reduced. This reduction resulted in a liquidation of LIFO inventory quantities carried at lower costs prevailing in prior years as compared with the cost of 2009 purchases, the effect of which decreased cost of goods sold by approximately $0.8 million. There was no material liquidation of LIFO inventory in 2008 or 2007.2011 and 2010. A comparison of inventories is as follows (in thousands): |
| | | | | | | | | | | | | | | | | June 30, | | | June 30, | | | | 2009 | | 2008 | | | 2011 | | 2010 | | Raw materials | | $ | 9,832 | | $ | 15,272 | | | $ | 9,235 | | $ | 9,696 | | Work in process and finished parts | | 5,124 | | 8,082 | | | 3,951 | | 4,943 | | Finished goods | | | 58,888 | | | 62,437 | | | | 60,494 | | | 57,998 | | Total | | $ | 73,844 | | $ | 85,791 | | | $ | 73,680 | | $ | 72,637 | |
| | 3. | PROPERTY, PLANT AND EQUIPMENT |
| | | | | | | | | | | (in thousands) | | Estimated | | June 30, | | | | Life (Years) | | 2011 | | 2010 | | Land | | | | | $ | 3,984 | | $ | 3,984 | | Buildings and improvements | | 5-39 | | | 39,851 | | | 40,248 | | Machinery and equipment | | 3-7 | | | 26,513 | | | 28,251 | | Delivery equipment | | 3-5 | | | 18,180 | | | 18,269 | | Furniture and fixtures | | 3-7 | | | 4,000 | | | 4,291 | | Construction in progress | | | | | | 366 | | | — | | Total | | | | | | 92,894 | | | 95,043 | | Less accumulated depreciation | | | | | | (71,507 | ) | | (73,429 | ) | Net | | | | | $ | 21,387 | | $ | 21,614 | |
| | 4. | PROPERTY, PLANT AND EQUIPMENTOTHER NONCURRENT ASSETS
|
| | | | | | | | | | | | | Estimated
Life (Years) | | June 30, | | (in thousands) | | | 2009 | | 2008 | | Land | | | | | $ | 3,984 | | $ | 4,049 | | Buildings and improvements | | | 5-39 | | | 40,857 | | | 41,138 | | Machinery and equipment | | | 3-7 | | | 28,894 | | | 31,322 | | Delivery equipment | | | 3-5 | | | 18,872 | | | 19,103 | | Furniture and fixtures | | | 3-7 | | | 4,095 | | | 4,251 | | Total | | | | | | 96,702 | | | 99,863 | | Less accumulated depreciation | | | | | | (73,404 | ) | | (73,491 | ) | Net | | | | | $ | 23,298 | | $ | 26,372 | |
| | | | | | | | (in thousands) | | June 30, | | | | 2011 | | 2010 | | Cash value of life insurance | | $ | 6,815 | | $ | 6,560 | | Rabbi Trust assets (see Note 9) | | | 5,533 | | | 4,683 | | Other | | | 29 | | | 14 | | Total | | $ | 12,377 | | $ | 11,257 | |
| | 5. | ACCRUED LIABILITIES – OTHER ASSETS |
| | | | | | | | | | | | | | | (in thousands) | | June 30, | | | June 30, | | | | 2009 | | 2008 | | | 2011 | | 2010 | | Cash value of life insurance | | $ | 6,520 | | $ | 6,232 | | | Rabbi Trust assets (see Note 10) | | 4,259 | | 5,229 | | | Dividends | | | $ | 504 | | $ | 332 | | Income taxes | | | — | | 1,445 | | Advertising | | | 1,873 | | 2,200 | | Warranty | | | 970 | | 980 | | Other | | | 36 | | | 41 | | | | 1,857 | | | 2,002 | | Total | | $ | 10,815 | | $ | 11,502 | | | $ | 5,204 | | $ | 6,959 | |
| | 6. | ACCRUED LIABILITIES – OTHER
|
| | | | | | | | (in thousands) | | June 30, | | | | 2009 | | 2008 | | Dividends | | $ | 329 | | $ | 855 | | Advertising and rebates | | | 1,951 | | | 1,982 | | Warranty | | | 850 | | | 1,090 | | Other | | | 1,965 | | | 2,133 | | Total | | $ | 5,095 | | $ | 6,060 | |
| | 7.
| BORROWINGS AND CREDIT ARRANGEMENTS
| | | | The Company has lines ofmaintains a credit of $29.0 million with banks, with borrowings at differing rates based on the date and type of financing utilized. | | | | In March 2009, the Company amended its credit facility agreements with its primary bank reducing its long-term availability from $20.0 million to $10.0 million, shortening the maturity date to September 30, 2011, increasing its short-term facility from $12.0 million to $15.0 million, and extending its short-term facility to June 30, 2010. The Company pledged accounts receivable and inventory as security under the amended credit facility agreements. The amount of credit available to the Company will be based on eligible accounts receivable and inventory as defined in the amended agreements. At June 30, 2009, the Company had available collateral, as defined by the bank, of $52.5 million with borrowing availability of $25 million ofagreement which $10 million was outstanding.
|
| | | The amended agreements provideprovides short-term working capital financing up to $15.0 million with interest selected at the option of the Company at a Commercial Bank Floating Rate (“CBFR”) which is the prime rate subject to a floor calculationLIBOR plus 1% including $5.0 million of adjusted one month LIBOR rate (3.25% at June 30, 2009) or LIBOR (0.31% at June 30, 2009) plus 2.25%. At June 30, 2009, $10 million was outstanding. The short-term portion also provides overnightletters of credit when required for operations at prime.availability. No amounts were outstanding at June 30, 2009 related to overnight credit. As prescribed by SFAS 157, which is previously discussed in Note 1,2011 and 2010 under the Company recognizes the fair value of the borrowings as a Level 2 valuation.
| | | | The long-term portion of the credit facility provides up to $10.0 million and expires September 30, 2011. No amount was outstanding at June 30, 2009. Variable interest is set monthly at the option of the Company at a CBFR or LIBOR plus 3.0%. All interest rates are adjusted monthly, except for the overnight portion of the short-term line of credit, which varies daily at the prime rate.
| | | | As of June 30, 2009, the Company has effectively fixed the interest rates at 5.0% on approximately $10.0 million of its long-term debt through the use of interest rate swaps.
| | | | working capital facility. The credit agreement contains financial covenants. The primary covenant is an interest coverage ratio.ratio of 3.0 to 1.0. The ratio is computed as net (loss) income plus amortization, depreciation, interest expense income taxes and the aggregate of all expenses related to stock options (“EBITDA”)stock-based compensation expense less dividends divided by interest expense, which will vary by quarter overexpense. In addition, the termCompany must maintain working capital of the agreement.$60 million. At June 30, 2009,2011, the Company was in compliance with all of the financial covenants contained in the credit agreement. | | | | An officer of the Company is a director at a bank where the Company maintains an unsecured $4.0 million line of credit, cumulative letter of credit facilities and where its routine daily banking transactions are processed. In addition, the Rabbi Trust assets (Note 10) are administered by this bank’s trust department. The Company is contingently liable to insurance carriers under its comprehensive general, product, and vehicle liability policies, as well as some workers’ compensation, and has provided letters of credit in the amount of $4.9 million.$3.0 million at June 30, 2011.
| | | | An officer of the Company is a director at a bank where the Company maintains an additional unsecured $5.0 million line of credit at prime minus 1%, but not less than 2.5% and where its routine daily banking transactions are processed. No amount was outstanding on the line of credit at June 30, 2011 and 2010. In addition, the Rabbi Trust assets (Note 9) are administered by this bank’s trust department. The Company receives no special services or pricing on the services performed by the bank due to the directorship of this officer. No amount was outstanding on the line of credit at prime minus 1.0% at June 30, 2009. | | | 8.7.
| INCOME TAXES | | | | In determining the provision for income taxes, the Company uses an estimated annual effective tax rate that is based on the annual income (loss) income,, statutory tax rates and tax planning opportunities available in the various jurisdictions in which the Company operates.permanent differences between book and tax. This includes recognition of deferred tax assets and liabilities for the expected future tax consequences of events that have been included in the financial statements or tax returns to the extent pervasive evidence exists that they will be realized in future periods. The deferred tax balances are adjusted to reflect tax rates by tax jurisdiction, based on currently enacted tax laws, which are expected to be in effect in the years in which the temporary differences are expected to reverse. In accordance with the Company’s income tax policy, significant or unusual items are separately recognized when they occur. | | | �� | The Company adopted the provisions of FIN 48 on July 1, 2007. As a resultcomponents of the implementation of FIN 48, the Company recognized an adjustment in the liability for unrecognized income tax benefits of $0.1 million, which is reported as a cumulative effect of a change in accounting principle and is reported as an adjustment to the beginning balance of retained earnings as of July 1, 2007. At the adoption date of July 1, 2007, the Company had approximately $0.8 million of gross liabilities related to unrecognized tax benefits (composed of $0.6 million of gross unrecognized tax benefits and accrued interest and penalties of $0.2 million) andthe related deferred tax assets are as follows (in thousands): |
| | | | | | | | | | June 30, | | | | 2011 | | 2010 | | Gross unrecognized tax benefits | | $ | 970 | | $ | 995 | | Accrued Interest and penalties | | | 340 | | | 215 | | Gross liabilities related to unrecognized tax benefits | | $ | 1,310 | | $ | 1,210 | | | | | | | | | | Deferred tax assets | | $ | 330 | | $ | 230 | |
| | | A reconciliation of approximately $0.2 million. At June 30, 2009, the Company included in other long-term liabilities approximately $0.6 millionbeginning and ending amount of gross liabilities related to unrecognized tax benefits (composed of $0.4 million of gross unrecognized tax benefits and accruedis as follows (in thousands): |
| | | | | | | | Balance at June 30, 2009 | | | | | $ | 404 | | Additions for tax positions of prior years | | | | | | 591 | | Balance at June 30, 2010 | | | | | | 995 | | Reduction for tax positions of prior years | | | | | | (25 | ) | Balance at June 30, 2011 | | | | | $ | 970 | |
| | | The Company records interest and penalties related to income taxes as income tax expense in the Consolidated Statements of $0.2 million)Operations. The total income tax provision in fiscal years 2011, 2010 and related deferred tax assets2009 was 35.7%, 38.1% and 41.5%, respectively, of approximately $0.2 million, all of which would affect our effective tax rate if recognized.income (loss) before income taxes. The Company does not expect that there will be any positions for which it is reasonably possible that the total amounts of unrecognized tax benefits will significantly increase or decrease within the next twelve months. |
| | | A reconciliation of the beginning and ending amount of unrecognized tax benefits is as follows (in thousands):
|
| | | | | Balance at July 1, 2007 | | $ | 617 | | Additions (reductions) based on tax positions related to fiscal year 2008 | | | (68 | ) | Balance at June 30, 2008 | | | 549 | | Additions (reductions) based on tax positions related to the current year | | | (145 | ) | Balance at June 30, 2009 | | $ | 404 | |
| | | Consistent with prior periods and upon adoption of FIN 48 the Company records interest and penalties related to income taxes as income tax expense in the Consolidated Statements of Operations. As of June 30, 2009 and 2008, the Company had approximately $0.2 million of accrued interest and penalties related to uncertain tax positions. The total income tax provision in fiscal years 2009, 2008 and 2007 was 41.5%, 35.8% and 35.6%, respectively, of (loss) income before income taxes.
| | | | The income tax provision (benefit) provision is as follows for the years ended June 30 (in thousands): |
| | | | | | | | | | | | | | | | | | | | | | | 2009 | | 2008 | | 2007 | | | 2011 | | 2010 | | 2009 | | Federal – current | | $ | (1,410 | ) | $ | 1,510 | | $ | 6,045 | | | $ | 5,313 | | $ | 6,630 | | $ | (1,410 | ) | State – current | | (110 | ) | | 270 | | 570 | | | 423 | | 975 | | (110 | ) | Deferred | | | 450 | | | 580 | | | (1,465 | ) | | | 54 | | | (955 | ) | | 450 | | Total | | $ | (1,070 | ) | $ | 2,360 | | $ | 5,150 | | | $ | 5,790 | | $ | 6,650 | | $ | (1,070 | ) |
| | | A reconciliation between the U.S. federal statutory tax rate and the effective tax rate is as follows for the years ended June 30: |
| | | | | | | | | | | | | | | | | | | | | | | 2009 | | 2008 | | 2007 | | | 2011 | | 2010 | | 2009 | | Federal statutory tax rate | | 34.0 | % | | 34.0 | % | | 35.0 | % | | 35.0 | % | | 35.0 | % | | 34.0 | % | State taxes, net of federal effect | | 2.7 | | 2.7 | | 2.6 | | | 2.6 | | 3.7 | | 2.7 | | Other | | | 4.8 | | | (0.9 | ) | | (2.0 | ) | | | (1.9 | ) | | (0.6 | ) | | 4.8 | | Effective tax rate | | | 41.5 | % | | 35.8 | % | | 35.6 | % | | | 35.7 | % | | 38.1 | % | | 41.5 | % |
| | | The effective tax rate for the fiscal year ended June 30, 2011 was 35.7% compared to 38.1% for fiscal year 2010. The change in effective tax rate is primarily due to the change in provision for uncertain tax positions related to various state taxing jurisdictions, stock-based compensation and the benefit of the Domestic Manufacturing Deduction under Section 199 (DMD), which provides a tax benefit on U.S. based manufacturing. The DMD tax benefit available in previous years was being phased in by statute and was therefore lower than the full DMD tax benefit for 2011. | | | | Although the Company’s effective full year tax expense rate has historically ranged from 35% to 39%, fiscal year ended June 30, 2009 reflects an effective income tax benefit rate of 41.5% due to losses or low level of earnings in various tax jurisdictions. The effective income tax expense rate was 35.8% for the fiscal year ended June 30, 2008. | | | | The primary components of deferred tax assets and (liabilities) are as follows (in thousands): |
| | | | | | | | | | | | | | | | | | | | | | | | | | | | | June 30, 2009 | | June 30, 2008 | | | June 30, 2011 | | June 30, 2010 | | | | Current | | Long-term | | Current | | Long-term | | | Current | | Long-term | | Current | | Long-term | | Investments | | $ | 30 | | $ | — | | $ | (580 | ) | $ | — | | | Accounts receivable | | 650 | | — | | 780 | | — | | | $ | 740 | | $ | — | | $ | 750 | | $ | — | | Inventory | | 1,180 | | — | | 1,730 | | — | | | 1,360 | | — | | 1,100 | | — | | Self insurance | | 780 | | — | | 1,040 | | — | | | 620 | | — | | 690 | | — | | Employee benefits | | 670 | | — | | 540 | | — | | | 360 | | — | | 680 | | — | | Accrued expenses | | 650 | | — | | 700 | | — | | | 620 | | — | | 830 | | — | | Property, plant and equipment | | — | | (570 | ) | | — | | (940 | ) | | — | | (760 | ) | | — | | (340 | ) | Deferred compensation | | — | | 1,900 | | — | | 2,030 | | | — | | 2,520 | | — | | 2,280 | | Other | | | — | | | 815 | | | — | | | 302 | | | | — | | | 800 | | | — | | | 1,070 | | Total | | $ | 3,960 | | $ | 2,145 | | $ | 4,210 | | $ | 1,392 | | | $ | 3,700 | | $ | 2,560 | | $ | 4,050 | | $ | 3,010 | |
| | | The Company is subject to U.S. federal income tax as well as income tax of multiple state and foreign jurisdictions. Generally, tax years 2005–20092008–2011 remain open to examination by the Internal Revenue Service or other taxing jurisdictions to which we are subject. |
| | | 9.8.
| STOCK-BASED COMPENSATION | | | | The Company has two stock-based compensation methods available when determining employee compensation. |
| | | | (1) | 2007 Long-Term Management Incentive Compensation Plan – The plan provides for shares of common stock and cash to be awarded to officers and key employees based on performance targets set by the Nominating and Compensation Committee of the Board of Directors (the “Committee”). The Company’s shareholders approved 500,000 shares to be issued under the plan. The Committee selected consolidated operating results for organic net sales growth and fully-diluted earnings per share for the two-year transition period which began on July 1, 2007 and ended on June 30, 2009 and the three-year performance periods beginning July 1, 2007 and ending on June 30, 2010, beginning July 1, 2008 and ending on June 30, 2011, and beginning July 1, 2009 and ending on June 30, 2012.2012, and beginning July 1, 2010 and ending on June 30, 2013. The Committee has also specified that payouts, if any, for awards earned under the fiscal years 2008-2009, 2008-2010, 2009-2011, 2010-2012 and 2010-20122011-2013 performance periods will be 60% stock and 40% cash. Awards will be paid to participants as soon as practicable following the end of the performance periods subject to Committee approval and verification of results, and subjectresults. The compensation cost related to the negative discretionnumber of the Committee. As the payouts of these awards are subjectshares to the negative discretion of the Committeebe granted under each performance period is fixed on the grant date, which is not established until the awards are paid. Accordingly,date the performance period begins. The compensation cost related to the cash portion of the award is re-measured based on the equity award’s estimated fair value at the end of each reporting period prior to the grant date to the extent service has been rendered in comparison to the total requisite service period. Further, theThe accrual of compensation cost is based on the probable outcomes of the performance conditions. The short-term portion of the accruedrecorded cash award payable in stock is classified within equitycurrent liabilities (payroll and related items) and the long-term portion of the accruedrecorded cash award payable in cash is classified within other long-term liabilities in the Consolidated Balance Sheets. As of June 30, 2011, the Company has recorded cash awards payable of $0.4 million within current liabilities and $0.7 million within long-term liabilities. As of June 30, 2010, the Company recorded cash awards payable of $0.4 million within long-term liabilities. There have been no awards related to any of the performance periods as of June 30, 2011.
|
| | | | | The fair value of the equity portion of the award is estimated each period based on the market value of the Company’s common shares reduced by the present value of expected dividends to be paid prior to the service period, discounted using a risk-free interest rate. In the period the grant date occurs, cumulative compensation cost will be adjusted to reflect the cumulative effect of measuring compensation cost based on the fair value at the grant date. Under the plan the aggregate number of shares and cash that could be awarded to key executives if the minimum, target and maximum performance goals are met, arebased upon the fair market value at June 30, 2011, is as follows:follows (in thousands): |
| | | | | | | | | | | | | | | | | | | | | | | | | | | | | | | | At Target | | At Maximum | | | Minimum | | Target | | Maximum | | Performance Period | | Stock | | Cash | | Stock | | Cash | | | Shares | | Cash | | Shares | | Cash | | Shares | | Cash | | Fiscal Year 2008 – 2010 | | 33,330 | | $ | 186,204 | | 53,329 | | $ | 297,931 | | | Fiscal Year 2009 – 2011 | | 44,621 | | $ | 249,283 | | 71,398 | | $ | 398,877 | | | 16 | | $ | 152 | | 45 | | $ | 435 | | 71 | | $ | 696 | | Fiscal Year 2010 – 2012 | | 58,155 | | $ | 324,893 | | 93,058 | | $ | 519,884 | | | 20 | | $ | 198 | | 58 | | $ | 567 | | 93 | | $ | 907 | | Fiscal Year 2011 – 2013 | | | 17 | | $ | 162 | | 48 | | $ | 463 | | 76 | | $ | 741 | |
| | | | | No amounts were earned for the two-year transition period ended June 30, 2009. No compensation costs were accrued at June 30, 2009 or 2008. If the target performance goals would be achieved, the total amount of stock compensation cost recognized over the requisite service periods would be $0.5$0.9 million (2008-2010)(2009-2011), $0.6 million (2009-2011) and $0.8$1.1 million (2010-2012) and $1.0 million (2011-2013) based on the estimated fair values at June 30, 2009. At June 30,2011. The Company recorded compensation expense of $1.3 million, $0.9 million, and $0 during fiscal years 2011, 2010 and 2009, 500,000 shares were available for awards. respectively.
| | | | | (2) | Stock Option Plans – The stock option plans for key employees and directors provide for the granting of incentive and nonqualified stock options. Under the plans, options are granted at an exercise price equal to the fair market value of the underlying common stock at the date of grant, and may be exercisable for up to 10 years. All options are exercisable when granted. | | | | | | In December 2008, 2007fiscal years 2011, 2010 and 2006,2009, the Company issued options for 265,000, 120,00087,500, 165,000 and 135,000265,000 common shares at weighted average exercise prices of $6.82, $12.40$17.23, $8.43 and $12.63$6.82 (the fair market value on the date of grant), respectively. The options were immediately available for exercise and may be exercised for a period of 10 years. In accordance with the provisions of SFAS No. 123(R) theThe Company recorded compensation expense of $0.4 million, $0.3 million and $0.1 million $0.2 millionduring fiscal years 2011, 2010 and $0.3 million during the quarters ended December 31, 2008, 2007 and 2006,2009, respectively. The assumptions used in determining the compensation expense are discussed below. | | | | | | The fair value of each option grant is estimated on the date of grant using the Black-Scholes option-pricing model with the following weighted-average assumptions used for grants in fiscal 2009, 20082011, 2010 and 2007,2009, respectively; dividend yield of 7.6%1.2%, 4.2%2.4% and 4.1%7.6%, expected volatility of 21.8%33.4%, 19.5%25.3% and 21.6%21.8%; risk-free interest rate of 1.6%1.5%, 3.3%2.2% and 4.5%1.6%; and an expected life of 6,5, 5 and 6 years, respectively. The expected volatility and expected life are determined based on historical data. | | | | | | The weighted-average grant date fair value of stock options granted during the three months ended December 31, 2008, 2007fiscal years 2011, 2010 and 20062009 was $0.45, $1.55$4.84, $1.64 and $2.03,$0.45, respectively. The cash proceeds, income tax benefit and aggregate intrinsic value of options (the amount by which the market price of the stock on the date of exercise exceeded the market price of stock on the date of grant) exercised during the fiscal years ended June 30, 2009, 20082011, 2010 and 2007,2009, respectively, were not material. |
| | | | | At June 30, 2009, 230,1002011, 423,950 shares were available for future grants. It is the Company’s policy to issue new shares upon exercise of stock options. The Company accepts shares of the Company’s common stock as payment for the exercise price of options. These shares received as payment are retired upon receipt. |
| | | | | A summary of the status of the Company’s stock option plans as of June 30, 2009, 20082011, 2010 and 20072009 and the changes during the years then ended is presented below: |
| | | | | | | | | | | | | | | | | | | | | | | Shares | | Weighted Average
Exercise Price | | Aggregate
Intrinsic Value
(in millions) | | | Shares
(in thousands) | | Weighted Average
Exercise Price | | Aggregate
Intrinsic Value
(in thousands) | | Outstanding and exercisable at June 30, 2007 | | 782,174 | | $15.45 | | $0.4 | | | Outstanding and exercisable at June 30, 2009 | | | 1,020 | | $ | 12.94 | | $ | 407 | | Granted | | 120,000 | | 12.40 | | | | | 165 | | 8.43 | | | | Exercised | | (3,400 | ) | | 11.80 | | | | | (99 | ) | | 7.52 | | | | Canceled | | | (5,790 | ) | | 16.07 | | | | | | | (34 | ) | | 13.40 | | | | Outstanding and exercisable at June 30, 2008 | | 892,984 | | 15.05 | | 0.0 | | | Outstanding and exercisable at June 30, 2010 | | | 1,052 | | 12.70 | | 1,168 | | Granted | | 265,000 | | 6.82 | | | | | 88 | | 17.23 | | | | Exercised | | (4,235 | ) | | 6.81 | | | | | (91 | ) | | 7.41 | | | | Canceled | | | (133,295 | ) | | 14.93 | | | | | | | (3 | ) | | 17.30 | | | | Outstanding and exercisable at June 30, 2009 | | | 1,020,454 | | $12.94 | | $0.4 | | | Outstanding and exercisable at June 30, 2011 | | | | 1,046 | | $ | 13.56 | | $ | 2,271 | |
| | | The following table summarizes information for options outstanding and exercisable at June 30, 2009:2011: |
| | | | | | | | | | | | | | Weighted Average | | | Range of
Prices | | | Options
Outstanding | | | Remaining
Life (Years) | | | Exercise
Price | | | $ 6.81 – 10.75 | | | 271,815 | | | 9.1 | | | $ 6.97 | | | 12.35 – 13.59 | | | 268,773 | | | 7.0 | | | 12.60 | | | 14.40 – 16.52 | | | 356,266 | | | 5.4 | | | 15.54 | | | 19.21 – 20.27 | | | 123,600 | | | 4.4 | | | 19.34 | | | $ 6.81 – 20.27 | | | 1,020,454 | | | 6.7 | | | $ 12.94 | |
| | | | | | | | | | | | | | | | | | | | Weighted Average | | Range of
Prices | | Options Outstanding
(in thousands) | | Remaining
Life (Years) | | Exercise
Price | | | $ | 6.81 – 10.75 | | | 254 | | | 8.0 | | | | $ | 7.71 | | | | | 12.35 – 12.74 | | | 230 | | | 6.0 | | | | | 12.51 | | | | | 14.40 – 16.52 | | | 352 | | | 3.4 | | | | | 15.54 | | | | | 17.23 – 20.27 | | | 210 | | | 5.3 | | | | | 18.46 | | | | $ | 6.81 – 20.27 | | | 1,046 | | | 5.4 | | | | $ | 13.56 | | |
| | 10.9.
| BENEFIT AND RETIREMENT PLANS | | | | The Company sponsors various defined contribution pension and retirement plans, which cover substantially all employees, other than employees covered by multi-employer pension plans under collective bargaining agreements. Total pension and retirement plan expense was $1.7 million, $1.5 million and $1.8 million in fiscal year 2009years 2011, 2010 and $2.0 million in each of the fiscal years 2008 and 2007.2009. The amounts include $0.5 million in each of thefiscal year 2011, $0.4 million in fiscal 2010 and $0.5 million in fiscal years 2009, 2008 and 2007, for the Company’s matching contribution to retirement savings plans. The Company’s cost for pension plans is generally determined as 2% - 6% of each covered employee’s wages. The Company’s matching contribution for the retirement savings plans is generally 25% - 50% of employee contributions (up to 4% of employee earnings). | | | | In addition to the above, amounts charged to pension expense and contributed to multi-employer defined benefit pension plans administered by others under collective bargaining agreements were $0.5 million $0.8 million and $0.9 million in fiscal 2009, 2008years 2011, 2010 and 2007,2009, respectively. The cumulative cost to exit the Company’s multi-employer plans was approximately $3.9$7.2 million on June 30, 2009.2011. | | | | The Company has unfunded deferred compensation plans with executive officers. The plans require various annual contributions for the participants based upon compensation levels and age. All participants are fully vested. For fiscal 2009, 20082011, 2010 and 2007,2009, the benefit obligation was increased by interest expense of $0.2 million, $0.2 million and $0.1 million, service costs of $0.4 million, $0.3 million and $0.2 million, service costs of $0.2 million, $0.3 million and $0.5 million, and decreased by payments of $0.6$0.4 million, $0.8$0.4 million and $0.5$0.6 million, respectively. At June 30, 20092011 and 2008,2010, the deferred compensation liability was $5.0 million$5.3 and $5.3$5.1 million, respectively. Funds of the deferred compensation plans are held in a Rabbi Trust. The assets held in the Rabbi Trust are not available for general corporate purposes. The Rabbi Trust is subject to creditor claims in the event of insolvency, but otherwise must be used only for purposes of providing benefits under the plans. As of June 30, 2009,2011, the Company’s deferred compensation plan assets, held in the Rabbi Trust, were invested in stock and bond funds. As of June 30, 20092011 and 2008,2010, the fair market value of the assets held in the Rabbi Trust were $4.3$5.5 million and $5.2$4.7 million, respectively, and are classified as “Other Assets” in the Consolidated Balance Sheets. These assets are classified as Level 2 in accordance with SFAS 157fair value accounting as discussed in Note 1. | | |
| | | Under provisions of the Company’s Voluntary Deferred Compensation Plan, executive officers may defer common stock awards received as participantspart of the 2007 Long-Term Incentive Planincentive compensation plans until retirement. Under the plan, no shares were deferred during the fiscal years ended June 30, 20092011 and 2008.2010. At June 30, 20092011 and 2008, 47,3222010, 36,867 shares and 53,57542,094 shares with an award date value of $0.7$0.5 million and $0.8$0.6 million, respectively, had been deferred and are being held on behalf of the employees. Under the plan, 6,2535,227 shares and 7,2785,228 shares were distributed in fiscal years 20092011 and 2008,2010, respectively. | | | | TheAs of June 30, 2011, the Company’s defined benefit pension plan covers 59has no active hourly production employees of DMI.DMI and is frozen. There are a total of 463444 participants in the plan. Retirement benefits are based on years of credited service multiplied by a dollar amount negotiated under collective bargaining agreements. The Company’s policy is to fund normal costs and amortization of prior service costs at a level that is equal to or greater than the minimum required under the Employee Retirement Income Security Act of 1974 (ERISA). According to an agreement reached with the collective bargaining unit, all benefits and participants are fixed. Future benefits will accrue to current participants; however, new participants cannot be added to the plan. As of June 30, 20092011 and 2008,2010, the Company recorded an accrued benefit liability related to the funded status of the defined benefit pension plan recognized on the Company’s consolidated balance sheets in other long-term liabilities of $1.8$1.1 million and $0.3$2.4 million, respectively. The accumulated benefit obligation was $5.7$6.2 million and $5.2$6.6 million at fiscal years ended June 30, 2011 and 2010, respectively. The Company recorded expense of $0.2 million, $0.2 million and $0 during fiscal years 2011, 2010 and 2009, and 2008, respectively.respectively, related to the plan.
| | | 11.10.
| COMPREHENSIVE INCOME (LOSS) INCOME |
| | | The components of comprehensive income (loss) income,, net of income taxes, for the years ended June 30, were as follows (in thousands): |
| | | | | | | | | | | | | | | 2009 | | 2008 | | 2007 | | | Net (loss) income | | $ | (1,509 | ) | $ | 4,236 | | $ | 9,334 | | | Other comprehensive (loss) income (OCI): | | | | | | | | | | | | Change in fair value of derivatives, net of income taxes of $5, $176 and $70, respectively | | | (1 | ) | | (273 | ) | | (168 | ) | | Change in fair value of available-for-sale, Securities, net of income taxes of $631, $54, $(205), respectively | | | (1,022 | ) | | (84 | ) | | 301 | | | Change in minimum pension liability, net of income taxes of $595, $321 and $(140), respectively | | | (969 | ) | | (524 | ) | | 255 | | | Total other comprehensive (loss) income | | | (1,992 | ) | | (881 | ) | | 388 | | | Total comprehensive (loss) income | | $ | (3,501 | ) | $ | 3,355 | | $ | 9,722 | |
| | | | | | | | | | | | | 2011 | | 2010 | | 2009 | | Net income (loss) | | $ | 10,417 | | $ | 10,801 | | $ | (1,509 | ) | Other comprehensive income (loss) (OCI): | | | | | | | | | | | Change in fair value of derivatives, net of income taxes of $0, $(109) and $5, respectively | | | — | | | 177 | | | (1 | ) | Change in fair value of available-for-sale, Securities, net of income taxes of $(214), $(24), $631, respectively | | | 348 | | | 39 | | | (1,022 | ) | Change in minimum pension liability, net of income taxes of $(532), $124 and $595, respectively | | | 869 | | | (204 | ) | | (969 | ) | Total other comprehensive income (loss) | | | 1,217 | | | 12 | | | (1,992 | ) | Total comprehensive income (loss) | | $ | 11,634 | | $ | 10,813 | | $ | (3,501 | ) |
| | | The components of accumulated other comprehensive (loss) income,loss, net of income taxes, are as follows (in thousands): |
| | | | | | | | | | | | June 30, | | | | | 2009 | | 2008 | | | Available-for-sale securities | | $ | (47 | ) | $ | 975 | | | Interest rate swaps | | | (180 | ) | | (178 | ) | | Pension and other post-retirement benefit adjustments | | | (1,537 | ) | | (569 | ) | | Total accumulated other comprehensive (loss) income | | $ | (1,764 | ) | $ | 228 | |
| | | | | | | | | | June 30, | | | | 2011 | | 2010 | | Available-for-sale securities | | $ | 337 | | $ | (11 | ) | Pension and other post-retirement benefit adjustments | | | (872 | ) | | (1,741 | ) | Total accumulated other comprehensive loss | | $ | (535 | ) | $ | (1,752 | ) |
| | 12.11.
| LITIGATION | | | | The Company has been named as one of several defendants in an Indiana civil lawsuit related to groundwater contamination. The lawsuit alleges that the contamination source is a property once owned by the Company. The Company does not believe that it caused or contributed to the contamination. This lawsuit is in its preliminary stages. Plaintiffs have not identified a dollar amount of their alleged damages and the status of insurance coverage has not been determined. We are unable to estimate a range of reasonably possible outcomes or losses at this time. Accordingly, no accrual related to this matter has been recorded in the June 30, 2011 financial statements. Legal and other related expenses of $0.5 million have been incurred responding to this lawsuit and are included in Selling, General and Administrative expense in the fiscal year 2011 Consolidated Statement of Operations. |
| | | Other Proceedings– From time to time, the Company is subject to various other legal proceedings, including lawsuits, which arise out of, and are incidental to, the conduct of the Company’s business. The Company does not consider any of such other proceedings that are currently pending, individually or in the aggregate, to be material to its business or likely to result in a material adverse effect on its consolidated operating results, financial condition, or cash flows. | | | 13.12.
| COMMITMENTS AND CONTINGENCIES |
| | | FACILITY LEASES – the Company leases certain facilities and equipment under various operating leases. These leases require the Company to pay the lease cost, operating costs, including property taxes, insurance, and maintenance. Total lease expense related to the various operating leases was approximately $4.3$2.7 million, $4.0$3.4 million and $3.6$4.3 million in fiscal 2009, 20082011, 2010 and 2007,2009, respectively. |
| | | Expected future minimum commitments under operating leases as of June 30, 20092011 were as follows (in thousands): |
| | | | | | | Fiscal Year Ended June 30 | | | 2010 | | | 2,022 | | | 2011 | | | 1,229 | | | 2012 | | | 1,112 | | | 2013 | | | 768 | | | 2014 | | | 482 | | | Thereafter | | | 162 | | | | | $ | 5,775 | |
| | | | | Fiscal Year Ended June 30, | | 2012 | | $ | 1,851 | | 2013 | | | 1,315 | | 2014 | | | 751 | | 2015 | | | 165 | | 2016 | | | — | | Thereafter | | | — | | | | $ | 4,082 | |
| | 14.13.
| FACILITY CONSOLIDATIONCLOSING COSTS | | | | During the fiscal year ended June 30, 2009,2011, the Company closed a manufacturing facility and recorded pre-tax charges for facility consolidation and relatedclosing costs of $2.6$1.0 million. The charges represent employee separation costs of $2.0$0.6 million and facilityother closing costs of $0.6$0.4 million with no future benefit to the Company. In the process of recording facility consolidation charges, the company reviewed the usefulness and/or ability to sell idle assets at these facilities in order to determine their fair value. Based on this review, the Company recorded an asset impairment of $0.1 million related to machinery and equipment and included it in thewere classified as “Facility Consolidation and Other Charges” lineClosing Costs” in the Consolidated Statements of Operations.Operations and June 30, 2011. At June 30, 2011, the closure is completed and there were no facility consolidation liabilities remaining. | | | 15.14.
| SEGMENTSSEGMENT REPORTING
|
| | | The Company operates in one reportable operating segment, furniture products. Our operations involve the distribution of manufactured and imported products consisting of a broad line of upholstered and wood furniture such as sofas, loveseats, chairs, reclining and rocker-reclining chairs, swivel rockers, sofa beds, convertible bedding units, occasional tables, desks, dining tables and chairs and bedroom furniture for residential recreational vehicle, and commercial markets. The Company’s furniture products are sold primarily throughout the United States by the Company’s internal sales force and various independent representatives. The Company makes minimal export sales. No single customer accounted for more than 10% of net sales. | | | | Set forth below is information for the past three fiscal years showing the Company’s net sales attributable to each of the areas of application (in thousands): |
| | | | | | | | | | | | | | | FOR THE YEARS ENDED JUNE 30, | | | | | 2009 | | 2008 | | 2007 | | | Residential | | $ | 230,727 | | $ | 258,084 | | $ | 259,710 | | | Recreational Vehicle | | | 16,197 | | | 56,090 | | | 66,165 | | | Commercial | | | 77,234 | | | 91,481 | | | 99,525 | | | | | $ | 324,158 | | $ | 405,655 | | $ | 425,400 | |
16. SUPPLEMENTARY QUARTERLY FINANCIAL INFORMATION– UNAUDITED
| | | | | | | | | | | | | | | | (in thousands, except per share amounts) | | FOR THE QUARTER ENDED | | | | | September 30 | | December 31 | | March 31 | | June 30 | | | Fiscal 2009: | | | | | | | | | | | | | | | Net sales | | $ | 91,417 | | $ | 84,550 | | $ | 73,627 | | $ | 74,564 | | | Gross margin | | | 17,136 | | | 16,131 | | | 12,168 | | | 15,639 | | | Net (loss) income (1) | | | (749 | ) | | 296 | | | (1,854 | ) | | 798 | | | (Loss) earnings per share: | | | | | | | | | | | | | | | Basic | | $ | (0.11 | ) | $ | 0.04 | | $ | (0.28 | ) | $ | 0.12 | | | Diluted | | $ | (0.11 | ) | $ | 0.04 | | $ | (0.28 | ) | $ | 0.12 | |
| | | | | | | | | | | | | FOR THE YEARS ENDED JUNE 30, | | | | 2011 | | 2010 | | 2009 | | Residential | | $ | 258,095 | | $ | 246,041 | | $ | 230,727 | | Commercial | | | 81,331 | | | 80,425 | | | 93,431 | | | | $ | 339,426 | | $ | 326,466 | | $ | 324,158 | |
| | | | | | | | | | | | | | | | (in thousands, except per share amounts) | | FOR THE QUARTER ENDED | | | | | September 30 | | December 31 | | March 31 | | June 30 | | | Fiscal 2008: | | | | | | | | | | | | | | | Net sales | | $ | 100,900 | | $ | 105,986 | | $ | 98,138 | | $ | 100,630 | | | Gross margin | | | 19,763 | | | 22,070 | | | 18,019 | | | 18,637 | | | Net income | | | 1,183 | | | 1,868 | | | 849 | | | 336 | | | Earnings per share: | | | | | | | | | | | | | | | Basic | | $ | 0.18 | | $ | 0.28 | | $ | 0.13 | | $ | 0.05 | | | Diluted | | $ | 0.18 | | $ | 0.28 | | $ | 0.13 | | $ | 0.05 | |
| | 15. | The sum of the per share amounts for the quarters may not equal the total for the year due to the treasury stock method.SUPPLEMENTARY QUARTERLY FINANCIAL INFORMATION– UNAUDITED
|
| | | | | | | | | | | | | | (in thousands, except per share amounts) | | FOR THE QUARTER ENDED | | | | September 30 | | December 31 | | March 31 | | June 30 | | Fiscal 2011: | | | | | | | | | | | | | | Net sales | | $ | 87,230 | | $ | 82,821 | | $ | 85,175 | | $ | 84,200 | | Gross margin | | | 19,606 | | | 18,825 | | | 18,207 | | | 20,664 | | Net income (1) | | | 2,343 | | | 2,131 | | | 2,455 | | | 3,488 | | Earnings per share: | | | | | | | | | | | | | | Basic | | $ | 0.35 | | $ | 0.32 | | $ | 0.37 | | $ | 0.52 | | Diluted | | $ | 0.34 | | $ | 0.31 | | $ | 0.35 | | $ | 0.50 | |
| | | | (1) | The quartersquarter ended September 30, 2008, December 31, 2008, March 31, 2009 and June 30, 2009 include2010 includes facility consolidation and other chargesclosing costs after-tax of $0.8$1.0 million or $0.13 per share, $0.3 million or $0.05 per share, $0.3 million or $0.05 per share and $0.1 million or $0.02$0.15 per share, respectively. |
| | | | | | | | | | | | | | (in thousands, except per share amounts) | | FOR THE QUARTER ENDED | | | | September 30 | | December 31 | | March 31 | | June 30 | | Fiscal 2010: | | | | | | | | | | | | | | Net sales | | $ | 75,941 | | $ | 83,524 | | $ | 81,451 | | $ | 85,550 | | Gross margin | | | 16,556 | | | 20,041 | | | 18,033 | | | 20,151 | | Net income | | | 1,380 | | | 2,964 | | | 2,320 | | | 4,137 | | Earnings per share: | | | | | | | | | | | | | | Basic | | $ | 0.21 | | $ | 0.45 | | $ | 0.35 | | $ | 0.62 | | Diluted | | $ | 0.21 | | $ | 0.45 | | $ | 0.34 | | $ | 0.61 | |
| | Item 9. | Changes in and Disagreements with Accountants on Accounting and Financial Disclosure |
None. | | Item 9A. | Controls and Procedures |
Evaluation of disclosure controls and procedures – Based on their evaluation as of the end of the period covered by this Annual Report on Form 10-K, the Company’s Chief Executive Officer (“CEO”) and Chief Financial Officer (“CFO”) have concluded that the Company’s disclosure controls and procedures (as defined in Rules 13a-15(e) or 15d-15(e)) under the Securities Act of 1934, as amended) were effective as of June 30, 2009.2011. Changes in internal control over financial reporting – During fiscal year 2009, the Company completed remediation of the material weaknessyear-ended June 30, 2011, there was no change in internal control over financial reporting identified during fiscal year 2008, specifically related to the reconciliation of accounts payable at its material consolidated subsidiary. Remedial measures undertaken during fiscal 2009 included simplifying the account structure surrounding the accounts payable transactions by reducing the number of general ledger accounts used to record accounts payable, improving the accounts payable reconciliation process by revising the automatic postings to accounts payable, and enhancing the review and approval of the accounts payable reconciliation process with our subsidiary associates. The Company believes that these remediation actions have improved the Company’s internal controlscontrol over financial reporting (as defined in Rule 13a-15(f) under the Securities Exchange Act of 1934) and are sufficientthat has materially affected, or is reasonably likely to remediatematerially affect the material weakness described above.Company’s internal control over financial reporting. Management’s Annual Report on Internal Control Over Financial Reporting – Management is responsible for establishing and maintaining adequate internal control over financial reporting, as such term is defined in Rules 13a-15(f) or 15d-15(f) of the Securities Exchange Act of 1934, as amended. We performed an evaluation under the supervision and with the participation of our management, including the CEO and CFO, to assess the effectiveness of the design and operation of our disclosure controls and procedures under the Exchange Act as of June 30, 2009.2011. In making this assessment, we used the criteria set forth by the Committee of Sponsoring Organizations of the Treadway Commission in Internal Control — Integrated Framework. Based on thatthose criteria, management concluded that the internal control over financial reporting is effective as of June 30, 2009.2011. This annual report does not include an attestation report of the Company’s registered public accounting firm regarding internal control over financial reporting. Management’s report was not subject to attestation by the Company’s registered public accounting firm pursuant to temporary rules of the Securities and Exchange Commission for smaller reporting companies that permit the Company to provide only management’s report in this annual report.
| | Item 9B. | Other Information |
None.
PART III | | Item 10. | Directors, Executive Officers and Corporate Governance |
The information identifying directors of the Company, the Audit and Ethics Committee, the Audit and Ethics Committee Expert and Section 16(a) beneficial ownership reporting compliance, will be contained in the Company’s fiscal 20082011 definitive proxy statement to be filed with the Securities and Exchange Commission under the sections captioned “Proposal 1 Election of Directors,” “Corporate Governance – Audit and Ethics Committee, of the Board of Directors”” “Corporate Governance – Nomination Matters” and “Compliance with Section“Section 16(a) of the Securities Exchange Act of 1934” and areBeneficial Ownership Reporting Compliance” is incorporated herein by reference. The Company has adopted a code of ethics called theGuidelines for Business Conduct that applies to the Company’s employees, including the principal executive officer, principal financial officer, principal accounting officer or controller, and persons performing similar functions. A copy of the code of ethics is posted on our website atwww.flexsteel.com. The executive officers of the Company, their ages, positions (in each case as of June 30, 2009)2011), and the year they were first elected or appointed an officer of the registrant, are as follows: | | | Name (age) | | Position (date first became officer) | Ronald J. Klosterman (61)(63) | | President & Chief Executive Officer (1989) | James R. Richardson (65)(67) | | Senior Vice President of Residential Sales and Marketing (1979) | Thomas D. Burkart (66)(68) | | Senior Vice President of Vehicle Seating (1984) | Patrick M. Crahan (61)(63) | | Senior Vice President of Commercial Seating (1989) | Jeffrey T. Bertsch (54)(56) | | Senior Vice President of Corporate Services (1989) | Donald D. Dreher (60)(61) | | Senior Vice President (2004), President & CEO of DMI Furniture, Inc. (1986) | James E. Gilbertson (59)(61) | | Senior Vice President of Vehicle Seating (1989) | Timothy E. Hall (51)(53) | | Senior Vice President-Finance, Chief Financial Officer, Secretary & SecretaryTreasurer (2000) |
| | Item 11. | Executive Compensation |
The information identifying executive compensation will be contained in the Company’s fiscal year 20092011 definitive proxy statement to be filed with the Securities and Exchange Commission under the sections captioned “Executive Compensation,” and “Director Compensation,” and “Corporate Governance - Compensation Committee Interlocks and Insider Participation” and areis incorporated herein by reference. | | Item 12. | Security Ownership of Certain Beneficial Owners and Management and Related Stockholder Matters |
The information identifying beneficial ownership of stock and supplementary data will be contained in the Company’s fiscal year 20092011 definitive proxy statement to be filed with the Securities and Exchange Commission under the sections captioned “Ownership of Stock By Directors and Executive Officers,” “Ownership of Stock by Certain Beneficial Owners,” and “Equity Compensation Plan Information” and areis incorporated herein by reference. | | Item 13. | Certain Relationships and Related Transactions, and Director Independence |
This information will be contained under the headingsections “Interest of Management and Others in Certain Transactions” and “Corporate Governance – Board of Directors” in the Company’s fiscal year 20092011 definitive proxy statement to be filed with the Securities and Exchange Commission and is incorporated herein by reference. | | Item 14. | Principal Accountant Fees and Services |
Deloitte & Touche LLP was the Company’s independent registered public accounting firm in fiscal 2009.2011. In addition to performing the audit of the Company’s consolidated financial statements, Deloitte & Touche LLP provided various audit-related services during fiscal 2009.2011. The Audit and Ethics Committee pre-approves both the type of services to be provided by Deloitte & Touche LLP and the estimated fees related to these services. The Audit and Ethics Committee reviewed professional services and the possible effect on Deloitte & Touche LLP’s independence was considered. The Audit and Ethics Committee has considered and found the provision of services for non-audit services compatible with maintaining Deloitte & Touche LLP’s independence. All services provided by Deloitte & Touche LLP during fiscal 20092011 were pre-approved by the Audit and Ethics Committee.
The aggregate fees billed for each of the past two fiscal years ended June 30 for each of the following categories of services are set forth below:
| | | | | | | | | | | | 2009 | | 2008 | | | Audit Fees(1) | | $ | 365,000 | | $ | 578,000 | | | Audit Related Fees(2) | | | 38,000 | | | 38,000 | | | Tax Fees(3) | | | — | | | 22,000 | | | Total | | $ | 403,000 | | $ | 638,000 | |
| | | | | | | | | | 2011 | | 2010 | | Audit Fees (1) | | $ | 357,500 | | $ | 376,000 | | Tax Fees (2) | | | 15,000 | | | — | | | | $ | 372,500 | | $ | 376,000 | |
| | (1) | Professional fees and expenses for the audit of financial statements and internal control over financial reporting services for fiscal 20092011 and 2008, as applicable, andfiscal 2010 consisted of (i) audit of the Company’s annual consolidated financial statements; (ii) reviews of the Company’s quarterly consolidated financial statements; (iii) employee benefit plan audits; (iv) consents and other services related to Securities and Exchange Commission matters; and (iv)(v) consultations on financial accounting and reporting matters arising during the course of the audit and reviews. Fiscal 2010 also included internal control over financial reporting services. | | | (2) | Professional fees and expenses for audit-related services billed in fiscal 2009 and 2008 consisted of employee benefit plan audits. | | | (3)
| Professional fees and expenses for tax services billed in fiscal 20082011 consisted of tax planning and advice services totaling $22,000$15,000 and consisted of (i) tax advice related to structuring certain proposed transactions; and (ii) general tax planning matters.
|
PART IV | | Item 15. | Exhibits, Financial Statement Schedules, and Reports on Form 8-K |
| | | (a) | (1) | Financial Statements | | | | | The financial statements of the Company are set forth above in Item 8. | | | | | (2) | Schedules | | | | | The following financial statement schedules for the years ended June 30, 2009, 2008 and 2007 are submitted herewith:
|
The following financial statement schedules for the years ended June 30, 2011, 2010 and 2009 are submitted herewith: SCHEDULE II
RESERVES RESERVES For the Years Ended June 30, 2009, 20082011, 2010 and 20072009 | | | | | | | | | | | | | | | | Description | | Balance at
Beginning
of Year | | Additions
Charged to
Income | | Deductions
from
Reserves | | Balance at
End of Year | | | Allowance for Doubtful Accounts: | | | | | | | | | | | | | | | 2009 | | $ | 2,110,000 | | $ | 1,240,000 | | $ | (1,590,000 | ) | $ | 1,760,000 | | | 2008 | | $ | 2,090,000 | | $ | 1,050,000 | | $ | (1,030,000 | ) | $ | 2,110,000 | | | 2007 | | $ | 2,820,000 | | $ | — | | $ | (730,000 | ) | $ | 2,090,000 | |
| | | | | | | | | | | | | | Description | | Balance at
Beginning of
Year | | Additions
Charged to
Income | | Deductions
from
Reserves | | Balance at
End of Year | | Allowance for Doubtful Accounts: | | | | | | | | | | | | | | 2011 | | $ | 2,020,000 | | $ | 870,000 | | $ | (890,000 | ) | $ | 2,000,000 | | 2010 | | $ | 1,760,000 | | $ | 920,000 | | $ | (660,000 | ) | $ | 2,020,000 | | 2009 | | $ | 2,110,000 | | $ | 1,240,000 | | $ | (1,590,000 | ) | $ | 1,760,000 | |
| | | | Other schedules are omitted because they are not required or are not applicable or because the required information is included in the financial statements. |
| | | | (3) | Exhibit No. | | | | | 3.1 | The 1983Amended and Restated Articles of Incorporation of the Company as amended through February 14, 2007 (incorporatedincorporated by reference to Form 8-K, as filed with the Company’s Annual ReportSecurities and Exchange Commission on Form 10-K for the fiscal year ended June 30, 2007).December 8, 2010.
|
| | | | 3.2 | By-LawsAmended and Restated Bylaws of the Company (incorporatedincorporated by reference to the Company’s Annual Report on Form 10-K for the fiscal year ended June 30, 1993).
| | | | | 3.3
| Amendments to Restated By-Laws of the Company (incorporated by reference to Exhibit 3.1 to the Company’s Form 8-K, as filed with the Securities and Exchange Commission on JuneDecember 8, 2007).2010.
| | | | | 10.1 | 1995 Stock Option Plan incorporated by reference from the 1995 Flexsteel definitive proxy statement. * |
| | | | 10.2 | 1999 Stock Option Plan incorporated by reference from the 1999 Flexsteel definitive proxy statement. * | | | | | 10.210.3
| Flexsteel Industries, Inc. Voluntary Deferred Compensation Plan incorporated(incorporated by reference to Exhibit No. 10.5 to the Annual Report on Form 10-K for the fiscal year ended June 30, 2001.2001). * | | | | | 10.310.4
| Flexsteel Industries, Inc. Restoration Retirement Plan incorporated(incorporated by reference to Exhibit No. 10.6 to the Annual Report on Form 10-K for the fiscal year ended June 30, 2001.2001). * | | | | | 10.410.5
| Flexsteel Industries, Inc. Senior Officer Supplemental Retirement Plan incorporated(incorporated by reference to Exhibit No. 10.7 to the Annual Report on Form 10-K for the fiscal year ended June 30, 2001.2001). * | | | | | 10.510.6
| 2002 Stock Option Plan incorporated(incorporated by reference to Appendix A from the 2002 Flexsteel definitive proxy statement.statement). * | | | | | 10.610.7
| Agreement and Plan of Merger, dated as of August 12, 2003, by and among Flexsteel, Churchill Acquisition Corp. and DMI (incorporated by reference to Exhibit 99(d)(1) of Flexsteel Industries, Inc.’s Tender Offer Statement on Schedule TO filed with the Securities and Exchange Commission on August 20, 2003) incorporated by reference to Form 8-K and Amendments No. 1 to Form 8-K, as filed with Securities and Exchange Commission on October 2, 2003. | | | | | 10.7
| Credit Facility Agreement dated June 30, 2004 as amended or modified on June 10, 2005, August 19, 2005, December 23, 2005, January 3, 2006, and May 19, 2006 incorporated by reference to Exhibit 10.9 to Flexsteel Industries, Inc. Annual Report on Form 10-K for the fiscal year ended June 30, 2006..
| | | | | 10.8 | Flexsteel Industries, Inc. 2006 Stock Option Plan incorporated(incorporated by reference to Appendix C from the 2006 Flexsteel Proxy Statement filed with the Securities and Exchange Commission on October 31, 2006.2006). | | | | | 10.9 | Note Modification Agreement date June 25, 2007 (long-term facility) between Flexsteel Industries, Inc. and JPMorgan Chase Bank, N.A. incorporated by reference to Exhibit 10.1 to Flexsteel’s Form 8-K filed with the Securities and Exchange Commission on June 26, 2007.
| | | | | 10.10
| Note Modification Agreement date June 25, 2007 (short-term facility) between Flexsteel Industries, Inc. and JPMorgan Chase Bank, N.A. incorporated by reference to Exhibit 10.1 to Flexsteel’s Form 8-K filed with the Securities and Exchange Commission on June 26, 2007.
| | | | | 10.11
| Credit Agreement date June 25, 2007 between Flexsteel Industries, Inc. and JPMorgan Chase Bank, N.A. incorporated by reference to Exhibit 10.3 to Flexsteel’s Form 8-K filed with the Securities and Exchange Commission on June 26, 2007.
| | | | | 10.12
| Employment Agreement dated October 1, 2006 between Flexsteel Industries, Inc. and Donald D. Dreher incorporated(incorporated by reference to Exhibit 10.1 to Flexsteel’s Form 8-K filed with the Securities and Exchange Commission on October 5, 2006.2006). * | | | | | 10.13
| Note Modification Agreement dated June 26, 2008 (short-term facility) between Flexsteel Industries, Inc. and JPMorgan Chase Bank, N.A. incorporated by reference to Exhibit 10.1 to Flexsteel’s Form 8-K filed with the Securities and Exchange Commission on June 27, 2008.
| | | | | 10.14
| Credit Agreement dated June 26, 2008 between Flexsteel Industries, Inc. and JPMorgan Chase Bank, N.A. incorporated by reference to Exhibit 10.2 to Flexsteel’s Form 8-K filed with the Securities and Exchange Commission on June 27, 2008.
| | | | | 10.1510.10
| Amendment to Employment Agreement dated June 27, 2008 between Flexsteel Industries, Inc. and Donald D. Dreher incorporated(incorporated by reference to Exhibit 10.3 to Flexsteel’s Form 8-K filed with the Securities and Exchange Commission on June 27, 2008.2008).* |
| | | | 10.1610.11
| Flexsteel Industries, Inc. 2007 Long-Term Management Compensation Plan (incorporated by reference to Appendix C to the Definitive Proxy Statement on Schedule 14A filed with the Commission on November 1, 2007). * | | | | | 10.1710.12
| Credit Agreement dated March 27, 2009 between Flexsteel Industries, Inc. and JPMorgan Chase Bank, N.A. incorporatedStock Option Plan (incorporated by reference to Exhibit 10.1 to Flexsteel’s Form 8-K filed withAppendix A from the Securities and Exchange Commission on March 31, 2009.2009 Flexsteel definitive proxy statement). *
| | | | | 10.1810.13
| Continuing SecurityCredit Agreement dated March 27, 2009June 7, 2011 between Flexsteel Industries, Inc. and JPMorgan ChaseWells Fargo Bank, N.A. incorporatedN. A. (incorporated by reference to Exhibit 10.2 to Flexsteel’s Form 8-K filed with the Securities and Exchange Commission on March 31, 2009.June 9, 2011).
| | | | | 10.1910.14
| Revolving Line of Credit Note (“Facility A”) dated March 27, 2009June 7, 2011 between Flexsteel Industries, Inc. and JPMorgan ChaseWells Fargo Bank, N.A. incorporatedN. A. (incorporated by reference to Exhibit 10.3 to Flexsteel’s Form 8-K filed with the Securities and Exchange Commission on March 31, 2009. | | | | | 10.20
| Line of Credit Note (“Facility B”) dated March 27, 2009 between Flexsteel Industries, Inc. and JPMorgan Chase Bank, N.A. incorporated by reference to Exhibit 10.4 to Flexsteel’s Form 8-K filed with the Securities and Exchange Commission on March 31, 2009.June 9, 2011).
| | | | | 21.1 | Subsidiaries of the Company. Filed herewith. | | | | | 23 | Consent of Independent Registered Public Accounting Firm. Filed herewith. | | | | | 31.1 | Certification by Chief Executive Officer Pursuant to 18 U.S.C. Section 1350 as Adopted Pursuant to Section 302 of the Sarbanes-Oxley Act of 2002.Certification. Filed herewith.
| | | | | 31.2 | Certification by Chief Financial Officer Pursuant to 18 U.S.C. Section 1350 as Adopted Pursuant to Section 302 of the Sarbanes-Oxley Act of 2002.Certification. Filed herewith.
| | | | | 32 | Certification by Chief Executive Officer and Chief Financial Officer Pursuant to 18 U.S.C. Section 1350 as Adopted Pursuant to Section 906 of the Sarbanes-Oxley Act of 2002. Filed herewith. | | | | | | *Management contracts, compensatory plans and arrangements required to be filed as an exhibit to this report. |
SIGNATURES Pursuant to the requirements of Section 13 or 15(d) of the Securities Exchange Act of 1934, the registrant has duly caused this report to be signed on its behalf by the undersigned, thereunto duly authorized. | | | | | | Date: | August 26, 200919, 2011 | | | FLEXSTEEL INDUSTRIES, INC. | | | | | | | | | | | By: | /S/ Ronald J. Klosterman | | | | | | Ronald J. Klosterman | | | | | | Chief Executive Officer | | | | | | and | | | | | | Principal Executive Officer | | | | | | | | | | | By: | /S/ Timothy E. Hall | | | | | | Timothy E. Hall | | | | | | Chief Financial Officer | | | | | | and | | | | | | Principal Financial and Accounting Officer | |
Pursuant to the requirements of the Securities Exchange Act of 1934, this report has been signed below by the following persons on behalf of the registrant and in the capacities and on the dates indicated. | | | | | Date: | August 26, 200919, 2011 | | /S/ L. Bruce Boylen | | | | | L. Bruce Boylen | | | | | Chairman of the Board of Directors | | | | | | | Date: | August 26, 200919, 2011 | | /S/ Ronald J. Klosterman | | | | | Ronald J. Klosterman | | | | | Director | | | | | | | Date: | August 26, 200919, 2011 | | /S/ Jeffrey T. Bertsch | | | | | Jeffrey T. Bertsch | | | | | Director | | | | | | | Date: | August 26, 200919, 2011 | | /S/ Mary C. Bottie | | | | | Mary C. Bottie | | | | | Director | | | | | | | Date: | August 26, 200919, 2011 | | /S/ Patrick M. Crahan | | | | | Patrick M. Crahan | | | | | Director | | | | | | | Date: | August 26, 200919, 2011 | | /S/ Lynn J. Davis | | | | | Lynn J. Davis | | | | | Director | | | | | | | Date: | August 26, 200919, 2011 | | /S/ Robert E. Deignan | | | | | Robert E. Deignan | | | | | Director | | | | | | | Date: | August 26, 200919, 2011 | | /S/ Thomas E. Holloran | | | | | Thomas E. Holloran | | | | | Director | | | | | | | Date: | August 26, 200919, 2011 | | /S/ Eric S. RangenThomas M. Levine | | | | | Eric S. RangenThomas M. Levine
| | | | | Director | | | | | | | Date: | August 26, 200919, 2011 | | /S/ Robert J. Maricich | | | | | Robert J. Maricich | | | | | Director | | | | | | | Date: | August 19, 2011 | | /S/ Eric S. Rangen | | | | | Eric S. Rangen | | | | | Director | | | | | | | Date: | August 19, 2011 | | /S/ James R. Richardson | | | | | James R. Richardson | | | | | Director | | | | | | | Date: | August 19, 2011 | | /S/ Nancy E. Uridil | | | | | Nancy E. Uridil | | | | | Director | |
3533
|