DONALDSON COMPANY, INC.
ANNUAL REPORT ON FORM 10-K
|
|
|
| |||
|
|
| Page | |||
|
|
| ||||
| ||||||
| 1 | |||||
| ||||||
| 1 | |||||
| ||||||
|
| |||||
1 | ||||||
|
| 2 | ||||
| ||||||
| 2 | |||||
|
| 2 | ||||
| ||||||
| 2 | |||||
|
| 2 | ||||
| ||||||
|
| |||||
| ||||||
|
| |||||
| ||||||
|
| |||||
| ||||||
|
| |||||
2 | ||||||
| 3 | |||||
| 5 | |||||
| 5 | |||||
| 6 | |||||
|
|
| ||||
| ||||||
|
| |||||
|
| |||||
7 | ||||||
|
| |||||
10 | ||||||
Management’s Discussion and Analysis of Financial Condition and Results of Operations |
|
| ||||
| ||||||
|
|
| ||||
23 | ||||||
|
| |||||
24 | ||||||
|
| |||||
25 | ||||||
Changes in and Disagreements with Accountants on Accounting and Financial Disclosure |
|
| ||||
54 | ||||||
|
| |||||
54 | ||||||
|
| |||||
|
| |||||
55 | ||||||
|
| |||||
55 | ||||||
Security Ownership of Certain Beneficial Owners and Management and Related Stockholder Matters |
|
| ||||
55 | ||||||
Certain Relationships and Related Transactions, and Director Independence |
|
| ||||
56 | ||||||
|
| |||||
|
| |||||
| ||||||
|
| |||||
| ||||||
|
| |||||
| ||||||
|
| |||||
|
| |||||
|
| |||||
Donaldson Company, Inc. (“Donaldson” or the “Company”) was founded in 1915 and organized in its present corporate form under the laws of the State of Delaware in 1936.
The Company is a worldwide manufacturer of filtration systems and replacement parts. The Company’s product mix includes air and liquid filtration systems and exhaust and emission control products. Products are manufactured at 4039 plants around the world and through three joint ventures. The Company has two reporting segments: Engine Products and Industrial Products. Products in the Engine Products segment consist of air filtration systems, exhaust and emissions systems, liquid filtration systems, and replacement parts.filters. The Engine Products segment sells to original equipment manufacturers (“OEMs”) in the construction, mining, agriculture, aerospace, defense, and truck markets and to independent distributors, OEM dealer networks, independent distributors, private label accounts, and large equipment fleets. Products in the Industrial Products segment consist of dust, fume, and mist collectors, compressed air purification systems, liquidair filtration systems, air filter systems for gas turbines, PTFE membrane-based products, and specialized air filtration systems for diverse applications including computer hard disk drives. The Industrial Products segment sells to various industrial end-users, OEMs of gas-fired turbines and OEMs and end-users requiring clean air.
The table below shows the percentage of total net sales contributed by the principal classes of similar products for each of the last three fiscal years:
|
|
|
|
|
|
|
|
|
|
|
|
|
|
|
|
|
|
|
|
|
|
| Year Ended July 31 |
|
| Year Ended July 31, |
| ||||||||||||||
|
| 2009 |
| 2008 |
| 2007 |
|
| 2011 |
| 2010 |
| 2009 |
| ||||||
Engine Products segment |
|
|
|
|
|
|
|
|
|
|
|
|
|
| ||||||
Off-Road Equipment Products (including Aerospace and Defense products) |
| 20 | % |
| 20 | % |
| 18 | % | |||||||||||
Off-Road Products |
| 14 | % |
| 12 | % |
| 13 | % | |||||||||||
Aerospace and Defense Products |
| 5 | % |
| 6 | % |
| 6 | % | |||||||||||
On-Road Products |
| 4 | % |
| 6 | % |
| 9 | % |
| 5 | % |
| 4 | % |
| 4 | % | ||
Aftermarket Products (including replacement part sales to the Company’s OEM’s) |
| 30 | % |
| 29 | % |
| 30 | % | |||||||||||
Aftermarket Products* |
| 38 | % |
| 37 | % |
| 30 | % | |||||||||||
Retrofit Emissions Products |
| 1 | % |
| 1 | % |
| 2 | % | |||||||||||
*includes replacement part sales to the Company’s OEMs customers |
|
|
|
|
|
|
| |||||||||||||
|
|
|
|
|
|
|
| |||||||||||||
Industrial Products segment |
|
|
|
|
|
|
|
|
|
|
|
|
|
| ||||||
Industrial Filtration Solutions Products |
| 27 | % |
| 27 | % |
| 27 | % |
| 22 | % |
| 22 | % |
| 26 | % | ||
Gas Turbine Systems Products |
| 11 | % |
| 10 | % |
| 8 | % | |||||||||||
Gas Turbine Products |
| 7 | % |
| 8 | % |
| 11 | % | |||||||||||
Special Applications Products |
| 8 | % |
| 8 | % |
| 8 | % |
| 8 | % |
| 10 | % |
| 8 | % | ||
Financial information about segment operations appears in Note JK in the Notes to Consolidated Financial Statements on page 51.49.
The Company makes its annual reports on Form 10-K, quarterly reports on Form 10-Q and current reports on Form 8-K, and amendments to those reports, available free of charge through its website, at www.donaldson.com, as soon as reasonably practicable after it electronically files such material with (or furnishes such material to) the Securities and Exchange Commission. Also available on the Company’s website are corporate governance documents, including the Company’s code of business conduct and ethics, corporate governance guidelines, Audit Committee charter, Human Resources Committee charter, and Corporate Governance Committee charter. These documents are available in print, free of charge to any shareholder who requests them. The information contained on the Company’s website is not incorporated by reference into this Annual Report on Form 10-K and should not be considered to be part of this Form 10-K.
In general, the Company’s Engine and Industrial Products segments are not considered to be seasonal. However, aA number of the Company’s end markets are dependent on the construction, agricultural, and power generation industries, which are generally stronger in the second half of the Company’s fiscal year. The first two quarters of the fiscal year also contain the traditional summer and winter holiday periods, which are characterized by more Customer plant closures.
Principal methods of competition in both the Engine and Industrial Products segments are technology, price, geographic coverage, service, and product performance. The Company competes in a number of highly competitive filtration markets in both segments. The Company believes it is a market leader with many of its product lines. The Company believes within the Engine Products segment it is a market leader in its Off-Road Equipment and On-Road Products lines for OEMs and is a significant participant in the aftermarket for replacement filters. The Engine Products segment’s principal competitors include several large global competitors and many regional competitors, especially in the Engine Aftermarket Products business. The Industrial Products segment’s principal competitors vary from country to country and include several large regional and global competitors and a significant number of smaller competitors who compete in a specific geographical region or in a limited number of product applications.
The principal raw materials that the Company uses are steel, filter media, and plastics. The Company purchases a variety of types of steel. Commodity prices were high during the first half ofgenerally increased throughout the year, but decreasedthe impact was moderated by certain long term supply contracts. The Company anticipates a further impact from rising commodity prices in Fiscal 2012, as compared to Fiscal 2011, specifically for steel and media, as these supply contracts expired during the secondlatter half such that the full year was comparable withof Fiscal 2008.2011. The Company experienced no significant supply problems in the purchase of its major raw materials. The Company typically has multiple sources of supply for the raw materials essential to its business. The Companybusiness, and is not required to carry significant amounts of raw material inventory to secure supplier allotments. However, the Company does stock finished goods inventory at its regional distribution centers in order to meet anticipated Customer demand.
The Company owns various patents and trademarks, which it considers in the aggregate to constitute a valuable asset, including patents and trademarks for products sold under the Ultra-Web®, PowerCore®, and Donaldson® trademarks. However, it does not regard the validity of any one patent or trademark as being of material importance.
There were no Customers that accounted for over 10 percent of net sales in Fiscal 2011, 2010 or 2009. Sales to Caterpillar Inc. and its subsidiaries (“Caterpillar”) accounted for 10 percent of net sales in Fiscal 2008 and Fiscal 2007. Caterpillar has been a customer of the Company for many years and purchases many models and types of products for a variety of applications. Sales to the U.S. Government do not constitute a material portion of the Company’s business. There were no Customers over 10 percent of gross accounts receivable in Fiscal 20092011 or 2008.2010.
At August 31, 2009,2011, the backlog of orders expected to be delivered within 90 days was $259,181,000.$423.8 million. All of this backlog is expected to be shipped during Fiscal 2010.2012. The 90-day backlog at August 31, 2008,2010, was $415,078,000.$361.1 million. Backlog is one of many indicators of business conditions in the Company’s markets. However, it is not always indicative of future results for a number of reasons, including short lead times in the Company’s replacement parts businessbusinesses and the timing of orders in many of the Company’s Engine OEM and Industrial markets.
During Fiscal 2009,2011, the Company spent $40,643,000$55.3 million on research and development activities. Research and development expenses include basic scientific research and the application of scientific advances to the development of new and improved products and their uses. The Company spent $43,757,000$44.5 million and $40.6 million in Fiscal 20082010 and $36,458,000 in Fiscal 20072009, respectively, on research and development activities. Substantially all commercial research and development is performed in-house.
The Company does not anticipate any material effect on its capital expenditures, earnings, or competitive position during Fiscal 20102012 due to compliance with government regulations regulating the discharge of materials into the environment or otherwise relating to the protection of the environment.
The Company employed over 10,60013,000 persons in worldwide operations as of August 31, 2009.2011.
Financial information about geographic areas appears in Note JK of the Notes to Consolidated Financial Statements on page 51.49.
There are inherent risks and uncertainties associated with our global operations that involve the design, manufacturing and sale of products for highly demanding Customer applications throughout the world. These risks and uncertainties associated with our business could adversely affect our operating performance and financial condition. The following discussion, along with discussions elsewhere in this report, outlines the risks and uncertainties that we believe are the most material to our business. In light of the current global economic slowdown in recent years and the continued uncertainty, we want to further highlight the risks and uncertainties associated with: world economic factors;factors and the reduction in sales volume and orders due to decreased global demandongoing economic uncertainty that is impacting many regions of the world, the financial condition of our suppliers and Customers, aggressively workingthe potential for some Customers to reduceincrease their levelsreliance on their own filtration capabilities, currency fluctuations, commodity prices, political factors, the Company’s international operations, the possible reduced demand for hard disk drive products with the increased use of inventory; increasedflash memory, highly competitive markets, governmental laws and regulations, including the unprecedentedimpact of the various economic stimulus and financial actionsreform measures being undertakenimplemented by governments around the world; a significant tighteningworld, the implementation of credit availability; andour new information systems, potential global events resulting in instability and unpredictability in the world’s markets, including financial bailouts of sovereign nations, political changes, military and terrorist activities, health outbreaks. We undertakeoutbreaks, and other factors discussed below. The Company undertakes no obligation to publicly update or revise any forward-looking statements.statements, whether as a result of new information, future events or otherwise.
Operating internationally carries risks which could negatively affect our financial performance.
We have sales and manufacturing operations throughout the world, with the heaviest concentrations in North America, Europe and Asia. Our stability, growth, and profitability are subject to a number of risks of doing business internationally that could harm our business, including:
|
|
|
| • | political and military events, |
|
|
|
| • | legal and regulatory requirements, including import, export, |
|
|
|
| • | tariffs and trade barriers, |
|
|
|
| • | potential difficulties in staffing and managing local operations, |
|
|
|
| • | credit risk of local Customers and distributors, |
|
|
|
| • | difficulties in protecting intellectual property, |
|
|
|
| • | local economic, political and social conditions, specifically in China and Thailand where we have significant investments and |
|
|
|
| • | potential global health outbreaks. |
Maintaining a competitive advantage requires continuing investment with uncertain returns.
We operate in highly competitive markets and have numerous competitors who may already be well establishedwell-established in those markets. We expect our competitors to continue improving the design and performance of their products and to introduce new products that could be competitive in both price and performance. We believe that we have certain technological advantages over our competitors, but maintaining these advantages requires us to continually invest in research and development, sales and marketing, and Customer service and support. There is no guarantee that we will be successful in maintaining these advantages. We make investments in new technologies that address increased performance and regulatory requirements around the globe. There is no guarantee that we will be successful in completing development or achieving sales of these products or that the margins on such products will be acceptable. Our financial performance may be negatively impacted if a competitor’s successful product innovation reaches the market before ours or gains broader market acceptance.
SeveralA few of our major OEM Customers also manufacture filtration systems. Although these OEM Customers rely on us and other suppliers for some of their filtration systems, they sometimes choose to manufacture additional filtration systems for their own use. There is also a risk that a Customer could acquire one or more of our competitors.
We may be adversely impacted by changes in technology that could reduce or eliminate the demand for our products. These risks include:
|
|
|
| • | breakthroughs in technology which provide a viable alternative to diesel engines and |
|
|
|
| • | reduced demand for disk drive products |
We participate in highly competitive markets with pricing pressure. If we are not able to compete effectively our margins and results of operations could be adversely affected.
The businesses and product lines in which we participate are very competitive and we risk losing business based on a wide range of factors including technology, price, delivery,geographic coverage, product performance, and Customer service. Large Customers continue to seek productivity gains and lower prices from their suppliers. We may lose business or negatively impact our margins if we are unable to deliver the best value to our Customers.
Demand for our products relies on economic and industrial conditions worldwide.
Demand for our products tends to respond to varying levels of economic, construction, agricultural, mining, and industrial activity in the United States and in other industrialized nations.
Sales to Caterpillar accounted for slightly less than 10 percent of our net sales in Fiscal 20092011, 2010 and 10 percent of our net sales in Fiscal 2008.2009. An adverse change in Caterpillar’s financial performance or a material reduction in our sales to Caterpillar could negatively impact our operating results.
Changes in our product mix impacts our financial performance.
We sell products that have varying profit margins. Our financial performance can be impacted depending on the mix of products we sell during a given period.
Unavailable or higher cost materials could result inimpact our Customers being dissatisfied.financial performance.
We obtain raw material,materials including steel, filter media, and plastics, and other components from third-party suppliers and tend to carry limited raw material inventories. An unanticipated delay in delivery by our suppliers could result in the inability to deliver on-time and meet the expectations of our Customers. This could negatively affect our financial performance. An increase in commodity prices during a recession or an otherwise challenging business and economic environment could also result in lower operating margins.
Difficulties with the Company’s information technology systems could adversely affect the Company’sour results.
The Company has many information technology systems that are important to the operation of its businesses. The Company could encounter difficulties in developing new systems or maintaining and upgrading existing systems. Such difficulties could lead to significant expenses due to disruption in business operations and could adversely affect the Company’s results.
Unfavorable fluctuations in foreign currency exchange rates could negatively impact our results and financial position.
We have operations in many countries. Each of our subsidiaries reports its results of operations and financial position in its relevant foreign currency, which is then translated into U.S. dollars. This translated financial information is included in our consolidated financial statements. The strengthening of the U.S. dollar in comparison to the foreign currencies of our subsidiaries could have a negative impact on our results and financial position.
Acquisitions may have an impact on our results.
We have made and continue to pursue acquisitions. We cannot guarantee that these acquisitions will have a positive impact on our results. These acquisitions could negatively impact our profitability due to operating and integration inefficiencies, the incurrence of debt, contingent liabilities, and amortization expenses related to intangible assets. There are also a number of other risks involved in acquisitions. We could lose key existing Customers, have difficulties in assimilating the acquired operations, assume unanticipated legal liabilities, or lose key employees.
Compliance with environmental and product laws and regulations can be costly.
We are subject to many environmental laws and regulations in the jurisdictions in which we operate. We routinely incur costs in order to comply with these laws and regulations. We may be adversely impacted by new or changing laws and regulations that affect both our operations and our ability to develop and sell products that meet our Customers’ requirements.
Item 1B. Unresolved Staff Comments
None.
The Company’s principal administrative office and research facilities are located in Bloomington, Minnesota, a suburb of Minneapolis, Minnesota. The principal European administrative and engineering offices are located in Leuven, Belgium. The Company also has extensive operations in the Asia-Pacific region.
The Company’s principal plantmanufacturing and distribution activities are carried out inlocated throughout the United States and internationally. Followingworld. The following is a summary of the principal plants and other materially important physical properties owned or leased by the Company.
|
| |
Americas | Europe / Middle East / Africa | |
Auburn, Alabama (E) | Kadan, Czech Republic (I) | |
Riverbank, California (I)* | Klasterec, Czech Republic | |
Valencia, California (E)* | Domjean, France (E) | |
Dixon, Illinois | Paris, France (E)* | |
Frankfort, Indiana | Dulmen, Germany (E) | |
Cresco, Iowa | Flensburg, Germany (I) | |
Grinnell, Iowa (E) | Haan, Germany (I) | |
Nicholasville, Kentucky | Ostiglia, Italy | |
Bloomington, Minnesota |
| |
Chillicothe, Missouri (E) | Johannesburg, South Africa* | |
Chesterfield, Missouri (E)* | Hull, United Kingdom | |
| Philadelphia, Pennsylvania (I) | Leicester, United Kingdom (I) |
|
| |
Greeneville, Tennessee |
|
|
Baldwin, Wisconsin | Australia | |
Stevens Point, Wisconsin | Wyong, Australia | |
Sao Paulo, Brazil (E)* |
|
|
| Asia | |
Aguascalientes, Mexico |
| |
| Hong Kong, China* | |
Monterrey, Mexico (I) | Wuxi, China | |
|
| New Delhi, India |
| Joint Venture Facilities | Gunma, Japan |
Champaign, Illinois (E) | Rayong, Thailand (I) | |
Jakarta, Indonesia |
| |
Dammam, Saudi Arabia (I) | Third-Party Logistics Providers | |
|
| |
Distribution Centers | Wuxi, China | |
Wyong, Australia | Mumbai, India | |
Brugge, Belgium | Plainfield, Indiana (I) | |
|
| |
Rensselaer, Indiana | Gunma, Japan | |
Ostiglia, Italy |
| |
Aguascalientes, Mexico | Greeneville, Tennessee (I) | |
Johannesburg, South Africa |
|
|
The Company’s properties are utilized for both the Engine and Industrial Products segments except as indicated with an (E) for Engine or (I) for Industrial. The Company leases certain of its facilities, primarily under long-term leases. The facilities denoted with an asterisk (*) are leased facilities. In Wuxi, China and Bloomington, Minnesota a portion of the operationsactivities are conducted in leased facilities. The Company uses third-party logistics providers for some of its product distribution and neither leases nor owns the facilities. The Company considers its properties to be suitable for their present purposes, well-maintained, and in good operating condition.
In accordance with SFAS No. 5, “Accounting for Contingencies,” (SFAS No. 5), theThe Company records provisions with respect to identified claims or lawsuits when it is probable that a liability has been incurred and the amount of the loss can be reasonably estimated. Claims and lawsuits are reviewed quarterly and provisions are taken or adjusted to reflect the status of a particular matter. The Company believes the recorded reserves in its consolidated financial statements are adequate in light of the probable and estimable outcomes. Any recorded liabilities were not material to the Company’s financial position, results of operation andor liquidity, and the Company does not believe that any of the currently identified claims or litigation will materially affect its financial position, results of operation or liquidity.
The Company has reached a preliminary agreement to settle the class action lawsuits that were previously disclosed in its SEC filings, including most recently the Form 10-Q for the quarter ending April 30, 2011. On March 31, 2008, S&E Quick Lube, a filter distributor, filed a lawsuit alleging that 12 filter manufacturers, including the Company, engaged in a conspiracy to fix prices, rig bids, and allocate U.S. Customers for aftermarket automotive filters. The U.S. cases have been consolidated into a single multi-district litigation in the Northern District of Illinois. The Company denies any liability and has vigorously defended the claims raised in these lawsuits. The settlement will fully resolve all claims brought against the Company in the lawsuits and the Company does not admit any liability or wrongdoing. The settlement is still subject to Court approval and will not have a material impact on the Company’s financial position, results of operations or liquidity.
The Company has reached a preliminary agreement with the Air Resources Board for the State of California (“ARB”) to settle regulatory claims brought by ARB in connection with the sales of our Diesel Multi-Stage Filter System (“DMF”) for an immaterial amount. On May 19, 2010, ARB revoked its verification of the Company’s DMF for use with on-road diesel engines, for which verification was originally issued on December 16, 2005. The Company denies that any sales were made in California without ARB verification. The Company is not currently selling any DMF product and is working with the Environmental Protection Agency to verify the product for any future sales.
Item 4. Submission of Matters to a Vote of Security Holders(Removed and Reserved)
No matters were submitted to a vote of security holders of the Company during the quarter ended July 31, 2009.
Executive Officers of the Registrant
Current information regarding executive officers is presented below. All terms of office are for one year. There are no arrangements or understandings between individual officers and any other person pursuant to which the officer was selected as an executive officer.
|
|
|
|
|
|
|
|
|
|
|
|
| ||
Name |
|
| Age |
| Positions and Offices Held |
| First Year Elected or |
| Age |
| Positions and Offices Held |
| First Fiscal Year | |
Tod E. Carpenter | Tod E. Carpenter |
| 50 |
| Vice President, Europe and Middle East |
| 2008 | Tod E. Carpenter |
| 52 |
| Vice President, Europe and Middle East |
| 2008 |
|
|
|
|
|
|
|
|
|
|
| ||||
William M. Cook | William M. Cook |
| 56 |
| Chairman, President and Chief Executive Officer |
| 1994 | William M. Cook |
| 58 |
| Chairman, President and Chief Executive Officer |
| 1994 |
|
|
|
|
|
|
|
|
|
|
| ||||
Sandra N. Joppa | Sandra N. Joppa |
| 44 |
| Vice President, Human Resources |
| 2005 | Sandra N. Joppa |
| 46 |
| Vice President, Human Resources |
| 2005 |
|
|
|
|
|
|
|
|
|
|
| ||||
Norman C. Linnell | Norman C. Linnell |
| 50 |
| Vice President, General Counsel and Secretary |
| 1996 | Norman C. Linnell |
| 52 |
| Vice President, General Counsel and Secretary |
| 1996 |
|
|
|
|
|
|
|
|
|
|
| ||||
Charles J. McMurray | Charles J. McMurray |
| 55 |
| Senior Vice President, Industrial Products |
| 2003 | Charles J. McMurray |
| 57 |
| Senior Vice President, Industrial Products |
| 2003 |
|
|
|
|
|
|
|
|
|
|
| ||||
Mary Lynne Perushek | Mary Lynne Perushek |
| 51 |
| Vice President and Chief Information Officer |
| 2006 | Mary Lynne Perushek |
| 53 |
| Vice President and Chief Information Officer |
| 2006 |
|
|
|
|
|
|
|
|
|
|
| ||||
Lowell F. Schwab |
| 61 |
| Senior Vice President, Global Operations |
| 1994 | ||||||||
|
|
|
|
| ||||||||||
David W. Timm | David W. Timm |
| 56 |
| Vice President, Asia-Pacific |
| 2007 | David W. Timm |
| 58 |
| Vice President, Asia-Pacific |
| 2007 |
|
|
|
|
|
|
|
|
|
|
| ||||
Thomas R. VerHage | Thomas R. VerHage |
| 56 |
| Vice President and Chief Financial Officer |
| 2004 | Thomas R. VerHage |
| 58 |
| Vice President and Chief Financial Officer |
| 2004 |
|
|
|
|
|
|
|
|
|
|
| ||||
Jay L. Ward | Jay L. Ward |
| 45 |
| Senior Vice President, Engine Products |
| 2006 | Jay L. Ward |
| 47 |
| Senior Vice President, Engine Products |
| 2006 |
|
|
|
|
|
|
|
|
|
|
| ||||
Debra L. Wilfong | Debra L. Wilfong |
| 54 |
| Vice President and Chief Technology Officer |
| 2007 | Debra L. Wilfong |
| 56 |
| Vice President and Chief Technology Officer |
| 2007 |
|
|
|
|
|
| |||||||||
Mr. Carpenter joined the Company in 1996 and has held various positions, including Gas Turbine Systems General Manager from 2002 to 2004; General Manager, Industrial Filtration Systems (IFS)(“IFS’) Sales from 2004 to 2006; General Manager, IFS Americas in 2006; and Vice President, Global IFS from 2006 to 2008. Mr. Carpenter was appointed Vice President, Europe and Middle East in August 2008. Mr. Carpenter has been appointed Senior Vice President, Engine Products, effective October 1, 2011.
Mr. Cook joined the Company in 1980 and has held various positions, including CFO and Senior Vice President, International from 2001 to 2004 and President and CEO from 2004 to 2005. Mr. Cook was appointed Chairman, President and CEO in July 2005.
Ms. Joppa was appointed Vice President, Human Resources and Communications in November 2005. Prior to that time, Ms. Joppa held various positions at General Mills, a consumer food products company, from 1989 to 2005, including service as Director of Human Resources for several different operating divisions from 1999 to 2005.
Mr. Linnell joined the Company in 1996 as General Counsel and Secretary and was appointed Vice President, General Counsel and Secretary in 2000.
Mr. McMurray joined the Company in 1980 and has held various positions, including Director, Global Information Technology from 2001 to 2003; Vice President, Human Resources from 2004 to 2005; and Vice President, Information Technology, Europe, South Africa, and Mexico from 2005 to 2006. Mr. McMurray became Senior Vice President, Industrial Products in September 2006. Mr. McMurray has been appointed Senior Vice President and Chief Administrative Officer, effective October 1, 2011.
Ms. Perushek was appointed Vice President and Chief Information Officer in November 2006. Prior to that time, Ms. Perushek was Vice President of Global Information Technology at H.B. Fuller Company, a worldwide manufacturer of adhesive products, from 2005 to 2006 and Chief Information Officer for Young America Corporation, a marketing company, from 1999 to 2004.
Mr. Schwab joined the Company in 1977 and has held various positions, including Senior Vice President, Operations from 1994 to 2004 and Senior Vice President, Engine Products from 2004 to 2008. Mr. Schwab was appointed Senior Vice President, Global Operations, in August 2008.
Mr. Timm joined the Company in 1983 and has held various positions, including General Manager, Disk Drive from 1995 to 2005 and General Manager, Gas Turbine Systems Products from 2005 to 2006. Mr. Timm was appointed Vice President, Asia-Pacific in December 2006.
Table The Company has announced that Mr. Timm will retire from the Company at the end of Contents2011, with his replacement to be announced at a later date.
Mr. VerHage was appointed Vice President and Chief Financial Officer in March 2004. Prior to that time, Mr. VerHage was a partner for Deloitte & Touche, LLP, an international accounting firm, from 2002 to 2004. The Company has announced that Mr. VerHage is leaving the Company on October 31, 2011 and that James F. Shaw, age 42, currently Controller and Principal Accounting Officer for the Company, has been appointed Vice President and Chief Financial Officer, effective November 1, 2011.
Mr. Ward joined the Company in 1998 and has held various positions, including Director, Operations from 2001 to 2003; Director, Product and Business Development, IFS Group from 2003 to 2004; Managing Director, Europe from 2004 to 2006; and Vice President, Europe, and Middle East from 2006 to 2008. Mr. Ward was appointed Senior Vice President, Engine Products in August 2008. Mr. Ward has been appointed Senior Vice President, Industrial Products, effective October 1, 2011.
Ms. Wilfong was appointed Vice President and Chief Technology Officer in May 2007. Prior to that time, Ms. Wilfong held various director positions in researchwas Director, Research and developmentDevelopment at 3M Company, an international consumer products company, from 2000 to 2007, most recently as Director, Research and Development for the 3M Automotive Division from 2006 to 2007.
Item 5. Market for Registrant’s Common Equity, Related Stockholder Matters and Issuer Purchases of Equity Securities
The common shares of the Company are traded on the New York Stock Exchange under the symbol DCI. The amount and frequency of all cash dividends declared on the Company’s common stock for Fiscal 20092011 and 20082010 appear in Note NP of the Notes to Consolidated Financial Statements on page 55.54. The Company’s dividend payout ratio target is 20 percent to 30 percent of the average earnings per share of the last three years. This guidance is expected to be used for future dividend payouts. As of September 23, 2009,22, 2011, there were 2,1091,950 shareholders of record of common stock.
The low and high sales prices for the Company’s common stock for each full quarterly period during Fiscal 20092011 and 20082010 were as follows:
|
|
|
|
|
|
|
|
|
|
| First Quarter |
| Second Quarter |
| Third Quarter |
| Fourth Quarter |
Fiscal |
| $ |
| $ |
| $ |
| $ |
Fiscal |
| $ |
| $ |
| $ |
| $ |
The following table sets forth information in connection with purchases made by, or on behalf of, the Company or any affiliated purchaser of the Company, of shares of the Company’s common stock during the quarterly period ended July 31, 2009.2011.
|
|
|
|
|
|
|
|
|
|
|
|
|
|
|
Period |
| Total Number of |
| Average Price |
| Total Number of |
| Maximum Number |
| |||||
May 1-May 31, 2009 |
|
| — |
|
| — |
|
| — |
|
| 930,210 |
| |
June 1-June 30, 2009 |
|
| 18,972 |
| $ | 36.12 |
|
| — |
|
| 930,210 |
| |
July 1-July 31, 2009 |
|
| — |
|
| — |
|
| — |
|
| 930,210 |
| |
Total |
|
| 18,972 |
| $ | 36.12 |
|
| — |
|
| 930,210 |
| |
|
|
|
|
|
|
|
|
|
|
|
|
|
|
Period |
| Total Number of |
| Average Price |
| Total Number of |
| Maximum Number |
| ||||
May 1 - May 31, 2011 |
|
| — |
| $ | — |
|
| — |
|
| 6,187,240 |
|
June 1 - June 30, 2011 |
|
| 900,000 |
| $ | 56.35 |
|
| 900,000 |
|
| 5,287,240 |
|
July 1 - July 31, 2011 |
|
| 291,558 |
| $ | 59.23 |
|
| 256,648 |
|
| 5,030,592 |
|
Total |
|
| 1,191,558 |
| $ | 57.06 |
|
| 1,156,648 |
|
| 5,030,592 |
|
The Company initiated the purchase of an additional 162,900 shares for $9.2 million in July 2011 that are not included in Fiscal 2011 repurchases as the transactions did not settle until after fiscal year end. These repurchases will be included in Fiscal 2012 activity.
|
|
|
| ||
(1) | On March |
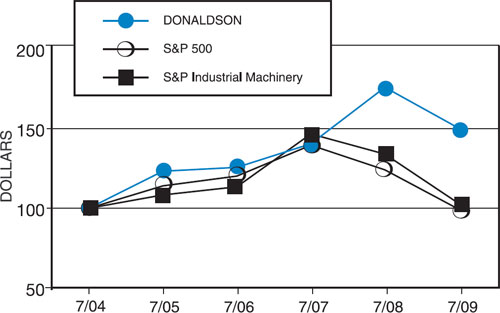
The graph below compares the cumulative total stockholder return on the Company’s Common Stockcommon stock for the last five fiscal years with the cumulative total return of the Standard & Poor’s 500 Stock Index and the Standard & Poor’s Index of Industrial Machinery Companies.Index. The graph and table assume the investment of $100 in each of the Company’s Common Stockcommon stock and the specified indexes at the beginning of the applicable period, and assume the reinvestment of all dividends.
COMPARISON OF 5 YEAR CUMULATIVE TOTAL RETURN
Among Donaldson Company, Inc., Thethe S&P 500 IndexAnd Theand the S&P Industrial Machinery Index
|
|
|
|
|
|
|
|
|
|
|
|
|
|
|
|
|
|
|
|
|
|
|
|
|
|
|
|
|
|
|
|
|
|
|
|
|
|
|
|
| Year ended July 31, |
|
| Year Ended July 31, |
| ||||||||||||||||||||||||||||||||
|
| 2009 |
| 2008 |
| 2007 |
| 2006 |
| 2005 |
| 2004 |
|
| 2011 |
| 2010 |
| 2009 |
| 2008 |
| 2007 |
| 2006 |
| ||||||||||||
Donaldson Company, Inc. |
| $ | 150.18 |
| $ | 175.88 |
| $ | 140.46 |
| $ | 125.67 |
| $ | 123.27 |
| $ | 100.00 |
|
| $ | 177.91 |
| $ | 150.95 |
| $ | 119.50 |
| $ | 139.95 |
| $ | 111.77 |
| $ | 100.00 |
|
S&P 500 |
| 99.33 |
| 124.10 |
| 139.58 |
| 120.19 |
| 114.05 |
| 100.00 |
|
| 112.56 |
| 94.07 |
| 82.64 |
| 103.25 |
| 116.13 |
| 100.00 |
| ||||||||||||
S&P Industrial Machinery |
| 102.93 |
| 133.98 |
| 146.65 |
| 113.48 |
| 108.37 |
| 100.00 |
|
| 143.55 |
| 119.05 |
| 90.70 |
| 118.06 |
| 129.23 |
| 100.00 |
| ||||||||||||
Item 6. Selected Financial Data
The following table sets fourthforth selected financial data for each of the fiscal years in the five-year period ended July 31, 20092011 (in millions, except per share data):
|
|
|
|
|
|
|
|
|
|
|
|
|
|
|
|
|
|
|
|
|
|
|
|
|
|
|
|
|
|
|
|
|
|
| Year ended July 31, |
|
| Year Ended July 31, |
| ||||||||||||||||||||||||||
|
| 2009 |
| 2008 |
| 2007 |
| 2006 |
| 2005 |
|
| 2011 |
| 2010 |
| 2009 |
| 2008 |
| 2007 |
| ||||||||||
Net sales |
| $ | 1,868.6 |
| $ | 2,232.5 |
| $ | 1,918.8 |
| $ | 1,694.3 |
| $ | 1,595.7 |
|
| $ | 2,294.0 |
| $ | 1,877.1 |
| $ | 1,868.6 |
| $ | 2,232.5 |
| $ | 1,918.8 |
|
Income from continuing operations |
| 131.9 |
| 172.0 |
| 150.7 |
| 132.3 |
| 110.6 |
|
| 225.3 |
| 166.2 |
| 131.9 |
| 172.0 |
| 150.7 |
| ||||||||||
Diluted earnings per share |
| 1.67 |
| 2.12 |
| 1.83 |
| 1.55 |
| 1.27 |
|
| 2.87 |
| 2.10 |
| 1.67 |
| 2.12 |
| 1.83 |
| ||||||||||
Total assets |
| 1,334.0 |
| 1,548.6 |
| 1,319.0 |
| 1,124.1 |
| 1,111.8 |
|
| 1,726.1 |
| 1,499.5 |
| 1,334.0 |
| 1,548.6 |
| 1,319.0 |
| ||||||||||
Long-term obligations |
| 253.7 |
| 176.5 |
| 129.0 |
| 100.5 |
| 103.3 |
|
| 205.7 |
| 256.2 |
| 253.7 |
| 176.5 |
| 129.0 |
| ||||||||||
Cash dividends declared per share |
| 0.460 |
| 0.430 |
| 0.370 |
| 0.410 |
| 0.180 |
|
| 0.560 |
| 0.480 |
| 0.460 |
| 0.430 |
| 0.370 |
| ||||||||||
Cash dividends paid per share |
| 0.455 |
| 0.420 |
| 0.360 |
| 0.320 |
| 0.235 |
|
| 0.535 |
| 0.470 |
| 0.455 |
| 0.420 |
| 0.360 |
| ||||||||||
Item 7. Management’s Discussion and Analysis of Financial Condition and Results of Operation
Results of Operation
The following discussion of the Company’s financial condition and results of operations should be read in conjunction with the Consolidated Financial Statements and Notes thereto and other financial information included elsewhere in this report.
Overview
The Company manufactures and distributesis a worldwide manufacturer of filtration systems and replacement parts. The Company’s core strengths are leading filtration technology, strong Customer relationships, and its global presence. The Company operates through two reporting segments, Engine Products and Industrial Products, and has a product mix including air and liquid filtersfiltration systems and exhaust and emission control products. As a worldwide business, the Company’s results of operations are affected by conditions in the global economic environment. Under normal economic conditions, the Company’s diversitymarket diversification between its original equipmentOEM and replacement parts Customers, its diesel engine and industrial end markets, and its North American and international end markets has helped to limit the impact of weakness in any one product line, market or geography on the consolidated results of the Company. However, the global recession had a dramatic negative impact on the Company’s results in Fiscal 2009 as nearly every product group and geographic area was impacted.
The Company reported record sales in Fiscal 20092011 of $1,868.6$2,294.0 million, down 16.3up 22.2 percent from $2,233.5$1,877.1 million in the prior year. The Company’s results were negativelypositively impacted by foreign currency translation. The impact of foreign currency translation, decreasedwhich increased sales by $76.8$49.8 million. Excluding the current year impact of foreign currency translation, worldwide sales decreased 12.9 percent during the year.increased 19.6 percent.
Although net sales excluding foreign currency translation is not a measure of financial performance under GAAP, the Company believes it is useful in understanding its financial results and provides a comparable measure for understanding the operating results of the Company between different fiscal periods excluding the impact of foreign currency translation. The following is a reconciliation to the most comparable GAAP financial measure of this non-GAAP financial measure (in millions):
|
|
|
|
|
|
|
| |||||||
|
|
|
|
|
|
|
|
| Year Ended July 31, |
| ||||
|
| July 31, |
| July 31, |
|
| 2011 |
| 2010 |
| ||||
Net sales, excluding foreign currency translation |
| $ | 1,945.4 |
| $ | 2,110.0 |
|
| $ | 2,244.2 |
| $ | 1,833.9 |
|
Foreign currency translation impact |
|
| (76.8 | ) |
| 122.5 |
|
| 49.8 |
|
| 43.2 |
| |
Net sales |
| $ | 1,868.6 | $ | 2,232.5 |
| $ | 2,294.0 |
| $ | 1,877.1 |
| ||
Although not as large asThe Company also reported record net earnings in Fiscal 2011 of $225.3 million, an increase of 35.6 percent from $166.2 million in the impact on net sales, theprior year. The Company’s net earnings were also negativelypositively impacted by foreign currency translation. The impact of foreign currency translation, during the year decreasedwhich increased net earnings by $3.8$6.1 million. Excluding the current year impact of foreign currency translation, net earnings decreased 21.1increased 31.9 percent.
Although net earnings excluding foreign currency translation is not a measure of financial performance under GAAP, the Company believes it is useful in understanding its financial results and provides a comparable measure for understanding the operating results of the Company between different fiscal periods excluding the impact of foreign currency translation. The following is a reconciliation to the most comparable GAAP financial measure of this non-GAAP financial measure (in millions):
|
|
|
|
|
|
|
| |||||||
|
|
|
|
|
|
|
|
| Year Ended July 31, |
| ||||
|
| July 31, |
| July 31, |
|
| 2011 |
| 2010 |
| ||||
Net earnings, excluding foreign currency translation |
| $ | 135.7 |
| $ | 159.1 |
|
| $ | 219.2 |
| $ | 162.6 |
|
Foreign currency translation impact, net of tax |
|
| (3.8 | ) |
| 12.9 |
|
| 6.1 |
|
| 3.6 |
| |
Net earnings |
| $ | 131.9 | $ | 172.0 |
| $ | 225.3 |
| $ | 166.2 |
| ||
The Company reported diluted earnings per share of $1.67,$2.87, a 21.236.7 percent decreaseincrease from $2.12$2.10 in the prior year.
Included inAs discussed above, the results are pre-tax restructuring chargesCompany recorded full year records for net sales and net earnings. In addition, operating margin was a record of $17.8 million resulting primarily from workforce reductions of 2,800 since the beginning of13.7 percent for the year. Gross marginThe Company’s manufacturing plants and distribution centers executed very well and continued to make both capital and operating expenses include $10.1 millioninvestments which, along with the Company’s Continuous Improvement initiatives, resulted in a record year and $7.7 million of restructuring expenses, respectively. Theputs the Company also realized $43.0 million in cost savings from restructuring actions completed throughout the year.
The effective tax rate for Fiscal 2009 was 18.3 percent compareda position to 27.2 percent in Fiscal 2008. This decrease is attributable to a number of discrete tax items, partiallyprofitably support its Customers’ global growth plans. These improvements were slightly offset by increased expense from the repatriation of foreign earnings. Absent these items, the underlying tax rate for the Fiscal 2009 has decreased
from Fiscal 2008 by 1.2 points to 30.4 percent. The reinstatement of the U.S. Researchincreases in purchased raw material and Experimentation credit, changes in current year unrecognized tax benefits, reduced statutory tax rates and the mix of earnings between foreign jurisdictions all contributed to the reduction in the underlying rate.
The Company continued to improve an already strong liquidity position which allowed for continued investment in business and debt reduction while increasing cash reserves and maintaining its dividend. While Fiscal 2009 was significantly impacted by the global recession, there are signs that some of the Company’s end markets have begun to stabilize. While the Company’s future visibility remains limited and it’s too early to call a recovery, the Company believes that the worst of the global economic downturn is behind it in many of its early and mid-cycle end markets, including the heavy truck, construction, special applications and replacement parts markets. This view is factored into the Fiscal 2010 outlook discussed below.freight costs.
Following is financial information for the Company’s Engine and Industrial Products segments. Corporate and Unallocated includes corporate expenses determined to be non-allocable to the segments and interest income and expense. See further discussion of segment information in Note JK of the Company’s Notes to Consolidated Financial Statements.
|
|
|
|
|
|
|
|
|
|
|
|
|
|
|
|
|
|
|
|
|
|
|
|
|
|
|
|
| Engine |
| Industrial |
| Corporate & |
| Total |
|
| Engine |
| Industrial |
| Corporate & |
| Total |
| ||||||||
|
| (thousands of dollars) |
| |||||||||||||||||||||||
2011 |
|
|
|
|
|
|
|
|
| |||||||||||||||||
Net sales |
| $ | 1,440,495 |
| $ | 853,534 |
| $ | — |
| $ | 2,294,029 |
| |||||||||||||
Earnings before income taxes |
| 211,255 |
| 123,871 |
| (22,863 | ) |
| 312,263 |
| ||||||||||||||||
|
|
|
|
|
|
|
|
|
| |||||||||||||||||
2010 |
|
|
|
|
|
|
|
|
| |||||||||||||||||
Net sales |
| $ | 1,126,007 |
| $ | 751,057 |
| $ | — |
| $ | 1,877,064 |
| |||||||||||||
Earnings before income taxes |
| 155,833 |
| 91,084 |
| (16,741 | ) |
| 230,176 |
| ||||||||||||||||
|
| (thousands of dollars) |
|
|
|
|
|
|
|
|
|
| ||||||||||||||
2009 |
|
|
|
|
|
|
|
|
|
|
|
|
|
|
|
|
|
| ||||||||
Net sales |
| $ | 1,001,961 |
| $ | 866,668 |
| $ | — |
| $ | 1,868,629 |
|
| $ | 1,027,685 |
| $ | 840,944 |
| $ | — |
| $ | 1,868,629 |
|
Earnings before income taxes |
| 83,797 |
| 89,526 |
| (11,898 | ) |
| 161,425 |
|
| 85,896 |
| 87,427 |
| (11,898 | ) |
| 161,425 |
| ||||||
|
|
|
|
|
|
|
|
|
| |||||||||||||||||
2008 |
|
|
|
|
|
|
|
|
| |||||||||||||||||
Net sales |
| $ | 1,229,171 |
| $ | 1,003,350 |
| $ | — |
| $ | 2,232,521 |
| |||||||||||||
Earnings before income taxes |
| 158,931 |
| 102,420 |
| (25,188 | ) |
| 236,163 |
| ||||||||||||||||
|
|
|
|
|
|
|
|
|
| |||||||||||||||||
2007 |
|
|
|
|
|
|
|
|
| |||||||||||||||||
Net sales |
| $ | 1,084,262 |
| $ | 834,566 |
| $ | — |
| $ | 1,918,828 |
| |||||||||||||
Earnings before income taxes |
| 140,762 |
| 80,321 |
| (16,222 | ) |
| 204,861 |
| ||||||||||||||||
During FiscalFor the twelve months ended July 31, 2010 and 2009, net sales reflect the Company’sreclassification of $31,636 and $25,724, respectively, earnings before income taxes reflect a reclassification of $5,360 and $2,099, respectively, as a result of an internal reorganization of Industrial Hydraulics from Industrial Products to Engine Products, segment net sales decreased as a percent of total net sales to 53.6 percent compared to 55.1 percent in the prior year. For the Company’s Industrial Products segment, net sales as a percent of total net sales increased to 46.4 percent from 44.9 percent in the prior year.which became effective August 1, 2010.
Factors within the Company’s reporting segments thatMany factors contributed to the Company’s results for Fiscal 2009 included a significant impact fromeach of the Company’s distributorsreporting segments for Fiscal 2011, including an improvement in global economic conditions, the Company’s program of Continuous Improvement initiatives, new product introductions, emerging market growth, and OEM customers aggressively working down their inventory levels.the expansion of the Company’s distribution capabilities.
In the Engine Products segment, the Company experienced weak business conditionsincreased sales in most end marketsall end-markets and regions. Spending inregions with the construction and mining end-markets in the United States, Europe and Asia was down, resulting in a decrease in off-road equipment related sales. This decrease was partially offset by an increase inexception of Aerospace and Defense salesProducts. The earnings improvement for the current fiscal year was primarily driven by better absorption of fixed costs due to improved volumes at our manufacturing plants, and the benefit of the acquisition of Western Filter Corporation in October 2008. On-roadContinuous Improvement initiatives. The Aftermarket Products sales decreased in the United States, Europe and Asia due to a drop in demand for new trucks, which lowered new truck build rates. Aftermarket sales also decreased due to decreasesincreases were driven by continued improvement in equipment utilization in most off-road end markets and decreased freight activity which impacted on-road markets, partially offset by increases in retrofit emissions salesrates in the United States. In the Industrial Products segment,mining, construction, and transportation industries globally. The Off-Road Product sales increase is driven by higher demand for agriculture and mining equipment, due to continued strong commodity prices and improved sales of heavy construction equipment, which was also weakdue to increased global infrastructure spending, especially in all markets across all regions. Demand for Industrial Filtration Solutions Products was down as a result of the decline in general industrial activity. Also contributing to the decrease in Industrial Filtration Solutionsdeveloping economies. On-Road Products sales was the sale of the air dryer business in Maryville, Tennessee, in October 2008, partially offset by the benefit from the acquisition of LMC West, Inc. in February of 2008. Worldwide sales in Gas Turbine Products weakened late in the yearimproved as North America and full year sales were slightly lower as compared to the prior year. Gas Turbine Products sales are typically large systems and, as a result, the Company’s shipments and revenues fluctuate from quarter to quarter. Sales of Special Applications Products were weak due to decreased demand for semiconductor fabrications and industrial uses for PTFE membranes and a sudden contraction of the disk drive market that resulted in decreased demand for the Company’s hard disk drive filters.Europe heavy truck build rates continued rebounding.
In the Industrial Products segment, where many product lines are later economic cycle businesses, sales increased due to improving global economies leading to greater Customer demand. In Industrial Filtration Solutions Products, sales of new dust collection equipment and replacement filters continued to grow. Gas Turbine Products sales remained slow due to static Customer demand for large gas turbine power generation projects as a result of unchanged global power generation requirements. The increase in sales in Special Applications Products is due to strong sales in certain product lines serving the membrane, semiconductor, imaging, and venting end markets.
Following are net sales by product within both the Engine and Industrial Products segments:
|
|
|
|
|
|
|
|
|
|
|
|
|
|
|
|
|
|
|
|
|
|
| 2009 |
| 2008 |
| 2007 |
|
| 2011 |
| 2010 |
| 2009 |
| ||||||
|
| (thousands of dollars) |
|
| (thousands of dollars) |
| ||||||||||||||
Engine Products segment: |
|
|
|
|
|
|
|
|
|
|
|
|
|
| ||||||
Off-Road Products* |
| $ | 362,785 |
| $ | 448,681 |
| $ | 352,065 |
| ||||||||||
Off-Road Products |
| $ | 327,557 |
| $ | 222,329 |
| $ | 243,691 |
| ||||||||||
Aerospace and Defense Products |
| 104,883 |
| 111,977 |
| 119,094 |
| |||||||||||||
On-Road Products |
| 71,958 |
| 123,146 |
| 166,370 |
|
| 127,107 |
| 81,874 |
| 71,958 |
| ||||||
Aftermarket Products** |
|
| 567,218 |
|
| 657,344 |
|
| 565,827 |
| ||||||||||
Aftermarket Products* |
| 861,393 |
| 691,899 |
| 561,846 |
| |||||||||||||
Retrofit Emissions Products |
|
| 19,555 |
|
| 17,928 |
|
| 31,096 |
| ||||||||||
Total Engine Products segment |
|
| 1,001,961 |
|
| 1,229,171 |
|
| 1,084,262 |
|
|
| 1,440,495 |
|
| 1,126,007 |
|
| 1,027,685 |
|
Industrial Products segment: |
|
|
|
|
|
|
|
|
|
|
|
|
|
| ||||||
Industrial Filtration Solutions Products |
| 503,611 |
| 600,526 |
| 515,022 |
|
| 507,646 |
| 423,050 |
| 477,908 |
| ||||||
Gas Turbine Products |
| 206,760 |
| 213,138 |
| 158,025 |
|
| 154,726 |
| 150,131 |
| 206,760 |
| ||||||
Special Applications Products |
|
| 156,297 |
|
| 189,686 |
|
| 161,519 |
|
|
| 191,162 |
|
| 177,876 |
|
| 156,276 |
|
Total Industrial Products segment |
| 866,668 | 1,003,350 | 834,566 |
|
| 853,534 |
|
| 751,057 |
|
| 840,944 |
| ||||||
| ||||||||||||||||||||
Total Company |
| $ | 1,868,629 | $ | 2,232,521 | $ | 1,918,828 |
| $ | 2,294,029 |
| $ | 1,877,064 |
| $ | 1,868,629 |
| |||
|
|
|
|
| |
| ||
| Includes replacement part sales to the Company’s OEM Customers. | |
Outlook
While it appears that conditions may have stabilized at many of the Company’s Customers andThe Company forecasts continued expansion in many of its end markets, thewith higher growth in emerging economies. The Company continuesforecasts its full year Fiscal 2012 EPS to have limited visibility into the future. Consequently, the Company remains cautious in the near-term about forecasting a return to growth.be between $3.15 and $3.45.
|
|
|
| • | The Company is planning its total Fiscal |
|
|
|
| • | The |
• | The Company’s full year Fiscal 2012 tax rate is projected to be between | |
|
|
|
| • | The Company |
|
|
Engine Products– The Company expectsforecasts full year sales to decrease 3increase 8 to 815 percent, inclusive ofincluding the impact of foreign currency translation.
|
|
|
| • |
|
|
|
|
| • |
|
|
|
|
| • |
|
|
|
|
|
|
|
| networks continue to |
• | The Company forecasts modest sales gains in Aerospace and Defense Products for Fiscal 2012 as the continued slowdown in military spending is anticipated to be offset by increased commercial aerospace sales. |
Industrial Products– - The Company forecasts full year Fiscal 2010FY12 sales to decrease 11increase 7 to 1615 percent, inclusive ofincluding the impact of foreign currency translation.
|
|
|
| • | The Company’s Industrial Filtration Solutions Products’ sales are projected to |
|
|
|
| • | The Company |
|
|
|
| • | Special Applications Products’ sales are projected to |
Fiscal 20092011 Compared to Fiscal 20082010
Engine Products SegmentThe Engine Products segment sells to OEMs in the construction, mining, agriculture, aerospace, defense, and truck markets and to independent distributors, OEM dealer networks, private label accounts, and large equipment fleets. Products include air filtration systems, exhaust and emissions systems, liquid filtration systems, and replacement filters.
Sales for the Engine Products segment were $1,002.0$1,440.5 million, a decreasean increase of 18.527.9 percent from $1,229.2$1,126.0 million in the prior year. International Engine Products sales decreased 24.3 percent and sales in the United States decreased 12.4increased by 25.9 percent in Fiscal 2011 compared to Fiscal 2010. International Engine Products sales increased 29.8 percent from the prior year. The impact of foreign currency decreasedincreased total sales by $38.9$31.5 million, or 3.22.8 percent. Earnings before income taxes as a percentage of Engine Products segment sales of 8.414.7 percent decreasedincreased from 12.913.8 percent in the prior year. The Engine Products segment has been negatively impactedearnings improvement for the current fiscal year was driven by lowerbetter absorption of fixed manufacturing costs due to the drop in salesimproved volumes and increased costs related to restructuring,the Company’s ongoing Continuous Improvement initiatives, partially offset by cost savings as a result of workforce reductions already completed, improved distribution efficiencies asincreased commodity costs compared to the prior year andyear. There were $1.9 million in restructuring expenses for the impact of cost control measures including reductionsEngine Products segment in incentive compensation.the prior year.
Worldwide sales of Off-Road Products were $362.8$327.6 million, an increase of 47.3 percent from $222.3 million in the prior year. Sales in the United States increased 35.8 percent over the prior fiscal year. Internationally, sales of Off-Road Products were up 56.0 percent from the prior year, with sales increasing in Asia and Europe by 58.2 percent and 55.6 percent, respectively. The Company’s overall increase was driven by higher demand for agriculture, construction, and mining equipment due to continued strong commodity prices and improved sales of heavy construction equipment, which was due to increased global infrastructure spending, especially in developing economies. Off-Road Products sales in the U.S. also benefited from market share gains on new platforms that began production during calendar year 2011. These increases were slightly offset by U.S. residential and non-residential construction markets, which showed continued weakness, resulting in lower sales of the Company’s products into those markets.
Worldwide sales of Aerospace and Defense Products were $104.9 million, a 6.3 percent decrease of 19.1 percent from $448.7$112.0 million in the prior year. Sales in the United States decreased 7.2 percent. Global mining activity started declining due to decreased commodity prices in the second quarter of Fiscal 2009, and remained weak throughout the remainder of the year. Spending in U.S. residential and non-residential construction markets was down more than 278.7 percent and 5 percent, respectively, over prior year, resulting in a decrease in the sales of the Company’s products into those markets. Domestic Aerospace and Defense sales benefited from the recent acquisition of Western Filter Corporation, which resulted in $15.4 million of incremental sales over the prior year and continued strong demandas a result of slowdowns in U.S. military activity, which is causing an associated slowdown in government procurement spending for filters for military equipment.major programs. Internationally, sales of Off-RoadAerospace and Defense Products were down 31.3increased 3.0 percent fromover the prior year, withyear. The international sales decreasing in both Europe and Asia by 32.5 percent and 29.5 percent, respectively. Sales in the European construction equipment end market decreasedincreased primarily due to a declinemarket share gains resulting from improving the Company’s Aerospace distribution capabilities in construction activity related to the economic downturn. Sales to the European agricultural end market also decreased. In Asia, sales have declined significantly in Japan in the construction end markets.Europe.
Worldwide sales of On-Road Products were $72.0$127.1 million, a decreasean increase of 41.655.2 percent from $123.1$81.9 million in the prior year. On-Road Products sales in the United States decreased 43.2increased 86.0 percent from the prior year, primarily as a result of a 29 percent decrease inyear. Class 8 truck build rates 40increased 47.8 percent decrease inand medium duty truck build rates by the Company’s Customers and a reduction in high value product mixincreased 37.1 percent over the prior year. International On-Road Products sales decreased 39.6increased 27.4 percent from the prior year, driven by decreasedincreased sales in Europe and Asia of 51.0 percent and 32.5 percent, respectively, reflecting45.6 percent. This increase is consistent with the current economic downturn for freight activity and newincrease in European build rates. The overall sales increase was a result of an increase in Customer truck build rates.rates, higher content per truck, and a slightly higher market share.
Worldwide Engine Aftermarket Products sales of $567.2$861.4 million decreased 13.7increased 24.5 percent from $657.3$691.9 million in the prior year. Sales in the United States decreased 9.5increased 26.3 percent over the prior year, drivenyear. International sales increased 23.1
by inventory adjustments at the Company’s Customers and decreases in utilization rates in the mining, construction and transportation industries, partially offset by increases in retrofit emission sales of $5.2 million. International sales decreased 17.4 percent from the prior year, primarily driven by sales decreasesincreases in Asia, Latin America and Europe and Asia of 26.137.8 percent, 25.7 percent, and 8.013.5 percent, respectively, duerespectively. The sales increases in the U.S. and internationally were attributable to weak economic conditions.improved On-Road and Off-Road equipment utilization rates from a year ago, the Company’s increased distribution and market share growth, and the continued increase in the percentage of equipment in the field that uses the Company’s proprietary filtration systems.
Worldwide sales of Retrofit Emissions Products were $19.6 million, an increase of 9.1 percent from $17.9 million in the prior year. The Company’s Retrofit Emissions Products sales are solely in the United States. Sales of Retrofit Emissions Products increased overall, but challenges still remain in the supply chain for certain components and delays in regulatory approval for certain of the Company’s products have impacted the Company’s sales.
Industrial Products SegmentThe Industrial Products segment sells to various industrial end-users, OEMs of gas-fired turbines, and OEMs and end-users requiring highly purifiedclean air. Products include dust, fume, and mist collectors, compressed air purification systems, liquid filters and parts, air filterfiltration systems for gas turbines, PTFE membrane and laminates,based products, and specialized air filtration systems for applications, including computer hard disk drives.
Sales for the Industrial Products segment were $866.7$853.5 million, a decreasean increase of 13.6 percent from $1,003.4$751.1 million in the prior year. International Industrial Products sales decreased 14.2increased 8.5 percent and sales in the United States decreased 12.3increased 27.2 percent from the prior year. The impact of foreign currency decreasedincreased sales by $37.9$18.3 million, or 3.82.4 percent. Despite the 13.6 percent decrease in sales, earningsEarnings before income taxes as a percentage of Industrial Products segment sales of 10.314.5 percent increased from 10.212.1 percent in the prior year. The improvement in earnings as a percent of sales over the prior year was driven by better execution on large project shipments, cost savings from restructuring actions and the impact of cost control measures including reductions in incentive compensation expense. These were slightly offset by lower absorptionleverage of fixed operating costs and restructuring costs.better plant utilization. Restructuring expenses in Fiscal 2011 were $0.7 million, a decrease from $8.3 million in Fiscal 2010.
Worldwide sales of Industrial Filtration Solutions Products of $503.6$507.6 million decreased 16.1increased 20.0 percent from $600.5$423.1 million in the prior year. Sales in the United States, Europe and Europe decreased 18.3Asia increased 25.3 percent, 12.9 percent, and 21.026.2 percent, respectively. SalesThe increased sales were due to increased manufacturing activity, higher investment in Asiacapital equipment by manufacturers, and the continued strengthening of replacement filter sales due to utilization of existing equipment. North American general industrial activity remained relatively flatstrong as evidenced by a 110 percent increase in machine tool consumption in the United States during Fiscal 2011 as compared to the prior year. The decline in Europe was due to reduced demand for industrial dust collectors and compressed air purification systems which fell with the downturn in general manufacturing activity during the year. Domestic sales decreased from the prior year as a result of this same decline in general industrial activity. The results in the year were also influenced by the sale of the air dryer business in Maryville, Tennessee, on October 31, 2008 and the acquisition of LMC West, Inc. (LMC West) in February of Fiscal 2008. The sale of the air dryer business in Maryville, Tennessee, decreased sales $7.6 million over last year. The acquisition of LMC West contributed to $7.0 million of sales during the twelve months of Fiscal 2009 and $4.7 million during the latter six months of Fiscal 2008.2010.
Worldwide sales of Gas Turbine Products were $206.8$154.7 million, a decreasean increase of 3.03.1 percent from $213.1$150.1 million in the prior year. Gas Turbine Products sales are typically large systems and, as a result, the Company’s shipments and revenues fluctuate from quarterperiod to quarter. Incoming orders declined 58 percent in Fiscal 2009 versus Fiscal 2008, a reflection of the reducedperiod. Sales slightly improved due to additional demand for smaller systems used in the oil and gas industry as a result of higher average oil prices and an increase in Aftermarket sales for replacement filters. These increases were slightly offset by a decline in the sales of air filtration systems for large turbines used for power generation projects globally. This trend is expected to continue in Fiscal 2010.generation.
Worldwide sales of Special Applications Products were $156.3$191.2 million, a 17.67.5 percent decreaseincrease from $189.7$177.9 million in the prior year. Domestic Special Application Products sales decreased 10.0 percent. International sales of Special Application Products decreased 18.7increased 6.1 percent over the prior year. The primary decreases internationally wereyear, primarily in Europe, which increased 47.0 percent. Domestic Special Application Products sales increased 17.1 percent. The global sales increases were driven by strong sales in some of the Company’s product lines serving the membrane, semiconductor, imaging, and Asia, which decreased 25.5 and 17.3 percent, respectively,venting end markets, partially offset by a slight decline in the Company’s disk drive filter sales due to a significant reductionsoft demand in demandthe global end market for hard disk drives. Overall, the decline in disk drive filters, semiconductor filtration systems and PTFE membrane filtration products. The reduction in demandsales is primarily a result of a worldwide contraction in the end markets for computers, data storage devices and other electronic products that began in the second quarter of Fiscal 2009.comparable with published disk drive build rates.
Consolidated ResultsThe Company reported net earnings for Fiscal 20092011 of $131.9$225.3 million compared to $172.0$166.2 million in Fiscal 2008, a decrease2010, an increase of 23.335.6 percent. Diluted net earnings per share was $1.67, down 21.2were $2.87, up 36.7 percent from $2.12$2.10 in the prior year. The Company’s operating income of $170.0$315.3 million decreasedincreased from prior year operating income of $245.8$238.2 million by 30.932.3 percent.
The table below shows the percentage of total operating income contributed by each segment for each of the last three fiscal years. Corporate and Unallocated includes corporate expenses determined to be non-allocable to the segments, and interest income, and interest expense:
|
|
|
|
|
|
|
|
|
|
|
|
|
|
|
|
|
|
| ||
|
| 2009 |
| 2008 |
| 2007 |
|
| 2011 |
| 2010 |
| 2009 |
| ||||||
Engine Products |
| 44.5 | % |
| 61.1 | % |
| 62.9 | % |
|
| 64.1 | % |
| 63.1 | % |
| 45.7 | % | |
Industrial Products |
| 51.8 | % |
| 42.1 | % |
| 37.8 | % |
|
| 38.7 | % |
| 37.8 | % |
| 50.6 | % | |
Corporate and Unallocated |
| 3.7 | % |
| (3.2 | %) |
| (0.7 | %) |
|
|
| (2.8 | )% |
| (0.9 | )% |
| 3.7 | % |
Total Company |
| 100 | % |
| 100 | % |
| 100 | % |
|
|
| 100.0 | % |
| 100.0 | % |
| 100.0 | % |
International operating income, prior to corporate expense allocations, totaled 77.980.2 percent of consolidated operating income in Fiscal 20092011 as compared to 89.480.3 percent in Fiscal 2008.2010. Total international operating income decreased 39.8increased 32.1 percent from the prior year. This decreaseincrease is attributable to restructuring charges internationally exceeding domestic restructuringincreased Customer sales and the leverage of fixed costs weaker foreign currencies and overall weak business conditions abroad.with the higher volume of sales. The table below shows the percentage of total operating income contributed by each major geographic region for each of the last three fiscal years:
|
|
|
|
|
|
|
|
|
|
|
|
|
|
|
|
|
|
| ||
|
| 2009 |
| 2008 |
| 2007 |
|
| 2011 |
| 2010 |
| 2009 |
| ||||||
United States |
| 22.1 | % |
| 10.6 | % |
| 22.3 | % |
|
| 19.8 | % |
| 19.7 | % |
| 22.1 | % | |
Europe |
| 23.3 | % |
| 43.3 | % |
| 34.8 | % |
|
| 31.0 | % |
| 24.6 | % |
| 23.3 | % | |
Asia |
| 43.5 | % |
| 37.9 | % |
| 38.6 | % |
| ||||||||||
Asia - Pacific |
| 39.6 | % |
| 45.3 | % |
| 43.5 | % | |||||||||||
Other |
| 11.1 | % | 8.2 | % |
| 4.3 | % |
|
|
| 9.6 | % |
| 10.4 | % |
| 11.1 | % | |
Total Company |
| 100 | % |
| 100 | % |
| 100 | % |
|
|
| 100.0 | % |
| 100.0 | % |
| 100.0 | % |
Gross margin for Fiscal 20092011 was 31.635.5 percent, a decreasean increase from 32.535.1 percent in the prior year. The Company had $10.1 million in restructuring costs which reducedimproved gross margin was the result of better fixed cost absorption and the Company’s ongoing Continuous Improvement initiatives of approximately $27 million, which were partially offset by increases in the year. In addition, lower absorptionpurchased raw material (steel and petrochemical based raw materials) of fixed costs due to the drop in production volumes,approximately $19 million, net of savings from completed restructuring related activities, negatively impactedselective price increases to Customers. Within gross margin, by approximately $23 million. Partially offsetting these factors were the positive impacts of improved product mix, improved distribution efficiencies and better execution on large project shipments. During Fiscal 2008, the Company began using a new warehouse management system at its main U.S. distribution center. The company encountered start-up problemsincurred minimal restructuring and asset impairment charges during the transitionfiscal year, compared to the new systems which, although now resolved, resulted in $7.6$7.5 million in unanticipatedlast year. The fiscal 2010 charges in Fiscal 2008 that did not recur in Fiscal 2009. The Company also incurred a charge of approximately $5.0 million to pretax incomewere primarily related to a downsizing at a plant in Germany and included severance and asset impairments for the use of the Last-In, First-Out (LIFO) accounting method for its U.S. inventories, which charges increasing commodity costs to income immediately. As commodity costs were relatively flat in Fiscal 2009, the Company did not experience a similar impact from rising commodity prices.building and inventory.
Operating expenses for Fiscal 20092011 were $419.8$498.5 million or 22.521.7 percent of sales, as compared to $480.1$420.5 million or 21.522.4 percent in the prior year. OperatingThe decrease in operating expenses as a percentpercentage of sales is driven by the higher volume of sales and benefits from the Company’s Continuous Improvement initiatives. In addition, the current year included a $1.9 million reduction in restructuring expenses compared to Fiscal 2010. These benefits were partially offset by costs for our strategic operating investments totaling $13.9 million for the fiscal year and higher compensation related expenses such as incentive compensation of $9.2 million and pension expense of $5.1 million over the prior year.
Interest expense of $12.5 million increased due to sales volume declines and $7.7$0.5 million from $12.0 million in restructuring cost during the year, offset by $19.4prior year. Net other income totaled $9.5 million in benefitsFiscal 2011 up from restructuring actions taken and $19.5$3.9 million of lower incentive compensation expense as compared toin the prior year. The Company’s expense reduction programs remain in effect.
Interest expenseincrease of $17.0$5.6 million increased $0.4 million from $16.6 million inover the prior year as a resultis primarily attributable to increased interest income of higher debt levels. Net other$2.0 million, increased earnings from non-consolidated joint ventures of $2.1 million, and increased royalty income totaled $8.5 million in Fiscal 2009 up from $6.9 million in the prior year.of $1.4 million. Components of other income for Fiscal 20092011 were as follows: interest income of $1.6$3.3 million, earnings from non-consolidated joint ventures of $2.3$4.1 million, royalty income of $6.1$8.7 million, partially offset by charitable donations of $0.6$1.1 million, foreign exchange losses of $0.4$4.5 million, and other miscellaneous income and expense items resulting in expenses of $0.5$1.0 million.
The effective tax rate for Fiscal 20092011 was 18.327.9 percent compared to 27.227.8 percent in Fiscal 2008.2010. The decrease in effectiveaverage underlying tax rate isremained at 29.7 percent, while discrete items were also a consistent percentage of pre-tax profits. Fiscal 2010 contained $4.3 million of discrete tax benefits from the expiration of the statute of limitations at foreign subsidiaries. Fiscal 2011 contained $5.8 million of discrete tax benefits primarily due tofrom the settlementsrelease of long-standing court cases and examinationsreserves after the favorable conclusions of foreign tax audits, the expiration of statutes in various jurisdictions, for tax years 2003 through 2006, the reassessment of the corresponding unrecognized tax benefits for the subsequent open years and a favorable resolution of a foreign tax matter. Partially offsetting these effects, the Company’s Fiscal 2009 tax rate was unfavorably impacted by an increased expense from the repatriation of foreign earnings. Absent these items, the underlying tax rate for the Fiscal
2009 has decreased from Fiscal 2008 by 1.2 points to 30.4 percent. The reinstatement of the U.S. Research and Experimentation credit, changes in current year unrecognized tax benefits, reduced statutory tax rates and the mixpositive impact of earnings betweendividends from some foreign jurisdictions all contributed to the reduction in the underlying rate.subsidiaries.
Total backlog at July 31, 2009,2011, was $528.0$816.4 million, down 33.7up 29.9 percent from the same period in the prior year. Backlog is one of many indicators of business conditions in the Company’s markets. However, it is not always indicative of future results for a number of reasons, including short lead times in the Company’s replacement parts businesses and the timing of the receipt of orders in many of the Company’s Engine OEM and Industrial markets. In the Engine Products segment, total open order backlog decreased 31.8increased 36.6 percent from the prior year. In the Industrial Products segment, total open order backlog decreased 36.8increased 14.9 percent from the prior year. Because some of the change in backlog can be attributed to a change in the ordering patterns of the Company’s Customers and/or the impact of foreign exchange translation rates, it may not necessarily correspond to future sales.
Fiscal 20082010 Compared to Fiscal 20072009
Engine Products SegmentThe Engine Products segment sells to OEMs in the construction, mining, agriculture, aerospace, defense, and truck markets and to independent distributors, OEM dealer networks, private label accounts, and large equipment fleets. Products include air filtration systems, exhaust and emissions systems, liquid filtration systems, and replacement filters.
Sales for the Engine Products segment were $1.229 billion,$1,126.0 million, an increase of 13.49.6 percent from $1.084 billion$1,027.7 million in the prior year, reflecting increases in the Off-Road and Aftermarket Products businesses, partially offset by decreased On-Roadyear. Engine Products sales in the NAFTA region.United States remained relatively flat in Fiscal 2010 compared to Fiscal 2009, increasing only 0.5 percent in the current fiscal year. International Engine Products sales increased 19.6 percent from the prior year. The impact of foreign currency increased sales by $60.6$24.9 million, or 5.62.4 percent. Earnings before income taxes as a percentage of Engine Products segment sales of 12.913.8 percent decreasedincreased from 13.08.4 percent in the prior year. The earnings improvement for the current fiscal year was driven by a greater mix of higher-margin Aftermarket sales versus lower-margin first-fit product sales, better absorption of fixed manufacturing costs due to the increase in production volumes and benefits related to completed restructuring efforts and other Continuous Improvement initiatives. In addition, restructuring expenses for the Engine Products segment as a percentwere down $5.3 million over the prior year, but this was more than offset by $6.2 million of sales was down slightly from last year due the impact of distribution inefficiencies and start-up costsincreased warranty expenses related to the implementation of a new warehouse management system at our Rensselaer, Indiana distribution center, offset by stronger global volume across most business units.Retrofit Emissions Products.
Worldwide sales of Off-Road Products were $448.7$222.3 million, an increasea decrease of 27.48.8 percent from $352.1$243.7 million in the prior year. Sales in the United States showed an increase of 27.1decreased 15.0 percent primarily driven by the impact of the acquisition of Aerospace Filtration Systems, Inc. in March of Fiscal 2007 and robust sales in the Company’s defense business due to the combination of replacement parts sales growth, new vehicle programs (including the Mine Resistant Ambush Protected armored vehicles) and retrofit programs$95.1 million for the Abrams Tank and military helicopters including the Black Hawk. In addition, strong sales in agriculture, mining and non-residential construction markets more than offset a decrease in residential construction markets.fiscal year. Internationally, sales of Off-Road Products were up 27.8down 3.4 percent from the prior year, with sales increasingdecreasing in both Europe andby 10.7 percent, which were slightly offset by an increase in Off-Road sales in Asia of 7.4 percent. The Company’s overall decrease was driven by 24.4 percent and 36.3 percent, respectively, reflecting strengtha weakness in the heavyearly portion of the fiscal year with a gradual strengthening in end-markets in the last half of the fiscal year. This was evident in the gradual improvement of sales to OEMs during the last months of the fiscal year. The first half of the year was down primarily due to declines in spending in the residential and non-residential construction marketmarkets. The latter half of the year saw increases in the mining industry as a result of higher commodity prices and increased demand for mining and agricultural equipment internationally.improvements in worldwide construction activity.
Worldwide sales of On-Road Products were $123.1$81.9 million, a decreasean increase of 26.013.8 percent from $166.4$72.0 million in the prior year. On-Road Products sales in the United States decreased 43.3increased 3.4 percent from the prior year, primarily as a result of lower newa slight market share improvement and higher content per truck. The Company performed better than the impact due to the change in truck build rates atfor the Company’s Customers following the implementation of the 2007 Environmental Protection Agency diesel emission regulations.year in Class 8 truck builds, which decreased by 3.7 percent and medium duty truck build rates which increased 0.3 percent. International On-Road Products sales increased 14.925.2 percent from the prior year. On-Road Productsyear, driven by increased sales in Asia of 45.2 percent, as a result of increased truck exports by the Company’s Japanese OEM Customers to higher growth emerging markets, and rebounding sales in Europe benefited from stronger build rates resulting in a sales increaseduring the second half of 28.1 percent.the fiscal year.
Worldwide Engine Aftermarket Products sales of $657.3$691.9 million increased 16.223.1 percent from $565.8$561.8 million in the prior year. Sales in the United States increased 4.614.7 percent over the prior year. International sales increased 28.429.7 percent withfrom the prior year, primarily driven by sales increasingincreases in Asia, Latin America and Europe Asia and Mexico by 25.3of 36.9 percent, 23.528.9 percent, and 77.024.7 percent, respectively. The large percentage increasesales increases in Mexico is partiallythe United States and internationally were driven by rebounds in equipment utilization rates in the mining, construction, and transportation industries. The Company also improved its distribution capabilities to be closer to and better serve its Customers and increased sales due to the Company’s recent market share “wins.”
Worldwide sales of Retrofit Emissions Products were $17.9 million, a decrease of 42.3 percent from $31.1 million in the prior year. The Company’s Retrofit Emissions Products sales are solely in the United States. Sales of Retrofit Emissions Products decreased as a result of transferring some Customer relationships tocontinuing postponements in the availability of government grant money and delays and losses of regulatory approval for certain of the Company’s Mexican subsidiaryproducts, including the DMF product.
Worldwide sales of Aerospace and Defense Products were $112.0 million, a 6.0 percent decrease from $119.1 million in the prior year. Sales in the United States to better serve the Customers. Geographic expansion and high equipment utilization rates contributed to the overall increases. In addition, sales continue to benefit from the increasing amount of equipment in the field with the Company’s PowerCore™ filtration systems. Sales of PowerCore™ replacement filters increased 58.9decreased 9.0 percent over the prior year.
Tableyear as a result of Contentsslowdowns in government procurement for major defense programs. Internationally, sales of Aerospace and Defense Products increased 8.0 percent over the prior year. The international sales increased primarily as a result of the startup of recent defense program wins.
Industrial Products SegmentThe Industrial Products segment sells to various industrial end-users, OEMs of gas-fired turbines, and OEMs and end-users requiring clean air. Products include dust, fume, and mist collectors, compressed air purification systems, air filtration systems for gas turbines, PTFE membrane based products, and specialized air filtration systems for applications including computer hard disk drives.
Sales for the Industrial Products segment were $1,003.4$751.1 million, an increasea decrease of 20.210.7 percent from $834.6$840.9 million in the prior year, resulting from strongeryear. International Industrial Products sales decreased 9.0 percent, and sales in Industrial Filtration Solutions Products, Special Application Products and Gas Turbine Systems Products across all regions.the United States decreased 15.0 percent from the prior year. The impact of foreign currency increased sales by $62.0$17.2 million, or 7.42.0 percent. EarningsDespite the 10.7 percent decrease in sales, earnings before income taxes as a percentage of Industrial Products segment sales of 10.2were 12.1 percent, increasedincreasing from 9.610.4 percent in the prior year. The improvement in earnings as a percent of
sales over the prior year was driven by cost leverage across most business units due to strong global volumes offset slightly lower marginsbetter execution on large project shipments, increased plant utilization, improved product mix, and Continuous Improvement initiatives. Restructuring expenses in Fiscal 2010 were $8.3 million, a few large projectsdecrease from $10.1 million in both our Gas Turbine and Industrial Air Filtration business units.Fiscal 2009.
Worldwide sales of Industrial Filtration Solutions Products of $600.5$423.1 million increased 16.6decreased 11.5 percent from $515.0$478.0 million in the prior year. Sales in the United States, Europe and Asia and South Africa increased 9.9decreased 11.9 percent, 22.0 percent, 16.512.0 percent, and 25.08.0 percent, respectively. U.S.Sales in Mexico decreased 20.9 percent in Fiscal 2010 as compared to Fiscal 2009. Overall, the Company experienced weak sales includedconditions for its Industrial Filtration Solutions Products during the impactbeginning of the acquisitionfiscal year, with conditions improving towards the end of LMC West, Inc. in February of Fiscal 2008. Demand was strong worldwide but specificallythe fiscal year. The decreased sales in Europe whereand Asia were due to reduced demand for industrial dust collectors and compressed air purification systems due to the downturn in general manufacturing investment conditions were favorable throughoutactivity. Domestic sales decreased due to a decline in general industrial activity that did not stabilize until late in the fiscal year.year, as evidenced by a 19 percent drop in machine tool consumption in the United States during fiscal year 2010 as compared to fiscal year 2009.
Worldwide sales of Gas Turbine Products were $213.1$150.1 million, an increasea decrease of 34.927.4 percent from $158.0$206.8 million in the prior year. Growth globally has been strong in both the power generation and oil and gas markets. The Gas Turbine Products sales are typically large systems and, as a result, the Company’s shipments and revenues fluctuate from quarterperiod to quarter.period. Incoming orders declined 9 percent in Fiscal 2010 versus Fiscal 2009, a reflection of the reduced demand for power generation projects globally. Sales remained slow due to a deceleration in Customer demand for large gas turbine power generation projects as a result of the decrease in global electrical power requirements and also as a result of one Customer’s increased utilization of its own internal filtration businesses.
Worldwide sales of Special Applications Products were $189.7$177.9 million, a 17.413.8 percent increase from $161.5$156.3 million in the prior year. SalesDomestic Special Application Products sales increased 5.8 percent, driven by an increase in the United States, Europe, and Asiasales to industrial Customers of PTFE membranes. International sales of Special Application Products increased 8.315.1 percent 25.3 percent, and 17.8 percent, respectively, fromover the prior year, primarily in Asia, which increased 18.6 percent. These international sales increases were driven by improved demand for the Company’s Customers’ hard disk drives as sales ofthe end-markets for computers, data storage devices, and other electronic products rebounded. Overall, the Company’s market growth is comparable with published disk drive filters and PTFE membranes remained strong.build rates.
Consolidated ResultsThe Company reported record net earnings for Fiscal 20082010 of $172.0$166.2 million compared to $150.7$131.9 million in Fiscal 2007,2009, an increase of 14.126.0 percent. Diluted net earnings per share was a record $2.12,were $2.10, up 15.825.7 percent from $1.83$1.67 in the prior year. The Company’s operating income of $245.8$238.2 million increased from prior year operating income of $211.1$170.0 million by 16.440.2 percent.
The table below shows the percentage of total operating income contributed by each segment for each of the last three fiscal years. Corporate and Unallocated includes corporate expenses determined to be non-allocable to the segments, and interest income, and interest expense:
|
|
|
|
|
|
|
|
|
|
|
|
|
|
|
|
|
|
| ||
|
| 2008 |
| 2007 |
| 2006 |
|
| 2010 |
| 2009 |
| 2008 |
| ||||||
Engine Products |
| 61.1 | % |
| 62.9 | % |
| 67.7 | % |
|
| 63.1 | % |
| 45.7 | % |
| 61.1 | % | |
Industrial Products |
| 42.1 | % |
| 37.8 | % |
| 33.6 | % |
|
| 37.8 | % |
| 50.6 | % |
| 42.1 | % | |
Corporate and Unallocated |
| (3.2 | %) |
| (0.7 | %) |
| (1.3 | %) |
|
|
| (0.9 | )% |
| 3.7 | % |
| (3.2 | )% |
Total Company |
| 100 | % |
| 100 | % |
| 100 | % |
|
|
| 100.0 | % |
| 100.0 | % |
| 100.0 | % |
International operating income, prior to corporate expense allocations, totaled 89.480.3 percent of consolidated operating income in Fiscal 20082010 as compared to 77.777.9 percent in Fiscal 2007.2009. Total international operating income increased 34.044.6 percent from the prior year. This increase is attributable to increased Customer sales and stronger foreign currencies, the favorable impact of new plants globally and overall strong business conditions.currencies. The table below shows the percentage of total operating income contributed by each major geographic region for each of the last three fiscal years:
|
|
|
|
|
|
|
|
|
|
|
|
|
|
|
|
|
|
| ||
|
| 2008 |
| 2007 |
| 2006 |
|
| 2010 |
| 2009 |
| 2008 |
| ||||||
United States |
| 10.6 | % |
| 22.3 | % |
| 22.8 | % |
|
| 19.7 | % |
| 22.1 | % |
| 10.6 | % | |
Europe |
| 43.3 | % |
| 34.8 | % |
| 32.7 | % |
|
| 24.6 | % |
| 23.3 | % |
| 43.3 | % | |
Asia |
| 37.9 | % |
| 38.6 | % |
| 37.5 | % |
| ||||||||||
Asia - Pacific |
| 45.3 | % |
| 43.5 | % |
| 37.9 | % | |||||||||||
Other |
| 8.2 | % |
| 4.3 | % |
| 7.0 | % |
|
| 10.4 | % |
| 11.1 | % |
| 8.2 | % | |
Total Company |
| 100 | % |
| 100 | % |
| 100 | % |
|
|
| 100.0 | % |
| 100.0 | % |
| 100.0 | % |
Gross margin for Fiscal 20082010 was 32.535.1 percent, an increase from 31.531.6 percent in the prior year. The primary drivers for the improved gross margin includewas the result of improved fixed cost absorption, a higher production volumes, a favorable product mix cost controlsof replacement filter sales, savings from restructuring actions and productivity improvements. Partially offsettingongoing Continuous Improvement initiatives. Within gross margin, the improvements was a charge of $5.0 million to pretax income related to the use of the Last-In, First-Out (LIFO) accounting method for itsCompany incurred
U.S. inventories, which charges increasing commodity costs to income immediately. Also partially offsetting the improvements$7.5 million in gross margin were higher than expected distribution costs associated with implementing the investments made to increase the Company’s distribution capabilitiesrestructuring and higher purchased commodity costs. During the second quarter, the Company began utilizing a new warehouse management system at its main U.S. distribution center. The Company encountered start-up problemsasset impairment charges during the transitionfiscal year, compared to the new system. There$10.1 million last year. This year’s charges were incremental expensesprimarily related to refining the system which resulteda downsizing at a plant in $7.6 million in unanticipated chargesGermany and included severance and asset impairments for the year. Gross margin inbuilding and inventory.
Operating expenses for Fiscal 2007 was also negatively impacted by a higher mix2010 were $420.5 million or 22.4 percent of systems sales, versus replacement part sales and higher than expected distribution costs in Europe from the integration of new distribution facilities while Customer demand ramped up beyond expectations. Plant rationalization and start-up costs for new facilities were $0.6as compared to $419.8 million in Fiscal 2008, down from $5.3 millionor 22.5 percent in the prior year. Operating expenses for Fiscal 2008 were $480.1 million or 21.5as a percent of sales up from $393.8was relatively flat and included $15.1 million or 20.5 percentof higher incentive compensation expense partially offset by a $5.0 million decrease in restructuring costs as compared to the prior year. This increase was driven byDuring the impactfiscal year the Company increased warranty accruals due to specific warranty matters in our Retrofit Emissions Products group, recording an expense of foreign exchange as well as investments in research and development to support essential product development initiatives and$6.2 million for this matter during the development of next generation technologies and products across many product lines. The Company also increased its investment in information technology to improve Customer support capabilities and enhance its internal system infrastructure capabilities.year.
Interest expense of $16.6$12.0 million increased $2.0decreased $5.0 million from $14.6$17.0 million in the prior year as a result of increased borrowing costs associated withreduced debt levels and lower interest rates throughout the increases in working capital and the Aerospace Filtration Systems, Inc. acquisition in March of 2007.year. Net other income totaled $6.9$3.9 million in Fiscal 2008 compared to $8.32010 down from $8.5 million in the prior year. Components of other income for Fiscal 20082010 were as follows: interest income of $1.5$1.3 million, earnings from non-consolidated joint ventures of $1.9$2.0 million, royalty income of $7.6$7.2 million, charitable donations of $0.9$1.6 million, foreign exchange losses of $3.1$4.6 million, and other miscellaneous income and expense items resulting in expenses of $0.1$0.4 million.
The effective income tax rate for Fiscal 20082010 was 27.2 percent.27.8 percent compared to 18.3 percent in Fiscal 2009. The increase in effective income tax rate for Fiscal 2007 was 26.4 percent. The Company’s Fiscal 2008 tax rate benefited from the effect of changes in foreign statutory tax rates on outstanding deferred tax positions and reduced state tax expenseis primarily due to lower U.S. earnings. U.S. earnings were also a significantly lower percentagedecrease in discrete tax benefits. Fiscal 2009 contained $19.6 million of total earnings, emphasizingdiscrete tax benefits, which predominantly occurred in the fact thatsecond quarter, and primarily related to changes to uncertain tax position reserves in connection with the averageeffective settlements of court cases and examinations in various jurisdictions covering various years. Fiscal 2010 contained $4.3 million of discrete tax rate continues to reflectbenefits, primarily recorded in the significant contributionsecond quarter, from the Company’s international operations, the majority of which have statutory tax rates below those of the U.S. Offsetting these favorable effects, the Company’s Fiscal 2008 tax rate was also impacted by a reduced U.S. dividends received deduction, a reduced benefit from the repatriation of foreign earnings, the expiration of some foreign tax incentives, and the expiration of the U.S. Researchstatute of limitations at foreign subsidiaries and Experimentation credit.other discrete items. Without consideration of discrete items, the average underlying tax rate improved over the prior year to 29.7 percent from 30.4 percent mainly due to the mix of earnings between tax jurisdictions.
Total backlog at July 31, 2008,2010, was $771.2$628.3 million, up 25.219.0 percent from the same period in the prior year. Backlog is one of many indicators of business conditions in the Company’s markets. However, it is not always indicative of future results for a number of reasons, including short lead times in the Company’s replacement parts businesses and the timing of receipt of orders in many of the Company’s Engine OEM and Industrial markets. In the Engine Products segment, total open order backlog increased 24.931.5 percent from the prior year. In the Industrial Products segment, total open order backlog increased 25.6decreased 1.8 percent from the prior year. Because some of the change in backlog can be attributed to a change in the ordering patterns of the Company’s Customers and/or the impact of foreign exchange translation rates, it may not necessarily correspond to higher future sales.
Liquidity and Capital Resources
Financial ConditionAt July 31, 2009,2011, the Company’s capital structure was comprised of $35.1$61.0 million of current debt, $253.7$205.7 million of long-term debt and $688.6$934.7 million of shareholders’ equity. The Company had cash and cash equivalents of $143.7$273.5 million at July 31, 2009.2011. The ratio of long-term debt to total capital was 26.918.0 percent and 19.325.5 percent at July 31, 20092011 and 2008,2010, respectively.
Total debt outstanding decreased $32.8$45.0 million during the year to $288.7$266.7 million outstanding at July 31, 2009.2011. Short-term borrowings outstanding at the end of the year were $109.8$36.9 million lower as compared toless than the prior year, and long-term debt increased $77.0decreased $8.1 million (including current maturities) from the prior year.
The increase in long-term debt was comprised of a new note agreement. On November 14, 2008, the Company issued an $80 million senior unsecured note, due on November 14, 2013. The debt was issued at face value and bears interest payable semi-annually at a rate of 6.59 percent. The proceeds from the note were used to refinance existing debt and for general corporate purposes.
The following table summarizes the Company’s cash obligations as of July 31, 2009,2011, for the years indicated (thousands of dollars):
|
|
|
|
|
|
|
|
|
|
|
|
|
|
|
|
|
|
|
|
|
|
|
|
|
|
|
|
|
|
|
|
|
|
| Payments Due by Period |
|
| Payments Due by Period |
| ||||||||||||||||||||||||||
Contractual Obligations |
| Total |
| Less than |
| 1 - 3 |
| 3 – 5 |
| More than |
|
| Total |
| Less than 1 |
| 1 - 3 years |
| 3 - 5 years |
| More than 5 |
| ||||||||||
Long-term debt obligations |
| $ | 257,879 |
| $ | 4,982 |
| $ | 47,678 |
| $ | 97,434 |
| $ | 107,785 |
|
| $ | 247,037 |
| $ | 45,595 |
| $ | 101,442 |
| $ | — |
| $ | 100,000 |
|
Capital lease obligations |
| 1,291 |
| 514 |
| 718 |
| 59 |
| — |
|
| 796 |
| 428 |
| 360 |
| 8 |
| — |
| ||||||||||
Interest on long-term debt obligations |
| 79,030 |
| 13,484 |
| 25,344 |
| 19,952 |
| 20,250 |
|
| 49,508 |
| 11,946 |
| 19,752 |
| 10,960 |
| 6,850 |
| ||||||||||
Operating lease obligations |
| 21,290 |
| 8,422 |
| 8,924 |
| 3,750 |
| 194 |
|
| 26,579 |
| 10,546 |
| 12,196 |
| 3,006 |
| 831 |
| ||||||||||
Purchase obligations(1) |
| 125,599 |
| 106,621 |
| 18,500 |
| 478 |
| — |
| |||||||||||||||||||||
Pension and deferred compensation(2) |
|
| 78,643 |
|
| 6,416 |
|
| 10,100 |
|
| 9,725 |
|
| 52,402 | |||||||||||||||||
Total(3) |
| $ | 563,732 |
| $ | 140,439 |
| $ | 111,264 |
| $ | 131,398 |
| $ | 180,631 |
| ||||||||||||||||
Purchase obligations(1) |
| 246,872 |
| 236,709 |
| 9,339 |
| 824 |
| — |
| |||||||||||||||||||||
Pension and deferred compensation(2) |
|
| 78,324 |
|
| 5,070 |
|
| 10,533 |
|
| 10,372 |
|
| 52,349 |
| ||||||||||||||||
Total(3) |
| $ | 649,116 |
| $ | 310,294 |
| $ | 153,622 |
| $ | 25,170 |
| $ | 160,030 |
| ||||||||||||||||
|
|
| |
(1) | Purchase obligations consist primarily of inventory, tooling, contract employment services and capital expenditures. The Company’s purchase orders for inventory are based on expected Customer demand, and quantities and dollar volumes are subject to change. | |
|
| |
(2) | Pension and deferred compensation consists of long-term pension liabilities and salary and bonus deferrals elected by certain executives under the Company’s deferred compensation plan. Deferred compensation balances earn interest based on a | |
|
| |
(3) | In addition to the above contractual obligations, the Company may be obligated for additional cash outflows of |
As a result ofThe Company’s general funding policy for its past contribution practices,pension plans is to make at least the minimum contributions as required by applicable regulations. Additionally, the Company does not have amay elect to make additional contributions up to the maximum tax deductible contribution. As such, the Company made contributions of $20.6 million to its U.S. pension plans in Fiscal 2011. There is no minimum required contribution underfunding requirement for the Pension Benefit Guarantee Corporation requirements for itsCompany’s U.S. pension plans for Fiscal 2010. As such, there2012. The Company is no current intention to makecurrently evaluating whether or not a U.S. pension contribution will be made in Fiscal 2010. For2012. The Company made contributions of $7.1 million to its non-U.S. pension plans the Companyin Fiscal 2011 and estimates that it will contribute approximately $5$4.7 million in Fiscal 20102012 based upon the local government prescribed funding requirements. Future estimates of the Company’s pension plan contributions may change significantly depending on the actual rate of return on plan assets, discount rates, and regulatory requirements.
The Company has a five-year, multi-currency revolving facility with a group of banks under which the Company may borrow up to $250 million. This facility matures on April 2, 2013. The agreement provides that loans may be made under a selection of currencies and rate formulas including Base Rate Advances or Off Shore Rate Advances. The interest rate on each advance is based on certain market interest rates and leverage ratios. Facility fees and other fees on the entire loan commitment are payable over the duration of this facility. There was $20.0nothing outstanding at July 31, 2011 and $50.0 million outstanding at July 31, 2009, and $70.0 million outstanding at2010. At July 31, 2008.2011 and 2010, $238.6 million and $180.0 million, respectively, was available for further borrowing under such facilities. The amount available for further borrowing reflects a reduction for issued standby letters of credit, as discussed below. At July 31, 2009 and 2008, $210.0 million and $161.5 million, respectively, was available for further borrowing under such facilities. The weighted average interest rate on these short-term borrowings outstanding at July 31, 20092010 was 0.6 percent. Our multi-currency revolving facility contains debt covenants specifically related to maintaining a certain interest coverage ratio and 2008,a certain leverage ratio as well as other covenants that under certain circumstances can restrict our ability to incur additional indebtedness, make investments and other restricted payments, create liens, and sell assets. As of July 31, 2011, the Company was 0.56 percent and 2.73 percent, respectively.in compliance with all such covenants.
The Company also has three uncommitted credit facilities in the United States, which provide unsecured borrowings for general corporate purposes. At July 31, 20092011 and 2008,2010, there was $56.9 million and $70.0 million available for use.use, respectively. There was $9.6$13.1 million and $28.0 million outstanding under these facilities at July 31, 2009 and 2008, respectively. The weighted average interest rate on these short-term borrowings outstanding at July 31, 20092011 and 2008, was 0.53 percent and 2.79 percent, respectively.nothing outstanding at July 31, 2010.
The Company also has a €100 million program for issuing treasury notes for raising short, medium, and long-term financing for its European operations. There were no amountswas nothing outstanding on this program at
July 31, 2009 and 2008.2011 or 2010. Additionally, the Company’s European operations have lines of credit with an available limit of €72.9€45.6 million. There were no amountswas nothing outstanding on these lines of credit as of July 31, 2009. As of July 31, 2008, there was €23.5 million,2011 or $36.9 million outstanding. The weighted average interest rate of these short-term borrowings outstanding at July 31, 2008, was 5.60 percent.2010.
Other international subsidiaries may borrow under various credit facilities. There were no amountswas nothing outstanding under these credit facilities as of July 31, 2009. As of July 31, 2008, borrowings under these facilities were $4.5 million. The weighted average interest rate on these international borrowings outstanding at July 31, 2008, was 2.88 percent.
During the first quarter of Fiscal 2009, the global credit market began to experience a significant tightening of credit availability and interest rate volatility. This crisis resulted in reduced funding available for commercial banks and corporate debt issuers. As a result, capital market financing became more expensive and less available. The Company has assessed the implications of these factors on its current business and believes that its current financial resources are sufficient to continue financing its operations. There can be no assurance, however, that the cost2011 or availability of future borrowings will not be impacted by ongoing capital market disruptions.
The Company is exposed to changes in the fair value of its fixed-rate debt resulting from interest rate fluctuations. To hedge this exposure the Company entered into two fixed-to-variable interest rate swaps on August 3, 2009, subsequent to year end, for $80 million and $25 million, respectively, for approximately 5 and 8 years, respectively. These interest rate swaps will be accounted for as fair value hedges. Changes in the payment of interest resulting from the interest rate swaps will be recorded as an offset to interest expense.
Certain note agreements contain debt covenants related to working capital levels and limitations on indebtedness. As of July 31, 2009, the Company was in compliance with all such covenants. The Company currently expects to remain in compliance with these covenants.2010.
Also, at July 31, 20092011 and 2008,2010, the Company had outstanding standby letters of credit totaling $20.0$11.4 million, and $18.5 million, respectively, upon which no amounts had been drawn. The letters of credit guarantee payment to third parties in the event the Company is in breach of a specified bond financing agreement and insurance contract terms as detailed in each letter of credit.
During Fiscal 2011, credit in the global credit markets became more accessible than in recent years and market interest rates remained low. The Company believes that its current financial resources are sufficient to continue financing its operations for the next twelve months. There can be no assurance, however, that the cost or availability of future borrowings will not be impacted by future capital market disruptions.
Certain note agreements contain debt covenants related to working capital levels and limitations on indebtedness. As of July 31, 2011, the Company was in compliance with all such covenants. The Company currently expects to remain in compliance with these covenants.
Shareholders’ equity decreased $51.4increased $188.1 million in Fiscal 20092011 to $688.6$934.7 million at July 31, 2009.2011. The decreaseincrease was primarily due to the current year earnings of $225.3 million, changes to foreign currency translation of $63.4$72.5 million, $58.6$13.8 million of stock options exercised, $12.2 million in tax reductions related to employee plans, $7.2 million (net of tax) of adjustments related to the pension liability, $32.8and $6.5 million of stock option expense. These increases were partially offset by $108.9 million of treasury stock repurchases and $35.5$42.8 million of dividend declarations. These decreases were partially offset by current year earnings of $131.9 million.
Cash FlowsDuring Fiscal 2009, $276.92011, $246.1 million of cash was generated from operating activities, compared with $173.5$203.0 million in Fiscal 2008 and $117.0 million2010. The increase in Fiscal 2007. Operating cash flows in Fiscal 2009 increased by $103.4 million from the prior year. Operating cash flows were positively impacted by the decreased level of sales as a result of the worldwide recession and the Company’s cash flow improvement initiatives. This led to a decrease in accounts receivable and inventory levels of $146.8 million and $115.5 million, respectively, and corresponding increase operating cash flows. These positive impacts were partially offset by the negative impacts of decreases in accounts payable and accrued compensation of $82.3 million and $22.9 million, respectively, which reduced operating cash flows. In addition to cash generated from operating activities of $43.1 million was primarily attributable to the CompanyCompany’s net earnings increase of $59.1 million over the prior year, partially offset by changes in working capital needs resulting from increased its outstanding net long-term debt by $72.7 million.inventory to support increased demand and a larger discretionary pension contribution than the prior year. Cash flow generated by operations $3.9 million of proceeds from the sale of the Maryville, TN air dryer business and $80.0 million of additional long-term debt werecash on hand was used primarily to support $45.6$59.9 million of net capital expenditures, the acquisition of Western Filter Corporation for $78.5 million, $32.8$108.9 million for stock repurchases, $35.2$41.0 million for dividend payments and repayment of $103.7 million of short-term debt.to reduce total debt by $50.0 million. Cash and cash equivalents increased $60.3$41.5 million during Fiscal 2009.2011.
Net capital expenditures for property, plant and equipment totaled $45.6$59.9 million in Fiscal 2009, $70.82011 and $42.7 million in Fiscal 2008 and $76.6 million in Fiscal 2007.2010. Net capital expenditures is comprised of purchases of property, plant, and equipment of $46.1 million, $72.1$60.6 million and $77.4$43.1 million in Fiscal 2009, 20082011 and 2007,2010, respectively, partially offset by proceeds from the sale of property, plant and equipment of
$0.5 million, $1.3 million, and $0.8 million in Fiscal 2009, 20082011 and 2007, respectively.$0.5 million in Fiscal 20092010. Fiscal 2011 capital expenditures primarily related to new plant capacity additions, and productivity enhancing investments at various plants worldwide.worldwide, and tooling to manufacture new products.
Capital spending in Fiscal 20102012 is planned at $30.0 million to $40.0be approximately $100.0 million. It is anticipated that Fiscal 20102012 capital expenditures will be financed primarily by cash on hand, cash generated from operations, and existing lines of credit.credit as needed.
The Company expects that cash generated by operating activities will exceed $150be between $275 and $305 million in Fiscal 2010.2012. At July 31, 2009,2011, the Company had cash of $143.7$273.5 million, which primarily exists at subsidiaries outside of the United States. The Company also had $270.4$295.5 million available under existing credit facilities in the United States, €172.9€145.6 million or $245.3$209.7 million, available under existing credit facilities in Europe and $41.4$67.5 million available under various credit facilities and currencies in Asia and the rest of the world. The Company believes that the combination of existing cash, available credit under existing credit facilities, and the expected cash generated by operating activities will be adequate to meet cash requirements for Fiscal 2010,2012, including debt repayment, issuance of anticipated dividends, possible share repurchase activity, and capital expenditures.
DividendsThe Company’s dividend policy is to maintain a payout ratio, which allows dividends to increase with the long-term growth of earnings per share. The Company’s dividend payout ratio target is 20 percent to 30 percent of the average earnings per share of the last three years. Including the Company’s declaration on July 29, 2011 of a $0.15 per share dividend to be paid, the dividend payout ratio was 28.1 percent on July 31, 2011.
Share Repurchase PlanThe Board of Directors authorized the repurchase of 8.0 million shares of common stock under the stock repurchase plan dated March 26, 2010. In Fiscal 2009,2011, the Company repurchased 0.82.0 million shares of common stock for $32.8$108.9 million, under the share repurchase plan authorized in March 2006or 2.5 percent of its diluted outstanding shares, at an average price of $40.86$55.67 per share. The Company repurchased 2.21.7 million shares for $92.2$66.7 million in Fiscal 2008.2010. The Company repurchased 2.20.8 million shares for $76.9$32.8 million in Fiscal 2007.2009. As of July 31, 2009,2011, the Company had remaining authorization to repurchase 0.95.0 million shares under this plan.pursuant to the current authorization. The Company initiated the purchase of an additional 162,900 shares in July 2011 for $9.2 million that are not included in Fiscal 2011 repurchases as the transactions did not settle until after fiscal year end. These repurchases will be included in Fiscal 2012 activity.
Off-Balance Sheet ArrangementsThe Company does not have any off-balance sheet arrangements, with the exception of the guarantee of 50 percent of certain debt of its joint venture, Advanced Filtration Systems, Inc.AFSI as further discussed in Note KL of the Company’s Notes to Consolidated Financial Statements. As of July 31, 2009,2011, the joint venture had $27.7$24.6 million of outstanding debt. The Company does not believe that this guarantee will have a current or future effect on its financial condition, results of operation, liquidity or capital resources.
�� New Accounting StandardsIn May 2009, the Financial Accounting Standards Board (FASB) issued FAS No. 165, Subsequent Events (FAS 165), which establishes general standards of accounting and disclosure for events that occur after the balance sheet date but before the financial statements are issued. This new standard was effective for interim or annual financial periods ending after June 15, 2009, and did not have an impact on our consolidated financial position or results of operations.
In April 2009,December 2010, the FASB issued FSP No. FAS 107-1 and APB 28-1,Interim Disclosures about Fair Valueupdated the accounting guidance relating to the annual goodwill impairment test. The updated guidance requires companies to perform the second step of Financial Instruments, (FSP No. FAS-107-1 and APB-28-1), which amends FAS 107,Disclosures about Fair Valuethe impairment test to measure the amount of Financial Instrumentsand Accounting Principles Board (APB) Opinion No. 28,Interim Financial Reporting, to require disclosures about fair value of financial instruments for interim periods. This FSP will be effective forimpairment loss, if any, when it is more likely than not that goodwill impairment exists when the Company for the quarter ended October 31, 2009, and will expand the Company’s disclosures regarding the use of fair value in interim periods.
In December 2008, the FASB issued FSP No. FAS 132(R)-1,Employers’ Disclosures about Postretirement Benefit Plan Assets(FSP No. FAS 132(R)), which provides guidance on an employer’s disclosures about plan assetscarrying amount of a defined benefit pensionreporting unit is zero or other postretirement plan. This FSPnegative. In considering whether it is effective for fiscal years ending after December 15, 2009.more likely than not that goodwill impairment exists, an entity shall evaluate whether there are adverse qualitative factors. The Company is currently evaluating the impact of adopting FSP No. FAS 132(R) on our defined benefit pension and other postretirement plan note disclosures.
In September 2006, the FASB issued SFAS No. 158,Employers’ Accounting for Defined Benefit Pension and Other Postretirement Plans, an amendment of FASB Statements No. 87, 88, 106, and 132(R)(SFAS 158). The portion of the statement that requires recognition of the overfunded or underfunded status of defined benefit postretirement plans as an asset or liability in the statement of financial position was adopted inupdated guidance
Fiscal 2007 with minimal impact. SFAS 158 also requires measurement of the funded status of a plan as of the date of the statement of financial position. That provision required the Company to change its measurement date from April 30 to July 31 in Fiscal 2009. The adoption of the measurement date provision resulted in an after-tax decrease to Retained earnings of $0.9 million, a decrease to Other assets of $0.5 million increase to Other long-term liabilities of $0.8 million and an increase to Deferred income taxes of $0.5 million.
In September 2006, the FASB issued SFAS No. 157,Fair Value Measurements(SFAS 157). This statement defines fair value, establishes a framework for measuring fair value in U.S. generally accepted accounting principles and expands disclosures about fair value measurements. SFAS 157 applies whenever another standard requires (or permits) assets or liabilities to be measured at fair value, except for the measurement of share-based payments. SFAS 157 does not expand the use of fair value to any new circumstances, and wasis effective for the majorityCompany beginning in the first quarter of the Company’s assets and liabilities for its Fiscal 2009fiscal year beginning August 1, 2008.2012. The adoption of this portion of SFAS 157 in Fiscal 2009 did not have a material impact on the Company’s financial statements. On February 12, 2008, the FASB issued FASB Staff Position (FSP) FAS 157-2,Effective Date of FASB Statement No. 157(FSP FAS 157-2). FSP FAS 157-2 delays by one year the effective date of SFAS 157 for certain non-financial assets and non-financial liabilities. The Companyguidance is currently evaluating the impact the FSP FAS 157-2 will have on the determination of fair value related to non-financial assets and non-financial liabilities in Fiscal 2010. The adoption of FSP FAS 157-2 is not expected to have a material impact on the Company’s financial statements.
In February 2007, the FASB issued SFAS No. 159,The Fair Value Option for Financial Assets and Financial Liabilities(“SFAS 159”). SFAS 159 permits entities to choose to measure many financial instruments and certain other items at fair value that are not currently required to be measured at fair value. SFAS 159 is effective for fiscal years beginning after November 15, 2007, and was effective for the Company with its 2009 fiscal year, beginning August 1, 2008. The adoption of SFAS 159 did not have a material impact on the Company’s financial statements.
In December 2007, the FASB issued SFAS No. 141(R),Business Combinations(SFAS 141(R)), which changes the accounting for business combinations and their effects on the financial statements. SFAS 141(R) will be effective for the Company at the beginning of Fiscal 2010. In February 2009, the FASB issued FASB Staff Position 141(R)-a,Accounting for Assets Acquired and Liabilities Assumed in a Business Combination That Arise from Contingencies(FSP FAS 141(R)-a), which will amend certain provisions of SFAS 141(R). The adoptions of SFAS 141(R) and FSP FAS 141(R)-a are not expected to have a material impact on the Company’s consolidated financial statements.
In March 2008,May 2011, the FASB issued SFAS No. 161,Disclosuresupdated the accounting guidance related to fair value measurements. The updated guidance results in a consistent definition of fair value and common requirements for measurement of and disclosure about Derivative Instrumentsfair value between U.S. GAAP and Hedging Activities, an amendmentInternational Financial Reporting Standards (IFRS). The updated guidance is effective for the Company beginning in the third quarter of FASB Statement No. 133(SFAS 161). SFAS 161 requires enhanced disclosures about an entity’s derivative and hedging activities, including (a) how and why an entity uses derivative instruments, (b) how derivative instruments and related hedged items are accounted for under SFAS No. 133,Accounting for Derivative Instruments and Hedging Activities, and (c) how derivative instruments and related hedged items affect an entity’s financial position, financial performance and cash flows.fiscal year 2012. The Company adoptedis currently evaluating the provisionsimpact of SFAS 161 effective February 1, 2009. The adoption of SFAS 161 onlythis accounting guidance on its consolidated financial statements.
In June 2011, the FASB updated the disclosure requirements for comprehensive income. The updated guidance requires additional disclosures aboutcompanies to disclose the Company’s derivativestotal of comprehensive income, the components of net income, and thus didthe components of other comprehensive income either in a single continuous statement of comprehensive income or in two separate but consecutive statements. The updated guidance does not affect how earnings per share is calculated or presented. The updated guidance is effective for the Company’sCompany beginning in the third quarter of fiscal year 2012. The Company is currently evaluating the impact of adoption of this accounting guidance on its consolidated financial statements.
Market Risk
The Company’s market risk includes the potential loss arising from adverse changes in foreign currency exchange rates and interest rates. The Company manages foreign currency market risk from time to time through the use of a variety of financial and derivative instruments. The Company does not enter into any of these instruments for trading purposes to generate revenue. Rather, the Company’s objective in managing these risks is to reduce fluctuations in earnings and cash flows associated with changes in foreign currency exchange rates. The Company uses forward exchange contracts and other hedging activities to hedge the U.S. dollar value resulting from existing recognized foreign currency denominated asset and liability balances and also for anticipated foreign currency transactions. The Company also naturally hedges foreign
currency through its production in the countries in which it sells its products. The Company’s market risk on interest rates is the potential decrease in fair value of long-term debt resulting from a potential increase in interest rates. See further discussion of these market risks below.below and in Note E of the Notes to Consolidated Financial Statements.
Foreign CurrencyDuring Fiscal 2009,2011, the U.S. dollar was strong throughout the yeargenerally weaker than Fiscal 2010 compared to many of the currencies of the foreign countries in which the Company operates. The overall strengthweakness of the dollar had a negativepositive impact on the Company’s international net sales results because the foreign denominated revenues translated into fewermore U.S. dollars.
It is not possible to determine the true impact of foreign currency translation changes. However, the direct effect on reported net sales and net earnings can be estimated. For the year ended July 31, 2009,2011, the impact of foreign currency translation resulted in an overall decreaseincrease in reported net sales of $76.8$49.8 million, a decrease in operating expenses of $24.5$9.7 million and a decrease in reported net earnings of $3.8$6.1 million. Foreign currency translation had a negativepositive impact in most regions around the world. In Europe, the strongerweaker U.S. dollar relative to the euro and British pound sterling resulted in a decreasetotal increase of $66.2$8.1 million in reported net sales and an insignificant decrease in reported net earnings.sales. The strongerweaker U.S. dollar relative to the Japanese yen, Australian dollar, Korean won, Mexican peso, andChinese renminbi, South African rand, and Thai baht also had a negativepositive impact on foreign currency translation, with a decreasean increase in reported net sales of $10.7$15.6 million, $6.1$8.8 million, $12.3$5.0 million, $4.8 million, $4.4 million, and $8.4$4.1 million, respectively, and a decreasean increase in reported net earnings of $0.6$1.1 million, $1.2 million, $0.6 million, $2.1$0.9 million, $0.4 million, and $0.4$1.0 million, respectively. Foreign currency losses were partially offset by gains relative to the Japanese yen and Chinese renminbi of $13.8 million and $4.4 million, respectively, in reported net sales and $0.3 million and $0.7 million, respectively, in reported net earnings.
The Company maintains significant assets and operations in Europe, Asia-Pacific, South Africa, and Mexico, resulting in exposure to foreign currency gains and losses. A portion of the Company’s foreign currency exposure is naturally hedged by incurring liabilities, including bank debt, denominated in the local currency in which the Company’s foreign subsidiaries are located.
The foreign subsidiaries of the Company generally purchase the majority of their input costs and then sell to many of their Customers in the same local currency.
The Company may be exposed to cost increases relative to local currencies in the markets to which it sells. To mitigate such adverse trends, the Company, from time to time, enters into forward exchange contracts and other hedging activities. Additionally, foreign currency positions are partially offsetting and are netted against one another to reduce exposure.
Some products made in the United States are sold abroad. As a result, sales of such products are affected by the value of the U.S. dollar relative to other currencies. Any long-term strengthening of the U.S. dollar could depress these
sales. Also, competitive conditions in the Company’s markets may limit its ability to increase product pricing in the face of adverse currency movements.
InterestThe Company’s exposure to market risks for changes in interest rates relates primarily to its short-term investments, short-term borrowings, and interest rate swap agreements as well as the potential increase in fair value of long-term debt resulting from a potential decrease in interest rates. The Company has no earnings or cash flow exposure due to market risks on its long-term debt obligations as a result of the fixed-rate nature of the debt. However, interest rate changes would affect the fair market value of the debt. As of July 31, 2009,2011, the estimated fair value of long-term debt with fixed interest rates was $253.1$268.3 million compared to its carrying value of $250.1$247.0 million. The fair value is estimated by discounting the projected cash flows using the rate that similar amounts of debt could currently be borrowed. As of July 31, 2009,2011, the Company’s financial liabilities with exposure to changes in interest rates consisted mainly of $29.6$13.1 million of short-term debt outstanding. Assuming a hypothetical increase of one-half percent in short-term interest rates, with all other variables remaining constant, interest expense would have increased $0.6$0.4 million in Fiscal 2009.2011.
PensionsThe Company is exposed to market return fluctuations on its qualified defined benefit pension plans. During Fiscal 2009,Although the market value of these assets declined in conjunction with the global economic downturn. This decline in market value is the principle reason that pension expense is expected to increase by $1.1 millionincreased in Fiscal 2010. At2011, we adjusted our long–term rate of return from 8.0 percent to 7.75 percent on our U.S. plans and from a weighted average of 6.17 percent to 6.03 percent on our non-U.S. plans to reflect our future expectation for returns. In addition, we adjusted our discount rate used to value our pension obligation for our U.S. plans from 5.25 percent to 4.91 percent and from 5.17 percent to 5.36 percent for the non-U.S plans. Our plans were underfunded by $30.5 million at July 31, 2009, the Company’s annual measurement date for its
pension plans, the plans were under funded by $40.7 million2011, since the projected benefit obligation exceeded the fair value of the plan assets.
Critical Accounting Policies
The Company’s consolidated financial statements are prepared in conformity with generally accepted accounting principles generally accepted in the United States of America.America (U.S. GAAP). The preparation of these financial statements requires the use of estimates, judgments and assumptions that affect the reported amounts of assets and liabilities at the date of the financial statements and the reported amounts of revenue and expenses during the periods presented. Management bases these estimates on historical experience and various other assumptions that are believed to be reasonable under the circumstances, the results of which form the basis for making judgments about the recorded values of certain assets and liabilities. The Company believes its use of estimates and underlying accounting assumptions adheres to generally accepted accounting principlesU.S. GAAP and is consistently applied. Valuations based on estimates and underlying accounting assumptions are reviewed for reasonableness on a consistent basis throughout the Company. Management believes the Company’s critical accounting policies that require more significant judgments and estimates used in the preparation of its consolidated financial statements and that are the most important to aid in fully understanding its financial results are the following:
Revenue recognition, warranty and allowance for doubtful accountsRevenue is recognized when both product ownership and the risk of loss have transferred to the Customer and the Company has no remaining obligations. The Company records estimated discounts and rebates as a reduction of sales in the same period revenue is recognized. Accruals for warranties on products sold are recorded based on historical return percentages and specific product recall campaigns. Allowances for doubtful accounts are estimated by management based on evaluation of potential losses related to Customer receivable balances. The allowance for doubtful accounts is the Company’s best estimate of the amount of probable credit losses in its existing accounts receivable. The Company determines the allowance based on historical write-off experience in the industry, regional economic data, and evaluation of specific Customer accounts for risk of loss. The Company reviews its allowance for doubtful accounts monthly. Past due balances over 90 days and over a specified amount are reviewed individually for collectibility. All other balances are reviewed on a pooled basis by type of receivable. Account balances are charged off against the allowance when the Company feels it is probable the receivable will not be recovered. The Company does not have any off-balance-sheetoff-balance sheet credit exposure related to its Customers. The establishment of this reserve requires the use of judgment and assumptions regarding the potential for losses on receivable balances. Though management considers these balances adequate and proper, changes in economic conditions in specific markets in which the Company operates could have an effect on reserve balances required.
Goodwill and other intangible assetsGoodwill is assessed for impairment annually, or more frequently if events or changes in circumstances indicate that the asset might be impaired. The Company performs impairment assessments for its reporting units and uses a discounted cash flow model based on management’s judgments and assumptions to determine the estimated fair value. An impairment loss generally would be recognized when the carrying amount of the reporting unit’s net assets exceeds the estimated fair value of the reporting unit. The Company performed an impairment assessment during the third quarter of Fiscal 20092011 to satisfy its annual impairment requirement. The impairment assessment in the third quarter indicated that the estimated fair value of each reporting unit exceeded its corresponding carrying amount, including recorded goodwill and, as such, no impairment existed at that time. Other intangible assets with definite lives continue to be amortized over their estimated useful lives. Definite lived intangible
assets are also subject to impairment assessments. A considerable amount of management judgment and assumptions are required in performing the impairment assessments, principally in determining the fair value of each reporting unit. While the Company believes its judgments and assumptions are reasonable, different assumptions could change the estimated fair values and, therefore, impairment charges could be required.
Income taxesAs part of the process of preparing the Company’s Consolidated Financial Statements, management is required to estimate income taxes in each of the jurisdictions in which the Company operates. This process involves estimating actual current tax exposure together with assessing temporary differences resulting from differing treatment of items for tax and book accounting purposes. These
differences result in deferred tax assets and liabilities, which are included within the Company’s Consolidated Balance Sheet. These assets and liabilities are evaluated by using estimates of future taxable income streams and the impact of tax planning strategies. Management assesses the likelihood that deferred tax assets will be recovered from future taxable income and to the extent management believes that recovery is not likely, a valuation allowance is established. To the extent that a valuation allowance is established or increased, an expense within the tax provision is included in the statement of operations. Reserves are also estimated for uncertain tax positions that are currently unresolved. The Company routinely monitors the potential impact of such situations and believes that it is properly reserved. Valuations related to tax accruals and assets can be impacted by changes to tax codes, changes in statutory tax rates and the Company’s future taxable income levels.
The Company’s accounting for income taxes in Fiscal 2008 was affected by the adoption of FIN No. 48,Accounting for Uncertainty in Income Taxes,which the Company was required to adopt on August 1, 2007. This pronouncement prescribes a recognition threshold and measurement attribute for the financial statement recognition and measurement of tax positions taken or expected to be taken in a tax return. As such, the standard required the Company to reassess all of the Company’s uncertain tax return positions in accordance with this new accounting principle. As of July 31, 2009,2011, the liability for unrecognized tax benefits, accrued interest and penalties was $16.9$21.5 million.
Employee Benefit PlansThe Company incurs expenses relating to employee benefits such as non-contributory defined benefit pension plans, and postretirement health care benefits. In accounting for these employment costs, management must make a variety of assumptions and estimates including mortality rates, discount rates, overall Company compensation increases, expected return on plan assets, and health care cost trend rates. The Company considers historical data as well as current facts and circumstances and uses a third-party specialist to assist management in determining these estimates.
To develop the assumption regarding the expected long-term rate of return on assets for its U.S. pension plans, the Company considered the historical returns and the future expectations for returns for each asset class, as well as the target asset allocation of the pension portfolio. This resulted in the selection of the 8.507.75 percent long-term rate of return on assets assumption as of July 31, 2011 for developing the Fiscal 2012 expense for the Company’s U.S. pension plans. In addition, we lowered our discount rate used to value our pension obligation for our U.S. plans from 5.25 percent to 4.91 percent. The expected long-term rate of return on assets assumption for the plans outside the U.S. reflects the investment allocation and expected total portfolio returns specific to each plan and country. The expected long-term rate of return on assets shown in the pension benefit disclosure for non-U.S. plans is an asset-based weighted average of all non-U.S. plans.
Reflecting the relatively long-term nature of the plans’ obligations, approximately 45 percent of the plans assets are invested in equity securities, 30 percent in alternative investments (funds of hedge funds), 10 percent in real assets (investments into funds containing commodities and real estate), 10 percent in fixed income, and 5 percent in private equity. Within equity securities, the Company targets an allocation of 15 percent international, 15 percent equity long / short, 10 percent small cap, and 5 percent large cap.
A one percent change in the expected long-term rate of return on U.S. plan assets, from 8.0 percent, would have changed the Fiscal 20092011 annual pension expense by approximately $3.6$2.7 million. The expected long-term rate of return on assets assumption for the plans outside the U.S. follows the same methodology as described above but reflects the investment allocation and expected total portfolio returns specific to each plan and country.
The Company’s objective in selecting a discount rate for its pension plans is to select the best estimate of the rate at which the benefit obligations could be effectively settled on the measurement date, taking into account the nature and duration of the benefit obligations of the plan. In making this best estimate, the Company looks at rates of return on high-quality fixed-income investments currently available and expected to be available during the period to maturity of the benefits. This process includes assessing the universe of bonds available on the measurement date with a quality rating of Aa or better. Similar appropriate benchmarks are used to determine the discount rate for the non-U.S. plans. As of the measurement date of July 31, 2009,2011, the Company elected to maintain the 6.00 percentdecreased its discount rate electedfor the U.S. pension plans to 4.91 percent from 5.25 percent as of July 31, 2009, for the U.S. pension plans. This2010. The decrease of 34 basis points is consistent with published bond indices. A 0.25 percentThe change increased the Company’s U.S. projected benefit obligation as of July 31, 2011 by approximately $7.2 million and is expected to increase pension expense in fiscal year 2012 by approximately $0.5 million. The rates discussed above are weighted average rates as we have multiple plans both in the discount rate would have changed the benefit obligation related to the U.S. plans by approximately $6.5 million at July 31, 2009, and changed Fiscal 2009 annual pension expense by approximately $0.3 million.internationally.
Forward-Looking StatementsSafe Harbor Statement under the Securities Reform Act of 1995
The Company, through its management, may make forward-looking statements reflecting the Company’s current views with respect to future events and financial performance. These forward-looking statements, which may be
included in reports filed under the Securities Exchange Act of 1934, as amended (the “Exchange Act”), in press releases and in other documents and materials as well as in written or oral statements made by or on behalf of the Company, are subject to certain risks and uncertainties, including those discussed in Item 1A of this Form 10-K, which could cause actual results to differ materially from historical results or those anticipated. The words or phrases “will likely result,” “are expected to,” “will continue,” “estimate,” “project,” “believe,” “expect,” “anticipate,” “forecast”“forecast,” and similar expressions are intended to identify forward-looking statements within the meaning of Section 21e of the Exchange Act and Section 27A of the Securities Act of 1933, as amended, as enacted by the Private Securities Litigation Reform Act of 1995 (“PSLRA”). In particular the Company desires to take advantage of the protections of the PSLRA in connection with the forward-looking statements made in this annual reportAnnual Report on Form 10-K.10-K, including those contained in the “Outlook” section of Item 7. Management’s Discussion and Analysis of Financial Condition and Results of Operation.
Readers are cautioned not to place undue reliance on these forward-looking statements, which speak only as of the date such statements are made. In addition, the Company wishes to advise readers that the factors listed in Item 1A of this Form 10-K, as well as other factors, could affect the Company’s performance and could cause the Company’s actual results for future periods to differ materially from any opinions or statements expressed. These factors include, but are not limited to risks associated with: world economic factors and the ongoing economic uncertainty, the reduced demand for hard disk drive products with the increased use of flash memory, the potential for some Customers to increase their reliance on their own filtration capabilities, currency fluctuations, commodity prices, political factors, the Company’s international operations, highly competitive markets, environmental laws and regulations, including regulatory approvals for Retrofit Emission Products, governmental laws and regulations, including the impact of the various economic stimulus and financial reform measures being implemented, the implementation of our new information technology systems, potential global events resulting in market instability including financial bailouts of sovereign nations, political changes, military and terrorist activities, health outbreaks, and other factors included in Item 1A of this Report on Form 10-K. The Company undertakes no obligation to publicly update or revise any forward-looking statements, whether as a result of new information, future events or otherwise.
Item 7A. Quantitative and Qualitative Disclosures about Market Risk
Market risk disclosure appears in Management’s Discussion and Analysis on page 22 under21under “Market Risk.”
Item 8. Financial Statements and Supplementary Data
Management’s Report on Internal Control over Financial Reporting
Management is responsible for establishing and maintaining adequate internal control over financial reporting for the Company. Management conducted an evaluation of the effectiveness of internal control over financial reporting based on the framework inInternal Control – Integrated Frameworkissued by the Committee of Sponsoring Organizations of the Treadway Commission (“COSO”). Based on this evaluation, management concluded that the Company’s internal control over financial reporting was effective as of July 31, 2009.2011. The Company’s independent registered public accounting firm, PricewaterhouseCoopers LLP, has audited the effectiveness of the Company’s internal control over financial reporting as of July 31, 2009,2011, as stated in this report which follows in Item 8 of this Form 10-K.
|
|
|
|
|
|
William M. Cook | Thomas R. VerHage |
Chief Executive Officer | Chief Financial Officer |
September | September 23, 2011 |


Report of Independent Registered Public Accounting Firm
To the Shareholders and Board of Directors of Donaldson Company, Inc.
In our opinion, the accompanying consolidated balance sheets and the related consolidated statements of earnings, shareholders'shareholders’ equity and cash flows present fairly, in all material respects, the financial position of Donaldson Company, Inc. and its subsidiaries at July 31, 20092011 and July 31, 2008,2010, and the results of their operations and their cash flows for each of the three years in the period ended July 31, 2009,2011, in conformity with accounting principles generally accepted in the United States of America. In addition, in our opinion the financial statement schedule listed in the index appearing under Item 15(2)item 15(II) presents fairly, in all material respects, the information set forth therein when read in conjunction with the related consolidated financial statements. Also in our opinion, the Company maintained, in all material respects, effective internal control over financial reporting as of July 31, 2009,2011, based on criteria established inInternal Control - Integrated Framework issued by the Committee of Sponsoring Organizations of the Treadway Commission (COSO). The Company'sCompany’s management is responsible for these financial statements and financial statement schedule, for maintaining effective internal control over financial reporting and for its assessment of the effectiveness of internal control over financial reporting, included in the accompanying Management'sManagement’s Report on Internal Control over Financial Reporting. Our responsibility is to express opinions on these financial statements, on the financial statement schedule, and on the Company'sCompany’s internal control over financial reporting based on our integrated audits. We conducted our audits in accordance with the standards of the Public Company Accounting Oversight Board (United States). Those standards require that we plan and perform the audits to obtain reasonable assurance about whether the financial statements are free of material misstatement and whether effective internal control over financial reporting was maintained in all material respects. Our audits of the financial statements included examining, on a test basis, evidence supporting the amounts and disclosures in the financial statements, assessing the accounting principles used and significant estimates made by management, and evaluating the overall financial statement presentation. Our audit of internal control over financial reporting included obtaining an understanding of internal control over financial reporting, assessing the risk that a material weakness exists, and testing and evaluating the design and operating effectiveness of internal control based on the assessed risk. Our audits also included performing such other procedures as we considered necessary in the circumstances. We believe that our audits provide a reasonable basis for our opinions.
As discussed in Note A to the consolidated financial statements, the Company changed the manner in which it accounts for defined benefit arrangements effective July 31, 2007. Also, as discussed in Note I to the consolidated financial statements, the Company changed the manner in which it accounts for unrecognized income tax positions effective August 1, 2007.
A company’s internal control over financial reporting is a process designed to provide reasonable assurance regarding the reliability of financial reporting and the preparation of financial statements for external purposes in accordance with generally accepted accounting principles. A company’s internal control over financial reporting includes those policies and procedures that (i) pertain to the maintenance of records that, in reasonable detail, accurately and fairly reflect the transactions and dispositions of the assets of the company; (ii) provide reasonable assurance that transactions are recorded as necessary to permit preparation of financial statements in accordance with generally accepted accounting principles, and that receipts and expenditures of the company are being made only in accordance with authorizations of management and directors of the company; and (iii) provide reasonable assurance regarding prevention or timely detection of unauthorized acquisition, use, or disposition of the company’s assets that could have a material effect on the financial statements.
Because of its inherent limitations, internal control over financial reporting may not prevent or detect misstatements. Also, projections of any evaluation of effectiveness to future periods are subject to the risk that controls may become inadequate because of changes in conditions, or that the degree of compliance with the policies or procedures may deteriorate.
/s/ PricewaterhouseCoopers LLP |
|
|

Consolidated Statements of Earnings
Donaldson Company, Inc. and Subsidiaries
|
|
|
|
|
|
|
|
|
|
|
|
|
|
|
|
|
|
|
|
|
|
| Year ended July 31, |
|
| Year ended July 31, |
| ||||||||||||||
|
| 2009 |
| 2008 |
| 2007 |
|
| 2011 |
| 2010 |
| 2009 |
| ||||||
|
| (thousands of dollars, except share |
|
| (thousands of dollars, except share |
| ||||||||||||||
Net sales |
| $ | 1,868,629 |
| $ | 2,232,521 |
| $ | 1,918,828 |
|
| $ | 2,294,029 |
| $ | 1,877,064 |
| $ | 1,868,629 |
|
Cost of sales |
|
| 1,278,923 |
|
| 1,506,659 |
|
| 1,313,964 |
|
|
| 1,480,233 |
|
| 1,218,316 |
|
| 1,278,923 |
|
Gross margin |
| 589,706 |
| 725,862 |
| 604,864 |
|
| 813,796 |
| 658,748 |
| 589,706 |
| ||||||
Selling, general and administrative |
| 379,108 |
| 436,293 |
| 357,306 |
|
| 443,227 |
| 376,018 |
| 379,108 |
| ||||||
Research and development |
|
| 40,643 |
|
| 43,757 |
|
| 36,458 |
|
|
| 55,286 |
|
| 44,486 |
|
| 40,643 |
|
Operating income |
| 169,955 |
| 245,812 |
| 211,100 |
|
| 315,283 |
| 238,244 |
| 169,955 |
| ||||||
Interest expense |
| 17,018 |
| 16,550 |
| 14,559 |
|
| 12,525 |
| 11,975 |
| 17,018 |
| ||||||
Other income, net |
|
| (8,488 | ) |
| (6,901 | ) |
| (8,320 | ) |
|
| (9,505 | ) |
| (3,907 | ) |
| (8,488 | ) |
Earnings before income taxes |
| 161,425 |
| 236,163 |
| 204,861 |
|
| 312,263 |
| 230,176 |
| 161,425 |
| ||||||
Income taxes |
|
| 29,518 |
|
| 64,210 |
|
| 54,144 |
|
|
| 86,972 |
|
| 64,013 |
|
| 29,518 |
|
Net earnings |
| $ | 131,907 |
| $ | 171,953 |
| $ | 150,717 |
|
| $ | 225,291 |
| $ | 166,163 |
| $ | 131,907 |
|
Weighted average shares — basic |
| 77,879,036 |
| 79,207,604 |
| 80,454,861 |
| |||||||||||||
Weighted average shares — diluted |
| 79,172,042 |
| 81,211,343 |
| 82,435,756 |
| |||||||||||||
Net earnings per share — basic |
| $ | 1.69 |
| $ | 2.17 |
| $ | 1.87 |
| ||||||||||
Net earnings per share — diluted |
| $ | 1.67 |
| $ | 2.12 |
| $ | 1.83 |
| ||||||||||
Weighted average shares - basic |
| 77,196,370 |
| 77,848,528 |
| 77,967,141 |
| |||||||||||||
Weighted average shares - diluted |
| 78,598,459 |
| 79,177,772 |
| 79,199,838 |
| |||||||||||||
Net earnings per share - basic |
| $ | 2.92 |
| $ | 2.13 |
| $ | 1.69 |
| ||||||||||
Net earnings per share - diluted |
| $ | 2.87 |
| $ | 2.10 |
| $ | 1.67 |
| ||||||||||
The accompanying notes are an integral part of these Consolidated Financial Statements.
Consolidated Balance Sheets
Donaldson Company, Inc. and Subsidiaries
|
|
|
|
|
|
|
|
|
|
|
|
|
|
|
|
| At July 31, |
|
| At July 31, |
| ||||||||
|
| 2009 |
| 2008 |
|
| 2011 |
| 2010 |
| ||||
|
| (thousands of dollars, |
|
| (thousands of dollars, except |
| ||||||||
Assets |
|
|
|
|
|
|
|
|
|
| ||||
Current assets |
|
|
|
|
|
|
|
|
|
| ||||
Cash and cash equivalents |
| $ | 143,687 |
| $ | 83,357 |
|
| $ | 273,494 |
| $ | 232,000 |
|
Accounts receivable, less allowance of $7,387 and $7,509 |
| 280,187 |
| 413,863 |
| |||||||||
Inventories |
| 180,238 |
| 264,129 |
| |||||||||
Accounts receivable, less allowance of $6,908 and $6,315 |
| 445,700 |
| 358,917 |
| |||||||||
Inventories, net |
| 271,476 |
| 203,631 |
| |||||||||
Deferred income taxes |
| 21,501 |
| 32,061 |
|
| 29,805 |
| 22,054 |
| ||||
Prepaids and other current assets |
|
| 51,154 |
|
| 60,347 |
|
|
| 46,107 |
|
| 43,613 |
|
Total current assets |
|
| 676,767 |
|
| 853,757 |
|
| $ | 1,066,582 |
| $ | 860,215 |
|
Property, plant and equipment, net |
| 381,068 |
| 415,159 |
|
| 391,502 |
| 365,892 |
| ||||
Goodwill |
| 169,027 |
| 134,162 |
|
| 171,741 |
| 165,315 |
| ||||
Intangible assets |
| 65,386 |
| 46,317 |
| |||||||||
Intangible assets, net |
| 53,496 |
| 58,292 |
| |||||||||
Other assets |
|
| 41,748 |
|
| 99,227 |
|
|
| 42,772 |
|
| 49,792 |
|
Total assets |
| $ | 1,333,996 |
| $ | 1,548,622 |
|
| $ | 1,726,093 |
| $ | 1,499,506 |
|
|
|
|
|
|
| |||||||||
Liabilities and shareholders’ equity |
|
|
|
|
|
|
|
|
|
| ||||
Current liabilities |
|
|
|
|
|
|
|
|
|
| ||||
Short-term borrowings |
| $ | 29,558 |
| $ | 139,404 |
|
| $ | 13,129 |
| $ | 50,000 |
|
Current maturities of long-term debt |
| 5,496 |
| 5,669 |
|
| 47,871 |
| 5,536 |
| ||||
Trade accounts payable |
| 123,063 |
| 200,967 |
|
| 215,918 |
| 165,907 |
| ||||
Accrued employee compensation and related taxes |
| 54,662 |
| 66,155 |
|
| 86,974 |
| 73,632 |
| ||||
Accrued liabilities |
| 39,624 |
| 56,296 |
|
| 64,008 |
| 40,546 |
| ||||
Other current liabilities |
|
| 47,681 |
|
| 48,216 |
|
|
| 68,344 |
|
| 53,635 |
|
Total current liabilities |
| 300,084 |
| 516,707 |
|
| 496,244 |
| 389,256 |
| ||||
Long-term debt |
| 253,674 |
| 176,475 |
|
| 205,748 |
| 256,192 |
| ||||
Deferred income taxes |
| 9,416 |
| 35,738 |
|
| 11,196 |
| 7,076 |
| ||||
Other long-term liabilities |
|
| 82,204 |
|
| 79,667 |
|
|
| 78,194 |
|
| 100,349 |
|
Total liabilities |
| 645,378 |
| 808,587 |
|
| 791,382 |
| 752,873 |
| ||||
Commitments and contingencies (Note K) |
|
|
|
|
| |||||||||
Commitments and contingencies (Note N) |
|
|
|
|
| |||||||||
Shareholders’ equity |
|
|
|
|
|
|
|
|
|
| ||||
Preferred stock, $1.00 par value, 1,000,000 shares authorized, none issued |
| — |
| — |
|
| — |
| — |
| ||||
Common stock, $5.00 par value, 120,000,000 shares authorized, 88,643,194 shares issued in 2009 and 2008 |
| 443,216 |
| 443,216 |
| |||||||||
Common stock, $5.00 par value, 120,000,000 shares authorized, 88,643,194 shares issued in 2011 and 2010 |
| 443,216 |
| 443,216 |
| |||||||||
Retained earnings |
| 615,817 |
| 522,476 |
|
| 925,542 |
| 744,247 |
| ||||
Stock compensation plans |
| 19,894 |
| 27,065 |
|
| 24,736 |
| 22,326 |
| ||||
Accumulated other comprehensive income (loss) |
| (9,677 | ) |
| 112,883 |
|
| 40,027 |
| (40,486 | ) | |||
Treasury stock-11,295,409 and 11,021,619 shares in 2009 and 2008, at cost |
|
| (380,632 | ) |
| (365,605 | ) | |||||||
Treasury stock, 13,245,864 and 12,222,381 shares in 2011 and 2010, at cost |
|
| (498,810 | ) |
| (422,670 | ) | |||||||
Total shareholders’ equity |
|
| 688,618 |
|
| 740,035 |
|
|
| 934,711 |
|
| 746,633 |
|
Total liabilities and shareholders’ equity |
| $ | 1,333,996 |
| $ | 1,548,622 |
|
| $ | 1,726,093 |
| $ | 1,499,506 |
|
The accompanying notes are an integral part of these Consolidated Financial Statements.
Consolidated Statements of Cash Flows
Donaldson Company, Inc. and Subsidiaries
|
|
|
|
|
|
|
|
|
|
|
|
|
|
|
|
|
|
|
|
|
|
| Year ended July 31, |
|
| Year ended July 31, |
| ||||||||||||||
|
| 2009 |
| 2008 |
| 2007 |
|
| 2011 |
| 2010 |
| 2009 |
| ||||||
|
| (thousands of dollars) |
|
| (thousands of dollars) |
| ||||||||||||||
Operating Activities |
|
|
|
|
|
|
|
|
|
|
|
|
|
| ||||||
Net earnings |
| $ | 131,907 |
| $ | 171,953 |
| $ | 150,717 |
|
| $ | 225,291 |
| $ | 166,163 |
| $ | 131,907 |
|
Adjustments to reconcile net earnings to net cash provided by operating activities |
|
|
|
|
|
|
|
|
|
|
|
|
|
| ||||||
Depreciation and amortization |
| 58,597 |
| 56,732 |
| 49,566 |
|
| 60,491 |
| 59,232 |
| 58,597 |
| ||||||
Equity in earnings of affiliates, net of distributions |
| (982 | ) |
| (1,558 | ) |
| (691 | ) | |||||||||||
Equity in losses (earnings) of affiliates, net of distributions |
| (2,585 | ) |
| 183 |
| (982 | ) | ||||||||||||
Deferred income taxes |
| (4,726 | ) |
| (1,205 | ) |
| (4,401 | ) |
| 1,957 |
| 3,025 |
| (4,726 | ) | ||||
Tax benefit of equity plans |
| (2,663 | ) |
| (9,178 | ) |
| (5,898 | ) |
| (9,873 | ) |
| (4,625 | ) |
| (2,663 | ) | ||
Stock compensation plan expense |
| 1,900 |
| 9,312 |
| 6,608 |
|
| 9,234 |
| 8,253 |
| 1,900 |
| ||||||
Other, net |
| (7 | ) |
| (2,528 | ) |
| (16,626 | ) |
| (11,991 | ) |
| (6,110 | ) |
| (7 | ) | ||
Changes in operating assets and liabilities, net of acquired businesses |
|
|
|
|
|
|
|
|
|
|
|
|
|
| ||||||
Accounts receivable |
| 116,983 |
| (29,779 | ) |
| (31,418 | ) |
| (62,274 | ) |
| (79,308 | ) |
| 116,983 |
| |||
Inventories |
| 66,145 |
| (49,400 | ) |
| (36,469 | ) |
| (52,999 | ) |
| (25,826 | ) |
| 66,145 |
| |||
Prepaids and other current assets |
| (11,489 | ) |
| (4,755 | ) |
| 658 |
|
| 7,233 |
| (3,970 | ) |
| (11,489 | ) | |||
Trade accounts payable and other accrued expenses |
|
| (78,738 | ) |
| 33,940 |
|
| 4,999 |
|
|
| 81,571 |
|
| 85,988 |
|
| (78,738 | ) |
Net cash provided by operating activities |
|
| 276,927 |
|
| 173,534 |
|
| 117,045 |
|
|
| 246,055 |
|
| 203,005 |
|
| 276,927 |
|
Investing Activities |
|
|
|
|
|
|
|
|
|
|
|
|
|
| ||||||
Purchases of property, plant and equipment |
| (46,080 | ) |
| (72,152 | ) |
| (77,440 | ) |
| (60,633 | ) |
| (43,149 | ) |
| (46,080 | ) | ||
Proceeds from sale of property, plant, and equipment |
| 511 |
| 1,330 |
| 857 |
| |||||||||||||
Acquisitions, investments, and divestitures of affiliates |
|
| (74,318 | ) |
| (2,377 | ) |
| (40,615 | ) | ||||||||||
Proceeds from sale of property, plant and equipment |
| 782 |
| 490 |
| 511 |
| |||||||||||||
Acquisitions, investments and divestitures of affiliates |
|
| 3,493 |
|
| (250 | ) |
| (74,318 | ) | ||||||||||
Net cash used in investing activities |
|
| (119,887 | ) |
| (73,199 | ) |
| (117,198 | ) |
|
| (56,358 | ) |
| (42,909 | ) |
| (119,887 | ) |
Financing Activities |
|
|
|
|
|
|
|
|
|
|
|
|
|
| ||||||
Proceeds from long-term debt |
| 80,471 |
| 50,297 |
| 64,903 |
|
| 6,774 |
| 531 |
| 80,471 |
| ||||||
Repayments of long-term debt |
| (7,745 | ) |
| (33,074 | ) |
| (9,507 | ) |
| (13,353 | ) |
| (5,508 | ) |
| (7,745 | ) | ||
Change in short-term borrowings |
| (103,695 | ) |
| 12,478 |
| 44,904 |
|
| (36,603 | ) |
| 20,713 |
| (103,695 | ) | ||||
Purchase of treasury stock |
| (32,773 | ) |
| (92,202 | ) |
| (76,898 | ) |
| (108,929 | ) |
| (66,696 | ) |
| (32,773 | ) | ||
Dividends paid |
| (35,166 | ) |
| (33,003 | ) |
| (28,806 | ) |
| (41,013 | ) |
| (36,242 | ) |
| (35,166 | ) | ||
Tax benefit of equity plans |
| 2,663 |
| 9,178 |
| 5,898 |
|
| 9,873 |
| 4,625 |
| 2,663 |
| ||||||
Exercise of stock options |
|
| 4,476 |
|
| 9,308 |
|
| 7,346 |
|
|
| 15,899 |
|
| 13,053 |
|
| 4,476 |
|
Net cash provided by (used in) financing activities |
|
| (91,769 | ) |
| (77,018 | ) |
| 7,840 |
| ||||||||||
Net cash used in financing activities |
|
| (167,352 | ) |
| (69,524 | ) |
| (91,769 | ) | ||||||||||
Effect of exchange rate changes on cash |
|
| (4,941 | ) |
| 4,803 |
|
| 2,083 |
|
|
| 19,149 |
|
| (2,259 | ) |
| (4,941 | ) |
Increase in cash and cash equivalents |
| 60,330 |
| 28,120 |
| 9,770 |
|
| 41,494 |
| 88,313 |
| 60,330 |
| ||||||
Cash and cash equivalents, beginning of year |
|
| 83,357 |
|
| 55,237 |
|
| 45,467 |
|
|
| 232,000 |
|
| 143,687 |
|
| 83,357 |
|
Cash and cash equivalents, end of year |
| $ | 143,687 |
| $ | 83,357 |
| $ | 55,237 |
|
| $ | 273,494 |
| $ | 232,000 |
| $ | 143,687 |
|
|
|
|
|
|
|
|
|
|
|
|
|
|
|
| ||||||
Supplemental Cash Flow Information |
|
|
|
|
|
|
|
|
|
|
|
|
|
| ||||||
Cash paid during the year for: |
|
|
|
|
|
|
|
|
|
|
|
|
|
| ||||||
Income taxes |
| $ | 41,196 |
| $ | 50,629 |
| $ | 59,179 |
|
| $ | 57,688 |
| $ | 40,032 |
| $ | 41,196 |
|
Interest |
| 14,861 |
| 14,589 |
| 12,630 |
|
| 12,852 |
| 11,446 |
| 14,861 |
| ||||||
The accompanying notes are an integral part of these Consolidated Financial Statements.
Consolidated Statements of Changes in Shareholders’ Equity
Donaldson Company, Inc. and Subsidiaries
|
|
|
|
|
|
|
|
|
|
|
|
|
|
|
|
|
|
|
|
|
|
|
|
|
|
|
|
|
|
|
|
|
|
|
|
|
|
|
|
|
|
|
|
|
|
| Common |
| Additional |
| Retained |
| Stock |
| Accumulated |
| Treasury |
| Total |
|
| Common |
| Additional |
| Retained |
| Stock |
| Accumulated Other |
| Treasury |
| Total |
| ||||||||||||||
|
| (thousands of dollars, except per share amounts) |
|
| (thousands of dollars, except per share amounts) |
| ||||||||||||||||||||||||||||||||||||||
Balance July 31, 2006 |
| $ | 443,216 |
| $ | — |
| $ | 275,598 |
| $ | 20,535 |
| $ | 51,194 |
| $ | (243,741 | ) | $ | 546,802 |
| ||||||||||||||||||||||
Balance July 31, 2008 |
| $ | 443,216 |
| $ | — |
| $ | 522,476 |
| $ | 27,065 |
| $ | 112,883 |
| $ | (365,605 | ) | $ | 740,035 |
| ||||||||||||||||||||||
Comprehensive income |
|
|
|
|
|
|
|
|
|
|
|
|
|
|
|
|
|
|
|
|
|
|
|
|
|
|
|
|
|
| ||||||||||||||
Net earnings |
|
|
|
|
| 150,717 |
|
|
|
|
|
|
| 150,717 |
|
|
|
|
|
| 131,907 |
|
|
|
|
|
|
| 131,907 |
| ||||||||||||||
Foreign currency translation |
|
|
|
|
|
|
|
|
| 28,615 |
|
|
| 28,615 |
|
|
|
|
|
|
|
|
|
| (63,385 | ) |
|
|
| (63,385 | ) | |||||||||||||
Additional minimum pension liability, net of tax |
|
|
|
|
|
|
|
|
| 312 |
|
|
| 312 |
| |||||||||||||||||||||||||||||
Pension liability adjustment, net of deferred taxes |
|
|
|
|
|
|
|
|
| (58,593 | ) |
|
|
| (58,593 | ) | ||||||||||||||||||||||||||||
Net loss on cash flow hedging derivatives |
|
|
|
|
|
|
|
|
| 118 |
|
|
|
| 118 |
|
|
|
|
|
|
|
|
|
| (582 | ) |
|
|
|
| (582 | ) | |||||||||||
Comprehensive income |
|
|
|
|
|
|
|
|
|
|
|
|
|
| 179,762 |
|
|
|
|
|
|
|
|
|
|
|
|
|
|
| 9,347 |
| ||||||||||||
Treasury stock acquired |
|
|
|
|
|
|
|
|
|
|
| (76,898 | ) |
| (76,898 | ) |
|
|
|
|
|
|
|
|
|
|
| (32,773 | ) |
| (32,773 | ) | ||||||||||||
Stock options exercised |
|
|
| (7,700 | ) |
| (9,499 | ) |
| 1,513 |
|
|
| 19,133 |
| 3,447 |
|
|
|
| (2,998 | ) |
| (6,151 | ) |
|
|
|
|
| 12,104 |
| 2,955 |
| ||||||||||
Deferred stock and other activity |
|
|
|
|
| (2,273 | ) |
| 541 |
|
|
| 3,276 |
| 1,544 |
|
|
|
| (529 | ) |
| (88 | ) |
| (4,344 | ) |
|
|
| 3,710 |
| (1,251 | ) | ||||||||||
Performance awards |
|
|
|
|
| (1,163 | ) |
| (1,768 | ) |
|
|
| 1,626 |
| (1,305 | ) |
|
|
| (266 | ) |
| (60 | ) |
| (2,827 | ) |
|
|
| 1,932 |
| (1,221 | ) | |||||||||
Stock option expense |
|
|
|
|
| 3,422 |
|
|
|
|
|
|
| 3,422 |
|
|
|
|
|
| 4,143 |
|
|
|
|
|
|
| 4,143 |
| ||||||||||||||
Tax reduction — employee plans |
|
|
| 7,700 |
|
|
|
|
|
|
|
|
| 7,700 |
| |||||||||||||||||||||||||||||
Adjustment to adopt SFAS 158, net of tax |
|
|
|
|
|
|
|
|
| (10,231 | ) |
|
|
| (10,231 | ) | ||||||||||||||||||||||||||||
Dividends ($.370 per share) |
|
|
|
|
|
|
|
| (29,545 | ) |
|
|
|
|
|
|
|
|
|
| (29,545 | ) | ||||||||||||||||||||||
Balance July 31, 2007 |
|
| 443,216 |
|
| — |
|
| 387,257 |
|
| 20,821 |
|
| 70,008 |
|
| (296,604 | ) |
| 624,698 |
| ||||||||||||||||||||||
Tax reduction - employee plans |
|
|
| 3,793 |
|
|
|
|
|
|
|
|
| 3,793 |
| |||||||||||||||||||||||||||||
Adjustment to adopt retirement benefit compensation guidance, net of tax |
|
|
|
|
| (887 | ) |
|
|
|
|
|
|
| (887 | ) | ||||||||||||||||||||||||||||
Dividends ($0.460 per share) |
|
|
|
|
|
|
|
| (35,523 | ) |
|
|
|
|
|
|
|
|
|
| (35,523 | ) | ||||||||||||||||||||||
Balance July 31, 2009 |
|
| 443,216 |
|
| — |
|
| 615,817 |
|
| 19,894 |
|
| (9,677 | ) |
| (380,632 | ) |
| 688,618 |
| ||||||||||||||||||||||
Comprehensive income |
|
|
|
|
|
|
|
|
|
|
|
|
|
|
|
|
|
|
|
|
|
|
|
|
|
|
|
|
|
| ||||||||||||||
Net earnings |
|
|
|
|
| 171,953 |
|
|
|
|
|
|
| 171,953 |
|
|
|
|
|
| 166,163 |
|
|
|
|
|
|
| 166,163 |
| ||||||||||||||
Foreign currency translation |
|
|
|
|
|
|
|
|
| 57,151 |
|
|
| 57,151 |
|
|
|
|
|
|
|
|
|
| (15,961 | ) |
|
|
| (15,961 | ) | |||||||||||||
Additional minimum pension liability, net of tax |
|
|
|
|
|
|
|
|
| (14,671 | ) |
|
|
| (14,671 | ) | ||||||||||||||||||||||||||||
Pension liability adjustment, net of deferred taxes |
|
|
|
|
|
|
|
|
| (14,780 | ) |
|
|
| (14,780 | ) | ||||||||||||||||||||||||||||
Net loss on cash flow hedging derivatives |
|
|
|
|
|
|
|
|
| (68 | ) |
|
|
|
| (68 | ) | |||||||||||||||||||||||||||
Comprehensive income |
|
|
|
|
|
|
|
|
|
|
|
|
|
| 135,354 |
| ||||||||||||||||||||||||||||
Treasury stock acquired |
|
|
|
|
|
|
|
|
|
|
| (66,696 | ) |
| (66,696 | ) | ||||||||||||||||||||||||||||
Stock options exercised |
|
|
| (5,608 | ) |
| (7,678 | ) |
| 2,676 |
|
|
| 22,951 |
| 12,341 |
| |||||||||||||||||||||||||||
Deferred stock and other activity |
|
|
| (704 | ) |
| (30 | ) |
| (244 | ) |
|
|
| 1,707 |
| 729 |
| ||||||||||||||||||||||||||
Performance awards |
|
|
| 7 |
| (7 | ) |
|
|
|
|
|
|
| — |
| ||||||||||||||||||||||||||||
Stock option expense |
|
|
|
|
| 6,891 |
|
|
|
|
|
|
| 6,891 |
| |||||||||||||||||||||||||||||
Tax reduction - employee plans |
|
|
| 6,305 |
|
|
|
|
|
|
|
|
| 6,305 |
| |||||||||||||||||||||||||||||
Dividends ($0.480 per share) |
|
|
|
|
|
|
|
| (36,909 | ) |
|
|
|
|
|
|
|
|
|
| (36,909 | ) | ||||||||||||||||||||||
Balance July 31, 2010 |
|
| 443,216 |
|
| — |
|
| 744,247 |
|
| 22,326 |
|
| (40,486 | ) |
| (422,670 | ) |
| 746,633 |
| ||||||||||||||||||||||
Comprehensive income |
|
|
|
|
|
|
|
|
|
|
|
|
|
|
| |||||||||||||||||||||||||||||
Net earnings |
|
|
|
|
| 225,291 |
|
|
|
|
|
|
| 225,291 |
| |||||||||||||||||||||||||||||
Foreign currency translation |
|
|
|
|
|
|
|
|
| 72,505 |
|
|
| 72,505 |
| |||||||||||||||||||||||||||||
Pension liability adjustment, net of deferred taxes |
|
|
|
|
|
|
|
|
| 7,166 |
|
|
| 7,166 |
| |||||||||||||||||||||||||||||
Net gain on cash flow hedging derivatives |
|
|
|
|
|
|
|
|
| 395 |
|
|
|
| 395 |
|
|
|
|
|
|
|
|
|
| 842 |
|
|
|
| 842 |
| ||||||||||||
Comprehensive income |
|
|
|
|
|
|
|
|
|
|
|
|
|
| 214,828 |
|
|
|
|
|
|
|
|
|
|
|
|
|
|
| 305,804 |
| ||||||||||||
Treasury stock acquired |
|
|
|
|
|
|
|
|
|
|
| (92,202 | ) |
| (92,202 | ) |
|
|
|
|
|
|
|
|
|
|
| (108,929 | ) |
| (108,929 | ) | ||||||||||||
Stock options exercised |
|
|
| (7,827 | ) |
| (9,810 | ) |
| 4,223 |
|
|
| 20,883 |
| 7,469 |
|
|
|
| (10,792 | ) |
| (7,854 | ) |
| 1,862 |
|
|
| 30,604 |
| 13,820 |
| ||||||||||
Deferred stock and other activity |
|
|
| (2,981 | ) |
| 2,564 |
| 3,474 |
|
|
| 1,363 |
| 4,420 |
|
|
|
| (1,418 | ) |
| 174 |
| 548 |
|
|
| 2,185 |
| 1,489 |
| ||||||||||||
Performance awards |
|
|
| (675 | ) |
| 279 |
| (1,453 | ) |
|
|
| 955 |
| (894 | ) |
|
|
| (7 | ) |
| 7 |
|
|
|
|
|
|
| — |
| |||||||||||
Stock option expense |
|
|
|
|
| 4,214 |
|
|
|
|
|
|
| 4,214 |
|
|
|
|
|
| 6,462 |
|
|
|
|
|
|
| 6,462 |
| ||||||||||||||
Tax reduction — employee plans |
|
|
| 11,483 |
|
|
|
|
|
|
|
|
| 11,483 |
| |||||||||||||||||||||||||||||
Adjustment to adopt FIN 48 |
|
|
|
|
| (336 | ) |
|
|
|
|
| (336 | ) | ||||||||||||||||||||||||||||||
Dividends ($.430 per share) |
|
|
|
|
|
|
|
| (33,645 | ) |
|
|
|
|
|
|
|
|
| (33,645 | ) | |||||||||||||||||||||||
Balance July 31, 2008 |
|
| 443,216 |
|
| — |
|
| 522,476 |
|
| 27,065 |
|
| 112,883 |
|
| (365,605 | ) |
| 740,035 |
| ||||||||||||||||||||||
Comprehensive income |
|
|
|
|
|
|
|
|
|
|
|
|
|
|
| |||||||||||||||||||||||||||||
Net earnings |
|
|
|
|
| 131,907 |
|
|
|
|
| 131,907 |
| |||||||||||||||||||||||||||||||
Foreign currency translation |
|
|
|
|
|
|
|
|
| (63,385 | ) |
|
|
| (63,385 | ) | ||||||||||||||||||||||||||||
Pension liability adjustment, net of tax |
|
|
|
|
|
|
|
|
| (58,593 | ) |
|
|
| (58,593 | ) | ||||||||||||||||||||||||||||
Net gain on cash flow hedging derivatives |
|
|
|
|
|
|
|
|
| (582 | ) |
|
|
|
| (582 | ) | |||||||||||||||||||||||||||
Comprehensive income |
|
|
|
|
|
|
|
|
|
|
|
|
|
| 9,347 |
| ||||||||||||||||||||||||||||
Treasury stock acquired |
|
|
|
|
|
|
|
|
|
|
| (32,773 | ) |
| (32,773 | ) | ||||||||||||||||||||||||||||
Stock options exercised |
|
|
| (2,998 | ) |
| (6,151 | ) |
|
|
|
|
| 12,104 |
| 2,955 |
| |||||||||||||||||||||||||||
Deferred stock and other activity |
|
|
| (529 | ) |
| (88 | ) |
| (4,344 | ) |
|
|
| 3,710 |
| (1,251 | ) | ||||||||||||||||||||||||||
Performance awards |
|
|
| (266 | ) |
| (60 | ) |
| (2,827 | ) |
|
|
| 1,932 |
| (1,221 | ) | ||||||||||||||||||||||||||
Stock option expense |
|
|
|
|
| 4,143 |
|
|
|
|
|
|
| 4,143 |
| |||||||||||||||||||||||||||||
Tax reduction — employee plans |
|
|
| 3,793 |
|
|
|
|
|
|
|
|
| 3,793 |
| |||||||||||||||||||||||||||||
Adjustment to adopt FAS 158 measurement date provision, net of tax |
|
|
|
|
| (887 | ) |
|
|
|
|
|
|
| (887 | ) | ||||||||||||||||||||||||||||
Dividends ($.460 per share) |
|
|
|
|
|
|
|
| (35,523 | ) |
|
|
|
|
|
|
|
|
|
| (35,523 | ) | ||||||||||||||||||||||
Balance July 31, 2009 |
| $ | 443,216 |
| $ | — |
| $ | 615,817 |
| $ | 19,894 |
| $ | (9,677 | ) | $ | (380,632 | ) | $ | 688,618 |
| ||||||||||||||||||||||
Tax reduction - employee plans |
|
|
| 12,217 |
|
|
|
|
|
|
|
|
| 12,217 |
| |||||||||||||||||||||||||||||
Dividends ($0.560 per share) |
|
|
|
|
|
|
|
| (42,785 | ) |
|
|
|
|
|
|
|
|
|
| (42,785 | ) | ||||||||||||||||||||||
Balance July 31, 2011 |
| $ | 443,216 |
| $ | — |
| $ | 925,542 |
| $ | 24,736 |
| $ | 40,027 |
| $ | (498,810 | ) | $ | 934,711 |
| ||||||||||||||||||||||
The accompanying notes are an integral part of these Consolidated Financial Statements.
NOTES TO CONSOLIDATED FINANCIAL STATEMENTS
Donaldson Company, Inc. and Subsidiaries
NOTE A
Summary of Significant Accounting Policies
Description of BusinessDonaldson Company, Inc. (“Donaldson” or the “Company”), is a leading worldwide providermanufacturer of filtration systems and replacement parts. The Company’s product mix includes air and liquid filtration systems and exhaust and emission control products. Products are manufactured at 4039 plants around the world and through three joint ventures. Products are sold to original equipment manufacturers (“OEM”OEMs”), distributors, and dealers, and directly to end users.end-users.
Principles of ConsolidationThe Consolidated Financial Statements include the accounts of Donaldson Company, Inc. and all majority-owned subsidiaries. All intercompany accounts and transactions have been eliminated. The Company’s three joint ventures that are not majority-owned are accounted for under the equity method. The Company does not have any variable interests in variable interest entities as of July 31, 2009.2011. The companyCompany uses a fiscal period which ends on a calendar basis for international affiliates and on the Friday nearest to July 31 for U.S. purposes. Fiscal 2007 results included 53 weeks of U.S. sales and earnings.
Use of EstimatesThe preparation of Financial Statements in conformity with accounting principles generally accepted in the United States of AmericaU.S. GAAP requires management to make estimates and assumptions that affect the amounts reported in the financial statements and accompanying notes. Actual results could differ from those estimates.
Foreign Currency TranslationFor foreign operations, local currencies are considered the functional currency. Assets and liabilities are translated to U.S. dollars at year-end exchange rates and the resulting gains and losses arising from the translation of net assets located outside the United States are recorded as a cumulative translation adjustment, a component of Accumulated other comprehensive income (loss) in the Consolidated Balance Sheets. Elements of the Consolidated Statements of Earnings are translated at average exchange rates in effect during the year. Realized and unrealized foreign currency transaction gains and losses are included in Other income, net in the Consolidated Statements of Earnings. Foreign currency transaction losses of $0.2$4.5 million, $3.1$4.6 million, and $0.2 million are included in otherOther income, net in the Consolidated Statements of Earnings in Fiscal 2009, 2008,2011, 2010, and 2007,2009, respectively.
Cash EquivalentsThe Company considers all highly liquid temporary investments with a maturity of three months or less when purchased to be cash equivalents. Cash equivalents are carried at cost that approximates market value.
Short-Term Investments Classification of the Company’s investments as current or non-current is dependent upon management’s intended holding period, the investment’s maturity date and liquidity considerations based on market conditions. If management intends to hold the investments for longer than one year as of the balance sheet date, they are classified as non-current. The Company does not have any short-term investments as of July 31, 2011.
Accounts Receivable and Allowance for Doubtful AccountsTrade accounts receivable are recorded at the invoiced amount and do not bear interest. The allowance for doubtful accounts is the Company’s best estimate of the amount of probable credit losses in its existing accounts receivable. The Company determines the allowance based on historical write-off experience in the industry, regional economic data, and evaluation of specific Customer accounts for risk of loss. The Company reviews its allowance for doubtful accounts monthly. Past due balances over 90 days and over a specified amount are reviewed individually for collectibility.collectability. All other balances are reviewed on a pooled basis by type of receivable. Account balances are charged off against the allowance when the Company feels it is probable the receivable will not be recovered. The Company does not have any off-balance-sheet credit exposure related to its Customers.
InventoriesInventories are stated at the lower of cost or market. U.S. inventories are valued using the last-in, first-out (“LIFO”) method, while the international subsidiaries use the first-in, first-out (“FIFO”) method. Inventories valued at LIFO were approximately 33 percent and 3531 percent of total inventories at July 31, 20092011 and 2008,2010, respectively. For inventories valued under the LIFO method, the FIFO cost exceeded the LIFO carrying values by $34.0$37.1 million and $37.7$32.7 million at July 31, 20092011 and 2008,2010, respectively. Results of
operations for all periods presented were not materially affected by the liquidation of LIFO inventory. As of July 31, 2011 and 2010, the Company had obsolete inventory reserves of $14.5 million and $14.9 million, respectively. The components of inventory are as follows (thousands of dollars):
|
|
|
|
|
|
|
| |||||||
|
|
|
|
|
|
|
|
| At July 31, |
| ||||
|
| July 31, |
| July 31, |
|
| 2011 |
| 2010 |
| ||||
Materials |
| $ | 71,518 |
| $ | 110,135 |
|
| $ | 110,466 |
| $ | 79,371 |
|
Work in process |
| 20,022 |
| 23,728 |
|
| 33,917 |
| 23,163 |
| ||||
Finished products |
|
| 88,698 |
|
| 130,266 |
|
|
| 127,093 |
|
| 101,097 |
|
Total inventories |
| $ | 180,238 |
| $ | 264,129 |
| $ | 271,476 |
| $ | 203,631 |
| |
Property, Plant and EquipmentProperty, plant and equipment are stated at cost. Additions, improvements, or major renewals are capitalized, while expenditures that do not enhance or extend the asset’s useful life are charged to operating expense as incurred. Depreciation is computed under the straight-line method. Depreciation expense was $54.5 million in Fiscal 2011, $53.2 million in Fiscal 2010, and $52.9 million in Fiscal 2009, $52.4 million in Fiscal 2008, and $46.6 million in Fiscal 2007.2009. The estimated useful lives of property, plant, and equipment are 10 to 40 years for buildings, including building improvements, and 3 to 10 years for machinery and equipment. The components of property, plant, and equipment are as follows (thousands of dollars):
|
|
|
|
|
|
|
| |||||||
|
|
|
|
|
|
|
|
| At July 31, |
| ||||
|
| July 31, |
| July 31, |
|
| 2011 |
| 2010 |
| ||||
Land |
| $ | 21,793 |
| $ | 21,561 |
|
| $ | 22,578 |
| $ | 21,771 |
|
Buildings |
| 242,049 |
| 235,615 |
|
| 266,482 |
| 240,787 |
| ||||
Machinery and equipment |
| 600,198 |
| 586,937 |
|
| 625,439 |
| 587,977 |
| ||||
Construction in progress |
|
| 18,507 |
| 57,633 |
|
| 31,375 |
|
| 26,223 |
| ||
Less accumulated depreciation |
|
| (501,479 | ) |
| (486,587 | ) |
|
| (554,372 | ) |
| (510,866 | ) |
Total property, plant and equipment, net |
| $ | 381,068 | $ | 415,159 |
| $ | 391,502 |
| $ | 365,892 |
| ||
Internal-Use SoftwareThe Company capitalizes direct costs of materials and services used in the development and purchase of internal-use software. Amounts capitalized are amortized on a straight-line basis over a period of five years and are reported as a component of machinery and equipment within property, plant, and equipment.
Goodwill and Other Intangible AssetsGoodwill represents the excess of the purchase price over the fair value of net assets acquired in business combinations under the purchase method of accounting. Other intangible assets, consisting primarily of patents, trademarks, and Customer relationships and lists, are recorded at cost and are amortized on a straight-line basis over their estimated useful lives of 3 to 20 years. Goodwill is assessed for impairment annually or if an event occurs or circumstances change that would indicate the carrying amount may be impaired. The impairment assessment for goodwill is done at a reporting unit level. Reporting units are one level below the business segment level, but can be combined when reporting units within the same segment have similar economic characteristics. An impairment loss generally would be recognized when the carrying amount of the reporting unit’s net assets exceeds the estimated fair value of the reporting unit. The Company completed its annual impairment assessment in the third quarters of Fiscal 20092011 and 2008,2010, which indicated no impairment.
Recoverability of Long-Lived AssetsThe Company reviews its long-lived assets, including identifiable intangibles, for impairment when events or changes in circumstances indicate that the carrying amount of an asset may not be recoverable. If impairment indicators are present and the estimated future undiscounted cash flows are less than the carrying value of the assets, the carrying value is reduced.
Income TaxesThe provision for income taxes is computed based on the pretax income included in the Consolidated Statements of Earnings. Deferred tax assets and liabilities are recognized for the expected future tax consequences attributed to differences between the financial statement carrying amounts of existing assets and liabilities and their respective tax basis. Deferred tax assets and liabilities are measured using the enacted tax rates expected to apply to taxable income in the years in which those temporary differences are expected to reverse.
Valuation allowances are recorded to reduce deferred tax assets when it is more likely than not that a tax benefit will not be realized.
Comprehensive Income (Loss)Comprehensive income (loss) consists of net income, foreign currency translation adjustments, net changes in the funded status of pension retirement obligations, and net gain or loss on cash flow hedging derivatives, and is presented in the Consolidated Statements of Changes in Shareholders’ Equity. The components of the ending balances of accumulatedAccumulated other comprehensive income (loss) are as follows (thousands of dollars):
|
|
|
|
|
|
|
|
|
|
| ||||||||||
|
|
|
|
|
|
|
|
|
|
|
| At July 31, |
| |||||||
|
| July 31, |
| July 31, |
| July 31, |
|
| 2011 |
| 2010 |
| 2009 |
| ||||||
Foreign currency translation adjustment |
| $ | 75,155 |
| $ | 138,540 |
| $ | 81,389 |
|
| $ | 131,699 |
| $ | 59,194 |
| $ | 75,155 |
|
Net gain (loss) on cash flow hedging derivatives, net of deferred taxes |
| (394 | ) |
| 188 |
| (207 | ) |
| 380 |
| (462 | ) |
| (394 | ) | ||||
Pension liability adjustment, net of deferred taxes |
|
| (84,438 | ) |
| (25,845 | ) |
| (11,174 | ) |
|
| (92,052 | ) |
| (99,218 | ) |
| (84,438 | ) |
Total accumulated other comprehensive income (loss) |
| $ | (9,677 | ) | $ | 112,883 |
| $ | 70,008 |
|
| $ | 40,027 |
| $ | (40,486 | ) | $ | (9,677 | ) |
Cumulative foreign translation is not adjusted for income taxes. All translation relates to permanent investments in non-U.S. subsidiaries.
Earnings Per ShareThe Company’s basic net earnings per share isare computed by dividing net earnings by the weighted average number of outstanding common shares. The Company’s diluted net earnings per share is computed by dividing net earnings by the weighted average number of outstanding common shares and dilutivecommon equivalent shares relating to stock options restricted stock and stock incentive plans. Certain outstanding options were excluded from the diluted net earnings per share calculations because their exercise prices were greater than the average market price of the Company’s common stock during those periods. There were 1,158,451494,349 options, 245,344845,827 options, and 10,0001,158,451 options excluded from the diluted net earnings per share calculation for the fiscal year ended July 31, 2011, 2010, and 2009, 2008, and 2007, respectively.
The following table presents information necessary to calculate basic and diluted earnings per share:
|
|
|
|
|
|
|
|
|
|
|
|
| 2009 |
| 2008 |
| 2007 |
| |||
|
| (thousands of dollars, |
| |||||||
Weighted average shares — basic |
|
| 77,879 |
|
| 79,208 |
|
| 80,455 |
|
Dilutive shares |
|
| 1,293 |
|
| 2,003 |
|
| 1,981 |
|
Weighted average shares — diluted |
|
| 79,172 |
|
| 81,211 |
|
| 82,436 |
|
Net earnings for basic and diluted earnings per share computation |
| $ | 131,907 |
| $ | 171,953 |
| $ | 150,717 |
|
Net earnings per share — basic |
| $ | 1.69 |
| $ | 2.17 |
| $ | 1.87 |
|
Net earnings per share — diluted |
| $ | 1.67 |
| $ | 2.12 |
| $ | 1.83 |
|
|
|
|
|
|
|
|
|
|
|
|
|
| 2011 |
| 2010 |
| 2009 |
| |||
|
| (thousands of dollars, except per share amounts) |
| |||||||
Weighted average shares - basic |
|
| 77,196 |
|
| 77,849 |
|
| 77,967 |
|
Diluted share equivalents |
|
| 1,402 |
|
| 1,329 |
|
| 1,233 |
|
Weighted average shares - diluted |
|
| 78,598 |
|
| 79,178 |
|
| 79,200 |
|
Net earnings for basic and diluted earnings per share computation |
| $ | 225,291 |
| $ | 166,163 |
| $ | 131,907 |
|
Net earnings per share - basic |
| $ | 2.92 |
| $ | 2.13 |
| $ | 1.69 |
|
Net earnings per share - diluted |
| $ | 2.87 |
| $ | 2.10 |
| $ | 1.67 |
|
Treasury StockRepurchased common stock is stated at cost and is presented as a separate reduction of shareholders’ equity.
Research and DevelopmentResearch and development costs are charged against earnings in the year incurred. Research and development expenses include basic scientific research and the application of scientific advances to the development of new and improved products and their uses.
Stock-Based CompensationThe Company offers stock-based employee compensation plans, which are more fully described in Note H.I. Stock-based employee compensation cost is recognized using the fair-value based method for all new awards granted after August 1, 2005. Compensation costs for unvested stock options and awards that were outstanding at August 1, 2005, are recognized over the requisite service period based on the grant-date fair value of those options and awards as previously calculated under the pro-forma disclosures.method.
Revenue RecognitionRevenue is recognized when both product ownership and the risk of loss have transferred to the Customer and the Company has no remaining obligations. The Company records estimated discounts and rebates as a reduction of sales in the same period revenue is recognized. Shipping and handling costs for Fiscal 2011, 2010, and 2009 2008 and 2007 totaling $50.4$61.9 million, $53.0$49.8 million, and $34.8$50.4 million, respectively, are classified as a component of operating expenses.
Product WarrantiesThe Company provides for estimated warranty costs at the time of sale and accrues for specific items at the time their existence is known and the amounts are determinable. The Company estimates warranty costs using standard quantitative measures based on historical warranty claim experience and evaluation of specific Customer warranty issues. For a warranty reserve reconciliation see Note M.
Derivative Instruments and Hedging ActivitiesThe Company recognizes all derivatives on the balance sheet at fair value. Derivatives that are not hedges are adjusted to fair value through income. If the derivative is a hedge, depending on the nature of the hedge, changes in the fair value of derivatives are either offset against the change in fair value of the hedged assets, liabilities or firm commitments through earnings or recognized in shareholders’ equity through other comprehensive income until the hedged item is recognized. Gains or losses related to the ineffective portion of any hedge are recognized through earnings in the current period.
Exit or Disposal ActivitiesThe Company accounts for costs relating to exit or disposal activities under SFAS No. 146,Accounting for Costs Associated with Exitbased on FASB guidance related to exit or Disposal Activities. SFAS No. 146disposal cost obligations. This guidance addresses recognition, measurement, and reporting of costs associated with exit and disposal activities including restructuring. See Note LO for disclosures related to restructuring.
GuaranteesUpon issuance of a guarantee, the Company recognizes a liability for the fair value of an obligation assumed under a guarantee. See Note KL for disclosures related to guarantees.
New Accounting StandardsIn May 2009, the Financial Accounting Standards Board (FASB) issued FAS No. 165, Subsequent Events (FAS 165), which establishes general standards of accounting and disclosure for events that occur after the balance sheet date but before the financial statements are issued. This new standard was effective for interim or annual financial periods ending after June 15, 2009, and did not have an impact on our consolidated financial position or results of operations.
In April 2009,December 2010, the FASB issued FSP No. FAS 107-1 and APB 28-1,Interim Disclosures about Fair Valueupdated the accounting guidance relating to the annual goodwill impairment test. The updated guidance requires companies to perform the second step of Financial Instruments, (FSP No. FAS-107-1 and APB-28-1), which amends FAS 107,Disclosures about Fair Valuethe impairment test to measure the amount of Financial Instrumentsand Accounting Principles Board (APB) Opinion No. 28,Interim Financial Reporting, to require disclosures about fair valueimpairment loss, if any, when it is more likely than not that goodwill impairment exists when the carrying amount of financial instruments for interim periods. This FSP will bea reporting unit is zero or negative. In considering whether it is more likely than not that goodwill impairment exists, an entity shall evaluate whether there are adverse qualitative factors. The updated guidance is effective for the Company for the quarter ended October 31, 2009, and will expand the Company’s disclosures regarding the use of fair value in interim periods.
In December 2008, the FASB issued FSP No. FAS 132(R)-1,Employers’ Disclosures about Postretirement Benefit Plan Assets(FSP No. FAS 132(R)), which provides guidance on an employer’s disclosures about plan assets of a defined benefit pension or other postretirement plan. This FSP is effective for fiscal years ending after December 15, 2009. The Company is currently evaluating the impact of adopting FSP No. FAS 132(R) on our defined benefit pension and other postretirement plan note disclosures.
In September 2006, the FASB issued SFAS No. 158,Employers’ Accounting for Defined Benefit Pension and Other Postretirement Plans, an amendment of FASB Statements No. 87, 88, 106, and 132(R)(SFAS 158). The portion of the statement that requires recognition of the overfunded or underfunded status of defined benefit postretirement plans as an asset or liabilitybeginning in the statementfirst quarter of financial position was adopted in Fiscal 2007 with minimal impact. SFAS 158 also requires measurement of the funded status of a plan as of the date of the statement of financial position. That provision required the Company to change its measurement date from April 30 to July 31 in Fiscal 2009. The adoption of the measurement date provision resulted in an after-tax decrease to Retained earnings of $0.9 million, a decrease to Other assets of $0.5 million increase to Other long-term liabilities of $0.8 million and an increase to Deferred income taxes of $0.5 million.
In September 2006, the FASB issued SFAS No. 157,Fair Value Measurements(SFAS 157). This statement defines fair value, establishes a framework for measuring fair value in U.S. generally accepted accounting principles and expands disclosures about fair value measurements. SFAS 157 applies whenever another standard requires (or permits) assets or liabilities to be measured at fair value, except for the measurement of share-based payments. SFAS 157 does not expand the use of fair value to any new circumstances, and was effective for the majority of the Company’s assets and liabilities for its Fiscal 2009fiscal year beginning August 1, 2008.2012. The adoption of this portion of SFAS 157 in Fiscal 2009 did not have a
material impact on the Company’s financial statements. On February 12, 2008, the FASB issued FASB Staff Position (FSP) FAS 157-2,Effective Date of FASB Statement No. 157(FSP FAS 157-2). FSP FAS 157-2 delays by one year the effective date of SFAS 157 for certain non-financial assets and non-financial liabilities. The Companyguidance is currently evaluating the impact the FSP FAS 157-2 will have on the determination of fair value related to non-financial assets and non-financial liabilities in Fiscal 2010. The adoption of FSP FAS 157-2 is not expected to have a material impact on the Company’s financial statements.
In February 2007, the FASB issued SFAS No. 159,The Fair Value Option for Financial Assets and Financial Liabilities(“SFAS 159”). SFAS 159 permits entities to choose to measure many financial instruments and certain other items at fair value that are not currently required to be measured at fair value. SFAS 159 is effective for fiscal years beginning after November 15, 2007, and was effective for the Company with its 2009 fiscal year, beginning August 1, 2008. The adoption of SFAS 159 did not have a material impact on the Company’s financial statements.
In December 2007, the FASB issued SFAS No. 141(R),Business Combinations(SFAS 141(R)), which changes the accounting for business combinations and their effects on the financial statements. SFAS 141(R) will be effective for the Company at the beginning of Fiscal 2010. In February 2009, the FASB issued FASB Staff Position 141(R)-a,Accounting for Assets Acquired and Liabilities Assumed in a Business Combination That Arise from Contingencies(FSP FAS 141(R)-a), which will amend certain provisions of SFAS 141(R). The adoptions of SFAS 141(R) and FSP FAS 141(R)-a are not expected to have a material impact on the Company’s consolidated financial statements.
In March 2008,May 2011, the FASB issued SFAS No. 161,Disclosuresupdated the accounting guidance related to fair value measurements. The updated guidance results in a consistent definition of fair value and common requirements for measurement of and disclosure about Derivative Instrumentsfair value between U.S. GAAP and Hedging Activities, an amendmentInternational Financial Reporting Standards (IFRS). The updated guidance is effective for the Company beginning in the third quarter of FASB Statement No. 133(SFAS 161). SFAS 161 requires enhanced disclosures about an entity’s derivative and hedging activities, including (a) how and why an entity uses derivative instruments, (b) how derivative instruments and related hedged items are accounted for under SFAS No. 133,Accounting for Derivative Instruments and Hedging Activities, and (c) how derivative instruments and related hedged items affect an entity’s financial position, financial performance and cash flows.fiscal year 2012. The Company adoptedis currently evaluating the provisionsimpact of SFAS 161 effective February 1, 2009. The adoption of SFAS 161 onlythis accounting guidance on its consolidated financial statements.
In June 2011, the FASB updated the disclosure requirements for comprehensive income. The updated guidance requires additional disclosures aboutcompanies to disclose the Company’s derivativestotal of comprehensive income, the components of net income, and thus didthe components of other comprehensive income either in a single continuous statement of comprehensive income or in two separate but consecutive statements. The updated guidance does not affect how earnings per share is calculated or presented. The updated guidance is effective for the Company’sCompany beginning in the third quarter of fiscal year 2012. The Company is currently evaluating the impact of adoption of this accounting guidance on its consolidated financial statements.
NOTE B
Goodwill and Other Intangible Assets
The Company has allocated goodwill to its Industrial Products and Engine Products segments. AdditionsAs of August 1, 2010, as a result of an internal reorganization, the Company transferred Industrial Hydraulics, a component of its Industrial Filtration Solutions Products within the Industrial Products segment to goodwill and other intangible assets in Fiscal 2009 relate to the acquisition of 100 percent of the stock of Western Filter Corporation on October 15, 2008, for $78.5 million, as part ofAftermarket Products within the Engine Products segment. The weighted average life ofsegment, along with the intangibles acquired in this acquisition is 17.6 years and consists primarily of customer related intangibles. Goodwillgoodwill associated with this acquisition is tax deductible. Dispositionscomponent. Disposition of goodwill and other intangible assets induring Fiscal 2009 relate2011 relates to the sale of the air dryerCompany’s Ultracool chiller business, based in Maryville, Tennessee, on October 31, 2008,Terrassa, Spain, for $4.6$3.6 million, which resulted in a lossgain on sale of $0.6 million. This air dryer$0.4 million in the second quarter. The Ultracool chiller business manufactured industrial circulation chillers and was part of the Company’s Industrial Products segment. Additions to goodwill and other intangible assets inThere was no acquisition or disposition activity during Fiscal 2008 relate to the acquisition of LMC West, Inc. on February 4, 2008, as part of the Industrial Products segment. Financial results for each of the above acquisitions are included in the Company’s consolidated results from the date of acquisition. Pro forma financial results are not presented as the acquisitions are not material, individually or in the aggregate.2010. The Company completed its annual impairment assessmentassessments in the third quarterquarters of Fiscal 20092011 and 2008,2010. The results of this assessment showed that the fair values of the reporting units to which indicatedgoodwill is assigned continue to exceed the book values of the respective reporting units, resulting in no goodwill impairment.
Following is a reconciliation of goodwill for the years ended July 31, 20092011 and 2008:2010:
|
|
|
|
|
|
|
|
|
|
|
|
|
|
|
|
|
|
|
|
|
|
| Engine |
| Industrial |
| Total |
|
| Engine |
| Industrial |
| Total Goodwill |
| ||||||
|
| (thousands of dollars) |
|
| (thousands of dollars) |
| ||||||||||||||
Balance as of July 31, 2007 |
| $ | 17,912 |
| $ | 106,695 |
| $ | 124,607 |
| ||||||||||
Acquisition activity |
| — |
| 625 |
| 625 |
| |||||||||||||
Balance as of July 31, 2009 |
| $ | 61,582 |
| $ | 107,445 |
| $ | 169,027 |
| ||||||||||
Foreign exchange translation |
|
| 1,214 |
|
| 7,716 |
|
| 8,930 |
|
|
| (668 | ) |
| (3,044 | ) |
| (3,712 | ) |
Balance as of July 31, 2008 |
| $ | 19,126 |
| $ | 115,036 |
| $ | 134,162 |
| ||||||||||
Acquisition activity |
| 43,646 |
| — |
| 43,646 |
| |||||||||||||
Balance as of July 31, 2010 |
| $ | 60,914 |
| $ | 104,401 |
| $ | 165,315 |
| ||||||||||
Goodwill transferred |
| 11,258 |
| (11,258 | ) |
| — |
| ||||||||||||
Disposition activity |
| — |
| (1,089 | ) |
| (1,089 | ) |
| — |
| (325 | ) |
| (325 | ) | ||||
Foreign exchange translation |
|
| (1,190 | ) |
| (6,502 | ) |
| (7,692 | ) |
|
| 794 |
|
| 5,957 |
|
| 6,751 |
|
Balance as of July 31, 2009 |
| $ | 61,582 |
| $ | 107,445 |
| $ | 169,027 |
| ||||||||||
Balance as of July 31, 2011 |
| $ | 72,966 |
| $ | 98,775 |
| $ | 171,741 |
| ||||||||||
Intangible assets are comprised of patents, trademarks, and Customer relationships and lists. Following is a reconciliation of intangible assets for the years ended July 31, 20092011 and 2008:2010:
|
|
|
|
|
|
|
|
|
|
|
|
|
|
|
|
|
|
|
|
|
|
| Gross |
| Accumulated |
| Net Intangible |
|
| Gross |
| Accumulated |
| Net |
| ||||||
|
| (thousands of dollars) |
|
| (thousands of dollars) |
| ||||||||||||||
Balance as of July 31, 2007 |
| $ | 57,203 |
| $ | (10,902 | ) | $ | 46,301 |
| ||||||||||
Intangibles acquired |
| 1,868 |
| — |
| 1,868 |
| |||||||||||||
Balance as of July 31, 2009 |
| $ | 85,809 |
| $ | (20,423 | ) | $ | 65,386 |
| ||||||||||
Amortization expense |
| — |
| (4,330 | ) |
| (4,330 | ) |
| — |
| (6,007 | ) |
| (6,007 | ) | ||||
Foreign exchange translation |
|
| 3,171 |
|
| (693 | ) |
| 2,478 |
|
|
| (2,322 | ) |
| 1,235 |
|
| (1,087 | ) |
Balance as of July 31, 2008 |
| $ | 62,242 |
| $ | (15,925 | ) | $ | 46,317 |
| ||||||||||
Intangibles acquired |
| 26,710 |
| — |
| 26,710 |
| |||||||||||||
Intangibles sold |
| (300 | ) |
| 114 |
| (186 | ) | ||||||||||||
Balance as of July 31, 2010 |
| $ | 83,487 |
| $ | (25,195 | ) | $ | 58,292 |
| ||||||||||
Amortization expense |
| — |
| (5,601 | ) |
| (5,601 | ) |
| — |
| (5,917 | ) |
| (5,917 | ) | ||||
Foreign exchange translation |
|
| (2,843 | ) |
| 989 |
|
| (1,854 | ) |
|
| 1,952 |
|
| (831 | ) |
| 1,121 |
|
Balance as of July 31, 2009 |
| $ | 85,809 |
| $ | (20,423 | ) | $ | 65,386 |
| ||||||||||
Balance as of July 31, 2011 |
| $ | 85,439 |
| $ | (31,943 | ) | $ | 53,496 |
| ||||||||||
Net intangible assets consist of patents, trademarks and tradenamestrade names of $23.9$20.0 million and $23.5$20.5 million as of July 31, 20092011 and 2008,2010, respectively, and Customer related intangibles of $41.5$33.5 million and $22.8$37.8 million as of July 31, 20092011 and 2008,2010, respectively. AmortizationExpected amortization expense relating to existing intangible assets is expected to be approximately $6.1 million for the year ending July 31, 2010, $6.0 million for the year ending July 31, 2011, $5.9 million for the year ending July 31, 2012, $5.7 million for the year ending July 31, 2013 and $5.3 million for the year ending July 31, 2014.as follows (in thousands):
|
|
|
|
|
|
Fiscal Year |
|
|
|
|
|
2012 |
|
| $ | 5,863 |
|
2013 |
|
| $ | 5,700 |
|
2014 |
|
| $ | 5,327 |
|
2015 |
|
| $ | 5,221 |
|
2016 |
|
| $ | 5,206 |
|
NOTE C
Credit Facilities
The Company has a five-year, multi-currency revolving facility with a group of banks under which the Company may borrow up to $250 million. This facility matures on April 2, 2013. The agreement provides that loans may be made under a selection of currencies and rate formulas including Base Rate Advances or Off Shore Rate Advances. The interest rate on each advance is based on certain market interest rates and leverage ratios. Facility fees and other fees on the entire loan commitment are payable over the duration of this facility. There was $20.0nothing outstanding at July 31, 2011, and $50.0 million outstanding at July 31, 2009, and $70.0 million outstanding at2010. At July 31, 2008.2011 and 2010, $238.6 million and $180.0 million, respectively, were available for further borrowing under such facilities. The amount available for further borrowing reflects a reduction for issued standby letters of credit, as discussed below. At July 31, 2009 and 2008, $210.0 million and $161.5 million, respectively, was available for further borrowing under such facilities. The weighted average interest rate on these short-term borrowings outstanding at July 31, 20092010 was 0.6 percent. Our multi-currency revolving facility contains debt covenants specifically related to maintaining a certain interest coverage ratio and 2008,a certain leverage ratio as well as other covenants that under certain circumstances can restrict our ability to incur additional indebtedness, make investments and other restricted payments, create liens, and sell assets. As of July 31, 2011, the Company was 0.56 percentin compliance with all such covenants.
Certain note agreements contain debt covenants related to working capital levels and 2.73 percent, respectively.limitations on indebtedness. As of July 31, 2011, the Company was in compliance with all such covenants. The Company currently expects to remain in compliance with these covenants.
The Company also has three uncommitted credit facilities in the United States, which provide unsecured borrowings for general corporate purposes. At July 31, 20092011 and 2008,2010, there was $56.9 million and $70.0 million available for use. There was $9.6$13.1 million and $28.0 million outstanding under these facilities at July 31, 20092011 and 2008,
respectively.nothing outstanding at July 31, 2010. The weighted average interest rate on these short-term borrowings outstanding at July 31, 2009 and 2008,2011 was 0.53 percent and 2.79 percent, respectively.0.9 percent.
The Company also has a €100 million program for issuing treasury notes for raising short, medium, and long-term financing for its European operations. There was nothing outstanding on this program at July 31, 2009 and 2008.2011 or 2010. Additionally, the Company’s European operations have lines of credit with an available limit of €72.9€45.6 million. There was nothing outstanding on these lines of credit as of July 31, 2009. As of July 31, 2008, there was €23.5 million,2011 or $36.9 million outstanding. The weighted average interest rate of these short-term borrowings outstanding at July 31, 2008, was 5.60 percent.2010.
Other international subsidiaries may borrow under various credit facilities. There was nothing outstanding under these credit facilities as of July 31, 2009. As of July 31, 2008, borrowings under these facilities were $4.5 million. The weighted average interest rate on these international borrowings outstanding at July 31, 2008, was 2.88 percent.2011 or 2010.
As discussed further in Note K,L, at July 31, 20092011 and 2008,2010, the Company had outstanding standby letters of credit totaling $20.0$11.4 million, and $18.5 million, respectively, upon which no amounts had been drawn. The letters of credit guarantee payment to third parties in the event the Company is in breach of specified bond financing agreement and insurance contract terms as detailed in each letter of credit.
NOTE D
Long-Term Debt
Long-term debt consists of the following:
|
|
|
|
|
|
|
|
|
|
|
|
|
|
|
|
| 2009 |
| 2008 |
|
| 2011 |
| 2010 |
| ||||
|
| (thousands of dollars) |
|
| (thousands of dollars) |
| ||||||||
6.39% Unsecured senior notes due August 15, 2010, interest payable semi-annually, principal payments of $5.0 million, to be paid annually commencing August 16, 2006 |
| 9,981 |
| 14,942 |
| |||||||||
4.85% Unsecured senior notes, interest payable semi-annually, principal payment of $30.0 million due December 17, 2011. |
| 30,000 |
| 30,000 |
| |||||||||
6.39% Unsecured senior notes due August 15, 2010, interest payable semi-annually. This note was repaid on August 16, 2010 |
| $ | — |
| $ | 4,999 |
| |||||||
4.85% Unsecured senior notes, interest payable semi-annually, principal payment of $30.0 million due December 17, 2011 |
| 30,000 |
| 30,000 |
| |||||||||
6.59% Unsecured senior notes, interest payable semi-annually, principal payment of $80.0 million due November 14, 2013 |
| 80,000 |
| — |
|
| 80,000 |
| 80,000 |
| ||||
5.48% Unsecured senior notes, interest payable semi-annually, principal payment of $50.0 million due June 1, 2017 |
| 50,000 |
| 50,000 |
|
| 50,000 |
| 50,000 |
| ||||
5.48% Unsecured senior notes, interest payable semi-annually, principal payment of $25.0 million due September 28, 2017 |
| 25,000 |
| 25,000 |
|
| 25,000 |
| 25,000 |
| ||||
5.48% Unsecured senior notes, interest payable semi-annually, principal payment of $25.0 million due November 30, 2017 |
| 25,000 |
| 25,000 |
|
| 25,000 |
| 25,000 |
| ||||
1.418% Guaranteed senior notes, interest payable semi-annually, principal payment of ¥1.2 billion due January 31, 2012 |
| 12,679 |
| 11,123 |
|
| 15,595 |
| 13,884 |
| ||||
2.019% Guaranteed senior note, interest payable semi-annually, principal payment of ¥1.65 billion due May 18, 2014 |
| 17,434 |
| 15,295 |
|
| 21,442 |
| 19,091 |
| ||||
Variable Rate Commercial Property Loan, to a maximum of R37 million, interest rate of 13.75% as of July 31, 2008, repaid in 2009 |
| — |
| 1,882 |
| |||||||||
Variable Rate Industrial Development Revenue Bonds (“Low Floaters”) interest payable monthly, principal payment of $7.755 million due September 1, 2024, and an interest rate of 0.67% as of July 31, 2009 |
| 7,755 |
| 7,755 |
| |||||||||
Capitalized lease obligations and other, with various maturity dates and Interest rates |
|
| 1,321 |
|
| 1,147 |
| |||||||
Variable Rate Industrial Development Revenue Bonds (“Low Floaters”) interest payable monthly, principal payment of $7.755 million due September 1, 2024, interest rate of 0.40% as of April 25, 2011. These bonds were repaid on April 25, 2011. |
| — |
| 7,755 |
| |||||||||
Capitalized lease obligations and other, with various maturity dates and interest rates |
| 796 |
| 890 |
| |||||||||
Terminated interest rate swap contracts |
|
| 5,786 |
|
| 5,109 |
| |||||||
Total |
| 259,170 |
| 182,144 |
|
|
| 253,619 |
|
| 261,728 |
| ||
Less current maturities |
|
| 5,496 |
|
| 5,669 |
|
|
| 47,871 |
|
| 5,536 |
|
Total long-term debt |
| $ | 253,674 |
| $ | 176,475 |
|
| $ | 205,748 |
| $ | 256,192 |
|
Annual maturities of long-term debt are $5.5 million in 2010, $5.4 million in 2011, $43.0$46.0 million in 2012, $97.5$0.3 million in 2013, $101.5 million in 2014, and $107.8$100.0 million thereafter. There are no maturities in 2013.2015 or 2016. As of July 31, 2009,2011, the estimated fair value of long-term debt with fixed interest rates was $253.1$268.3 million compared to its carrying value of $250.1$247.0 million.
On November 14, 2008,April 25, 2011, the Company issued an $80 million senior unsecured note. The note is due on November 14, 2013. The debt was issued at face value and bears interest payable semi-annually at a rate of 6.59 percent. The proceeds from the note were used to refinance existing debt andpaid off its Variable Rate Industrial Development Revenue Bond for general corporate purposes.
On June 1, 2007, the Company issued $100 million of senior unsecured notes. The first $50 million was funded on June 1, 2007, and the remaining two $25 million tranches were funded on September 28, 2007, and November 30, 2007. The three tranches are due on June 1, 2017, September 28, 2017, and November 30, 2017, respectively. The debt was issued at face value and bears interest payable semi-annually at a rate of 5.48 percent. The proceeds from the notes were used to refinance existing debt and for general corporate purposes.
The Company is exposed to changes in the fair value of its fixed-rate debt resulting from interest rate fluctuations. To hedge this exposure the Company entered into two fixed-to-variable interest rate swaps on August 3, 2009, subsequent to year end, for $80 million and $25 million, respectively, for approximately 5 and 8 years, respectively. These interest rate swaps will be accounted for as fair value hedges. Changes in the payment of interest resulting from the interest rate swaps will be recorded as an offset to interest expense.$7.8 million.
Certain note agreements contain debt covenants related to working capital levels and limitations on indebtedness. As of July 31, 2009,2011, the Company was in compliance with all such covenants. The Company currently expects to remain in compliance with these covenants.
NOTE EDerivatives and Other Financial Instruments
DerivativesThe Company uses derivative instruments, primarily forward exchange contracts and interest rate swaps, to manage its exposure to fluctuations in foreign exchange rates andrates. The Company also uses interest rates.rate swaps to manage its exposure to changes in the fair value of its fixed-rate debt resulting from interest rate fluctuations. It is the Company’s policy to enter into derivative transactions only to the extent true exposures exist; the Company does not enter into derivative transactions for speculative or trading purposes. The Company enters into derivative transactions only with highly rated counterparties.counterparties with high credit ratings. These transactions may expose the Company to credit risk to the extent that the instruments have a positive fair value, but the Company has not experienced any material losses, nor does the Company anticipate any material losses.
The Company enters into forward exchange contracts of generally less than one year to hedge forecasted transactions amongstbetween its subsidiaries and to reduce potential exposure related to fluctuations in foreign exchange rates for existing recognized assets and liabilities. It also utilizes forward exchange contracts for anticipated intercompany and third-party transactions such as purchases, sales, and dividend payments denominated in local currencies. Forward exchange contracts are designated as cash flow hedges as they are designed to hedge the variability of cash flows associated with the underlying existing recognized or anticipated transactions. Changes in the value of derivatives designated as cash flow hedges are recorded in other comprehensive income (loss) in shareholders’ equity until earnings are affected by the variability of the underlying cash flows. At that time, the applicable amount of gain or loss from the derivative instrument that is deferred in shareholders’ equity is reclassified to earnings. The Company expects to record $0.2 million of net deferred gains from these forward exchange contracts during the next twelve months. Effectiveness is measured using spot rates to value both the hedge contract and the hedged item. The excluded forward points, as well as any ineffective portions of hedges, are recorded in earnings through the same line as the underlying transaction. During Fiscal 2011, 2010, and 2009, $1.1 million, $0.2 million, and $0.4 million of losses were recorded due to the exclusion of forward points from the assessment of hedge effectiveness.
These unrealized losses and gains are reclassified, as appropriate, as earnings are affected by the variability of the underlying cash flows during the term of the hedges. The Company expects to record $0.6 million of net deferred losses from these forward exchange contracts during the next twelve months.
The Company is exposed to changes in the fair value of its fixed-rate debt resulting from interest rate fluctuations. To hedge this exposure the Company entered into two fixed-to-variable interest rate swaps on August 3, 2009, subsequent to year end, for $80 million and $25 million, respectively, for approximately 5 and 8 years, respectively. These interest rate swaps will be accounted for as fair value hedges. Changes in the payment of interest resulting from the interest rate swaps will be recorded as an offset to interest expense.
The Company entered into and settled an interest rate lock in October 2008. The interest rate lock settlement resulted in a $0.5 million in gain, net of deferred taxes of $0.2 million, which will be amortized into income over the life of the related debt.
The following summarizes the Company’s fair value of outstanding derivatives at July 31, 2009, and 2008, on the Consolidated Balance Sheets (thousands of dollars):
|
|
|
|
|
|
|
|
|
| July 31, |
| July 31, |
| ||
Asset derivatives recorded under the caption Prepaids and other current assets |
|
|
|
|
|
|
|
Foreign exchange contracts |
| $ | 493 |
| $ | 952 |
|
|
|
|
|
|
|
|
|
Liability derivatives recorded under the caption Other current liabilities |
|
|
|
|
|
|
|
Foreign exchange contracts |
| $ | 2,366 |
| $ | 1,252 |
|
The impact on OtherAccumulated other comprehensive income (loss) (OCI) and earnings from foreign exchange contracts that qualified as cash flow hedges for the twelve months ended July 31, 20092011 and 2008,2010, was as follows (thousands of dollars):
|
|
|
|
|
|
|
|
|
| July 31, |
| July 31, |
| ||
Net carrying amount at beginning of year |
| $ | 188 |
| $ | (206 | ) |
Cash flow hedges deferred in OCI |
|
| (1,826 | ) |
| 2,628 |
|
Cash flow hedges reclassified to income (effective portion) |
|
| 580 |
|
| (2,211 | ) |
Change in deferred taxes |
|
| 408 |
|
| (23 | ) |
Net carrying amount at July 31 |
| $ | (650 | ) | $ | 188 |
|
The Company’s derivative financial instruments present certain market and counterparty risks; however, concentration of counterparty risk is mitigated as the Company deals with a variety of major banks worldwide. In addition, only conventional derivative financial instruments are utilized. The Company would not be materially impacted if any of the counterparties to the derivative financial instruments outstanding at July 31, 2009, failed to perform according to the terms of its agreement. At this time, the Company does not require collateral or any other form of securitization to be furnished by the counterparties to its derivative instruments.
|
|
|
|
|
|
|
|
|
| July 31, |
| ||||
|
| 2011 |
| 2010 |
| ||
Net carrying amount at beginning of year |
| $ | (660 | ) | $ | (650 | ) |
Cash flow hedges deferred in OCI |
|
| (782 | ) |
| (3,789 | ) |
Cash flow hedges reclassified to income (effective portion) |
|
| 1,963 |
|
| 3,788 |
|
Change in deferred taxes |
|
| (280 | ) |
| (9 | ) |
Net carrying amount at July 31 |
| $ | 241 |
| $ | (660 | ) |
Fair Value of Financial InstrumentsAt July 31, 20092011 and 2008,2010, the Company’s financial instruments included cash and cash equivalents, accounts receivable, accounts payable, short-term borrowings, long-term debt, and derivative contracts. The fair values of cash and cash equivalents, accounts receivable, accounts payable, and short-term borrowings approximated carrying values because of the short-term nature of these instruments. Derivative contracts are reported at their fair values based on third-party quotes. As of July 31, 2009,2011, the estimated fair value of long-term debt with fixed interest rates was $253.1$268.3 million compared to its carrying value of $250.1$247.0 million. The fair value is estimated by discounting the projected cash flows using the rate that similar amounts of debt could currently be borrowed.
Credit RiskThe Company is exposed to credit loss in the event of nonperformance by counterparties in interest rate swaps and foreign exchange forward contracts. Collateral is generally not required of the counterparties or of the Company. In the unlikely event a counterparty fails to meet the contractual terms of an interest rate swap or foreign exchange forward contract, the Company’s risk is limited to the fair value of the instrument. There wereThe Company had no interest rate swaps outstanding at July 31, 2009 or 2008.2011. There was one interest rate swap outstanding at July 31, 2010, which
was subsequently terminated August 17, 2010. The Company actively monitors its exposure to credit risk through the use of credit approvals and credit limits, and by
selecting major international banks and financial institutions as counterparties. The Company has not had any historical instances of non-performance by any counterparties, nor does it anticipate any future instances of non-performance.
NOTE F
Fair Value
The following summarizes the Company’s fair value of outstanding derivatives at July 31, 2011, and 2010, on the Consolidated Balance Sheets (thousands of dollars):
|
|
|
|
|
|
|
|
|
| At July 31, |
| ||||
|
| 2011 |
| 2010 |
| ||
Asset derivatives recorded under the caption Prepaids and other current assets Foreign exchange contracts |
| $ | 945 |
| $ | 807 |
|
|
|
|
|
|
|
|
|
Asset derivatives recorded under the caption Other assets Interest rate swap asset |
| $ | — |
| $ | 4,590 |
|
|
|
|
|
|
|
|
|
Liability derivatives recorded under the caption Other current liabilities Foreign exchange contracts |
| $ | 1,470 |
| $ | 2,127 |
|
The Company’s derivative financial instruments present certain market and counterparty risks; however, concentration of counterparty risk is mitigated as the Company deals with a variety of major banks worldwide. In addition, only conventional derivative financial instruments are utilized. The Company would not be materially impacted if any of the counterparties to the derivative financial instruments outstanding at July 31, 2011, failed to perform according to the terms of its agreement. At this time, the Company does not require collateral or any other form of securitization to be furnished by the counterparties to its derivative instruments.
The fair values of the Company’s financial assets and financial liabilities listed below reflect the amounts that would be received to sell the assets or paid to transfer the liabilities in an orderly transaction between market participants at the measurement date (exit price). The fair values are based on inputs other than quoted prices that are observable for the asset or liability. These inputs include foreign currency exchange rates and interest rates. The financial assets and financial liabilities are primarily valued using standard calculations and models that use as their basis readily observable market parameters. Industry standard data providers are the primary source for forward and spot rate information for both interest rates and currency rates.
|
|
|
|
|
|
|
|
|
| Significant Other Observable Inputs |
| ||||
|
| At July 31, |
| ||||
|
| 2011 |
| 2010 |
| ||
Forward exchange contracts – net liability position |
| $ | (525 | ) | $ | (1,320 | ) |
Interest rate swaps – net asset position |
|
| — |
|
| 4,590 |
|
*Inputs to the valuation methodology of level 2 assets include quoted prices for similar assets or liabilities in active markets; quoted prices for identical or similar assets or liabilities in inactive markets; inputs other than quoted prices that are observable for the asset or liability; and inputs that are derived principally from or corroborated by observable market data by correlation or other means.
NOTE G Employee Benefit Plans
Pension PlansThe Company and certain of its international subsidiaries have defined benefit pension plans for many of itstheir hourly and salaried employees. There are two types of U.S. plans. The first type of U.S. plans include plans that provideplan is a traditional defined benefits as well asbenefit pension plan primarily for production employees. The second is a plan for salaried workers that provides defined benefits pursuant to a cash balance feature whereby a participant accumulates a benefit comprised of a percentage of current salary that varies with years of service, interest credits and transition credits. The international plans generally provide pension benefits based on years of service and compensation level. During Fiscal 2009, the Company changed its measurement date to July 31, in accordance with the measurement date provisions
Net periodic pension costs for the Company’s pension plans include the following components:
|
|
|
|
|
|
|
|
|
|
|
|
|
|
|
|
|
|
|
|
|
|
| 2009 |
| 2008 |
| 2007 |
|
| 2011 |
| 2010 |
| 2009 |
| ||||||
|
| (thousands of dollars) |
|
| (thousands of dollars) |
| ||||||||||||||
Net periodic cost: |
|
|
|
|
|
|
|
|
|
|
|
|
|
| ||||||
Service cost |
| $ | 15,385 |
| $ | 15,996 |
| $ | 15,067 |
|
| $ | 16,148 |
| $ | 13,184 |
| $ | 15,385 |
|
Interest cost |
| 18,481 |
| 17,702 |
| 17,014 |
|
| 19,440 |
| 19,445 |
| 18,481 |
| ||||||
Expected return on assets |
| (29,143 | ) |
| (28,275 | ) |
| (24,955 | ) |
| (27,538 | ) |
| (28,390 | ) |
| (29,143 | ) | ||
Transition amount amortization |
| 193 |
| 164 |
| 523 |
|
| 225 |
| 226 |
| 193 |
| ||||||
Prior service cost amortization |
| 438 |
| 380 |
| 314 |
|
| 449 |
| 293 |
| 438 |
| ||||||
Actuarial (gain)/loss amortization |
| 1,088 |
| (58 | ) |
| 1,408 |
| ||||||||||||
Actuarial loss amortization |
| 3,962 |
| 2,864 |
| 1,088 |
| |||||||||||||
Curtailment loss |
| 910 |
| — |
| 408 |
|
|
| — |
|
| — |
|
| 910 |
| |||
Settlement gain |
|
| — |
|
| (35 | ) |
| (2,357 | ) | ||||||||||
Net periodic benefit cost |
| $ | 7,352 |
| $ | 5,874 |
| $ | 7,422 |
|
| $ | 12,686 |
| $ | 7,622 |
| $ | 7,352 |
|
NegotiationsDuring Fiscal 2009, negotiations with one of our unions resulted in a freeze in pension benefits at one of our U.S. plants. In exchange for the freezing of the plan, participants will bewere made eligible for a companyCompany match in a defined contribution plan. The freeze in the plan resulted in a curtailment loss of $0.9 million during Fiscal 2009.
In anticipation of Japanese defined benefit plan law changes, the Company terminated the defined benefit plan offered to its employees in Japan on December 31, 2006, which resulted in a net settlement gain of $1.9 million in Fiscal 2007. This plan was replaced with a defined contribution plan as of January 1, 2007. The Company incurred the cost of initial contributions to the defined contribution plan as well as other costs of converting participants to the new defined contribution plan resulting in a net pretax gain for the net settlement and transition to the defined contribution plan of approximately $0.6 million during Fiscal 2007.
Effective July 31, 2007, the Company adopted SFAS No. 158,Employers’ Accounting for Defined Benefit Pension and Other Postretirement Plans—an amendment of FASB Statements No. 87, 88, 106, and 132(R). This statement requires recognition of the overfunded or underfunded status of defined benefit postretirement plans as an asset or liability in the statement of financial position. This statement also requires that changes in the funded status are recognized in accumulated other comprehensive income in the year in which the adoption occurs and in other comprehensive income in the following years. SFAS 158’s provisions regarding the change in the measurement date of postretirement benefits plans required the Company to change its measurement date from April 30 to July 31 during Fiscal 2009. The adoption of the measurement date provisions resulted in an after-tax decrease to Retained earnings of $0.9 million, a decrease to Other assets of $0.5 million increase to Other long-term liabilities of $0.8 million and an increase to Deferred income taxes of $0.5 million.
The obligations and funded status of the Company’s pension plans as of 20092011 and 2008,2010, is as follows:
|
|
|
|
|
|
|
|
|
|
|
|
|
|
|
|
| 2009 |
| 2008 |
|
| 2011 |
| 2010 |
| ||||
|
| (thousands of dollars) |
|
| (thousands of dollars) |
| ||||||||
Change in benefit obligation: |
|
|
|
|
|
|
|
|
|
| ||||
Benefit obligation, beginning of year |
| $ | 330,258 |
| $ | 312,514 |
|
| $ | 377,903 |
| $ | 338,154 |
|
Service cost |
| 18,730 |
| 15,996 |
|
| 16,148 |
| 13,183 |
| ||||
Interest cost |
| 22,868 |
| 17,702 |
|
| 19,440 |
| 19,445 |
| ||||
Plan amendments |
| 1,639 |
| — |
| |||||||||
Participant contributions |
| 1,476 |
| 1,381 |
|
| 1,058 |
| 1,043 |
| ||||
Plan amendments |
| — |
| 1,221 |
| |||||||||
Actuarial gain |
| (1,077 | ) |
| (2,410 | ) | ||||||||
Actuarial loss |
| 1,034 |
| 31,918 |
| |||||||||
Currency exchange rates |
| (13,338 | ) |
| 3,610 |
|
| 6,936 |
| (6,531 | ) | |||
Settlement |
| — |
| (272 | ) | |||||||||
Benefits paid |
|
| (20,763 | ) |
| (19,484 | ) |
|
| (20,146 | ) |
| (19,309 | ) |
Benefit obligation, end of year |
| $ | 338,154 |
| $ | 330,258 |
|
| $ | 404,012 |
| $ | 377,903 |
|
|
|
|
|
|
| |||||||||
Change in plan assets: |
|
|
|
|
|
|
|
|
|
| ||||
Fair value of plan assets, beginning of year |
| $ | 378,695 |
| $ | 377,461 |
|
| $ | 319,734 |
| $ | 297,479 |
|
Actual return on plan assets |
| (62,057 | ) |
| 5,389 |
|
| 38,758 |
| 31,013 |
| |||
Company contributions |
| 13,356 |
| 11,316 |
|
| 27,655 |
| 15,064 |
| ||||
Participant contributions |
| 1,476 |
| 1,381 |
|
| 1,058 |
| 1,043 |
| ||||
Currency exchange rates |
| (13,228 | ) |
| 2,904 |
|
| 6,496 |
| (5,556 | ) | |||
Settlement |
| — |
| (272 | ) | |||||||||
Benefits paid |
|
| (20,763 | ) |
| (19,484 | ) |
|
| (20,146 | ) |
| (19,309 | ) |
Fair value of plan assets, end of year |
| $ | 297,479 |
| $ | 378,695 |
|
| $ | 373,555 |
| $ | 319,734 |
|
|
|
|
|
|
| |||||||||
Funded status: |
|
|
|
|
|
|
|
|
|
| ||||
Over (under) funded status at July 31, 2009 and April 30, 2008 |
| $ | (40,675 | ) | $ | 48,437 |
| |||||||
Fourth quarter contributions |
|
| — |
|
| 808 |
| |||||||
Over (under) funded status after fourth quarter contributions |
| $ | (40,675 | ) | $ | 49,245 |
| |||||||
Underfunded status at July 31, 2011 and 2010 |
| $ | (30,457 | ) | $ | (58,169 | ) | |||||||
The net under fundedunderfunded status of $40.7$30.5 million at July 31, 2009,2011 is recognized in the accompanying Consolidated Balance Sheet as $4.3$6.4 million within Other assets for the Company’s over fundedover-funded plans and $45.0$36.9 million within Other long-term liabilities for the Company’s under fundedunderfunded plans. Included in Accumulated other comprehensive incomeloss at July 31, 2009,2011 are the following amounts that have not yet been recognized in net periodic pension expense: unrecognized actuarial losses of $123.0$134.7 million, unrecognized prior service cost of $4.2$5.1 million, and unrecognized transition obligations of $3.4$3.0 million. The actuarial loss, prior service cost and unrecognized transition obligation are included in Accumulated other comprehensive income,loss, net of tax. The amounts expected to be recognized in net periodic pension expense during Fiscal 20102012 are $1.4$5.8 million, $0.3$0.5 million, and $0.2 million, respectively. The accumulated benefit obligation for all defined benefit pension plans was $296.7$365.2 million and $282.7$332.4 million at July 31, 2009,2011 and April 30, 2008,2010, respectively.
The projected benefit obligation, accumulated benefit obligation and fair value of plan assets for pension plans with accumulated benefit obligations in excess of plan assets were $246.7$294.2 million, $234.3$282.3 million, and $213.3$262.4 million, respectively, as of July 31, 2009,2011, and $16.4$282.7 million, $13.8$266.0 million, and $0.0$230.3 million, respectively, as of April 30, 2008.July 31, 2010.
For the years ended July 31, 20092011 and 2008,2010 the U.S. pension plans represented approximately 7271 percent and 7573 percent, respectively, of the Company’s total plan assets, and approximately 72 percent and 7074 percent, respectively, of the Company’s total projected benefit obligation.
The weighted-average discount rates and rates of increase in future compensation levels used in determining the actuarial present value of the projected benefit obligation are as follows:
|
|
|
|
|
|
|
|
|
|
|
|
|
|
|
Weighted average actuarial assumptions |
| 2009 |
| 2008 |
|
| 2011 |
| 2010 |
| ||||
All U.S. plans: |
|
|
|
|
|
|
|
|
|
| ||||
Discount rate |
| 6.00 | % |
| 6.00 | % |
| 4.91 | % |
| 5.25 | % | ||
Rate of compensation increase |
| 5.00 | % |
| 5.00 | % |
| 4.50 | % |
| 5.00 | % | ||
Non-U.S. plans: |
|
|
|
|
| |||||||||
Non - U.S. plans: |
|
|
|
|
| |||||||||
Discount rate |
| 5.90 | % |
| 6.30 | % |
| 5.36 | % |
| 5.17 | % | ||
Rate of compensation increase |
| 3.87 | % |
| 4.48 | % |
| 3.57 | % |
| 3.69 | % | ||
The weighted-average discount rates, expected returns on plan assets and rates of increase in future compensation levels used to determine the net periodic benefit cost are as follows:
|
|
|
|
|
|
|
|
|
|
|
|
|
|
|
|
|
|
|
|
|
Weighted average actuarial assumptions |
| 2009 |
| 2008 |
| 2007 |
|
| 2011 |
| 2010 |
| 2009 |
| ||||||
All U.S. plans: |
|
|
|
|
|
|
|
|
|
|
|
|
|
| ||||||
Discount rate |
| 6.00 | % |
| 6.00 | % |
| 6.25 | % |
| 5.25 | % |
| 6.00 | % |
| 6.00 | % | ||
Expected return on plan assets |
| 8.50 | % |
| 8.50 | % |
| 8.50 | % |
| 8.00 | % |
| 8.50 | % |
| 8.50 | % | ||
Rate of compensation increase |
| 5.00 | % |
| 5.00 | % |
| 5.00 | % |
| 5.00 | % |
| 5.00 | % |
| 5.00 | % | ||
Non-U.S. plans: |
|
|
|
|
|
|
| |||||||||||||
Non - U.S. plans: |
|
|
|
|
|
|
| |||||||||||||
Discount rate |
| 6.30 | % |
| 5.23 | % |
| 4.64 | % |
| 5.17 | % |
| 5.90 | % |
| 6.30 | % | ||
Expected return on plan assets |
| 7.14 | % |
| 7.49 | % |
| 6.60 | % |
| 6.17 | % |
| 6.64 | % |
| 7.14 | % | ||
Rate of compensation increase |
| 4.48 | % |
| 4.01 | % |
| 3.62 | % |
| 3.69 | % |
| 3.87 | % |
| 4.48 | % | ||
Expected Long-Term Rate of ReturnTo develop the expected long-term rate of return on assets assumption, the Company considered the historical returns and the future expectations for returns for each asset class, as well as the target asset allocation of the pension portfolio. This resulted inAs of our measurement date of July 31, 2011, the selection of the 8.50 percentCompany decreased its long-term rate of return on assets assumption for the Company’s U.S. pension plans.plans to 7.75 percent from 8.0 percent as of July 31, 2010. The Company believes that based on the asset mix and the target asset allocation, the 7.75 percent rate is an appropriate rate. This is slightly below the Company’s twenty year average but above the five and ten year averages. Thus, the Company will use the 7.75 percent rate for the calculation of its Fiscal 2012 net periodic cost. The expected long-term rate of return on assets assumption for the plans outside the U.S. reflects the investment allocation and expected total portfolio returns specific to each plan and country. The expected long-term rate of return on assets shown in the pension benefit disclosure for non-U.S. plans is an asset-based weighted average of all non-U.S. plans.
Discount RateThe Company’s objective in selecting a discount rate is to select the best estimate of the rate at which the benefit obligations could be effectively settled on the measurement date, taking into account the nature and duration of the benefit obligations of the plan. In making this best estimate, the Company looks at rates of return on high-quality fixed-income investments currently available, and expected to be available, during the period to maturity of the benefits. This process includes looking at the universe of bonds available on the measurement date with a quality rating of Aa or better. Similar appropriate benchmarks are used to determine the discount rate for the non-U.S. plans. The discount rate for non-U.S. plans disclosed in the assumptions used to determine net periodic benefit cost and to determine benefit obligations is based upon a weighted average, using year-end projected benefit obligations, of all non-U.S. plans.obligations.
Plan AssetsThe Company’s pension plan weighted-average asset allocations by asset category are as follows:
|
|
|
|
|
|
|
|
|
| Plan Assets at |
| ||||
Asset Category |
| 2009 |
| 2008 |
| ||
All U.S. plans: |
|
|
|
|
|
|
|
Equity securities |
|
| 41 | % |
| 44 | % |
Alternative investments |
|
| 42 | % |
| 36 | % |
Real assets |
|
| 12 | % |
| 12 | % |
Fixed income |
|
| 5 | % |
| 8 | % |
Total U.S. plans |
|
| 100 | % |
| 100 | % |
Non U.S. plans: |
|
|
|
|
|
|
|
Equity securities |
|
| 44 | % |
| 64 | % |
Debt securities |
|
| 56 | % |
| 36 | % |
Total Non U.S. plans |
|
| 100 | % |
| 100 | % |
Plan AssetsThe fair values of the assets held by the U.S. pension plans by asset category are as follows (in millions):
|
|
|
|
|
|
|
|
|
|
|
|
|
|
Asset Category |
| Quoted Prices in |
| Significant |
| Significant |
| Total |
| ||||
2011 |
|
|
|
|
|
|
|
|
|
|
|
|
|
Cash |
| $ | 0.3 |
| $ | — |
| $ | — |
| $ | 0.3 |
|
Global Equity Securities |
|
| 64.8 |
|
| 56.2 |
|
| 0.3 |
|
| 121.3 |
|
Fixed Income Securities |
|
| 36.6 |
|
| — |
|
| — |
|
| 36.6 |
|
Private Equity |
|
| — |
|
| — |
|
| 17.6 |
|
| 17.6 |
|
Absolute Return |
|
| — |
|
| 20.1 |
|
| 31.4 |
|
| 51.5 |
|
Real Assets |
|
| — |
|
| — |
|
| 38.0 |
|
| 38.0 |
|
Total U.S. Assets at July 31, 2011 |
| $ | 101.7 |
| $ | 76.3 |
| $ | 87.3 |
| $ | 265.3 |
|
2010 |
|
|
|
|
|
|
|
|
|
|
|
|
|
Cash |
| $ | 0.9 |
| $ | — |
| $ | — |
| $ | 0.9 |
|
Global Equity Securities |
|
| 48.7 |
|
| 50.2 |
|
| 2.4 |
|
| 101.3 |
|
Fixed Income Securities |
|
| 17.1 |
|
| — |
|
| — |
|
| 17.1 |
|
Private Equity |
|
| — |
|
| — |
|
| 14.8 |
|
| 14.8 |
|
Absolute Return |
|
| — |
|
| 39.4 |
|
| 33.1 |
|
| 72.5 |
|
Real Assets |
|
| — |
|
| 9.6 |
|
| 16.3 |
|
| 25.9 |
|
Total U.S. Assets at July 31, 2010 |
| $ | 66.7 |
| $ | 99.2 |
| $ | 66.6 |
| $ | 232.5 |
|
The 2010 information in the above table contains adjustments to the classifications within the fair value hierarchy from that reported in the prior year.
Global equity consists of publicly traded U.S. and non-U.S. equities, Australasia, Far East (EAFE) index funds, equity private placement funds, and some cash and cash equivalents. Publicly traded equities are valued at the closing price reported in the active market in which the individual securities are traded. Index funds are valued at the net asset value (NAV) as determined by the custodian of the fund. The NAV is based on the fair value of the underlying assets owned by the fund, minus its liabilities then divided by the number of units outstanding.
Fixed income consists primarily of investment grade debt securities, but may include up to 10% in high yield securities rated B or higher by Moody’s or S&P. It may also include up to 20% in securities denominated in foreign currencies. Corporate and other bonds and notes are valued at either the yields currently available on comparable securities of issuers with similar credit ratings or valued under a discounted cash flows approach that maximizes observable inputs, such as current yields of similar instruments, but includes adjustments for certain risks that may not be observable such as credit and liquidity risks.
Private equity consists of interests in partnerships that invest in U.S. and non-U.S. debt and equity securities. The portfolio is a diversified mix of partnership interests including buyouts, distressed debt, growth equity, mezzanine, real estate, and venture capital investments. Partnership interests are valued using the most recent general partner statement of fair value, updated for any subsequent partnership interests’ cash flow.
Absolute return consists primarily of private partnership interests in hedge funds of funds. Partnership interests are valued using the NAV as determined by the administrator or custodian of the fund.
Real Assets consist of commodity funds, Real Estate Investment Trusts (REITS), and interests in partnerships that invest in private real estate, commodity, and timber investments. Private investments are valued using the most recent partnership statement of fair value, updated for any subsequent partnership interests’ cash flows. Commodity funds and REITS are valued at the closing price reported in the active market in which they are traded.
The following table sets forth a summary of changes in the fair values of the U.S. pension plans’ Level 3 assets for the years ended July 31, 2011 and 2010 (in millions):
|
|
|
|
|
|
|
|
|
|
|
|
|
|
|
|
|
|
| Global |
| Private |
| Absolute |
| Real Assets |
| Total |
| |||||
Beginning balance at August 1, 2009 |
| $ | 2.7 |
| $ | 11.4 |
| $ | 41.4 |
| $ | 15.5 |
| $ | 71.0 |
|
Unrealized gains |
|
| 0.1 |
|
| 1.8 |
|
| 2.8 |
|
| 0.1 |
|
| 4.8 |
|
Realized gains |
|
| — |
|
| — |
|
| 0.7 |
|
| — |
|
| 0.7 |
|
Purchases, sales, issuances and settlements, net |
|
| (0.4 | ) |
| 1.6 |
|
| (11.8 | ) |
| 0.7 |
|
| (9.9 | ) |
Ending balance at July 31, 2010 |
| $ | 2.4 |
| $ | 14.8 |
| $ | 33.1 |
| $ | 16.3 |
| $ | 66.6 |
|
Unrealized gains |
|
| — |
|
| 1.5 |
|
| 2.1 |
|
| 3.4 |
|
| 7.0 |
|
Realized gains |
|
| — |
|
| 1.0 |
|
| — |
|
| — |
|
| 1.0 |
|
Purchases, sales, issuances and settlements, net |
|
| (2.1 | ) |
| 0.3 |
|
| (3.8 | ) |
| 18.3 |
|
| 12.7 |
|
Ending balance at July 31, 2011 |
| $ | 0.3 |
| $ | 17.6 |
| $ | 31.4 |
| $ | 38.0 |
| $ | 87.3 |
|
Fair values of the assets held by the international pension plans by asset category are as follows (in millions):
|
|
|
|
|
|
|
|
|
|
|
|
|
|
Asset Category |
| Quoted Prices in |
| Significant |
| Significant |
| Total |
| ||||
2011 |
|
|
|
|
|
|
|
|
|
|
|
|
|
Global Equity Securities |
| $ | 33.5 |
| $ | — |
| $ | — |
| $ | 33.5 |
|
Fixed Income Securities |
|
| — |
|
| 26.5 |
|
| — |
|
| 26.5 |
|
Equity/Fixed Income |
|
| 15.4 |
|
| — |
|
| 26.3 |
|
| 41.7 |
|
Real Assets |
|
| — |
|
| 6.5 |
|
| — |
|
| 6.5 |
|
Total International Assets at July 31, 2011 |
| $ | 48.9 |
| $ | 33.0 |
| $ | 26.3 |
| $ | 108.2 |
|
2010 |
|
|
|
|
|
|
|
|
|
|
|
|
|
Global Equity Securities |
| $ | 26.8 |
| $ | — |
| $ | — |
| $ | 26.8 |
|
Fixed Income Securities |
|
| — |
|
| 20.7 |
|
| — |
|
| 20.7 |
|
Equity/Fixed Income |
|
| 12.5 |
|
| — |
|
| 21.7 |
|
| 34.2 |
|
Real Assets |
|
| — |
|
| 5.5 |
|
| — |
|
| 5.5 |
|
Total International Assets at July 31, 2010 |
| $ | 39.3 |
| $ | 26.2 |
| $ | 21.7 |
| $ | 87.2 |
|
Global equity consists of a fixed weights index fund, used to maintain a fixed 50/50 distribution between UK and overseas assets. Publicly traded equities are valued at the closing price reported in the active market in which the individual securities are traded.
Fixed income consists of corporate bond funds with the investment objective to achieve active corporate bond returns which are inflation linked and paid as a single payment in 2055. Corporate bonds and notes are valued at either the closing price reported if traded on an active market or at yields currently available on comparable securities of issuers with similar credit ratings or valued under a discounted cash flows approach that maximizes observable inputs, such as current yields of similar instruments, but includes adjustments for certain risks that may not be observable such as credit and liquidity risks.
Equity/Fixed Income consists of Level 1 assets that are part of a unit linked fund with a strategic asset allocation of 40% fixed income products and 60% equity type products. Assets are valued at either the closing price reported if traded on an active market or at yields currently available on comparable securities of issuers with similar credit ratings. Index funds are valued at the net asset value as determined by the custodian of the fund. The Level 3 assets are composed of mathematical reserves on individual contracts and the Company does not have any influence on the investment decisions as made by the insurer due to the specific minimum guaranteed return characteristics of this type of contract. European insurers in general, broadly have a strategic asset allocation with 80%-90% fixed income products and 20%-10% equity type products (including real estate).
Real Assets consists of property funds. Property funds are valued using the most recent partnership statement of fair value, updated for any subsequent partnership interests’ cash flows.
The following table sets forth a summary of changes in the fair values of the International pension plans’ Level 3 assets for the year ended July 31, 2011 and 2010 (in millions):
|
|
|
|
|
|
| Equity/Fixed |
| |
Beginning balance at August 1, 2009 |
| $ | 23.1 |
|
Unrealized gains |
|
| 0.3 |
|
Foreign currency exchange |
|
| (1.9 | ) |
Purchases, sales, issuances and settlements, net |
|
| 0.2 |
|
Ending balance at July 31, 2010 |
| $ | 21.7 |
|
Unrealized gains |
|
| 0.9 |
|
Foreign currency exchange |
|
| 2.5 |
|
Purchases, sales, issuances and settlements, net |
|
| 1.2 |
|
Ending balance at July 31, 2011 |
| $ | 26.3 |
|
Investment Policies and Strategies.For the Company’s U.S. plans, the Company uses a total return investment approach to achieve a long-term return on plan assets, with a prudent level of risk for the purpose of meeting its retirement income commitments to employees. The plan’s investments are diversified to assist in managing risk. The Company’s asset allocation guidelines target an allocation of 45 percent equity securities, 30 percent alternative investments (funds of hedge funds), 10 percent real assets (investments into funds containing commodities and real estate), 10 percent fixed income, and 5 percent private equity. Within equity securities, the Company will target an allocation of 15 percent international, 15 percent equity long / long/short, 10 percent small cap and 5 percent large cap. These target allocation guidelines are determined in consultation with the Company’s investment consultant, and through the use of modeling the risk/return trade-offs among asset classes utilizing assumptions about expected annual return, expected volatility/standard deviation of returns, and expected correlations with other asset classes. Investment policy and performance is measured and monitored on an ongoing basis by the Company’s investment committee through its use of an investment consultant and through quarterly investment portfolio reviews.
For the Company’s non-U.S. plans, the general investment objectives are to maintain a suitably diversified portfolio of secure assets of appropriate liquidity which will generate income and capital growth to meet, together with any new contributions from members and the Company, the cost of current and future benefits. Investment policy and performance is measured and monitored on an ongoing basis by the Company’s investment committee through its use of an investment consultant and through quarterly investment portfolio reviews.
Estimated Contributions and Future PaymentsAs a result ofThe Company’s general funding policy for its past funding practices,pension plans is to make at least the minimum contributions as required by applicable regulations. Additionally, the Company does not have a minimum required contribution undermay elect to make additional contributions up to the Pension Benefit Guarantee Corporation requirements formaximum tax deductible contribution. As such, the Company made contributions of $20.6 million to its U.S. pension plans in Fiscal 2011. There is no minimum funding request for the Company’s U.S. plans for Fiscal 2010. As a result, there2012. The Company is no current intention to makecurrently evaluating whether or not a U.S. pension contribution will be made in Fiscal 2010. For2012. The Company made contributions of $7.1 million to its non-U.S. pension plans the Companyin Fiscal 2011 and estimates that it will contribute approximately $5$4.7 million in Fiscal 2010,2012 based upon the local government prescribed funding requirements. Future estimates of the Company’s pension plan contributions may change significantly depending on the actual rate of return on plan assets, discount rates and regulatory requirements.
Estimated future benefit payments for the Company’s U.S. and non-U.S. plans are as follows (thousands of dollars):
|
|
|
|
|
Fiscal year 2010 |
| $ | 18,528 |
|
Fiscal year 2011 |
| $ | 18,624 |
|
Fiscal year 2012 |
| $ | 22,469 |
|
Fiscal year 2013 |
| $ | 20,829 |
|
Fiscal year 2014 |
| $ | 23,313 |
|
Fiscal years 2015-2019 |
| $ | 125,346 |
|
|
|
|
|
|
Fiscal Year |
|
|
|
|
2012 |
| $ | 25,769 |
|
2013 |
| $ | 23,314 |
|
2014 |
| $ | 25,648 |
|
2015 |
| $ | 26,242 |
|
2016 |
| $ | 25,323 |
|
2017-2021 |
| $ | 148,290 |
|
Postemployment and Postretirement Benefit PlansThe Company provides certain postemployment and postretirement health care benefits for certain U.S. employees for a limited time after termination of employment. The Company has recorded a liability for its postretirement benefit plan in the amount of $1.7$1.5 million and $3.1$1.6 million as of July 31, 20092011 and July 31, 2008,2010, respectively. The annual cost resulting from these benefits is not material. Union negotiations have resulted in one U.S. plant freezing the plan. This change resulted in a curtailment gain of $1.4 million. For measurement purposes, an 8a 7.4 percent annual rate of increase in the per capita cost of covered health care benefits was assumed for Fiscal 2009.2011. The Company has assumed that the long-term rate of increase will decrease gradually to an ultimate annual rate of 54.5 percent. A one-percentage point increase in the health care cost trend rate would increase the Fiscal 20092011 and 20082010 liability by $0.1 million and $0.5 million, respectively.million.
Retirement Savings and Employee Stock Ownership PlanThe Company provides a contributory employee savings plan to U.S. employees that permits participants to make contributions by salary reduction pursuant to section 401(k) of the Internal Revenue Code. Through April 13, 2009, employeeEmployee contributions of up to 25 percent of compensation are matched at a rate equaling 100 percent of the first 3 percent contributed and 50 percent of the next 2 percent contributed. The Company’s contributions under this plan are based on the level of employee contributions as well as a discretionary contribution based on performance of the Company. The Plan was amended effective April 13, 2009, to reduce Company fixed matching contributions to the Plan for salaried employees. After April 13, 2009, fixed matching contributions for salaried employees were calculated at 50 percent of up to 3 percent of compensation deferred by the participant and deposited into the Plan, and 25 percent of the next 2 percent of compensation deferred by
the participant and deposited to the Plan. In addition, the Company fixed matching contribution was eliminated for Company Executive Officers and Vice Presidents. Total contribution expense for these plans was $5.1$9.1 million, $8.3$4.5 million, and $8.1$5.1 million for the years ended July 31, 2009, 20082011, 2010, and 2007,2009, respectively. This plan also includes shares from an Employee Stock Ownership Plan (“ESOP”). As of July 31, 2009,2011, all shares of the ESOP have been allocated to participants. Total ESOP shares are considered to be shares outstanding for earnings per share calculations.
Deferred Compensation and Other Benefit PlansThe Company provides various deferred compensation and other benefit plans to certain executives. The deferred compensation plan allows these employees to defer the receipt of all of their bonus and other stock related compensation and up to 75 percent of their salary to future periods. Other benefit plans are provided to supplement the benefits for a select group of highly compensated individuals which are reduced because of compensation limitations set by the Internal Revenue Code. The Company has recorded a liability in the amount of $10.0$9.2 million and $10.6$8.8 million as of the year ended July 31, 20092011 and July 31, 2008,2010, respectively, related primarily to its deferred compensation plans.
NOTE G
H Shareholders’ Equity
Stock RightsOn January 27, 2006, the Board of Directors of the Company approved the extension of the benefits afforded by the Company’s existing rights plan by adopting a new shareholder rights plan. Pursuant to the Rights Agreement, dated as of January 27, 2006 by and between the Company and Wells Fargo Bank, N.A., as Rights Agent, one right was issued on March 3, 2006 for each outstanding share of common stock of the Company upon the expiration of the Company’s existing rights. Each of the new rights entitles the registered holder to purchase from the Company one one-thousandth of a share of Series A Junior Participating Preferred Stock, without par value, at a price of $143.00 per one one-thousandth of a share. The rights, however, will not become exercisable unless and until, among other things, any person acquires 15 percent or more of the outstanding common stock of the Company. If a person acquires 15 percent or more of the outstanding common stock of the Company (subject to certain conditions and exceptions more fully described in the Rights Agreement), each right will entitle the holder (other than the person who acquired 15 percent or more of the outstanding common stock) to purchase common stock of the Company having a market value equal to twice the exercise price of a right. The rights are redeemable under certain circumstances at $.001 per right and will expire, unless earlier redeemed, on March 2, 2016.
Stock Compensation PlansThe Stock Compensation Plans in the Consolidated Statements of Changes in Shareholders’ Equity consist of the balance of amounts payable to eligible participants for stock compensation that was deferred to a Rabbi Trust pursuant to the provisions of the 20012010 Master Stock Incentive Plan, as well as performance awards payable in common stock discussed further in Note H.I.
Treasury StockThe Company believes that the share repurchase program is a way of providing return to its shareholders. The Board of Directors authorized the repurchase, at the Company’s discretion, of up to 8.0 million shares of common stock under the stock repurchase plan dated March 31, 2006.26, 2010. As of July 31, 2009,2011, the Company had remaining authorization to repurchase 0.95.0 million shares under this plan. Following is a summary of treasury stock share activity for Fiscal 20092011 and 2008:2010:
|
|
|
|
|
|
|
|
|
|
|
|
|
|
|
|
| 2009 |
| 2008 |
|
| 2011 |
| 2010 |
| ||||
Balance at beginning of year |
| 11,021,619 |
| 9,500,372 |
|
| 12,222,381 |
| 11,295,409 |
| ||||
Stock repurchases |
| 802,000 |
| 2,245,790 |
|
| 1,956,648 |
| 1,651,600 |
| ||||
Net issuance upon exercise of stock options |
| (355,491 | ) |
| (647,225 | ) |
| (862,981 | ) |
| (667,991 | ) | ||
Issuance under compensation plans |
| (99,612 | ) |
| (67,822 | ) |
| (62,304 | ) |
| (46,197 | ) | ||
Discretionary stock paid into 401(k) plan |
| (60,122 | ) |
| — |
| ||||||||
Other activity |
|
| (12,985 | ) |
| (9,496 | ) |
|
| (7,880 | ) |
| (10,440 | ) |
Balance at end of year |
|
| 11,295,409 |
|
| 11,021,619 |
|
|
| 13,245,864 |
|
| 12,222,381 |
|
The Company initiated the purchase of an additional 162,900 shares for $9.2 million in July 2011 that are not included in Fiscal 2011 repurchases as the transactions did not settle until after fiscal year end. These repurchases will be included in Fiscal 2012 activity.
NOTE H
I Stock Option Plans
Employee Incentive PlansIn November 2001,2010 shareholders approved the 20012010 Master Stock Incentive Plan (the “Plan”) that replaced the 19912001 Plan that expiredwas scheduled to expire on December 31, 2001,2010 and provided for similar awards. The Plan extends through December 2011September 2020 and allows for the granting of nonqualified stock options, incentive stock options, restricted stock, restricted stock units, stock appreciation rights (“SAR”), dividend equivalents, dollar-denominated awards and other stock-based awards. Options under the Plan are granted to key employees at market price at the date of grant. Options are exercisable for up to 10 years from the date of grant. The Plan also allows for the granting of performance awards to a limited number of key executives. As administered by the Human Resources Committee of the Company’s Board of Directors, these performance awards are payable in common stock and are based on a formula which measures performance of the Company over a three-year period. Performance award expense under these plans totaled $1.8 million in Fiscal 2011 and $0.5 million in Fiscal 2010. The Company recorded a net reversal of performance award expense in Fiscal 2009 of $3.1 million. The net benefit ismillion due to the reversal of $3.6 million of Long-Term Compensation Plan expense recognized in prior periods. This reversal reflects an adjustment in the expected payouts for the three-year cycles ending July 31, 2009, and July 31, 2010, to zeroperiods based upon actual and forecasted results. Performance award expense under these plans totaled $4.2 million and $2.7 million in Fiscal 2008 and 2007, respectively.
Stock options issued from Fiscal 19992001 to Fiscal 20092011 become exercisable for non-executives in equal increments over three years. Stock options issued in Fiscal 2011 become exercisable for executives in equal increments over three years. Stock options issued from Fiscal 19992001 to Fiscal 20092010 became exercisable for most executives immediately upon the date of grant. Certain other stock options issued to executives during Fiscal 2004, 2006, and 2007 becomebecame exercisable in equal increments over three years. For Fiscal 2011, the Company recorded pretax compensation expense associated with stock options of $6.5 million and recorded $2.4 million of related tax benefit. For Fiscal 2010 and 2009, the Company recorded pretax compensation expense associated with stock options of $6.9 million and $4.1 million, respectively, and recorded$2.5 million and $1.5 million, respectively, of related tax benefit.
Stock-based employee compensation cost is recognized using the fair-value based method for all new awards granted after August 1, 2005. Compensation costs for unvested stock options and awards that were outstanding at August 1, 2005, are recognized over the requisite service period based on the grant-date fair value of those options and awards as previously calculated under the pro-forma disclosures.method. The Company determined the fair value of these awards using the Black-Scholes option pricing model, with the following weighted average assumptions:
|
|
|
|
|
|
|
|
|
|
|
|
|
|
|
|
|
|
|
|
|
|
| 2009 |
| 2008 |
| 2007 |
|
| 2011 |
| 2010 |
| 2009 |
| ||||||
Risk-free interest rate |
| 1.4 – 4.0% |
| 2.1 - 4.2% |
| 4.4 - 4.9% |
| |||||||||||||
Risk - free interest rate |
| <0.12 - 3.1 | % |
| < 0.01 - 3.9 | % |
| 1.4 - 4.0 | % | |||||||||||
Expected volatility |
| 21.6 – 25.5% |
| 15.2 – 22.4% |
| 18.3 - 23.6% |
|
| 25.5 - 34.7 | % |
| 24.4 - 32.3 | % |
| 21.6 - 25.5 | % | ||||
Expected dividend yield |
| 1.0% |
| 1.0% |
| 1.0% |
|
| 1.0 | % |
| 1.0 | % |
| 1.0 | % | ||||
|
|
|
|
|
|
|
| |||||||||||||
Expected life |
|
|
|
|
|
|
|
|
|
|
|
|
|
| ||||||
Director original grants without reloads |
| 8 years |
| 8 years |
| 7 years |
|
| 8 years |
| 8 years |
| 8 years |
| ||||||
Non-officer original grants |
| 7 years |
| 7 years |
| 6 years |
| |||||||||||||
Non - officer original grants |
| 8 years |
| 7 - 8 years |
| 7 years |
| |||||||||||||
Officer original grants with reloads |
| 4 years |
| 3 years |
| 3 years |
|
| — |
| 4 years |
| 4 years |
| ||||||
Reload grants |
| <5 years |
| <3 years |
| <1 year |
|
| <8 years |
| <8 years |
| <5 years |
| ||||||
Officer original grants without reloads |
| 7 years |
| 7 years |
| 6 years |
|
| 8 years |
| 8 years |
| 7 years |
| ||||||
Officer original grants with reloads and vesting |
| — |
| — |
| 5 years |
| |||||||||||||
Reload grants are grants made to officers or directors who exercised a reloadable option during the fiscal year and made payment of the purchase price using shares of previously owned Company stock. The reload grant is for the number of shares equal to the shares used in payment of the purchase price and/or withheld for minimum tax withholding. Beginning in Fiscal 2011 options no longer have a reload provision for officers and directors.
Black-Scholes is a widely accepted stock option pricing model; however, the ultimate value of stock options granted will be determined by the actual lives of options granted and the actual future price levels of the Company’s common stock. The weighted average fair value for options granted during Fiscal 2011, 2010, and 2009 2008is $17.26, $13.23, and 2007 is $8.56 $10.60 and $7.89 per share, respectively, using the Black-Scholes pricing model.
The following table summarizes stock option activity:
|
|
|
|
|
|
|
|
|
|
|
|
|
|
|
|
| Options |
| Weighted |
|
| Options |
| Weighted |
| ||||
Outstanding at July 31, 2008 |
| 5,181,778 |
| $ | 25.62 |
|
| 5,181,778 |
| $ | 25.62 |
| ||
Granted |
| 366,588 |
| 34.23 |
|
| 366,588 |
| 34.23 |
| ||||
Exercised |
| (505,363 | ) |
| 17.64 |
|
| (505,363 | ) |
| 17.64 |
| ||
Canceled |
|
| (44,878 | ) |
| 39.04 |
|
|
| (44,878 | ) |
| 39.04 |
|
Outstanding at July 31, 2009 |
|
| 4,998,125 |
|
| 26.94 |
|
| 4,998,125 |
| 26.94 |
| ||
Granted |
| 643,974 |
| 42.41 |
| |||||||||
Exercised |
| (848,990 | ) |
| 20.84 |
| ||||||||
Canceled |
|
| (21,297 | ) |
| 41.94 |
| |||||||
Outstanding at July 31, 2010 |
| 4,771,812 |
| 30.04 |
| |||||||||
Granted |
| 551,601 |
| 57.22 |
| |||||||||
Exercised |
| (1,121,751 | ) |
| 23.10 |
| ||||||||
Canceled |
|
| (7,665 | ) |
| 47.20 |
| |||||||
Outstanding at July 31, 2011 |
|
| 4,193,997 |
|
| 35.44 |
| |||||||
The total intrinsic value of options exercised during Fiscal 2011, 2010, and 2009 2008 and 2007 was $9.1$34.2 million, $26.2$19.5 million, and $20.6$9.1 million, respectively.
Shares reserved at July 31, 20092011 for outstanding options and future grants were 11,521,192.8,307,431. Shares reserved consist of shares available for grant plus all outstanding options. An amount isUpon shareholder approval of the 2010 Master Stock Incentive Plan, 4,600,000 shares were added to shares reserved each year based onreserved. Remaining shares outstanding adjustedavailable for certain items as detailed in the Plan. The aggregate number of shares of common stock that may be issued under all awardsgrant under the Plan in any calendar year may not exceed 1.5 percent of2001 plan were removed from the sum of the Company’s outstanding shares of common stock, the outstanding share equivalents, as determined by the Company in the calculation of earnings per share on a fully diluted basis, and shares held in treasury of the Company as reported for the Company’s most recent fiscal year that ends during such calendar year.reserved calculation.
The following table summarizes information concerning outstanding and exercisable options as of July 31, 2009:2011:
|
|
|
|
|
|
|
|
|
|
|
|
|
|
|
|
|
Range of Exercise Prices |
| Number |
| Weighted |
| Weighted |
| Number |
| Weighted |
| |||||
$5 to $15 |
|
| 603,792 |
|
| 1.03 |
| $ | 12.41 |
|
| 603,792 |
| $ | 12.41 |
|
$15 to $25 |
|
| 1,281,872 |
|
| 2.84 |
|
| 18.02 |
|
| 1,281,872 |
|
| 18.02 |
|
$25 and $35 |
|
| 2,463,644 |
|
| 5.52 |
|
| 31.57 |
|
| 2,338,294 |
|
| 31.48 |
|
$35 and above |
|
| 648,817 |
|
| 7.94 |
|
| 40.47 |
|
| 481,390 |
|
| 40.61 |
|
|
|
| 4,998,125 |
|
| 4.61 |
|
| 26.94 |
|
| 4,705,348 |
|
| 26.30 |
|
|
|
|
|
|
|
|
|
|
|
|
|
|
|
|
|
|
Range of Exercise Prices |
| Number |
| Weighted |
| Weighted |
| Number |
| Weighted |
| |||||
$12 to $22 |
|
| 658,066 |
|
| 1.19 |
| $ | 17.89 |
|
| 658,066 |
| $ | 17.89 |
|
$22 to $32 |
|
| 1,102,423 |
|
| 2.94 |
|
| 30.12 |
|
| 1,086,511 |
|
| 30.09 |
|
$32 to $42 |
|
| 1,121,686 |
|
| 5.67 |
|
| 34.95 |
|
| 1,101,164 |
|
| 34.96 |
|
$42 and above |
|
| 1,311,822 |
|
| 8.23 |
|
| 49.15 |
|
| 655,381 |
|
| 44.34 |
|
|
|
| 4,193,997 |
|
| 5.05 |
|
| 35.44 |
|
| 3,501,122 |
|
| 32.00 |
|
At July 31, 2009,2011, the aggregate intrinsic value of shares outstanding and exercisable was $57.5$85.0 million and $56.9$81.9 million, respectively.
The following table summarizes the status of options which contain vesting provisions:
|
|
|
|
|
|
|
|
|
|
|
|
|
|
|
|
| Options |
| Weighted |
|
| Options |
| Weighted |
| ||||
Non-vested at July 31, 2008 |
| 439,684 |
| $ | 10.43 |
| ||||||||
Non - vested at July 31, 2010 |
| 407,453 |
| $ | 12.89 |
| ||||||||
Granted |
| 79,575 |
| 8.83 |
|
| 482,250 |
| 18.45 |
| ||||
Vested |
| (207,390 | ) |
| 10.16 |
|
| (189,913 | ) |
| 12.27 |
| ||
Canceled |
|
| (19,092 | ) |
| 10.14 |
|
|
| (6,915 | ) |
| 15.42 |
|
Non-vested at July 31, 2009 |
|
| 292,777 |
|
| 10.21 |
| |||||||
Non - vested at July 31, 2011 |
|
| 692,875 |
|
| 16.90 |
| |||||||
The total fair value of shares vested during Fiscal 2011, 2010, and 2009 2008 and 2007 was $7.9$10.5 million, $6.3$8.0 million, and $2.8$7.9 million, respectively.
As of July 31, 20092011, there was $1.6$6.1 million of total unrecognized compensation cost related to non-vested stock options granted under the Plan. This unvested cost is expected to be recognized during Fiscal 2010,2012, Fiscal 20112013, and Fiscal 2012.2014.
NOTE I
J Income Taxes
The components of earnings before income taxes are as follows:
|
|
|
|
|
|
|
|
|
|
|
|
|
|
|
|
|
|
|
|
|
|
| 2009 |
| 2008 |
| 2007 |
|
| 2011 |
| 2010 |
| 2009 |
| ||||||
|
| (thousands of dollars) |
|
| (thousands of dollars) |
| ||||||||||||||
Earnings before income taxes: |
|
|
|
|
|
|
|
|
|
|
|
|
|
| ||||||
United States |
| $ | 69,863 |
| $ | 73,445 |
| $ | 88,157 |
|
| $ | 117,562 |
| $ | 85,987 |
| $ | 69,863 |
|
Foreign |
|
| 91,562 |
|
| 162,718 |
|
| 116,704 |
|
|
| 194,701 |
|
| 144,189 |
|
| 91,562 |
|
Total |
| $ | 161,425 |
| $ | 236,163 |
| $ | 204,861 |
|
| $ | 312,263 |
| $ | 230,176 |
| $ | 161,425 |
|
The components of the provision for income taxes are as follows:
|
|
|
|
|
|
|
|
|
|
|
|
|
|
|
|
|
|
|
|
|
|
| 2009 |
| 2008 |
| 2007 |
|
| 2011 |
| 2010 |
| 2009 |
| ||||||
|
| (thousands of dollars) |
|
| (thousands of dollars) |
| ||||||||||||||
Income taxes: |
|
|
|
|
|
|
|
|
|
|
|
|
|
| ||||||
Current: |
|
|
|
|
|
|
| |||||||||||||
Current |
|
|
|
|
|
|
| |||||||||||||
Federal |
| $ | 18,624 |
| $ | 27,180 |
| $ | 27,430 |
|
| $ | 26,675 |
| $ | 25,455 |
| $ | 18,624 |
|
State |
| 2,444 |
| 619 |
| 2,975 |
|
| 3,555 |
| 2,206 |
| 2,444 |
| ||||||
Foreign |
|
| 13,176 |
|
| 37,616 |
|
| 28,140 |
|
|
| 54,785 |
|
| 33,327 |
|
| 13,176 |
|
|
|
| 34,244 |
|
| 65,415 |
|
| 58,545 |
|
|
| 85,015 |
|
| 60,988 |
|
| 34,244 |
|
Deferred: |
|
|
|
|
|
|
| |||||||||||||
Deferred |
|
|
|
|
|
|
| |||||||||||||
Federal |
| (3,888 | ) |
| (4,712 | ) |
| (4,674 | ) |
| 8,556 |
| 3,860 |
| (3,888 | ) | ||||
State |
| 90 |
| 2 |
| (332 | ) |
| 191 |
| 20 |
| 90 |
| ||||||
Foreign |
|
| (928 | ) |
| 3,505 |
|
| 605 |
|
|
| (6,790 | ) |
| (855 | ) |
| (928 | ) |
|
|
| (4,726 | ) |
| (1,205 | ) |
| (4,401 | ) |
|
| 1,957 |
|
| 3,025 |
|
| (4,726 | ) |
Total |
| $ | 29,518 |
| $ | 64,210 |
| $ | 54,144 |
|
| $ | 86,972 |
| $ | 64,013 |
| $ | 29,518 |
|
The following table reconciles the U.S. statutory income tax rate with the effective income tax rate:
|
|
|
|
|
|
|
|
|
|
|
|
|
|
|
|
|
|
|
|
|
|
| 2009 |
| 2008 |
| 2007 |
|
| 2011 |
| 2010 |
| 2009 |
| ||||||
Statutory U.S. federal rate |
| 35.0 | % |
| 35.0 | % |
| 35.0 | % |
| 35.0 | % |
| 35.0 | % |
| 35.0 | % | ||
State income taxes |
| 1.3 |
| 0.3 |
| 0.8 |
|
| 1.0 |
| 0.8 |
| 1.3 |
| ||||||
Foreign taxes at lower rates |
| (7.5 | ) |
| (7.6 | ) |
| (5.9 | ) |
| (6.6 | ) |
| (8.2 | ) |
| (7.5 | ) | ||
Export, manufacturing and research credits |
| (0.5 | ) |
| (0.6 | ) |
| (1.5 | ) |
| (1.6 | ) |
| (0.9 | ) |
| (0.5 | ) | ||
Tax on repatriation of earnings |
| 0.7 |
| (0.6 | ) |
| (1.1 | ) | ||||||||||||
U.S. tax impact on repatriation of earnings |
| (0.3 | ) |
| 0.1 |
| 0.7 |
| ||||||||||||
Change in unrecognized tax benefits |
| (10.6 | ) |
| 0.5 |
| 0.1 |
|
| 0.1 |
| 1.2 |
| (10.6 | ) | |||||
Other |
|
| (0.1 | ) |
| 0.2 |
|
| (1.0 | ) |
|
| 0.3 |
|
| (0.2 | ) |
| (0.1 | ) |
|
|
| 18.3 | % |
| 27.2 | % |
| 26.4 | % |
|
| 27.9 | % |
| 27.8 | % |
| 18.3 | % |
The tax effects of temporary differences that give rise to deferred tax assets and liabilities are as follows:
|
|
|
|
|
|
|
|
|
| 2009 |
| 2008 |
| ||
|
| (thousands of dollars) |
| ||||
Deferred tax assets: |
|
|
|
|
|
|
|
Accrued expenses |
| $ | 8,438 |
| $ | 11,146 |
|
Compensation and retirement plans |
|
| 30,916 |
|
| 812 |
|
Tax credit and NOL carryforwards |
|
| 1,439 |
|
| 6,625 |
|
Inventory reserves |
|
| 10,183 |
|
| 8,588 |
|
Other |
|
| 2,232 |
|
| 4,370 |
|
Deferred tax assets |
|
| 53,208 |
|
| 31,541 |
|
Valuation allowance |
|
| (1,053 | ) |
| (2,472 | ) |
Net deferred tax assets |
|
| 52,155 |
|
| 29,069 |
|
Deferred tax liabilities: |
|
|
|
|
|
|
|
Depreciation and amortization |
|
| (31,593 | ) |
| (28,636 | ) |
Other |
|
| (2,923 | ) |
| (2,584 | ) |
Deferred tax liabilities |
|
| (34,516 | ) |
| (31,220 | ) |
Net deferred tax asset (liability) |
| $ | 17,639 |
| $ | (2,151 | ) |
|
|
|
|
|
|
|
|
|
| 2011 |
| 2010 |
| ||
|
| (thousands of dollars) |
| ||||
Deferred tax assets: |
|
|
|
|
|
|
|
Accrued expenses |
| $ | 12,243 |
| $ | 9,130 |
|
Compensation and retirement plans |
|
| 33,298 |
|
| 39,438 |
|
Tax credit and NOL carryforwards |
|
| 1,173 |
|
| 954 |
|
Inventory reserves |
|
| 9,545 |
|
| 8,324 |
|
Other |
|
| 3,311 |
|
| 1,846 |
|
Deferred tax assets: |
|
| 59,570 |
|
| 59,692 |
|
Valuation allowance |
|
| (692 | ) |
| (604 | ) |
Net deferred tax assets |
|
| 58,878 |
|
| 59,088 |
|
Deferred tax liabilities: |
|
|
|
|
|
|
|
Depreciation and amortization |
|
| (37,112 | ) |
| (30,248 | ) |
Other |
|
| (1,119 | ) |
| (1,420 | ) |
Deferred tax liabilities |
|
| (38,231 | ) |
| (31,668 | ) |
Net deferred tax asset |
| $ | 20,647 |
| $ | 27,420 |
|
The effective tax rate for Fiscal 20092011 was 18.327.9 percent compared 27.2to 27.8 percent in Fiscal 2008.2010. The decrease in effectiveaverage underlying tax rate isremained at 29.7 percent, while discrete items were also a consistent percentage of pre-tax profits. Fiscal 2010 contained $4.3 million of discrete tax benefits from the expiration of the statute of limitations at foreign subsidiaries and other discrete items. Fiscal 2011 contained $5.8 million of discrete tax benefits primarily due tofrom the settlementsrelease of long-standing court cases and examinationsreserves after the favorable conclusions of foreign tax audits, the expiration of statutes in various jurisdictions, for tax years 2003 through 2006, the reassessment of the corresponding unrecognized tax benefits for the subsequent open years and a favorable resolution of a foreign tax matter. Partially offsetting these effects, the Company’s Fiscal 2009 tax rate was unfavorably impacted by an increased expense from the repatriation of foreign earnings. Absent these items, the underlying tax rate for the Fiscal 2009 has decreased from Fiscal 2008 by 1.2 points to 30.4 percent. The reinstatement of the U.S. Research and Experimentation credit, changes in current year unrecognized tax benefits, reduced statutory tax rates and the mixfavorable impact of earnings betweendividends from some foreign jurisdictions all contributed to the reduction in the underlying rate.subsidiaries.
The Company has not provided for U.S. income taxes on additional undistributed earnings of non-U.S. subsidiaries of approximately $483.4$623.0 million. The Company currently plansintends to permanently reinvest these undistributed earnings in its non-U.S. subsidiaries.overseas as there are significant investment opportunities there, and the Company does not intend to incur a tax cost to repatriate these funds. If any portion were to be distributed, the related U.S. tax liability may be reduced by foreign income taxes paid on those earnings plus any available foreign tax credit carryovers. Determination of the unrecognized deferred tax liability related to these undistributed earnings is not practicable.
While non-US operations have been profitable overall, theThe Company has cumulative pre-tax loss carryforwards of $6.7$4.8 million, which are carried as net operating lossesexist in certainvarious international subsidiaries. If fully realized, the unexpired net operating losses may be carried forward to offset future local income tax payments of $1.2 million, at current rates of tax, of $1.4 million.tax. Approximately 3712 percent of these net operating losses expire within the next three years, while the majority of the remaining net operating loss carryforwards expire more than 5 years out or have no statutory expiration under current local laws. However, as it is more likely than notmore-likely-than-not that certain of these losses will not be realized, a valuation allowance of $1.1$0.7 million exists as of July 31, 2009.2011.
The Company adopted the provisions of FIN 48,Accountingmaintains a reserve for Uncertainty in Income Taxes, an Interpretation of FASB Statement No. 109,on August 1, 2007.uncertain tax benefits. The accounting standard defines the threshold for recognizing the benefits of tax return positions in the financial statements as “more-likely-than-not” to be sustained by the taxing authorities based solely on the technical merits of the position. If the recognition threshold is met, the tax benefit is measured and recognized as the largest amount of tax benefit that in the Company’s judgment is greater than
50 percent likely to be realized. As a result of the implementation of FIN 48, the Company recognized a $0.3 million increase in the liability for unrecognized tax benefits, which was accounted for as a reduction to the August 1, 2007, balance of retained earnings. A reconciliation of the beginning and ending amount of gross unrecognized tax benefits is as follows (thousands of dollars):follows:
|
|
|
|
|
|
|
|
|
|
|
|
|
|
|
|
|
|
|
| 2009 |
| 2008 |
|
| 2011 |
| 2010 |
| 2009 |
| |||||
|
| (thousands of dollars) |
|
| (thousands of dollars) |
| |||||||||||
Gross unrecognized tax benefits at beginning of fiscal year |
| $ | 32,002 |
| $ | 28,209 |
|
| $ | 18,994 |
| $ | 16,928 |
| $ | 32,002 |
|
Additions for tax positions of the current year |
| 3,527 |
| 8,221 |
|
| 7,406 |
| 3,122 |
| 3,527 |
| |||||
Additions for tax positions of prior years |
| 772 |
| 2,322 |
|
| 668 |
| 470 |
| 772 |
| |||||
Reductions for tax positions of prior years |
| (8,258 | ) |
| (540 | ) |
| (164 | ) |
| (179 | ) |
| (8,258 | ) | ||
Settlements |
| (10,092 | ) |
| — |
|
| (3,895 | ) |
| — |
| (10,092 | ) | |||
Reductions due to lapse of applicable statute of limitations |
|
| (1,023 | ) |
| (6,210 | ) |
|
| (3,004 | ) |
| (1,347 | ) |
| (1,023 | ) |
Gross unrecognized tax benefits at end of fiscal year |
| $ | 16,928 |
| $ | 32,002 |
|
| $ | 20,005 |
| $ | 18,994 |
| $ | 16,928 |
|
The Company recognizes interest and penalties accrued related to unrecognized tax benefits in income tax expense. During the fiscal year ended July 31, 2009,2011, the Company recognized interest expense, net of tax benefit, of approximately $0.7$0.3 million. At July 31, 20092011 and 2008,July 31, 2010, accrued interest and penalties on a gross basis were $1.8$1.5 million and $5.7$2.5 million, respectively.
The Company’s uncertain tax positions are affected by the tax years that are under audit or remain subject to examination by the relevant taxing authorities. The following tax years, in addition to the current year, remain subject to examination, at least for certain issues, by the major tax jurisdictions indicated:
|
|
|
Major Jurisdictions |
| Open Tax Years |
Belgium |
|
|
China |
|
|
France |
|
|
Germany |
|
|
Italy |
| 2003 through |
Japan | 2009 through 2010 | |
Mexico |
|
|
Thailand | 2005 through 2010 | |
United Kingdom |
|
|
United States |
|
|
If the Company were to prevail on all unrecognized tax benefits recorded, substantially all of the unrecognized tax benefits would benefit the effective tax rate. With an average statute of limitations of about 5 years, up to $1.4$3.0 million of the unrecognized tax benefits could potentially be realizedexpire in the next 12 month period, unless extended by audit.
In accordance with SFAS No. 123R,Share Based Payment – Revised 2004, SFAS No. 109,Accounting for Income Taxes It is possible that quicker than expected settlement of either current or future audits and EITF Topic D-32,Intra-period Tax Allocationdisputes would cause additional reversals of previously recorded reserves in the Effect of Pretax Income from Continuing Operations,next 12 month period. Currently, the Company has elected to use the “with-and-without” intra-periodapproximately $0.2 million of unrecognized tax allocation rules. Under these rules, the windfall tax benefit is calculated based on the incremental tax benefit received from deductionsbenefits that are in dispute with various taxing authorities related to stock-based compensation.transfer pricing and deductibility of expenses. Quantification of an estimated range and timing of future audit settlements cannot be made at this time.
NOTE K Segment Reporting
NOTE JSegment Reporting
Consistent with SFAS No. 131,Disclosures about Segments of an Enterprise and Related Information,FASB guidance related to segment reporting, the Company identified two reportable segments: Engine Products and Industrial Products. Segment selection was based on the internal organizational structure, management of operations, and performance evaluation by management and the Company’s Board of Directors.
The Engine Products segment sells to OEMs in the construction, mining, agriculture, aerospace, defense, and truck markets and to independent distributors, OEM dealer networks, private label accounts, and large equipment fleets. Products include air filtration systems, exhaust and emissions systems, liquid filtration systems, and replacement filters.
The Industrial Products segment sells to various industrial end-users, OEMs of gas-fired turbines, and OEMs and end-users requiring highly purifiedclean air. Products include dust, fume, and mist collectors, compressed air purification systems, air filterfiltration systems for gas turbines, PTFE membrane based products, and specialized air filtration systems for applications including computer hard disk drives.
Corporate and Unallocated includes corporate expenses determined to be non-allocable to the segments, and interest income, and interest expense. Assets included in Corporate and Unallocated principally are cash and cash equivalents,
inventory reserves, certain prepaids, certain investments, other assets, and assets allocated to general corporate purposes.
The Company has an internal measurement system to evaluate performance and allocate resources based on profit or loss from operations before income taxes. The Company’s manufacturing facilities serve both reporting segments. Therefore, the Company uses an allocation methodology to assign costs and assets to the segments. A certain amount of costs and assets relate to general corporate purposes and are not assigned to either segment. Certain accounting policies applied to the reportable segments differ from those described in the summary of significant accounting policies. The reportable segments account for receivables on a gross basis and account for inventory on a standard cost basis.
Segment allocated assets are primarily accounts receivable, inventories, property, plant and equipment, and goodwill. Reconciling items included in Corporate and Unallocated are created based on accounting
differences between segment reporting and the consolidated, external reporting as well as internal allocation methodologies.
The Company is an integrated enterprise, characterized by substantial intersegment cooperation, cost allocations, and sharing of assets. Therefore, we do not represent that these segments, if operated independently, would report the operating profit and other financial information shown below. In the following table, reclassifications have been made in prior periods as a result of an internal reorganization of Industrial Hydraulics from Industrial Products to Engine Products, which became effective August 1, 2010.
Segment detail is summarized as follows:
|
|
|
|
|
|
|
|
|
|
|
|
|
|
|
|
|
|
|
|
|
|
|
|
|
|
|
|
| Engine |
| Industrial |
| Corporate & |
| Total |
|
| Engine |
| Industrial |
| Corporate & |
| Total |
| ||||||||
|
| (thousands of dollars) |
| |||||||||||||||||||||||
2011 |
|
|
|
|
|
|
|
|
| |||||||||||||||||
Net sales |
| $ | 1,440,495 |
| $ | 853,534 |
| $ | — |
| $ | 2,294,029 |
| |||||||||||||
Depreciation and amortization |
| 36,338 |
| 19,396 |
| 4,757 |
| 60,491 |
| |||||||||||||||||
Equity earnings in unconsolidated affiliates |
| 3,302 |
| 803 |
| — |
| 4,105 |
| |||||||||||||||||
Earnings before income taxes |
| 211,255 |
| 123,871 |
| (22,863 | ) |
| 312,263 |
| ||||||||||||||||
Assets |
| 888,080 |
| 519,730 |
| 318,283 |
| 1,726,093 |
| |||||||||||||||||
Equity investments in unconsolidated affiliates |
| 16,619 |
| 2,558 |
| — |
| 19,177 |
| |||||||||||||||||
Capital expenditures, net of acquired businesses |
| 36,423 |
| 19,442 |
| 4,768 |
| 60,633 |
| |||||||||||||||||
|
|
|
|
|
|
|
|
|
| |||||||||||||||||
2010 |
|
|
|
|
|
|
|
|
| |||||||||||||||||
Net sales |
| $ | 1,126,007 |
| $ | 751,057 |
| $ | — |
| $ | 1,877,064 |
| |||||||||||||
Depreciation and amortization |
| 33,433 |
| 20,935 |
| 4,864 |
| 59,232 |
| |||||||||||||||||
Equity earnings in unconsolidated affiliates |
| 1,859 |
| 160 |
| — |
| 2,019 |
| |||||||||||||||||
Earnings before income taxes |
| 155,833 |
| 91,084 |
| (16,741 | ) |
| 230,176 |
| ||||||||||||||||
Assets |
| 702,300 |
| 477,154 |
| 320,052 |
| 1,499,506 |
| |||||||||||||||||
Equity investments in unconsolidated affiliates |
| 14,860 |
| 625 |
| — |
| 15,485 |
| |||||||||||||||||
Capital expenditures, net of acquired businesses |
| 24,355 |
| 15,250 |
| 3,544 |
| 43,149 |
| |||||||||||||||||
|
| (thousands of dollars) |
|
|
|
|
|
|
|
|
|
| ||||||||||||||
2009 |
|
|
|
|
|
|
|
|
|
|
|
| ||||||||||||||
Net sales |
| $ | 1,001,961 |
| $ | 866,668 |
| $ | — |
| $ | 1,868,629 |
|
| $ | 1,027,685 |
| $ | 840,944 |
| $ | — |
| $ | 1,868,629 |
|
Depreciation and amortization |
| 31,517 |
| 21,156 |
| 5,924 |
| 58,597 |
|
| 32,287 |
| 20,386 |
| 5,924 |
| 58,597 |
| ||||||||
Equity earnings in unconsolidated affiliates |
| 2,172 |
| 94 |
| — |
| 2,266 |
|
| 2,172 |
| 94 |
| — |
| 2,266 |
| ||||||||
Earnings before income taxes |
| 83,797 |
| 89,526 |
| (11,898 | ) |
| 161,425 |
|
| 85,896 |
| 87,427 |
| (11,898 | ) |
| 161,425 |
| ||||||
Assets |
| 610,341 |
| 495,228 |
| 228,427 |
| 1,333,996 |
|
| 631,278 |
| 474,291 |
| 228,427 |
| 1,333,996 |
| ||||||||
Equity investments in unconsolidated affiliates |
| 15,474 |
| 517 |
| — |
| 15,991 |
|
| 15,474 |
| 517 |
| — |
| 15,991 |
| ||||||||
Capital expenditures, net of acquired businesses |
| 24,785 |
| 16,637 |
| 4,658 |
| 46,080 |
|
| 25,390 |
| 16,032 |
| 4,658 |
| 46,080 |
| ||||||||
2008 |
|
|
|
|
|
|
|
|
| |||||||||||||||||
Net sales |
| $ | 1,229,171 |
| $ | 1,003,350 |
| $ | — |
| $ | 2,232,521 |
| |||||||||||||
Depreciation and amortization |
| 27,386 |
| 19,314 |
| 10,032 |
| 56,732 |
| |||||||||||||||||
Equity earnings in unconsolidated affiliates |
| 1,876 |
| 34 |
| — |
| 1,910 |
| |||||||||||||||||
Earnings before income taxes |
| 158,931 |
| 102,420 |
| (25,188 | ) |
| 236,163 |
| ||||||||||||||||
Assets |
| 628,444 |
| 590,273 |
| 329,905 |
| 1,548,622 |
| |||||||||||||||||
Equity investments in unconsolidated affiliates |
| 15,190 |
| 506 |
| — |
| 15,696 |
| |||||||||||||||||
Capital expenditures, net of acquired businesses |
| 34,830 |
| 24,564 |
| 12,758 |
| 72,152 |
| |||||||||||||||||
2007 |
|
|
|
|
|
| �� |
|
|
| ||||||||||||||||
Net sales |
| $ | 1,084,262 |
| $ | 834,566 |
| $ | — |
| $ | 1,918,828 |
| |||||||||||||
Depreciation and amortization |
| 23,735 |
| 16,512 |
| 9,319 |
| 49,566 |
| |||||||||||||||||
Equity earnings in unconsolidated affiliates |
| 6,128 |
| (225 | ) |
| — |
| 5,903 |
| ||||||||||||||||
Earnings before income taxes |
| 140,762 |
| 80,321 |
| (16,222 | ) |
| 204,861 |
| ||||||||||||||||
Assets |
| 540,510 |
| 510,817 |
| 267,690 |
| 1,319,017 |
| |||||||||||||||||
Equity investments in unconsolidated affiliates |
| 14,968 |
| 2,445 |
| — |
| 17,413 |
| |||||||||||||||||
Capital expenditures, net of acquired businesses |
| 37,083 |
| 25,798 |
| 14,559 |
| 77,440 |
| |||||||||||||||||
Following are net sales by product within the Engine Products segment and Industrial Products segment:
|
|
|
|
|
|
|
|
|
|
|
|
|
|
|
|
|
|
|
|
|
|
| 2009 |
| 2008 |
| 2007 |
|
| 2011 |
| 2010 |
| 2009 |
| ||||||
|
| (thousands of dollars) |
|
| (thousands of dollars) |
| ||||||||||||||
Engine Products segment: |
|
|
|
|
|
|
|
|
|
|
|
|
|
| ||||||
Off-Road Products* |
| $ | 362,785 |
| $ | 448,681 |
| $ | 352,065 |
| ||||||||||
Off-Road Products |
| $ | 327,557 |
| $ | 222,329 |
| $ | 243,691 |
| ||||||||||
Aerospace and Defense Products |
| 104,883 |
| 111,977 |
| 119,094 |
| |||||||||||||
On-Road Products |
| 71,958 |
| 123,146 |
| 166,370 |
|
| 127,107 |
| 81,874 |
| 71,958 |
| ||||||
Aftermarket Products** |
|
| 567,218 |
|
| 657,344 |
|
| 565,827 |
| ||||||||||
Aftermarket Products* |
| 861,393 |
| 691,899 |
| 561,846 |
| |||||||||||||
Retrofit Emissions Products |
|
| 19,555 |
|
| 17,928 |
|
| 31,096 |
| ||||||||||
Total Engine Products segment |
|
| 1,001,961 |
|
| 1,229,171 |
|
| 1,084,262 |
|
|
| 1,440,495 |
|
| 1,126,007 |
|
| 1,027,685 |
|
|
|
|
|
|
|
|
| |||||||||||||
Industrial Products segment: |
|
|
|
|
|
|
|
|
|
|
|
|
|
| ||||||
Industrial Filtration Solutions Products |
| 503,611 |
| 600,526 |
| 515,022 |
|
| 507,646 |
| 423,050 |
| 477,908 |
| ||||||
Gas Turbine Products |
| 206,760 |
| 213,138 |
| 158,025 |
|
| 154,726 |
| 150,131 |
| 206,760 |
| ||||||
Special Applications Products |
|
| 156,297 |
|
| 189,686 |
|
| 161,519 |
|
|
| 191,162 |
|
| 177,876 |
|
| 156,276 |
|
Total Industrial Products segment |
|
| 866,668 |
|
| 1,003,350 |
|
| 834,566 |
|
|
| 853,534 |
|
| 751,057 |
|
| 840,944 |
|
|
|
|
|
|
|
|
| |||||||||||||
Total Company |
| $ | 1,868,629 |
| $ | 2,232,521 |
| $ | 1,918,828 |
|
| $ | 2,294,029 |
| $ | 1,877,064 |
| $ | 1,868,629 |
|
|
|
|
|
| Includes replacement part sales to the Company’s OEM Customers. |
Geographic sales by origination and property, plant and equipment:
|
|
|
|
|
|
|
|
|
|
|
|
|
|
|
|
| Net Sales |
| Property, Plant & |
|
| Net Sales |
| Property, Plant & |
| ||||
|
| (thousands of dollars) |
| |||||||||||
2011 |
|
|
|
|
| |||||||||
United States |
| $ | 941,218 |
| $ | 141,584 |
| |||||||
Europe |
| 653,275 |
| 131,739 |
| |||||||||
Asia - Pacific |
| 540,874 |
| 81,035 |
| |||||||||
Other |
|
| 158,662 |
|
| 37,144 |
| |||||||
Total |
| $ | 2,294,029 |
| $ | 391,502 |
| |||||||
|
|
|
|
|
| |||||||||
2010 |
|
|
|
|
| |||||||||
United States |
| $ | 745,400 |
| $ | 139,717 |
| |||||||
Europe |
| 545,803 |
| 122,646 |
| |||||||||
Asia - Pacific |
| 460,470 |
| 72,950 |
| |||||||||
Other |
|
| 125,391 |
|
| 30,579 |
| |||||||
Total |
| $ | 1,877,064 |
| $ | 365,892 |
| |||||||
|
| (thousands of dollars) |
|
|
|
|
|
| ||||||
2009 |
|
|
|
|
|
|
|
|
|
| ||||
United States |
| $ | 778,979 |
| $ | 141,052 |
|
| $ | 778,979 |
| $ | 141,052 |
|
Europe |
| 567,117 |
| 138,350 |
|
| 567,117 |
| 138,350 |
| ||||
Asia-Pacific |
| 419,423 |
| 71,686 |
| |||||||||
Asia - Pacific |
| 419,423 |
| 71,686 |
| |||||||||
Other |
|
| 103,110 |
|
| 29,980 |
|
|
| 103,110 |
|
| 29,980 |
|
Total |
| $ | 1,868,629 |
| $ | 381,068 |
|
| $ | 1,868,629 |
| $ | 381,068 |
|
2008 |
|
|
|
|
| |||||||||
United States |
| $ | 888,658 |
| $ | 144,429 |
| |||||||
Europe |
| 766,797 |
| 166,195 |
| |||||||||
Asia-Pacific |
| 471,275 |
| 65,829 |
| |||||||||
Other |
|
| 105,791 |
|
| 38,706 |
| |||||||
Total |
| $ | 2,232,521 |
| $ | 415,159 |
| |||||||
2007 |
|
|
|
|
| |||||||||
United States |
| $ | 827,648 |
| $ | 142,511 |
| |||||||
Europe |
| 615,049 |
| 129,564 |
| |||||||||
Asia-Pacific |
| 397,080 |
| 61,057 |
| |||||||||
Other |
|
| 79,051 |
|
| 31,301 |
| |||||||
Total |
| $ | 1,918,828 |
| $ | 364,433 |
| |||||||
ConcentrationsThere were no Customers over 10 percent of net sales during Fiscal 2009. Sales to one Customer accounted for 10 percent of net sales in Fiscal 20082011, 2010, and 2007.2009. There were no Customers over 10 percent of gross accounts receivable in Fiscal 20092011 and 2008.
NOTE KCommitments and Contingencies2010.
NOTE L Guarantees to Related Party
The Company and its partner, Caterpillar Inc. equally own the shares of Advanced Filtration Systems Inc. (AFSI), in an unconsolidated joint venture, Advanced Filtration Systems Inc.,and guarantee certain debt of the joint venture. As of July 31, 2009,2011, the joint venture had $27.7$24.6 million of outstanding debt.debt, of which the Company guarantees half. In addition, during Fiscal 2011, 2010, and
2009, 2008 and 2007, the Company recorded its equity in earnings of this equity method investment of $1.0$1.6 million, $0.6$0.4 million, and $5.0$1.0 million and royalty income of $5.1$6.2 million, $5.4 million, and $0.4$5.1 million, respectively.respectively, related to AFSI.
At July 31, 2011 and 2010, the Company had a contingent liability for standby letters of credit totaling $11.4 million and $20.0 million, respectively, which have been issued and are outstanding. The letters of credit guarantee payment to third parties in the event the Company is in breach of a specified bond financing agreement and insurance contract terms as detailed in each letter of credit. At July 31, 2011 and 2010, there were no amounts drawn upon these letters of credit.
NOTE M Warranty
The Company provides for warranties on certain products. In addition, the Company may incur specific Customer warranty issues. Following is a reconciliation of warranty reserves (in thousands of dollars):
|
|
|
|
|
|
|
|
|
Balance at August 1, 2007 |
| $ | 8,545 |
| ||||
Balance at July 31, 2009 |
| $ | 9,215 |
| ||||
Accruals for warranties issued during the reporting period |
| 3,634 |
|
| 12,389 |
| ||
Accruals related to pre-existing warranties (including changes in estimates) |
| 3,982 |
|
| (1,244 | ) | ||
Less settlements made during the period |
|
| (4,638 | ) |
|
| (4,653 | ) |
Balance at July 31, 2008 |
| $ | 11,523 |
| ||||
Balance at July 31, 2010 |
| $ | 15,707 |
| ||||
Accruals for warranties issued during the reporting period |
| 2,942 |
|
| 8,406 |
| ||
Accruals related to pre-existing warranties (including changes in estimates) |
| (2,141 | ) |
| 7,735 |
| ||
Less settlements made during the period |
|
| (3,109 | ) |
|
| (12,128 | ) |
Balance at July 31, 2009 |
| $ | 9,215 |
| ||||
Balance at July 31, 2011 |
| $ | 19,720 |
| ||||
At July 31, 2009During Fiscal 2011, the increase in warranty accruals was primarily due to three specific warranty matters: one in the Company’s Retrofit Emissions Product group for $3.6 million, one in the Company’s Off-Road Products group for $1.8 million, and 2008,one in the On-Road Product group for $4.1 million. These warranty accruals were partially offset by supplier and insurance recoveries of $4.2 million. During Fiscal 2010, the Company hadincreased warranty accruals due to a contingent liabilityspecific warranty matter in our Retrofit Emissions Products group and recorded an expense of $6.2 million for standby letters of credit totaling $20.0 millionthis matter.
NOTE N Commitments and $18.5 million, respectively, which have been issued and are outstanding. The letters of credit guarantee payment to beneficial third parties in the event the Company is in breach of specified contract terms as detailed in each letter of credit. At July 31, 2009 and 2008, there were no amounts drawn upon these letters of credit.Contingencies
In accordance with SFAS No. 5, “Accounting for Contingencies,” (SFAS No. 5), theThe Company records provisions with respect to identified claims or lawsuits when it is probable that a liability has been incurred and the amount of the loss can be reasonably estimated. Claims and lawsuits are reviewed quarterly and provisions are taken or adjusted to reflect the status of a particular matter. The Company believes the recorded reserves in its consolidated financial statements are adequate in light of the probable and estimable outcomes. The recorded liabilities were not material to the Company’s financial position, results of operation andor liquidity and the Company does not believe that any of the currently identified claims or litigation will materially affect its financial position, results of operation andor liquidity.
The Company has reached a preliminary agreement to settle the class action lawsuits that were previously disclosed in its SEC filings, including most recently the Form 10-Q for the quarter ending April 30, 2011. On March 31, 2008, S&E Quick Lube, a filter distributor, filed a lawsuit alleging that 12 filter manufacturers, including the Company, engaged in a conspiracy to fix prices, rig bids, and allocate U.S. Customers for aftermarket automotive filters. The U.S. cases have been consolidated into a single multi-district litigation in the Northern District of Illinois. The Company denies any liability and has vigorously defended the claims raised in these lawsuits. The settlement will fully resolve all claims brought against the Company in the lawsuits and the Company does not admit any liability or wrongdoing. The settlement is still subject to Court approval and will not have a material impact on the Company’s financial position, results of operations or liquidity.
The Company has reached a preliminary agreement with the Air Resources Board for the State of California (“ARB”) to settle regulatory claims brought by ARB in connection with the sales of our Diesel Multi-Stage Filter System (“DMF”) for an immaterial amount. On May 19, 2010, ARB revoked its verification of the Company’s DMF for use with on-road diesel engines, for which verification was originally issued on December 16, 2005. The Company denies that any sales were made in California without ARB verification. The Company is not currently selling any DMF product and is working with the Environmental Protection Agency to verify the product for any future sales.
NOTE L
O Restructuring
The following is a reconciliation of restructuring reserves (in thousands of dollars):
|
|
|
|
|
|
|
|
|
Balance at July 31, 2008 |
| $ | — |
|
| $ | — |
|
Accruals for restructuring during the reporting period |
| 17,755 |
|
| 17,755 |
| ||
Less settlements made during the period |
|
| (13,915 | ) |
|
| (13,915 | ) |
Balance at July 31, 2009 |
| $ | 3,840 |
|
| $ | 3,840 |
|
Accruals for restructuring during the reporting period |
| 8,023 |
| |||||
Less settlements made during the period |
|
| (7,724 | ) | ||||
Balance at July 31, 2010 |
| $ | 4,139 |
| ||||
Accruals for restructuring during the reporting period |
| 759 |
| |||||
Less settlements made during the period |
|
| (4,898 | ) | ||||
Balance at July 31, 2011 |
| $ | — |
| ||||
TheCertain restructuring actions commenced in Fiscal 2009 in response to the dramatic downturn in the worldwide economy made signification cost reductionand these actions necessary duringand related costs carried over into Fiscal 2009. As a result, costs incurred2010 and shown inFiscal 2011. In Fiscal 2011, the table above are primarily associated with workforce reductions of 2,800 since the beginning of the fiscal year. Gross margin and operating expenses include $10.1 million and $7.7 million of restructuring expenses, respectively. The Engine Products segment incurred minimal restructuring expenses and Industrial Products segment and Corporate and Unallocated incurred $7.2$0.7 million $10.1in restructuring expenses. The restructuring expenses in Fiscal 2011 include employee severance costs for approximately five employees related to the completion of the Company’s planned restructuring activities. The Company did not previously anticipate these additional charges in Fiscal 2011.
The fiscal 2010 costs were employee severance costs related to the reduction in workforce of approximately 550 employees. In addition to these restructuring costs, the Company recorded $2.1 million andin asset impairment costs related to the downsizing of a plant in Germany. Fiscal 2009 included $17.3 million in employee severance costs related to the reduction in workforce of approximately 2,800 employees. In addition, $0.5 million respectively.was incurred primarily for distribution center consolidation and production line transfers.
The Company expects to settle its remaining liability during Fiscal 2010.Restructuring and asset impairment expense detail is summarized as follows (in thousands):
|
|
|
|
|
|
|
|
|
|
|
|
| Fiscal Year |
| |||||||
|
| 2011 |
| 2010 |
| 2009 |
| |||
Gross Margin |
| $ | 20 |
| $ | 7,488 |
| $ | 10,109 |
|
Operating expenses |
|
| 739 |
|
| 2,677 |
|
| 7,646 |
|
Total restructuring and asset impairment expenses |
| $ | 759 |
| $ | 10,165 |
| $ | 17,755 |
|
NOTE MSubsequent Events
The Company has evaluated and reviewed for subsequent events that would impact the financial statements for the 12 months ended July 31, 2009, through the issuance date of the financials, September 25, 2009.
NOTE N
P Quarterly Financial Information (Unaudited)
|
|
|
|
|
|
|
|
|
|
|
|
|
|
|
|
|
|
|
|
|
|
|
|
|
|
|
|
| First |
| Second |
| Third |
| Fourth |
|
| First |
| Second |
| Third |
| Fourth |
| ||||||||
|
| (thousands of dollars, except per share amounts) |
|
| (In thousands) |
| ||||||||||||||||||||
2009 |
|
|
|
|
|
|
|
|
| |||||||||||||||||
2011 |
|
|
|
|
|
|
|
|
| |||||||||||||||||
Net sales |
| $ | 573,260 |
| $ | 460,601 |
| $ | 413,447 |
| $ | 421,321 |
|
| $ | 536,909 |
| $ | 537,105 |
| $ | 594,565 |
| $ | 625,450 |
|
Gross margin |
| 186,703 |
| 134,012 |
| 130,782 |
| 138,209 |
|
| 188,090 |
| 189,543 |
| 209,158 |
| 227,005 |
| ||||||||
Net earnings |
| 47,962 |
| 33,793 |
| 26,598 |
| 23,554 |
|
| 53,134 |
| 44,579 |
| 61,811 |
| 65,767 |
| ||||||||
Basic earnings per share |
| .62 |
| .43 |
| .34 |
| .30 |
|
| 0.69 |
| 0.57 |
| 0.80 |
| 0.86 |
| ||||||||
Diluted earnings per share |
| .60 |
| .43 |
| .34 |
| .30 |
|
| 0.68 |
| 0.56 |
| 0.79 |
| 0.84 |
| ||||||||
Dividends declared per share |
| — |
| .230 |
| — |
| .230 |
|
| — |
| 0.260 |
| — |
| 0.300 |
| ||||||||
Dividends paid per share |
| .110 |
| .115 |
| .115 |
| .115 |
|
| 0.125 |
| 0.130 |
| 0.130 |
| 0.150 |
| ||||||||
|
|
|
|
|
|
|
|
|
|
|
|
|
|
|
|
|
|
| ||||||||
2008 |
|
|
|
|
|
|
|
|
| |||||||||||||||||
2010 |
|
|
|
|
|
|
|
|
| |||||||||||||||||
Net sales |
| $ | 525,576 |
| $ | 511,763 |
| $ | 587,760 |
| $ | 607,422 |
|
| $ | 428,080 |
| $ | 436,122 |
| $ | 497,619 |
| $ | 515,243 |
|
Gross margin |
| 172,864 |
| 163,185 |
| 188,266 |
| 201,547 |
|
| 148,400 |
| 145,947 |
| 177,371 |
| 187,030 |
| ||||||||
Net earnings |
| 43,323 |
| 34,070 |
| 45,987 |
| 48,573 |
|
| 34,569 |
| 30,966 |
| 49,458 |
| 51,170 |
| ||||||||
Basic earnings per share |
| .54 |
| .43 |
| .58 |
| .62 |
|
| 0.44 |
| 0.40 |
| 0.64 |
| 0.66 |
| ||||||||
Diluted earnings per share |
| .53 |
| .42 |
| .57 |
| .60 |
|
| 0.44 |
| 0.39 |
| 0.62 |
| 0.65 |
| ||||||||
Dividends declared per share |
| — |
| .210 |
| — |
| .220 |
|
| — |
| 0.115 |
| 0.120 |
| 0.245 |
| ||||||||
Dividends paid per share |
| .100 |
| .100 |
| .110 |
| .110 |
|
| 0.115 |
| 0.115 |
| 0.120 |
| 0.120 |
| ||||||||
The quarter ended October 31, 2010 included restructuring charges after-tax of $0.6 million or $0.01 per share. The quarters ended October 31, 2009, January 31, 2009,2010, April 30, 2009,2010, and July 31, 2009,2010, include restructuring charges after-tax of $2.9$0.9 million or $0.04$0.01 per share, $4.7 million or $0.06 per share and $4.5$3.6 million or $0.05 per share, $2.7 million or $0.03 per share, and less than $0.1 million, respectively.
Item 9. Changes in and Disagreements with Accountants on Accounting and Financial Disclosure
None.
Item 9A. Controls and Procedures
Evaluation of Disclosure Controls and Procedures
As of the end of the period covered by this report (the “Evaluation Date”), the Company carried out an evaluation, under the supervision and with the participation of management, including the Chief Executive Officer and the Chief Financial Officer, of the effectiveness of the design and operation of the Company’s disclosure controls and procedures (as defined in Rule 13a-15(e) of the Exchange Act). Based upon that evaluation, the Chief Executive Officer and Chief Financial Officer concluded that, as of the Evaluation Date, the Company’s disclosure controls and procedures were effective to ensure that information required to be disclosed by the Company in the reports that it files or submits under the Exchange Act is (i) recorded, processed, summarized and reported within the time periods specified in applicable rules and forms, and (ii) accumulated and communicated to our management, including our Chief Executive Officer and Chief Financial Officer, to allow timely decisions regarding required disclosure.
Changes in Internal Control over Financial Reporting
No change in the Company’s internal control over financial reporting (as defined in Rule 13a-15(f) of the Exchange Act) identified in connection with such evaluation during the fiscal quarter ended July 31, 2009,2011, has materially affected, or is reasonably likely to materially affect, the Company’s internal control over financial reporting.
Management’s Report on Internal Control over Financial Reporting
See Management’s Report on Internal Control over Financial Reporting under Item 8 on page 27.25.
Report of Independent Registered Public Accounting Firm
See Report of Independent Registered Public Accounting Firm under Item 8 on page 28.26.
None.
Item 10. Directors, Executive Officers and Corporate Governance
The information under the captions “Item 1: Election of Directors”; “Director Selection Process,” “Audit Committee,” “Audit Committee Expertise; Complaint-Handling Procedures,” and “Section 16(a) Beneficial Ownership Reporting Compliance” of the 20092011 Proxy Statement is incorporated herein by reference. Information on the Executive Officers of the Company is found under the caption “Executive Officers of the Registrant” on page 76 of this Annual Report on Form 10-K.
The Company has adopted a code of business conduct and ethics in compliance with applicable rules of the Securities and Exchange Commission that applies to its principal executive officer, its principal financial officer and its principal accounting officer or controller, or persons performing similar functions. A copy of the code of business conduct and ethics is posted on the Company’s website at www.donaldson.com. The code of business conduct and ethics is available in print, free of charge to any shareholder who requests it. The Company will disclose any amendments to, or waivers of, the code of business conduct and ethics for the Company’s principal executive officer, principal financial officer, and principal accounting officer on the Company’s website.
Item 11. Executive Compensation
The information under the captions “Compensation Committee Report,” “Executive Compensation” and ‘Director“Director Compensation” of the Company’s proxy statement for the 2009 annual shareholders meeting2011 Proxy Statement is incorporated herein by reference.
Item 12. Security Ownership of Certain Beneficial Owners and Management and Related Stockholder Matters
The information under the caption “Security Ownership” of the Company’s proxy statement for the 2009 annual shareholders meeting2011 Proxy Statement is incorporated herein by reference.
The following table sets forth information as of July 31, 2009,2011 regarding the Company’s equity compensation plans:
|
|
|
|
|
|
|
|
|
|
|
|
|
|
|
|
|
|
| ||
Plan category |
| Number of securities |
| Weighted-average |
| Number of securities |
| |||||||||||||
Plan Category |
| Number of securities |
| Weighted - average |
| Number of securities |
| |||||||||||||
|
| (a) |
| (b) |
| (c) |
|
| (a) |
| (b) |
| (c) |
| ||||||
Equity compensation plans approved by security holders |
|
|
|
|
|
|
| |||||||||||||
Equity compensation plans approved by security holders: |
|
|
|
|
|
|
| |||||||||||||
1980 Master Stock Compensation Plan: |
|
|
|
|
|
|
|
|
|
|
|
|
|
| ||||||
Stock Options |
| — |
| — |
| — |
|
| — |
| — |
| — |
| ||||||
Deferred Stock Gain Plan |
| 54,667 |
| $ | 13.2261 |
| — |
|
| 42,057 |
| $ | 13.9878 |
| — |
| ||||
|
|
|
|
|
|
|
| |||||||||||||
1991 Master Stock Compensation Plan: |
|
|
|
|
|
|
|
|
|
|
|
|
|
| ||||||
Stock Options |
| 1,350,821 |
| $ | 18.2605 |
| — |
|
| 114,744 |
| $ | 19.3523 |
| — |
| ||||
Deferred Stock Option Gain Plan |
| 326,612 |
| $ | 30.6203 |
| — |
|
| 342,685 |
| $ | 34.4576 |
| — |
| ||||
Deferred LTC/Restricted Stock |
| 156,304 |
| $ | 21.6543 |
| — |
|
| 134,158 |
| $ | 22.7091 |
| — |
| ||||
|
|
|
|
|
|
|
| |||||||||||||
2001 Master Stock Incentive Plan: |
|
|
|
|
|
|
|
|
|
|
|
|
|
| ||||||
Stock Options |
| 3,112,012 |
| $ | 30.3412 |
| See Note 1 |
|
| 3,164,380 |
| $ | 32.6285 |
| — |
| ||||
Deferred Stock Option Gain Plan |
| 21,600 |
| $ | 59.9872 |
| — |
| ||||||||||||
Deferred LTC/Restricted Stock |
| 158,437 |
| $ | 30.7006 |
| See Note 1 |
|
| 152,118 |
| $ | 30.3986 |
| — |
| ||||
Long Term Compensation |
|
| 12,334 |
| $ | 43.9300 |
|
| See Note 1 |
| ||||||||||
Subtotal for plans approved by security holders: |
|
| 5,171,187 |
| $ | 26.8030 |
|
|
|
| ||||||||||
Equity compensation plans not approved by security holders |
|
|
|
|
|
|
| |||||||||||||
Nonqualified Stock Option Program for Non-Employee Directors |
| 535,292 |
| $ | 29.0432 |
| See Note 2 |
| ||||||||||||
Long-Term Compensation |
| 71,059 |
| $ | 40.8296 |
| — |
| ||||||||||||
|
|
|
|
|
|
|
| |||||||||||||
2010 Master Stock Incentive Plan: |
|
|
|
|
|
|
| |||||||||||||
Stock Options |
| 407,500 |
| $ | 58.1400 |
| See Note 1 |
| ||||||||||||
Deferred LTC/Restricted Stock |
| — |
| $ | — |
| — |
| ||||||||||||
Long-Term Compensation |
|
| — |
| $ | — |
|
| — |
| ||||||||||
Subtotal for plans approved by security holders |
|
| 4,450,301 |
| $ | 34.4754 |
|
|
| |||||||||||
|
|
|
|
|
|
|
| |||||||||||||
Equity compensation plans not approved by security holders: |
|
|
|
|
|
|
| |||||||||||||
Non-qualified Stock Option Program for Non - Employee Directors |
| 507,373 |
| $ | 38.4163 |
| See Note 2 |
| ||||||||||||
ESOP Restoration |
|
| 30,878 |
| $ | 12.2894 |
|
| See Note 3 |
|
|
| 25,016 |
| $ | 13.0282 |
|
| See Note 3 |
|
Subtotal for plans not approved by security holders: |
|
| 556,170 |
| $ | 28.1294 |
|
|
|
| ||||||||||
Total: |
|
| 5,737,357 |
| $ | 26.9339 |
|
|
|
| ||||||||||
Subtotal for plans not approved by security holders |
|
| 532,389 |
| $ | 37.2234 |
|
|
|
| ||||||||||
Total |
|
| 4,982,690 |
| $ | 34.769 |
|
|
|
| ||||||||||
Note 1: SharesThe 2010 Master Stock Incentive Plan limits the number of shares authorized for issuance to 4,600,000 during the 10-year term are limited in each plan year to 1.5% of the Company’s “outstanding shares” (as defined inplan. There are currently 4,112,369 shares of the 2001 Master Stock Incentive Plan).authorization remaining.
Note 2: The stock option program for non-employee directors (filed as exhibit 10-N10-H to Form 10-Q report filed for the Company’s 1998 Form 10-K report)first quarter ended October 31, 2008) provides for each non-employee director to receive annual option grants of 7,200 shares. The 20012010 Master Stock Incentive Plan, which was approved by the Company’s stockholders on November 16, 2001, also19, 2010 provides for the issuance of stock options to non-employee directors.directors, and the stock option program for non-employee directors has been adopted as a sub-plan under the 2010 Master Stock Incentive Plan and shares issued to directors after December 10, 2010 will be issued under the 2010 Master Stock Incentive Plan.
Note 3: The Company has a non-qualified ESOP Restoration Plan established on August 1, 1990 (filed as exhibit 10-E10-D to the Company’s 2009 Form 10-Q for the quarter ended January 31, 1998)10-K report), to supplement the benefits for executive employees under the Company’s Employee Stock Ownership Plan that would otherwise be reduced because of the compensation limitations under the Internal Revenue Code. The ESOP’s 10-year term was completed on July 31, 1997 and the only ongoing benefits under the ESOP Restoration Plan are the accrual of dividend equivalent rights to the participants in the Plan.
Item 13. Certain Relationships and Related Transactions, and Director Independence |
|
The information under the captioncaptions “Policy and Procedures Regarding Transactions with Related Persons” and “Board Oversight and Director Independence” of the Company’s proxy statement for the 2009 annual shareholders meeting2011 Proxy Statement is incorporated hereherein by reference.
|
The information under the captions “Independent Auditor Fees” and “Audit Committee Report”committee Pre-Approval Policies and Procedures” of the Company’s proxy statement for the 2009 annual shareholders meeting2011 Proxy Statement is incorporated herein by reference.
|
Documents filed with this report:
|
|
|
| (1) | Financial Statements |
|
| |
Consolidated Statements of Earnings — years ended July 31, | ||
|
| Consolidated Balance Sheets — July 31, |
|
| Consolidated Statements of Cash Flows — years ended July 31, |
|
| Consolidated Statements of Changes in Shareholders’ Equity — years ended July 31, |
|
| Notes to Consolidated Financial Statements |
|
| Report of Independent Registered Public Accounting Firm |
|
|
|
| (2) | Financial Statement Schedules — |
|
| |
Schedule II Valuation and qualifying accounts | ||
|
| All other schedules (Schedules I, III, IV and V) for which provision is made in the applicable accounting regulations of the Securities and Exchange Commission are not required under the related instruction, or are inapplicable, and therefore have been omitted. |
|
|
|
| (3) | Exhibits |
|
| |
The exhibits listed in the accompanying index are filed as part of this report or incorporated by reference as indicated therein. |
Pursuant to the requirements of Section 13 or 15(d) of the Securities Exchange Act of 1934, the registrant has duly caused this report to be signed on its behalf by the undersigned, thereunto duly authorized.
|
|
| ||
| ||||
DONALDSON COMPANY, INC. | ||||
|
|
| ||
Date: | September | 23, 2011 | By: /s/ William M. Cook |
|
| ||||
|
| | ||
| William M. Cook |
| ||
Chief Executive Officer |

Pursuant to the requirements of the Securities Exchange Act of 1934, this report has been signed below by the following persons on behalf of the registrant and in the capacities indicated on September 25, 2009.23, 2011.
|
|
|
/s/ William M. Cook |
| President, Chief Executive Officer and Chairman |
| ||
William M. Cook |
| (principal executive officer) |
|
|
|
/s/ Thomas R. VerHage |
| Vice President and Chief Financial Officer |
| ||
Thomas R. VerHage |
| (principal financial officer) |
|
|
|
/s/ James F. Shaw |
| Controller |
| ||
James F. Shaw |
| (principal accounting officer) |
|
|
|
* |
| Director |
F. Guillaume Bastiaens |
|
|
|
|
|
* |
| Director |
Janet M. Dolan |
|
|
|
|
|
* |
| Director |
Jack W. Eugster |
|
|
|
|
|
* |
| Director |
John F. Grundhofer |
|
|
|
|
|
* |
| Director |
Michael J. Hoffman |
|
|
|
|
|
* |
| Director |
Paul David Miller |
|
|
|
|
|
* |
| Director |
Jeffrey Noddle |
|
|
|
|
|
* |
| Director |
Willard D. Oberton |
|
|
|
|
|
* |
| Director |
Ajita G. Rajendra | ||
* | Director | |
John P. Wiehoff |
|
|
|
|
|
*By: |
|
|
Norman C. Linnell |
|
|
As attorney-in-fact |
|
|


SCHEDULE II —- VALUATION AND QUALIFYING ACCOUNTS
DONALDSON COMPANY, INC. AND SUBSIDIARIES
(thousands of dollars)
|
|
|
|
|
|
|
|
|
|
|
|
|
|
|
|
|
|
|
|
|
| Additions |
|
|
|
|
|
|
| ||||
Description |
| Balance at |
| Charged to |
| Charged to |
| Deductions |
| Balance at |
| |||||
Year ended July 31, 2009: |
|
|
|
|
|
|
|
|
|
|
|
|
|
|
|
|
|
|
|
|
|
|
|
|
|
|
|
|
|
|
|
|
|
Allowance for doubtful accounts deducted from accounts receivable |
| $ | 7,509 |
| $ | 1,240 |
| $ | (534 | ) | $ | (828 | ) | $ | 7,387 |
|
|
|
|
|
|
|
|
|
|
|
|
|
|
|
|
|
|
Year ended July 31, 2008: |
|
|
|
|
|
|
|
|
|
|
|
|
|
|
|
|
|
|
|
|
|
|
|
|
|
|
|
|
|
|
|
|
|
Allowance for doubtful accounts deducted from accounts receivable |
| $ | 6,768 |
| $ | 1,126 |
| $ | 537 |
| $ | (922 | ) | $ | 7,509 |
|
|
|
|
|
|
|
|
|
|
|
|
|
|
|
|
|
|
Year ended July 31, 2007: |
|
|
|
|
|
|
|
|
|
|
|
|
|
|
|
|
|
|
|
|
|
|
|
|
|
|
|
|
|
|
|
|
|
Allowance for doubtful accounts deducted from accounts receivable |
| $ | 8,398 |
| $ | 914 |
| $ | 358 |
| $ | (2,902 | ) | $ | 6,768 |
|
|
|
|
|
|
|
|
|
|
|
|
|
|
|
|
|
|
|
|
|
|
| Additions |
|
|
|
|
|
|
| ||||
Description |
| Balance at |
| Charged to |
| Charged to |
| Deductions |
| Balance at |
| |||||
Year ended July 31, 2011: |
|
|
|
|
|
|
|
|
|
|
|
|
|
|
|
|
Allowance for doubtful accounts deducted from accounts receivable |
| $ | 6,315 |
| $ | 482 |
| $ | 481 |
| $ | (370 | ) | $ | 6,908 |
|
| ||||||||||||||||
Year ended July 31, 2010: |
|
|
|
|
|
|
|
|
|
|
|
|
|
|
|
|
Allowance for doubtful accounts deducted from accounts receivable |
| $ | 7,387 |
| $ | 1,063 |
| $ | (293 | ) | $ | (1,842 | ) | $ | 6,315 |
|
| ||||||||||||||||
Year ended July 31, 2009: |
|
|
|
|
|
|
|
|
|
|
|
|
|
|
|
|
Allowance for doubtful accounts deducted from accounts receivable |
| $ | 7,509 |
| $ | 1,240 |
| $ | (534 | ) | $ | (828 | ) | $ | 7,387 |
|
Note A —- Allowance for doubtful accounts foreign currency translation losses (gains) recorded directly to equity.
Note B —- Bad debts charged to allowance, net of reserves and changes in estimates.
EXHIBIT INDEX
ANNUAL REPORT ON FORM 10-K
|
|
|
* 3-A | — | Restated Certificate of Incorporation of Registrant as currently in effect (Filed as Exhibit 3-A to 2010 Form |
|
|
|
| — | Certificate of Designation, Preferences and Rights of Series A Junior Participating Preferred Stock of Registrant, dated as of March 3, 2006 |
|
|
|
* 3-C | — | Amended and Restated Bylaws of Registrant (as of January 30, 2009) (Filed as Exhibit 3-C to Form |
|
|
|
* 4 | — | ** |
|
|
|
| — | Preferred Stock Amended and Restated Rights Agreement between Registrant and Wells Fargo Bank, N.A., as Rights Agent, dated as of January 27, 2006 |
|
|
|
| — | Officer Annual Cash Incentive |
|
|
|
*10-B | — | 1980 Master Stock Compensation Plan as Amended (Filed as Exhibit 10-A to Form 10-Q Report filed for the first quarter ended October 31, 2008)*** |
|
|
|
*10-C | — | Form of Performance Award Agreement under 1991 Master Stock Compensation Plan (Filed as Exhibit 10-B to Form 10-Q Report filed for the first quarter ended October 31, 2008)*** |
|
|
|
*10-D | — | ESOP Restoration Plan (2003 Restatement) (Filed as Exhibit 10-D to 2009 Form 10-K Report)*** |
|
|
|
*10-E | — | Deferred Compensation Plan for Non-employee Directors as amended (Filed as Exhibit 10-C to Form 10-Q Report filed for the first quarter ended October 31, 2008)*** |
|
|
|
*10-F | — | Independent Director Retirement and Benefit Plan as amended (Filed as Exhibit 10-D to Form 10-Q Report filed for the first quarter ended October 31, 2008)*** |
|
|
|
10-G | — |
|
|
|
|
|
|
|
* | — | 1991 Master Stock Compensation Plan as amended (Filed as Exhibit 10-E to Form 10-Q Report filed for the first quarter ended October 31, 2008)*** |
|
|
|
* | — | Form of Restricted Stock Award under 1991 Master Stock Compensation Plan (Filed as Exhibit 10-F to Form 10-Q Report filed for the first quarter ended October 31, 2008)*** |
|
|
|
* | — | Form of Agreement to Defer Compensation for certain Executive Officers (Filed as Exhibit 10-G to Form 10-Q Report filed for the first quarter ended October 31, 2008)*** |
|
|
|
* | — | Stock Option Program for Non-employee Directors (Filed as Exhibit 10-H to Form 10-Q Report filed for the first quarter ended October 31, 2008)*** |
|
|
|
* | — | Note Purchase Agreement among Donaldson Company, Inc. and certain listed Insurance Companies Dated as of July 15, 1998 (Filed as Exhibit 10-I to Form 10-Q Report filed for the first quarter ended October 31, 2008) |
|
|
|
* | — | Second Supplement and First Amendment to Note Purchase Agreement among Donaldson Company, Inc. and certain listed Insurance Companies dated as of September 30, 2004 (Filed as Exhibit |
|
|
|
| — | 2001 Master Stock Incentive Plan (Filed as Exhibit 10-O to 2009 Form 10-K Report)*** |
|
|
|
* | — | Form of Officer Stock Option Award Agreement under the 2001 Master Stock Incentive Plan (Filed as Exhibit |
|
|
|
* | — | Form of Non-Employee Director Non-Qualified Stock Option Agreement under the 2001 Master Stock Incentive Plan (Filed as Exhibit |
|
|
|
|
|
|
|
|
|
|
|
|
|
|
|
10-Q | — | Restated Compensation Plan for Non-Employee Directors dated July 28, 2006 *** |
10-R | — | Restated Long-Term Compensation Plan dated May 23, 2006 *** |
10-S | — | Qualified Performance-Based Compensation Plan *** |
10-T | — | Deferred Compensation and 401(k) Excess Plan |
10-U | — | Deferred Stock Option Gain Plan (2008 Restatement)*** |
10-V | — | Excess Pension Plan (2008 Restatement)*** |
|
|
|
*10-W |
|
|
|
|
|
|
|
|
| — | Form of Management Severance Agreement for Executive Officers (Filed as Exhibit 10-A to Form 10-Q Report for the Third Quarter ended April 30, 2008)*** |
*10-X | — | 2010 Master Stock Incentive Plan (Filed as Exhibit 4.5 to Registration Statement on Form S-* (File No. 333-170729) filed on November 19, 2010)*** |
*10-Y | — | Form of Officer Stock Option Award Agreement under the 2010 Master Stock Incentive Plan (Filed as Exhibit 10.1 to Form 8-K Report filed on December 16, 2010) *** |
*10-Z | — | Form of Restricted Stock Award Agreement under the 2010 Master Stock Incentive Plan (Filed as Exhibit 10.2 to Form 8-K Report filed on December 16, 2010) *** |
10-AA | — | Non-Employee Director Automatic Stock Option Grant Program*** |
|
|
|
11 | — | Computation of net earnings per share (See “Earnings Per Share” in “Summary of Significant Accounting Policies” in Note A in the Notes to Consolidated Financial Statements on page |
|
|
|
21 | — | Subsidiaries |
|
|
|
23 | — | Consent of PricewaterhouseCoopers LLP |
|
|
|
24 | — | Powers of Attorney |
|
|
|
31-A | — | Certification of Chief Executive Officer pursuant to Section 302 of the Sarbanes-Oxley Act of 2002 |
|
|
|
31-B | — | Certification of Chief Financial Officer pursuant to Section 302 of the Sarbanes-Oxley Act of 2002 |
|
|
|
32 | — | Certifications of Chief Executive Officer and Chief Financial Officer pursuant to 18 U.S.C. Section 1350, as adopted pursuant to Section 906 of the Sarbanes-Oxley Act of 2002 |
101 | — | The following financial information from the Donaldson Company, Inc. Annual Report on Form 10-K for the fiscal year ended July 31, 2011 as filed with the Securities and Exchange Commission, formatted in Extensible Business Reporting Language (XBRL): (i) the Consolidated Statements of Earnings, (ii) the Consolidated Balance Sheets, (iii) the Consolidated Statements of Cash Flows (iv) the Consolidated Statement of Changes in Shareholders’ Equity and (v) the Notes to Consolidated Financial Statements. |
|
|
* | Exhibit has previously been filed with the Securities and Exchange Commission and is incorporated herein by reference as an exhibit. |
|
|
** | Pursuant to the provisions of Regulation S-K Item 601(b)(4)(iii)(A) copies of instruments defining the rights of holders of certain long-term debts of the Company and its subsidiaries are not filed and in lieu thereof the Company agrees to furnish a copy thereof to the Securities and Exchange Commission upon request. |
|
|
*** | Denotes compensatory plan or management contract. |
| |
62Note: Exhibits have been furnished only to the Securities and Exchange Commission. Copies will be furnished to individuals upon request.
61