Securities registered pursuant to Section 12(g) of the Act:
None
None
(Title of Class)
|
Yeso Nox
Indicate by check mark if the registrant is not required to file reports pursuant to Section 13 or Section 15(d) of the Act.
Yeso Nox
Indicate by check mark whether the registrant (1) has filed all reports required to be filed by Section 13 or 15(d) of the Securities Exchange Act of 1934 during the preceding 12 months (or for such shorter period that the registrant was required to file such reports), and (2) has been subject to such filing requirements for the past 90 days. Yesx Noo
Indicate by check mark whether the registrant has submitted electronically and posted on its corporate Website, if any, every Interactive Data File required to be submitted and posted pursuant to Rule 405 of Regulation S-T during the preceding 12 months (or for such shorter period that the registrant was required to submit and post such files). Yesox Noo
Indicate by check mark if disclosure of delinquent filers pursuant to Item 405 of Regulation S-K is not contained herein, and will not be contained, to the best of registrant’s knowledge, in definitive proxy or information statements incorporated by reference in Part III of this Form 10-K or any amendment to this Form 10-K.x
Large accelerated filero Accelerated filerx Non-accelerated filero Indicate by check mark whether the registrant is a shell company (as defined in Rule 12b-2 of the Act). Yeso Nox The aggregate market value of the voting stock held by non-affiliates, computed by reference to the last sales price on December 31, Indicate the number of shares outstanding of each of the registrant’s classes of Common Stock, as of the latest practicable date. DOCUMENTS INCORPORATED BY REFERENCE 1 PART I Cautionary Statement Relevant to Forward-Looking Information for the Purpose of “Safe Harbor” Provisions of the Private Securities Litigation Reform Act of 1995 The Company and its representatives may from time to time make written or oral forward-looking statements with respect to long-term goals or anticipated results of the Company, including statements contained in the Company’s filings with the Securities and Exchange Commission and in its reports to stockholders. Statements, including those in this Annual Report on Form 10-K, which are not historical or current facts, are “forward-looking statements” made pursuant to the safe harbor provisions of the Private Securities Litigation Reform Act of 1995. There are certain important factors that could cause our results to differ materially from those anticipated by some of the statements made herein. Investors are cautioned that all forward-looking statements involve risk and uncertainty. Some of the factors that could affect results are the cyclical nature of the furniture industry, supply chain disruptions, litigation, including expenses relating to the Indiana civil litigation, the effectiveness of new product introductions and distribution channels, the product mix of sales, pricing pressures, the cost of raw materials and fuel, retention and recruitment of key employees, actions by governments including laws, regulations, taxes and tariffs, inflation, the amount of sales generated and the profit margins thereon, competition (both U.S. and foreign), credit exposure with customers, participation in multi-employer pension plans and general economic conditions. For further information regarding these risks and uncertainties, see the “Risk Factors” section in Item 1A of this Annual Report on Form 10-K. The Company specifically declines to undertake any obligation to publicly revise any forward-looking statements that have been made to reflect events or circumstances after the date of such statements or to reflect the occurrence of anticipated or unanticipated events. Item 1. Business General The Company has one active wholly-owned subsidiary: DMI Furniture, Inc. (“DMI”), which is a Louisville, Kentucky-based, importer and marketer of residential and commercial office The Company operates in one reportable FOR THE YEARS ENDED JUNE 30, (in thousands) FOR THE YEARS ENDED JUNE 30, 2011 2010 2009 2013 2012 2011 Residential $ 258,095 $ 246,041 $ 230,727 $ 311,214 $ 275,442 $ 258,095 Commercial 81,331 80,425 93,431 74,975 76,647 81,331 $ 339,426 $ 326,466 $ 324,158 $ 386,189 $ 352,089 $ 339,426 Manufacturing and Offshore Sourcing We operate manufacturing facilities that are located in Arkansas, California, Georgia, Iowa, Mississippi and Juarez, Mexico. These manufacturing operations are integral to our product offerings and distribution strategy by offering smaller and more frequent product runs of a wider product selection. We identify and eliminate manufacturing inefficiencies and adjust manufacturing schedules on a daily basis to meet customer requirements. We have established relationships with key suppliers to ensure prompt delivery of quality component parts. Our production includes the use of selected offshore component parts to enhance our value in the marketplace. We integrate our manufactured products with finished products acquired from offshore suppliers who can meet our quality specification and scheduling requirements. We will continue to pursue and refine this blended strategy, offering customers manufactured goods, products manufactured utilizing imported component parts, and ready-to-deliver imported products. The Company believes that it best serves customers by offering products from each of these categories to assist customers in reaching specific consumers with varied price points, styles and product categories. This blended focus on products allows the Company to provide a wide range of options to satisfy customer requirements. Competition Seasonality Foreign Operations Customer Backlog June 30, 2011 June 30, 2010 June 30, 2009 $35,700 $49,000 $35,200 June 30, 2013 June 30, 2012 June 30, 2011 $43,300 $38,700 $35,700 Raw Materials Working Capital Practices Industry Factors Government Regulations Environmental Matters Trademarks and Patents It is not common in the furniture industry to obtain a patent for a furniture design. If a particular design of a furniture manufacturer is well accepted in the marketplace, it is common for other manufacturers to imitate the same design without recourse by the furniture manufacturer who initially introduced the design. Furniture products are designed by the Company’s own design staff and through the services of Fiscal Year Ended June 30, Expenditures Expenditures 2013 $2,520 2012 $2,310 2011 $2,190 $2,190 2010 $2,040 2009 $2,680 Employees Website and Available Information A copy of the Company’s Annual Report on Form 10-K, as filed with the Securities and Exchange Commission (“SEC”), other SEC reports filed or furnished and ourGuidelines for Business Conduct are available, without charge, on the Company’s website atwww.flexsteel.com or by writing to the Office of the Secretary, Flexsteel Industries, Inc., P. O. Box 877, Dubuque, IA 52004-0877. The executive officers of the Company, their ages, positions (in each case as of August 16, 2013), and the year they were first elected or appointed an officer of the registrant, are as follows: Name (age) Position (date first became officer) Karel K. Czanderna (57) President & Chief Executive Officer (2012) Timothy E. Hall (55) Senior Vice President-Finance, Chief Financial Officer, Secretary & Treasurer (2000) Jeffrey T. Bertsch (58) Senior Vice President of Corporate Services (1989) Julia K. Bizzis (56) Senior Vice President Strategic Growth (2013) Donald D. Dreher (63) Senior Vice President (2004), President & CEO of DMI Furniture, Inc. (2003) James R. Richardson (69) Senior Vice President of Residential Sales and Marketing (1979) Item 1A. Risk Factors Our business is subject to a variety of risks. You should carefully consider the risk factors detailed below in conjunction with the other information contained in this Annual Report on Form 10-K. Should any of these risks actually materialize, our business, financial condition, and future prospects could be negatively impacted. These risks are not the only ones we face. There may be additional factors that are presently unknown to us or that we currently believe to be immaterial that could affect our business. Our products are considered highly deferrable purchases for consumers during economic downturns. Prolonged negative economic conditions could impact our business. Home furnishings and commercial products are generally considered a deferrable purchase by most consumers and end-users. Economic downturns and prolonged negative economic conditions could affect consumer spending habits by decreasing the overall demand for home furnishings and commercial products. These events could impact retailers, hospitality, recreational vehicle seating and healthcare businesses resulting in an impact on our business. A recovery in our sales could lag significantly behind a general economic recovery due to the deferrable nature and relatively significant cost of home furnishings and commercial products purchases. Our future success depends on our ability to manage our global supply chain. We acquire raw materials, component parts and certain finished products from external suppliers, both U.S. and foreign. Many of these suppliers are dependent upon other suppliers in countries other than where they are located. This global interdependence within our supply chain is subject to delays in delivery, availability, quality and pricing (including tariffs) of products. The delivery of goods from these suppliers may be delayed by customs, labor issues, changes in political, economic and social conditions, laws and regulations. Unfavorable fluctuations in price, quality, delivery and availability of these products could negatively affect our ability to meet demands of our customers and have a negative impact on product margin. Competition from U.S. and foreign finished product manufacturers may adversely affect our business, operating results or financial condition. The furniture industry is very competitive and fragmented. We compete with U.S. and foreign manufacturers and distributors. As a result, we may not be able to maintain or raise the prices of our products in response to competitive pressures or increasing costs. Also, due to the large number of competitors and their wide range of product offerings, we may not be able to significantly differentiate our products (through styling, finish and other construction techniques) from those of our competitors. Our current and potential customers have the ability to obtain products direct from the manufacturers. As a result, we are continually subject to the risk of losing market share, which may lower our sales and earnings. Business failures of large dealers or a group of customers could impact our future sales and earnings. Our business practice has been to extend payment terms to our customers. As a result, we have a large amount of trade receivables. Although we have no customers that individually represent 10% or more of our annual net sales or accounts receivable, net, balance as of June 30, 2013, business failures of a large customer or a group of customers could require us to record additional receivable reserves, which would decrease earnings. Receivables collection can be significantly impacted by economic conditions. Deterioration of the economy or a lack of economic recovery could cause further business failures of our customers, which could in turn require additional receivable reserves and lower our earnings. Our failure to anticipate or respond to changes in consumer or designer tastes and fashions in a timely manner could adversely affect our business and decrease our sales and earnings. Furniture is a styled product and is subject to rapidly changing consumer and end-user trends and tastes and is highly fashion oriented, and if we are not able to acquire sufficient fabric variety, or if we are unable to predict or respond to changes in fashion trends, we may lose sales and have to sell excess inventory at reduced prices. Our success depends on our ability to recruit and retain key employees. Our success depends on our ability to recruit and retain key employees. If we are not successful in recruiting and retaining key employees or experience the unexpected loss of key employees, our operations may be negatively impacted. Future costs of complying with various laws and regulations may adversely impact future operating results. Our business is subject to various laws and regulations Terms of collective bargaining agreements and labor disruptions could adversely impact our results of operations. We employ approximately Due to our participation in multi-employer pension plans, we may have exposures under those plans that could extend beyond what our obligations would be with respect to our employees. We participate in, and make periodic contributions to, three multi-employer pension plans that cover Our future results may be affected by various legal proceedings and compliance risk, including those involving product liability, environmental, or other matters. We face the business risk of exposure to product liability claims in the event that the use of any of our products results in personal injury or property damage. In the event any of our products prove to be defective, we may be required to recall or redesign such products. We are also subject to various laws and regulations relating to environmental protection and the discharge of materials into the Item 1B. Unresolved Staff Comments Item 2. Properties The Company owns the following facilities as of June 30, Location Approximate Principal Operations 221,000 Manufacturing Riverside, California Manufacturing and Distribution Dublin, Georgia 300,000 Manufacturing New Paris, Indiana 168,000 Held for sale Huntingburg, Indiana 691,000 Distribution Dubuque, Iowa Manufacturing and Distribution Dubuque, Iowa 40,000 Corporate Office Starkville, Mississippi 349,000 Manufacturing Lancaster, Pennsylvania 216,000 Distribution The Company leases the following facilities as of June 30, Location Approximate Principal Operations 32,000 Ferdinand, Indiana 101,000 Distribution Louisville, Kentucky 15,000 Administrative Offices Juarez, Mexico Manufacturing The Company’s operating plants are well suited for their manufacturing purposes and have been updated and expanded from time to time as conditions warrant. Management believes there is adequate production and distribution capacity at the Company’s facilities to meet present market demands. The Company leases showrooms for displaying its products in the furniture markets in High Point, North Carolina and Las Vegas, Nevada. Item 3. Legal Proceedings Indiana Civil Litigation – A Complaint for Damages and Injunctive Relief and Request for Jury Trial was filed on March 3, 2011 in Elkhart, Indiana Superior Court by Leo VanNorman, et al, plaintiffs vs. Flexsteel Industries, Inc., et al, defendants. The Plaintiffs have not identified a dollar amount of their alleged Other Item 4. PART II Item 5. Market for the Registrant’s Common Equity, Related Stockholder Matters and Issuer Purchases of Equity Securities Share Investment Performance The following graph 2006 2007 2008 2009 2010 2011 2008 2009 2010 2011 2012 2013 Flexsteel 100.00 115.82 93.64 73.16 97.88 132.62 100.00 78.13 104.53 141.64 196.86 249.18 Peer Group 100.00 87.04 62.64 31.24 39.52 48.76 New Peer Group 100.00 63.84 97.91 144.69 139.38 198.91 NASDAQ 100.00 122.72 93.36 71.02 79.93 105.32 100.00 76.07 85.62 112.80 109.34 142.31 Former Peer Group 100.00 49.87 63.09 77.84 77.96 111.35 The NASDAQ Global Select Market is the principal market on which the Company’s common stock is traded. Sale Price of Common Stock * Cash Dividends Sale Price of Common Stock * Cash Dividends Fiscal 2011 Fiscal 2010 Fiscal 2013 Fiscal 2012 High Low High Low Fiscal 2011 Fiscal 2010 High Low High Low Fiscal 2013 Fiscal 2012 First Quarter $ 15.84 $ 10.08 $ 8.84 $ 6.64 $ 0.075 $ 0.05 $ 23.28 $ 18.68 $ 15.91 $ 13.04 $ 0.15 $ 0.10 Second Quarter 18.75 14.22 10.34 7.77 0.075 0.05 23.44 19.01 15.00 13.26 0.15 0.10 Third Quarter 19.69 14.11 16.50 9.33 0.075 0.05 26.29 21.15 18.39 13.82 0.15 0.10 Fourth Quarter 16.60 13.80 15.74 10.75 0.075 0.05 25.43 18.56 22.00 18.28 0.15 0.15 * Reflects the market price as reported on The NASDAQ Global The Company estimates there were approximately 2013. There were no repurchases of the Company’s common stock during the quarter ended June 30, 2013. The payment of future cash dividends is within the discretion of our Board of Directors and will depend, among other factors, on our earnings, capital requirements and operating and financial condition. Item 6. Selected Financial Data The selected financial data presented below should be read in conjunction with the Company’s consolidated financial statements and notes thereto included in Item 8 of this Annual Report on Form 10-K and with “Management’s Discussion and Analysis of Financial Condition and Results of Operations” included in Item 7 of this Annual Report on Form 10-K. The selected consolidated 2011 2010 2009 2008 2007 SUMMARY OF OPERATIONS Net sales $ 339,426 $ 326,466 $ 324,158 $ 405,655 $ 425,400 Cost of goods sold 262,124 251,685 263,083 327,165 344,177 Operating income (loss) 15,864 17,529 (2,272 ) 7,596 14,699 Interest and other income 343 361 661 469 1,277 Interest expense — 439 968 1,469 1,491 Income (loss) before income taxes 16,207 17,451 (2,579 ) 6,596 14,484 Income tax provision (benefit) 5,790 6,650 (1,070 ) 2,360 5,150 Net income (loss) (1) (2) (3) 10,417 10,801 (1,509 ) 4,236 9,334 Earnings (loss) per common share: (1) (2) (3) Basic 1.56 1.63 (0.23 ) 0.64 1.42 Diluted 1.50 1.61 (0.23 ) 0.64 1.42 Cash dividends declared per common share $ 0.30 $ 0.20 $ 0.36 $ 0.52 $ 0.52 SELECTED DATA AS OF JUNE 30 Average common shares outstanding: Basic 6,693 6,608 6,576 6,574 6,568 Diluted 6,929 6,697 6,576 6,611 6,583 Total assets $ 164,677 $ 157,670 $ 150,971 $ 179,906 $ 185,014 Property, plant and equipment, net 21,387 21,614 23,298 26,372 28,168 Capital expenditures 2,573 1,251 1,203 1,228 10,839 Long-term debt — — — 20,811 21,336 Working capital (current assets less current liabilities) 100,683 90,800 78,416 100,920 97,902 Shareholders’ equity $ 128,573 $ 117,612 $ 106,998 $ 112,752 $ 112,679 SELECTED RATIOS Net income (loss), as a percent of sales 3.1 3.3 (0.5 ) 1.0 2.2 Current ratio 4.6 to 1 3.9 to 1 3.2 to 1 3.5 to 1 3.2 to 1 Return on ending shareholders’ equity 8.1 9.2 (1.4 ) 3.8 8.3 Average number of employees 1,320 1,400 1,600 2,140 2,290 2013 2012 2011 2010 2009 SUMMARY OF OPERATIONS Net sales $ 386,189 $ 352,089 $ 339,426 $ 326,466 $ 324,158 Cost of goods sold 295,720 266,810 262,124 251,685 263,083 Operating income (loss) 20,271 20,246 15,864 17,529 (2,272 ) Interest and other income 610 422 343 361 661 Interest expense — — — 439 968 Income (loss) before income taxes 20,881 20,668 16,207 17,451 (2,579 ) Income tax provision (benefit) 7,730 7,600 5,790 6,650 (1,070 ) Net income (loss) (1) (2) (3) 13,151 13,068 10,417 10,801 (1,509 ) Earnings (loss) per common share: (1) (2) (3) Basic 1.87 1.93 1.56 1.63 (0.23 ) Diluted 1.80 1.86 1.50 1.61 (0.23 ) Cash dividends declared per common share $ 0.60 $ 0.45 $ 0.30 $ 0.20 $ 0.36 SELECTED DATA AS OF JUNE 30 Average common shares outstanding: Basic 7,041 6,781 6,693 6,608 6,576 Diluted 7,326 7,008 6,929 6,697 6,576 Total assets $ 192,539 $ 181,672 $ 164,677 $ 157,670 $ 150,971 Property, plant and equipment, net 32,145 29,867 21,387 21,614 23,298 Capital expenditures 6,225 10,939 2,573 1,251 1,203 Working capital (current assets less current liabilities) 113,699 103,744 100,683 90,800 78,416 Shareholders’ equity $ 151,237 $ 139,442 $ 128,573 $ 117,612 $ 106,998 SELECTED RATIOS Net income (loss), as a percent of sales 3.4 3.7 3.1 3.3 (0.5 ) Current ratio 4.2 to 1 4.3 to 1 4.6 to 1 3.9 to 1 3.2 to 1 Return on ending shareholders’ equity 8.7 9.4 8.1 9.2 (1.4 ) Average number of employees 1,320 1,300 1,320 1,400 1,600 (1) Fiscal 2013 net income and per share amounts include executive transition costs of $0.8 million (after tax) or $0.11 per share. (2) Fiscal 2011 net income and per share amounts include charges consisting of employee separation costs and inventory write down related to closing a manufacturing facility of $1.0 million (after tax) or $0.15 per share. Fiscal 2009 net loss and per share amounts reflect facility consolidation and other costs (after tax) of $1.5 million or $0.23 Item 7. Management’s Discussion and Analysis of Financial Condition and Results of Operations General The following analysis of the results of operations and financial condition of the Company should be read in conjunction with the consolidated financial statements and related notes included elsewhere in this Annual Report on Form 10-K. Critical Accounting Policies The discussion and analysis of the Company’s consolidated financial statements and results of operations are based on consolidated financial statements prepared in accordance with accounting principles generally accepted in the United States of America. Preparation of these consolidated financial statements requires the use of estimates and judgments that affect the reported results. The Company uses estimates based on the best information available in recording transactions and balances resulting from business operations. Estimates are used for such items as Allowance for doubtful accounts – the Company establishes an allowance for doubtful accounts through review of open accounts, historical collections and historical Inventories – the Company values inventory at the lower of cost or Revenue recognition – is Recently Issued Accounting Pronouncements See Item 8. Note 1 to the Company’s Consolidated Financial Statements. Results of Operations The following table has been prepared as an aid in understanding the Company’s results of operations on a comparative basis for the fiscal years ended June 30, FOR THE YEARS ENDED JUNE 30, FOR THE YEARS ENDED JUNE 30, 2011 2010 2009 2013 2012 2011 Net sales 100.0 % 100.0 % 100.0 % 100.0 % 100.0 % 100.0 % Cost of goods sold (77.2 ) (77.2 ) (81.2 ) (76.6 ) (75.8 ) (77.2 ) Gross margin 22.8 22.8 18.8 23.4 24.2 22.8 Selling, general and administrative (17.8 ) (17.5 ) (18.8 ) (18.2 ) (18.4 ) (17.8 ) Facility consolidation and other charges (0.3 ) — (0.8 ) — — (0.3 ) Operating income (loss) 4.7 5.3 (0.8 ) Operating income 5.2 5.8 4.7 Other income, net 0.1 0.0 0.0 0.2 0.1 0.1 Income (loss) before income taxes 4.8 5.3 (0.8 ) Income tax (provision) benefit (1.7 ) (2.0 ) 0.3 Net income (loss) 3.1 % 3.3 % (0.5 )% Income before income taxes 5.4 5.9 4.8 Income tax provision (2.0 ) (2.2 ) (1.7 ) Net income 3.4 % 3.7 % 3.1 % Fiscal Net sales for fiscal Gross margin for the fiscal year ended June 30, 2013 was 23.4% compared to 24.2% for the prior fiscal year. During fiscal year 2013 the Company’s expenses related to workers compensation and health insurance programs were approximately $1.5 million higher than in fiscal 2012, impacting gross margin by 0.4%. Selling, general and administrative expenses for the fiscal year ended June 30, 2013 were 18.2% of net sales compared to 18.4% in the prior fiscal year. The current year includes executive transition costs of $1.3 million or 0.4% of net sales. The effective tax rate for the fiscal year ended June 30, 2013 was 37.0% compared to 36.8% for fiscal year 2012. The change in effective tax rate is primarily due to the lower benefit of the Domestic Manufacturing Deduction under Internal Revenue Code Section 199 (DMD), which provides a tax benefit on U.S. based manufacturing, and the limitation on executive compensation deduction. The fiscal year 2013 net income increased $0.1 million to $13.2 million, the highest ever reported for the Company. The number of diluted shares increased during fiscal 2013 due to additional shares outstanding and the impact of the Company’s higher stock trading price on outstanding options, resulting in the Company reporting diluted earnings per share of $1.80 for fiscal year 2013 versus $1.86 for fiscal year 2012. All earnings per share amounts are on a diluted basis. Fiscal 2012 Compared to Fiscal 2011 Net sales for fiscal 2012 were $352.1 million compared to $339.4 million in the prior fiscal year, an increase of 3.7%. For the fiscal year ended June 30, 2012, residential net sales were $275.4 million compared to $258.1 million for the year ended June 30, 2011, an increase of Gross margin for the year ended June 30, Operating income The effective tax rate for the fiscal year ended June 30, The above factors resulted in net income for the fiscal year ended June 30, 2011. All earnings per share amounts are on a diluted basis. Liquidity and Capital Resources Working capital (current assets less current liabilities) at June 30, The Company’s main source of liquidity is cash and cash flows from operations. As of June 30, 2013 and 2012, the Company had cash totaling $10.9 million and $14.0 million, respectively. The Company maintains a credit agreement which provides short-term working capital financing up to $10.0 million with interest of LIBOR plus 1%, including up to $4.0 million of letters of credit. Letters of credit outstanding at June 30, 2013 totaled $2.3 million, leaving borrowing availability of $7.7 million. The Company did not utilize any borrowing availability under the credit facility during the period other than the aforementioned letters of credit. The credit agreement expires June 30, 2014. At June 30, 2013, the Company was in compliance with all of the financial covenants contained in the credit agreement. An officer of the Company is a director at a bank where the Company maintains an unsecured $8.0 million line of credit, with interest at prime minus 1%, and where its routine banking transactions are processed. The Company did not utilize any borrowing availability during the period and no amount was outstanding on the line of credit at June 30, 2013. In addition, the supplemental retirement plans assets, held in a Rabbi Trust, of $5.8 million are administered by this bank’s trust department. The Company receives no special services or pricing on the services performed by the bank due to the directorship of this officer. Cash decreased Net cash provided by operating activities Net cash used in investing activities was During fiscal year Net cash used in financing activities was The Company expects that capital expenditures for fiscal year 2014 will be approximately At June 30, Total Less than 1 - 3 3 - 5 More than Operating lease obligations $ 4,082 $ 1,851 $ 2,231 $ — $ — Total 1 Year 2 - 3 4 - 5 More than Operating lease obligations $ 10,087 $ 2,617 $ 3,897 $ 1,588 $ 1,985 Supplemental retirement plans 5,403 2,989 — — 2,414 Total contractual obligations 15,490 5,606 3,897 1,588 4,399 Financing Arrangements See Note 6 to the Consolidated Financial Statements of this Annual Report on Form 10-K. Outlook Item 7A. Quantitative and Qualitative Disclosures About Market Risk General– Market risk represents the risk of changes in the value of a financial instrument, derivative or non-derivative, caused by fluctuations in interest rates, foreign exchange rates and equity prices. As discussed below, management of the Company does not believe that changes in these factors could cause material fluctuations in the Company’s results of operations or cash flows. The ability to import furniture products can be adversely affected by political issues in the countries where suppliers are located, disruptions associated with shipping distances and negotiations with port employees. Other risks related to furniture product importation include government imposition of regulations and/or quotas; duties and taxes on imports; and significant fluctuation in the value of the U.S. dollar against foreign currencies. Any of these factors could interrupt supply, increase costs and decrease earnings. Inflation – Increased operating costs are reflected in product or services pricing with any limitations on price increases determined by the marketplace. Inflation or other pricing pressures could impact raw material costs, labor costs and interest rates which are important components of costs for the Company and could have an adverse effect on our profitability, especially where increases in these costs exceed price increases on finished products. Foreign Currency Risk – During fiscal years Interest Rate Risk –The Company’s primary market risk exposure with regard to financial instruments is changes in interest rates. At June 30, Item 8. Financial Statements and Supplementary Data REPORT OF INDEPENDENT REGISTERED PUBLIC ACCOUNTING FIRM To the Board of Directors and We have audited the accompanying consolidated balance sheets of Flexsteel Industries, Inc. and subsidiaries (the “Company”) as of June 30, We conducted our audits in accordance with the standards of the Public Company Accounting Oversight Board (United States). Those standards require that we plan and perform the audit to obtain reasonable assurance about whether the financial statements are free of material misstatement. In our opinion, such consolidated financial statements present fairly, in all material respects, the financial position of Flexsteel Industries, Inc. and subsidiaries as of June 30, (Amounts in thousands, except share and per share data) JUNE 30, June 30, 2011 2010 2013 2012 ASSETS CURRENT ASSETS: Cash $ 17,889 $ 8,278 $ 10,934 $ 13,970 Trade receivables – less allowance for doubtful accounts: 2011, $2,000; 2010, $2,020 31,451 35,748 Trade Receivables - less allowances: 2013, $1,560; 2012, $1,910 36,075 33,601 Inventories 73,680 72,637 92,417 82,689 Deferred income taxes 3,700 4,050 4,970 3,750 Other 1,633 1,076 Other current assets 4,805 1,583 Total current assets 128,353 121,789 149,201 135,593 NONCURRENT ASSETS: Property, plant and equipment, net 21,387 21,614 32,145 29,867 Deferred income taxes 2,560 3,010 1,190 3,160 Other assets 12,377 11,257 10,003 13,052 TOTAL $ 164,677 $ 157,670 $ 192,539 $ 181,672 LIABILITIES AND SHAREHOLDERS’ EQUITY CURRENT LIABILITIES: Accounts payable – trade $ 9,899 $ 10,815 Accounts payable - trade $ 13,927 $ 12,973 Accrued liabilities: Payroll and related items 6,922 7,023 7,836 8,037 Insurance 5,645 6,192 4,667 4,440 Other 5,204 6,959 Other current liabilities 9,072 6,399 Total current liabilities 27,670 30,989 35,502 31,849 LONG-TERM LIABILITIES: Deferred compensation 5,270 5,096 Supplemental retirement plans 2,414 5,613 Other liabilities 3,164 3,973 3,386 4,768 Total liabilities 36,104 40,058 41,302 42,230 COMMITMENTS AND CONTINGENCIES (Note 12) SHAREHOLDERS’ EQUITY: Cumulative preferred stock – $50 par value; authorized 60,000 shares; outstanding – none Undesignated (subordinated) stock – $1 par value; authorized 700,000 shares; outstanding – none Common stock – $1 par value; authorized 15,000,000 shares; outstanding 2011, 6,710,612 shares; 2010, 6,645,532 shares 6,711 6,646 Cumulative preferred stock - $50 par value; authorized 60,000 shares; outstanding - none Undesignated (subordinated) stock - $1 par value; authorized 700,000 shares; outstanding - none Common stock - $1 par value; authorized 15,000,000 shares; outstanding 2013, 7,106,723 shares; 2012, 6,905,534 shares 7,107 6,906 Additional paid-in capital 6,698 5,425 10,615 8,476 Retained earnings 115,699 107,293 134,606 125,699 Accumulated other comprehensive loss (535 ) (1,752 ) (1,091 ) (1,639 ) Total shareholders’ equity 128,573 117,612 151,237 139,442 TOTAL $ 164,677 $ 157,670 $ 192,539 $ 181,672 See accompanying Notes to Consolidated Financial Statements. FLEXSTEEL INDUSTRIES, INC. AND SUBSIDIARIES For the years ended June 30, 2013 2012 2011 Net sales $ 386,189 $ 352,089 $ 339,426 Cost of goods sold (295,720 ) (266,810 ) (262,124 ) Gross margin 90,469 85,279 77,302 Selling, general and administrative (70,198 ) (65,033 ) (60,422 ) Facility closing costs — — (1,016 ) Operating income 20,271 20,246 15,864 Interest and other income 610 422 343 Income before income taxes 20,881 20,668 16,207 Income tax provision (7,730 ) (7,600 ) (5,790 ) Net income $ 13,151 $ 13,068 $ 10,417 Weighted average number of common shares outstanding: Basic 7,041 6,781 6,693 Diluted 7,326 7,008 6,929 Earnings per share of common stock: Basic $ 1.87 $ 1.93 $ 1.56 Diluted $ 1.80 $ 1.86 $ 1.50 Cash dividends declared per common share $ 0.60 $ 0.45 $ 0.30 CONSOLIDATED STATEMENTS OF COMPREHENSIVE INCOME For the years ended June 30, 2013 2012 2011 Net income $ 13,151 $ 13,068 $ 10,417 Unrealized gains (losses) on securities in supplemental retirement plans 96 (5 ) 562 Income tax (expense) benefit related to securities in supplemental retirement plans gains (losses) (36 ) 2 (214 ) Net unrealized gains (losses) on securities in supplemental retirement plans (1) 60 (3 ) 348 Minimum pension liability 787 (1,771 ) 1,401 Income tax (expense) benefit related to minimum pension liability (299 ) 670 (532 ) Net minimum pension liability 488 (1,101 ) 869 Other comprehensive income (loss), net of tax 548 (1,104 ) 1,217 Comprehensive income $ 13,699 $ 11,964 $ 11,634 See Note 9 to the Consolidated Financial Statements See accompanying Notes to Consolidated Financial Statements. FOR THE YEARS ENDED JUNE 30, 2011 2010 2009 NET SALES $ 339,426 $ 326,466 $ 324,158 COST OF GOODS SOLD (262,124 ) (251,685 ) (263,083 ) GROSS MARGIN 77,302 74,781 61,075 SELLING, GENERAL AND ADMINISTRATIVE (60,422 ) (57,252 ) (60,792 ) FACILITY CLOSING COSTS (1,016 ) — (2,555 ) OPERATING INCOME (LOSS) 15,864 17,529 (2,272 ) OTHER INCOME (EXPENSE): Interest and other income 343 361 661 Interest expense — (439 ) (968 ) Total 343 (78 ) (307 ) INCOME (LOSS) BEFORE INCOME TAXES 16,207 17,451 (2,579 ) INCOME TAX (PROVISION) BENEFIT (5,790 ) (6,650 ) 1,070 NET INCOME (LOSS) $ 10,417 $ 10,801 $ (1,509 ) WEIGHTED AVERAGE NUMBER OF COMMON SHARES OUTSTANDING: Basic 6,693 6,608 6,576 Diluted 6,929 6,697 6,576 EARNINGS (LOSS) PER SHARE OF COMMON STOCK: Basic $ 1.56 $ 1.63 $ (0.23 ) Diluted $ 1.50 $ 1.61 $ (0.23 ) CASH DIVIDENDS DECLARED PER COMMON SHARE $ 0.30 $ 0.20 $ 0.36 FLEXSTEEL INDUSTRIES, INC. AND SUBSIDIARIES Total Par Additional Retained Accumulated Total Balance at June 30, 2010 $ 6,646 $ 5,425 $ 107,293 $ (1,752 ) $ 117,612 Issuance of common stock: Stock options exercised, net 65 259 — — 324 Unrealized gain on available for sale investments, net of tax — — — 348 348 Long-term incentive compensation — 590 — — 590 Stock-based compensation — 424 — — 424 Minimum pension liability adjustment, net of tax — — — 869 869 Cash dividends declared — — (2,011 ) — (2,011 ) Net income — — 10,417 — 10,417 Balance at June 30, 2011 $ 6,711 $ 6,698 $ 115,699 $ (535 ) $ 128,573 Issuance of common stock: Stock options exercised, net 156 761 — — 917 Unrealized gain on available for sale investments, net of tax — — — (3 ) (3 ) Long-term incentive compensation 39 761 — — 800 Stock-based compensation — 256 — — 256 Minimum pension liability adjustment, net of tax — — — (1,101 ) (1,101 ) Cash dividends declared — — (3,068 ) — (3,068 ) Net income — — 13,068 — 13,068 Balance at June 30, 2012 $ 6,906 $ 8,476 $ 125,699 $ (1,639 ) $ 139,442 Issuance of common stock: Stock options exercised, net 92 1,197 — — 1,289 Unrealized gain on available for sale investments, net of tax — — — 60 60 Long-term incentive compensation 109 442 — — 551 Stock-based compensation — 500 — — 500 Minimum pension liability adjustment, net of tax — — — 488 488 Cash dividends declared — — (4,244 ) — (4,244 ) Net income — — 13,151 — 13,151 Balance at June 30, 2013 $ 7,107 $ 10,615 $ 134,606 $ (1,091 ) $ 151,237 See accompanying Notes to Consolidated Financial Statements. Total Par Additional Retained Accumulated Total Balance at July 1, 2008 $ 6,576 $ 4,256 $ 101,692 $ 228 $ 112,752 Unrealized loss on available for sale investments, net of tax — — — (1,022 ) (1,022 ) Stock-based compensation — 114 — — 114 Interest rate swaps valuation adjustment, net of tax — — — (1 ) (1 ) Minimum pension liability adjustment, net of tax — — — (969 ) (969 ) Cash dividends declared — — (2,367 ) — (2,367 ) Net loss — — (1,509 ) — (1,509 ) Balance at June 30, 2009 6,576 4,370 97,816 (1,764 ) 106,998 Issuance of common stock: Stock options exercised, net 70 274 — — 344 Unrealized gain on available for sale investments, net of tax — — — 39 39 Long-term incentive compensation — 510 — — 510 Stock-based compensation — 271 — — 271 Interest rate swaps valuation adjustment, net of tax — — — 177 177 Minimum pension liability adjustment, net of tax — — — (204 ) (204 ) Cash dividends declared — — (1,324 ) — (1,324 ) Net income — — 10,801 — 10,801 Balance at June 30, 2010 6,646 5,425 107,293 (1,752 ) 117,612 Issuance of common stock: Stock options exercised, net 65 259 — — 324 Unrealized gain on available for sale investments, net of tax — — — 348 348 Long-term incentive compensation — 590 — — 590 Stock-based compensation — 424 — — 424 Minimum pension liability adjustment, net of tax — — — 869 869 Cash dividends declared — — (2,011 ) — (2,011 ) Net income — — 10,417 — 10,417 Balance at June 30, 2011 $ 6,711 $ 6,698 $ 115,699 $ (535 ) $ 128,573 FOR THE YEARS ENDED JUNE 30, 2013 2012 2011 OPERATING ACTIVITIES: Net income $ 13,151 $ 13,068 $ 10,417 Adjustments to reconcile net income to net cash provided by (used in) operating activities: Depreciation 3,803 2,835 2,690 Deferred income taxes 414 23 54 Stock-based compensation expense 1,051 1,056 1,014 Excess tax benefit from stock-based payment arrangements (182 ) — — Provision for losses on accounts receivable (215 ) (150 ) 870 Other non-cash, net 69 7 224 Gain on disposition of capital assets (18 ) (34 ) (185 ) Changes in operating assets and liabilities: Trade receivables (2,260 ) (2,000 ) 3,427 Inventories (9,728 ) (9,009 ) (1,043 ) Other current assets 58 50 (557 ) Other assets (307 ) (308 ) (270 ) Accounts payable - trade 1,082 2,699 (841 ) Accrued liabilities (138 ) 572 (2,541 ) Other long-term liabilities (665 ) (174 ) 367 Supplemental retirement plans (210 ) 342 174 Net cash provided by operating activities 5,905 8,977 13,800 INVESTING ACTIVITIES: Purchases of investments (1,086 ) (777 ) (698 ) Proceeds from sales of investments 1,273 405 410 Proceeds from sale of capital assets 21 34 187 Capital expenditures (6,225 ) (10,939 ) (2,573 ) Net cash used in investing activities (6,017 ) (11,277 ) (2,674 ) FINANCING ACTIVITIES: Dividends paid (4,213 ) (2,535 ) (1,839 ) Proceeds from issuance of common stock 1,107 916 324 Excess tax benefit from stock-based payment arrangements 182 — — Net cash used in financing activities (2,924 ) (1,619 ) (1,515 ) (Decrease) increase in cash and cash equivalents (3,036 ) (3,919 ) 9,611 Cash at beginning of year 13,970 17,889 8,278 Cash at end of year $ 10,934 $ 13,970 $ 17,889 FOR THE YEARS ENDED JUNE 30, 2013 2012 2011 SUPPLEMENTAL INFORMATION CASH PAID DURING THE PERIOD FOR: Income taxes paid $ 7,250 $ 6,237 $ 7,647 Capital expenditures in accounts payable $ 261 $ 389 $ 14 See accompanying Notes to Consolidated Financial Statements. FOR THE YEARS ENDED JUNE 30, 2011 2010 2009 OPERATING ACTIVITIES: Net income (loss) $ 10,417 $ 10,801 $ (1,509 ) Adjustments to reconcile net income (loss) to net cash provided by (used in) operating activities: Depreciation 2,690 2,986 3,733 Deferred income taxes 54 (963 ) 449 Stock-based compensation expense 1,014 781 114 Provision for losses on accounts receivable 870 920 1,240 Other non-cash, net 224 218 14 Gain on disposition of capital assets (185 ) (9 ) (252 ) Gain on sale of investments — — (462 ) Impairment of long-lived assets — — 138 Changes in operating assets and liabilities: Trade receivables 3,427 (5,386 ) 11,261 Inventories (1,043 ) 1,207 11,947 Other current assets (557 ) 2,837 (781 ) Other assets (270 ) (18 ) (288 ) Accounts payable – trade (841 ) 994 (4,849 ) Accrued liabilities (2,541 ) 3,618 (2,918 ) Other long-term liabilities 367 1,028 (178 ) Deferred compensation 174 105 (352 ) Net cash provided by operating activities 13,800 19,119 17,307 INVESTING ACTIVITIES: Purchases of investments (698 ) (721 ) (520 ) Proceeds from sales of investments 410 359 1,460 Proceeds from sale of capital assets 187 34 676 Capital expenditures (2,573 ) (1,251 ) (1,203 ) Net cash (used in) provided by investing activities (2,674 ) (1,579 ) 413 FINANCING ACTIVITIES: (Repayments of) proceeds from short-term borrowings, net — (10,000 ) 4,857 Repayment of long-term borrowings — — (20,811 ) Dividends paid (1,839 ) (1,320 ) (2,893 ) Proceeds from issuance of common stock 324 344 — Net cash used in financing activities (1,515 ) (10,976 ) (18,847 ) Increase (decrease) in cash and cash equivalents 9,611 6,564 (1,127 ) Cash and cash equivalents at beginning of year 8,278 1,714 2,841 Cash and cash equivalents at end of year $ 17,889 $ 8,278 $ 1,714 FOR THE YEARS ENDED JUNE 30, 2011 2010 2009 SUPPLEMENTAL INFORMATION CASH PAID DURING THE PERIOD FOR: Interest $ — $ 439 $ 979 Income taxes paid (refunded) $ 7,647 $ 3,587 $ (62 ) FLEXSTEEL INDUSTRIES, INC. AND SUBSIDIARIES 1. SUMMARY OF SIGNIFICANT ACCOUNTING POLICIES DESCRIPTION OF BUSINESS – Flexsteel Industries, Inc. and subsidiaries (the “Company”) is one of the oldest and largest PRINCIPLES OF CONSOLIDATION – the consolidated financial statements include the accounts of Flexsteel Industries, Inc. and its wholly owned subsidiaries. All intercompany transactions and accounts have been eliminated in consolidation. USE OF ESTIMATES – the preparation of consolidated financial statements in conformity with accounting principles generally accepted in the United States of America requires management to make estimates and assumptions that affect the amounts reported in the consolidated financial statements and accompanying notes. Ultimate results could differ from those estimates. FAIR VALUE – the Company’s cash, accounts receivable, other current assets, accounts payable and certain accrued liabilities are carried at amounts which reasonably approximate their fair value due to their short-term nature. Generally accepted accounting principles on fair value measurement for certain financial assets and liabilities INVENTORIES – are stated at the lower of cost or PROPERTY, PLANT AND EQUIPMENT – is stated at cost and depreciated using the straight-line method over the estimated useful lives of the assets. For internal use software, the Company’s policy is to capitalize external direct costs of materials and services, directly related internal payroll and payroll-related costs, and interest costs. These costs are amortized using the straight-line method over the useful lives. VALUATION OF LONG–LIVED ASSETS – the Company periodically reviews the carrying value of long-lived assets and estimated depreciable or amortizable lives for continued appropriateness. This review is based upon projections of anticipated future cash flows and is performed whenever events or changes in circumstances indicate that asset carrying values may not be recoverable or that the estimated depreciable or amortizable lives may have changed. No impairments of long-lived assets or changes in depreciable or amortizable lives were incurred during fiscal year 2013. WARRANTY – the Company estimates the amount of warranty claims on sold product that may be incurred based on current and historical data. The actual warranty expense could differ from the estimates made by the Company based on product performance. REVENUE RECOGNITION – is ADVERTISING COSTS – are charged to selling, general and administrative expense in the periods incurred. The Company conducts no direct-response advertising programs and there are no assets related to advertising recorded on the consolidated balance sheet. Advertising expenditures, primarily shared customer advertising in which an identifiable benefit is received and national trade-advertising programs, were approximately DESIGN, RESEARCH AND DEVELOPMENT COSTS – are charged to selling, general and administrative expense in the periods incurred. Expenditures for design, research and development costs were approximately INSURANCE – the Company is self-insured for health care and most workers’ compensation up to predetermined amounts above which third party insurance applies. The Company purchases specific stop-loss insurance for individual health care claims in excess of $150,000 per plan year. For workers’ compensation the Company retains the first INCOME TAXES – the Company uses the liability method of accounting for income taxes. Under this method, deferred tax assets and liabilities are determined based on differences between the financial reporting and tax bases of assets and liabilities and are measured using the enacted tax rates and laws that will be in effect when the differences are expected to reverse. The Company recognizes in its financial statements the tax benefit from an uncertain tax position only if it is more likely than not that the tax position will be sustained on examination by the taxing authorities, based on the technical merits of the position. EARNINGS In computing EPS for the fiscal years ended 2013, 2012 and 2011, net income as reported for each respective period is divided by the fully diluted weighted average number of June 30, (in thousands) 2013 2012 2011 Basic shares 7,041 6,781 6,693 Potential common shares: Stock options 253 142 147 Long-term incentive plan 32 85 89 285 227 236 Diluted shares 7,326 7,008 6,929 Anti-dilutive shares 10 300 424 STOCK–BASED COMPENSATION – the Company recognizes compensation expense related to the cost of employee services received in exchange for Company equity interests based on the award’s fair value at the date of grant. See Note 8 Stock-Based Compensation. ACCOUNTING DEVELOPMENTS – In 2. INVENTORIES Inventories valued on a LIFO basis (steel) would have been approximately June 30, (in thousands) June 30, 2011 2010 2013 2012 Raw materials $ 9,235 $ 9,696 $ 10,684 $ 10,410 Work in process and finished parts 3,951 4,943 5,410 5,288 Finished goods 60,494 57,998 76,323 66,991 Total $ 73,680 $ 72,637 $ 92,417 $ 82,689 3. PROPERTY, PLANT AND EQUIPMENT (in thousands) Estimated June 30, Estimated June 30, Life (Years) 2011 2010 2013 2012 Land $ 3,984 $ 3,984 $ 4,233 $ 4,150 Buildings and improvements 5-39 39,851 40,248 5-39 49,147 39,978 Machinery and equipment 3-7 26,513 28,251 3-7 27,048 26,449 Delivery equipment 3-5 18,180 18,269 3-5 18,689 18,113 Furniture and fixtures 3-7 4,000 4,291 3-7 6,265 3,843 Construction in progress 366 — — 9,333 Total 92,894 95,043 105,382 101,866 Less accumulated depreciation (71,507 ) (73,429 ) (73,237 ) (71,999 ) Net $ 21,387 $ 21,614 32,145 29,867 4. OTHER NONCURRENT ASSETS (in thousands) June 30, June 30, 2011 2010 2013 2012 Cash value of life insurance $ 6,815 $ 6,560 $ 7,337 $ 7,072 Rabbi Trust assets (see Note 9) 5,533 4,683 2,529 5,900 Other 29 14 137 80 Total $ 12,377 $ 11,257 $ 10,003 $ 13,052 5. ACCRUED LIABILITIES – OTHER (in thousands) June 30, June 30, 2011 2010 2013 2012 Dividends $ 504 $ 332 $ 1,067 $ 1,036 Income taxes — 1,445 299 562 Advertising 1,873 2,200 2,220 1,899 Warranty 970 980 1,000 1,010 Supplemental retirement plans - current 2,989 — Other 1,857 2,002 1,497 1,892 Total $ 5,204 $ 6,959 $ 9,072 $ 6,399 6. CREDIT ARRANGEMENTS The Company maintains a credit agreement which provides short-term working capital financing up to An officer of the Company is a director at a bank where the Company maintains an 7. INCOME TAXES In determining the provision for income taxes, the Company uses an estimated annual effective tax rate that is based on the annual income, The components of the gross liabilities related to unrecognized tax benefits and the related deferred tax assets are as June 30, (in thousands) June 30, 2011 2010 2013 2012 Gross unrecognized tax benefits $ 970 $ 995 $ 1,085 $ 1,000 Accrued Interest and penalties 340 215 Accrued interest and penalties 425 365 Gross liabilities related to unrecognized tax benefits $ 1,310 $ 1,210 $ 1,510 $ 1,365 Deferred tax assets $ 330 $ 230 $ 440 $ 350 A reconciliation of the beginning and ending amount of unrecognized tax benefits is as Balance at June 30, 2009 $ 404 Additions for tax positions of prior years 591 Balance at June 30, 2010 995 Reduction for tax positions of prior years (25 ) Balance at June 30, 2011 $ 970 (in thousands) 2013 2012 2011 Balance at July 1 $ 1,000 $ 970 $ 995 Additions based on tax positions related to the current year 265 207 193 Additions for tax positions of prior years 100 — 41 Reductions for tax positions of prior years (280 ) (177 ) (259 ) Balance at June 30 $ 1,085 $ 1,000 $ 970 The Company records interest and penalties related to income taxes as income tax expense in the The income tax provision (benefit) is as follows for the years ended June 2011 2010 2009 Federal – current $ 5,313 $ 6,630 $ (1,410 ) State – current 423 975 (110 ) (in thousands) 2013 2012 2011 Federal- current $ 6,750 $ 6,969 $ 5,313 State - current 566 608 423 Deferred 54 (955 ) 450 414 23 54 Total $ 5,790 $ 6,650 $ (1,070 ) $ 7,730 $ 7,600 $ 5,790 A reconciliation between the U.S. federal statutory tax rate and the effective tax rate is as follows for the years ended June 30: 2011 2010 2009 2013 2012 2011 Federal statutory tax rate 35.0 % 35.0 % 34.0 % 35.0 % 35.0 % 35.0 % State taxes, net of federal effect 2.6 3.7 2.7 2.6 2.9 2.6 Other (1.9 ) (0.6 ) 4.8 (0.6 ) (1.1 ) (1.9 ) Effective tax rate 35.7 % 38.1 % 41.5 % 37.0 % 36.8 % 35.7 % The effective tax rate for the fiscal The primary components of deferred tax assets and (liabilities) are as June 30, 2011 June 30, 2010 (in thousands) June 30, 2013 June 30, 2012 Current Long-term Current Long-term Current Long-term Current Long-term Accounts receivable $ 740 $ — $ 750 $ — $ 590 $ — $ 710 $ — Inventory 1,360 — 1,100 — 1,530 — 1,390 — Self insurance 620 — 690 — Self-insurance 500 — 480 — Employee benefits 360 — 680 — 800 — 480 — Accrued expenses 620 — 830 — 550 — 690 — Property, plant and equipment — (760 ) — (340 ) — (1,150 ) — (860 ) Deferred compensation — 2,520 — 2,280 Supplemental retirement plans 1,000 810 — 2,430 Other — 800 — 1,070 — 1,530 — 1,590 Total $ 3,700 $ 2,560 $ 4,050 $ 3,010 $ 4,970 $ 1,190 $ 3,750 $ 3,160 The Company is subject to U.S. federal income tax as well as income tax of multiple state and foreign jurisdictions. Generally, tax years 8. STOCK-BASED COMPENSATION The Company has two stock-based compensation methods available when determining employee compensation. (1) Long-Term Management Incentive Compensation Plan – The plan provides for shares of common stock and cash to be awarded to officers and key employees based on performance targets set by the Nominating and Compensation Committee of the Board of Directors (the “Committee”). The Company’s shareholders approved 500,000 shares to be issued under the plan. As of June 30, 2013, 148,213 shares have been issued. The Committee selected consolidated operating results for organic net sales growth and fully-diluted earnings per share for the three-year performance periods beginning July 1, The aggregate number of shares and cash that could be awarded to key executives if the minimum, target and maximum performance goals are met, based upon the fair market value at June 30, Minimum Target Maximum Performance Period Shares Cash Shares Cash Shares Cash Fiscal Year 2009 – 2011 16 $ 152 45 $ 435 71 $ 696 Fiscal Year 2010 – 2012 20 $ 198 58 $ 567 93 $ 907 Fiscal Year 2011 – 2013 17 $ 162 48 $ 463 76 $ 741 (in thousands) Minimum Target Maximum Performance Period Shares Cash Shares Cash Shares Cash Fiscal Year 2011 - 2013 12 $ 198 35 $ 566 56 $ 905 Fiscal Year 2012 - 2014 11 $ 179 32 $ 512 50 $ 819 Fiscal Year 2013 - 2015 10 $ 168 30 $ 481 47 $ 769 If the target performance goals would be achieved, the total amount of compensation cost recognized over the requisite service periods would be $0.9 million Stock Option Plans – The stock option plans for key employees and directors provide for the granting of incentive and nonqualified stock options. Under the plans, options are granted at an exercise price equal to the fair market value of the underlying common stock at the date of grant, and may be exercisable for up to 10 years. All options are exercisable when granted. In fiscal years The fair value of each option grant is estimated on the date of grant using the Black-Scholes option-pricing model with the following weighted-average assumptions used for grants in fiscal The weighted-average grant date fair value of stock options granted during fiscal years 2013, 2012 and 2011 At June 30, A summary of the status of the Company’s stock option plans as of June 30, Shares Weighted Average Aggregate Shares Weighted Average Aggregate Outstanding and exercisable at June 30, 2009 1,020 $ 12.94 $ 407 Outstanding and exercisable at June 30, 2011 1,046 13.56 2,271 Granted 165 8.43 83 13.87 Exercised (99 ) 7.52 (306 ) 12.57 Canceled (34 ) 13.40 (5 ) 17.12 Outstanding and exercisable at June 30, 2010 1,052 12.70 1,168 Outstanding and exercisable at June 30, 2012 818 $ 13.94 $ 4,783 Granted 88 17.23 89 20.31 Exercised (91 ) 7.41 (109 ) 13.38 Canceled (3 ) 17.30 (11 ) 16.09 Outstanding and exercisable at June 30, 2011 1,046 $ 13.56 $ 2,271 Outstanding and exercisable at June 30, 2013 787 $ 14.71 $ 7,609 The following table summarizes information for options outstanding and exercisable at June 30, Weighted Average Range of Options Outstanding Remaining Exercise $ 6.81 – 10.75 254 8.0 $ 7.71 12.35 – 12.74 230 6.0 12.51 14.40 – 16.52 352 3.4 15.54 17.23 – 20.27 210 5.3 18.46 $ 6.81 – 20.27 1,046 5.4 $ 13.56 Range of Options Weighted Average Remaining Exercise $ 6.81 - 8.55 129 5.9 $ 7.62 12.35 - 13.90 216 5.1 12.86 14.40 – 17.23 245 3.5 16.02 19.21 – 22.82 197 4.3 19.77 $ 6.81 – 22.82 787 4.6 14.71 9. BENEFIT AND RETIREMENT PLANS Defined Contribution and Retirement Plans The Company sponsors various defined contribution pension and retirement plans, which cover substantially all employees, other than employees covered by multi-employer pension plans under collective bargaining agreements. Total pension and retirement plan expense was The Company contributes to • Assets contributed to the multi-employer plan by • If a participating employer stops contributing to the plan, the unfunded obligations of the plan may be shared by the remaining participating employers. • If a participating employer chooses to stop participating in The Company’s participation in these plans for the annual period ended June 30, 2013, is outlined in the following table. Unless otherwise noted, the most recent Pension Protection Act zone status available in 2013 and 2012 is for the plan’s year-end at December 31, 2012 and 2011, Pension Protection Company Contributions Expiration Date Number of EIN/Pension June 30, Rehabilitation Surcharge Pension Fund 2013 2012 2013 2012 2011 Central States SE and SW Areas Pension Fund 36-6044243 Red Red Implemented $ 243 $ 254 $ 249 Yes 03/28/2015 18 Steelworkers Pension Trust 23-6648508 Green Green No 347 285 283 No 10/31/2015 194 Central Pension Fund 36-6052390 Green Green No 7 7 7 No 05/31/2017 3 $ 597 $ 546 $ 539 The cumulative cost to exit the Company’s multi-employer plans was approximately $8.6 million, $7.8 million and $7.2 million on June 30, Supplemental Retirement Plans The Company has unfunded 10. ACCUMULATED OTHER COMPREHENSIVE INCOME (LOSS) 2011 2010 2009 Net income (loss) $ 10,417 $ 10,801 $ (1,509 ) Other comprehensive income (loss) (OCI): Change in fair value of derivatives, net of income taxes of $0, $(109) and $5, respectively — 177 (1 ) Change in fair value of available-for-sale, Securities, net of income taxes of $(214), $(24), $631, respectively 348 39 (1,022 ) Change in minimum pension liability, net of income taxes of $(532), $124 and $595, respectively 869 (204 ) (969 ) Total other comprehensive income (loss) 1,217 12 (1,992 ) Total comprehensive income (loss) $ 11,634 $ 10,813 $ (3,501 ) The components of accumulated other comprehensive loss, net of income taxes, are as June 30, June 30, 2011 2010 (in thousands) 2013 2012 2011 Available-for-sale securities $ 337 $ (11 ) $ 394 $ 334 $ 337 Pension and other post-retirement benefit adjustments (872 ) (1,741 ) (1,485 ) (1,973 ) (872 ) Total accumulated other comprehensive loss $ (535 ) $ (1,752 ) $ (1,091 ) $ (1,639 ) $ (535 ) 11. LITIGATION Indiana Civil Litigation – A Complaint for Damages and Injunctive Relief and Request for Jury Trial was filed on March 3, 2011 in Elkhart, Indiana Superior Court by Leo VanNorman, et al, plaintiffs vs. Flexsteel Industries, Inc., et al, defendants. The Plaintiffs have not identified a dollar amount of their alleged Other Proceedings– From time to time, the Company is subject to various other legal proceedings, including lawsuits, which arise out of, and are incidental to, the conduct of the Company’s business. The Company does not consider any of such other proceedings that are currently pending, individually or in the aggregate, to be material to its business or likely to result in a material effect on its consolidated operating results, financial condition, or cash flows. 12. COMMITMENTS AND CONTINGENCIES FACILITY LEASES – the Company leases certain facilities and equipment under various operating leases. These leases require the Company to pay the lease cost, operating costs, including property taxes, insurance, and maintenance. Total lease expense related to the various operating leases was approximately Expected future minimum commitments under operating leases as of June 30, (in thousands) Fiscal Year Ended June 30, Fiscal Year Ended June 30, Fiscal Year Ended June 30, 2012 $ 1,851 2013 1,315 2014 751 $ 2,617 2015 165 2,218 2016 — 1,679 2017 794 2018 794 Thereafter — 1,985 $ 4,082 $ 10,087 13. SEGMENT REPORTING The Company operates in one reportable Set forth below is information for the past three fiscal years showing the Company’s net sales attributable to each of the areas of FOR THE YEARS ENDED JUNE 30, (in thousands) FOR THE YEARS ENDED JUNE 30, 2011 2010 2009 2013 2012 2011 Residential $ 258,095 $ 246,041 $ 230,727 $ 311,214 $ 275,442 $ 258,095 Commercial 81,331 80,425 93,431 74,975 76,647 81,331 $ 339,426 $ 326,466 $ 324,158 $ 386,189 $ 352,089 $ 339,426 SUPPLEMENTARY QUARTERLY FINANCIAL INFORMATION– UNAUDITED (in thousands, except per share amounts) FOR THE QUARTER ENDED FOR THE QUARTER ENDED September 30 December 31 March 31 June 30 September 30 December 31 March 31 June 30 Fiscal 2011: Fiscal 2013: Net sales $ 87,230 $ 82,821 $ 85,175 $ 84,200 $ 91,237 $ 94,590 $ 98,351 $ 102,010 Gross margin 19,606 18,825 18,207 20,664 21,101 22,747 22,839 23,781 Net income 2,343 2,131 2,455 3,488 2,872 2,922 3,118 4,240 Earnings per share: Basic $ 0.35 $ 0.32 $ 0.37 $ 0.52 $ 0.41 $ 0.42 $ 0.44 $ 0.60 Diluted $ 0.34 $ 0.31 $ 0.35 $ 0.50 $ 0.40 $ 0.40 $ 0.42 $ 0.57 (in thousands, except per share amounts) FOR THE QUARTER ENDED September 30 December 31 March 31 June 30 FOR THE QUARTER ENDED Fiscal 2010: September 30 December 31 March 31 June 30 Fiscal 2012: Net sales $ 75,941 $ 83,524 $ 81,451 $ 85,550 $ 81,520 $ 85,001 $ 91,631 $ 93,936 Gross margin 16,556 20,041 18,033 20,151 18,964 20,458 22,098 23,759 Net income 1,380 2,964 2,320 4,137 2,378 2,948 3,343 4,399 Earnings per share: Basic $ 0.21 $ 0.45 $ 0.35 $ 0.62 $ 0.35 $ 0.44 $ 0.49 $ 0.64 Diluted $ 0.21 $ 0.45 $ 0.34 $ 0.61 $ 0.34 $ 0.42 $ 0.48 $ 0.61 Item 9. Changes in and Disagreements with Accountants on Accounting and Financial Disclosure None. Item 9A. Controls and Procedures Evaluation of disclosure controls and procedures – Based on their evaluation as of the end of the period covered by this Annual Report on Form 10-K, the Company’s Chief Executive Officer (“CEO”) and Chief Financial Officer (“CFO”) have concluded that the Company’s disclosure controls and procedures (as defined in Rules 13a-15(e) or 15d-15(e)) under the Securities Act of 1934, as amended) were effective as of June 30, Changes in internal control over financial reporting – During the Management’s Annual Report on Internal Control Over Financial Reporting – Management is responsible for establishing and maintaining adequate internal control over financial reporting, as such term is defined in Rules 13a-15(f) or 15d-15(f) of the Securities Exchange Act of 1934, as amended. We performed an evaluation under the supervision and with the participation of our management, including the CEO and CFO, to assess the effectiveness of the design and operation of our disclosure controls and procedures under the Exchange Act as of June 30, Item 9B. Other Information None. PART III Item 10. Directors, Executive Officers and Corporate Governance The information contained in the Company’s The Company has adopted a code of ethics called theGuidelines for Business Conduct that applies to the Company’s employees, including the principal executive officer, principal financial officer, principal accounting officer or controller, and persons performing similar functions. A copy of the code of ethics is posted on our website at www.flexsteel.com. Item 11. Executive Compensation The information contained in the Company’s Item 12. Security Ownership of Certain Beneficial Owners and Management and Related Stockholder Matters The information contained in the Company’s Item 13. Certain Relationships and Related Transactions, and Director Independence Item 14. Principal Accountant Fees and Services 2011 2010 Audit Fees (1) $ 357,500 $ 376,000 Tax Fees (2) 15,000 — $ 372,500 $ 376,000 PART IV Item 15. Exhibits, Financial Statement Schedules, and Reports on Form 8-K (a) (1) Financial Statements The financial statements of the Company are set forth above in Item 8. (2) Schedules Description Balance at Additions Deductions Balance at Allowance for Doubtful Accounts: 2011 $ 2,020,000 $ 870,000 $ (890,000 ) $ 2,000,000 2010 $ 1,760,000 $ 920,000 $ (660,000 ) $ 2,020,000 2009 $ 2,110,000 $ 1,240,000 $ (1,590,000 ) $ 1,760,000 The following financial statement schedules for the years ended June 30, 2013, 2012 and 2011 are submitted herewith: SCHEDULE II VALUATION AND QUALIFYING ACCOUNTS For the Years Ended June 30, 2013, 2012 and 2011 (in thousands) Balance at (Additions) Reductions to Income Additions to (Deductions from) Balance at Accounts Receivable Allowances: 2013 $ 1,910 $ (215 ) $ (135 ) $ 1,560 2012 $ 2,000 $ (150 ) $ 60 $ 1,910 2011 $ 2,020 $ 870 $ (890 ) $ 2,000 Other schedules are omitted because they are not required or are not applicable or because the required information is included in the financial statements. (3) Exhibit No. 3.1 Amended and Restated Articles of Incorporation of the Company 3.2 Amended and Restated Bylaws of the Company 10.1 1995 Stock Option Plan 10.2 1999 Stock Option Plan 10.3 Flexsteel Industries, Inc. Voluntary Deferred Compensation Plan (incorporated by reference to Exhibit No. 10.5 to the Annual Report on Form 10-K for the fiscal year ended June 30, 2001). * 10.4 Flexsteel Industries, Inc. Restoration Retirement Plan (incorporated by reference to Exhibit No. 10.6 to the Annual Report on Form 10-K for the fiscal year ended June 30, 2001). * 10.5 Flexsteel Industries, Inc. Senior Officer Supplemental Retirement Plan (incorporated by reference to Exhibit No. 10.7 to the Annual Report on Form 10-K for the fiscal year ended June 30, 2001). * 10.6 2002 Stock Option Plan (incorporated by reference to Appendix A from the 2002 Flexsteel definitive proxy statement). * 10.7 Agreement and Plan of Merger, dated as of August 12, 2003, by and among Flexsteel, Churchill Acquisition Corp. and DMI (incorporated by reference to Exhibit 99(d)(1) of Flexsteel Industries, Inc.’s Tender Offer Statement on Schedule TO filed with the Securities and Exchange Commission on August 20, 2003). 10.8 Flexsteel Industries, Inc. 2006 Stock Option Plan (incorporated by reference to Appendix C from the 2006 Flexsteel Proxy Statement filed with the Securities and Exchange Commission on October 31, 2006). 10.9 Employment Agreement dated October 1, 2006 between Flexsteel Industries, Inc. and Donald D. Dreher (incorporated by reference to Exhibit 10.1 to Flexsteel’s Form 8-K filed with the Securities and Exchange Commission on October 5, 2006). * 10.10 Amendment to Employment Agreement dated June 27, 2008 between Flexsteel Industries, Inc. and Donald D. Dreher (incorporated by reference to Exhibit 10.3 to Flexsteel’s Form 8-K filed with the Securities and Exchange Commission on June 27, 2008).* 10.11 Flexsteel Industries, Inc. 2007 Long-Term Management Compensation Plan (incorporated by reference to Appendix C to the Definitive Proxy Statement on Schedule 14A filed with the Commission on November 1, 2007). * 10.12 2009 Stock Option Plan (incorporated by reference to Appendix A from the 2009 Flexsteel definitive proxy statement). * 10.13 Credit Agreement dated 10.14 Revolving Line of Credit Note dated April 14, 2010 between Flexsteel Industries, Inc. and Wells Fargo Bank, N.A. (incorporated by reference to Form 8-K filed with the Securities and Exchange Commission on April 19, 2010). 10.15 First Amendment dated June 7, 2011 to Credit Agreement dated April 14, 2010 between Flexsteel Industries, Inc. and Wells Fargo Bank, N.A. (incorporated by reference to Form 8-K filed with the Securities and Exchange Commission on June 9, 2011). Revolving Line of Credit Note dated June 7, 2011 between Flexsteel Industries, Inc. and Wells Fargo Bank, 10.17 Second Amendment dated May 11, 2012 to Credit Agreement dated April 14, 2010 between Flexsteel Industries, Inc. and Wells Fargo Bank, N.A. (incorporated by reference to Form 10-Q for the period ended March 31, 2013 filed with the Securities and Exchange Commission on April 18, 2013). 10.18 Revolving Line of Credit Note dated May 11, 2012 between Flexsteel Industries, Inc. and Wells Fargo Bank, N.A. (incorporated by reference to Form 10-Q for the period ended March 31, 2013 filed with the Securities and Exchange Commission on April 18, 2013). 10.19 Third Amendment dated June 28, 2013 to Credit Agreement dated April 14, 2010 between Flexsteel Industries, Inc. and Wells Fargo Bank, N.A. (incorporated by reference to Form 8-K filed with the Securities and Exchange Commission on July 5, 2013). 10.20 Revolving Line of Credit Note dated June 28, 2013 between Flexsteel Industries, Inc. and Wells Fargo Bank, N.A. (incorporated by reference to Form 8-K filed with the Securities and Exchange Commission on July 5, 2013). 10.21 One-Year Incentive Compensation Award for Karel K. Czanderna, dated July 1, 2012 (incorporated by reference to Exhibit 4.1 of Flexsteel’s Form S-8 filed with the Securities and Exchange Commission on August 20, 2012.)* 10.22 Restricted Stock Unit Award Agreement for Karel K. Czanderna, dated July 1, 2012 (incorporated by reference to Exhibit 4.1 of Flexsteel’s Form S-8 filed with the Securities and Exchange Commission on August 20, 2012.)* 21.1 Subsidiaries of the Company. Filed herewith. 23 Consent of Independent Registered Public Accounting Firm. Filed herewith. 31.1 Certification. Filed herewith. 31.2 Certification. Filed herewith. 32 Certification by Chief Executive Officer and Chief Financial Officer Pursuant to 18 U.S.C. Section 1350 as Adopted Pursuant to Section 906 of the Sarbanes-Oxley Act of 2002. Filed herewith. 101.INS XBRL Instance Document. 101.SCH XBRL Taxonomy Extension Schema Document. 101.CAL XBRL Taxonomy Extension Calculation Linkbase Document. 101.LAB XBRL Taxonomy Extension Labels Linkbase Document. 101.DEF XBRL Taxonomy Extension Definition Linkbase Document. 101.PRE XBRL Taxonomy Extension Presentation Linkbase Document. *Management contracts, compensatory plans and arrangements required to be filed as an exhibit to this report. SIGNATURES Pursuant to the requirements of Section 13 or 15(d) of the Securities Exchange Act of 1934, the registrant has duly caused this report to be signed on its behalf by the undersigned, thereunto duly authorized. Date: August FLEXSTEEL INDUSTRIES, INC. By: /S/ Chief Executive Officer and Principal Executive Officer By: /S/ Timothy E. Hall Timothy E. Hall Chief Financial Officer and Principal Financial and Accounting Officer Pursuant to the requirements of the Securities Exchange Act of 1934, this report has been signed below by the following persons on behalf of the registrant and in the capacities and on the dates indicated. Date: August /S/ Chairman of the Board of Directors Date: August /S/ Karel K. Czanderna �� Karel K. Czanderna Director Date: August 23, 2013 /S/ Jeffrey T. Bertsch Jeffrey T. Bertsch Director Date: August 23, 2013 /S/ Mary C. Bottie Mary C. Bottie Director Date: August 23, 2013 /S/ Patrick M. Crahan Patrick M. Crahan Director Date: August 23, 2013 /S/ Robert E. Deignan Robert E. Deignan Director Date: August 23, 2013 /S/ Thomas M. Levine Thomas M. Levine Director Date: August 23, 2013 /S/ Ronald J. Klosterman Ronald J. Klosterman Director Date: August /S/ Robert J. Maricich Robert J. Maricich Director Date: August /S/ Eric S. Rangen Eric S. Rangen Director Date: August /S/ James R. Richardson James R. Richardson Director Date: August /S/ Nancy E. Uridil Nancy E. Uridil Director 33o Accelerated filero Non-accelerated fileroSmaller reporting companyx20102012 (which was the last business day of the registrant’s most recently completed second quarter) was $74,061,443.$96,762,452.6,715,6127,107,723 Common Shares ($1 par value) as of August 15, 2011.9, 2013.
In Part III, portions of the registrant’s 20112013 Proxy Statement to be filed with the Securities and Exchange Commission within 120 days of the Registrant’s fiscal year end.
Flexsteel Industries, Inc. and Subsidiaries (the “Company”) was incorporated in 1929 and is one of the oldest and largest manufacturers, importersmanufacturer, importer and marketersmarketer of residential and commercial upholstered and woodenwood furniture products in the United States. Product offerings include a wide variety of upholstered and wood furniture such as sofas, loveseats, chairs, reclining and rocker-reclining chairs, swivel rockers, sofa beds, convertible bedding units, occasional tables, desks, dining tables and chairs and bedroom furniture. The Company’s products are intended for use in home, office, hotel, healthcare and other commercial applications. Featured as a basicA featured component in most of the upholstered furniture is a unique steel drop-in seat spring from which our name “Flexsteel” is derived. The Company distributes its products throughout the United States through the Company’s sales force and various independent representatives. The Company’s products are also sold to several national and regional chains, some of which sell on a private label basis. No single customer accounted for more than 10% of net sales.furniture with warehouses in Indiana and manufacturing sources in Asia;furniture. DMI’s divisionsbrands are WYNWOOD, HomestylesHome Styles and DMI Commercial Office Furniture. operating segment, furniture products. Our furniture products business involves the distribution of manufactured and imported products consisting of a broad line of upholstered and wooden furniture for residential and commercial markets. Set forth below is information for the past three fiscal years showing the Company’s net sales attributable to each of the areas of application (in thousands):application: We operate manufacturing facilities that are located in Arkansas, California, Georgia, Iowa, Mississippi and Juarez, Mexico. These manufacturing operations are integral to our product offerings and distribution strategy by offering smaller and more frequent product runs of a wider product selection. We identify and eliminate manufacturing inefficiencies and adjust manufacturing schedules on a daily basis to meet customer requirements. We have established relationships with key suppliers to ensure prompt delivery of quality component parts. Our production includes the use of selected offshore component parts to enhance our product quality and value in the marketplace.
The furniture industry is highly competitive and includes a large number of U.S. and foreign manufacturers and distributors, none of which dominates the market. Our competition includes foreign manufacturers, in countries such as China, and customers who obtain products directly from foreign manufacturers. The markets in which we compete include a large number of relatively small manufacturers; however, certain competitors have substantially greater sales volumes than we have. Our products compete based on style, quality, price, delivery, service and durability. We believe that our manufacturing and sourcing capabilities, facility locations, commitment to customers, product quality, delivery, service and value and experienced production, sales, marketing and management teams, aided by offshore sourced components and finished product, are our competitive advantages.
The Company’s business is not considered seasonal.
The Company makes minimal export sales. At June 30, 2011,2013, the Company had approximately 90 employees located in Asia to inspect and coordinate the delivery of purchased products.
The approximate backlog of customer orders believed to be firm as of the end of the current fiscal year and the prior two fiscal years were as follows (in thousands):
The Company utilizes various types of wood, fabrics, leathers, upholsteredfabric, leather, filling material, high carbon spring steel, bar and wire stock, polyurethane and other raw materials in manufacturing furniture. While the Company purchases these materials from numerous outside suppliers, both U.S. and foreign, it is not dependent upon any single source of supply. The costs of certain raw materials fluctuate, but all continue to be readily available.
For a discussion of the Company’s working capital practices, see “Liquidity and Capital Resources” in Item 7 of this Annual Report on Form 10-K.
The Company has exposure to actions by governments, including tariffs, see “Risk Factors” in Item 1A of this Annual Report on Form 10-K.
The Company is subject to various local, state, and federal laws, regulations and agencies that affect businesses generally, see “Risk Factors” in Item 1A of this Annual Report on Form 10-K.
The Company is subject to environmental laws and regulations with respect to product content and industrial waste, see “Risk Factors” in Item 1A and “Legal Proceedings” in Item 3 of this Annual Report on Form 10-K.
The Company owns the American and Canadian improvement patents to its Flexsteel seat spring, as well as patents on convertible beds. The Company has patents and owns certain trademarks in connection with its furniture products, which are due to expire on dates ranging from 20112013 to 2025.2026. The Company does not consider its trademarks and patents material to its business.independentthird-party designers. New models and designs of furniture, as well as new fabrics, are introduced continuously. In the last three fiscal years, these design activities involved the following expenditures (in thousands):
The Company had 1,3001,360 employees as of June 30, 20112013, including 250285 employees that are covered by collective bargaining agreements. Management believes it has good relations with employees.
Our website is located atwww.flexsteel.com. www.flexsteel.com. Information on the website does not constitute part of this Annual Report on Form 10-K.such as the California Transparency in Supply Chains Act of 2010, Patient Protection and Affordable Care Act of 2010, the Pension Protection Act of 2006, the Lacey Act, as amended in 2008 to cover plants and trees, the Consumer Product Safety Improvement Act of 2008, the Security and Accountability for Every (SAFE) Port Act of 2006 and the Maritime Transportation Security Act of 2002 as well as many others. Partially in response to the financial markets crises and the global economic recession, regulatory initiatives have accelerated. These initiativeswhich could have a significant impact on our operations and the cost to comply with such laws and regulations could adversely impact our financial position, results of operations and cash flows. In addition, failure to comply with such laws and regulations, even inadvertently, could produce negative consequences which could adversely impact our operations.1,3001,360 people, 250285 of whom are covered by collective bargaining agreements. Terms of collective bargaining agreements that prevent us from competing effectively could adversely affect our financial condition, results of operations and cash flows. We are committed to working with those groups to avert or resolve conflicts as they arise. However, there can be no assurance that these efforts will be successful.200215 of our union employees. Multi-employer pension plans are managed by trustee boards comprised of participating employer and labor union representatives, and the employers participating in a multi-employer pension plan are jointly responsible for maintaining the plan’s funding requirements. Based on the most recent information available to us, we believe that the present value of actuarially accrued liabilities in the multi-employer pension plans substantially exceeds the value of the assets held in trust to pay benefits. As a result of our participation, we could experience greater volatility in our overall pension funding obligations. Our obligations may be impacted by the funded status of the plans, the plans’ investment performance, changes in the participant demographics, financial stability of contributing employers and changes in actuarial assumptions.environment and weenvironment. We could incur substantial costs, including legal expenses, as a result of the noncompliance with, or liability for cleanup or other costs or damages under, environmental laws. See Note 11, “Litigation” within the Notes to Consolidated Financial Statements for a description of an existing environmental claim against the Company. Additionally, the Company is involved in various other kinds of commercial disputes. Given the inherent uncertainty of litigation, these various legal proceedings and compliance matters could have a material impact on our business, operating results or financial condition. None.2011:2013:Approximate
Size (square feet)Dubuque, IowaHarrison, Arkansas719,000 Distribution and Corporate OfficesLancaster, Pennsylvania216,000Distribution236,000305,00069,000DistributionManufacturingHarrison, Arkansas221,000ManufacturingStarkville, Mississippi349,000691,000719,0002011:2013:Approximate
Size (square feet)Louisville, KentuckyCerritos, California15,000Administrative OfficesDistribution48,000225,000Company has been named as one of several defendants in an Indiana civil lawsuit related to groundwater contamination. The lawsuitcomplaint alleges that the source of groundwater contamination sourceunderneath plaintiffs’ current or former residences is a propertytwo adjacent properties, in Elkhart, Indiana, once owned by the Company. The VanNorman case is set for a Phase 1 trial in May 2014 on the issue of cause or contribution to the Elkhart contamination. A subsequent Complaint for Damages under RICO and RPTL, and Injunctive Relief under RCRA, titled Dennis and Darlene Knoll, et al, vs. Flexsteel Industries, Inc., et al, was filed on May 5, 2012 in United States District Court Northern District of Indiana South Bend Division by a subgroup of the state court plaintiffs, as well as the current owner of one of the properties once owned by the Company. The District Court dismissed one of the two RCRA claims in March 2013, and dismissed both RICO claims in June 2013. One RCRA claim and a RPTL claim remain pending in the Knoll case. Relief sought in these complaints includes payment to Plaintiffs for their damages and attorneys’ fees and costs, payment to remove the contamination, payment for medical monitoring, and punitive damages. Based on policy language and jurisdiction, insurance coverage is in question. Flexsteel has filed an appeal to the Iowa Supreme Court regarding two adverse opinions of an Iowa District Court regarding coverage issues. The Company does not believe that it caused or contributed to the contamination. This lawsuit is in its preliminary stages.damages and the status of insurance coverage has not been determined. Wedamages. Therefore, we are unable to estimate a range of reasonably possible outcomes or losses at this time. Accordingly, no accrual related to this matter has been recorded in the June 30, 20112013 financial statements. LegalDuring the fiscal years ended June 30, 2013, 2012 and 2011, legal and other related expenses of $2.3 million, $2.4 million and $0.5 million, respectively, have been incurred responding to this lawsuitthe state and federal lawsuits, as well as in pursuing insurance coverage. These costs are included in Selling, General and Administrative expense in the fiscal year 2011 Consolidated StatementStatements of Operations.Income.Proceedings.Proceedings – From time to time, the Company is subject to various other legal proceedings, including lawsuits, which arise out of, and are incidental to, the conduct of the Company’s business. The Company does not consider any of such other proceedings that are currently pending, individually or in the aggregate, to be material to its business or likely to result in a material effect on its consolidated operating results, financial condition, or cash flows.ReservedMine Safety Disclosures
None.is based upon the SIC Code #251 Household Furniture Index as a peer group. It shows changes over the past five-year period in the value of $100 invested in: (1) Flexsteel’s common stock; (2) The NASDAQ Global Market; and (3) an industry peer group of the following: American Woodmark Corp, Bassett Furniture Ind., Dixie Group Inc., Ethan Allen Interiors Inc., Hooker Furniture Corp., iRobot Corp., Johnson Outdoors Inc., Kid Brands Inc., Kimball International, Knoll Inc., La-Z-Boy Inc., Lifetime Brands Inc., Patrick Industries Inc., and Select Comfort Corp. During the fiscal year ended June 30, 2013, the Company completed a compensation study utilizing the peer group above. The Company chose to utilize the new peer group for the share investment performance graph. The former peer group was comprised of the following: Bassett Furniture Ind., Chromcraft Revington Inc., Ethan Allen Interiors, Furniture Brands Intl., Hooker Furniture Corp., Kimball International, La-Z-Boy Inc., Natuzzi S.P.A., and Stanley Furniture Inc.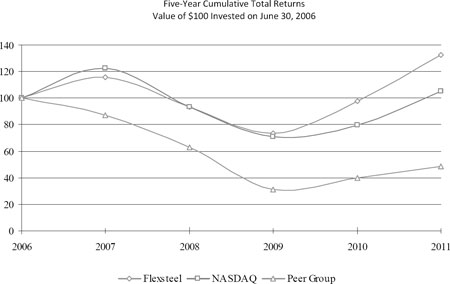
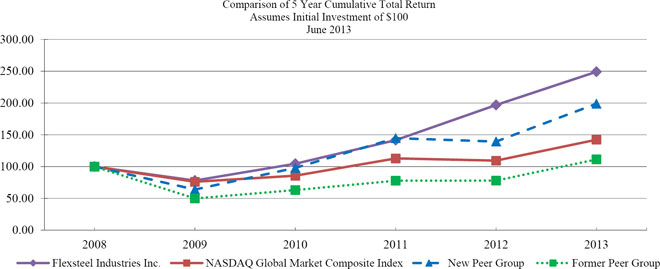
Per Share
Per ShareMarket.Market through January 2, 2013 and on The NASDAQ Global Select Market thereafter.1,6003,000 holders of common stock of the Company as of June 30, 2011.2011.statementstatements of operationsincome data of the Company is derived from the Company’s consolidated financial statements.(2)(3) per share.(3)Fiscal 2007 net income and per share amounts reflect the net gain (after tax) on sale of building of approximately $2.5 million or $0.37 per share, the gain on life insurance of $0.6 million or $0.08 per share and the net gain (after tax) on the sale of vacant land of approximately $0.2 million or $0.04 per share.collectibilitycollectability of trade accounts receivable and inventory valuation. Ultimate results may differ from these estimates under different assumptions or conditions.collection and allowanceswrite-off amounts. The allowance for doubtful accounts is intended to reduce trade accounts receivable to the amount that reasonably approximates their net realizable value. The amount ultimately realized from trade accounts receivable may differ from the amount estimated in the consolidated financial statements based on collection experience.market. A portionnet realizable value. The Company’s inventory valuation reflects markdowns for the excess of our finished goods inventory is madethe cost over the amount expected to orderbe realized and manyconsiders obsolete and excess inventory. Markdowns establish a new cost basis for the Company’s inventory. Subsequent changes in facts or circumstances do not result in the reversal of our raw material parts are interchangeable between products. Management assesses the inventory on hand and if necessary writes down the obsoletepreviously recorded markdowns or excess inventory to market.an increase in that newly established cost basis.upon delivery ofwhen both product to our customerownership and when collectibility is reasonably assured. Delivery of product to our customer is evidenced through the shipping terms indicating when title and risk of loss have transferred to the customer, collectability is transferred. Ourreasonably assured, and the Company has no remaining obligations. The Company’s ordering process creates persuasive evidence of the sale arrangement and the sales amountprice is determined. The delivery of the goods to ourthe customer completes the earnings process. Net sales consist of product sales and related delivery charge revenue, net of adjustments for returns and allowances. Shipping and handling costs are included in cost of goods sold.2011, 20102013, 2012 and 2009.2011. Amounts presented are percentages of the Company’s net sales.20112013 Compared to Fiscal 2010201220112013 were $339.4$386.2 million compared to $326.5$352.1 million in the prior fiscal year, an increase of 4%10%. For the fiscal year ended June 30, 2011,2013, residential net sales were $258.1$311.2 million compared to $246.0$275.4 million for the year ended June 30, 2010,2012, an increase of 4.9%13.0%. The residential net sales increase of $35.8 million was primarily due to growth from existing customers and products, and expansion of product portfolio and customer base. Commercial net sales were $81.3$75.0 million for the year ended June 30, 2013, a decrease of 2.2% from net sales of $76.7 million for the year ended June 30, 2012.1.1% from6.7%. Commercial net sales of $80.5were $76.7 million for the year ended June 30, 2010. Gross margin2012, a decrease of 5.8% from net sales of $81.3 million for the yearsyear ended June 30, 2011 and 2010 was 22.8%. The gross2011.2011, includes2012 was 24.2% compared to 22.8% for the prior year primarily due to better absorption of fixed costs on the higher sales volume and lower freight costs. The prior year included a $0.6 million inventory write-down related to a facility closing offset by operational improvements.closing.For the fiscal years ended June 30, 2011 and 2010, selling,Selling, general and administrative expenses for the fiscal year ended June 30, 2012 were 17.8% and 17.5%$65.0 million or 18.4% of net sales respectively. The percentage increase forcompared to $60.4 million or 17.8% of net sales in the year ended June 30, 2011 reflects higher2011. The current year includes an increase in legal and professional fees.fees of $2.1 million, or 0.6% of sales, primarily related to an Indiana civil lawsuit and a $1.0 million decrease in bad debt expense, compared to the prior year.decreasedincreased by $1.7$4.4 million in fiscal year 20112012 in comparison to the prior year. During fiscal year 2011, the Company recorded pre-tax charges of $1.6 million related to closing a manufacturing facility. Of these pre-tax charges, employee separation and other closing costs of $1.0 million are reported as facility closing costs and an inventory write-down of $0.6 million is reported as cost of goods sold.20112012 was 35.7%36.8% compared to 38.1%35.7% for fiscal year 2010.2011. The change in effective tax rate is primarily due to the benefit of the DMD, which provides a tax benefit on U.S. based manufacturing, the change in provision for uncertain tax positions related to various state taxing jurisdictions and stock-based compensation and the benefit of the Domestic Manufacturing Deduction under Internal Revenue Code Section 199 (DMD), which provides a tax benefit on U.S. based manufacturing. The DMD tax benefit available in previous years was being phased in by statute and was therefore lower than the full DMD tax benefit for 2011.compensation.20112012 of $13.1 million or $1.86 per share compared to $10.4 million or $1.50 per share compared to $10.8 million or $1.61 per share in fiscal 2010.Fiscal 2010 Compared to Fiscal 2009 Net sales for fiscal 2010 were $326.5 million compared to $324.2 million in the prior fiscal year, an increase of 1%. Residential net sales were $246.0 million compared to $230.7 million in fiscal 2009, an increase of 7%. Commercial net sales were $80.5 million for fiscal 2010, a decrease of 14% from net sales of $93.5 million for fiscal 2009. The Company’s operating income improved by $19.8 million in fiscal year 2010 in comparison to the prior year. The Company benefited from strategies implemented and actions taken during fiscal year 2009 including consolidation of manufacturing operations and workforce reductions that brought production capacity and fixed overhead more in line with current product demand. During the prior fiscal year, the Company recorded pre-tax charges of approximately $2.6 million related to facility consolidation and employee separation costs. Company-wide employment was reduced approximately 30% through plant closures and workforce reductions and remains at these reduced levels. These factors contributed significantly to gross margin improvements and selling, general and administrative expense reductions. Gross margin for fiscal year 2010 was 22.8% compared to 18.8% for the prior year period. The gross margin improvements for the year were greatly impacted by the operational changes discussed above. In addition, gross margin improved due to stability in material and product costs and lower ocean freight costs. For the fiscal years ended 2010 and 2009, selling, general and administrative expenses were 17.5% and 18.8% of net sales, respectively. These percentage improvements are due to the operational changes discussed above, as well as, lower bad debt and advertising costs. Interest expense decreased $0.6 million to $0.4 million for fiscal year 2010 due to lower borrowings. The effective tax rate for the fiscal year ended June 30, 2010 was 38.1%. The effective income tax benefit rate was 41.5% for fiscal year 2009 due to losses or low level of earnings in various tax jurisdictions. The above factors resulted in net income for the fiscal year ended June 30, 2010 of $10.8 million or $1.61 per share compared to a net loss of $1.5 million or $0.23 per share in fiscal 2009. All earnings per share amounts are on a diluted basis.20112013 was $100.7$113.7 million as compared to $90.8$103.7 million at June 30, 2010.2012. Significant changes in working capital from June 30, 20102012 to June 30, 20112013 included increasedincreases in inventories of $9.7 million, other current assets of $4.4 million and accounts receivable of $2.5 million. The increases were offset by a decrease in cash of $9.6$3.0 million, increased other current liabilities of $2.7 million and increased accounts payable of $1.0 million. The higher inventory levels support increased residential sales volume and expanded product offerings.accrualsby $3.0 million during fiscal year 2013 with net cash provided by operating activities of $2.4$5.9 million offset by decreased accounts receivablecapital expenditures of $4.3$6.2 million and payment of dividends of $4.2 million. The decreaseCompany completed construction and moved into its Corporate Headquarters in receivables is dueDubuque, Iowa during fiscal year 2013. The total cost of construction and equipping the Corporate Headquarters building was approximately $11.8 million, with $2.7 million paid during fiscal year 2013. Dividends to timing of collections and lower shipment volume in the fourthCompany’s shareholders during fiscal quarter.year 2013 increased 33% to $0.60 per share ($4.2 million) from $0.45 per share ($2.5 million) for fiscal year 2012.was $13.8of $9.0 million for thein fiscal year ended June 30, 2011 reflecting2012 was comprised primarily of net income of $10.4$13.1 million, changes in operating assets and liabilities of $1.3$7.8 million and non-cash charges of $4.7$3.7 million. The change in net cash provided by operating activities of $19.1 million in fiscal year 2010 was comprised primarily of net income of $10.8 million, changes in operating assets and liabilities of $4.4 million and non-cash charges of $3.9 million. Depreciation expense was $2.7 million and $3.0 million for the years ended June 30, 2011 and 2010, respectively.$2.7$6.0 million and $11.3 million in fiscal years 2013 and 2012, respectively. Net sales of investments were $0.2 million for fiscal year 2013 versus net purchases of investments of $0.4 million in fiscal year 2011 compared to cash used by investing activities of $1.6 million in fiscal year 2010. Net purchases of investments were $0.3 million.2012. Capital expenditures were $2.6$6.2 million and $10.9 million during fiscal years 2013 and 2012, respectively.2011.2013, four executive officers retired from the Company. Two were directors and will continue to serve in that capacity. As a result of the retirements, during fiscal year 2014 the Company will make distributions of approximately $3.0 million from its supplemental retirement plans. The distributions will be made out of the Rabbi Trust assets, not out of the Company’s operating cash. The Company has increased its current assets and liabilities and decreased its long-term assets and liabilities to reflect these anticipated distributions.$1.5$2.9 million and $1.6 million in fiscal year 2011,years 2013 and 2012, respectively, primarily for the payment of dividends of $1.8$4.2 million, compared to $11.0$2.5 million in fiscal year 2010. For fiscal year 2010, the cash was used primarily to reduce borrowings by $10.0 million and pay dividends of $1.3 million.2012.$15.0$4.5 million in fiscal year 2012. The Company plans to invest approximately $12 million to construct, furnish and equip a corporate office building in Dubuque, Iowa, and the balance of the expenditures onprimarily for delivery and manufacturing equipment.equipment and information technology infrastructure. The Company estimates that depreciation expense will be approximately $4.5 million for fiscal year 2014. Management believes that the Company has adequate cash, cash flows from operations and credit arrangements to meet its operating and capital requirements for fiscal year 2012, including the construction of a corporate office.2014. In the opinion of management, the Company’s liquidity and credit resources provide it with the ability to react to opportunities as they arise, to pay quarterly dividends to its shareholders, and to purchase productive capital assets that enhance safety and improve operations.2011,2013, the Company has no long-term debt obligations and therefore, no contractual interest payments are included in the table below. The following table summarizes the Company’s contractual obligations at June 30, 20112013 and the effect these obligations are expected to have on the Company’s liquidity and cash flow in the future (in thousands):
1 Year
Years
Years
5 Years
Years
Years
5 YearsContractualThe long-term portion of the contractual obligations associated with the Company’s deferred compensationsupplemental retirement plans were excluded fromare included in the table above under more than five years as the Company cannot predict when the events that trigger payment will occur. Total accumulated deferred compensation liabilities were $5.3 million at June 30, 2011. At June 30, 20112013, the Company had no capital lease obligations, and no purchase obligations for raw materials or finished goods. The purchase price on all open purchase orders was fixed and denominated in U.S. dollars. Additionally, the Company has excluded the uncertain tax contingency reservepositions from the above table, as the timing of payments, if any, cannot be reasonably estimated.We had modest gains in sales for the current year over the prior year partially due to a strong backlog entering the year. We enter fiscal year 2012 with lower backlogs and anticipateThe Company believes that first quarter fiscal year 2012 sales will be lower than first quarter fiscal year 2011. Macroeconomic conditions, such as, high unemployment, minimal job growth, a weak housing market and low levels of consumer confidence continue to adversely impact our business. The macroeconomic environment tempers expectations ofmoderate top line growth will continue through the first partend of fiscalcalendar year 2012.2013. Residential growth is expected to continue with existing customers and products, and through expanding our product portfolio and customer base. The Company expects this growth to be led by increased demand for upholstered products. The Company expects demand for its commercial office industryproducts to remain at current levels into the second half of the calendar year. The Company is reporting improving order trends. While we have benefited minimally from those improvementsconfident in its ability to date, we believe we will see increased sales volume during fiscal year 2012. We anticipate increased orders for hospitality products during fiscal year 2012 resulting from pent up demand caused by delays in typical refurbishing cycles for hotel properties.take advantage of market opportunities.We remainThe Company remains committed to ourits core strategies, which include a wide range of quality product offerings and price points to the residential and commercial markets, combined with a conservative approach to business. We will maintain our focus on a strong balance sheet through emphasis on cash flow and improvingincreasing profitability. We believe these core strategies are in the best interest of our shareholders.2011, 20102013, 2012 and 2009,2011, the Company did not have sales, purchases, or other expenses denominated in foreign currencies. As such, the Company is not directly exposed to market risk associated with currency exchange rates and prices.2011,2013, the Company does not have any debt outstanding.StockholdersShareholders of Flexsteel Industries, Inc.20112013 and 2010,2012, and the related consolidated statements of operations,income, comprehensive income, changes in shareholders’ equity, and cash flows for each of the three years in the period ended June 30, 2011.2013. Our audits also included the financial statement schedule listed in the Index at Item 15. These financial statements and financial statement schedule are the responsibility of the Company’s management. Our responsibility is to express an opinion on the financial statements and financial statement schedule based on our audits.The Company is not required to have, nor were we engaged to perform, an audit of its internal control over financial reporting. Our audits included consideration of internal control over financial reporting as a basis for designing audit procedures that are appropriate in the circumstances, but not for the purpose of expressing an opinion on the effectiveness of the Company’s internal control over financial reporting. Accordingly, we express no such opinion. An audit also includes examining, on a test basis, evidence supporting the amounts and disclosures in the financial statements,statements. An audit also includes assessing the accounting principles used and significant estimates made by management, as well as evaluating the overall financial statement presentation. We believe that our audits provide a reasonable basis for our opinion.20112013 and 2010,2012, and the results of their operations and their cash flows for each of the three years in the period ended June 30, 2011,2013, in conformity with accounting principles generally accepted in the United States of America. Also, in our opinion, such financial statement schedule, when considered in relation to the basic consolidated financial statements taken as a whole, presentspresent fairly, in all material respects, the information set forth therein.
Consolidated Statements of Income
(Amounts in thousands, except per share data)
(Amounts in thousands)FLEXSTEEL INDUSTRIES, INC. AND SUBSIDIARIES of Operations(Amounts in thousands, except per share data)
Consolidated Statements of Changes in Shareholders’ Equity
(Amounts in thousands)
Value of
Common
Shares ($1 Par)
Paid-In
Capital
Earnings
Other
Comprehensive
(Loss) IncomeFLEXSTEEL INDUSTRIES, INC. AND SUBSIDIARIES(Amounts in thousands)
Value of
Common
Shares ($1 Par)
Paid-In
Capital
Earnings
Other
Comprehensive
(Loss) IncomeFLEXSTEEL INDUSTRIES, INC. AND SUBSIDIARIES(Amounts in thousands)See accompanying Notes to Consolidated Financial Statements.FLEXSTEEL INDUSTRIES, INC. AND SUBSIDIARIES
Notes to Consolidated Financial Statementsmanufacturers, importersmanufacturer, importer and marketersmarketer of residential and commercial upholstered and wooden furniture products in the United States. The Company’s furniture products include a broad line of quality upholstered and wooden furniture for residential and commercial use. Product offerings include a wide variety of upholstered and wood furniture such as sofas, loveseats, chairs, reclining and rocker-reclining chairs, swivel rockers, sofa beds, convertible bedding units, occasional tables, desks, dining tables and chairs, bedroom furniture and home and commercial office furniture. The Company has one active wholly-owned subsidiary: DMI Furniture, Inc. (“DMI”), which is a Louisville, Kentucky-based, importer and marketer of residential and commercial office furniture with warehouses in Indiana and manufacturing sources in Asia;furniture. DMI’s divisionsbrands are WYNWOOD, HomestylesHome Styles and DMI Commercial Office Furniture.requiresrequire that each asset and liability carried at fair value be classified into one of the following categories: Level 1: Quoted market prices in active markets for identical assets and liabilities; Level 2: Observable market based inputs or unobservable inputs that are corroborated by market data; or Level 3: Unobservable inputs that are not corroborated by market data. The Company has not changed its valuation techniques in measuring the fair value of any financial assets and liabilities during the period.ALLOWANCE FOR DOUBTFUL ACCOUNTS RECEIVABLE ALLOWANCES – the Company establishes an allowance for doubtful accounts through review of open accounts, and historical collection andreceivable allowances amounts. The allowance for doubtful accounts is intended to reduce trade accounts receivable to thean amount that reasonably approximates their net realizable value. The Company’s accounts receivable allowances consist of an allowance for doubtful accounts which is established through review of open accounts, historical collection, and historical write-off amounts and an allowance for estimated returns on sales of the Company’s products which is based on historical product returns, as well as existing product return authorizations. The Company records a provision against revenue for estimated returns on sales of our products in the same period that the related revenues are recognized. The amount ultimately realized from trade accounts receivable may differ from the amount estimated in the consolidated financial statements based on collection experience.statements.market.net realizable value. Steel products are valued on the last-in, first-out (“LIFO”) method. OtherAll other inventories are valued on the first-in, first-out (“FIFO”) method.upon deliverywhen both product ownership and the risk of productloss have transferred to the Company’s customer, and collectibilitycollectability is reasonably assured.assured, and the Company has no remaining obligations. The Company’s ordering process creates persuasive evidence of the sale arrangement and the sales amountprice is determined. The delivery of the goods to the customer completes the earnings process. Net sales consist of product sales and related delivery charge revenue, net of adjustments for returns and allowances. Shipping and handling costs are included in cost of goods sold.$4.5$5.6 million, $4.1$4.9 million and $4.5 million in fiscal 2011, 20102013, 2012 and 2009,2011, respectively.$2.2$2.5 million, $2.0$2.3 million and $2.7$2.2 million in fiscal 2011, 20102013, 2012 and 2009,2011, respectively.$350,000$400,000 per claim and purchases excess coverage up to the statutory limits for amounts in excess of the retention limit. Losses are accrued based upon the Company’s estimates of the aggregate liability for claims incurred using certain actuarial assumptions followed in the insurance industry and based on Company experience. The Company records these insurance accruals within the accrued liabilities – insurance account on the consolidated balance sheets.(LOSS) PER SHARE (EPS) – basic earnings (loss) per share of common stock is based on the weighted-average number of common shares outstanding during each fiscal year. Diluted earnings per share of common stock includes the dilutive effect of potential common shares outstanding. The Company’s potential common shares outstanding are stock options and shares associated with the long-term management incentive compensation plan, which resulted in a dilutive effect of 236,082 shares and 89,403 shares in fiscal 2011 and 2010, respectively.plan. The Company calculates the dilutive effect of outstanding options using the treasury stock method. Anti-dilutive shares are not included in the computation of diluted EPS when their exercise price was greater than the average closing market price of the common shares. The Company calculates the dilutive effect of shares related to the long-term management incentive compensation plan based on the number of shares, if any, that would be issuable if the end of the fiscal year were the end of the contingency period. The dilutive effect42,539 shares of stock options is excluded in fiscal 2009 because the net loss caused the effect of the options to be anti-dilutive. Options to purchase 424,150 shares, 716,939 shares and 759,689 shares of common stock were outstanding in fiscal 2011, 2010 and 2009, respectively, but were not included in the computation of diluted earnings per share as their exercise prices were greater than the average market price of the common shares.outstanding:June 2011,February 2013, the FASBFinancial Accounting Standards Board issued guidanceAccounting Standards Update (“ASU”) 2013-02, which requires additional disclosures on presentationthe effect of significant reclassifications out of accumulated other comprehensive income. The new guidance eliminates the current option to reportASU requires a company that reports other comprehensive income and its componentsto present (either on the face of the statement where net income is presented or in the statement of changes in equity. Instead, an entity will be required to present either a continuous statementnotes) the effects on the line items of net income andof significant amounts reclassified out of accumulated other comprehensive income. For other amounts that are not required to be reclassified in their entirety to net income or in two separate but consecutive statements.the same reporting period, an entity is required to cross-reference to other required disclosures that provide additional details about those amounts. This guidanceASU is effective for fiscal years and interim periods within those years, beginning after December 15, 2011. Early2012, and will be adopted by the Company on July 1, 2013. As it only requires additional disclosure, the adoption of this ASU will not impact the new guidance is permitted and full retrospective application is required. We will be required to adopt this guidance beginning with our first quarter of fiscal 2013.Company’s consolidated financial statements.$1.9 million and $1.7 million higher at June 30, 20112013 and 2010,2012, respectively, if they had been valued on a FIFO basis. At June 30, 20112013 and 20102012 the total value of LIFO inventory was $1.5$2.6 million and $2.3$2.9 million, respectively. There was no material liquidation of LIFO inventory in 2011 and 2010.2013, 2012, or 2011. A comparison of inventories is as follows (in thousands):follows:
Life (Years)$15.0$10.0 million with interest of LIBOR plus 1%, including $5.0up to $4.0 million of letters of credit. Letters of credit availability. No amounts were outstanding at June 30, 2011 and 20102013 totaled $2.3 million, leaving borrowing availability of $7.7 million. The Company did not utilize any borrowing availability under the working capital facility.credit facility during the period other than the aforementioned letters of credit. The credit agreement contains financial covenants. The primary covenant is an interest coverage ratio of 3.0 to 1.0. The ratio is computed as net (loss) income plus interest expense and stock-based compensation expense less dividends divided by interest expense. In addition, the Company must maintain working capital of $60 million.expires June 30, 2014. At June 30, 2011,2013, the Company was in compliance with all of the financial covenants contained in the credit agreement. The Company is contingently liable to insurance carriers under its comprehensive general, product, and vehicle liability policies, as well as some workers’ compensation, and has provided letters of credit in the amount of $3.0 million at June 30, 2011.additional unsecured $5.0$8.0 million line of credit, with interest at prime minus 1%, but not less than 2.5% and where its routine daily banking transactions are processed. NoThe Company did not utilize any borrowing availability during the period and no amount was outstanding on the line of credit at June 30, 2011 and 2010.2013. In addition, the supplemental retirement plans assets, held in a Rabbi Trust, assets (Note 9)of $5.8 million are administered by this bank’s trust department. The Company receives no special services or pricing on the services performed by the bank due to the directorship of this officer. (loss), statutory tax rates and permanent differences between book and tax. This includes recognition of deferred tax assets and liabilities for the expected future tax consequences of events that have been included in the financial statements or tax returns to the extent pervasive evidence exists that they will be realized in future periods. The deferred tax balances are adjusted to reflect tax rates by tax jurisdiction, based on currently enacted tax laws, which are expected to be in effect in the years in which the temporary differences are expected to reverse. In accordance with the Company’s income tax policy, significant or unusual items are separately recognized when they occur.��follows (in thousands):follows:follows (in thousands):follows:Consolidated Statementsconsolidated statements of Operations. The total income tax provision in fiscal years 2011, 2010 and 2009 was 35.7%, 38.1% and 41.5%, respectively, of income (loss) before income taxes.income. The Company does not expect that there will be any positions for which it is reasonably possible that the total amounts of unrecognized tax benefits will significantly increase or decrease within the next twelve months.30 (in thousands):30:yearyears ended June 30, 2013, 2012, 2011 was 37.0%, 36.8% and 35.7% compared to 38.1% for fiscal year 2010., respectively. The changechanges in effective tax rate isrates are primarily due to the change in provision for uncertain tax positions related to various state taxing jurisdictions, stock-based compensation and the lower benefit of the Domestic Manufacturing Deduction under Section 199 (DMD), which provides a tax benefit on U.S. based manufacturing. The DMD tax benefit available in previous years was being phased in by statuteU.S.-based manufacturing, and was therefore lower than the full DMD tax benefit for 2011.Although the Company’s effective full year tax expense rate has historically ranged from 35% to 39%, fiscal year ended June 30, 2009 reflects an effective income tax benefit rate of 41.5% due to losses or low level of earnings in various tax jurisdictions.limitation on executive compensation deduction.follows (in thousands):follows:2008–20112009–2012 remain open to examination by the Internal Revenue Service or other taxing jurisdictions to which we are subject.2008 and ending on June 30, 2011, beginning July 1, 2009 and ending on June 30, 2012, and beginning July 1, 2010 and ending on June 30, 2013.2013, beginning July 1, 2011 and ending on June 30, 2014, and beginning July 1, 2012 and ending on June 30, 2015. The Committee has also specified that payouts, if any, for awards earned under the fiscal years 2009-2011, 2010-2012 and 2011-2013in these performance periods will be 60% stock and 40% cash. Awards will be paid to participants as soon as practicable following the end of the performance periods subject to Committee approval and verification of results. The compensation cost related to the number of shares to be granted under each performance period is fixed on the grant date, which is the date the performance period begins. The compensation cost related to the cash portion of the award is re-measured based on the equity award’s estimated fair value at the end of each reporting period. The accrual is based on the probable outcomes of the performance conditions. The short-term portion of the recorded cash award payable is classified within current liabilities, (payrollpayroll and related items)items, and the long-term portion of the recorded cash award payable is classified within other long-term liabilities in the Consolidated Balance Sheets.consolidated balance sheets. As of June 30, 2011,2013 and June 30, 2012, the Company has recorded cash awards payable of $0.4$0.6 million and $1.1 million within current liabilities and $0.4 million and $0.7 million within long-term liabilities. As ofliabilities, respectively. During the years ended June 30, 2010,2013, 2012 and 2011, the Company recorded cash awards payableexpense of $0.4$1.2 million, within long-term liabilities. There have been no awards related to any of the performance periods as of June 30, 2011.$1.8 million and $1.3 million, respectively.2011,2013, is as follows (in thousands):follows:(2009-2011)(2011-2013), $1.0 million (2012-2014) and $1.1 million (2010-2012) and $1.0 million (2011-2013)(2013-2015) based on the estimated fair values at June 30, 2011. The Company recorded compensation expense of $1.3 million, $0.9 million, and $0 during fiscal years 2011, 2010 and 2009, respectively.2013. (2)(1)2011, 20102013, 2012 and 2009,2011 the Company issued options for 87,500, 165,00089,300, 82,500 and 265,00087,500 common shares at weighted average exercise prices of $17.23, $8.43$20.31, $13.87 and $6.82$17.23 (the fair market value on the date of grant), respectively. The options were immediately available for exercise and may be exercised for a period of 10 years. The Company recorded compensation expense of $0.4$0.5 million, $0.3 million and $0.1$0.4 million during fiscal years 2011, 20102013, 2012 and 2009,2011, respectively. The assumptions used in determining the compensation expense are discussed below.2011, 20102013, 2012 and 2009,2011, respectively; dividend yield of 1.2%2.5%, 2.4%2.9% and 7.6%1.2%, expected volatility of 33.4%35.4%, 25.3%34.4% and 21.8%33.4%; risk-free interest rate of 1.5%0.8%, 2.2%0.9% and 1.6%1.5%; and an expected life of 5 5 and 6 years, respectively. The expected volatility and expected life are determined based on historical data.2010was $5.06, $3.11 and 2009 was $4.84, $1.64 and $0.45, respectively. The cash proceeds income tax benefitfrom stock options exercised were $1.1 million, $0.9 million and aggregate intrinsic value of options (the amount by which the market price of the stock on the date of exercise exceeded the market price of stock on the date of grant) exercised during the$0.3 million, respectively, for fiscal years ended June 30, 2013, 2012 and 2011. The income tax benefit related to the exercise of stock options was $0.2 million, $0.1 million and $0.0 million for fiscal year ended June 30, 2013, 2012 and 2011, 2010 and 2009, respectively, were not material.respectively.2011, 423,9502013, 251,900 shares were available for future grants. It is the Company’s policy to issue new shares upon exercise of stock options. The Company accepts shares of the Company’s common stock as payment for the exercise price of options. These shares received as payment are retired upon receipt.2011, 20102013, 2012 and 20092011 and the changes during the years then ended is presented below:
(in thousands)
Exercise Price
Intrinsic Value
(in thousands)
(in thousands)
Exercise Price
Intrinsic Value
(in thousands)2011:2013:
Prices
(in thousands)
Life (Years)
Price
Prices
Outstanding
(in thousands)
Life (Years)
Price$1.7$1.8 million, $1.5$1.6 million and $1.8$1.7 million in fiscal years 2011, 20102013, 2012 and 2009.2011. The amounts include $0.5 million in fiscal year 2011,2013, $0.4 million in fiscal 20102012 and $0.5 million in fiscal years 2009,2011, for the Company’s matching contribution to retirement savings plans. The Company’s cost for pension plans is generally determined as 2% - 6% of each covered employee’s wages. The Company’s matching contribution for the retirement savings plans is generally 25% - 50% of employee contributions (up to 4% of employee earnings).In additionMulti-employer Pension Plansthe above, amounts charged to pension expense and contributed tothree multi-employer defined benefit pension plans administeredunder the terms of collective-bargaining agreements that cover its union-represented employees. The risks of participating in these multi-employer plans are different from single-employer plans in the following aspects:others under collective bargaining agreements were $0.5 millionone employer may be used to provide benefits to employees of other participating employers.fiscal yearssome of its multi-employer plans, the employer may be required to pay those plans an amount based on the underfunded status of the plan, referred to as a withdrawal liability.2010respectively. The zone status is based on information that the Company received from the plan and 2009, respectively. is certified by the plan’s actuary. Among other factors, plans in the red zone are generally less that 65 percent funded, plans in the yellow zone are between 65 percent and 80 percent funded, and plans in the green zone are at least 80 percent funded.
Act Zone Status
(in thousands)
of Collective
Bargaining
Agreement
Company
Employees
in Plan
Plan Number
Plan Status
Imposed2011.2013, 2012 and 2011, respectively.deferred compensationsupplemental retirement plans with executive officers. The plans require various annual contributions for the participants based upon compensation levels and age. All participants are fully vested. At June 30, 2013 and 2012, the supplemental retirement plan liability was $5.4 million and $5.6 million, respectively, of which $3.0 million and $0.0 million were recorded in other current liabilities and $2.4 million and $5.6 million were recorded in other long-term liabilities, respectively. The Company maintains supplemental retirement plans, collectively referred to as the Supplemental Plan, which provides for additional annual defined contributions toward retirement benefits to certain of the Company’s executive officers. For fiscal 2011, 20102013, 2012 and 2009,2011, the benefit obligation was increased by interest expense of $0.2 million, $0.2 million and $0.1 million, service costs of $0.4$0.5 million, $0.3 million and $0.2 million, deposits of $0.5 million, $0.4 million and $0.4 million, and decreased by payments of $0.4$1.3 million, $0.4 million and $0.6 million, respectively. At June 30, 2011 and 2010, the deferred compensation liability was $5.3 and $5.1$0.4 million, respectively. Funds of the deferred compensation plans are held in a Rabbi Trust. The assets held in the Rabbi Trust are not available for general corporate purposes. The Rabbi Trust is subject to creditor claims in the event of insolvency, but otherwise must be used only for purposes of providing benefits under the plans. As of June 30, 2011,2013, the Company’s deferred compensation plan assets, held in the Rabbi Trust, were invested in stock and bond funds.funds and are recorded in the consolidated balance sheets at fair market value. As of June 30, 20112013 and 2010,2012, the fair market value of the assets held in the Rabbi Trust were $5.5$5.8 million and $4.7$5.9 million, respectively, $3.3 million and $0.0 million, respectively, of the assets are classified as “Other Assets”other current assets and $2.5 million and $5.9 million, respectively, are classified as other assets in the Consolidated Balance Sheets.consolidated balance sheets. These assets are classified as Level 2 in accordance with fair value accounting as discussed in Note 1.Under provisions of the Company’s Voluntary Deferred CompensationDefined Benefit Plan executive officers may defer common stock awards received as part of incentive compensation plans until retirement. Under the plan, no shares were deferred during the fiscal years ended June 30, 2011 and 2010. At June 30, 2011 and 2010, 36,867 shares and 42,094 shares with an award date value of $0.5 million and $0.6 million, respectively, had been deferred and are being held on behalf of the employees. Under the plan, 5,227 shares and 5,228 shares were distributed in fiscal years 2011 and 2010, respectively.As of June 30, 2011, theThe Company’s defined benefit pension plan has no active employees of DMI and is frozen. There are a total of 444424 participants in the plan. Retirement benefits are based on years of credited service multiplied by a dollar amount negotiated under collective bargaining agreements. The Company’s policy is to fund normal costs and amortization of prior service costs at a level that is equal to or greater than the minimum required under the Employee Retirement Income Security Act of 1974 (ERISA). As of June 30, 20112013 and 2010,2012, the Company recorded an accrued benefit liability related to the funded status of the defined benefit pension plan recognized on the Company’s consolidated balance sheets in other long-term liabilities of $1.1$1.5 million and $2.4$2.7 million, respectively. The accumulated benefit obligation was $6.2$7.4 million and $6.6$7.8 million at fiscal years ended June 30, 20112013 and 2010,2012, respectively. The Company recorded expense of $0.2$0.1 million, $0.2$0.0 million and $0$0.2 million during fiscal years 2011, 20102013, 2012 and 2009,2011, respectively, related to the plan.The components of comprehensive income (loss), net of income taxes, for the years ended June 30, were as follows (in thousands):follows (in thousands):follows:Company has been named as one of several defendants in an Indiana civil lawsuit related to groundwater contamination. The lawsuitcomplaint alleges that the source of groundwater contamination sourceunderneath plaintiffs’ current or former residences is a propertytwo adjacent properties, in Elkhart, Indiana, once owned by the Company. The VanNorman case is set for a Phase 1 trial in May 2014 on the issue of cause or contribution to the Elkhart contamination. A subsequent Complaint for Damages under RICO and RPTL, and Injunctive Relief under RCRA, titled Dennis and Darlene Knoll, et al, vs. Flexsteel Industries, Inc., et al, was filed on May 5, 2012 in United States District Court Northern District of Indiana South Bend Division by a subgroup of the state court plaintiffs, as well as the current owner of one of the properties once owned by the Company. The District Court dismissed one of the two RCRA claims in March 2013, and dismissed both RICO claims in June 2013. One RCRA claim and a RPTL claim remain pending in the Knoll case. Relief sought in these complaints includes payment to Plaintiffs for their damages and attorneys’ fees and costs, payment to remove the contamination, payment for medical monitoring, and punitive damages. Based on policy language and jurisdiction, insurance coverage is in question. Flexsteel has filed an appeal to the Iowa Supreme Court regarding two adverse opinions of an Iowa District Court regarding coverage issues. The Company does not believe that it caused or contributed to the contamination. This lawsuit is in its preliminary stages. damages and the status of insurance coverage has not been determined. Wedamages. Therefore, we are unable to estimate a range of reasonably possible outcomes or losses at this time. Accordingly, no accrual related to this matter has been recorded in the June 30, 20112013 financial statements. LegalDuring the fiscal years ended June 30, 2013, 2012 and 2011, legal and other related expenses of $2.3 million, $2.4 million and $0.5 million, respectively, have been incurred responding to this lawsuitthe state and federal lawsuits, as well as in pursuing insurance coverage. These costs are included in Selling, Generalselling, general and Administrativeadministrative expense in the fiscal year 2011 Consolidated Statementconsolidated statements of Operations.income.$2.7$2.5 million, $3.4$2.2 million and $4.3$2.7 million in fiscal 2011, 20102013, 2012 and 2009,2011, respectively.20112013 were as follows (in thousands):follows:FACILITY CLOSING COSTSDuring the fiscal year 2011, the Company closed a manufacturing facility and recorded pre-tax charges for facility closing costs of $1.0 million. The charges represent employee separation costs of $0.6 million and other closing costs of $0.4 million and were classified as “Facility Closing Costs” in the Consolidated Statements of Operations and June 30, 2011. At June 30, 2011, the closure is completed and there were no facility consolidation liabilities remaining.14. operating segment, furniture products. Our operations involve the distribution of manufactured and imported furniture for residential and commercial markets. The Company’s furniture products are sold primarily throughout the United States by the Company’s internal sales force and various independent representatives. The Company makes minimal export sales. No single customer accounted for more than 10% of net sales.application (in thousands):application:15.14.(1)(1)The quarter ended September 30, 2010 includes facility closing costs after-tax of $1.0 million or $0.15 per share, respectively.2011.2013.year-endedfiscal quarter ended June 30, 2011,2013, there was no change in the Company’s internal control over financial reporting (as defined in Rule 13a-15(f) under the Securities Exchange Act of 1934) that has materially affected, or is reasonably likely to materially affect the Company’s internal control over financial reporting.2011.2013. In making this assessment, we used the criteria set forth by the Committee of Sponsoring Organizations of the Treadway Commission in Internal Control — Integrated Framework.Framework (1992). Based on those criteria, management concluded that the internal control over financial reporting is effective as of June 30, 2011.2013. The effectiveness of the Company’s internal control over financial reporting as of June 30, 2013, has been audited by Deloitte & Touche LLP, our independent registered public accounting firm, as stated in their report in Part II, Item 8 of this Form 10-K. None.20112013 definitive proxy statement to be filed with the Securities and Exchange Commission under the sections captioned “Proposal 1 Election of Directors,” “Corporate Governance – Audit and Ethics Committee,” “Corporate Governance – Nomination Matters”Matters,” and “Section 16(a) Beneficial Ownership Reporting Compliance” is incorporated herein by reference. The executive officers of the Company, their ages, positions (in each case as of June 30, 2011), and the year they were first elected or appointed an officer of the registrant, are as follows:Name (age)Position (date first became officer)Ronald J. Klosterman (63)President & Chief Executive Officer (1989)James R. Richardson (67)Senior Vice President of Residential Sales and Marketing (1979)Thomas D. Burkart (68)Senior Vice President of Vehicle Seating (1984)Patrick M. Crahan (63)Senior Vice President of Commercial Seating (1989)Jeffrey T. Bertsch (56)Senior Vice President of Corporate Services (1989)Donald D. Dreher (61)Senior Vice President (2004), President & CEO of DMI Furniture, Inc. (1986)James E. Gilbertson (61)Senior Vice President of Vehicle Seating (1989)Timothy E. Hall (53)Senior Vice President-Finance, Chief Financial Officer, Secretary & Treasurer (2000)20112013 definitive proxy statement to be filed with the Securities and Exchange Commission under the sections captioned “Executive Compensation,” and “Director Compensation,” is incorporated herein by reference.20112013 definitive proxy statement to be filed with the Securities and Exchange Commission under the sections captioned “Ownership of Stock By Directors and Executive Officers,” “Ownership of Stock by Certain Beneficial Owners,” and “Equity Compensation Plan Information” is incorporated herein by reference.ThisThe information contained under the sections “Interest of Management and Others in Certain Transactions” and “Corporate Governance – Board of Directors” in the Company’s 20112013 definitive proxy statement to be filed with the Securities and Exchange Commission is incorporated herein by reference.Deloitte & Touche LLP wasThe information contained in the Company’s independent registered public accounting firm in fiscal 2011. In addition to performing the audit of the Company’s consolidated financial statements, Deloitte & Touche LLP provided various audit-related services during fiscal 2011. The Audit and Ethics Committee pre-approves both the type of services2013 definitive proxy statement to be providedfiled with the Securities and Exchange Commission under the sections captioned “Independent Registered Public Accounting Firm” is incorporated herein by Deloitte & Touche LLP and the estimated fees related to these services. The Audit and Ethics Committee reviewed professional services and the possible effect on Deloitte & Touche LLP’s independence was considered. The Audit and Ethics Committee has considered and found the provision of services for non-audit services compatible with maintaining Deloitte & Touche LLP’s independence. All services provided by Deloitte & Touche LLP during fiscal 2011 were pre-approved by the Audit and Ethics Committee.reference.(1)Professional fees and expenses for the audit of financial statements for fiscal 2011 and fiscal 2010 consisted of (i) audit of the Company’s annual consolidated financial statements; (ii) reviews of the Company’s quarterly consolidated financial statements; (iii) employee benefit plan audits; (iv) consents and other services related to Securities and Exchange Commission matters; and (v) consultations on financial accounting and reporting matters arising during the course of the audit and reviews. Fiscal 2010 also included internal control over financial reporting services.(2)Professional fees and expenses for tax services billed in fiscal 2011 consisted of tax planning and advice services totaling $15,000 and consisted of (i) tax advice related to structuring certain proposed transactions; and (ii) general tax planning matters. The following financial statement schedules for the years ended June 30, 2011, 2010 and 2009 are submitted herewith:SCHEDULE IIRESERVESFor the Years Ended June 30, 2011, 2010 and 2009
Beginning of
Year
Charged to
Income
from
Reserves
End of Year
Description
Beginning of
Year
Reserves
End of YearExhibit No.Exhibitsincorporated(incorporated by reference to Form 8-K, as filed with the Securities and Exchange Commission on December 8, 2010.2010).incorporated(incorporated by reference to Form 8-K, as filed with the Securities and Exchange Commission on December 8, 2010.2010).incorporated(incorporated by reference from the 1995 Flexsteel definitive proxy statement.statement). *incorporated(incorporated by reference from the 1999 Flexsteel definitive proxy statement.statement). *June 7, 2011April 14, 2010 between Flexsteel Industries, Inc. and Wells Fargo Bank, N. A.N.A. (incorporated by reference to Form 8-K filed with the Securities and Exchange Commission on April 19, 2010).10.1410.16N. A.N.A. (incorporated by reference to Form 8-K filed with the Securities and Exchange Commission on June 9, 2011).19, 201123, 2013Ronald J. KlostermanKarel K. CzandernaRonald J. KlostermanKarel K. Czanderna19, 201123, 2013L. Bruce BoylenLynn J. DavisL. Bruce BoylenLynn J. Davis19, 201123, 201319, 2011/S/ Jeffrey T. BertschJeffrey T. BertschDirectorDate:August 19, 2011/S/ Mary C. BottieMary C. BottieDirectorDate:August 19, 2011/S/ Patrick M. CrahanPatrick M. CrahanDirectorDate:August 19, 2011/S/ Lynn J. DavisLynn J. DavisDirectorDate:August 19, 2011/S/ Robert E. DeignanRobert E. DeignanDirectorDate:August 19, 2011/S/ Thomas E. HolloranThomas E. HolloranDirectorDate:August 19, 2011/S/ Thomas M. LevineThomas M. LevineDirectorDate:August 19, 201123, 201319, 201123, 201319, 201123, 201319, 201123, 2013